| OMB APPROVAL | ||
| OMB Number: 3235-0570 | ||
| Expires: January 31, 2014 | ||
| Estimated average burden hours per response: 20.6 | ||
UNITED STATES
SECURITIES AND EXCHANGE COMMISSION
SECURITIES AND EXCHANGE COMMISSION
Washington, D.C. 20549
FORM N-CSR
CERTIFIED SHAREHOLDER REPORT OF REGISTERED MANAGEMENT
INVESTMENT COMPANIES
INVESTMENT COMPANIES
Investment Company Act file number 811-06463
AIM International Mutual Funds (Invesco International Mutual Funds)
(Exact name of registrant as specified in charter)
11 Greenway Plaza, Suite 2500 Houston, Texas 77046
(Address of principal executive offices) (Zip code)
Philip A. Taylor 11 Greenway Plaza, Suite 2500 Houston, Texas 77046
(Name and address of agent for service)
Registrant’s telephone number, including area code: (713) 626-1919
Date of fiscal year end: 10/31
Date of reporting period: 10/31/11
Item 1. Reports to Stockholders.
 |
| Annual Report to Shareholders | October 31, 2011 |
Invesco Asia Pecific Growth Fund
Nasdaq:
A: ASIAX § B: ASIBX § C: ASICX § Y: ASIYX
A: ASIAX § B: ASIBX § C: ASICX § Y: ASIYX
| 2 | Letters to Shareholders | |
| 4 | Performance Summary | |
| 4 | Management Discussion | |
| 6 | Long-Term Fund Performance | |
| 8 | Supplemental Information | |
| 9 | Schedule of Investments | |
| 11 | Financial Statements | |
| 13 | Notes to Financial Statements | |
| 20 | Financial Highlights | |
| 21 | Auditor’s Report | |
| 22 | Fund Expenses | |
| 23 | Approval of Investment Advisory and Sub-Advisory Agreements | |
| 25 | Tax Information | |
| T-1 | Trustees and Officers | |
Letters to Shareholders

Philip Taylor
Dear Shareholders:
Enclosed is important information about your Fund and its performance. I encourage you to read this report to learn more about your Fund’s short- and long-term performance and its holdings as of the close of the reporting period. This report also includes useful information about your Fund’s management team and a discussion of how your Fund was managed during the reporting period.
Investors are likely to confront both opportunities and challenges in 2012 – just as we did in 2011. After all, changes in market sentiment never do investors the courtesy of announcing their impending arrival, and your goals and needs may have changed, requiring changes in your financial strategy.
That’s why the start of a new year is always a good time to catch up with your financial adviser. He or she can explain how your investments performed in the year just ended – how each performed individually, and more important, how they performed as a diversified portfolio. Of course, it’s important to remember that an investment’s long-term performance is more important than its short-term performance. Looking ahead to the new year and evaluating your individual situation, your financial adviser can provide valuable insight into whether your investments are still appropriate for your individual needs, goals and risk tolerance.
For current information about your Fund
In addition to meeting with your financial adviser to discuss your individual situation at the start of the new year, you also may find it helpful to stay abreast of market trends and developments. Doing so may provide reassurance in times of economic uncertainty and market volatility such as we saw in 2011 – and are likely to see again in 2012.
Invesco can help you stay informed about your investments and market trends. On our website, invesco.com/us, we provide timely market updates and commentary from many of our fund managers and other investment professionals. Also on our website, you can obtain information about your account at any hour of the day or night. I invite you to visit and explore the tools and information we offer at invesco.com/us.
Our commitment to investment excellence
As we’ve seen over the last several years, market conditions can change – often suddenly and dramatically. That’s one reason financial advisers typically advise their clients to be well diversified and to maintain a long-term investment focus. While diversification can’t guarantee a profit or protect against loss, it may cushion the impact of dramatic market moves. Maintaining a long-term investment focus for your long-term goals – financing your retirement or your children’s education, for example – may help you avoid making rash investment decisions based on short-term market swings.
Likewise, Invesco’s investment professionals maintain a long-term focus. Across our broad array of investment products, investment excellence is our ultimate goal. Each of our funds is managed by specialized teams of investment professionals, and as a company, we maintain a single focus – investment management – that allows our fund managers to concentrate on doing what they do best: managing your money.
Our funds are managed strictly according to their stated investment objectives and strategies, with robust risk oversight using consistent, repeatable investment processes that don’t change in response to short-term market events. This disciplined approach can’t guarantee a profit; no investment can do that, since all involve some measure of risk. But it can ensure that your money is managed the way we said it would be – according to your Fund’s objective and strategies.
Our adherence to stated investment objectives and strategies allows your financial adviser to build a diversified portfolio that meets your individual risk tolerance and financial goals. It also means that when your goals change, your financial adviser will be able to find an Invesco fund that’s appropriate for your needs.
Questions?
If you have questions about your account, please contact one of our client service representatives at 800 959 4246. If you have a general Invesco-related question or comment for me, I invite you to email me directly at phil@invesco.com.
All of us at Invesco look forward to serving your investment management needs for many years to come. Thank you for investing with us.
Sincerely,

Philip Taylor
Senior Managing Director, Invesco Ltd.
Senior Managing Director, Invesco Ltd.
2 | Invesco Asia Pacific Growth Fund |

Bruce Crockett
Dear Fellow Shareholders:
Although the world’s economies are gradually recovering from the financial crisis, it has not been a smooth path. Unrest in the Middle East, persistently weak job and housing markets in the U.S. and continued government balance sheet repair in Europe are contributing to a slow, labored march toward global recovery.
In this environment, investors face risks that could make it more difficult to achieve their long-term financial goals – a secure retirement, home ownership, a child’s college education. Although the markets are complex and dynamic, there are ways to simplify the process and potentially increase your odds of achieving your goals. The best approach is to create a solid financial plan that helps you save and invest in ways that anticipate your needs over the long term.
Your financial adviser can help you define your financial plan, develop an appropriate investment strategy and put you in a better position to achieve your financial goals over the long term. This can take some of the guesswork out of the process and help you make thoughtful investments. Your financial adviser also can help you better understand your tolerance for risk, so that your investment approach lets you sleep at night while getting you closer to your goals. Lastly, your financial adviser can develop an asset allocation strategy that seeks to balance your investment approach, providing some protection against a decline in the markets while allowing you to participate in rising markets. Invesco calls this type of approach “intentional investing.” It means thinking carefully, planning thoughtfully and acting deliberately.
While no investment can guarantee favorable returns, your Board remains committed to managing costs and enhancing the performance of Invesco’s funds as part of our Investor First orientation. We continue to oversee the funds with the same strong sense of responsibility for your money and your continued trust that we’ve always maintained.
Thanks to the approval of our fund shareholders, Invesco has made great progress in realigning our U.S. mutual fund product line following our acquisition of Morgan Stanley’s retail asset management business, including Van Kampen Investments. When completed, the realignment will reduce overlap in the product lineup, enhance efficiency across our product line and build a solid foundation for further growth to meet client and shareholder needs. I would like to thank those of you who voted your proxy, and I hope our shareholders haven’t been too inconvenienced by the process.
As always, please contact me at bruce@brucecrockett.com with any questions or concerns you may have. On behalf of your Board, we look forward to continuing to represent your interests and serving your needs.
Sincerely,

Bruce L. Crockett
Independent Chair
Invesco Funds Board of Trustees
Independent Chair
Invesco Funds Board of Trustees
3 | Invesco Asia Pacific Growth Fund |
Management’s Discussion of Fund Performance
Performance summary
Global equity markets faced headwinds in 2010 and 2011. China’s growth continued to slow as the U.S. battled high unemployment and runaway deficits. Several European countries faced similar deficits, which brought to light the imperfect structure of the euro. The reporting period ended with a market upswing, however, as European leaders took steps to address the Greek sovereign debt issue, expand the bailout fund and stabilize the banking system.
The volatility and weakness experienced by global equity markets over the fiscal year ended October 31, 2011, was reflected in the performance of Invesco Asia Pacific Growth Fund. Class A shares at net asset value (NAV) closed slightly lower than the Fund’s style-specific benchmark, the MSCI All Country Asia Pacific Ex-Japan Index.
Your Fund’s long-term performance appears later in this report.
Fund vs. Indexes
Total returns, 10/31/10 to 10/31/11, at net asset value (NAV). Performance shown does not include applicable contingent deferred sales charges (CDSC) or front-end sales charges, which would have reduced performance.
| Class A Shares | -4.67 | % | ||
| Class B Shares | -5.38 | |||
| Class C Shares | -5.37 | |||
| Class Y Shares | -4.40 | |||
MSCI EAFE Index▼(Broad Market Index) | -4.08 | |||
MSCI All Country Asia Pacific Ex-Japan Index▼(Style-Specific Index) | -4.12 | |||
Lipper Pacific Region Ex-Japan Funds Index▼(Peer Group Index) | -7.25 | |||
Source(s): ▼ Lipper Inc.
How we invest
When selecting stocks for your Fund, we use a disciplined investment strategy that emphasizes fundamental research, supported by both quantitative analysis and portfolio construction techniques. Our EQV (earnings, quality, valuation) strategy focuses primarily on identifying quality companies that have experienced, or exhibit the potential for, accelerated or above-average earnings growth, but whose stock prices have not fully reflected these attributes.
While research responsibilities within the portfolio management team are focused by geographic region, we select
investments for the Fund using a bottom-up investment approach, which means we construct the Fund primarily on a stock-by-stock basis. We focus on the strengths of individual companies rather than sectors, countries or market-cap trends.
We believe disciplined sell decisions are key to successful investing. We consider selling a stock for one of the following reasons:
| n | A company’s fundamentals deteriorate, or it posts disappointing earnings. | |
| n | A stock’s price seems overvalued. | |
| n | A more attractive opportunity becomes available. |
Market conditions and your Fund
Market volatility was intense during the reporting period. During mid-2011, Greek sovereign debt concerns and signs of slowing global growth continued to worry investors. In addition, numerous world events caught investors’ attention, including the growing unrest in the Middle East and northern Africa, and the devastating earthquake and tsunami in Japan on March 11. Renewed credit problems overseas and the market correction that occurred in May, June, July and August created a more uncertain environment, which prompted many investors to favor safety over risk.
Although Europe’s debt status bore the greatest negative macroeconomic heft globally, inflation was the major concern across Asia throughout the fiscal year. Fortunately, this concern started to subside toward the end of the period, with a surprise rate cut in Indonesia, inflationary easing in China and an expected crest in India’s inflation rate. The slowdown in inflation rates gave Asian governments the ability to loosen monetary policy as needed to help maintain financial stability and potentially stimulate economic growth.
Though inflation rates in China receded from peak levels over the reporting period, China’s capacity to continue its economic expansion and serve as the world’s growth engine came into question due to a more recent slowdown that negatively affected investor sentiment. Despite the deceleration in growth, we believe China’s economy remains healthy.
In this environment, we continued to construct the Fund’s portfolio with a long-term view and a bottom-up ap-
Portfolio Composition
By sector
| Financials | 23.0 | % | ||
| Consumer Discretionary | 16.3 | |||
| Information Technology | 10.8 | |||
| Industrials | 9.8 | |||
| Utilities | 6.7 | |||
| Telecommunication Services | 6.1 | |||
| Consumer Staples | 5.5 | |||
| Energy | 4.8 | |||
| Health Care | 4.8 | |||
| Materials | 4.5 | |||
Money Market Funds Plus Other Assets Less Liabilities | 7.7 | |||
Top 10 Equity Holdings*
| 1. | Industrial & Commercial Bank of China Ltd.-Class H | 3.8 | % | |||||
| 2. | SM Investments Corp. | 3.2 | ||||||
| 3. | Taiwan Semiconductor Manufacturing Co. Ltd. | 3.1 | ||||||
| 4. | CNOOC Ltd.-ADR | 2.7 | ||||||
| 5. | NHN Corp. | 2.7 | ||||||
| 6. | Kossan Rubber Industries Berhad | 2.6 | ||||||
| 7. | Kasikornbank PCL | 2.6 | ||||||
| 8. | Public Bank Berhad | 2.5 | ||||||
| 9. | BHP Billiton Ltd. | 2.5 | ||||||
| 10. | PT Summarecon Agung Tbk | 2.5 | ||||||
Top Five Countries*
| 1. | China | 17.4 | % | |||||
| 2. | Philippines | 13.3 | ||||||
| 3. | Australia | 12.7 | ||||||
| 4. | Indonesia | 8.9 | ||||||
| 5. | South Korea | 8.6 | ||||||
| Total Net Assets | $529.0 million | |||||||
| Total Number of Holdings* | 56 | |||||||
The Fund’s holdings are subject to change, and there is no assurance that the Fund will continue to hold any particular security.
* Excluding money market fund holdings.
4 | Invesco Asia Pacific Growth Fund |
proach (i.e., selecting stocks on an individual basis). The portfolio held an average of about 11% cash over the reporting period. This higher-than-average cash position was advantageous in a period when markets were plagued with volatility. It’s important to note that we do not use cash for “top-down” tactical asset allocation purposes. Historically, when the portfolio’s cash position has been higher than average, it has reflected a lack of good EQV investment opportunities in the marketplace, rather than an overall negative opinion on markets.
In geographic terms, a meaningful underweight position in India was a key positive contributor to Fund results relative to the MSCI All Country Asia Pacific Ex-Japan Index. Relative performance also benefited from the Fund’s overweight exposure to the Philippines and Thailand. Strong stock selection in South Korea and Singapore added value over the period as well and enabled the Fund to outperform the index significantly in these countries.
NHN, South Korea’s premier Internet company and operator of its most popular search portal, was among the top individual contributors to Fund performance over the reporting period. NHN continued to benefit from the proliferation of smartphone usage, which in turn drove search advertising on mobile devices.
In contrast, a meaningful underweight position in Australia combined with lagging stock selection in Hong Kong detracted from relative results. Industrial & Commercial Bank of China (ICBC) was among the top individual detractors from Fund performance. The company’s stock price declined as part of the global sell-off of financial stocks, which was exacerbated by an increase in the perceived risk associated with asset quality. We maintained our position in the stock as we believe there is value in ICBC due to its strong capital position and prudent loan portfolios.
From a sector perspective, strong stock selection across the industrials and consumer staples sectors enabled the Fund to substantially outperform the index in these sectors over the reporting period. In contrast, stock selection in the consumer discretionary and telecommunication services sectors made them the largest detractors from relative results.
As long-term, bottom-up stock selectors, we see volatility as an opportunity to buy quality growth companies at more attractive valuations than usual; consequently, we took advantage of market volatility to buy several stocks that had long been on our EQV radar.
Stock selection in the portfolio continued to be driven by the underlying fundamentals of a company – not any top-down macroeconomic views. That said, because of our belief in the long-term strength of consumer growth in Asia, we maintained a significant overweight exposure to the consumer discretionary sector at the end of the reporting period. The Fund also remained overweight versus the index in the utilities, health care and industrials sectors. It had an underweight exposure to the financials, materials and energy sectors.
In closing, volatile markets can test an investor’s resolve, but it’s worth noting that real investment opportunity can present itself when the markets are turbulent. We welcome any new investors who joined the Fund during the reporting period, and we thank all of our shareholders for your continued investment in Invesco Asia Pacific Growth Fund.
The views and opinions expressed in management’s discussion of Fund performance are those of Invesco Advisers, Inc. These views and opinions are subject to change at any time based on factors such as market and economic conditions. These views and opinions may not be relied upon as investment advice or recommendations, or as an offer for a particular security. The information is not a complete analysis of every aspect of any market, country, industry, security or the Fund. Statements of fact are from sources considered reliable, but Invesco Advisers, Inc. makes no representation or warranty as to their completeness or accuracy. Although historical performance is no guarantee of future results, these insights may help you understand our investment management philosophy.
See important Fund and, if applicable, index disclosures later in this report.

Shuxin Cao
Chartered Financial Analyst, portfolio manager, is lead manager of Invesco Asia Pacific Growth Fund. He joined Invesco in 1997. Mr. Cao earned a B.A. in English from the Tianjin Foreign Language Institute and an M.B.A. from Texas A&M University. He is also a Certified Public Accountant.

Brent Bates
Chartered Financial Analyst, portfolio manager, is manager of Invesco Asia Pacific Growth Fund. He joined Invesco in 1996. Mr. Bates earned a B.B.A. from Texas A&M University. He is also a Certified Public Accountant.

Mark Jason
Chartered Financial Analyst, portfolio manager, is manager of Invesco Asia Pacific Growth Fund. He joined Invesco in 2001. Mr. Jason earned a B.S. in finance and a B.S. in real estate from California State University at Northridge.
5 | Invesco Asia Pacific Growth Fund |
Your Fund’s Long-Term Performance
Results of a $10,000 Investment – Oldest Share Classes since Inception
Index data from 10/31/97, Fund data from 11/3/97
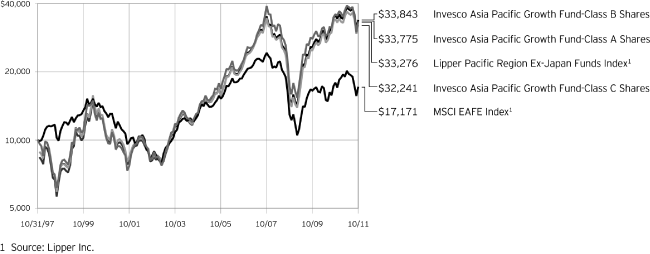
Past performance cannot guarantee comparable future results.
The data shown in the chart include reinvested distributions, applicable sales charges and Fund expenses including management fees. Results for Class B shares are calculated as if a hypothetical shareholder had liquidated his entire investment in the Fund at the close of the reporting period and paid the contingent deferred sales charges, if applicable. Index results include reinvested dividends, but they do not reflect sales
charges. Performance of the peer group, if applicable, reflects fund expenses and management fees; performance of a market index does not. Performance shown in the chart and table(s) does not reflect deduction of taxes a shareholder would pay on Fund distributions or sale of Fund shares.
This chart, which is a logarithmic chart, presents the fluctuations in the value of the Fund and its indexes. We believe that a logarithmic chart is more
effective than other types of charts in illustrating changes in value during the early years shown in the chart. The vertical axis, the one that indicates the dollar value of an investment, is constructed with each segment representing a percent change in the value of the investment. In this chart, each segment represents a doubling, or 100% change, in the value of the investment. In other words, the space between $5,000 and $10,000 is the same size as the space between $10,000 and $20,000, and so on.
6 | Invesco Asia Pacific Growth Fund |
| Average Annual Total Returns | ||||||||
| As of 10/31/11, including maximum applicable sales charges | ||||||||
| Class A Shares | ||||||||
| Inception (11/3/97) | 9.09 | % | ||||||
| 10 | Years | 14.57 | ||||||
| 5 | Years | 7.83 | ||||||
| 1 | Year | -9.90 | ||||||
| Class B Shares | ||||||||
| Inception (11/3/97) | 9.10 | % | ||||||
| 10 | Years | 14.59 | ||||||
| 5 | Years | 7.96 | ||||||
| 1 | Year | -10.06 | ||||||
| Class C Shares | ||||||||
| Inception (11/3/97) | 8.73 | % | ||||||
| 10 | Years | 14.38 | ||||||
| 5 | Years | 8.24 | ||||||
| 1 | Year | -6.31 | ||||||
| Class Y Shares | ||||||||
| 10 | Years | 15.31 | % | |||||
| 5 | Years | 9.22 | ||||||
| 1 | Year | -4.40 | ||||||
Class Y shares incepted on October 3, 2008. Performance shown prior to that date is that of Class A shares and includes the 12b-1 fees applicable to Class A shares. Class A share performance reflects any applicable fee waivers or expense reimbursements.
The performance data quoted represent past performance and cannot guarantee comparable future results; current performance may be lower or higher. Please visit invesco.com/performance for the most recent month-end performance. Performance figures reflect reinvested distributions, changes in net asset value and the effect of the maximum sales charge unless otherwise stated. Investment return and principal value will fluctuate so that you may have a gain or loss when you sell shares.
The total annual Fund operating expense ratio set forth in the most recent Fund prospectus as of the date of this report for Class A, Class B, Class C and Class Y shares was 1.61%, 2.36%, 2.36% and 1.36%, respectively. The expense ratios presented above may vary from the expense ratios presented in other sections of this report that are based on expenses incurred during the period covered by this report.
| Average Annual Total Returns | ||||||||
| As of 9/30/11, the most recent calendar quarter-end, including maximum applicable sales charges | ||||||||
| Class A Shares | ||||||||
| Inception (11/3/97) | 8.43 | % | ||||||
| 10 | Years | 14.07 | ||||||
| 5 | Years | 7.03 | ||||||
| 1 | Year | -15.91 | ||||||
| Class B Shares | ||||||||
| Inception (11/3/97) | 8.44 | % | ||||||
| 10 | Years | 14.11 | ||||||
| 5 | Years | 7.14 | ||||||
| 1 | Year | -16.05 | ||||||
| Class C Shares | ||||||||
| Inception (11/3/97) | 8.07 | % | ||||||
| 10 | Years | 13.88 | ||||||
| 5 | Years | 7.42 | ||||||
| 1 | Year | -12.58 | ||||||
| Class Y Shares | ||||||||
| 10 | Years | 14.81 | % | |||||
| 5 | Years | 8.40 | ||||||
| 1 | Year | -10.82 | ||||||
Class A share performance reflects the maximum 5.50% sales charge, and Class B and Class C share performance reflects the applicable contingent deferred sales charge (CDSC) for the period involved. The CDSC on Class B shares declines from 5% beginning at the time of purchase to 0% at the beginning of the seventh year. The CDSC on Class C shares is 1% for the first year after purchase. Class Y shares do not have a front-end sales charge or a CDSC; therefore, performance is at net asset value.
The performance of the Fund’s share classes will differ primarily due to different sales charge structures and class expenses.
Had the adviser not waived fees and/or reimbursed expenses in the past, performance would have been lower.
A redemption fee of 2% is imposed on certain redemptions or exchanges out of the Fund within 31 days of purchase. Exceptions to the redemption fee are listed in the Fund’s prospectus. Effective January 1, 2012, after the close of the reporting period, the Fund will eliminate the redemption fee, if applicable, assessed on shares of the Fund redeemed or exchanged within 31 days of purchase.
7 | Invesco Asia Pacific Growth Fund |
Invesco Asia Pacific Growth Fund’s investment objective is long-term growth of capital.
| n | Unless otherwise stated, information presented in this report is as of October 31, 2011, and is based on total net assets. | |
| n | Unless otherwise noted, all data provided by Invesco. | |
| n | To access your Fund’s reports/prospectus, visit invesco.com/fundreports. |
About share classes
| n | Class B shares may not be purchased or acquired by exchange from share classes other than Class B shares. Please see the prospectus for more information. | |
| n | Class Y shares are available to only certain investors. Please see the prospectus for more information. |
Principal risks of investing in the Fund
| n | Developing markets securities risk. Securities issued by foreign companies and governments located in developing countries may be affected more negatively by inflation, devaluation of their currencies, higher transaction costs, delays in settlement, adverse political developments, the introduction of capital controls, withholding taxes, nationalization of private assets, expropriation, social unrest, war or lack of timely information than those in developed countries. | |
| n | Foreign securities risk. The Fund’s foreign investments may be affected by changes in a foreign country’s exchange rates; political and social instability; changes in economic or taxation policies; difficulties when enforcing obligations; decreased liquidity; and increased volatility. Foreign companies may be subject to less regulation resulting in less publicly available information about the companies. | |
| n | Geographic concentration risk. Because the Fund’s investments are concentrated in the Asia Pacific region, the Fund’s performance is expected to be closely tied to social, political, and economic conditions within the Asia Pacific region and to be more volatile than the performance of more geographically diversified funds. |
| n | Growth investing risk. Growth stocks tend to be more expensive relative to their earnings or assets compared with other types of stock. As a result they tend to be more sensitive to changes in their earnings and can be more volatile. | |
| n | IPO risk. Although the Fund’s return during certain periods was positively impacted by its investments in initial public offerings (IPOs), there can be no assurance that the Fund will have favorable IPO investment opportunities in the future. | |
| n | Management risk. The investment techniques and risk analysis used by the Fund’s portfolio managers may not produce the desired results. | |
| n | Market risk. The prices of and the income generated by the Fund’s securities may decline in response to, among other things, investor sentiment; general economic and market conditions; regional or global instability; and currency and interest rate fluctuations. |
About indexes used in this report
| n | The MSCI EAFE® Index is an unmanaged index considered representative of stocks of Europe, Australasia and the Far East. | |
| n | The MSCI All Country Asia Pacific Ex-Japan Index is an unmanaged index considered representative of Pacific region stock markets, excluding Japan. | |
| n | The Lipper Pacific Region Ex-Japan Funds Index is an unmanaged index considered representative of Pacific region ex-Japan funds tracked by Lipper. | |
| n | The Fund is not managed to track the performance of any particular index, including the index(es) defined here, and consequently, the performance of the Fund may deviate significantly from the performance of the index(es). |
| n | A direct investment cannot be made in an index. Unless otherwise indicated, index results include reinvested dividends, and they do not reflect sales charges. Performance of the peer group, if applicable, reflects fund expenses; performance of a market index does not. |
Other information
| n | The Chartered Financial Analyst® (CFA®) designation is globally recognized and attests to a charterholder’s success in a rigorous and comprehensive study program in the field of investment management and research analysis. | |
| n | CPA® and Certified Public Accountant® are trademarks owned by the American Institute of Certified Public Accountants. | |
| n | The returns shown in management’s discussion of Fund performance are based on net asset values calculated for shareholder transactions. Generally accepted accounting principles require adjustments to be made to the net assets of the Fund at period end for financial reporting purposes, and as such, the net asset values for shareholder transactions and the returns based on those net asset values may differ from the net asset values and returns reported in the Financial Highlights. | |
| n | Industry classifications used in this report are generally according to the Global Industry Classification Standard, which was developed by and is the exclusive property and a service mark of MSCI Inc. and Standard & Poor’s. |
This report must be accompanied or preceded by a currently effective Fund prospectus, which contains more complete information, including sales charges and expenses. Investors should read it carefully before investing.
NOT FDIC INSURED | MAY LOSE VALUE | NO BANK GUARANTEE
Fund Nasdaq Symbols
| Class A Shares | ASIAX | |
| Class B Shares | ASIBX | |
| Class C Shares | ASICX | |
| Class Y Shares | ASIYX |
8 | Invesco Asia Pacific Growth Fund |
Schedule of Investments
October 31, 2011
| Shares | Value | |||||||
| Common Stocks & Other Equity Interests–92.33% | ||||||||
| Australia–12.66% | ||||||||
| BHP Billiton Ltd. | 334,413 | $ | 13,083,249 | |||||
| Brambles Ltd. | 1,276,067 | 8,800,504 | ||||||
Coca-Cola Amatil Ltd. | 642,760 | 8,296,011 | ||||||
| Computershare Ltd. | 674,096 | 5,328,665 | ||||||
| CSL Ltd. | 381,718 | 11,423,903 | ||||||
| QBE Insurance Group Ltd. | 596,904 | 9,155,369 | ||||||
| WorleyParsons Ltd. | 376,574 | 10,889,650 | ||||||
| 66,977,351 | ||||||||
| China–17.37% | ||||||||
| Anta Sports Products Ltd. | 5,545,000 | 4,964,815 | ||||||
| China Yurun Food Group Ltd. | 2,826,000 | 4,858,101 | ||||||
| CNOOC Ltd.–ADR | 76,559 | 14,439,793 | ||||||
| Franshion Properties China Ltd. | 18,238,000 | 3,694,842 | ||||||
| Industrial & Commercial Bank of China Ltd.–Class H | 32,865,000 | 20,178,069 | ||||||
| Lee & Man Paper Manufacturing Ltd. | 15,764,000 | 6,392,057 | ||||||
| Minth Group Ltd. | 5,894,000 | 6,033,752 | ||||||
| NetEase.com Inc.–ADR | 182,510 | 8,645,499 | ||||||
| Stella International Holdings Ltd. | 5,562,500 | 12,579,661 | ||||||
| Vinda International Holdings Ltd. | 5,425,000 | 6,152,362 | ||||||
| Want Want China Holdings Ltd. | 4,307,000 | 3,966,260 | ||||||
| 91,905,211 | ||||||||
| Hong Kong–6.67% | ||||||||
| Cheung Kong (Holdings) Ltd. | 723,000 | 8,977,412 | ||||||
| China Mobile Ltd. | 835,000 | 7,957,262 | ||||||
| Dickson Concepts (International) Ltd. | 4,757,000 | 2,704,582 | ||||||
| Hongkong Land Holdings Ltd. | 619,000 | 3,241,889 | ||||||
| Hutchison Whampoa Ltd. | 1,094,000 | 9,995,451 | ||||||
| Paliburg Holdings Ltd. | 7,699,240 | 2,428,852 | ||||||
| 35,305,448 | ||||||||
| India–1.36% | ||||||||
| Infosys Technologies Ltd. | 122,594 | 7,219,053 | ||||||
| Indonesia–8.93% | ||||||||
| PT Bank Central Asia Tbk | 7,280,500 | 6,582,748 | ||||||
| PT Indocement Tunggal Prakarsa Tbk | 2,682,000 | 4,855,282 | ||||||
| PT Perusahaan Gas Negara | 34,198,000 | 11,212,129 | ||||||
| PT Summarecon Agung Tbk | 100,487,000 | 13,062,624 | ||||||
| PT Telekomunikasi Indonesia Tbk | 13,859,000 | 11,505,141 | ||||||
| 47,217,924 | ||||||||
| Malaysia–7.49% | ||||||||
Kossan Rubber Industries Berhad(a) | 15,057,500 | 13,983,511 | ||||||
| Parkson Holdings Berhad | 6,772,777 | 12,318,987 | ||||||
| Public Bank Berhad | 3,220,000 | 13,312,795 | ||||||
| 39,615,293 | ||||||||
| Philippines–13.29% | ||||||||
| Ayala Corp. | 1,240,250 | 8,772,441 | ||||||
| Energy Development Corp. | 56,110,650 | 7,946,946 | ||||||
First Gen Corp.(b)(c) | 1,919,100 | 617,578 | ||||||
First Gen Corp.(c) | 35,899,189 | 11,552,586 | ||||||
GMA Holdings, Inc.–PDR(a)(b) | 1,468,000 | 219,217 | ||||||
GMA Holdings, Inc.–PDR(a) | 49,179,200 | 7,343,965 | ||||||
| Manila Water Co. | 9,073,600 | 4,119,725 | ||||||
| Philippine Long Distance Telephone Co. | 228,910 | 12,760,592 | ||||||
| SM Investments Corp. | 1,317,145 | 17,006,909 | ||||||
| 70,339,959 | ||||||||
| Singapore–3.70% | ||||||||
| Keppel Corp. Ltd. | 1,480,200 | 11,058,214 | ||||||
| United Overseas Bank Ltd. | 626,000 | 8,481,926 | ||||||
| 19,540,140 | ||||||||
| South Korea–8.56% | ||||||||
| Hyundai Department Store Co., Ltd. | 64,249 | 9,176,369 | ||||||
| Hyundai MOBIS | 28,099 | 8,092,883 | ||||||
| Lotte Confectionery Co., Ltd. | 2,498 | 3,904,514 | ||||||
| MegaStudy Co., Ltd. | 47,261 | 5,230,848 | ||||||
| NHN Corp. | 67,295 | 14,023,957 | ||||||
| S1 Corp. | 93,459 | 4,862,306 | ||||||
| 45,290,877 | ||||||||
| Taiwan–4.12% | ||||||||
| Taiwan Semiconductor Manufacturing Co. Ltd. | 6,775,464 | 16,524,169 | ||||||
| Wistron Corp. | 4,554,673 | 5,276,844 | ||||||
| 21,801,013 | ||||||||
| Thailand–8.18% | ||||||||
| BEC World PCL | 3,643,100 | 4,418,764 | ||||||
| CP ALL PCL | 1,322,200 | 2,013,964 | ||||||
| Kasikornbank PCL | 3,426,500 | 13,791,392 | ||||||
| Major Cineplex Group PCL | 16,339,300 | 6,346,566 | ||||||
| Siam Commercial Bank PCL | 3,255,900 | 12,296,785 | ||||||
| Thai Stanley Electric PCL–Class F | 960,700 | 4,405,645 | ||||||
| 43,273,116 | ||||||||
| Total Common Stocks & Other Equity Interests (Cost $382,203,241) | 488,485,385 | |||||||
See accompanying Notes to Financial Statements which are an integral part of the financial statements.
9 Invesco Asia Pacific Growth Fund
| Shares | Value | |||||||
| Money Market Funds–7.45% | ||||||||
Liquid Assets Portfolio–Institutional Class(d) | 19,696,497 | $ | 19,696,497 | |||||
Premier Portfolio–Institutional Class(d) | 19,696,498 | 19,696,498 | ||||||
| Total Money Market Funds (Cost $39,392,995) | 39,392,995 | |||||||
| TOTAL INVESTMENTS–99.78% (Cost $421,596,236) | 527,878,380 | |||||||
| OTHER ASSETS LESS LIABILITIES–0.22% | 1,168,613 | |||||||
| NET ASSETS–100.00% | $ | 529,046,993 | ||||||
Investment Abbreviations:
| ADR | – American Depositary Receipts | |
| PDR | – Philippine Deposit Receipts |
Notes to Schedule of Investments:
| (a) | Affiliated company during the period. The Investment Company Act of 1940 defines affiliates as those companies in which a fund holds 5% or more of the outstanding voting securities. The Fund has not owned enough of the outstanding voting securities of the issuer to have control (as defined in the Investment Company Act of 1940) of that issuer. The aggregate value of these securities as of October 31, 2011 was $21,546,693 which represented 4.07% of the Fund’s Net Assets. See Note 4. | |
| (b) | Security purchased or received in a transaction exempt from registration under the Securities Act of 1933, as amended. The security may be resold pursuant to an exemption from registration under the 1933 Act, typically to qualified institutional buyers. The aggregate value of these securities at October 31, 2011 was $836,795, which represented 0.16% of the Fund’s Net Assets. | |
| (c) | Non-income producing security | |
| (d) | The money market fund and the Fund are affiliated by having the same investment adviser. |
See accompanying Notes to Financial Statements which are an integral part of the financial statements.
10 Invesco Asia Pacific Growth Fund
Statement of Assets and Liabilities
October 31, 2011
| Assets: | ||||
| Investments, at value (Cost $382,203,241) | $ | 488,485,385 | ||
| Investments in affiliated money market funds, at value and cost | 39,392,995 | |||
| Total investments, at value (Cost $421,596,236) | 527,878,380 | |||
| Foreign currencies, at value (Cost $2,496,798) | 2,587,576 | |||
| Receivable for: | ||||
| Investments sold | 569,949 | |||
| Fund shares sold | 1,899,499 | |||
| Dividends | 5,898 | |||
| Investment for trustee deferred compensation and retirement plans | 37,769 | |||
| Other assets | 23,263 | |||
| Total assets | 533,002,334 | |||
| Liabilities: | ||||
| Payable for: | ||||
| Fund shares reacquired | 959,578 | |||
| Accrued fees to affiliates | 382,755 | |||
| Accrued other operating expenses | 2,531,928 | |||
| Trustee deferred compensation and retirement plans | 81,080 | |||
| Total liabilities | 3,955,341 | |||
| Net assets applicable to shares outstanding | $ | 529,046,993 | ||
| Net assets consist of: | ||||
| Shares of beneficial interest | $ | 380,987,399 | ||
| Undistributed net investment income | 3,834,127 | |||
| Undistributed net realized gain | 37,852,244 | |||
| Unrealized appreciation | 106,373,223 | |||
| $ | 529,046,993 | |||
| Net Assets: | ||||
| Class A | $ | 385,828,477 | ||
| Class B | $ | 30,393,729 | ||
| Class C | $ | 76,962,296 | ||
| Class Y | $ | 35,862,491 | ||
| Shares outstanding, $0.001 par value per share, with an unlimited number of shares authorized: | ||||
| Class A | 13,576,975 | |||
| Class B | 1,136,894 | |||
| Class C | 2,893,375 | |||
| Class Y | 1,257,620 | |||
| Class A: | ||||
| Net asset value per share | $ | 28.42 | ||
| Maximum offering price per share | ||||
(Net asset value of $28.42 ¸ 94.50%) | $ | 30.07 | ||
| Class B: | ||||
| Net asset value and offering price per share | $ | 26.73 | ||
| Class C: | ||||
| Net asset value and offering price per share | $ | 26.60 | ||
| Class Y: | ||||
| Net asset value and offering price per share | $ | 28.52 | ||
See accompanying Notes to Financial Statements which are an integral part of the financial statements.
11 Invesco Asia Pacific Growth Fund
Statement of Operations
For the year ended October 31, 2011
| Investment income: | ||||
| Dividends (net of foreign withholding taxes of $1,784,617) | $ | 13,678,739 | ||
| Dividends from affiliates | 716,088 | |||
| Total investment income | 14,394,827 | |||
| Expenses: | ||||
| Advisory fees | 5,372,018 | |||
| Administrative services fees | 164,739 | |||
| Custodian fees | 528,409 | |||
| Distribution fees: | ||||
| Class A | 1,061,456 | |||
| Class B | 372,225 | |||
| Class C | 883,167 | |||
| Transfer agent fees | 1,292,724 | |||
| Trustees’ and officers’ fees and benefits | 30,568 | |||
| Other | 228,097 | |||
| Total expenses | 9,933,403 | |||
| Less: Fees waived, expenses reimbursed and expense offset arrangement(s) | (111,080 | ) | ||
| Net expenses | 9,822,323 | |||
| Net investment income | 4,572,504 | |||
| Realized and unrealized gain (loss) from: | ||||
| Net realized gain (loss) from: | ||||
| Investment securities (includes net of foreign taxes of $663,530) | 37,885,780 | |||
| Foreign currencies | (49,754 | ) | ||
| 37,836,026 | ||||
| Change in net unrealized appreciation (depreciation) of: | ||||
| Investment securities (net of foreign taxes on holdings of $596,247) | (72,136,719 | ) | ||
| Foreign currencies | 31,089 | |||
| (72,105,630 | ) | |||
| Net realized and unrealized gain (loss) | (34,269,604 | ) | ||
| Net increase (decrease) in net assets resulting from operations | $ | (29,697,100 | ) | |
See accompanying Notes to Financial Statements which are an integral part of the financial statements.
12 Invesco Asia Pacific Growth Fund
Statement of Changes in Net Assets
For the years ended October 31, 2011 and 2010
| 2011 | 2010 | |||||||
| Operations: | ||||||||
| Net investment income | $ | 4,572,504 | $ | 3,494,035 | ||||
| Net realized gain | 37,836,026 | 31,478,238 | ||||||
| Change in net unrealized appreciation (depreciation) | (72,105,630 | ) | 114,587,227 | |||||
| Net increase (decrease) in net assets resulting from operations | (29,697,100 | ) | 149,559,500 | |||||
| Distributions to shareholders from net investment income: | ||||||||
| Class A | (3,296,075 | ) | (3,879,814 | ) | ||||
| Class B | (92,167 | ) | (275,097 | ) | ||||
| Class C | (205,092 | ) | (443,821 | ) | ||||
| Class Y | (325,228 | ) | (174,270 | ) | ||||
| Total distributions from net investment income | (3,918,562 | ) | (4,773,002 | ) | ||||
| Distributions to shareholders from net realized gains: | ||||||||
| Class A | (3,602,407 | ) | — | |||||
| Class B | (361,815 | ) | — | |||||
| Class C | (805,153 | ) | — | |||||
| Class Y | (283,195 | ) | — | |||||
| Total distributions from net realized gains | (5,052,570 | ) | — | |||||
| Share transactions–net: | ||||||||
| Class A | (15,948,252 | ) | 23,943,896 | |||||
| Class B | (7,542,507 | ) | (6,061,150 | ) | ||||
| Class C | (2,772,610 | ) | 9,548,306 | |||||
| Class Y | 5,729,512 | 14,277,167 | ||||||
| Net increase (decrease) in net assets resulting from share transactions | (20,533,857 | ) | 41,708,219 | |||||
| Net increase (decrease) in net assets | (59,202,089 | ) | 186,494,717 | |||||
| Net assets: | ||||||||
| Beginning of year | 588,249,082 | 401,754,365 | ||||||
| End of year (includes undistributed net investment income of $3,834,127 and $3,811,112, respectively) | $ | 529,046,993 | $ | 588,249,082 | ||||
Notes to Financial Statements
October 31, 2011
NOTE 1—Significant Accounting Policies
Invesco Asia Pacific Growth Fund (the “Fund”) is a series portfolio of AIM International Mutual Funds (Invesco International Mutual Funds) (the “Trust”). The Trust is a Delaware statutory trust registered under the Investment Company Act of 1940, as amended (the “1940 Act”), as an open-end series management investment company consisting of six separate portfolios, each authorized to issue an unlimited number of shares of beneficial interest. The assets, liabilities and operations of each portfolio are accounted for separately. Information presented in these financial statements pertains only to the Fund. Matters affecting each portfolio or class will be voted on exclusively by the shareholders of such portfolio or class.
The Fund’s investment objective is long-term growth of capital.
The Fund currently consists of four different classes of shares: Class A, Class B, Class C and Class Y. Class A shares are sold with a front-end sales charge unless certain waiver criteria are met and under certain circumstances load waived shares may be subject to contingent deferred sales charges (“CDSC”). Class C shares are sold with a CDSC. Class Y shares are sold at net asset value. Effective November 30, 2010, new or additional investments in Class B shares are no longer permitted. Existing shareholders of Class B shares may continue to reinvest dividends and capital gains distributions in Class B shares until they convert. Also, shareholders in Class B shares will be able to exchange those shares for Class B shares of other Invesco Funds offering such shares until they convert.
13 Invesco Asia Pacific Growth Fund
Generally, Class B shares will automatically convert to Class A shares on or about the month-end which is at least eight years after the date of purchase. Redemption of Class B shares prior to conversion date will be subject to a CDSC.
The following is a summary of the significant accounting policies followed by the Fund in the preparation of its financial statements.
| A. | Security Valuations — Securities, including restricted securities, are valued according to the following policy. | |
| A security listed or traded on an exchange (except convertible bonds) is valued at its last sales price or official closing price as of the close of the customary trading session on the exchange where the security is principally traded, or lacking any sales or official closing price on a particular day, the security may be valued at the closing bid price on that day. Securities traded in the over-the-counter market are valued based on prices furnished by independent pricing services or market makers. When such securities are valued by an independent pricing service they may be considered fair valued. Futures contracts are valued at the final settlement price set by an exchange on which they are principally traded. Listed options are valued at the mean between the last bid and ask prices from the exchange on which they are principally traded. Options not listed on an exchange are valued by an independent source at the mean between the last bid and ask prices. For purposes of determining net asset value per share, futures and option contracts generally are valued 15 minutes after the close of the customary trading session of the New York Stock Exchange (“NYSE”). | ||
| Investments in open-end and closed-end registered investment companies that do not trade on an exchange are valued at the end of day net asset value per share. Investments in open-end and closed-end registered investment companies that trade on an exchange are valued at the last sales price or official closing price as of the close of the customary trading session on the exchange where the security is principally traded. | ||
| Debt obligations (including convertible bonds) and unlisted equities are fair valued using an evaluated quote provided by an independent pricing service. Evaluated quotes provided by the pricing service may be determined without exclusive reliance on quoted prices, and may reflect appropriate factors such as institution-size trading in similar groups of securities, developments related to specific securities, dividend rate, yield, quality, type of issue, coupon rate, maturity, individual trading characteristics and other market data. Debt securities are subject to interest rate and credit risks. In addition, all debt securities involve some risk of default with respect to interest and/or principal payments. | ||
| Foreign securities (including foreign exchange contracts) are converted into U.S. dollar amounts using the applicable exchange rates as of the close of the NYSE. If market quotations are available and reliable for foreign exchange traded equity securities, the securities will be valued at the market quotations. Because trading hours for certain foreign securities end before the close of the NYSE, closing market quotations may become unreliable. If between the time trading ends on a particular security and the close of the customary trading session on the NYSE, events occur that are significant and make the closing price unreliable, the Fund may fair value the security. If the event is likely to have affected the closing price of the security, the security will be valued at fair value in good faith using procedures approved by the Board of Trustees. Adjustments to closing prices to reflect fair value may also be based on a screening process of an independent pricing service to indicate the degree of certainty, based on historical data, that the closing price in the principal market where a foreign security trade is not the current value as of the close of the NYSE. Foreign securities meeting the approved degree of certainty that the price is not reflective of current value will be priced at the indication of fair value from the independent pricing service. Multiple factors may be considered by the independent pricing service in determining adjustments to reflect fair value and may include information relating to sector indices, American Depositary Receipts and domestic and foreign index futures. Foreign securities may have additional risks including exchange rate changes, potential for sharply devalued currencies and high inflation, political and economical upheaval, the relative lack of issuer information, relatively low market liquidity and the potential lack of strict financial and accounting controls and standards. | ||
| Securities for which market prices are not provided by any of the above methods may be valued based upon quotes furnished by independent sources. The last bid price may be used to value equity securities. The mean between the last bid and asked prices is used to value debt obligations, including Corporate Loans. | ||
| Securities for which market quotations are not readily available or are unreliable are valued at fair value as determined in good faith by or under the supervision of the Trust’s officers following procedures approved by the Board of Trustees. Issuer specific events, market trends, bid/ask quotes of brokers and information providers and other market data may be reviewed in the course of making a good faith determination of a security’s fair value. | ||
| Valuations change in response to many factors including the historical and prospective earnings of the issuer, the value of the issuer’s assets, general economic conditions, interest rates, investor perceptions and market liquidity. Because of the inherent uncertainties of valuation, the values reflected in the financial statements may materially differ from the value received upon actual sale of those investments. | ||
| B. | Securities Transactions and Investment Income — Securities transactions are accounted for on a trade date basis. Realized gains or losses on sales are computed on the basis of specific identification of the securities sold. Interest income is recorded on the accrual basis from settlement date. Dividend income (net of withholding tax, if any) is recorded on the ex-dividend date. | |
| The Fund may periodically participate in litigation related to Fund investments. As such, the Fund may receive proceeds from litigation settlements. Any proceeds received are included in the Statement of Operations as realized gain (loss) for investments no longer held and as unrealized gain (loss) for investments still held. | ||
| Brokerage commissions and mark ups are considered transaction costs and are recorded as an increase to the cost basis of securities purchased and/or a reduction of proceeds on a sale of securities. Such transaction costs are included in the determination of net realized and unrealized gain (loss) from investment securities reported in the Statement of Operations and the Statement of Changes in Net Assets and the net realized and unrealized gains (losses) on securities per share in the Financial Highlights. Transaction costs are included in the calculation of the Fund’s net asset value and, accordingly, they reduce the Fund’s total returns. These transaction costs are not considered operating expenses and are not reflected in net investment income reported in the Statement of Operations and Statement of Changes in Net Assets, or the net investment income per share and ratios of expenses and net investment income reported in the Financial Highlights, nor are they limited by any expense limitation arrangements between the Fund and the investment adviser. | ||
| The Fund allocates income and realized and unrealized capital gains and losses to a class based on the relative net assets of each class. | ||
| C. | Country Determination — For the purposes of making investment selection decisions and presentation in the Schedule of Investments, the investment adviser may determine the country in which an issuer is located and/or credit risk exposure based on various factors. These factors include the laws of the country under which the issuer is organized, where the issuer maintains a principal office, the country in which the issuer derives 50% or more |
14 Invesco Asia Pacific Growth Fund
| of its total revenues and the country that has the primary market for the issuer’s securities, as well as other criteria. Among the other criteria that may be evaluated for making this determination are the country in which the issuer maintains 50% or more of its assets, the type of security, financial guarantees and enhancements, the nature of the collateral and the sponsor organization. Country of issuer and/or credit risk exposure has been determined to be the United States of America, unless otherwise noted. | ||
| D. | Distributions — Distributions from income and net realized capital gain, if any, are generally paid annually and recorded on ex-dividend date. The Fund may elect to treat a portion of the proceeds from redemptions as distributions for federal income tax purposes. | |
| E. | Federal Income Taxes — The Fund intends to comply with the requirements of Subchapter M of the Internal Revenue Code necessary to qualify as a regulated investment company and to distribute substantially all of the Fund’s taxable earnings to shareholders. As such, the Fund will not be subject to federal income taxes on otherwise taxable income (including net realized capital gain) that is distributed to shareholders. Therefore, no provision for federal income taxes is recorded in the financial statements. | |
| The Fund files tax returns in the U.S. Federal jurisdiction and certain other jurisdictions. Generally, the Fund is subject to examinations by such taxing authorities for up to three years after the filing of the return for the tax period. | ||
| F. | Expenses — Fees provided for under the Rule 12b-1 plan of a particular class of the Fund and which are directly attributable to that class are charged to the operations of such class. All other expenses are allocated among the classes based on relative net assets. | |
| G. | Accounting Estimates — The preparation of financial statements in conformity with accounting principles generally accepted in the United States of America (“GAAP”) requires management to make estimates and assumptions that affect the reported amounts of assets and liabilities at the date of the financial statements and the reported amounts of revenues and expenses during the reporting period including estimates and assumptions related to taxation. Actual results could differ from those estimates by a significant amount. In addition, the Fund monitors for material events or transactions that may occur or become known after the period-end date and before the date the financial statements are released to print. | |
| H. | Indemnifications — Under the Trust’s organizational documents, each Trustee, officer, employee or other agent of the Trust is indemnified against certain liabilities that may arise out of performance of their duties to the Fund. Additionally, in the normal course of business, the Fund enters into contracts, including the Fund’s servicing agreements that contain a variety of indemnification clauses. The Fund’s maximum exposure under these arrangements is unknown as this would involve future claims that may be made against the Fund that have not yet occurred. The risk of material loss as a result of such indemnification claims is considered remote. | |
| I. | Redemption Fees — The Fund has a 2% redemption fee that is to be retained by the Fund to offset transaction costs and other expenses associated with short-term redemptions and exchanges. The fee, subject to certain exceptions, is imposed on certain redemptions or exchanges of shares within 31 days of purchase. The redemption fee is recorded as an increase in shareholder capital and is allocated among the share classes based on the relative net assets of each class. Effective January 1, 2012, the Fund will eliminate the 2% redemption fee, if applicable, assessed on shares of the Fund redeemed or exchanged within 31 days of purchase. | |
| J. | Foreign Currency Translations — Foreign currency is valued at the close of the NYSE based on quotations posted by banks and major currency dealers. Portfolio securities and other assets and liabilities denominated in foreign currencies are translated into U.S. dollar amounts at date of valuation. Purchases and sales of portfolio securities (net of foreign taxes withheld on disposition) and income items denominated in foreign currencies are translated into U.S. dollar amounts on the respective dates of such transactions. The Fund does not separately account for the portion of the results of operations resulting from changes in foreign exchange rates on investments and the fluctuations arising from changes in market prices of securities held. The combined results of changes in foreign exchange rates and the fluctuation of market prices on investments (net of estimated foreign tax withholding) are included with the net realized and unrealized gain or loss from investments in the Statement of Operations. Reported net realized foreign currency gains or losses arise from (1) sales of foreign currencies, (2) currency gains or losses realized between the trade and settlement dates on securities transactions, and (3) the difference between the amounts of dividends, interest, and foreign withholding taxes recorded on the Fund’s books and the U.S. dollar equivalent of the amounts actually received or paid. Net unrealized foreign currency gains and losses arise from changes in the fair values of assets and liabilities, other than investments in securities at fiscal period end, resulting from changes in exchange rates. | |
| The Fund may invest in foreign securities which may be subject to foreign taxes on income, gains on investments or currency repatriation, a portion of which may be recoverable. | ||
| K. | Foreign Currency Contracts — The Fund may enter into foreign currency contracts to manage or minimize currency or exchange rate risk. The Fund may also enter into foreign currency contracts for the purchase or sale of a security denominated in a foreign currency in order to “lock in” the U.S. dollar price of that security. A foreign currency contract is an obligation to purchase or sell a specific currency for an agreed-upon price at a future date. The use of foreign currency contracts does not eliminate fluctuations in the price of the underlying securities the Fund owns or intends to acquire but establishes a rate of exchange in advance. Fluctuations in the value of these contracts are measured by the difference in the contract date and reporting date exchange rates and are recorded as unrealized appreciation (depreciation) until the contracts are closed. When the contracts are closed, realized gains (losses) are recorded. Realized and unrealized gains (losses) on the contracts are included in the Statement of Operations. The primary risks associated with foreign currency contracts include failure of the counterparty to meet the terms of the contract and the value of the foreign currency changing unfavorably. These risks may be in excess of the amounts reflected in the Statement of Assets and Liabilities. |
15 Invesco Asia Pacific Growth Fund
NOTE 2—Advisory Fees and Other Fees Paid to Affiliates
The Trust has entered into a master investment advisory agreement with Invesco Advisers, Inc. (the “Adviser” or “Invesco”). Under the terms of the investment advisory agreement, the Fund pays an advisory fee to the Adviser based on the annual rate of the Fund’s average daily net assets as follows:
| Average Daily Net Assets | Rate | |||
| First $250 million | 0 | .935% | ||
| Next $250 million | 0 | .91% | ||
| Next $500 million | 0 | .885% | ||
| Next $1.5 billion | 0 | .86% | ||
| Next $2.5 billion | 0 | .835% | ||
| Next $2.5 billion | 0 | .81% | ||
| Next $2.5 billion | 0 | .785% | ||
| Over $10 billion | 0 | .76% | ||
Under the terms of a master sub-advisory agreement between the Adviser and each of Invesco Asset Management Deutschland GmbH, Invesco Asset Management Limited, Invesco Asset Management (Japan) Limited, Invesco Australia Limited, Invesco Hong Kong Limited, Invesco Senior Secured Management, Inc. and Invesco Canada Ltd. (collectively, the “Affiliated Sub-Advisers”) the Adviser, not the Fund, may pay 40% of the fees paid to the Adviser to any such Affiliated Sub-Adviser(s) that provide discretionary investment management services to the Fund based on the percentage of assets allocated to such Sub-Adviser(s).
The Adviser has contractually agreed, through at least February 28, 2013, to waive advisory fees and/or reimburse expenses of all shares to the extent necessary to limit total annual fund operating expenses after fee waiver and/or expense reimbursement (excluding certain items discussed below) of Class A, Class B, Class C and Class Y shares to 2.25%, 3.00%, 3.00% and 2.00%, respectively, of average daily net assets. In determining the Adviser’s obligation to waive advisory fees and/or reimburse expenses, the following expenses are not taken into account, and could cause the total annual fund operating expenses after fee waiver and/or expense reimbursement to exceed the numbers reflected above: (1) interest; (2) taxes; (3) dividend expense on short sales; (4) extraordinary or non-routine items; and (5) expenses that the Fund has incurred but did not actually pay because of an expense offset arrangement. Unless the Board of the Trustees and Invesco mutually agree to amend or continue the fee waiver agreement, it will terminate on February 28, 2013. The Advisor did not waive fees and/or reimburse expenses during the period under this expense limitation.
The Adviser has contractually agreed, through at least June 30, 2012, to waive the advisory fee payable by the Fund in an amount equal to 100% of the net advisory fees the Adviser receives from the affiliated money market funds on investments by the Fund of uninvested cash in such affiliated money market funds.
For the year ended October 31, 2011, the Adviser waived advisory fees of $106,502.
At the request of the Trustees of the Trust, Invesco Ltd. agreed to reimburse expenses incurred by the Fund in connection with market timing matters in the Invesco Funds, which may include legal, audit, shareholder reporting, communications and trustee expenses. These expenses along with the related expense reimbursement are included in the Statement of Operations. For the year ended October 31, 2011, Invesco Ltd. reimbursed expenses of the Fund in the amount of $1,863.
The Trust has entered into a master administrative services agreement with Invesco pursuant to which the Fund has agreed to pay Invesco for certain administrative costs incurred in providing accounting services to the Fund. For the year ended October 31, 2011, expenses incurred under the agreement are shown in the Statement of Operations as administrative services fees.
The Trust has entered into a transfer agency and service agreement with Invesco Investment Services, Inc. (“IIS”) pursuant to which the Fund has agreed to pay IIS a fee for providing transfer agency and shareholder services to the Fund and reimburse IIS for certain expenses incurred by IIS in the course of providing such services. IIS may make payments to intermediaries that provide omnibus account services, sub-accounting services and/or networking services. All fees payable by IIS to intermediaries that provide omnibus account services or sub-accounting are charged back to the Fund, subject to certain limitations approved by the Trust’s Board of Trustees. For the year ended October 31, 2011, the expenses incurred under the agreement are shown in the Statement of Operations as transfer agent fees.
The Trust has entered into master distribution agreements with Invesco Distributors, Inc. (“IDI”) to serve as the distributor for the Class A, Class B, Class C and Class Y shares of the Fund. The Trust has adopted plans pursuant to Rule 12b-1 under the 1940 Act with respect to the Fund’s Class A, Class B and Class C shares (collectively, the “Plans”). The Fund, pursuant to the Plans, pays IDI compensation at the annual rate of 0.25% of the Fund’s average daily net assets of Class A shares and 1.00% of the average daily net assets of each class of Class B and Class C shares. Of the Plan payments, up to 0.25% of the average daily net assets of each class of shares may be paid to furnish continuing personal shareholder services to customers who purchase and own shares of such classes. Any amounts not paid as a service fee under the Plans would constitute an asset-based sales charge. Rules of the Financial Industry Regulatory Authority (“FINRA”) impose a cap on the total sales charges, including asset-based sales charges that may be paid by any class of shares of the Fund. For the year ended October 31, 2011, expenses incurred under the Plans are shown in the Statement of Operations as distribution fees.
Front-end sales commissions and CDSC (collectively, the “sales charges”) are not recorded as expenses of the Fund. Front-end sales commissions are deducted from proceeds from the sales of Fund shares prior to investment in Class A shares of the Fund. CDSC are deducted from redemption proceeds prior to remittance to the shareholder. During the year ended October 31, 2011, IDI advised the Fund that IDI retained $148,582 in front-end sales commissions from the sale of Class A shares and $6,716, $58,322 and $23,753 from Class A, Class B and Class C shares, respectively, for CDSC imposed on redemptions by shareholders.
Certain officers and trustees of the Trust are officers and directors of the Adviser, Invesco Ltd., IIS and/or IDI.
16 Invesco Asia Pacific Growth Fund
NOTE 3—Additional Valuation Information
GAAP defines fair value as the price that would be received to sell an asset or paid to transfer a liability in an orderly transaction between market participants at the measurement date, under current market conditions. GAAP establishes a hierarchy that prioritizes the inputs to valuation methods giving the highest priority to readily available unadjusted quoted prices in an active market for identical assets (Level 1) and the lowest priority to significant unobservable inputs (Level 3) generally when market prices are not readily available or are unreliable. Based on the valuation inputs, the securities or other investments are tiered into one of three levels. Changes in valuation methods may result in transfers in or out of an investment’s assigned level:
| Level 1 — | Prices are determined using quoted prices in an active market for identical assets. | |
| Level 2 — | Prices are determined using other significant observable inputs. Observable inputs are inputs that other market participants may use in pricing a security. These may include quoted prices for similar securities, interest rates, prepayment speeds, credit risk, yield curves, loss severities, default rates, discount rates, volatilities and others. | |
| Level 3 — | Prices are determined using significant unobservable inputs. In situations where quoted prices or observable inputs are unavailable (for example, when there is little or no market activity for an investment at the end of the period), unobservable inputs may be used. Unobservable inputs reflect the Fund’s own assumptions about the factors market participants would use in determining fair value of the securities or instruments and would be based on the best available information. |
The following is a summary of the tiered valuation input levels, as of October 31, 2011. The level assigned to the securities valuations may not be an indication of the risk or liquidity associated with investing in those securities. Because of the inherent uncertainties of valuation, the values reflected in the financial statements may materially differ from the value received upon actual sale of those investments.
| Level 1* | Level 2* | Level 3 | Total | |||||||||||||
| Australia | $ | — | $ | 66,977,351 | $ | — | $ | 66,977,351 | ||||||||
| China | 23,085,292 | 68,819,919 | — | 91,905,211 | ||||||||||||
| Hong Kong | — | 35,305,448 | — | 35,305,448 | ||||||||||||
| India | — | 7,219,053 | — | 7,219,053 | ||||||||||||
| Indonesia | — | 47,217,924 | — | 47,217,924 | ||||||||||||
| Malaysia | — | 39,615,293 | — | 39,615,293 | ||||||||||||
| Philippines | 7,563,182 | 62,776,777 | — | 70,339,959 | ||||||||||||
| Singapore | — | 19,540,140 | — | 19,540,140 | ||||||||||||
| South Korea | — | 45,290,877 | — | 45,290,877 | ||||||||||||
| Taiwan | — | 21,801,013 | — | 21,801,013 | ||||||||||||
| Thailand | — | 43,273,116 | — | 43,273,116 | ||||||||||||
| United States | 39,392,995 | — | — | 39,392,995 | ||||||||||||
| Total Investments | $ | 70,041,469 | $ | 457,836,911 | $ | — | $ | 527,878,380 | ||||||||
| * | Transfers occured between Level 1 and Level 2 due to foreign fair value adjustments. |
NOTE 4—Investments in Other Affiliates
The Investment Company Act of 1940 defines affiliates as those issuances in which a fund holds 5% or more of the outstanding voting securities. The Fund has not owned enough of the outstanding voting securities of the issuer to have control (as defined in the Investment Company Act of 1940) of that issuer. The following is a summary of the investments in affiliates for the year ended October 31, 2011.
| Change in | ||||||||||||||||||||||||||||
| Value | Purchases | Proceeds | Unrealized | Realized | Value | Dividend | ||||||||||||||||||||||
| 10/31/10 | at Cost | from Sales | Appreciation | Gain (Loss) | 10/31/11 | Income | ||||||||||||||||||||||
| GMA Holdings, Inc. — PDR* | $ | 8,314,922 | $ | 300,436 | $ | — | $ | (1,052,176 | ) | $ | — | $ | 7,563,182 | $ | 277,738 | |||||||||||||
| Kossan Rubber Industries* | 11,153,408 | 3,995,218 | — | (1,165,115 | ) | — | 13,983,511 | 368,406 | ||||||||||||||||||||
| Total | $ | 19,468,330 | $ | 4,295,654 | $ | — | $ | (2,217,291 | ) | — | $ | 21,546,693 | $ | 646,144 | ||||||||||||||
| * | As of October 31, 2011, the security is no longer an affiliate of the Fund. |
NOTE 5—Expense Offset Arrangement(s)
The expense offset arrangement is comprised of transfer agency credits which result from balances in Demand Deposit Accounts (DDA) used by the transfer agent for clearing shareholder transactions. For the year ended October 31, 2011, the Fund received credits from this arrangement, which resulted in the reduction of the Fund’s total expenses of $2,715.
17 Invesco Asia Pacific Growth Fund
NOTE 6—Trustees’ and Officers’ Fees and Benefits
“Trustees’ and Officers’ Fees and Benefits” include amounts accrued by the Fund to pay remuneration to certain Trustees and Officers of the Fund. Trustees have the option to defer compensation payable by the Fund, and “Trustees’ and Officers’ Fees and Benefits” also include amounts accrued by the Fund to fund such deferred compensation amounts. Those Trustees who defer compensation have the option to select various Invesco Funds in which their deferral accounts shall be deemed to be invested. Finally, certain current Trustees are eligible to participate in a retirement plan that provides for benefits to be paid upon retirement to Trustees over a period of time based on the number of years of service. The Fund may have certain former Trustees who also participate in a retirement plan and receive benefits under such plan. “Trustees’ and Officers’ Fees and Benefits” include amounts accrued by the Fund to fund such retirement benefits. Obligations under the deferred compensation and retirement plans represent unsecured claims against the general assets of the Fund.
During the year ended October 31, 2011, the Fund paid legal fees of $2,416 for services rendered by Kramer, Levin, Naftalis & Frankel LLP as counsel to the Independent Trustees. A partner of that firm is a Trustee of the Trust.
NOTE 7—Cash Balances
The Fund is permitted to temporarily carry a negative or overdrawn balance in its account with The State Street Bank and Trust Company, the custodian bank. To compensate the custodian bank for such overdrafts, the overdrawn Fund may either (1) leave funds as a compensating balance in the account so the custodian bank can be compensated by earning the additional interest; or (2) compensate by paying the custodian bank at a rate agreed upon by the custodian bank and Invesco, not to exceed the contractually agreed upon rate.
NOTE 8—Distributions to Shareholders and Tax Components of Net Assets
Tax Character of Distributions to Shareholders Paid During the Years Ended October 31, 2011 and 2010:
| 2011 | 2010 | |||||||
| Ordinary income | $ | 3,918,683 | $ | 4,773,002 | ||||
| Long-term capital gain | 5,052,449 | — | ||||||
| Total distributions | $ | 8,971,132 | $ | 4,773,002 | ||||
Tax Components of Net Assets at Period-End:
| 2011 | ||||
| Undistributed ordinary income | $ | 3,911,702 | ||
| Undistributed long-term gain | 38,569,003 | |||
| Net unrealized appreciation — investments | 105,564,105 | |||
| Net unrealized appreciation — other investments | 91,079 | |||
| Temporary book/tax differences | (76,295 | ) | ||
| Shares of beneficial interest | 380,987,399 | |||
| Total net assets | $ | 529,046,933 | ||
The difference between book-basis and tax-basis unrealized appreciation (depreciation) is due to differences in the timing of recognition of gains and losses on investments for tax and book purposes. The Fund’s net unrealized appreciation difference is attributable primarily to wash sales.
The temporary book/tax differences are a result of timing differences between book and tax recognition of income and/or expenses. The Fund’s temporary book/tax differences are primarily a result of trustee deferral of compensation and retirement plan benefits.
The Fund does not have a capital loss carryforward at period-end.
NOTE 9—Investment Securities
The aggregate amount of investment securities (other than short-term securities, U.S. Treasury obligations and money market funds, if any) purchased and sold by the Fund during the year ended October 31, 2011 was $145,800,430 and $140,900,624, respectively. Cost of investments on a tax basis includes the adjustments for financial reporting purposes as of the most recently completed Federal income tax reporting period-end.
| Unrealized Appreciation (Depreciation) of Investment Securities on a Tax Basis | ||||
| Aggregate unrealized appreciation of investment securities | $ | 130,887,986 | ||
| Aggregate unrealized (depreciation) of investment securities | (25,323,881 | ) | ||
| Net unrealized appreciation of investment securities | $ | 105,564,105 | ||
| Cost of investments for tax purposes is $422,314,275. | ||||
18 Invesco Asia Pacific Growth Fund
NOTE 10—Reclassification of Permanent Differences
Primarily as a result of differing book/tax treatment of foreign currency transactions and the treatment of foreign capital gains, on October 31, 2011, undistributed net investment income was decreased by $630,927, undistributed net realized gain was increased by $630,927. This reclassification had no effect on the net assets of the Fund.
NOTE 11—Share Information
| Summary of Share Activity | ||||||||||||||||
| Years ended October 31, | ||||||||||||||||
| 2011(a) | 2010 | |||||||||||||||
| Shares | Amount | Shares | Amount | |||||||||||||
| Sold: | ||||||||||||||||
| Class A | 4,394,289 | $ | 132,259,271 | 5,094,972 | $ | 134,540,630 | ||||||||||
| Class B | 183,714 | 5,229,772 | 242,206 | 5,936,913 | ||||||||||||
| Class C | 971,523 | 27,533,484 | 1,020,065 | 25,280,888 | ||||||||||||
| Class Y | 926,353 | 27,890,937 | 895,032 | 23,297,209 | ||||||||||||
| Issued as reinvestment of dividends: | ||||||||||||||||
| Class A | 202,721 | 6,022,831 | 153,943 | 3,585,333 | ||||||||||||
| Class B | 14,079 | 396,192 | 11,405 | 252,177 | ||||||||||||
| Class C | 26,920 | 753,756 | 18,610 | 409,418 | ||||||||||||
| Class Y | 12,441 | 370,115 | 6,558 | 152,858 | ||||||||||||
| Automatic conversion of Class B shares to Class A shares: | ||||||||||||||||
| Class A | 132,714 | 3,941,506 | 156,332 | 3,934,508 | ||||||||||||
| Class B | (140,624 | ) | (3,941,506 | ) | (165,172 | ) | (3,934,508 | ) | ||||||||
Reacquired:(b) | ||||||||||||||||
| Class A | (5,329,504 | ) | (158,171,860 | ) | (4,677,943 | ) | (118,116,575 | ) | ||||||||
| Class B | (330,303 | ) | (9,226,965 | ) | (351,613 | ) | (8,315,732 | ) | ||||||||
| Class C | (1,126,481 | ) | (31,059,850 | ) | (685,012 | ) | (16,142,000 | ) | ||||||||
| Class Y | (748,469 | ) | (22,531,540 | ) | (363,295 | ) | (9,172,900 | ) | ||||||||
| Net increase (decrease) in share activity | (810,627 | ) | $ | (20,533,857 | ) | 1,356,088 | $ | 41,708,219 | ||||||||
| (a) | There are entities that are record owners of more than 5% of the outstanding shares of the Fund and in the aggregate own 27% of the outstanding shares of the Fund. IDI has an agreement with these entities to sell Fund shares. The Fund, Invesco and/or Invesco affiliates may make payments to these entities, which are considered to be related to the Fund, for providing services to the Fund, Invesco and/or Invesco affiliates including but not limited to services such as securities brokerage, distribution, third party record keeping and account servicing. The Fund has no knowledge as to whether all or any portion of the shares owned of record by these entities are also owned beneficially. | |
| (b) | Net of redemption fees of $59,864 and $37,011 allocated among the classes based on relative net assets of each class for the years ended October 31, 2011 and 2010. |
19 Invesco Asia Pacific Growth Fund
NOTE 12—Financial Highlights
The following schedule presents financial highlights for a share of the Fund outstanding throughout the periods indicated.
| Ratio of | Ratio of | |||||||||||||||||||||||||||||||||||||||||||||||||||||||
| expenses | expenses | |||||||||||||||||||||||||||||||||||||||||||||||||||||||
| Net gains | to average | to average net | Ratio of net | |||||||||||||||||||||||||||||||||||||||||||||||||||||
| Net asset | (losses) on | Dividends | Distributions | net assets | assets without | investment | ||||||||||||||||||||||||||||||||||||||||||||||||||
| value, | Net | securities (both | Total from | from net | from net | Net asset | Net assets, | with fee waivers | fee waivers | income | ||||||||||||||||||||||||||||||||||||||||||||||
| beginning | investment | realized and | investment | investment | realized | Total | value, end | Total | end of period | and/or expenses | and/or expenses | to average | Portfolio | |||||||||||||||||||||||||||||||||||||||||||
| of period | income(a) | unrealized) | operations | income | gains | Distributions | of period(b) | Return(c) | (000s omitted) | absorbed | absorbed | net assets | turnover(d) | |||||||||||||||||||||||||||||||||||||||||||
| Class A | ||||||||||||||||||||||||||||||||||||||||||||||||||||||||
| Year ended 10/31/11 | $ | 30.30 | $ | 0.28 | $ | (1.68 | ) | $ | (1.40 | ) | $ | (0.23 | ) | $ | (0.25 | ) | $ | (0.48 | ) | $ | 28.42 | (4.67 | )% | $ | 385,828 | 1.53 | %(e) | 1.55 | %(e) | 0.93 | %(e) | 27 | % | |||||||||||||||||||||||
| Year ended 10/31/10 | 22.23 | 0.23 | 8.12 | 8.35 | (0.28 | ) | — | (0.28 | ) | 30.30 | 37.97 | 429,596 | 1.60 | 1.61 | 0.91 | 25 | ||||||||||||||||||||||||||||||||||||||||
| Year ended 10/31/09 | 13.52 | 0.24 | 8.82 | 9.06 | (0.35 | ) | — | (0.35 | ) | 22.23 | 68.89 | 298,982 | 1.78 | 1.79 | 1.43 | 28 | ||||||||||||||||||||||||||||||||||||||||
| Year ended 10/31/08 | 35.16 | 0.34 | (18.36 | ) | (18.02 | ) | (0.21 | ) | (3.41 | ) | (3.62 | ) | 13.52 | (56.58 | ) | 189,403 | 1.67 | 1.68 | 1.34 | 25 | ||||||||||||||||||||||||||||||||||||
| Year ended 10/31/07 | 22.82 | 0.24 | 13.00 | 13.24 | (0.10 | ) | (0.80 | ) | (0.90 | ) | 35.16 | 59.90 | 646,720 | 1.61 | 1.63 | 0.84 | 41 | |||||||||||||||||||||||||||||||||||||||
| Class B | ||||||||||||||||||||||||||||||||||||||||||||||||||||||||
| Year ended 10/31/11 | 28.58 | 0.05 | (1.59 | ) | (1.54 | ) | (0.06 | ) | (0.25 | ) | (0.31 | ) | 26.73 | (5.41 | ) | 30,394 | 2.28 | (e) | 2.30 | (e) | 0.18 | (e) | 27 | |||||||||||||||||||||||||||||||||
| Year ended 10/31/10 | 21.02 | 0.04 | 7.69 | 7.73 | (0.17 | ) | — | (0.17 | ) | 28.58 | 36.98 | 40,299 | 2.35 | 2.36 | 0.16 | 25 | ||||||||||||||||||||||||||||||||||||||||
| Year ended 10/31/09 | 12.65 | 0.11 | 8.37 | 8.48 | (0.11 | ) | — | (0.11 | ) | 21.02 | 67.63 | 35,178 | 2.53 | 2.54 | 0.68 | 28 | ||||||||||||||||||||||||||||||||||||||||
| Year ended 10/31/08 | 33.19 | 0.14 | (17.23 | ) | (17.09 | ) | (0.04 | ) | (3.41 | ) | (3.45 | ) | 12.65 | (56.91 | ) | 26,678 | 2.42 | 2.43 | 0.59 | 25 | ||||||||||||||||||||||||||||||||||||
| Year ended 10/31/07 | 21.65 | 0.02 | 12.32 | 12.34 | — | (0.80 | ) | (0.80 | ) | 33.19 | 58.70 | 92,295 | 2.36 | 2.38 | 0.09 | 41 | ||||||||||||||||||||||||||||||||||||||||
| Class C | ||||||||||||||||||||||||||||||||||||||||||||||||||||||||
| Year ended 10/31/11 | 28.44 | 0.05 | (1.58 | ) | (1.53 | ) | (0.06 | ) | (0.25 | ) | (0.31 | ) | 26.60 | (5.41 | ) | 76,962 | 2.28 | (e) | 2.30 | (e) | 0.18 | (e) | 27 | |||||||||||||||||||||||||||||||||
| Year ended 10/31/10 | 20.92 | 0.04 | 7.65 | 7.69 | (0.17 | ) | — | (0.17 | ) | 28.44 | 36.97 | 85,918 | 2.35 | 2.36 | 0.16 | 25 | ||||||||||||||||||||||||||||||||||||||||
| Year ended 10/31/09 | 12.59 | 0.11 | 8.33 | 8.44 | (0.11 | ) | — | (0.11 | ) | 20.92 | 67.64 | 55,810 | 2.53 | 2.54 | 0.68 | 28 | ||||||||||||||||||||||||||||||||||||||||
| Year ended 10/31/08 | 33.06 | 0.14 | (17.16 | ) | (17.02 | ) | (0.04 | ) | (3.41 | ) | (3.45 | ) | 12.59 | (56.92 | ) | 37,630 | 2.42 | 2.43 | 0.59 | 25 | ||||||||||||||||||||||||||||||||||||
| Year ended 10/31/07 | 21.56 | 0.02 | 12.28 | 12.30 | — | (0.80 | ) | (0.80 | ) | 33.06 | 58.77 | 130,965 | 2.36 | 2.38 | 0.09 | 41 | ||||||||||||||||||||||||||||||||||||||||
| Class Y | ||||||||||||||||||||||||||||||||||||||||||||||||||||||||
| Year ended 10/31/11 | 30.39 | 0.35 | (1.68 | ) | (1.33 | ) | (0.29 | ) | (0.25 | ) | (0.54 | ) | 28.52 | (4.43 | ) | 35,862 | 1.28 | (e) | 1.30 | (e) | 1.18 | (e) | 27 | |||||||||||||||||||||||||||||||||
| Year ended 10/31/10 | 22.28 | 0.30 | 8.14 | 8.44 | (0.33 | ) | — | (0.33 | ) | 30.39 | 38.31 | 32,436 | 1.35 | 1.36 | 1.16 | 25 | ||||||||||||||||||||||||||||||||||||||||
| Year ended 10/31/09 | 13.52 | 0.29 | 8.82 | 9.11 | (0.35 | ) | — | (0.35 | ) | 22.28 | 69.31 | 11,785 | 1.53 | 1.54 | 1.68 | 28 | ||||||||||||||||||||||||||||||||||||||||
| Year ended 10/31/08(f) | 17.47 | 0.02 | (3.97 | ) | (3.95 | ) | — | — | — | 13.52 | (22.61 | ) | 4,351 | 1.52 | (g) | 1.52 | (g) | 1.49 | (g) | 25 | ||||||||||||||||||||||||||||||||||||
| (a) | Calculated using average shares outstanding. | |
| (b) | Includes redemption fees added to shares of beneficial interest which were less than $0.005 per share. | |
| (c) | Includes adjustments in accordance with accounting principles generally accepted in the United States of America and as such, the net asset value for financial reporting purposes and the returns based upon those net asset values may differ from the net asset value and returns for shareholder transactions. Does not include sales charges and is not annualized for periods less than one year, if applicable. | |
| (d) | Portfolio turnover is calculated at the fund level and is not annualized for periods less than one year, if applicable. | |
| (e) | Ratios are based on average daily net assets (000’s) of $424,583, $37,222, $88,317, and $35,700, for Class A, Class B, Class C and Class Y shares, respectively. | |
| (f) | Commencement date of October 3, 2008. | |
| (g) | Annualized. |
20 Invesco Asia Pacific Growth Fund
Report of Independent Registered Public Accounting Firm
To the Board of Trustees of AIM International Mutual Funds (Invesco International Mutual Funds)
and Shareholders of Invesco Asia Pacific Growth Fund:
In our opinion, the accompanying statement of assets and liabilities, including the schedule of investments, and the related statements of operations and of changes in net assets and the financial highlights present fairly, in all material respects, the financial position of Invesco Asia Pacific Growth Fund (one of the funds constituting AIM International Mutual Funds (Invesco International Mutual Funds), hereafter referred to as the “Fund”) at October 31, 2011, the results of its operations for the year then ended, the changes in its net assets for each of the two years in the period then ended and the financial highlights for each of the five years in the period then ended, in conformity with accounting principles generally accepted in the United States of America. These financial statements and financial highlights (hereafter referred to as “financial statements”) are the responsibility of the Fund’s management; our responsibility is to express an opinion on these financial statements based on our audits. We conducted our audits of these financial statements in accordance with the standards of the Public Company Accounting Oversight Board (United States). Those standards require that we plan and perform the audit to obtain reasonable assurance about whether the financial statements are free of material misstatement. An audit includes examining, on a test basis, evidence supporting the amounts and disclosures in the financial statements, assessing the accounting principles used and significant estimates made by management, and evaluating the overall financial statement presentation. We believe that our audits, which included confirmation of securities at October 31, 2011 by correspondence with the custodian and brokers, provide a reasonable basis for our opinion.
PRICEWATERHOUSECOOPERS LLP
Houston, Texas
December 21, 2011
21 Invesco Asia Pacific Growth Fund
Calculating your ongoing Fund expenses
Example
As a shareholder of the Fund, you incur two types of costs: (1) transaction costs, which may include sales charges (loads) on purchase payments or contingent deferred sales charges on redemptions, and redemption fees, if any; and (2) ongoing costs, including management fees, distribution and/or service (12b-1) fees, and other Fund expenses. This example is intended to help you understand your ongoing costs (in dollars) of investing in the Fund and to compare these costs with ongoing costs of investing in other mutual funds. The example is based on an investment of $1,000 invested at the beginning of the period and held for the entire period May 1, 2011 through October 31, 2011.
Actual expenses
The table below provides information about actual account values and actual expenses. You may use the information in this table, together with the amount you invested, to estimate the expenses that you paid over the period. Simply divide your account value by $1,000 (for example, an $8,600 account value divided by $1,000 = 8.6), then multiply the result by the number in the table under the heading entitled “Actual Expenses Paid During Period” to estimate the expenses you paid on your account during this period.
Hypothetical example for comparison purposes
The table below also provides information about hypothetical account values and hypothetical expenses based on the Fund’s actual expense ratio and an assumed rate of return of 5% per year before expenses, which is not the Fund’s actual return.
The hypothetical account values and expenses may not be used to estimate the actual ending account balance or expenses you paid for the period. You may use this information to compare the ongoing costs of investing in the Fund and other funds. To do so, compare this 5% hypothetical example with the 5% hypothetical examples that appear in the shareholder reports of the other funds.
Please note that the expenses shown in the table are meant to highlight your ongoing costs only and do not reflect any transaction costs, such as sales charges (loads) on purchase payments, contingent deferred sales charges on redemptions, and redemption fees, if any. Therefore, the hypothetical information is useful in comparing ongoing costs only, and will not help you determine the relative total costs of owning different funds. In addition, if these transaction costs were included, your costs would have been higher.
| HYPOTHETICAL | ||||||||||||||||||||||||||||||
| ACTUAL | (5% annual return before expenses) | |||||||||||||||||||||||||||||
| Beginning | Ending | Expenses | Ending | Expenses | Annualized | |||||||||||||||||||||||||
| Account Value | Account Value | Paid During | Account Value | Paid During | Expense | |||||||||||||||||||||||||
| Class | (05/01/11) | (10/31/11)1 | Period2 | (10/31/11) | Period2 | Ratio | ||||||||||||||||||||||||
| A | $ | 1,000.00 | $ | 879.30 | $ | 7.34 | $ | 1,017.39 | $ | 7.88 | 1.55 | % | ||||||||||||||||||
| B | 1,000.00 | 876.10 | 10.88 | 1,013.61 | 11.67 | 2.30 | ||||||||||||||||||||||||
| C | 1,000.00 | 875.90 | 10.88 | 1,013.61 | 11.67 | 2.30 | ||||||||||||||||||||||||
| Y | 1,000.00 | 880.50 | 6.16 | 1,018.65 | 6.61 | 1.30 | ||||||||||||||||||||||||
| 1 | The actual ending account value is based on the actual total return of the Fund for the period May 1, 2011 through October 31, 2011, after actual expenses and will differ from the hypothetical ending account value which is based on the Fund’s expense ratio and a hypothetical annual return of 5% before expenses. |
| 2 | Expenses are equal to the Fund’s annualized expense ratio as indicated above multiplied by the average account value over the period, multiplied by 184/365 to reflect the most recent fiscal half year. |
22 Invesco Asia Pacific Growth Fund
| Approval of Investment Advisory and Sub-Advisory Contracts |
The Board of Trustees (the Board) of AIM International Mutual Funds (Invesco International Mutual Funds) is required under the Investment Company Act of 1940, as amended, to approve annually the renewal of the Invesco Asia Pacific Growth Fund (the Fund) investment advisory agreement with Invesco Advisers, Inc. (Invesco Advisers) and the Master Intergroup Sub-Advisory Contract for Mutual Funds (the sub-advisory contracts) with Invesco Asset Management Deutschland GmbH, Invesco Asset Management Limited, Invesco Asset Management (Japan) Limited, Invesco Australia Limited, Invesco Hong Kong Limited, Invesco Senior Secured Management, Inc. and Invesco Canada Ltd. (collectively, the Affiliated Sub-Advisers). During contract renewal meetings held on June 14-15, 2011, the Board as a whole, and the disinterested or “independent” Trustees, who comprise 80% of the Board, voting separately, approved the continuance of the Fund’s investment advisory agreement and the sub-advisory contracts for another year, effective July 1, 2011. In doing so, the Board considered the process that it follows in reviewing and approving the Fund’s investment advisory agreement and sub-advisory contracts and the information that it is provided. The Board determined that the Fund’s investment advisory agreement and the sub-advisory contracts are in the best interests of the Fund and its shareholders and the compensation to Invesco Advisers and the Affiliated Sub-Advisers under the agreements is fair and reasonable.
The Board’s Fund Evaluation Process
The Board’s Investments Committee has established three Sub-Committees, each of which is responsible for overseeing the management of a number of the series portfolios of the funds advised by Invesco Advisers (the Invesco Funds). The Sub-Committees meet throughout the year to review the performance of their assigned funds, including reviewing materials prepared under the direction of the independent Senior Officer, an officer of the Invesco Funds who reports directly to the independent Trustees. Over the course of each year, the Sub-Committees meet with portfolio managers for their assigned Invesco Funds and other members of management to review the performance, investment objective(s), policies, strategies and limitations and investment risks of these funds. The Sub-Committees meet regularly and at designated contract renewal meetings each year to conduct a review of the performance, fees, expenses and other matters related to their assigned Invesco Funds. Each Sub-Committee recommends to the Investments Committee, which in turn recommends to the full Board, whether to approve the continuance of each Invesco Fund’s investment advisory agreement and sub-advisory contracts for another year.
During the contract renewal process, the Trustees receive comparative performance and fee data regarding the Invesco Funds prepared by Invesco Advisers and an independent company, Lipper, Inc. (Lipper). The Trustees also receive an independent written evaluation from the Senior Officer. The Senior Officer’s evaluation is prepared as part of his responsibility to manage the process by which the Invesco Funds’ proposed management fees are negotiated during the annual contract renewal process to ensure they are negotiated in a manner that is at arms’ length and reasonable. The independent Trustees are assisted in their annual evaluation of the Fund’s investment advisory agreement by the Senior Officer and by independent legal counsel. The independent Trustees also discuss the continuance of the investment advisory agreement and sub-advisory contracts in private sessions with the Senior Officer and counsel.
In evaluating the fairness and reasonableness of the Fund’s investment advisory agreement and sub-advisory contracts, the Board considered, among other things, the factors discussed below. The Trustees also considered information provided in connection with fund acquisitions approved by the Trustees to rationalize the Invesco Funds product range following the acquisition of the retail mutual fund business of Morgan Stanley (the Morgan Stanley Transaction). The Trustees recognized that the advisory fees for the Invesco Funds include advisory fees that are the result of years of review and negotiation between the Trustees and Invesco Advisers as well as advisory fees inherited from Morgan Stanley and Van Kampen funds acquired in the Morgan Stanley Transaction. The Trustees’ deliberations and conclusions in a particular year may be based in part on their deliberations and conclusions regarding these same arrangements throughout the year and in prior years. One Trustee may have weighed a particular piece of information differently than another Trustee.
The discussion below serves as the Senior Officer’s independent written evaluation with respect to the Fund’s investment advisory agreement as well as a discussion of the material factors and related conclusions that formed the basis for the Board’s approval of the Fund’s investment advisory agreement and sub-advisory contracts. Unless otherwise stated, this information is current as of June 15, 2011, and may not reflect consideration of factors that became known to the Board after that date, including, for example, changes to the Fund’s performance, advisory fees, expense limitations and/or fee waivers.
Factors and Conclusions and Summary of Independent Written Fee Evaluation
| A. | Nature, Extent and Quality of Services Provided by Invesco Advisers and the Affiliated Sub-Advisers |
The Board reviewed the advisory services provided to the Fund by Invesco Advisers under the Fund’s investment advisory agreement, the performance of Invesco Advisers in providing these services, and the credentials and experience of the officers and employees of Invesco Advisers who provide these services, including the Fund’s portfolio manager or managers, with whom the Board met during the year. The Board’s review of the qualifications of Invesco Advisers to provide advisory services included the Board’s considerations of Invesco Advisers’ performance and investment process oversight, independent credit analysis and investment risk management.
In determining whether to continue the Fund’s investment advisory agreement, the Board considered the prior relationship between Invesco Advisers and the Fund, as well as the Board’s knowledge of Invesco Advisers’ operations, and concluded that it is beneficial to maintain the current relationship, in part, because of such knowledge. The Board also considered services that Invesco Advisers and its affiliates provide to the Invesco Funds such as various back office support functions, equity and fixed income trading operations, internal audit, distribution and legal and compliance. The Board concluded that the nature, extent and quality of the services provided to the Fund by Invesco Advisers are appropriate and satisfactory and the advisory services are provided in accordance with the terms of the Fund’s investment advisory agreement.
The Board reviewed the services provided by the Affiliated Sub-Advisers under the sub-advisory contracts and the credentials and experience of the officers and employees of the Affiliated Sub-Advisers who provide these services. The Board noted that the Affiliated Sub-Advisers have offices and personnel that are located in financial centers around the world. As a result, the Affiliated Sub-Advisers can provide research and investment analysis on the markets and economies of various countries in which the Fund invests and make recommendations on securities of companies located in such countries. The Board concluded that the sub-advisory contracts benefit the Fund and its shareholders by permitting Invesco Advisers to use the resources and talents of the Affiliated Sub-Advisers in managing the Fund. The Board concluded that the nature, extent and quality of the services provided by the Affiliated Sub-Advisers are appropriate and
23 Invesco Asia Pacific Growth Fund
satisfactory and in accordance with the terms of the Fund’s sub-advisory contracts.
| B. | Fund Performance |
The Board considered Fund performance as a relevant factor in considering whether to approve the investment advisory agreement. The Board did not view Fund performance as a relevant factor in considering whether to approve the sub-advisory contracts for the Fund, as no Affiliated Sub-Adviser currently manages assets of the Fund.
The Board compared the Fund’s performance during the past one, three and five calendar years to the performance of funds in the Lipper performance universe and against the Lipper Pacific Ex Japan Funds Index. The Board noted that performance of Class A shares of the Fund was in the first quintile of the performance universe for the one year period and the second quintile for the three and five year periods (the first quintile being the best performing funds and the fifth quintile being the worst performing funds). The Board noted that performance of Class A shares of the Fund was above the performance of the Index for the one, three and five year periods. Although the independent written evaluation of the Fund’s Senior Officer only considered Fund performance through the most recent calendar year, the Trustees also reviewed more recent Fund performance and this review did not change their conclusions.
| C. | Advisory and Sub-Advisory Fees and Fee Waivers |
The Board compared the Fund’s contractual advisory fee rate to the contractual advisory fee rates of funds in the Fund’s Lipper expense group at a common asset level. The Board noted that the contractual advisory fee rate for Class A shares of the Fund was below the median contractual advisory fee rate of funds in the expense group. The Board also reviewed the methodology used by Lipper in providing expense group information, which includes using audited financial data from the most recent annual report of each fund in the expense group that was publicly available as of the end of the past calendar year and including only one fund per investment adviser. The Board noted that comparative data is as of varying dates, which may affect the comparability of data during times of market volatility.
The Board noted that Invesco Advisers and the Affiliated Sub-Advisers do not manage other funds or client accounts in a manner substantially similar to the management of the Fund.
The Board noted that Invesco Advisers has contractually agreed to waive fees and/or limit expenses of the Fund through at least February 28, 2012 in an amount necessary to limit total annual operating expenses to a specified percentage of average daily net assets for each class of the Fund. The Board noted that at the current expense ratio for the Fund, this expense waiver does not have any impact.
The Board also considered the services provided by the Affiliated Sub-Advisers pursuant to the sub-advisory contracts, as well as the allocation of fees between Invesco Advisers and the Affiliated Sub-Advisers pursuant to the sub-advisory contracts. The Board noted that Invesco Advisers provides services to sub-advised Invesco Funds, including oversight of the Affiliated Sub-Advisers as well as the additional services described above other than day-to-day portfolio management. The Board also noted that the sub-advisory fees have no direct effect on the Fund or its shareholders, as they are paid by Invesco Advisers to the Affiliated Sub-Advisers.
Based upon the information and considerations described above, the Board concluded that the Fund’s advisory and sub-advisory fees are fair and reasonable.
| D. | Economies of Scale and Breakpoints |
The Board considered the extent to which there are economies of scale in the provision of advisory services to the Fund. The Board also considered whether the Fund benefits from economies of scale through contractual breakpoints in the Fund’s advisory fee schedule. The Board also noted that the Fund shares directly in economies of scale through lower fees charged by third party service providers based on the combined size of the Invesco Funds and other clients advised by Invesco Advisers.
| E. | Profitability and Financial Resources |
The Board reviewed information from Invesco Advisers concerning the costs of the advisory and other services that Invesco Advisers and its affiliates provide to the Fund and the profitability of Invesco Advisers and its affiliates in providing these services. The Board reviewed with Invesco Advisers the methodology used to prepare the profitability information. The Board considered the profitability of Invesco Advisers in connection with managing the Fund and the Invesco Funds. The Board noted that Invesco Advisers continues to operate at a net profit from the services Invesco Advisers and its subsidiaries provide to the Fund and the Invesco Funds. The Board concluded that the level of profits realized by Invesco Advisers and its affiliates from providing services to the Fund is not excessive given the nature, quality and extent of the services provided to the Invesco Funds. The Board considered whether Invesco Advisers and each Affiliated Sub-Adviser are financially sound and have the resources necessary to perform their obligations under the investment advisory agreement and sub-advisory contracts. The Board concluded that Invesco Advisers and each Affiliated Sub-Adviser have the financial resources necessary to fulfill these obligations.
| F. | Collateral Benefits to Invesco Advisers and its Affiliates |
The Board considered various other benefits received by Invesco Advisers and its affiliates from the relationship with the Fund, including the fees received for their provision of administrative, transfer agency and distribution services to the Fund. The Board considered the performance of Invesco Advisers and its affiliates in providing these services and the organizational structure employed to provide these services. The Board also considered that these services are provided to the Fund pursuant to written contracts that are reviewed and approved on an annual basis by the Board; that the services are required for the operation of the Fund; that Invesco Advisers and its affiliates can provide services, the nature and quality of which are at least equal to those provided by others offering the same or similar services; and that the fees for such services are fair and reasonable in light of the usual and customary charges by others for services of the same nature and quality.
The Board considered the benefits realized by Invesco Advisers and the Affiliated Sub-Advisers as a result of portfolio brokerage transactions executed through “soft dollar” arrangements. The Board noted that soft dollar arrangements shift the payment obligation for research and execution services from Invesco Advisers and the Affiliated Sub-Advisers to the Invesco Funds and therefore may reduce Invesco Advisers’ and the Affiliated Sub-Advisers’ expenses. The Board concluded that the soft dollar arrangements are appropriate. The Board also concluded that, based on their review and representations made by the Chief Compliance Officer of the Invesco Funds, these arrangements are consistent with regulatory requirements.
The Board considered that the Fund’s uninvested cash and cash collateral from any securities lending arrangements may be invested in money market funds advised by Invesco Advisers pursuant to procedures approved by the Board. The Board noted that Invesco Advisers receives advisory fees from these affiliated money market funds attributable to such investments, although Invesco Advisers has contractually agreed to waive through varying periods the advisory fees payable by the Invesco Funds. The waiver is in an amount equal to 100% of the net advisory fee Invesco Advisers receives from the affiliated money market funds with respect to the Fund’s investment in the affiliated money market funds of uninvested cash, but not cash collateral. The Board concluded that the Fund’s investment of uninvested cash and cash collateral from any securities lending arrangements in the affiliated money market funds is in the best interests of the Fund and its shareholders.
24 Invesco Asia Pacific Growth Fund
Tax Information
Form 1099-DIV, Form 1042-S and other year-end tax information provide shareholders with actual calendar year amounts that should be included in their tax returns. Shareholders should consult their tax advisors.
The following distribution information is being provided as required by the Internal Revenue Code or to meet a specific state’s requirement.
The Fund designates the following amounts or, if subsequently determined to be different, the maximum amount allowable for its fiscal year ended October 31, 2011:
Federal and State Income Tax | ||||
| Long-Term Capital Gain Dividends | $ | 5,052,449 | ||
| Qualified Dividend Income* | 100% | |||
| Corporate Dividends Received Deduction* | 0.00% | |||
| Foreign Taxes | $ | 0.0926 per share | ||
| Foreign Source Income | $ | 0.8766 per share | ||
| * | The above percentages are based on ordinary income dividends paid to shareholders during the Fund’s fiscal year. |
25 Invesco Asia Pacific Growth Fund
Trustees and Officers
The address of each trustee and officer is AIM International Mutual Funds (Invesco International Mutual Funds) (the “Trust”), 11 Greenway Plaza, Suite 2500, Houston, Texas 77046-1173. The trustees serve for the life of the Trust, subject to their earlier death, incapacitation, resignation, retirement or removal as more specifically provided in the Trust’s organizational documents. Each officer serves for a one year term or until their successors are elected and qualified. Column two below includes length of time served with predecessor entities, if any.
| Number of | ||||||||
| Funds in | ||||||||
| Fund Complex | ||||||||
| Name, Year of Birth and | Trustee and/ | Principal Occupation(s) | Overseen by | Other Directorship(s) | ||||
| Position(s) Held with the Trust | or Officer Since | During Past 5 Years | Trustee | Held by Trustee | ||||
| Interested Persons | ||||||||
Martin L. Flanagan1 — 1960 Trustee | 2007 | Executive Director, Chief Executive Officer and President, Invesco Ltd. (ultimate parent of Invesco and a global investment management firm); Advisor to the Board, Invesco Advisers, Inc. (formerly known as Invesco Institutional (N.A.), Inc.); Trustee, The Invesco Funds; Vice Chair, Investment Company Institute; and Member of Executive Board, SMU Cox School of Business | 141 | None | ||||
| Formerly: Chairman, Invesco Advisers, Inc. (registered investment adviser); Director, Chairman, Chief Executive Officer and President, IVZ Inc. (holding company), INVESCO Group Services, Inc. (service provider) and Invesco North American Holdings, Inc. (holding company); Director, Chief Executive Officer and President, Invesco Holding Company Limited (parent of Invesco and a global investment management firm); Director, Invesco Ltd.; Chairman, Investment Company Institute and President, Co-Chief Executive Officer, Co-President, Chief Operating Officer and Chief Financial Officer, Franklin Resources, Inc. (global investment management organization) | ||||||||
Philip A. Taylor2 — 1954 Trustee, President and Principal Executive Officer | 2006 | Head of North American Retail and Senior Managing Director, Invesco Ltd.; Director, Co-Chairman, Co-President and Co-Chief Executive Officer, Invesco Advisers, Inc. (formerly known as Invesco Institutional (N.A.), Inc.) (registered investment adviser); Director, Chairman, Chief Executive Officer and President, Invesco Management Group, Inc. (formerly Invesco Aim Management Group, Inc.) (financial services holding company); Director and President, INVESCO Funds Group, Inc. (registered investment adviser and registered transfer agent); Director and Chairman, Invesco Investment Services, Inc. (formerly known as Invesco Aim Investment Services, Inc.) (registered transfer agent) and IVZ Distributors, Inc. (formerly known as INVESCO Distributors, Inc.) (registered broker dealer); Director, President and Chairman, Invesco Inc. (holding company) and Invesco Canada Holdings Inc. (holding company); Chief Executive Officer, Invesco Corporate Class Inc. (corporate mutual fund company) and Invesco Canada Fund Inc. (corporate mutual fund company); Director, Chairman and Chief Executive Officer, Invesco Canada Ltd. (formerly known as Invesco Trimark Ltd./Invesco Trimark Ltèe) (registered investment adviser and registered transfer agent); Trustee, President and Principal Executive Officer, The Invesco Funds (other than AIM Treasurer’s Series Trust (Invesco Treasurer’s Series Trust) and Short-Term Investments Trust); Trustee and Executive Vice President, The Invesco Funds (AIM Treasurer’s Series Trust (Invesco Treasurer’s Series Trust) and Short-Term Investments Trust only); Director, Invesco Investment Advisers LLC (formerly known as Van Kampen Asset Management); Director, Chief Executive Officer and President, Van Kampen Exchange Corp. | 141 | None | ||||
| Formerly: Director and Chairman, Van Kampen Investor Services Inc.: | ||||||||
| Director, Chief Executive Officer and President, 1371 Preferred Inc. (holding company); and Van Kampen Investments Inc.; Director and President, AIM GP Canada Inc. (general partner for limited partnerships); and Van Kampen Advisors, Inc.; Director and Chief Executive Officer, Invesco Trimark Dealer Inc. (registered broker dealer); Director, Invesco Distributors, Inc. (formerly known as Invesco Aim Distributors, Inc.) (registered broker dealer); Manager, Invesco PowerShares Capital Management LLC; Director, Chief Executive Officer and President, Invesco Advisers, Inc.; Director, Chairman, Chief Executive Officer and President, Invesco Aim Capital Management, Inc.; President, Invesco Trimark Dealer Inc. and Invesco Trimark Ltd./Invesco Trimark Ltèe; Director and President, AIM Trimark Corporate Class Inc. and AIM Trimark Canada Fund Inc.; Senior Managing Director, Invesco Holding Company Limited; Trustee and Executive Vice President, Tax-Free Investments Trust; Director and Chairman, Fund Management Company (former registered broker dealer); President and Principal Executive Officer, The Invesco Funds (AIM Treasurer’s Series Trust (Invesco Treasurer’s Series Trust), Short-Term Investments Trust and Tax-Free Investments Trust only); President, AIM Trimark Global Fund Inc. and AIM Trimark Canada Fund Inc. | ||||||||
Wayne W. Whalen3 — 1939 Trustee | 2010 | Of Counsel, and prior to 2010, partner in the law firm of Skadden, Arps, Slate, Meagher & Flom LLP, legal counsel to funds in the Fund Complex | 159 | Director of the Abraham Lincoln Presidential Library Foundation | ||||
| Independent Trustees | ||||||||
| Bruce L. Crockett — 1944 Trustee and Chair | 1992 | Chairman, Crockett Technology Associates (technology consulting company) | 141 | ACE Limited (insurance company); and Investment Company Institute | ||||
| Formerly: Director, Captaris (unified messaging provider); Director, President and Chief Executive Officer COMSAT Corporation; and Chairman, Board of Governors of INTELSAT (international communications company) | ||||||||
| David C. Arch — 1945 Trustee | 2010 | Chairman and Chief Executive Officer of Blistex Inc., a consumer health care products manufacturer. | 159 | Member of the Heartland Alliance Advisory Board, a nonprofit organization serving human needs based in Chicago. Board member of the Illinois Manufacturers’ Association. Member of the Board of Visitors, Institute for the Humanities, University of Michigan | ||||
| 1 | Mr. Flanagan is considered an interested person of the Trust because he is an officer of the adviser to the Trust, and an officer and a director of Invesco Ltd., ultimate parent of the adviser to the Trust. |
| 2 | Mr. Taylor is considered an interested person of the Trust because he is an officer and a director of the adviser to, and a director of the principal underwriter of, the Trust. |
| 3 | Mr. Whalen has been deemed to be an interested person of the Trust because of his prior service as counsel to the predecessor funds of certain Invesco open-end funds and his affiliation with the law firm that served as counsel to such predecessor funds and continues to serve as counsel to the Invesco Van Kampen closed-end funds. |
T-1 Invesco Asia Pacific Growth Fund
Trustees and Officers—(continued)
The address of each trustee and officer is AIM International Mutual Funds (Invesco International Mutual Funds) (the “Trust”), 11 Greenway Plaza, Suite 2500, Houston, Texas 77046-1173. The trustees serve for the life of the Trust, subject to their earlier death, incapacitation, resignation, retirement or removal as more specifically provided in the Trust’s organizational documents. Each officer serves for a one year term or until their successors are elected and qualified. Column two below includes length of time served with predecessor entities, if any.
| Number of | ||||||||
| Funds in | ||||||||
| Fund Complex | ||||||||
| Name, Year of Birth and | Trustee and/ | Principal Occupation(s) | Overseen by | Other Directorship(s) | ||||
| Position(s) Held with the Trust | or Officer Since | During Past 5 Years | Trustee | Held by Trustee | ||||
| Independent Trustees—(continued) | ||||||||
| Bob R. Baker — 1936 Trustee | 2003 | Retired | 141 | None | ||||
| Formerly: President and Chief Executive Officer, AMC Cancer Research Center; and Chairman and Chief Executive Officer, First Columbia Financial Corporation | ||||||||
| Frank S. Bayley — 1939 Trustee | 2001 | Retired Formerly: Director, Badgley Funds, Inc. (registered investment company) (2 portfolios) and Partner, law firm of Baker & McKenzie | 141 | Director and Chairman, C.D. Stimson Company (a real estate investment company) | ||||
| James T. Bunch — 1942 Trustee | 2003 | Founder, Green, Manning & Bunch Ltd. (investment banking firm) Formerly: Executive Committee, United States Golf Association; and Director, Policy Studies, Inc. and Van Gilder Insurance Corporation | 141 | Vice Chairman, Board of Governors, Western Golf Association/Evans Scholars Foundation and Director, Denver Film Society | ||||
| Rodney F. Dammeyer — 1940 Trustee | 2010 | President of CAC, LLC, a private company offering capital investment and management advisory services. Formerly: Prior to January 2004, Director of TeleTech Holdings Inc.; Prior to 2002, Director of Arris Group, Inc.; Prior to 2001, Managing Partner at Equity Group Corporate Investments. Prior to 1995, Vice Chairman of Anixter International. Prior to 1985, experience includes Senior Vice President and Chief Financial Officer of Household International, Inc, Executive Vice President and Chief Financial Officer of Northwest Industries, Inc. and Partner of Arthur Andersen & Co. | 159 | Director of Quidel Corporation and Stericycle, Inc. Prior to May 2008, Trustee of The Scripps Research Institute. Prior to February 2008, Director of Ventana Medical Systems, Inc. Prior to April 2007, Director of GATX Corporation. Prior to April 2004, Director of TheraSense, Inc. | ||||
| Albert R. Dowden — 1941 Trustee | 2000 | Director of a number of public and private business corporations, including the Boss Group, Ltd. (private investment and management); Reich & Tang Funds (5 portfolios) (registered investment company); and Homeowners of America Holding Corporation/ Homeowners of America Insurance Company (property casualty company) | 141 | Board of Nature’s Sunshine Products, Inc. | ||||
| Formerly: Director, Continental Energy Services, LLC (oil and gas pipeline service); Director, CompuDyne Corporation (provider of product and services to the public security market) and Director, Annuity and Life Re (Holdings), Ltd. (reinsurance company); Director, President and Chief Executive Officer, Volvo Group North America, Inc.; Senior Vice President, AB Volvo; Director of various public and private corporations; Chairman, DHJ Media, Inc.; Director Magellan Insurance Company; and Director, The Hertz Corporation, Genmar Corporation (boat manufacturer), National Media Corporation; Advisory Board of Rotary Power International (designer, manufacturer, and seller of rotary power engines); and Chairman, Cortland Trust, Inc. (registered investment company) | ||||||||
| Jack M. Fields — 1952 Trustee | 1997 | Chief Executive Officer, Twenty First Century Group, Inc. (government affairs company); and Owner and Chief Executive Officer, Dos Angelos Ranch, L.P. (cattle, hunting, corporate entertainment), Discovery Global Education Fund (non-profit) and Cross Timbers Quail Research Ranch (non-profit) | 141 | Administaff | ||||
| Formerly: Chief Executive Officer, Texana Timber LP (sustainable forestry company) and member of the U.S. House of Representatives | ||||||||
| Carl Frischling — 1937 Trustee | 1991 | Partner, law firm of Kramer Levin Naftalis and Frankel LLP | 141 | Director, Reich & Tang Funds (6 portfolios) | ||||
| Prema Mathai-Davis — 1950 Trustee | 1998 | Retired | 141 | None | ||||
| Formerly: Chief Executive Officer, YWCA of the U.S.A. | ||||||||
| Larry Soll — 1942 Trustee | 2003 | Retired | 141 | None | ||||
| Formerly, Chairman, Chief Executive Officer and President, Synergen Corp. (a biotechnology company) | ||||||||
| Hugo F. Sonnenschein — 1940 Trustee | 2010 | President Emeritus and Honorary Trustee of the University of Chicago and the Adam Smith Distinguished Service Professor in the Department of Economics at the University of Chicago. Prior to July 2000, President of the University of Chicago. | 159 | Trustee of the University of Rochester and a member of its investment committee. Member of the National Academy of Sciences, the American Philosophical Society and a fellow of the American Academy of Arts and Sciences | ||||
| Raymond Stickel, Jr. — 1944 Trustee | 2005 | Retired | 141 | Director of Long Cove Club Owners’ association (home owner’s association) | ||||
| Formerly: Director, Mainstay VP Series Funds, Inc. (25 portfolios) and Partner, Deloitte & Touche | ||||||||
T-2 Invesco Asia Pacific Growth Fund
Trustees and Officers—(continued)
The address of each trustee and officer is AIM International Mutual Funds (Invesco International Mutual Funds) (the “Trust”), 11 Greenway Plaza, Suite 2500, Houston, Texas 77046-1173. The trustees serve for the life of the Trust, subject to their earlier death, incapacitation, resignation, retirement or removal as more specifically provided in the Trust’s organizational documents. Each officer serves for a one year term or until their successors are elected and qualified. Column two below includes length of time served with predecessor entities, if any.
| Number of | ||||||||
| Funds in | ||||||||
| Fund Complex | ||||||||
| Name, Year of Birth and | Trustee and/ | Principal Occupation(s) | Overseen by | Other Directorship(s) | ||||
| Position(s) Held with the Trust | or Officer Since | During Past 5 Years | Trustee | Held by Trustee | ||||
| Other Officers | ||||||||
| Russell C. Burk — 1958 Senior Vice President and Senior Officer | 2005 | Senior Vice President and Senior Officer of Invesco Funds | N/A | N/A | ||||
| John M. Zerr — 1962 Senior Vice President, Chief Legal Officer and Secretary | 2006 | Director, Senior Vice President, Secretary and General Counsel, Invesco Management Group, Inc. (formerly known as Invesco Aim Management Group, Inc.) and Van Kampen Exchange Corp.; Senior Vice President, Invesco Advisers, Inc. (formerly known as Invesco Institutional (N.A.), Inc.) (registered investment adviser); Senior Vice President and Secretary, Invesco Distributors, Inc. (formerly known as Invesco Aim Distributors, Inc.); Director, Vice President and Secretary, Invesco Investment Services, Inc. (formerly known as Invesco Aim Investment Services, Inc.) and IVZ Distributors, Inc. (formerly known as INVESCO Distributors, Inc.); Director and Vice President, INVESCO Funds Group, Inc.; Senior Vice President, Chief Legal Officer and Secretary, The Invesco Funds; Manager, Invesco PowerShares Capital Management LLC; Director, Secretary and General Counsel, Invesco Investment Advisers LLC (formerly known as Van Kampen Asset Management); Secretary and General Counsel, Van Kampen Funds Inc. and Chief Legal Officer, PowerShares Exchange-Traded Fund Trust, PowerShares Exchange-Traded Fund Trust II, PowerShares India Exchange-Traded Fund Trust and PowerShares Actively Managed Exchange-Traded Fund Trust | N/A | N/A | ||||
| Formerly: Director and Secretary, Van Kampen Advisors Inc.; Director Vice President, Secretary and General Counsel Van Kampen Investor Services Inc.; Director, Invesco Distributors, Inc. (formerly known as Invesco Aim Distributors, Inc.); Director, Senior Vice President, General Counsel and Secretary, Invesco Advisers, Inc.; and Van Kampen Investments Inc.; Director, Vice President and Secretary, Fund Management Company; Director, Senior Vice President, Secretary, General Counsel and Vice President, Invesco Aim Capital Management, Inc.; Chief Operating Officer and General Counsel, Liberty Ridge Capital, Inc. (an investment adviser); Vice President and Secretary, PBHG Funds (an investment company) and PBHG Insurance Series Fund (an investment company); Chief Operating Officer, General Counsel and Secretary, Old Mutual Investment Partners (a broker-dealer); General Counsel and Secretary, Old Mutual Fund Services (an administrator) and Old Mutual Shareholder Services (a shareholder servicing center); Executive Vice President, General Counsel and Secretary, Old Mutual Capital, Inc. (an investment adviser); and Vice President and Secretary, Old Mutual Advisors Funds (an investment company) | ||||||||
| Lisa O. Brinkley — 1959 Vice President | 2004 | Global Compliance Director, Invesco Ltd.; Chief Compliance Officer, Invesco Investment Services, Inc.(formerly known as Invesco Aim Investment Services, Inc.); and Vice President, The Invesco Funds Formerly: Chief Compliance Officer, Invesco Distributors, Inc. (formerly known as Invesco Aim Distributors, Inc.) and Van Kampen Investor Services Inc.; Senior Vice President, Invesco Management Group, Inc.; Senior Vice President and Chief Compliance Officer, Invesco Advisers, Inc. and The Invesco Funds; Vice President and Chief Compliance Officer, Invesco Aim Capital Management, Inc. and Invesco Distributors, Inc.; Vice President, Invesco Investment Services, Inc. and Fund Management Company | N/A | N/A | ||||
| Sheri Morris — 1964 Vice President, Treasurer and Principal Financial Officer | 1999 | Vice President, Treasurer and Principal Financial Officer, The Invesco Funds; and Vice President, Invesco Advisers, Inc. (formerly known as Invesco Institutional (N.A.), Inc.) (registered investment adviser). | N/A | N/A | ||||
| Formerly: Treasurer, PowerShares Exchange-Traded Fund Trust, PowerShares Exchange-Traded Fund Trust II, PowerShares India Exchange-Traded Fund Trust and PowerShares Actively Managed Exchange-Traded Fund Trust; Vice President, Invesco Advisers, Inc., Invesco Aim Capital Management, Inc. and Invesco Aim Private Asset Management, Inc.; Assistant Vice President and Assistant Treasurer, The Invesco Funds and Assistant Vice President, Invesco Advisers, Inc., Invesco Aim Capital Management, Inc. and Invesco Aim Private Asset Management, Inc. | ||||||||
T-3 Invesco Asia Pacific Growth Fund
Trustees and Officers—(continued)
The address of each trustee and officer is AIM International Mutual Funds (Invesco International Mutual Funds) (the “Trust”), 11 Greenway Plaza, Suite 2500, Houston, Texas 77046-1173. The trustees serve for the life of the Trust, subject to their earlier death, incapacitation, resignation, retirement or removal as more specifically provided in the Trust’s organizational documents. Each officer serves for a one year term or until their successors are elected and qualified. Column two below includes length of time served with predecessor entities, if any.
| Number of | ||||||||
| Funds in | ||||||||
| Fund Complex | ||||||||
| Name, Year of Birth and | Trustee and/ | Principal Occupation(s) | Overseen by | Other Directorship(s) | ||||
| Position(s) Held with the Trust | or Officer Since | During Past 5 Years | Trustee | Held by Trustee | ||||
| Other Officers—(continued) | ||||||||
| Karen Dunn Kelley — 1960 Vice President | 2004 | Head of Invesco’s World Wide Fixed Income and Cash Management Group; Senior Vice President, Invesco Advisers, Inc. (formerly known as Invesco Institutional (N.A.), Inc.) (registered investment adviser); Executive Vice President, Invesco Distributors, Inc. (formerly known as Invesco Aim Distributors, Inc.); Senior Vice President, Invesco Management Group, Inc. (formerly known as Invesco Aim Management Group, Inc.); and Director, Invesco Mortgage Capital Inc.; Vice President, The Invesco Funds (other than AIM Treasurer’s Series Trust (Invesco Treasurer’s Series Trust) and Short-Term Investments Trust); President and Principal Executive Officer, The Invesco Funds (AIM Treasurer’s Series Trust (Invesco Treasurer’s Series Trust) and Short-Term Investments Trust only). | N/A | N/A | ||||
| Formerly: Senior Vice President, Van Kampen Investments Inc.; Vice President, Invesco Advisers, Inc. (formerly known as Invesco Institutional (N.A.), Inc.); Director of Cash Management and Senior Vice President, Invesco Advisers, Inc. and Invesco Aim Capital Management, Inc.; President and Principal Executive Officer, Tax-Free Investments Trust; Director and President, Fund Management Company; Chief Cash Management Officer, Director of Cash Management, Senior Vice President, and Managing Director, Invesco Aim Capital Management, Inc.; Director of Cash Management, Senior Vice President, and Vice President, Invesco Advisers, Inc. and The Invesco Funds (AIM Treasurer’s Series Trust (Invesco Treasurer’s Series Trust), Short-Term Investments Trust and Tax-Free Investments Trust only) | ||||||||
| Lance A. Rejsek — 1967 Anti-Money Laundering Compliance Officer | 2005 | Anti-Money Laundering Compliance Officer, Invesco Advisers, Inc. (formerly known as Invesco Institutional (N.A.), Inc.) (registered investment adviser); Invesco Distributors, Inc. (formerly known as Invesco Aim Distributors, Inc.), Invesco Investment Services, Inc. (formerly known as Invesco Aim Investment Services, Inc.), The Invesco Funds, PowerShares Exchange-Traded Fund Trust, PowerShares Exchange-Traded Fund Trust II, PowerShares India Exchange-Traded Fund Trust, PowerShares Actively Managed Exchange-Traded Fund Trust, Invesco Investment Advisers LLC (formerly known as Van Kampen Asset Management) and Van Kampen Funds Inc. | N/A | N/A | ||||
| Formerly: Anti-Money Laundering Compliance Officer, Van Kampen Investor Services Inc., Fund Management Company, Invesco Advisers, Inc., Invesco Aim Capital Management, Inc. and Invesco Aim Private Asset Management, Inc. | ||||||||
| Todd L. Spillane — 1958 Chief Compliance Officer | 2006 | Senior Vice President, Invesco Management Group, Inc. (formerly known as Invesco Aim Management Group, Inc.) and Van Kampen Exchange Corp.; Senior Vice President and Chief Compliance Officer, Invesco Advisers, Inc. (registered investment adviser) (formerly known as Invesco Institutional (N.A.), Inc.); Chief Compliance Officer, The Invesco Funds, PowerShares Exchange-Traded Fund Trust, PowerShares Exchange-Traded Fund Trust II, PowerShares India Exchange-Traded Fund Trust, PowerShares Actively Managed Exchange-Traded Fund Trust, INVESCO Private Capital Investments, Inc. (holding company) and Invesco Private Capital, Inc. (registered investment adviser); Vice President, Invesco Distributors, Inc. (formerly known as Invesco Aim Distributors, Inc.) and Invesco Investment Services, Inc. (formerly known as Invesco Aim Investment Services, Inc.). | N/A | N/A | ||||
| Formerly: Chief Compliance Officer, Invesco Van Kampen Closed-End Funds; Senior Vice President, Van Kampen Investments Inc.; Senior Vice President and Chief Compliance Officer, Invesco Advisers, Inc. and Invesco Aim Capital Management, Inc.; Chief Compliance Officer, Invesco Global Asset Management (N.A.), Inc., Invesco Senior Secured Management, Inc. (registered investment adviser) and Van Kampen Investor Services Inc.; Vice President, Invesco Aim Capital Management, Inc. and Fund Management Company | ||||||||
The Statement of Additional Information of the Trust includes additional information about the Fund’s Trustees and is available upon request, without charge, by calling 1.800.959.4246. Please refer to the Fund’s prospectus for information on the Fund’s sub-advisers.
| Office of the Fund 11 Greenway Plaza, Suite 2500 Houston, TX 77046-1173 | Investment Adviser Invesco Advisers, Inc. 1555 Peachtree Street, N.E. Atlanta, GA 30309 | Distributor Invesco Distributors, Inc. 11 Greenway Plaza, Suite 2500 Houston, TX 77046-1173 | Auditors PricewaterhouseCoopers LLP 1201 Louisiana Street, Suite 2900 Houston, TX 77002-5678 | |||
| Counsel to the Fund Stradley Ronon Stevens & Young, LLP 2600 One Commerce Square Philadelphia, PA 19103 | Counsel to the Independent Trustees Kramer, Levin, Naftalis & Frankel LLP 1177 Avenue of the Americas New York, NY 10036-2714 | Transfer Agent Invesco Investment Services, Inc. 11 Greenway Plaza, Suite 2500 Houston, TX 77046-1173 | Custodian State Street Bank and Trust Company 225 Franklin Boston, MA 02110-2801 |
T-4 Invesco Asia Pacific Growth Fund

Invesco mailing information
Send general correspondence to Invesco Investment Services, Inc., P.O. Box 219078, Kansas City, MO 64121-9078.
Invesco privacy policy
You share personal and financial information with us that is necessary for your transactions and your account records. We take very seriously the obligation to keep that information confidential and private.
Invesco collects nonpublic personal information about you from account applications or other forms you complete and from your transactions with us or our affiliates. We do not disclose information about you or our former customers to service providers or other third parties except to the extent necessary to service your account and in other limited circumstances as permitted by law. For example, we use this information to facilitate the delivery of transaction confirmations, financial reports, prospectuses and tax forms.
Even within Invesco, only people involved in the servicing of your accounts and compliance monitoring have access to your information. To ensure the highest level of confidentiality and security, Invesco maintains physical, electronic and procedural safeguards that meet or exceed federal standards. Special measures, such as data encryption and authentication, apply to your communications with us on our website. More detail is available to you at invesco.com/privacy.
Important notice regarding delivery of security holder documents
To reduce Fund expenses, only one copy of most shareholder documents may be mailed to shareholders with multiple accounts at the same address (Householding). Mailing of your shareholder documents may be householded indefinitely unless you instruct us otherwise. If you do not want the mailing of these documents to be combined with those for other members of your household, please contact Invesco Investment Services, Inc. at 800 959 4246 or contact your financial institution. We will begin sending you individual copies for each account within 30 days after receiving your request.
Fund holdings and proxy voting information
The Fund provides a complete list of its holdings four times in each fiscal year, at the quarter-ends. For the second and fourth quarters, the lists appear in the Fund’s semiannual and annual reports to shareholders. For the first and third quarters, the Fund files the lists with the Securities and Exchange Commission (SEC) on Form N-Q. The most recent list of portfolio holdings is available at invesco.com/completeqtrholdings. Shareholders can also look up the Fund’s Forms N-Q on the SEC website at sec.gov. Copies of the Fund’s Forms N-Q may be reviewed and copied at the SEC Public Reference Room in Washington, D.C. You can obtain information on the operation of the Public Reference Room, including information about duplicating fee charges, by calling 202 551 8090 or 800 732 0330, or by electronic request at the following email address: publicinfo@sec.gov. The SEC file numbers for the Fund are 811-06463 and 033-44611.
A description of the policies and procedures that the Fund uses to determine how to vote proxies relating to portfolio securities is available without charge, upon request, from our Client Services department at 800 959 4246 or at invesco.com/proxyguidelines. The information is also available on the SEC website, sec.gov.
Information regarding how the Fund voted proxies related to its portfolio securities during the 12 months ended June 30, 2011, is available at invesco.com/proxysearch. The information is also available on the SEC website, sec.gov.
Invesco Advisers, Inc. is an investment adviser; it provides investment advisory services to individual and institutional clients and does not sell securities. Invesco Distributors, Inc. is the U.S. distributor for Invesco Ltd.’s retail mutual funds, exchange-traded funds and institutional money market funds. Both are wholly owned, indirect subsidiaries of Invesco Ltd.

| APG-AR-1 | Invesco Distributors, Inc. |
 |
| Annual Report to Shareholders | October 31, 2011 |
Invesco European Growth Fund
Nasdaq:
A: AEDAX § B: AEDBX § C: AEDCX § R: AEDRX § Y: AEDYX § Investor: EGINX
A: AEDAX § B: AEDBX § C: AEDCX § R: AEDRX § Y: AEDYX § Investor: EGINX
| 2 | Letters to Shareholders | |
| 4 | Performance Summary | |
| 4 | Management Discussion | |
| 6 | Long-Term Fund Performance | |
| 8 | Supplemental Information | |
| 9 | Schedule of Investments | |
| 11 | Financial Statements | |
| 13 | Notes to Financial Statements | |
| 20 | Financial Highlights | |
| 21 | Auditor’s Report | |
| 22 | Fund Expenses | |
| 23 | Approval of Investment Advisory and Sub-Advisory Agreements | |
| 25 | Tax Information | |
| T-1 | Trustees and Officers |
Letters to Shareholders

Philip Taylor
Dear Shareholders:
Enclosed is important information about your Fund and its performance. I encourage you to read this report to learn more about your Fund’s short- and long-term performance and its holdings as of the close of the reporting period. This report also includes useful information about your Fund’s management team and a discussion of how your Fund was managed during the reporting period.
Investors are likely to confront both opportunities and challenges in 2012 – just as we did in 2011. After all, changes in market sentiment never do investors the courtesy of announcing their impending arrival, and your goals and needs may have changed, requiring changes in your financial strategy.
That’s why the start of a new year is always a good time to catch up with your financial adviser. He or she can explain how your investments performed in the year just ended – how each performed individually, and more important, how they performed as a diversified portfolio. Of course, it’s important to remember that an investment’s long-term performance is more important than its short-term performance. Looking ahead to the new year and evaluating your individual situation, your financial adviser can provide valuable insight into whether your investments are still appropriate for your individual needs, goals and risk tolerance.
For current information about your Fund
In addition to meeting with your financial adviser to discuss your individual situation at the start of the new year, you also may find it helpful to stay abreast of market trends and developments. Doing so may provide reassurance in times of economic uncertainty and market volatility such as we saw in 2011 – and are likely to see again in 2012.
Invesco can help you stay informed about your investments and market trends. On our website, invesco.com/us, we provide timely market updates and commentary from many of our fund managers and other investment professionals. Also on our website, you can obtain information about your account at any hour of the day or night. I invite you to visit and explore the tools and information we offer at invesco.com/us.
Our commitment to investment excellence
As we’ve seen over the last several years, market conditions can change – often suddenly and dramatically. That’s one reason financial advisers typically advise their clients to be well diversified and to maintain a long-term investment focus. While diversification can’t guarantee a profit or protect against loss, it may cushion the impact of dramatic market moves. Maintaining a long-term investment focus for your long-term goals – financing your retirement or your children’s education, for example – may help you avoid making rash investment decisions based on short-term market swings.
Likewise, Invesco’s investment professionals maintain a long-term focus. Across our broad array of investment products, investment excellence is our ultimate goal. Each of our funds is managed by specialized teams of investment professionals, and as a company, we maintain a single focus – investment management – that allows our fund managers to concentrate on doing what they do best: managing your money.
Our funds are managed strictly according to their stated investment objectives and strategies, with robust risk oversight using consistent, repeatable investment processes that don’t change in response to short-term market events. This disciplined approach can’t guarantee a profit; no investment can do that, since all involve some measure of risk. But it can ensure that your money is managed the way we said it would be – according to your Fund’s objective and strategies.
Our adherence to stated investment objectives and strategies allows your financial adviser to build a diversified portfolio that meets your individual risk tolerance and financial goals. It also means that when your goals change, your financial adviser will be able to find an Invesco fund that’s appropriate for your needs.
Questions?
If you have questions about your account, please contact one of our client service representatives at 800 959 4246. If you have a general Invesco-related question or comment for me, I invite you to email me directly at phil@invesco.com.
All of us at Invesco look forward to serving your investment management needs for many years to come. Thank you for investing with us.
Sincerely,

Philip Taylor
Senior Managing Director, Invesco Ltd.
Senior Managing Director, Invesco Ltd.
| 2 | Invesco European Growth Fund |

Bruce Crockett
Dear Fellow Shareholders:
Although the world’s economies are gradually recovering from the financial crisis, it has not been a smooth path. Unrest in the Middle East, persistently weak job and housing markets in the U.S. and continued government balance sheet repair in Europe are contributing to a slow, labored march toward global recovery.
In this environment, investors face risks that could make it more difficult to achieve their long-term financial goals – a secure retirement, home ownership, a child’s college education. Although the markets are complex and dynamic, there are ways to simplify the process and potentially increase your odds of achieving your goals. The best approach is to create a solid financial plan that helps you save and invest in ways that anticipate your needs over the long term.
Your financial adviser can help you define your financial plan, develop an appropriate investment strategy and put you in a better position to achieve your financial goals over the long term. This can take some of the guesswork out of the process and help you make thoughtful investments. Your financial adviser also can help you better understand your tolerance for risk, so that your investment approach lets you sleep at night while getting you closer to your goals. Lastly, your financial adviser can develop an asset allocation strategy that seeks to balance your investment approach, providing some protection against a decline in the markets while allowing you to participate in rising markets. Invesco calls this type of approach “intentional investing.” It means thinking carefully, planning thoughtfully and acting deliberately.
While no investment can guarantee favorable returns, your Board remains committed to managing costs and enhancing the performance of Invesco’s funds as part of our Investor First orientation. We continue to oversee the funds with the same strong sense of responsibility for your money and your continued trust that we’ve always maintained.
Thanks to the approval of our fund shareholders, Invesco has made great progress in realigning our U.S. mutual fund product line following our acquisition of Morgan Stanley’s retail asset management business, including Van Kampen Investments. When completed, the realignment will reduce overlap in the product lineup, enhance efficiency across our product line and build a solid foundation for further growth to meet client and shareholder needs. I would like to thank those of you who voted your proxy, and I hope our shareholders haven’t been too inconvenienced by the process.
As always, please contact me at bruce@brucecrockett.com with any questions or concerns you may have. On behalf of your Board, we look forward to continuing to represent your interests and serving your needs.
Sincerely,

Bruce L. Crockett
Independent Chair
Invesco Funds Board of Trustees
Independent Chair
Invesco Funds Board of Trustees
| 3 | Invesco European Growth Fund |
Management’s Discussion of Fund Performance
Performance summary
Global equity markets faced headwinds in 2010 and 2011. China’s growth continued to slow as the U.S. battled high unemployment and runaway deficits. Several European countries faced similar deficits, which brought to light the imperfect structure of the euro. The reporting period ended with a market upswing, however, as European leaders took steps to address the Greek sovereign debt issue, expand the bailout fund and stabilize the banking system.
Invesco European Growth Fund was down modestly over the fiscal year ended October 31, 2011. Relative results were favorable, however, with Class A shares of the Fund at net asset value (NAV) outperforming the Fund’s style-specific benchmark, the MSCI Europe Growth Index, and significantly outperforming its peer group benchmark, the Lipper European Funds Index.
Your Fund’s long-term performance appears later in this report.
Fund vs. Indexes
Total returns, 10/31/10 to 10/31/11, at net asset value (NAV). Performance shown does not include applicable contingent deferred sales charges (CDSC) or front-end sales charges, which would have reduced performance.
| Class A Shares* | -1.02 | % | ||
| Class B Shares* | -1.78 | |||
| Class C Shares* | -1.75 | |||
| Class R Shares* | -1.28 | |||
| Class Y Shares* | -0.77 | |||
| Investor Class Shares* | -0.96 | |||
MSCI EAFE Index▼ (Broad Market Index) | -4.08 | |||
MSCI Europe Growth Index▼ (Style-Specific Index) | -2.36 | |||
Lipper European Funds Index▼ (Peer Group Index) | -8.23 | |||
| Source(s): ▼Lipper Inc. | ||
| * | Performance includes litigation proceeds. Had these proceeds not been received, total returns would have been lower. |
How we invest
When selecting stocks for your Fund, we use a disciplined investment strategy that emphasizes fundamental research, supported by both quantitative analysis and portfolio construction techniques. Our EQV (earnings, quality, valuation) strategy focuses primarily on identifying quality companies that have experienced, or exhibit the potential for, accelerated or above-average earnings growth, but whose stock prices have not fully reflected these attributes.
While research responsibilities within the portfolio management team are focused by geographic region, we select
investments for the Fund using a bottom-up investment approach, which means we construct the Fund primarily on a stock-by-stock basis. We focus on the strengths of individual companies rather than sectors, countries or market-cap trends.
We believe disciplined sell decisions are key to successful investing. We consider selling a stock for one of the following reasons:
| n | A company’s fundamentals deteriorate, or it posts disappointing earnings. | |
| n | A stock’s price seems overvalued. | |
| n | A more attractive opportunity becomes available. |
Market conditions and your Fund
Market volatility was intense during the reporting period. During mid-2011, Greek sovereign debt concerns and signs of slowing global growth continued to worry investors. In addition, numerous world events caught investors’ attention, including the growing unrest in the Middle East and northern Africa, and the devastating earthquake and tsunami in Japan on March 11.
In addition to watching the debt situation in Europe unfold, investors also witnessed a global economic slowdown during the reporting period. Consumers in the West continued to repair their balance sheets by paying down debt, which led to generally slower growth. China’s economic growth, while healthy, started to slow, and a correction in the Chinese housing boom could also have some negative reverberations. These economic headwinds eroded consumer and corporate confidence around the world.
In this environment, we continued to construct the Fund’s portfolio with a long-term view and a bottom-up approach (i.e., selecting stocks on an individual basis). From a sector perspective, the Fund fared better than the MSCI Europe Growth Index in six of 10 sectors, significantly outperforming in the financials, energy and materials sectors. In each instance, strong stock selection played a key role in driving relative results. In the materials sector, the Fund’s underweight position also benefited relative results.
In financials, the reporting period’s weakest sector, stock selection combined with underweight exposure (particularly in the commercial banking industry) drove relative results. As noted previously, European sovereign debt was the focal point of investor concern through
Portfolio Composition
By sector
| Consumer Discretionary | 20.4 | % | ||
| Industrials | 18.3 | |||
| Consumer Staples | 15.5 | |||
| Financials | 11.2 | |||
| Energy | 10.4 | |||
| Health Care | 7.8 | |||
| Information Technology | 6.2 | |||
| Materials | 1.9 | |||
| Telecommunication Services | 1.8 | |||
| Utilities | 1.5 | |||
Money Market Funds | ||||
Plus Other Assets Less Liabilities | 5.0 | |||
Top 10 Equity Holdings*
| 1. | Paddy Power PLC | 2.8 | % | |||||
| 2. | Aryzta AG | 2.7 | ||||||
| 3. | Compass Group PLC | 2.2 | ||||||
| 4. | Prosafe S.E. | 2.2 | ||||||
| 5. | Imperial Tobacco Group PLC | 2.1 | ||||||
| 6. | Anheuser-Busch InBev N.V. | 1.9 | ||||||
| 7. | Informa PLC | 1.9 | ||||||
| 8. | IG Group Holdings PLC | 1.8 | ||||||
| 9. | Homeserve PLC | 1.8 | ||||||
| 10. | Novartis AG | 1.8 | ||||||
Top Five Countries*
| 1. | United Kingdom | 39.0 | % | |||||
| 2. | Switzerland | 12.0 | ||||||
| 3. | France | 7.8 | ||||||
| 4. | Germany | 6.6 | ||||||
| 5. | Sweden | 5.6 | ||||||
| Total Net Assets | $809.7 million | |
| Total Number of Holdings* | 76 |
The Fund’s holdings are subject to change, and there is no assurance that the Fund will continue to hold any particular security.
*Excluding money market fund holdings.
| 4 | Invesco European Growth Fund |
most of the period. We were not overly surprised by this turn of market events. We’ve long felt that finding a solution to Europe’s sovereign debt loads would be a protracted affair because the eurozone, while unified by a currency, lacks a cohesive fiscal mechanism and empowered leadership.
Strong stock selection led to double-digit gains and meaningful outperformance versus the index within the energy sector over the reporting period. Fund holdings in the energy equipment & services industry were particularly strong. TGS Nopec, a Norwegian company that provides geoscience data, software and services to oil and gas exploration and production companies around the world, and Prosafe, the world’s leading owner and operator of semi-submersible accommodation (flotels) and service rigs, were two of the Fund’s top contributors.
In contrast, stock selection in the consumer discretionary sector (particularly in the luxury goods, media and auto components industries) combined with underweight exposure to a strong consumer staples sector detracted from relative results. Strong stock selection in the consumer staples sector, however, enabled the Fund to outperform the index sector over the reporting period despite its underweight position.
BNP Paribas, a global financial institution based in France, was among the most significant individual detractors from Fund performance over the period. The company’s stock has been negatively affected by European sovereign debt issues and liquidity concerns surrounding many European banks. BNP Paribas’ most significant sovereign exposure is to Italy, while it has negligible exposure to Greece and Portugal.
As long-term, bottom-up stock selectors, we see volatility as an opportunity to buy quality growth companies at more attractive valuations than usual; consequently, we took advantage of market volatility to buy several stocks that had long been on our EQV radar.
It’s important to note that many of our “quality growth” European holdings offer attractive global footprints but are selling at low valuations. Many European companies no longer do business exclusively in Europe. Like their U.S. counterparts, they now derive large portions of their revenues from abroad, including from the faster growing emerging markets.
At the close of the reporting period,
we remained focused on investing according to our bottom-up stock selection process and maintaining our long-term investment view. We thank you for your continued investment in Invesco European Growth Fund.
The views and opinions expressed in management’s discussion of Fund performance are those of Invesco Advisers, Inc. These views and opinions are subject to change at any time based on factors such as market and economic conditions. These views and opinions may not be relied upon as investment advice or recommendations, or as an offer for a particular security. The information is not a complete analysis of every aspect of any market, country, industry, security or the Fund. Statements of fact are from sources considered reliable, but Invesco Advisers, Inc. makes no representation or warranty as to their completeness or accuracy. Although historical performance is no guarantee of future results, these insights may help you understand our investment management philosophy.
See important Fund and, if applicable, index disclosures later in this report.

Jason Holzer
Chartered Financial Analyst, portfolio manager, is lead manager of Invesco European Growth Fund with respect to the Fund’s small- and mid-cap investments. He joined Invesco in 1996. Mr. Holzer earned a B.A. in quantitative economics and an M.S. in engineering economic systems from Stanford University.

Clas Olsson
Portfolio manager and CIO of Invesco’s International Growth Investment Management Unit, is lead manager of Invesco European Growth Fund with respect to the Fund’s large-cap investments. He joined Invesco in 1994. Mr. Olsson became a commissioned officer at the Royal Swedish Naval Academy in 1988. He earned a B.B.A. from The University of Texas at Austin.

Matthew Dennis
Chartered Financial Analyst, portfolio manager, is manager of Invesco European Growth Fund. He joined Invesco in 2000. Mr. Dennis earned a B.A. in economics from The University of Texas at Austin and an M.S. in finance from Texas A&M University.

Borge Endresen
Chartered Financial Analyst, portfolio manager, is manager of Invesco European Growth Fund. He joined Invesco in 1999. Mr. Endresen earned a B.S. in finance from the University of Oregon and an M.B.A. from The University of Texas at Austin.

Richard Nield
Chartered Financial Analyst, portfolio manager, is manager of Invesco European Growth Fund. He joined Invesco in 2000. Mr. Nield earned a Bachelor of Commerce degree in finance and international business from McGill University in Montreal.
| 5 | Invesco European Growth Fund |
Your Fund’s Long-Term Performance
Results of a $10,000 Investment – Oldest Share Classes since Inception
Index data from 10/31/97, Fund data from 11/3/97
Past performance cannot guarantee comparable future results.
The data shown in the chart include reinvested distributions, applicable sales charges and Fund expenses including management fees. Results for Class B shares are calculated as if a hypothetical shareholder had liquidated his entire investment in the Fund at the close of the reporting period and paid the contingent deferred sales charges, if applicable. Index results include reinvested dividends, but they do not reflect sales
charges. Performance of the peer group, if applicable, reflects fund expenses and management fees; performance of a market index does not. Performance shown in the chart and table(s) does not reflect deduction of taxes a shareholder would pay on Fund distributions or sale of Fund shares.
This chart, which is a logarithmic chart, presents the fluctuations in the value of the Fund and its indexes. We believe that a logarithmic chart is more effective than other types of charts in illustrating
changes in value during the early years shown in the chart. The vertical axis, the one that indicates the dollar value of an investment, is constructed with each segment representing a percent change in the value of the investment. In this chart, each segment represents a doubling, or 100% change, in the value of the investment. In other words, the space between $5,000 and $10,000 is the same size as the space between $10,000 and $20,000, and so on.
| 6 | Invesco European Growth Fund |
| Average Annual Total Returns | ||||
| As of 10/31/11, including maximum applicable sales charges | ||||
Class A Shares | ||||
| Inception (11/3/97) | 10.56 | % | ||
| 10 Years | 9.44 | |||
| 5 Years | -1.00 | |||
| 1 Year | -6.46 | |||
Class B Shares | ||||
| Inception (11/3/97) | 10.57 | % | ||
| 10 Years | 9.45 | |||
| 5 Years | -0.93 | |||
| 1 Year | -6.67 | |||
Class C Shares | ||||
| Inception (11/3/97) | 10.23 | % | ||
| 10 Years | 9.28 | |||
| 5 Years | -0.62 | |||
| 1 Year | -2.73 | |||
Class R Shares | ||||
| 10 Years | 9.82 | % | ||
| 5 Years | -0.12 | |||
| 1 Year | -1.28 | |||
Class Y Shares | ||||
| 10 Years | 10.15 | % | ||
| 5 Years | 0.28 | |||
| 1 Year | -0.77 | |||
Investor Class Shares | ||||
| 10 Years | 10.09 | % | ||
| 5 Years | 0.15 | |||
| 1 Year | -0.96 | |||
| Performance includes litigation proceeds. Had these proceeds not been received, total returns would have been lower. | ||||
| Average Annual Total Returns | ||||
| As of 9/30/11, the most recent calendar quarter-end, including maximum applicable sales charges | ||||
Class A Shares | ||||
| Inception (11/3/97) | 9.93 | % | ||
| 10 Years | 8.82 | |||
| 5 Years | -1.78 | |||
| 1 Year | -9.87 | |||
Class B Shares | ||||
| Inception (11/3/97) | 9.94 | % | ||
| 10 Years | 8.83 | |||
| 5 Years | -1.72 | |||
| 1 Year | -10.09 | |||
Class C Shares | ||||
| Inception (11/3/97) | 9.60 | % | ||
| 10 Years | 8.66 | |||
| 5 Years | -1.41 | |||
| 1 Year | -6.31 | |||
Class R Shares | ||||
| 10 Years | 9.20 | % | ||
| 5 Years | -0.91 | |||
| 1 Year | -4.90 | |||
Class Y Shares | ||||
| 10 Years | 9.52 | % | ||
| 5 Years | -0.51 | |||
| 1 Year | -4.38 | |||
Investor Class Shares | ||||
| 10 Years | 9.47 | % | ||
| 5 Years | -0.64 | |||
| 1 Year | -4.58 | |||
| Performance includes litigation proceeds. Had these proceeds not been received, total returns would have been lower. | ||||
presented above may vary from the expense ratios presented in other sections of this report that are based on expenses incurred during the period covered by this report.
Class A share performance reflects the maximum 5.50% sales charge, and Class B and Class C share performance reflects the applicable contingent deferred sales charge (CDSC) for the period involved. The CDSC on Class B shares declines from 5% beginning at the time of purchase to 0% at the beginning of the seventh year. The CDSC on Class C shares is 1% for the first year after purchase. Class R, Class Y and Investor Class shares do not have a front-end sales charge or a CDSC; therefore, performance is at net asset value.
The performance of the Fund’s share classes will differ primarily due to different sales charge structures and class expenses.
A redemption fee of 2% is imposed on certain redemptions or exchanges out of the Fund within 31 days of purchase. Exceptions to the redemption fee are listed in the Fund’s prospectus. Effective January 1, 2012, after the close of the reporting period, the Fund will eliminate the redemption fee, if applicable, assessed on shares of the Fund redeemed or exchanged within 31 days of purchase.
Class R shares incepted on June 3, 2002. Performance shown prior to that date is that of Class A shares, restated to reflect the higher 12b-1 fees applicable to Class R shares. Class A share performance reflects any applicable fee waivers or expense reimbursements.
Class Y shares incepted on October 3, 2008. Performance shown prior to that date is that of Class A shares and includes the 12b-1 fees applicable to Class A shares. Class A share performance reflects any applicable fee waivers or expense reimbursements.
Investor Class shares incepted on September 30, 2003. Performance shown prior to that date is that of Class A shares and includes the 12b-1 fees applicable to Class A shares. Class A share performance reflects any applicable fee waivers or expense reimbursements.
The performance data quoted represent past performance and cannot guarantee comparable future results; current performance may be lower or higher. Please visit invesco.com/performance for the most recent month-end performance. Performance figures reflect reinvested distributions, changes in net asset value and the effect of the maximum sales charge unless otherwise stated. Investment return and principal value will fluctuate so that you may have a gain or loss when you sell shares.
The total annual Fund operating expense ratio set forth in the most recent Fund prospectus as of the date of this report for Class A, Class B, Class C, Class R, Class Y and Investor Class shares was 1.51%, 2.26%, 2.26%, 1.76%, 1.26% and 1.48%, respectively. The expense ratios
| 7 | Invesco European Growth Fund |
Invesco European Growth Fund’s investment objective is long-term growth of capital.
| n | Unless otherwise stated, information presented in this report is as of October 31, 2011, and is based on total net assets. | |
| n | Unless otherwise noted, all data provided by Invesco. | |
| n | To access your Fund’s reports/prospectus, visit invesco.com/fundreports. |
About share classes
| n | Class B shares may not be purchased or acquired by exchange from share classes other than Class B shares. Please see the prospectus for more information. | |
| n | Class R shares are available only to certain retirement plans. Please see the prospectus for more information. | |
| n | Class Y shares are available to only certain investors. Please see the prospectus for more information. | |
| n | All Investor Class shares are closed to new investors. Contact your financial adviser about purchasing our other share classes. |
Principal risks of investing in the Fund
| n | Developing markets securities risk. Securities issued by foreign companies and governments located in developing countries may be affected more negatively by inflation, devaluation of their currencies, higher transaction costs, delays in settlement, adverse political developments, the introduction of capital controls, withholding taxes, nationalization of private assets, expropriation, social unrest, war or lack of timely information than those in developed countries. | |
| n | Foreign securities risk. The Fund’s foreign investments may be affected by changes in a foreign country’s exchange rates; political and social instability; changes in economic or taxation policies; difficulties when enforcing obligations; decreased liquidity; and increased volatility. Foreign companies may be subject to less regulation resulting in less publicly available information about the companies. | |
| n | Geographic concentration risk. Because the Fund’s investments are concentrated in Europe, the Fund’s performance is expected to be closely tied to social, political, and economic conditions within Europe and to be more volatile than the performance of more geographically diversified funds. |
| n | Growth investing risk. Growth stocks tend to be more expensive relative to their earnings or assets compared with other types of stock. As a result they tend to be more sensitive to changes in their earnings and can be more volatile. | |
| n | IPO risk. Although the Fund’s return during certain periods was positively impacted by its investments in initial public offerings (IPOs), there can be no assurance that the Fund will have favorable IPO investment opportunities in the future. | |
| n | Management risk. The investment techniques and risk analysis used by the Fund’s portfolio managers may not produce the desired results. | |
| n | Market risk. The prices of and the income generated by the Fund’s securities may decline in response to, among other things, investor sentiment; general economic and market conditions; regional or global instability; and currency and interest rate fluctuations. | |
| n | Small- and mid-capitalization risk. Stocks of small and mid-sized companies tend to be more vulnerable to adverse developments in the above factors and may have little or no operating history or track record of success, and limited product lines, markets, management and financial resources. The securities of small and mid-sized companies may be more volatile due to less market interest and less publicly available information about the issuer. They also may be illiquid or restricted as to resale, or may trade less frequently and in smaller volumes, all of which may cause difficulty when establishing or closing a position at a desirable price. |
About indexes used in this report
| n | The MSCI EAFE® Index is an unmanaged index considered representative of stocks of Europe, Australasia and the Far East. |
| n | The MSCI Europe Growth Index is an unmanaged index considered representative of European growth stocks. | |
| n | The Lipper European Funds Index is an unmanaged index considered representative of European funds tracked by Lipper. | |
| n | The Fund is not managed to track the performance of any particular index, including the index(es) defined here, and consequently, the performance of the Fund may deviate significantly from the performance of the index(es). | |
| n | A direct investment cannot be made in an index. Unless otherwise indicated, index results include reinvested dividends, and they do not reflect sales charges. Performance of the peer group, if applicable, reflects fund expenses; performance of a market index does not. |
Other information
| n | The Chartered Financial Analyst® (CFA®) designation is globally recognized and attests to a charterholder’s success in a rigorous and comprehensive study program in the field of investment management and research analysis. | |
| n | The returns shown in management’s discussion of Fund performance are based on net asset values calculated for shareholder transactions. Generally accepted accounting principles require adjustments to be made to the net assets of the Fund at period end for financial reporting purposes, and as such, the net asset values for shareholder transactions and the returns based on those net asset values may differ from the net asset values and returns reported in the Financial Highlights. | |
| n | Industry classifications used in this report are generally according to the Global Industry Classification Standard, which was developed by and is the exclusive property and a service mark of MSCI Inc. and Standard & Poor’s. |
This report must be accompanied or preceded by a currently effective Fund prospectus, which contains more complete information, including sales charges and expenses. Investors should read it carefully before investing.
NOT FDIC INSURED | MAY LOSE VALUE | NO BANK GUARANTEE
Fund Nasdaq Symbols
| Class A Shares | AEDAX | |||
| Class B Shares | AEDBX | |||
| Class C Shares | AEDCX | |||
| Class R Shares | AEDRX | |||
| Class Y Shares | AEDYX | |||
| Investor Class Shares | EGINX | |||
| 8 | Invesco European Growth Fund |
Schedule of Investments
October 31, 2011
| Shares | Value | |||||||
| Common Stocks & Other Equity Interests–94.05% | ||||||||
| Austria–0.86% | ||||||||
| Andritz AG | 78,641 | $ | 6,940,022 | |||||
| Belgium–2.67% | ||||||||
| Anheuser-Busch InBev N.V. | 275,221 | 15,280,136 | ||||||
| S.A. D’leteren N.V. | 112,885 | 6,340,740 | ||||||
| 21,620,876 | ||||||||
| Denmark–1.41% | ||||||||
| Novo Nordisk A.S.–Class B | 108,290 | 11,434,900 | ||||||
| France–7.83% | ||||||||
| BNP Paribas S.A. | 172,385 | 7,643,386 | ||||||
| Cap Gemini S.A. | 196,425 | 7,511,424 | ||||||
| Cie Generale des Etablissements Michelin–Class B | 79,796 | 5,763,972 | ||||||
| Danone S.A. | 189,991 | 13,133,238 | ||||||
| Faurecia | 235,408 | 6,201,293 | ||||||
| Publicis Groupe S.A. | 95,881 | 4,634,521 | ||||||
| SA des Ciments Vicat (Vicat) | 120,940 | 7,891,402 | ||||||
| Schneider Electric S.A. | 77,858 | 4,509,813 | ||||||
| Total S.A. | 117,423 | 6,144,113 | ||||||
| 63,433,162 | ||||||||
| Germany–6.63% | ||||||||
| Bayer AG | 66,864 | 4,105,193 | ||||||
| Bayerische Motoren Werke AG | 93,701 | 7,636,258 | ||||||
| Deutsche Boerse AG | 119,315 | 6,603,847 | ||||||
| Fresenius Medical Care AG & Co. KGaA | 141,770 | 10,314,246 | ||||||
| SAP AG | 206,604 | 12,449,888 | ||||||
| Wirecard AG | 791,884 | 12,603,184 | ||||||
| 53,712,616 | ||||||||
| Greece–0.48% | ||||||||
| Jumbo S.A. | 716,646 | 3,897,079 | ||||||
| Ireland–4.24% | ||||||||
| DCC PLC | 407,912 | 11,272,852 | ||||||
| Paddy Power PLC | 417,196 | 23,037,970 | ||||||
| 34,310,822 | ||||||||
| Italy–0.41% | ||||||||
| Ansaldo STS S.p.A. | 319,249 | 3,325,562 | ||||||
| Netherlands–4.11% | ||||||||
| Aalberts Industries N.V. | 490,943 | 8,631,116 | ||||||
| Koninklijke Ahold N.V. | 770,622 | 9,854,384 | ||||||
| Unilever N.V. | 289,429 | 9,952,678 | ||||||
| VimpelCom Ltd.–ADR | 444,629 | 4,882,026 | ||||||
| 33,320,204 | ||||||||
| Norway–3.98% | ||||||||
| Prosafe S.E. | 2,304,988 | 17,443,505 | ||||||
| TGS Nopec Geophysical Co. A.S.A. | 649,772 | 14,749,396 | ||||||
| 32,192,901 | ||||||||
| Russia–1.14% | ||||||||
| Gazprom OAO–ADR | 793,714 | 9,196,878 | ||||||
| Spain–0.65% | ||||||||
| Prosegur, Compania de Seguridad S.A. | 105,356 | 5,227,103 | ||||||
| Sweden–5.60% | ||||||||
| Intrum Justitia A.B. | 810,101 | 13,267,241 | ||||||
| Kinnevik Investment A.B.–Class B | 403,826 | 8,418,436 | ||||||
| Swedbank AB–Class A | 576,007 | 8,040,483 | ||||||
| Telefonaktiebolaget LM Ericsson–Class B | 910,352 | 9,476,551 | ||||||
| Volvo AB–Class B | 492,960 | 6,111,828 | ||||||
| 45,314,539 | ||||||||
| Switzerland–12.04% | ||||||||
| ABB Ltd. | 421,727 | 7,951,625 | ||||||
| Aryzta AG | 449,957 | 21,705,239 | ||||||
Dufry AG(a) | 132,312 | 14,135,303 | ||||||
| Julius Baer Group Ltd. | 240,699 | 9,054,866 | ||||||
| Nestle S.A. | 223,734 | 12,948,901 | ||||||
| Novartis AG | 261,625 | 14,787,759 | ||||||
| Roche Holding AG | 58,588 | 9,633,187 | ||||||
| Syngenta AG | 23,638 | 7,231,176 | ||||||
| 97,448,056 | ||||||||
| Turkey–3.03% | ||||||||
| Haci Omer Sabanci Holding A.S. | 3,826,299 | 13,044,729 | ||||||
| Tupras-Turkiye Petrol Rafinerileri A.S. | 510,985 | 11,495,669 | ||||||
| 24,540,398 | ||||||||
| United Kingdom–38.97% | ||||||||
| Amlin PLC | 2,260,983 | 10,397,394 | ||||||
| Balfour Beatty PLC | 2,383,493 | 9,607,543 | ||||||
| BG Group PLC | 545,727 | 11,826,369 | ||||||
| British American Tobacco PLC | 321,997 | 14,735,316 | ||||||
| Bunzl PLC | 855,948 | 11,028,957 | ||||||
| Centrica PLC | 1,627,987 | 7,710,457 | ||||||
| Chemring Group PLC | 1,447,825 | 11,838,285 | ||||||
See accompanying Notes to Financial Statements which are an integral part of the financial statements.
9 Invesco European Growth Fund
| Shares | Value | |||||||
United Kingdom–(continued) | ||||||||
| Compass Group PLC | 1,988,617 | $ | 18,049,459 | |||||
| GlaxoSmithKline PLC | 112,655 | 2,535,932 | ||||||
| Homeserve PLC | 2,650,051 | 14,849,819 | ||||||
| IG Group Holdings PLC | 2,002,117 | 14,924,569 | ||||||
| Imperial Tobacco Group PLC | 455,312 | 16,593,029 | ||||||
| Informa PLC | 2,591,598 | 15,058,597 | ||||||
| International Power PLC | 768,407 | 4,166,195 | ||||||
| Kingfisher PLC | 2,103,441 | 8,698,962 | ||||||
| Lancashire Holdings Ltd. | 1,111,732 | 12,735,721 | ||||||
| Micro Focus International PLC | 1,461,803 | 7,898,019 | ||||||
| Mitie Group PLC | 3,345,206 | 13,481,608 | ||||||
| Next PLC | 268,357 | 10,960,933 | ||||||
| Reed Elsevier PLC | 1,535,767 | 13,146,276 | ||||||
| Royal Dutch Shell PLC–Class B | 360,177 | 12,946,420 | ||||||
| Shire PLC | 320,877 | 10,065,953 | ||||||
| Smiths Group PLC | 491,182 | 7,503,219 | ||||||
| Tesco PLC | 1,792,407 | 11,551,907 | ||||||
| UBM PLC | 779,954 | 6,352,101 | ||||||
| Ultra Electronics Holdings PLC | 504,333 | 12,825,963 | ||||||
| Vodafone Group PLC | 3,625,749 | 10,055,226 | ||||||
| William Hill PLC | 1,439,895 | 4,989,476 | ||||||
| WPP PLC | 871,306 | 9,030,230 | ||||||
| 315,563,935 | ||||||||
| Total Common Stocks & Other Equity Interests (Cost $612,625,829) | 761,479,053 | |||||||
| Preferred Stocks–0.93% | ||||||||
| Germany–0.93% | ||||||||
| Volkswagen AG -1.76% Pfd. (Cost $8,515,692) | 42,864 | 7,498,544 | ||||||
| Money Market Funds–4.57% | ||||||||
Liquid Assets Portfolio–Institutional Class(b) | 18,521,507 | 18,521,506 | ||||||
Premier Portfolio–Institutional Class(b) | 18,521,507 | 18,521,507 | ||||||
| Total Money Market Funds (Cost $37,043,013) | 37,043,013 | |||||||
| TOTAL INVESTMENTS–99.55% (Cost $658,184,534) | 806,020,610 | |||||||
| OTHER ASSETS LESS LIABILITIES–0.45% | 3,665,844 | |||||||
| NET ASSETS–100.00% | $ | 809,686,454 | ||||||
Investment Abbreviations:
| ADR | – American Depositary Receipt | |
| Pfd. | – Preferred |
Notes to Schedule of Investments:
| (a) | Non-income producing security. | |
| (b) | The money market fund and the Fund are affiliated by having the same investment adviser. |
See accompanying Notes to Financial Statements which are an integral part of the financial statements.
10 Invesco European Growth Fund
Statement of Assets and Liabilities
October 31, 2011
| Assets: | ||||
| Investments, at value (Cost $621,141,521) | $ | 768,977,597 | ||
| Investments in affiliated money market funds, at value and cost | 37,043,013 | |||
| Total investments, at value (Cost $658,184,534) | 806,020,610 | |||
| Foreign currencies, at value (Cost $961,759) | 1,011,125 | |||
| Receivable for: | ||||
| Investments sold | 4,192,617 | |||
| Fund shares sold | 630,797 | |||
| Dividends | 1,999,413 | |||
| Investment for trustee deferred compensation and retirement plans | 67,797 | |||
| Other assets | 24,528 | |||
| Total assets | 813,946,887 | |||
| Liabilities: | ||||
| Payable for: | ||||
| Investments purchased | 2,563,428 | |||
| Fund shares reacquired | 915,637 | |||
| Accrued fees to affiliates | 461,593 | |||
| Accrued other operating expenses | 143,845 | |||
| Trustee deferred compensation and retirement plans | 175,930 | |||
| Total liabilities | 4,260,433 | |||
| Net assets applicable to shares outstanding | $ | 809,686,454 | ||
| Net assets consist of: | ||||
| Shares of beneficial interest | $ | 664,400,403 | ||
| Undistributed net investment income | 22,275,648 | |||
| Undistributed net realized gain (loss) | (24,914,284 | ) | ||
| Unrealized appreciation | 147,924,687 | |||
| $ | 809,686,454 | |||
| Net Assets: | ||||
| Class A | $ | 362,912,575 | ||
| Class B | $ | 21,177,095 | ||
| Class C | $ | 41,077,687 | ||
| Class R | $ | 14,910,840 | ||
| Class Y | $ | 215,716,043 | ||
| Investor Class | $ | 153,892,214 | ||
| Shares outstanding, $0.001 par value per share, with an unlimited number of shares authorized: | ||||
| Class A | 12,046,581 | |||
| Class B | 749,118 | |||
| Class C | 1,451,731 | |||
| Class R | 497,098 | |||
| Class Y | 7,138,464 | |||
| Investor Class | 5,117,012 | |||
| Class A: | ||||
| Net asset value per share | $ | 30.13 | ||
| Maximum offering price per share (Net asset value of $30.13 divided by 94.50%) | $ | 31.88 | ||
| Class B: | ||||
| Net asset value and offering price per share | $ | 28.27 | ||
| Class C: | ||||
| Net asset value and offering price per share | $ | 28.30 | ||
| Class R: | ||||
| Net asset value and offering price per share | $ | 30.00 | ||
| Class Y: | ||||
| Net asset value and offering price per share | $ | 30.22 | ||
| Investor Class: | ||||
| Net asset value and offering price per share | $ | 30.07 | ||
See accompanying Notes to Financial Statements which are an integral part of the financial statements.
11 Invesco European Growth Fund
Statement of Operations
For the year ended October 31, 2011
| Investment income: | ||||
| Dividends (net of foreign withholding taxes of $1,723,942) | $ | 29,595,021 | ||
| Dividends from affiliated money market funds | 71,903 | |||
| Total investment income | 29,666,924 | |||
| Expenses: | ||||
| Advisory fees | 8,184,734 | |||
| Administrative services fees | 257,843 | |||
| Custodian fees | 251,092 | |||
| Distribution fees: | ||||
| Class A | 1,032,119 | |||
| Class B | 273,846 | |||
| Class C | 493,174 | |||
| Class R | 83,299 | |||
| Investor Class | 323,853 | |||
| Transfer agent fees | 1,804,774 | |||
| Trustees’ and officers’ fees and benefits | 42,743 | |||
| Other | 274,539 | |||
| Total expenses | 13,022,016 | |||
| Less: Fees waived, expenses reimbursed and expense offset arrangement(s) | (115,065 | ) | ||
| Net expenses | 12,906,951 | |||
| Net investment income | 16,759,973 | |||
| Realized and unrealized gain (loss) from: | ||||
| Net realized gain (loss) from: | ||||
| Investment securities | 26,150,170 | |||
| Foreign currencies | (362,358 | ) | ||
| 25,787,812 | ||||
| Change in net unrealized appreciation (depreciation) of: | ||||
| Investment securities | (52,186,556 | ) | ||
| Foreign currencies | 72,004 | |||
| (52,114,552 | ) | |||
| Net realized and unrealized gain (loss) | (26,326,740 | ) | ||
| Net increase (decrease) in net assets resulting from operations | $ | (9,566,767 | ) | |
See accompanying Notes to Financial Statements which are an integral part of the financial statements.
12 Invesco European Growth Fund
Statement of Changes in Net Assets
For the years ended October 31, 2011 and 2010
| 2011 | 2010 | |||||||
| Operations: | ||||||||
| Net investment income | $ | 16,759,973 | $ | 8,828,223 | ||||
| Net realized gain | 25,787,812 | 48,578,200 | ||||||
| Change in net unrealized appreciation (depreciation) | (52,114,552 | ) | 73,753,583 | |||||
| Net increase (decrease) in net assets resulting from operations | (9,566,767 | ) | 131,160,006 | |||||
| Distributions to shareholders from net investment income: | ||||||||
| Class A | (5,034,945 | ) | (6,045,526 | ) | ||||
| Class B | (144,732 | ) | (289,814 | ) | ||||
| Class C | (253,785 | ) | (441,336 | ) | ||||
| Class R | (166,534 | ) | (192,013 | ) | ||||
| Class Y | (2,800,684 | ) | (1,998,716 | ) | ||||
| Investor Class | (2,105,390 | ) | (2,436,731 | ) | ||||
| Total distributions from net investment income | (10,506,070 | ) | (11,404,136 | ) | ||||
| Share transactions–net: | ||||||||
| Class A | (61,449,648 | ) | (69,998,952 | ) | ||||
| Class B | (10,292,445 | ) | (12,200,136 | ) | ||||
| Class C | (14,798,478 | ) | (11,096,982 | ) | ||||
| Class R | (2,323,285 | ) | (1,757,407 | ) | ||||
| Class Y | 31,068,314 | 85,153,798 | ||||||
| Investor Class | (17,836,532 | ) | (27,252,780 | ) | ||||
| Net increase (decrease) in net assets resulting from share transactions | (75,632,074 | ) | (37,152,459 | ) | ||||
| Net increase (decrease) in net assets | (95,704,911 | ) | 82,603,411 | |||||
| Net assets: | ||||||||
| Beginning of year | 905,391,365 | 822,787,954 | ||||||
| End of year (includes undistributed net investment income of $22,275,648 and $10,301,245, respectively) | $ | 809,686,454 | $ | 905,391,365 | ||||
Notes to Financial Statements
October 31, 2010
NOTE 1—Significant Accounting Policies
Invesco European Growth Fund (the “Fund”) is a series portfolio of AIM International Mutual Funds (Invesco International Mutual Funds) (the “Trust”). The Trust is a Delaware statutory trust registered under the Investment Company Act of 1940, as amended (the “1940 Act”), as an open-end series management investment company consisting of six separate portfolios, each authorized to issue an unlimited number of shares of beneficial interest. The assets, liabilities and operations of each portfolio are accounted for separately. Information presented in these financial statements pertains only to the Fund. Matters affecting each portfolio or class will be voted on exclusively by the shareholders of such portfolio or class.
The Fund’s investment objective is long-term growth of capital.
The Fund currently consists of six different classes of shares: Class A, Class B, Class C, Class R, Class Y and Investor Class. Investor Class shares of the Fund are offered only to certain grandfathered investors. Class A shares are sold with a front-end sales charge unless certain waiver criteria are met and under certain circumstances load waived shares may be subject to contingent deferred sales charges (“CDSC”). Class C shares are sold with a CDSC. Class R, Class Y and Investor Class shares are sold at net asset value. Effective November 30, 2010, new or additional investments in Class B shares are no longer permitted. Existing shareholders of Class B shares may continue to reinvest dividends and capital gains distributions in Class B shares until they convert. Also, shareholders in Class B shares will be able to exchange those shares for Class B shares of other Invesco Funds offering such shares until they convert. Generally, Class B shares will automatically convert to Class A shares on or about the month-end which is at least eight years after the date of purchase. Redemption of Class B shares prior to conversion date will be subject to a CDSC.
13 Invesco European Growth Fund
The following is a summary of the significant accounting policies followed by the Fund in the preparation of its financial statements.
| A. | Security Valuations — Securities, including restricted securities, are valued according to the following policy. | |
| A security listed or traded on an exchange (except convertible bonds) is valued at its last sales price or official closing price as of the close of the customary trading session on the exchange where the security is principally traded, or lacking any sales or official closing price on a particular day, the security may be valued at the closing bid price on that day. Securities traded in the over-the-counter market are valued based on prices furnished by independent pricing services or market makers. When such securities are valued by an independent pricing service they may be considered fair valued. Futures contracts are valued at the final settlement price set by an exchange on which they are principally traded. Listed options are valued at the mean between the last bid and ask prices from the exchange on which they are principally traded. Options not listed on an exchange are valued by an independent source at the mean between the last bid and ask prices. For purposes of determining net asset value per share, futures and option contracts generally are valued 15 minutes after the close of the customary trading session of the New York Stock Exchange (“NYSE”). | ||
| Investments in open-end and closed-end registered investment companies that do not trade on an exchange are valued at the end of day net asset value per share. Investments in open-end and closed-end registered investment companies that trade on an exchange are valued at the last sales price or official closing price as of the close of the customary trading session on the exchange where the security is principally traded. | ||
| Debt obligations (including convertible bonds) and unlisted equities are fair valued using an evaluated quote provided by an independent pricing service. Evaluated quotes provided by the pricing service may be determined without exclusive reliance on quoted prices, and may reflect appropriate factors such as institution-size trading in similar groups of securities, developments related to specific securities, dividend rate, yield, quality, type of issue, coupon rate, maturity, individual trading characteristics and other market data. Debt securities are subject to interest rate and credit risks. In addition, all debt securities involve some risk of default with respect to interest and/or principal payments. | ||
| Foreign securities (including foreign exchange contracts) are converted into U.S. dollar amounts using the applicable exchange rates as of the close of the NYSE. If market quotations are available and reliable for foreign exchange traded equity securities, the securities will be valued at the market quotations. Because trading hours for certain foreign securities end before the close of the NYSE, closing market quotations may become unreliable. If between the time trading ends on a particular security and the close of the customary trading session on the NYSE, events occur that are significant and make the closing price unreliable, the Fund may fair value the security. If the event is likely to have affected the closing price of the security, the security will be valued at fair value in good faith using procedures approved by the Board of Trustees. Adjustments to closing prices to reflect fair value may also be based on a screening process of an independent pricing service to indicate the degree of certainty, based on historical data, that the closing price in the principal market where a foreign security trade is not the current value as of the close of the NYSE. Foreign securities meeting the approved degree of certainty that the price is not reflective of current value will be priced at the indication of fair value from the independent pricing service. Multiple factors may be considered by the independent pricing service in determining adjustments to reflect fair value and may include information relating to sector indices, American Depositary Receipts and domestic and foreign index futures. Foreign securities may have additional risks including exchange rate changes, potential for sharply devalued currencies and high inflation, political and economic upheaval, the relative lack of issuer information, relatively low market liquidity and the potential lack of strict financial and accounting controls and standards. | ||
| Securities for which market prices are not provided by any of the above methods may be valued based upon quotes furnished by independent sources. The last bid price may be used to value equity securities. The mean between the last bid and asked prices is used to value debt obligations, including Corporate Loans. | ||
| Securities for which market quotations are not readily available or are unreliable are valued at fair value as determined in good faith by or under the supervision of the Trust’s officers following procedures approved by the Board of Trustees. Issuer specific events, market trends, bid/ask quotes of brokers and information providers and other market data may be reviewed in the course of making a good faith determination of a security’s fair value. | ||
| Valuations change in response to many factors including the historical and prospective earnings of the issuer, the value of the issuer’s assets, general economic conditions, interest rates, investor perceptions and market liquidity. Because of the inherent uncertainties of valuation, the values reflected in the financial statements may materially differ from the value received upon actual sale of those investments. | ||
| B. | Securities Transactions and Investment Income — Securities transactions are accounted for on a trade date basis. Realized gains or losses on sales are computed on the basis of specific identification of the securities sold. Interest income is recorded on the accrual basis from settlement date. Dividend income (net of withholding tax, if any) is recorded on the ex-dividend date. | |
| The Fund may periodically participate in litigation related to Fund investments. As such, the Fund may receive proceeds from litigation settlements. Any proceeds received are included in the Statement of Operations as realized gain (loss) for investments no longer held and as unrealized gain (loss) for investments still held. | ||
| Brokerage commissions and mark ups are considered transaction costs and are recorded as an increase to the cost basis of securities purchased and/or a reduction of proceeds on a sale of securities. Such transaction costs are included in the determination of net realized and unrealized gain (loss) from investment securities reported in the Statement of Operations and the Statement of Changes in Net Assets and the net realized and unrealized gains (losses) on securities per share in the Financial Highlights. Transaction costs are included in the calculation of the Fund’s net asset value and, accordingly, they reduce the Fund’s total returns. These transaction costs are not considered operating expenses and are not reflected in net investment income reported in the Statement of Operations and Statement of Changes in Net Assets, or the net investment income per share and ratios of expenses and net investment income reported in the Financial Highlights, nor are they limited by any expense limitation arrangements between the Fund and the investment adviser. | ||
| The Fund allocates income and realized and unrealized capital gains and losses to a class based on the relative net assets of each class. | ||
| C. | Country Determination — For the purposes of making investment selection decisions and presentation in the Schedule of Investments, the investment adviser may determine the country in which an issuer is located and/or credit risk exposure based on various factors. These factors include the laws of the country under which the issuer is organized, where the issuer maintains a principal office, the country in which the issuer derives 50% or more of its total revenues and the country that has the primary market for the issuer’s securities, as well as other criteria. Among the other criteria that may be evaluated for making this determination are the country in which the issuer maintains 50% or more of its assets, the type of security, financial guarantees |
14 Invesco European Growth Fund
| and enhancements, the nature of the collateral and the sponsor organization. Country of issuer and/or credit risk exposure has been determined to be the United States of America, unless otherwise noted. | ||
| D. | Distributions — Distributions from income and net realized capital gain, if any, are generally paid annually and recorded on ex-dividend date. The Fund may elect to treat a portion of the proceeds from redemptions as distributions for federal income tax purposes. | |
| E. | Federal Income Taxes — The Fund intends to comply with the requirements of Subchapter M of the Internal Revenue Code necessary to qualify as a regulated investment company and to distribute substantially all of the Fund’s taxable earnings to shareholders. As such, the Fund will not be subject to federal income taxes on otherwise taxable income (including net realized capital gain) that is distributed to shareholders. Therefore, no provision for federal income taxes is recorded in the financial statements. | |
| The Fund files tax returns in the U.S. Federal jurisdiction and certain other jurisdictions. Generally, the Fund is subject to examinations by such taxing authorities for up to three years after the filing of the return for the tax period. | ||
| F. | Expenses — Fees provided for under the Rule 12b-1 plan of a particular class of the Fund and which are directly attributable to that class are charged to the operations of such class. All other expenses are allocated among the classes based on relative net assets. | |
| G. | Accounting Estimates — The preparation of financial statements in conformity with accounting principles generally accepted in the United States of America (“GAAP”) requires management to make estimates and assumptions that affect the reported amounts of assets and liabilities at the date of the financial statements and the reported amounts of revenues and expenses during the reporting period including estimates and assumptions related to taxation. Actual results could differ from those estimates by a significant amount. In addition, the Fund monitors for material events or transactions that may occur or become known after the period-end date and before the date the financial statements are released to print. | |
| H. | Indemnifications — Under the Trust’s organizational documents, each Trustee, officer, employee or other agent of the Trust is indemnified against certain liabilities that may arise out of performance of their duties to the Fund. Additionally, in the normal course of business, the Fund enters into contracts, including the Fund’s servicing agreements that contain a variety of indemnification clauses. The Fund’s maximum exposure under these arrangements is unknown as this would involve future claims that may be made against the Fund that have not yet occurred. The risk of material loss as a result of such indemnification claims is considered remote. | |
| I. | Redemption Fees — The Fund has a 2% redemption fee that is to be retained by the Fund to offset transaction costs and other expenses associated with short-term redemptions and exchanges. The fee, subject to certain exceptions, is imposed on certain redemptions or exchanges of shares within 31 days of purchase. The redemption fee is recorded as an increase in shareholder capital and is allocated among the share classes based on the relative net assets of each class. Effective January 1, 2012, the Fund will eliminate the 2% redemption fee assessed on shares of the Fund redeemed or exchanged within 31 days of purchase. | |
| J. | Foreign Currency Translations — Foreign currency is valued at the close of the NYSE based on quotations posted by banks and major currency dealers. Portfolio securities and other assets and liabilities denominated in foreign currencies are translated into U.S. dollar amounts at date of valuation. Purchases and sales of portfolio securities (net of foreign taxes withheld on disposition) and income items denominated in foreign currencies are translated into U.S. dollar amounts on the respective dates of such transactions. The Fund does not separately account for the portion of the results of operations resulting from changes in foreign exchange rates on investments and the fluctuations arising from changes in market prices of securities held. The combined results of changes in foreign exchange rates and the fluctuation of market prices on investments (net of estimated foreign tax withholding) are included with the net realized and unrealized gain or loss from investments in the Statement of Operations. Reported net realized foreign currency gains or losses arise from (1) sales of foreign currencies, (2) currency gains or losses realized between the trade and settlement dates on securities transactions, and (3) the difference between the amounts of dividends, interest, and foreign withholding taxes recorded on the Fund’s books and the U.S. dollar equivalent of the amounts actually received or paid. Net unrealized foreign currency gains and losses arise from changes in the fair values of assets and liabilities, other than investments in securities at fiscal period end, resulting from changes in exchange rates. | |
| The Fund may invest in foreign securities which may be subject to foreign taxes on income, gains on investments or currency repatriation, a portion of which may be recoverable. | ||
| K. | Foreign Currency Contracts — The Fund may enter into foreign currency contracts to manage or minimize currency or exchange rate risk. The Fund may also enter into foreign currency contracts for the purchase or sale of a security denominated in a foreign currency in order to “lock in” the U.S. dollar price of that security. A foreign currency contract is an obligation to purchase or sell a specific currency for an agreed-upon price at a future date. The use of foreign currency contracts does not eliminate fluctuations in the price of the underlying securities the Fund owns or intends to acquire but establishes a rate of exchange in advance. Fluctuations in the value of these contracts are measured by the difference in the contract date and reporting date exchange rates and are recorded as unrealized appreciation (depreciation) until the contracts are closed. When the contracts are closed, realized gains (losses) are recorded. Realized and unrealized gains (losses) on the contracts are included in the Statement of Operations. The primary risks associated with foreign currency contracts include failure of the counterparty to meet the terms of the contract and the value of the foreign currency changing unfavorably. These risks may be in excess of the amounts reflected in the Statement of Assets and Liabilities. |
15 Invesco European Growth Fund
NOTE 2—Advisory Fees and Other Fees Paid to Affiliates
The Trust has entered into a master investment advisory agreement with Invesco Advisers, Inc. (the “Adviser” or “Invesco”). Under the terms of the investment advisory agreement, the Fund pays an advisory fee to the Adviser based on the annual rate of the Fund’s average daily net assets as follows:
| Average Daily Net Assets | Rate | |||
| First $250 million | 0 | .935% | ||
| Next $250 million | 0 | .91% | ||
| Next $500 million | 0 | .885% | ||
| Next $1.5 billion | 0 | .86% | ||
| Next $2.5 billion | 0 | .835% | ||
| Next $2.5 billion | 0 | .81% | ||
| Next $2.5 billion | 0 | .785% | ||
| Over $10 billion | 0 | .76% | ||
Under the terms of a master sub-advisory agreement between the Adviser and each of Invesco Asset Management Deutschland GmbH, Invesco Asset Management Limited, Invesco Asset Management (Japan) Limited, Invesco Australia Limited, Invesco Hong Kong Limited, Invesco Senior Secured Management, Inc. and Invesco Canada Ltd. (collectively, the “Affiliated Sub-Advisers”) the Adviser, not the Fund, may pay 40% of the fees paid to the Adviser to any such Affiliated Sub-Adviser(s) that provide discretionary investment management services to the Fund based on the percentage of assets allocated to such Sub-Adviser(s).
The Adviser has contractually agreed, through at least February 28, 2013, to waive advisory fees and/or reimburse expenses of all shares to the extent necessary to limit total annual fund operating expenses after fee waiver and/or expense reimbursement (excluding certain items discussed below) of Class A, Class B, Class C, Class R, Class Y and Investor Class shares to 2.25%, 3.00%, 3.00%, 2.50%, 2.00% and 2.25%, respectively, of average daily net assets. In determining the Adviser’s obligation to waive advisory fees and/or reimburse expenses, the following expenses are not taken into account, and could cause the total annual fund operating expenses after fee waiver and/or expense reimbursement to exceed the numbers reflected above: (1) interest; (2) taxes; (3) dividend expense on short sales; (4) extraordinary or non-routine items; and (5) expenses that the Fund has incurred but did not actually pay because of an expense offset arrangement. Unless the Board of the Trustees and Invesco mutually agree to amend or continue the fee waiver agreement, it will terminate on February 28, 2013. The Adviser did not waive fees and/or reimburse expenses during the period under this expense limitation.
The Adviser has contractually agreed, through at least June 30, 2012, to waive the advisory fee payable by the Fund in an amount equal to 100% of the net advisory fees the Adviser receives from the affiliated money market funds on investments by the Fund of uninvested cash in such affiliated money market funds.
For the year ended October 31, 2011, the Adviser waived advisory fees of $108,343.
At the request of the Trustees of the Trust, Invesco Ltd. agreed to reimburse expenses incurred by the Fund in connection with market timing matters in the Invesco Funds, which may include legal, audit, shareholder reporting, communications and trustee expenses. These expenses along with the related expense reimbursement are included in the Statement of Operations. For the year ended October 31, 2011, Invesco Ltd. reimbursed expenses of the Fund in the amount of $2,800.
The Trust has entered into a master administrative services agreement with Invesco pursuant to which the Fund has agreed to pay Invesco for certain administrative costs incurred in providing accounting services to the Fund. For the year ended October 31, 2011, expenses incurred under the agreement are shown in the Statement of Operations as administrative services fees.
The Trust has entered into a transfer agency and service agreement with Invesco Investment Services, Inc. (“IIS”) pursuant to which the Fund has agreed to pay IIS a fee for providing transfer agency and shareholder services to the Fund and reimburse IIS for certain expenses incurred by IIS in the course of providing such services. IIS may make payments to intermediaries that provide omnibus account services, sub-accounting services and/or networking services. All fees payable by IIS to intermediaries that provide omnibus account services or sub-accounting are charged back to the Fund, subject to certain limitations approved by the Trust’s Board of Trustees. For the year ended October 31, 2011, expenses incurred under the agreement are shown in the Statement of Operations as transfer agent fees.
The Trust has entered into master distribution agreements with Invesco Distributors, Inc. (“IDI”) to serve as the distributor for the Class A, Class B, Class C, Class R, Class Y and Investor Class shares of the Fund. The Trust has adopted plans pursuant to Rule 12b-1 under the 1940 Act with respect to the Fund’s Class A, Class B, Class C, Class R and Investor Class shares (collectively, the “Plans”). The Fund, pursuant to the Plans, pays IDI compensation at the annual rate of 0.25% of the Fund’s average daily net assets of Class A shares, 1.00% of the average daily net assets of Class B and Class C shares and 0.50% of the average daily net assets of Class R shares. The Fund, pursuant to the Investor Class Plan, reimburses IDI for its allocated share of expenses incurred pursuant to the Investor Class Plan for the period, up to a maximum annual rate of 0.25% of the average daily net assets of Investor Class shares. Of the Plan payments, up to 0.25% of the average daily net assets of each class of shares may be paid to furnish continuing personal shareholder services to customers who purchase and own shares of such classes. Any amounts not paid as a service fee under the Plans would constitute an asset-based sales charge. Rules of the Financial Industry Regulatory Authority (“FINRA”) impose a cap on the total sales charges, including asset-based sales charges that may be paid by any class of shares of the Fund. For the year ended October 31, 2011, expenses incurred under the Plans are shown in the Statement of Operations as distribution fees.
Front-end sales commissions and CDSC (collectively, the “sales charges”) are not recorded as expenses of the Fund. Front-end sales commissions are deducted from proceeds from the sales of Fund shares prior to investment in Class A shares of the Fund. CDSC are deducted from redemption proceeds prior to remittance to the shareholder. During the year ended October 31, 2011, IDI advised the Fund that IDI retained $23,068 in front-end sales commissions from the sale of Class A shares and $103, $48,382 and $1,520 from Class A, Class B and Class C shares, respectively, for CDSC imposed on redemptions by shareholders.
Certain officers and trustees of the Trust are officers and directors of the Adviser, Invesco Ltd., IIS and/or IDI.
16 Invesco European Growth Fund
NOTE 3—Additional Valuation Information
GAAP defines fair value as the price that would be received to sell an asset or paid to transfer a liability in an orderly transaction between market participants at the measurement date, under current market conditions. GAAP establishes a hierarchy that prioritizes the inputs to valuation methods giving the highest priority to readily available unadjusted quoted prices in an active market for identical assets (Level 1) and the lowest priority to significant unobservable inputs (Level 3) generally when market prices are not readily available or are unreliable. Based on the valuation inputs, the securities or other investments are tiered into one of three levels. Changes in valuation methods may result in transfers in or out of an investment’s assigned level:
| Level 1 — | Prices are determined using quoted prices in an active market for identical assets. | |
| Level 2 — | Prices are determined using other significant observable inputs. Observable inputs are inputs that other market participants may use in pricing a security. These may include quoted prices for similar securities, interest rates, prepayment speeds, credit risk, yield curves, loss severities, default rates, discount rates, volatilities and others. | |
| Level 3 — | Prices are determined using significant unobservable inputs. In situations where quoted prices or observable inputs are unavailable (for example, when there is little or no market activity for an investment at the end of the period), unobservable inputs may be used. Unobservable inputs reflect the Fund’s own assumptions about the factors market participants would use in determining fair value of the securities or instruments and would be based on the best available information. |
The following is a summary of the tiered valuation input levels, as of October 31, 2011. The level assigned to the securities valuations may not be an indication of the risk or liquidity associated with investing in those securities. Because of the inherent uncertainties of valuation, the values reflected in the financial statements may materially differ from the value received upon actual sale of those investments.
| Level 1* | Level 2* | Level 3 | Total | |||||||||||||
| Australia | $ | — | $ | 6,940,022 | $ | — | $ | 6,940,022 | ||||||||
| Belgium | — | 21,620,876 | — | 21,620,876 | ||||||||||||
| Denmark | — | 11,434,900 | — | 11,434,900 | ||||||||||||
| France | 6,144,113 | 57,289,049 | — | 63,433,162 | ||||||||||||
| Germany | 6,603,847 | 54,607,313 | — | 61,211,160 | ||||||||||||
| Greece | 3,897,079 | — | — | 3,897,079 | ||||||||||||
| Ireland | — | 34,310,822 | — | 34,310,822 | ||||||||||||
| Italy | — | 3,325,562 | — | 3,325,562 | ||||||||||||
| Netherlands | 4,882,026 | 28,438,178 | — | 33,320,204 | ||||||||||||
| Norway | — | 32,192,901 | — | 32,192,901 | ||||||||||||
| Russia | — | 9,196,878 | — | 9,196,878 | ||||||||||||
| Spain | — | 5,227,103 | — | 5,227,103 | ||||||||||||
| Sweden | — | 45,314,539 | — | 45,314,539 | ||||||||||||
| Switzerland | 22,018,935 | 75,429,121 | — | 97,448,056 | ||||||||||||
| Turkey | — | 24,540,398 | — | 24,540,398 | ||||||||||||
| United Kingdom | 25,548,305 | 290,015,630 | — | 315,563,935 | ||||||||||||
| United States | 37,043,013 | — | — | 37,043,013 | ||||||||||||
| Total Investments | $ | 106,137,318 | $ | 699,883,292 | $ | — | $ | 806,020,610 | ||||||||
* Transfers occurred between Level 1 and Level 2 due to foreign fair value adjustments.
NOTE 4—Expense Offset Arrangement(s)
The expense offset arrangement is comprised of transfer agency credits which result from balances in Demand Deposit Accounts (DDA) used by the transfer agent for clearing shareholder transactions. For the year ended October 31, 2011, the Fund received credits from this arrangement, which resulted in the reduction of the Fund’s total expenses of $3,922.
NOTE 5—Trustees’ and Officers’ Fees and Benefits
“Trustees’ and Officers’ Fees and Benefits” include amounts accrued by the Fund to pay remuneration to certain Trustees and Officers of the Fund. Trustees have the option to defer compensation payable by the Fund, and “Trustees’ and Officers’ Fees and Benefits” also include amounts accrued by the Fund to fund such deferred compensation amounts. Those Trustees who defer compensation have the option to select various Invesco Funds in which their deferral accounts shall be deemed to be invested. Finally, certain current Trustees are eligible to participate in a retirement plan that provides for benefits to be paid upon retirement to Trustees over a period of time based on the number of years of service. The Fund may have certain former Trustees who also participate in a retirement plan and receive benefits under such plan. “Trustees’ and Officers’ Fees and Benefits” include amounts accrued by the Fund to fund such retirement benefits. Obligations under the deferred compensation and retirement plans represent unsecured claims against the general assets of the Fund.
During the year ended October 31, 2011, the Fund paid legal fees of $2,967 for services rendered by Kramer, Levin, Naftalis & Frankel LLP as counsel to the Independent Trustees. A partner of that firm is a Trustee of the Trust.
17 Invesco European Growth Fund
NOTE 6—Cash Balances
The Fund is permitted to temporarily carry a negative or overdrawn balance in its account with The State Street Bank and Trust Company, the custodian bank. To compensate the custodian bank for such overdrafts, the overdrawn Fund may either (1) leave funds as a compensating balance in the account so the custodian bank can be compensated by earning the additional interest; or (2) compensate by paying the custodian bank at a rate agreed upon by the custodian bank and Invesco, not to exceed the contractually agreed upon rate.
NOTE 7—Distributions to Shareholders and Tax Components of Net Assets
Tax Character of Distributions to Shareholders Paid During the Years Ended October 31, 2011 and 2010:
| 2011 | 2010 | |||||||
| Ordinary income | $ | 10,506,070 | $ | 11,404,136 | ||||
Tax Components of Net Assets at Period-End:
| 2011 | ||||
| Undistributed ordinary income | $ | 22,437,458 | ||
| Net unrealized appreciation — investments | 147,638,622 | |||
| Net unrealized appreciation — other investments | 88,611 | |||
| Temporary book/tax differences | (161,809 | ) | ||
| Capital loss carryforward | (24,716,831 | ) | ||
| Shares of beneficial interest | 664,400,403 | |||
| Total net assets | $ | 809,686,454 | ||
The difference between book-basis and tax-basis unrealized appreciation (depreciation) is due to differences in the timing of recognition of gains and losses on investments for tax and book purposes. The Fund’s net unrealized appreciation difference is attributable primarily to wash sales.
The temporary book/tax differences are a result of timing differences between book and tax recognition of income and/or expenses. The Fund’s temporary book/tax differences are the result of the trustee deferral of compensation and retirement plan benefits.
Capital loss carryforward is calculated and reported as of a specific date. Results of transactions and other activity after that date may affect the amount of capital loss carryforward actually available for the Fund to utilize. The ability to utilize capital loss carryforward in the future may be limited under the Internal Revenue Code and related regulations based on the results of future transactions.
The Fund utilized $20,083,817 of capital loss carryforward in the current period to offset net realized capital gain for federal income tax purposes. The Fund has a capital loss carryforward as of October 31, 2011, which expires as follows:
| Capital Loss | ||||
| Expiration | Carryforward* | |||
| October 31, 2017 | $ | 24,716,831 | ||
| * | Capital loss carryforward as of the date listed above is reduced for limitations, if any, to the extent required by the Internal Revenue Code. |
NOTE 8—Investment Securities
The aggregate amount of investment securities (other than short-term securities, U.S. Treasury obligations and money market funds, if any) purchased and sold by the Fund during the year ended October 31, 2011 was $177,404,651 and $210,306,430, respectively. Cost of investments on a tax basis includes the adjustments for financial reporting purposes as of the most recently completed Federal income tax reporting period-end.
| Unrealized Appreciation (Depreciation) of Investment Securities on a Tax Basis | ||||
| Aggregate unrealized appreciation of investment securities | $ | 189,315,190 | ||
| Aggregate unrealized (depreciation) of investment securities | (41,676,568 | ) | ||
| Net unrealized appreciation of investment securities | $ | 147,638,622 | ||
| Cost of investments for tax purposes is $658,381,988 | ||||
NOTE 9—Reclassification of Permanent Differences
Primarily as a result of differing book/tax treatment of foreign currency transactions and litigation settlements, on October 31, 2011, undistributed net investment income was increased by $5,720,500, undistributed net realized gain (loss) was decreased by $5,704,877 and shares of beneficial interest decreased by $15,623. This reclassification had no effect on the net assets of the Fund.
18 Invesco European Growth Fund
NOTE 10—Share Information
| Summary of Share Activity | ||||||||||||||||
| Year ended October 31, | ||||||||||||||||
| 2011(a) | 2010 | |||||||||||||||
| Shares | Amount | Shares | Amount | |||||||||||||
| Sold: | ||||||||||||||||
| Class A | 883,072 | $ | 27,902,997 | 906,997 | $ | 24,886,945 | ||||||||||
| Class B | 27,790 | 832,775 | 66,960 | 1,742,084 | ||||||||||||
| Class C | 106,525 | 3,115,796 | 151,508 | 3,931,229 | ||||||||||||
| Class R | 135,473 | 4,262,417 | 198,310 | 5,430,864 | ||||||||||||
| Class Y | 3,120,034 | 98,847,706 | 3,963,944 | 111,220,666 | ||||||||||||
| Investor Class | 191,023 | 5,976,110 | 231,996 | 6,381,125 | ||||||||||||
| Issued as reinvestment of dividends: | ||||||||||||||||
| Class A | 159,206 | 4,809,610 | 203,191 | 5,549,150 | ||||||||||||
| Class B | 4,949 | 141,239 | 10,629 | 274,323 | ||||||||||||
| Class C | 8,294 | 236,949 | 15,328 | 395,924 | ||||||||||||
| Class R | 5,495 | 165,684 | 7,027 | 191,567 | ||||||||||||
| Class Y | 90,823 | 2,746,476 | 22,909 | 626,323 | ||||||||||||
| Investor Class | 68,022 | 2,050,194 | 86,999 | 2,371,578 | ||||||||||||
| Automatic conversion of Class B shares to Class A shares: | ||||||||||||||||
| Class A | 155,232 | 4,903,561 | 212,293 | 5,820,337 | ||||||||||||
| Class B | (164,909 | ) | (4,903,561 | ) | (225,403 | ) | (5,820,337 | ) | ||||||||
Reacquired:(b) | ||||||||||||||||
| Class A | (3,213,924 | ) | (99,065,816 | ) | (3,894,131 | ) | (106,255,384 | ) | ||||||||
| Class B | (217,027 | ) | (6,362,898 | ) | (328,350 | ) | (8,396,206 | ) | ||||||||
| Class C | (619,520 | ) | (18,151,223 | ) | (601,401 | ) | (15,424,135 | ) | ||||||||
| Class R | (216,755 | ) | (6,751,386 | ) | (270,093 | ) | (7,379,838 | ) | ||||||||
| Class Y | (2,251,650 | ) | (70,525,868 | ) | (979,371 | ) | (26,693,191 | ) | ||||||||
| Investor Class | (834,210 | ) | (25,862,836 | ) | (1,320,990 | ) | (36,005,483 | ) | ||||||||
| Net increase (decrease) in share activity | (2,562,057 | ) | $ | (75,632,074 | ) | (1,541,648 | ) | $ | (37,152,459 | ) | ||||||
| (a) | There are entities that are record owners of more than 5% of the outstanding shares of the Fund and in the aggregate own 30% of the outstanding shares of the Fund. IDI has an agreement with these entities to sell Fund shares. The Fund, Invesco and/or Invesco affiliates may make payments to these entities, which are considered to be related to the Fund, for providing services to the Fund, Invesco and/or Invesco affiliates including but not limited to services such as securities brokerage, distribution, third party record keeping and account servicing. The Fund has no knowledge as to whether all or any portion of the shares owned of record by these entities are also owned beneficially. | |
| (b) | Net of redemption fees of $9,871 and $19,529 allocated among the classes based on relative net assets of each class for the years ended October 31, 2011 and 2010, respectively. |
19 Invesco European Growth Fund
NOTE 11—Financial Highlights
The following schedule presents financial highlights for a share of the Fund outstanding throughout the periods indicated.
| Ratio of | Ratio of | |||||||||||||||||||||||||||||||||||||||||||||||||||||||
| Net gains | expenses | expenses | ||||||||||||||||||||||||||||||||||||||||||||||||||||||
| (losses) | to average | to average net | Ratio of net | |||||||||||||||||||||||||||||||||||||||||||||||||||||
| Net asset | on securities | Dividends | Distributions | net assets | assets without | investment | ||||||||||||||||||||||||||||||||||||||||||||||||||
| value, | Net | (both | Total from | from net | from net | Net asset | Net assets, | with fee waivers | fee waivers | income | ||||||||||||||||||||||||||||||||||||||||||||||
| beginning | investment | realized and | investment | investment | realized | Total | value, end | Total | end of period | and/or expenses | and/or expenses | to average | Portfolio | |||||||||||||||||||||||||||||||||||||||||||
| of period | income(a) | unrealized) | operations | income | gains | Distributions | of period(b) | Return(c) | (000s omitted) | absorbed | absorbed | net assets | turnover(d) | |||||||||||||||||||||||||||||||||||||||||||
| Class A | ||||||||||||||||||||||||||||||||||||||||||||||||||||||||
| Year ended 10/31/11 | $ | 30.81 | $ | 0.58 | $ | (0.89 | )(e) | $ | (0.31 | ) | $ | (0.37 | ) | $ | — | $ | (0.37 | ) | $ | 30.13 | (1.02 | )%(e) | $ | 362,913 | 1.44 | %(f) | 1.45 | %(f) | 1.84 | %(f) | 21 | % | ||||||||||||||||||||||||
| Year ended 10/31/10 | 26.66 | 0.29 | 4.23 | 4.52 | (0.37 | ) | — | (0.37 | ) | 30.81 | 17.12 | 433,347 | 1.50 | 1.51 | 1.07 | 25 | ||||||||||||||||||||||||||||||||||||||||
| Year ended 10/31/09 | 22.86 | 0.32 | 5.64 | 5.96 | (0.78 | ) | (1.38 | ) | (2.16 | ) | 26.66 | 29.54 | 443,525 | 1.64 | 1.65 | 1.48 | 21 | |||||||||||||||||||||||||||||||||||||||
| Year ended 10/31/08 | 49.22 | 0.63 | (23.02 | ) | (22.39 | ) | (0.58 | ) | (3.39 | ) | (3.97 | ) | 22.86 | (49.17 | ) | 426,609 | 1.49 | 1.50 | 1.66 | 18 | ||||||||||||||||||||||||||||||||||||
| Year ended 10/31/07 | 39.83 | 0.56 | 11.52 | 12.08 | (0.31 | ) | (2.38 | ) | (2.69 | ) | 49.22 | 31.84 | 1,095,988 | 1.47 | 1.49 | 1.28 | 20 | |||||||||||||||||||||||||||||||||||||||
| Class B | ||||||||||||||||||||||||||||||||||||||||||||||||||||||||
| Year ended 10/31/11 | 28.92 | 0.32 | (0.84 | )(e) | (0.52 | ) | (0.13 | ) | — | (0.13 | ) | 28.27 | (1.78 | )(e) | 21,177 | 2.19 | (f) | 2.20 | (f) | 1.09 | (f) | 21 | ||||||||||||||||||||||||||||||||||
| Year ended 10/31/10 | 25.06 | 0.08 | 3.97 | 4.05 | (0.19 | ) | — | (0.19 | ) | 28.92 | 16.24 | 31,767 | 2.25 | 2.26 | 0.32 | 25 | ||||||||||||||||||||||||||||||||||||||||
| Year ended 10/31/09 | 21.37 | 0.15 | 5.33 | 5.48 | (0.41 | ) | (1.38 | ) | (1.79 | ) | 25.06 | 28.60 | 39,459 | 2.39 | 2.40 | 0.73 | 21 | |||||||||||||||||||||||||||||||||||||||
| Year ended 10/31/08 | 46.29 | 0.33 | (21.59 | ) | (21.26 | ) | (0.27 | ) | (3.39 | ) | (3.66 | ) | 21.37 | (49.56 | ) | 48,021 | 2.24 | 2.25 | 0.91 | 18 | ||||||||||||||||||||||||||||||||||||
| Year ended 10/31/07 | 37.63 | 0.22 | 10.87 | 11.09 | (0.05 | ) | (2.38 | ) | (2.43 | ) | 46.29 | 30.87 | 177,053 | 2.22 | 2.24 | 0.53 | 20 | |||||||||||||||||||||||||||||||||||||||
| Class C | ||||||||||||||||||||||||||||||||||||||||||||||||||||||||
| Year ended 10/31/11 | 28.95 | 0.32 | (0.84 | )(e) | (0.52 | ) | (0.13 | ) | — | (0.13 | ) | 28.30 | (1.78 | )(e) | 41,078 | 2.19 | (f) | 2.20 | (f) | 1.09 | (f) | 21 | ||||||||||||||||||||||||||||||||||
| Year ended 10/31/10 | 25.08 | 0.08 | 3.98 | 4.06 | (0.19 | ) | — | (0.19 | ) | 28.95 | 16.27 | 56,637 | 2.25 | 2.26 | 0.32 | 25 | ||||||||||||||||||||||||||||||||||||||||
| Year ended 10/31/09 | 21.39 | 0.15 | 5.33 | 5.48 | (0.41 | ) | (1.38 | ) | (1.79 | ) | 25.08 | 28.57 | 59,971 | 2.39 | 2.40 | 0.73 | 21 | |||||||||||||||||||||||||||||||||||||||
| Year ended 10/31/08 | 46.31 | 0.33 | (21.59 | ) | (21.26 | ) | (0.27 | ) | (3.39 | ) | (3.66 | ) | 21.39 | (49.53 | ) | 65,252 | 2.24 | 2.25 | 0.91 | 18 | ||||||||||||||||||||||||||||||||||||
| Year ended 10/31/07 | 37.65 | 0.22 | 10.87 | 11.09 | (0.05 | ) | (2.38 | ) | (2.43 | ) | 46.31 | 30.84 | 182,178 | 2.22 | 2.24 | 0.53 | 20 | |||||||||||||||||||||||||||||||||||||||
| Class R | ||||||||||||||||||||||||||||||||||||||||||||||||||||||||
| Year ended 10/31/11 | 30.68 | 0.50 | (0.89 | )(e) | (0.39 | ) | (0.29 | ) | — | (0.29 | ) | 30.00 | (1.28 | )(e) | 14,911 | 1.69 | (f) | 1.70 | (f) | 1.59 | (f) | 21 | ||||||||||||||||||||||||||||||||||
| Year ended 10/31/10 | 26.56 | 0.22 | 4.21 | 4.43 | (0.31 | ) | — | (0.31 | ) | 30.68 | 16.82 | 17,578 | 1.75 | 1.76 | 0.82 | 25 | ||||||||||||||||||||||||||||||||||||||||
| Year ended 10/31/09 | 22.70 | 0.27 | 5.63 | 5.90 | (0.66 | ) | (1.38 | ) | (2.04 | ) | 26.56 | 29.24 | 16,933 | 1.89 | 1.90 | 1.23 | 21 | |||||||||||||||||||||||||||||||||||||||
| Year ended 10/31/08 | 48.90 | 0.53 | (22.86 | ) | (22.33 | ) | (0.48 | ) | (3.39 | ) | (3.87 | ) | 22.70 | (49.28 | ) | 14,030 | 1.74 | 1.75 | 1.41 | 18 | ||||||||||||||||||||||||||||||||||||
| Year ended 10/31/07 | 39.60 | 0.45 | 11.45 | 11.90 | (0.22 | ) | (2.38 | ) | (2.60 | ) | 48.90 | 31.53 | 25,129 | 1.72 | 1.74 | 1.03 | 20 | |||||||||||||||||||||||||||||||||||||||
| Class Y | ||||||||||||||||||||||||||||||||||||||||||||||||||||||||
| Year ended 10/31/11 | 30.91 | 0.66 | (0.91 | )(e) | (0.25 | ) | (0.44 | ) | — | (0.44 | ) | 30.22 | (0.80 | )(e) | 215,716 | 1.19 | (f) | 1.20 | (f) | 2.09 | (f) | 21 | ||||||||||||||||||||||||||||||||||
| Year ended 10/31/10 | 26.73 | 0.36 | 4.25 | 4.61 | (0.43 | ) | — | (0.43 | ) | 30.91 | 17.44 | 190,994 | 1.25 | 1.26 | 1.32 | 25 | ||||||||||||||||||||||||||||||||||||||||
| Year ended 10/31/09 | 22.87 | 0.42 | 5.61 | 6.03 | (0.79 | ) | (1.38 | ) | (2.17 | ) | 26.73 | 29.84 | 84,793 | 1.39 | 1.40 | 1.73 | 21 | |||||||||||||||||||||||||||||||||||||||
| Year ended 10/31/08(g) | 28.09 | 0.03 | (5.25 | ) | (5.22 | ) | — | — | — | 22.87 | (18.58 | ) | 5,177 | 1.34 | (h) | 1.35 | (h) | 1.81 | (h) | 18 | ||||||||||||||||||||||||||||||||||||
| Investor Class | ||||||||||||||||||||||||||||||||||||||||||||||||||||||||
| Year ended 10/31/11 | 30.76 | 0.60 | (0.92 | )(e) | (0.32 | ) | (0.37 | ) | — | (0.37 | ) | 30.07 | (1.03 | )(e) | 153,892 | 1.38 | (f) | 1.39 | (f) | 1.90 | (f) | 21 | ||||||||||||||||||||||||||||||||||
| Year ended 10/31/10 | 26.61 | 0.30 | 4.22 | 4.52 | (0.37 | ) | — | (0.37 | ) | 30.76 | 17.16 | 175,069 | 1.47 | 1.48 | 1.10 | 25 | ||||||||||||||||||||||||||||||||||||||||
| Year ended 10/31/09 | 22.83 | 0.32 | 5.64 | 5.96 | (0.80 | ) | (1.38 | ) | (2.18 | ) | 26.61 | 29.58 | 178,106 | 1.64 | 1.65 | 1.48 | 21 | |||||||||||||||||||||||||||||||||||||||
| Year ended 10/31/08 | 49.14 | 0.64 | (22.98 | ) | (22.34 | ) | (0.58 | ) | (3.39 | ) | (3.97 | ) | 22.83 | (49.14 | ) | 155,205 | 1.47 | 1.48 | 1.69 | 18 | ||||||||||||||||||||||||||||||||||||
| Year ended 10/31/07 | 39.78 | 0.56 | 11.50 | 12.06 | (0.32 | ) | (2.38 | ) | (2.70 | ) | 49.14 | 31.80 | 376,835 | 1.47 | 1.49 | 1.28 | 20 | |||||||||||||||||||||||||||||||||||||||
| (a) | Calculated using average shares outstanding. | |
| (b) | Includes redemption fees added to shares of beneficial interest which were less than $0.005 per share. | |
| (c) | Includes adjustments in accordance with accounting principles generally accepted in the United States of America and as such, the net asset value for financial reporting purposes and the returns based upon those net asset values may differ from the net asset value and returns for shareholder transactions. Does not include sales charges and is not annualized for periods less than one year, if applicable. | |
| (d) | Portfolio turnover is calculated at the fund level and is not annualized for periods less than one year, if applicable. | |
| (e) | Includes litigation proceeds received during the period. Had the litigation proceeds not been received, Net gains (losses) on securities (both realized and unrealized) per share, for the year ended October 31, 2011, would have been $(1.11), $(1.06), $(1.06), $(1.11), $(1.13) and $(1.14) for Class A, Class B, Class C, Class R, Class Y and Investor Class shares, respectively, and total returns would have been lower. | |
| (f) | Ratios are based on average daily net assets (000’s) of $412,848, $27,385, $49,317, $16,660, $227,970 and $169,463 for Class A, Class B, Class C, Class R, Class Y and Investor Class shares, respectively. | |
| (g) | Commencement date of October 3, 2008. | |
| (h) | Annualized. |
20 Invesco European Growth Fund
Report of Independent Registered Public Accounting Firm
To the Board of Trustees of AIM International Mutual Funds (Invesco International Mutual Funds)
and Shareholders of Invesco European Growth Fund:
In our opinion, the accompanying statement of assets and liabilities, including the schedule of investments, and the related statements of operations and of changes in net assets and the financial highlights present fairly, in all material respects, the financial position of Invesco European Growth Fund (one of the funds constituting AIM International Mutual Funds (Invesco International Mutual Funds), hereafter referred to as the “Fund”) at October 31, 2011, the results of its operations for the year then ended, the changes in its net assets for each of the two years in the period then ended and the financial highlights for each of the five years in the period then ended, in conformity with accounting principles generally accepted in the United States of America. These financial statements and financial highlights (hereafter referred to as “financial statements”) are the responsibility of the Fund’s management; our responsibility is to express an opinion on these financial statements based on our audits. We conducted our audits of these financial statements in accordance with the standards of the Public Company Accounting Oversight Board (United States). Those standards require that we plan and perform the audit to obtain reasonable assurance about whether the financial statements are free of material misstatement. An audit includes examining, on a test basis, evidence supporting the amounts and disclosures in the financial statements, assessing the accounting principles used and significant estimates made by management, and evaluating the overall financial statement presentation. We believe that our audits, which included confirmation of securities at October 31, 2011 by correspondence with the custodian and brokers, provide a reasonable basis for our opinion.
PRICEWATERHOUSECOOPERS LLP
Houston, Texas
December 21, 2011
21 Invesco European Growth Fund
Calculating your ongoing Fund expenses
Example
As a shareholder of the Fund, you incur two types of costs: (1) transaction costs, which may include sales charges (loads) on purchase payments or contingent deferred sales charges on redemptions, and redemption fees, if any; and (2) ongoing costs, including management fees, distribution and/or service (12b-1) fees, and other Fund expenses. This example is intended to help you understand your ongoing costs (in dollars) of investing in the Fund and to compare these costs with ongoing costs of investing in other mutual funds. The example is based on an investment of $1,000 invested at the beginning of the period and held for the entire period May 1, 2011 through October 31, 2011.
Actual expenses
The table below provides information about actual account values and actual expenses. You may use the information in this table, together with the amount you invested, to estimate the expenses that you paid over the period. Simply divide your account value by $1,000 (for example, an $8,600 account value divided by $1,000 = 8.6), then multiply the result by the number in the table under the heading entitled “Actual Expenses Paid During Period” to estimate the expenses you paid on your account during this period.
Hypothetical example for comparison purposes
The table below also provides information about hypothetical account values and hypothetical expenses based on the Fund’s actual expense ratio and an assumed rate of return of 5% per year before expenses, which is not the Fund’s actual return.
The hypothetical account values and expenses may not be used to estimate the actual ending account balance or expenses you paid for the period. You may use this information to compare the ongoing costs of investing in the Fund and other funds. To do so, compare this 5% hypothetical example with the 5% hypothetical examples that appear in the shareholder reports of the other funds.
Please note that the expenses shown in the table are meant to highlight your ongoing costs only and do not reflect any transaction costs, such as sales charges (loads) on purchase payments, contingent deferred sales charges on redemptions, and redemption fees, if any. Therefore, the hypothetical information is useful in comparing ongoing costs only, and will not help you determine the relative total costs of owning different funds. In addition, if these transaction costs were included, your costs would have been higher.
| HYPOTHETICAL | ||||||||||||||||||||||||||||||
| ACTUAL | (5% annual return before expenses) | |||||||||||||||||||||||||||||
| Beginning | Ending | Expenses | Ending | Expenses | Annualized | |||||||||||||||||||||||||
| Account Value | Account Value | Paid During | Account Value | Paid During | Expense | |||||||||||||||||||||||||
| Class | (05/01/11) | (10/31/11)1 | Period2 | (10/31/11) | Period2 | Ratio | ||||||||||||||||||||||||
| A | $ | 1,000.00 | $ | 867.30 | $ | 6.78 | $ | 1,017.95 | $ | 7.32 | 1.44 | % | ||||||||||||||||||
| B | 1,000.00 | 864.00 | 10.29 | 1,014.17 | 11.12 | 2.19 | ||||||||||||||||||||||||
| C | 1,000.00 | 864.10 | 10.29 | 1,014.17 | 11.12 | 2.19 | ||||||||||||||||||||||||
| R | 1,000.00 | 866.30 | 7.95 | 1,016.69 | 8.59 | 1.69 | ||||||||||||||||||||||||
| Y | 1,000.00 | 868.40 | 5.60 | 1,019.21 | 6.06 | 1.19 | ||||||||||||||||||||||||
| Investor | 1,000.00 | 867.40 | 6.82 | 1,017.90 | 7.38 | 1.45 | ||||||||||||||||||||||||
| 1 | The actual ending account value is based on the actual total return of the Fund for the period May 1, 2011 through October 31, 2011, after actual expenses and will differ from the hypothetical ending account value which is based on the Fund’s expense ratio and a hypothetical annual return of 5% before expenses. |
| 2 | Expenses are equal to the Fund’s annualized expense ratio as indicated above multiplied by the average account value over the period, multiplied by 184/365 to reflect the most recent fiscal half year. |
22 Invesco European Growth Fund
| Approval of Investment Advisory and Sub-Advisory Contracts |
The Board of Trustees (the Board) of AIM International Mutual Funds (Invesco International Mutual Funds) is required under the Investment Company Act of 1940, as amended, to approve annually the renewal of the Invesco European Growth Fund (the Fund) investment advisory agreement with Invesco Advisers, Inc. (Invesco Advisers) and the Master Intergroup Sub-Advisory Contract for Mutual Funds (the sub-advisory contracts) with Invesco Asset Management Deutschland GmbH, Invesco Asset Management Limited, Invesco Asset Management (Japan) Limited, Invesco Australia Limited, Invesco Hong Kong Limited, Invesco Senior Secured Management, Inc. and Invesco Canada Ltd. (collectively, the Affiliated Sub-Advisers). During contract renewal meetings held on June 14-15, 2011, the Board as a whole, and the disinterested or “independent” Trustees, who comprise 80% of the Board, voting separately, approved the continuance of the Fund’s investment advisory agreement and the sub-advisory contracts for another year, effective July 1, 2011. In doing so, the Board considered the process that it follows in reviewing and approving the Fund’s investment advisory agreement and sub-advisory contracts and the information that it is provided. The Board determined that the Fund’s investment advisory agreement and the sub-advisory contracts are in the best interests of the Fund and its shareholders and the compensation to Invesco Advisers and the Affiliated Sub-Advisers under the agreements is fair and reasonable.
The Board’s Fund Evaluation Process
The Board’s Investments Committee has established three Sub-Committees, each of which is responsible for overseeing the management of a number of the series portfolios of the funds advised by Invesco Advisers (the Invesco Funds). The Sub-Committees meet throughout the year to review the performance of their assigned funds, including reviewing materials prepared under the direction of the independent Senior Officer, an officer of the Invesco Funds who reports directly to the independent Trustees. Over the course of each year, the Sub-Committees meet with portfolio managers for their assigned Invesco Funds and other members of management to review the performance, investment objective(s), policies, strategies and limitations and investment risks of these funds. The Sub-Committees meet regularly and at designated contract renewal meetings each year to conduct a review of the performance, fees, expenses and other matters related to their assigned Invesco Funds. Each Sub-Committee recommends to the Investments Committee, which in turn recommends to the full Board, whether to approve the continuance of each Invesco Fund’s investment advisory agreement and sub-advisory contracts for another year.
During the contract renewal process, the Trustees receive comparative performance and fee data regarding the Invesco Funds prepared by Invesco Advisers and an independent company, Lipper, Inc. (Lipper). The Trustees also receive an independent written evaluation from the Senior Officer. The Senior Officer’s evaluation is prepared as part of his responsibility to manage the process by which the Invesco Funds’ proposed management fees are negotiated during the annual contract renewal process to ensure they are negotiated in a manner that is at arms’ length and reasonable. The independent Trustees are assisted in their annual evaluation of the Fund’s investment advisory agreement by the Senior Officer and by independent legal counsel. The independent Trustees also discuss the continuance of the investment advisory agreement and sub-advisory contracts in private sessions with the Senior Officer and counsel.
In evaluating the fairness and reasonableness of the Fund’s investment advisory agreement and sub-advisory contracts, the Board considered, among other things, the factors discussed below. The Trustees also considered information provided in connection with fund acquisitions approved by the Trustees to rationalize the Invesco Funds product range following the acquisition of the retail mutual fund business of Morgan Stanley (the Morgan Stanley Transaction). The Trustees recognized that the advisory fees for the Invesco Funds include advisory fees that are the result of years of review and negotiation between the Trustees and Invesco Advisers as well as advisory fees inherited from Morgan Stanley and Van Kampen funds acquired in the Morgan Stanley Transaction. The Trustees’ deliberations and conclusions in a particular year may be based in part on their deliberations and conclusions regarding these same arrangements throughout the year and in prior years. One Trustee may have weighed a particular piece of information differently than another Trustee.
The discussion below serves as the Senior Officer’s independent written evaluation with respect to the Fund’s investment advisory agreement as well as a discussion of the material factors and related conclusions that formed the basis for the Board’s approval of the Fund’s investment advisory agreement and sub-advisory contracts. Unless otherwise stated, this information is current as of June 15, 2011, and may not reflect consideration of factors that became known to the Board after that date, including, for example, changes to the Fund’s performance, advisory fees, expense limitations and/or fee waivers.
Factors and Conclusions and Summary of Independent Written Fee Evaluation
| A. | Nature, Extent and Quality of Services Provided by Invesco Advisers and the Affiliated Sub-Advisers |
The Board reviewed the advisory services provided to the Fund by Invesco Advisers under the Fund’s investment advisory agreement, the performance of Invesco Advisers in providing these services, and the credentials and experience of the officers and employees of Invesco Advisers who provide these services, including the Fund’s portfolio manager or managers, with whom the Board met during the year. The Board’s review of the qualifications of Invesco Advisers to provide advisory services included the Board’s consideration of Invesco Advisers’ performance and investment process oversight, independent credit analysis and investment risk management.
In determining whether to continue the Fund’s investment advisory agreement, the Board considered the prior relationship between Invesco Advisers and the Fund, as well as the Board’s knowledge of Invesco Advisers’ operations, and concluded that it is beneficial to maintain the current relationship, in part, because of such knowledge. The Board also considered services that Invesco Advisers and its affiliates provide to the Invesco Funds such as various back office support functions, equity and fixed income trading operations, internal audit, distribution and legal and compliance. The Board concluded that the nature, extent and quality of the services provided to the Fund by Invesco Advisers are appropriate and satisfactory and the advisory services are provided in accordance with the terms of the Fund’s investment advisory agreement.
The Board reviewed the services provided by the Affiliated Sub-Advisers under the sub-advisory contracts and the credentials and experience of the officers and employees of the Affiliated Sub-Advisers who provide these services. The Board noted that the Affiliated Sub-Advisers have offices and personnel that are located in financial centers around the world. As a result, the Affiliated Sub-Advisers can provide research and investment analysis on the markets and economies of various countries in which the Fund invests and make recommendations on securities of companies located in such countries. The Board concluded that the sub-advisory contracts benefit the Fund and its shareholders by permitting Invesco Advisers to use the resources and talents of the Affiliated Sub-Advisers in managing the Fund. The Board concluded that the
23 Invesco European Growth Fund
nature, extent and quality of the services provided by the Affiliated Sub-Advisers are appropriate and satisfactory and in accordance with the terms of the Fund’s sub-advisory contracts.
| B. | Fund Performance |
The Board considered Fund performance as a relevant factor in considering whether to approve the investment advisory agreement. The Board did not view Fund performance as a relevant factor in considering whether to approve the sub-advisory contracts for the Fund, as no Affiliated Sub-Adviser currently manages assets of the Fund.
The Board compared the Fund’s performance during the past one, three and five calendar years to the performance of funds in the Lipper performance universe and against the Lipper European Region Funds Index. The Board noted that performance of Class A shares of the Fund was in the second quintile of the performance universe for the one, three and five year periods (the first quintile being the best performing funds and the fifth quintile being the worst performing funds). The Board noted that performance of Class A shares of the Fund was above the performance of the Index for the one, three and five year periods. Although the independent written evaluation of the Fund’s Senior Officer only considered Fund performance through the most recent calendar year, the Trustees also reviewed more recent Fund performance and this review did not change their conclusions.
| C. | Advisory and Sub-Advisory Fees and Fee Waivers |
The Board compared the Fund’s contractual advisory fee rate to the contractual advisory fee rates of funds in the Fund’s Lipper expense group at a common asset level. The Board noted that the contractual advisory fee rate for Class A shares of the Fund was above the median contractual advisory fee rate of funds in the expense group. The Board also reviewed the methodology used by Lipper in providing expense group information, which includes using audited financial data from the most recent annual report of each fund in the expense group that was publicly available as of the end of the past calendar year and including only one fund per investment adviser. The Board noted that comparative data is as of varying dates, which may affect the comparability of data during times of market volatility.
The Board noted that Invesco Advisers and the Affiliated Sub-Advisers do not manage other mutual funds or client accounts in a manner substantially similar to the management of the Fund.
The Board noted that Invesco Advisers has contractually agreed to waive fees and/or limit expenses of the Fund through at least February 28, 2012 in an amount necessary to limit total annual operating expenses to a specified percentage of average daily net assets for each class of the Fund. The Board noted that at the current expense ratio for the Fund, this expense waiver does not have any impact.
The Board also considered the services provided by the Affiliated Sub-Advisers pursuant to the sub-advisory contracts, as well as the allocation of fees between Invesco Advisers and the Affiliated Sub-Advisers pursuant to the sub-advisory contracts. The Board noted that Invesco Advisers provides services to sub-advised Invesco Funds, including oversight of the Affiliated Sub-Advisers as well as the additional services described above other than day-to-day portfolio management. The Board also noted that the sub-advisory fees have no direct effect on the Fund or its shareholders, as they are paid by Invesco Advisers to the Affiliated Sub-Advisers.
Based upon the information and considerations described above, the Board concluded that the Fund’s advisory and sub-advisory fees are fair and reasonable.
| D. | Economies of Scale and Breakpoints |
The Board considered the extent to which there are economies of scale in the provision of advisory services to the Fund. The Board also considered whether the Fund benefits from economies of scale through contractual breakpoints in the Fund’s advisory fee schedule. The Board also noted that the Fund shares directly in economies of scale through lower fees charged by third party service providers based on the combined size of the Invesco Funds and other clients advised by Invesco Advisers.
| E. | Profitability and Financial Resources |
The Board reviewed information from Invesco Advisers concerning the costs of the advisory and other services that Invesco Advisers and its affiliates provide to the Fund and the profitability of Invesco Advisers and its affiliates in providing these services. The Board reviewed with Invesco Advisers the methodology used to prepare the profitability information. The Board considered the profitability of Invesco Advisers in connection with managing the Fund and the Invesco Funds. The Board noted that Invesco Advisers continues to operate at a net profit from services Invesco Advisers and its subsidiaries provide to the Fund and the Invesco Funds. The Board concluded that the level of profits realized by Invesco Advisers and its affiliates from providing services to the Fund is not excessive given the nature, quality and extent of the services provided to the Invesco Funds. The Board considered whether Invesco Advisers and each Affiliated Sub-Adviser are financially sound and have the resources necessary to perform their obligations under the investment advisory agreement and sub-advisory contracts. The Board concluded that Invesco Advisers and each Affiliated Sub-Adviser have the financial resources necessary to fulfill these obligations.
| F. | Collateral Benefits to Invesco Advisers and its Affiliates |
The Board considered various other benefits received by Invesco Advisers and its affiliates from the relationship with the Fund, including the fees received for their provision of administrative, transfer agency and distribution services to the Fund. The Board considered the performance of Invesco Advisers and its affiliates in providing these services and the organizational structure employed to provide these services. The Board also considered that these services are provided to the Fund pursuant to written contracts that are reviewed and approved on an annual basis by the Board; that the services are required for the operation of the Fund; that Invesco Advisers and its affiliates can provide services, the nature and quality of which are at least equal to those provided by others offering the same or similar services; and that the fees for such services are fair and reasonable in light of the usual and customary charges by others for services of the same nature and quality.
The Board considered the benefits realized by Invesco Advisers and the Affiliated Sub-Advisers as a result of portfolio brokerage transactions executed through “soft dollar” arrangements. The Board noted that soft dollar arrangements shift the payment obligation for research and execution services from Invesco Advisers and the Affiliated Sub-Advisers to the Invesco Funds and therefore may reduce Invesco Advisers’ and the Affiliated Sub-Advisers’ expenses. The Board concluded that the soft dollar arrangements are appropriate. The Board also concluded that, based on their review and representations made by the Chief Compliance Officer of the Invesco Funds, these arrangements are consistent with regulatory requirements.
The Board considered that the Fund’s uninvested cash and cash collateral from any securities lending arrangements may be invested in money market funds advised by Invesco Advisers pursuant to procedures approved by the Board. The Board noted that Invesco Advisers receives advisory fees from these affiliated money market funds attributable to such investments, although Invesco Advisers has contractually agreed to waive through varying periods the advisory fees payable by the Invesco Funds. The waiver is in an amount equal to 100% of the net advisory fee Invesco Advisers receives from the affiliated money market funds with respect to the Fund’s investment in the affiliated money market funds of uninvested cash, but not cash collateral. The Board concluded that the Fund’s investment of uninvested cash and cash collateral from any securities lending arrangements in the affiliated money market funds is in the best interests of the Fund and its shareholders.
24 Invesco European Growth Fund
Tax Information
Form 1099-DIV, Form 1042-S and other year-end tax information provide shareholders with actual calendar year amounts that should be included in their tax returns. Shareholders should consult their tax advisors.
The following distribution information is being provided as required by the Internal Revenue Code or to meet a specific state’s requirement.
The Fund designates the following amounts or, if subsequently determined to be different, the maximum amount allowable for its fiscal year ended October 31, 2011:
Federal and State Income Tax | ||||
| Qualified Dividend Income* | 100% | |||
| Corporate Dividends Received Deduction* | 0% | |||
| Foreign Taxes | $ | 0.0645 per share | ||
| Foreign Source Income | $ | 1.1712 per share | ||
| * | The above percentages are based on ordinary income dividends paid to shareholders during the Fund’s fiscal year. |
25 Invesco European Growth Fund
Trustees and Officers
The address of each trustee and officer is AIM International Mutual Funds (Invesco International Mutual Funds) (the “Trust”), 11 Greenway Plaza, Suite 2500, Houston, Texas 77046-1173. The trustees serve for the life of the Trust, subject to their earlier death, incapacitation, resignation, retirement or removal as more specifically provided in the Trust’s organizational documents. Each officer serves for a one year term or until their successors are elected and qualified. Column two below includes length of time served with predecessor entities, if any.
| Number of | ||||||||
| Funds in | ||||||||
| Fund Complex | ||||||||
| Name, Year of Birth and | Trustee and/ | Principal Occupation(s) | Overseen by | Other Directorship(s) | ||||
| Position(s) Held with the Trust | or Officer Since | During Past 5 Years | Trustee | Held by Trustee | ||||
| Interested Persons | ||||||||
Martin L. Flanagan1 — 1960 Trustee | 2007 | Executive Director, Chief Executive Officer and President, Invesco Ltd. (ultimate parent of Invesco and a global investment management firm); Advisor to the Board, Invesco Advisers, Inc. (formerly known as Invesco Institutional (N.A.), Inc.); Trustee, The Invesco Funds; Vice Chair, Investment Company Institute; and Member of Executive Board, SMU Cox School of Business | 141 | None | ||||
| Formerly: Chairman, Invesco Advisers, Inc. (registered investment adviser); Director, Chairman, Chief Executive Officer and President, IVZ Inc. (holding company), INVESCO Group Services, Inc. (service provider) and Invesco North American Holdings, Inc. (holding company); Director, Chief Executive Officer and President, Invesco Holding Company Limited (parent of Invesco and a global investment management firm); Director, Invesco Ltd.; Chairman, Investment Company Institute and President, Co-Chief Executive Officer, Co-President, Chief Operating Officer and Chief Financial Officer, Franklin Resources, Inc. (global investment management organization) | ||||||||
Philip A. Taylor2 — 1954 Trustee, President and Principal Executive Officer | 2006 | Head of North American Retail and Senior Managing Director, Invesco Ltd.; Director, Co-Chairman, Co-President and Co-Chief Executive Officer, Invesco Advisers, Inc. (formerly known as Invesco Institutional (N.A.), Inc.) (registered investment adviser); Director, Chairman, Chief Executive Officer and President, Invesco Management Group, Inc. (formerly Invesco Aim Management Group, Inc.) (financial services holding company); Director and President, INVESCO Funds Group, Inc. (registered investment adviser and registered transfer agent); Director and Chairman, Invesco Investment Services, Inc. (formerly known as Invesco Aim Investment Services, Inc.) (registered transfer agent) and IVZ Distributors, Inc. (formerly known as INVESCO Distributors, Inc.) (registered broker dealer); Director, President and Chairman, Invesco Inc. (holding company) and Invesco Canada Holdings Inc. (holding company); Chief Executive Officer, Invesco Corporate Class Inc. (corporate mutual fund company) and Invesco Canada Fund Inc. (corporate mutual fund company); Director, Chairman and Chief Executive Officer, Invesco Canada Ltd. (formerly known as Invesco Trimark Ltd./Invesco Trimark Ltèe) (registered investment adviser and registered transfer agent); Trustee, President and Principal Executive Officer, The Invesco Funds (other than AIM Treasurer’s Series Trust (Invesco Treasurer’s Series Trust) and Short-Term Investments Trust); Trustee and Executive Vice President, The Invesco Funds (AIM Treasurer’s Series Trust (Invesco Treasurer’s Series Trust) and Short-Term Investments Trust only); Director, Invesco Investment Advisers LLC (formerly known as Van Kampen Asset Management); Director, Chief Executive Officer and President, Van Kampen Exchange Corp. | 141 | None | ||||
| Formerly: Director and Chairman, Van Kampen Investor Services Inc.: | ||||||||
| Director, Chief Executive Officer and President, 1371 Preferred Inc. (holding company); and Van Kampen Investments Inc.; Director and President, AIM GP Canada Inc. (general partner for limited partnerships); and Van Kampen Advisors, Inc.; Director and Chief Executive Officer, Invesco Trimark Dealer Inc. (registered broker dealer); Director, Invesco Distributors, Inc. (formerly known as Invesco Aim Distributors, Inc.) (registered broker dealer); Manager, Invesco PowerShares Capital Management LLC; Director, Chief Executive Officer and President, Invesco Advisers, Inc.; Director, Chairman, Chief Executive Officer and President, Invesco Aim Capital Management, Inc.; President, Invesco Trimark Dealer Inc. and Invesco Trimark Ltd./Invesco Trimark Ltèe; Director and President, AIM Trimark Corporate Class Inc. and AIM Trimark Canada Fund Inc.; Senior Managing Director, Invesco Holding Company Limited; Trustee and Executive Vice President, Tax-Free Investments Trust; Director and Chairman, Fund Management Company (former registered broker dealer); President and Principal Executive Officer, The Invesco Funds (AIM Treasurer’s Series Trust (Invesco Treasurer’s Series Trust), Short-Term Investments Trust and Tax-Free Investments Trust only); President, AIM Trimark Global Fund Inc. and AIM Trimark Canada Fund Inc. | ||||||||
Wayne W. Whalen3 — 1939 Trustee | 2010 | Of Counsel, and prior to 2010, partner in the law firm of Skadden, Arps, Slate, Meagher & Flom LLP, legal counsel to funds in the Fund Complex | 159 | Director of the Abraham Lincoln Presidential Library Foundation | ||||
| Independent Trustees | ||||||||
| Bruce L. Crockett — 1944 Trustee and Chair | 1992 | Chairman, Crockett Technology Associates (technology consulting company) Formerly: Director, Captaris (unified messaging provider); Director, President and Chief Executive Officer COMSAT Corporation; and Chairman, Board of Governors of INTELSAT (international communications company) | 141 | ACE Limited (insurance company); and Investment Company Institute | ||||
| David C. Arch — 1945 Trustee | 2010 | Chairman and Chief Executive Officer of Blistex Inc., a consumer health care products manufacturer. | 159 | Member of the Heartland Alliance Advisory Board, a nonprofit organization serving human needs based in Chicago. Board member of the Illinois Manufacturers’ Association. Member of the Board of Visitors, Institute for the Humanities, University of Michigan | ||||
| 1 | Mr. Flanagan is considered an interested person of the Trust because he is an officer of the adviser to the Trust, and an officer and a director of Invesco Ltd., ultimate parent of the adviser to the Trust. |
| 2 | Mr. Taylor is considered an interested person of the Trust because he is an officer and a director of the adviser to, and a director of the principal underwriter of, the Trust. |
| 3 | Mr. Whalen has been deemed to be an interested person of the Trust because of his prior service as counsel to the predecessor funds of certain Invesco open-end funds and his affiliation with the law firm that served as counsel to such predecessor funds and continues to serve as counsel to the Invesco Van Kampen closed-end funds. |
T-1 Invesco European Growth Fund
Trustees and Officers—(continued)
The address of each trustee and officer is AIM International Mutual Funds (Invesco International Mutual Funds) (the “Trust”), 11 Greenway Plaza, Suite 2500, Houston, Texas 77046-1173. The trustees serve for the life of the Trust, subject to their earlier death, incapacitation, resignation, retirement or removal as more specifically provided in the Trust’s organizational documents. Each officer serves for a one year term or until their successors are elected and qualified. Column two below includes length of time served with predecessor entities, if any.
| Number of | ||||||||
| Funds in | ||||||||
| Fund Complex | ||||||||
| Name, Year of Birth and | Trustee and/ | Principal Occupation(s) | Overseen by | Other Directorship(s) | ||||
| Position(s) Held with the Trust | or Officer Since | During Past 5 Years | Trustee | Held by Trustee | ||||
| Independent Trustees—(continued) | ||||||||
| Bob R. Baker — 1936 Trustee | 2003 | Retired Formerly: President and Chief Executive Officer, AMC Cancer Research Center; and Chairman and Chief Executive Officer, First Columbia Financial Corporation | 141 | None | ||||
| Frank S. Bayley — 1939 Trustee | 2001 | Retired Formerly: Director, Badgley Funds, Inc. (registered investment company) (2 portfolios) and Partner, law firm of Baker & McKenzie | 141 | Director and Chairman, C.D. Stimson Company (a real estate investment company) | ||||
| James T. Bunch — 1942 Trustee | 2003 | Founder, Green, Manning & Bunch Ltd. (investment banking firm) Formerly: Executive Committee, United States Golf Association; and Director, Policy Studies, Inc. and Van Gilder Insurance Corporation | 141 | Vice Chairman, Board of Governors, Western Golf Association/Evans Scholars Foundation and Director, Denver Film Society | ||||
| Rodney F. Dammeyer — 1940 Trustee | 2010 | President of CAC, LLC, a private company offering capital investment and management advisory services. Formerly: Prior to January 2004, Director of TeleTech Holdings Inc.; Prior to 2002, Director of Arris Group, Inc.; Prior to 2001, Managing Partner at Equity Group Corporate Investments. Prior to 1995, Vice Chairman of Anixter International. Prior to 1985, experience includes Senior Vice President and Chief Financial Officer of Household International, Inc, Executive Vice President and Chief Financial Officer of Northwest Industries, Inc. and Partner of Arthur Andersen & Co. | 159 | Director of Quidel Corporation and Stericycle, Inc. Prior to May 2008, Trustee of The Scripps Research Institute. Prior to February 2008, Director of Ventana Medical Systems, Inc. Prior to April 2007, Director of GATX Corporation. Prior to April 2004, Director of TheraSense, Inc. | ||||
| Albert R. Dowden — 1941 Trustee | 2000 | Director of a number of public and private business corporations, including the Boss Group, Ltd. (private investment and management); Reich & Tang Funds (5 portfolios) (registered investment company); and Homeowners of America Holding Corporation/ Homeowners of America Insurance Company (property casualty company) Formerly: Director, Continental Energy Services, LLC (oil and gas pipeline service); Director, CompuDyne Corporation (provider of product and services to the public security market) and Director, Annuity and Life Re (Holdings), Ltd. (reinsurance company); Director, President and Chief Executive Officer, Volvo Group North America, Inc.; Senior Vice President, AB Volvo; Director of various public and private corporations; Chairman, DHJ Media, Inc.; Director Magellan Insurance Company; and Director, The Hertz Corporation, Genmar Corporation (boat manufacturer), National Media Corporation; Advisory Board of Rotary Power International (designer, manufacturer, and seller of rotary power engines); and Chairman, Cortland Trust, Inc. (registered investment company) | 141 | Board of Nature’s Sunshine Products, Inc. | ||||
| Jack M. Fields — 1952 Trustee | 1997 | Chief Executive Officer, Twenty First Century Group, Inc. (government affairs company); and Owner and Chief Executive Officer, Dos Angelos Ranch, L.P. (cattle, hunting, corporate entertainment), Discovery Global Education Fund (non-profit) and Cross Timbers Quail Research Ranch (non-profit) Formerly: Chief Executive Officer, Texana Timber LP (sustainable forestry company) and member of the U.S. House of Representatives | 141 | Administaff | ||||
| Carl Frischling — 1937 Trustee | 1991 | Partner, law firm of Kramer Levin Naftalis and Frankel LLP | 141 | Director, Reich & Tang Funds (6 portfolios) | ||||
| Prema Mathai-Davis — 1950 Trustee | 1998 | Retired Formerly: Chief Executive Officer, YWCA of the U.S.A. | 141 | None | ||||
| Larry Soll — 1942 Trustee | 2003 | Retired Formerly, Chairman, Chief Executive Officer and President, Synergen Corp. (a biotechnology company) | 141 | None | ||||
| Hugo F. Sonnenschein — 1940 Trustee | 2010 | President Emeritus and Honorary Trustee of the University of Chicago and the Adam Smith Distinguished Service Professor in the Department of Economics at the University of Chicago. Prior to July 2000, President of the University of Chicago. | 159 | Trustee of the University of Rochester and a member of its investment committee. Member of the National Academy of Sciences, the American Philosophical Society and a fellow of the American Academy of Arts and Sciences | ||||
| Raymond Stickel, Jr. — 1944 Trustee | 2005 | Retired | 141 | Director of Long Cove Club Owners’ association (home owner’s association) | ||||
| Formerly: Director, Mainstay VP Series Funds, Inc. (25 portfolios) and Partner, Deloitte & Touche | ||||||||
T-2 Invesco European Growth Fund
Trustees and Officers—(continued)
The address of each trustee and officer is AIM International Mutual Funds (Invesco International Mutual Funds) (the “Trust”), 11 Greenway Plaza, Suite 2500, Houston, Texas 77046-1173. The trustees serve for the life of the Trust, subject to their earlier death, incapacitation, resignation, retirement or removal as more specifically provided in the Trust’s organizational documents. Each officer serves for a one year term or until their successors are elected and qualified. Column two below includes length of time served with predecessor entities, if any.
| Number of | ||||||||
| Funds in | ||||||||
| Fund Complex | ||||||||
| Name, Year of Birth and | Trustee and/ | Principal Occupation(s) | Overseen by | Other Directorship(s) | ||||
| Position(s) Held with the Trust | or Officer Since | During Past 5 Years | Trustee | Held by Trustee | ||||
| Other Officers | ||||||||
| Russell C. Burk — 1958 Senior Vice President and Senior Officer | 2005 | Senior Vice President and Senior Officer of Invesco Funds | N/A | N/A | ||||
| John M. Zerr — 1962 Senior Vice President, Chief Legal Officer and Secretary | 2006 | Director, Senior Vice President, Secretary and General Counsel, Invesco Management Group, Inc. (formerly known as Invesco Aim Management Group, Inc.) and Van Kampen Exchange Corp.; Senior Vice President, Invesco Advisers, Inc. (formerly known as Invesco Institutional (N.A.), Inc.) (registered investment adviser); Senior Vice President and Secretary, Invesco Distributors, Inc. (formerly known as Invesco Aim Distributors, Inc.); Director, Vice President and Secretary, Invesco Investment Services, Inc. (formerly known as Invesco Aim Investment Services, Inc.) and IVZ Distributors, Inc. (formerly known as INVESCO Distributors, Inc.); Director and Vice President, INVESCO Funds Group, Inc.; Senior Vice President, Chief Legal Officer and Secretary, The Invesco Funds; Manager, Invesco PowerShares Capital Management LLC; Director, Secretary and General Counsel, Invesco Investment Advisers LLC (formerly known as Van Kampen Asset Management); Secretary and General Counsel, Van Kampen Funds Inc. and Chief Legal Officer, PowerShares Exchange-Traded Fund Trust, PowerShares Exchange-Traded Fund Trust II, PowerShares India Exchange-Traded Fund Trust and PowerShares Actively Managed Exchange-Traded Fund Trust Formerly: Director and Secretary, Van Kampen Advisors Inc.; Director Vice President, Secretary and General Counsel Van Kampen Investor Services Inc.; Director, Invesco Distributors, Inc. (formerly known as Invesco Aim Distributors, Inc.); Director, Senior Vice President, General Counsel and Secretary, Invesco Advisers, Inc.; and Van Kampen Investments Inc.; Director, Vice President and Secretary, Fund Management Company; Director, Senior Vice President, Secretary, General Counsel and Vice President, Invesco Aim Capital Management, Inc.; Chief Operating Officer and General Counsel, Liberty Ridge Capital, Inc. (an investment adviser); Vice President and Secretary, PBHG Funds (an investment company) and PBHG Insurance Series Fund (an investment company); Chief Operating Officer, General Counsel and Secretary, Old Mutual Investment Partners (a broker-dealer); General Counsel and Secretary, Old Mutual Fund Services (an administrator) and Old Mutual Shareholder Services (a shareholder servicing center); Executive Vice President, General Counsel and Secretary, Old Mutual Capital, Inc. (an investment adviser); and Vice President and Secretary, Old Mutual Advisors Funds (an investment company) | N/A | N/A | ||||
| Lisa O. Brinkley — 1959 Vice President | 2004 | Global Compliance Director, Invesco Ltd.; Chief Compliance Officer, Invesco Investment Services, Inc.(formerly known as Invesco Aim Investment Services, Inc.); and Vice President, The Invesco Funds Formerly: Chief Compliance Officer, Invesco Distributors, Inc. (formerly known as Invesco Aim Distributors, Inc.) and Van Kampen Investor Services Inc.; Senior Vice President, Invesco Management Group, Inc.; Senior Vice President and Chief Compliance Officer, Invesco Advisers, Inc. and The Invesco Funds; Vice President and Chief Compliance Officer, Invesco Aim Capital Management, Inc. and Invesco Distributors, Inc.; Vice President, Invesco Investment Services, Inc. and Fund Management Company | N/A | N/A | ||||
| Sheri Morris — 1964 Vice President, Treasurer and Principal Financial Officer | 1999 | Vice President, Treasurer and Principal Financial Officer, The Invesco Funds; and Vice President, Invesco Advisers, Inc. (formerly known as Invesco Institutional (N.A.), Inc.) (registered investment adviser). | N/A | N/A | ||||
| Formerly: Treasurer, PowerShares Exchange-Traded Fund Trust, PowerShares Exchange-Traded Fund Trust II, PowerShares India Exchange-Traded Fund Trust and PowerShares Actively Managed Exchange-Traded Fund Trust; Vice President, Invesco Advisers, Inc., Invesco Aim Capital Management, Inc. and Invesco Aim Private Asset Management, Inc.; Assistant Vice President and Assistant Treasurer, The Invesco Funds and Assistant Vice President, Invesco Advisers, Inc., Invesco Aim Capital Management, Inc. and Invesco Aim Private Asset Management, Inc. | ||||||||
T-3 Invesco European Growth Fund
Trustees and Officers—(continued)
The address of each trustee and officer is AIM International Mutual Funds (Invesco International Mutual Funds) (the “Trust”), 11 Greenway Plaza, Suite 2500, Houston, Texas 77046-1173. The trustees serve for the life of the Trust, subject to their earlier death, incapacitation, resignation, retirement or removal as more specifically provided in the Trust’s organizational documents. Each officer serves for a one year term or until their successors are elected and qualified. Column two below includes length of time served with predecessor entities, if any.
| Number of | ||||||||
| Funds in | ||||||||
| Fund Complex | ||||||||
| Name, Year of Birth and | Trustee and/ | Principal Occupation(s) | Overseen by | Other Directorship(s) | ||||
| Position(s) Held with the Trust | or Officer Since | During Past 5 Years | Trustee | Held by Trustee | ||||
| Other Officers—(continued) | ||||||||
| Karen Dunn Kelley — 1960 Vice President | 2004 | Head of Invesco’s World Wide Fixed Income and Cash Management Group; Senior Vice President, Invesco Advisers, Inc. (formerly known as Invesco Institutional (N.A.), Inc.) (registered investment adviser); Executive Vice President, Invesco Distributors, Inc. (formerly known as Invesco Aim Distributors, Inc.); Senior Vice President, Invesco Management Group, Inc. (formerly known as Invesco Aim Management Group, Inc.); and Director, Invesco Mortgage Capital Inc.; Vice President, The Invesco Funds (other than AIM Treasurer’s Series Trust (Invesco Treasurer’s Series Trust) and Short-Term Investments Trust); President and Principal Executive Officer, The Invesco Funds (AIM Treasurer’s Series Trust (Invesco Treasurer’s Series Trust) and Short-Term Investments Trust only). Formerly: Senior Vice President, Van Kampen Investments Inc.; Vice President, Invesco Advisers, Inc. (formerly known as Invesco Institutional (N.A.), Inc.); Director of Cash Management and Senior Vice President, Invesco Advisers, Inc. and Invesco Aim Capital Management, Inc.; President and Principal Executive Officer, Tax-Free Investments Trust; Director and President, Fund Management Company; Chief Cash Management Officer, Director of Cash Management, Senior Vice President, and Managing Director, Invesco Aim Capital Management, Inc.; Director of Cash Management, Senior Vice President, and Vice President, Invesco Advisers, Inc. and The Invesco Funds (AIM Treasurer’s Series Trust (Invesco Treasurer’s Series Trust), Short-Term Investments Trust and Tax-Free Investments Trust only) | N/A | N/A | ||||
| Lance A. Rejsek — 1967 Anti-Money Laundering Compliance Officer | 2005 | Anti-Money Laundering Compliance Officer, Invesco Advisers, Inc. (formerly known as Invesco Institutional (N.A.), Inc.) (registered investment adviser); Invesco Distributors, Inc. (formerly known as Invesco Aim Distributors, Inc.), Invesco Investment Services, Inc. (formerly known as Invesco Aim Investment Services, Inc.), The Invesco Funds, PowerShares Exchange-Traded Fund Trust, PowerShares Exchange-Traded Fund Trust II, PowerShares India Exchange-Traded Fund Trust, PowerShares Actively Managed Exchange-Traded Fund Trust, Invesco Investment Advisers LLC (formerly known as Van Kampen Asset Management) and Van Kampen Funds Inc. Formerly: Anti-Money Laundering Compliance Officer, Van Kampen Investor Services Inc., Fund Management Company, Invesco Advisers, Inc., Invesco Aim Capital Management, Inc. and Invesco Aim Private Asset Management, Inc. | N/A | N/A | ||||
| Todd L. Spillane — 1958 Chief Compliance Officer | 2006 | Senior Vice President, Invesco Management Group, Inc. (formerly known as Invesco Aim Management Group, Inc.) and Van Kampen Exchange Corp.; Senior Vice President and Chief Compliance Officer, Invesco Advisers, Inc. (registered investment adviser) (formerly known as Invesco Institutional (N.A.), Inc.); Chief Compliance Officer, The Invesco Funds, PowerShares Exchange-Traded Fund Trust, PowerShares Exchange-Traded Fund Trust II, PowerShares India Exchange-Traded Fund Trust, PowerShares Actively Managed Exchange-Traded Fund Trust, INVESCO Private Capital Investments, Inc. (holding company) and Invesco Private Capital, Inc. (registered investment adviser); Vice President, Invesco Distributors, Inc. (formerly known as Invesco Aim Distributors, Inc.) and Invesco Investment Services, Inc. (formerly known as Invesco Aim Investment Services, Inc.). | N/A | N/A | ||||
| Formerly: Chief Compliance Officer, Invesco Van Kampen Closed-End Funds; Senior Vice President, Van Kampen Investments Inc.; Senior Vice President and Chief Compliance Officer, Invesco Advisers, Inc. and Invesco Aim Capital Management, Inc.; Chief Compliance Officer, Invesco Global Asset Management (N.A.), Inc., Invesco Senior Secured Management, Inc. (registered investment adviser) and Van Kampen Investor Services Inc.; Vice President, Invesco Aim Capital Management, Inc. and Fund Management Company | ||||||||
The Statement of Additional Information of the Trust includes additional information about the Fund’s Trustees and is available upon request, without charge, by calling 1.800.959.4246. Please refer to the Fund’s prospectus for information on the Fund’s sub-advisers.
| Office of the Fund 11 Greenway Plaza, Suite 2500 Houston, TX 77046-1173 | Investment Adviser Invesco Advisers, Inc. 1555 Peachtree Street, N.E. Atlanta, GA 30309 | Distributor Invesco Distributors, Inc. 11 Greenway Plaza, Suite 2500 Houston, TX 77046-1173 | Auditors PricewaterhouseCoopers LLP 1201 Louisiana Street, Suite 2900 Houston, TX 77002-5678 | |||
| Counsel to the Fund Stradley Ronon Stevens & Young, LLP 2600 One Commerce Square Philadelphia, PA 19103 | Counsel to the Independent Trustees Kramer, Levin, Naftalis & Frankel LLP 1177 Avenue of the Americas New York, NY 10036-2714 | Transfer Agent Invesco Investment Services, Inc. 11 Greenway Plaza, Suite 2500 Houston, TX 77046-1173 | Custodian State Street Bank and Trust Company 225 Franklin Boston, MA 02110-2801 |
T-4 Invesco European Growth Fund

Invesco mailing information
Send general correspondence to Invesco Investment Services, Inc., P.O. Box 219078, Kansas City, MO 64121-9078.
Invesco privacy policy
You share personal and financial information with us that is necessary for your transactions and your account records. We take very seriously the obligation to keep that information confidential and private.
Invesco collects nonpublic personal information about you from account applications or other forms you complete and from your transactions with us or our affiliates. We do not disclose information about you or our former customers to service providers or other third parties except to the extent necessary to service your account and in other limited circumstances as permitted by law. For example, we use this information to facilitate the delivery of transaction confirmations, financial reports, prospectuses and tax forms.
Even within Invesco, only people involved in the servicing of your accounts and compliance monitoring have access to your information. To ensure the highest level of confidentiality and security, Invesco maintains physical, electronic and procedural safeguards that meet or exceed federal standards. Special measures, such as data encryption and authentication, apply to your communications with us on our website. More detail is available to you at invesco.com/privacy.
Important notice regarding delivery of security holder documents
To reduce Fund expenses, only one copy of most shareholder documents may be mailed to shareholders with multiple accounts at the same address (Householding). Mailing of your shareholder documents may be householded indefinitely unless you instruct us otherwise. If you do not want the mailing of these documents to be combined with those for other members of your household, please contact Invesco Investment Services, Inc. at 800 959 4246 or contact your financial institution. We will begin sending you individual copies for each account within 30 days after receiving your request.
Fund holdings and proxy voting information
The Fund provides a complete list of its holdings four times in each fiscal year, at the quarter-ends. For the second and fourth quarters, the lists appear in the Fund’s semiannual and annual reports to shareholders. For the first and third quarters, the Fund files the lists with the Securities and Exchange Commission (SEC) on Form N-Q. The most recent list of portfolio holdings is available at invesco.com/completeqtrholdings. Shareholders can also look up the Fund’s Forms N-Q on the SEC website at sec.gov. Copies of the Fund’s Forms N-Q may be reviewed and copied at the SEC Public Reference Room in Washington, D.C. You can obtain information on the operation of the Public Reference Room, including information about duplicating fee charges, by calling 202 551 8090 or 800 732 0330, or by electronic request at the following email address: publicinfo@sec.gov. The SEC file numbers for the Fund are 811-06463 and 033-44611.
A description of the policies and procedures that the Fund uses to determine how to vote proxies relating to portfolio securities is available without charge, upon request, from our Client Services department at 800 959 4246 or at invesco.com/proxyguidelines. The information is also available on the SEC website, sec.gov.
Information regarding how the Fund voted proxies related to its portfolio securities during the 12 months ended June 30, 2011, is available at invesco.com/proxysearch. The information is also available on the SEC website, sec.gov.
Invesco Advisers, Inc. is an investment adviser; it provides investment advisory services to individual and institutional clients and does not sell securities. Invesco Distributors, Inc. is the U.S. distributor for Invesco Ltd.’s retail mutual funds, exchange-traded funds and institutional money market funds. Both are wholly owned, indirect subsidiaries of Invesco Ltd.
| EGR-AR-1 | Invesco Distributors, Inc. |
 |
| Annual Report to Shareholders | October 31, 2011 |
Invesco Global Growth Fund
Nasdaq:
A: AGGAX § B: AGGBX § C: AGGCX § Y: AGGYX § Institutional: GGAIX
A: AGGAX § B: AGGBX § C: AGGCX § Y: AGGYX § Institutional: GGAIX
| 2 | Letters to Shareholders | |
| 4 | Performance Summary | |
| 4 | Management Discussion | |
| 6 | Long-Term Fund Performance | |
| 8 | Supplemental Information | |
| 9 | Schedule of Investments | |
| 11 | Financial Statements | |
| 13 | Notes to Financial Statements | |
| 21 | Financial Highlights | |
| 22 | Auditor’s Report | |
| 23 | Fund Expenses | |
| 24 | Approval of Investment Advisory and Sub-Advisory Agreements | |
| 26 | Tax Information | |
| T-1 | Trustees and Officers |
Letters to Shareholders

Philip Taylor
Dear Shareholders:
Enclosed is important information about your Fund and its performance. I encourage you to read this report to learn more about your Fund’s short- and long-term performance and its holdings as of the close of the reporting period. This report also includes useful information about your Fund’s management team and a discussion of how your Fund was managed during the reporting period.
Investors are likely to confront both opportunities and challenges in 2012 – just as we did in 2011. After all, changes in market sentiment never do investors the courtesy of announcing their impending arrival, and your goals and needs may have changed, requiring changes in your financial strategy.
That’s why the start of a new year is always a good time to catch up with your financial adviser. He or she can explain how your investments performed in the year just ended – how each performed individually, and more important, how they performed as a diversified portfolio. Of course, it’s important to remember that an investment’s long-term performance is more important than its short-term performance. Looking ahead to the new year and evaluating your individual situation, your financial adviser can provide valuable insight into whether your investments are still appropriate for your individual needs, goals and risk tolerance.
For current information about your Fund
In addition to meeting with your financial adviser to discuss your individual situation at the start of the new year, you also may find it helpful to stay abreast of market trends and developments. Doing so may provide reassurance in times of economic uncertainty and market volatility such as we saw in 2011 – and are likely to see again in 2012.
Invesco can help you stay informed about your investments and market trends. On our website, invesco.com/us, we provide timely market updates and commentary from many of our fund managers and other investment professionals. Also on our website, you can obtain information about your account at any hour of the day or night. I invite you to visit and explore the tools and information we offer at invesco.com/us.
Our commitment to investment excellence
As we’ve seen over the last several years, market conditions can change – often suddenly and dramatically. That’s one reason financial advisers typically advise their clients to be well diversified and to maintain a long-term investment focus. While diversification can’t guarantee a profit or protect against loss, it may cushion the impact of dramatic market moves. Maintaining a long-term investment focus for your long-term goals – financing your retirement or your children’s education, for example – may help you avoid making rash investment decisions based on short-term market swings.
Likewise, Invesco’s investment professionals maintain a long-term focus. Across our broad array of investment products, investment excellence is our ultimate goal. Each of our funds is managed by specialized teams of investment professionals, and as a company, we maintain a single focus – investment management – that allows our fund managers to concentrate on doing what they do best: managing your money.
Our funds are managed strictly according to their stated investment objectives and strategies, with robust risk oversight using consistent, repeatable investment processes that don’t change in response to short-term market events. This disciplined approach can’t guarantee a profit; no investment can do that, since all involve some measure of risk. But it can ensure that your money is managed the way we said it would be – according to your Fund’s objective and strategies.
Our adherence to stated investment objectives and strategies allows your financial adviser to build a diversified portfolio that meets your individual risk tolerance and financial goals. It also means that when your goals change, your financial adviser will be able to find an Invesco fund that’s appropriate for your needs.
Questions?
If you have questions about your account, please contact one of our client service representatives at 800 959 4246. If you have a general Invesco-related question or comment for me, I invite you to email me directly at phil@invesco.com.
All of us at Invesco look forward to serving your investment management needs for many years to come. Thank you for investing with us.
Sincerely,

Philip Taylor
Senior Managing Director, Invesco Ltd.
Senior Managing Director, Invesco Ltd.
| 2 | Invesco Global Growth Fund |

Bruce Crockett
Dear Fellow Shareholders:
Although the world’s economies are gradually recovering from the financial crisis, it has not been a smooth path. Unrest in the Middle East, persistently weak job and housing markets in the U.S. and continued government balance sheet repair in Europe are contributing to a slow, labored march toward global recovery.
In this environment, investors face risks that could make it more difficult to achieve their long-term financial goals – a secure retirement, home ownership, a child’s college education. Although the markets are complex and dynamic, there are ways to simplify the process and potentially increase your odds of achieving your goals. The best approach is to create a solid financial plan that helps you save and invest in ways that anticipate your needs over the long term.
Your financial adviser can help you define your financial plan, develop an appropriate investment strategy and put you in a better position to achieve your financial goals over the long term. This can take some of the guesswork out of the process and help you make thoughtful investments. Your financial adviser also can help you better understand your tolerance for risk, so that your investment approach lets you sleep at night while getting you closer to your goals. Lastly, your financial adviser can develop an asset allocation strategy that seeks to balance your investment approach, providing some protection against a decline in the markets while allowing you to participate in rising markets. Invesco calls this type of approach “intentional investing.” It means thinking carefully, planning thoughtfully and acting deliberately.
While no investment can guarantee favorable returns, your Board remains committed to managing costs and enhancing the performance of Invesco’s funds as part of our Investor First orientation. We continue to oversee the funds with the same strong sense of responsibility for your money and your continued trust that we’ve always maintained.
Thanks to the approval of our fund shareholders, Invesco has made great progress in realigning our U.S. mutual fund product line following our acquisition of Morgan Stanley’s retail asset management business, including Van Kampen Investments. When completed, the realignment will reduce overlap in the product lineup, enhance efficiency across our product line and build a solid foundation for further growth to meet client and shareholder needs. I would like to thank those of you who voted your proxy, and I hope our shareholders haven’t been too inconvenienced by the process.
As always, please contact me at bruce@brucecrockett.com with any questions or concerns you may have. On behalf of your Board, we look forward to continuing to represent your interests and serving your needs.
Sincerely,

Bruce L. Crockett
Independent Chair
Invesco Funds Board of Trustees
Independent Chair
Invesco Funds Board of Trustees
| 3 | Invesco Global Growth Fund |
Management’s Discussion of Fund Performance
Performance summary
Global equity markets faced headwinds in 2010 and 2011. China’s growth continued to slow as the U.S. battled high unemployment and runaway deficits. Several European countries faced similar deficits, which brought to light the imperfect structure of the euro. The reporting period ended with a market upswing, however, as European leaders took steps to address the Greek sovereign debt issue, expand the bailout fund and stabilize the banking system.
For the fiscal year ended October 31, 2011, Class A shares of Invesco Global Growth Fund at net asset value (NAV) posted a modest positive return but lagged the Fund’s style-specific benchmark, the MSCI World Growth Index. The Fund’s underweight position to a strong U.S. equity market was a key detractor from performance during this period.
Your Fund’s long-term performance appears later in this report.
Fund vs. Indexes
Total returns, 10/31/10 to 10/31/11, at net asset value (NAV). Performance shown does not include applicable contingent deferred sales charges (CDSC) or front-end sales charges, which would have reduced performance.
| Class A Shares | 0.41 | % | ||
| Class B Shares | -0.33 | |||
| Class C Shares | -0.33 | |||
| Class Y Shares | 0.61 | |||
| Institutional Class Shares | 0.91 | |||
MSCI World Index▼ (Broad Market Index) | 1.76 | |||
MSCI World Growth Index▼ (Style-Specific Index) | 3.09 | |||
Lipper Global Large-Cap Growth Funds Index▼ (Peer Group Index) | 0.04 | |||
| Source(s): ▼Lipper Inc. |
How we invest
When selecting stocks for your Fund, we use a disciplined investment strategy that emphasizes fundamental research, supported by both quantitative analysis and portfolio construction techniques. Our EQV (earnings, quality, valuation) strategy focuses primarily on identifying quality companies that have experienced, or exhibit the potential for, accelerated or above-average earnings growth, but whose stock prices have not fully reflected these attributes.
While research responsibilities within the portfolio management team are focused by geographic region, we select
investments for the Fund using a bottom-up investment approach, which means we construct the Fund primarily on a stock-by-stock basis. We focus on the strengths of individual companies rather than sectors, countries or market-cap trends.
We believe disciplined sell decisions are key to successful investing. We consider selling a stock for one of the following reasons:
| n | A company’s fundamentals deteriorate, or it posts disappointing earnings. | |
| n | A stock’s price seems overvalued. | |
| n | A more attractive opportunity becomes available. |
Market conditions and your Fund
Market volatility was intense during the reporting period. During mid-2011, Greek sovereign debt concerns and signs of slowing global growth continued to worry investors. In addition, numerous world events caught investors’ attention, including the growing unrest in the Middle East and northern Africa, and the devastating earthquake and tsunami in Japan on March 11.
Although markets stabilized and were generally positive through the summer, major equity indexes sold off precipitously in August as the U.S. struggled with its debt ceiling and ultimately received the first-ever downgrade to its credit rating from Standard & Poor’s. Uncertainty created by the U.S. credit downgrade combined with a lack of consumer confidence and an intensifying debt crisis in the eurozone continued to weigh on investors through the end of the reporting period, reigniting fears of a global recession and a double-dip recession in the U.S.
In this environment, we continued to construct the Fund’s portfolio with a long-term view and a bottom-up approach (i.e., selecting stocks on an individual basis). From a sector perspective, favorable stock selection in the energy sector was the largest positive contributor to results relative to the Fund’s style-specific benchmark, the MSCI World Growth Index. Underweight exposure to one of the reporting period’s weakest sectors, materials, and overweight exposure to the positive-performing consumer discretionary sector also benefited the Fund on a relative basis.
In the energy sector, double-digit gains were supported by Fund holdings in the oil, gas & consumable fuels and energy equipment & services industries. A top
Portfolio Composition
By sector
By sector
| Consumer Discretionary | 21.2 | % | ||
| Information Technology | 18.8 | |||
| Health Care | 13.6 | |||
| Consumer Staples | 12.7 | |||
| Energy | 8.9 | |||
| Financials | 7.7 | |||
| Industrials | 7.2 | |||
| Materials | 3.5 | |||
| Telecommunication Services | 2.4 | |||
| Utilities | 0.7 | |||
Money Market Funds | ||||
Plus Other Assets Less Liabilities | 3.3 | |||
Top 10 Equity Holdings*
| 1. | Apple Inc. | 2.6 | % | |||||
| 2. | UnitedHealth Group Inc. | 2.1 | ||||||
| 3. | Imperial Tobacco Group PLC | 2.0 | ||||||
| 4. | Teva Pharmaceutical Industries Ltd. | 1.8 | ||||||
| 5. | Canon, Inc. | 1.7 | ||||||
| 6. | BHP Billiton Ltd. | 1.7 | ||||||
| 7. | Anheuser-Busch InBev N.V. | 1.6 | ||||||
| 8. | Banco Bradesco S.A. | 1.6 | ||||||
| 9. | Unilever N.V. | 1.5 | ||||||
| 10. | Occidental Petroleum Corp. | 1.5 | ||||||
Top Five Countries*
| 1. | United States | 25.3 | % | |||||
| 2. | United Kingdom | 14.3 | ||||||
| 3. | Japan | 7.4 | ||||||
| 4. | Switzerland | 6.6 | ||||||
| 5. | Germany | 6.3 | ||||||
| Total Net Assets | $208.8 million | |||
| Total Number of Holdings* | 95 | |||
The Fund’s holdings are subject to change, and there is no assurance that the Fund will continue to hold any particular security.
| *Excluding money market fund holdings. |
| 4 | Invesco Global Growth Fund |
performer in this sector was Australian-based energy services company Worley Parsons. In the consumer discretionary sector, select holdings in the automobiles and auto components industries were particularly strong. Top stock-level contributors in this sector included South Korean after-market auto parts manufacturer Hyundai Mobis and German auto manufacturer BMW.
In contrast, the Fund underperformed the MSCI World Growth Index by the widest margins in the industrials, information technology (IT) and telecommunication services sectors. Underperformance overall was driven predominately by stock selection. In the industrials sector, we saw particular weakness across Fund holdings in the airlines, electrical equipment and aerospace & defense industries. The largest single detractor from the Fund’s performance was U.S.-based Delta Air Lines. We sold our position in Delta during the reporting period and deployed capital into select new opportunities.
In the IT sector, select holdings in the IT services industry were particularly weak. The Fund’s 0% exposure to IBM, which had double-digit gains for the reporting period, was a key driver of relative underperformance given its representation in the MSCI World Growth Index.
In geographic terms, a meaningful underweight position in one of the period’s strongest markets, the U.S., was the largest detractor from relative results. However, solid stock selection enabled the Fund to deliver double-digit gains in this market and outperform the MSCI World Growth Index despite the underweight handicap. U.S.-based Apple was the Fund’s largest stock-level contributor over the reporting period. Apple continued to benefit from strong growth in revenue and earnings, driven by the success of its iPad product in the expanding tablet market, as well as new distributors and solid demand for the iPhone.
The Fund’s exposure to emerging markets detracted from both absolute and relative results. During the reporting period, emerging markets underperformed developed markets due to multiple macroeconomic headwinds, including the European debt crisis, a deteriorating global economy, rising inflation and tightening monetary policies.
As long-term, bottom-up stock selectors, we see volatility as an opportunity to buy quality growth companies at more attractive valuations than usual; consequently, we took advantage of market volatility to buy several stocks that had long been on our EQV radar.
Stock selection in the portfolio continued to be driven by the underlying fundamentals of a company – not any top-down macroeconomic views. That said, because of our belief in the long-term strength of consumer growth outside the U.S., we maintained overweight exposure to the consumer discretionary sector at the end of the reporting period. We reduced our exposure to the health care sector slightly but remained overweight compared with the MSCI World Growth Index. We also ended the reporting period with overweight exposure to the telecommunication services sector, while our largest underweight positions were in the materials, industrials and consumer staples sectors.
On March 22, 2011, Ryan Amerman joined the Fund’s management team to oversee its U.S. allocation, and Rob Lloyd left the team. On August 31, 2011, Barrett Sides retired from the investment management business and was replaced on the management team by Mark Jason. A complete list of your Fund’s managers appears at right.
At the close of the reporting period, we remained focused on investing according to our bottom-up stock selection process and maintaining our long-term investment view. We thank you for your continued investment in Invesco Global Growth Fund.
The views and opinions expressed in management’s discussion of Fund performance are those of Invesco Advisers, Inc. These views and opinions are subject to change at any time based on factors such as market and economic conditions. These views and opinions may not be relied upon as investment advice or recommendations, or as an offer for a particular security. The information is not a complete analysis of every aspect of any market, country, industry, security or the Fund. Statements of fact are from sources considered reliable, but Invesco Advisers, Inc. makes no representation or warranty as to their completeness or accuracy. Although historical performance is no guarantee of future results, these insights may help you understand our investment management philosophy.
See important Fund and, if applicable, index disclosures later in this report.

Matthew Dennis
Chartered Financial Analyst, portfolio manager, is lead manager of Invesco Global Growth Fund. He joined Invesco in 2000. Mr. Dennis earned a B.A. in economics from The University of Texas at Austin and an M.S. in finance from Texas A&M University.
Chartered Financial Analyst, portfolio manager, is lead manager of Invesco Global Growth Fund. He joined Invesco in 2000. Mr. Dennis earned a B.A. in economics from The University of Texas at Austin and an M.S. in finance from Texas A&M University.

Ryan Amerman
Chartered Financial Analyst, portfolio manager, is manager of Invesco Global Growth Fund. He joined Invesco in 1996. Mr. Amerman earned a B.B.A. from Stephen F. Austin State University and an M.B.A. from the University of St. Thomas.
Chartered Financial Analyst, portfolio manager, is manager of Invesco Global Growth Fund. He joined Invesco in 1996. Mr. Amerman earned a B.B.A. from Stephen F. Austin State University and an M.B.A. from the University of St. Thomas.

Mark Jason
Chartered Financial Analyst, portfolio manager, is manager of Invesco Global Growth Fund. He joined Invesco in 2001. Mr. Jason earned a B.S. in finance and a B.S. in real estate from California State University at Northridge.
Chartered Financial Analyst, portfolio manager, is manager of Invesco Global Growth Fund. He joined Invesco in 2001. Mr. Jason earned a B.S. in finance and a B.S. in real estate from California State University at Northridge.
| 5 | Invesco Global Growth Fund |
Your Fund’s Long-Term Performance
Results of a $10,000 Investment – Oldest Share Classes since Inception
Index data from 8/31/94, Fund data from 9/15/94
Past performance cannot guarantee comparable future results.
The data shown in the chart include reinvested distributions, applicable sales charges and Fund expenses including management fees. Results for Class B shares are calculated as if a hypothetical shareholder had liquidated his entire investment in the Fund at the close of the reporting period and paid the contingent deferred sales charges, if applicable. Index results include reinvested dividends, but they do not reflect sales
charges. Performance of the peer group, if applicable, reflects fund expenses and management fees; performance of a market index does not. Performance shown in the chart and table(s) does not reflect deduction of taxes a shareholder would pay on Fund distributions or sale of Fund shares.
This chart, which is a logarithmic chart, presents the fluctuations in the value of the Fund and its indexes. We believe that a logarithmic chart is more effective than other types of charts in illustrating
changes in value during the early years shown in the chart. The vertical axis, the one that indicates the dollar value of an investment, is constructed with each segment representing a percent change in the value of the investment. In this chart, each segment represents a doubling, or 100% change, in the value of the investment. In other words, the space between $5,000 and $10,000 is the same size as the space between $10,000 and $20,000, and so on.
6 Invesco Global Growth Fund
Average Annual Total Returns
As of 10/31/11, including maximum applicable sales charges
| Class A Shares | ||||||||
| Inception (9/15/94) | 5.46 | % | ||||||
| 10 Years | 4.17 | |||||||
| 5 Years | -1.01 | |||||||
| 1 Year | -5.12 | |||||||
| Class B Shares | ||||||||
| Inception (9/15/94) | 5.54 | % | ||||||
| 10 Years | 4.23 | |||||||
| 5 Years | -1.03 | |||||||
| 1 Year | -5.32 | |||||||
| Class C Shares | ||||||||
| Inception (8/4/97) | 2.07 | % | ||||||
| 10 Years | 4.07 | |||||||
| 5 Years | -0.64 | |||||||
| 1 Year | -1.33 | |||||||
| Class Y Shares | ||||||||
| 10 Years | 4.85 | % | ||||||
| 5 Years | 0.27 | |||||||
| 1 Year | 0.61 | |||||||
| Institutional Class Shares | ||||||||
| 10 Years | 5.03 | % | ||||||
| 5 Years | 0.62 | |||||||
| 1 Year | 0.91 | |||||||
Class Y shares incepted on October 3, 2008. Performance shown prior to that date is that of Class A shares and includes the 12b-1 fees applicable to Class A shares. Class A share performance reflects any applicable fee waivers or expense reimbursements.
Institutional Class shares incepted on September 28, 2007. Performance shown prior to that date is that of Class A shares and includes the 12b-1 fees applicable to Class A shares. Class A share performance reflects any applicable fee waivers or expense reimbursements.
The performance data quoted represent past performance and cannot guarantee comparable future results; current performance may be lower or higher. Please visit invesco.com/performance for the most recent month-end performance. Performance figures reflect reinvested distributions, changes in net asset value and the effect of the maximum sales charge unless otherwise stated. Investment return and principal value will fluctuate so that you may have a gain or loss when you sell shares.
Average Annual Total Returns
As of 9/30/11, the most recent calendar quarter-end, including maximum applicable sales charges
| Class A Shares | ||||||||
| Inception (9/15/94) | 4.86 | % | ||||||
| 10 Years | 3.48 | |||||||
| 5 Years | -2.49 | |||||||
| 1 Year | -10.14 | |||||||
| Class B Shares | ||||||||
| Inception (9/15/94) | 4.94 | % | ||||||
| 10 Years | 3.53 | |||||||
| 5 Years | -2.50 | |||||||
| 1 Year | -10.34 | |||||||
| Class C Shares | ||||||||
| Inception (8/4/97) | 1.35 | % | ||||||
| 10 Years | 3.37 | |||||||
| 5 Years | -2.12 | |||||||
| 1 Year | -6.56 | |||||||
| Class Y Shares | ||||||||
| 10 Years | 4.15 | % | ||||||
| 5 Years | -1.22 | |||||||
| 1 Year | -4.65 | |||||||
| Institutional Class Shares | ||||||||
| 10 Years | 4.33 | % | ||||||
| 5 Years | -0.88 | |||||||
| 1 Year | -4.41 | |||||||
The total annual Fund operating expense ratio set forth in the most recent Fund prospectus as of the date of this report for Class A, Class B, Class C, Class Y and Institutional Class shares was 1.63%, 2.38%, 2.38%, 1.38% and 1.08%, respectively. The expense ratios presented above may vary from the expense ratios presented in other sections of this report that are based on expenses incurred during the period covered by this report.
Class A share performance reflects the maximum 5.50% sales charge, and Class B and Class C share performance reflects the applicable contingent deferred sales charge (CDSC) for the period involved. The CDSC on Class B shares declines from 5% beginning at the time of purchase to 0% at the beginning of the seventh year. The CDSC on Class C shares is 1% for the first year after purchase. Class Y and Institutional Class shares do not have a front-end sales charge or a CDSC; therefore, performance is at net asset value.
The performance of the Fund’s share classes will differ primarily due to different sales charge structures and class expenses.
A redemption fee of 2% is imposed on certain redemptions or exchanges out of the Fund within 31 days of purchase. Exceptions to the redemption fee are listed in the Fund’s prospectus. Effective January 1, 2012, after the close of the reporting period, the Fund will eliminate the redemption fee, if applicable, assessed on shares of the Fund redeemed or exchanged within 31 days of purchase.
| 7 | Invesco Global Growth Fund |
Invesco Global Growth Fund’s investment objective is long-term growth of capital.
| n | Unless otherwise stated, information presented in this report is as of October 31, 2011, and is based on total net assets. | |
| n | Unless otherwise noted, all data provided by Invesco. | |
| n | To access your Fund’s reports/prospectus, visit invesco.com/fundreports. |
About share classes
| n | Class B shares may not be purchased or acquired by exchange from share classes other than Class B shares. Please see the prospectus for more information. | |
| n | Class Y shares are available to only certain investors. Please see the prospectus for more information. | |
| n | Institutional Class shares are offered exclusively to institutional investors, including defined contribution plans that meet certain criteria. Please see the prospectus for more information. |
Principal risks of investing in the Fund
| n | Developing markets securities risk. Securities issued by foreign companies and governments located in developing countries may be affected more negatively by inflation, devaluation of their currencies, higher transaction costs, delays in settlement, adverse political developments, the introduction of capital controls, withholding taxes, nationalization of private assets, expropriation, social unrest, war or lack of timely information than those in developed countries. | |
| n | Foreign securities risk. The Fund’s foreign investments may be affected by changes in a foreign country’s exchange rates; political and social instability; changes in economic or taxation policies; difficulties when enforcing obligations; decreased liquidity; and increased volatility. Foreign companies may be subject to less regulation resulting in less publicly available information about the companies. | |
| n | Growth investing risk. Growth stocks tend to be more expensive relative to their earnings or assets compared with other types of stock. As a result they tend to be more sensitive to changes in their earnings and can be more volatile. |
| n | Management risk. The investment techniques and risk analysis used by the Fund’s portfolio managers may not produce the desired results. | |
| n | Market risk. The prices of and the income generated by the Fund’s securities may decline in response to, among other things, investor sentiment; general economic and market conditions; regional or global instability; and currency and interest rate fluctuations. | |
| n | Small- and mid-capitalization risk. Stocks of small and mid-sized companies tend to be more vulnerable to adverse developments in the above factors and may have little or no operating history or track record of success, and limited product lines, markets, management and financial resources. The securities of small and mid-sized companies may be more volatile due to less market interest and less publicly available information about the issuer. They also may be illiquid or restricted as to resale, or may trade less frequently and in smaller volumes, all of which may cause difficulty when establishing or closing a position at a desirable price. |
About indexes used in this report
| n | The MSCI World IndexSM is an unmanaged index considered representative of stocks of developed countries. | |
| n | The MSCI World Growth Index is an unmanaged index considered representative of growth stocks of developed countries. | |
| n | The Lipper Global Large-Cap Growth Funds Index is an unmanaged index considered representative of global large-cap growth funds tracked by Lipper. | |
| n | The Fund is not managed to track the performance of any particular index, including the index(es) defined here, and consequently, the performance of the Fund may deviate significantly from the performance of the index(es). |
| n | A direct investment cannot be made in an index. Unless otherwise indicated, index results include reinvested dividends, and they do not reflect sales charges. Performance of the peer group, if applicable, reflects fund expenses; performance of a market index does not. |
Other information
| n | The Chartered Financial Analyst® (CFA®) designation is globally recognized and attests to a charterholder’s success in a rigorous and comprehensive study program in the field of investment management and research analysis. | |
| n | The returns shown in management’s discussion of Fund performance are based on net asset values calculated for shareholder transactions. Generally accepted accounting principles require adjustments to be made to the net assets of the Fund at period end for financial reporting purposes, and as such, the net asset values for shareholder transactions and the returns based on those net asset values may differ from the net asset values and returns reported in the Financial Highlights. | |
| n | Industry classifications used in this report are generally according to the Global Industry Classification Standard, which was developed by and is the exclusive property and a service mark of MSCI Inc. and Standard & Poor’s. |
This report must be accompanied or preceded by a currently effective Fund prospectus, which contains more complete information, including sales charges and expenses. Investors should read it carefully before investing.
NOT FDIC INSURED | MAY LOSE VALUE | NO BANK GUARANTEE
Fund Nasdaq Symbols
| Class A Shares | AGGAX | |||
| Class B Shares | AGGBX | |||
| Class C Shares | AGGCX | |||
| Class Y Shares | AGGYX | |||
| Institutional Class Shares | GGAIX | |||
| 8 | Invesco Global Growth Fund |
Schedule of Investments
October 31, 2011
| Shares | Value | |||||||
| Common Stocks & Other Equity Interests–95.66% | ||||||||
| Australia–4.60% | ||||||||
| BHP Billiton Ltd. | 88,169 | $ | 3,449,438 | |||||
| Brambles Ltd. | 276,484 | 1,906,795 | ||||||
| QBE Insurance Group Ltd. | 101,039 | 1,549,746 | ||||||
| WorleyParsons Ltd. | 93,303 | 2,698,107 | ||||||
| 9,604,086 | ||||||||
| Belgium–1.63% | ||||||||
| Anheuser-Busch InBev N.V. | 61,168 | 3,396,018 | ||||||
| Brazil–2.05% | ||||||||
| Banco Bradesco S.A.–ADR | 178,707 | 3,252,467 | ||||||
| Cielo S.A. | 38,800 | 1,036,431 | ||||||
| 4,288,898 | ||||||||
| Canada–1.03% | ||||||||
| Suncor Energy, Inc. | 67,327 | 2,142,560 | ||||||
| China–1.21% | ||||||||
| Industrial & Commercial Bank of China Ltd.–Class H | 4,129,000 | 2,535,075 | ||||||
| Denmark–1.16% | ||||||||
| Novo Nordisk A/S–Class B | 22,996 | 2,428,266 | ||||||
| France–4.83% | ||||||||
| BNP Paribas S.A. | 34,370 | 1,523,933 | ||||||
| Cap Gemini S.A. | 51,479 | 1,968,591 | ||||||
| Cie Generale des Etablissements Michelin–Class B | 18,273 | 1,319,929 | ||||||
| Danone S.A. | 40,212 | 2,779,678 | ||||||
| L’Oreal S.A | 12,420 | 1,367,836 | ||||||
| Schneider Electric S.A. | 19,260 | 1,115,608 | ||||||
| 10,075,575 | ||||||||
| Germany–5.26% | ||||||||
| Adidas AG | 44,598 | 3,137,422 | ||||||
| Bayer AG | 16,542 | 1,035,721 | ||||||
| Bayerische Motoren Werke AG | 23,021 | 1,876,120 | ||||||
| Fresenius Medical Care AG & Co. KGaA | 27,012 | 1,965,214 | ||||||
| SAP AG | 49,321 | 2,972,067 | ||||||
| 10,986,544 | ||||||||
| Hong Kong–1.21% | ||||||||
| China Mobile Ltd. | 117,500 | 1,119,735 | ||||||
| Hutchison Whampoa Ltd. | 153,000 | 1,397,901 | ||||||
| 2,517,636 | ||||||||
| India–0.97% | ||||||||
| Infosys Technologies Ltd.–ADR | 34,672 | 2,031,432 | ||||||
| Ireland–4.07% | ||||||||
| Accenture PLC–Class A | 50,490 | 3,042,527 | ||||||
| Cooper Industries PLC | 29,051 | 1,524,016 | ||||||
| Ingersoll-Rand PLC | 36,670 | 1,141,537 | ||||||
| WPP PLC | 269,260 | 2,790,615 | ||||||
| 8,498,695 | ||||||||
| Israel–1.82% | ||||||||
| Teva Pharmaceutical Industries Ltd.–ADR | 93,160 | 3,805,586 | ||||||
| Japan–7.40% | ||||||||
| Canon, Inc. | 77,500 | 3,539,128 | ||||||
| Fanuc Corp. | 9,900 | 1,598,596 | ||||||
| Keyence Corp. | 8,700 | 2,212,841 | ||||||
| Komatsu Ltd. | 51,600 | 1,270,491 | ||||||
| Nidec Corp. | 23,500 | 1,934,036 | ||||||
| Toyota Motor Corp. | 53,900 | 1,802,183 | ||||||
| Yamada Denki Co., Ltd. | 42,880 | 3,090,404 | ||||||
| 15,447,679 | ||||||||
| Mexico–1.82% | ||||||||
| America Movil S.A.B. de C.V.–Series L–ADR | 70,478 | 1,791,551 | ||||||
| Grupo Televisa S.A.B. de C.V.–ADR | 94,623 | 2,018,308 | ||||||
| 3,809,859 | ||||||||
| Netherlands–2.23% | ||||||||
| Koninklijke Ahold N.V. | 111,408 | 1,424,638 | ||||||
| Unilever N.V. | 93,929 | 3,229,963 | ||||||
| 4,654,601 | ||||||||
| Russia–0.98% | ||||||||
| Gazprom–ADR | 176,868 | 2,049,395 | ||||||
| Singapore–0.67% | ||||||||
| United Overseas Bank Ltd. | 104,000 | 1,409,138 | ||||||
| South Korea–2.18% | ||||||||
| Hyundai Mobis | 8,932 | 2,572,534 | ||||||
NHN Corp.(a) | 9,495 | 1,978,713 | ||||||
| 4,551,247 | ||||||||
| Spain–0.90% | ||||||||
| Amadeus IT Holding S.A.–Class A | 100,215 | 1,880,984 | ||||||
| Sweden–2.51% | ||||||||
| Swedbank AB–Class A | 119,209 | 1,664,039 | ||||||
| Telefonaktiebolaget LM Ericsson–Class B | 229,446 | 2,388,479 | ||||||
| Volvo AB–Class B | 95,202 | 1,180,335 | ||||||
| 5,232,853 | ||||||||
See accompanying Notes to Financial Statements which are an integral part of the financial statements.
9 Invesco Global Growth Fund
| Shares | Value | |||||||
| Switzerland–6.58% | ||||||||
| ABB Ltd. | 99,288 | $ | 1,872,066 | |||||
| Julius Baer Group Ltd. | 50,180 | 1,887,724 | ||||||
| Nestle S.A. | 33,340 | 1,929,597 | ||||||
| Novartis AG | 56,445 | 3,190,425 | ||||||
| Roche Holding AG | 15,346 | 2,523,228 | ||||||
| Syngenta AG | 7,638 | 2,336,565 | ||||||
| 13,739,605 | ||||||||
| Taiwan–1.02% | ||||||||
| Taiwan Semiconductor Manufacturing Co. Ltd. | 869,428 | 2,120,383 | ||||||
| United Kingdom–14.27% | ||||||||
| BG Group PLC | 114,466 | 2,480,576 | ||||||
| British American Tobacco PLC | 39,764 | 1,819,691 | ||||||
| Centrica PLC | 307,164 | 1,454,787 | ||||||
| Compass Group PLC | 325,066 | 2,950,425 | ||||||
| GlaxoSmithKline PLC | 28,850 | 649,431 | ||||||
| Imperial Tobacco Group PLC | 114,946 | 4,189,001 | ||||||
| Kingfisher PLC | 485,959 | 2,009,725 | ||||||
| Next PLC | 64,798 | 2,646,648 | ||||||
| Reed Elsevier PLC | 313,246 | 2,681,408 | ||||||
| Royal Dutch Shell PLC–Class B | 78,046 | 2,805,333 | ||||||
| Smith & Nephew PLC | 174,615 | 1,593,101 | ||||||
| Tesco PLC | 380,062 | 2,449,467 | ||||||
| Vodafone Group PLC | 743,084 | 2,060,782 | ||||||
| 29,790,375 | ||||||||
| United States–25.26% | ||||||||
Amazon.com, Inc.(a) | 10,938 | 2,335,372 | ||||||
Apple Inc.(a) | 13,174 | 5,332,572 | ||||||
| Broadcom Corp.–Class A | 39,965 | 1,442,337 | ||||||
Cameron International Corp.(a) | 44,913 | 2,207,025 | ||||||
| Cardinal Health, Inc. | 60,359 | 2,672,093 | ||||||
| Chubb Corp. (The) | 18,437 | 1,236,201 | ||||||
| Comcast Corp.–Class A | 101,541 | 2,381,136 | ||||||
| Corning Inc. | 49,905 | 713,142 | ||||||
| Costco Wholesale Corp. | 24,851 | 2,068,846 | ||||||
Deckers Outdoor Corp.(a) | 20,732 | 2,389,156 | ||||||
DIRECTV–Class A(a) | 57,351 | 2,607,176 | ||||||
Express Scripts, Inc.(a) | 26,411 | 1,207,775 | ||||||
| Exxon Mobil Corp. | 12,997 | 1,014,936 | ||||||
Gilead Sciences, Inc.(a) | 65,735 | 2,738,520 | ||||||
Google Inc.–Class A(a) | 5,057 | 2,996,981 | ||||||
| Home Depot, Inc. (The) | 29,377 | 1,051,697 | ||||||
| Johnson Controls, Inc. | 32,942 | 1,084,780 | ||||||
| JPMorgan Chase & Co. | 29,838 | 1,037,169 | ||||||
| Macy’s, Inc. | 46,892 | 1,431,613 | ||||||
Medco Health Solutions, Inc.(a) | 4,299 | 235,843 | ||||||
| Microsoft Corp. | 103,895 | 2,766,724 | ||||||
| Mosaic Co. (The) | 24,872 | 1,456,504 | ||||||
| Occidental Petroleum Corp. | 34,687 | 3,223,810 | ||||||
| PepsiCo, Inc. | 30,364 | 1,911,414 | ||||||
| UnitedHealth Group Inc. | 89,278 | 4,284,451 | ||||||
| Visa Inc.–Class A | 9,944 | 927,377 | ||||||
| 52,754,650 | ||||||||
| Total Common Stocks & Other Equity Interests (Cost $176,221,938) | 199,751,140 | |||||||
| Preferred Stocks–0.99% | ||||||||
| Germany–0.99% | ||||||||
| Volkswagen AG–Pfd. (Cost $2,118,859) | 11,816 | 2,067,068 | ||||||
| Money Market Funds–2.66% | ||||||||
Liquid Assets Portfolio–Institutional Class(b) | 2,772,804 | 2,772,804 | ||||||
Premier Portfolio–Institutional Class(b) | 2,772,804 | 2,772,804 | ||||||
| Total Money Market Funds (Cost $5,545,608) | 5,545,608 | |||||||
| TOTAL INVESTMENTS–99.31% (Cost $183,886,405) | 207,363,816 | |||||||
| OTHER ASSETS LESS LIABILITIES–0.69% | 1,440,483 | |||||||
| NET ASSETS–100.00% | $ | 208,804,299 | ||||||
Investment Abbreviations:
| ADR | – American Depositary Receipt | |
| Pfd. | – Preferred |
Notes to Schedule of Investments:
| (a) | Non-income producing security. | |
| (b) | The money market fund and the Fund are affiliated by having the same investment adviser. |
See accompanying Notes to Financial Statements which are an integral part of the financial statements.
10 Invesco Global Growth Fund
Statement of Assets and Liabilities
October 31, 2011
| Assets: | ||||
| Investments, at value (Cost $178,340,797) | $ | 201,818,208 | ||
| Investments in affiliated money market funds, at value and cost | 5,545,608 | |||
| Total investments, at value (Cost $183,886,405) | 207,363,816 | |||
| Foreign currencies, at value (Cost $484,991) | 605,338 | |||
| Receivable for: | ||||
| Investments sold | 1,699,225 | |||
| Fund shares sold | 57,648 | |||
| Dividends | 334,246 | |||
| Investment for trustee deferred compensation and retirement plans | 53,147 | |||
| Other assets | 18,823 | |||
| Total assets | 210,132,243 | |||
| Liabilities: | ||||
| Payable for: | ||||
| Investments purchased | 656,476 | |||
| Fund shares reacquired | 276,518 | |||
| Accrued fees to affiliates | 178,740 | |||
| Accrued other operating expenses | 108,389 | |||
| Trustee deferred compensation and retirement plans | 107,821 | |||
| Total liabilities | 1,327,944 | |||
| Net assets applicable to shares outstanding | $ | 208,804,299 | ||
| Net assets consist of: | ||||
| Shares of beneficial interest | $ | 200,671,101 | ||
| Undistributed net investment income | 1,025,140 | |||
| Undistributed net realized gain (loss) | (16,474,317 | ) | ||
| Unrealized appreciation | 23,582,375 | |||
| $ | 208,804,299 | |||
| Net Assets: | ||||
| Class A | $ | 185,484,369 | ||
| Class B | $ | 10,776,132 | ||
| Class C | $ | 10,838,149 | ||
| Class Y | $ | 1,399,827 | ||
| Institutional Class | $ | 305,822 | ||
| Shares outstanding, $0.001 par value per share, with an unlimited number of shares authorized: | ||||
| Class A | 8,333,308 | |||
| Class B | 517,433 | |||
| Class C | 520,405 | |||
| Class Y | 62,680 | |||
| Institutional Class | 13,696 | |||
| Class A: | ||||
| Net asset value per share | $ | 22.26 | ||
Maximum offering price per share (Net asset value of $22.26 ¸ 94.50%) | $ | 23.56 | ||
| Class B: | ||||
| Net asset value and offering price per share | $ | 20.83 | ||
| Class C: | ||||
| Net asset value and offering price per share | $ | 20.83 | ||
| Class Y: | ||||
| Net asset value and offering price per share | $ | 22.33 | ||
| Institutional Class: | ||||
| Net asset value and offering price per share | $ | 22.33 | ||
See accompanying Notes to Financial Statements which are an integral part of the financial statements.
11 Invesco Global Growth Fund
Statement of Operations
For the year ended October 31, 2011
| Investment income: | ||||
| Dividends (net of foreign withholding taxes of $371,582) | $ | 4,873,699 | ||
| Dividends from affiliated money market funds | 7,242 | |||
| Total investment income | 4,880,941 | |||
| Expenses: | ||||
| Advisory fees | 1,840,534 | |||
| Administrative services fees | 92,915 | |||
| Custodian fees | 111,441 | |||
| Distribution fees: | ||||
| Class A | 507,045 | |||
| Class B | 136,181 | |||
| Class C | 122,205 | |||
| Transfer agent fees | 867,001 | |||
| Trustees’ and officers’ fees and benefits | 23,081 | |||
| Other | 234,619 | |||
| Total expenses | 3,935,022 | |||
| Less: Fees waived, expenses reimbursed and expense offset arrangement(s) | (14,469 | ) | ||
| Net expenses | 3,920,553 | |||
| Net investment income | 960,388 | |||
| Realized and unrealized gain (loss) from: | ||||
| Net realized gain from: | ||||
| Investment securities (includes net gains from securities sold to affiliates of $110,633) | 14,214,397 | |||
| Foreign currencies (net of foreign taxes of $19,777) | 79,704 | |||
| 14,294,101 | ||||
| Change in net unrealized appreciation (depreciation) of: | ||||
| Investment securities | (13,446,995 | ) | ||
| Foreign currencies | 87,749 | |||
| (13,359,246 | ) | |||
| Net realized and unrealized gain | 934,855 | |||
| Net increase in net assets resulting from operations | $ | 1,895,243 | ||
See accompanying Notes to Financial Statements which are an integral part of the financial statements.
12 Invesco Global Growth Fund
Statement of Changes in Net Assets
For the years ended October 31, 2011 and 2010
| 2011 | 2010 | |||||||
| Operations: | ||||||||
| Net investment income | $ | 960,388 | $ | 828,552 | ||||
| Net realized gain | 14,294,101 | 22,065,299 | ||||||
| Change in net unrealized appreciation (depreciation) | (13,359,246 | ) | 10,226,276 | |||||
| Net increase in net assets resulting from operations | 1,895,243 | 33,120,127 | ||||||
| Distributions to shareholders from net investment income: | ||||||||
| Class A | (1,239,504 | ) | (1,916,459 | ) | ||||
| Class B | — | (44,533 | ) | |||||
| Class C | — | (31,053 | ) | |||||
| Class Y | (11,973 | ) | (15,589 | ) | ||||
| Institutional Class | (99 | ) | (14,783 | ) | ||||
| Total distributions from net investment income | (1,251,576 | ) | (2,022,417 | ) | ||||
| Share transactions–net: | ||||||||
| Class A | (23,374,415 | ) | (23,159,258 | ) | ||||
| Class B | (5,105,489 | ) | (5,859,939 | ) | ||||
| Class C | (2,089,321 | ) | (2,005,362 | ) | ||||
| Class Y | 279,528 | (413,474 | ) | |||||
| Institutional Class | 277,310 | (1,016,753 | ) | |||||
| Net increase (decrease) in net assets resulting from share transactions | (30,012,387 | ) | (32,454,786 | ) | ||||
| Net increase (decrease) in net assets | (29,368,720 | ) | (1,357,076 | ) | ||||
| Net assets: | ||||||||
| Beginning of year | 238,173,019 | 239,530,095 | ||||||
| End of year (includes undistributed net investment income of $1,025,140 and $1,136,691, respectively) | $ | 208,804,299 | $ | 238,173,019 | ||||
Notes to Financial Statements
October 31, 2011
NOTE 1—Significant Accounting Policies
Invesco Global Growth Fund (the “Fund”) is a series portfolio of AIM International Mutual Funds (Invesco International Mutual Funds) (the “Trust”). The Trust is a Delaware statutory trust registered under the Investment Company Act of 1940, as amended (the “1940 Act”), as an open-end series management investment company consisting of six separate portfolios, each authorized to issue an unlimited number of shares of beneficial interest. The assets, liabilities and operations of each portfolio are accounted for separately. Information presented in these financial statements pertains only to the Fund. Matters affecting each portfolio or class will be voted on exclusively by the shareholders of such portfolio or class.
The Fund’s investment objective is long-term growth of capital.
The Fund currently consists of five different classes of shares: Class A, Class B, Class C, Class Y and Institutional Class. Class A shares are sold with a front-end sales charge unless certain waiver criteria are met and under certain circumstances load waived shares may be subject to contingent deferred sales charges (“CDSC”). Class C shares are sold with a CDSC. Class Y and Institutional Class shares are sold at net asset value. Effective November 30, 2010, new or additional investments in Class B shares are no longer permitted. Existing shareholders of Class B shares may continue to reinvest dividends and capital gains distributions in Class B shares until they convert. Also, shareholders in Class B shares will be able to exchange those shares for Class B shares of other Invesco Funds offering such shares until they convert. Generally, Class B shares will automatically convert to Class A shares on or about the month-end which is at least eight years after the date of purchase. Redemption of Class B shares prior to conversion date will be subject to a CDSC.
The following is a summary of the significant accounting policies followed by the Fund in the preparation of its financial statements.
| A. | Security Valuations — Securities, including restricted securities, are valued according to the following policy. | |
| A security listed or traded on an exchange (except convertible bonds) is valued at its last sales price or official closing price as of the close of the customary trading session on the exchange where the security is principally traded, or lacking any sales or official closing price on a particular day, the security may be valued at the closing bid price on that day. Securities traded in the over-the-counter market are valued based on prices furnished by |
13 Invesco Global Growth Fund
| independent pricing services or market makers. When such securities are valued by an independent pricing service they may be considered fair valued. Futures contracts are valued at the final settlement price set by an exchange on which they are principally traded. Listed options are valued at the mean between the last bid and ask prices from the exchange on which they are principally traded. Options not listed on an exchange are valued by an independent source at the mean between the last bid and ask prices. For purposes of determining net asset value per share, futures and option contracts generally are valued 15 minutes after the close of the customary trading session of the New York Stock Exchange (“NYSE”). | ||
| Investments in open-end and closed-end registered investment companies that do not trade on an exchange are valued at the end of day net asset value per share. Investments in open-end and closed-end registered investment companies that trade on an exchange are valued at the last sales price or official closing price as of the close of the customary trading session on the exchange where the security is principally traded. | ||
| Debt obligations (including convertible bonds) and unlisted equities are fair valued using an evaluated quote provided by an independent pricing service. Evaluated quotes provided by the pricing service may be determined without exclusive reliance on quoted prices, and may reflect appropriate factors such as institution-size trading in similar groups of securities, developments related to specific securities, dividend rate, yield, quality, type of issue, coupon rate, maturity, individual trading characteristics and other market data. Debt securities are subject to interest rate and credit risks. In addition, all debt securities involve some risk of default with respect to interest and/or principal payments. | ||
| Foreign securities (including foreign exchange contracts) are converted into U.S. dollar amounts using the applicable exchange rates as of the close of the NYSE. If market quotations are available and reliable for foreign exchange traded equity securities, the securities will be valued at the market quotations. Because trading hours for certain foreign securities end before the close of the NYSE, closing market quotations may become unreliable. If between the time trading ends on a particular security and the close of the customary trading session on the NYSE, events occur that are significant and make the closing price unreliable, the Fund may fair value the security. If the event is likely to have affected the closing price of the security, the security will be valued at fair value in good faith using procedures approved by the Board of Trustees. Adjustments to closing prices to reflect fair value may also be based on a screening process of an independent pricing service to indicate the degree of certainty, based on historical data, that the closing price in the principal market where a foreign security trade is not the current value as of the close of the NYSE. Foreign securities meeting the approved degree of certainty that the price is not reflective of current value will be priced at the indication of fair value from the independent pricing service. Multiple factors may be considered by the independent pricing service in determining adjustments to reflect fair value and may include information relating to sector indices, American Depositary Receipts and domestic and foreign index futures. Foreign securities may have additional risks including exchange rate changes, potential for sharply devalued currencies and high inflation, political and economical upheaval, the relative lack of issuer information, relatively low market liquidity and the potential lack of strict financial and accounting controls and standards. | ||
| Securities for which market prices are not provided by any of the above methods may be valued based upon quotes furnished by independent sources. The last bid price may be used to value equity securities. The mean between the last bid and asked prices is used to value debt obligations, including Corporate Loans. | ||
| Securities for which market quotations are not readily available or are unreliable are valued at fair value as determined in good faith by or under the supervision of the Trust’s officers following procedures approved by the Board of Trustees. Issuer specific events, market trends, bid/ask quotes of brokers and information providers and other market data may be reviewed in the course of making a good faith determination of a security’s fair value. | ||
| Valuations change in response to many factors including the historical and prospective earnings of the issuer, the value of the issuer’s assets, general economic conditions, interest rates, investor perceptions and market liquidity. Because of the inherent uncertainties of valuation, the values reflected in the financial statements may materially differ from the value received upon actual sale of those investments. | ||
| B. | Securities Transactions and Investment Income — Securities transactions are accounted for on a trade date basis. Realized gains or losses on sales are computed on the basis of specific identification of the securities sold. Interest income is recorded on the accrual basis from settlement date. Dividend income (net of withholding tax, if any) is recorded on the ex-dividend date. | |
| The Fund may periodically participate in litigation related to Fund investments. As such, the Fund may receive proceeds from litigation settlements. Any proceeds received are included in the Statement of Operations as realized gain (loss) for investments no longer held and as unrealized gain (loss) for investments still held. | ||
| Brokerage commissions and mark ups are considered transaction costs and are recorded as an increase to the cost basis of securities purchased and/or a reduction of proceeds on a sale of securities. Such transaction costs are included in the determination of net realized and unrealized gain (loss) from investment securities reported in the Statement of Operations and the Statement of Changes in Net Assets and the net realized and unrealized gains (losses) on securities per share in the Financial Highlights. Transaction costs are included in the calculation of the Fund’s net asset value and, accordingly, they reduce the Fund’s total returns. These transaction costs are not considered operating expenses and are not reflected in net investment income reported in the Statement of Operations and Statement of Changes in Net Assets, or the net investment income per share and ratios of expenses and net investment income reported in the Financial Highlights, nor are they limited by any expense limitation arrangements between the Fund and the investment adviser. | ||
| The Fund allocates income and realized and unrealized capital gains and losses to a class based on the relative net assets of each class. | ||
| C. | Country Determination — For the purposes of making investment selection decisions and presentation in the Schedule of Investments, the investment adviser may determine the country in which an issuer is located and/or credit risk exposure based on various factors. These factors include the laws of the country under which the issuer is organized, where the issuer maintains a principal office, the country in which the issuer derives 50% or more of its total revenues and the country that has the primary market for the issuer’s securities, as well as other criteria. Among the other criteria that may be evaluated for making this determination are the country in which the issuer maintains 50% or more of its assets, the type of security, financial guarantees and enhancements, the nature of the collateral and the sponsor organization. Country of issuer and/or credit risk exposure has been determined to be the United States of America, unless otherwise noted. | |
| D. | Distributions — Distributions from income and net realized capital gain, if any, are generally paid annually and recorded on ex-dividend date. The Fund may elect to treat a portion of the proceeds from redemptions as distributions for federal income tax purposes. |
14 Invesco Global Growth Fund
| E. | Federal Income Taxes — The Fund intends to comply with the requirements of Subchapter M of the Internal Revenue Code necessary to qualify as a regulated investment company and to distribute substantially all of the Fund’s taxable earnings to shareholders. As such, the Fund will not be subject to federal income taxes on otherwise taxable income (including net realized capital gain) that is distributed to shareholders. Therefore, no provision for federal income taxes is recorded in the financial statements. | |
| The Fund files tax returns in the U.S. Federal jurisdiction and certain other jurisdictions. Generally, the Fund is subject to examinations by such taxing authorities for up to three years after the filing of the return for the tax period. | ||
| F. | Expenses — Fees provided for under the Rule 12b-1 plan of a particular class of the Fund are charged to the operations of such class. Transfer agency fees and expenses and other shareholder recordkeeping fees and expenses attributable to the Institutional Class are charged to such class. Transfer agency fees and expenses and other shareholder recordkeeping fees and expenses relating to all other classes are allocated among those classes based on relative net assets. All other expenses are allocated among the classes based on relative net assets. | |
| G. | Accounting Estimates — The preparation of financial statements in conformity with accounting principles generally accepted in the United States of America (“GAAP”) requires management to make estimates and assumptions that affect the reported amounts of assets and liabilities at the date of the financial statements and the reported amounts of revenues and expenses during the reporting period including estimates and assumptions related to taxation. Actual results could differ from those estimates by a significant amount. In addition, the Fund monitors for material events or transactions that may occur or become known after the period-end date and before the date the financial statements are released to print. | |
| H. | Indemnifications — Under the Trust’s organizational documents, each Trustee, officer, employee or other agent of the Trust is indemnified against certain liabilities that may arise out of performance of their duties to the Fund. Additionally, in the normal course of business, the Fund enters into contracts, including the Fund’s servicing agreements that contain a variety of indemnification clauses. The Fund’s maximum exposure under these arrangements is unknown as this would involve future claims that may be made against the Fund that have not yet occurred. The risk of material loss as a result of such indemnification claims is considered remote. | |
| I. | Redemption Fees — The Fund has a 2% redemption fee that is to be retained by the Fund to offset transaction costs and other expenses associated with short-term redemptions and exchanges. The fee, subject to certain exceptions, is imposed on certain redemptions or exchanges of shares within 31 days of purchase. The redemption fee is recorded as an increase in shareholder capital and is allocated among the share classes based on the relative net assets of each class. Effective January 1, 2012, the Fund will eliminate the 2% redemption fee, if applicable, assessed on shares of the Fund redeemed or exchanged within 31 days of purchase. | |
| J. | Foreign Currency Translations — Foreign currency is valued at the close of the NYSE based on quotations posted by banks and major currency dealers. Portfolio securities and other assets and liabilities denominated in foreign currencies are translated into U.S. dollar amounts at date of valuation. Purchases and sales of portfolio securities (net of foreign taxes withheld on disposition) and income items denominated in foreign currencies are translated into U.S. dollar amounts on the respective dates of such transactions. The Fund does not separately account for the portion of the results of operations resulting from changes in foreign exchange rates on investments and the fluctuations arising from changes in market prices of securities held. The combined results of changes in foreign exchange rates and the fluctuation of market prices on investments (net of estimated foreign tax withholding) are included with the net realized and unrealized gain or loss from investments in the Statement of Operations. Reported net realized foreign currency gains or losses arise from (1) sales of foreign currencies, (2) currency gains or losses realized between the trade and settlement dates on securities transactions, and (3) the difference between the amounts of dividends, interest, and foreign withholding taxes recorded on the Fund’s books and the U.S. dollar equivalent of the amounts actually received or paid. Net unrealized foreign currency gains and losses arise from changes in the fair values of assets and liabilities, other than investments in securities at fiscal period end, resulting from changes in exchange rates. | |
| The Fund may invest in foreign securities which may be subject to foreign taxes on income, gains on investments or currency repatriation, a portion of which may be recoverable. | ||
| K. | Foreign Currency Contracts — The Fund may enter into foreign currency contracts to manage or minimize currency or exchange rate risk. The Fund may also enter into foreign currency contracts for the purchase or sale of a security denominated in a foreign currency in order to “lock in” the U.S. dollar price of that security. A foreign currency contract is an obligation to purchase or sell a specific currency for an agreed-upon price at a future date. The use of foreign currency contracts does not eliminate fluctuations in the price of the underlying securities the Fund owns or intends to acquire but establishes a rate of exchange in advance. Fluctuations in the value of these contracts are measured by the difference in the contract date and reporting date exchange rates and are recorded as unrealized appreciation (depreciation) until the contracts are closed. When the contracts are closed, realized gains (losses) are recorded. Realized and unrealized gains (losses) on the contracts are included in the Statement of Operations. The primary risks associated with foreign currency contracts include failure of the counterparty to meet the terms of the contract and the value of the foreign currency changing unfavorably. These risks may be in excess of the amounts reflected in the Statement of Assets and Liabilities. |
15 Invesco Global Growth Fund
NOTE 2—Advisory Fees and Other Fees Paid to Affiliates
The Trust has entered into a master investment advisory agreement with Invesco Advisers, Inc. (the “Adviser” or “Invesco”). Under the terms of the investment advisory agreement, the Fund pays an advisory fee to the Adviser based on the annual rate of the Fund’s average daily net assets as follows:
| Average Daily Net Assets | Rate | |||
| First $250 million | 0 | .80% | ||
| Next $250 million | 0 | .78% | ||
| Next $500 million | 0 | .76% | ||
| Next $1.5 billion | 0 | .74% | ||
| Next $2.5 billion | 0 | .72% | ||
| Next $2.5 billion | 0 | .70% | ||
| Next $2.5 billion | 0 | .68% | ||
| Over $10 billion | 0 | .66% | ||
Under the terms of a master sub-advisory agreement between the Adviser and each of Invesco Asset Management Deutschland GmbH, Invesco Asset Management Limited, Invesco Asset Management (Japan) Limited, Invesco Australia Limited, Invesco Hong Kong Limited, Invesco Senior Secured Management, Inc. and Invesco Canada Ltd. (collectively, the “Affiliated Sub-Advisers”) the Adviser, not the Fund, may pay 40% of the fees paid to the Adviser to any such Affiliated Sub-Adviser(s) that provide discretionary investment management services to the Fund based on the percentage of assets allocated to such Sub-Adviser(s).
The Adviser has contractually agreed, through at least February 28, 2012, to waive advisory fees and/or reimburse expenses of all shares to the extent necessary to limit total annual fund operating expenses after fee waiver and/or expense reimbursement (excluding certain items discussed below) of Class A, Class B, Class C, Class Y and Institutional Class shares to 2.25%, 3.00%, 3.00%, 2.00% and 2.00%, respectively, of average daily net assets. Effective December 19, 2011, the Adviser has contractually agreed, through at least December 31, 2012, to reduce such limits by 0.93%. In determining the Adviser’s obligation to waive advisory fees and/or reimburse expenses, the following expenses are not taken into account, and could cause the total annual fund operating expenses after fee waiver and/or expense reimbursement to exceed the numbers reflected above: (1) interest; (2) taxes; (3) dividend expense on short sales; (4) extraordinary items or non-routine items; and (5) expenses that the Fund has incurred but did not actually pay because of an expense offset arrangement. Unless the Board of the Trustees and Invesco mutually agree to amend or continue the fee waiver agreement, it will terminate on February 28, 2012. The Adviser did not waive fees for reimbursed expenses during the period under this expense limitation.
The Adviser has contractually agreed, through at least June 30, 2012, to waive the advisory fee payable by the Fund in an amount equal to 100% of the net advisory fees the Adviser receives from the affiliated money market funds on investments by the Fund of uninvested cash in such affiliated money market funds.
For the year ended October 31, 2011, the Adviser waived advisory fees of $10,816.
At the request of the Trustees of the Trust, Invesco Ltd. agreed to reimburse expenses incurred by the Fund in connection with market timing matters in the Invesco Funds, which may include legal, audit, shareholder reporting, communications and trustee expenses. These expenses along with the related expense reimbursement are included in the Statement of Operations. For the year ended October 31, 2011, Invesco Ltd. reimbursed expenses of the Fund in the amount of $1,574.
The Trust has entered into a transfer agency and service agreement with Invesco Investment Services, Inc. (“IIS”) pursuant to which the Fund has agreed to pay IIS a fee for providing transfer agency and shareholder services to the Fund and reimburse IIS for certain expenses incurred by IIS in the course of providing such services. IIS may make payments to intermediaries that provide omnibus account services, sub-accounting services and/or networking services. All fees payable by IIS to intermediaries that provide omnibus account services or sub-accounting are charged back to the Fund, subject to certain limitations approved by the Trust’s Board of Trustees. For the year ended October 31, 2011, expenses incurred under the agreement are shown in the Statement of Operations as transfer agent fees.
The Trust has entered into a master administrative services agreement with Invesco pursuant to which the Fund has agreed to pay Invesco for certain administrative costs incurred in providing accounting services to the Fund. For the year ended October 31, 2011, expenses incurred under the agreement are shown in the Statement of Operations as administrative services fees.
The Trust has entered into master distribution agreements with Invesco Distributors, Inc. (“IDI”) to serve as the distributor for the Class A, Class B, Class C, Class Y and Institutional Class shares of the Fund. The Trust has adopted plans pursuant to Rule 12b-1 under the 1940 Act with respect to the Fund’s Class A, Class B and Class C shares (collectively, the “Plans”). The Fund, pursuant to the Plans, pays IDI compensation at the annual rate of 0.25% of the Fund’s average daily net assets of Class A shares and 1.00% of the average daily net assets of Class B and Class C shares. Of the Plan payments, up to 0.25% of the average daily net assets of each class of shares may be paid to furnish continuing personal shareholder services to customers who purchase and own shares of such classes. Any amounts not paid as a service fee under the Plans would constitute an asset-based sales charge. Rules of the Financial Industry Regulatory Authority (“FINRA”) impose a cap on the total sales charges, including asset-based sales charges that may be paid by any class of shares of the Fund. For the year ended October 31, 2011, expenses incurred under the Plans are shown in the Statement of Operations as distribution fees.
Front-end sales commissions and CDSC (collectively, the “sales charges”) are not recorded as expenses of the Fund. Front-end sales commissions are deducted from proceeds from the sales of Fund shares prior to investment in Class A shares of the Fund. CDSC are deducted from redemption proceeds prior to remittance to the shareholder. During the year ended October 31, 2011, IDI advised the Fund that IDI retained $13,638 in front-end sales commissions from the sale of Class A shares and $5, $17,342 and $605 from Class A, Class B and Class C shares, respectively, for CDSC imposed on redemptions by shareholders.
Certain officers and trustees of the Trust are officers and directors of the Adviser, Invesco Ltd., IIS and/or IDI.
16 Invesco Global Growth Fund
NOTE 3—Additional Valuation Information
GAAP defines fair value as the price that would be received to sell an asset or paid to transfer a liability in an orderly transaction between market participants at the measurement date, under current market conditions. GAAP establishes a hierarchy that prioritizes the inputs to valuation methods giving the highest priority to readily available unadjusted quoted prices in an active market for identical assets (Level 1) and the lowest priority to significant unobservable inputs (Level 3) generally when market prices are not readily available or are unreliable. Based on the valuation inputs, the securities or other investments are tiered into one of three levels. Changes in valuation methods may result in transfers in or out of an investment’s assigned level:
| Level 1 — | Prices are determined using quoted prices in an active market for identical assets. | |
| Level 2 — | Prices are determined using other significant observable inputs. Observable inputs are inputs that other market participants may use in pricing a security. These may include quoted prices for similar securities, interest rates, prepayment speeds, credit risk, yield curves, loss severities, default rates, discount rates, volatilities and others. | |
| Level 3 — | Prices are determined using significant unobservable inputs. In situations where quoted prices or observable inputs are unavailable (for example, when there is little or no market activity for an investment at the end of the period), unobservable inputs may be used. Unobservable inputs reflect the Fund’s own assumptions about the factors market participants would use in determining fair value of the securities or instruments and would be based on the best available information. |
The following is a summary of the tiered valuation input levels, as of October 31, 2011. The level assigned to the securities valuations may not be an indication of the risk or liquidity associated with investing in those securities. Because of the inherent uncertainties of valuation, the values reflected in the financial statements may materially differ from the value received upon actual sale of those investments.
During the year ended October 31, 2011, there were no significant transfers between investment levels.
| Level 1 | Level 2 | Level 3 | Total | |||||||||||||
| Australia | $ | — | $ | 9,604,086 | $ | — | $ | 9,604,086 | ||||||||
| Belgium | — | 3,396,018 | — | 3,396,018 | ||||||||||||
| Brazil | 4,288,898 | — | — | 4,288,898 | ||||||||||||
| Canada | 2,142,560 | — | — | 2,142,560 | ||||||||||||
| China | — | 2,535,075 | — | 2,535,075 | ||||||||||||
| Denmark | — | 2,428,266 | — | 2,428,266 | ||||||||||||
| France | — | 10,075,575 | — | 10,075,575 | ||||||||||||
| Germany | — | 13,053,612 | — | 13,053,612 | ||||||||||||
| Hong Kong | — | 2,517,636 | — | 2,517,636 | ||||||||||||
| India | 2,031,432 | — | — | 2,031,432 | ||||||||||||
| Ireland | 5,708,080 | 2,790,615 | — | 8,498,695 | ||||||||||||
| Israel | 3,805,586 | — | — | 3,805,586 | ||||||||||||
| Japan | — | 15,447,679 | — | 15,447,679 | ||||||||||||
| Mexico | 3,809,859 | — | — | 3,809,859 | ||||||||||||
| Netherlands | — | 4,654,601 | — | 4,654,601 | ||||||||||||
| Russia | — | 2,049,395 | — | 2,049,395 | ||||||||||||
| Singapore | — | 1,409,138 | — | 1,409,138 | ||||||||||||
| South Korea | — | 4,551,247 | — | 4,551,247 | ||||||||||||
| Spain | — | 1,880,984 | — | 1,880,984 | ||||||||||||
| Sweden | — | 5,232,853 | — | 5,232,853 | ||||||||||||
| Switzerland | 5,526,990 | 8,212,615 | — | 13,739,605 | ||||||||||||
| Taiwan | — | 2,120,383 | — | �� | 2,120,383 | |||||||||||
| United Kingdom | 3,454,764 | 26,335,611 | — | 29,790,375 | ||||||||||||
| United States | 58,300,258 | — | — | 58,300,258 | ||||||||||||
| Total Investments | $ | 89,068,427 | $ | 118,295,389 | $ | — | $ | 207,363,816 | ||||||||
NOTE 4—Security Transactions with Affiliated Funds
The Fund is permitted to purchase or sell securities from or to certain other Invesco Funds under specified conditions outlined in procedures adopted by the Board of Trustees of the Trust. The procedures have been designed to ensure that any purchase or sale of securities by the Fund from or to another fund or portfolio that is or could be considered an affiliate by virtue of having a common investment adviser (or affiliated investment advisers), common Trustees and/or common officers complies with Rule 17a-7 of the 1940 Act. Further, as defined under the procedures, each transaction is effected at the current market price. Pursuant to these procedures, for the year ended October 31, 2011, the Fund engaged in securities purchases of $0 and securities sales of $296,562, which resulted in net realized gains of $110,633.
17 Invesco Global Growth Fund
NOTE 5—Expense Offset Arrangement(s)
The expense offset arrangement is comprised of transfer agency credits which result from balances in Demand Deposit Accounts (DDA) used by the transfer agent for clearing shareholder transactions. For the year ended October 31, 2011, the Fund received credits from this arrangement, which resulted in the reduction of the Fund’s total expenses of $2,079.
NOTE 6—Trustees’ and Officers’ Fees and Benefits
“Trustees’ and Officers’ Fees and Benefits” include amounts accrued by the Fund to pay remuneration to certain Trustees and Officers of the Fund. Trustees have the option to defer compensation payable by the Fund, and “Trustees’ and Officers’ Fees and Benefits” also include amounts accrued by the Fund to fund such deferred compensation amounts. Those Trustees who defer compensation have the option to select various Invesco Funds in which their deferral accounts shall be deemed to be invested. Finally, certain current Trustees are eligible to participate in a retirement plan that provides for benefits to be paid upon retirement to Trustees over a period of time based on the number of years of service. The Fund may have certain former Trustees who also participate in a retirement plan and receive benefits under such plan. “Trustees’ and Officers’ Fees and Benefits” include amounts accrued by the Fund to fund such retirement benefits. Obligations under the deferred compensation and retirement plans represent unsecured claims against the general assets of the Fund.
During the year ended October 31, 2011, the Fund paid legal fees of $1,855 for services rendered by Kramer, Levin, Naftalis & Frankel LLP as counsel to the Independent Trustees. A partner of that firm is a Trustee of the Trust.
NOTE 7—Cash Balances
The Fund is permitted to temporarily carry a negative or overdrawn balance in its account with The State Street Bank and Trust Company, the custodian bank. To compensate the custodian bank for such overdrafts, the overdrawn Fund may either (1) leave funds as a compensating balance in the account so the custodian bank can be compensated by earning the additional interest; or (2) compensate by paying the custodian bank at a rate agreed upon by the custodian bank and Invesco, not to exceed the contractually agreed upon rate.
NOTE 8—Distributions to Shareholders and Tax Components of Net Assets
Tax Character of Distributions to Shareholders Paid During the Years Ended October 31, 2011 and 2010:
| 2011 | 2010 | |||||||
| Ordinary income | $ | 1,251,576 | $ | 2,022,417 | ||||
Tax Components of Net Assets at Period-End:
| 2011 | ||||
| Undistributed ordinary income | $ | 1,126,230 | ||
| Net unrealized appreciation — investments | 23,437,621 | |||
| Net unrealized appreciation (depreciation) — other investments | 104,964 | |||
| Temporary book/tax differences | (101,090 | ) | ||
| Capital loss carryforward | (16,434,527 | ) | ||
| Shares of beneficial interest | 200,671,101 | |||
| Total net assets | $ | 208,804,299 | ||
The difference between book-basis and tax-basis unrealized appreciation (depreciation) is due to differences in the timing of recognition of gains and losses on investments for tax and book purposes. The Fund’s net unrealized appreciation difference is attributable primarily to wash sales.
The temporary book/tax differences are a result of timing differences between book and tax recognition of income and/or expenses. The Fund’s temporary book/tax differences are the result of the trustee deferral of compensation and retirement plan benefits.
Capital loss carryforward is calculated and reported as of a specific date. Results of transactions and other activity after that date may affect the amount of capital loss carryforward actually available for the Fund to utilize. The ability to utilize capital loss carryforward in the future may be limited under the Internal Revenue Code and related regulations based on the results of future transactions.
18 Invesco Global Growth Fund
The Fund utilized $14,128,894 of capital loss carryforward in the current period to offset net realized capital gain for federal income tax purposes. The Fund has a capital loss carryforward as of October 31, 2011, which expires as follows:
| Capital Loss | ||||
| Expiration | Carryforward* | |||
| October 31, 2017 | $ | 16,434,527 | ||
| * | Capital loss carryforward as of the date listed above is reduced for limitations, if any, to the extent required by the Internal Revenue Code. |
NOTE 9—Investment Securities
The aggregate amount of investment securities (other than short-term securities, U.S. Treasury obligations and money market funds, if any) purchased and sold by the Fund during the year ended October 31, 2011 was $62,946,120 and $91,806,988, respectively. Cost of investments on a tax basis includes the adjustments for financial reporting purposes as of the most recently completed Federal income tax reporting period-end.
| Unrealized Appreciation (Depreciation) of Investment Securities on a Tax Basis | ||||
| Aggregate unrealized appreciation of investment securities | $ | 35,229,504 | ||
| Aggregate unrealized (depreciation) of investment securities | (11,791,883 | ) | ||
| Net unrealized appreciation of investment securities | $ | 23,437,621 | ||
| Cost of investments for tax purposes is $183,926,195. | ||||
NOTE 10—Reclassification of Permanent Differences
Primarily as a result of differing book/tax treatment of foreign currency transactions and litigation settlements, on October 31, 2011, undistributed net investment income was increased by $179,637, and undistributed net realized gain (loss) was decreased by $179,637. This reclassification had no effect on the net assets of the Fund.
19 Invesco Global Growth Fund
NOTE 11—Share Information
| Summary of Share Activity | ||||||||||||||||
| Year ended October 31, | ||||||||||||||||
| 2011(a) | 2010 | |||||||||||||||
| Shares | Amount | Shares | Amount | |||||||||||||
| Sold: | ||||||||||||||||
| Class A | 342,583 | $ | 7,944,364 | 369,644 | $ | 7,576,455 | ||||||||||
| Class B | 29,878 | 643,525 | 73,955 | 1,425,575 | ||||||||||||
| Class C | 60,024 | 1,291,118 | 54,666 | 1,053,568 | ||||||||||||
| Class Y | 32,379 | 743,804 | 8,976 | 180,706 | ||||||||||||
| Institutional Class | 14,129 | 293,317 | 1,662 | 34,382 | ||||||||||||
| Issued as reinvestment of dividends: | ||||||||||||||||
| Class A | 49,848 | 1,132,552 | 85,489 | 1,755,933 | ||||||||||||
| Class B | — | — | 2,252 | 43,653 | ||||||||||||
| Class C | — | — | 1,524 | 29,524 | ||||||||||||
| Class Y | 476 | 10,826 | 624 | 12,836 | ||||||||||||
| Institutional Class | — | — | 720 | 14,783 | ||||||||||||
| Automatic conversion of Class B shares to Class A shares: | ||||||||||||||||
| Class A | 145,218 | 3,355,437 | 197,229 | 4,038,825 | ||||||||||||
| Class B | (154,699 | ) | (3,355,437 | ) | (209,783 | ) | (4,038,825 | ) | ||||||||
Reacquired:(b) | ||||||||||||||||
| Class A | (1,551,991 | ) | (35,806,768 | ) | (1,793,200 | ) | (36,530,471 | ) | ||||||||
| Class B | (109,720 | ) | (2,393,577 | ) | (170,768 | ) | (3,290,342 | ) | ||||||||
| Class C | (156,604 | ) | (3,380,439 | ) | (160,175 | ) | (3,088,454 | ) | ||||||||
| Class Y | (20,377 | ) | (475,102 | ) | (30,720 | ) | (607,016 | ) | ||||||||
| Institutional Class | (818 | ) | (16,007 | ) | (53,726.5 | ) | (1,065,918 | ) | ||||||||
| Net increase (decrease) in share activity | (1,319,674 | ) | $ | (30,012,387 | ) | (1,621,630.5 | ) | $ | (32,454,786 | ) | ||||||
| (a) | There are entities that are record owners of more than 5% of the outstanding shares of the Fund and in the aggregate own 25% of the outstanding shares of the Fund. IDI has an agreement with these entities to sell Fund shares. The Fund, Invesco and/or Invesco affiliates may make payments to these entities, which are considered to be related to the Fund, for providing services to the Fund, Invesco and/or Invesco affiliates including but not limited to services such as securities brokerage, distribution, third party record keeping and account servicing. The Fund has no knowledge as to whether all or any portion of the shares owned of record by these entities are also owned beneficially. | |
| (b) | Net of redemption fees of $1,643 and $805 allocated among the classes based on relative net assets of each class for the years ended October 31, 2011 and 2010, respectively. |
20 Invesco Global Growth Fund
NOTE 12—Financial Highlights
The following schedule presents financial highlights for a share of the Fund outstanding throughout the periods indicated.
| Ratio of | Ratio of | |||||||||||||||||||||||||||||||||||||||||||||||
| Net gains | expenses | expenses | ||||||||||||||||||||||||||||||||||||||||||||||
| (losses) on | to average | to average net | Ratio of net | |||||||||||||||||||||||||||||||||||||||||||||
| Net asset | Net | securities | Dividends | net assets | assets without | investment | ||||||||||||||||||||||||||||||||||||||||||
| value, | investment | (both | Total from | from net | Net asset | Net assets, | with fee waivers | fee waivers | income (loss) | |||||||||||||||||||||||||||||||||||||||
| beginning | income | realized and | investment | investment | value, end | Total | end of period | and/or expenses | and/or expenses | to average | Portfolio | |||||||||||||||||||||||||||||||||||||
| of period | (loss)(a) | unrealized) | operations | income | of period(b) | return(c) | (000s omitted) | absorbed | absorbed | net assets | turnover(d) | |||||||||||||||||||||||||||||||||||||
| Class A | ||||||||||||||||||||||||||||||||||||||||||||||||
| Year ended 10/31/11 | $ | 22.30 | $ | 0.12 | $ | (0.02 | ) | $ | 0.10 | $ | (0.14 | ) | $ | 22.26 | 0.41 | % | $ | 185,484 | 1.62 | %(e) | 1.63 | %(e) | 0.50 | %(e) | 28 | % | ||||||||||||||||||||||
| Year ended 10/31/10 | 19.51 | 0.09 | 2.88 | 2.97 | (0.18 | ) | 22.30 | 15.33 | 208,436 | 1.62 | 1.63 | 0.44 | 41 | |||||||||||||||||||||||||||||||||||
| Year ended 10/31/09 | 16.56 | 0.14 | 3.05 | (f) | 3.19 | (0.24 | ) | 19.51 | 19.62 | (f) | 204,605 | 1.79 | 1.80 | 0.83 | 40 | |||||||||||||||||||||||||||||||||
| Year ended 10/31/08 | 28.18 | 0.24 | (11.80 | ) | (11.56 | ) | (0.06 | ) | 16.56 | (41.11 | ) | 190,275 | 1.59 | 1.60 | 1.00 | 48 | ||||||||||||||||||||||||||||||||
| Year ended 10/31/07 | 22.94 | 0.12 | 5.22 | 5.34 | (0.10 | ) | 28.18 | 23.35 | 355,538 | 1.53 | 1.57 | 0.47 | 38 | |||||||||||||||||||||||||||||||||||
| Class B | ||||||||||||||||||||||||||||||||||||||||||||||||
| Year ended 10/31/11 | 20.90 | (0.05 | ) | (0.02 | ) | (0.07 | ) | — | 20.83 | (0.33 | ) | 10,776 | 2.37 | (e) | 2.38 | (e) | (0.25 | )(e) | 28 | |||||||||||||||||||||||||||||
| Year ended 10/31/10 | 18.29 | (0.06 | ) | 2.71 | 2.65 | (0.04 | ) | 20.90 | 14.53 | 15,713 | 2.37 | 2.38 | (0.31 | ) | 41 | |||||||||||||||||||||||||||||||||
| Year ended 10/31/09 | 15.42 | 0.01 | 2.86 | (f) | 2.87 | 0.00 | 18.29 | 18.64 | (f) | 19,325 | 2.54 | 2.55 | 0.08 | 40 | ||||||||||||||||||||||||||||||||||
| Year ended 10/31/08 | 26.37 | 0.06 | (11.01 | ) | (10.95 | ) | — | 15.42 | (41.52 | ) | 25,426 | 2.34 | 2.35 | 0.25 | 48 | |||||||||||||||||||||||||||||||||
| Year ended 10/31/07 | 21.54 | (0.07 | ) | 4.90 | 4.83 | — | 26.37 | 22.42 | 79,333 | 2.28 | 2.32 | (0.28 | ) | 38 | ||||||||||||||||||||||||||||||||||
| Class C | ||||||||||||||||||||||||||||||||||||||||||||||||
| Year ended 10/31/11 | 20.90 | (0.05 | ) | (0.02 | ) | (0.07 | ) | — | 20.83 | (0.33 | ) | 10,838 | 2.37 | (e) | 2.38 | (e) | (0.25 | )(e) | 28 | |||||||||||||||||||||||||||||
| Year ended 10/31/10 | 18.30 | (0.06 | ) | 2.70 | 2.64 | (0.04 | ) | 20.90 | 14.47 | 12,893 | 2.37 | 2.38 | (0.31 | ) | 41 | |||||||||||||||||||||||||||||||||
| Year ended 10/31/09 | 15.42 | 0.01 | 2.87 | (f) | 2.88 | 0.00 | 18.30 | 18.71 | (f) | 13,192 | 2.54 | 2.55 | 0.08 | 40 | ||||||||||||||||||||||||||||||||||
| Year ended 10/31/08 | 26.38 | 0.06 | (11.02 | ) | (10.96 | ) | — | 15.42 | (41.55 | ) | 12,719 | 2.34 | 2.35 | 0.25 | 48 | |||||||||||||||||||||||||||||||||
| Year ended 10/31/07 | 21.55 | (0.07 | ) | 4.90 | 4.83 | — | 26.38 | 22.41 | 27,878 | 2.28 | 2.32 | (0.28 | ) | 38 | ||||||||||||||||||||||||||||||||||
| Class Y | ||||||||||||||||||||||||||||||||||||||||||||||||
| Year ended 10/31/11 | 22.37 | 0.17 | (0.02 | ) | 0.15 | (0.19 | ) | 22.33 | 0.66 | 1,400 | 1.37 | (e) | 1.38 | (e) | 0.75 | (e) | 28 | |||||||||||||||||||||||||||||||
| Year ended 10/31/10 | 19.57 | 0.14 | 2.89 | 3.03 | (0.23 | ) | 22.37 | 15.58 | 1,123 | 1.37 | 1.38 | 0.69 | 41 | |||||||||||||||||||||||||||||||||||
| Year ended 10/31/09 | 16.57 | 0.19 | 3.05 | (f) | 3.24 | (0.24 | ) | 19.57 | 19.93 | (f) | 1,395 | 1.54 | 1.55 | 1.08 | 40 | |||||||||||||||||||||||||||||||||
| Year ended 10/31/08(g) | 19.00 | 0.01 | (2.44 | ) | (2.43 | ) | — | 16.57 | (12.79 | ) | 821 | 1.45 | (h) | 1.46 | (h) | 1.14 | (h) | 48 | ||||||||||||||||||||||||||||||
| Institutional Class | ||||||||||||||||||||||||||||||||||||||||||||||||
| Year ended 10/31/11 | 22.37 | 0.28 | (0.06 | ) | 0.22 | (0.26 | ) | 22.33 | 0.95 | 306 | 0.82 | (e) | 0.83 | (e) | 1.30 | (e) | 28 | |||||||||||||||||||||||||||||||
| Year ended 10/31/10 | 19.59 | 0.20 | 2.89 | 3.09 | (0.31 | ) | 22.37 | 15.93 | 9 | 1.07 | 1.08 | 0.99 | 41 | |||||||||||||||||||||||||||||||||||
| Year ended 10/31/09 | 16.65 | 0.26 | 3.05 | (f) | 3.31 | (0.37 | ) | 19.59 | 20.49 | (f) | 1,013 | 1.07 | 1.08 | 1.55 | 40 | |||||||||||||||||||||||||||||||||
| Year ended 10/31/08 | 28.19 | 0.30 | (11.77 | ) | (11.47 | ) | (0.07 | ) | 16.65 | (40.79 | ) | 1,010 | 1.08 | 1.09 | 1.51 | 48 | ||||||||||||||||||||||||||||||||
| Year ended 10/31/07(g) | 27.11 | 0.02 | 1.06 | 1.08 | — | 28.19 | 3.98 | 10 | 1.05 | (h) | 1.05 | (h) | 0.94 | (h) | 38 | |||||||||||||||||||||||||||||||||
| (a) | Calculated using average shares outstanding. | |
| (b) | Includes redemption fees added to shares of beneficial interest which were less than $0.005 per share. | |
| (c) | Includes adjustments in accordance with accounting principles generally accepted in the United States of America and as such, the net asset value for financial reporting purposes and the returns based upon those net asset values may differ from the net asset value and returns for shareholder transactions. Does not include sales charges and is not annualized for periods less than one year, if applicable. | |
| (d) | Portfolio turnover is calculated at the fund level and is not annualized for periods less than one year, if applicable. | |
| (e) | Ratios are based on average daily net assets (000’s) of $202,818, $13,618, $12,221, $1,362 and $49 for Class A, Class B, Class C, Class Y and Institutional Class shares, respectively. | |
| (f) | Includes litigation proceeds received during the period. Had the litigation proceeds not been received, net gains (losses) on securities (both realized and unrealized) per share would have been $2.93, $2.74, $2.75, $2.93 and $2.93 for Class A, Class B, Class C, Class Y and Institutional Class shares, respectively and total returns would have been lower. | |
| (g) | Commencement date for Class Y and Institutional Class shares was October 3, 2008 and September 28, 2007, respectively. | |
| (h) | Annualized. |
NOTE 13 — Reorganization
The Board of Trustees unanimously approved an Agreement and Plan of Reorganization (the “Agreement”) pursuant to which the Fund would acquire all of the assets and liabilities of Invesco Global Advantage Fund (the “Target Fund”) in exchange for shares of the Fund.
The Target Fund’s shareholders approved the Agreement on November 28, 2011 and the reorganization is expected to be consummated on December 19, 2011. Upon closing of the reorganization, shareholders of the Target Fund will receive a corresponding share class of the Fund in exchange for their shares of the Target Fund and the Target Fund will liquidate and cease operations.
21 Invesco Global Growth Fund
Report of Independent Registered Public Accounting Firm
To the Board of Trustees of AIM International Mutual Funds
(Invesco International Mutual Funds)and Shareholders of Invesco Global Growth Fund:
In our opinion, the accompanying statement of assets and liabilities, including the schedule of investments, and the related statements of operations and of changes in net assets and the financial highlights present fairly, in all material respects, the financial position of Invesco Global Growth Fund (one of the funds constituting AIM International Mutual Funds (Invesco International Mutual Funds), hereafter referred to as the “Fund”) at October 31, 2011, the results of its operations for the year then ended, the changes in its net assets for each of the two years in the period then ended and the financial highlights for each of the five years in the period then ended, in conformity with accounting principles generally accepted in the United States of America. These financial statements and financial highlights (hereafter referred to as “financial statements”) are the responsibility of the Fund’s management; our responsibility is to express an opinion on these financial statements based on our audits. We conducted our audits of these financial statements in accordance with the standards of the Public Company Accounting Oversight Board (United States). Those standards require that we plan and perform the audit to obtain reasonable assurance about whether the financial statements are free of material misstatement. An audit includes examining, on a test basis, evidence supporting the amounts and disclosures in the financial statements, assessing the accounting principles used and significant estimates made by management, and evaluating the overall financial statement presentation. We believe that our audits, which included confirmation of securities at October 31, 2011 by correspondence with the custodian and brokers, provide a reasonable basis for our opinion.
PRICEWATERHOUSECOOPERS LLP
Houston, Texas
December 21, 2011
22 Invesco Global Growth Fund
Calculating your ongoing Fund expenses
Example
As a shareholder of the Fund, you incur two types of costs: (1) transaction costs, which may include sales charges (loads) on purchase payments or contingent deferred sales charges on redemptions, and redemption fees, if any; and (2) ongoing costs, including management fees, distribution and/or service (12b-1) fees, and other Fund expenses. This example is intended to help you understand your ongoing costs (in dollars) of investing in the Fund and to compare these costs with ongoing costs of investing in other mutual funds. The example is based on an investment of $1,000 invested at the beginning of the period and held for the entire period May 1, 2011 through October 31, 2011.
Actual expenses
The table below provides information about actual account values and actual expenses. You may use the information in this table, together with the amount you invested, to estimate the expenses that you paid over the period. Simply divide your account value by $1,000 (for example, an $8,600 account value divided by $1,000 = 8.6), then multiply the result by the number in the table under the heading entitled “Actual Expenses Paid During Period” to estimate the expenses you paid on your account during this period.
Hypothetical example for comparison purposes
The table below also provides information about hypothetical account values and hypothetical expenses based on the Fund’s actual expense ratio and an assumed rate of return of 5% per year before expenses, which is not the Fund’s actual return.
The hypothetical account values and expenses may not be used to estimate the actual ending account balance or expenses you paid for the period. You may use this information to compare the ongoing costs of investing in the Fund and other funds. To do so, compare this 5% hypothetical example with the 5% hypothetical examples that appear in the shareholder reports of the other funds.
Please note that the expenses shown in the table are meant to highlight your ongoing costs only and do not reflect any transaction costs, such as sales charges (loads) on purchase payments, contingent deferred sales charges on redemptions, and redemption fees, if any. Therefore, the hypothetical information is useful in comparing ongoing costs only, and will not help you determine the relative total costs of owning different funds. In addition, if these transaction costs were included, your costs would have been higher.
| HYPOTHETICAL | ||||||||||||||||||||||||||||||
| (5% annual return before | ||||||||||||||||||||||||||||||
| ACTUAL | expenses) | |||||||||||||||||||||||||||||
| Beginning | Ending | Expenses | Ending | Expenses | Annualized | |||||||||||||||||||||||||
| Account Value | Account Value | Paid During | Account Value | Paid During | Expense | |||||||||||||||||||||||||
| Class | (05/01/11) | (10/31/11)1 | Period2 | (10/31/11) | Period2 | Ratio | ||||||||||||||||||||||||
| A | $ | 1,000.00 | $ | 891.10 | $ | 7.77 | $ | 1,016.99 | $ | 8.29 | 1.63 | % | ||||||||||||||||||
| B | 1,000.00 | 887.80 | 11.32 | 1,013.21 | 12.08 | 2.38 | ||||||||||||||||||||||||
| C | 1,000.00 | 887.80 | 11.32 | 1,013.21 | 12.08 | 2.38 | ||||||||||||||||||||||||
| Y | 1,000.00 | 892.10 | 6.58 | 1,018.25 | 7.02 | 1.38 | ||||||||||||||||||||||||
| Institutional | 1,000.00 | 893.50 | 3.87 | 1,021.12 | 4.13 | 0.81 | ||||||||||||||||||||||||
| 1 | The actual ending account value is based on the actual total return of the Fund for the period May 1, 2011 through October 31, 2011, after actual expenses and will differ from the hypothetical ending account value which is based on the Fund’s expense ratio and a hypothetical annual return of 5% before expenses. |
| 2 | Expenses are equal to the Fund’s annualized expense ratio as indicated above multiplied by the average account value over the period, multiplied by 184/365 to reflect the most recent fiscal half year. |
23 Invesco Global Growth Fund
| Approval of Investment Advisory and Sub-Advisory Contracts |
The Board of Trustees (the Board) of AIM International Mutual Funds (Invesco International Mutual Funds) is required under the Investment Company Act of 1940, as amended, to approve annually the renewal of the Invesco Global Growth Fund (the Fund) investment advisory agreement with Invesco Advisers, Inc. (Invesco Advisers) and the Master Intergroup Sub-Advisory Contract for Mutual Funds (the sub-advisory contracts) with Invesco Asset Management Deutschland GmbH, Invesco Asset Management Limited, Invesco Asset Management (Japan) Limited, Invesco Australia Limited, Invesco Hong Kong Limited, Invesco Senior Secured Management, Inc. and Invesco Canada Ltd. (collectively, the Affiliated Sub-Advisers). During contract renewal meetings held on June 14-15, 2011, the Board as a whole, and the disinterested or “independent” Trustees, who comprise 80% of the Board, voting separately, approved the continuance of the Fund’s investment advisory agreement and the sub-advisory contracts for another year, effective July 1, 2011. In doing so, the Board considered the process that it follows in reviewing and approving the Fund’s investment advisory agreement and sub-advisory contracts and the information that it is provided. The Board determined that the Fund’s investment advisory agreement and the sub-advisory contracts are in the best interests of the Fund and its shareholders and the compensation to Invesco Advisers and the Affiliated Sub-Advisers under the agreements is fair and reasonable.
The Board’s Fund Evaluation Process
The Board’s Investments Committee has established three Sub-Committees, each of which is responsible for overseeing the management of a number of the series portfolios of the funds advised by Invesco Advisers (the Invesco Funds). The Sub-Committees meet throughout the year to review the performance of their assigned funds, including reviewing materials prepared under the direction of the independent Senior Officer, an officer of the Invesco Funds who reports directly to the independent Trustees. Over the course of each year, the Sub-Committees meet with portfolio managers for their assigned Invesco Funds and other members of management to review the performance, investment objective(s), policies, strategies and limitations and investment risks of these funds. The Sub-Committees meet regularly and at designated contract renewal meetings each year to conduct a review of the performance, fees, expenses and other matters related to their assigned Invesco Funds. Each Sub-Committee recommends to the Investments Committee, which in turn recommends to the full Board, whether to approve the continuance of each Invesco Fund’s investment advisory agreement and sub-advisory contracts for another year.
During the contract renewal process, the Trustees receive comparative performance and fee data regarding the Invesco Funds prepared by Invesco Advisers and an independent company, Lipper, Inc. (Lipper). The Trustees also receive an independent written evaluation from the Senior Officer. The Senior Officer’s evaluation is prepared as part of his responsibility to manage the process by which the Invesco Funds’ proposed management fees are negotiated during the annual contract renewal process to ensure they are negotiated in a manner that is at arms’ length and reasonable. The independent Trustees are assisted in their annual evaluation of the Fund’s investment advisory agreement by the Senior Officer and by independent legal counsel. The independent Trustees also discuss the continuance of the investment advisory agreement and sub-advisory contracts in private sessions with the Senior Officer and counsel.
In evaluating the fairness and reasonableness of the Fund’s investment advisory agreement and sub-advisory contracts, the Board considered, among other things, the factors discussed below. The Trustees also considered information provided in connection with fund acquisitions approved by the Trustees to rationalize the Invesco Funds product range following the acquisition of the retail mutual fund business of Morgan Stanley (the Morgan Stanley Transaction). The Trustees recognized that the advisory fees for the Invesco Funds include advisory fees that are the result of years of review and negotiation between the Trustees and Invesco Advisers as well as advisory fees inherited from Morgan Stanley and Van Kampen funds acquired in the Morgan Stanley Transaction. The Trustees’ deliberations and conclusions in a particular year may be based in part on their deliberations and conclusions regarding these same arrangements throughout the year and in prior years. One Trustee may have weighed a particular piece of information differently than another Trustee.
The discussion below serves as the Senior Officer’s independent written evaluation with respect to the Fund’s investment advisory agreement as well as a discussion of the material factors and related conclusions that formed the basis for the Board’s approval of the Fund’s investment advisory agreement and sub-advisory contracts. Unless otherwise stated, this information is current as of June 15, 2011, and may not reflect consideration of factors that became known to the Board after that date, including, for example, changes to the Fund’s performance, advisory fees, expense limitations and/or fee waivers.
Factors and Conclusions and Summary of Independent Written Fee Evaluation
| A. | Nature, Extent and Quality of Services Provided by Invesco Advisers and the Affiliated Sub-Advisers |
The Board reviewed the advisory services provided to the Fund by Invesco Advisers under the Fund’s investment advisory agreement, the performance of Invesco Advisers in providing these services, and the credentials and experience of the officers and employees of Invesco Advisers who provide these services, including the Fund’s portfolio manager or managers, with whom the Board met during the year. The Board’s review of the qualifications of Invesco Advisers to provide advisory services included the Board’s consideration of Invesco Advisers’ performance and investment process oversight, independent credit analysis and investment risk management.
In determining whether to continue the Fund’s investment advisory agreement, the Board considered the prior relationship between Invesco Advisers and the Fund, as well as the Board’s knowledge of Invesco Advisers’ operations, and concluded that it is beneficial to maintain the current relationship, in part, because of such knowledge. The Board also considered services that Invesco Advisers and its affiliates provide to the Invesco Funds such as various back office support functions, equity and fixed income trading operations, internal audit, distribution and legal and compliance. The Board concluded that the nature, extent and quality of the services provided to the Fund by Invesco Advisers are appropriate and satisfactory and the advisory services are provided in accordance with the terms of the Fund’s investment advisory agreement.
The Board reviewed the services provided by the Affiliated Sub-Advisers under the sub-advisory contracts and the credentials and experience of the officers and employees of the Affiliated Sub-Advisers who provide these services. The Board noted that the Affiliated Sub-Advisers have offices and personnel that are located in financial centers around the world. As a result, the Affiliated Sub-Advisers can provide research and investment analysis on the markets and economies of various countries in which the Fund invests and make recommendations on securities of companies located in such countries. The Board concluded that the sub-advisory contracts benefit the Fund and its shareholders by permitting Invesco Advisers to use the resources and talents of the Affiliated Sub-Advisers in managing the Fund. The Board concluded that the nature, extent and quality of the services provided by the Affiliated Sub-Advisers are appropriate and satisfactory and in accordance with the terms of the Fund’s sub-advisory contracts.
| B. | Fund Performance |
The Board considered Fund performance as a relevant factor in considering whether to approve the investment advisory agreement. The Board did not view Fund performance as a relevant factor in considering whether to approve the sub-advisory contracts for the Fund, as no Affiliated Sub-Adviser currently manages assets of the Fund.
The Board compared the Fund’s performance during the past one, three and five calendar years to the performance of funds in the Lipper performance universe and against the Lipper Global Large-Cap Growth Funds Index. The Board noted that performance of Class A shares of the Fund was in the fourth quintile of the performance universe for the one year period, the second quintile for the three year period and the third quintile for the five year period (the first quintile being the best performing funds and the fifth quintile being the worst performing funds). The Board noted that performance of Class A shares of the Fund was below the performance of the Index for the one year period and above the performance of the Index for the
24 Invesco Global Growth Fund
three and five year periods. Although the independent written evaluation of the Fund’s Senior Officer only considered Fund performance through the most recent calendar year, the Trustees also reviewed more recent Fund performance and this review did not change their conclusions.
| C. | Advisory and Sub-Advisory Fees and Fee Waivers |
The Board compared the Fund’s contractual advisory fee rate to the contractual advisory fee rates of funds in the Fund’s Lipper expense group at a common asset level. The Board noted that the contractual advisory fee rate for Class A shares of the Fund was below the median contractual advisory fee rate of funds in the expense group. The Board also reviewed the methodology used by Lipper in providing expense group information, which includes using audited financial data from the most recent annual report of each fund in the expense group that was publicly available as of the end of the past calendar year and including only one fund per investment adviser. The Board noted that comparative data is as of varying dates, which may affect the comparability of data during times of market volatility.
The Board also compared the Fund’s effective fee rate (the advisory fee after advisory fee waivers and before expense limitations/waivers) to the advisory fee rates of other mutual funds advised by Invesco Advisers and its affiliates with investment strategies comparable to those of the Fund. The Board noted that the Fund’s rate was above the rate of one mutual fund with comparable investment strategies.
Other than the mutual fund described above, the Board noted that Invesco Advisers and the Affiliated Sub-Advisers do not manage other mutual funds or client accounts in a manner substantially similar to the management of the Fund.
The Board noted that Invesco Advisers has contractually agreed to waive fees and/or limit expenses of the Fund through at least June 30, 2013 in an amount necessary to limit total annual operating expenses to a specified percentage of average daily net assets for each class of the Fund. The Board also considered the effect this fee waiver would have on the Fund’s total estimated expenses.
The Board also considered the services provided by the Affiliated Sub-Advisers pursuant to the sub-advisory contracts, as well as the allocation of fees between Invesco Advisers and the Affiliated Sub-Advisers pursuant to the sub-advisory contracts. The Board noted that Invesco Advisers provides services to sub-advised Invesco Funds, including oversight of the Affiliated Sub-Advisers as well as the additional services described above other than day-to-day portfolio management. The Board also noted that the sub-advisory fees have no direct effect on the Fund or its shareholders, as they are paid by Invesco Advisers to the Affiliated Sub-Advisers.
Based upon the information and considerations described above, the Board concluded that the Fund’s advisory and sub-advisory fees are fair and reasonable.
| D. | Economies of Scale and Breakpoints |
The Board considered the extent to which there are economies of scale in the provision of advisory services to the Fund. The Board also considered whether the Fund benefits from economies of scale through contractual breakpoints in the Fund’s advisory fee schedule. The Board also noted that the Fund shares directly in economies of scale through lower fees charged by third party service providers based on the combined size of the Invesco Funds and other clients advised by Invesco Advisers.
| E. | Profitability and Financial Resources |
The Board reviewed information from Invesco Advisers concerning the costs of the advisory and other services that Invesco Advisers and its affiliates provide to the Fund and the profitability of Invesco Advisers and its affiliates in providing these services. The Board reviewed with Invesco Advisers the methodology used to prepare the profitability information. The Board considered the profitability of Invesco Advisers in connection with managing the Fund and the Invesco Funds. The Board noted that Invesco Advisers continues to operate at a net profit from services Invesco Advisers and its subsidiaries provide to the Fund and the Invesco Funds. The Board concluded that the level of profits realized by Invesco Advisers and its affiliates from providing services to the Fund is not excessive given the nature, quality and extent of the services provided to the Invesco Funds. The Board considered whether Invesco Advisers and each Affiliated Sub-Adviser are financially sound and have the resources necessary to perform their obligations under the investment advisory agreement and sub-advisory contracts. The Board concluded that Invesco Advisers and each Affiliated Sub-Adviser have the financial resources necessary to fulfill these obligations.
| F. | Collateral Benefits to Invesco Advisers and its Affiliates |
The Board considered various other benefits received by Invesco Advisers and its affiliates from the relationship with the Fund, including the fees received for their provision of administrative, transfer agency and distribution services to the Fund. The Board considered the performance of Invesco Advisers and its affiliates in providing these services and the organizational structure employed to provide these services. The Board also considered that these services are provided to the Fund pursuant to written contracts that are reviewed and approved on an annual basis by the Board; that the services are required for the operation of the Fund; that Invesco Advisers and its affiliates can provide services, the nature and quality of which are at least equal to those provided by others offering the same or similar services; and that the fees for such services are fair and reasonable in light of the usual and customary charges by others for services of the same nature and quality.
The Board considered the benefits realized by Invesco Advisers and the Affiliated Sub-Advisers as a result of portfolio brokerage transactions executed through “soft dollar” arrangements. The Board noted that soft dollar arrangements shift the payment obligation for research and execution services from Invesco Advisers and the Affiliated Sub-Advisers to the Invesco Funds and therefore may reduce Invesco Advisers’ and the Affiliated Sub-Advisers’ expenses. The Board concluded that the soft dollar arrangements are appropriate. The Board also concluded that, based on their review and representations made by the Chief Compliance Officer of the Invesco Funds, these arrangements are consistent with regulatory requirements.
The Board considered that the Fund’s uninvested cash and cash collateral from any securities lending arrangements may be invested in money market funds advised by Invesco Advisers pursuant to procedures approved by the Board. The Board noted that Invesco Advisers receives advisory fees from these affiliated money market funds attributable to such investments, although Invesco Advisers has contractually agreed to waive through varying periods the advisory fees payable by the Invesco Funds. The waiver is in an amount equal to 100% of the net advisory fee Invesco Advisers receives from the affiliated money market funds with respect to the Fund’s investment in the affiliated money market funds of uninvested cash, but not cash collateral. The Board concluded that the Fund’s investment of uninvested cash and cash collateral from any securities lending arrangements in the affiliated money market funds is in the best interests of the Fund and its shareholders.
25 Invesco Global Growth Fund
Tax Information
Form 1099-DIV, Form 1042-S and other year–end tax information provide shareholders with actual calendar year amounts that should be included in their tax returns. Shareholders should consult their tax advisors.
The following distribution information is being provided as required by the Internal Revenue Code or to meet a specific state’s requirement.
The Fund designates the following amounts or, if subsequently determined to be different, the maximum amount allowable for its fiscal year ended October 31, 2011:
Federal and State Income Tax | ||||
| Qualified Dividend Income* | 100.00% | |||
| Corporate Dividends Received Deduction* | 59.10% | |||
| * | The above percentages are based on ordinary income dividends paid to shareholders during the Fund’s fiscal year. |
26 Invesco Global Growth Fund
Trustees and Officers
The address of each trustee and officer is AIM International Mutual Funds (Invesco International Mutual Funds) (the “Trust”), 11 Greenway Plaza, Suite 2500, Houston, Texas 77046-1173. The trustees serve for the life of the Trust, subject to their earlier death, incapacitation, resignation, retirement or removal as more specifically provided in the Trust’s organizational documents. Each officer serves for a one year term or until their successors are elected and qualified. Column two below includes length of time served with predecessor entities, if any.
| Number of | ||||||||
| Funds in | ||||||||
| Fund Complex | ||||||||
| Name, Year of Birth and | Trustee and/ | Principal Occupation(s) | Overseen by | Other Directorship(s) | ||||
| Position(s) Held with the Trust | or Officer Since | During Past 5 Years | Trustee | Held by Trustee | ||||
| Interested Persons | ||||||||
Martin L. Flanagan1 — 1960 Trustee | 2007 | Executive Director, Chief Executive Officer and President, Invesco Ltd. (ultimate parent of Invesco and a global investment management firm); Advisor to the Board, Invesco Advisers, Inc. (formerly known as Invesco Institutional (N.A.), Inc.); Trustee, The Invesco Funds; Vice Chair, Investment Company Institute; and Member of Executive Board, SMU Cox School of Business | 141 | None | ||||
| Formerly: Chairman, Invesco Advisers, Inc. (registered investment adviser); Director, Chairman, Chief Executive Officer and President, IVZ Inc. (holding company), INVESCO Group Services, Inc. (service provider) and Invesco North American Holdings, Inc. (holding company); Director, Chief Executive Officer and President, Invesco Holding Company Limited (parent of Invesco and a global investment management firm); Director, Invesco Ltd.; Chairman, Investment Company Institute and President, Co-Chief Executive Officer, Co-President, Chief Operating Officer and Chief Financial Officer, Franklin Resources, Inc. (global investment management organization) | ||||||||
Philip A. Taylor2 — 1954 Trustee, President and Principal Executive Officer | 2006 | Head of North American Retail and Senior Managing Director, Invesco Ltd.; Director, Co-Chairman, Co-President and Co-Chief Executive Officer, Invesco Advisers, Inc. (formerly known as Invesco Institutional (N.A.), Inc.) (registered investment adviser); Director, Chairman, Chief Executive Officer and President, Invesco Management Group, Inc. (formerly Invesco Aim Management Group, Inc.) (financial services holding company); Director and President, INVESCO Funds Group, Inc. (registered investment adviser and registered transfer agent); Director and Chairman, Invesco Investment Services, Inc. (formerly known as Invesco Aim Investment Services, Inc.) (registered transfer agent) and IVZ Distributors, Inc. (formerly known as INVESCO Distributors, Inc.) (registered broker dealer); Director, President and Chairman, Invesco Inc. (holding company) and Invesco Canada Holdings Inc. (holding company); Chief Executive Officer, Invesco Corporate Class Inc. (corporate mutual fund company) and Invesco Canada Fund Inc. (corporate mutual fund company); Director, Chairman and Chief Executive Officer, Invesco Canada Ltd. (formerly known as Invesco Trimark Ltd./Invesco Trimark Ltèe) (registered investment adviser and registered transfer agent); Trustee, President and Principal Executive Officer, The Invesco Funds (other than AIM Treasurer’s Series Trust (Invesco Treasurer’s Series Trust) and Short-Term Investments Trust); Trustee and Executive Vice President, The Invesco Funds (AIM Treasurer’s Series Trust (Invesco Treasurer’s Series Trust) and Short-Term Investments Trust only); Director, Invesco Investment Advisers LLC (formerly known as Van Kampen Asset Management); Director, Chief Executive Officer and President, Van Kampen Exchange Corp. | 141 | None | ||||
| Formerly: Director and Chairman, Van Kampen Investor Services Inc.: | ||||||||
| Director, Chief Executive Officer and President, 1371 Preferred Inc. (holding company); and Van Kampen Investments Inc.; Director and President, AIM GP Canada Inc. (general partner for limited partnerships); and Van Kampen Advisors, Inc.; Director and Chief Executive Officer, Invesco Trimark Dealer Inc. (registered broker dealer); Director, Invesco Distributors, Inc. (formerly known as Invesco Aim Distributors, Inc.) (registered broker dealer); Manager, Invesco PowerShares Capital Management LLC; Director, Chief Executive Officer and President, Invesco Advisers, Inc.; Director, Chairman, Chief Executive Officer and President, Invesco Aim Capital Management, Inc.; President, Invesco Trimark Dealer Inc. and Invesco Trimark Ltd./Invesco Trimark Ltèe; Director and President, AIM Trimark Corporate Class Inc. and AIM Trimark Canada Fund Inc.; Senior Managing Director, Invesco Holding Company Limited; Trustee and Executive Vice President, Tax-Free Investments Trust; Director and Chairman, Fund Management Company (former registered broker dealer); President and Principal Executive Officer, The Invesco Funds (AIM Treasurer’s Series Trust (Invesco Treasurer’s Series Trust), Short-Term Investments Trust and Tax-Free Investments Trust only); President, AIM Trimark Global Fund Inc. and AIM Trimark Canada Fund Inc. | ||||||||
Wayne W. Whalen3 — 1939 Trustee | 2010 | Of Counsel, and prior to 2010, partner in the law firm of Skadden, Arps, Slate, Meagher & Flom LLP, legal counsel to funds in the Fund Complex | 159 | Director of the Abraham Lincoln Presidential Library Foundation | ||||
| Independent Trustees | ||||||||
| Bruce L. Crockett — 1944 Trustee and Chair | 1992 | Chairman, Crockett Technology Associates (technology consulting company) Formerly: Director, Captaris (unified messaging provider); Director, President and Chief Executive Officer COMSAT Corporation; and Chairman, Board of Governors of INTELSAT (international communications company) | 141 | ACE Limited (insurance company); and Investment Company Institute | ||||
| David C. Arch — 1945 Trustee | 2010 | Chairman and Chief Executive Officer of Blistex Inc., a consumer health care products manufacturer. | 159 | Member of the Heartland Alliance Advisory Board, a nonprofit organization serving human needs based in Chicago. Board member of the Illinois Manufacturers’ Association. Member of the Board of Visitors, Institute for the Humanities, University of Michigan | ||||
| 1 | Mr. Flanagan is considered an interested person of the Trust because he is an officer of the adviser to the Trust, and an officer and a director of Invesco Ltd., ultimate parent of the adviser to the Trust. |
| 2 | Mr. Taylor is considered an interested person of the Trust because he is an officer and a director of the adviser to, and a director of the principal underwriter of, the Trust. |
| 3 | Mr. Whalen has been deemed to be an interested person of the Trust because of his prior service as counsel to the predecessor funds of certain Invesco open-end funds and his affiliation with the law firm that served as counsel to such predecessor funds and continues to serve as counsel to the Invesco Van Kampen closed-end funds. |
T-1 Invesco Global Growth Fund
Trustees and Officers—(continued)
The address of each trustee and officer is AIM International Mutual Funds (Invesco International Mutual Funds) (the “Trust”), 11 Greenway Plaza, Suite 2500, Houston, Texas 77046-1173. The trustees serve for the life of the Trust, subject to their earlier death, incapacitation, resignation, retirement or removal as more specifically provided in the Trust’s organizational documents. Each officer serves for a one year term or until their successors are elected and qualified. Column two below includes length of time served with predecessor entities, if any.
| Number of | ||||||||
| Funds in | ||||||||
| Fund Complex | ||||||||
| Name, Year of Birth and | Trustee and/ | Principal Occupation(s) | Overseen by | Other Directorship(s) | ||||
| Position(s) Held with the Trust | or Officer Since | During Past 5 Years | Trustee | Held by Trustee | ||||
| Independent Trustees—(continued) | ||||||||
| Bob R. Baker — 1936 Trustee | 2003 | Retired Formerly: President and Chief Executive Officer, AMC Cancer Research Center; and Chairman and Chief Executive Officer, First Columbia Financial Corporation | 141 | None | ||||
| Frank S. Bayley — 1939 Trustee | 2001 | Retired Formerly: Director, Badgley Funds, Inc. (registered investment company) (2 portfolios) and Partner, law firm of Baker & McKenzie | 141 | Director and Chairman, C.D. Stimson Company (a real estate investment company) | ||||
| James T. Bunch — 1942 Trustee | 2003 | Founder, Green, Manning & Bunch Ltd. (investment banking firm) Formerly: Executive Committee, United States Golf Association; and Director, Policy Studies, Inc. and Van Gilder Insurance Corporation | 141 | Vice Chairman, Board of Governors, Western Golf Association/Evans Scholars Foundation and Director, Denver Film Society | ||||
| Rodney F. Dammeyer — 1940 Trustee | 2010 | President of CAC, LLC, a private company offering capital investment and management advisory services. Formerly: Prior to January 2004, Director of TeleTech Holdings Inc.; Prior to 2002, Director of Arris Group, Inc.; Prior to 2001, Managing Partner at Equity Group Corporate Investments. Prior to 1995, Vice Chairman of Anixter International. Prior to 1985, experience includes Senior Vice President and Chief Financial Officer of Household International, Inc, Executive Vice President and Chief Financial Officer of Northwest Industries, Inc. and Partner of Arthur Andersen & Co. | 159 | Director of Quidel Corporation and Stericycle, Inc. Prior to May 2008, Trustee of The Scripps Research Institute. Prior to February 2008, Director of Ventana Medical Systems, Inc. Prior to April 2007, Director of GATX Corporation. Prior to April 2004, Director of TheraSense, Inc. | ||||
| Albert R. Dowden — 1941 Trustee | 2000 | Director of a number of public and private business corporations, including the Boss Group, Ltd. (private investment and management); Reich & Tang Funds (5 portfolios) (registered investment company); and Homeowners of America Holding Corporation/ Homeowners of America Insurance Company (property casualty company) Formerly: Director, Continental Energy Services, LLC (oil and gas pipeline service); Director, CompuDyne Corporation (provider of product and services to the public security market) and Director, Annuity and Life Re (Holdings), Ltd. (reinsurance company); Director, President and Chief Executive Officer, Volvo Group North America, Inc.; Senior Vice President, AB Volvo; Director of various public and private corporations; Chairman, DHJ Media, Inc.; Director Magellan Insurance Company; and Director, The Hertz Corporation, Genmar Corporation (boat manufacturer), National Media Corporation; Advisory Board of Rotary Power International (designer, manufacturer, and seller of rotary power engines); and Chairman, Cortland Trust, Inc. (registered investment company) | 141 | Board of Nature’s Sunshine Products, Inc. | ||||
| Jack M. Fields — 1952 Trustee | 1997 | Chief Executive Officer, Twenty First Century Group, Inc. (government affairs company); and Owner and Chief Executive Officer, Dos Angelos Ranch, L.P. (cattle, hunting, corporate entertainment), Discovery Global Education Fund (non-profit) and Cross Timbers Quail Research Ranch (non-profit) Formerly: Chief Executive Officer, Texana Timber LP (sustainable forestry company) and member of the U.S. House of Representatives | 141 | Administaff | ||||
| Carl Frischling — 1937 Trustee | 1991 | Partner, law firm of Kramer Levin Naftalis and Frankel LLP | 141 | Director, Reich & Tang Funds (6 portfolios) | ||||
| Prema Mathai-Davis — 1950 Trustee | 1998 | Retired Formerly: Chief Executive Officer, YWCA of the U.S.A. | 141 | None | ||||
| Larry Soll — 1942 Trustee | 2003 | Retired Formerly, Chairman, Chief Executive Officer and President, Synergen Corp. (a biotechnology company) | 141 | None | ||||
| Hugo F. Sonnenschein — 1940 Trustee | 2010 | President Emeritus and Honorary Trustee of the University of Chicago and the Adam Smith Distinguished Service Professor in the Department of Economics at the University of Chicago. Prior to July 2000, President of the University of Chicago. | 159 | Trustee of the University of Rochester and a member of its investment committee. Member of the National Academy of Sciences, the American Philosophical Society and a fellow of the American Academy of Arts and Sciences | ||||
| Raymond Stickel, Jr. — 1944 Trustee | 2005 | Retired | 141 | Director of Long Cove Club Owners’ association (home owner’s association) | ||||
| Formerly: Director, Mainstay VP Series Funds, Inc. (25 portfolios) and Partner, Deloitte & Touche | ||||||||
T-2 Invesco Global Growth Fund
Trustees and Officers—(continued)
The address of each trustee and officer is AIM International Mutual Funds (Invesco International Mutual Funds) (the “Trust”), 11 Greenway Plaza, Suite 2500, Houston, Texas 77046-1173. The trustees serve for the life of the Trust, subject to their earlier death, incapacitation, resignation, retirement or removal as more specifically provided in the Trust’s organizational documents. Each officer serves for a one year term or until their successors are elected and qualified. Column two below includes length of time served with predecessor entities, if any.
| Number of | ||||||||
| Funds in | ||||||||
| Fund Complex | ||||||||
| Name, Year of Birth and | Trustee and/ | Principal Occupation(s) | Overseen by | Other Directorship(s) | ||||
| Position(s) Held with the Trust | or Officer Since | During Past 5 Years | Trustee | Held by Trustee | ||||
| Other Officers | ||||||||
| Russell C. Burk — 1958 Senior Vice President and Senior Officer | 2005 | Senior Vice President and Senior Officer of Invesco Funds | N/A | N/A | ||||
| John M. Zerr — 1962 Senior Vice President, Chief Legal Officer and Secretary | 2006 | Director, Senior Vice President, Secretary and General Counsel, Invesco Management Group, Inc. (formerly known as Invesco Aim Management Group, Inc.) and Van Kampen Exchange Corp.; Senior Vice President, Invesco Advisers, Inc. (formerly known as Invesco Institutional (N.A.), Inc.) (registered investment adviser); Senior Vice President and Secretary, Invesco Distributors, Inc. (formerly known as Invesco Aim Distributors, Inc.); Director, Vice President and Secretary, Invesco Investment Services, Inc. (formerly known as Invesco Aim Investment Services, Inc.) and IVZ Distributors, Inc. (formerly known as INVESCO Distributors, Inc.); Director and Vice President, INVESCO Funds Group, Inc.; Senior Vice President, Chief Legal Officer and Secretary, The Invesco Funds; Manager, Invesco PowerShares Capital Management LLC; Director, Secretary and General Counsel, Invesco Investment Advisers LLC (formerly known as Van Kampen Asset Management); Secretary and General Counsel, Van Kampen Funds Inc. and Chief Legal Officer, PowerShares Exchange-Traded Fund Trust, PowerShares Exchange-Traded Fund Trust II, PowerShares India Exchange-Traded Fund Trust and PowerShares Actively Managed Exchange-Traded Fund Trust Formerly: Director and Secretary, Van Kampen Advisors Inc.; Director Vice President, Secretary and General Counsel Van Kampen Investor Services Inc.; Director, Invesco Distributors, Inc. (formerly known as Invesco Aim Distributors, Inc.); Director, Senior Vice President, General Counsel and Secretary, Invesco Advisers, Inc.; and Van Kampen Investments Inc.; Director, Vice President and Secretary, Fund Management Company; Director, Senior Vice President, Secretary, General Counsel and Vice President, Invesco Aim Capital Management, Inc.; Chief Operating Officer and General Counsel, Liberty Ridge Capital, Inc. (an investment adviser); Vice President and Secretary, PBHG Funds (an investment company) and PBHG Insurance Series Fund (an investment company); Chief Operating Officer, General Counsel and Secretary, Old Mutual Investment Partners (a broker-dealer); General Counsel and Secretary, Old Mutual Fund Services (an administrator) and Old Mutual Shareholder Services (a shareholder servicing center); Executive Vice President, General Counsel and Secretary, Old Mutual Capital, Inc. (an investment adviser); and Vice President and Secretary, Old Mutual Advisors Funds (an investment company) | N/A | N/A | ||||
| Lisa O. Brinkley — 1959 Vice President | 2004 | Global Compliance Director, Invesco Ltd.; Chief Compliance Officer, Invesco Investment Services, Inc.(formerly known as Invesco Aim Investment Services, Inc.); and Vice President, The Invesco Funds Formerly: Chief Compliance Officer, Invesco Distributors, Inc. (formerly known as Invesco Aim Distributors, Inc.) and Van Kampen Investor Services Inc.; Senior Vice President, Invesco Management Group, Inc.; Senior Vice President and Chief Compliance Officer, Invesco Advisers, Inc. and The Invesco Funds; Vice President and Chief Compliance Officer, Invesco Aim Capital Management, Inc. and Invesco Distributors, Inc.; Vice President, Invesco Investment Services, Inc. and Fund Management Company | N/A | N/A | ||||
| Sheri Morris — 1964 Vice President, Treasurer and Principal Financial Officer | 1999 | Vice President, Treasurer and Principal Financial Officer, The Invesco Funds; and Vice President, Invesco Advisers, Inc. (formerly known as Invesco Institutional (N.A.), Inc.) (registered investment adviser). | N/A | N/A | ||||
| Formerly: Treasurer, PowerShares Exchange-Traded Fund Trust, PowerShares Exchange-Traded Fund Trust II, PowerShares India Exchange-Traded Fund Trust and PowerShares Actively Managed Exchange-Traded Fund Trust; Vice President, Invesco Advisers, Inc., Invesco Aim Capital Management, Inc. and Invesco Aim Private Asset Management, Inc.; Assistant Vice President and Assistant Treasurer, The Invesco Funds and Assistant Vice President, Invesco Advisers, Inc., Invesco Aim Capital Management, Inc. and Invesco Aim Private Asset Management, Inc. | ||||||||
T-3 Invesco Global Growth Fund
Trustees and Officers—(continued)
The address of each trustee and officer is AIM International Mutual Funds (Invesco International Mutual Funds) (the “Trust”), 11 Greenway Plaza, Suite 2500, Houston, Texas 77046-1173. The trustees serve for the life of the Trust, subject to their earlier death, incapacitation, resignation, retirement or removal as more specifically provided in the Trust’s organizational documents. Each officer serves for a one year term or until their successors are elected and qualified. Column two below includes length of time served with predecessor entities, if any.
| Number of | ||||||||
| Funds in | ||||||||
| Fund Complex | ||||||||
| Name, Year of Birth and | Trustee and/ | Principal Occupation(s) | Overseen by | Other Directorship(s) | ||||
| Position(s) Held with the Trust | or Officer Since | During Past 5 Years | Trustee | Held by Trustee | ||||
| Other Officers—(continued) | ||||||||
| Karen Dunn Kelley — 1960 Vice President | 2004 | Head of Invesco’s World Wide Fixed Income and Cash Management Group; Senior Vice President, Invesco Advisers, Inc. (formerly known as Invesco Institutional (N.A.), Inc.) (registered investment adviser); Executive Vice President, Invesco Distributors, Inc. (formerly known as Invesco Aim Distributors, Inc.); Senior Vice President, Invesco Management Group, Inc. (formerly known as Invesco Aim Management Group, Inc.); and Director, Invesco Mortgage Capital Inc.; Vice President, The Invesco Funds (other than AIM Treasurer’s Series Trust (Invesco Treasurer’s Series Trust) and Short-Term Investments Trust); President and Principal Executive Officer, The Invesco Funds (AIM Treasurer’s Series Trust (Invesco Treasurer’s Series Trust) and Short-Term Investments Trust only). Formerly: Senior Vice President, Van Kampen Investments Inc.; Vice President, Invesco Advisers, Inc. (formerly known as Invesco Institutional (N.A.), Inc.); Director of Cash Management and Senior Vice President, Invesco Advisers, Inc. and Invesco Aim Capital Management, Inc.; President and Principal Executive Officer, Tax-Free Investments Trust; Director and President, Fund Management Company; Chief Cash Management Officer, Director of Cash Management, Senior Vice President, and Managing Director, Invesco Aim Capital Management, Inc.; Director of Cash Management, Senior Vice President, and Vice President, Invesco Advisers, Inc. and The Invesco Funds (AIM Treasurer’s Series Trust (Invesco Treasurer’s Series Trust), Short-Term Investments Trust and Tax-Free Investments Trust only) | N/A | N/A | ||||
| Lance A. Rejsek — 1967 Anti-Money Laundering Compliance Officer | 2005 | Anti-Money Laundering Compliance Officer, Invesco Advisers, Inc. (formerly known as Invesco Institutional (N.A.), Inc.) (registered investment adviser); Invesco Distributors, Inc. (formerly known as Invesco Aim Distributors, Inc.), Invesco Investment Services, Inc. (formerly known as Invesco Aim Investment Services, Inc.), The Invesco Funds, PowerShares Exchange-Traded Fund Trust, PowerShares Exchange-Traded Fund Trust II, PowerShares India Exchange-Traded Fund Trust, PowerShares Actively Managed Exchange-Traded Fund Trust, Invesco Investment Advisers LLC (formerly known as Van Kampen Asset Management) and Van Kampen Funds Inc. Formerly: Anti-Money Laundering Compliance Officer, Van Kampen Investor Services Inc., Fund Management Company, Invesco Advisers, Inc., Invesco Aim Capital Management, Inc. and Invesco Aim Private Asset Management, Inc. | N/A | N/A | ||||
| Todd L. Spillane — 1958 Chief Compliance Officer | 2006 | Senior Vice President, Invesco Management Group, Inc. (formerly known as Invesco Aim Management Group, Inc.) and Van Kampen Exchange Corp.; Senior Vice President and Chief Compliance Officer, Invesco Advisers, Inc. (registered investment adviser) (formerly known as Invesco Institutional (N.A.), Inc.); Chief Compliance Officer, The Invesco Funds, PowerShares Exchange-Traded Fund Trust, PowerShares Exchange-Traded Fund Trust II, PowerShares India Exchange-Traded Fund Trust, PowerShares Actively Managed Exchange-Traded Fund Trust, INVESCO Private Capital Investments, Inc. (holding company) and Invesco Private Capital, Inc. (registered investment adviser); Vice President, Invesco Distributors, Inc. (formerly known as Invesco Aim Distributors, Inc.) and Invesco Investment Services, Inc. (formerly known as Invesco Aim Investment Services, Inc.). | N/A | N/A | ||||
| Formerly: Chief Compliance Officer, Invesco Van Kampen Closed-End Funds; Senior Vice President, Van Kampen Investments Inc.; Senior Vice President and Chief Compliance Officer, Invesco Advisers, Inc. and Invesco Aim Capital Management, Inc.; Chief Compliance Officer, Invesco Global Asset Management (N.A.), Inc., Invesco Senior Secured Management, Inc. (registered investment adviser) and Van Kampen Investor Services Inc.; Vice President, Invesco Aim Capital Management, Inc. and Fund Management Company | ||||||||
The Statement of Additional Information of the Trust includes additional information about the Fund’s Trustees and is available upon request, without charge, by calling 1.800.959.4246. Please refer to the Fund’s prospectus for information on the Fund’s sub-advisers.
| Office of the Fund 11 Greenway Plaza, Suite 2500 Houston, TX 77046-1173 | Investment Adviser Invesco Advisers, Inc. 1555 Peachtree Street, N.E. Atlanta, GA 30309 | Distributor Invesco Distributors, Inc. 11 Greenway Plaza, Suite 2500 Houston, TX 77046-1173 | Auditors PricewaterhouseCoopers LLP 1201 Louisiana Street, Suite 2900 Houston, TX 77002-5678 | |||
| Counsel to the Fund Stradley Ronon Stevens & Young, LLP 2600 One Commerce Square Philadelphia, PA 19103 | Counsel to the Independent Trustees Kramer, Levin, Naftalis & Frankel LLP 1177 Avenue of the Americas New York, NY 10036-2714 | Transfer Agent Invesco Investment Services, Inc. 11 Greenway Plaza, Suite 2500 Houston, TX 77046-1173 | Custodian State Street Bank and Trust Company 225 Franklin Boston, MA 02110-2801 |
T-4 Invesco Global Growth Fund

Invesco mailing information
Send general correspondence to Invesco Investment Services, Inc., P.O. Box 219078, Kansas City, MO 64121-9078.
Invesco privacy policy
You share personal and financial information with us that is necessary for your transactions and your account records. We take very seriously the obligation to keep that information confidential and private.
Invesco collects nonpublic personal information about you from account applications or other forms you complete and from your transactions with us or our affiliates. We do not disclose information about you or our former customers to service providers or other third parties except to the extent necessary to service your account and in other limited circumstances as permitted by law. For example, we use this information to facilitate the delivery of transaction confirmations, financial reports, prospectuses and tax forms.
Even within Invesco, only people involved in the servicing of your accounts and compliance monitoring have access to your information. To ensure the highest level of confidentiality and security, Invesco maintains physical, electronic and procedural safeguards that meet or exceed federal standards. Special measures, such as data encryption and authentication, apply to your communications with us on our website. More detail is available to you at invesco.com/privacy.
Important notice regarding delivery of security holder documents
To reduce Fund expenses, only one copy of most shareholder documents may be mailed to shareholders with multiple accounts at the same address (Householding). Mailing of your shareholder documents may be householded indefinitely unless you instruct us otherwise. If you do not want the mailing of these documents to be combined with those for other members of your household, please contact Invesco Investment Services, Inc. at 800 959 4246 or contact your financial institution. We will begin sending you individual copies for each account within 30 days after receiving your request.
Fund holdings and proxy voting information
The Fund provides a complete list of its holdings four times in each fiscal year, at the quarter-ends. For the second and fourth quarters, the lists appear in the Fund’s semiannual and annual reports to shareholders. For the first and third quarters, the Fund files the lists with the Securities and Exchange Commission (SEC) on Form N-Q. The most recent list of portfolio holdings is available at invesco.com/completeqtrholdings. Shareholders can also look up the Fund’s Forms N-Q on the SEC website at sec.gov. Copies of the Fund’s Forms N-Q may be reviewed and copied at the SEC Public Reference Room in Washington, D.C. You can obtain information on the operation of the Public Reference Room, including information about duplicating fee charges, by calling 202 551 8090 or 800 732 0330, or by electronic request at the following email address: publicinfo@sec.gov. The SEC file numbers for the Fund are 811-06463 and 033-44611.
A description of the policies and procedures that the Fund uses to determine how to vote proxies relating to portfolio securities is available without charge, upon request, from our Client Services department at 800 959 4246 or at invesco.com/proxyguidelines. The information is also available on the SEC website, sec.gov.

Information regarding how the Fund voted proxies related to its portfolio securities during the 12 months ended June 30, 2011, is available at invesco.com/proxysearch. The information is also available on the SEC website, sec.gov.
Invesco Advisers, Inc. is an investment adviser; it provides investment advisory services to individual and institutional clients and does not sell securities. Invesco Distributors, Inc. is the U.S. distributor for Invesco Ltd.’s retail mutual funds, exchange-traded funds and institutional money market funds. Both are wholly owned, indirect subsidiaries of Invesco Ltd.
GLG-AR-1 Invesco Distributors, Inc.
 |
| Annual Report to Shareholders | October 31, 2011 |
Invesco Global Small & Mid Cap Growth Fund
Nasdaq:
A: AGAAX § B: AGABX § C: AGACX § Y: AGAYX § Institutional: GAIIX
| 2 | Letters to Shareholders | |
| 4 | Performance Summary | |
| 4 | Management Discussion | |
| 6 | Long-Term Fund Performance | |
| 8 | Supplemental Information | |
| 9 | Schedule of Investments | |
| 11 | Financial Statements | |
| 13 | Notes to Financial Statements | |
| 20 | Financial Highlights | |
| 21 | Auditor’s Report | |
| 22 | Fund Expenses | |
| 23 | Approval of Investment Advisory and Sub-Advisory Agreements | |
| 25 | Tax Information | |
| T-1 | Trustees and Officers | |
Letters to Shareholders

Philip Taylor
Dear Shareholders:
Enclosed is important information about your Fund and its performance. I encourage you to read this report to learn more about your Fund’s short- and long-term performance and its holdings as of the close of the reporting period. This report also includes useful information about your Fund’s management team and a discussion of how your Fund was managed during the reporting period.
Investors are likely to confront both opportunities and challenges in 2012 – just as we did in 2011. After all, changes in market sentiment never do investors the courtesy of announcing their impending arrival, and your goals and needs may have changed, requiring changes in your financial strategy.
That’s why the start of a new year is always a good time to catch up with your financial adviser.
He or she can explain how your investments performed in the year just ended – how each performed individually, and more important, how they performed as a diversified portfolio. Of course, it’s important to remember that an investment’s long-term performance is more important than its short-term performance. Looking ahead to the new year and evaluating your individual situation, your financial adviser can provide valuable insight into whether your investments are still appropriate for your individual needs, goals and risk tolerance.
For current information about your Fund
In addition to meeting with your financial adviser to discuss your individual situation at the start of the new year, you also may find it helpful to stay abreast of market trends and developments. Doing so may provide reassurance in times of economic uncertainty and market volatility such as we saw in 2011 – and are likely to see again in 2012.
Invesco can help you stay informed about your investments and market trends. On our website, invesco.com/us, we provide timely market updates and commentary from many of our fund managers and other investment professionals. Also on our website, you can obtain information about your account at any hour of the day or night. I invite you to visit and explore the tools and information we offer at invesco.com/us.
Our commitment to investment excellence
As we’ve seen over the last several years, market conditions can change – often suddenly and dramatically. That’s one reason financial advisers typically advise their clients to be well diversified and to maintain a long-term investment focus. While diversification can’t guarantee a profit or protect against loss, it may cushion the impact of dramatic market moves. Maintaining a long-term investment focus for your long-term goals – financing your retirement or your children’s education, for example – may help you avoid making rash investment decisions based on short-term market swings.
Likewise, Invesco’s investment professionals maintain a long-term focus. Across our broad array of investment products, investment excellence is our ultimate goal. Each of our funds is managed by specialized teams of investment professionals, and as a company, we maintain a single focus – investment management – that allows our fund managers to concentrate on doing what they do best: managing your money.
Our funds are managed strictly according to their stated investment objectives and strategies, with robust risk oversight using consistent, repeatable investment processes that don’t change in response to short-term market events. This disciplined approach can’t guarantee a profit; no investment can do that, since all involve some measure of risk. But it can ensure that your money is managed the way we said it would be – according to your Fund’s objective and strategies.
Our adherence to stated investment objectives and strategies allows your financial adviser to build a diversified portfolio that meets your individual risk tolerance and financial goals. It also means that when your goals change, your financial adviser will be able to find an Invesco fund that’s appropriate for your needs.
Questions?
If you have questions about your account, please contact one of our client service representatives at 800 959 4246. If you have a general Invesco-related question or comment for me, I invite you to email me directly at phil@invesco.com.
All of us at Invesco look forward to serving your investment management needs for many years to come. Thank you for investing with us.
Sincerely,

Philip Taylor
Senior Managing Director, Invesco Ltd.
Senior Managing Director, Invesco Ltd.
| 2 | Invesco Global Small & Mid Cap Growth Fund |

Bruce Crockett
Dear Fellow Shareholders:
Although the world’s economies are gradually recovering from the financial crisis, it has not been a smooth path. Unrest in the Middle East, persistently weak job and housing markets in the U.S. and continued government balance sheet repair in Europe are contributing to a slow, labored march toward global recovery.
In this environment, investors face risks that could make it more difficult to achieve their long-term financial goals – a secure retirement, home ownership, a child’s college education. Although the markets are complex and dynamic, there are ways to simplify the process and potentially increase your odds of achieving your goals. The best approach is to create a solid financial plan that helps you save and invest in ways that anticipate your needs over the long term.
Your financial adviser can help you define your financial plan, develop an appropriate investment strategy and put you in a better position to achieve your financial goals over the long term. This can take some of the guesswork out of the process and help you make thoughtful investments. Your financial adviser also can help you better understand your tolerance for risk, so that your investment approach lets you sleep at night while getting you closer to your goals. Lastly, your financial adviser can develop an asset allocation strategy that seeks to balance your investment approach, providing some protection against a decline in the markets while allowing you to participate in rising markets. Invesco calls this type of approach “intentional investing.” It means thinking carefully, planning thoughtfully and acting deliberately.
While no investment can guarantee favorable returns, your Board remains committed to managing costs and enhancing the performance of Invesco’s funds as part of our Investor First orientation. We continue to oversee the funds with the same strong sense of responsibility for your money and your continued trust that we’ve always maintained.
Thanks to the approval of our fund shareholders, Invesco has made great progress in realigning our U.S. mutual fund product line following our acquisition of Morgan Stanley’s retail asset management business, including Van Kampen Investments. When completed, the realignment will reduce overlap in the product lineup, enhance efficiency across our product line and build a solid foundation for further growth to meet client and shareholder needs. I would like to thank those of you who voted your proxy, and I hope our shareholders haven’t been too inconvenienced by the process.
As always, please contact me at bruce@brucecrockett.com with any questions or concerns you may have. On behalf of your Board, we look forward to continuing to represent your interests and serving your needs.
Sincerely,

Bruce L. Crockett
Independent Chair
Invesco Funds Board of Trustees
Independent Chair
Invesco Funds Board of Trustees
| 3 | Invesco Global Small & Mid Cap Growth Fund |
Management’s Discussion of Fund Performance
Performance summary
Global equity markets faced headwinds in 2010 and 2011. China’s growth continued to slow as the U.S. battled high unemployment and runaway deficits. Several European countries faced similar deficits, which brought to light the imperfect structure of the euro. The reporting period ended with a market upswing, however, as European leaders took steps to address the Greek sovereign debt issue, expand the bailout fund and stabilize the banking system.
Invesco Global Small & Mid Cap Growth Fund delivered negative returns for the fiscal year ended October 31, 2011. Although relatively in line with its peers, as represented by the Lipper Global Small/Mid-Cap Funds Category Average, the Fund significantly lagged its style-specific benchmark, the MSCI World Growth Index. The Fund’s underweight position to a strong U.S. equity market was a key detractor from performance during this period.
Your Fund’s long-term performance appears later in this report.
Fund vs. Indexes
Total returns, 10/31/10 to 10/31/11, at net asset value (NAV). Performance shown does not include applicable contingent deferred sales charges (CDSC) or front-end sales charges, which would have reduced performance.
| Class A Shares | -3.05 | % | ||
| Class B Shares | -3.73 | |||
| Class C Shares | -3.79 | |||
| Class Y Shares | -2.81 | |||
| Institutional Class Shares | -2.57 | |||
MSCI World Index▼ (Broad Market Index) | 1.76 | |||
MSCI World Growth Index▼ (Style-Specific Index) | 3.09 | |||
Lipper Global Small/Mid-Cap Funds Category Average▼ (Peer Group) | -2.93 | |||
| Source(s):▼Lipper Inc. | ||
How we invest
When selecting stocks for your Fund, we use a disciplined investment strategy that emphasizes fundamental research, supported by both quantitative analysis and portfolio construction techniques. Our EQV (earnings, quality, valuation) strategy focuses primarily on identifying quality companies that have experienced, or exhibit the potential for, accelerated or above-average earnings growth, but whose stock prices have not fully reflected these attributes.
While research responsibilities within the portfolio management team are focused by geographic region, we select
investments for the Fund using a bottom-up investment approach, which means we construct the Fund primarily on a stock-by-stock basis. We focus on the strengths of individual companies rather than sectors, countries or market-cap trends.
We believe disciplined sell decisions are key to successful investing. We consider selling a stock for one of the following reasons:
| n | A company’s fundamentals deteriorate, or it posts disappointing earnings. | |
| n | A stock’s price seems overvalued. | |
| n | A more attractive opportunity becomes available. |
Market conditions and your Fund
Market volatility was intense during the reporting period. During mid-2011, Greek sovereign debt concerns and signs of slowing global growth continued to worry investors. In addition, numerous world events caught investors’ attention, including the growing unrest in the Middle East and northern Africa, and the devastating earthquake and tsunami in Japan on March 11. Although markets stabilized and were generally positive through the summer, major equity indexes sold off precipitously in August as the U.S. struggled with its debt ceiling and ultimately received the first-ever downgrade to its credit rating from Standard & Poor’s.
In emerging market countries, investors grew risk-averse on news of potential defaults in Europe as well as slowing growth and accounting concerns in China, leading to a relatively indiscriminate correction in almost all emerging market countries. Concerns about potential overheating in emerging market economies and potential double-dip recession in developed economies continued to foster uncertainty about the pace and vigor of a global economic recovery.
In this environment, we continued to construct the Fund’s portfolio with a long-term view and a bottom-up approach (i.e., selecting stocks on an individual basis). From a sector perspective, favorable stock selection in the information technology sector was the largest contributor to both relative and absolute results. Fund holdings in the Internet software & services industry were particularly strong.
NHN, South Korea’s premier Internet company and operator of its most popular search portal, was among the top individual contributors to Fund perfor-
Portfolio Composition
By sector
| Consumer Discretionary | 19.3 | % | ||
| Financials | 17.2 | |||
| Information Technology | 14.4 | |||
| Industrials | 13.5 | |||
| Energy | 6.9 | |||
| Health Care | 5.7 | |||
| Materials | 5.3 | |||
| Consumer Staples | 4.2 | |||
| Utilities | 4.2 | |||
| Telecommunication Services | 2.2 | |||
Money Market Funds | ||||
Plus Other Assets Less Liabilities | 7.1 | |||
Top 10 Equity Holdings*
| 1. | Ayala Corp. | 3.9 | % | |||||
| 2. | Cielo S.A. | 2.8 | ||||||
| 3. | EXEDY Corp. | 2.3 | ||||||
| 4. | IG Group Holdings PLC | 2.1 | ||||||
| 5. | Siam Commercial Bank PCL | 2.0 | ||||||
| 6. | Homeserve PLC | 2.0 | ||||||
| 7. | Aryzta A.G. | 1.8 | ||||||
| 8. | DCC PLC | 1.7 | ||||||
| 9. | Onex Corp. | 1.7 | ||||||
| 10. | Naspers Ltd.-Class N | 1.7 | ||||||
Top Five Industries*
| 1. United States | 26.5 | % | ||
| 2. United Kingdom | 17.9 | |||
| 3. Canada | 8.9 | |||
| 4. Brazil | 5.4 | |||
| 5. Philippines | 5.2 | |||
| Total Net Assets | $585.8 million | |
| Total Number of Holdings* | 103 |
The Fund’s holdings are subject to change, and there is no assurance that the Fund will continue to hold any particular security.
*Excluding money market fund holdings.
| 4 | Invesco Global Small & Mid Cap Growth Fund |
mance over the reporting period. NHN continued to benefit from the proliferation of smartphone usage, which in turn drove search advertising on mobile devices.
In the energy sector, double-digit gains were supported by Fund holdings in the oil, gas & consumable fuels industry. Top stock-level performers in the sector included Continental Resources and Paramount Resources. We sold our position in Continental Resources during the reporting period and deployed capital into select new opportunities.
As noted earlier, however, the Fund lagged the MSCI World Growth Index over the reporting period. From a sector perspective, underperformance was driven predominantly by Fund holdings in the consumer discretionary, industrials and consumer staples sectors. The Fund’s European-based holdings across the hotels, restaurants & leisure, media, and commercial services & supplies industries were particularly weak. Intralot and Homeserve were among the largest stock-level detractors over the period. We sold our position in Intralot during the reporting period.
From a geographic perspective, our exposure to the U.S. was the single largest detractor from relative performance. Although the Fund delivered positive returns in this market, a significant underweight position versus the index negatively affected relative results.
During the reporting period, emerging markets underperformed developed markets due to multiple macroeconomic headwinds, including the European debt crisis, a deteriorating global economy, rising inflation and tightening monetary policies. The Fund’s exposure to emerging markets detracted from both absolute and relative performance as the index did not have exposure to this segment of the market. Similarly, the Fund’s bias toward small- and mid-cap stocks, segments of the market that suffered more than their large-cap peers during the period, detracted from relative results. The MSCI World Growth Index is predominantly large-cap focused.
As long-term, bottom-up stock selectors, we see volatility as an opportunity to buy quality growth companies at more attractive valuations than usual; consequently, we took advantage of market volatility to buy several stocks that had long been on our EQV radar.
On March 22, 2011, James Leach joined the Fund’s management team as lead portfolio manager with respect to the Fund’s U.S. allocation, and Paul Rasplicka left the team. A complete list of your Fund’s managers appears at right.
In closing, volatile markets can test an investor’s resolve, but it’s worth noting that real investment opportunity can present itself when the markets are turbulent. We thank you for your continued investment in Invesco Global Small & Mid Cap Growth Fund.
The views and opinions expressed in management’s discussion of Fund performance are those of Invesco Advisers, Inc. These views and opinions are subject to change at any time based on factors such as market and economic conditions. These views and opinions may not be relied upon as investment advice or recommendations, or as an offer for a particular security. The information is not a complete analysis of every aspect of any market, country, industry, security or the Fund. Statements of fact are from sources considered reliable, but Invesco Advisers, Inc. makes no representation or warranty as to their completeness or accuracy. Although historical performance is no guarantee of future results, these insights may help you understand our investment management philosophy.
See important Fund and, if applicable, index disclosures later in this report.

Shuxin Cao
Chartered Financial Analyst, portfolio manager, is lead manager of Invesco Global Small & Mid Cap Growth Fund with respect to the Fund’s investments in Asia Pacific and Latin America. He joined Invesco in 1997. Mr. Cao earned a B.A. in English from the Tianjin Foreign Language Institute and an M.B.A. from Texas A&M University. He is also a Certified Public Accountant.

Jason Holzer
Chartered Financial Analyst, portfolio manager, is lead manager of Invesco Global Small & Mid Cap Growth Fund with respect to the Fund’s investments in Europe and Canada. He joined Invesco in 1996. Mr. Holzer earned a B.A. in quantitative economics and an M.S. in engineering economic systems from Stanford University.

James Leach
Chartered Financial Analyst, portfolio manager, is lead manager of Invesco Global Small & Mid Cap Growth Fund with respect to the domestic portion of the Fund’s portfolio. He joined Invesco in 2011. Mr. Leach earned a B.S. in mechanical engineering from the University of California and an M.B.A. from the Stern School of Business at New York University.

Borge Endresen
Chartered Financial Analyst, portfolio manager, is manager of Invesco Global Small & Mid Cap Growth Fund. He joined Invesco in 1999. Mr. Endresen earned a B.S. in finance from the University of Oregon and an M.B.A. from The University of Texas at Austin.
| 5 | Invesco Global Small & Mid Cap Growth Fund |
Your Fund’s Long-Term Performance
Results of a $10,000 Investment — Oldest Share Classes since Inception
Index data from 8/31/94, Fund data from 9/15/94
Past performance cannot guarantee comparable future results.
The data shown in the chart include reinvested distributions, applicable sales charges and Fund expenses including management fees. Results for Class B shares are calculated as if a hypothetical shareholder had liquidated his entire investment in the Fund at the close of the reporting period and paid the contingent deferred sales charges, if applicable. Index results include reinvested dividends, but they do not reflect sales
charges. Performance of the peer group, if applicable, reflects fund expenses and management fees; performance of a market index does not. Performance shown in the chart and table(s) does not reflect deduction of taxes a shareholder would pay on Fund distributions or sale of Fund shares.
This chart, which is a logarithmic chart, presents the fluctuations in the value of the Fund and its indexes. We believe that a logarithmic chart is more effective than other types of charts in illustrating
changes in value during the early years shown in the chart. The vertical axis, the one that indicates the dollar value of an investment, is constructed with each segment representing a percent change in the value of the investment. In this chart, each segment represents a doubling, or 100% change, in the value of the investment. In other words, the space between $5,000 and $10,000 is the same size as the space between $10,000 and $20,000, and so on.
| 6 | Invesco Global Small & Mid Cap Growth Fund |
| Average Annual Total Returns | ||||
| As of 10/31/11, including maximum applicable sales charges | ||||
Class A Shares | ||||
| Inception (9/15/94) | 7.61 | % | ||
| 10 Years | 7.69 | |||
| 5 Years | 0.06 | |||
| 1 Year | -8.38 | |||
Class B Shares | ||||
| Inception (9/15/94) | 7.69 | % | ||
| 10 Years | 7.75 | |||
| 5 Years | 0.18 | |||
| 1 Year | -8.54 | |||
Class C Shares | ||||
| Inception (8/4/97) | 4.27 | % | ||
| 10 Years | 7.58 | |||
| 5 Years | 0.46 | |||
| 1 Year | -4.75 | |||
Class Y Shares | ||||
| 10 Years | 8.39 | % | ||
| 5 Years | 1.37 | |||
| 1 Year | -2.81 | |||
Institutional Class Shares | ||||
| 10 Years | 8.56 | % | ||
| 5 Years | 1.68 | |||
| 1 Year | -2.57 | |||
Class Y shares incepted on October 3, 2008. Performance shown prior to that date is that of Class A shares and includes the 12b-1 fees applicable to Class A shares. Class A share performance reflects any applicable fee waivers or expense reimbursements.
Institutional Class shares incepted on September 28, 2007. Performance shown prior to that date is that of Class A shares and includes the 12b-1 fees applicable to Class A shares. Class A share performance reflects any applicable fee waivers or expense reimbursements.
The performance data quoted represent past performance and cannot guarantee comparable future results; current performance may be lower or higher. Please visit invesco.com/performance for the most recent month-end performance. Performance figures reflect reinvested distributions, changes in net asset value and the effect of the maximum sales charge unless otherwise stated. Investment return and principal value will fluctuate so that you may have a gain or loss when you sell shares.
| Average Annual Total Returns | ||||
| As of 9/30/11, the most recent calendar quarter-end, including maximum applicable sales charges | ||||
Class A Shares | ||||
| Inception (9/15/94) | 7.09 | % | ||
| 10 Years | 7.23 | |||
| 5 Years | -0.82 | |||
| 1 Year | -13.56 | |||
Class B Shares | ||||
| Inception (9/15/94) | 7.17 | % | ||
| 10 Years | 7.29 | |||
| 5 Years | -0.71 | |||
| 1 Year | -13.74 | |||
Class C Shares | ||||
| Inception (8/4/97) | 3.64 | % | ||
| 10 Years | 7.12 | |||
| 5 Years | -0.43 | |||
| 1 Year | -10.11 | |||
Class Y Shares | ||||
| 10 Years | 7.92 | % | ||
| 5 Years | 0.47 | |||
| 1 Year | -8.33 | |||
Institutional Class Shares | ||||
| 10 Years | 8.09 | % | ||
| 5 Years | 0.78 | |||
| 1 Year | -8.06 | |||
The total annual Fund operating expense ratio set forth in the most recent Fund prospectus as of the date of this report for Class A, Class B, Class C, Class Y and Institutional Class shares was 1.46%, 2.21%, 2.21%, 1.21% and 0.93%, respectively. The expense ratios presented above may vary from the expense ratios presented in other sections of this report that are based on expenses incurred during the period covered by this report.
Class A share performance reflects the maximum 5.50% sales charge, and Class B and Class C share performance reflects the applicable contingent deferred sales charge (CDSC) for the period involved. The CDSC on Class B shares declines from 5% beginning at the time of purchase to 0% at the beginning of the seventh year. The CDSC on Class C shares is 1% for the first year after purchase. Class Y and Institutional Class shares do not have a front-end sales charge or a CDSC; therefore, performance is at net asset value.
The performance of the Fund’s share classes will differ primarily due to different sales charge structures and class expenses.
A redemption fee of 2% is imposed on certain redemptions or exchanges out of the Fund within 31 days of purchase. Exceptions to the redemption fee are listed in the Fund’s prospectus. Effective January 1, 2012, after the close of the reporting period, the Fund will eliminate the redemption fee, if applicable, assessed on shares of the Fund redeemed or exchanged within 31 days of purchase.
| 7 | Invesco Global Small & Mid Cap Growth Fund |
Invesco Global Small & Mid Cap Growth Fund’s investment objective is long-term growth of capital.
| n | Unless otherwise stated, information presented in this report is as of October 31, 2011, and is based on total net assets. | |
| n | Unless otherwise noted, all data provided by Invesco. | |
| n | To access your Fund’s reports/prospectus, visit invesco.com/fundreports. |
About share classes
| n | Class B shares may not be purchased or acquired by exchange from share classes other than Class B shares. Please see the prospectus for more information. | |
| n | Class Y shares are available to only certain investors. Please see the prospectus for more information. | |
| n | Institutional Class shares are offered exclusively to institutional investors, including defined contribution plans that meet certain criteria. Please see the prospectus for more information. |
Principal risks of investing in the Fund
| n | Developing markets securities risk. Securities issued by foreign companies and governments located in developing countries may be affected more negatively by inflation, devaluation of their currencies, higher transaction costs, delays in settlement, adverse political developments, the introduction of capital controls, withholding taxes, nationalization of private assets, expropriation, social unrest, war or lack of timely information than those in developed countries. | |
| n | Foreign securities risk. The Fund’s foreign investments may be affected by changes in a foreign country’s exchange rates; political and social instability; changes in economic or taxation policies; difficulties when enforcing obligations; decreased liquidity; and increased volatility. Foreign companies may be subject to less regulation resulting in less publicly available information about the companies. | |
| n | Growth investing risk. Growth stocks tend to be more expensive relative to their earnings or assets compared with other types of stock. As a result they tend to be more sensitive to changes in their earnings and can be more volatile. |
| n | Management risk. The investment techniques and risk analysis used by the Fund’s portfolio managers may not produce the desired results. | |
| n | Market risk. The prices of and the income generated by the Fund’s securities may decline in response to, among other things, investor sentiment; general economic and market conditions; regional or global instability; and currency and interest rate fluctuations. | |
| n | Small- and mid-capitalization risk. Stocks of small and mid-sized companies tend to be more vulnerable to adverse developments in the above factors and may have little or no operating history or track record of success, and limited product lines, markets, management and financial resources. The securities of small and mid-sized companies may be more volatile due to less market interest and less publicly available information about the issuer. They also may be illiquid or restricted as to resale, or may trade less frequently and in smaller volumes, all of which may cause difficulty when establishing or closing a position at a desirable price. |
About indexes used in this report
| n | The MSCI World IndexSM is an unmanaged index considered representative of stocks of developed countries. |
| n | The MSCI World Growth Index is an unmanaged index considered representative of growth stocks of developed countries. | |
| n | The Lipper Global Small/Mid-Cap Funds Category Average represents an average of all of the funds in the Lipper Global Small/Mid-Cap Funds category. | |
| n | The Fund is not managed to track the performance of any particular index, including the index(es) defined here, and consequently, the performance of the Fund may deviate significantly from the performance of the index(es). |
| n | A direct investment cannot be made in an index. Unless otherwise indicated, index results include reinvested dividends, and they do not reflect sales charges. Performance of the peer group, if applicable, reflects fund expenses; performance of a market index does not. |
Other information
| n | The Chartered Financial Analyst® (CFA®) designation is globally recognized and attests to a charterholder’s success in a rigorous and comprehensive study program in the field of investment management and research analysis. |
| n | CPA® and Certified Public Accountant® are trademarks owned by the American Institute of Certified Public Accountants. |
| n | The returns shown in management’s discussion of Fund performance are based on net asset values calculated for shareholder transactions. Generally accepted accounting principles require adjustments to be made to the net assets of the Fund at period end for financial reporting purposes, and as such, the net asset values for shareholder transactions and the returns based on those net asset values may differ from the net asset values and returns reported in the Financial Highlights. |
| n | Industry classifications used in this report are generally according to the Global Industry Classification Standard, which was developed by and is the exclusive property and a service mark of MSCI Inc. and Standard & Poor’s. |
This report must be accompanied or preceded by a currently effective Fund prospectus, which contains more complete information, including sales charges and expenses. Investors should read it carefully before investing.
NOT FDIC INSURED | MAY LOSE VALUE | NO BANK GUARANTEE
Fund Nasdaq Symbols
| Class A Shares | AGAAX | |
| Class B Shares | AGABX | |
| Class C Shares | AGACX | |
| Class Y Shares | AGAYX | |
| Institutional Class Shares | GAIIX |
| 8 | Invesco Global Small & Mid Cap Growth Fund |
Schedule of Investments
October 31, 2011
| Shares | Value | |||||||
| Common Stocks & Other Equity Interests–91.79% | ||||||||
| Australia–0.59% | ||||||||
| Computershare Ltd. | 434,889 | $ | 3,437,756 | |||||
| Brazil–4.29% | ||||||||
| CETIP S.A. | 183,800 | 2,518,586 | ||||||
| Cielo S.A. | 610,613 | 16,310,774 | ||||||
| Duratex S.A. | 1,151,240 | 6,327,559 | ||||||
| 25,156,919 | ||||||||
| Canada–8.88% | ||||||||
| Astral Media, Inc.–Class A | 158,400 | 5,432,944 | ||||||
| Fairfax Financial Holdings Ltd. | 20,671 | 8,632,841 | ||||||
| MacDonald, Dettwiler and Associates Ltd. | 77,012 | 3,458,863 | ||||||
| Onex Corp. | 302,723 | 10,028,059 | ||||||
Open Text Corp.(a) | 102,645 | 6,276,808 | ||||||
Paramount Resources Ltd.–Class A(a) | 251,828 | 9,154,858 | ||||||
Precision Drilling Corp.(a) | 777,655 | 9,010,416 | ||||||
| 51,994,789 | ||||||||
| China–4.04% | ||||||||
| Anta Sports Products Ltd. | 5,871,000 | 5,256,705 | ||||||
| China Yurun Food Group Ltd. | 3,148,000 | 5,411,643 | ||||||
| Lee & Man Paper Manufacturing Ltd. | 11,015,000 | 4,466,411 | ||||||
NetEase.com Inc.–ADR(a) | 180,333 | 8,542,374 | ||||||
| 23,677,133 | ||||||||
| France–0.60% | ||||||||
| Faurecia | 133,450 | 3,515,439 | ||||||
| Germany–0.91% | ||||||||
| Deutsche Boerse A.G. | 96,354 | 5,333,001 | ||||||
| Hong Kong–0.44% | ||||||||
| Hongkong Land Holdings Ltd. | 497,000 | 2,602,939 | ||||||
| Indonesia–1.35% | ||||||||
| PT Perusahaan Gas Negara | 24,071,500 | 7,892,063 | ||||||
| Ireland–2.34% | ||||||||
| Cooper Industries PLC | 68,439 | 3,590,310 | ||||||
| DCC PLC | 366,961 | 10,141,151 | ||||||
| 13,731,461 | ||||||||
| Israel–0.46% | ||||||||
Check Point Software Technologies Ltd.(a) | 46,451 | 2,676,971 | ||||||
| Japan–3.33% | ||||||||
| EXEDY Corp. | 466,400 | 13,702,367 | ||||||
| THK Co., Ltd. | 298,500 | 5,790,710 | ||||||
| 19,493,077 | ||||||||
| Mexico–1.15% | ||||||||
| America Movil SAB de C.V.–Series L–ADR | 264,384 | 6,720,641 | ||||||
| Netherlands–1.12% | ||||||||
| LyondellBasell Industries N.V.–Class A | 76,658 | 2,518,982 | ||||||
| VimpelCom Ltd.–ADR | 370,246 | 4,065,301 | ||||||
| 6,584,283 | ||||||||
| Philippines–5.17% | ||||||||
| Ayala Corp. | 3,265,289 | 23,095,791 | ||||||
Energy Development Corp.(b) | 6,577,500 | 931,571 | ||||||
| Energy Development Corp. | 44,094,600 | 6,245,114 | ||||||
| 30,272,476 | ||||||||
| Singapore–0.63% | ||||||||
| Avago Technologies Ltd. | 108,696 | 3,670,664 | ||||||
| South Africa–2.36% | ||||||||
| AngloGold Ashanti Ltd.–ADR | 87,789 | 3,968,941 | ||||||
| Naspers Ltd.–Class N | 208,079 | 9,859,047 | ||||||
| 13,827,988 | ||||||||
| South Korea–1.53% | ||||||||
NHN Corp.(a) | 43,091 | 8,979,959 | ||||||
| Spain–0.70% | ||||||||
| Prosegur, Compania de Seguridad S.A. | 82,257 | 4,081,076 | ||||||
| Sweden–1.05% | ||||||||
| Kinnevik Investment A.B.–Class B | 294,904 | 6,147,773 | ||||||
| Switzerland–1.79% | ||||||||
| Aryzta A.G. | 217,713 | 10,502,143 | ||||||
| Thailand–1.99% | ||||||||
| Siam Commercial Bank PCL | 3,089,900 | 11,669,841 | ||||||
| Turkey–2.66% | ||||||||
| Haci Omer Sabanci Holding A.S. | 1,770,697 | 6,036,711 | ||||||
| Tupras-Turkiye Petrol Rafinerileri A.S. | 424,952 | 9,560,178 | ||||||
| 15,596,889 | ||||||||
| United Kingdom–17.94% | ||||||||
| African Barrick Gold Ltd. | 676,174 | 5,857,398 | ||||||
| Bunzl PLC | 443,869 | 5,719,287 | ||||||
| Chemring Group PLC | 955,565 | 7,813,272 | ||||||
| Compass Group PLC | 611,853 | 5,553,415 | ||||||
| Homeserve PLC | 2,048,957 | 11,481,530 | ||||||
| IG Group Holdings PLC | 1,623,859 | 12,104,885 | ||||||
| Informa PLC | 1,662,227 | 9,658,445 | ||||||
| International Power PLC | 569,712 | 3,088,898 | ||||||
See accompanying Notes to Financial Statements which are an integral part of the financial statements.
9 Invesco Global Small & Mid Cap Growth Fund
| Shares | Value | |||||||
United Kingdom–(continued) | ||||||||
| Lancashire Holdings Ltd. | 637,330 | $ | 7,301,091 | |||||
| Micro Focus International PLC | 1,256,609 | 6,789,371 | ||||||
| Playtech Ltd. | 453,774 | 1,986,399 | ||||||
| Shire PLC | 238,859 | 7,493,038 | ||||||
| Smiths Group PLC | 396,534 | 6,057,391 | ||||||
| Ultra Electronics Holdings PLC | 266,074 | 6,766,671 | ||||||
| UBM PLC | 424,848 | 3,460,047 | ||||||
| William Hill PLC | 1,137,590 | 3,941,938 | ||||||
| 105,073,076 | ||||||||
| United States–26.47% | ||||||||
| Abercrombie & Fitch Co.–Class A | 93,074 | 6,924,706 | ||||||
| Aetna Inc. | 96,908 | �� | 3,853,062 | |||||
Affiliated Managers Group, Inc.(a) | 23,250 | 2,153,183 | ||||||
AGCO Corp.(a) | 69,447 | 3,043,862 | ||||||
| Albemarle Corp. | 78,754 | 4,196,801 | ||||||
Allscripts Healthcare Solutions, Inc.(a) | 107,080 | 2,050,582 | ||||||
| Amphenol Corp.–Class A | 113,805 | 5,404,599 | ||||||
Avnet, Inc.(a) | 94,925 | 2,877,177 | ||||||
BioMarin Pharmaceutical Inc.(a) | 65,597 | 2,237,514 | ||||||
BorgWarner, Inc.(a) | 68,353 | 5,228,321 | ||||||
| C.H. Robinson Worldwide, Inc. | 50,684 | 3,518,990 | ||||||
| Cabot Oil & Gas Corp. | 58,217 | 4,524,625 | ||||||
CareFusion Corp.(a) | 127,015 | 3,251,584 | ||||||
| Church & Dwight Co., Inc. | 83,362 | 3,682,933 | ||||||
| Cinemark Holdings, Inc. | 192,126 | 3,971,244 | ||||||
Citrix Systems, Inc.(a) | 72,888 | 5,308,433 | ||||||
| Coach, Inc. | 104,148 | 6,776,910 | ||||||
Cognizant Technology Solutions Corp.–Class A(a) | 40,889 | 2,974,675 | ||||||
Complete Production Services, Inc.(a) | 27,896 | 914,989 | ||||||
DaVita, Inc.(a) | 59,688 | 4,178,160 | ||||||
Deckers Outdoor Corp.(a) | 23,110 | 2,663,196 | ||||||
Dick’s Sporting Goods, Inc.(a) | 118,515 | 4,632,751 | ||||||
| Discover Financial Services | 136,112 | 3,206,799 | ||||||
Dollar Tree, Inc.(a) | 42,480 | 3,396,701 | ||||||
Express Scripts, Inc.(a) | 69,959 | 3,199,225 | ||||||
F5 Networks, Inc.(a) | 25,378 | 2,638,043 | ||||||
| Gardner Denver Inc. | 56,829 | 4,394,587 | ||||||
Gartner, Inc.(a) | 65,955 | 2,540,587 | ||||||
| Gentex Corp. | 171,807 | 5,174,827 | ||||||
Green Mountain Coffee Roasters, Inc.(a) | 30,818 | 2,003,786 | ||||||
| H.J. Heinz Co. | 52,040 | 2,781,018 | ||||||
HMS Holdings Corp.(a) | 32,426 | 792,491 | ||||||
Intrepid Potash, Inc.(a) | 125,503 | 3,492,748 | ||||||
Juniper Networks, Inc.(a) | 8,731 | 213,648 | ||||||
Key Energy Services, Inc.(a) | 130,988 | 1,693,675 | ||||||
Navistar International Corp.(a) | 90,579 | 3,810,659 | ||||||
NII Holdings Inc.(a) | 94,755 | 2,229,585 | ||||||
| Patterson-UTI Energy, Inc. | 104,448 | 2,122,383 | ||||||
| PetSmart, Inc. | 42,883 | 2,013,357 | ||||||
| Robert Half International, Inc. | 113,661 | 3,004,060 | ||||||
Shutterfly, Inc.(a) | 57,421 | 2,392,733 | ||||||
| Starwood Hotels & Resorts Worldwide, Inc. | 57,821 | 2,897,410 | ||||||
Tesla Motors, Inc.(a) | 46,605 | 1,368,789 | ||||||
Ulta Salon, Cosmetics & Fragrance, Inc.(a) | 77,557 | 5,218,811 | ||||||
United Therapeutics Corp.(a) | 56,795 | 2,483,645 | ||||||
| Universal Health Services, Inc.–Class B | 97,428 | 3,894,197 | ||||||
Whiting Petroleum Corp.(a) | 80,244 | 3,735,358 | ||||||
| 155,067,419 | ||||||||
| Total Common Stocks & Other Equity Interests (Cost $448,192,873) | 537,705,776 | |||||||
| Preferred Stocks–1.08% | ||||||||
| Brazil–1.08% | ||||||||
| Companhia de Transmissao de Energia Eletrica Paulista–Pfd. (Cost $5,406,331) | 218,100 | 6,293,717 | ||||||
| Money Market Funds–7.47% | ||||||||
Liquid Assets Portfolio–Institutional Class(c) | 21,887,228 | 21,887,228 | ||||||
Premier Portfolio–Institutional Class(c) | 21,887,227 | 21,887,227 | ||||||
| Total Money Market Funds (Cost $43,774,455) | 43,774,455 | |||||||
| TOTAL INVESTMENTS–100.34% (Cost $497,373,659) | 587,773,948 | |||||||
| OTHER ASSETS LESS LIABILITIES–(0.34)% | (1,981,444 | ) | ||||||
| NET ASSETS–100.00% | $ | 585,792,504 | ||||||
Investment Abbreviations:
| ADR | – American Depositary Receipt | |
| Pfd. | – Preferred |
Notes to Schedule of Investments:
| (a) | Non-income producing security. | |
| (b) | Security purchased or received in a transaction exempt from registration under the Securities Act of 1933, as amended. The security may be resold pursuant to an exemption from registration under the 1933 Act, typically to qualified institutional buyers. The value of this security at October 31, 2011 was $931,571, which represented less than 1% of the Fund’s Net Assets. | |
| (c) | The money market fund and the Fund are affiliated by having the same investment adviser. |
See accompanying Notes to Financial Statements which are an integral part of the financial statements.
10 Invesco Global Small & Mid Cap Growth Fund
Statement of Assets and Liabilities
October 31, 2011
| Assets: | ||||
| Investments, at value (Cost $453,599,204) | $ | 543,999,493 | ||
| Investments in affiliated money market funds, at value and cost | 43,774,455 | |||
| Total investments, at value (Cost $497,373,659) | 587,773,948 | |||
| Foreign currencies, at value (Cost $244,569) | 283,784 | |||
| Receivable for: | ||||
| Investments sold | 5,275,777 | |||
| Fund shares sold | 111,547 | |||
| Dividends | 705,569 | |||
| Investment for trustee deferred compensation and retirement plans | 69,734 | |||
| Other assets | 26,367 | |||
| Total assets | 594,246,726 | |||
| Liabilities: | ||||
| Payable for: | ||||
| Investments purchased | 5,427,452 | |||
| Fund shares reacquired | 1,317,732 | |||
| Accrued fees to affiliates | 417,789 | |||
| Accrued other operating expenses | 1,098,653 | |||
| Trustee deferred compensation and retirement plans | 192,596 | |||
| Total liabilities | 8,454,222 | |||
| Net assets applicable to shares outstanding | $ | 585,792,504 | ||
| Net assets consist of: | ||||
| Shares of beneficial interest | $ | 454,711,656 | ||
| Undistributed net investment income | 5,921,642 | |||
| Undistributed net realized gain | 34,825,672 | |||
| Unrealized appreciation | 90,333,534 | |||
| $ | 585,792,504 | |||
| Net Assets: | ||||
| Class A | $ | 508,793,575 | ||
| Class B | $ | 23,124,126 | ||
| Class C | $ | 23,367,565 | ||
| Class Y | $ | 7,589,379 | ||
| Institutional Class | $ | 22,917,859 | ||
| Shares outstanding, $0.001 par value per share, with an unlimited number of shares authorized: | ||||
| Class A | 28,371,046 | |||
| Class B | 1,469,311 | |||
| Class C | 1,483,798 | |||
| Class Y | 421,678 | |||
| Institutional Class | 1,276,512 | |||
| Class A: | ||||
| Net asset value per share | $ | 17.93 | ||
| Maximum offering price per share (Net asset value of $17.93 divided by 94.50%) | $ | 18.97 | ||
| Class B: | ||||
| Net asset value and offering price per share | $ | 15.74 | ||
| Class C: | ||||
| Net asset value and offering price per share | $ | 15.75 | ||
| Class Y: | ||||
| Net asset value and offering price per share | $ | 18.00 | ||
| Institutional Class: | ||||
| Net asset value and offering price per share | $ | 17.95 | ||
See accompanying Notes to Financial Statements which are an integral part of the financial statements.
11 Invesco Global Small & Mid Cap Growth Fund
Statement of Operations
For the year ended October 31, 2011
| Investment income: | ||||
| Dividends (net of foreign withholding taxes of $954,396) | $ | 15,665,992 | ||
| Dividends from affiliated money market funds | 38,387 | |||
| Total investment income | 15,704,379 | |||
| Expenses: | ||||
| Advisory fees | 5,239,551 | |||
| Administrative services fees | 194,026 | |||
| Custodian fees | 243,395 | |||
| Distribution fees: | ||||
| Class A | 1,437,695 | |||
| Class B | 298,951 | |||
| Class C | 268,593 | |||
| Transfer agent fees — A, B, C and Y | 1,736,011 | |||
| Transfer agent fees — Institutional | 8,100 | |||
| Trustees’ and officers’ fees and benefits | 36,568 | |||
| Other | 251,871 | |||
| Total expenses | 9,714,761 | |||
| Less: Fees waived, expenses reimbursed and expense offset arrangement(s) | (64,412 | ) | ||
| Net expenses | 9,650,349 | |||
| Net investment income | 6,054,030 | |||
| Realized and unrealized gain (loss) from: | ||||
| Net realized gain (loss) from: | ||||
| Investment securities (includes net gains from securities sold to affiliates of $4,733,536) | 46,939,516 | |||
| Foreign currencies | (98,512 | ) | ||
| 46,841,004 | ||||
| Change in net unrealized appreciation (depreciation) of: | ||||
| Investment securities (net of foreign taxes on holdings of $(183,685)) | (69,550,547 | ) | ||
| Foreign currencies | (105,811 | ) | ||
| (69,656,358 | ) | |||
| Net realized and unrealized gain (loss) | (22,815,354 | ) | ||
| Net increase (decrease) in net assets resulting from operations | $ | (16,761,324 | ) | |
See accompanying Notes to Financial Statements which are an integral part of the financial statements.
12 Invesco Global Small & Mid Cap Growth Fund
Statement of Changes in Net Assets
For the years ended October 31, 2011 and 2010
| 2011 | 2010 | |||||||
| Operations: | ||||||||
| Net investment income | $ | 6,054,030 | $ | 2,130,787 | ||||
| Net realized gain | 46,841,004 | 69,493,346 | ||||||
| Change in net unrealized appreciation (depreciation) | (69,656,358 | ) | 77,046,675 | |||||
| Net increase (decrease) in net assets resulting from operations | (16,761,324 | ) | 148,670,808 | |||||
| Distributions to shareholders from net investment income: | ||||||||
| Class A | (2,433,351 | ) | (2,235,495 | ) | ||||
| Class Y | (52,803 | ) | (31,453 | ) | ||||
| Institutional Class | (261,973 | ) | (237,117 | ) | ||||
| Total distributions from net investment income | (2,748,127 | ) | (2,504,065 | ) | ||||
| Share transactions–net: | ||||||||
| Class A | (63,952,043 | ) | (57,139,426 | ) | ||||
| Class B | (10,746,044 | ) | (12,402,494 | ) | ||||
| Class C | (1,830,344 | ) | 418,837 | |||||
| Class Y | (169,160 | ) | 1,847,893 | |||||
| Institutional Class | (4,147,809 | ) | (2,051,832 | ) | ||||
| Net increase (decrease) in net assets resulting from share transactions | (80,845,400 | ) | (69,327,022 | ) | ||||
| Net increase (decrease) in net assets | (100,354,851 | ) | 76,839,721 | |||||
| Net assets: | ||||||||
| Beginning of year | 686,147,355 | 609,307,634 | ||||||
| End of year (includes undistributed net investment income of $5,921,642 and $2,353,454, respectively) | $ | 585,792,504 | $ | 686,147,355 | ||||
Notes to Financial Statements
October 31, 2011
NOTE 1—Significant Accounting Policies
Invesco Global Small & Mid Cap Growth Fund (the “Fund”) is a series portfolio of AIM International Mutual Funds (Invesco International Mutual Funds) (the “Trust”). The Trust is a Delaware statutory trust registered under the Investment Company Act of 1940, as amended (the “1940 Act”), as an open-end series management investment company consisting of six separate portfolios, each authorized to issue an unlimited number of shares of beneficial interest. The assets, liabilities and operations of each portfolio are accounted for separately. Information presented in these financial statements pertains only to the Fund. Matters affecting each portfolio or class will be voted on exclusively by the shareholders of such portfolio or class.
The Fund’s investment objective is long-term growth of capital.
The Fund currently consists of five different classes of shares: Class A, Class B, Class C, Class Y and Institutional Class. Class A shares are sold with a front-end sales charge unless certain waiver criteria are met and under certain circumstances load waived shares may be subject to contingent deferred sales charges (“CDSC”). Class C shares are sold with a CDSC. Class Y and Institutional Class shares are sold at net asset value. Effective November 30, 2010, new or additional investments in Class B shares are no longer permitted. Existing shareholders of Class B shares may continue to reinvest dividends and capital gains distributions in Class B shares until they convert. Also, shareholders in Class B shares will be able to exchange those shares for Class B shares of other Invesco Funds offering such shares until they convert. Generally, Class B shares will automatically convert to Class A shares on or about the month-end which is at least eight years after the date of purchase. Redemption of Class B shares prior to conversion date will be subject to a CDSC.
The following is a summary of the significant accounting policies followed by the Fund in the preparation of its financial statements.
| A. | Security Valuations — Securities, including restricted securities, are valued according to the following policy. | |
| A security listed or traded on an exchange (except convertible bonds) is valued at its last sales price or official closing price as of the close of the customary trading session on the exchange where the security is principally traded, or lacking any sales or official closing price on a particular day, the security may be valued at the closing bid price on that day. Securities traded in the over-the-counter market are valued based on prices furnished by independent pricing services or market makers. When such securities are valued by an independent pricing service they may be considered fair valued. Futures contracts are valued at the final settlement price set by an exchange on which they are principally traded. Listed options are valued at the mean |
13 Invesco Global Small & Mid Cap Growth Fund
| between the last bid and ask prices from the exchange on which they are principally traded. Options not listed on an exchange are valued by an independent source at the mean between the last bid and ask prices. For purposes of determining net asset value per share, futures and option contracts generally are valued 15 minutes after the close of the customary trading session of the New York Stock Exchange (“NYSE”). | ||
| Investments in open-end and closed-end registered investment companies that do not trade on an exchange are valued at the end of day net asset value per share. Investments in open-end and closed-end registered investment companies that trade on an exchange are valued at the last sales price or official closing price as of the close of the customary trading session on the exchange where the security is principally traded. | ||
| Debt obligations (including convertible bonds) and unlisted equities are fair valued using an evaluated quote provided by an independent pricing service. Evaluated quotes provided by the pricing service may be determined without exclusive reliance on quoted prices, and may reflect appropriate factors such as institution-size trading in similar groups of securities, developments related to specific securities, dividend rate, yield, quality, type of issue, coupon rate, maturity, individual trading characteristics and other market data. Debt securities are subject to interest rate and credit risks. In addition, all debt securities involve some risk of default with respect to interest and/or principal payments. | ||
| Foreign securities (including foreign exchange contracts) are converted into U.S. dollar amounts using the applicable exchange rates as of the close of the NYSE. If market quotations are available and reliable for foreign exchange traded equity securities, the securities will be valued at the market quotations. Because trading hours for certain foreign securities end before the close of the NYSE, closing market quotations may become unreliable. If between the time trading ends on a particular security and the close of the customary trading session on the NYSE, events occur that are significant and make the closing price unreliable, the Fund may fair value the security. If the event is likely to have affected the closing price of the security, the security will be valued at fair value in good faith using procedures approved by the Board of Trustees. Adjustments to closing prices to reflect fair value may also be based on a screening process of an independent pricing service to indicate the degree of certainty, based on historical data, that the closing price in the principal market where a foreign security trade is not the current value as of the close of the NYSE. Foreign securities meeting the approved degree of certainty that the price is not reflective of current value will be priced at the indication of fair value from the independent pricing service. Multiple factors may be considered by the independent pricing service in determining adjustments to reflect fair value and may include information relating to sector indices, American Depositary Receipts and domestic and foreign index futures. Foreign securities may have additional risks including exchange rate changes, potential for sharply devalued currencies and high inflation, political and economical upheaval, the relative lack of issuer information, relatively low market liquidity and the potential lack of strict financial and accounting controls and standards. | ||
| Securities for which market prices are not provided by any of the above methods may be valued based upon quotes furnished by independent sources. The last bid price may be used to value equity securities. The mean between the last bid and asked prices is used to value debt obligations, including Corporate Loans. | ||
| Securities for which market quotations are not readily available or are unreliable are valued at fair value as determined in good faith by or under the supervision of the Trust’s officers following procedures approved by the Board of Trustees. Issuer specific events, market trends, bid/ask quotes of brokers and information providers and other market data may be reviewed in the course of making a good faith determination of a security’s fair value. | ||
| Valuations change in response to many factors including the historical and prospective earnings of the issuer, the value of the issuer’s assets, general economic conditions, interest rates, investor perceptions and market liquidity. Because of the inherent uncertainties of valuation, the values reflected in the financial statements may materially differ from the value received upon actual sale of those investments. | ||
| B. | Securities Transactions and Investment Income — Securities transactions are accounted for on a trade date basis. Realized gains or losses on sales are computed on the basis of specific identification of the securities sold. Interest income is recorded on the accrual basis from settlement date. Dividend income (net of withholding tax, if any) is recorded on the ex-dividend date. | |
| The Fund may periodically participate in litigation related to Fund investments. As such, the Fund may receive proceeds from litigation settlements. Any proceeds received are included in the Statement of Operations as realized gain (loss) for investments no longer held and as unrealized gain (loss) for investments still held. | ||
| Brokerage commissions and mark ups are considered transaction costs and are recorded as an increase to the cost basis of securities purchased and/or a reduction of proceeds on a sale of securities. Such transaction costs are included in the determination of net realized and unrealized gain (loss) from investment securities reported in the Statement of Operations and the Statement of Changes in Net Assets and the net realized and unrealized gains (losses) on securities per share in the Financial Highlights. Transaction costs are included in the calculation of the Fund’s net asset value and, accordingly, they reduce the Fund’s total returns. These transaction costs are not considered operating expenses and are not reflected in net investment income reported in the Statement of Operations and Statement of Changes in Net Assets, or the net investment income per share and ratios of expenses and net investment income reported in the Financial Highlights, nor are they limited by any expense limitation arrangements between the Fund and the investment adviser. | ||
| The Fund allocates income and realized and unrealized capital gains and losses to a class based on the relative net assets of each class. | ||
| C. | Country Determination — For the purposes of making investment selection decisions and presentation in the Schedule of Investments, the investment adviser may determine the country in which an issuer is located and/or credit risk exposure based on various factors. These factors include the laws of the country under which the issuer is organized, where the issuer maintains a principal office, the country in which the issuer derives 50% or more of its total revenues and the country that has the primary market for the issuer’s securities, as well as other criteria. Among the other criteria that may be evaluated for making this determination are the country in which the issuer maintains 50% or more of its assets, the type of security, financial guarantees and enhancements, the nature of the collateral and the sponsor organization. Country of issuer and/or credit risk exposure has been determined to be the United States of America, unless otherwise noted. | |
| D. | Distributions — Distributions from income and net realized capital gain, if any, are generally paid annually and recorded on ex-dividend date. The Fund may elect to treat a portion of the proceeds from redemptions as distributions for federal income tax purposes. | |
| E. | Federal Income Taxes — The Fund intends to comply with the requirements of Subchapter M of the Internal Revenue Code necessary to qualify as a regulated investment company and to distribute substantially all of the Fund’s taxable earnings to shareholders. As such, the Fund will not be subject to federal income taxes on otherwise taxable income (including net realized capital gain) that is distributed to shareholders. Therefore, no provision for federal income taxes is recorded in the financial statements. |
14 Invesco Global Small & Mid Cap Growth Fund
| The Fund files tax returns in the U.S. Federal jurisdiction and certain other jurisdictions. Generally, the Fund is subject to examinations by such taxing authorities for up to three years after the filing of the return for the tax period. | ||
| F. | Expenses — Fees provided for under the Rule 12b-1 plan of a particular class of the Fund are charged to the operations of such class. Transfer agency fees and expenses and other shareholder recordkeeping fees and expenses attributable to the Institutional Class are charged to such class. Transfer agency fees and expenses and other shareholder recordkeeping fees and expenses relating to all other classes are allocated among those classes based on relative net assets. All other expenses are allocated among the classes based on relative net assets. | |
| G. | Accounting Estimates — The preparation of financial statements in conformity with accounting principles generally accepted in the United States of America (“GAAP”) requires management to make estimates and assumptions that affect the reported amounts of assets and liabilities at the date of the financial statements and the reported amounts of revenues and expenses during the reporting period including estimates and assumptions related to taxation. Actual results could differ from those estimates by a significant amount. In addition, the Fund monitors for material events or transactions that may occur or become known after the period-end date and before the date the financial statements are released to print. | |
| H. | Indemnifications — Under the Trust’s organizational documents, each Trustee, officer, employee or other agent of the Trust is indemnified against certain liabilities that may arise out of performance of their duties to the Fund. Additionally, in the normal course of business, the Fund enters into contracts, including the Fund’s servicing agreements that contain a variety of indemnification clauses. The Fund’s maximum exposure under these arrangements is unknown as this would involve future claims that may be made against the Fund that have not yet occurred. The risk of material loss as a result of such indemnification claims is considered remote. | |
| I. | Redemption Fees — The Fund has a 2% redemption fee that is to be retained by the Fund to offset transaction costs and other expenses associated with short-term redemptions and exchanges. The fee, subject to certain exceptions, is imposed on certain redemptions or exchanges of shares within 31 days of purchase. The redemption fee is recorded as an increase in shareholder capital and is allocated among the share classes based on the relative net assets of each class. Effective January 1, 2012, the Fund will eliminate the 2% redemption fee, if applicable, assessed on shares of the Fund redeemed or exchanged within 31 days of purchase. | |
| J. | Foreign Currency Translations — Foreign currency is valued at the close of the NYSE based on quotations posted by banks and major currency dealers. Portfolio securities and other assets and liabilities denominated in foreign currencies are translated into U.S. dollar amounts at date of valuation. Purchases and sales of portfolio securities (net of foreign taxes withheld on disposition) and income items denominated in foreign currencies are translated into U.S. dollar amounts on the respective dates of such transactions. The Fund does not separately account for the portion of the results of operations resulting from changes in foreign exchange rates on investments and the fluctuations arising from changes in market prices of securities held. The combined results of changes in foreign exchange rates and the fluctuation of market prices on investments (net of estimated foreign tax withholding) are included with the net realized and unrealized gain or loss from investments in the Statement of Operations. Reported net realized foreign currency gains or losses arise from (1) sales of foreign currencies, (2) currency gains or losses realized between the trade and settlement dates on securities transactions, and (3) the difference between the amounts of dividends, interest, and foreign withholding taxes recorded on the Fund’s books and the U.S. dollar equivalent of the amounts actually received or paid. Net unrealized foreign currency gains and losses arise from changes in the fair values of assets and liabilities, other than investments in securities at fiscal period end, resulting from changes in exchange rates. | |
| The Fund may invest in foreign securities which may be subject to foreign taxes on income, gains on investments or currency repatriation, a portion of which may be recoverable. | ||
| K. | Foreign Currency Contracts — The Fund may enter into foreign currency contracts to manage or minimize currency or exchange rate risk. The Fund may also enter into foreign currency contracts for the purchase or sale of a security denominated in a foreign currency in order to “lock in” the U.S. dollar price of that security. A foreign currency contract is an obligation to purchase or sell a specific currency for an agreed-upon price at a future date. The use of foreign currency contracts does not eliminate fluctuations in the price of the underlying securities the Fund owns or intends to acquire but establishes a rate of exchange in advance. Fluctuations in the value of these contracts are measured by the difference in the contract date and reporting date exchange rates and are recorded as unrealized appreciation (depreciation) until the contracts are closed. When the contracts are closed, realized gains (losses) are recorded. Realized and unrealized gains (losses) on the contracts are included in the Statement of Operations. The primary risks associated with foreign currency contracts include failure of the counterparty to meet the terms of the contract and the value of the foreign currency changing unfavorably. These risks may be in excess of the amounts reflected in the Statement of Assets and Liabilities. |
NOTE 2—Advisory Fees and Other Fees Paid to Affiliates
The Trust has entered into a master investment advisory agreement with Invesco Advisers, Inc. (the “Adviser” or “Invesco”). Under the terms of the investment advisory agreement, the Fund pays an advisory fee to the Adviser based on the annual rate of the Fund’s average daily net assets as follows:
| Average Daily Net Assets | Rate | |||
| First $250 million | 0 | .80% | ||
| Next $250 million | 0 | .78% | ||
| Next $500 million | 0 | .76% | ||
| Next $1.5 billion | 0 | .74% | ||
| Next $2.5 billion | 0 | .72% | ||
| Next $2.5 billion | 0 | .70% | ||
| Next $2.5 billion | 0 | .68% | ||
| Over $10 billion | 0 | .66% | ||
15 Invesco Global Small & Mid Cap Growth Fund
Under the terms of a master sub-advisory agreement between the Adviser and each of Invesco Asset Management Deutschland GmbH, Invesco Asset Management Limited, Invesco Asset Management (Japan) Limited, Invesco Australia Limited, Invesco Hong Kong Limited, Invesco Senior Secured Management, Inc. and Invesco Canada Ltd. (collectively, the “Affiliated Sub-Advisers”) the Adviser, not the Fund, may pay 40% of the fees paid to the Adviser to any such Affiliated Sub-Adviser(s) that provide discretionary investment management services to the Fund based on the percentage of assets allocated to such Sub-Adviser(s).
The Adviser has contractually agreed, through at least February 28, 2013, to waive advisory fees and/or reimburse expenses of all shares to the extent necessary to limit total annual fund operating expenses after fee waiver and/or expense reimbursement (excluding certain items discussed below) of Class A, Class B, Class C, Class Y and Institutional Class shares to 2.25%, 3.00%, 3.00%, 2.00% and 2.00%, respectively, of average daily net assets. In determining the Adviser’s obligation to waive advisory fees and/or reimburse expenses, the following expenses are not taken into account, and could cause the total annual fund operating expenses after fee waiver and/or expense reimbursement to exceed the numbers reflected above: (1) interest; (2) taxes; (3) dividend expense on short sales; (4) extraordinary items or non-routine items; and (5) expenses that the Fund has incurred but did not actually pay because of an expense offset arrangement. Unless the Board of the Trustees and Invesco mutually agree to amend or continue the fee waiver agreement, it will terminate on February 28, 2013. The Adviser did not waive fees for reimbursed expenses during the period under this expense limitation.
The Adviser has contractually agreed, through at least June 30, 2012, to waive the advisory fee payable by the Fund in an amount equal to 100% of the net advisory fees the Adviser receives from the affiliated money market funds on investments by the Fund of uninvested cash in such affiliated money market funds.
For the year ended October 31, 2011, the Adviser waived advisory fees of $57,135.
At the request of the Trustees of the Trust, Invesco Ltd. agreed to reimburse expenses incurred by the Fund in connection with market timing matters in the Invesco Funds, which may include legal, audit, shareholder reporting, communications and trustee expenses. These expenses along with the related expense reimbursement are included in the Statement of Operations. For the year ended October 31, 2011, Invesco Ltd. reimbursed expenses of the Fund in the amount of $2,880.
The Trust has entered into a master administrative services agreement with Invesco pursuant to which the Fund has agreed to pay Invesco for certain administrative costs incurred in providing accounting services to the Fund. For the year ended October 31, 2011, expenses incurred under the agreement are shown in the Statement of Operations as administrative services fees.
The Trust has entered into a transfer agency and service agreement with Invesco Investment Services, Inc. (“IIS”) pursuant to which the Fund has agreed to pay IIS a fee for providing transfer agency and shareholder services to the Fund and reimburse IIS for certain expenses incurred by IIS in the course of providing such services. IIS may make payments to intermediaries that provide omnibus account services, sub-accounting services and/or networking services. All fees payable by IIS to intermediaries that provide omnibus account services or sub-accounting are charged back to the Fund, subject to certain limitations approved by the Trust’s Board of Trustees. For the year ended October 31, 2011, expenses incurred under the agreement are shown in the Statement of Operations as transfer agent fees.
The Trust has entered into master distribution agreements with Invesco Distributors, Inc. (“IDI”) to serve as the distributor for the Class A, Class B, Class C, Class Y and Institutional Class shares of the Fund. The Trust has adopted plans pursuant to Rule 12b-1 under the 1940 Act with respect to the Fund’s Class A, Class B and Class C shares (collectively, the “Plans”). The Fund, pursuant to the Plans, pays IDI compensation at the annual rate of 0.25% of the Fund’s average daily net assets of Class A shares and 1.00% of the average daily net assets of Class B and Class C shares. Of the Plan payments, up to 0.25% of the average daily net assets of each class of shares may be paid to furnish continuing personal shareholder services to customers who purchase and own shares of such classes. Any amounts not paid as a service fee under the Plans would constitute an asset-based sales charge. Rules of the Financial Industry Regulatory Authority (“FINRA”) impose a cap on the total sales charges, including asset-based sales charges that may be paid by any class of shares of the Fund. For the year ended October 31, 2011, expenses incurred under the Plans are shown in the Statement of Operations as distribution fees.
Front-end sales commissions and CDSC (collectively, the “sales charges”) are not recorded as expenses of the Fund. Front-end sales commissions are deducted from proceeds from the sales of Fund shares prior to investment in Class A shares of the Fund. CDSC are deducted from redemption proceeds prior to remittance to the shareholder. During the year ended October 31, 2011, IDI advised the Fund that IDI retained $43,897 in front-end sales commissions from the sale of Class A shares and $2,366, $40,100 and $787 from Class A, Class B and Class C shares, respectively, for CDSC imposed on redemptions by shareholders.
Certain officers and trustees of the Trust are officers and directors of the Adviser, Invesco Ltd., IIS and/or IDI.
NOTE 3—Additional Valuation Information
GAAP defines fair value as the price that would be received to sell an asset or paid to transfer a liability in an orderly transaction between market participants at the measurement date, under current market conditions. GAAP establishes a hierarchy that prioritizes the inputs to valuation methods giving the highest priority to readily available unadjusted quoted prices in an active market for identical assets (Level 1) and the lowest priority to significant unobservable inputs (Level 3) generally when market prices are not readily available or are unreliable. Based on the valuation inputs, the securities or other investments are tiered into one of three levels. Changes in valuation methods may result in transfers in or out of an investment’s assigned level:
| Level 1 — | Prices are determined using quoted prices in an active market for identical assets. | |
| Level 2 — | Prices are determined using other significant observable inputs. Observable inputs are inputs that other market participants may use in pricing a security. These may include quoted prices for similar securities, interest rates, prepayment speeds, credit risk, yield curves, loss severities, default rates, discount rates, volatilities and others. | |
| Level 3 — | Prices are determined using significant unobservable inputs. In situations where quoted prices or observable inputs are unavailable (for example, when there is little or no market activity for an investment at the end of the period), unobservable inputs may be used. Unobservable inputs reflect the Fund’s own assumptions about the factors market participants would use in determining fair value of the securities or instruments and would be based on the best available information. |
16 Invesco Global Small & Mid Cap Growth Fund
The following is a summary of the tiered valuation input levels, as of October 31, 2011. The level assigned to the securities valuations may not be an indication of the risk or liquidity associated with investing in those securities. Because of the inherent uncertainties of valuation, the values reflected in the financial statements may materially differ from the value received upon actual sale of those investments.
During the year ended October 31, 2011, there were no significant transfers between investment levels.
| Level 1 | Level 2 | Level 3 | Total | |||||||||||||
| Australia | $ | — | $ | 3,437,756 | $ | — | $ | 3,437,756 | ||||||||
| Brazil | 31,450,636 | — | — | 31,450,636 | ||||||||||||
| Canada | 51,994,789 | — | — | 51,994,789 | ||||||||||||
| China | 8,542,374 | 15,134,759 | — | 23,677,133 | ||||||||||||
| France | — | 3,515,439 | — | 3,515,439 | ||||||||||||
| Germany | 5,333,001 | — | — | 5,333,001 | ||||||||||||
| Hong Kong | — | 2,602,939 | — | 2,602,939 | ||||||||||||
| Indonesia | — | 7,892,063 | — | 7,892,063 | ||||||||||||
| Ireland | 3,590,310 | 10,141,151 | — | 13,731,461 | ||||||||||||
| Israel | 2,676,971 | — | — | 2,676,971 | ||||||||||||
| Japan | — | 19,493,077 | — | 19,493,077 | ||||||||||||
| Mexico | 6,720,641 | — | — | 6,720,641 | ||||||||||||
| Netherlands | 6,584,283 | — | — | 6,584,283 | ||||||||||||
| Philippines | — | 30,272,476 | — | 30,272,476 | ||||||||||||
| Singapore | 3,670,664 | — | — | 3,670,664 | ||||||||||||
| South Africa | 3,968,941 | 9,859,047 | — | 13,827,988 | ||||||||||||
| South Korea | — | 8,979,959 | — | 8,979,959 | ||||||||||||
| Spain | — | 4,081,076 | — | 4,081,076 | ||||||||||||
| Sweden | — | 6,147,773 | — | 6,147,773 | ||||||||||||
| Switzerland | — | 10,502,143 | — | 10,502,143 | ||||||||||||
| Thailand | — | 11,669,841 | — | 11,669,841 | ||||||||||||
| Turkey | — | 15,596,889 | — | 15,596,889 | ||||||||||||
| United Kingdom | 9,479,437 | 95,593,639 | — | 105,073,076 | ||||||||||||
| United States | 198,841,874 | — | — | 198,841,874 | ||||||||||||
| Total Investments | $ | 332,853,921 | $ | 254,920,027 | $ | — | $ | 587,773,948 | ||||||||
NOTE 4—Security Transactions with Affiliated Funds
The Fund is permitted to purchase or sell securities from or to certain other Invesco Funds under specified conditions outlined in procedures adopted by the Board of Trustees of the Trust. The procedures have been designed to ensure that any purchase or sale of securities by the Fund from or to another fund or portfolio that is or could be considered an affiliate by virtue of having a common investment adviser (or affiliated investment advisers), common Trustees and/or common officers complies with Rule 17a-7 of the 1940 Act. Further, as defined under the procedures, each transaction is effected at the current market price. Pursuant to these procedures, for the year ended October 31, 2011, the Fund engaged in securities purchases of $15,988,549 and securities sales of $31,578,667, which resulted in net realized gains of $4,733,536.
NOTE 5—Expense Offset Arrangement(s)
The expense offset arrangement is comprised of transfer agency credits which result from balances in Demand Deposit Accounts (DDA) used by the transfer agent for clearing shareholder transactions. For the year ended October 31, 2011, the Fund received credits from this arrangement, which resulted in the reduction of the Fund’s total expenses of $4,397.
NOTE 6—Trustees’ and Officers’ Fees and Benefits
“Trustees’ and Officers’ Fees and Benefits” include amounts accrued by the Fund to pay remuneration to certain Trustees and Officers of the Fund. Trustees have the option to defer compensation payable by the Fund, and “Trustees’ and Officers’ Fees and Benefits” also include amounts accrued by the Fund to fund such deferred compensation amounts. Those Trustees who defer compensation have the option to select various Invesco Funds in which their deferral accounts shall be deemed to be invested. Finally, certain current Trustees are eligible to participate in a retirement plan that provides for benefits to be paid upon retirement to Trustees over a period of time based on the number of years of service. The Fund may have certain former Trustees who also participate in a retirement plan and receive benefits under such plan. “Trustees’ and Officers’ Fees and Benefits” include amounts accrued by the Fund to fund such retirement benefits. Obligations under the deferred compensation and retirement plans represent unsecured claims against the general assets of the Fund.
17 Invesco Global Small & Mid Cap Growth Fund
During the year ended October 31, 2011, the Fund paid legal fees of $2,592 for services rendered by Kramer, Levin, Naftalis & Frankel LLP as counsel to the Independent Trustees. A partner of that firm is a Trustee of the Trust.
NOTE 7—Cash Balances
The Fund is permitted to temporarily carry a negative or overdrawn balance in its account with The State Street Bank and Trust Company, the custodian bank. To compensate the custodian bank for such overdrafts, the overdrawn Fund may either (1) leave funds as a compensating balance in the account so the custodian bank can be compensated by earning the additional interest; or (2) compensate by paying the custodian bank at a rate agreed upon by the custodian bank and Invesco, not to exceed the contractually agreed upon rate.
NOTE 8—Distributions to Shareholders and Tax Components of Net Assets
Tax Character of Distributions to Shareholders Paid During the Years Ended October 31, 2011 and 2010:
| 2011 | 2010 | |||||||
| Ordinary income | $ | 2,748,127 | $ | 2,504,065 | ||||
Tax Components of Net Assets at Period-End:
| 2011 | ||||
| Undistributed ordinary income | $ | 6,105,405 | ||
| Undistributed long-term gain | 35,646,497 | |||
| Net unrealized appreciation — investments | 89,579,464 | |||
| Net unrealized appreciation (depreciation) — other investments | (66,755 | ) | ||
| Temporary book/tax differences | (183,763 | ) | ||
| Shares of beneficial interest | 454,711,656 | |||
| Total net assets | $ | 585,792,504 | ||
The difference between book-basis and tax-basis unrealized appreciation (depreciation) is due to differences in the timing of recognition of gains and losses on investments for tax and book purposes. The Fund’s net unrealized appreciation (depreciation) difference is attributable primarily to wash sales.
The temporary book/tax differences are a result of timing differences between book and tax recognition of income and/or expenses. The Fund’s temporary book/tax differences are the result of the trustee deferral of compensation and retirement plan benefits.
Capital loss carryforward is calculated and reported as of a specific date. Results of transactions and other activity after that date may affect the amount of capital loss carryforward actually available for the Fund to utilize. The ability to utilize capital loss carryforward in the future may be limited under the Internal Revenue Code and related regulations based on the results of future transactions.
The Fund utilized $10,283,479 of capital loss carryforward in the current period to offset net realized capital gain for federal income tax purposes. The Fund does not have any capital loss carryforward as of October 31, 2011.
NOTE 9—Investment Securities
The aggregate amount of investment securities (other than short-term securities, U.S. Treasury obligations and money market funds, if any) purchased and sold by the Fund during the year ended October 31, 2011 was $368,335,879 and $451,641,973, respectively. Cost of investments on a tax basis includes the adjustments for financial reporting purposes as of the most recently completed Federal income tax reporting period-end.
| Unrealized Appreciation (Depreciation) of Investment Securities on a Tax Basis | ||||
| Aggregate unrealized appreciation of investment securities | $ | 119,426,436 | ||
| Aggregate unrealized (depreciation) of investment securities | (29,846,972 | ) | ||
| Net unrealized appreciation of investment securities | $ | 89,579,464 | ||
| Cost of investments for tax purposes is $498,194,484. | ||||
NOTE 10—Reclassification of Permanent Differences
Primarily as a result of differing book/tax treatment of foreign currency transactions and litigation settlements, on October 31, 2011, undistributed net investment income was increased by $262,285 and undistributed net realized gain was decreased by $262,285. This reclassification had no effect on the net assets of the Fund.
18 Invesco Global Small & Mid Cap Growth Fund
NOTE 11—Share Information
| Summary of Share Activity | ||||||||||||||||
| Year Ended October 31, | ||||||||||||||||
| 2011(a) | 2010 | |||||||||||||||
| Shares | Amount | Shares | Amount | |||||||||||||
| Sold: | ||||||||||||||||
| Class A | 1,679,095 | $ | 32,113,470 | 1,639,314 | $ | 27,277,998 | ||||||||||
| Class B | 102,712 | 1,727,710 | 187,227 | 2,716,125 | ||||||||||||
| Class C | 326,553 | 5,556,756 | 321,713 | 4,823,586 | ||||||||||||
| Class Y | 191,884 | 3,637,247 | 230,707 | 3,850,932 | ||||||||||||
| Institutional Class | 222,144 | 4,183,712 | 55,143 | 913,868 | ||||||||||||
| Issued as reinvestment of dividends: | ||||||||||||||||
| Class A | 124,919 | 2,353,483 | 138,020 | 2,154,485 | ||||||||||||
| Class Y | 2,680 | 50,544 | 1,914 | 29,910 | ||||||||||||
| Institutional Class | 3,330 | 62,538 | 3,525 | 54,849 | ||||||||||||
| Automatic conversion of Class B shares to Class A shares: | ||||||||||||||||
| Class A | 348,022 | 6,697,374 | 542,311 | 8,915,319 | ||||||||||||
| Class B | (395,239 | ) | (6,697,374 | ) | (613,635 | ) | (8,915,319 | ) | ||||||||
Reacquired:(b) | ||||||||||||||||
| Class A | (5,529,361 | ) | (105,116,370 | ) | (5,810,143 | ) | (95,487,228 | ) | ||||||||
| Class B | (343,739 | ) | (5,776,380 | ) | (429,904 | ) | (6,203,300 | ) | ||||||||
| Class C | (453,901 | ) | (7,387,100 | ) | (301,516 | ) | (4,404,749 | ) | ||||||||
| Class Y | (199,107 | ) | (3,856,951 | ) | (124,177 | ) | (2,032,949 | ) | ||||||||
| Institutional Class | (437,752 | ) | (8,394,059 | ) | (181,083 | ) | (3,020,549 | ) | ||||||||
| Net increase (decrease) in share activity | (4,357,760 | ) | $ | (80,845,400 | ) | (4,340,584 | ) | $ | (69,327,022 | ) | ||||||
| (a) | There are entities that are record owners of more than 5% of the outstanding shares of the Fund and in the aggregate own 23% of the outstanding shares of the Fund. IDI has an agreement with these entities to sell Fund shares. The Fund, Invesco and/or Invesco affiliates may make payments to these entities, which are considered to be related to the Fund, for providing services to the Fund, Invesco and/or Invesco affiliates including but not limited to services such as securities brokerage, distribution, third party record keeping and account servicing. The Fund has no knowledge as to whether all or any portion of the shares owned of record by these entities are also owned beneficially. | |
| (b) | Net of redemption fees of $17,417 and $14,404 allocated among the classes based on relative net assets of each class for the years ended October 31, 2011 and 2010, respectively. |
19 Invesco Global Small & Mid Cap Growth Fund
NOTE 12—Financial Highlights
The following schedule presents financial highlights for a share of the Fund outstanding throughout the periods indicated.
| Ratio of | Ratio of | |||||||||||||||||||||||||||||||||||||||||||||||||||||||
| Net gains | expenses | expenses | ||||||||||||||||||||||||||||||||||||||||||||||||||||||
| (losses) on | to average | to average net | Ratio of net | |||||||||||||||||||||||||||||||||||||||||||||||||||||
| Net asset | Net | securities | Dividends | Distributions | net assets | assets without | investment | |||||||||||||||||||||||||||||||||||||||||||||||||
| value, | investment | (both | Total from | from net | from net | Net asset | Net assets, | with fee waivers | fee waivers | income (loss) | ||||||||||||||||||||||||||||||||||||||||||||||
| beginning | income | realized and | investment | investment | realized | Total | value, end | Total | end of period | and/or expenses | and/or expenses | to average | Portfolio | |||||||||||||||||||||||||||||||||||||||||||
| of period | (loss) | unrealized) | operations | income | gains | Distributions | of period(a) | Return(b) | (000s omitted) | absorbed | absorbed | net assets | turnover(c) | |||||||||||||||||||||||||||||||||||||||||||
| Class A | ||||||||||||||||||||||||||||||||||||||||||||||||||||||||
| Year ended 10/31/11 | $ | 18.57 | $ | 0.18 | (d) | $ | (0.74 | ) | $ | (0.56 | ) | $ | (0.08 | ) | $ | — | $ | (0.08 | ) | $ | 17.93 | (3.05 | )% | $ | 508,794 | 1.40 | %(e) | 1.41 | %(e) | 0.95 | %(e) | 58 | % | |||||||||||||||||||||||
| Year ended 10/31/10 | 14.79 | 0.06 | (d) | 3.78 | 3.84 | (0.06 | ) | — | (0.06 | ) | 18.57 | 26.07 | 589,712 | 1.45 | 1.46 | 0.37 | 39 | |||||||||||||||||||||||||||||||||||||||
| Year ended 10/31/09 | 12.87 | 0.05 | (d) | 3.07 | 3.12 | (0.15 | ) | (1.05 | ) | (1.20 | ) | 14.79 | 28.24 | 521,223 | 1.61 | 1.62 | 0.40 | 54 | ||||||||||||||||||||||||||||||||||||||
| Year ended 10/31/08 | 29.51 | 0.15 | (d) | (13.09 | ) | (12.94 | ) | (0.10 | ) | (3.60 | ) | (3.70 | ) | 12.87 | (49.68 | ) | 464,060 | 1.45 | 1.46 | 0.70 | 74 | |||||||||||||||||||||||||||||||||||
| Year ended 10/31/07 | 25.10 | 0.12 | 7.68 | 7.80 | (0.04 | ) | (3.35 | ) | (3.39 | ) | 29.51 | 34.57 | 1,022,682 | 1.42 | 1.50 | 0.47 | 43 | |||||||||||||||||||||||||||||||||||||||
| Class B | ||||||||||||||||||||||||||||||||||||||||||||||||||||||||
| Year ended 10/31/11 | 16.36 | 0.03 | (d) | (0.65 | ) | (0.62 | ) | — | — | — | 15.74 | (3.79 | ) | 23,124 | 2.15 | (e) | 2.16 | (e) | 0.20 | (e) | 58 | |||||||||||||||||||||||||||||||||||
| Year ended 10/31/10 | 13.07 | (0.05 | )(d) | 3.34 | 3.29 | — | — | — | 16.36 | 25.17 | 34,439 | 2.20 | 2.21 | (0.38 | ) | 39 | ||||||||||||||||||||||||||||||||||||||||
| Year ended 10/31/09 | 11.43 | (0.04 | )(d) | 2.73 | 2.69 | — | (1.05 | ) | (1.05 | ) | 13.07 | 27.33 | 38,709 | 2.36 | 2.37 | (0.35 | ) | 54 | ||||||||||||||||||||||||||||||||||||||
| Year ended 10/31/08 | 26.73 | (0.01 | )(d) | (11.69 | ) | (11.70 | ) | — | (3.60 | ) | (3.60 | ) | 11.43 | (50.07 | ) | 44,392 | 2.20 | 2.21 | (0.05 | ) | 74 | |||||||||||||||||||||||||||||||||||
| Year ended 10/31/07 | 23.15 | (0.07 | ) | 7.00 | 6.93 | — | (3.35 | ) | (3.35 | ) | 26.73 | 33.58 | 136,818 | 2.17 | 2.25 | (0.28 | ) | 43 | ||||||||||||||||||||||||||||||||||||||
| Class C | ||||||||||||||||||||||||||||||||||||||||||||||||||||||||
| Year ended 10/31/11 | 16.37 | 0.03 | (d) | (0.65 | ) | (0.62 | ) | — | — | — | 15.75 | (3.79 | ) | 23,368 | 2.15 | (e) | 2.16 | (e) | 0.20 | (e) | 58 | |||||||||||||||||||||||||||||||||||
| Year ended 10/31/10 | 13.08 | (0.05 | )(d) | 3.34 | 3.29 | — | — | — | 16.37 | 25.15 | 26,369 | 2.20 | 2.21 | (0.38 | ) | 39 | ||||||||||||||||||||||||||||||||||||||||
| Year ended 10/31/09 | 11.43 | (0.04 | )(d) | 2.74 | 2.70 | — | (1.05 | ) | (1.05 | ) | 13.08 | 27.41 | 20,802 | 2.36 | 2.37 | (0.35 | ) | 54 | ||||||||||||||||||||||||||||||||||||||
| Year ended 10/31/08 | 26.74 | (0.01 | )(d) | (11.70 | ) | (11.71 | ) | — | (3.60 | ) | (3.60 | ) | 11.43 | (50.09 | ) | 19,690 | 2.20 | 2.21 | (0.05 | ) | 74 | |||||||||||||||||||||||||||||||||||
| Year ended 10/31/07 | 23.16 | (0.07 | ) | 7.00 | 6.93 | — | (3.35 | ) | (3.35 | ) | 26.74 | 33.56 | 43,760 | 2.17 | 2.25 | (0.28 | ) | 43 | ||||||||||||||||||||||||||||||||||||||
| Class Y | ||||||||||||||||||||||||||||||||||||||||||||||||||||||||
| Year ended 10/31/11 | 18.64 | 0.23 | (d) | (0.75 | ) | (0.52 | ) | (0.12 | ) | — | (0.12 | ) | 18.00 | (2.81 | ) | 7,589 | 1.15 | (e) | 1.16 | (e) | 1.20 | (e) | 58 | |||||||||||||||||||||||||||||||||
| Year ended 10/31/10 | 14.84 | 0.10 | (d) | 3.80 | 3.90 | (0.10 | ) | — | (0.10 | ) | 18.64 | 26.38 | 7,944 | 1.20 | 1.21 | 0.62 | 39 | |||||||||||||||||||||||||||||||||||||||
| Year ended 10/31/09 | 12.87 | 0.09 | (d) | 3.09 | 3.18 | (0.16 | ) | (1.05 | ) | (1.21 | ) | 14.84 | 28.70 | 4,715 | 1.36 | 1.37 | 0.65 | 54 | ||||||||||||||||||||||||||||||||||||||
| Year ended 10/31/08(f) | 15.38 | 0.01 | (d) | (2.52 | ) | (2.51 | ) | — | — | — | 12.87 | (16.32 | ) | 1,580 | 1.24 | (g) | 1.26 | (g) | 0.91 | (g) | 74 | |||||||||||||||||||||||||||||||||||
| Institutional Class | ||||||||||||||||||||||||||||||||||||||||||||||||||||||||
| Year ended 10/31/11 | 18.59 | 0.27 | (d) | (0.74 | ) | (0.47 | ) | (0.17 | ) | — | (0.17 | ) | 17.95 | (2.57 | ) | 22,918 | 0.91 | (e) | 0.92 | (e) | 1.44 | (e) | 58 | |||||||||||||||||||||||||||||||||
| Year ended 10/31/10 | 14.81 | 0.15 | (d) | 3.78 | 3.93 | (0.15 | ) | — | (0.15 | ) | 18.59 | 26.72 | 27,683 | 0.92 | 0.93 | 0.90 | 39 | |||||||||||||||||||||||||||||||||||||||
| Year ended 10/31/09 | 12.93 | 0.13 | (d) | 3.07 | 3.20 | (0.27 | ) | (1.05 | ) | (1.32 | ) | 14.81 | 29.20 | 23,859 | 0.96 | 0.97 | 1.05 | 54 | ||||||||||||||||||||||||||||||||||||||
| Year ended 10/31/08 | 29.53 | 0.23 | (d) | (13.12 | ) | (12.89 | ) | (0.11 | ) | (3.60 | ) | (3.71 | ) | 12.93 | (49.46 | ) | 17,593 | 0.93 | 0.94 | 1.22 | 74 | |||||||||||||||||||||||||||||||||||
| Year ended 10/31/07(f) | 27.82 | 0.02 | 1.69 | 1.71 | — | — | — | 29.53 | 6.15 | 11 | 1.00 | (g) | 1.00 | (g) | 0.90 | (g) | 43 | |||||||||||||||||||||||||||||||||||||||
| (a) | Includes redemption fees added to shares of beneficial interest which were less than $0.005 per share. | |
| (b) | Includes adjustments in accordance with accounting principles generally accepted in the United States of America and as such, the net asset value for financial reporting purposes and the returns based upon those net asset values may differ from the net asset value and returns for shareholder transactions. Does not include sales charges and is not annualized for periods less than one year, if applicable. | |
| (c) | Portfolio turnover is calculated at the fund level and is not annualized for periods less than one year, if applicable. | |
| (d) | Calculated using average shares outstanding. | |
| (e) | Ratios are based on average daily net assets (000’s omitted) of $575,078, $29,895, $26,859, $8,365 and $29,480 for Class A, Class B, Class C, Class Y and Institutional Class shares, respectively. | |
| (f) | Commencement date of October 3, 2008 and September 28, 2007 for Class Y and Institutional Class Shares, respectively. | |
| (g) | Annualized. |
20 Invesco Global Small & Mid Cap Growth Fund
Report of Independent Registered Public Accounting Firm
To the Board of Trustees of AIM International Mutual Funds (Invesco International Mutual Funds)
and Shareholders of Invesco Global Small & Mid Cap Growth Fund:
In our opinion, the accompanying statement of assets and liabilities, including the schedule of investments, and the related statements of operations and of changes in net assets and the financial highlights present fairly, in all material respects, the financial position of Invesco Global Small & Mid Cap Growth Fund (one of the funds constituting AIM International Mutual Funds (Invesco International Mutual Funds), hereafter referred to as the “Fund”) at October 31, 2011, the results of its operations for the year then ended, the changes in its net assets for each of the two years in the period then ended and the financial highlights for each of the five years in the period then ended indicated, in conformity with accounting principles generally accepted in the United States of America. These financial statements and financial highlights (hereafter referred to as “financial statements”) are the responsibility of the Fund’s management; our responsibility is to express an opinion on these financial statements based on our audits. We conducted our audits of these financial statements in accordance with the standards of the Public Company Accounting Oversight Board (United States). Those standards require that we plan and perform the audit to obtain reasonable assurance about whether the financial statements are free of material misstatement. An audit includes examining, on a test basis, evidence supporting the amounts and disclosures in the financial statements, assessing the accounting principles used and significant estimates made by management, and evaluating the overall financial statement presentation. We believe that our audits, which included confirmation of securities at October 31, 2011 by correspondence with the custodian and brokers, provide a reasonable basis for our opinion.
PRICEWATERHOUSECOOPERS LLP
Houston, Texas
December 21, 2011
21 Invesco Global Small & Mid Cap Growth Fund
Calculating your ongoing Fund expenses
Example
As a shareholder of the Fund, you incur two types of costs: (1) transaction costs, which may include sales charges (loads) on purchase payments or contingent deferred sales charges on redemptions, and redemption fees, if any; and (2) ongoing costs, including management fees, distribution and/or service (12b-1) fees, and other Fund expenses. This example is intended to help you understand your ongoing costs (in dollars) of investing in the Fund and to compare these costs with ongoing costs of investing in other mutual funds. The example is based on an investment of $1,000 invested at the beginning of the period and held for the entire period May 1, 2011 through October 31, 2011.
Actual expenses
The table below provides information about actual account values and actual expenses. You may use the information in this table, together with the amount you invested, to estimate the expenses that you paid over the period. Simply divide your account value by $1,000 (for example, an $8,600 account value divided by $1,000 = 8.6), then multiply the result by the number in the table under the heading entitled “Actual Expenses Paid During Period” to estimate the expenses you paid on your account during this period.
Hypothetical example for comparison purposes
The table below also provides information about hypothetical account values and hypothetical expenses based on the Fund’s actual expense ratio and an assumed rate of return of 5% per year before expenses, which is not the Fund’s actual return.
The hypothetical account values and expenses may not be used to estimate the actual ending account balance or expenses you paid for the period. You may use this information to compare the ongoing costs of investing in the Fund and other funds. To do so, compare this 5% hypothetical example with the 5% hypothetical examples that appear in the shareholder reports of the other funds.
Please note that the expenses shown in the table are meant to highlight your ongoing costs only and do not reflect any transaction costs, such as sales charges (loads) on purchase payments, contingent deferred sales charges on redemptions, and redemption fees, if any. Therefore, the hypothetical information is useful in comparing ongoing costs only, and will not help you determine the relative total costs of owning different funds. In addition, if these transaction costs were included, your costs would have been higher.
| HYPOTHETICAL | ||||||||||||||||||||||||||||||
| (5% annual return before | ||||||||||||||||||||||||||||||
| ACTUAL | expenses) | |||||||||||||||||||||||||||||
| Beginning | Ending | Expenses | Ending | Expenses | Annualized | |||||||||||||||||||||||||
| Account Value | Account Value | Paid During | Account Value | Paid During | Expense | |||||||||||||||||||||||||
| Class | (05/01/11) | (10/31/11)1 | Period2 | (10/31/11) | Period2 | Ratio | ||||||||||||||||||||||||
| A | $ | 1,000.00 | $ | 853.40 | $ | 6.54 | $ | 1,018.15 | $ | 7.12 | 1.40 | % | ||||||||||||||||||
| B | 1,000.00 | 850.40 | 10.03 | 1,014.37 | 10.92 | 2.15 | ||||||||||||||||||||||||
| C | 1,000.00 | 850.40 | 10.03 | 1,014.37 | 10.92 | 2.15 | ||||||||||||||||||||||||
| Y | 1,000.00 | 854.70 | 5.38 | 1,019.41 | 5.85 | 1.15 | ||||||||||||||||||||||||
| Institutional | 1,000.00 | 855.60 | 4.64 | 1,020.57 | 4.69 | 0.92 | ||||||||||||||||||||||||
| 1 | The actual ending account value is based on the actual total return of the Fund for the period May 1, 2011 through October 31, 2011, after actual expenses and will differ from the hypothetical ending account value which is based on the Fund’s expense ratio and a hypothetical annual return of 5% before expenses. |
| 2 | Expenses are equal to the Fund’s annualized expense ratio as indicated above multiplied by the average account value over the period, multiplied by 184/365 to reflect the most recent fiscal half year. |
22 Invesco Global Small & Mid Cap Growth Fund
| Approval of Investment Advisory and Sub-Advisory Contracts |
The Board of Trustees (the Board) of AIM International Mutual Funds (Invesco International Mutual Funds) is required under the Investment Company Act of 1940, as amended, to approve annually the renewal of the Invesco Global Small & Mid Cap Growth Fund (the Fund) investment advisory agreement with Invesco Advisers, Inc. (Invesco Advisers) and the Master Intergroup Sub-Advisory Contract for Mutual Funds (the sub-advisory contracts) with Invesco Asset Management Deutschland GmbH, Invesco Asset Management Limited, Invesco Asset Management (Japan) Limited, Invesco Australia Limited, Invesco Hong Kong Limited, Invesco Senior Secured Management, Inc. and Invesco Canada Ltd. (collectively, the Affiliated Sub-Advisers). During contract renewal meetings held on June 14-15, 2011, the Board as a whole, and the disinterested or “independent” Trustees, who comprise 80% of the Board, voting separately, approved the continuance of the Fund’s investment advisory agreement and the sub-advisory contracts for another year, effective July 1, 2011. In doing so, the Board considered the process that it follows in reviewing and approving the Fund’s investment advisory agreement and sub-advisory contracts and the information that it is provided. The Board determined that the Fund’s investment advisory agreement and the sub-advisory contracts are in the best interests of the Fund and its shareholders and that the compensation to Invesco Advisers and the Affiliated Sub-Advisers under the agreements is fair and reasonable.
The Board’s Fund Evaluation Process
The Board’s Investments Committee has established three Sub-Committees, each of which is responsible for overseeing the management of a number of the series portfolios of the funds advised by Invesco Advisers (the Invesco Funds). The Sub-Committees meet throughout the year to review the performance of their assigned funds, including reviewing materials prepared under the direction of the independent Senior Officer, an officer of the Invesco Funds who reports directly to the independent Trustees. Over the course of each year, the Sub-Committees meet with portfolio managers for their assigned Invesco Funds and other members of management to review the performance, investment objective(s), policies, strategies and limitations and investment risks of these funds. The Sub-Committees meet regularly and at designated contract renewal meetings each year to conduct a review of the performance, fees, expenses and other matters related to their assigned Invesco Funds. Each Sub-Committee recommends to the Investments Committee, which in turn recommends to the full Board, whether to approve the continuance of each Invesco Fund’s investment advisory agreement and sub-advisory contracts for another year.
During the contract renewal process, the Trustees receive comparative performance and fee data regarding the Invesco Funds prepared by Invesco Advisers and an independent company, Lipper, Inc. (Lipper). The Trustees also receive an independent written evaluation from the Senior Officer. The Senior Officer’s evaluation is prepared as part of his responsibility to manage the process by which the Invesco Funds’ proposed management fees are negotiated during the annual contract renewal process to ensure they are negotiated in a manner that is at arms’ length and reasonable. The independent Trustees are assisted in their annual evaluation of the Fund’s investment advisory agreement by the Senior Officer and by independent legal counsel. The independent Trustees also discuss the continuance of the investment advisory agreement and sub-advisory contracts in private sessions with the Senior Officer and counsel.
In evaluating the fairness and reasonableness of the Fund’s investment advisory agreement and sub-advisory contracts, the Board considered, among other things, the factors discussed below. The Trustees also considered information provided in connection with fund acquisitions approved by the Trustees to rationalize the Invesco Funds product range following the acquisition of the retail mutual fund business of Morgan Stanley (the Morgan Stanley Transaction). The Trustees recognized that the advisory fees for the Invesco Funds include advisory fees that are the result of years of review and negotiation between the Trustees and Invesco Advisers as well as advisory fees inherited from Morgan Stanley and Van Kampen funds acquired in the Morgan Stanley Transaction. The Trustees’ deliberations and conclusions in a particular year may be based in part on their deliberations and conclusions regarding these same arrangements throughout the year and in prior years. One Trustee may have weighed a particular piece of information differently than another Trustee.
The discussion below serves as the Senior Officer’s independent written evaluation with respect to the Fund’s investment advisory agreement as well as a discussion of the material factors and related conclusions that formed the basis for the Board’s approval of the Fund’s investment advisory agreement and sub-advisory contracts. Unless otherwise stated, this information is current as of June 15, 2011, and may not reflect consideration of factors that became known to the Board after that date, including, for example, changes to the Fund’s performance, advisory fees, expense limitations and/or fee waivers.
Factors and Conclusions and Summary of Independent Written Fee Evaluation
| A. | Nature, Extent and Quality of Services Provided by Invesco Advisers and the Affiliated Sub-Advisers |
The Board reviewed the advisory services provided to the Fund by Invesco Advisers under the Fund’s investment advisory agreement, the performance of Invesco Advisers in providing these services, and the credentials and experience of the officers and employees of Invesco Advisers who provide these services, including the Fund’s portfolio manager or managers, with whom the Board met during the year. The Board’s review of the qualifications of Invesco Advisers to provide advisory services included the Board’s consideration of Invesco Advisers’ performance and investment process oversight, independent credit analysis and investment risk management.
In determining whether to continue the Fund’s investment advisory agreement, the Board considered the prior relationship between Invesco Advisers and the Fund, as well as the Board’s knowledge of Invesco Advisers’ operations, and concluded that it is beneficial to maintain the current relationship, in part, because of such knowledge. The Board also considered services that Invesco Advisers and its affiliates provide to the Invesco Funds such as various back office support functions, equity and fixed income trading operations, internal audit, distribution and legal and compliance. The Board concluded that the nature, extent and quality of the services provided to the Fund by Invesco Advisers are appropriate and satisfactory and the advisory services are provided in accordance with the terms of the Fund’s investment advisory agreement.
The Board reviewed the services provided by the Affiliated Sub-Advisers under the sub-advisory contracts and the credentials and experience of the officers and employees of the Affiliated Sub-Advisers who provide these services. The Board noted that the Affiliated Sub-Advisers have offices and personnel that are located in financial centers around the world. As a result, the Affiliated Sub-Advisers can provide research and investment analysis on the markets and economies of various countries in which the Fund invests and make recommendations on securities of companies located in such countries. The Board concluded that the sub-advisory contracts benefit the Fund and its shareholders by permitting Invesco Advisers to use the resources and talents of the Affiliated Sub-Advisers in managing the Fund. The Board concluded that the nature, extent and quality of the services provided by the Affiliated Sub-Advisers are appropriate and
23 Invesco Global Small & Mid Cap Growth Fund
satisfactory and in accordance with the terms of the Fund’s sub-advisory contracts.
| B. | Fund Performance |
The Board considered Fund performance as a relevant factor in considering whether to approve the investment advisory agreement. The Board did not view Fund performance as a relevant factor in considering whether to approve the sub-advisory contracts for the Fund, as no Affiliated Sub-Adviser currently manages assets of the Fund.
The Board compared the Fund’s performance during the past one, three and five calendar years to the performance of funds in the Lipper performance universe and against the Lipper Global Small-/Mid-Cap Funds Index. The Board noted that performance of Class A shares of the Fund was in the fourth quintile of the performance universe for the one year period, the fifth quintile for the three year period and the third quintile for the five year period (the first quintile being the best performing funds and the fifth quintile being the worst performing funds). The Board noted that performance of the Class A shares of the Fund was below the performance of the Index for the one and three year periods, and that Index performance data was not available for the five year period. Although the independent written evaluation of the Fund’s Senior Officer only considered Fund performance through the most recent calendar year, the Trustees also reviewed more recent Fund performance and this review did not change their conclusions.
| C. | Advisory and Sub-Advisory Fees and Fee Waivers |
The Board compared the Fund’s contractual advisory fee rate to the contractual advisory fee rates of funds in the Fund’s Lipper expense group at a common asset level. The Board noted that the contractual advisory fee rate for Class A shares of the Fund was below the median contractual advisory fee rate of funds in the expense group. The Board also reviewed the methodology used by Lipper in providing expense group information, which includes using audited financial data from the most recent annual report of each fund in the expense group that was publicly available as of the end of the past calendar year and including only one fund per investment adviser. The Board noted that comparative data is as of varying dates, which may affect the comparability of data during times of market volatility.
The Board noted that Invesco Advisers and the Affiliated Sub-Advisers do not manage other mutual funds or client accounts in a manner substantially similar to the management of the Fund.
The Board noted that Invesco Advisers has contractually agreed to waive fees and/or limit expenses of the Fund through at least February 28, 2012 in an amount necessary to limit total annual operating expenses to a specified percentage of average daily net assets for each class of the Fund. The Board noted that at the current expense ratio for the Fund, this expense waiver does not have any impact.
The Board also considered the services provided by the Affiliated Sub-Advisers pursuant to the sub-advisory contracts, as well as the allocation of fees between Invesco Advisers and the Affiliated Sub-Advisers pursuant to the sub-advisory contracts. The Board noted that Invesco Advisers provides services to sub-advised Invesco Funds, including oversight of the Affiliated Sub-Advisers as well as the additional services described above other than day-to-day portfolio management. The Board also noted that the sub-advisory fees have no direct effect on the Fund or its shareholders, as they are paid by Invesco Advisers to the Affiliated Sub-Advisers.
Based upon information and considerations described above, the Board concluded that the Fund’s advisory and sub-advisory fees are fair and reasonable.
| D. | Economies of Scale and Breakpoints |
The Board considered the extent to which there are economies of scale in the provision of advisory services to the Fund. The Board also considered whether the Fund benefits from economies of scale through contractual breakpoints in the Fund’s advisory fee schedule. The Board also noted that the Fund shares directly in economies of scale through lower fees charged by third party service providers based on the combined size of the Invesco Funds and other clients advised by Invesco Advisers.
| E. | Profitability and Financial Resources |
The Board reviewed information from Invesco Advisers concerning the costs of the advisory and other services that Invesco Advisers and its affiliates provide to the Fund and the profitability of Invesco Advisers and its affiliates in providing these services. The Board reviewed with Invesco Advisers the methodology used to prepare the profitability information. The Board considered the profitability of Invesco Advisers in connection with managing the Fund and the Invesco Funds. The Board noted that Invesco Advisers continues to operate at a net profit from services Invesco Advisers and its subsidiaries provide to the Fund and the Invesco Funds. The Board concluded that the level of profits realized by Invesco Advisers and its affiliates from providing services to the Fund is not excessive given the nature, quality and extent of the services provided to the Invesco Funds. The Board considered whether Invesco Advisers and each Affiliated Sub-Adviser are financially sound and have the resources necessary to perform their obligations under the investment advisory agreement and sub-advisory contracts. The Board concluded that Invesco Advisers and each Affiliated Sub-Adviser have the financial resources necessary to fulfill these obligations.
| F. | Collateral Benefits to Invesco Advisers and its Affiliates |
The Board considered various other benefits received by Invesco Advisers and its affiliates from the relationship with the Fund, including the fees received for their provision of administrative, transfer agency and distribution services to the Fund. The Board considered the performance of Invesco Advisers and its affiliates in providing these services and the organizational structure employed to provide these services. The Board also considered that these services are provided to the Fund pursuant to written contracts that are reviewed and approved on an annual basis by the Board; that the services are required for the operation of the Fund; that Invesco Advisers and its affiliates can provide services, the nature and quality of which are at least equal to those provided by others offering the same or similar services; and that the fees for such services are fair and reasonable in light of the usual and customary charges by others for services of the same nature and quality.
The Board considered the benefits realized by Invesco Advisers and the Affiliated Sub-Advisers as a result of portfolio brokerage transactions executed through “soft dollar” arrangements. The Board noted that soft dollar arrangements shift the payment obligation for research and execution services from Invesco Advisers and the Affiliated Sub-Advisers to the Invesco Funds and therefore may reduce Invesco Advisers’ and the Affiliated Sub-Advisers’ expenses. The Board concluded that the soft dollar arrangements are appropriate. The Board also concluded that, based on their review and representations made by the Chief Compliance Officer of the Invesco Funds, these arrangements are consistent with regulatory requirements.
The Board considered that the Fund’s uninvested cash and cash collateral from any securities lending arrangements may be invested in money market funds advised by Invesco Advisers pursuant to procedures approved by the Board. The Board noted that Invesco Advisers receives advisory fees from these affiliated money market funds attributable to such investments, although Invesco Advisers has contractually agreed to waive through varying periods the advisory fees payable by the Invesco Funds. The waiver is in an amount equal to 100% of the net advisory fee Invesco Advisers receives from the affiliated money market funds with respect to the Fund’s investment in the affiliated money market funds of uninvested cash, but not cash collateral. The Board concluded that the Fund’s investment of uninvested cash and cash collateral from any securities lending arrangements in the affiliated money market funds is in the best interests of the Fund and its shareholders.
24 Invesco Global Small & Mid Cap Growth Fund
Tax Information
Form 1099-DIV, Form 1042-S and other year-end tax information provide shareholders with actual calendar year amounts that should be included in their tax returns. Shareholders should consult their tax advisors.
The following distribution information is being provided as required by the Internal Revenue Code or to meet a specific state’s requirement.
The Fund designates the following amounts or, if subsequently determined to be different, the maximum amount allowable for its fiscal year ended October 31, 2011:
Federal and State Income Tax | ||||
| Qualified Dividend Income* | 100.00% | |||
| Corporate Dividends Received Deduction* | 38.47% | |||
| * | The above percentages are based on ordinary income dividends paid to shareholders during the Fund’s fiscal year. |
25 Invesco Global Small & Mid Cap Growth Fund
Trustees and Officers
The address of each trustee and officer is AIM International Mutual Funds (Invesco International Mutual Funds) (the “Trust”), 11 Greenway Plaza, Suite 2500, Houston, Texas 77046-1173. The trustees serve for the life of the Trust, subject to their earlier death, incapacitation, resignation, retirement or removal as more specifically provided in the Trust’s organizational documents. Each officer serves for a one year term or until their successors are elected and qualified. Column two below includes length of time served with predecessor entities, if any.
| Number of | ||||||||
| Funds in | ||||||||
| Fund Complex | ||||||||
| Name, Year of Birth and | Trustee and/ | Principal Occupation(s) | Overseen by | Other Directorship(s) | ||||
| Position(s) Held with the Trust | or Officer Since | During Past 5 Years | Trustee | Held by Trustee | ||||
| Interested Persons | ||||||||
Martin L. Flanagan1 — 1960 Trustee | 2007 | Executive Director, Chief Executive Officer and President, Invesco Ltd. (ultimate parent of Invesco and a global investment management firm); Advisor to the Board, Invesco Advisers, Inc. (formerly known as Invesco Institutional (N.A.), Inc.); Trustee, The Invesco Funds; Vice Chair, Investment Company Institute; and Member of Executive Board, SMU Cox School of Business | 141 | None | ||||
| Formerly: Chairman, Invesco Advisers, Inc. (registered investment adviser); Director, Chairman, Chief Executive Officer and President, IVZ Inc. (holding company), INVESCO Group Services, Inc. (service provider) and Invesco North American Holdings, Inc. (holding company); Director, Chief Executive Officer and President, Invesco Holding Company Limited (parent of Invesco and a global investment management firm); Director, Invesco Ltd.; Chairman, Investment Company Institute and President, Co-Chief Executive Officer, Co-President, Chief Operating Officer and Chief Financial Officer, Franklin Resources, Inc. (global investment management organization) | ||||||||
Philip A. Taylor2 — 1954 Trustee, President and Principal Executive Officer | 2006 | Head of North American Retail and Senior Managing Director, Invesco Ltd.; Director, Co-Chairman, Co-President and Co-Chief Executive Officer, Invesco Advisers, Inc. (formerly known as Invesco Institutional (N.A.), Inc.) (registered investment adviser); Director, Chairman, Chief Executive Officer and President, Invesco Management Group, Inc. (formerly Invesco Aim Management Group, Inc.) (financial services holding company); Director and President, INVESCO Funds Group, Inc. (registered investment adviser and registered transfer agent); Director and Chairman, Invesco Investment Services, Inc. (formerly known as Invesco Aim Investment Services, Inc.) (registered transfer agent) and IVZ Distributors, Inc. (formerly known as INVESCO Distributors, Inc.) (registered broker dealer); Director, President and Chairman, Invesco Inc. (holding company) and Invesco Canada Holdings Inc. (holding company); Chief Executive Officer, Invesco Corporate Class Inc. (corporate mutual fund company) and Invesco Canada Fund Inc. (corporate mutual fund company); Director, Chairman and Chief Executive Officer, Invesco Canada Ltd. (formerly known as Invesco Trimark Ltd./Invesco Trimark Ltèe) (registered investment adviser and registered transfer agent); Trustee, President and Principal Executive Officer, The Invesco Funds (other than AIM Treasurer’s Series Trust (Invesco Treasurer’s Series Trust) and Short-Term Investments Trust); Trustee and Executive Vice President, The Invesco Funds (AIM Treasurer’s Series Trust (Invesco Treasurer’s Series Trust) and Short-Term Investments Trust only); Director, Invesco Investment Advisers LLC (formerly known as Van Kampen Asset Management); Director, Chief Executive Officer and President, Van Kampen Exchange Corp. | 141 | None | ||||
| Formerly: Director and Chairman, Van Kampen Investor Services Inc.: | ||||||||
| Director, Chief Executive Officer and President, 1371 Preferred Inc. (holding company); and Van Kampen Investments Inc.; Director and President, AIM GP Canada Inc. (general partner for limited partnerships); and Van Kampen Advisors, Inc.; Director and Chief Executive Officer, Invesco Trimark Dealer Inc. (registered broker dealer); Director, Invesco Distributors, Inc. (formerly known as Invesco Aim Distributors, Inc.) (registered broker dealer); Manager, Invesco PowerShares Capital Management LLC; Director, Chief Executive Officer and President, Invesco Advisers, Inc.; Director, Chairman, Chief Executive Officer and President, Invesco Aim Capital Management, Inc.; President, Invesco Trimark Dealer Inc. and Invesco Trimark Ltd./Invesco Trimark Ltèe; Director and President, AIM Trimark Corporate Class Inc. and AIM Trimark Canada Fund Inc.; Senior Managing Director, Invesco Holding Company Limited; Trustee and Executive Vice President, Tax-Free Investments Trust; Director and Chairman, Fund Management Company (former registered broker dealer); President and Principal Executive Officer, The Invesco Funds (AIM Treasurer’s Series Trust (Invesco Treasurer’s Series Trust), Short-Term Investments Trust and Tax-Free Investments Trust only); President, AIM Trimark Global Fund Inc. and AIM Trimark Canada Fund Inc. | ||||||||
Wayne W. Whalen3 — 1939 Trustee | 2010 | Of Counsel, and prior to 2010, partner in the law firm of Skadden, Arps, Slate, Meagher & Flom LLP, legal counsel to funds in the Fund Complex | 159 | Director of the Abraham Lincoln Presidential Library Foundation | ||||
| Independent Trustees | ||||||||
| Bruce L. Crockett — 1944 Trustee and Chair | 1992 | Chairman, Crockett Technology Associates (technology consulting company) Formerly: Director, Captaris (unified messaging provider); Director, President and Chief Executive Officer COMSAT Corporation; and Chairman, Board of Governors of INTELSAT (international communications company) | 141 | ACE Limited (insurance company); and Investment Company Institute | ||||
| David C. Arch — 1945 Trustee | 2010 | Chairman and Chief Executive Officer of Blistex Inc., a consumer health care products manufacturer. | 159 | Member of the Heartland Alliance Advisory Board, a nonprofit organization serving human needs based in Chicago. Board member of the Illinois Manufacturers’ Association. Member of the Board of Visitors, Institute for the Humanities, University of Michigan | ||||
| 1 | Mr. Flanagan is considered an interested person of the Trust because he is an officer of the adviser to the Trust, and an officer and a director of Invesco Ltd., ultimate parent of the adviser to the Trust. |
| 2 | Mr. Taylor is considered an interested person of the Trust because he is an officer and a director of the adviser to, and a director of the principal underwriter of, the Trust. |
| 3 | Mr. Whalen has been deemed to be an interested person of the Trust because of his prior service as counsel to the predecessor funds of certain Invesco open-end funds and his affiliation with the law firm that served as counsel to such predecessor funds and continues to serve as counsel to the Invesco Van Kampen closed-end funds. |
T-1 Invesco Global Small & Mid Cap Growth Fund
Trustees and Officers—(continued)
The address of each trustee and officer is AIM International Mutual Funds (Invesco International Mutual Funds) (the “Trust”), 11 Greenway Plaza, Suite 2500, Houston, Texas 77046-1173. The trustees serve for the life of the Trust, subject to their earlier death, incapacitation, resignation, retirement or removal as more specifically provided in the Trust’s organizational documents. Each officer serves for a one year term or until their successors are elected and qualified. Column two below includes length of time served with predecessor entities, if any.
| Number of | ||||||||
| Funds in | ||||||||
| Fund Complex | ||||||||
| Name, Year of Birth and | Trustee and/ | Principal Occupation(s) | Overseen by | Other Directorship(s) | ||||
| Position(s) Held with the Trust | or Officer Since | During Past 5 Years | Trustee | Held by Trustee | ||||
| Independent Trustees—(continued) | ||||||||
| Bob R. Baker — 1936 Trustee | 2003 | Retired Formerly: President and Chief Executive Officer, AMC Cancer Research Center; and Chairman and Chief Executive Officer, First Columbia Financial Corporation | 141 | None | ||||
| Frank S. Bayley — 1939 Trustee | 2001 | Retired Formerly: Director, Badgley Funds, Inc. (registered investment company) (2 portfolios) and Partner, law firm of Baker & McKenzie | 141 | Director and Chairman, C.D. Stimson Company (a real estate investment company) | ||||
| James T. Bunch — 1942 Trustee | 2003 | Founder, Green, Manning & Bunch Ltd. (investment banking firm) Formerly: Executive Committee, United States Golf Association; and Director, Policy Studies, Inc. and Van Gilder Insurance Corporation | 141 | Vice Chairman, Board of Governors, Western Golf Association/Evans Scholars Foundation and Director, Denver Film Society | ||||
| Rodney F. Dammeyer — 1940 Trustee | 2010 | President of CAC, LLC, a private company offering capital investment and management advisory services. Formerly: Prior to January 2004, Director of TeleTech Holdings Inc.; Prior to 2002, Director of Arris Group, Inc.; Prior to 2001, Managing Partner at Equity Group Corporate Investments. Prior to 1995, Vice Chairman of Anixter International. Prior to 1985, experience includes Senior Vice President and Chief Financial Officer of Household International, Inc, Executive Vice President and Chief Financial Officer of Northwest Industries, Inc. and Partner of Arthur Andersen & Co. | 159 | Director of Quidel Corporation and Stericycle, Inc. Prior to May 2008, Trustee of The Scripps Research Institute. Prior to February 2008, Director of Ventana Medical Systems, Inc. Prior to April 2007, Director of GATX Corporation. Prior to April 2004, Director of TheraSense, Inc. | ||||
| Albert R. Dowden — 1941 Trustee | 2000 | Director of a number of public and private business corporations, including the Boss Group, Ltd. (private investment and management); Reich & Tang Funds (5 portfolios) (registered investment company); and Homeowners of America Holding Corporation/ Homeowners of America Insurance Company (property casualty company) Formerly: Director, Continental Energy Services, LLC (oil and gas pipeline service); Director, CompuDyne Corporation (provider of product and services to the public security market) and Director, Annuity and Life Re (Holdings), Ltd. (reinsurance company); Director, President and Chief Executive Officer, Volvo Group North America, Inc.; Senior Vice President, AB Volvo; Director of various public and private corporations; Chairman, DHJ Media, Inc.; Director Magellan Insurance Company; and Director, The Hertz Corporation, Genmar Corporation (boat manufacturer), National Media Corporation; Advisory Board of Rotary Power International (designer, manufacturer, and seller of rotary power engines); and Chairman, Cortland Trust, Inc. (registered investment company) | 141 | Board of Nature’s Sunshine Products, Inc. | ||||
| Jack M. Fields — 1952 Trustee | 1997 | Chief Executive Officer, Twenty First Century Group, Inc. (government affairs company); and Owner and Chief Executive Officer, Dos Angelos Ranch, L.P. (cattle, hunting, corporate entertainment), Discovery Global Education Fund (non-profit) and Cross Timbers Quail Research Ranch (non-profit) Formerly: Chief Executive Officer, Texana Timber LP (sustainable forestry company) and member of the U.S. House of Representatives | 141 | Administaff | ||||
| Carl Frischling — 1937 Trustee | 1991 | Partner, law firm of Kramer Levin Naftalis and Frankel LLP | 141 | Director, Reich & Tang Funds (6 portfolios) | ||||
| Prema Mathai-Davis — 1950 Trustee | 1998 | Retired Formerly: Chief Executive Officer, YWCA of the U.S.A. | 141 | None | ||||
| Larry Soll — 1942 Trustee | 2003 | Retired Formerly, Chairman, Chief Executive Officer and President, Synergen Corp. (a biotechnology company) | 141 | None | ||||
| Hugo F. Sonnenschein — 1940 Trustee | 2010 | President Emeritus and Honorary Trustee of the University of Chicago and the Adam Smith Distinguished Service Professor in the Department of Economics at the University of Chicago. Prior to July 2000, President of the University of Chicago. | 159 | Trustee of the University of Rochester and a member of its investment committee. Member of the National Academy of Sciences, the American Philosophical Society and a fellow of the American Academy of Arts and Sciences | ||||
| Raymond Stickel, Jr. — 1944 Trustee | 2005 | Retired | 141 | Director of Long Cove Club Owners’ association (home owner’s association) | ||||
| Formerly: Director, Mainstay VP Series Funds, Inc. (25 portfolios) and Partner, Deloitte & Touche | ||||||||
T-2 Invesco Global Small & Mid Cap Growth Fund
Trustees and Officers—(continued)
The address of each trustee and officer is AIM International Mutual Funds (Invesco International Mutual Funds) (the “Trust”), 11 Greenway Plaza, Suite 2500, Houston, Texas 77046-1173. The trustees serve for the life of the Trust, subject to their earlier death, incapacitation, resignation, retirement or removal as more specifically provided in the Trust’s organizational documents. Each officer serves for a one year term or until their successors are elected and qualified. Column two below includes length of time served with predecessor entities, if any.
| Number of | ||||||||
| Funds in | ||||||||
| Fund Complex | ||||||||
| Name, Year of Birth and | Trustee and/ | Principal Occupation(s) | Overseen by | Other Directorship(s) | ||||
| Position(s) Held with the Trust | or Officer Since | During Past 5 Years | Trustee | Held by Trustee | ||||
| Other Officers | ||||||||
| Russell C. Burk — 1958 Senior Vice President and Senior Officer | 2005 | Senior Vice President and Senior Officer of Invesco Funds | N/A | N/A | ||||
| John M. Zerr — 1962 Senior Vice President, Chief Legal Officer and Secretary | 2006 | Director, Senior Vice President, Secretary and General Counsel, Invesco Management Group, Inc. (formerly known as Invesco Aim Management Group, Inc.) and Van Kampen Exchange Corp.; Senior Vice President, Invesco Advisers, Inc. (formerly known as Invesco Institutional (N.A.), Inc.) (registered investment adviser); Senior Vice President and Secretary, Invesco Distributors, Inc. (formerly known as Invesco Aim Distributors, Inc.); Director, Vice President and Secretary, Invesco Investment Services, Inc. (formerly known as Invesco Aim Investment Services, Inc.) and IVZ Distributors, Inc. (formerly known as INVESCO Distributors, Inc.); Director and Vice President, INVESCO Funds Group, Inc.; Senior Vice President, Chief Legal Officer and Secretary, The Invesco Funds; Manager, Invesco PowerShares Capital Management LLC; Director, Secretary and General Counsel, Invesco Investment Advisers LLC (formerly known as Van Kampen Asset Management); Secretary and General Counsel, Van Kampen Funds Inc. and Chief Legal Officer, PowerShares Exchange-Traded Fund Trust, PowerShares Exchange-Traded Fund Trust II, PowerShares India Exchange-Traded Fund Trust and PowerShares Actively Managed Exchange-Traded Fund Trust Formerly: Director and Secretary, Van Kampen Advisors Inc.; Director Vice President, Secretary and General Counsel Van Kampen Investor Services Inc.; Director, Invesco Distributors, Inc. (formerly known as Invesco Aim Distributors, Inc.); Director, Senior Vice President, General Counsel and Secretary, Invesco Advisers, Inc.; and Van Kampen Investments Inc.; Director, Vice President and Secretary, Fund Management Company; Director, Senior Vice President, Secretary, General Counsel and Vice President, Invesco Aim Capital Management, Inc.; Chief Operating Officer and General Counsel, Liberty Ridge Capital, Inc. (an investment adviser); Vice President and Secretary, PBHG Funds (an investment company) and PBHG Insurance Series Fund (an investment company); Chief Operating Officer, General Counsel and Secretary, Old Mutual Investment Partners (a broker-dealer); General Counsel and Secretary, Old Mutual Fund Services (an administrator) and Old Mutual Shareholder Services (a shareholder servicing center); Executive Vice President, General Counsel and Secretary, Old Mutual Capital, Inc. (an investment adviser); and Vice President and Secretary, Old Mutual Advisors Funds (an investment company) | N/A | N/A | ||||
| Lisa O. Brinkley — 1959 Vice President | 2004 | Global Compliance Director, Invesco Ltd.; Chief Compliance Officer, Invesco Investment Services, Inc.(formerly known as Invesco Aim Investment Services, Inc.); and Vice President, The Invesco Funds Formerly: Chief Compliance Officer, Invesco Distributors, Inc. (formerly known as Invesco Aim Distributors, Inc.) and Van Kampen Investor Services Inc.; Senior Vice President, Invesco Management Group, Inc.; Senior Vice President and Chief Compliance Officer, Invesco Advisers, Inc. and The Invesco Funds; Vice President and Chief Compliance Officer, Invesco Aim Capital Management, Inc. and Invesco Distributors, Inc.; Vice President, Invesco Investment Services, Inc. and Fund Management Company | N/A | N/A | ||||
| Sheri Morris — 1964 Vice President, Treasurer and Principal Financial Officer | 1999 | Vice President, Treasurer and Principal Financial Officer, The Invesco Funds; and Vice President, Invesco Advisers, Inc. (formerly known as Invesco Institutional (N.A.), Inc.) (registered investment adviser). | N/A | N/A | ||||
| Formerly: Treasurer, PowerShares Exchange-Traded Fund Trust, PowerShares Exchange-Traded Fund Trust II, PowerShares India Exchange-Traded Fund Trust and PowerShares Actively Managed Exchange-Traded Fund Trust; Vice President, Invesco Advisers, Inc., Invesco Aim Capital Management, Inc. and Invesco Aim Private Asset Management, Inc.; Assistant Vice President and Assistant Treasurer, The Invesco Funds and Assistant Vice President, Invesco Advisers, Inc., Invesco Aim Capital Management, Inc. and Invesco Aim Private Asset Management, Inc. | ||||||||
T-3 Invesco Global Small & Mid Cap Growth Fund
Trustees and Officers—(continued)
The address of each trustee and officer is AIM International Mutual Funds (Invesco International Mutual Funds) (the “Trust”), 11 Greenway Plaza, Suite 2500, Houston, Texas 77046-1173. The trustees serve for the life of the Trust, subject to their earlier death, incapacitation, resignation, retirement or removal as more specifically provided in the Trust’s organizational documents. Each officer serves for a one year term or until their successors are elected and qualified. Column two below includes length of time served with predecessor entities, if any.
| Number of | ||||||||
| Funds in | ||||||||
| Fund Complex | ||||||||
| Name, Year of Birth and | Trustee and/ | Principal Occupation(s) | Overseen by | Other Directorship(s) | ||||
| Position(s) Held with the Trust | or Officer Since | During Past 5 Years | Trustee | Held by Trustee | ||||
| Other Officers—(continued) | ||||||||
| Karen Dunn Kelley — 1960 Vice President | 2004 | Head of Invesco’s World Wide Fixed Income and Cash Management Group; Senior Vice President, Invesco Advisers, Inc. (formerly known as Invesco Institutional (N.A.), Inc.) (registered investment adviser); Executive Vice President, Invesco Distributors, Inc. (formerly known as Invesco Aim Distributors, Inc.); Senior Vice President, Invesco Management Group, Inc. (formerly known as Invesco Aim Management Group, Inc.); and Director, Invesco Mortgage Capital Inc.; Vice President, The Invesco Funds (other than AIM Treasurer’s Series Trust (Invesco Treasurer’s Series Trust) and Short-Term Investments Trust); President and Principal Executive Officer, The Invesco Funds (AIM Treasurer’s Series Trust (Invesco Treasurer’s Series Trust) and Short-Term Investments Trust only). Formerly: Senior Vice President, Van Kampen Investments Inc.; Vice President, Invesco Advisers, Inc. (formerly known as Invesco Institutional (N.A.), Inc.); Director of Cash Management and Senior Vice President, Invesco Advisers, Inc. and Invesco Aim Capital Management, Inc.; President and Principal Executive Officer, Tax-Free Investments Trust; Director and President, Fund Management Company; Chief Cash Management Officer, Director of Cash Management, Senior Vice President, and Managing Director, Invesco Aim Capital Management, Inc.; Director of Cash Management, Senior Vice President, and Vice President, Invesco Advisers, Inc. and The Invesco Funds (AIM Treasurer’s Series Trust (Invesco Treasurer’s Series Trust), Short-Term Investments Trust and Tax-Free Investments Trust only) | N/A | N/A | ||||
| Lance A. Rejsek — 1967 Anti-Money Laundering Compliance Officer | 2005 | Anti-Money Laundering Compliance Officer, Invesco Advisers, Inc. (formerly known as Invesco Institutional (N.A.), Inc.) (registered investment adviser); Invesco Distributors, Inc. (formerly known as Invesco Aim Distributors, Inc.), Invesco Investment Services, Inc. (formerly known as Invesco Aim Investment Services, Inc.), The Invesco Funds, PowerShares Exchange-Traded Fund Trust, PowerShares Exchange-Traded Fund Trust II, PowerShares India Exchange-Traded Fund Trust, PowerShares Actively Managed Exchange-Traded Fund Trust, Invesco Investment Advisers LLC (formerly known as Van Kampen Asset Management) and Van Kampen Funds Inc. Formerly: Anti-Money Laundering Compliance Officer, Van Kampen Investor Services Inc., Fund Management Company, Invesco Advisers, Inc., Invesco Aim Capital Management, Inc. and Invesco Aim Private Asset Management, Inc. | N/A | N/A | ||||
| Todd L. Spillane — 1958 Chief Compliance Officer | 2006 | Senior Vice President, Invesco Management Group, Inc. (formerly known as Invesco Aim Management Group, Inc.) and Van Kampen Exchange Corp.; Senior Vice President and Chief Compliance Officer, Invesco Advisers, Inc. (registered investment adviser) (formerly known as Invesco Institutional (N.A.), Inc.); Chief Compliance Officer, The Invesco Funds, PowerShares Exchange-Traded Fund Trust, PowerShares Exchange-Traded Fund Trust II, PowerShares India Exchange-Traded Fund Trust, PowerShares Actively Managed Exchange-Traded Fund Trust, INVESCO Private Capital Investments, Inc. (holding company) and Invesco Private Capital, Inc. (registered investment adviser); Vice President, Invesco Distributors, Inc. (formerly known as Invesco Aim Distributors, Inc.) and Invesco Investment Services, Inc. (formerly known as Invesco Aim Investment Services, Inc.). | N/A | N/A | ||||
| Formerly: Chief Compliance Officer, Invesco Van Kampen Closed-End Funds; Senior Vice President, Van Kampen Investments Inc.; Senior Vice President and Chief Compliance Officer, Invesco Advisers, Inc. and Invesco Aim Capital Management, Inc.; Chief Compliance Officer, Invesco Global Asset Management (N.A.), Inc., Invesco Senior Secured Management, Inc. (registered investment adviser) and Van Kampen Investor Services Inc.; Vice President, Invesco Aim Capital Management, Inc. and Fund Management Company | ||||||||
The Statement of Additional Information of the Trust includes additional information about the Fund’s Trustees and is available upon request, without charge, by calling 1.800.959.4246. Please refer to the Fund’s prospectus for information on the Fund’s sub-advisers.
| Office of the Fund 11 Greenway Plaza, Suite 2500 Houston, TX 77046-1173 | Investment Adviser Invesco Advisers, Inc. 1555 Peachtree Street, N.E. Atlanta, GA 30309 | Distributor Invesco Distributors, Inc. 11 Greenway Plaza, Suite 2500 Houston, TX 77046-1173 | Auditors PricewaterhouseCoopers LLP 1201 Louisiana Street, Suite 2900 Houston, TX 77002-5678 | |||
| Counsel to the Fund Stradley Ronon Stevens & Young, LLP 2600 One Commerce Square Philadelphia, PA 19103 | Counsel to the Independent Trustees Kramer, Levin, Naftalis & Frankel LLP 1177 Avenue of the Americas New York, NY 10036-2714 | Transfer Agent Invesco Investment Services, Inc. 11 Greenway Plaza, Suite 2500 Houston, TX 77046-1173 | Custodian State Street Bank and Trust Company 225 Franklin Boston, MA 02110-2801 |
T-4 Invesco Global Small & Mid Cap Growth Fund

Invesco mailing information
Send general correspondence to Invesco Investment Services, Inc., P.O. Box 219078, Kansas City, MO 64121-9078.
Invesco privacy policy
You share personal and financial information with us that is necessary for your transactions and your account records. We take very seriously the obligation to keep that information confidential and private.
Invesco collects nonpublic personal information about you from account applications or other forms you complete and from your transactions with us or our affiliates. We do not disclose information about you or our former customers to service providers or other third parties except to the extent necessary to service your account and in other limited circumstances as permitted by law. For example, we use this information to facilitate the delivery of transaction confirmations, financial reports, prospectuses and tax forms.
Even within Invesco, only people involved in the servicing of your accounts and compliance monitoring have access to your information. To ensure the highest level of confidentiality and security, Invesco maintains physical, electronic and procedural safeguards that meet or exceed federal standards. Special measures, such as data encryption and authentication, apply to your communications with us on our website. More detail is available to you at invesco.com/privacy.
Important notice regarding delivery of security holder documents
To reduce Fund expenses, only one copy of most shareholder documents may be mailed to shareholders with multiple accounts at the same address (Householding). Mailing of your shareholder documents may be householded indefinitely unless you instruct us otherwise. If you do not want the mailing of these documents to be combined with those for other members of your household, please contact Invesco Investment Services, Inc. at 800 959 4246 or contact your financial institution. We will begin sending you individual copies for each account within 30 days after receiving your request.
Fund holdings and proxy voting information
The Fund provides a complete list of its holdings four times in each fiscal year, at the quarter-ends. For the second and fourth quarters, the lists appear in the Fund’s semiannual and annual reports to shareholders. For the first and third quarters, the Fund files the lists with the Securities and Exchange Commission (SEC) on Form N-Q. The most recent list of portfolio holdings is available at invesco.com/completeqtrholdings. Shareholders can also look up the Fund’s Forms N-Q on the SEC website at sec.gov. Copies of the Fund’s Forms N-Q may be reviewed and copied at the SEC Public Reference Room in Washington, D.C. You can obtain information on the operation of the Public Reference Room, including information about duplicating fee charges, by calling 202 551 8090 or 800 732 0330, or by electronic request at the following email address: publicinfo@sec.gov. The SEC file numbers for the Fund are 811-06463 and 033-44611.
A description of the policies and procedures that the Fund uses to determine how to vote proxies relating to portfolio securities is available without charge, upon request, from our Client Services department at 800 959 4246 or at invesco.com/proxyguidelines. The information is also available on the SEC website, sec.gov.

Information regarding how the Fund voted proxies related to its portfolio securities during the 12 months ended June 30, 2011, is available at invesco.com/proxysearch. The information is also available on the SEC website, sec.gov.
Invesco Advisers, Inc. is an investment adviser; it provides investment advisory services to individual and institutional clients and does not sell securities. Invesco Distributors, Inc. is the U.S. distributor for Invesco Ltd.’s retail mutual funds, exchange-traded funds and institutional money market funds. Both are wholly owned, indirect subsidiaries of Invesco Ltd.
| GSMG-AR-1 | Invesco Distributors, Inc. |
 |
| Annual Report to Shareholders | October 31, 2011 |
Invesco International Core Equity Fund
Nasdaq:
A: IBVAX § B: IBVBX § C: IBVCX § R: IIBRX § Y: IBVYX § Investor: IIBCX
Institutional: IBVIX
A: IBVAX § B: IBVBX § C: IBVCX § R: IIBRX § Y: IBVYX § Investor: IIBCX
Institutional: IBVIX
| 2 | Letters to Shareholders | |
| 4 | Performance Summary | |
| 4 | Management Discussion | |
| 6 | Long-Term Fund Performance | |
| 8 | Supplemental Information | |
| 9 | Schedule of Investments | |
| 12 | Financial Statements | |
| 14 | Notes to Financial Statements | |
| 21 | Financial Highlights | |
| 22 | Auditor’s Report | |
| 23 | Fund Expenses | |
| 24 | Approval of Investment Advisory and Sub-Advisory Agreements | |
| 26 | Tax Information | |
| T-1 | Trustees and Officers |
Letters to Shareholders

Philip Taylor
Dear Shareholders:
Enclosed is important information about your Fund and its performance. I encourage you to read this report to learn more about your Fund’s short- and long-term performance and its holdings as of the close of the reporting period. This report also includes useful information about your Fund’s management team and a discussion of how your Fund was managed during the reporting period.
Investors are likely to confront both opportunities and challenges in 2012 – just as we did in 2011. After all, changes in market sentiment never do investors the courtesy of announcing their impending arrival, and your goals and needs may have changed, requiring changes in your financial strategy.
That’s why the start of a new year is always a good time to catch up with your financial adviser. He or she can explain how your investments performed in the year just ended – how each performed individually, and more important, how they performed as a diversified portfolio. Of course, it’s important to remember that an investment’s long-term performance is more important than its short-term performance. Looking ahead to the new year and evaluating your individual situation, your financial adviser can provide valuable insight into whether your investments are still appropriate for your individual needs, goals and risk tolerance.
For current information about your Fund
In addition to meeting with your financial adviser to discuss your individual situation at the start of the new year, you also may find it helpful to stay abreast of market trends and developments. Doing so may provide reassurance in times of economic uncertainty and market volatility such as we saw in 2011 – and are likely to see again in 2012.
Invesco can help you stay informed about your investments and market trends. On our website, invesco.com/us, we provide timely market updates and commentary from many of our fund managers and other investment professionals. Also on our website, you can obtain information about your account at any hour of the day or night. I invite you to visit and explore the tools and information we offer at invesco.com/us.
Our commitment to investment excellence
As we’ve seen over the last several years, market conditions can change – often suddenly and dramatically. That’s one reason financial advisers typically advise their clients to be well diversified and to maintain a long-term investment focus. While diversification can’t guarantee a profit or protect against loss, it may cushion the impact of dramatic market moves. Maintaining a long-term investment focus for your long-term goals – financing your retirement or your children’s education, for example – may help you avoid making rash investment decisions based on short-term market swings.
Likewise, Invesco’s investment professionals maintain a long-term focus. Across our broad array of investment products, investment excellence is our ultimate goal. Each of our funds is managed by specialized teams of investment professionals, and as a company, we maintain a single focus – investment management – that allows our fund managers to concentrate on doing what they do best: managing your money.
Our funds are managed strictly according to their stated investment objectives and strategies, with robust risk oversight using consistent, repeatable investment processes that don’t change in response to short-term market events. This disciplined approach can’t guarantee a profit; no investment can do that, since all involve some measure of risk. But it can ensure that your money is managed the way we said it would be – according to your Fund’s objective and strategies.
Our adherence to stated investment objectives and strategies allows your financial adviser to build a diversified portfolio that meets your individual risk tolerance and financial goals. It also means that when your goals change, your financial adviser will be able to find an Invesco fund that’s appropriate for your needs.
Questions?
If you have questions about your account, please contact one of our client service representatives at 800 959 4246. If you have a general Invesco-related question or comment for me, I invite you to email me directly at phil@invesco.com.
All of us at Invesco look forward to serving your investment management needs for many years to come. Thank you for investing with us.
Sincerely,

Philip Taylor
Senior Managing Director, Invesco Ltd.
Senior Managing Director, Invesco Ltd.
| 2 | Invesco International Core Equity Fund |

Bruce Crockett
Dear Fellow Shareholders:
Although the world’s economies are gradually recovering from the financial crisis, it has not been a smooth path. Unrest in the Middle East, persistently weak job and housing markets in the U.S. and continued government balance sheet repair in Europe are contributing to a slow, labored march toward global recovery.
In this environment, investors face risks that could make it more difficult to achieve their long-term financial goals – a secure retirement, home ownership, a child’s college education. Although the markets are complex and dynamic, there are ways to simplify the process and potentially increase your odds of achieving your goals. The best approach is to create a solid financial plan that helps you save and invest in ways that anticipate your needs over the long term.
Your financial adviser can help you define your financial plan, develop an appropriate investment strategy and put you in a better position to achieve your financial goals over the long term. This can take some of the guesswork out of the process and help you make thoughtful investments. Your financial adviser also can help you better understand your tolerance for risk, so that your investment approach lets you sleep at night while getting you closer to your goals. Lastly, your financial adviser can develop an asset allocation strategy that seeks to balance your investment approach, providing some protection against a decline in the markets while allowing you to participate in rising markets. Invesco calls this type of approach “intentional investing.” It means thinking carefully, planning thoughtfully and acting deliberately.
While no investment can guarantee favorable returns, your Board remains committed to managing costs and enhancing the performance of Invesco’s funds as part of our Investor First orientation. We continue to oversee the funds with the same strong sense of responsibility for your money and your continued trust that we’ve always maintained.
Thanks to the approval of our fund shareholders, Invesco has made great progress in realigning our U.S. mutual fund product line following our acquisition of Morgan Stanley’s retail asset management business, including Van Kampen Investments. When completed, the realignment will reduce overlap in the product lineup, enhance efficiency across our product line and build a solid foundation for further growth to meet client and shareholder needs. I would like to thank those of you who voted your proxy, and I hope our shareholders haven’t been too inconvenienced by the process.
As always, please contact me at bruce@brucecrockett.com with any questions or concerns you may have. On behalf of your Board, we look forward to continuing to represent your interests and serving your needs.
Sincerely,

Bruce L. Crockett
Independent Chair
Invesco Funds Board of Trustees
Independent Chair
Invesco Funds Board of Trustees
| 3 | Invesco International Core Equity Fund |
Management’s Discussion of Fund Performance
Performance summary
For the fiscal year ended October 31, 2011, all share classes of Invesco International Core Equity Fund, at net asset value (NAV), underperformed its benchmark, the MSCI EAFE Index, and the Lipper International Large-Cap Core Funds Index.
Stock selection in the consumer staples, telecommunication services and utilities sectors contributed positively to Fund performance, while holdings in the information technology (IT), materials, financials, industrials and consumer discretionary sectors detracted during the reporting period.
Your Fund’s long-term performance appears later in this report.
Fund vs. Indexes
Total returns, 10/31/10 to 10/31/11, at net asset value (NAV). Performance shown does not include applicable contingent deferred sales charges (CDSC) or front-end sales charges, which would have reduced performance.
| Class A Shares | -7.46 | % | ||
| Class B Shares | -8.16 | |||
| Class C Shares | -8.19 | |||
| Class R Shares | -7.76 | |||
| Class Y Shares | -7.23 | |||
| Investor Class Shares | -7.53 | |||
| Institutional Class Shares | -6.85 | |||
MSCI EAFE Index▼ (Broad Market/Style-Specific Index) | -4.08 | |||
Lipper International Large-Cap Core Funds Index▼ (Peer Group Index) | -5.91 | |||
| Source(s): ▼Lipper Inc. | ||
How we invest
The Fund invests primarily in stocks of mid- and large-cap foreign companies with a record of stable earnings and strong balance sheets. Our investment process includes a valuation assessment, fundamental research and team-based portfolio decisions. We address risk at the security level by emphasizing balance sheet strength and earnings stability of individual holdings. At the portfolio level, we seek to achieve appropriate diversification relative to the index. We are committed to a long-term investment horizon resulting in low rates of portfolio turnover. Risk management efforts also seek to ensure that the largest single component of active risk is security specific, which is consistent with stock selection being the sole targeted area of excess return.
We strive to maintain a consistent investment discipline through varying market conditions and an appropriate level of overall portfolio diversification. Individual holdings are selected based on their own merits, however, and not on projections of country or sector performance.
Our sell discipline is a replication of the security selection process in that we look to trim or liquidate positions in the portfolio based on valuation, fundamentals or portfolio design considerations.
Market conditions and your Fund
Global equity markets faced headwinds in 2010 and 2011. Notably, several southern European economies, including Greece, Spain, Portugal and Italy, faced solvency concerns amid massive fiscal deficits. Although the U.S. economy
continued with a positive growth rate in 2010 and into 2011, investors remained concerned about high unemployment and a still-weak housing market. The reporting period ended with a market upswing as European leaders took steps to address the Greek sovereign debt issue, expand the bailout fund and stabilize the banking system.
Market volatility was a common theme for the reporting period. The sovereign debt crisis intensified in the eurozone and global growth slowed, prompting concerns of a global recession. Market volatility increased drastically due to civil unrest in the Middle East and northern Africa and a devastating earthquake and tsunami in Japan. Renewed credit problems overseas and the market correction that occurred in May, June and August created a more uncertain environment, which prompted many investors to favor safety over risk.
In emerging market countries, investors grew risk-averse on news of potential defaults in Europe as well as slowing growth and accounting concerns in China. This led to a relatively indiscriminate correction in almost all emerging market countries. Concerns about potential overheating in emerging market economies, coupled with concerns of a potential double-dip recession in developed economies, continued to foster uncertainty about the pace and vigor of a global economic recovery.
The Fund stayed true to its process and benefited from its quality orientation in stock selection in several sectors. Our stock selection within the consumer staples, telecommunication services and utilities sectors made the largest contribution to the Fund’s relative results. Within consumer staples, U.K.-based Imperial Tobacco Group, an international tobacco company, was a top contributor. In the telecommunication services sector,
Portfolio Composition
By sector
| Financials | 18.7 | % | ||
| Energy | 11.7 | |||
| Materials | 11.7 | |||
| Consumer Staples | 10.7 | |||
| Consumer Discretionary | 10.2 | |||
| Industrials | 9.8 | |||
| Telecommunication Services | 8.9 | |||
| Health Care | 6.6 | |||
| Utilities | 4.8 | |||
| Information Technology | 3.1 | |||
Money Market Funds | ||||
Plus Other Assets Less Liabilities | 3.8 | |||
Top 10 Equity Holdings*
| 1. | Imperial Tobacco Group PLC | 3.3 | % | |||||
| 2. | Swisscom AG | 2.7 | ||||||
| 3. | Royal Dutch Shell PLC-ADR | 2.7 | ||||||
| 4. | BHP Billiton Ltd. | 2.6 | ||||||
| 5. | Sanofi | 2.5 | ||||||
| 6. | Yara International A.S.A. | 2.3 | ||||||
| 7. | Zurich Financial Services AG | 2.3 | ||||||
| 8. | Bouygues S.A. | 2.2 | ||||||
| 9. | Porsche Automobil Holding SE | 2.1 | ||||||
| 10. | Yamada Denki Co., Ltd. | 2.1 | ||||||
| Total Net Assets | $292.8 million | |
| Total Number of Holdings* | 104 |
The Fund’s holdings are subject to change, and there is no assurance that the Fund will continue to hold any particular security.
*Excluding money market fund holdings.
*Excluding money market fund holdings.
| 4 | Invesco International Core Equity Fund |
Australian-based Telstra was also a notable contributor to the portfolio. Detracting from the Fund’s relative performance was stock selection in the industrials, IT, financials and consumer discretionary sectors. While the health care sector delivered positive absolute returns, the Fund’s underweight in this sector was a drag on performance. Within the consumer discretionary sector, Hong Kong clothing retailer Esprit detracted from the Fund’s performance. Additionally, the Fund’s financial holdings in Danish bank Danske Bank and French bank BNP Paribas negatively affected Fund performance for the reporting period. On an absolute basis, Fund holdings in the consumer staples, energy, health care, telecommunication services and utilities sectors posted positive returns during the fiscal year.
From a geographical perspective, the Fund’s exposure to continental Europe was a detractor from Fund performance during the fiscal year. Specifically, stock selection in Denmark, Finland, France, Greece and Switzerland negatively affected the Fund’s returns. Stock selection in Hong Kong was also a detractor for the Fund. Conversely, our stock selection in Italy, the Netherlands and the U.K. helped Fund performance versus the benchmark. The Fund also benefited from a slight overweight exposure to Japan.
From a positioning perspective, the Fund increased its allocation to the consumer discretionary and consumer staples sectors during the fiscal year, although it remained underweight relative to the benchmark. The Fund also increased its weightings in the materials and telecommunication sectors while lowering its weighting in the energy, health care, industrials and IT sectors.
From a geographic perspective, the Fund maintained a healthy weighting in emerging markets and Canada, while being modestly underweight in Germany, France and the U.K., relative to the benchmark. In addition, the Fund is slightly overweight in Japan. Fund holdings are determined based on the merits of individual holdings and not on a country or sector basis. During the fiscal year, we initiated positions in numerous holdings including Michelin, Deutsche Lufthansa, Toyota and Asahi. We also liquidated numerous holdings such as National Bank of Greece, Nokia, Intact Financial, Canon and Takeda Pharmaceutical.
The ongoing likelihood of defaults in sovereign debt and decelerating economic growth across both the developed and emerging market regions have sparked fears of another recession for much of the world. Despite these macroeconomic issues, after the recent market correction we view corporate balance sheets as generally healthy and market valuations as generally attractive from a historical context. We continue to find attractive investment opportunities despite the current uncertain market environment. We remain firmly committed to our investment approach of striving to build diversified portfolios with above-average profitability characteristics and discounted valuations.
We would like to caution investors against making investment decisions based on short-term performance. As always, we recommend that you consult your financial adviser to discuss your individual financial program.
We welcome any new investors who have joined the Fund during the fiscal year, and to all of our shareholders we would like to say thank you for your continued investment in Invesco International Core Equity Fund.
The views and opinions expressed in management’s discussion of Fund performance are those of Invesco Advisers, Inc. These views and opinions are subject to change at any time based on factors such as market and economic conditions. These views and opinions may not be relied upon as investment advice or recommendations, or as an offer for a particular security. The information is not a complete analysis of every aspect of any market, country, industry, security or the Fund. Statements of fact are from sources considered reliable, but Invesco Advisers, Inc. makes no representation or warranty as to their completeness or accuracy. Although historical performance is no guarantee of future results, these insights may help you understand our investment management philosophy.
See important Fund and, if applicable, index disclosures later in this report.

Ingrid Baker
Chartered Financial Analyst, portfolio manager, is manager of Invesco International Core Equity Fund. She joined Invesco in 1999. Ms. Baker earned a B.A. in international politics from Oberlin College. She also earned an M.B.A in finance from the University of Navarra.
Chartered Financial Analyst, portfolio manager, is manager of Invesco International Core Equity Fund. She joined Invesco in 1999. Ms. Baker earned a B.A. in international politics from Oberlin College. She also earned an M.B.A in finance from the University of Navarra.

W. Lindsay Davidson
Portfolio manager, is manager of Invesco International Core Equity Fund. He joined Invesco in 1984. Mr. Davidson earned a degree in economics from Edinburgh University.
Portfolio manager, is manager of Invesco International Core Equity Fund. He joined Invesco in 1984. Mr. Davidson earned a degree in economics from Edinburgh University.

E. Sargent McGowan
Chartered Financial Analyst, portfolio manager and Head of Developed Market Equities, is manager of Invesco International Core Equity Fund. He joined Invesco in 2002. Mr. McGowan earned a B.S. in commerce from the University of Virginia and an M.B.A. in investment management from the University of North Carolina.
Chartered Financial Analyst, portfolio manager and Head of Developed Market Equities, is manager of Invesco International Core Equity Fund. He joined Invesco in 2002. Mr. McGowan earned a B.S. in commerce from the University of Virginia and an M.B.A. in investment management from the University of North Carolina.

Anuja Singha
Chartered Financial Analyst, portfolio manager, is manager of Invesco International Core Equity Fund. She joined Invesco in 1998. Ms. Singha earned a B.A. in economics from Mills College and a Ph.D. in economics from Emory University.
Chartered Financial Analyst, portfolio manager, is manager of Invesco International Core Equity Fund. She joined Invesco in 1998. Ms. Singha earned a B.A. in economics from Mills College and a Ph.D. in economics from Emory University.

Stephen Thomas
Chartered Financial Analyst, portfolio manager, is manager of Invesco International Core Equity Fund. He joined Invesco in 2000. Mr. Thomas earned a B.B.A. in banking/finance and an M.B.A. from the University of Mississippi.
Chartered Financial Analyst, portfolio manager, is manager of Invesco International Core Equity Fund. He joined Invesco in 2000. Mr. Thomas earned a B.B.A. in banking/finance and an M.B.A. from the University of Mississippi.
| 5 | Invesco International Core Equity Fund |
Your Fund’s Long-Term Performance
Results of a $10,000 Investment – Oldest Share Class since Inception without Sales Charges
Fund data from 10/28/98, index data from 10/31/98
Results of a $10,000 Investment – Oldest Share Class since Inception with Sales Charges
Index data from 1/31/00, Fund data from 2/14/00
Past performance cannot guarantee comparable future results.
The performance data shown in the first chart above is that of the Fund’s Investor class shares. The performance of the Fund’s other share classes will differ primarily due to different sales charge structures and class expenses and may be greater than or less than the performance of the Fund’s Investor Class shares. The data shown in this chart includes reinvested distributions, Fund expenses and management fees. Index results include reinvested dividends.
The performance data shown in the second chart above is that of the Fund’s Class C shares. The performance of the Fund’s other share classes will differ
primarily due to different sales charge structures and class expenses and may be greater than or less than the performance of the Fund’s Class C shares. The data shown in this chart includes applicable sales charges, reinvested distributions, Fund expenses and management fees. Index results include reinvested dividends, but they do not reflect sales charges.
Performance of the peer group reflects fund expenses and management fees; performance of a market index does not. Performance shown in the charts and table(s) does not reflect deduction of taxes a shareholder would pay on Fund distributions or sale of Fund shares.
Both charts above are logarithmic charts, which present the fluctuations in the value of the Fund’s share class and its indexes. We believe that a logarithmic chart is more effective than other types of charts in illustrating changes in value during the early years shown in the chart. The vertical axis, the one that indicates the dollar value of an investment, is constructed with each segment representing a percent change in the value of the investment. In both charts, each segment represents a doubling, or 100% change, in the value of the investment.
| 6 | Invesco International Core Equity Fund |
| Average Annual Total Returns | ||||
| As of 10/31/11, including maximum applicable sales charges | ||||
Class A Shares | ||||
| Inception (3/28/02) | 3.28 | % | ||
| 5 Years | -4.29 | |||
| 1 Year | -12.56 | |||
Class B Shares | ||||
| Inception (3/28/02) | 3.35 | % | ||
| 5 Years | -4.27 | |||
| 1 Year | -12.74 | |||
Class C Shares | ||||
| Inception (2/14/00) | 0.64 | % | ||
| 10 Years | 3.95 | |||
| 5 Years | -3.94 | |||
| 1 Year | -9.11 | |||
Class R Shares | ||||
| Inception (11/24/03) | 4.52 | % | ||
| 5 Years | -3.47 | |||
| 1 Year | -7.76 | |||
Class Y Shares | ||||
| 10 Years | 4.87 | % | ||
| 5 Years | -3.07 | |||
| 1 Year | -7.23 | |||
Investor Class Shares | ||||
| Inception (10/28/98) | 3.03 | % | ||
| 10 Years | 4.80 | |||
| 5 Years | -3.21 | |||
| 1 Year | -7.53 | |||
Institutional Class Shares | ||||
| Inception (4/30/04) | 4.33 | % | ||
| 5 Years | -2.62 | |||
| 1 Year | -6.85 | |||
| Average Annual Total Returns | ||||
| As of 9/30/11, the most recent calendar quarter-end, including maximum applicable sales charges | ||||
Class A Shares | ||||
| Inception (3/28/02) | 2.45 | % | ||
| 5 Years | -5.22 | |||
| 1 Year | -16.40 | |||
Class B Shares | ||||
| Inception (3/28/02) | 2.51 | % | ||
| 5 Years | -5.18 | |||
| 1 Year | -16.54 | |||
Class C Shares | ||||
| Inception (2/14/00) | -0.03 | % | ||
| 10 Years | 3.15 | |||
| 5 Years | -4.87 | |||
| 1 Year | -13.07 | |||
Class R Shares | ||||
| Inception (11/24/03) | 3.53 | % | ||
| 5 Years | -4.39 | |||
| 1 Year | -11.78 | |||
Class Y Shares | ||||
| 10 Years | 4.05 | % | ||
| 5 Years | -4.02 | |||
| 1 Year | -11.41 | |||
Investor Class Shares | ||||
| Inception (10/28/98) | 2.41 | % | ||
| 10 Years | 3.98 | |||
| 5 Years | -4.15 | |||
| 1 Year | -11.61 | |||
Institutional Class Shares | ||||
| Inception (4/30/04) | 3.25 | % | ||
| 5 Years | -3.57 | |||
| 1 Year | -11.01 | |||
Class A share performance reflects the maximum 5.50% sales charge, and Class B and Class C share performance reflects the applicable contingent deferred sales charge (CDSC) for the period involved. The CDSC on Class B shares declines from 5% beginning at the time of purchase to 0% at the beginning of the seventh year. The CDSC on Class C shares is 1% for the first year after purchase. Class R, Class Y, Investor Class and Institutional Class shares do not have a front-end sales charge or a CDSC; therefore, performance is at net asset value.
The performance of the Fund’s share classes will differ primarily due to different sales charge structures and class expenses.
Had the adviser not waived fees and/or reimbursed expenses for Class C shares in the past, performance would have been lower.
A redemption fee of 2% is imposed on certain redemptions or exchanges out of the Fund within 31 days of purchase. Exceptions to the redemption fee are listed in the Fund’s prospectus. Effective January 1, 2012, after the close of the reporting period, the Fund will eliminate the redemption fee, if applicable, assessed on shares of the Fund redeemed or exchanged within 31 days of purchase.
Class Y shares incepted on October 3, 2008. Performance shown prior to that date is that of Investor Class shares and includes the 12b-1 fees applicable to Investor Class shares. Investor Class share performance reflects any applicable fee waivers or expense reimbursements.
The performance data quoted represent past performance and cannot guarantee comparable future results; current performance may be lower or higher. Please visit invesco.com/performance for the most recent month-end performance. Performance figures reflect reinvested distributions, changes in net asset value and the effect of the maximum
sales charge unless otherwise stated. Investment return and principal value will fluctuate so that you may have a gain or loss when you sell shares.
The total annual Fund operating expense ratio set forth in the most recent Fund prospectus as of the date of this report for Class A, Class B, Class C, Class R, Class Y, Investor Class and Institutional Class shares was 1.51%, 2.26%, 2.26%, 1.76%, 1.26%, 1.51% and 0.91%, respectively. The expense ratios presented above may vary from the expense ratios presented in other sections of this report that are based on expenses incurred during the period covered by this report.
| 7 | Invesco International Core Equity Fund |
Invesco International Core Equity Fund’s investment objective is long-term growth of capital.
| n | Unless otherwise stated, information presented in this report is as of October 31, 2011, and is based on total net assets. | |
| n | Unless otherwise noted, all data provided by Invesco. | |
| n | To access your Fund’s reports/prospectus, visit invesco.com/fundreports. |
About share classes
| n | Class B shares may not be purchased or acquired by exchange from share classes other than Class B shares. Please see the prospectus for more information. | |
| n | Class R shares are available only to certain retirement plans. Please see the prospectus for more information. | |
| n | Class Y shares are available to only certain investors. Please see the prospectus for more information. | |
| n | All Investor Class shares are closed to new investors. Contact your financial adviser about purchasing our other share classes. | |
| n | Institutional Class shares are offered exclusively to institutional investors, including defined contribution plans that meet certain criteria. Please see the prospectus for more information. |
Principal risks of investing in the Fund
| n | Developing markets securities risk. Securities issued by foreign companies and governments located in developing countries may be affected more negatively by inflation, devaluation of their currencies, higher transaction costs, delays in settlement, adverse political developments, the introduction of capital controls, withholding taxes, nationalization of private assets, expropriation, social unrest, war or lack of timely information than those in developed countries. | |
| n | Foreign securities risk. The Fund’s foreign investments may be affected by changes in a foreign country’s exchange rates; political and social instability; changes in economic or taxation policies; difficulties when enforcing obligations; decreased liquidity; and increased volatility. Foreign companies may be subject to less regulation resulting in less publicly available information about the companies. |
| n | Management risk. The investment techniques and risk analysis used by the Fund’s portfolio managers may not produce the desired results. | |
| n | Market risk. The prices of and the income generated by the Fund’s securities may decline in response to, among other things, investor sentiment; general economic and market conditions; regional or global instability; and currency and interest rate fluctuations. |
About indexes used in this report
| n | The MSCI EAFE® Index is an unmanaged index considered representative of stocks of Europe, Australasia and the Far East. | |
| n | The Lipper International Large-Cap Core Funds Index is an unmanaged index considered representative of international large-cap core funds tracked by Lipper. | |
| n | The Fund is not managed to track the performance of any particular index, including the index(es) defined here, and consequently, the performance of the Fund may deviate significantly from the performance of the index(es). | |
| n | A direct investment cannot be made in an index. Unless otherwise indicated, index results include reinvested dividends, and they do not reflect sales charges. Performance of the peer group, if applicable, reflects fund expenses; performance of a market index does not. |
Other information
| n | The Chartered Financial Analyst® (CFA®) designation is globally recognized and attests to a charterholder’s success in a rigorous and comprehensive study program in the field of investment management and research analysis. | |
| n | The returns shown in management’s discussion of Fund performance are based on net asset values calculated for shareholder transactions. Generally accepted accounting principles require adjustments to be made to the net assets of the Fund at period end for financial reporting purposes, and as such, the net asset values for shareholder transactions and the returns based on those net asset values may differ from the net asset values and returns reported in the Financial Highlights. | |
| n | Industry classifications used in this report are generally according to the Global Industry Classification Standard, which was developed by and is the exclusive property and a service mark of MSCI Inc. and Standard & Poor’s. |
This report must be accompanied or preceded by a currently effective Fund prospectus, which contains more complete information, including sales charges and expenses. Investors should read it carefully before investing.
NOT FDIC INSURED | MAY LOSE VALUE | NO BANK GUARANTEE
Fund Nasdaq Symbols
| Class A Shares | IBVAX | |||
| Class B Shares | IBVBX | |||
| Class C Shares | IBVCX | |||
| Class R Shares | IIBRX | |||
| Class Y Shares | IBVYX | |||
| Investor Class Shares | IIBCX | |||
| Institutional Class Shares | IBVIX | |||
| 8 | Invesco International Core Equity Fund |
Schedule of Investments
October 31, 2011
| Shares | Value | |||||||
| Common Stocks & Other Equity Interests–94.02% | ||||||||
| Australia–7.96% | ||||||||
| Australia & New Zealand Banking Group Ltd. | 192,577 | $ | 4,340,288 | |||||
| BHP Billiton Ltd. | 193,422 | 7,567,254 | ||||||
| Macquarie Group Ltd. | 96,927 | 2,447,844 | ||||||
| Suncorp Group Ltd. | 489,472 | 4,374,989 | ||||||
| Telstra Corp. Ltd. | 1,405,471 | 4,568,165 | ||||||
| 23,298,540 | ||||||||
| Brazil–1.23% | ||||||||
Banco Santander Brasil S.A.(a)(b) | 26,100 | 235,793 | ||||||
Banco Santander Brasil S.A.(a) | 44,900 | 405,636 | ||||||
Companhia Energetica de Minas Gerais–ADR(c) | 37,579 | 640,346 | ||||||
| PDG Realty S.A. Empreendimentos e Participacoes | 166,000 | 733,392 | ||||||
| Petroleo Brasileiro S.A.–ADR | 32,451 | 876,501 | ||||||
| Vale S.A.–ADR | 27,522 | 699,334 | ||||||
| 3,591,002 | ||||||||
| Canada–3.95% | ||||||||
| Encana Corp. | 98,838 | 2,141,804 | ||||||
Metro Inc.–Class A(c) | 67,551 | 3,306,796 | ||||||
| Nexen Inc. | 160,565 | 2,724,632 | ||||||
| Toronto-Dominion Bank (The) | 44,766 | 3,375,510 | ||||||
| 11,548,742 | ||||||||
| China–1.10% | ||||||||
| China Construction Bank Corp.–Class H | 588,000 | 427,406 | ||||||
| China Dongxiang Group Co. | 1,538,000 | 270,412 | ||||||
| China Minsheng Banking Corp., Ltd.–Class H | 1,110,500 | 890,838 | ||||||
| CNOOC Ltd. | 382,800 | 723,522 | ||||||
| KWG Property Holding Ltd. | 597,500 | 254,838 | ||||||
| Renhe Commercial Holdings Co., Ltd. | 4,652,000 | 639,386 | ||||||
| 3,206,402 | ||||||||
| Denmark–1.01% | ||||||||
| Danske Bank A.S. | 215,774 | 2,946,376 | ||||||
| France–10.83% | ||||||||
| BNP Paribas S.A. | 75,582 | 3,351,234 | ||||||
| Bouygues S.A. | 172,785 | 6,460,555 | ||||||
| Cie Generale des Etablissements Michelin–Class B | 55,760 | 4,027,759 | ||||||
| Sanofi | 102,370 | 7,327,982 | ||||||
Total S.A.–ADR(c) | 102,336 | 5,352,173 | ||||||
| Vallourec S.A | 85,903 | 5,202,054 | ||||||
| 31,721,757 | ||||||||
| Germany–2.63% | ||||||||
Deutsche Lufthansa AG–REGS(b) | 247,921 | 3,370,077 | ||||||
Muenchener Rueckversicherungs-Gesellschaft AG–REGS(b) | 14,347 | 1,923,282 | ||||||
| Salzgitter AG | 42,732 | 2,408,041 | ||||||
| 7,701,400 | ||||||||
| Hong Kong–2.87% | ||||||||
| Cheung Kong (Holdings) Ltd. | 248,000 | 3,079,389 | ||||||
| China Mobile Ltd. | 105,500 | 1,005,379 | ||||||
| Esprit Holdings Ltd. | 697,028 | 1,007,467 | ||||||
| Henderson Land Development Co. Ltd. | 614,000 | 3,320,596 | ||||||
| 8,412,831 | ||||||||
| India–0.55% | ||||||||
| Canara Bank Ltd. | 54,918 | 522,901 | ||||||
| Grasim Industries Ltd. | 8,854 | 449,724 | ||||||
| Oil and Natural Gas Corp. Ltd. | 114,196 | 649,320 | ||||||
| 1,621,945 | ||||||||
| Indonesia–0.13% | ||||||||
| PT Telekomunikasi Indonesia Tbk | 458,000 | 380,212 | ||||||
| Ireland–0.24% | ||||||||
| Dragon Oil PLC | 77,757 | 692,016 | ||||||
| Italy–2.50% | ||||||||
Eni S.p.A–ADR(c) | 110,478 | 4,863,241 | ||||||
| Finmeccanica S.p.A. | 358,132 | 2,448,480 | ||||||
| 7,311,721 | ||||||||
| Japan–22.54% | ||||||||
| Asahi Group Holdings, Ltd. | 223,700 | 4,589,126 | ||||||
| East Japan Railway Co. | 46,200 | 2,805,472 | ||||||
| FUJIFILM Holdings Corp. | 229,700 | 5,632,775 | ||||||
| Mitsubishi Corp. | 220,300 | 4,534,723 | ||||||
| Mitsubishi UFJ Financial Group, Inc. | 1,224,500 | 5,304,599 | ||||||
| Nippon Telegraph & Telephone Corp. | 68,700 | 3,512,144 | ||||||
| Nippon Yusen Kabushiki Kaisha | 1,261,000 | 3,191,125 | ||||||
| Nissan Motor Co., Ltd. | 636,200 | 5,861,225 | ||||||
| Nitto Denko Corp. | 65,900 | 2,773,637 | ||||||
| NTT DoCoMo, Inc. | 1,899 | 3,354,326 | ||||||
| Seven & I Holdings Co., Ltd. | 136,900 | 3,661,337 | ||||||
| Shin-Etsu Chemical Co., Ltd. | 56,000 | 2,876,396 | ||||||
| Sumitomo Chemical Co., Ltd. | 1,230,000 | 4,557,601 | ||||||
| Toyo Suisan Kaisha, Ltd. | 147,000 | 3,765,280 | ||||||
| Toyota Motor Corp. | 102,300 | 3,420,470 | ||||||
| Yamada Denki Co., Ltd. | 85,300 | 6,147,654 | ||||||
| 65,987,890 | ||||||||
See accompanying Notes to Financial Statements which are an integral part of the financial statements.
9 Invesco International Core Equity Fund
| Shares | Value | |||||||
| Mexico–0.24% | ||||||||
| America Movil S.A.B. de C.V.–Series L | 561,600 | $ | 713,413 | |||||
| Netherlands–1.76% | ||||||||
Unilever N.V.(c) | 150,142 | 5,162,976 | ||||||
| Norway–3.25% | ||||||||
| Statoil A.S.A. | 106,685 | 2,714,327 | ||||||
| Yara International A.S.A. | 144,024 | 6,803,219 | ||||||
| 9,517,546 | ||||||||
| Poland–0.22% | ||||||||
| KGHM Polska Miedz S.A. | 13,499 | 651,401 | ||||||
| Russia–0.51% | ||||||||
| Gazprom–ADR | 43,788 | 507,378 | ||||||
Magnitogorsk Iron & Steel Works, REGS–GDR(b) | 59,797 | 367,211 | ||||||
Rosneft Oil Co., REGS-GDR(b) | 88,078 | 622,188 | ||||||
| 1,496,777 | ||||||||
| South Africa–0.92% | ||||||||
| Sasol Ltd. | 14,426 | 650,340 | ||||||
| Standard Bank Group Ltd. | 51,460 | 631,648 | ||||||
Steinhoff International Holdings Ltd.(d) | 248,676 | 739,409 | ||||||
| Tiger Brands Ltd. | 23,354 | 669,940 | ||||||
| 2,691,337 | ||||||||
| South Korea–2.17% | ||||||||
| Dongbu Insurance Co., Ltd. | 13,347 | 555,396 | ||||||
| Hyundai Mipo Dockyard Co., Ltd. | 5,373 | 584,227 | ||||||
| Hyundai Mobis | 4,078 | 1,174,518 | ||||||
| KT&G Corp. | 9,240 | 578,431 | ||||||
| LG Electronics Inc. | 4,239 | 282,170 | ||||||
| POSCO | 2,105 | 728,683 | ||||||
| Samsung Electronics Co., Ltd. | 1,479 | 1,280,617 | ||||||
| Shinhan Financial Group Co., Ltd. | 14,937 | 584,784 | ||||||
| SK Telecom Co., Ltd. | 2,799 | 370,418 | ||||||
| SK Telecom Co., Ltd.–ADR | 14,627 | 216,333 | ||||||
| 6,355,577 | ||||||||
| Spain–5.38% | ||||||||
| Banco Santander S.A. | 449,346 | 3,840,612 | ||||||
| Iberdrola S.A. | 604,335 | 4,384,072 | ||||||
| Repsol YPF, S.A. | 117,151 | 3,529,277 | ||||||
| Telefonica S.A. | 187,171 | 3,993,285 | ||||||
| 15,747,246 | ||||||||
| Switzerland–7.16% | ||||||||
Actelion Ltd.,–REGS(b)(d) | 66,337 | 2,453,328 | ||||||
Holcim Ltd.,–REGS(b)(d) | 61,574 | 3,902,504 | ||||||
Swisscom AG,–REGS(b) | 19,764 | 7,955,981 | ||||||
Zurich Financial Services AG(d) | 28,937 | 6,651,043 | ||||||
| 20,962,856 | ||||||||
| Taiwan–0.70% | ||||||||
| AU Optronics Corp.–ADR | 59,724 | 255,619 | ||||||
| Coretronic Corp | 325,000 | 244,514 | ||||||
| HTC Corp. | 23,337 | 518,934 | ||||||
| Powertech Technology Inc. | 279,000 | 681,691 | ||||||
| Wistron Corp. | 297,000 | 344,091 | ||||||
| 2,044,849 | ||||||||
| Thailand–0.33% | ||||||||
| Bangkok Bank PCL.–NVDR | 140,000 | 672,708 | ||||||
| PTT PCL | 30,500 | 299,287 | ||||||
| 971,995 | ||||||||
| Turkey–0.12% | ||||||||
Asya Katilim Bankasi A.S.(d) | 337,555 | 357,711 | ||||||
| United Kingdom–13.72% | ||||||||
| AstraZeneca PLC | 77,075 | 3,680,382 | ||||||
| Barclays PLC | 1,174,261 | 3,630,503 | ||||||
| Eurasian Natural Resources Corp. | 58,795 | 617,514 | ||||||
| GlaxoSmithKline PLC | 261,732 | 5,866,598 | ||||||
| Imperial Tobacco Group PLC | 266,516 | 9,712,697 | ||||||
| International Power PLC | 798,179 | 4,327,615 | ||||||
| National Grid PLC | 461,002 | 4,566,139 | ||||||
| Royal Dutch Shell PLC–ADR | 109,556 | 7,768,616 | ||||||
| 40,170,064 | ||||||||
| Total Common Stocks & Other Equity Interests (Cost $272,410,133) | 275,264,582 | |||||||
| Preferred Stocks–2.14% | ||||||||
| Germany–2.14% | ||||||||
| Porsche Automobil Holding SE–1.04% Pfd. (Cost $6,086,554) | 107,357 | 6,264,585 | ||||||
| Money Market Funds–3.26% | ||||||||
Liquid Assets Portfolio–Institutional Class(e) | 4,776,671 | 4,776,671 | ||||||
Premier Portfolio–Institutional Class(e) | 4,776,671 | 4,776,671 | ||||||
| Total Money Market Funds (Cost $9,553,342) | 9,553,342 | |||||||
| TOTAL INVESTMENTS (excluding investments purchased with cash collateral from securities on loan)–99.42% (Cost $288,050,029) | 291,082,509 | |||||||
| Investments Purchased with Cash Collateral from Securities on Loan–5.59% | ||||||||
Liquid Assets Portfolio–Institutional Class (Cost $16,351,195)(e)(f) | 16,351,195 | 16,351,195 | ||||||
| TOTAL INVESTMENTS–105.01% (Cost $304,401,224) | 307,433,704 | |||||||
| OTHER ASSETS LESS LIABILITIES–(5.01)% | (14,655,963 | ) | ||||||
| NET ASSETS–100.00% | $ | 292,777,741 | ||||||
See accompanying Notes to Financial Statements which are an integral part of the financial statements.
10 Invesco International Core Equity Fund
Investment Abbreviations:
| ADR | – American Depositary Receipt | |
| GDR | – Global Depositary Receipt | |
| NVDR | – Non-Voting Depositary Receipt | |
| REGS | – Regulation S | |
| Pfd. | – Preferred |
Notes to Schedule of Investments:
| (a) | Each unit represents 55 common shares and 50 preferred shares | |
| (b) | Security purchased or received in a transaction exempt from registration under the Securities Act of 1933, as amended. The security may be resold pursuant to an exemption from registration under the 1933 Act, typically to qualified institutional buyers. The aggregate value of these securities at October 31, 2011 was $20,830,364, which represented 7.11% of the Fund’s Net Assets. | |
| (c) | All or a portion of this security was out on loan at October 31, 2011. | |
| (d) | Non-income producing security. | |
| (e) | The money market fund and the Fund are affiliated by having the same investment adviser. | |
| (f) | The security has been segregated to satisfy the commitment to return the cash collateral received in securities lending transactions upon the borrower’s return of the securities loaned. See Note 1J. |
See accompanying Notes to Financial Statements which are an integral part of the financial statements.
11 Invesco International Core Equity Fund
Statement of Assets and Liabilities
October 31, 2011
| Assets: | ||||
| Investments, at value (Cost $278,496,687)* | $ | 281,529,167 | ||
| Investments in affiliated money market funds, at value and cost | 25,904,537 | |||
| Total investments, at value (Cost $304,401,224) | 307,433,704 | |||
| Foreign currencies, at value (Cost $983,207) | 1,017,659 | |||
| Receivable for: | ||||
| Fund shares sold | 22,809 | |||
| Dividends | 1,207,737 | |||
| Investment for trustee deferred compensation and retirement plans | 41,605 | |||
| Other assets | 21,847 | |||
| Total assets | 309,745,361 | |||
| Liabilities: | ||||
| Payable for: | ||||
| Fund shares reacquired | 299,095 | |||
| Collateral upon return of securities loaned | 16,351,195 | |||
| Accrued fees to affiliates | 86,056 | |||
| Accrued other operating expenses | 146,433 | |||
| Trustee deferred compensation and retirement plans | 84,841 | |||
| Total liabilities | 16,967,620 | |||
| Net assets applicable to shares outstanding | $ | 292,777,741 | ||
| Net assets consist of: | ||||
| Shares of beneficial interest | $ | 355,529,935 | ||
| Undistributed net investment income | 8,734,402 | |||
| Undistributed net realized gain (loss) | (74,596,844 | ) | ||
| Unrealized appreciation | 3,110,248 | |||
| $ | 292,777,741 | |||
| Net Assets: | ||||
| Class A | $ | 43,983,192 | ||
| Class B | $ | 4,653,812 | ||
| Class C | $ | 15,597,111 | ||
| Class R | $ | 2,885,346 | ||
| Class Y | $ | 1,353,675 | ||
| Investor Class | $ | 16,009,192 | ||
| Institutional Class | $ | 208,295,413 | ||
| Shares outstanding, $0.001 par value per share, with an unlimited number of shares authorized: | ||||
| Class A | 4,390,926 | |||
| Class B | 465,402 | |||
| Class C | 1,600,773 | |||
| Class R | 288,119 | |||
| Class Y | 132,981 | |||
| Investor Class | 1,575,187 | |||
| Institutional Class | 20,753,406 | |||
| Class A: | ||||
| Net asset value per share | $ | 10.02 | ||
| Maximum offering price per share | ||||
| (Net asset value of $10.02 divided by 94.50%) | $ | 10.60 | ||
| Class B: | ||||
| Net asset value and offering price per share | $ | 10.00 | ||
| Class C: | ||||
| Net asset value and offering price per share | $ | 9.74 | ||
| Class R: | ||||
| Net asset value and offering price per share | $ | 10.01 | ||
| Class Y: | ||||
| Net asset value and offering price per share | $ | 10.18 | ||
| Investor Class: | ||||
| Net asset value and offering price per share | $ | 10.16 | ||
| Institutional Class: | ||||
| Net asset value and offering price per share | $ | 10.04 | ||
| * | At October 31, 2011, securities with an aggregate value of $15,161,694 were on loan to brokers. |
See accompanying Notes to Financial Statements which are an integral part of the financial statements.
12 Invesco International Core Equity Fund
Statement of Operations
For the year ended October 31, 2011
| Investment income: | ||||
| Dividends (net of foreign withholding taxes of $937,061) | $ | 13,230,074 | ||
| Dividends from affiliated money market funds (includes securities lending income of $223,541) | 231,080 | |||
| Total investment income | 13,461,154 | |||
| Expenses: | ||||
| Advisory fees | 2,380,251 | |||
| Administrative services fees | 132,994 | |||
| Custodian fees | 130,667 | |||
| Distribution fees: | ||||
| Class A | 111,840 | |||
| Class B | 62,587 | |||
| Class C | 188,632 | |||
| Class R | 15,220 | |||
| Investor Class | 46,526 | |||
| Transfer agent fees — A, B, C, R, Y and Investor | 355,059 | |||
| Transfer agent fees — Institutional | 7,323 | |||
| Trustees’ and officers’ fees and benefits | 25,371 | |||
| Other | 207,308 | |||
| Total expenses | 3,663,778 | |||
| Less: Fees waived, expenses reimbursed and expense offset arrangement(s) | (13,585 | ) | ||
| Net expenses | 3,650,193 | |||
| Net investment income | 9,810,961 | |||
| Realized and unrealized gain (loss) from: | ||||
| Net realized gain (loss) from: | ||||
| Investment securities (net of foreign taxes of $73,888) | 4,668,340 | |||
| Foreign currencies (net of foreign taxes of $2,474) | (159,945 | ) | ||
| 4,508,395 | ||||
| Change in net unrealized appreciation (depreciation) of: | ||||
| Investment securities (net of foreign taxes on holdings of $20,520) | (36,429,118 | ) | ||
| Foreign currencies | 14,338 | |||
| (36,414,780 | ) | |||
| Net realized and unrealized gain (loss) | (31,906,385 | ) | ||
| Net increase (decrease) in net assets resulting from operations | $ | (22,095,424 | ) | |
See accompanying Notes to Financial Statements which are an integral part of the financial statements.
13 Invesco International Core Equity Fund
Statement of Changes in Net Assets
For the years ended October 31, 2011 and 2010
| 2011 | 2010 | |||||||
| Operations: | ||||||||
| Net investment income | $ | 9,810,961 | $ | 6,355,352 | ||||
| Net realized gain | 4,508,395 | 6,107,583 | ||||||
| Change in net unrealized appreciation (depreciation) | (36,414,780 | ) | 14,144,002 | |||||
| Net increase (decrease) in net assets resulting from operations | (22,095,424 | ) | 26,606,937 | |||||
| Distributions to shareholders from net investment income: | ||||||||
| Class A | (492,615 | ) | (994,982 | ) | ||||
| Class B | (19,825 | ) | (80,400 | ) | ||||
| Class C | (58,152 | ) | (196,085 | ) | ||||
| Class R | (27,144 | ) | (40,295 | ) | ||||
| Class Y | (27,226 | ) | (37,253 | ) | ||||
| Investor Class | (231,567 | ) | (345,741 | ) | ||||
| Institutional Class | (4,423,038 | ) | (5,062,018 | ) | ||||
| Total distributions from net investment income | (5,279,567 | ) | (6,756,774 | ) | ||||
| Share transactions–net: | ||||||||
| Class A | 8,638,671 | (23,700,004 | ) | |||||
| Class B | (1,765,326 | ) | (3,346,559 | ) | ||||
| Class C | (3,064,318 | ) | (3,883,197 | ) | ||||
| Class R | 84,794 | 181,072 | ||||||
| Class Y | (351,372 | ) | (237,478 | ) | ||||
| Investor Class | (1,895,737 | ) | (3,109,959 | ) | ||||
| Institutional Class | (1,264,414 | ) | (28,124,434 | ) | ||||
| Net increase (decrease) in net assets resulting from share transactions | 382,298 | (62,220,559 | ) | |||||
| Net increase (decrease) in net assets | (26,992,693 | ) | (42,370,396 | ) | ||||
| Net assets: | ||||||||
| Beginning of year | 319,770,434 | 362,140,830 | ||||||
| End of year (includes undistributed net investment income of $8,734,402 and $4,349,675, respectively) | $ | 292,777,741 | $ | 319,770,434 | ||||
Notes to Financial Statements
October 31, 2011
NOTE 1—Significant Accounting Policies
Invesco International Core Equity Fund (the “Fund”) is a series portfolio of AIM International Mutual Funds (Invesco International Mutual Funds) (the “Trust”). The Trust is a Delaware statutory trust registered under the Investment Company Act of 1940, as amended (the “1940 Act”), as an open-end series management investment company consisting of six separate portfolios, each authorized to issue an unlimited number of shares of beneficial interest. The assets, liabilities and operations of each portfolio are accounted for separately. Information presented in these financial statements pertains only to the Fund. Matters affecting each portfolio or class will be voted on exclusively by the shareholders of such portfolio or class.
The Fund’s investment objective is long-term growth of capital.
The Fund currently consists of seven different classes of shares: Class A, Class B, Class C, Class R, Class Y, Investor Class and Institutional Class. Investor Class shares of the Fund are offered only to certain grandfathered investors. Class A shares are sold with a front-end sales charge unless certain waiver criteria are met and under certain circumstances load waived shares may be subject to contingent deferred sales charges (“CDSC”). Class C shares are sold with a CDSC. Class R, Class Y, Investor Class and Institutional Class shares are sold at net asset value. Effective November 30, 2010, new or additional investments in Class B shares are no longer permitted. Existing shareholders of Class B shares may continue to reinvest dividends and capital gains distributions in Class B shares until they convert. Also, shareholders in Class B shares will be able to exchange those shares for Class B shares of other Invesco Funds offering such
14 Invesco International Core Equity Fund
shares until they convert. Generally, Class B shares will automatically convert to Class A shares on or about the month-end which is at least eight years after the date of purchase. Redemption of Class B shares prior to conversion date will be subject to a CDSC.
The following is a summary of the significant accounting policies followed by the Fund in the preparation of its financial statements.
| A. | Security Valuations — Securities, including restricted securities, are valued according to the following policy. | |
| A security listed or traded on an exchange (except convertible bonds) is valued at its last sales price or official closing price as of the close of the customary trading session on the exchange where the security is principally traded, or lacking any sales or official closing price on a particular day, the security may be valued at the closing bid price on that day. Securities traded in the over-the-counter market are valued based on prices furnished by independent pricing services or market makers. When such securities are valued by an independent pricing service they may be considered fair valued. Futures contracts are valued at the final settlement price set by an exchange on which they are principally traded. Listed options are valued at the mean between the last bid and ask prices from the exchange on which they are principally traded. Options not listed on an exchange are valued by an independent source at the mean between the last bid and ask prices. For purposes of determining net asset value per share, futures and option contracts generally are valued 15 minutes after the close of the customary trading session of the New York Stock Exchange (“NYSE”). | ||
| Investments in open-end and closed-end registered investment companies that do not trade on an exchange are valued at the end of day net asset value per share. Investments in open-end and closed-end registered investment companies that trade on an exchange are valued at the last sales price or official closing price as of the close of the customary trading session on the exchange where the security is principally traded. | ||
| Debt obligations (including convertible bonds) and unlisted equities are fair valued using an evaluated quote provided by an independent pricing service. Evaluated quotes provided by the pricing service may be determined without exclusive reliance on quoted prices, and may reflect appropriate factors such as institution-size trading in similar groups of securities, developments related to specific securities, dividend rate, yield, quality, type of issue, coupon rate, maturity, individual trading characteristics and other market data. Debt securities are subject to interest rate and credit risks. In addition, all debt securities involve some risk of default with respect to interest and/or principal payments. | ||
| Foreign securities (including foreign exchange contracts) are converted into U.S. dollar amounts using the applicable exchange rates as of the close of the NYSE. If market quotations are available and reliable for foreign exchange traded equity securities, the securities will be valued at the market quotations. Because trading hours for certain foreign securities end before the close of the NYSE, closing market quotations may become unreliable. If between the time trading ends on a particular security and the close of the customary trading session on the NYSE, events occur that are significant and make the closing price unreliable, the Fund may fair value the security. If the event is likely to have affected the closing price of the security, the security will be valued at fair value in good faith using procedures approved by the Board of Trustees. Adjustments to closing prices to reflect fair value may also be based on a screening process of an independent pricing service to indicate the degree of certainty, based on historical data, that the closing price in the principal market where a foreign security trade is not the current value as of the close of the NYSE. Foreign securities meeting the approved degree of certainty that the price is not reflective of current value will be priced at the indication of fair value from the independent pricing service. Multiple factors may be considered by the independent pricing service in determining adjustments to reflect fair value and may include information relating to sector indices, American Depositary Receipts and domestic and foreign index futures. Foreign securities may have additional risks including exchange rate changes, potential for sharply devalued currencies and high inflation, political and economical upheaval, the relative lack of issuer information, relatively low market liquidity and the potential lack of strict financial and accounting controls and standards. | ||
| Securities for which market prices are not provided by any of the above methods may be valued based upon quotes furnished by independent sources. The last bid price may be used to value equity securities. The mean between the last bid and asked prices is used to value debt obligations, including Corporate Loans. | ||
| Securities for which market quotations are not readily available or are unreliable are valued at fair value as determined in good faith by or under the supervision of the Trust’s officers following procedures approved by the Board of Trustees. Issuer specific events, market trends, bid/ask quotes of brokers and information providers and other market data may be reviewed in the course of making a good faith determination of a security’s fair value. | ||
| Valuations change in response to many factors including the historical and prospective earnings of the issuer, the value of the issuer’s assets, general economic conditions, interest rates, investor perceptions and market liquidity. Because of the inherent uncertainties of valuation, the values reflected in the financial statements may materially differ from the value received upon actual sale of those investments. | ||
| B. | Securities Transactions and Investment Income — Securities transactions are accounted for on a trade date basis. Realized gains or losses on sales are computed on the basis of specific identification of the securities sold. Interest income is recorded on the accrual basis from settlement date. Dividend income (net of withholding tax, if any) is recorded on the ex-dividend date. | |
| The Fund may periodically participate in litigation related to Fund investments. As such, the Fund may receive proceeds from litigation settlements. Any proceeds received are included in the Statement of Operations as realized gain (loss) for investments no longer held and as unrealized gain (loss) for investments still held. | ||
| Brokerage commissions and mark ups are considered transaction costs and are recorded as an increase to the cost basis of securities purchased and/or a reduction of proceeds on a sale of securities. Such transaction costs are included in the determination of net realized and unrealized gain (loss) from investment securities reported in the Statement of Operations and the Statement of Changes in Net Assets and the net realized and unrealized gains (losses) on securities per share in the Financial Highlights. Transaction costs are included in the calculation of the Fund’s net asset value and, accordingly, they reduce the Fund’s total returns. These transaction costs are not considered operating expenses and are not reflected in net investment income reported in the Statement of Operations and Statement of Changes in Net Assets, or the net investment income per share and ratios of expenses and net investment income reported in the Financial Highlights, nor are they limited by any expense limitation arrangements between the Fund and the investment adviser. | ||
| The Fund allocates income and realized and unrealized capital gains and losses to a class based on the relative net assets of each class. | ||
| C. | Country Determination — For the purposes of making investment selection decisions and presentation in the Schedule of Investments, the investment adviser may determine the country in which an issuer is located and/or credit risk exposure based on various factors. These factors include the laws of the country under which the issuer is organized, where the issuer maintains a principal office, the country in which the issuer derives 50% or more |
15 Invesco International Core Equity Fund
| of its total revenues and the country that has the primary market for the issuer’s securities, as well as other criteria. Among the other criteria that may be evaluated for making this determination are the country in which the issuer maintains 50% or more of its assets, the type of security, financial guarantees and enhancements, the nature of the collateral and the sponsor organization. Country of issuer and/or credit risk exposure has been determined to be the United States of America, unless otherwise noted. | ||
| D. | Distributions — Distributions from income and net realized capital gain, if any, are generally paid annually and recorded on ex-dividend date. The Fund may elect to treat a portion of the proceeds from redemptions as distributions for federal income tax purposes. | |
| E. | Federal Income Taxes — The Fund intends to comply with the requirements of Subchapter M of the Internal Revenue Code necessary to qualify as a regulated investment company and to distribute substantially all of the Fund’s taxable earnings to shareholders. As such, the Fund will not be subject to federal income taxes on otherwise taxable income (including net realized capital gain) that is distributed to shareholders. Therefore, no provision for federal income taxes is recorded in the financial statements. | |
| The Fund files tax returns in the U.S. Federal jurisdiction and certain other jurisdictions. Generally, the Fund is subject to examinations by such taxing authorities for up to three years after the filing of the return for the tax period. | ||
| F. | Expenses — Fees provided for under the Rule 12b-1 plan of a particular class of the Fund are charged to the operations of such class. Transfer agency fees and expenses and other shareholder recordkeeping fees and expenses attributable to the Institutional Class are charged to such class. Transfer agency fees and expenses and other shareholder recordkeeping fees and expenses relating to all other classes are allocated among those classes based on relative net assets. All other expenses are allocated among the classes based on relative net assets. | |
| G. | Accounting Estimates — The preparation of financial statements in conformity with accounting principles generally accepted in the United States of America (“GAAP”) requires management to make estimates and assumptions that affect the reported amounts of assets and liabilities at the date of the financial statements and the reported amounts of revenues and expenses during the reporting period including estimates and assumptions related to taxation. Actual results could differ from those estimates by a significant amount. In addition, the Fund monitors for material events or transactions that may occur or become known after the period-end date and before the date the financial statements are released to print. | |
| H. | Indemnifications — Under the Trust’s organizational documents, each Trustee, officer, employee or other agent of the Trust is indemnified against certain liabilities that may arise out of performance of their duties to the Fund. Additionally, in the normal course of business, the Fund enters into contracts, including the Fund’s servicing agreements that contain a variety of indemnification clauses. The Fund’s maximum exposure under these arrangements is unknown as this would involve future claims that may be made against the Fund that have not yet occurred. The risk of material loss as a result of such indemnification claims is considered remote. | |
| I. | Redemption Fees — The Fund has a 2% redemption fee that is to be retained by the Fund to offset transaction costs and other expenses associated with short-term redemptions and exchanges. The fee, subject to certain exceptions, is imposed on certain redemptions or exchanges of shares within 31 days of purchase. The redemption fee is recorded as an increase in shareholder capital and is allocated among the share classes based on the relative net assets of each class. Effective January 1, 2012, the Fund will eliminate the 2% redemption fee, if applicable, assessed on shares of the Fund redeemed or exchanged within 31 days of purchase. | |
| J. | Securities Lending — The Fund may lend portfolio securities having a market value up to one-third of the Fund’s total assets. Such loans are secured by collateral equal to no less than the market value of the loaned securities determined daily by the securities lending provider. Such collateral will be cash or debt securities issued or guaranteed by the U.S. Government or any of its sponsored agencies. Cash collateral received in connection with these loans is invested in short-term money market instruments or affiliated money market funds and is shown as such on the Schedule of Investments. It is the Fund’s policy to obtain additional collateral from or return excess collateral to the borrower by the end of the next business day, following the valuation date of the securities loaned. Therefore, the value of the collateral held may be temporarily less than the value of the securities on loan. Lending securities entails a risk of loss to the Fund if and to the extent that the market value of the securities loaned were to increase and the borrower did not increase the collateral accordingly, and the borrower fails to return the securities. Upon the failure of the borrower to return the securities, collateral may be liquidated and the securities may be purchased on the open market to replace the loaned securities. The Fund could experience delays and costs in gaining access to the collateral. The Fund bears the risk of any deficiency in the amount of the collateral available for return to the borrower due to any loss on the collateral invested. Dividends received on cash collateral investments for securities lending transactions, which are net of compensation to counterparties, is included in Dividends from affiliates on the Statement of Operations. The aggregate value of securities out on loan is shown as a footnote on the Statement of Assets and Liabilities, if any. | |
| K. | Foreign Currency Translations — Foreign currency is valued at the close of the NYSE based on quotations posted by banks and major currency dealers. Portfolio securities and other assets and liabilities denominated in foreign currencies are translated into U.S. dollar amounts at date of valuation. Purchases and sales of portfolio securities (net of foreign taxes withheld on disposition) and income items denominated in foreign currencies are translated into U.S. dollar amounts on the respective dates of such transactions. The Fund does not separately account for the portion of the results of operations resulting from changes in foreign exchange rates on investments and the fluctuations arising from changes in market prices of securities held. The combined results of changes in foreign exchange rates and the fluctuation of market prices on investments (net of estimated foreign tax withholding) are included with the net realized and unrealized gain or loss from investments in the Statement of Operations. Reported net realized foreign currency gains or losses arise from (1) sales of foreign currencies, (2) currency gains or losses realized between the trade and settlement dates on securities transactions, and (3) the difference between the amounts of dividends, interest, and foreign withholding taxes recorded on the Fund’s books and the U.S. dollar equivalent of the amounts actually received or paid. Net unrealized foreign currency gains and losses arise from changes in the fair values of assets and liabilities, other than investments in securities at fiscal period end, resulting from changes in exchange rates. | |
| The Fund may invest in foreign securities which may be subject to foreign taxes on income, gains on investments or currency repatriation, a portion of which may be recoverable. | ||
| L. | Foreign Currency Contracts — The Fund may enter into foreign currency contracts to manage or minimize currency or exchange rate risk. The Fund may also enter into foreign currency contracts for the purchase or sale of a security denominated in a foreign currency in order to “lock in” the |
16 Invesco International Core Equity Fund
| U.S. dollar price of that security. A foreign currency contract is an obligation to purchase or sell a specific currency for an agreed-upon price at a future date. The use of foreign currency contracts does not eliminate fluctuations in the price of the underlying securities the Fund owns or intends to acquire but establishes a rate of exchange in advance. Fluctuations in the value of these contracts are measured by the difference in the contract date and reporting date exchange rates and are recorded as unrealized appreciation (depreciation) until the contracts are closed. When the contracts are closed, realized gains (losses) are recorded. Realized and unrealized gains (losses) on the contracts are included in the Statement of Operations. The primary risks associated with foreign currency contracts include failure of the counterparty to meet the terms of the contract and the value of the foreign currency changing unfavorably. These risks may be in excess of the amounts reflected in the Statement of Assets and Liabilities. |
NOTE 2—Advisory Fees and Other Fees Paid to Affiliates
The Trust has entered into a master investment advisory agreement with Invesco Advisers, Inc. (the “Adviser” or “Invesco”). Under the terms of the investment advisory agreement, the Fund pays an advisory fee to the Adviser based on the annual rate of the Fund’s average daily net assets as follows:
| Average Daily Net Assets | Rate | |||
| First $500 million | 0 | .75% | ||
| Next $500 million | 0 | .65% | ||
| From $1 billion | 0 | .55% | ||
| From $2 billion | 0 | .45% | ||
| From $4 billion | 0 | .40% | ||
| From $6 billion | 0 | .375% | ||
| Over $8 billion | 0 | .35% | ||
Under the terms of a master sub-advisory agreement between the Adviser and each of Invesco Asset Management Deutschland GmbH, Invesco Asset Management Limited, Invesco Asset Management (Japan) Limited, Invesco Australia Limited, Invesco Hong Kong Limited, Invesco Senior Secured Management, Inc. and Invesco Canada Ltd. (collectively, the “Affiliated Sub-Advisers”) the Adviser, not the Fund, may pay 40% of the fees paid to the Adviser to any such Affiliated Sub-Adviser(s) that provide discretionary investment management services to the Fund based on the percentage of assets allocated to such Sub-Adviser(s).
The Adviser has contractually agreed, through at least February 28, 2013, to waive advisory fees and/or reimburse expenses of all shares to the extent necessary to limit total annual fund operating expenses after fee waiver and/or expense reimbursement (excluding certain items discussed below) of Class A, Class B, Class C, Class R, Class Y, Investor Class and Institutional Class shares to 2.25%, 3.00%, 3.00%, 2.50%, 2.00%, 2.25% and 2.00%, respectively, of average daily net assets. In determining the Adviser’s obligation to waive advisory fees and/or reimburse expenses, the following expenses are not taken into account, and could cause the total annual fund operating expenses after fee waiver and/or expense reimbursement to exceed the numbers reflected above: (1) interest; (2) taxes; (3) dividend expense on short sales; (4) extraordinary items or non-routine items; and (5) expenses that the Fund has incurred but did not actually pay because of an expense offset arrangement. Unless the Board of the Trustees and Invesco mutually agree to amend or continue the fee waiver agreement, it will terminate on February 28, 2013. The Adviser did not waive fees and/or reimburse expenses during the period under this expense limitation.
Further, the Adviser has contractually agreed, through at least June 30, 2012, to waive the advisory fee payable by the Fund in an amount equal to 100% of the net advisory fees the Adviser receives from the affiliated money market funds on investments by the Fund of uninvested cash (excluding investments of cash collateral from securities lending) in such affiliated money market funds.
For the year ended October 31, 2011, the Adviser waived advisory fees of $12,059.
At the request of the Trustees of the Trust, Invesco Ltd. agreed to reimburse expenses incurred by the Fund in connection with market timing matters in the Invesco Funds, which may include legal, audit, shareholder reporting, communications and trustee expenses. These expenses along with the related expense reimbursement are included in the Statement of Operations. For the year ended October 31, 2011, Invesco Ltd. reimbursed expenses of the Fund in the amount of $606.
The Trust has entered into a master administrative services agreement with Invesco pursuant to which the Fund has agreed to pay Invesco for certain administrative costs incurred in providing accounting services to the Fund. For the year ended October 31, 2011, expenses incurred under the agreement are shown in the Statement of Operations as administrative services fees.
The Trust has entered into a transfer agency and service agreement with Invesco Investment Services, Inc. (“IIS”) pursuant to which the Fund has agreed to pay IIS a fee for providing transfer agency and shareholder services to the Fund and reimburse IIS for certain expenses incurred by IIS in the course of providing such services. IIS may make payments to intermediaries that provide omnibus account services, sub-accounting services and/or networking services. All fees payable by IIS to intermediaries that provide omnibus account services or sub-accounting are charged back to the Fund, subject to certain limitations approved by the Trust’s Board of Trustees. For the year ended October 31, 2011, expenses incurred under the agreement are shown in the Statement of Operations as transfer agent fees.
The Trust has entered into master distribution agreements with Invesco Distributors, Inc. (“IDI”) to serve as the distributor for the Class A, Class B, Class C, Class R, Class Y, Investor Class and Institutional Class shares of the Fund. The Trust has adopted plans pursuant to Rule 12b-1 under the 1940 Act with respect to the Fund’s Class A, Class B, Class C, Class R and Investor Class shares (collectively, the “Plans”). The Fund, pursuant to the Plans, pays IDI compensation at the annual rate of 0.25% of the Fund’s average daily net assets of Class A shares, 1.00% of the average daily net assets of Class B and Class C shares, 0.50% of the average daily net assets of Class R shares and 0.25% of the average daily net assets of Investor Class shares. Of the Plan payments, up to 0.25% of the average daily net assets of each class of shares may be paid to furnish continuing personal shareholder services to customers who purchase and own shares of such classes. Any amounts not paid as a service fee under the Plans would constitute an asset-based sales charge. Rules of the Financial Industry Regulatory
17 Invesco International Core Equity Fund
Authority (“FINRA”) impose a cap on the total sales charges, including asset-based sales charges that may be paid by any class of shares of the Fund. For the year ended October 31, 2011, expenses incurred under the Plans are shown in the Statement of Operations as distribution fees.
Front-end sales commissions and CDSC (collectively, the “sales charges”) are not recorded as expenses of the Fund. Front-end sales commissions are deducted from proceeds from the sales of Fund shares prior to investment in Class A shares of the Fund. CDSC are deducted from redemption proceeds prior to remittance to the shareholder. During the year ended October 31, 2011, IDI advised the Fund that IDI retained $7,196 in front-end sales commissions from the sale of Class A shares and $6, $9,437 and $445 from Class A, Class B and Class C shares, respectively, for CDSC imposed on redemptions by shareholders.
Certain officers and trustees of the Trust are officers and directors of the Adviser, Invesco Ltd., IIS and/or IDI.
NOTE 3—Additional Valuation Information
GAAP defines fair value as the price that would be received to sell an asset or paid to transfer a liability in an orderly transaction between market participants at the measurement date, under current market conditions. GAAP establishes a hierarchy that prioritizes the inputs to valuation methods giving the highest priority to readily available unadjusted quoted prices in an active market for identical assets (Level 1) and the lowest priority to significant unobservable inputs (Level 3) generally when market prices are not readily available or are unreliable. Based on the valuation inputs, the securities or other investments are tiered into one of three levels. Changes in valuation methods may result in transfers in or out of an investment’s assigned level:
| Level 1 — | Prices are determined using quoted prices in an active market for identical assets. | |
| Level 2 — | Prices are determined using other significant observable inputs. Observable inputs are inputs that other market participants may use in pricing a security. These may include quoted prices for similar securities, interest rates, prepayment speeds, credit risk, yield curves, loss severities, default rates, discount rates, volatilities and others. | |
| Level 3 — | Prices are determined using significant unobservable inputs. In situations where quoted prices or observable inputs are unavailable (for example, when there is little or no market activity for an investment at the end of the period), unobservable inputs may be used. Unobservable inputs reflect the Fund’s own assumptions about the factors market participants would use in determining fair value of the securities or instruments and would be based on the best available information. |
The following is a summary of the tiered valuation input levels, as of October 31, 2011. The level assigned to the securities valuations may not be an indication of the risk or liquidity associated with investing in those securities. Because of the inherent uncertainties of valuation, the values reflected in the financial statements may materially differ from the value received upon actual sale of those investments.
During the year ended October 31, 2011, there were no significant transfers between investment levels.
| Level 1 | Level 2 | Level 3 | Total | |||||||||||||
| Australia | $ | — | $ | 23,298,540 | $ | — | $ | 23,298,540 | ||||||||
| Brazil | 3,591,002 | — | — | 3,591,002 | ||||||||||||
| Canada | 11,548,742 | — | — | 11,548,742 | ||||||||||||
| China | — | 3,206,402 | — | 3,206,402 | ||||||||||||
| Denmark | — | 2,946,376 | — | 2,946,376 | ||||||||||||
| France | 5,352,173 | 26,369,584 | — | 31,721,757 | ||||||||||||
| Germany | — | 13,965,985 | — | 13,965,985 | ||||||||||||
| Hong Kong | — | 8,412,831 | — | 8,412,831 | ||||||||||||
| India | — | 1,621,945 | — | 1,621,945 | ||||||||||||
| Indonesia | — | 380,212 | — | 380,212 | ||||||||||||
| Ireland | 692,016 | — | — | 692,016 | ||||||||||||
| Italy | 4,863,241 | 2,448,480 | — | 7,311,721 | ||||||||||||
| Japan | — | 65,987,890 | — | 65,987,890 | ||||||||||||
| Mexico | 713,413 | — | — | 713,413 | ||||||||||||
| Netherlands | — | 5,162,976 | — | 5,162,976 | ||||||||||||
| Norway | — | 9,517,546 | — | 9,517,546 | ||||||||||||
| Poland | — | 651,401 | — | 651,401 | ||||||||||||
| Russia | — | 1,496,777 | — | 1,496,777 | ||||||||||||
| South Africa | 650,340 | 2,040,997 | — | 2,691,337 | ||||||||||||
| South Korea | 794,764 | 5,560,813 | — | 6,355,577 | ||||||||||||
| Spain | 3,840,612 | 11,906,634 | — | 15,747,246 | ||||||||||||
| Switzerland | — | 20,962,856 | — | 20,962,856 | ||||||||||||
| Taiwan | 255,619 | 1,789,230 | — | 2,044,849 | ||||||||||||
| Thailand | — | 971,995 | — | 971,995 | ||||||||||||
| Turkey | — | 357,711 | — | 357,711 | ||||||||||||
| United Kingdom | 7,768,616 | 32,401,448 | — | 40,170,064 | ||||||||||||
| United States | 25,904,537 | — | — | 25,904,537 | ||||||||||||
| Total Investments | $ | 65,975,075 | $ | 241,458,629 | $ | — | $ | 307,433,704 | ||||||||
18 Invesco International Core Equity Fund
NOTE 4—Expense Offset Arrangement(s)
The expense offset arrangement is comprised of transfer agency credits which result from balances in Demand Deposit Accounts (DDA) used by the transfer agent for clearing shareholder transactions. For the year ended October 31, 2011, the Fund received credits from this arrangement, which resulted in the reduction of the Fund’s total expenses of $920.
NOTE 5—Trustees’ and Officers’ Fees and Benefits
“Trustees’ and Officers’ Fees and Benefits” include amounts accrued by the Fund to pay remuneration to certain Trustees and Officers of the Fund. Trustees have the option to defer compensation payable by the Fund, and “Trustees’ and Officers’ Fees and Benefits” also include amounts accrued by the Fund to fund such deferred compensation amounts. Those Trustees who defer compensation have the option to select various Invesco Funds in which their deferral accounts shall be deemed to be invested. Finally, certain current Trustees are eligible to participate in a retirement plan that provides for benefits to be paid upon retirement to Trustees over a period of time based on the number of years of service. The Fund may have certain former Trustees who also participate in a retirement plan and receive benefits under such plan. “Trustees’ and Officers’ Fees and Benefits” include amounts accrued by the Fund to fund such retirement benefits. Obligations under the deferred compensation and retirement plans represent unsecured claims against the general assets of the Fund.
During the year ended October 31, 2011, the Fund paid legal fees of $1,996 for services rendered by Kramer, Levin, Naftalis & Frankel LLP as counsel to the Independent Trustees. A partner of that firm is a Trustee of the Trust.
NOTE 6—Cash Balances
The Fund is permitted to temporarily carry a negative or overdrawn balance in its account with The State Street Bank and Trust Company, the custodian bank. To compensate the custodian bank for such overdrafts, the overdrawn Fund may either (1) leave funds as a compensating balance in the account so the custodian bank can be compensated by earning the additional interest; or (2) compensate by paying the custodian bank at a rate agreed upon by the custodian bank and Invesco, not to exceed the contractually agreed upon rate.
NOTE 7—Distributions to Shareholders and Tax Components of Net Assets
Tax Character of Distributions to Shareholders Paid During the Years Ended October 31, 2011 and 2010:
| 2011 | 2010 | |||||||
| Ordinary income | $ | 5,279,567 | $ | 6,756,774 | ||||
Tax Components of Net Assets at Period-End:
| 2011 | ||||
| Undistributed ordinary income | $ | 8,812,960 | ||
| Net unrealized appreciation (depreciation) — investments | (120,461 | ) | ||
| Net unrealized appreciation — other investments | 77,768 | |||
| Temporary book/tax differences | (78,558 | ) | ||
| Capital loss carryforward | (71,443,903 | ) | ||
| Shares of beneficial interest | 355,529,935 | |||
| Total net assets | $ | 292,777,741 | ||
The difference between book-basis and tax-basis unrealized appreciation (depreciation) is due to differences in the timing of recognition of gains and losses on investments for tax and book purposes. The Fund’s net unrealized appreciation (depreciation) difference is attributable primarily to wash sales.
The temporary book/tax differences are a result of timing differences between book and tax recognition of income and/or expenses. The Fund’s temporary book/tax differences are the result of the trustee deferral of compensation and retirement plan benefits.
Capital loss carryforward is calculated and reported as of a specific date. Results of transactions and other activity after that date may affect the amount of capital loss carryforward actually available for the Fund to utilize. The ability to utilize capital loss carryforward in the future may be limited under the Internal Revenue Code and related regulations based on the results of future transactions.
The Fund utilized $3,320,043 of capital loss carryforward in the current period to offset net realized capital gain for federal income tax purposes. The Fund has a capital loss carryforward as of October 31, 2011, which expires as follows:
| Capital Loss | ||||
| Expiration | Carryforward* | |||
| October 31, 2016 | $ | 11,926,758 | ||
| October 31, 2017 | 59,517,145 | |||
| Total capital loss carryforward | $ | 71,443,903 | ||
| * | Capital loss carryforward as of the date listed above is reduced for limitations, if any, to the extent required by the Internal Revenue Code. |
19 Invesco International Core Equity Fund
NOTE 8—Investment Securities
The aggregate amount of investment securities (other than short-term securities, U.S. Treasury obligations and money market funds, if any) purchased and sold by the Fund during the year ended October 31, 2011 was $84,397,609 and $80,486,092, respectively. Cost of investments on a tax basis includes the adjustments for financial reporting purposes as of the most recently completed Federal income tax reporting period-end.
| Unrealized Appreciation (Depreciation) of Investment Securities on a Tax Basis | ||||
| Aggregate unrealized appreciation of investment securities | $ | 35,648,022 | ||
| Aggregate unrealized (depreciation) of investment securities | (35,768,483 | ) | ||
| Net unrealized appreciation (depreciation) of investment securities | $ | (120,461 | ) | |
| Cost of investments for tax purposes is $307,554,165. | ||||
NOTE 9—Reclassification of Permanent Differences
Primarily as a result of differing book/tax treatment of foreign currency transactions, litigation settlements and foreign capital gain taxes, on October 31, 2011, undistributed net investment income was decreased by $146,667 and undistributed net realized gain (loss) was increased by $146,667. This reclassification had no effect on the net assets of the Fund.
NOTE 10—Share Information
| Summary of Share Activity | ||||||||||||||||
| Year ended October 31, | ||||||||||||||||
| 2011(a) | 2010 | |||||||||||||||
| Shares | Amount | Shares | Amount | |||||||||||||
| Sold: | ||||||||||||||||
| Class A | 1,656,894 | $ | 18,905,446 | 588,507 | $ | 6,117,298 | ||||||||||
| Class B | 118,128 | 1,348,732 | 64,519 | 675,741 | ||||||||||||
| Class C | 123,695 | 1,321,952 | 188,883 | 1,942,148 | ||||||||||||
| Class R | 98,816 | 1,059,284 | 159,062 | 1,659,257 | ||||||||||||
| Class Y | 26,495 | 296,534 | 71,353 | 748,734 | ||||||||||||
| Investor Class | 91,664 | 1,026,309 | 146,139 | 1,541,654 | ||||||||||||
| Institutional Class | 2,874,759 | 30,019,524 | 6,325,941 | 64,297,311 | ||||||||||||
| Issued as reinvestment of dividends: | ||||||||||||||||
| Class A | 41,920 | 459,022 | 89,742 | 955,749 | ||||||||||||
| Class B | 1,718 | 18,918 | 7,276 | 77,708 | ||||||||||||
| Class C | 4,747 | 50,933 | 16,614 | 172,952 | ||||||||||||
| Class R | 2,474 | 27,144 | 3,614 | 38,562 | ||||||||||||
| Class Y | 2,028 | 22,519 | 3,147 | 34,024 | ||||||||||||
| Investor Class | 20,260 | 225,084 | 31,230 | 337,598 | ||||||||||||
| Institutional Class | 405,410 | 4,423,027 | 476,201 | 5,062,018 | ||||||||||||
| Automatic conversion of Class B shares to Class A shares: | ||||||||||||||||
| Class A | 157,225 | 1,708,417 | 138,141 | 1,431,377 | ||||||||||||
| Class B | (157,076 | ) | (1,708,417 | ) | (138,192 | ) | (1,431,377 | ) | ||||||||
Reacquired:(b) | ||||||||||||||||
| Class A | (1,153,714 | ) | (12,434,214 | ) | (3,107,300 | ) | (32,204,428 | ) | ||||||||
| Class B | (129,629 | ) | (1,424,559 | ) | (259,122 | ) | (2,668,631 | ) | ||||||||
| Class C | (416,726 | ) | (4,437,203 | ) | (592,782 | ) | (5,998,297 | ) | ||||||||
| Class R | (89,623 | ) | (1,001,634 | ) | (147,272 | ) | (1,516,747 | ) | ||||||||
| Class Y | (60,565 | ) | (670,425 | ) | (98,198 | ) | (1,020,236 | ) | ||||||||
| Investor Class | (284,590 | ) | (3,147,130 | ) | (479,929 | ) | (4,989,211 | ) | ||||||||
| Institutional Class | (3,266,068 | ) | (35,706,965 | ) | (9,339,381 | ) | (97,483,763 | ) | ||||||||
| Net increase (decrease) in share activity | 68,242 | $ | 382,298 | (5,851,807 | ) | $ | (62,220,559 | ) | ||||||||
| (a) | 67% of the outstanding shares of the Fund are owned by affiliated mutual funds. Affiliated mutual funds are other mutual funds that are also advised by Invesco. | |
| (b) | Net of redemption fees of $1,280 and $12,274 allocated among the classes based on relative net assets of each class for the years ended October 31, 2011 and year ended October 30, 2010, respectively. |
20 Invesco International Core Equity Fund
NOTE 11—Financial Highlights
The following schedule presents financial highlights for a share of the Fund outstanding throughout the periods indicated.
| Ratio of | Ratio of | |||||||||||||||||||||||||||||||||||||||||||||||||||||||
| Net gains | expenses | expenses | ||||||||||||||||||||||||||||||||||||||||||||||||||||||
| (losses) on | to average | to average net | Ratio of net | |||||||||||||||||||||||||||||||||||||||||||||||||||||
| Net asset | securities | Dividends | Distributions | net assets | assets without | investment | ||||||||||||||||||||||||||||||||||||||||||||||||||
| value, | Net | (both | Total from | from net | from net | Net asset | Net assets, | with fee waivers | fee waivers | income to | ||||||||||||||||||||||||||||||||||||||||||||||
| beginning | investment | realized and | investment | investment | realized | Total | value, end | Total | end of period | and/or expenses | and/or expenses | average | Portfolio | |||||||||||||||||||||||||||||||||||||||||||
| of period | income(a) | unrealized) | operations | income | gains | distributions | of period(b) | return(c) | (000s omitted) | absorbed | absorbed | net assets | turnover(d) | |||||||||||||||||||||||||||||||||||||||||||
| Class A | ||||||||||||||||||||||||||||||||||||||||||||||||||||||||
| Year ended 10/31/11 | $ | 10.96 | $ | 0.30 | $ | (1.11 | ) | $ | (0.81 | ) | $ | (0.13 | ) | $ | — | $ | (0.13 | ) | $ | 10.02 | (7.46 | )% | $ | 43,983 | 1.54 | %(e) | 1.54 | %(e) | 2.71 | %(e) | 26 | % | ||||||||||||||||||||||||
| Year ended 10/31/10 | 10.34 | 0.17 | 0.62 | 0.79 | (0.17 | ) | — | (0.17 | ) | 10.96 | 7.68 | 40,422 | 1.51 | 1.51 | 1.59 | 39 | ||||||||||||||||||||||||||||||||||||||||
| Year ended 10/31/09 | 8.63 | 0.14 | 1.87 | 2.01 | (0.30 | ) | — | (0.30 | ) | 10.34 | 24.35 | 61,810 | 1.62 | 1.62 | 1.63 | 43 | ||||||||||||||||||||||||||||||||||||||||
| Year ended 10/31/08 | 16.77 | 0.28 | (7.01 | ) | (6.73 | ) | (0.18 | ) | (1.23 | ) | (1.41 | ) | 8.63 | (43.45 | ) | 45,100 | 1.45 | 1.45 | 2.13 | 38 | ||||||||||||||||||||||||||||||||||||
| Year ended 10/31/07 | 14.44 | 0.22 | 2.75 | 2.97 | (0.22 | ) | (0.42 | ) | (0.64 | ) | 16.77 | 21.26 | 96,961 | 1.41 | 1.41 | 1.46 | 27 | |||||||||||||||||||||||||||||||||||||||
| Class B | ||||||||||||||||||||||||||||||||||||||||||||||||||||||||
| Year ended 10/31/11 | 10.92 | 0.22 | (1.11 | ) | (0.89 | ) | (0.03 | ) | — | (0.03 | ) | 10.00 | (8.16 | ) | 4,654 | 2.29 | (e) | 2.29 | (e) | 1.96 | (e) | 26 | ||||||||||||||||||||||||||||||||||
| Year ended 10/31/10 | 10.30 | 0.09 | 0.62 | 0.71 | (0.09 | ) | — | (0.09 | ) | 10.92 | 6.88 | 6,906 | 2.26 | 2.26 | 0.84 | 39 | ||||||||||||||||||||||||||||||||||||||||
| Year ended 10/31/09 | 8.54 | 0.08 | 1.86 | 1.94 | (0.18 | ) | — | (0.18 | ) | 10.30 | 23.26 | 9,864 | 2.37 | 2.37 | 0.88 | 43 | ||||||||||||||||||||||||||||||||||||||||
| Year ended 10/31/08 | 16.58 | 0.18 | (6.93 | ) | (6.75 | ) | (0.06 | ) | (1.23 | ) | (1.29 | ) | 8.54 | (43.79 | ) | 10,873 | 2.20 | 2.20 | 1.38 | 38 | ||||||||||||||||||||||||||||||||||||
| Year ended 10/31/07 | 14.30 | 0.11 | 2.71 | 2.82 | (0.12 | ) | (0.42 | ) | (0.54 | ) | 16.58 | 20.25 | 32,592 | 2.16 | 2.16 | 0.71 | 27 | |||||||||||||||||||||||||||||||||||||||
| Class C | ||||||||||||||||||||||||||||||||||||||||||||||||||||||||
| Year ended 10/31/11 | 10.65 | 0.21 | (1.09 | ) | (0.88 | ) | (0.03 | ) | — | (0.03 | ) | 9.74 | (8.28 | ) | 15,597 | 2.29 | (e) | 2.29 | (e) | 1.96 | (e) | 26 | ||||||||||||||||||||||||||||||||||
| Year ended 10/31/10 | 10.04 | 0.09 | 0.61 | 0.70 | (0.09 | ) | — | (0.09 | ) | 10.65 | 6.96 | 20,110 | 2.26 | 2.26 | 0.84 | 39 | ||||||||||||||||||||||||||||||||||||||||
| Year ended 10/31/09 | 8.33 | 0.07 | 1.82 | 1.89 | (0.18 | ) | — | (0.18 | ) | 10.04 | 23.25 | 22,854 | 2.37 | 2.37 | 0.88 | 43 | ||||||||||||||||||||||||||||||||||||||||
| Year ended 10/31/08 | 16.21 | 0.18 | (6.77 | ) | (6.59 | ) | (0.06 | ) | (1.23 | ) | (1.29 | ) | 8.33 | (43.80 | ) | 21,323 | 2.20 | 2.20 | 1.38 | 38 | ||||||||||||||||||||||||||||||||||||
| Year ended 10/31/07 | 13.98 | 0.11 | 2.66 | 2.77 | (0.12 | ) | (0.42 | ) | (0.54 | ) | 16.21 | 20.36 | 50,234 | 2.16 | 2.16 | 0.71 | 27 | |||||||||||||||||||||||||||||||||||||||
| Class R | ||||||||||||||||||||||||||||||||||||||||||||||||||||||||
| Year ended 10/31/11 | 10.95 | 0.27 | (1.11 | ) | (0.84 | ) | (0.10 | ) | — | (0.10 | ) | 10.01 | (7.76 | ) | 2,885 | 1.79 | (e) | 1.79 | (e) | 2.46 | (e) | 26 | ||||||||||||||||||||||||||||||||||
| Year ended 10/31/10 | 10.33 | 0.14 | 0.62 | 0.76 | (0.14 | ) | — | (0.14 | ) | 10.95 | 7.41 | 3,028 | 1.76 | 1.76 | 1.34 | 39 | ||||||||||||||||||||||||||||||||||||||||
| Year ended 10/31/09 | 8.61 | 0.12 | 1.86 | 1.98 | (0.26 | ) | — | (0.26 | ) | 10.33 | 23.88 | 2,697 | 1.87 | 1.87 | 1.38 | 43 | ||||||||||||||||||||||||||||||||||||||||
| Year ended 10/31/08 | 16.72 | 0.24 | (6.98 | ) | (6.74 | ) | (0.14 | ) | (1.23 | ) | (1.37 | ) | 8.61 | (43.55 | ) | 2,077 | 1.70 | 1.70 | 1.88 | 38 | ||||||||||||||||||||||||||||||||||||
| Year ended 10/31/07 | 14.40 | 0.18 | 2.74 | 2.92 | (0.18 | ) | (0.42 | ) | (0.60 | ) | 16.72 | 20.97 | 4,286 | 1.66 | 1.66 | 1.21 | 27 | |||||||||||||||||||||||||||||||||||||||
| Class Y | ||||||||||||||||||||||||||||||||||||||||||||||||||||||||
| Year ended 10/31/11 | 11.14 | 0.33 | (1.12 | ) | (0.79 | ) | (0.17 | ) | — | (0.17 | ) | 10.18 | (7.23 | ) | 1,354 | 1.29 | (e) | 1.29 | (e) | 2.96 | (e) | 26 | ||||||||||||||||||||||||||||||||||
| Year ended 10/31/10 | 10.51 | 0.19 | 0.64 | 0.83 | (0.20 | ) | — | (0.20 | ) | 11.14 | 7.91 | 1,839 | 1.26 | 1.26 | 1.84 | 39 | ||||||||||||||||||||||||||||||||||||||||
| Year ended 10/31/09 | 8.75 | 0.18 | 1.88 | 2.06 | (0.30 | ) | — | (0.30 | ) | 10.51 | 24.61 | 1,983 | 1.37 | 1.37 | 1.88 | 43 | ||||||||||||||||||||||||||||||||||||||||
| Year ended 10/31/08(f) | 10.45 | 0.01 | (1.71 | ) | (1.70 | ) | — | — | — | 8.75 | (16.27 | ) | 185 | 1.30 | (g) | 1.30 | (g) | 2.28 | (g) | 38 | ||||||||||||||||||||||||||||||||||||
| Investor Class | ||||||||||||||||||||||||||||||||||||||||||||||||||||||||
| Year ended 10/31/11 | 11.12 | 0.30 | (1.13 | ) | (0.83 | ) | (0.13 | ) | — | (0.13 | ) | 10.16 | (7.53 | ) | 16,009 | 1.54 | (e) | 1.54 | (e) | 2.71 | (e) | 26 | ||||||||||||||||||||||||||||||||||
| Year ended 10/31/10 | 10.49 | 0.17 | 0.63 | 0.80 | (0.17 | ) | — | (0.17 | ) | 11.12 | 7.67 | 19,438 | 1.51 | 1.51 | 1.59 | 39 | ||||||||||||||||||||||||||||||||||||||||
| Year ended 10/31/09 | 8.75 | 0.14 | 1.90 | 2.04 | (0.30 | ) | — | (0.30 | ) | 10.49 | 24.35 | 21,500 | 1.62 | 1.62 | 1.63 | 43 | ||||||||||||||||||||||||||||||||||||||||
| Year ended 10/31/08 | 16.98 | 0.28 | (7.10 | ) | (6.82 | ) | (0.18 | ) | (1.23 | ) | (1.41 | ) | 8.75 | (43.44 | ) | 19,710 | 1.45 | 1.45 | 2.13 | 38 | ||||||||||||||||||||||||||||||||||||
| Year ended 10/31/07 | 14.61 | 0.23 | 2.78 | 3.01 | (0.22 | ) | (0.42 | ) | (0.64 | ) | 16.98 | 21.29 | 44,428 | 1.41 | 1.41 | 1.46 | 27 | |||||||||||||||||||||||||||||||||||||||
| Institutional Class | ||||||||||||||||||||||||||||||||||||||||||||||||||||||||
| Year ended 10/31/11 | 10.99 | 0.37 | (1.11 | ) | (0.74 | ) | (0.21 | ) | — | (0.21 | ) | 10.04 | (6.85 | ) | 208,295 | 0.91 | (e) | 0.91 | (e) | 3.34 | (e) | 26 | ||||||||||||||||||||||||||||||||||
| Year ended 10/31/10 | 10.37 | 0.23 | 0.63 | 0.86 | (0.24 | ) | — | (0.24 | ) | 10.99 | 8.35 | 228,027 | 0.91 | 0.91 | 2.19 | 39 | ||||||||||||||||||||||||||||||||||||||||
| Year ended 10/31/09 | 8.70 | 0.20 | 1.86 | 2.06 | (0.39 | ) | — | (0.39 | ) | 10.37 | 25.10 | 241,432 | 0.94 | 0.94 | 2.31 | 43 | ||||||||||||||||||||||||||||||||||||||||
| Year ended 10/31/08 | 16.89 | 0.35 | (7.05 | ) | (6.70 | ) | (0.26 | ) | (1.23 | ) | (1.49 | ) | 8.70 | (43.08 | ) | 209,494 | 0.87 | 0.87 | 2.71 | 38 | ||||||||||||||||||||||||||||||||||||
| Year ended 10/31/07 | 14.54 | 0.31 | 2.75 | 3.06 | (0.29 | ) | (0.42 | ) | (0.71 | ) | 16.89 | 21.89 | 405,507 | 0.88 | 0.88 | 1.99 | 27 | |||||||||||||||||||||||||||||||||||||||
| (a) | Calculated using average shares outstanding. | |
| (b) | Includes redemption fees added to shares of beneficial interest which were less than $0.005 per share. | |
| (c) | Includes adjustments in accordance with accounting principles generally accepted in the United States of America and as such, the net asset value for financial reporting purposes and the returns based upon those net asset values may differ from the net asset value and returns for shareholder transactions. Does not include sales charges and is not annualized for periods less than one year, if applicable. | |
| (d) | Portfolio turnover is calculated at the fund level and is not annualized for periods less than one year, if applicable. | |
| (e) | Ratios are based on average daily net assets (000’s omitted) of $44,736, $6,259, $18,863, $3,044, $1,624, $18,610 and $224,230 for Class A, Class B, Class C, Class R, Class Y, Investor Class and Institutional Class shares, respectively. | |
| (f) | Commencement date of October 3, 2008. | |
| (g) | Annualized. |
21 Invesco International Core Equity Fund
Report of Independent Registered Public Accounting Firm
To the Board of Trustees of AIM International Mutual Funds (Invesco International Mutual Funds)
and Shareholders of Invesco International Core Equity Fund:
In our opinion, the accompanying statement of assets and liabilities, including the schedule of investments, and the related statements of operations and of changes in net assets and the financial highlights present fairly, in all material respects, the financial position of Invesco International Core Equity Fund (one of the funds constituting AIM International Mutual Funds (Invesco International Mutual Funds), hereafter referred to as the “Fund”) at October 31, 2011, the results of its operations for the year then ended, the changes in its net assets for each of the two years in the period then ended and the financial highlights for each of the five years in the period then ended, in conformity with accounting principles generally accepted in the United States of America. These financial statements and financial highlights (hereafter referred to as “financial statements”) are the responsibility of the Fund’s management; our responsibility is to express an opinion on these financial statements based on our audits. We conducted our audits of these financial statements in accordance with the standards of the Public Company Accounting Oversight Board (United States). Those standards require that we plan and perform the audit to obtain reasonable assurance about whether the financial statements are free of material misstatement. An audit includes examining, on a test basis, evidence supporting the amounts and disclosures in the financial statements, assessing the accounting principles used and significant estimates made by management, and evaluating the overall financial statement presentation. We believe that our audits, which included confirmation of securities at October 31, 2011 by correspondence with the custodian and brokers, provide a reasonable basis for our opinion.
PRICEWATERHOUSECOOPERS LLP
Houston, Texas
December 21, 2011
22 Invesco International Core Equity Fund
Calculating your ongoing Fund expenses
Example
As a shareholder of the Fund, you incur two types of costs: (1) transaction costs, which may include sales charges (loads) on purchase payments or contingent deferred sales charges on redemptions, and redemption fees, if any; and (2) ongoing costs, including management fees, distribution and/or service (12b-1) fees, and other Fund expenses. This example is intended to help you understand your ongoing costs (in dollars) of investing in the Fund and to compare these costs with ongoing costs of investing in other mutual funds. The example is based on an investment of $1,000 invested at the beginning of the period and held for the entire period May 1, 2011 through October 31, 2011.
Actual expenses
The table below provides information about actual account values and actual expenses. You may use the information in this table, together with the amount you invested, to estimate the expenses that you paid over the period. Simply divide your account value by $1,000 (for example, an $8,600 account value divided by $1,000 = 8.6), then multiply the result by the number in the table under the heading entitled “Actual Expenses Paid During Period” to estimate the expenses you paid on your account during this period.
Hypothetical example for comparison purposes
The table below also provides information about hypothetical account values and hypothetical expenses based on the Fund’s actual expense ratio and an assumed rate of return of 5% per year before expenses, which is not the Fund’s actual return.
The hypothetical account values and expenses may not be used to estimate the actual ending account balance or expenses you paid for the period. You may use this information to compare the ongoing costs of investing in the Fund and other funds. To do so, compare this 5% hypothetical example with the 5% hypothetical examples that appear in the shareholder reports of the other funds.
Please note that the expenses shown in the table are meant to highlight your ongoing costs only and do not reflect any transaction costs, such as sales charges (loads) on purchase payments, contingent deferred sales charges on redemptions, and redemption fees, if any. Therefore, the hypothetical information is useful in comparing ongoing costs only, and will not help you determine the relative total costs of owning different funds. In addition, if these transaction costs were included, your costs would have been higher.
| HYPOTHETICAL | ||||||||||||||||||||||||||||||
| (5% annual return before | ||||||||||||||||||||||||||||||
| ACTUAL | expenses) | |||||||||||||||||||||||||||||
| Beginning | Ending | Expenses | Ending | Expenses | Annualized | |||||||||||||||||||||||||
| Account Value | Account Value | Paid During | Account Value | Paid During | Expense | |||||||||||||||||||||||||
| Class | (05/01/11) | (10/31/11)1 | Period2 | (10/31/11) | Period2 | Ratio | ||||||||||||||||||||||||
| A | $ | 1,000.00 | $ | 839.90 | $ | 7.19 | $ | 1,017.39 | $ | 7.88 | 1.55 | % | ||||||||||||||||||
| B | 1,000.00 | 836.80 | 10.65 | 1,013.61 | 11.67 | 2.30 | ||||||||||||||||||||||||
| C | 1,000.00 | 836.10 | 10.64 | 1,013.61 | 11.67 | 2.30 | ||||||||||||||||||||||||
| R | 1,000.00 | 838.40 | 8.34 | 1,016.13 | 9.15 | 1.80 | ||||||||||||||||||||||||
| Y | 1,000.00 | 840.60 | 6.03 | 1,018.65 | 6.61 | 1.30 | ||||||||||||||||||||||||
| Investor | 1,000.00 | 839.00 | 7.18 | 1,017.39 | 7.88 | 1.55 | ||||||||||||||||||||||||
| Institutional | 1,000.00 | 842.30 | 4.23 | 1,020.62 | 4.63 | 0.91 | ||||||||||||||||||||||||
| 1 | The actual ending account value is based on the actual total return of the Fund for the period May 1, 2011 through October 31, 2011, after actual expenses and will differ from the hypothetical ending account value which is based on the Fund’s expense ratio and a hypothetical annual return of 5% before expenses. |
| 2 | Expenses are equal to the Fund’s annualized expense ratio as indicated above multiplied by the average account value over the period, multiplied by 184/365 to reflect the most recent fiscal half year. |
23 Invesco International Core Equity Fund
| Approval of Investment Advisory and Sub-Advisory Contracts |
The Board of Trustees (the Board) of AIM International Mutual Funds (Invesco International Mutual Funds) is required under the Investment Company Act of 1940, as amended, to approve annually the renewal of the Invesco International Core Equity Fund (the Fund) investment advisory agreement with Invesco Advisers, Inc. (Invesco Advisers) and the Master Intergroup Sub-Advisory Contract for Mutual Funds (the sub-advisory contracts) with Invesco Asset Management Deutschland GmbH, Invesco Asset Management Limited, Invesco Asset Management (Japan) Limited, Invesco Australia Limited, Invesco Hong Kong Limited, Invesco Senior Secured Management, Inc. and Invesco Canada Ltd. (collectively, the Affiliated Sub-Advisers). During contract renewal meetings held on June 14-15, 2011, the Board as a whole, and the disinterested or “independent” Trustees, who comprise 80% of the Board, voting separately, approved the continuance of the Fund’s investment advisory agreement and the sub-advisory contracts for another year, effective July 1, 2011. In doing so, the Board considered the process that it follows in reviewing and approving the Fund’s investment advisory agreement and sub-advisory contracts and the information that it is provided. The Board determined that the Fund’s investment advisory agreement and the sub-advisory contracts are in the best interests of the Fund and its shareholders and the compensation to Invesco Advisers and the Affiliated Sub-Advisers under the agreements is fair and reasonable.
The Board’s Fund Evaluation Process
The Board’s Investments Committee has established three Sub-Committees, each of which is responsible for overseeing the management of a number of the series portfolios of the funds advised by Invesco Advisers (the Invesco Funds). The Sub-Committees meet throughout the year to review the performance of their assigned funds, including reviewing materials prepared under the direction of the independent Senior Officer, an officer of the Invesco Funds who reports directly to the independent Trustees. Over the course of each year, the Sub-Committees meet with portfolio managers for their assigned Invesco Funds and other members of management to review the performance, investment objective(s), policies, strategies and limitations and investment risks of these funds. The Sub-Committees meet regularly and at designated contract renewal meetings each year to conduct a review of the performance, fees, expenses and other matters related to their assigned Invesco Funds. Each Sub-Committee recommends to the Investments Committee, which in turn recommends to the full Board, whether to approve the continuance of each Invesco Fund’s investment advisory agreement and sub-advisory contracts for another year.
During the contract renewal process, the Trustees receive comparative performance and fee data regarding the Invesco Funds prepared by Invesco Advisers and an independent company, Lipper, Inc. (Lipper). The Trustees also receive an independent written evaluation from the Senior Officer. The Senior Officer’s evaluation is prepared as part of his responsibility to manage the process by which the Invesco Funds’ proposed management fees are negotiated during the annual contract renewal process to ensure they are negotiated in a manner that is at arms’ length and reasonable. The independent Trustees are assisted in their annual evaluation of the Fund’s investment advisory agreement by the Senior Officer and by independent legal counsel. The independent Trustees also discuss the continuance of the investment advisory agreement and sub-advisory contracts in private sessions with the Senior Officer and counsel.
In evaluating the fairness and reasonableness of the Fund’s investment advisory agreement and sub-advisory contracts, the Board considered, among other things, the factors discussed below. The Trustees also considered information provided in connection with fund acquisitions approved by the Trustees to rationalize the Invesco Funds product range following the acquisition of the retail mutual fund business of Morgan Stanley (the Morgan Stanley Transaction). The Trustees recognized that the advisory fees for the Invesco Funds include advisory fees that are the result of years of review and negotiation between the Trustees and Invesco Advisers as well as advisory fees inherited from Morgan Stanley and Van Kampen funds acquired in the Morgan Stanley Transaction. The Trustees’ deliberations and conclusions in a particular year may be based in part on their deliberations and conclusions regarding these same arrangements throughout the year and in prior years. One Trustee may have weighed a particular piece of information differently than another Trustee.
The discussion below serves as the Senior Officer’s independent written evaluation with respect to the Fund’s investment advisory agreement as well as a discussion of the material factors and related conclusions that formed the basis for the Board’s approval of the Fund’s investment advisory agreement and sub-advisory contracts. Unless otherwise stated, this information is current as of June 15, 2011, and may not reflect consideration of factors that became known to the Board after that date, including, for example, changes to the Fund’s performance, advisory fees, expense limitations and/or fee waivers.
Factors and Conclusions and Summary of Independent Written Fee Evaluation
| A. | Nature, Extent and Quality of Services Provided by Invesco Advisers and the Affiliated Sub-Advisers |
The Board reviewed the advisory services provided to the Fund by Invesco Advisers under the Fund’s investment advisory agreement, the performance of Invesco Advisers in providing these services, and the credentials and experience of the officers and employees of Invesco Advisers who provide these services, including the Fund’s portfolio manager or managers, with whom the Board met during the year. The Board’s review of the qualifications of Invesco Advisers to provide advisory services included the Board’s consideration of Invesco Advisers’ performance and investment process oversight, independent credit analysis and investment risk management.
In determining whether to continue the Fund’s investment advisory agreement, the Board considered the prior relationship between Invesco Advisers and the Fund, as well as the Board’s knowledge of Invesco Advisers’ operations, and concluded that it is beneficial to maintain the current relationship, in part, because of such knowledge. The Board also considered services that Invesco Advisers and its affiliates provide to the Invesco Funds such as various back office support functions, equity and fixed income trading operations, internal audit, distribution and legal and compliance. The Board concluded that the nature, extent and quality of the services provided to the Fund by Invesco Advisers are appropriate and satisfactory and the advisory services are provided in accordance with the terms of the Fund’s investment advisory agreement.
The Board reviewed the services provided by the Affiliated Sub-Advisers under the sub-advisory contracts and the credentials and experience of the officers and employees of the Affiliated Sub-Advisers who provide these services. The Board noted that the Affiliated Sub-Advisers have offices and personnel that are located in financial centers around the world. As a result, the Affiliated Sub-Advisers can provide research and investment analysis on the markets and economies of various countries in which the Fund invests and make recommendations on securities of companies located in such countries. The Board concluded that the sub-advisory contracts benefit the Fund and its shareholders by permitting Invesco Advisers to use the resources and talents of the Affiliated Sub-Advisers in managing the Fund. The Board concluded that the nature, extent and quality of the services provided by the Affiliated Sub-Advisers are appropriate and satisfactory and in accordance with the terms of the Fund’s sub-advisory contracts.
| B. | Fund Performance |
The Board considered Fund performance as a relevant factor in considering whether to approve the investment advisory agreement. The Board did not view Fund performance as a relevant factor in considering whether to approve the sub-advisory contracts for the Fund, as no Affiliated Sub-Adviser currently manages assets of the Fund.
The Board compared the Fund’s performance during the past one, three and five calendar years to the performance of all funds in the Lipper performance universe and against the Lipper
24 Invesco International Core Equity Fund
International Large-Cap Core Funds Index. The Board noted that performance of Investor Class shares of the Fund was in the fifth quintile of the performance universe for the one year period, in the second quintile for the three year period and in the third quintile for the five year period (the first quintile being the best performing funds and the fifth quintile being the worst performing funds). The Board noted that performance of Investor Class shares of the Fund was below the performance of the Index for the one year period and above the performance of the Index for the three and five year periods. Although the independent written evaluation of the Fund’s Senior Officer only considered Fund performance through the most recent calendar year, the Trustees also reviewed more recent Fund performance and this review did not change their conclusions.
| C. | Advisory and Sub-Advisory Fees and Fee Waivers |
The Board compared the Fund’s contractual advisory fee rate to the contractual advisory fee rates of funds in the Fund’s Lipper expense group at a common asset level. The Board noted that the contractual advisory fee rate for Investor Class shares of the Fund was at the median contractual advisory fee rate of funds in the expense group. The Board also reviewed the methodology used by Lipper in providing expense group information, which includes using audited financial data from the most recent annual report of each fund in the expense group that was publicly available as of the end of the past calendar year and including only one fund per investment adviser. The Board noted that comparative data is as of varying dates, which may affect the comparability of data during times of market volatility.
The Board noted that Invesco Advisers and the Affiliated Sub-Advisers do not advise other mutual funds with investment strategies comparable to those of the Fund.
The Board considered the fees charged by Invesco Advisers and the Affiliated Sub-Advisers to other client accounts with investment strategies comparable to those of the Fund. The Board noted that Invesco Advisers or the Affiliated Sub-Advisers may charge lower fees to large institutional clients solely for investment management services. Invesco Advisers reviewed with the Board the significantly greater scope of services it provides to the Invesco Funds relative to other client accounts. These additional services include provision of administrative services, officers and office space, oversight of service providers, preparation of annual registration statement updates and financial information and regulatory compliance under the Investment Company Act of 1940, as amended. Invesco Advisers also reviewed generally the higher frequency of shareholder purchases and redemptions in the Invesco Funds relative to the flow of assets for other client accounts. Invesco Advisers advised the Board that advance notice of redemptions is often provided to Invesco Advisers by institutional clients. The Board did note that sub-advisory fees charged by the Affiliated Sub-Advisers to manage the Invesco Funds and to manage other client accounts were often more comparable. The Board concluded that the aggregate services provided to the Invesco Funds were sufficiently different from those provided to institutional clients, and the Board did not place significant weight on these fee comparisons.
The Board also noted that Invesco Advisers has contractually agreed to waive fees and/or limit expenses of the Fund through at least February 28, 2012 in an amount necessary to limit total annual operating expenses to a specified percentage of average daily net assets for each class of the Fund. The Board noted that at the current expense ratio for the Fund, this expense waiver does not have any impact.
The Board also considered the services provided by the Affiliated Sub-Advisers pursuant to the sub-advisory contracts, as well as the allocation of fees between Invesco Advisers and the Affiliated Sub-Advisers pursuant to the sub-advisory contracts. The Board noted that Invesco Advisers provides services to sub-advised Invesco Funds, including oversight of the Affiliated Sub-Advisers as well as the additional services described above other than day-to-day portfolio management. The Board also noted that the sub-advisory fees have no direct effect on the Fund or its shareholders, as they are paid by Invesco Advisers to the Affiliated Sub-Advisers.
Based upon the information and considerations described above, the Board concluded that the Fund’s advisory and sub-advisory fees are fair and reasonable.
| D. | Economies of Scale and Breakpoints |
The Board considered the extent to which there are economies of scale in the provision of advisory services to the Fund. The Board also considered whether the Fund benefits from economies of scale through contractual breakpoints in the Fund’s advisory fee schedule. The Board also noted that the Fund shares directly in economies of scale through lower fees charged by third party service providers based on the combined size of the Invesco Funds and other clients advised by Invesco Advisers.
| E. | Profitability and Financial Resources |
The Board reviewed information from Invesco Advisers concerning the costs of the advisory and other services that Invesco Advisers and its affiliates provide to the Fund and the profitability of Invesco Advisers and its affiliates in providing these services. The Board reviewed with Invesco Advisers the methodology used to prepare the profitability information. The Board considered the profitability of Invesco Advisers in connection with managing the Fund and the Invesco Funds. The Board noted that Invesco Advisers continues to operate at a net profit from services Invesco Advisers and its subsidiaries provide to the Fund and the Invesco Funds. The Board concluded that the level of profits realized by Invesco Advisers and its affiliates from providing services to the Fund is not excessive given the nature, quality and extent of the services provided to the Invesco Funds. The Board considered whether Invesco Advisers and each Affiliated Sub-Adviser are financially sound and have the resources necessary to perform their obligations under the investment advisory agreement and sub-advisory contracts. The Board concluded that Invesco Advisers and each Affiliated Sub-Adviser have the financial resources necessary to fulfill these obligations.
| F. | Collateral Benefits to Invesco Advisers and its Affiliates |
The Board considered various other benefits received by Invesco Advisers and its affiliates from the relationship with the Fund, including the fees received for their provision of administrative, transfer agency and distribution services to the Fund. The Board considered the performance of Invesco Advisers and its affiliates in providing these services and the organizational structure employed to provide these services. The Board also considered that these services are provided to the Fund pursuant to written contracts that are reviewed and approved on an annual basis by the Board; that the services are required for the operation of the Fund; that Invesco Advisers and its affiliates can provide services, the nature and quality of which are at least equal to those provided by others offering the same or similar services; and that the fees for such services are fair and reasonable in light of the usual and customary charges by others for services of the same nature and quality.
The Board considered the benefits realized by Invesco Advisers and the Affiliated Sub-Advisers as a result of portfolio brokerage transactions executed through “soft dollar” arrangements. The Board noted that soft dollar arrangements shift the payment obligation for research and execution services from Invesco Advisers and the Affiliated Sub-Advisers to the Invesco Funds and therefore may reduce Invesco Advisers’ and the Affiliated Sub-Advisers’ expenses. The Board concluded that the soft dollar arrangements are appropriate. The Board also concluded that, based on their review and representations made by the Chief Compliance Officer of the Invesco Funds, these arrangements are consistent with regulatory requirements.
The Board considered that the Fund’s uninvested cash and cash collateral from any securities lending arrangements may be invested in money market funds advised by Invesco Advisers pursuant to procedures approved by the Board. The Board noted that Invesco Advisers receives advisory fees from these affiliated money market funds attributable to such investments, although Invesco Advisers has contractually agreed to waive through varying periods the advisory fees payable by the Invesco Funds. The waiver is in an amount equal to 100% of the net advisory fee Invesco Advisers receives from the affiliated money market funds with respect to the Fund’s investment in the affiliated money market funds of uninvested cash, but not cash collateral. The Board concluded that the Fund’s investment of uninvested cash and cash collateral from any securities lending arrangements in the affiliated money market funds is in the best interests of the Fund and its shareholders.
25 Invesco International Core Equity Fund
Tax Information
Form 1099-DIV, Form 1042-S and other year-end tax information provide shareholders with actual calendar year amounts that should be included in their tax returns. Shareholders should consult their tax advisors.
The following distribution information is being provided as required by the Internal Revenue Code or to meet a specific state’s requirement.
The Fund designates the following amounts or, if subsequently determined to be different, the maximum amount allowable for its fiscal year ended October 31, 2011:
Federal and State Income Tax | ||||
| Qualified Dividend Income* | 100.00% | |||
| Corporate Dividends Received Deduction* | 0.00% | |||
| * | The above percentages are based on ordinary income dividends paid to shareholders during the Fund’s fiscal year. |
26 Invesco International Core Equity Fund
Trustees and Officers
The address of each trustee and officer is AIM International Mutual Funds (Invesco International Mutual Funds) (the “Trust”), 11 Greenway Plaza, Suite 2500, Houston, Texas 77046-1173. The trustees serve for the life of the Trust, subject to their earlier death, incapacitation, resignation, retirement or removal as more specifically provided in the Trust’s organizational documents. Each officer serves for a one year term or until their successors are elected and qualified. Column two below includes length of time served with predecessor entities, if any.
| Number of | ||||||||
| Funds in | ||||||||
| Fund Complex | ||||||||
| Name, Year of Birth and | Trustee and/ | Principal Occupation(s) | Overseen by | Other Directorship(s) | ||||
| Position(s) Held with the Trust | or Officer Since | During Past 5 Years | Trustee | Held by Trustee | ||||
| Interested Persons | ||||||||
Martin L. Flanagan1 — 1960 Trustee | 2007 | Executive Director, Chief Executive Officer and President, Invesco Ltd. (ultimate parent of Invesco and a global investment management firm); Advisor to the Board, Invesco Advisers, Inc. (formerly known as Invesco Institutional (N.A.), Inc.); Trustee, The Invesco Funds; Vice Chair, Investment Company Institute; and Member of Executive Board, SMU Cox School of Business | 141 | None | ||||
| Formerly: Chairman, Invesco Advisers, Inc. (registered investment adviser); Director, Chairman, Chief Executive Officer and President, IVZ Inc. (holding company), INVESCO Group Services, Inc. (service provider) and Invesco North American Holdings, Inc. (holding company); Director, Chief Executive Officer and President, Invesco Holding Company Limited (parent of Invesco and a global investment management firm); Director, Invesco Ltd.; Chairman, Investment Company Institute and President, Co-Chief Executive Officer, Co-President, Chief Operating Officer and Chief Financial Officer, Franklin Resources, Inc. (global investment management organization) | ||||||||
Philip A. Taylor2 — 1954 Trustee, President and Principal Executive Officer | 2006 | Head of North American Retail and Senior Managing Director, Invesco Ltd.; Director, Co-Chairman, Co-President and Co-Chief Executive Officer, Invesco Advisers, Inc. (formerly known as Invesco Institutional (N.A.), Inc.) (registered investment adviser); Director, Chairman, Chief Executive Officer and President, Invesco Management Group, Inc. (formerly Invesco Aim Management Group, Inc.) (financial services holding company); Director and President, INVESCO Funds Group, Inc. (registered investment adviser and registered transfer agent); Director and Chairman, Invesco Investment Services, Inc. (formerly known as Invesco Aim Investment Services, Inc.) (registered transfer agent) and IVZ Distributors, Inc. (formerly known as INVESCO Distributors, Inc.) (registered broker dealer); Director, President and Chairman, Invesco Inc. (holding company) and Invesco Canada Holdings Inc. (holding company); Chief Executive Officer, Invesco Corporate Class Inc. (corporate mutual fund company) and Invesco Canada Fund Inc. (corporate mutual fund company); Director, Chairman and Chief Executive Officer, Invesco Canada Ltd. (formerly known as Invesco Trimark Ltd./Invesco Trimark Ltèe) (registered investment adviser and registered transfer agent); Trustee, President and Principal Executive Officer, The Invesco Funds (other than AIM Treasurer’s Series Trust (Invesco Treasurer’s Series Trust) and Short-Term Investments Trust); Trustee and Executive Vice President, The Invesco Funds (AIM Treasurer’s Series Trust (Invesco Treasurer’s Series Trust) and Short-Term Investments Trust only); Director, Invesco Investment Advisers LLC (formerly known as Van Kampen Asset Management); Director, Chief Executive Officer and President, Van Kampen Exchange Corp. | 141 | None | ||||
| Formerly: Director and Chairman, Van Kampen Investor Services Inc.: | ||||||||
| Director, Chief Executive Officer and President, 1371 Preferred Inc. (holding company); and Van Kampen Investments Inc.; Director and President, AIM GP Canada Inc. (general partner for limited partnerships); and Van Kampen Advisors, Inc.; Director and Chief Executive Officer, Invesco Trimark Dealer Inc. (registered broker dealer); Director, Invesco Distributors, Inc. (formerly known as Invesco Aim Distributors, Inc.) (registered broker dealer); Manager, Invesco PowerShares Capital Management LLC; Director, Chief Executive Officer and President, Invesco Advisers, Inc.; Director, Chairman, Chief Executive Officer and President, Invesco Aim Capital Management, Inc.; President, Invesco Trimark Dealer Inc. and Invesco Trimark Ltd./Invesco Trimark Ltèe; Director and President, AIM Trimark Corporate Class Inc. and AIM Trimark Canada Fund Inc.; Senior Managing Director, Invesco Holding Company Limited; Trustee and Executive Vice President, Tax-Free Investments Trust; Director and Chairman, Fund Management Company (former registered broker dealer); President and Principal Executive Officer, The Invesco Funds (AIM Treasurer’s Series Trust (Invesco Treasurer’s Series Trust), Short-Term Investments Trust and Tax-Free Investments Trust only); President, AIM Trimark Global Fund Inc. and AIM Trimark Canada Fund Inc. | ||||||||
Wayne W. Whalen3 — 1939 Trustee | 2010 | Of Counsel, and prior to 2010, partner in the law firm of Skadden, Arps, Slate, Meagher & Flom LLP, legal counsel to funds in the Fund Complex | 159 | Director of the Abraham Lincoln Presidential Library Foundation | ||||
| Independent Trustees | ||||||||
| Bruce L. Crockett — 1944 Trustee and Chair | 1992 | Chairman, Crockett Technology Associates (technology consulting company) Formerly: Director, Captaris (unified messaging provider); Director, President and Chief Executive Officer COMSAT Corporation; and Chairman, Board of Governors of INTELSAT (international communications company) | 141 | ACE Limited (insurance company); and Investment Company Institute | ||||
| David C. Arch — 1945 Trustee | 2010 | Chairman and Chief Executive Officer of Blistex Inc., a consumer health care products manufacturer. | 159 | Member of the Heartland Alliance Advisory Board, a nonprofit organization serving human needs based in Chicago. Board member of the Illinois Manufacturers’ Association. Member of the Board of Visitors, Institute for the Humanities, University of Michigan | ||||
| 1 | Mr. Flanagan is considered an interested person of the Trust because he is an officer of the adviser to the Trust, and an officer and a director of Invesco Ltd., ultimate parent of the adviser to the Trust. |
| 2 | Mr. Taylor is considered an interested person of the Trust because he is an officer and a director of the adviser to, and a director of the principal underwriter of, the Trust. |
| 3 | Mr. Whalen has been deemed to be an interested person of the Trust because of his prior service as counsel to the predecessor funds of certain Invesco open-end funds and his affiliation with the law firm that served as counsel to such predecessor funds and continues to serve as counsel to the Invesco Van Kampen closed-end funds. |
T-1 Invesco International Core Equity Fund
Trustees and Officers—(continued)
The address of each trustee and officer is AIM International Mutual Funds (Invesco International Mutual Funds) (the “Trust”), 11 Greenway Plaza, Suite 2500, Houston, Texas 77046-1173. The trustees serve for the life of the Trust, subject to their earlier death, incapacitation, resignation, retirement or removal as more specifically provided in the Trust’s organizational documents. Each officer serves for a one year term or until their successors are elected and qualified. Column two below includes length of time served with predecessor entities, if any.
| Number of | ||||||||
| Funds in | ||||||||
| Fund Complex | ||||||||
| Name, Year of Birth and | Trustee and/ | Principal Occupation(s) | Overseen by | Other Directorship(s) | ||||
| Position(s) Held with the Trust | or Officer Since | During Past 5 Years | Trustee | Held by Trustee | ||||
| Independent Trustees—(continued) | ||||||||
| Bob R. Baker — 1936 Trustee | 2003 | Retired Formerly: President and Chief Executive Officer, AMC Cancer Research Center; and Chairman and Chief Executive Officer, First Columbia Financial Corporation | 141 | None | ||||
| Frank S. Bayley — 1939 Trustee | 2001 | Retired Formerly: Director, Badgley Funds, Inc. (registered investment company) (2 portfolios) and Partner, law firm of Baker & McKenzie | 141 | Director and Chairman, C.D. Stimson Company (a real estate investment company) | ||||
| James T. Bunch — 1942 Trustee | 2003 | Founder, Green, Manning & Bunch Ltd. (investment banking firm) Formerly: Executive Committee, United States Golf Association; and Director, Policy Studies, Inc. and Van Gilder Insurance Corporation | 141 | Vice Chairman, Board of Governors, Western Golf Association/Evans Scholars Foundation and Director, Denver Film Society | ||||
| Rodney F. Dammeyer — 1940 Trustee | 2010 | President of CAC, LLC, a private company offering capital investment and management advisory services. Formerly: Prior to January 2004, Director of TeleTech Holdings Inc.; Prior to 2002, Director of Arris Group, Inc.; Prior to 2001, Managing Partner at Equity Group Corporate Investments. Prior to 1995, Vice Chairman of Anixter International. Prior to 1985, experience includes Senior Vice President and Chief Financial Officer of Household International, Inc, Executive Vice President and Chief Financial Officer of Northwest Industries, Inc. and Partner of Arthur Andersen & Co. | 159 | Director of Quidel Corporation and Stericycle, Inc. Prior to May 2008, Trustee of The Scripps Research Institute. Prior to February 2008, Director of Ventana Medical Systems, Inc. Prior to April 2007, Director of GATX Corporation. Prior to April 2004, Director of TheraSense, Inc. | ||||
| Albert R. Dowden — 1941 Trustee | 2000 | Director of a number of public and private business corporations, including the Boss Group, Ltd. (private investment and management); Reich & Tang Funds (5 portfolios) (registered investment company); and Homeowners of America Holding Corporation/ Homeowners of America Insurance Company (property casualty company) Formerly: Director, Continental Energy Services, LLC (oil and gas pipeline service); Director, CompuDyne Corporation (provider of product and services to the public security market) and Director, Annuity and Life Re (Holdings), Ltd. (reinsurance company); Director, President and Chief Executive Officer, Volvo Group North America, Inc.; Senior Vice President, AB Volvo; Director of various public and private corporations; Chairman, DHJ Media, Inc.; Director Magellan Insurance Company; and Director, The Hertz Corporation, Genmar Corporation (boat manufacturer), National Media Corporation; Advisory Board of Rotary Power International (designer, manufacturer, and seller of rotary power engines); and Chairman, Cortland Trust, Inc. (registered investment company) | 141 | Board of Nature’s Sunshine Products, Inc. | ||||
| Jack M. Fields — 1952 Trustee | 1997 | Chief Executive Officer, Twenty First Century Group, Inc. (government affairs company); and Owner and Chief Executive Officer, Dos Angelos Ranch, L.P. (cattle, hunting, corporate entertainment), Discovery Global Education Fund (non-profit) and Cross Timbers Quail Research Ranch (non-profit) Formerly: Chief Executive Officer, Texana Timber LP (sustainable forestry company) and member of the U.S. House of Representatives | 141 | Administaff | ||||
| Carl Frischling — 1937 Trustee | 1991 | Partner, law firm of Kramer Levin Naftalis and Frankel LLP | 141 | Director, Reich & Tang Funds (6 portfolios) | ||||
| Prema Mathai-Davis — 1950 Trustee | 1998 | Retired Formerly: Chief Executive Officer, YWCA of the U.S.A. | 141 | None | ||||
| Larry Soll — 1942 Trustee | 2003 | Retired Formerly, Chairman, Chief Executive Officer and President, Synergen Corp. (a biotechnology company) | 141 | None | ||||
| Hugo F. Sonnenschein — 1940 Trustee | 2010 | President Emeritus and Honorary Trustee of the University of Chicago and the Adam Smith Distinguished Service Professor in the Department of Economics at the University of Chicago. Prior to July 2000, President of the University of Chicago. | 159 | Trustee of the University of Rochester and a member of its investment committee. Member of the National Academy of Sciences, the American Philosophical Society and a fellow of the American Academy of Arts and Sciences | ||||
| Raymond Stickel, Jr. — 1944 Trustee | 2005 | Retired | 141 | Director of Long Cove Club Owners’ association (home owner’s association) | ||||
| Formerly: Director, Mainstay VP Series Funds, Inc. (25 portfolios) and Partner, Deloitte & Touche | ||||||||
T-2 Invesco International Core Equity Fund
Trustees and Officers—(continued)
The address of each trustee and officer is AIM International Mutual Funds (Invesco International Mutual Funds) (the “Trust”), 11 Greenway Plaza, Suite 2500, Houston, Texas 77046-1173. The trustees serve for the life of the Trust, subject to their earlier death, incapacitation, resignation, retirement or removal as more specifically provided in the Trust’s organizational documents. Each officer serves for a one year term or until their successors are elected and qualified. Column two below includes length of time served with predecessor entities, if any.
| Number of | ||||||||
| Funds in | ||||||||
| Fund Complex | ||||||||
| Name, Year of Birth and | Trustee and/ | Principal Occupation(s) | Overseen by | Other Directorship(s) | ||||
| Position(s) Held with the Trust | or Officer Since | During Past 5 Years | Trustee | Held by Trustee | ||||
| Other Officers | ||||||||
| Russell C. Burk — 1958 Senior Vice President and Senior Officer | 2005 | Senior Vice President and Senior Officer of Invesco Funds | N/A | N/A | ||||
| John M. Zerr — 1962 Senior Vice President, Chief Legal Officer and Secretary | 2006 | Director, Senior Vice President, Secretary and General Counsel, Invesco Management Group, Inc. (formerly known as Invesco Aim Management Group, Inc.) and Van Kampen Exchange Corp.; Senior Vice President, Invesco Advisers, Inc. (formerly known as Invesco Institutional (N.A.), Inc.) (registered investment adviser); Senior Vice President and Secretary, Invesco Distributors, Inc. (formerly known as Invesco Aim Distributors, Inc.); Director, Vice President and Secretary, Invesco Investment Services, Inc. (formerly known as Invesco Aim Investment Services, Inc.) and IVZ Distributors, Inc. (formerly known as INVESCO Distributors, Inc.); Director and Vice President, INVESCO Funds Group, Inc.; Senior Vice President, Chief Legal Officer and Secretary, The Invesco Funds; Manager, Invesco PowerShares Capital Management LLC; Director, Secretary and General Counsel, Invesco Investment Advisers LLC (formerly known as Van Kampen Asset Management); Secretary and General Counsel, Van Kampen Funds Inc. and Chief Legal Officer, PowerShares Exchange-Traded Fund Trust, PowerShares Exchange-Traded Fund Trust II, PowerShares India Exchange-Traded Fund Trust and PowerShares Actively Managed Exchange-Traded Fund Trust Formerly: Director and Secretary, Van Kampen Advisors Inc.; Director Vice President, Secretary and General Counsel Van Kampen Investor Services Inc.; Director, Invesco Distributors, Inc. (formerly known as Invesco Aim Distributors, Inc.); Director, Senior Vice President, General Counsel and Secretary, Invesco Advisers, Inc.; and Van Kampen Investments Inc.; Director, Vice President and Secretary, Fund Management Company; Director, Senior Vice President, Secretary, General Counsel and Vice President, Invesco Aim Capital Management, Inc.; Chief Operating Officer and General Counsel, Liberty Ridge Capital, Inc. (an investment adviser); Vice President and Secretary, PBHG Funds (an investment company) and PBHG Insurance Series Fund (an investment company); Chief Operating Officer, General Counsel and Secretary, Old Mutual Investment Partners (a broker-dealer); General Counsel and Secretary, Old Mutual Fund Services (an administrator) and Old Mutual Shareholder Services (a shareholder servicing center); Executive Vice President, General Counsel and Secretary, Old Mutual Capital, Inc. (an investment adviser); and Vice President and Secretary, Old Mutual Advisors Funds (an investment company) | N/A | N/A | ||||
| Lisa O. Brinkley — 1959 Vice President | 2004 | Global Compliance Director, Invesco Ltd.; Chief Compliance Officer, Invesco Investment Services, Inc.(formerly known as Invesco Aim Investment Services, Inc.); and Vice President, The Invesco Funds Formerly: Chief Compliance Officer, Invesco Distributors, Inc. (formerly known as Invesco Aim Distributors, Inc.) and Van Kampen Investor Services Inc.; Senior Vice President, Invesco Management Group, Inc.; Senior Vice President and Chief Compliance Officer, Invesco Advisers, Inc. and The Invesco Funds; Vice President and Chief Compliance Officer, Invesco Aim Capital Management, Inc. and Invesco Distributors, Inc.; Vice President, Invesco Investment Services, Inc. and Fund Management Company | N/A | N/A | ||||
| Sheri Morris — 1964 Vice President, Treasurer and Principal Financial Officer | 1999 | Vice President, Treasurer and Principal Financial Officer, The Invesco Funds; and Vice President, Invesco Advisers, Inc. (formerly known as Invesco Institutional (N.A.), Inc.) (registered investment adviser). | N/A | N/A | ||||
| Formerly: Treasurer, PowerShares Exchange-Traded Fund Trust, PowerShares Exchange-Traded Fund Trust II, PowerShares India Exchange-Traded Fund Trust and PowerShares Actively Managed Exchange-Traded Fund Trust; Vice President, Invesco Advisers, Inc., Invesco Aim Capital Management, Inc. and Invesco Aim Private Asset Management, Inc.; Assistant Vice President and Assistant Treasurer, The Invesco Funds and Assistant Vice President, Invesco Advisers, Inc., Invesco Aim Capital Management, Inc. and Invesco Aim Private Asset Management, Inc. | ||||||||
T-3 Invesco International Core Equity Fund
Trustees and Officers—(continued)
The address of each trustee and officer is AIM International Mutual Funds (Invesco International Mutual Funds) (the “Trust”), 11 Greenway Plaza, Suite 2500, Houston, Texas 77046-1173. The trustees serve for the life of the Trust, subject to their earlier death, incapacitation, resignation, retirement or removal as more specifically provided in the Trust’s organizational documents. Each officer serves for a one year term or until their successors are elected and qualified. Column two below includes length of time served with predecessor entities, if any.
| Number of | ||||||||
| Funds in | ||||||||
| Fund Complex | ||||||||
| Name, Year of Birth and | Trustee and/ | Principal Occupation(s) | Overseen by | Other Directorship(s) | ||||
| Position(s) Held with the Trust | or Officer Since | During Past 5 Years | Trustee | Held by Trustee | ||||
| Other Officers—(continued) | ||||||||
| Karen Dunn Kelley — 1960 Vice President | 2004 | Head of Invesco’s World Wide Fixed Income and Cash Management Group; Senior Vice President, Invesco Advisers, Inc. (formerly known as Invesco Institutional (N.A.), Inc.) (registered investment adviser); Executive Vice President, Invesco Distributors, Inc. (formerly known as Invesco Aim Distributors, Inc.); Senior Vice President, Invesco Management Group, Inc. (formerly known as Invesco Aim Management Group, Inc.); and Director, Invesco Mortgage Capital Inc.; Vice President, The Invesco Funds (other than AIM Treasurer’s Series Trust (Invesco Treasurer’s Series Trust) and Short-Term Investments Trust); President and Principal Executive Officer, The Invesco Funds (AIM Treasurer’s Series Trust (Invesco Treasurer’s Series Trust) and Short-Term Investments Trust only). Formerly: Senior Vice President, Van Kampen Investments Inc.; Vice President, Invesco Advisers, Inc. (formerly known as Invesco Institutional (N.A.), Inc.); Director of Cash Management and Senior Vice President, Invesco Advisers, Inc. and Invesco Aim Capital Management, Inc.; President and Principal Executive Officer, Tax-Free Investments Trust; Director and President, Fund Management Company; Chief Cash Management Officer, Director of Cash Management, Senior Vice President, and Managing Director, Invesco Aim Capital Management, Inc.; Director of Cash Management, Senior Vice President, and Vice President, Invesco Advisers, Inc. and The Invesco Funds (AIM Treasurer’s Series Trust (Invesco Treasurer’s Series Trust), Short-Term Investments Trust and Tax-Free Investments Trust only) | N/A | N/A | ||||
| Lance A. Rejsek — 1967 Anti-Money Laundering Compliance Officer | 2005 | Anti-Money Laundering Compliance Officer, Invesco Advisers, Inc. (formerly known as Invesco Institutional (N.A.), Inc.) (registered investment adviser); Invesco Distributors, Inc. (formerly known as Invesco Aim Distributors, Inc.), Invesco Investment Services, Inc. (formerly known as Invesco Aim Investment Services, Inc.), The Invesco Funds, PowerShares Exchange-Traded Fund Trust, PowerShares Exchange-Traded Fund Trust II, PowerShares India Exchange-Traded Fund Trust, PowerShares Actively Managed Exchange-Traded Fund Trust, Invesco Investment Advisers LLC (formerly known as Van Kampen Asset Management) and Van Kampen Funds Inc. Formerly: Anti-Money Laundering Compliance Officer, Van Kampen Investor Services Inc., Fund Management Company, Invesco Advisers, Inc., Invesco Aim Capital Management, Inc. and Invesco Aim Private Asset Management, Inc. | N/A | N/A | ||||
| Todd L. Spillane — 1958 Chief Compliance Officer | 2006 | Senior Vice President, Invesco Management Group, Inc. (formerly known as Invesco Aim Management Group, Inc.) and Van Kampen Exchange Corp.; Senior Vice President and Chief Compliance Officer, Invesco Advisers, Inc. (registered investment adviser) (formerly known as Invesco Institutional (N.A.), Inc.); Chief Compliance Officer, The Invesco Funds, PowerShares Exchange-Traded Fund Trust, PowerShares Exchange-Traded Fund Trust II, PowerShares India Exchange-Traded Fund Trust, PowerShares Actively Managed Exchange-Traded Fund Trust, INVESCO Private Capital Investments, Inc. (holding company) and Invesco Private Capital, Inc. (registered investment adviser); Vice President, Invesco Distributors, Inc. (formerly known as Invesco Aim Distributors, Inc.) and Invesco Investment Services, Inc. (formerly known as Invesco Aim Investment Services, Inc.). | N/A | N/A | ||||
| Formerly: Chief Compliance Officer, Invesco Van Kampen Closed-End Funds; Senior Vice President, Van Kampen Investments Inc.; Senior Vice President and Chief Compliance Officer, Invesco Advisers, Inc. and Invesco Aim Capital Management, Inc.; Chief Compliance Officer, Invesco Global Asset Management (N.A.), Inc., Invesco Senior Secured Management, Inc. (registered investment adviser) and Van Kampen Investor Services Inc.; Vice President, Invesco Aim Capital Management, Inc. and Fund Management Company | ||||||||
The Statement of Additional Information of the Trust includes additional information about the Fund’s Trustees and is available upon request, without charge, by calling 1.800.959.4246. Please refer to the Fund’s prospectus for information on the Fund’s sub-advisers.
| Office of the Fund 11 Greenway Plaza, Suite 2500 Houston, TX 77046-1173 | Investment Adviser Invesco Advisers, Inc. 1555 Peachtree Street, N.E. Atlanta, GA 30309 | Distributor Invesco Distributors, Inc. 11 Greenway Plaza, Suite 2500 Houston, TX 77046-1173 | Auditors PricewaterhouseCoopers LLP 1201 Louisiana Street, Suite 2900 Houston, TX 77002-5678 | |||
| Counsel to the Fund Stradley Ronon Stevens & Young, LLP 2600 One Commerce Square Philadelphia, PA 19103 | Counsel to the Independent Trustees Kramer, Levin, Naftalis & Frankel LLP 1177 Avenue of the Americas New York, NY 10036-2714 | Transfer Agent Invesco Investment Services, Inc. 11 Greenway Plaza, Suite 2500 Houston, TX 77046-1173 | Custodian State Street Bank and Trust Company 225 Franklin Boston, MA 02110-2801 |
T-4 Invesco International Core Equity Fund

Invesco mailing information
Send general correspondence to Invesco Investment Services, Inc., P.O. Box 219078, Kansas City, MO 64121-9078.
Invesco privacy policy
You share personal and financial information with us that is necessary for your transactions and your account records. We take very seriously the obligation to keep that information confidential and private.
Invesco collects nonpublic personal information about you from account applications or other forms you complete and from your transactions with us or our affiliates. We do not disclose information about you or our former customers to service providers or other third parties except to the extent necessary to service your account and in other limited circumstances as permitted by law. For example, we use this information to facilitate the delivery of transaction confirmations, financial reports, prospectuses and tax forms.
Even within Invesco, only people involved in the servicing of your accounts and compliance monitoring have access to your information. To ensure the highest level of confidentiality and security, Invesco maintains physical, electronic and procedural safeguards that meet or exceed federal standards. Special measures, such as data encryption and authentication, apply to your communications with us on our website. More detail is available to you at invesco.com/privacy.
Important notice regarding delivery of security holder documents
To reduce Fund expenses, only one copy of most shareholder documents may be mailed to shareholders with multiple accounts at the same address (Householding). Mailing of your shareholder documents may be householded indefinitely unless you instruct us otherwise. If you do not want the mailing of these documents to be combined with those for other members of your household, please contact Invesco Investment Services, Inc. at 800 959 4246 or contact your financial institution. We will begin sending you individual copies for each account within 30 days after receiving your request.
Fund holdings and proxy voting information
The Fund provides a complete list of its holdings four times in each fiscal year, at the quarter-ends. For the second and fourth quarters, the lists appear in the Fund’s semiannual and annual reports to shareholders. For the first and third quarters, the Fund files the lists with the Securities and Exchange Commission (SEC) on Form N-Q. The most recent list of portfolio holdings is available at invesco.com/completeqtrholdings. Shareholders can also look up the Fund’s Forms N-Q on the SEC website at sec.gov. Copies of the Fund’s Forms N-Q may be reviewed and copied at the SEC Public Reference Room in Washington, D.C. You can obtain information on the operation of the Public Reference Room, including information about duplicating fee charges, by calling 202 551 8090 or 800 732 0330, or by electronic request at the following email address: publicinfo@sec.gov. The SEC file numbers for the Fund are 811-06463 and 033-44611.
A description of the policies and procedures that the Fund uses to determine how to vote proxies relating to portfolio securities is available without charge, upon request, from our Client Services department at 800 959 4246 or at invesco.com/proxyguidelines. The information is also available on the SEC website, sec.gov.
Information regarding how the Fund voted proxies related to its portfolio securities during the 12 months ended June 30, 2011, is available at invesco.com/proxysearch. The information is also available on the SEC website, sec.gov.
Invesco Advisers, Inc. is an investment adviser; it provides investment advisory services to individual and institutional clients and does not sell securities. Invesco Distributors, Inc. is the U.S. distributor for Invesco Ltd.’s retail mutual funds, exchange-traded funds and institutional money market funds. Both are wholly owned, indirect subsidiaries of Invesco Ltd.
| I-ICE-AR-1 | Invesco Distributors, Inc. |
 |
| Annual Report to Shareholders | October 31, 2011 |
Invesco International Growth Fund
Nasdaq:
A: AIIEX § B: AIEBX § C: AIECX § R: AIERX § Y: AIIYX § Institutional: AIEVX
A: AIIEX § B: AIEBX § C: AIECX § R: AIERX § Y: AIIYX § Institutional: AIEVX
| 2 | Letters to Shareholders | |
| 4 | Performance Summary | |
| 4 | Management Discussion | |
| 6 | Long-Term Fund Performance | |
| 8 | Supplemental Information | |
| 9 | Schedule of Investments | |
| 11 | Financial Statements | |
| 13 | Notes to Financial Statements | |
| 21 | Financial Highlights | |
| 22 | Auditor’s Report | |
| 23 | Fund Expenses | |
| 24 | Approval of Investment Advisory and Sub-Advisory Agreements | |
| 26 | Tax Information | |
| T-1 | Trustees and Officers |
Letters to Shareholders

Philip Taylor
Dear Shareholders:
Enclosed is important information about your Fund and its performance. I encourage you to read this report to learn more about your Fund’s short- and long-term performance and its holdings as of the close of the reporting period. This report also includes useful information about your Fund’s management team and a discussion of how your Fund was managed during the reporting period.
Investors are likely to confront both opportunities and challenges in 2012 – just as we did in 2011. After all, changes in market sentiment never do investors the courtesy of announcing their impending arrival, and your goals and needs may have changed, requiring changes in your financial strategy.
That’s why the start of a new year is always a good time to catch up with your financial adviser. He or she can explain how your investments performed in the year just ended – how each performed individually, and more important, how they performed as a diversified portfolio. Of course, it’s important to remember that an investment’s long-term performance is more important than its short-term performance. Looking ahead to the new year and evaluating your individual situation, your financial adviser can provide valuable insight into whether your investments are still appropriate for your individual needs, goals and risk tolerance.
For current information about your Fund
In addition to meeting with your financial adviser to discuss your individual situation at the start of the new year, you also may find it helpful to stay abreast of market trends and developments. Doing so may provide reassurance in times of economic uncertainty and market volatility such as we saw in 2011 – and are likely to see again in 2012.
Invesco can help you stay informed about your investments and market trends. On our website, invesco.com/us, we provide timely market updates and commentary from many of our fund managers and other investment professionals. Also on our website, you can obtain information about your account at any hour of the day or night. I invite you to visit and explore the tools and information we offer at invesco.com/us.
Our commitment to investment excellence
As we’ve seen over the last several years, market conditions can change – often suddenly and dramatically. That’s one reason financial advisers typically advise their clients to be well diversified and to maintain a long-term investment focus. While diversification can’t guarantee a profit or protect against loss, it may cushion the impact of dramatic market moves. Maintaining a long-term investment focus for your long-term goals – financing your retirement or your children’s education, for example – may help you avoid making rash investment decisions based on short-term market swings.
Likewise, Invesco’s investment professionals maintain a long-term focus. Across our broad array of investment products, investment excellence is our ultimate goal. Each of our funds is managed by specialized teams of investment professionals, and as a company, we maintain a single focus – investment management – that allows our fund managers to concentrate on doing what they do best: managing your money.
Our funds are managed strictly according to their stated investment objectives and strategies, with robust risk oversight using consistent, repeatable investment processes that don’t change in response to short-term market events. This disciplined approach can’t guarantee a profit; no investment can do that, since all involve some measure of risk. But it can ensure that your money is managed the way we said it would be – according to your Fund’s objective and strategies.
Our adherence to stated investment objectives and strategies allows your financial adviser to build a diversified portfolio that meets your individual risk tolerance and financial goals. It also means that when your goals change, your financial adviser will be able to find an Invesco fund that’s appropriate for your needs.
Questions?
If you have questions about your account, please contact one of our client service representatives at 800 959 4246. If you have a general Invesco-related question or comment for me, I invite you to email me directly at phil@invesco.com.
All of us at Invesco look forward to serving your investment management needs for many years to come. Thank you for investing with us.
Sincerely,

Philip Taylor
Senior Managing Director, Invesco Ltd.
Senior Managing Director, Invesco Ltd.
2 Invesco International Growth Fund

Bruce Crockett
Dear Fellow Shareholders:
Although the world’s economies are gradually recovering from the financial crisis, it has not been a smooth path. Unrest in the Middle East, persistently weak job and housing markets in the U.S. and continued government balance sheet repair in Europe are contributing to a slow, labored march toward global recovery.
In this environment, investors face risks that could make it more difficult to achieve their long-term financial goals – a secure retirement, home ownership, a child’s college education. Although the markets are complex and dynamic, there are ways to simplify the process and potentially increase your odds of achieving your goals. The best approach is to create a solid financial plan that helps you save and invest in ways that anticipate your needs over the long term.
Your financial adviser can help you define your financial plan, develop an appropriate investment strategy and put you in a better position to achieve your financial goals over the long term. This can take some of the guesswork out of the process and help you make thoughtful investments. Your financial adviser also can help you better understand your tolerance for risk, so that your investment approach lets you sleep at night while getting you closer to your goals. Lastly, your financial adviser can develop an asset allocation strategy that seeks to balance your investment approach, providing some protection against a decline in the markets while allowing you to participate in rising markets. Invesco calls this type of approach “intentional investing.” It means thinking carefully, planning thoughtfully and acting deliberately.
While no investment can guarantee favorable returns, your Board remains committed to managing costs and enhancing the performance of Invesco’s funds as part of our Investor First orientation. We continue to oversee the funds with the same strong sense of responsibility for your money and your continued trust that we’ve always maintained.
Thanks to the approval of our fund shareholders, Invesco has made great progress in realigning our U.S. mutual fund product line following our acquisition of Morgan Stanley’s retail asset management business, including Van Kampen Investments. When completed, the realignment will reduce overlap in the product lineup, enhance efficiency across our product line and build a solid foundation for further growth to meet client and shareholder needs. I would like to thank those of you who voted your proxy, and I hope our shareholders haven’t been too inconvenienced by the process.
As always, please contact me at bruce@brucecrockett.com with any questions or concerns you may have. On behalf of your Board, we look forward to continuing to represent your interests and serving your needs.
Sincerely,

Bruce L. Crockett
Independent Chair
Invesco Funds Board of Trustees
Independent Chair
Invesco Funds Board of Trustees
3 Invesco International Growth Fund
Management’s Discussion of Fund Performance
Performance summary
Global equity markets faced headwinds in 2010 and 2011. China’s growth continued to slow as the U.S. battled high unemployment and runaway deficits. Several European countries faced similar deficits, which brought to light the imperfect structure of the euro. The reporting period ended with a market upswing, however, as European leaders took steps to address the Greek sovereign debt issue, expand the bailout fund and stabilize the banking system.
Invesco International Growth Fund was down modestly for the fiscal year ended October 31, 2011. Relative results were favorable, however, with all share classes of the Fund at net asset value (NAV) outperforming the Fund’s style-specific benchmark, the MSCI EAFE Growth Index.
Your Fund’s long-term performance appears later in this report.
Fund vs. Indexes
Total returns, 10/31/10 to 10/31/11, at net asset value (NAV). Performance shown does not include applicable contingent deferred sales charges (CDSC) or front-end sales charges, which would have reduced performance.
| Class A Shares | -1.10 | % | ||
| Class B Shares | -1.81 | |||
| Class C Shares | -1.85 | |||
| Class R Shares | -1.34 | |||
| Class Y Shares | -0.83 | |||
| Institutional Class Shares | -0.68 | |||
MSCI EAFE Index ▼ (Broad Market Index) | -4.08 | |||
MSCI EAFE Growth Index ▼ (Style-Specific Index) | -2.78 | |||
Lipper International Multi-Cap Growth Funds Index ▼ (Peer Group Index) | -6.30 | |||
| Source(s): ▼Lipper Inc. | ||
How we invest
When selecting stocks for your Fund, we use a disciplined investment strategy that emphasizes fundamental research, supported by both quantitative analysis and portfolio construction techniques. Our EQV (earnings, quality, valuation) strategy focuses primarily on identifying quality companies that have experienced, or exhibit the potential for, accelerated or above-average earnings growth, but whose stock prices have not fully reflected these attributes.
While research responsibilities within the portfolio management team are focused by geographic region, we select
investments for the Fund using a bottom-up investment approach, which means we construct the Fund primarily on a stock-by-stock basis. We focus on the strengths of individual companies rather than sectors, countries or market-cap trends.
We believe disciplined sell decisions are key to successful investing. We consider selling a stock for one of the following reasons:
| n | A company’s fundamentals deteriorate, or it posts disappointing earnings. | |
| n | A stock’s price seems overvalued. | |
| n | A more attractive opportunity becomes available. |
Market conditions and your Fund
Market volatility was intense during the reporting period. During mid-2011, Greek sovereign debt concerns and signs of slowing global growth continued to worry investors. In addition, numerous world events caught investors’ attention, including the growing unrest in the Middle East and northern Africa, and the devastating earthquake and tsunami in Japan on March 11. Renewed credit problems overseas and the market correction that occurred in May, June, July and August created a more uncertain environment, which prompted many investors to favor safety over risk.
In this environment, we continued to manage the Fund’s portfolio with a long-term view and a bottom-up approach (i.e., selecting stocks on an individual basis). From a sector perspective, the Fund fared better than its style-specific benchmark, the MSCI EAFE Growth Index, in six of 10 sectors, significantly outperforming in the consumer discretionary, financials and energy sectors. In each instance, strong stock selection played a key role in driving results.
In the consumer discretionary sector, Fund holdings delivered positive returns versus the index, which experienced negative performance in this sector for the reporting period. Holdings in the automobiles industry were particularly strong. Top stock-level contributors in this sector included South Korean aftermarket auto parts manufacturer Hyundai Mobis and German auto manufacturer BMW.
In financials, the reporting period’s weakest sector, stock selection combined with underweight exposure drove relative results. As noted previously, European sovereign debt was the focal point of investor concern through most of the
Portfolio Composition
By sector
By sector
| Consumer Discretionary | 19.1 | % | ||
| Consumer Staples | 13.5 | |||
| Health Care | 10.5 | |||
| Energy | 10.2 | |||
| Information Technology | 10.1 | |||
| Financials | 9.9 | |||
| Industrials | 9.2 | |||
| Telecommunication Services | 3.8 | |||
| Materials | 3.6 | |||
| Utilities | 1.6 | |||
Money Market Funds | ||||
Plus Other Assets Less Liabilities | 8.5 | |||
Top 10 Equity Holdings*
| 1. | Compass Group PLC | 2.1 | % | |||||
| 2. | Imperial Tobacco Group PLC | 2.0 | ||||||
| 3. | Banco Bradesco S.A.-ADR | 1.8 | ||||||
| 4. | Yamada Denki Co., Ltd. | 1.8 | ||||||
| 5. | Canon, Inc. | 1.8 | ||||||
| 6. | Novartis AG | 1.8 | ||||||
| 7. | Teva Pharmaceutical | |||||||
| Industries Ltd.-ADR | 1.7 | |||||||
| 8. | Anheuser-Busch InBev N.V. | 1.7 | ||||||
| 9. | Suncor Energy, Inc. | 1.6 | ||||||
| 10. | Nestlé S.A. | 1.6 | ||||||
Top Five Countries*
| 1. | United Kingdom | 20.1 | % | |||||
| 2. | Japan | 9.6 | ||||||
| 3. | Switzerland | 7.5 | ||||||
| 4. | France | 7.0 | ||||||
| 5. | Germany | 6.7 | ||||||
| Total Net Assets | $4.6 billion | |||
| Total Number of Holdings* | 84 | |||
The Fund’s holdings are subject to change, and there is no assurance that the Fund will continue to hold any particular security.
*Excluding money market fund holdings.
4 Invesco International Growth Fund
period, and we believe it will remain a key issue for markets entering 2012. Notably, the Fund ended the reporting period with no direct exposure to the PIIGS (Portugal, Ireland, Italy, Greece, Spain) countries in Europe. (The Fund did hold two U.K. companies incorporated in Ireland for tax purposes.)
In contrast, Fund holdings in the telecommunication services sector (predominantly in the wireless industry) detracted from both relative and absolute results. Mexican telecommunications company America Movil was one such detractor. Concerns about increased competition and rising regulatory risk in Mexico weighed on the stock price. We reduced the Fund’s position in America Movil over the reporting period.
In contrast, Fund holdings in the telecommunication services sector (predominantly in the wireless industry) detracted from both relative and absolute results. Mexican telecommunications company America Movil was one such detractor. Concerns about increased competition and rising regulatory risk in Mexico weighed on the stock price. We reduced the Fund’s position in America Movil over the reporting period.
An underweight exposure to consumer staples, the reporting period’s strongest performing sector, also detracted from relative results. However, solid stock selection enabled the Fund to outperform the index sector despite the underweight position.
In broad geographic terms, the Fund outperformed the MSCI EAFE Growth Index across both Europe and Asia. Outperformance in Europe was led by strong results in the United Kingdom, which at about 20% was the Fund’s largest single country exposure. U.K.-based Imperial Tobacco Group was among the top individual contributors to Fund performance over the reporting period.
In Asia, favorable performance from Fund holdings in South Korea, Singapore and Japan supported Fund results. In Japan, the effects of the March earthquake and tsunami have largely passed, and production levels returned to normal. However, Japan faced the effects of a new natural disaster with flooding in Thailand because Japanese manufacturers use Thailand as a production hub. The yen’s continued strength and weak export numbers to the U.S. and Europe produced a steady stream of earnings growth downgrade revisions as well. As a result, the Fund’s meaningful underweight position in Japan contributed positively to relative performance.
In contrast, the Fund’s exposure to emerging markets detracted from both absolute and relative results as the MSCI EAFE Growth Index did not have exposure to this segment of the market. During the reporting period, emerging markets underperformed developed markets due to multiple macroeconomic headwinds, including the European debt crisis, a deteriorating global economy, rising inflation and tightening monetary policies.
As long-term, bottom-up stock selectors, we see volatility as an opportunity to buy quality growth companies at more attractive valuations than usual; consequently, we took advantage of market volatility to buy several stocks that had long been on our EQV radar.
Stock selection in the portfolio continued to be driven by the underlying fundamentals of a company – not any top-down macroeconomic views. That said, because of our belief in the long-term strength of consumer growth outside the U.S., we maintained overweight exposure to the consumer discretionary sector at the end of the reporting period. We reduced our exposure to the health care sector slightly but remained overweight compared with the index. The Fund also ended the period with overweight exposure to the energy and information technology sectors, while our largest underweight positions were in the materials, industrials and consumer staples sectors.
At the close of the reporting period, we remained focused on investing according to our bottom-up stock selection process and maintaining our long-term investment view. We thank you for your continued investment in Invesco International Growth Fund.
The views and opinions expressed in management’s discussion of Fund performance are those of Invesco Advisers, Inc. These views and opinions are subject to change at any time based on factors such as market and economic conditions. These views and opinions may not be relied upon as investment advice or recommendations, or as an offer for a particular security. The information is not a complete analysis of every aspect of any market, country, industry, security or the Fund. Statements of fact are from sources considered reliable, but Invesco Advisers, Inc. makes no representation or warranty as to their completeness or accuracy. Although historical performance is no guarantee of future results, these insights may help you understand our investment management philosophy.
See important Fund and, if applicable, index disclosures later in this report.

Clas Olsson
Portfolio manager and CIO of Invesco’s International Growth Investment Management Unit, is lead manager of Invesco International Growth Fund. He joined Invesco in 1994. Mr. Olsson became a commissioned officer at the Royal Swedish Naval Academy in 1988. He earned a B.B.A. from The University of Texas at Austin.
Portfolio manager and CIO of Invesco’s International Growth Investment Management Unit, is lead manager of Invesco International Growth Fund. He joined Invesco in 1994. Mr. Olsson became a commissioned officer at the Royal Swedish Naval Academy in 1988. He earned a B.B.A. from The University of Texas at Austin.

Shuxin Cao
Chartered Financial Analyst, portfolio manager, is manager of Invesco International Growth Fund. He joined Invesco in 1997. Mr. Cao earned a B.A. in English from the Tianjin Foreign Language Institute and an M.B.A. from Texas A&M University. He is also a Certified Public Accountant.
Chartered Financial Analyst, portfolio manager, is manager of Invesco International Growth Fund. He joined Invesco in 1997. Mr. Cao earned a B.A. in English from the Tianjin Foreign Language Institute and an M.B.A. from Texas A&M University. He is also a Certified Public Accountant.

Matthew Dennis
Chartered Financial Analyst, portfolio manager, is manager of Invesco International Growth Fund. He joined Invesco in 2000. Mr. Dennis earned a B.A. in economics from The University of Texas at Austin and an M.S. in finance from Texas A&M University.
Chartered Financial Analyst, portfolio manager, is manager of Invesco International Growth Fund. He joined Invesco in 2000. Mr. Dennis earned a B.A. in economics from The University of Texas at Austin and an M.S. in finance from Texas A&M University.

Jason Holzer
Chartered Financial Analyst, portfolio manager, is manager of Invesco International Growth Fund. He joined Invesco in 1996. Mr. Holzer earned a B.A. in quantitative economics and an M.S. in engineering economic systems from Stanford University.
Chartered Financial Analyst, portfolio manager, is manager of Invesco International Growth Fund. He joined Invesco in 1996. Mr. Holzer earned a B.A. in quantitative economics and an M.S. in engineering economic systems from Stanford University.

Mark Jason
Chartered Financial Analyst, portfolio manager, is manager of Invesco International Growth Fund. He joined Invesco in 2001. Mr. Jason earned a B.S. in finance and a B.S. in real estate from California State University at Northridge.
Chartered Financial Analyst, portfolio manager, is manager of Invesco International Growth Fund. He joined Invesco in 2001. Mr. Jason earned a B.S. in finance and a B.S. in real estate from California State University at Northridge.
5 Invesco International Growth Fund
Your Fund’s Long-Term Performance
Results of a $10,000 Investment – Oldest Share Class since Inception
Index data from 3/31/92, Fund data from 4/7/92
Past performance cannot guarantee comparable future results.
The data shown in the chart include reinvested distributions, applicable sales charges and Fund expenses including management fees. Index results include reinvested dividends, but they do not reflect sales charges. Performance of the peer group, if applicable, reflects fund expenses and management fees; performance of a market index does not.
Performance shown in the chart and table(s) does not reflect deduction of taxes a shareholder would pay on Fund distributions or sale of Fund shares.
This chart, which is a logarithmic chart, presents the fluctuations in the value of the Fund and its indexes. We believe that a logarithmic chart is more effective than other types of charts in illustrating changes in value during the early years shown in the chart. The vertical axis, the
one that indicates the dollar value of an investment, is constructed with each segment representing a percent change in the value of the investment. In this chart, each segment represents a doubling, or 100% change, in the value of the investment. In other words, the space between $5,000 and $10,000 is the same size as the space between $10,000 and $20,000, and so on.
6 Invesco International Growth Fund
Average Annual Total Returns
As of 10/31/11, including maximum applicable sales charges
| Class A Shares | ||||||||
| Inception (4/7/92) | 7.45 | % | ||||||
| 10 | Years | 6.94 | ||||||
| 5 | Years | 0.12 | ||||||
| 1 | Year | -6.54 | ||||||
| Class B Shares | ||||||||
| Inception (9/15/94) | 5.83 | % | ||||||
| 10 | Years | 6.93 | ||||||
| 5 | Years | 0.13 | ||||||
| 1 | Year | -6.71 | ||||||
| Class C Shares | ||||||||
| Inception (8/4/97) | 3.83 | % | ||||||
| 10 | Years | 6.77 | ||||||
| 5 | Years | 0.50 | ||||||
| 1 | Year | -2.83 | ||||||
| Class R Shares | ||||||||
| 10 | Years | 7.26 | % | |||||
| 5 | Years | 1.01 | ||||||
| 1 | Year | -1.34 | ||||||
| Class Y Shares | ||||||||
| 10 | Years | 7.64 | % | |||||
| 5 | Years | 1.43 | ||||||
| 1 | Year | -0.83 | ||||||
| Institutional Shares | ||||||||
| Inception (3/15/02) | 7.89 | % | ||||||
| 5 | Years | 1.70 | ||||||
| 1 | Year | -0.68 | ||||||
Class R shares incepted on June 3, 2002. Performance shown prior to that date is that of Class A shares, restated to reflect the higher 12b-1 fees applicable to Class R shares. Class A share performance reflects any applicable fee waivers or expense reimbursements.
Class Y shares incepted on October 3, 2008. Performance shown prior to that date is that of Class A shares and includes the 12b-1 fees applicable to Class A shares. Class A share performance reflects any applicable fee waivers or expense reimbursements.
The performance data quoted represent past performance and cannot guarantee comparable future results; current performance may be lower or higher. Please visit invesco.com/performance for the most recent month-end performance. Performance figures reflect reinvested distributions, changes in net asset value and the effect of the maximum
Average Annual Total Returns
As of 9/30/11, the most recent calendar quarter-end, including maximum applicable sales charges
| Class A Shares | ||||||||
| Inception (4/7/92) | 6.96 | % | ||||||
| 10 | Years | 6.18 | ||||||
| 5 | Years | -1.00 | ||||||
| 1 | Year | -11.43 | ||||||
| Class B Shares | ||||||||
| Inception (9/15/94) | 5.27 | % | ||||||
| 10 | Years | 6.17 | ||||||
| 5 | Years | -0.99 | ||||||
| 1 | Year | -11.61 | ||||||
| Class C Shares | ||||||||
| Inception (8/4/97) | 3.17 | % | ||||||
| 10 | Years | 6.01 | ||||||
| 5 | Years | -0.61 | ||||||
| 1 | Year | -7.85 | ||||||
| Class R Shares | ||||||||
| 10 | Years | 6.50 | % | |||||
| 5 | Years | -0.11 | ||||||
| 1 | Year | -6.46 | ||||||
| Class Y Shares | ||||||||
| 10 | Years | 6.87 | % | |||||
| 5 | Years | 0.29 | ||||||
| 1 | Year | -6.02 | ||||||
| Institutional Shares | ||||||||
| Inception (3/15/02) | 6.89 | % | ||||||
| 5 | Years | 0.56 | ||||||
| 1 | Year | -5.89 | ||||||
sales charge unless otherwise stated. Investment return and principal value will fluctuate so that you may have a gain or loss when you sell shares.
The net annual Fund operating expense ratio set forth in the most recent Fund prospectus as of the date of this report for Class A, Class B, Class C, Class R, Class Y and Institutional Class shares was 1.40%, 2.15%, 2.15%, 1.65%, 1.15% and 1.01%, respectively.1 The total annual Fund operating expense ratio set forth in the most recent Fund prospectus as of the date of this report for Class A, Class B, Class C, Class R, Class Y and Institutional Class shares was 1.43%, 2.18%, 2.18%, 1.68%, 1.18% and 1.01%, respectively. The expense ratios presented above may vary from the expense ratios presented in other sections of this report that are based on expenses incurred during the period covered by this report.
Class A share performance reflects the maximum 5.50% sales charge, and Class B and Class C share performance reflects the applicable contingent deferred sales charge (CDSC) for the period involved. The CDSC on Class B shares declines from 5% beginning at the time of purchase to 0% at the beginning of the seventh year. The CDSC on Class C shares is 1% for the first year after purchase. Class R, Class Y and Institutional Class shares do not have a front-end sales charge or a CDSC; therefore, performance is at net asset value.
The performance of the Fund’s share classes will differ primarily due to different sales charge structures and class expenses.
A redemption fee of 2% is imposed on certain redemptions or exchanges out of the Fund within 31 days of purchase. Exceptions to the redemption fee are listed in the Fund’s prospectus. Effective January 1, 2012, after the close of the reporting period, the Fund will eliminate the redemption fee, if applicable, assessed on shares of the Fund redeemed or exchanged within 31 days of purchase.
| 1 | Total annual Fund operating expenses after any contractual fee waivers and/or expense reimbursements by the adviser in effect through at least June 30, 2013. See current prospectus for more information. |
7 Invesco International Growth Fund
Invesco International Growth Fund’s investment objective is long-term growth of capital.
| n | Unless otherwise stated, information presented in this report is as of October 31, 2011, and is based on total net assets. |
| n | Unless otherwise noted, all data provided by Invesco. | |
| n | To access your Fund’s reports/prospectus, visit invesco.com/fundreports. |
About share classes
| n | Class B shares may not be purchased or acquired by exchange from share classes other than Class B shares. Please see the prospectus for more information. | |
| n | Class R shares are available only to certain retirement plans. Please see the prospectus for more information. | |
| n | Class Y shares are available to only certain investors. Please see the prospectus for more information. | |
| n | Institutional Class shares are offered exclusively to institutional investors, including defined contribution plans that meet certain criteria. Please see the prospectus for more information. |
Principal risks of investing in the Fund
| n | Developing markets securities risk. Securities issued by foreign companies and governments located in developing countries may be affected more negatively by inflation, devaluation of their currencies, higher transaction costs, delays in settlement, adverse political developments, the introduction of capital controls, withholding taxes, nationalization of private assets, expropriation, social unrest, war or lack of timely information than those in developed countries. |
| n | Foreign securities risk. The Fund’s foreign investments may be affected by changes in a foreign country’s exchange rates; political and social instability; changes in economic or taxation policies; difficulties when enforcing obligations; decreased liquidity; and increased volatility. Foreign companies may be subject to less regulation resulting in less publicly available information about the companies. |
| n | Growth investing risk. Growth stocks tend to be more expensive relative to their earnings or assets compared with other types of stock. As a result they tend to be more sensitive to changes in their earnings and can be more volatile. |
| n | Management risk. The investment techniques and risk analysis used by the Fund’s portfolio managers may not produce the desired results. |
| n | Market risk. The prices of and the income generated by the Fund’s securities may decline in response to, among other things, investor sentiment; general economic and market conditions; regional or global instability; and currency and interest rate fluctuations. |
About indexes used in this report
| n | The MSCI EAFE® Index is an unmanaged index considered representative of stocks of Europe, Australasia and the Far East. | |
| n | The MSCI EAFE® Growth Index is an unmanaged index considered representative of growth stocks of Europe, Australasia and the Far East. | |
| n | The Lipper International Multi-Cap Growth Funds Index is an unmanaged index considered representative of international multi-cap growth funds tracked by Lipper. | |
| n | The Fund is not managed to track the performance of any particular index, including the index(es) defined here, and consequently, the performance of the Fund may deviate significantly from the performance of the index(es). | |
| n | A direct investment cannot be made in an index. Unless otherwise indicated, index results include reinvested dividends, and they do not reflect sales charges. Performance of the peer group, if applicable, reflects fund expenses; performance of a market index does not. |
Other information
| n | The Chartered Financial Analyst® (CFA®) designation is globally recognized and attests to a charterholder’s success in a rigorous and comprehensive study program in the field of investment management and research analysis. | |
| n | CPA® and Certified Public Accountant® are trademarks owned by the American Institute of Certified Public Accountants. | |
| n | The returns shown in management’s discussion of Fund performance are based on net asset values calculated for shareholder transactions. Generally accepted accounting principles require adjustments to be made to the net assets of the Fund at period end for financial reporting purposes, and as such, the net asset values for shareholder transactions and the returns based on those net asset values may differ from the net asset values and returns reported in the Financial Highlights. | |
| n | Industry classifications used in this report are generally according to the Global Industry Classification Standard, which was developed by and is the exclusive property and a service mark of MSCI Inc. and Standard & Poor’s. |
This report must be accompanied or preceded by a currently effective Fund prospectus, which contains more complete information, including sales charges and expenses. Investors should read it carefully before investing.
NOT FDIC INSURED | MAY LOSE VALUE | NO BANK GUARANTEE
Fund Nasdaq Symbols
| Class A Shares | AIIEX | |||
| Class B Shares | AIEBX | |||
| Class C Shares | AIECX | |||
| Class R Shares | AIERX | |||
| Class Y Shares | AIIYX | |||
| Institutional Class Shares | AIEVX | |||
8 Invesco International Growth Fund
Schedule of Investments
October 31, 2011
| Shares | Value | |||||||
| Common Stocks & Other Equity Interests–90.37% | ||||||||
| Australia–5.65% | ||||||||
| BHP Billiton Ltd. | 1,770,524 | $ | 69,268,258 | |||||
| Brambles Ltd. | 7,050,630 | 48,625,266 | ||||||
| CSL Ltd. | 1,113,949 | 33,337,818 | ||||||
| QBE Insurance Group Ltd. | 2,549,538 | 39,105,051 | ||||||
| WorleyParsons Ltd. | 2,354,454 | 68,085,367 | ||||||
| 258,421,760 | ||||||||
| Belgium–1.71% | ||||||||
| Anheuser-Busch InBev N.V. | 1,408,402 | 78,193,795 | ||||||
| Brazil–2.61% | ||||||||
| Banco Bradesco S.A.–ADR | 4,582,833 | 83,407,561 | ||||||
| Petroleo Brasileiro S.A.–ADR | 1,422,105 | 35,965,035 | ||||||
| 119,372,596 | ||||||||
| Canada–6.00% | ||||||||
| Agrium Inc. | 513,550 | 42,300,831 | ||||||
| Canadian National Railway Co. | 502,877 | 39,355,153 | ||||||
| Canadian Natural Resources Ltd. | 984,892 | 34,708,633 | ||||||
| Cenovus Energy Inc. | 1,246,160 | 42,641,979 | ||||||
| Fairfax Financial Holdings Ltd. | 97,818 | 40,851,785 | ||||||
| Suncor Energy, Inc. | 2,334,199 | 74,281,666 | ||||||
| 274,140,047 | ||||||||
| China–1.21% | ||||||||
| Industrial & Commercial Bank of China Ltd.–Class H | 90,084,000 | 55,308,724 | ||||||
| Denmark–1.34% | ||||||||
| Novo Nordisk A.S.–Class B | 580,966 | 61,347,196 | ||||||
| France–7.01% | ||||||||
| BNP Paribas S.A. | 850,840 | 37,725,433 | ||||||
| Cap Gemini S.A. | 1,257,720 | 48,096,060 | ||||||
| Cie Generale des Etablissements Michelin–Class B | 406,961 | 29,396,360 | ||||||
| Danone S.A. | 880,404 | 60,858,434 | ||||||
| Eutelsat Communications S.A | 765,744 | 31,503,821 | ||||||
| L’Oreal S.A | 271,877 | 29,942,283 | ||||||
| Publicis Groupe S.A. | 497,842 | 24,063,781 | ||||||
| Schneider Electric S.A. | 491,762 | 28,484,607 | ||||||
| Total S.A. | 584,453 | 30,581,278 | ||||||
| 320,652,057 | ||||||||
| Germany–5.55% | ||||||||
| Adidas AG | 980,607 | 68,984,651 | ||||||
| Bayer AG | 357,329 | 22,790,405 | ||||||
| Bayerische Motoren Werke AG | 501,636 | 40,881,336 | ||||||
| Fresenius Medical Care AG & Co. KGaA | 707,323 | 51,460,138 | ||||||
| SAP AG | 1,154,105 | 69,545,980 | ||||||
| 253,662,510 | ||||||||
| Hong Kong–2.02% | ||||||||
| China Mobile Ltd. | 4,303,500 | 41,010,873 | ||||||
| Hutchison Whampoa Ltd. | 5,605,000 | 51,210,698 | ||||||
| 92,221,571 | ||||||||
| India–0.96% | ||||||||
| Infosys Ltd. | 747,773 | 44,033,256 | ||||||
| Israel–1.71% | ||||||||
| Teva Pharmaceutical Industries Ltd.–ADR | 1,918,544 | 78,372,522 | ||||||
| Japan–9.56% | ||||||||
| Canon, Inc. | 1,774,400 | 81,030,053 | ||||||
| Denso Corp. | 1,805,300 | 55,748,332 | ||||||
| Fanuc Corp. | 270,500 | 43,678,807 | ||||||
| Keyence Corp. | 175,800 | 44,714,654 | ||||||
| Komatsu Ltd. | 1,134,545 | 27,934,682 | ||||||
| Nidec Corp. | 553,502 | 45,552,889 | ||||||
| Toyota Motor Corp. | 1,692,100 | 56,576,508 | ||||||
| Yamada Denki Co., Ltd. | 1,136,497 | 81,908,448 | ||||||
| 437,144,373 | ||||||||
| Mexico–3.32% | ||||||||
| America Movil S.A.B. de C.V.–Series L–ADR | 2,442,982 | 62,100,602 | ||||||
| Fomento Economico Mexicano, S.A.B. de C.V.–ADR | 748,494 | 50,186,523 | ||||||
| Grupo Televisa S.A.B.–ADR | 1,850,107 | 39,462,782 | ||||||
| 151,749,907 | ||||||||
| Netherlands–2.46% | ||||||||
| Koninklijke (Royal) KPN N.V. | 542,054 | 7,082,453 | ||||||
| Koninklijke Ahold N.V. | 3,488,398 | 44,608,139 | ||||||
| Unilever N.V. | 1,763,819 | 60,652,949 | ||||||
| 112,343,541 | ||||||||
| Russia–1.32% | ||||||||
| Gazprom–ADR | 3,862,109 | 44,750,809 | ||||||
| VimpelCom Ltd.–ADR | 1,410,510 | 15,487,400 | ||||||
| 60,238,209 | ||||||||
| Singapore–2.46% | ||||||||
| Keppel Corp. Ltd. | 8,096,548 | 60,487,342 | ||||||
| United Overseas Bank Ltd. | 3,824,000 | 51,812,913 | ||||||
| 112,300,255 | ||||||||
See accompanying Notes to Financial Statements which are an integral part of the financial statements.
9 Invesco International Growth Fund
| Shares | Value | |||||||
| South Korea–2.63% | ||||||||
| Hyundai Mobis | 192,961 | $ | 55,575,316 | |||||
NHN Corp.(a) | 309,442 | 64,486,239 | ||||||
| 120,061,555 | ||||||||
| Sweden–3.31% | ||||||||
| Kinnevik Investment AB–Class B | 1,113,056 | 23,203,537 | ||||||
| Swedbank AB–Class A | 3,023,098 | 42,199,429 | ||||||
| Telefonaktiebolaget LM Ericsson–Class B | 4,982,308 | 51,864,658 | ||||||
| Volvo AB–Class B | 2,748,391 | 34,075,162 | ||||||
| 151,342,786 | ||||||||
| Switzerland–7.50% | ||||||||
| ABB Ltd. | 2,171,419 | 40,941,909 | ||||||
Julius Baer Group Ltd.(a) | 1,207,100 | 45,409,949 | ||||||
| Nestle S.A. | 1,230,663 | 71,226,247 | ||||||
| Novartis AG | 1,427,802 | 80,703,267 | ||||||
| Roche Holding AG | 325,946 | 53,592,865 | ||||||
Syngenta AG(a) | 167,466 | 51,230,057 | ||||||
| 343,104,294 | ||||||||
| Taiwan–1.28% | ||||||||
| Taiwan Semiconductor Manufacturing Co. Ltd. | 23,903,887 | 58,297,391 | ||||||
| Turkey–0.70% | ||||||||
| Akbank T.A.S. | 8,817,553 | 32,046,861 | ||||||
| United Kingdom–20.06% | ||||||||
| BG Group PLC | 3,183,965 | 68,999,235 | ||||||
| British American Tobacco PLC | 1,535,671 | 70,275,804 | ||||||
| Centrica PLC | 8,941,612 | 42,349,178 | ||||||
| Compass Group PLC | 10,743,205 | 97,509,495 | ||||||
| GlaxoSmithKline PLC | 628,991 | 14,158,965 | ||||||
| Imperial Tobacco Group PLC | 2,496,010 | 90,962,605 | ||||||
| Informa PLC | 6,429,861 | 37,360,996 | ||||||
| International Power PLC | 6,043,254 | 32,765,675 | ||||||
| Kingfisher PLC | 10,690,699 | 44,212,309 | ||||||
| Next PLC | 1,345,904 | 54,972,906 | ||||||
| Reed Elsevier PLC | 7,922,072 | 67,813,507 | ||||||
| Royal Dutch Shell PLC–Class B | 1,795,003 | 64,520,673 | ||||||
| Shire PLC | 1,388,723 | 43,564,420 | ||||||
| Smith & Nephew PLC | 4,293,391 | 39,170,785 | ||||||
| Tesco PLC | 9,488,973 | 61,155,607 | ||||||
| Vodafone Group PLC | 18,173,896 | 50,401,348 | ||||||
| WPP PLC | 3,541,328 | 36,702,381 | ||||||
| 916,895,889 | ||||||||
| Total Common Stocks & Other Equity Interests (Cost $3,370,130,441) | 4,131,251,095 | |||||||
| Preferred Stocks–1.13% | ||||||||
| Germany–1.13% | ||||||||
| Volkswagen AG -1.76% Pfd. (Cost $54,545,176) | 295,427 | 51,681,417 | ||||||
| Money Market Funds–7.76% | ||||||||
Liquid Assets Portfolio–Institutional Class(b) | 177,482,390 | 177,482,390 | ||||||
Premier Portfolio–Institutional Class(b) | 177,482,390 | 177,482,390 | ||||||
| Total Money Market Funds (Cost $354,964,780) | 354,964,780 | |||||||
| TOTAL INVESTMENTS–99.26% (Cost $3,779,640,397) | 4,537,897,292 | |||||||
| OTHER ASSETS LESS LIABILITIES–0.74% | 33,721,306 | |||||||
| NET ASSETS–100.00% | $ | 4,571,618,598 | ||||||
Investment Abbreviations:
| ADR | – American Depositary Receipt | |
| Pfd. | – Preferred |
Notes to Schedule of Investments:
| (a) | Non-income producing security. | |
| (b) | The money market fund and the Fund are affiliated by having the same investment adviser. |
See accompanying Notes to Financial Statements which are an integral part of the financial statements.
10 Invesco International Growth Fund
Statement of Assets and Liabilities
October 31, 2011
| Assets: | ||||
| Investments, at value (Cost $3,424,675,617) | $ | 4,182,932,512 | ||
| Investments in affiliated money market funds, at value and cost | 354,964,780 | |||
| Total investments, at value (Cost $3,779,640,397) | 4,537,897,292 | |||
| Foreign currencies, at value (Cost $11,099,845) | 11,957,444 | |||
| Receivable for: | ||||
| Investments sold | 33,190,670 | |||
| Fund shares sold | 8,399,141 | |||
| Dividends | 11,375,207 | |||
| Investment for trustee deferred compensation and retirement plans | 124,097 | |||
| Other assets | 57,511 | |||
| Total assets | 4,603,001,362 | |||
| Liabilities: | ||||
| Payable for: | ||||
| Investments purchased | 20,053,946 | |||
| Fund shares reacquired | 8,137,534 | |||
| Accrued fees to affiliates | 2,172,498 | |||
| Accrued other operating expenses | 563,643 | |||
| Trustee deferred compensation and retirement plans | 455,143 | |||
| Total liabilities | 31,382,764 | |||
| Net assets applicable to shares outstanding | $ | 4,571,618,598 | ||
| Net assets consist of: | ||||
| Shares of beneficial interest | $ | 4,114,525,750 | ||
| Undistributed net investment income | 61,773,335 | |||
| Undistributed net realized gain (loss) | (364,110,171 | ) | ||
| Unrealized appreciation | 759,429,684 | |||
| $ | 4,571,618,598 | |||
| Net Assets: | ||||
| Class A | $ | 2,056,979,446 | ||
| Class B | $ | 57,682,627 | ||
| Class C | $ | 145,944,174 | ||
| Class R | $ | 112,090,674 | ||
| Class Y | $ | 741,427,701 | ||
| Institutional Class | $ | 1,457,493,976 | ||
| Shares outstanding, $0.001 par value per share, with an unlimited number of shares authorized: | ||||
| Class A | 77,820,065 | |||
| Class B | 2,363,320 | |||
| Class C | 5,973,856 | |||
| Class R | 4,289,133 | |||
| Class Y | 27,948,349 | |||
| Institutional Class | 54,270,000 | |||
| Class A: | ||||
| Net asset value per share | $ | 26.43 | ||
Maximum offering price per share (Net asset value of $26.43 ¸ 94.50%) | $ | 27.97 | ||
| Class B: | ||||
| Net asset value and offering price per share | $ | 24.41 | ||
| Class C: | ||||
| Net asset value and offering price per share | $ | 24.43 | ||
| Class R: | ||||
| Net asset value and offering price per share | $ | 26.13 | ||
| Class Y: | ||||
| Net asset value and offering price per share | $ | 26.53 | ||
| Institutional Class: | ||||
| Net asset value and offering price per share | $ | 26.86 | ||
See accompanying Notes to Financial Statements which are an integral part of the financial statements.
11 Invesco International Growth Fund
Statement of Operations
For the year ended October 31, 2011
| Investment income: | ||||
| Dividends (net of foreign withholding taxes of $8,319,238) | $ | 111,788,614 | ||
| Dividends from affiliated money market funds | 281,540 | |||
| Interest | 8,698 | |||
| Total investment income | 112,078,852 | |||
| Expenses: | ||||
| Advisory fees | 36,060,320 | |||
| Administrative services fees | 625,741 | |||
| Custodian fees | 1,248,254 | |||
| Distribution fees: | ||||
| Class A | 5,192,606 | |||
| Class B | 560,192 | |||
| Class C | 1,503,270 | |||
| Class R | 594,213 | |||
| Transfer agent fees — A, B, C, R and Y | 6,166,486 | |||
| Transfer agent fees — Institutional | 834,492 | |||
| Trustees’ and officers’ fees and benefits | 143,155 | |||
| Other | 653,863 | |||
| Total expenses | 53,582,592 | |||
| Less: Fees waived, expenses reimbursed and expense offset arrangement(s) | (425,997 | ) | ||
| Net expenses | 53,156,595 | |||
| Net investment income | 58,922,257 | |||
| Realized and unrealized gain (loss) from: | ||||
| Net realized gain (loss) from: | ||||
| Investment securities | 121,172,093 | |||
| Foreign currencies | (1,841,776 | ) | ||
| Foreign currency contracts | (30,615 | ) | ||
| 119,299,702 | ||||
| Change in net unrealized appreciation (depreciation) of: | ||||
| Investment securities | (302,139,814 | ) | ||
| Foreign currencies | 559,718 | |||
| (301,580,096 | ) | |||
| Net realized and unrealized gain (loss) | (182,280,394 | ) | ||
| Net increase (decrease) in net assets resulting from operations | $ | (123,358,137 | ) | |
See accompanying Notes to Financial Statements which are an integral part of the financial statements.
12 Invesco International Growth Fund
Statement of Changes in Net Assets
For the years ended October 31, 2011 and 2010
| 2011 | 2010 | |||||||
| Operations: | ||||||||
| Net investment income | $ | 58,922,257 | $ | 31,097,701 | ||||
| Net realized gain | 119,299,702 | 56,574,978 | ||||||
| Change in net unrealized appreciation (depreciation) | (301,580,096 | ) | 421,169,295 | |||||
| Net increase (decrease) in net assets resulting from operations | (123,358,137 | ) | 508,841,974 | |||||
| Distributions to shareholders from net investment income: | ||||||||
| Class A | (19,146,777 | ) | (22,032,203 | ) | ||||
| Class B | (160,999 | ) | (408,547 | ) | ||||
| Class C | (454,272 | ) | (943,994 | ) | ||||
| Class R | (897,387 | ) | (705,248 | ) | ||||
| Class Y | (2,154,921 | ) | (997,224 | ) | ||||
| Institutional Class | (17,496,217 | ) | (15,085,528 | ) | ||||
| Total distributions from net investment income | (40,310,573 | ) | (40,172,744 | ) | ||||
| Share transactions–net: | ||||||||
| Class A | 163,825,425 | (39,448,094 | ) | |||||
| Class B | 8,745,916 | (17,226,913 | ) | |||||
| Class C | 8,119,730 | (15,251,325 | ) | |||||
| Class R | (909,172 | ) | 39,211,705 | |||||
| Class Y | 615,879,817 | 94,498,967 | ||||||
| Institutional Class | 268,371,175 | 162,072,812 | ||||||
| Net increase in net assets resulting from share transactions | 1,064,032,891 | 223,857,152 | ||||||
| Net increase in net assets | 900,364,181 | 692,526,382 | ||||||
| Net assets: | ||||||||
| Beginning of year | 3,671,254,417 | 2,978,728,035 | ||||||
| End of year (includes undistributed net investment income of $61,773,335 and $39,884,368, respectively) | $ | 4,571,618,598 | $ | 3,671,254,417 | ||||
Notes to Financial Statements
October 31, 2011
NOTE 1—Significant Accounting Policies
Invesco International Growth Fund (the “Fund”) is a series portfolio of AIM International Mutual Funds (Invesco International Mutual Funds) (the “Trust”). The Trust is a Delaware statutory trust registered under the Investment Company Act of 1940, as amended (the “1940 Act”), as an open-end series management investment company consisting of six separate portfolios, each authorized to issue an unlimited number of shares of beneficial interest. The assets, liabilities and operations of each portfolio are accounted for separately. Information presented in these financial statements pertains only to the Fund. Matters affecting each portfolio or class will be voted on exclusively by the shareholders of such portfolio or class.
The Fund’s investment objective is long-term growth of capital.
The Fund currently consists of six different classes of shares: Class A, Class B, Class C, Class R, Class Y and Institutional Class. Class A shares are sold with a front-end sales charge unless certain waiver criteria are met and under certain circumstances load waived shares may be subject to contingent deferred sales charges (“CDSC”). Class C shares are sold with a CDSC. Class R, Class Y and Institutional Class shares are sold at net asset value. Effective November 30, 2010, new or additional investments in Class B shares are no longer permitted. Existing shareholders of Class B shares may continue to reinvest dividends and capital gains distributions in Class B shares until they convert. Also, shareholders in Class B shares will be able to exchange those shares for Class B shares of other Invesco Funds offering such shares until they convert. Generally, Class B shares will automatically convert to Class A shares on or about the month-end which is at least eight years after the date of purchase. Redemption of Class B shares prior to conversion date will be subject to a CDSC.
The following is a summary of the significant accounting policies followed by the Fund in the preparation of its financial statements.
| A. | Security Valuations — Securities, including restricted securities, are valued according to the following policy. |
13 Invesco International Growth Fund
| A security listed or traded on an exchange (except convertible bonds) is valued at its last sales price or official closing price as of the close of the customary trading session on the exchange where the security is principally traded, or lacking any sales or official closing price on a particular day, the security may be valued at the closing bid price on that day. Securities traded in the over-the-counter market are valued based on prices furnished by independent pricing services or market makers. When such securities are valued by an independent pricing service they may be considered fair valued. Futures contracts are valued at the final settlement price set by an exchange on which they are principally traded. Listed options are valued at the mean between the last bid and ask prices from the exchange on which they are principally traded. Options not listed on an exchange are valued by an independent source at the mean between the last bid and ask prices. For purposes of determining net asset value per share, futures and option contracts generally are valued 15 minutes after the close of the customary trading session of the New York Stock Exchange (“NYSE”). | ||
| Investments in open-end and closed-end registered investment companies that do not trade on an exchange are valued at the end of day net asset value per share. Investments in open-end and closed-end registered investment companies that trade on an exchange are valued at the last sales price or official closing price as of the close of the customary trading session on the exchange where the security is principally traded. | ||
| Debt obligations (including convertible bonds) and unlisted equities are fair valued using an evaluated quote provided by an independent pricing service. Evaluated quotes provided by the pricing service may be determined without exclusive reliance on quoted prices, and may reflect appropriate factors such as institution-size trading in similar groups of securities, developments related to specific securities, dividend rate, yield, quality, type of issue, coupon rate, maturity, individual trading characteristics and other market data. Debt securities are subject to interest rate and credit risks. In addition, all debt securities involve some risk of default with respect to interest and/or principal payments. | ||
| Foreign securities (including foreign exchange contracts) are converted into U.S. dollar amounts using the applicable exchange rates as of the close of the NYSE. If market quotations are available and reliable for foreign exchange traded equity securities, the securities will be valued at the market quotations. Because trading hours for certain foreign securities end before the close of the NYSE, closing market quotations may become unreliable. If between the time trading ends on a particular security and the close of the customary trading session on the NYSE, events occur that are significant and make the closing price unreliable, the Fund may fair value the security. If the event is likely to have affected the closing price of the security, the security will be valued at fair value in good faith using procedures approved by the Board of Trustees. Adjustments to closing prices to reflect fair value may also be based on a screening process of an independent pricing service to indicate the degree of certainty, based on historical data, that the closing price in the principal market where a foreign security trade is not the current value as of the close of the NYSE. Foreign securities meeting the approved degree of certainty that the price is not reflective of current value will be priced at the indication of fair value from the independent pricing service. Multiple factors may be considered by the independent pricing service in determining adjustments to reflect fair value and may include information relating to sector indices, American Depositary Receipts and domestic and foreign index futures. Foreign securities may have additional risks including exchange rate changes, potential for sharply devalued currencies and high inflation, political and economical upheaval, the relative lack of issuer information, relatively low market liquidity and the potential lack of strict financial and accounting controls and standards. | ||
| Securities for which market prices are not provided by any of the above methods may be valued based upon quotes furnished by independent sources. The last bid price may be used to value equity securities. The mean between the last bid and asked prices is used to value debt obligations, including Corporate Loans. | ||
| Securities for which market quotations are not readily available or are unreliable are valued at fair value as determined in good faith by or under the supervision of the Trust’s officers following procedures approved by the Board of Trustees. Issuer specific events, market trends, bid/ask quotes of brokers and information providers and other market data may be reviewed in the course of making a good faith determination of a security’s fair value. | ||
| Valuations change in response to many factors including the historical and prospective earnings of the issuer, the value of the issuer’s assets, general economic conditions, interest rates, investor perceptions and market liquidity. Because of the inherent uncertainties of valuation, the values reflected in the financial statements may materially differ from the value received upon actual sale of those investments. | ||
| B. | Securities Transactions and Investment Income — Securities transactions are accounted for on a trade date basis. Realized gains or losses on sales are computed on the basis of specific identification of the securities sold. Interest income is recorded on the accrual basis from settlement date. Dividend income (net of withholding tax, if any) is recorded on the ex-dividend date. | |
| The Fund may periodically participate in litigation related to Fund investments. As such, the Fund may receive proceeds from litigation settlements. Any proceeds received are included in the Statement of Operations as realized gain (loss) for investments no longer held and as unrealized gain (loss) for investments still held. | ||
| Brokerage commissions and mark ups are considered transaction costs and are recorded as an increase to the cost basis of securities purchased and/or a reduction of proceeds on a sale of securities. Such transaction costs are included in the determination of net realized and unrealized gain (loss) from investment securities reported in the Statement of Operations and the Statement of Changes in Net Assets and the net realized and unrealized gains (losses) on securities per share in the Financial Highlights. Transaction costs are included in the calculation of the Fund’s net asset value and, accordingly, they reduce the Fund’s total returns. These transaction costs are not considered operating expenses and are not reflected in net investment income reported in the Statement of Operations and Statement of Changes in Net Assets, or the net investment income per share and ratios of expenses and net investment income reported in the Financial Highlights, nor are they limited by any expense limitation arrangements between the Fund and the investment adviser. | ||
| The Fund allocates income and realized and unrealized capital gains and losses to a class based on the relative net assets of each class. | ||
| C. | Country Determination — For the purposes of making investment selection decisions and presentation in the Schedule of Investments, the investment adviser may determine the country in which an issuer is located and/or credit risk exposure based on various factors. These factors include the laws of the country under which the issuer is organized, where the issuer maintains a principal office, the country in which the issuer derives 50% or more of its total revenues and the country that has the primary market for the issuer’s securities, as well as other criteria. Among the other criteria that may be evaluated for making this determination are the country in which the issuer maintains 50% or more of its assets, the type of security, financial guarantees and enhancements, the nature of the collateral and the sponsor organization. Country of issuer and/or credit risk exposure has been determined to be the United States of America, unless otherwise noted. |
14 Invesco International Growth Fund
| D. | Distributions — Distributions from income and net realized capital gain, if any, are generally paid annually and recorded on ex-dividend date. The Fund may elect to treat a portion of the proceeds from redemptions as distributions for federal income tax purposes. | |
| E. | Federal Income Taxes — The Fund intends to comply with the requirements of Subchapter M of the Internal Revenue Code necessary to qualify as a regulated investment company and to distribute substantially all of the Fund’s taxable earnings to shareholders. As such, the Fund will not be subject to federal income taxes on otherwise taxable income (including net realized capital gain) that is distributed to shareholders. Therefore, no provision for federal income taxes is recorded in the financial statements. | |
| The Fund files tax returns in the U.S. Federal jurisdiction and certain other jurisdictions. Generally, the Fund is subject to examinations by such taxing authorities for up to three years after the filing of the return for the tax period. | ||
| F. | Expenses — Fees provided for under the Rule 12b-1 plan of a particular class of the Fund are charged to the operations of such class. Transfer agency fees and expenses and other shareholder recordkeeping fees and expenses attributable to the Institutional Class are charged to such class. Transfer agency fees and expenses and other shareholder recordkeeping fees and expenses relating to all other classes are allocated among those classes based on relative net assets. All other expenses are allocated among the classes based on relative net assets. | |
| G. | Accounting Estimates — The preparation of financial statements in conformity with accounting principles generally accepted in the United States of America (“GAAP”) requires management to make estimates and assumptions that affect the reported amounts of assets and liabilities at the date of the financial statements and the reported amounts of revenues and expenses during the reporting period including estimates and assumptions related to taxation. Actual results could differ from those estimates by a significant amount. In addition, the Fund monitors for material events or transactions that may occur or become known after the period-end date and before the date the financial statements are released to print. | |
| H. | Indemnifications — Under the Trust’s organizational documents, each Trustee, officer, employee or other agent of the Trust is indemnified against certain liabilities that may arise out of performance of their duties to the Fund. Additionally, in the normal course of business, the Fund enters into contracts, including the Fund’s servicing agreements that contain a variety of indemnification clauses. The Fund’s maximum exposure under these arrangements is unknown as this would involve future claims that may be made against the Fund that have not yet occurred. The risk of material loss as a result of such indemnification claims is considered remote. | |
| I. | Redemption Fees — The Fund has a 2% redemption fee that is to be retained by the Fund to offset transaction costs and other expenses associated with short-term redemptions and exchanges. The fee, subject to certain exceptions, is imposed on certain redemptions or exchanges of shares within 31 days of purchase. The redemption fee is recorded as an increase in shareholder capital and is allocated among the share classes based on the relative net assets of each class. Effective January 1, 2012, the Fund will eliminate the 2% redemption fee, if applicable, assessed on shares of the Fund redeemed or exchanged within 31 days of purchase. | |
| J. | Foreign Currency Translations — Foreign currency is valued at the close of the NYSE based on quotations posted by banks and major currency dealers. Portfolio securities and other assets and liabilities denominated in foreign currencies are translated into U.S. dollar amounts at date of valuation. Purchases and sales of portfolio securities (net of foreign taxes withheld on disposition) and income items denominated in foreign currencies are translated into U.S. dollar amounts on the respective dates of such transactions. The Fund does not separately account for the portion of the results of operations resulting from changes in foreign exchange rates on investments and the fluctuations arising from changes in market prices of securities held. The combined results of changes in foreign exchange rates and the fluctuation of market prices on investments (net of estimated foreign tax withholding) are included with the net realized and unrealized gain or loss from investments in the Statement of Operations. Reported net realized foreign currency gains or losses arise from (1) sales of foreign currencies, (2) currency gains or losses realized between the trade and settlement dates on securities transactions, and (3) the difference between the amounts of dividends, interest, and foreign withholding taxes recorded on the Fund’s books and the U.S. dollar equivalent of the amounts actually received or paid. Net unrealized foreign currency gains and losses arise from changes in the fair values of assets and liabilities, other than investments in securities at fiscal period end, resulting from changes in exchange rates. | |
| The Fund may invest in foreign securities which may be subject to foreign taxes on income, gains on investments or currency repatriation, a portion of which may be recoverable. | ||
| K. | Foreign Currency Contracts — The Fund may enter into foreign currency contracts to manage or minimize currency or exchange rate risk. The Fund may also enter into foreign currency contracts for the purchase or sale of a security denominated in a foreign currency in order to “lock in” the U.S. dollar price of that security. A foreign currency contract is an obligation to purchase or sell a specific currency for an agreed-upon price at a future date. The use of foreign currency contracts does not eliminate fluctuations in the price of the underlying securities the Fund owns or intends to acquire but establishes a rate of exchange in advance. Fluctuations in the value of these contracts are measured by the difference in the contract date and reporting date exchange rates and are recorded as unrealized appreciation (depreciation) until the contracts are closed. When the contracts are closed, realized gains (losses) are recorded. Realized and unrealized gains (losses) on the contracts are included in the Statement of Operations. The primary risks associated with foreign currency contracts include failure of the counterparty to meet the terms of the contract and the value of the foreign currency changing unfavorably. These risks may be in excess of the amounts reflected in the Statement of Assets and Liabilities. |
15 Invesco International Growth Fund
NOTE 2—Advisory Fees and Other Fees Paid to Affiliates
The Trust has entered into a master investment advisory agreement with Invesco Advisers, Inc. (the “Adviser” or “Invesco”). Under the terms of the investment advisory agreement, the Fund pays an advisory fee to the Adviser based on the annual rate of the Fund’s average daily net assets as follows:
| Average Daily Net Assets | Rate | |||
| First $250 million | 0 | .935% | ||
| Next $250 million | 0 | .91% | ||
| Next $500 million | 0 | .885% | ||
| Next $1.5 billion | 0 | .86% | ||
| Next $2.5 billion | 0 | .835% | ||
| Next $2.5 billion | 0 | .81% | ||
| Next $2.5 billion | 0 | .785% | ||
| Over $10 billion | 0 | .76% | ||
Under the terms of a master sub-advisory agreement between the Adviser and each of Invesco Asset Management Deutschland GmbH, Invesco Asset Management Limited, Invesco Asset Management (Japan) Limited, Invesco Australia Limited, Invesco Hong Kong Limited, Invesco Senior Secured Management, Inc. and Invesco Canada Ltd. (collectively, the “Affiliated Sub-Advisers”) the Adviser, not the Fund, may pay 40% of the fees paid to the Adviser to any such Affiliated Sub-Adviser(s) that provide discretionary investment management services to the Fund based on the percentage of assets allocated to such Sub-Adviser(s).
Effective May 23, 2011, the Adviser has contractually agreed, through at least June 30, 2013, to waive advisory fees and/or reimburse expenses of all shares to the extent necessary to limit total annual fund operating expenses after fee waiver and/or expense reimbursement (excluding certain items discussed below) of Class A, Class B, Class C, Class R, Class Y and Institutional Class shares to 1.40%, 2.15%, 2.15%, 1.65%, 1.15% and 1.15%, respectively, of average daily net assets. Prior to May 23, 2011, the Adviser had contractually agreed to waive advisory fees and/or reimburse expenses of all shares to the extent necessary to limit total annual fund operating expenses after fee waiver and/or expense reimbursement (excluding certain items discussed below) of Class A, Class B, Class C, Class R, Class Y and Institutional Class shares to 2.25%, 3.00%, 3.00%, 2.50%, 2.00% and 2.00%, respectively, of average daily net assets. In determining the Adviser’s obligation to waive advisory fees and/or reimburse expenses, the following expenses are not taken into account, and could cause the total annual fund operating expenses after fee waiver and/or expense reimbursement to exceed the numbers reflected above: (1) interest; (2) taxes; (3) dividend expense on short sales; (4) extraordinary or non-routine items; and (5) expenses that the Fund has incurred but did not actually pay because of an expense offset arrangement. Unless the Board of the Trustees and Invesco mutually agree to amend or continue the fee waiver agreement, it will terminate on June 30, 2013. The Adviser did not waive fees and/or reimburse expenses under this expense limitation.
Further, the Adviser has contractually agreed, through at least June 30, 2012, to waive the advisory fee payable by the Fund in an amount equal to 100% of the net advisory fees the Adviser receives from the affiliated money market funds on investments by the Fund of uninvested cash (excluding investments of cash collateral from securities lending) in such affiliated money market funds.
For the year ended October 31, 2011, the Adviser waived advisory fees of $412,529.
At the request of the Trustees of the Trust, Invesco Ltd. agreed to reimburse expenses incurred by the Fund in connection with market timing matters in the Invesco Funds, which may include legal, audit, shareholder reporting, communications and trustee expenses. These expenses along with the related expense reimbursement are included in the Statement of Operations. For the year ended October 31, 2011, Invesco Ltd. reimbursed expenses of the Fund in the amount of $5,478.
The Trust has entered into a master administrative services agreement with Invesco pursuant to which the Fund has agreed to pay Invesco for certain administrative costs incurred in providing accounting services to the Fund. For the year ended October 31, 2011, expenses incurred under the agreement are shown in the Statement of Operations as administrative services fees.
The Trust has entered into a transfer agency and service agreement with Invesco Investment Services, Inc. (“IIS”) pursuant to which the Fund has agreed to pay IIS a fee for providing transfer agency and shareholder services to the Fund and reimburse IIS for certain expenses incurred by IIS in the course of providing such services. IIS may make payments to intermediaries that provide omnibus account services, sub-accounting services and/or networking services. All fees payable by IIS to intermediaries that provide omnibus account services or sub-accounting are charged back to the Fund, subject to certain limitations approved by the Trust’s Board of Trustees. For the year ended October 31, 2011, expenses incurred under the agreement are shown in the Statement of Operations as transfer agent fees.
The Trust has entered into master distribution agreements with Invesco Distributors, Inc. (“IDI”) to serve as the distributor for the Class A, Class B, Class C, Class R, Class Y and Institutional Class shares of the Fund. The Trust has adopted plans pursuant to Rule 12b-1 under the 1940 Act with respect to the Fund’s Class A, Class B, Class C and Class R shares (collectively, the “Plans”). The Fund, pursuant to the Plans, pays IDI compensation at the annual rate of 0.25% of the Fund’s average daily net assets of Class A shares, 1.00% of the average daily net assets of Class B and Class C shares and 0.50% of the average daily net assets of Class R shares. Of the Plan payments, up to 0.25% of the average daily net assets of each class of shares may be paid to furnish continuing personal shareholder services to customers who purchase and own shares of such classes. Any amounts not paid as a service fee under the Plans would constitute an asset-based sales charge. Rules of the Financial Industry Regulatory Authority (“FINRA”) impose a cap on the total sales charges, including asset-based sales charges that may be paid by any class of shares of the Fund. For the year ended October 31, 2011, expenses incurred under the Plans are shown in the Statement of Operations as distribution fees.
Front-end sales commissions and CDSC (collectively, the “sales charges”) are not recorded as expenses of the Fund. Front-end sales commissions are deducted from proceeds from the sales of Fund shares prior to investment in Class A shares of the Fund. CDSC are deducted from redemption proceeds prior to remittance
16 Invesco International Growth Fund
to the shareholder. During the year ended October 31, 2011, IDI advised the Fund that IDI retained $317,354 in front-end sales commissions from the sale of Class A shares and $11,007, $77,267 and $7,398 from Class A, Class B and Class C shares, respectively, for CDSC imposed on redemptions by shareholders.
Certain officers and trustees of the Trust are officers and directors of the Adviser, Invesco Ltd., IIS and/or IDI.
NOTE 3—Additional Valuation Information
GAAP defines fair value as the price that would be received to sell an asset or paid to transfer a liability in an orderly transaction between market participants at the measurement date, under current market conditions. GAAP establishes a hierarchy that prioritizes the inputs to valuation methods giving the highest priority to readily available unadjusted quoted prices in an active market for identical assets (Level 1) and the lowest priority to significant unobservable inputs (Level 3) generally when market prices are not readily available or are unreliable. Based on the valuation inputs, the securities or other investments are tiered into one of three levels. Changes in valuation methods may result in transfers in or out of an investment’s assigned level:
| Level 1 — | Prices are determined using quoted prices in an active market for identical assets. | |
| Level 2 — | Prices are determined using other significant observable inputs. Observable inputs are inputs that other market participants may use in pricing a security. These may include quoted prices for similar securities, interest rates, prepayment speeds, credit risk, yield curves, loss severities, default rates, discount rates, volatilities and others. | |
| Level 3 — | Prices are determined using significant unobservable inputs. In situations where quoted prices or observable inputs are unavailable (for example, when there is little or no market activity for an investment at the end of the period), unobservable inputs may be used. Unobservable inputs reflect the Fund’s own assumptions about the factors market participants would use in determining fair value of the securities or instruments and would be based on the best available information. |
The following is a summary of the tiered valuation input levels, as of October 31, 2011. The level assigned to the securities valuations may not be an indication of the risk or liquidity associated with investing in those securities. Because of the inherent uncertainties of valuation, the values reflected in the financial statements may materially differ from the value received upon actual sale of those investments.
| Level 1* | Level 2* | Level 3 | Total | |||||||||||||
| Australia | $ | — | $ | 258,421,760 | $ | — | $ | 258,421,760 | ||||||||
| Belgium | — | 78,193,795 | — | 78,193,795 | ||||||||||||
| Brazil | 119,372,596 | — | — | 119,372,596 | ||||||||||||
| Canada | 274,140,047 | — | — | 274,140,047 | ||||||||||||
| China | — | 55,308,724 | — | 55,308,724 | ||||||||||||
| Denmark | — | 61,347,196 | — | 61,347,196 | ||||||||||||
| France | 30,581,278 | 290,070,779 | — | 320,652,057 | ||||||||||||
| Germany | — | 305,343,927 | — | 305,343,927 | ||||||||||||
| Hong Kong | — | 92,221,571 | — | 92,221,571 | ||||||||||||
| India | — | 44,033,256 | — | 44,033,256 | ||||||||||||
| Israel | 78,372,522 | — | — | 78,372,522 | ||||||||||||
| Japan | — | 437,144,373 | — | 437,144,373 | ||||||||||||
| Mexico | 151,749,907 | — | — | 151,749,907 | ||||||||||||
| Netherlands | — | 112,343,541 | — | 112,343,541 | ||||||||||||
| Russia | 15,487,400 | 44,750,809 | — | 60,238,209 | ||||||||||||
| Singapore | — | 112,300,255 | — | 112,300,255 | ||||||||||||
| South Korea | — | 120,061,555 | — | 120,061,555 | ||||||||||||
| Sweden | — | 151,342,786 | — | 151,342,786 | ||||||||||||
| Switzerland | 131,933,324 | 211,170,970 | — | 343,104,294 | ||||||||||||
| Taiwan | — | 58,297,391 | — | 58,297,391 | ||||||||||||
| Turkey | — | 32,046,861 | — | 32,046,861 | ||||||||||||
| United Kingdom | 122,244,058 | 794,651,831 | — | 916,895,889 | ||||||||||||
| United States | 354,964,780 | — | — | 354,964,780 | ||||||||||||
| Total Investments | $ | 1,278,845,912 | $ | 3,259,051,380 | $ | — | $ | 4,537,897,292 | ||||||||
* Transfer occured between Level 1 and Level 2 due to foreign fair value adjustments.
17 Invesco International Growth Fund
NOTE 4—Derivative Investments
The Fund has implemented the required disclosures about derivative instruments and hedging activities in accordance with GAAP. This disclosure is intended to improve financial reporting about derivative instruments and hedging activities by requiring enhanced disclosures to enable investors to better understand their effects on an entity’s financial position and financial performance. The enhanced disclosure has no impact on the results of operations reported in the financial statements.
Effect of Derivative Instruments for the year ended October 31, 2011
The table below summarizes the gains (losses) on derivative instruments, detailed by primary risk exposure, recognized in earnings during the period:
| Location of Gain (Loss) on | ||||
| Statement of Operations | ||||
| Foreign Currency | ||||
| Contracts* | ||||
| Realized Gain (Loss) Currency risk | $ | (30,615 | ) | |
| Change in Unrealized Appreciation (Depreciation) Currency risk | — | |||
| Total | $ | (30,615 | ) | |
| * | The average notional value of foreign currency contracts outstanding during the period was $595,177. |
NOTE 5—Expense Offset Arrangement(s)
The expense offset arrangements are comprised of (1) transfer agency credits which result from balances in Demand Deposit Accounts (DDA) used by the transfer agent for clearing shareholder transactions and (2) custodian credits which result from periodic overnight cash balances at the custodian. For the year ended October 31, 2011, the Fund received credits from these arrangements, which resulted in the reduction of the Fund’s total expenses of $7,990.
NOTE 6—Trustees’ and Officers’ Fees and Benefits
“Trustees’ and Officers’ Fees and Benefits” include amounts accrued by the Fund to pay remuneration to certain Trustees and Officers of the Fund. Trustees have the option to defer compensation payable by the Fund, and “Trustees’ and Officers’ Fees and Benefits” also include amounts accrued by the Fund to fund such deferred compensation amounts. Those Trustees who defer compensation have the option to select various Invesco Funds in which their deferral accounts shall be deemed to be invested. Finally, certain current Trustees are eligible to participate in a retirement plan that provides for benefits to be paid upon retirement to Trustees over a period of time based on the number of years of service. The Fund may have certain former Trustees who also participate in a retirement plan and receive benefits under such plan. “Trustees’ and Officers’ Fees and Benefits” include amounts accrued by the Fund to fund such retirement benefits. Obligations under the deferred compensation and retirement plans represent unsecured claims against the general assets of the Fund.
During the year ended October 31, 2011, the Fund paid legal fees of $7,760 for services rendered by Kramer, Levin, Naftalis & Frankel LLP as counsel to the Independent Trustees. A partner of that firm is a Trustee of the Trust.
NOTE 7—Cash Balances
The Fund is permitted to temporarily carry a negative or overdrawn balance in its account with The State Street Bank and Trust Company, the custodian bank. To compensate the custodian bank for such overdrafts, the overdrawn Fund may either (1) leave funds as a compensating balance in the account so the custodian bank can be compensated by earning the additional interest; or (2) compensate by paying the custodian bank at a rate agreed upon by the custodian bank and Invesco, not to exceed the contractually agreed upon rate.
NOTE 8—Distributions to Shareholders and Tax Components of Net Assets
Tax Character of Distributions to Shareholders Paid During the Years Ended October 31, 2011 and 2010:
| 2011 | 2010 | |||||||
| Ordinary income | $ | 40,310,572 | $ | 40,172,744 | ||||
Tax Components of Net Assets at Period-End:
| 2011 | ||||
| Undistributed ordinary income | $ | 62,212,758 | ||
| Net unrealized appreciation — investments | 754,158,524 | |||
| Net unrealized appreciation — other investments | 1,172,789 | |||
| Temporary book/tax differences | (439,423 | ) | ||
| Capital loss carryforward | (360,011,800 | ) | ||
| Shares of beneficial interest | 4,114,525,750 | |||
| Total net assets | $ | 4,571,618,598 | ||
18 Invesco International Growth Fund
The difference between book-basis and tax-basis unrealized appreciation (depreciation) is due to differences in the timing of recognition of gains and losses on investments for tax and book purposes. The Fund’s net unrealized appreciation difference is attributable primarily to wash sales.
The temporary book/tax differences are a result of timing differences between book and tax recognition of income and/or expenses. The Fund’s temporary book/tax differences are the result of the trustee deferral of compensation and retirement plan benefits.
Capital loss carryforward is calculated and reported as of a specific date. Results of transactions and other activity after that date may affect the amount of capital loss carryforward actually available for the Fund to utilize. The ability to utilize capital loss carryforward in the future may be limited under the Internal Revenue Code and related regulations based on the results of future transactions. Under these limitation rules, the Fund is limited to utilizing $129,657,986 of capital loss carryforward in the fiscal year ending October 31, 2012.
The Fund utilized $114,177,501 of capital loss carryforward in the current period to offset net realized capital gain for federal income tax purposes. The Fund has a capital loss carryforward as of October 31, 2011, which expires as follows:
| Capital Loss | ||||
| Expiration | Carryforward* | |||
| October 31, 2016 | $ | 14,902,772 | ||
| October 31, 2017 | 345,109,028 | |||
| Total capital loss carryforward | $ | 360,011,800 | ||
| * | Capital loss carryforward as of the date listed above is reduced for limitations, if any, to the extent required by the Internal Revenue Code. |
NOTE 9—Investment Securities
The aggregate amount of investment securities (other than short-term securities, U.S. Treasury obligations and money market funds, if any) purchased and sold by the Fund during the year ended October 31, 2011 was $1,085,209,365 and $908,575,496, respectively. Cost of investments on a tax basis includes the adjustments for financial reporting purposes as of the most recently completed Federal income tax reporting period-end.
| Unrealized Appreciation (Depreciation) of Investment Securities on a Tax Basis | ||||
| Aggregate unrealized appreciation of investment securities | $ | 880,359,619 | ||
| Aggregate unrealized (depreciation) of investment securities | (126,201,095 | ) | ||
| Net unrealized appreciation of investment securities | $ | 754,158,524 | ||
| Cost of investments for tax purposes is $3,783,738,768. | ||||
NOTE 10—Reclassification of Permanent Differences
Primarily as a result of differing book/tax treatment of Fair Fund distributions, merger expenses and foreign currency transactions, on October 31, 2011, undistributed net investment income was increased by $3,714,218, undistributed net realized gain (loss) was decreased by $3,684,217 and shares of beneficial interest decreased by $30,000. Further, as a result of tax deferrals and capital carryforwards acquired in the reorganization of Invesco Van Kampen International Advantage Fund and Invesco Van Kampen International Growth Fund into the Fund, undistributed net investment income was decreased by $436,935, undistributed net realized gain was decreased by $317,261,901 and shares of beneficial interest increased by $317,698,836. These reclassification had no effect on the net assets of the Fund.
19 Invesco International Growth Fund
NOTE 11—Share Information
| Summary of Share Activity | ||||||||||||||||
| Years ended October 31, | ||||||||||||||||
| 2011(a) | 2010 | |||||||||||||||
| Shares | Amount | Shares | Amount | |||||||||||||
| Sold: | ||||||||||||||||
| Class A | 14,037,487 | $ | 387,500,963 | 17,385,142 | $ | 423,963,466 | ||||||||||
| Class B | 174,784 | 4,753,921 | 276,789 | 6,287,392 | ||||||||||||
| Class C | 747,741 | 19,387,187 | 878,681 | 20,023,442 | ||||||||||||
| Class R | 1,333,470 | 36,383,554 | 2,674,629 | 65,719,937 | ||||||||||||
| Class Y | 10,051,297 | 272,811,514 | 5,522,934 | 137,692,880 | ||||||||||||
| Institutional Class | 19,343,414 | 533,838,311 | 17,940,318 | 450,484,342 | ||||||||||||
| Issued as reinvestment of dividends: | ||||||||||||||||
| Class A | 546,284 | 14,760,585 | 771,653 | 18,882,349 | ||||||||||||
| Class B | 5,633 | 141,502 | 16,967 | 386,168 | ||||||||||||
| Class C | 11,641 | 292,664 | 38,058 | 866,964 | ||||||||||||
| Class R | 30,701 | 822,161 | 29,077 | 705,128 | ||||||||||||
| Class Y | 25,598 | 692,428 | 31,679 | 775,808 | ||||||||||||
| Institutional Class | 520,471 | 14,234,881 | 567,637 | 14,054,686 | ||||||||||||
Issued in connection with acquisitions:(b) | ||||||||||||||||
| Class A | 11,381,064 | 331,260,802 | — | — | ||||||||||||
| Class B | 952,100 | 25,671,741 | — | — | ||||||||||||
| Class C | 814,037 | 21,970,347 | — | — | ||||||||||||
| Class R | 102,409 | 2,950,523 | — | — | ||||||||||||
| Class Y | 15,897,443 | 463,869,410 | — | — | ||||||||||||
| Institutional Class | 3,490,727 | 103,037,338 | — | — | ||||||||||||
| Automatic conversion of Class B shares to Class A shares: | ||||||||||||||||
| Class A | 360,370 | 9,945,690 | 495,082 | 12,118,973 | ||||||||||||
| Class B | (389,081 | ) | (9,945,690 | ) | (533,827 | ) | (12,118,973 | ) | ||||||||
Reacquired:(c) | ||||||||||||||||
| Class A | (21,085,258 | ) | (579,642,615 | ) | (20,165,137 | ) | (494,412,882 | ) | ||||||||
| Class B | (462,709 | ) | (11,875,558 | ) | (520,359 | ) | (11,781,500 | ) | ||||||||
| Class C | (1,322,979 | ) | (33,530,468 | ) | (1,597,796 | ) | (36,141,731 | ) | ||||||||
| Class R | (1,494,180 | ) | (41,065,410 | ) | (1,128,843 | ) | (27,213,360 | ) | ||||||||
| Class Y | (4,426,443 | ) | (121,493,535 | ) | (1,809,474 | ) | (43,969,721 | ) | ||||||||
| Institutional Class | (13,918,449 | ) | (382,739,355 | ) | (12,267,329 | ) | (302,466,216 | ) | ||||||||
| Net increase in share activity | 36,727,572 | $ | 1,064,032,891 | 8,605,881 | $ | 223,857,152 | ||||||||||
| (a) | There are entities that are record owners of more than 5% of the outstanding shares of the Fund and in the aggregate own 33% of the outstanding shares of the Fund. IDI has an agreement with these entities to sell Fund shares. The Fund, Invesco and/or Invesco affiliates may make payments to these entities, which are considered to be related to the Fund, for providing services to the Fund, Invesco and/or Invesco affiliates including but not limited to services such as securities brokerage, distribution, third party record keeping and account servicing. The Fund has no knowledge as to whether all or any portion of the shares owned of record by these entities are also owned beneficially. | |
| (b) | As of the open of business on May 23, 2011, the Fund acquired all the net assets of Invesco Van Kampen International Advantage Fund and Invesco Van Kampen International Growth Fund pursuant to a plan of reorganization approved by the Trustees of the Fund on November 10, 2010 and by the shareholders of Invesco Van Kampen International Advantage Fund and Invesco Van Kampen International Growth Fund, respectively on April 14, 2011. The acquisition was accomplished by a tax-free exchange of 32,637,780 shares of the Fund for 5,574,029 shares outstanding of Invesco Van Kampen International Advantage Fund and 49,348,979 shares outstanding of Invesco Van Kampen International Growth Fund as of the close of business on May 20, 2011. Each class of shares of Invesco Van Kampen International Advantage Fund and Invesco Van Kampen International Growth Fund was exchanged for the like class of shares of the Fund based on the relative net asset value of Invesco Van Kampen International Advantage Fund and Invesco Van Kampen International Growth Fund to the net asset value of the Fund on the close of business, May 20, 2011. Invesco Van Kampen International Advantage Fund’s net assets as of the close of business on May 20, 2011 of $77,649,931 including $13,427,590 of unrealized appreciation and Invesco Van Kampen International Growth Fund’s net assets as of the close of business on May 20, 2011 of $871,110,230 including $153,130,351 of unrealized appreciation, were combined with the net assets of the Fund immediately before the acquisition of $3,996,943,417. The combined aggregate net assets of the Fund subsequent to the reorganization were $4,945,703,578. | |
| (c) | Net of redemption fees of $112,143 and $145,567 allocated among the classes based on relative net assets of each class for the years ended October 31, 2011 and 2010, respectively. |
20 Invesco International Growth Fund
NOTE 12—Financial Highlights
The following schedule presents financial highlights for a share of the Fund outstanding throughout the periods indicated.
| Ratio of | Ratio of | |||||||||||||||||||||||||||||||||||||||||||||||||||||||
| Net gains | expenses | expenses | ||||||||||||||||||||||||||||||||||||||||||||||||||||||
| (losses) on | to average | to average net | Ratio of net | |||||||||||||||||||||||||||||||||||||||||||||||||||||
| Net asset | securities | Dividends | Distributions | net assets | assets without | investment | ||||||||||||||||||||||||||||||||||||||||||||||||||
| value, | Net | (both | Total from | from net | from net | Net asset | Net assets, | with fee waivers | fee waivers | income | ||||||||||||||||||||||||||||||||||||||||||||||
| beginning | investment | realized and | investment | investment | realized | Total | value, end | Total | end of period | and/or expenses | and/or expenses | to average | Portfolio | |||||||||||||||||||||||||||||||||||||||||||
| of period | income(a) | unrealized) | operations | income | gains | Distributions | of period(b) | Return(c) | (000s omitted) | absorbed | absorbed | net assets | turnover(d) | |||||||||||||||||||||||||||||||||||||||||||
| Class A | ||||||||||||||||||||||||||||||||||||||||||||||||||||||||
| Year ended 10/31/11 | $ | 26.99 | $ | 0.36 | $ | (0.65 | ) | $ | (0.29 | ) | $ | (0.27 | ) | $ | — | $ | (0.27 | ) | $ | 26.43 | (1.10 | )% | $ | 2,056,979 | 1.38 | %(e) | 1.39 | %(e) | 1.29 | %(e) | 25 | % | ||||||||||||||||||||||||
| Year ended 10/31/10 | 23.41 | 0.21 | 3.66 | 3.87 | (0.29 | ) | — | (0.29 | ) | 26.99 | 16.68 | 1,958,940 | 1.43 | 1.44 | 0.85 | 25 | ||||||||||||||||||||||||||||||||||||||||
| Year ended 10/31/09 | 19.04 | 0.24 | 4.52 | 4.76 | (0.39 | ) | — | (0.39 | ) | 23.41 | 25.65 | 1,734,895 | 1.49 | 1.51 | 1.24 | 26 | ||||||||||||||||||||||||||||||||||||||||
| Year ended 10/31/08 | 36.57 | 0.40 | (15.91 | ) | (15.51 | ) | (0.18 | ) | (1.84 | ) | (2.02 | ) | 19.04 | (47.34 | ) | 1,452,469 | 1.44 | 1.45 | 1.38 | 38 | ||||||||||||||||||||||||||||||||||||
| Year ended 10/31/07 | 27.85 | 0.28 | 8.72 | 9.00 | (0.19 | ) | (0.09 | ) | (0.28 | ) | 36.57 | 32.55 | 2,899,666 | 1.44 | 1.47 | 0.87 | 22 | |||||||||||||||||||||||||||||||||||||||
| Class B | ||||||||||||||||||||||||||||||||||||||||||||||||||||||||
| Year ended 10/31/11 | 24.95 | 0.14 | (0.60 | ) | (0.46 | ) | (0.08 | ) | — | (0.08 | ) | 24.41 | (1.85 | ) | 57,683 | 2.13 | (e) | 2.14 | (e) | 0.54 | (e) | 25 | ||||||||||||||||||||||||||||||||||
| Year ended 10/31/10 | 21.68 | 0.02 | 3.40 | 3.42 | (0.15 | ) | — | (0.15 | ) | 24.95 | 15.83 | 51,950 | 2.18 | 2.19 | 0.10 | 25 | ||||||||||||||||||||||||||||||||||||||||
| Year ended 10/31/09 | 17.52 | 0.09 | 4.20 | 4.29 | (0.13 | ) | — | (0.13 | ) | 21.68 | 24.72 | 61,649 | 2.24 | 2.26 | 0.49 | 26 | ||||||||||||||||||||||||||||||||||||||||
| Year ended 10/31/08 | 33.88 | 0.17 | (14.69 | ) | (14.52 | ) | — | (1.84 | ) | (1.84 | ) | 17.52 | (45.03 | ) | 77,465 | 2.19 | 2.20 | 0.63 | 38 | |||||||||||||||||||||||||||||||||||||
| Year ended 10/31/07 | 25.84 | 0.03 | 8.10 | 8.13 | — | (0.09 | ) | (0.09 | ) | 33.88 | 31.55 | 252,203 | 2.19 | 2.22 | 0.12 | 22 | ||||||||||||||||||||||||||||||||||||||||
| Class C | ||||||||||||||||||||||||||||||||||||||||||||||||||||||||
| Year ended 10/31/11 | 24.97 | 0.14 | (0.60 | ) | (0.46 | ) | (0.08 | ) | — | (0.08 | ) | 24.43 | (1.85 | ) | 145,944 | 2.13 | (e) | 2.14 | (e) | 0.54 | (e) | 25 | ||||||||||||||||||||||||||||||||||
| Year ended 10/31/10 | 21.70 | 0.02 | 3.40 | 3.42 | (0.15 | ) | — | (0.15 | ) | 24.97 | 15.81 | 142,898 | 2.18 | 2.19 | 0.10 | 25 | ||||||||||||||||||||||||||||||||||||||||
| Year ended 10/31/09 | 17.53 | 0.09 | 4.21 | 4.30 | (0.13 | ) | — | (0.13 | ) | 21.70 | 24.76 | 139,000 | 2.24 | 2.26 | 0.49 | 26 | ||||||||||||||||||||||||||||||||||||||||
| Year ended 10/31/08 | 33.91 | 0.17 | (14.71 | ) | (14.54 | ) | — | (1.84 | ) | (1.84 | ) | 17.53 | (45.05 | ) | 125,172 | 2.19 | 2.20 | 0.63 | 38 | |||||||||||||||||||||||||||||||||||||
| Year ended 10/31/07 | 25.86 | 0.03 | 8.11 | 8.14 | — | (0.09 | ) | (0.09 | ) | 33.91 | 31.57 | 274,266 | 2.19 | 2.22 | 0.12 | 22 | ||||||||||||||||||||||||||||||||||||||||
| Class R | ||||||||||||||||||||||||||||||||||||||||||||||||||||||||
| Year ended 10/31/11 | 26.70 | 0.28 | (0.64 | ) | (0.36 | ) | (0.21 | ) | — | (0.21 | ) | 26.13 | (1.38 | ) | 112,091 | 1.63 | (e) | 1.64 | (e) | 1.04 | (e) | 25 | ||||||||||||||||||||||||||||||||||
| Year ended 10/31/10 | 23.18 | 0.15 | 3.62 | 3.77 | (0.25 | ) | — | (0.25 | ) | 26.70 | 16.36 | 115,237 | 1.68 | 1.69 | 0.60 | 25 | ||||||||||||||||||||||||||||||||||||||||
| Year ended 10/31/09 | 18.80 | 0.20 | 4.49 | 4.69 | (0.31 | ) | — | (0.31 | ) | 23.18 | 25.44 | 63,544 | 1.74 | 1.76 | 0.99 | 26 | ||||||||||||||||||||||||||||||||||||||||
| Year ended 10/31/08 | 36.18 | 0.32 | (15.74 | ) | (15.42 | ) | (0.12 | ) | (1.84 | ) | (1.96 | ) | 18.80 | (44.78 | ) | 34,821 | 1.69 | 1.70 | 1.13 | 38 | ||||||||||||||||||||||||||||||||||||
| Year ended 10/31/07 | 27.58 | 0.20 | 8.63 | 8.83 | (0.14 | ) | (0.09 | ) | (0.23 | ) | 36.18 | 32.21 | 48,321 | 1.69 | 1.72 | 0.62 | 22 | |||||||||||||||||||||||||||||||||||||||
| Class Y | ||||||||||||||||||||||||||||||||||||||||||||||||||||||||
| Year ended 10/31/11 | 27.08 | 0.42 | (0.64 | ) | (0.22 | ) | (0.33 | ) | — | (0.33 | ) | 26.53 | (0.83 | ) | 741,428 | 1.13 | (e) | 1.14 | (e) | 1.54 | (e) | 25 | ||||||||||||||||||||||||||||||||||
| Year ended 10/31/10 | 23.48 | 0.27 | 3.67 | 3.94 | (0.34 | ) | — | (0.34 | ) | 27.08 | 16.94 | 173,313 | 1.18 | 1.19 | 1.10 | 25 | ||||||||||||||||||||||||||||||||||||||||
| Year ended 10/31/09 | 19.04 | 0.32 | 4.52 | 4.84 | (0.40 | ) | — | (0.40 | ) | 23.48 | 26.05 | 62,343 | 1.24 | 1.26 | 1.49 | 26 | ||||||||||||||||||||||||||||||||||||||||
| Year ended 10/31/08(f) | 22.36 | 0.02 | (3.34 | ) | (3.32 | ) | — | — | — | 19.04 | (14.85 | ) | 2,537 | 1.25 | (g) | 1.27 | (g) | 1.57 | (g) | 38 | ||||||||||||||||||||||||||||||||||||
| Institutional Class | ||||||||||||||||||||||||||||||||||||||||||||||||||||||||
| Year ended 10/31/11 | 27.41 | 0.48 | (0.66 | ) | (0.18 | ) | (0.37 | ) | — | (0.37 | ) | 26.86 | (0.68 | ) | 1,457,494 | 0.97 | (e) | 0.98 | (e) | 1.70 | (e) | 25 | ||||||||||||||||||||||||||||||||||
| Year ended 10/31/10 | 23.77 | 0.31 | 3.72 | 4.03 | (0.39 | ) | — | (0.39 | ) | 27.41 | 17.12 | 1,228,916 | 1.02 | 1.03 | 1.26 | 25 | ||||||||||||||||||||||||||||||||||||||||
| Year ended 10/31/09 | 19.36 | 0.35 | 4.58 | 4.93 | (0.52 | ) | — | (0.52 | ) | 23.77 | 26.32 | 917,297 | 1.01 | 1.03 | 1.72 | 26 | ||||||||||||||||||||||||||||||||||||||||
| Year ended 10/31/08 | 37.14 | 0.52 | (16.17 | ) | (15.65 | ) | (0.29 | ) | (1.84 | ) | (2.13 | ) | 19.36 | (44.38 | ) | 526,647 | 1.03 | 1.04 | 1.79 | 38 | ||||||||||||||||||||||||||||||||||||
| Year ended 10/31/07 | 28.26 | 0.42 | 8.84 | 9.26 | (0.29 | ) | (0.09 | ) | (0.38 | ) | 37.14 | 33.13 | 833,977 | 1.02 | 1.05 | 1.30 | 22 | |||||||||||||||||||||||||||||||||||||||
| (a) | Calculated using average shares outstanding. | |
| (b) | Includes redemption fees added to shares of beneficial interest which were less than $0.005 per share. | |
| (c) | Includes adjustments in accordance with accounting principles generally accepted in the United States of America and as such, the net asset value for financial reporting purposes and the returns based upon those net asset values may differ from the net asset value and returns for shareholder transactions. Does not include sales charges and is not annualized for periods less than one year, if applicable. | |
| (d) | Portfolio turnover is calculated at the fund level and is not annualized for periods less than one year, if applicable. For the year ended October 31, 2011, the portfolio turnover calculation excludes the value of securities purchased of $690,712,747 and sold of $131,009,072 in the effort to realign the Fund’s portfolio holdings after the reorganization of Invesco Van Kampen International Advantage Fund and Invesco Van Kampen International Growth Fund into the Fund. | |
| (e) | Ratios are based on average daily net assets (000’s) of $2,077,042, $56,019, $150,327, $118,843, $413,120 and $1,376,005 for Class A, Class B, Class C, Class R, Class Y and Institutional Class shares, respectively. | |
| (f) | Commencement date of October 3, 2008. | |
| (g) | Annualized. |
21 Invesco International Growth Fund
Report of Independent Registered Public Accounting Firm
To the Board of Trustees of AIM International Mutual Funds (Invesco International Mutual Funds)
and Shareholders of Invesco International Growth Fund:
In our opinion, the accompanying statement of assets and liabilities, including the schedule of investments, and the related statements of operations and of changes in net assets and the financial highlights present fairly, in all material respects, the financial position of Invesco International Growth Fund (one of the funds constituting AIM International Mutual Funds (Invesco International Mutual Funds), hereafter referred to as the “Fund”) at October 31, 2011, the results of its operations for the year then ended, the changes in its net assets for each of the two years in the period then ended and the financial highlights for each of the five years in the period then ended, in conformity with accounting principles generally accepted in the United States of America. These financial statements and financial highlights (hereafter referred to as “financial statements”) are the responsibility of the Fund’s management; our responsibility is to express an opinion on these financial statements based on our audits. We conducted our audits of these financial statements in accordance with the standards of the Public Company Accounting Oversight Board (United States). Those standards require that we plan and perform the audit to obtain reasonable assurance about whether the financial statements are free of material misstatement. An audit includes examining, on a test basis, evidence supporting the amounts and disclosures in the financial statements, assessing the accounting principles used and significant estimates made by management, and evaluating the overall financial statement presentation. We believe that our audits, which included confirmation of securities at October 31, 2011 by correspondence with the custodian and brokers, provide a reasonable basis for our opinion.
PRICEWATERHOUSECOOPERS LLP
December 21, 2011
Houston, Texas
22 Invesco International Growth Fund
Calculating your ongoing Fund expenses
Example
As a shareholder of the Fund, you incur two types of costs: (1) transaction costs, which may include sales charges (loads) on purchase payments or contingent deferred sales charges on redemptions, and redemption fees, if any; and (2) ongoing costs, including management fees, distribution and/or service (12b-1) fees, and other Fund expenses. This example is intended to help you understand your ongoing costs (in dollars) of investing in the Fund and to compare these costs with ongoing costs of investing in other mutual funds. The example is based on an investment of $1,000 invested at the beginning of the period and held for the entire period May 1, 2011 through October 31, 2011.
Actual expenses
The table below provides information about actual account values and actual expenses. You may use the information in this table, together with the amount you invested, to estimate the expenses that you paid over the period. Simply divide your account value by $1,000 (for example, an $8,600 account value divided by $1,000 = 8.6), then multiply the result by the number in the table under the heading entitled “Actual Expenses Paid During Period” to estimate the expenses you paid on your account during this period.
Hypothetical example for comparison purposes
The table below also provides information about hypothetical account values and hypothetical expenses based on the Fund’s actual expense ratio and an assumed rate of return of 5% per year before expenses, which is not the Fund’s actual return.
The hypothetical account values and expenses may not be used to estimate the actual ending account balance or expenses you paid for the period. You may use this information to compare the ongoing costs of investing in the Fund and other funds. To do so, compare this 5% hypothetical example with the 5% hypothetical examples that appear in the shareholder reports of the other funds.
Please note that the expenses shown in the table are meant to highlight your ongoing costs only and do not reflect any transaction costs, such as sales charges (loads) on purchase payments, contingent deferred sales charges on redemptions, and redemption fees, if any. Therefore, the hypothetical information is useful in comparing ongoing costs only, and will not help you determine the relative total costs of owning different funds. In addition, if these transaction costs were included, your costs would have been higher.
| HYPOTHETICAL | ||||||||||||||||||||||||||||||
| ACTUAL | (5% annual return before expenses) | |||||||||||||||||||||||||||||
| Beginning | Ending | Expenses | Ending | Expenses | Annualized | |||||||||||||||||||||||||
| Account Value | Account Value | Paid During | Account Value | Paid During | Expense | |||||||||||||||||||||||||
| Class | (05/01/11) | (10/31/11)1 | Period2 | (10/31/11) | Period2 | Ratio | ||||||||||||||||||||||||
| A | $ | 1,000.00 | $ | 876.30 | $ | 6.57 | $ | 1,018.20 | $ | 7.07 | 1.39 | % | ||||||||||||||||||
| B | 1,000.00 | 873.00 | 10.10 | 1,014.42 | 10.87 | 2.14 | ||||||||||||||||||||||||
| C | 1,000.00 | 873.10 | 10.10 | 1,014.42 | 10.87 | 2.14 | ||||||||||||||||||||||||
| R | 1,000.00 | 875.10 | 7.75 | 1,016.94 | 8.34 | 1.64 | ||||||||||||||||||||||||
| Y | 1,000.00 | 877.60 | 5.40 | 1,019.46 | 5.80 | 1.14 | ||||||||||||||||||||||||
| Institutional | 1,000.00 | 878.30 | 4.84 | 1,020.37 | 4.89 | 0.96 | ||||||||||||||||||||||||
| 1 | The actual ending account value is based on the actual total return of the Fund for the period May 1, 2011 through October 31, 2011, after actual expenses and will differ from the hypothetical ending account value which is based on the Fund’s expense ratio and a hypothetical annual return of 5% before expenses. |
| 2 | Expenses are equal to the Fund’s annualized expense ratio as indicated above multiplied by the average account value over the period, multiplied by 184/365 to reflect the most recent fiscal half year. |
23 Invesco International Growth Fund
Approval of Investment Advisory and Sub-Advisory Contracts
The Board of Trustees (the Board) of AIM International Mutual Funds (Invesco International Mutual Funds) is required under the Investment Company Act of 1940, as amended, to approve annually the renewal of the Invesco International Growth Fund (the Fund) investment advisory agreement with Invesco Advisers, Inc. (Invesco Advisers) and the Master Intergroup Sub-Advisory Contract for Mutual Funds (the sub-advisory contracts) with Invesco Asset Management Deutschland GmbH, Invesco Asset Management Limited, Invesco Asset Management (Japan) Limited, Invesco Australia Limited, Invesco Hong Kong Limited, Invesco Senior Secured Management, Inc. and Invesco Canada Ltd. (collectively, the Affiliated Sub-Advisers). During contract renewal meetings held on June 14-15, 2011, the Board as a whole, and the disinterested or “independent” Trustees, who comprise 80% of the Board, voting separately, approved the continuance of the Fund’s investment advisory agreement and the sub-advisory contracts for another year, effective July 1, 2011. In doing so, the Board considered the process that it follows in reviewing and approving the Fund’s investment advisory agreement and sub-advisory contracts and the information that it is provided. The Board determined that the Fund’s investment advisory agreement and the sub-advisory contracts are in the best interests of the Fund and its shareholders and the compensation to Invesco Advisers and the Affiliated Sub-Advisers under the agreements is fair and reasonable.
The Board’s Fund Evaluation Process
The Board’s Investments Committee has established three Sub-Committees, each of which is responsible for overseeing the management of a number of the series portfolios of the funds advised by Invesco Advisers (the Invesco Funds). The Sub-Committees meet throughout the year to review the performance of their assigned funds, including reviewing materials prepared under the direction of the independent Senior Officer, an officer of the Invesco Funds who reports directly to the independent Trustees. Over the course of each year, the Sub-Committees meet with portfolio managers for their assigned Invesco Funds and other members of management to review the performance, investment objective(s), policies, strategies and limitations and investment risks of these funds. The Sub-Committees meet regularly and at designated contract renewal meetings each year to conduct a review of the performance, fees, expenses and other matters related to their assigned Invesco Funds. Each Sub-Committee recommends to the Investments Committee, which in turn recommends to the full Board, whether to approve the continuance of each Invesco Fund’s investment advisory agreement and sub-advisory contracts for another year.
During the contract renewal process, the Trustees receive comparative performance and fee data regarding the Invesco Funds prepared by Invesco Advisers and an independent company, Lipper, Inc. (Lipper). The Trustees also receive an independent written evaluation from the Senior Officer. The Senior Officer’s evaluation is prepared as part of his responsibility to manage the process by which the Invesco Funds’ proposed management fees are negotiated during the annual contract renewal process to ensure they are negotiated in a manner that is at arms’ length and reasonable. The independent Trustees are assisted in their annual evaluation of the Fund’s investment advisory agreement by the Senior Officer and by independent legal counsel. The independent Trustees also discuss the continuance of the investment advisory agreement and sub-advisory contracts in private sessions with the Senior Officer and counsel.
In evaluating the fairness and reasonableness of the Fund’s investment advisory agreement and sub-advisory contracts, the Board considered, among other things, the factors discussed below. The Trustees also considered information provided in connection with fund acquisitions approved by the Trustees to rationalize the Invesco Funds product range following the acquisition of the retail mutual fund business of Morgan Stanley (the Morgan Stanley Transaction). The Trustees recognized that the advisory fees for the Invesco Funds include advisory fees that are the result of years of review and negotiation between the Trustees and Invesco Advisers as well as advisory fees inherited from Morgan Stanley and Van Kampen funds acquired in the Morgan Stanley Transaction. The Trustees’ deliberations and conclusions in a particular year may be based in part on their deliberations and conclusions regarding these same arrangements throughout the year and in prior years. One Trustee may have weighed a particular piece of information differently than another Trustee.
The discussion below serves as the Senior Officer’s independent written evaluation with respect to the Fund’s investment advisory agreement as well as a discussion of the material factors and related conclusions that formed the basis for the Board’s approval of the Fund’s investment advisory agreement and sub-advisory contracts. Unless otherwise stated, this information is current as of June 15, 2011, and may not reflect consideration of factors that became known to the Board after that date, including, for example, changes to the Fund’s performance, advisory fees, expense limitations and/or fee waivers.
Factors and Conclusions and Summary of Independent Written Fee Evaluation
| A. | Nature, Extent and Quality of Services Provided by Invesco Advisers and the Affiliated Sub-Advisers |
The Board reviewed the advisory services provided to the Fund by Invesco Advisers under the Fund’s investment advisory agreement, the performance of Invesco Advisers in providing these services, and the credentials and experience of the officers and employees of Invesco Advisers who provide these services, including the Fund’s portfolio manager or managers, with whom the Board met during the year. The Board’s review of the qualifications of Invesco Advisers to provide advisory services included the Board’s consideration of Invesco Advisers’ performance and investment process oversight, independent credit analysis and investment risk management.
In determining whether to continue the Fund’s investment advisory agreement, the Board considered the prior relationship between Invesco Advisers and the Fund, as well as the Board’s knowledge of Invesco Advisers’ operations, and concluded that it is beneficial to maintain the current relationship, in part, because of such knowledge. The Board also considered services that Invesco Advisers and its affiliates provide to the Invesco Funds such as various back office support functions, equity and fixed income trading operations, internal audit, distribution and legal and compliance. The Board concluded that the nature, extent and quality of the services provided to the Fund by Invesco Advisers are appropriate and satisfactory and the advisory services are provided in accordance with the terms of the Fund’s investment advisory agreement.
The Board reviewed the services provided by the Affiliated Sub-Advisers under the sub-advisory contracts and the credentials and experience of the officers and employees of the Affiliated Sub-Advisers who provide these services. The Board noted that the Affiliated Sub-Advisers have offices and personnel that are located in financial centers around the world. As a result, the Affiliated Sub-Advisers can provide research and investment analysis on the markets and economies of various countries in which the Fund invests and make recommendations on securities of companies located in such countries. The Board concluded that the sub-advisory contracts benefit the Fund and its shareholders by permitting Invesco Advisers to use the resources and talents of the Affiliated Sub-Advisers in managing the Fund. The Board concluded that the nature, extent and quality of the services provided by the Affiliated Sub-Advisers are appropriate and satisfactory and in accordance with the terms of the Fund’s sub-advisory contracts.
| B. | Fund Performance |
The Board considered Fund performance as a relevant factor in considering whether to approve the investment advisory agreement. The Board did not view Fund performance as a relevant factor in considering whether to approve the sub-advisory contracts for the Fund, as no Affiliated Sub-Adviser currently manages assets of the Fund.
The Board compared the Fund’s performance during the past one, three and five calendar years to the performance of funds in the Lipper performance universe and against the Lipper International Large-Cap Growth Funds Index and the Lipper International Multi-Cap Growth Funds Index. The Board noted that performance of Class A shares of the Fund was in the fourth quintile of the performance universe for the one year period and the second quintile for the three and five year periods (the first quintile being the best performing funds and the fifth quintile being the worst
24 Invesco International Growth Fund
performing funds). The Board noted that performance of Class A shares of the Fund was below the performance of each Index for the one year period and above the performance of each Index for the three and five year periods. Although the independent written evaluation of the Fund’s Senior Officer only considered Fund performance through the most recent calendar year, the Trustees also reviewed more recent Fund performance and this review did not change their conclusions.
| C. | Advisory and Sub-Advisory Fees and Fee Waivers |
The Board compared the Fund’s contractual advisory fee rate to the contractual advisory fee rates of funds in the Fund’s Lipper expense group at a common asset level. The Board noted that the contractual advisory fee rate for Class A shares of the Fund was above the median contractual advisory fee rate of funds in the expense group. The Board also reviewed the methodology used by Lipper in providing expense group information, which includes using audited financial data from the most recent annual report of each fund in the expense group that was publicly available as of the end of the past calendar year and including only one fund per investment adviser. The Board noted that comparative data is as of varying dates, which may affect the comparability of data during times of market volatility.
The Board also compared the Fund’s effective fee rate (the advisory fee after any advisory fee waivers and before any expense limitations/waivers) to the advisory fee rates of other mutual funds advised by Invesco Advisers and its affiliates with investment strategies comparable to those of the Fund. The Board noted that the Fund’s effective fee rate was higher than the effective fee rate of the other mutual fund advised by Invesco Advisers with comparable investment strategies. The Board also noted that Invesco Advisers sub-advises other mutual funds with investment strategies similar to the Fund and that the sub-advisory fees are below the advisory fee of the Fund.
Other than the mutual funds described above, the Board noted that Invesco Advisers and the Affiliated Sub-Advisers do not manage other mutual funds or client accounts in a manner substantially similar to the management of the Fund.
The Board also considered the fees charged by Invesco Advisers and the Affiliated Sub-Advisers to other client accounts with investment strategies similar to those of the Fund. The Board noted that Invesco Advisers or the Affiliated Sub-Advisers may charge lower fees to large institutional clients solely for investment management services. Invesco Advisers reviewed with the Board the significantly greater scope of services it provides to the Invesco Funds relative to other client accounts. These additional services include provision of administrative services, officers and office space, oversight of service providers, preparation of annual registration statement updates and financial information and regulatory compliance under the Investment Company Act of 1940, as amended. Invesco Advisers also reviewed generally the higher frequency of shareholder purchases and redemptions in the Invesco Funds relative to the flow of assets for other client accounts. Invesco Advisers advised the Board that advance notice of redemptions is often provided to Invesco Advisers by institutional clients. The Board did note that sub-advisory fees charged by the Affiliated Sub-Advisers to manage the Invesco Funds and to manage other client accounts were often more comparable. The Board concluded that the aggregate services provided to the Invesco Funds were sufficiently different from those provided to institutional clients, and the Board did not place significant weight on these fee comparisons.
The Board noted that Invesco Advisers has contractually agreed to waive fees and/or limit expenses of the Fund through at least June 30, 2013 in an amount necessary to limit total annual operating expenses to a specified percentage of average daily net assets for each class of the Fund. The Board noted that at the current expense ratio for the Fund, this expense waiver does not have any impact.
The Board also considered the services provided by the Affiliated Sub-Advisers pursuant to the sub-advisory contracts, as well as the allocation of fees between Invesco Advisers and the Affiliated Sub-Advisers pursuant to the sub-advisory contracts. The Board noted that Invesco Advisers provides services to sub-advised Invesco Funds, including oversight of the Affiliated Sub-Advisers as well as the additional services described above other than day-to-day portfolio management. The Board also noted that the sub-advisory fees have no direct effect on the Fund or its shareholders, as they are paid by Invesco Advisers to the Affiliated Sub-Advisers.
Based upon the information and considerations described above, the Board concluded that the Fund’s advisory and sub-advisory fees are fair and reasonable.
| D. | Economies of Scale and Breakpoints |
The Board considered the extent to which there are economies of scale in the provision of advisory services to the Fund. The Board also considered whether the Fund benefits from economies of scale through contractual breakpoints in the Fund’s advisory fee schedule. The Board also noted that the Fund shares directly in economies of scale through lower fees charged by third party service providers based on the combined size of the Invesco Funds and other clients advised by Invesco Advisers.
| E. | Profitability and Financial Resources |
The Board reviewed information from Invesco Advisers concerning the costs of the advisory and other services that Invesco Advisers and its affiliates provide to the Fund and the profitability of Invesco Advisers and its affiliates in providing these services. The Board reviewed with Invesco Advisers the methodology used to prepare the profitability information. The Board considered the profitability of Invesco Advisers in connection with managing the Fund and the Invesco Funds. The Board noted that Invesco Advisers continues to operate at a net profit from services Invesco Advisers and its subsidiaries provide to the Fund and the Invesco Funds. The Board concluded that the level of profits realized by Invesco Advisers and its affiliates from providing services to the Fund is not excessive given the nature, quality and extent of the services provided to the Invesco Funds. The Board considered whether Invesco Advisers and each Affiliated Sub-Adviser are financially sound and have the resources necessary to perform their obligations under the investment advisory agreement and sub-advisory contracts. The Board concluded that Invesco Advisers and each Affiliated Sub-Adviser have the financial resources necessary to fulfill these obligations.
| F. | Collateral Benefits to Invesco Advisers and its Affiliates |
The Board considered various other benefits received by Invesco Advisers and its affiliates from the relationship with the Fund, including the fees received for their provision of administrative, transfer agency and distribution services to the Fund. The Board considered the performance of Invesco Advisers and its affiliates in providing these services and the organizational structure employed to provide these services. The Board also considered that these services are provided to the Fund pursuant to written contracts that are reviewed and approved on an annual basis by the Board; that the services are required for the operation of the Fund; that Invesco Advisers and its affiliates can provide services, the nature and quality of which are at least equal to those provided by others offering the same or similar services; and that the fees for such services are fair and reasonable in light of the usual and customary charges by others for services of the same nature and quality.
The Board considered the benefits realized by Invesco Advisers and the Affiliated Sub-Advisers as a result of portfolio brokerage transactions executed through “soft dollar” arrangements. The Board noted that soft dollar arrangements shift the payment obligation for research and execution services from Invesco Advisers and the Affiliated Sub-Advisers to the Invesco Funds and therefore may reduce Invesco Advisers’ and the Affiliated Sub-Advisers’ expenses. The Board concluded that the soft dollar arrangements are appropriate. The Board also concluded that, based on their review and representations made by the Chief Compliance Officer of the Invesco Funds, these arrangements are consistent with regulatory requirements.
The Board considered that the Fund’s uninvested cash and cash collateral from any securities lending arrangements may be invested in money market funds advised by Invesco Advisers pursuant to procedures approved by the Board. The Board noted that Invesco Advisers receives advisory fees from these affiliated money market funds attributable to such investments, although Invesco Advisers has contractually agreed to waive through varying periods the advisory fees payable by the Invesco Funds. The waiver is in an amount equal to 100% of the net advisory fee Invesco Advisers receives from the affiliated money market funds with respect to the Fund’s investment in the affiliated money market funds of uninvested cash, but not cash collateral. The Board concluded that the Fund’s investment of uninvested cash and cash collateral from any securities lending arrangements in the affiliated money market funds is in the best interests of the Fund and its shareholders.
25 Invesco International Growth Fund
Tax Information
Form 1099-DIV, Form 1042-S and other year-end tax information provide shareholders with actual calendar year amounts that should be included in their tax returns. Shareholders should consult their tax advisors.
The following distribution information is being provided as required by the Internal Revenue Code or to meet a specific state’s requirement.
The Fund designates the following amounts or, if subsequently determined to be different, the maximum amount allowable for its fiscal year ended October 31, 2011:
Federal and State Income Tax | ||||
| Qualified Dividend Income* | 100% | |||
| Corporate Dividends Received Deduction* | 0% | |||
| Foreign Tax Credit | $ | 0.0474 per share | ||
| Foreign Source Income | $ | 0.6896 per share | ||
| * | The above percentages are based on ordinary income dividends paid to shareholders during the Fund’s fiscal year. |
26 Invesco International Growth Fund
Trustees and Officers
The address of each trustee and officer is AIM International Mutual Funds (Invesco International Mutual Funds) (the “Trust”), 11 Greenway Plaza, Suite 2500, Houston, Texas 77046-1173. The trustees serve for the life of the Trust, subject to their earlier death, incapacitation, resignation, retirement or removal as more specifically provided in the Trust’s organizational documents. Each officer serves for a one year term or until their successors are elected and qualified. Column two below includes length of time served with predecessor entities, if any.
| Number of | ||||||||
| Funds in | ||||||||
| Fund Complex | ||||||||
| Name, Year of Birth and | Trustee and/ | Principal Occupation(s) | Overseen by | Other Directorship(s) | ||||
| Position(s) Held with the Trust | or Officer Since | During Past 5 Years | Trustee | Held by Trustee | ||||
| Interested Persons | ||||||||
Martin L. Flanagan1 — 1960 Trustee | 2007 | Executive Director, Chief Executive Officer and President, Invesco Ltd. (ultimate parent of Invesco and a global investment management firm); Advisor to the Board, Invesco Advisers, Inc. (formerly known as Invesco Institutional (N.A.), Inc.); Trustee, The Invesco Funds; Vice Chair, Investment Company Institute; and Member of Executive Board, SMU Cox School of Business | 141 | None | ||||
| Formerly: Chairman, Invesco Advisers, Inc. (registered investment adviser); Director, Chairman, Chief Executive Officer and President, IVZ Inc. (holding company), INVESCO Group Services, Inc. (service provider) and Invesco North American Holdings, Inc. (holding company); Director, Chief Executive Officer and President, Invesco Holding Company Limited (parent of Invesco and a global investment management firm); Director, Invesco Ltd.; Chairman, Investment Company Institute and President, Co-Chief Executive Officer, Co-President, Chief Operating Officer and Chief Financial Officer, Franklin Resources, Inc. (global investment management organization) | ||||||||
Philip A. Taylor2 — 1954 Trustee, President and Principal Executive Officer | 2006 | Head of North American Retail and Senior Managing Director, Invesco Ltd.; Director, Co-Chairman, Co-President and Co-Chief Executive Officer, Invesco Advisers, Inc. (formerly known as Invesco Institutional (N.A.), Inc.) (registered investment adviser); Director, Chairman, Chief Executive Officer and President, Invesco Management Group, Inc. (formerly Invesco Aim Management Group, Inc.) (financial services holding company); Director and President, INVESCO Funds Group, Inc. (registered investment adviser and registered transfer agent); Director and Chairman, Invesco Investment Services, Inc. (formerly known as Invesco Aim Investment Services, Inc.) (registered transfer agent) and IVZ Distributors, Inc. (formerly known as INVESCO Distributors, Inc.) (registered broker dealer); Director, President and Chairman, Invesco Inc. (holding company) and Invesco Canada Holdings Inc. (holding company); Chief Executive Officer, Invesco Corporate Class Inc. (corporate mutual fund company) and Invesco Canada Fund Inc. (corporate mutual fund company); Director, Chairman and Chief Executive Officer, Invesco Canada Ltd. (formerly known as Invesco Trimark Ltd./Invesco Trimark Ltèe) (registered investment adviser and registered transfer agent); Trustee, President and Principal Executive Officer, The Invesco Funds (other than AIM Treasurer’s Series Trust (Invesco Treasurer’s Series Trust) and Short-Term Investments Trust); Trustee and Executive Vice President, The Invesco Funds (AIM Treasurer’s Series Trust (Invesco Treasurer’s Series Trust) and Short-Term Investments Trust only); Director, Invesco Investment Advisers LLC (formerly known as Van Kampen Asset Management); Director, Chief Executive Officer and President, Van Kampen Exchange Corp. | 141 | None | ||||
| Formerly: Director and Chairman, Van Kampen Investor Services Inc.: | ||||||||
| Director, Chief Executive Officer and President, 1371 Preferred Inc. (holding company); and Van Kampen Investments Inc.; Director and President, AIM GP Canada Inc. (general partner for limited partnerships); and Van Kampen Advisors, Inc.; Director and Chief Executive Officer, Invesco Trimark Dealer Inc. (registered broker dealer); Director, Invesco Distributors, Inc. (formerly known as Invesco Aim Distributors, Inc.) (registered broker dealer); Manager, Invesco PowerShares Capital Management LLC; Director, Chief Executive Officer and President, Invesco Advisers, Inc.; Director, Chairman, Chief Executive Officer and President, Invesco Aim Capital Management, Inc.; President, Invesco Trimark Dealer Inc. and Invesco Trimark Ltd./Invesco Trimark Ltèe; Director and President, AIM Trimark Corporate Class Inc. and AIM Trimark Canada Fund Inc.; Senior Managing Director, Invesco Holding Company Limited; Trustee and Executive Vice President, Tax-Free Investments Trust; Director and Chairman, Fund Management Company (former registered broker dealer); President and Principal Executive Officer, The Invesco Funds (AIM Treasurer’s Series Trust (Invesco Treasurer’s Series Trust), Short-Term Investments Trust and Tax-Free Investments Trust only); President, AIM Trimark Global Fund Inc. and AIM Trimark Canada Fund Inc. | ||||||||
Wayne W. Whalen3 — 1939 Trustee | 2010 | Of Counsel, and prior to 2010, partner in the law firm of Skadden, Arps, Slate, Meagher & Flom LLP, legal counsel to funds in the Fund Complex | 159 | Director of the Abraham Lincoln Presidential Library Foundation | ||||
| Independent Trustees | ||||||||
| Bruce L. Crockett — 1944 Trustee and Chair | 1992 | Chairman, Crockett Technology Associates (technology consulting company) Formerly: Director, Captaris (unified messaging provider); Director, President and Chief Executive Officer COMSAT Corporation; and Chairman, Board of Governors of INTELSAT (international communications company) | 141 | ACE Limited (insurance company); and Investment Company Institute | ||||
| David C. Arch — 1945 Trustee | 2010 | Chairman and Chief Executive Officer of Blistex Inc., a consumer health care products manufacturer. | 159 | Member of the Heartland Alliance Advisory Board, a nonprofit organization serving human needs based in Chicago. Board member of the Illinois Manufacturers’ Association. Member of the Board of Visitors, Institute for the Humanities, University of Michigan | ||||
| 1 | Mr. Flanagan is considered an interested person of the Trust because he is an officer of the adviser to the Trust, and an officer and a director of Invesco Ltd., ultimate parent of the adviser to the Trust. |
| 2 | Mr. Taylor is considered an interested person of the Trust because he is an officer and a director of the adviser to, and a director of the principal underwriter of, the Trust. |
| 3 | Mr. Whalen has been deemed to be an interested person of the Trust because of his prior service as counsel to the predecessor funds of certain Invesco open-end funds and his affiliation with the law firm that served as counsel to such predecessor funds and continues to serve as counsel to the Invesco Van Kampen closed-end funds. |
T-1 Invesco International Growth Fund
Trustees and Officers—(continued)
The address of each trustee and officer is AIM International Mutual Funds (Invesco International Mutual Funds) (the “Trust”), 11 Greenway Plaza, Suite 2500, Houston, Texas 77046-1173. The trustees serve for the life of the Trust, subject to their earlier death, incapacitation, resignation, retirement or removal as more specifically provided in the Trust’s organizational documents. Each officer serves for a one year term or until their successors are elected and qualified. Column two below includes length of time served with predecessor entities, if any.
| Number of | ||||||||
| Funds in | ||||||||
| Fund Complex | ||||||||
| Name, Year of Birth and | Trustee and/ | Principal Occupation(s) | Overseen by | Other Directorship(s) | ||||
| Position(s) Held with the Trust | or Officer Since | During Past 5 Years | Trustee | Held by Trustee | ||||
| Independent Trustees—(continued) | ||||||||
| Bob R. Baker — 1936 Trustee | 2003 | Retired Formerly: President and Chief Executive Officer, AMC Cancer Research Center; and Chairman and Chief Executive Officer, First Columbia Financial Corporation | 141 | None | ||||
| Frank S. Bayley — 1939 Trustee | 2001 | Retired Formerly: Director, Badgley Funds, Inc. (registered investment company) (2 portfolios) and Partner, law firm of Baker & McKenzie | 141 | Director and Chairman, C.D. Stimson Company (a real estate investment company) | ||||
| James T. Bunch — 1942 Trustee | 2003 | Founder, Green, Manning & Bunch Ltd. (investment banking firm) Formerly: Executive Committee, United States Golf Association; and Director, Policy Studies, Inc. and Van Gilder Insurance Corporation | 141 | Vice Chairman, Board of Governors, Western Golf Association/Evans Scholars Foundation and Director, Denver Film Society | ||||
| Rodney F. Dammeyer — 1940 Trustee | 2010 | President of CAC, LLC, a private company offering capital investment and management advisory services. Formerly: Prior to January 2004, Director of TeleTech Holdings Inc.; Prior to 2002, Director of Arris Group, Inc.; Prior to 2001, Managing Partner at Equity Group Corporate Investments. Prior to 1995, Vice Chairman of Anixter International. Prior to 1985, experience includes Senior Vice President and Chief Financial Officer of Household International, Inc, Executive Vice President and Chief Financial Officer of Northwest Industries, Inc. and Partner of Arthur Andersen & Co. | 159 | Director of Quidel Corporation and Stericycle, Inc. Prior to May 2008, Trustee of The Scripps Research Institute. Prior to February 2008, Director of Ventana Medical Systems, Inc. Prior to April 2007, Director of GATX Corporation. Prior to April 2004, Director of TheraSense, Inc. | ||||
| Albert R. Dowden — 1941 Trustee | 2000 | Director of a number of public and private business corporations, including the Boss Group, Ltd. (private investment and management); Reich & Tang Funds (5 portfolios) (registered investment company); and Homeowners of America Holding Corporation/ Homeowners of America Insurance Company (property casualty company) Formerly: Director, Continental Energy Services, LLC (oil and gas pipeline service); Director, CompuDyne Corporation (provider of product and services to the public security market) and Director, Annuity and Life Re (Holdings), Ltd. (reinsurance company); Director, President and Chief Executive Officer, Volvo Group North America, Inc.; Senior Vice President, AB Volvo; Director of various public and private corporations; Chairman, DHJ Media, Inc.; Director Magellan Insurance Company; and Director, The Hertz Corporation, Genmar Corporation (boat manufacturer), National Media Corporation; Advisory Board of Rotary Power International (designer, manufacturer, and seller of rotary power engines); and Chairman, Cortland Trust, Inc. (registered investment company) | 141 | Board of Nature’s Sunshine Products, Inc. | ||||
| Jack M. Fields — 1952 Trustee | 1997 | Chief Executive Officer, Twenty First Century Group, Inc. (government affairs company); and Owner and Chief Executive Officer, Dos Angelos Ranch, L.P. (cattle, hunting, corporate entertainment), Discovery Global Education Fund (non-profit) and Cross Timbers Quail Research Ranch (non-profit) Formerly: Chief Executive Officer, Texana Timber LP (sustainable forestry company) and member of the U.S. House of Representatives | 141 | Administaff | ||||
| Carl Frischling — 1937 Trustee | 1991 | Partner, law firm of Kramer Levin Naftalis and Frankel LLP | 141 | Director, Reich & Tang Funds (6 portfolios) | ||||
| Prema Mathai-Davis — 1950 Trustee | 1998 | Retired Formerly: Chief Executive Officer, YWCA of the U.S.A. | 141 | None | ||||
| Larry Soll — 1942 Trustee | 2003 | Retired Formerly, Chairman, Chief Executive Officer and President, Synergen Corp. (a biotechnology company) | 141 | None | ||||
| Hugo F. Sonnenschein — 1940 Trustee | 2010 | President Emeritus and Honorary Trustee of the University of Chicago and the Adam Smith Distinguished Service Professor in the Department of Economics at the University of Chicago. Prior to July 2000, President of the University of Chicago. | 159 | Trustee of the University of Rochester and a member of its investment committee. Member of the National Academy of Sciences, the American Philosophical Society and a fellow of the American Academy of Arts and Sciences | ||||
| Raymond Stickel, Jr. — 1944 Trustee | 2005 | Retired | 141 | Director of Long Cove Club Owners’ association (home owner’s association) | ||||
| Formerly: Director, Mainstay VP Series Funds, Inc. (25 portfolios) and Partner, Deloitte & Touche | ||||||||
T-2 Invesco International Growth Fund
Trustees and Officers—(continued)
The address of each trustee and officer is AIM International Mutual Funds (Invesco International Mutual Funds) (the “Trust”), 11 Greenway Plaza, Suite 2500, Houston, Texas 77046-1173. The trustees serve for the life of the Trust, subject to their earlier death, incapacitation, resignation, retirement or removal as more specifically provided in the Trust’s organizational documents. Each officer serves for a one year term or until their successors are elected and qualified. Column two below includes length of time served with predecessor entities, if any.
| Number of | ||||||||
| Funds in | ||||||||
| Fund Complex | ||||||||
| Name, Year of Birth and | Trustee and/ | Principal Occupation(s) | Overseen by | Other Directorship(s) | ||||
| Position(s) Held with the Trust | or Officer Since | During Past 5 Years | Trustee | Held by Trustee | ||||
| Other Officers | ||||||||
| Russell C. Burk — 1958 Senior Vice President and Senior Officer | 2005 | Senior Vice President and Senior Officer of Invesco Funds | N/A | N/A | ||||
| John M. Zerr — 1962 Senior Vice President, Chief Legal Officer and Secretary | 2006 | Director, Senior Vice President, Secretary and General Counsel, Invesco Management Group, Inc. (formerly known as Invesco Aim Management Group, Inc.) and Van Kampen Exchange Corp.; Senior Vice President, Invesco Advisers, Inc. (formerly known as Invesco Institutional (N.A.), Inc.) (registered investment adviser); Senior Vice President and Secretary, Invesco Distributors, Inc. (formerly known as Invesco Aim Distributors, Inc.); Director, Vice President and Secretary, Invesco Investment Services, Inc. (formerly known as Invesco Aim Investment Services, Inc.) and IVZ Distributors, Inc. (formerly known as INVESCO Distributors, Inc.); Director and Vice President, INVESCO Funds Group, Inc.; Senior Vice President, Chief Legal Officer and Secretary, The Invesco Funds; Manager, Invesco PowerShares Capital Management LLC; Director, Secretary and General Counsel, Invesco Investment Advisers LLC (formerly known as Van Kampen Asset Management); Secretary and General Counsel, Van Kampen Funds Inc. and Chief Legal Officer, PowerShares Exchange-Traded Fund Trust, PowerShares Exchange-Traded Fund Trust II, PowerShares India Exchange-Traded Fund Trust and PowerShares Actively Managed Exchange-Traded Fund Trust Formerly: Director and Secretary, Van Kampen Advisors Inc.; Director Vice President, Secretary and General Counsel Van Kampen Investor Services Inc.; Director, Invesco Distributors, Inc. (formerly known as Invesco Aim Distributors, Inc.); Director, Senior Vice President, General Counsel and Secretary, Invesco Advisers, Inc.; and Van Kampen Investments Inc.; Director, Vice President and Secretary, Fund Management Company; Director, Senior Vice President, Secretary, General Counsel and Vice President, Invesco Aim Capital Management, Inc.; Chief Operating Officer and General Counsel, Liberty Ridge Capital, Inc. (an investment adviser); Vice President and Secretary, PBHG Funds (an investment company) and PBHG Insurance Series Fund (an investment company); Chief Operating Officer, General Counsel and Secretary, Old Mutual Investment Partners (a broker-dealer); General Counsel and Secretary, Old Mutual Fund Services (an administrator) and Old Mutual Shareholder Services (a shareholder servicing center); Executive Vice President, General Counsel and Secretary, Old Mutual Capital, Inc. (an investment adviser); and Vice President and Secretary, Old Mutual Advisors Funds (an investment company) | N/A | N/A | ||||
| Lisa O. Brinkley — 1959 Vice President | 2004 | Global Compliance Director, Invesco Ltd.; Chief Compliance Officer, Invesco Investment Services, Inc.(formerly known as Invesco Aim Investment Services, Inc.); and Vice President, The Invesco Funds Formerly: Chief Compliance Officer, Invesco Distributors, Inc. (formerly known as Invesco Aim Distributors, Inc.) and Van Kampen Investor Services Inc.; Senior Vice President, Invesco Management Group, Inc.; Senior Vice President and Chief Compliance Officer, Invesco Advisers, Inc. and The Invesco Funds; Vice President and Chief Compliance Officer, Invesco Aim Capital Management, Inc. and Invesco Distributors, Inc.; Vice President, Invesco Investment Services, Inc. and Fund Management Company | N/A | N/A | ||||
| Sheri Morris — 1964 Vice President, Treasurer and Principal Financial Officer | 1999 | Vice President, Treasurer and Principal Financial Officer, The Invesco Funds; and Vice President, Invesco Advisers, Inc. (formerly known as Invesco Institutional (N.A.), Inc.) (registered investment adviser). | N/A | N/A | ||||
| Formerly: Treasurer, PowerShares Exchange-Traded Fund Trust, PowerShares Exchange-Traded Fund Trust II, PowerShares India Exchange-Traded Fund Trust and PowerShares Actively Managed Exchange-Traded Fund Trust; Vice President, Invesco Advisers, Inc., Invesco Aim Capital Management, Inc. and Invesco Aim Private Asset Management, Inc.; Assistant Vice President and Assistant Treasurer, The Invesco Funds and Assistant Vice President, Invesco Advisers, Inc., Invesco Aim Capital Management, Inc. and Invesco Aim Private Asset Management, Inc. | ||||||||
T-3 Invesco International Growth Fund
Trustees and Officers—(continued)
The address of each trustee and officer is AIM International Mutual Funds (Invesco International Mutual Funds) (the “Trust”), 11 Greenway Plaza, Suite 2500, Houston, Texas 77046-1173. The trustees serve for the life of the Trust, subject to their earlier death, incapacitation, resignation, retirement or removal as more specifically provided in the Trust’s organizational documents. Each officer serves for a one year term or until their successors are elected and qualified. Column two below includes length of time served with predecessor entities, if any.
| Number of | ||||||||
| Funds in | ||||||||
| Fund Complex | ||||||||
| Name, Year of Birth and | Trustee and/ | Principal Occupation(s) | Overseen by | Other Directorship(s) | ||||
| Position(s) Held with the Trust | or Officer Since | During Past 5 Years | Trustee | Held by Trustee | ||||
| Other Officers—(continued) | ||||||||
| Karen Dunn Kelley — 1960 Vice President | 2004 | Head of Invesco’s World Wide Fixed Income and Cash Management Group; Senior Vice President, Invesco Advisers, Inc. (formerly known as Invesco Institutional (N.A.), Inc.) (registered investment adviser); Executive Vice President, Invesco Distributors, Inc. (formerly known as Invesco Aim Distributors, Inc.); Senior Vice President, Invesco Management Group, Inc. (formerly known as Invesco Aim Management Group, Inc.); and Director, Invesco Mortgage Capital Inc.; Vice President, The Invesco Funds (other than AIM Treasurer’s Series Trust (Invesco Treasurer’s Series Trust) and Short-Term Investments Trust); President and Principal Executive Officer, The Invesco Funds (AIM Treasurer’s Series Trust (Invesco Treasurer’s Series Trust) and Short-Term Investments Trust only). Formerly: Senior Vice President, Van Kampen Investments Inc.; Vice President, Invesco Advisers, Inc. (formerly known as Invesco Institutional (N.A.), Inc.); Director of Cash Management and Senior Vice President, Invesco Advisers, Inc. and Invesco Aim Capital Management, Inc.; President and Principal Executive Officer, Tax-Free Investments Trust; Director and President, Fund Management Company; Chief Cash Management Officer, Director of Cash Management, Senior Vice President, and Managing Director, Invesco Aim Capital Management, Inc.; Director of Cash Management, Senior Vice President, and Vice President, Invesco Advisers, Inc. and The Invesco Funds (AIM Treasurer’s Series Trust (Invesco Treasurer’s Series Trust), Short-Term Investments Trust and Tax-Free Investments Trust only) | N/A | N/A | ||||
| Lance A. Rejsek — 1967 Anti-Money Laundering Compliance Officer | 2005 | Anti-Money Laundering Compliance Officer, Invesco Advisers, Inc. (formerly known as Invesco Institutional (N.A.), Inc.) (registered investment adviser); Invesco Distributors, Inc. (formerly known as Invesco Aim Distributors, Inc.), Invesco Investment Services, Inc. (formerly known as Invesco Aim Investment Services, Inc.), The Invesco Funds, PowerShares Exchange-Traded Fund Trust, PowerShares Exchange-Traded Fund Trust II, PowerShares India Exchange-Traded Fund Trust, PowerShares Actively Managed Exchange-Traded Fund Trust, Invesco Investment Advisers LLC (formerly known as Van Kampen Asset Management) and Van Kampen Funds Inc. Formerly: Anti-Money Laundering Compliance Officer, Van Kampen Investor Services Inc., Fund Management Company, Invesco Advisers, Inc., Invesco Aim Capital Management, Inc. and Invesco Aim Private Asset Management, Inc. | N/A | N/A | ||||
| Todd L. Spillane — 1958 Chief Compliance Officer | 2006 | Senior Vice President, Invesco Management Group, Inc. (formerly known as Invesco Aim Management Group, Inc.) and Van Kampen Exchange Corp.; Senior Vice President and Chief Compliance Officer, Invesco Advisers, Inc. (registered investment adviser) (formerly known as Invesco Institutional (N.A.), Inc.); Chief Compliance Officer, The Invesco Funds, PowerShares Exchange-Traded Fund Trust, PowerShares Exchange-Traded Fund Trust II, PowerShares India Exchange-Traded Fund Trust, PowerShares Actively Managed Exchange-Traded Fund Trust, INVESCO Private Capital Investments, Inc. (holding company) and Invesco Private Capital, Inc. (registered investment adviser); Vice President, Invesco Distributors, Inc. (formerly known as Invesco Aim Distributors, Inc.) and Invesco Investment Services, Inc. (formerly known as Invesco Aim Investment Services, Inc.). | N/A | N/A | ||||
| Formerly: Chief Compliance Officer, Invesco Van Kampen Closed-End Funds; Senior Vice President, Van Kampen Investments Inc.; Senior Vice President and Chief Compliance Officer, Invesco Advisers, Inc. and Invesco Aim Capital Management, Inc.; Chief Compliance Officer, Invesco Global Asset Management (N.A.), Inc., Invesco Senior Secured Management, Inc. (registered investment adviser) and Van Kampen Investor Services Inc.; Vice President, Invesco Aim Capital Management, Inc. and Fund Management Company | ||||||||
The Statement of Additional Information of the Trust includes additional information about the Fund’s Trustees and is available upon request, without charge, by calling 1.800.959.4246. Please refer to the Fund’s prospectus for information on the Fund’s sub-advisers.
| Office of the Fund 11 Greenway Plaza, Suite 2500 Houston, TX 77046-1173 | Investment Adviser Invesco Advisers, Inc. 1555 Peachtree Street, N.E. Atlanta, GA 30309 | Distributor Invesco Distributors, Inc. 11 Greenway Plaza, Suite 2500 Houston, TX 77046-1173 | Auditors PricewaterhouseCoopers LLP 1201 Louisiana Street, Suite 2900 Houston, TX 77002-5678 | |||
| Counsel to the Fund Stradley Ronon Stevens & Young, LLP 2600 One Commerce Square Philadelphia, PA 19103 | Counsel to the Independent Trustees Kramer, Levin, Naftalis & Frankel LLP 1177 Avenue of the Americas New York, NY 10036-2714 | Transfer Agent Invesco Investment Services, Inc. 11 Greenway Plaza, Suite 2500 Houston, TX 77046-1173 | Custodian State Street Bank and Trust Company 225 Franklin Boston, MA 02110-2801 |
T-4 Invesco International Growth Fund

Invesco mailing information
Send general correspondence to Invesco Investment Services, Inc., P.O. Box 219078, Kansas City, MO 64121-9078.
Invesco privacy policy
You share personal and financial information with us that is necessary for your transactions and your account records. We take very seriously the obligation to keep that information confidential and private.
Invesco collects nonpublic personal information about you from account applications or other forms you complete and from your transactions with us or our affiliates. We do not disclose information about you or our former customers to service providers or other third parties except to the extent necessary to service your account and in other limited circumstances as permitted by law. For example, we use this information to facilitate the delivery of transaction confirmations, financial reports, prospectuses and tax forms.
Even within Invesco, only people involved in the servicing of your accounts and compliance monitoring have access to your information. To ensure the highest level of confidentiality and security, Invesco maintains physical, electronic and procedural safeguards that meet or exceed federal standards. Special measures, such as data encryption and authentication, apply to your communications with us on our website. More detail is available to you at invesco.com/privacy.
Important notice regarding delivery of security holder documents
To reduce Fund expenses, only one copy of most shareholder documents may be mailed to shareholders with multiple accounts at the same address (Householding). Mailing of your shareholder documents may be householded indefinitely unless you instruct us otherwise. If you do not want the mailing of these documents to be combined with those for other members of your household, please contact Invesco Investment Services, Inc. at 800 959 4246 or contact your financial institution. We will begin sending you individual copies for each account within 30 days after receiving your request.
Fund holdings and proxy voting information
The Fund provides a complete list of its holdings four times in each fiscal year, at the quarter-ends. For the second and fourth quarters, the lists appear in the Fund’s semiannual and annual reports to shareholders. For the first and third quarters, the Fund files the lists with the Securities and Exchange Commission (SEC) on Form N-Q. The most recent list of portfolio holdings is available at invesco.com/completeqtrholdings. Shareholders can also look up the Fund’s Forms N-Q on the SEC website at sec.gov. Copies of the Fund’s Forms N-Q may be reviewed and copied at the SEC Public Reference Room in Washington, D.C. You can obtain information on the operation of the Public Reference Room, including information about duplicating fee charges, by calling 202 551 8090 or 800 732 0330, or by electronic request at the following email address: publicinfo@sec.gov. The SEC file numbers for the Fund are 811-06463 and 033-44611.
A description of the policies and procedures that the Fund uses to determine how to vote proxies relating to portfolio securities is available without charge, upon request, from our Client Services department at 800 959 4246 or at invesco.com/proxyguidelines. The information is also available on the SEC website, sec.gov.
Information regarding how the Fund voted proxies related to its portfolio securities during the 12 months ended June 30, 2011, is available at invesco.com/proxysearch. The information is also available on the SEC website, sec.gov.
Invesco Advisers, Inc. is an investment adviser; it provides investment advisory services to individual and institutional clients and does not sell securities. Invesco Distributors, Inc. is the U.S. distributor for Invesco Ltd.’s retail mutual funds, exchange-traded funds and institutional money market funds. Both are wholly owned, indirect subsidiaries of Invesco Ltd.
| IGR-AR-1 | Invesco Distributors, Inc. |
| ITEM 2. | CODE OF ETHICS. |
| The Registrant did not grant any waivers, including implicit waivers, from any provisions of the Code to the PEO or PFO during the period covered by this report. |
| ITEM 3. | AUDIT COMMITTEE FINANCIAL EXPERT. |
| The Board of Trustees has determined that the Registrant has at least one audit committee financial expert serving on its Audit Committee. The Audit Committee financial expert is Raymond Stickel, Jr. Mr. Stickel is “independent” within the meaning of that term as used in Form N-CSR. |
| ITEM 4. | PRINCIPAL ACCOUNTANT FEES AND SERVICES. |
Fees Billed by Principal Accountant Related to the Registrant
PWC billed the Registrant aggregate fees for services rendered to the Registrant for the last two fiscal years as follows:
| Percentage of Fees | Percentage of Fees | |||||||||||||||
| Billed Applicable to | Billed Applicable to | |||||||||||||||
| Non-Audit Services | Non-Audit Services | |||||||||||||||
| Fees Billed for | Provided for fiscal | Fees Billed for | Provided for fiscal | |||||||||||||
| Services Rendered to | year end 10/31/2011 | Services Rendered to | year end 10/31/2010 | |||||||||||||
| the Registrant for | Pursuant to Waiver of | the Registrant for | Pursuant to Waiver of | |||||||||||||
| fiscal year end | Pre-Approval | fiscal year end | Pre-Approval | |||||||||||||
| 10/31/2011 | Requirement(1) | 10/31/2010 | Requirement(1) | |||||||||||||
| Audit Fees | $ | 212,800 | N/A | $ | 199,800 | N/A | ||||||||||
Audit-Related Fees(2) | $ | 4,250 | 0 | % | $ | 0 | 0 | % | ||||||||
Tax Fees(3) | $ | 58,400 | 0 | % | $ | 39,200 | 0 | % | ||||||||
| All Other Fees | $ | 0 | 0 | % | $ | 0 | 0 | % | ||||||||
| Total Fees | $ | 275,450 | 0 | % | $ | 239,000 | 0 | % | ||||||||
PWC billed the Registrant aggregate non-audit fees of $62,650 for the fiscal year ended October 31, 2011, and $39,200 for the fiscal year ended October 31, 2010, for non-audit services rendered to the Registrant.
| (1) | With respect to the provision of non-audit services, the pre-approval requirement is waived pursuant to a de minimis exception if (i) such services were not recognized as non-audit services by the Registrant at the time of engagement, (ii) the aggregate amount of all such services provided is no more than 5% of the aggregate audit and non-audit fees paid by the Registrant to PWC during a fiscal year; and (iii) such services are promptly brought to the attention of the Registrant’s Audit Committee and approved by the Registrant’s Audit Committee prior to the completion of the audit. | |
| (2) | Audit-Related fees for the fiscal year end October 31, 2011 includes fees billed for agreed upon procedures related to fund mergers. | |
| (3) | Tax fees for the fiscal year end October 31, 2011 includes fees billed for reviewing tax returns. Tax fees for the fiscal year end October 31, 2010 includes fees billed for reviewing tax returns. |
Fees Billed by PWC Related to Invesco and Invesco Affiliates
PWC billed Invesco Advisers, Inc. (“Invesco”), the Registrant’s adviser, and any entity controlling, controlled by or under common control with Invesco that provides ongoing services to the Registrant (“Invesco Affiliates”) aggregate fees for pre-approved non-audit services rendered to Invesco and Invesco Affiliates for the last two fiscal years as follows:
| Fees Billed for Non- | Fees Billed for Non- | |||||||||||||||
| Audit Services | Audit Services | |||||||||||||||
| Rendered to Invesco | Percentage of Fees | Rendered to Invesco | Percentage of Fees | |||||||||||||
| and Invesco Affiliates | Billed Applicable to | and Invesco Affiliates | Billed Applicable to | |||||||||||||
| for fiscal year end | Non-Audit Services | for fiscal year end | Non-Audit Services | |||||||||||||
| 10/31/2011 That Were | Provided for fiscal year | 10/31/2010 That Were | Provided for fiscal year | |||||||||||||
| Required | end 10/31/2011 | Required | end 10/31/2010 | |||||||||||||
| to be Pre-Approved | Pursuant to Waiver of | to be Pre-Approved | Pursuant to Waiver of | |||||||||||||
| by the Registrant’s | Pre-Approval | by the Registrant’s | Pre-Approval | |||||||||||||
| Audit Committee | Requirement(1) | Audit Committee | Requirement(1) | |||||||||||||
| Audit-Related Fees | $ | 0 | 0 | % | $ | 0 | 0 | % | ||||||||
| Tax Fees | $ | 0 | 0 | % | $ | 0 | 0 | % | ||||||||
| All Other Fees | $ | 0 | 0 | % | $ | 0 | 0 | % | ||||||||
Total Fees(2) | $ | 0 | 0 | % | $ | 0 | 0 | % | ||||||||
| (1) | With respect to the provision of non-audit services, the pre-approval requirement is waived pursuant to a de minimis exception if (i) such services were not recognized as non-audit services by the Registrant at the time of engagement, (ii) the aggregate amount of all such services provided is no more than 5% of the aggregate audit and non-audit fees paid by the Registrant, Invesco and Invesco Affiliates to PWC during a fiscal year; and (iii) such services are promptly brought to the attention of the Registrant’s Audit Committee and approved by the Registrant’s Audit Committee prior to the completion of the audit. | |
| (2) | Including the fees for services not required to be pre-approved by the registrant’s audit committee, PWC billed Invesco and Invesco Affiliates aggregate non-audit fees of $0 for the fiscal year ended October 31, 2011, and $0 for the fiscal year ended October 31, 2010, for non-audit services rendered to Invesco and Invesco Affiliates. | |
| The Audit Committee also has considered whether the provision of non-audit services that were rendered to Invesco and Invesco Affiliates that were not required to be pre-approved pursuant to SEC regulations, if any, is compatible with maintaining PWC’s independence. To the extent that such services were provided, the Audit Committee determined that the provision of such services is compatible with PWC maintaining independence with respect to the Registrant. |
PRE-APPROVAL OF AUDIT AND NON-AUDIT SERVICES
POLICIES AND PROCEDURES
As adopted by the Audit Committees of
the Invesco Funds (the “Funds”)
Last Amended May 4, 2010
POLICIES AND PROCEDURES
As adopted by the Audit Committees of
the Invesco Funds (the “Funds”)
Last Amended May 4, 2010
Statement of Principles
Under the Sarbanes-Oxley Act of 2002 and rules adopted by the Securities and Exchange Commission (“SEC”) (“Rules”), the Audit Committees of the Funds’ (the “Audit Committees”) Board of Trustees (the “Board”) are responsible for the appointment, compensation and oversight of the work of independent accountants (an “Auditor”). As part of this responsibility and to assure that the Auditor’s independence is not impaired, the Audit Committees pre-approve the audit and non-audit services provided to the Funds by each Auditor, as well as all non-audit services provided by the Auditor to the Funds’ investment adviser and to affiliates of the adviser that provide ongoing services to the Funds (“Service Affiliates”) if the services directly impact the Funds’ operations or financial reporting. The SEC Rules also specify the types of services that an Auditor may not provide to its audit client. The following policies and procedures comply with the requirements for pre-approval and provide a mechanism by which management of the Funds may request and secure pre-approval of audit and non-audit services in an orderly manner with minimal disruption to normal business operations.
Proposed services either may be pre-approved without consideration of specific case-by-case services by the Audit Committees (“general pre-approval”) or require the specific pre-approval of the Audit Committees (“specific pre-approval”). As set forth in these policies and procedures, unless a type of service has received general pre-approval, it will require specific pre-approval by the Audit Committees. Additionally, any fees exceeding 110% of estimated pre-approved fee levels provided at the time the service was pre-approved will also require specific approval by the Audit Committees before payment is made. The Audit Committees will also consider the impact of additional fees on the Auditor’s independence when determining whether to approve any additional fees for previously pre-approved services.
The Audit Committees will annually review and generally pre-approve the services that may be provided by each Auditor without obtaining specific pre-approval from the Audit Committee generally on an annual basis. The term of any general pre-approval runs from the date of such pre-approval through September 30th of the following year, unless the Audit Committees consider a different period and state otherwise. The Audit Committees will add to or subtract from the list of general pre-approved services from time to time, based on subsequent determinations.
The purpose of these policies and procedures is to set forth the guidelines to assist the Audit Committees in fulfilling their responsibilities.
Delegation
The Audit Committees may from time to time delegate pre-approval authority to one or more of its members who are Independent Trustees. All decisions to pre-approve a service by a delegated member shall be reported to the Audit Committees at the next quarterly meeting.
Audit Services
The annual audit services engagement terms will be subject to specific pre-approval of the Audit Committees. Audit services include the annual financial statement audit and other procedures such as tax provision work that is required to be performed by the independent auditor to be able to form an opinion on the Funds’ financial statements. The Audit Committees will obtain, review and consider sufficient information concerning the proposed Auditor to make a reasonable evaluation of the Auditor’s qualifications and independence.
In addition to the annual Audit services engagement, the Audit Committees may grant either general or specific pre-approval of other audit services, which are those services that only the independent auditor reasonably can provide. Other Audit services may include services such as issuing consents for the
inclusion of audited financial statements with SEC registration statements, periodic reports and other documents filed with the SEC or other documents issued in connection with securities offerings.
Non-Audit Services
The Audit Committees may provide either general or specific pre-approval of any non-audit services to the Funds and its Service Affiliates if the Audit Committees believe that the provision of the service will not impair the independence of the Auditor, is consistent with the SEC’s Rules on auditor independence, and otherwise conforms to the Audit Committees’ general principles and policies as set forth herein.
Audit-Related Services
“Audit-related services” are assurance and related services that are reasonably related to the performance of the audit or review of the Fund’s financial statements or that are traditionally performed by the independent auditor. Audit-related services include, among others, accounting consultations related to accounting, financial reporting or disclosure matters not classified as “Audit services”; assistance with understanding and implementing new accounting and financial reporting guidance from rulemaking authorities; and agreed-upon procedures related to mergers, compliance with ratings agency requirements and interfund lending activities.
Tax Services
“Tax services” include, but are not limited to, the review and signing of the Funds’ federal tax returns, the review of required distributions by the Funds and consultations regarding tax matters such as the tax treatment of new investments or the impact of new regulations. The Audit Committees will scrutinize carefully the retention of the Auditor in connection with a transaction initially recommended by the Auditor, the major business purpose of which may be tax avoidance or the tax treatment of which may not be supported in the Internal Revenue Code and related regulations. The Audit Committees will consult with the Funds’ Treasurer (or his or her designee) and may consult with outside counsel or advisors as necessary to ensure the consistency of Tax services rendered by the Auditor with the foregoing policy.
No Auditor shall represent any Fund or any Service Affiliate before a tax court, district court or federal court of claims.
Under rules adopted by the Public Company Accounting Oversight Board and approved by the SEC, in connection with seeking Audit Committees’ pre-approval of permissible Tax services, the Auditor shall:
| 1. | Describe in writing to the Audit Committees, which writing may be in the form of the proposed engagement letter: |
| a. | The scope of the service, the fee structure for the engagement, and any side letter or amendment to the engagement letter, or any other agreement between the Auditor and the Fund, relating to the service; and | ||
| b. | Any compensation arrangement or other agreement, such as a referral agreement, a referral fee or fee-sharing arrangement, between the Auditor and any person (other than the Fund) with respect to the promoting, marketing, or recommending of a transaction covered by the service; |
| 2. | Discuss with the Audit Committees the potential effects of the services on the independence of the Auditor; and | ||
| 3. | Document the substance of its discussion with the Audit Committees. |
All Other Auditor Services
The Audit Committees may pre-approve non-audit services classified as “All other services” that are not categorically prohibited by the SEC, as listed in Exhibit 1 to this policy.
Pre-Approval Fee Levels or Established Amounts
Pre-approval of estimated fees or established amounts for services to be provided by the Auditor under general or specific pre-approval policies will be set periodically by the Audit Committees. Any proposed fees exceeding 110% of the maximum estimated pre-approved fees or established amounts for pre-approved audit and non-audit services will be reported to the Audit Committees at the quarterly Audit Committees meeting and will require specific approval by the Audit Committees before payment is made. The Audit Committees will always factor in the overall relationship of fees for audit and non-audit services in determining whether to pre-approve any such services and in determining whether to approve any additional fees exceeding 110% of the maximum pre-approved fees or established amounts for previously pre-approved services.
Procedures
Generally on an annual basis, Invesco Advisers, Inc. (“Invesco”) will submit to the Audit Committees for general pre-approval, a list of non-audit services that the Funds or Service Affiliates of the Funds may request from the Auditor. The list will describe the non-audit services in reasonable detail and will include an estimated range of fees and such other information as the Audit Committee may request.
Each request for services to be provided by the Auditor under the general pre-approval of the Audit Committees will be submitted to the Funds’ Treasurer (or his or her designee) and must include a detailed description of the services to be rendered. The Treasurer or his or her designee will ensure that such services are included within the list of services that have received the general pre-approval of the Audit Committees. The Audit Committees will be informed at the next quarterly scheduled Audit Committees meeting of any such services for which the Auditor rendered an invoice and whether such services and fees had been pre-approved and if so, by what means.
Each request to provide services that require specific approval by the Audit Committees shall be submitted to the Audit Committees jointly by the Fund’s Treasurer or his or her designee and the Auditor, and must include a joint statement that, in their view, such request is consistent with the policies and procedures and the SEC Rules.
Each request to provide tax services under either the general or specific pre-approval of the Audit Committees will describe in writing: (i) the scope of the service, the fee structure for the engagement, and any side letter or amendment to the engagement letter, or any other agreement between the Auditor and the audit client, relating to the service; and (ii) any compensation arrangement or other agreement between the Auditor and any person (other than the audit client) with respect to the promoting, marketing, or recommending of a transaction covered by the service. The Auditor will discuss with the Audit Committees the potential effects of the services on the Auditor’s independence and will document the substance of the discussion.
Non-audit services pursuant to the de minimis exception provided by the SEC Rules will be promptly brought to the attention of the Audit Committees for approval, including documentation that each of the conditions for this exception, as set forth in the SEC Rules, has been satisfied.
On at least an annual basis, the Auditor will prepare a summary of all the services provided to any entity in the investment company complex as defined in section 2-01(f)(14) of Regulation S-X in sufficient detail as to the nature of the engagement and the fees associated with those services.
The Audit Committees have designated the Funds’ Treasurer to monitor the performance of all services provided by the Auditor and to ensure such services are in compliance with these policies and procedures. The Funds’ Treasurer will report to the Audit Committees on a periodic basis as to the results of such monitoring. Both the Funds’ Treasurer and management of Invesco will immediately report to the chairman of the Audit Committees any breach of these policies and procedures that comes to the attention of the Funds’ Treasurer or senior management of Invesco.
Exhibit 1 to Pre-Approval of Audit and Non-Audit Services Policies and Procedures
Conditionally Prohibited Non-Audit Services (not prohibited if the Fund can reasonably conclude that the results of the service would not be subject to audit procedures in connection with the audit of the Fund’s financial statements)
| • | Bookkeeping or other services related to the accounting records or financial statements of the audit client | ||
| • | Financial information systems design and implementation | ||
| • | Appraisal or valuation services, fairness opinions, or contribution-in-kind reports | ||
| • | Actuarial services | ||
| • | Internal audit outsourcing services |
Categorically Prohibited Non-Audit Services
| • | Management functions | ||
| • | Human resources | ||
| • | Broker-dealer, investment adviser, or investment banking services | ||
| • | Legal services | ||
| • | Expert services unrelated to the audit | ||
| • | Any service or product provided for a contingent fee or a commission | ||
| • | Services related to marketing, planning, or opining in favor of the tax treatment of confidential transactions or aggressive tax position transactions, a significant purpose of which is tax avoidance | ||
| • | Tax services for persons in financial reporting oversight roles at the Fund Any other service that the Public Company Oversight Board determines by regulation is impermissible. |
| ITEM 5. | AUDIT COMMITTEE OF LISTED REGISTRANTS. |
| Not applicable. |
| ITEM 6. | SCHEDULE OF INVESTMENTS. |
| Investments in securities of unaffiliated issuers is included as part of the reports to stockholders filed under Item 1 of this Form. |
| ITEM 7. | DISCLOSURE OF PROXY VOTING POLICIES AND PROCEDURES FOR CLOSED-END MANAGEMENT INVESTMENT COMPANIES. |
| Not applicable. |
| ITEM 8. | PORTFOLIO MANAGERS OF CLOSED-END MANAGEMENT COMPANIES. |
| Not applicable. |
| ITEM 9. | PURCHASES OF EQUITY SECURITIES BY CLOSED-END MANAGEMENT INVESTMENT COMPANY AND AFFILIATED PURCHASERS. |
| Not applicable. |
| ITEM 10. | SUBMISSION OF MATTERS TO A VOTE OF SECURITY HOLDERS. |
| None |
| ITEM 11. | CONTROLS AND PROCEDURES. |
| (a) | As of December 15, 2011, an evaluation was performed under the supervision and with the participation of the officers of the Registrant, including the PEO and PFO, to assess the effectiveness of the Registrant’s disclosure controls and procedures, as that term is |
| defined in Rule 30a-3(c) under the Investment Company Act of 1940 (the “Act”), as amended. Based on that evaluation, the Registrant’s officers, including the PEO and PFO, concluded that, as of December 15, 2011, the Registrant’s disclosure controls and procedures were reasonably designed to ensure: (1) that information required to be disclosed by the Registrant on Form N-CSR is recorded, processed, summarized and reported within the time periods specified by the rules and forms of the Securities and Exchange Commission; and (2) that material information relating to the Registrant is made known to the PEO and PFO as appropriate to allow timely decisions regarding required disclosure. | ||
| (b) | There have been no changes in the Registrant’s internal control over financial reporting (as defined in Rule 30a-3(d) under the Act) that occurred during the second fiscal quarter of the period covered by this report that have materially affected, or are reasonably likely to materially affect, the Registrant’s internal control over financial reporting. |
| ITEM 12. | EXHIBITS. |
| 12(a) (1) | Code of Ethics. | |
| 12(a) (2) | Certifications of principal executive officer and principal financial officer as required by Rule 30a-2(a) under the Investment Company Act of 1940. | |
| 12(a) (3) | Not applicable. | |
| 12(b) | Certifications of principal executive officer and principal financial officer as required by Rule 30a-2(b) under the Investment Company Act of 1940. |
SIGNATURES
Pursuant to the requirements of the Securities Exchange Act of 1934 and the Investment Company Act of 1940, the Registrant has duly caused this report to be signed on its behalf by the undersigned, thereunto duly authorized.
Registrant: AIM International Mutual Funds (Invesco International Mutual Funds)
| By: | /s/ PHILIP A. TAYLOR | |||
| Principal Executive Officer | ||||
| Date: | January 9, 2012 |
Pursuant to the requirements of the Securities and Exchange Act of 1934 and the Investment Company Act of 1940, this report has been signed below by the following persons on behalf of the Registrant and in the capacities and on the dates indicated.
| By: | /s/ PHILIP A. TAYLOR | |||
| Principal Executive Officer | ||||
| Date: | January 9, 2012 | |||
| By: | /s/ Sheri Morris | |||
| Principal Financial Officer | ||||
| Date: | January 9, 2012 |
EXHIBIT INDEX
| 12(a)(1) | Code of Ethics. | |
| 12(a)(2) | Certifications of principal executive officer and principal Financial officer as required by Rule 30a-2(a) under the Investment Company Act of 1940. | |
| 12(a)(3) | Not applicable. | |
| 12(b) | Certifications of principal executive officer and principal financial officer as required by Rule 30a-2(b) under the Investment Company Act of 1940. |