OMB APPROVAL | ||||
| OMB Number: | 3235-0570 | |||
| Expires: | January 31, 2014 | |||
| Estimated average burden | ||||
| hours per response: | 20.6 | |||
UNITED STATES
SECURITIES AND EXCHANGE COMMISSION
Washington, D.C. 20549
FORM N-CSR
CERTIFIED SHAREHOLDER REPORT OF REGISTERED
MANAGEMENT INVESTMENT COMPANIES
Investment Company Act file number 811-06463
AIM International Mutual Funds (Invesco International Mutual Funds)
(Exact name of registrant as specified in charter)
11 Greenway Plaza, Suite 1000 Houston,
Texas 77046
(Address of principal executive offices) (Zip code)
Philip A. Taylor
11 Greenway Plaza, Suite 1000 Houston,
Texas 77046
(Name and address of agent for service)
Registrant’s telephone number, including area code: (713) 626-1919
Date of fiscal year end: 10/31
Date of reporting period: 10/31/13
Item 1. Report to Stockholders.
|
Annual Report to Shareholders October 31, 2013 | |||
Invesco Asia Pacific Growth Fund
| ||||
Nasdaq: A: ASIAX n B: ASIBX n C: ASICX n Y: ASIYX | ||||

Letters to Shareholders
Philip Taylor | Dear Shareholders: Enclosed in this annual report, you’ll find information about your Fund and the factors that affected its performance during the reporting period. Inside, you’ll also find a discussion from your portfolio managers about how they managed your Fund, as well as performance data for your Fund, a complete list of your Fund’s investments as of the close of the reporting period and other important information. I hope you find this report of interest. During the reporting period covered by this report, major US equity indexes made multiyear or even all-time highs.1 Economic data were generally positive; housing and consumer spending data were particularly encouraging. Nonetheless, economic uncertainty and concern about continuing political and budget gridlock in Washington persisted. The US Federal Reserve’s deliberate vagueness about when, and to what degree, it might begin to curtail its extraordinarily accommodative monetary policies affected fixed income and equity markets | ||||||||

alike. Most developed, non-US stock markets remained positive for the first half of 2013, despite a difficult second quarter.
Periods of market volatility and economic uncertainty can weaken the will of even the most resolute investor. That’s why Invesco believes it’s often helpful to work with a skilled and trusted financial adviser who can emphasize the importance of adhering to an investment plan designed to achieve long-term goals rather than being sidetracked by short-term uncertainty that can result in inaction. A financial adviser who is familiar with your individual financial situation, investment goals and risk tolerance can be an invaluable partner as you work toward your financial goals. He or she can provide insight and perspective when markets are volatile; encouragement and reassurance when times are uncertain; and advice and guidance when your financial situation or investment goals change.
Our website, invesco.com/us, is another source of timely insight and information for investors. On the website, you’ll find fund-specific as well as more general information from many of Invesco’s investment professionals. You’ll find in-depth articles, video clips and audio commentaries – and, of course, you also can access information about your Invesco account whenever it’s convenient for you.
What we mean by Intentional Investing
At Invesco, all of our people and all of our resources are dedicated to helping investors achieve their financial objectives. It’s a philosophy we call Intentional Investing, and it guides the way we:
| n | Manage investments - Our dedicated investment professionals search the world for the best opportunities, and each investment team follows a clear, disciplined process to build portfolios and mitigate risk. |
| n | Provide choices - We offer multiple investment strategies, allowing you and your financial adviser to build a portfolio that’s purpose-built for your needs. |
| n | Connect with you - We’re committed to giving you the expert insights you need to make informed investing decisions, and we are well-equipped to provide high-quality support for investors and advisers. |
At Invesco, we believe in putting investors first. That’s why investment management is all we do. Our sole focus on managing your money allows you and your financial adviser to build a portfolio of Invesco funds appropriate for your investment needs and goals today and when your circumstances change.
Have questions?
For questions about your account, feel free to contact an Invesco client services representative at 800 959 4246. For Invesco-related questions or comments, please email me directly at phil@invesco.com.
All of us at Invesco look forward to serving your investment management needs for many years to come. Thank you for investing with us.
Sincerely,

Philip Taylor
Senior Managing Director, Invesco Ltd.
1 Source: Reuters
2 Invesco Asia Pacific Growth Fund
Bruce Crockett | Dear Fellow Shareholders: The Invesco Funds Board has worked on a variety of issues over the last several months, and I’d like to take this opportunity to discuss two that affect you and our fellow fund shareholders. The first issue on which your Board has been working is our annual review of the funds’ advisory and sub-advisory contracts with Invesco Advisers and its affiliates. This annual review, which is required by the Investment Company Act of 1940, focuses on the nature and quality of the services Invesco provides as adviser to the Invesco Funds and the reasonableness of the fees that it charges for those services. Each year, we spend months reviewing detailed information that we request from Invesco that allows us to evaluate its services and fees. We also use information from many independent sources, including materials provided by the independent Senior Officer of the Invesco Funds, who reports directly to the independent Trustees on the Board. Additionally, we meet with independent legal counsel and review | ||||||||

performance and fee data prepared by Lipper Inc., an independent, third-party firm widely recognized as a leader in its field.
I’m pleased to report that the Board determined in June that renewing the investment advisory agreement and the sub-advisory contracts with Invesco Advisers and its affiliates would serve the best interests of each fund and its shareholders.
The second area of focus to highlight is the Board’s efforts to ensure that we provide a lineup of funds that allow financial advisers to build portfolios that meet shareholders’ changing financial needs and goals. Today, more and more investors are reaching, or approaching, retirement. But interest rates remain low, making it difficult for many investors to generate the income they need, or will soon need, in their retirement years.
The members of your Board think about these things, too, and we’ve worked with Invesco Advisers to provide more income-generating options in the Invesco Funds lineup to help shareholders potentially meet their income needs. Your Board recently approved changes to three existing equity mutual funds, increasing their focus on generating income while also seeking to provide long-term growth of capital.
As a result of these changes, the funds and their respective management teams now have more flexibility to invest in the types of securities that could meet investors’ growing need for income generation, and in some cases, also help investors diversify their sources of income. These equity funds complement an array of fixed-income, asset allocation and alternative investment options in the Invesco Funds lineup designed to accommodate a variety of risk tolerances.
Be assured that your Board will continue working on behalf of fund shareholders, keeping your needs and interests uppermost in our minds.
As always, please contact me at bruce@brucecrockett.com with any questions or concerns you may have. On behalf of the Board, we look forward to continuing to represent your interests and serving your needs.
Sincerely,

Bruce L. Crockett
Independent Chair
Invesco Funds Board of Trustees
3 Invesco Asia Pacific Growth Fund
Management’s Discussion of Fund Performance
Performance summary
For the fiscal year ended October 31, 2013, Class A shares of Invesco Asia Pacific Growth Fund, at net asset value (NAV), delivered double-digit returns and outperformed the Fund’s style-specific benchmark, the MSCI All Country Asia Pacific ex-Japan Index. Fund holdings in China and stock selection in Malaysia were the leading contributors to this outperformance. The Fund’s holdings in certain Southeast Asian markets as well as stock selection and underweight exposure to Australia detracted from performance.
Your Fund’s long-term performance appears later in this report.
Fund vs. Indexes
Total returns, 10/31/12 to 10/31/13, at net asset value (NAV). Performance shown does not include applicable contingent deferred sales charges (CDSC) or front-end sales charges, which would have reduced performance.
| Class A Shares | 12.16 | % | |||
| Class B Shares | 11.36 | ||||
| Class C Shares | 11.31 | ||||
| Class Y Shares | 12.43 | ||||
| MSCI EAFE Index‚ (Broad Market Index) | 26.88 | ||||
| MSCI All Country Asia Pacific ex-Japan Indexn (Style-Specific Index) | 11.63 | ||||
| Lipper Pacific Region ex-Japan Funds Indexn (Peer Group Index) | 10.66 | ||||
Source(s): ‚Invesco, MSCI via FactSet Research Systems Inc.; nLipper Inc.
How we invest
When selecting stocks for your Fund, we use a disciplined investment strategy that emphasizes fundamental research to identify quality growth companies. This strategy is supported by quantitative analysis, portfolio construction and risk management techniques. Our EQV (earnings, quality and valuation) strategy focuses on identifying stocks that we believe have sustainable above-average earnings growth, efficient capital allocation and attractive prices.
While research responsibilities within the portfolio management team are focused by geographic region, we select investments for the Fund using a bottom-up investment approach, which means we construct the Fund primarily on a stock-by-stock basis. We focus on the strengths of individual companies rather than sectors, countries or market-cap trends. We believe disciplined sell decisions are the key to successful investing.
We consider selling a stock for several reasons, including when:
| n | Its price changes such that we believe it has become too expensive. |
| n | The original investment thesis for the company is no longer valid. |
| n | A more compelling investment opportunity is identified. |
Market conditions and your Fund
The fiscal year ended October 31, 2013, saw slow but steady improvement in global economies and strong US and global equity market returns.
Asian equity markets (excluding Japan) experienced a volatile fiscal year but generally ended the reporting period on a positive note. Certain emerging Asian markets struggled, however, on the back of continued sensitivity to the global liquidity environment. While North Asian equity markets proved relatively resilient, those in South Asia were more volatile, with concerns over current account
deterioration. This was particularly the case for Indonesia, where the current account deficit widened and the currency weakened markedly against the US dollar. India also suffered currency weakness in the rupee. While the rupee has been depreciating since late 2010, it gained renewed attention by slumping to a record low against the US dollar in late August of this year.1
In this environment, the Fund’s Class A shares, at NAV, delivered double-digit returns for the fiscal year, outperforming the Fund’s style-specific benchmark. The Fund’s relative performance was led by holdings in China, as well as stock selection in Malaysia and South Korea. The Fund’s biggest relative detractors came from the smaller Southeast Asian markets like Thailand, Indonesia and the Philippines. Underweight exposure and stock selection in Australia also detracted from relative performance.
The Fund delivered positive returns in seven of the 10 invested sectors. Relative performance was supported by stock selection in the health care and information technology sectors. Underweight exposure and stock selection in the materials sector was beneficial as well. In contrast, underweight exposure and stock selection in the financials sector was the leading sector-level detractor from relative performance.
The Fund’s low double-digit cash position throughout the fiscal year detracted from performance as markets continued to rally over the reporting period. It is important to note that we do not use cash for “top-down” tactical asset allocation purposes. Historically, when the portfolio’s cash position has been higher than average, it has reflected a lack of good EQV investment opportunities in the marketplace, rather than an overall negative opinion on markets.
In terms of stocks, Kossan Rubber Industries was the top individual
| Portfolio Composition | |||||
| By sector | |||||
| Financials | 22.9 | % | |||
| Consumer Discretionary | 15.9 | ||||
| Information Technology | 12.5 | ||||
| Industrials | 8.9 | ||||
| Telecommunication Services | 7.2 | ||||
| Utilities | 5.1 | ||||
| Health Care | 4.7 | ||||
| Materials | 3.7 | ||||
| Energy | 3.3 | ||||
| Consumer Staples | 2.7 | ||||
Money Market Funds Plus Other Assets Less Liabilities
|
| 13.1
|
| ||
Top 10 Equity Holdings*
| |||||
1. Industrial & Commercial Bank of China Ltd.-Class H | 3.6 | % | |||
2. Hutchison Whampoa Ltd. | 3.6 | ||||
3. Kossan Rubber Industries Berhad | 3.2 | ||||
4. PT Telekomunikasi Indonesia Persero Tbk | 2.9 | ||||
5. Minth Group Ltd. | 2.9 | ||||
6. Kasikornbank PCL | 2.9 | ||||
7. Public Bank Berhad | 2.5 | ||||
8. Taiwan Semiconductor Manufacturing Co. Ltd. | 2.5 | ||||
9. Philippine Long Distance Telephone Co. | 2.5 | ||||
10. Baidu, Inc. ADR
| 2.4 | ||||
Top Five Countries*
| |||||
1. China | 23.5 | % | |||
2. Indonesia | 10.1 | ||||
3. Hong Kong | 9.9 | ||||
4. Philippines | 8.4 | ||||
5. Australia | 7.8 |
| Total Net Assets | $795.5 million | ||||
Total Number of Holdings*
| 51 | ||||
The Fund’s holdings are subject to change, and there is no assurance that the Fund will continue to hold any particular security.
| *Excluding | money market fund holdings. |
4 Invesco Asia Pacific Growth Fund
contributor to performance. Kossan is a Malaysian rubber product manufacturer that specializes in making latex gloves for health care providers. Other top individual contributors included the Minth Group, an automobile parts manufacturer based in China, and Baidu, an Internet search engine company also based in China. The largest detractors included First Gen, a Philippine power company and South Korean electronics manufacturer Samsung Electronics. Not owning several Australian banks also hurt performance relative to the benchmark.
The Fund’s positioning is driven by our stock selection process, as opposed to any top-down or macro-based allocation criteria. Improving valuations across Asian emerging markets enabled us to selectively put cash to work in certain markets including Hong Kong, Singapore and China. We were also able to increase our exposure in the information technology, industrials and financials sectors. Conversely, we decreased Fund exposure in the Philippines and Australia. At the sector level, Fund exposure to the utilities and consumer staples sectors was also decreased.
The Fund ended the reporting period significantly overweight versus the index in the consumer discretionary sector. Our team is finding numerous opportunities in the sector at reasonable valuations. The Fund’s most significant underweight position against the benchmark was in the financials sector. Geographically, the Fund’s most significant overweight exposures versus the benchmark were in Indonesia and the Philippines. Australia continued to be the largest underweight exposure relative to the benchmark.
Over the reporting period, the Fund experienced double-digit returns at NAV. While we are pleased to provide shareholders with this performance, it would be imprudent for us to suggest that such a level of return is sustainable over the long term. With market volatility likely to continue for some time, our focus remains on ensuring that our portfolio is comprised of high-quality, reasonably valued companies capable of sustained earnings growth. We believe that this balanced, EQV-focused approach may help deliver attractive returns over the long term.
We thank you for your continued investment in Invesco Asia Pacific Growth Fund.
1 Source: Reuters
The views and opinions expressed in management’s discussion of Fund performance are those of Invesco Advisers, Inc. These views and opinions are subject to change at any time based on factors such as market and economic conditions. These views and opinions may not be relied upon as investment advice or recommendations, or as an offer for a particular security. The information is not a complete analysis of every aspect of any market, country, industry, security or the Fund. Statements of fact are from sources considered reliable, but Invesco Advisers, Inc. makes no representation or warranty as to their completeness or accuracy. Although historical performance is no guarantee of future results, these insights may help you understand our investment management philosophy.
See important Fund and, if applicable, index disclosures later in this report.
 | Shuxin (Steve) Cao Chartered Financial Analyst, portfolio manager, is lead manager of Invesco Asia Pacific Growth Fund. He joined | |
Invesco in 1997. Mr. Cao earned a BA in English from the Tianjin Foreign Language Institute and an MBA from Texas A&M University. He is also a Certified Public Accountant.
| ||
| Brent Bates Chartered Financial Analyst, portfolio manager, is manager of Invesco Asia Pacific Growth Fund. He | |
joined Invesco in 1996. Mr. Bates earned a BBA from Texas A&M University and is a Certified Public Accountant.
| ||
| Mark Jason Chartered Financial Analyst, portfolio manager, is manager of Invesco Asia Pacific Growth Fund. He | |
| joined Invesco in 2001. Mr. Jason earned a BS in finance and a BS in real estate from California State University, Northridge. | ||


5 Invesco Asia Pacific Growth Fund
Your Fund’s Long-Term Performance
Results of a $10,000 Investment – Oldest Share Class(es)
Fund and index data from 10/31/03
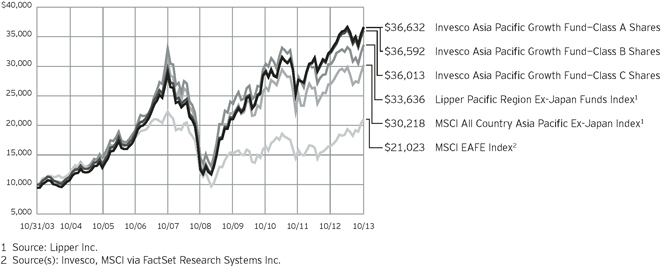
Past performance cannot guarantee comparable future results.
The data shown in the chart include reinvested distributions, applicable sales charges and Fund expenses including management fees. Results for Class B shares are calculated as if a hypothetical
shareholder had liquidated his entire investment in the Fund at the close of the reporting period and paid the contingent deferred sales charges, if applicable. Index results include reinvested dividends, but they do not reflect sales charges. Performance of the peer group,
if applicable, reflects fund expenses and management fees; performance of a market index does not. Performance shown in the chart and table(s) does not reflect deduction of taxes a shareholder would pay on Fund distributions or sale of Fund shares.
continued from page 8
| n | A direct investment cannot be made in an index. Unless otherwise indicated, index results include reinvested dividends, and they do not reflect sales charges. Performance of the peer group, if applicable, reflects fund expenses; performance of a market index does not. |
Other information
| n | CPA® and Certified Public Accountant® are trademarks owned by the American Institute of Certified Public Accountants. |
| n | The returns shown in management’s discussion of Fund performance are based on net asset values calculated for shareholder transactions. Generally accepted accounting principles require adjustments to be made to the net assets of the Fund at period end for financial reporting purposes, and as such, the net asset values for shareholder transactions and the returns based on those net asset values may differ from the net asset values and returns reported in the Financial Highlights. |
| n | Industry classifications used in this report are generally according to the Global Industry Classification Standard, which was developed by and is the exclusive property and a service mark of MSCI Inc. and Standard & Poor’s. |
6 Invesco Asia Pacific Growth Fund
| Average Annual Total Returns | |||||
As of 10/31/13, including maximum applicable sales charges
|
| ||||
| Class A Shares | |||||
| Inception (11/3/97) | 9.80 | % | |||
| 10 Years | 13.86 | ||||
| 5 Years | 22.63 | ||||
| 1 Year | 6.00 | ||||
| Class B Shares | |||||
| Inception (11/3/97) | 9.82 | % | |||
| 10 Years | 13.85 | ||||
| 5 Years | 22.94 | ||||
| 1 Year | 6.36 | ||||
| Class C Shares | |||||
| Inception (11/3/97) | 9.38 | % | |||
| 10 Years | 13.67 | ||||
| 5 Years | 23.09 | ||||
| 1 Year | 10.31 | ||||
| Class Y Shares | |||||
| 10 Years | 14.65 | % | |||
| 5 Years | 24.33 | ||||
| 1 Year |
| 12.43
|
| ||
Class Y shares incepted on October 3, 2008. Performance shown prior to that date is that of Class A shares and includes the 12b-1 fees applicable to Class A shares. Class A share performance reflects any applicable fee waivers or expense reimbursements.
The performance data quoted represent past performance and cannot guarantee comparable future results; current performance may be lower or higher. Please visit invesco.com/performance for the most recent month-end performance. Performance figures reflect reinvested distributions, changes in net asset value and the effect of the maximum sales charge unless otherwise stated. Investment return and principal value will fluctuate so that you may have a gain or loss when you sell shares.
The total annual Fund operating expense ratio set forth in the most recent Fund prospectus as of the date of this report for Class A, Class B, Class C and Class Y shares was 1.55%, 2.30%, 2.30% and 1.30%, respectively. The expense ratios presented above may vary from the expense ratios presented in other sections of this report that are based on expenses incurred during the period covered by this report.
| Average Annual Total Returns | |||||
| As of 9/30/13, the most recent calendar quarter end, including maximum applicable sales charges | |||||
| Class A Shares | |||||
| Inception (11/3/97) | 9.65 | % | |||
| 10 Years | 14.41 | ||||
| 5 Years | 14.76 | ||||
| 1 Year | 4.15 | ||||
| Class B Shares | |||||
| Inception (11/3/97) | 9.66 | % | |||
| 10 Years | 14.38 | ||||
| 5 Years | 14.96 | ||||
| 1 Year | 4.38 | ||||
| Class C Shares | |||||
| Inception (11/3/97) | 9.23 | % | |||
| 10 Years | 14.21 | ||||
| 5 Years | 15.18 | ||||
| 1 Year | 8.36 | ||||
| Class Y Shares | |||||
| 10 Years | 15.19 | % | |||
| 5 Years | 16.34 | ||||
| 1 Year |
| 10.49
|
| ||
Class A share performance reflects the maximum 5.50% sales charge, and Class B and Class C share performance reflects the applicable contingent deferred sales charge (CDSC) for the period involved. The CDSC on Class B shares declines from 5% beginning at the time of purchase to 0% at the beginning of the seventh year. The CDSC on Class C shares is 1% for the first year after purchase. Class Y shares do not have a front-end sales charge or a CDSC; therefore, performance is at net asset value.
The performance of the Fund’s share classes will differ primarily due to different sales charge structures and class expenses.
Had the adviser not waived fees and/ or reimbursed expenses in the past, performance would have been lower.
7 Invesco Asia Pacific Growth Fund
Invesco Asia Pacific Growth Fund’s investment objective is long-term growth of capital.
| n | Unless otherwise stated, information presented in this report is as of October 31, 2013, and is based on total net assets. |
| n | Unless otherwise noted, all data provided by Invesco. |
| n | To access your Fund’s reports/prospectus, visit invesco.com/fundreports. |
About share classes
| n | Class B shares may not be purchased for new or additional investments. Please see the prospectus for more information. |
| n | Class Y shares are available to only certain investors. Please see the prospectus for more information. |
Principal risks of investing in the Fund
| n | Depositary receipts risk. Depositary receipts involve many of the same risks as those associated with direct investment in foreign securities. In addition, the underlying issuers of certain depositary receipts, particularly unsponsored or unregistered depositary receipts, are under no obligation to distribute shareholder communications to the holders of such receipts or to pass through to them any voting rights with respect to the deposited securities. |
| n | Derivatives risk. The performance of derivative instruments is tied to the performance of an underlying currency, security, index, commodity or other asset. In addition to risks relating to their underlying assets, the use of derivatives may include other, possibly greater, risks. Derivatives involve costs, may be volatile, and may involve a small initial investment relative to the risk assumed. Risks associated with the use of derivatives may include counterparty, margin, leverage, correlation, liquidity, tax, market, interest rate and management risks, as well as the risk of potential increased regulation of derivatives. Derivatives may also be more difficult to purchase, sell or value than other investments. The Fund may lose more than the cash amount invested on investments in derivatives. Each of these risks is greater for the Fund than mutual funds that do not use derivatives to implement their investment strategy. |
| n | Developing/emerging markets securities risk. The prices of securities issued by foreign companies and governments |
located in developing/emerging markets countries may be affected more negatively by inflation, devaluation of their currencies, higher transaction costs, delays in settlement, adverse political developments, the introduction of capital controls, withholding taxes, nationalization of private assets, expropriation, social unrest, war or lack of timely information than those in developed countries.
| n | Foreign securities risk. The Fund’s foreign investments may be affected by changes in a foreign country’s exchange rates, political and social instability, changes in economic or taxation policies, difficulties when enforcing obligations, decreased liquidity, and increased volatility. Foreign companies may be subject to less regulation resulting in less publicly available information about the companies. |
| n | Geographic focus risk. From time to time the Fund may invest a substantial amount of its assets in securities of issuers located in a single country or a limited number of countries. If the Fund focuses its investments in this manner, it assumes the risk that economic, political and social conditions in those countries will have a significant impact on its investment performance. The Fund’s investment performance may also be more volatile if it focuses its investments in certain countries, especially emerging markets countries. |
| n | Growth investing risk. Growth stocks tend to be more expensive relative to their earnings or assets compared with other types of stock. As a result they tend to be more sensitive to changes in their earnings and can be more volatile. |
| n | Management risk. The investment techniques and risk analysis used by the Fund’s portfolio managers may not produce the desired results. |
| n | Market risk. The prices of and the income generated by the Fund’s securities may decline in response to, among other things, investor sentiment, general economic and market |
conditions, regional or global instability, and currency and interest rate fluctuations.
| n | Small- and mid-capitalization risks. Stocks of small- and mid-sized companies tend to be more vulnerable to adverse developments and may have little or no operating history or track record of success, and limited product lines, markets, management and financial resources. The securities of small- and mid-sized companies may be more volatile due to less market interest and less publicly available information about the issuer. They also may be illiquid or restricted as to resale, or may trade less frequently and in smaller volumes, all of which may cause difficulty when establishing or closing a position at a desirable price. |
About indexes used in this report
| n | The MSCI EAFE® Index is an unmanaged index considered representative of stocks of Europe, Australasia and the Far East. The index is computed using the net return, which withholds applicable taxes for non-resident investors. |
| n | The MSCI All Country Asia Pacific ex-Japan Index is an unmanaged index considered representative of Pacific region stock markets, excluding Japan. The index is computed using the net return, which withholds applicable taxes for non-resident investors. |
| n | The Lipper Pacific Region ex-Japan Funds Index is an unmanaged index considered representative of Pacific region ex-Japan funds tracked by Lipper. |
| n | The Fund is not managed to track the performance of any particular index, including the index(es) described here, and consequently, the performance of the Fund may deviate significantly from the performance of the index(es). |
continued on page 6
This report must be accompanied or preceded by a currently effective Fund prospectus, which contains more complete information, including sales charges and expenses. Investors should read it carefully before investing.
| NOT FDIC INSURED | MAY LOSE VALUE | NO BANK GUARANTEE |
Fund Nasdaq Symbols
| Class A Shares | ASIAX | |
| Class B Shares | ASIBX | |
| Class C Shares | ASICX | |
| Class Y Shares | ASIYX |
8 Invesco Asia Pacific Growth Fund
Schedule of Investments
October 31, 2013
| Shares | Value | |||||||
Common Stocks & Other Equity Interests–86.90% |
| |||||||
| Australia–7.83% | ||||||||
BHP Billiton Ltd. | 131,137 | $ | 4,640,026 | |||||
Brambles Ltd. | 1,626,177 | 14,294,681 | ||||||
Coca-Cola Amatil Ltd. | 487,760 | 5,947,297 | ||||||
Computershare Ltd. | 1,693,543 | 17,191,914 | ||||||
CSL Ltd. | 188,086 | 12,355,633 | ||||||
WorleyParsons Ltd. | 377,938 | 7,880,427 | ||||||
| 62,309,978 | ||||||||
| China–23.50% | ||||||||
Baidu, Inc.–ADR(a) | 120,285 | 19,353,857 | ||||||
Belle International Holdings Ltd. | 8,546,000 | 12,058,976 | ||||||
China Mobile Ltd. | 1,429,000 | 14,861,656 | ||||||
CNOOC Ltd. | 9,220,500 | 18,740,697 | ||||||
Franshion Properties China Ltd. | 25,236,000 | 8,755,945 | ||||||
Golden Eagle Retail Group Ltd. | 5,703,000 | 8,539,226 | ||||||
Industrial & Commercial Bank of China | 40,586,000 | 28,425,381 | ||||||
Lee & Man Paper Manufacturing Ltd. | 25,470,000 | 18,302,460 | ||||||
Minth Group Ltd. | 11,072,000 | 23,192,220 | ||||||
NetEase, Inc.–ADR | 136,594 | 9,221,461 | ||||||
Stella International Holdings Ltd. | 7,427,500 | 18,298,110 | ||||||
Want Want China Holdings Ltd. | 4,678,000 | 7,174,207 | ||||||
| 186,924,196 | ||||||||
| Hong Kong–9.90% | ||||||||
Cheung Kong (Holdings) Ltd. | 1,076,000 | 16,820,740 | ||||||
First Pacific Co. Ltd. | 7,158,000 | 8,113,334 | ||||||
Galaxy Entertainment Group Ltd.(a) | 1,417,000 | 10,554,433 | ||||||
Hongkong Land Holdings Ltd. | 2,435,000 | 14,999,600 | ||||||
Hutchison Whampoa Ltd. | 2,271,000 | 28,295,963 | ||||||
| 78,784,070 | ||||||||
| Indonesia–10.05% | ||||||||
PT Bank Central Asia Tbk | 10,073,500 | 9,337,243 | ||||||
PT Bank Mandiri Persero Tbk | 23,479,500 | 17,866,737 | ||||||
PT Indocement Tunggal Prakarsa Tbk | 3,582,500 | 6,641,321 | ||||||
PT Perusahaan Gas Negara Persero Tbk | 37,591,500 | 17,005,202 | ||||||
PT Summarecon Agung Tbk | 63,232,000 | 5,889,090 | ||||||
PT Telekomunikasi Indonesia Persero Tbk | 111,337,500 | 23,207,657 | ||||||
| 79,947,250 | ||||||||
| Malaysia–5.72% | ||||||||
Kossan Rubber Industries Berhad | 12,503,100 | 25,284,552 | ||||||
Public Bank Berhad | 3,503,400 | 20,240,903 | ||||||
| 45,525,455 | ||||||||
| Shares | Value | |||||||
| Philippines–8.44% | ||||||||
Ayala Corp. | 454,150 | $ | 6,337,710 | |||||
Energy Development Corp. | 60,951,050 | 8,181,349 | ||||||
First Gen Corp. | 31,919,789 | 11,878,505 | ||||||
GMA Holdings, Inc.–PDR | 48,103,500 | 8,224,567 | ||||||
Manila Water Co. | 5,372,000 | 3,108,077 | ||||||
Philippine Long Distance Telephone Co. | 294,015 | 19,528,421 | ||||||
SM Investments Corp. | 497,181 | 9,849,270 | ||||||
| 67,107,899 | ||||||||
| Singapore–4.14% | ||||||||
Keppel Corp. Ltd. | 2,068,200 | 18,064,700 | ||||||
United Overseas Bank Ltd. | 885,000 | 14,826,789 | ||||||
| 32,891,489 | ||||||||
| South Korea–6.35% | ||||||||
Hyundai Department Store Co., Ltd. | 100,471 | 16,007,466 | ||||||
Hyundai Mobis | 54,467 | 15,378,905 | ||||||
NAVER Corp. | 7,072 | 3,980,263 | ||||||
NHN Entertainment Corp.(a) | 15,784 | 1,688,916 | ||||||
Samsung Electronics Co., Ltd. | 9,680 | 13,413,843 | ||||||
| 50,469,393 | ||||||||
| Taiwan–2.48% | ||||||||
Taiwan Semiconductor Manufacturing Co. Ltd. | 5,341,464 | 19,738,458 | ||||||
| Thailand–6.65% | ||||||||
Kasikornbank PCL | 3,722,100 | 23,081,882 | ||||||
Major Cineplex Group PCL | 11,608,600 | 7,091,259 | ||||||
Siam Commercial Bank PCL (The) | 2,975,600 | 15,645,900 | ||||||
Thai Stanley Electric PCL | 960,700 | 7,085,490 | ||||||
| 52,904,531 | ||||||||
| United States–1.84% | ||||||||
Avago Technologies Ltd. | 322,817 | 14,665,576 | ||||||
Total Common Stocks & Other Equity Interests |
| 691,268,295 | ||||||
Money Market Funds–12.40% | ||||||||
Liquid Assets Portfolio–Institutional Class(b) | 49,314,322 | 49,314,322 | ||||||
Premier Portfolio–Institutional Class(b) | 49,314,321 | 49,314,321 | ||||||
Total Money Market Funds | 98,628,643 | |||||||
TOTAL INVESTMENTS–99.30% | 789,896,938 | |||||||
OTHER ASSETS LESS LIABILITIES–0.70% | 5,579,186 | |||||||
NET ASSETS–100.00% | $ | 795,476,124 | ||||||
Investment Abbreviations:
| ADR | – American Depositary Receipt | |
| PDR | – Philippine Depositary Receipt | |
Notes to Schedule of Investments:
| (a) | Non-income producing security. |
| (b) | The money market fund and the Fund are affiliated by having the same investment adviser. |
See accompanying Notes to Financial Statements which are an integral part of the financial statements.
9 Invesco Asia Pacific Growth Fund
Statement of Assets and Liabilities
October 31, 2013
Assets: |
| |||
Investments, at value (Cost $481,965,642) | $ | 691,268,295 | ||
Investments in affiliated money market funds, at value and cost | 98,628,643 | |||
Total investments, at value (Cost $580,594,285) | 789,896,938 | |||
Foreign currencies, at value (Cost $9,535,965) | 9,686,225 | |||
Receivable for: | ||||
Fund shares sold | 1,752,801 | |||
Dividends | 4,548 | |||
Investment for trustee deferred compensation and retirement plans | 55,577 | |||
Other assets | 39,963 | |||
Total assets | 801,436,052 | |||
Liabilities: |
| |||
Payable for: | ||||
Fund shares reacquired | 771,210 | |||
Accrued foreign taxes | 4,411,949 | |||
Accrued fees to affiliates | 492,240 | |||
Accrued trustees’ and officers’ fees and benefits | 2,129 | |||
Accrued other operating expenses | 149,230 | |||
Trustee deferred compensation and retirement plans | 133,170 | |||
Total liabilities | 5,959,928 | |||
Net assets applicable to shares outstanding | $ | 795,476,124 | ||
Net assets consist of: |
| |||
Shares of beneficial interest | $ | 540,492,381 | ||
Undistributed net investment income | 5,675,461 | |||
Undistributed net realized gain | 39,855,369 | |||
Net unrealized appreciation | 209,452,913 | |||
| $ | 795,476,124 | |||
Net Assets: |
| |||
Class A | $ | 555,504,894 | ||
Class B | $ | 22,421,238 | ||
Class C | $ | 96,519,520 | ||
Class Y | $ | 121,030,472 | ||
Shares outstanding, $0.001 par value per share, |
| |||
Class A | 16,605,834 | |||
Class B | 716,593 | |||
Class C | 3,102,128 | |||
Class Y | 3,605,628 | |||
Class A: | ||||
Net asset value per share | $ | 33.45 | ||
Maximum offering price per share | ||||
(Net asset value of $33.45 ¸ 94.50%) | $ | 35.40 | ||
Class B: | ||||
Net asset value and offering price per share | $ | 31.29 | ||
Class C: | ||||
Net asset value and offering price per share | $ | 31.11 | ||
Class Y: | ||||
Net asset value and offering price per share | $ | 33.57 | ||
See accompanying Notes to Financial Statements which are an integral part of the financial statements.
10 Invesco Asia Pacific Growth Fund
Statement of Operations
For the year ended October 31, 2013
Investment income: |
| |||
Dividends (net of foreign withholding taxes of $1,588,283) | $ | 17,682,440 | ||
Dividends from affiliated money market funds | 67,465 | |||
Total investment income | 17,749,905 | |||
Expenses: | ||||
Advisory fees | 6,689,034 | |||
Administrative services fees | 183,966 | |||
Custodian fees | 517,249 | |||
Distribution fees: | ||||
Class A | 1,308,587 | |||
Class B | 258,177 | |||
Class C | 921,459 | |||
Transfer agent fees | 1,326,087 | |||
Trustees’ and officers’ fees and benefits | 48,868 | |||
Other | 325,777 | |||
Total expenses | 11,579,204 | |||
Less: Fees waived and expense offset arrangement(s) | (117,555 | ) | ||
Net expenses | 11,461,649 | |||
Net investment income | 6,288,256 | |||
Realized and unrealized gain (loss) from: | ||||
Net realized gain (loss) from: | ||||
Investment securities | 40,447,477 | |||
Foreign currencies | (103,485 | ) | ||
| 40,343,992 | ||||
Change in net unrealized appreciation (depreciation) of: | ||||
Investment securities (net of foreign taxes on holdings of $(251,807)) | 31,205,412 | |||
Foreign currencies | (60,446 | ) | ||
| 31,144,966 | ||||
Net realized and unrealized gain | 71,488,958 | |||
Net increase in net assets resulting from operations | $ | 77,777,214 | ||
See accompanying Notes to Financial Statements which are an integral part of the financial statements.
11 Invesco Asia Pacific Growth Fund
Statement of Changes in Net Assets
For the years ended October 31, 2013 and 2012
| 2013 | 2012 | |||||||
Operations: |
| |||||||
Net investment income | $ | 6,288,256 | $ | 4,263,033 | ||||
Net realized gain | 40,343,992 | 12,622,481 | ||||||
Change in net unrealized appreciation | 31,144,966 | 71,934,724 | ||||||
Net increase in net assets resulting from operations | 77,777,214 | 88,820,238 | ||||||
Distributions to shareholders from net investment income: | ||||||||
Class A | (3,012,794 | ) | (3,532,360 | ) | ||||
Class B | — | (26,763 | ) | |||||
Class C | — | (67,611 | ) | |||||
Class Y | (540,337 | ) | (406,659 | ) | ||||
Total distributions from net investment income | (3,553,131 | ) | (4,033,393 | ) | ||||
Distributions to shareholders from net realized gains: | ||||||||
Class A | (9,721,485 | ) | (27,939,694 | ) | ||||
Class B | (603,903 | ) | (2,323,311 | ) | ||||
Class C | (1,852,367 | ) | (5,869,287 | ) | ||||
Class Y | (1,304,896 | ) | (2,471,959 | ) | ||||
Total distributions from net realized gains | (13,482,651 | ) | (38,604,251 | ) | ||||
Share transactions–net: | ||||||||
Class A | 53,882,110 | 37,767,909 | ||||||
Class B | (6,880,003 | ) | (5,357,121 | ) | ||||
Class C | 9,131,466 | (2,874,407 | ) | |||||
Class Y | 54,724,041 | 19,111,110 | ||||||
Net increase in net assets resulting from share transactions | 110,857,614 | 48,647,491 | ||||||
Net increase in net assets | 171,599,046 | 94,830,085 | ||||||
Net assets: | ||||||||
Beginning of year | 623,877,078 | 529,046,993 | ||||||
End of year (includes undistributed net investment income of $5,675,461 and $3,043,821, respectively) | $ | 795,476,124 | $ | 623,877,078 | ||||
Notes to Financial Statements
October 31, 2013
NOTE 1—Significant Accounting Policies
Invesco Asia Pacific Growth Fund (the “Fund”) is a series portfolio of AIM International Mutual Funds (Invesco International Mutual Funds) (the “Trust”). The Trust is a Delaware statutory trust registered under the Investment Company Act of 1940, as amended (the “1940 Act”), as an open-end series management investment company consisting of eight separate portfolios, each authorized to issue an unlimited number of shares of beneficial interest. The assets, liabilities and operations of each portfolio are accounted for separately. Information presented in these financial statements pertains only to the Fund. Matters affecting each portfolio or class will be voted on exclusively by the shareholders of such portfolio or class.
The Fund’s investment objective is long-term growth of capital.
The Fund currently consists of four different classes of shares: Class A, Class B, Class C and Class Y. Class A shares are sold with a front-end sales charge unless certain waiver criteria are met and under certain circumstances load waived shares may be subject to contingent deferred sales charges (“CDSC”). Class C shares are sold with a CDSC. Class Y shares are sold at net asset value. Effective November 30, 2010, new or additional investments in Class B shares are no longer permitted. Existing shareholders of Class B shares may continue to reinvest dividends and capital gains distributions in Class B shares until they convert to Class A shares. Also, shareholders in Class B shares will be able to exchange those shares for Class B shares of other Invesco Funds offering such shares until they convert to Class A shares. Generally, Class B shares will automatically convert to Class A shares on or about the month-end, which is at least eight years after the date of purchase. Redemption of Class B shares prior to the conversion date will be subject to a CDSC.
The following is a summary of the significant accounting policies followed by the Fund in the preparation of its financial statements.
| A. | Security Valuations — Securities, including restricted securities, are valued according to the following policy. |
A security listed or traded on an exchange (except convertible bonds) is valued at its last sales price or official closing price as of the close of the customary trading session on the exchange where the security is principally traded, or lacking any sales or official closing price on a particular day, the security may be valued at the closing bid price on that day. Securities traded in the over-the-counter market are valued based on prices
12 Invesco Asia Pacific Growth Fund
furnished by independent pricing services or market makers. When such securities are valued by an independent pricing service they may be considered fair valued. Futures contracts are valued at the final settlement price set by an exchange on which they are principally traded. Listed options are valued at the mean between the last bid and ask prices from the exchange on which they are principally traded. Options not listed on an exchange are valued by an independent source at the mean between the last bid and ask prices. For purposes of determining net asset value per share, futures and option contracts generally are valued 15 minutes after the close of the customary trading session of the New York Stock Exchange (“NYSE”).
Investments in open-end and closed-end registered investment companies that do not trade on an exchange are valued at the end of day net asset value per share. Investments in open-end and closed-end registered investment companies that trade on an exchange are valued at the last sales price or official closing price as of the close of the customary trading session on the exchange where the security is principally traded.
Debt obligations (including convertible bonds) and unlisted equities are fair valued using an evaluated quote provided by an independent pricing service. Evaluated quotes provided by the pricing service may be determined without exclusive reliance on quoted prices, and may reflect appropriate factors such as institution-size trading in similar groups of securities, developments related to specific securities, dividend rate (for unlisted equities), yield (for debt obligations), quality, type of issue, coupon rate (for debt obligations), maturity (for debt obligations), individual trading characteristics and other market data. Debt obligations are subject to interest rate and credit risks. In addition, all debt obligations involve some risk of default with respect to interest and/or principal payments.
Foreign securities’ (including foreign exchange contracts) prices are converted into U.S. dollar amounts using the applicable exchange rates as of the close of the NYSE. If market quotations are available and reliable for foreign exchange-traded equity securities, the securities will be valued at the market quotations. Because trading hours for certain foreign securities end before the close of the NYSE, closing market quotations may become unreliable. If between the time trading ends on a particular security and the close of the customary trading session on the NYSE, events occur that the Adviser determines are significant and make the closing price unreliable, the Fund may fair value the security. If the event is likely to have affected the closing price of the security, the security will be valued at fair value in good faith using procedures approved by the Board of Trustees. Adjustments to closing prices to reflect fair value may also be based on a screening process of an independent pricing service to indicate the degree of certainty, based on historical data, that the closing price in the principal market where a foreign security trades is not the current value as of the close of the NYSE. Foreign securities’ prices meeting the approved degree of certainty that the price is not reflective of current value will be priced at the indication of fair value from the independent pricing service. Multiple factors may be considered by the independent pricing service in determining adjustments to reflect fair value and may include information relating to sector indices, American Depositary Receipts and domestic and foreign index futures. Foreign securities may have additional risks including exchange rate changes, potential for sharply devalued currencies and high inflation, political and economic upheaval, the relative lack of issuer information, relatively low market liquidity and the potential lack of strict financial and accounting controls and standards.
Securities for which market prices are not provided by any of the above methods may be valued based upon quotes furnished by independent sources. The last bid price may be used to value equity securities. The mean between the last bid and asked prices is used to value debt obligations, including corporate loans.
Securities for which market quotations are not readily available or became unreliable are valued at fair value as determined in good faith by or under the supervision of the Trust’s officers following procedures approved by the Board of Trustees. Issuer specific events, market trends, bid/ask quotes of brokers and information providers and other market data may be reviewed in the course of making a good faith determination of a security’s fair value.
Valuations change in response to many factors including the historical and prospective earnings of the issuer, the value of the issuer’s assets, general economic conditions, interest rates, investor perceptions and market liquidity. Because of the inherent uncertainties of valuation, the values reflected in the financial statements may materially differ from the value received upon actual sale of those investments.
| B. | Securities Transactions and Investment Income — Securities transactions are accounted for on a trade date basis. Realized gains or losses on sales are computed on the basis of specific identification of the securities sold. Interest income is recorded on the accrual basis from settlement date. Dividend income (net of withholding tax, if any) is recorded on the ex-dividend date. |
The Fund may periodically participate in litigation related to Fund investments. As such, the Fund may receive proceeds from litigation settlements. Any proceeds received are included in the Statement of Operations as realized gain (loss) for investments no longer held and as unrealized gain (loss) for investments still held.
Brokerage commissions and mark ups are considered transaction costs and are recorded as an increase to the cost basis of securities purchased and/or a reduction of proceeds on a sale of securities. Such transaction costs are included in the determination of net realized and unrealized gain (loss) from investment securities reported in the Statement of Operations and the Statement of Changes in Net Assets and the net realized and unrealized gains (losses) on securities per share in the Financial Highlights. Transaction costs are included in the calculation of the Fund’s net asset value and, accordingly, they reduce the Fund’s total returns. These transaction costs are not considered operating expenses and are not reflected in net investment income reported in the Statement of Operations and Statement of Changes in Net Assets, or the net investment income per share and ratios of expenses and net investment income reported in the Financial Highlights, nor are they limited by any expense limitation arrangements between the Fund and the investment adviser.
The Fund allocates income and realized and unrealized capital gains and losses to a class based on the relative net assets of each class.
| C. | Country Determination — For the purposes of making investment selection decisions and presentation in the Schedule of Investments, the investment adviser may determine the country in which an issuer is located and/or credit risk exposure based on various factors. These factors include the laws of the country under which the issuer is organized, where the issuer maintains a principal office, the country in which the issuer derives 50% or more of its total revenues and the country that has the primary market for the issuer’s securities, as well as other criteria. Among the other criteria that may be evaluated for making this determination are the country in which the issuer maintains 50% or more of its assets, the type of security, financial guarantees and enhancements, the nature of the collateral and the sponsor organization. Country of issuer and/or credit risk exposure has been determined to be the United States of America, unless otherwise noted. |
| D. | Distributions — Distributions from income and net realized capital gain, if any, are generally declared and paid annually and recorded on the ex-dividend date. The Fund may elect to treat a portion of the proceeds from redemptions as distributions for federal income tax purposes. |
13 Invesco Asia Pacific Growth Fund
| E. | Federal Income Taxes — The Fund intends to comply with the requirements of Subchapter M of the Internal Revenue Code of 1986, as amended (the “Internal Revenue Code”), necessary to qualify as a regulated investment company and to distribute substantially all of the Fund’s taxable earnings to shareholders. As such, the Fund will not be subject to federal income taxes on otherwise taxable income (including net realized capital gain) that is distributed to shareholders. Therefore, no provision for federal income taxes is recorded in the financial statements. |
The Fund files tax returns in the U.S. Federal jurisdiction and certain other jurisdictions. Generally, the Fund is subject to examinations by such taxing authorities for up to three years after the filing of the return for the tax period.
| F. | Expenses — Fees provided for under the Rule 12b-1 plan of a particular class of the Fund and which are directly attributable to that class are charged to the operations of such class. All other expenses are allocated among the classes based on relative net assets. |
| G. | Accounting Estimates — The preparation of financial statements in conformity with accounting principles generally accepted in the United States of America (“GAAP”) requires management to make estimates and assumptions that affect the reported amounts of assets and liabilities at the date of the financial statements and the reported amounts of revenues and expenses during the reporting period including estimates and assumptions related to taxation. Actual results could differ from those estimates by a significant amount. In addition, the Fund monitors for material events or transactions that may occur or become known after the period-end date and before the date the financial statements are released to print. |
| H. | Indemnifications — Under the Trust’s organizational documents, each Trustee, officer, employee or other agent of the Trust is indemnified against certain liabilities that may arise out of the performance of their duties to the Fund. Additionally, in the normal course of business, the Fund enters into contracts, including the Fund’s servicing agreements, that contain a variety of indemnification clauses. The Fund’s maximum exposure under these arrangements is unknown as this would involve future claims that may be made against the Fund that have not yet occurred. The risk of material loss as a result of such indemnification claims is considered remote. |
| I. | Foreign Currency Translations — Foreign currency is valued at the close of the NYSE based on quotations posted by banks and major currency dealers. Portfolio securities and other assets and liabilities denominated in foreign currencies are translated into U.S. dollar amounts at date of valuation. Purchases and sales of portfolio securities (net of foreign taxes withheld on disposition) and income items denominated in foreign currencies are translated into U.S. dollar amounts on the respective dates of such transactions. The Fund does not separately account for the portion of the results of operations resulting from changes in foreign exchange rates on investments and the fluctuations arising from changes in market prices of securities held. The combined results of changes in foreign exchange rates and the fluctuation of market prices on investments (net of estimated foreign tax withholding) are included with the net realized and unrealized gain or loss from investments in the Statement of Operations. Reported net realized foreign currency gains or losses arise from (1) sales of foreign currencies, (2) currency gains or losses realized between the trade and settlement dates on securities transactions, and (3) the difference between the amounts of dividends, interest, and foreign withholding taxes recorded on the Fund’s books and the U.S. dollar equivalent of the amounts actually received or paid. Net unrealized foreign currency gains and losses arise from changes in the fair values of assets and liabilities, other than investments in securities at fiscal period end, resulting from changes in exchange rates. |
The Fund may invest in foreign securities which may be subject to foreign taxes on income, gains on investments or currency repatriation, a portion of which may be recoverable.
| J. | Foreign Currency Contracts — The Fund may enter into foreign currency contracts to manage or minimize currency or exchange rate risk. The Fund may also enter into foreign currency contracts for the purchase or sale of a security denominated in a foreign currency in order to “lock in” the U.S. dollar price of that security. A foreign currency contract is an obligation to purchase or sell a specific currency for an agreed-upon price at a future date. The use of foreign currency contracts does not eliminate fluctuations in the price of the underlying securities the Fund owns or intends to acquire but establishes a rate of exchange in advance. Fluctuations in the value of these contracts are measured by the difference in the contract date and reporting date exchange rates and are recorded as unrealized appreciation (depreciation) until the contracts are closed. When the contracts are closed, realized gains (losses) are recorded. Realized and unrealized gains (losses) on the contracts are included in the Statement of Operations. The primary risks associated with foreign currency contracts include failure of the counterparty to meet the terms of the contract and the value of the foreign currency changing unfavorably. These risks may be in excess of the amounts reflected in the Statement of Assets and Liabilities. |
NOTE 2—Advisory Fees and Other Fees Paid to Affiliates
The Trust has entered into a master investment advisory agreement with Invesco Advisers, Inc. (the “Adviser” or “Invesco”). Under the terms of the investment advisory agreement, the Fund pays an advisory fee to the Adviser based on the annual rate of the Fund’s average daily net assets as follows:
| Average Daily Net Assets | Rate | |||||
First $250 million | 0 | .935% | ||||
Next $250 million | 0 | .91% | ||||
Next $500 million | 0 | .885% | ||||
Next $1.5 billion | 0 | .86% | ||||
Next $2.5 billion | 0 | .835% | ||||
Next $2.5 billion | 0 | .81% | ||||
Next $2.5 billion | 0 | .785% | ||||
Over $10 billion | 0 | .76% | ||||
Under the terms of a master sub-advisory agreement between the Adviser and each of Invesco Asset Management Deutschland GmbH, Invesco Asset Management Limited, Invesco Asset Management (Japan) Limited, Invesco Australia Limited, Invesco Hong Kong Limited, Invesco Senior Secured Management, Inc. and Invesco Canada Ltd. (collectively, the “Affiliated Sub-Advisers”) the Adviser, not the Fund, may pay 40% of the fees paid to the
14 Invesco Asia Pacific Growth Fund
Adviser to any such Affiliated Sub-Adviser(s) that provide(s) discretionary investment management services to the Fund based on the percentage of assets allocated to such Sub-Adviser(s).
The Adviser has contractually agreed, through at least June 30, 2014, to waive advisory fees and/or reimburse expenses of all shares to the extent necessary to limit total annual fund operating expenses after fee waiver and/or expense reimbursement (excluding certain items discussed below) of Class A, Class B, Class C and Class Y shares to 2.25%, 3.00%, 3.00% and 2.00%, respectively, of average daily net assets. In determining the Adviser’s obligation to waive advisory fees and/or reimburse expenses, the following expenses are not taken into account, and could cause the total annual fund operating expenses after fee waiver and/or expense reimbursement to exceed the numbers reflected above: (1) interest; (2) taxes; (3) dividend expense on short sales; (4) extraordinary or non-routine items; and (5) expenses that the Fund has incurred but did not actually pay because of an expense offset arrangement. Unless Invesco continues the fee waiver agreement, it will terminate on June 30, 2014. The fee waiver agreement cannot be terminated during its term. The Adviser did not waive fees and/or reimburse expenses during the period under this expense limitation.
Further, the Adviser has contractually agreed, through June 30, 2014, to waive the advisory fee payable by the Fund in an amount equal to 100% of the net advisory fees the Adviser receives from the affiliated money market funds on investments by the Fund of uninvested cash in such affiliated money market funds.
For the year ended October 31, 2013, the Adviser waived advisory fees of $114,382.
The Trust has entered into a master administrative services agreement with Invesco pursuant to which the Fund has agreed to pay Invesco for certain administrative costs incurred in providing accounting services to the Fund. For the year ended October 31, 2013, expenses incurred under the agreement are shown in the Statement of Operations as Administrative services fees.
The Trust has entered into a transfer agency and service agreement with Invesco Investment Services, Inc. (“IIS”) pursuant to which the Fund has agreed to pay IIS a fee for providing transfer agency and shareholder services to the Fund and reimburse IIS for certain expenses incurred by IIS in the course of providing such services. IIS may make payments to intermediaries that provide omnibus account services, sub-accounting services and/or networking services. All fees payable by IIS to intermediaries that provide omnibus account services or sub-accounting are charged back to the Fund, subject to certain limitations approved by the Trust’s Board of Trustees. For the year ended October 31, 2013, the expenses incurred under the agreement are shown in the Statement of Operations as Transfer agent fees.
The Trust has entered into master distribution agreements with Invesco Distributors, Inc. (“IDI”) to serve as the distributor for the Class A, Class B, Class C and Class Y shares of the Fund. The Trust has adopted plans pursuant to Rule 12b-1 under the 1940 Act with respect to the Fund’s Class A, Class B and Class C shares (collectively, the “Plans”). The Fund, pursuant to the Plans, pays IDI compensation at the annual rate of 0.25% of the Fund’s average daily net assets of Class A shares and 1.00% of the average daily net assets of each class of Class B and Class C shares. Of the Plan payments, up to 0.25% of the average daily net assets of each class of shares may be paid to furnish continuing personal shareholder services to customers who purchase and own shares of such classes. Any amounts not paid as a service fee under the Plans would constitute an asset-based sales charge. Rules of the Financial Industry Regulatory Authority (“FINRA”) impose a cap on the total sales charges, including asset-based sales charges, that may be paid by any class of shares of the Fund. For the year ended October 31, 2013, expenses incurred under the Plans are shown in the Statement of Operations as Distribution fees.
Front-end sales commissions and CDSC (collectively, the “sales charges”) are not recorded as expenses of the Fund. Front-end sales commissions are deducted from proceeds from the sales of Fund shares prior to investment in Class A shares of the Fund. CDSC are deducted from redemption proceeds prior to remittance to the shareholder. During the year ended October 31, 2013, IDI advised the Fund that IDI retained $240,779 in front-end sales commissions from the sale of Class A shares and $2,636, $17,096 and $11,691 from Class A, Class B and Class C shares, respectively, for CDSC imposed on redemptions by shareholders.
Certain officers and trustees of the Trust are officers and directors of the Adviser, IIS and/or IDI.
NOTE 3—Additional Valuation Information
GAAP defines fair value as the price that would be received to sell an asset or paid to transfer a liability in an orderly transaction between market participants at the measurement date, under current market conditions. GAAP establishes a hierarchy that prioritizes the inputs to valuation methods, giving the highest priority to readily available unadjusted quoted prices in an active market for identical assets (Level 1) and the lowest priority to significant unobservable inputs (Level 3), generally when market prices are not readily available or are unreliable. Based on the valuation inputs, the securities or other investments are tiered into one of three levels. Changes in valuation methods may result in transfers in or out of an investment’s assigned level:
| Level 1 — | Prices are determined using quoted prices in an active market for identical assets. |
| Level 2 — | Prices are determined using other significant observable inputs. Observable inputs are inputs that other market participants may use in pricing a security. These may include quoted prices for similar securities, interest rates, prepayment speeds, credit risk, yield curves, loss severities, default rates, discount rates, volatilities and others. |
| Level 3 — | Prices are determined using significant unobservable inputs. In situations where quoted prices or observable inputs are unavailable (for example, when there is little or no market activity for an investment at the end of the period), unobservable inputs may be used. Unobservable inputs reflect the Fund’s own assumptions about the factors market participants would use in determining fair value of the securities or instruments and would be based on the best available information. |
The following is a summary of the tiered valuation input levels, as of October 31, 2013. The level assigned to the securities valuations may not be an indication of the risk or liquidity associated with investing in those securities. Because of the inherent uncertainties of valuation, the values reflected in the financial statements may materially differ from the value received upon actual sale of those investments.
15 Invesco Asia Pacific Growth Fund
During the year ended October 31, 2013, there were transfers from Level 1 to Level 2 of $106,967,255 and from Level 2 to Level 1 of $203,781,398, due to foreign fair value adjustments.
| Level 1 | Level 2 | Level 3 | Total | |||||||||||||
Australia | $ | 57,669,952 | $ | 4,640,026 | $ | — | $ | 62,309,978 | ||||||||
China | 119,305,950 | 67,618,246 | — | 186,924,196 | ||||||||||||
Hong Kong | 60,116,303 | 18,667,767 | — | 78,784,070 | ||||||||||||
Indonesia | 62,080,513 | 17,866,737 | — | 79,947,250 | ||||||||||||
Malaysia | — | 45,525,455 | — | 45,525,455 | ||||||||||||
Philippines | 67,107,899 | — | — | 67,107,899 | ||||||||||||
Singapore | 18,064,700 | 14,826,789 | — | 32,891,489 | ||||||||||||
South Korea | 37,055,550 | 13,413,843 | — | 50,469,393 | ||||||||||||
Taiwan | — | 19,738,458 | — | 19,738,458 | ||||||||||||
Thailand | — | 52,904,531 | — | 52,904,531 | ||||||||||||
United States | 113,294,219 | — | — | 113,294,219 | ||||||||||||
Total Investments | $ | 534,695,086 | $ | 255,201,852 | $ | — | $ | 789,896,938 | ||||||||
NOTE 4—Expense Offset Arrangement(s)
The expense offset arrangement is comprised of transfer agency credits which result from balances in demand deposit accounts used by the transfer agent for clearing shareholder transactions. For the year ended October 31, 2013, the Fund received credits from this arrangement, which resulted in the reduction of the Fund’s total expenses of $3,173.
NOTE 5—Trustees’ and Officers’ Fees and Benefits
Trustees’ and Officers’ Fees and Benefits include amounts accrued by the Fund to pay remuneration to certain Trustees and Officers of the Fund. Trustees have the option to defer compensation payable by the Fund, and Trustees’ and Officers’ Fees and Benefits also include amounts accrued by the Fund to fund such deferred compensation amounts. Those Trustees who defer compensation have the option to select various Invesco Funds in which their deferral accounts shall be deemed to be invested. Finally, certain current Trustees are eligible to participate in a retirement plan that provides for benefits to be paid upon retirement to Trustees over a period of time based on the number of years of service. The Fund may have certain former Trustees who also participate in a retirement plan and receive benefits under such plan. Trustees’ and Officers’ Fees and Benefits include amounts accrued by the Fund to fund such retirement benefits. Obligations under the deferred compensation and retirement plans represent unsecured claims against the general assets of the Fund.
NOTE 6—Cash Balances
The Fund is permitted to temporarily carry a negative or overdrawn balance in its account with State Street Bank and Trust Company, the custodian bank. Such balances, if any at period end, are shown in the Statement of Assets and Liabilities under the payable caption Amount due custodian. To compensate the custodian bank for such overdrafts, the overdrawn Fund may either (1) leave funds as a compensating balance in the account so the custodian bank can be compensated by earning the additional interest; or (2) compensate by paying the custodian bank at a rate agreed upon by the custodian bank and Invesco, not to exceed the contractually agreed upon rate.
NOTE 7—Distributions to Shareholders and Tax Components of Net Assets
Tax Character of Distributions to Shareholders Paid During the Years Ended October 31, 2013 and 2012:
| 2013 | 2012 | |||||||
Ordinary income | $ | 3,553,131 | $ | 4,033,393 | ||||
Long-term capital gain | 13,482,651 | 38,604,251 | ||||||
Total distributions | $ | 17,035,782 | $ | 42,637,644 | ||||
Tax Components of Net Assets at Period-End:
| 2013 | ||||
Undistributed ordinary income | $ | 5,885,038 | ||
Undistributed long-term gain | 40,387,332 | |||
Net unrealized appreciation — investments | 208,682,572 | |||
Net unrealized appreciation — other investments | 150,260 | |||
Temporary book/tax differences | (121,459 | ) | ||
Shares of beneficial interest | 540,492,381 | |||
Total net assets | $ | 795,476,124 | ||
16 Invesco Asia Pacific Growth Fund
The difference between book-basis and tax-basis unrealized appreciation (depreciation) is due to differences in the timing of recognition of gains and losses on investments for tax and book purposes. The Fund’s net unrealized appreciation difference is attributable primarily to wash sales and passive foreign investment companies.
The temporary book/tax differences are a result of timing differences between book and tax recognition of income and/or expenses. The Fund’s temporary book/tax differences are the result of the trustee deferral of compensation and retirement plan benefits.
Capital loss carryforward is calculated and reported as of a specific date. Results of transactions and other activity after that date may affect the amount of capital loss carryforward actually available for the Fund to utilize. Capital losses generated in years beginning after December 22, 2010 can be carried forward for an unlimited period, whereas previous losses expire in 8 tax years. Capital losses with an expiration period may not be used to offset capital gains until all net capital losses without an expiration date have been utilized. Capital loss carryforwards with no expiration date will retain their character as either short-term or long-term capital losses instead of as short-term capital losses as under prior law. The ability to utilize capital loss carryforward in the future may be limited under the Internal Revenue Code and related regulations based on the results of future transactions.
The Fund does not have a capital loss carryforward as of October 31, 2013.
NOTE 8—Investment Securities
The aggregate amount of investment securities (other than short-term securities, U.S. Treasury obligations and money market funds, if any) purchased and sold by the Fund during the year ended October 31, 2013 was $189,309,645 and $115,468,248, respectively. Cost of investments on a tax basis includes the adjustments for financial reporting purposes as of the most recently completed federal income tax reporting period-end.
| Unrealized Appreciation (Depreciation) of Investment Securities on a Tax Basis | ||||
Aggregate unrealized appreciation of investment securities | $ | 218,937,334 | ||
Aggregate unrealized (depreciation) of investment securities | (10,254,762 | ) | ||
Net unrealized appreciation of investment securities | $ | 208,682,572 | ||
Cost of investments for tax purposes is $581,214,366.
NOTE 9—Reclassification of Permanent Differences
Primarily as a result of differing book/tax treatment of foreign currency transactions, on October 31, 2013, undistributed net investment income was decreased by $103,485 and undistributed net realized gain was increased by $103,485. This reclassification had no effect on the net assets of the Fund.
NOTE 10—Share Information
| Summary of Share Activity | ||||||||||||||||
| Years ended October 31, | ||||||||||||||||
| 2013(a) | 2012 | |||||||||||||||
| Shares | Amount | Shares | Amount | |||||||||||||
Sold: | ||||||||||||||||
Class A | 5,889,455 | $ | 189,661,022 | 3,650,438 | $ | 104,623,607 | ||||||||||
Class B | 60,321 | 1,805,112 | 57,168 | 1,528,521 | ||||||||||||
Class C | 932,471 | 27,957,828 | 410,766 | 10,941,363 | ||||||||||||
Class Y | 3,751,686 | 121,128,269 | 1,522,078 | 43,739,490 | ||||||||||||
Issued as reinvestment of dividends: | ||||||||||||||||
Class A | 371,809 | 11,455,419 | 1,123,514 | 28,885,539 | ||||||||||||
Class B | 19,368 | 562,054 | 90,171 | 2,185,470 | ||||||||||||
Class C | 59,702 | 1,722,404 | 228,199 | 5,506,442 | ||||||||||||
Class Y | 47,330 | 1,460,123 | 100,103 | 2,575,648 | ||||||||||||
Automatic conversion of Class B shares to Class A shares: | ||||||||||||||||
Class A | 134,345 | 4,441,862 | 141,257 | 3,996,044 | ||||||||||||
Class B | (146,371 | ) | (4,441,862 | ) | (150,093 | ) | (3,996,044 | ) | ||||||||
Reacquired:(b) | ||||||||||||||||
Class A | (4,730,060 | ) | (151,676,193 | ) | (3,551,899 | ) | (99,737,281 | ) | ||||||||
Class B | (160,134 | ) | (4,805,307 | ) | (190,731 | ) | (5,075,068 | ) | ||||||||
Class C | (687,635 | ) | (20,548,766 | ) | (734,750 | ) | (19,322,212 | ) | ||||||||
Class Y | (2,107,171 | ) | (67,864,351 | ) | (966,018 | ) | (27,204,028 | ) | ||||||||
Net increase in share activity | 3,435,116 | $ | 110,857,614 | 1,730,203 | $ | 48,647,491 | ||||||||||
| (a) | There are entities that are record owners of more than 5% of the outstanding shares of the Fund and in the aggregate own 28% of the outstanding shares of the Fund. IDI has an agreement with these entities to sell Fund shares. The Fund, Invesco and/or Invesco affiliates may make payments to these entities, which are considered to be related to the Fund, for providing services to the Fund, Invesco and/or Invesco affiliates including but not limited to services such as securities brokerage, distribution, third party record keeping and account servicing. The Fund has no knowledge as to whether all or any portion of the shares owned of record by these entities are also owned beneficially. |
| (b) | Net of redemption fees of $10,831 allocated among the classes based on relative net assets of each class for the year ended October 31, 2012. |
17 Invesco Asia Pacific Growth Fund
NOTE 11—Financial Highlights
The following schedule presents financial highlights for a share of the Fund outstanding throughout the periods indicated.
| Net asset value, beginning of period | Net investment income(a) | Net gains (losses) on securities (both realized and unrealized) | Total from investment operations | Dividends from net investment income | Distributions from net realized gains | Total distributions | Net asset value, end of period(b) | Total return(c) | Net assets, end of period (000’s omitted) | Ratio of expenses to average net assets with fee waivers and/or expenses absorbed | Ratio of expenses to average net assets without fee waivers and/or expenses absorbed | Ratio of net to average | Portfolio turnover(d) | |||||||||||||||||||||||||||||||||||||||||||
Class A |
| |||||||||||||||||||||||||||||||||||||||||||||||||||||||
Year Ended 10/31/13 | $ | 30.65 | $ | 0.30 | $ | 3.35 | $ | 3.65 | $ | (0.20 | ) | $ | (0.65 | ) | $ | (0.85 | ) | $ | 33.45 | 12.16 | % | $ | 555,505 | 1.47 | %(e) | 1.49 | %(e) | 0.95 | %(e) | 18 | % | |||||||||||||||||||||||||
Year ended 10/31/12 | 28.42 | 0.26 | 4.34 | 4.60 | (0.27 | ) | (2.10 | ) | (2.37 | ) | 30.65 | 17.77 | 457,964 | 1.54 | 1.55 | 0.89 | 16 | |||||||||||||||||||||||||||||||||||||||
Year ended 10/31/11 | 30.30 | 0.28 | (1.68 | ) | (1.40 | ) | (0.23 | ) | (0.25 | ) | (0.48 | ) | 28.42 | (4.67 | ) | 385,828 | 1.53 | 1.55 | 0.93 | 27 | ||||||||||||||||||||||||||||||||||||
Year ended 10/31/10 | 22.23 | 0.23 | 8.12 | 8.35 | (0.28 | ) | — | (0.28 | ) | 30.30 | 37.97 | 429,596 | 1.60 | 1.61 | 0.91 | 25 | ||||||||||||||||||||||||||||||||||||||||
Year ended 10/31/09 | 13.52 | 0.24 | 8.82 | 9.06 | (0.35 | ) | — | (0.35 | ) | 22.23 | 68.89 | 298,982 | 1.78 | 1.79 | 1.43 | 28 | ||||||||||||||||||||||||||||||||||||||||
Class B |
| |||||||||||||||||||||||||||||||||||||||||||||||||||||||
Year Ended 10/31/13 | 28.74 | 0.06 | 3.14 | 3.20 | — | (0.65 | ) | (0.65 | ) | 31.29 | 11.32 | 22,421 | 2.22 | (e) | 2.24 | (e) | 0.20 | (e) | 18 | |||||||||||||||||||||||||||||||||||||
Year ended 10/31/12 | 26.73 | 0.04 | 4.10 | 4.14 | (0.03 | ) | (2.10 | ) | (2.13 | ) | 28.74 | 16.94 | 27,112 | 2.29 | 2.30 | 0.14 | 16 | |||||||||||||||||||||||||||||||||||||||
Year ended 10/31/11 | 28.58 | 0.05 | (1.59 | ) | (1.54 | ) | (0.06 | ) | (0.25 | ) | (0.31 | ) | 26.73 | (5.41 | ) | 30,394 | 2.28 | 2.30 | 0.18 | 27 | ||||||||||||||||||||||||||||||||||||
Year ended 10/31/10 | 21.02 | 0.04 | 7.69 | 7.73 | (0.17 | ) | — | (0.17 | ) | 28.58 | 36.98 | 40,299 | 2.35 | 2.36 | 0.16 | 25 | ||||||||||||||||||||||||||||||||||||||||
Year ended 10/31/09 | 12.65 | 0.11 | 8.37 | 8.48 | (0.11 | ) | — | (0.11 | ) | 21.02 | 67.63 | 35,178 | 2.53 | 2.54 | 0.68 | 28 | ||||||||||||||||||||||||||||||||||||||||
Class C |
| |||||||||||||||||||||||||||||||||||||||||||||||||||||||
Year Ended 10/31/13 | 28.58 | 0.06 | 3.12 | 3.18 | — | (0.65 | ) | (0.65 | ) | 31.11 | 11.31 | 96,520 | 2.22 | (e) | 2.24 | (e) | 0.20 | (e) | 18 | |||||||||||||||||||||||||||||||||||||
Year ended 10/31/12 | 26.60 | 0.04 | 4.07 | 4.11 | (0.03 | ) | (2.10 | ) | (2.13 | ) | 28.58 | 16.91 | 79,959 | 2.29 | 2.30 | 0.14 | 16 | |||||||||||||||||||||||||||||||||||||||
Year ended 10/31/11 | 28.44 | 0.05 | (1.58 | ) | (1.53 | ) | (0.06 | ) | (0.25 | ) | (0.31 | ) | 26.60 | (5.41 | ) | 76,962 | 2.28 | 2.30 | 0.18 | 27 | ||||||||||||||||||||||||||||||||||||
Year ended 10/31/10 | 20.92 | 0.04 | 7.65 | 7.69 | (0.17 | ) | — | (0.17 | ) | 28.44 | 36.97 | 85,918 | 2.35 | 2.36 | 0.16 | 25 | ||||||||||||||||||||||||||||||||||||||||
Year ended 10/31/09 | 12.59 | 0.11 | 8.33 | 8.44 | (0.11 | ) | — | (0.11 | ) | 20.92 | 67.64 | 55,810 | 2.53 | 2.54 | 0.68 | 28 | ||||||||||||||||||||||||||||||||||||||||
Class Y |
| |||||||||||||||||||||||||||||||||||||||||||||||||||||||
Year Ended 10/31/13 | 30.75 | 0.39 | 3.35 | 3.74 | (0.27 | ) | (0.65 | ) | (0.92 | ) | 33.57 | 12.43 | 121,030 | 1.22 | (e) | 1.24 | (e) | 1.20 | (e) | 18 | ||||||||||||||||||||||||||||||||||||
Year ended 10/31/12 | 28.52 | 0.33 | 4.35 | 4.68 | (0.35 | ) | (2.10 | ) | (2.45 | ) | 30.75 | 18.07 | 58,843 | 1.29 | 1.30 | 1.14 | 16 | |||||||||||||||||||||||||||||||||||||||
Year ended 10/31/11 | 30.39 | 0.35 | (1.68 | ) | (1.33 | ) | (0.29 | ) | (0.25 | ) | (0.54 | ) | 28.52 | (4.43 | ) | 35,862 | 1.28 | 1.30 | 1.18 | 27 | ||||||||||||||||||||||||||||||||||||
Year ended 10/31/10 | 22.28 | 0.30 | 8.14 | 8.44 | (0.33 | ) | — | (0.33 | ) | 30.39 | 38.31 | 32,436 | 1.35 | 1.36 | 1.16 | 25 | ||||||||||||||||||||||||||||||||||||||||
Year ended 10/31/09 | 13.52 | 0.29 | 8.82 | 9.11 | (0.35 | ) | — | (0.35 | ) | 22.28 | 69.31 | 11,785 | 1.53 | 1.54 | 1.68 | 28 | ||||||||||||||||||||||||||||||||||||||||
| (a) | Calculated using average shares outstanding. |
| (b) | Includes redemption fees added to shares of beneficial interest which were less than $0.005 per share for the fiscal years ended October 31, 2012 and prior. |
| (c) | Includes adjustments in accordance with accounting principles generally accepted in the United States of America and as such, the net asset value for financial reporting purposes and the returns based upon those net asset values may differ from the net asset value and returns for shareholder transactions. Does not include sales charges and is not annualized for periods less than one year, if applicable. |
| (d) | Portfolio turnover is calculated at the fund level and is not annualized for periods less than one year, if applicable. |
| (e) | Ratios are based on average daily net assets (000’s) of $523,435, $25,818, $92,146 and $93,238 for Class A, Class B, Class C and Class Y shares, respectively. |
18 Invesco Asia Pacific Growth Fund
Report of Independent Registered Public Accounting Firm
To the Board of Trustees of AIM International Mutual Funds (Invesco International Mutual Funds)
and Shareholders of Invesco Asia Pacific Growth Fund:
In our opinion, the accompanying statement of assets and liabilities, including the schedule of investments, and the related statements of operations and of changes in net assets and the financial highlights present fairly, in all material respects, the financial position of Invesco Asia Pacific Growth Fund (one of the funds constituting AIM International Mutual Funds (Invesco International Mutual Funds), hereafter referred to as the “Fund”) at October 31, 2013, the results of its operations for the year then ended, the changes in its net assets for each of the two years in the period then ended and the financial highlights for each of the five years in the period then ended, in conformity with accounting principles generally accepted in the United States of America. These financial statements and financial highlights (hereafter referred to as “financial statements”) are the responsibility of the Fund’s management; our responsibility is to express an opinion on these financial statements based on our audits. We conducted our audits of these financial statements in accordance with the standards of the Public Company Accounting Oversight Board (United States). Those standards require that we plan and perform the audit to obtain reasonable assurance about whether the financial statements are free of material misstatement. An audit includes examining, on a test basis, evidence supporting the amounts and disclosures in the financial statements, assessing the accounting principles used and significant estimates made by management, and evaluating the overall financial statement presentation. We believe that our audits, which included confirmation of securities at October 31, 2013 by correspondence with the custodian, provide a reasonable basis for our opinion.
PRICEWATERHOUSECOOPERS LLP
December 23, 2013
Houston, Texas
19 Invesco Asia Pacific Growth Fund
Calculating your ongoing Fund expenses
Example
As a shareholder of the Fund, you incur two types of costs: (1) transaction costs, which may include sales charges (loads) on purchase payments or contingent deferred sales charges on redemptions, if any; and (2) ongoing costs, including management fees, distribution and/or service (12b-1) fees, and other Fund expenses. This example is intended to help you understand your ongoing costs (in dollars) of investing in the Fund and to compare these costs with ongoing costs of investing in other mutual funds. The example is based on an investment of $1,000 invested at the beginning of the period and held for the entire period May 1, 2013 through October 31, 2013.
Actual expenses
The table below provides information about actual account values and actual expenses. You may use the information in this table, together with the amount you invested, to estimate the expenses that you paid over the period. Simply divide your account value by $1,000 (for example, an $8,600 account value divided by $1,000 = 8.6), then multiply the result by the number in the table under the heading entitled “Actual Expenses Paid During Period” to estimate the expenses you paid on your account during this period.
Hypothetical example for comparison purposes
The table below also provides information about hypothetical account values and hypothetical expenses based on the Fund’s actual expense ratio and an assumed rate of return of 5% per year before expenses, which is not the Fund’s actual return.
The hypothetical account values and expenses may not be used to estimate the actual ending account balance or expenses you paid for the period. You may use this information to compare the ongoing costs of investing in the Fund and other funds. To do so, compare this 5% hypothetical example with the 5% hypothetical examples that appear in the shareholder reports of the other funds.
Please note that the expenses shown in the table are meant to highlight your ongoing costs only and do not reflect any transaction costs, such as sales charges (loads) on purchase payments or contingent deferred sales charges on redemptions, if any. Therefore, the hypothetical information is useful in comparing ongoing costs only, and will not help you determine the relative total costs of owning different funds. In addition, if these transaction costs were included, your costs would have been higher.
| Class | Beginning Account Value (05/01/13) | ACTUAL | HYPOTHETICAL (5% annual return before | Annualized Expense Ratio | ||||||||||||||||||||
| Ending Account Value (10/31/13)1 | Expenses Paid During Period2 | Ending Account Value (10/31/13) | Expenses Paid During Period2 | |||||||||||||||||||||
| A | $ | 1,000.00 | $ | 998.20 | $ | 7.40 | $ | 1,017.80 | $ | 7.48 | 1.47 | % | ||||||||||||
| B | 1,000.00 | 994.60 | 11.16 | 1,014.01 | 11.27 | 2.22 | ||||||||||||||||||
| C | 1,000.00 | 994.30 | 11.16 | 1,014.01 | 11.27 | 2.22 | ||||||||||||||||||
| Y | 1,000.00 | 999.10 | 6.15 | 1,019.06 | 6.21 | 1.22 | ||||||||||||||||||
| 1 | The actual ending account value is based on the actual total return of the Fund for the period May 1, 2013 through October 31, 2013, after actual expenses and will differ from the hypothetical ending account value which is based on the Fund’s expense ratio and a hypothetical annual return of 5% before expenses. |
| 2 | Expenses are equal to the Fund’s annualized expense ratio as indicated above multiplied by the average account value over the period, multiplied by 184/365 to reflect the most recent fiscal half year. |
20 Invesco Asia Pacific Growth Fund
Approval of Investment Advisory and Sub-Advisory Contracts
The Board of Trustees (the Board) of AIM International Mutual Funds (Invesco International Mutual Funds) is required under the Investment Company Act of 1940, as amended, to approve annually the renewal of Invesco Asia Pacific Growth Fund’s (the Fund) investment advisory agreement with Invesco Advisers, Inc. (Invesco Advisers) and the Master Intergroup Sub-Advisory Contract for Mutual Funds (the sub-advisory contracts) with Invesco Asset Management Deutschland GmbH, Invesco Asset Management Limited, Invesco Asset Management (Japan) Limited, Invesco Australia Limited, Invesco Hong Kong Limited, Invesco Senior Secured Management, Inc. and Invesco Canada Ltd. (collectively, the Affiliated Sub-Advisers). During contract renewal meetings held on June 17-19, 2013, the Board as a whole, and the disinterested or “independent” Trustees, who comprise over 75% of the Board, voting separately, approved the continuance of the Fund’s investment advisory agreement and the sub-advisory contracts for another year, effective July 1, 2013. The Board determined that the continuation of the Fund’s investment advisory agreement and the sub-advisory contracts are in the best interests of the Fund and its shareholders and the compensation payable to Invesco Advisers and the Affiliated Sub-Advisers under the agreements is fair and reasonable.
The Board’s Fund Evaluation Process
The Board’s Investments Committee has established three Sub-Committees, each of which is primarily responsible for overseeing the management of a number of the funds advised by Invesco Advisers (the Invesco Funds). The Sub-Committees meet throughout the year to review the performance of their assigned Invesco Funds, including reviewing materials prepared under the direction of the independent Senior Officer, an officer of the Invesco Funds who reports directly to the independent Trustees. Over the course of each year, the Sub-Committees meet with portfolio managers for their assigned Invesco Funds and other members of management to review the performance, investment objective(s), policies, strategies, limitations and investment risks of these funds. The Sub-Committees meet regularly and at designated contract renewal meetings each year to conduct a review of the performance, fees, expenses and other matters related to their assigned Invesco Funds. Each Sub-Committee recommends to the Investments Committee, which in turn recommends to the full Board, whether and on what terms to approve the continuance of each Invesco Fund’s investment advisory agreement and sub-advisory contracts for another year.
During the contract renewal process, the Trustees receive comparative performance and fee data regarding the Invesco Funds prepared
by Invesco Advisers and Lipper Inc. (Lipper), an independent provider of investment company data. The Trustees also receive an independent written evaluation from the Senior Officer. The Senior Officer’s evaluation is prepared as part of his responsibility to manage the process by which the Invesco Funds’ proposed management fees are negotiated during the annual contract renewal process to ensure they are negotiated in a manner that is at arms’ length and reasonable. The independent Trustees are assisted in their annual evaluation of the Fund’s investment advisory agreement by the Senior Officer and by independent legal counsel. In addition to meetings with Invesco Advisers and fund counsel, the independent Trustees also discuss the continuance of the investment advisory agreement and sub-advisory contracts in separate sessions with the Senior Officer and with independent legal counsel.
In evaluating the fairness and reasonableness of compensation under the Fund’s investment advisory agreement and sub-advisory contracts, the Board considered, among other things, the factors discussed below. The Trustees recognized that the advisory fee rates for the Invesco Funds, in many cases, are the result of years of review and negotiation between the Trustees and Invesco Advisers as well as advisory fees previously approved by different predecessor boards. The Trustees’ deliberations and conclusions in a particular year may be based in part on their deliberations and conclusions regarding these same arrangements throughout the year and in prior years. The Trustees’ review and conclusions are based on the comprehensive consideration of all information presented to them and are not the result of any single determinative factor. Moreover, one Trustee may have weighed a particular piece of information or factor differently than another Trustee.
The discussion below serves as the Senior Officer’s independent written evaluation with respect to the Fund’s investment advisory agreement as well as a discussion of the material factors and related conclusions that formed the basis for the Board’s approval of the Fund’s investment advisory agreement and sub-advisory contracts. Unless otherwise stated, this information is current as of June 19, 2013, and may not reflect consideration of factors that became known to the Board after that date, including, for example, changes to the Fund’s performance, advisory fees, expense limitations and/or fee waivers.
Factors and Conclusions and Summary of Independent Written Fee Evaluation
| A. | Nature, Extent and Quality of Services Provided by Invesco Advisers and the Affiliated Sub-Advisers |
The Board reviewed the advisory services provided to the Fund by Invesco Advisers under
the Fund’s investment advisory agreement, the performance of Invesco Advisers in providing these services, and the credentials and experience of the officers and employees of Invesco Advisers who provide these services, including the Fund’s portfolio manager or managers, with whom the Sub-Committees met during the year. The Board’s review of the qualifications of Invesco Advisers to provide advisory services included the Board’s consideration of Invesco Advisers’ investment process oversight, independent credit analysis and investment risk management.
In determining whether to continue the Fund’s investment advisory agreement, the Board considered the benefits of reapproving an existing relationship and the greater uncertainty that may be associated with entering into a new relationship. The Board also considered non-advisory services that Invesco Advisers and its affiliates provide to the Invesco Funds such as various back office support functions, equity and fixed income trading operations, internal audit, distribution and legal and compliance. The Board concluded that the nature, extent and quality of the services provided to the Fund by Invesco Advisers are appropriate and satisfactory and consistent with the terms of the Fund’s investment advisory agreement.
The Board reviewed the services that may be provided by the Affiliated Sub-Advisers under the sub-advisory contracts and the credentials and experience of the officers and employees of the Affiliated Sub-Advisers who provide these services. The Board noted that the Affiliated Sub-Advisers have offices and personnel that are located in financial centers around the world. As a result, the Affiliated Sub-Advisers can provide research and investment analysis on the markets and economies of various countries in which the Fund may invest, make recommendations regarding securities and assist with security trades. The Board concluded that the sub-advisory contracts benefit the Fund and its shareholders by permitting Invesco Advisers to use the resources and talents of the Affiliated Sub-Advisers in managing the Fund. The Board concluded that the nature, extent and quality of the services that may be provided by the Affiliated Sub-Advisers are appropriate and satisfactory and consistent with the terms of the Fund’s sub-advisory contracts.
| B. | Fund Performance |
The Board considered Fund performance as a relevant factor in considering whether to approve the investment advisory agreement. The Board did not view Fund performance as a relevant factor in considering whether to approve the sub-advisory contracts for the Fund, as no Affiliated Sub-Adviser currently manages assets of the Fund.
The Board compared the Fund’s performance during the past one, three and five calendar years to the performance of funds in the Lipper
21 Invesco Asia Pacific Growth Fund
performance universe and against the Lipper Pacific Region Ex Japan Funds Index. The Board noted that performance of Class A shares of the Fund was in the first quintile of the performance universe for the one, three and five year periods (the first quintile being the best performing funds and the fifth quintile being the worst performing funds). The Board noted that performance of Class A shares of the Fund was above the performance of the Index for the one, three and five year periods. The Trustees also reviewed more recent Fund performance and this review did not change their conclusions.
| C. | Advisory and Sub-Advisory Fees |
The Board compared the Fund’s contractual management fee rate to the contractual management fee rates of funds in the Fund’s Lipper expense group at a common asset level. The Board noted that the contractual management fee rate for Class A shares of the Fund was below the median contractual management fee rate of funds in the expense group. The Board noted that the term “contractual management fee” may include both advisory and certain administrative services fees and that Invesco does not charge the Invesco Funds for the administrative services included in the term as defined by Lipper. The Board also reviewed the methodology used by Lipper in providing expense group information, which includes using each fund’s contractual management fee schedule (including any applicable breakpoints) as reported in the most recent prospectus or statement of additional information for each fund in the expense group.
The Board noted that Invesco Advisers and the Affiliated Sub-Advisers do not manage other funds or client accounts in a manner substantially similar to the management of the Fund.
The Board also considered the services that may be provided by the Affiliated Sub-Advisers pursuant to the sub-advisory contracts, as well as the fees payable by Invesco Advisers to the Affiliated Sub-Advisers pursuant to the sub-advisory contracts. The Board also noted that the sub-advisory fees are not paid directly by the Fund, but rather, are payable by Invesco Advisers to the Affiliated Sub-Advisers.
Based upon the information and considerations described above, the Board concluded that the compensation payable to Invesco Advisers and the Affiliated Sub-Advisers is fair and reasonable.
| D. | Economies of Scale and Breakpoints |
The Board considered the extent to which there are economies of scale in the provision of advisory services to the Fund. The Board also considered whether the Fund benefits from economies of scale through contractual breakpoints in the Fund’s advisory fee schedule and was assisted in this review by a report from the Senior Officer. The Board also noted that the Fund shares directly in economies of scale through lower fees charged by third party service providers based on the combined size of
the Invesco Funds and other clients advised by Invesco Advisers.
| E. | Profitability and Financial Resources |
The Board reviewed information from Invesco Advisers concerning the costs of the advisory and other services that Invesco Advisers and its affiliates provide to the Fund and the profitability of Invesco Advisers and its affiliates in providing these services for the year ended December 31, 2012. The Board received information from Invesco Advisers about the methodology used to prepare the profitability information. The Board considered the profitability of Invesco Advisers in managing the Fund and the Invesco Funds. The Board noted that Invesco Advisers continues to operate at a net profit from services Invesco Advisers and its subsidiaries provide to the Invesco Funds and the Fund. The Board did not deem the level of profits realized by Invesco Advisers and its affiliates from providing services to the Fund to be excessive given the nature, quality and extent of the services provided to the Invesco Funds. The Board received and accepted information from Invesco Advisers demonstrating that Invesco Advisers and each Affiliated Sub-Adviser are financially sound and have the resources necessary to perform their obligations under the investment advisory agreement and sub-advisory contracts.
| F. | Collateral Benefits to Invesco Advisers and its Affiliates |
The Board considered various other benefits received by Invesco Advisers and its affiliates from the relationship with the Fund, including the fees received for their provision of transfer agency and distribution services to the Fund. The Board considered comparative information regarding fees charged for these services, including information provided by Lipper and other independent sources. The Board considered the performance of Invesco Advisers and its affiliates in providing these services and the organizational structure employed to provide these services. The Board also considered that these services are provided to the Fund pursuant to written contracts that are reviewed and approved on an annual basis by the Board; that the services are required for the operation of the Fund; that Invesco Advisers and its affiliates can provide services, the nature and quality of which are at least equal to those provided by others offering the same or similar services; and that the fees for such services are fair and reasonable in light of the usual and customary charges by others for services of the same nature and quality.
The Board considered the benefits realized by Invesco Advisers and the Affiliated Sub-Advisers as a result of portfolio brokerage transactions executed through “soft dollar” arrangements. The Board noted that soft dollar arrangements shift the payment obligation for research services from Invesco Advisers and the Affiliated Sub-Advisers to the Invesco Funds and that the research received may be used with other clients of Invesco Advisers and may reduce Invesco Advisers’ and the Affiliated
Sub-Advisers’ expenses. The Board also considered periodic reports from the Chief Compliance Officer of the Invesco Funds demonstrating that these arrangements are consistent with regulatory requirements. The Board did not deem the soft dollar arrangements to be inappropriate.
The Board considered that the Fund’s uninvested cash and cash collateral from any securities lending arrangements may be invested in money market funds advised by Invesco Advisers pursuant to procedures approved by the Board. The Board noted that Invesco Advisers receives advisory fees from these affiliated money market funds attributable to such investments, although Invesco Advisers has contractually agreed to waive through varying periods the advisory fees payable by the Invesco Funds. The waiver is in an amount equal to 100% of the net advisory fee Invesco Advisers receives from the affiliated money market funds with respect to the Fund’s investment in the affiliated money market funds of uninvested cash, but not cash collateral. The Board concluded that the Fund’s investment of uninvested cash and cash collateral from any securities lending arrangements in the affiliated money market funds is in the best interests of the Fund and its shareholders.
The Board also considered use of an affiliated broker to execute certain trades for the Fund to among other things, control information leakage, and were advised that such trades are executed in compliance with rules under the Investment Company Act of 1940, as amended.
22 Invesco Asia Pacific Growth Fund
Tax Information
Form 1099-DIV, Form 1042-S and other year–end tax information provide shareholders with actual calendar year amounts that should be included in their tax returns. Shareholders should consult their tax advisors.
The following distribution information is being provided as required by the Internal Revenue Code or to meet a specific state’s requirement.
The Fund designates the following amounts or, if subsequently determined to be different, the maximum amount allowable for its fiscal year ended October 31, 2013:
Federal and State Income Tax | ||||
Long-Term Capital Gain Distributions | $ | 13,482,651 | ||
Qualified Dividend Income* | 100 | % | ||
Corporate Dividends Received Deduction* | 0 | % | ||
Foreign Taxes | $ | 0.0666 | per share | |
Foreign Source Income | $ | 0.8074 | per share | |
| * | The above percentages are based on ordinary income dividends paid to shareholders during the Fund’s fiscal year. |
23 Invesco Asia Pacific Growth Fund
Trustees and Officers
The address of each trustee and officer is AIM International Mutual Funds (Invesco International Mutual Funds) (the “Trust”), 11 Greenway Plaza, Suite 1000, Houston, Texas 77046-1173. The trustees serve for the life of the Trust, subject to their earlier death, incapacitation, resignation, retirement or removal as more specifically provided in the Trust’s organizational documents. Each officer serves for a one year term or until their successors are elected and qualified. Column two below includes length of time served with predecessor entities, if any.
Name, Year of Birth and Position(s) Held with the Trust | Trustee and/ or Officer Since | Principal Occupation(s) During Past 5 Years | Number of Funds in Fund Complex Overseen by Trustee | Other Directorship(s) Held by Trustee During Past 5 Years | ||||
| Interested Persons | ||||||||
| Martin L. Flanagan1 — 1960 Trustee | 2007 | Executive Director, Chief Executive Officer and President, Invesco Ltd. (ultimate parent of Invesco and a global investment management firm); Advisor to the Board, Invesco Advisers, Inc. (formerly known as Invesco Institutional (N.A.), Inc.); Trustee, The Invesco Funds; Vice Chair, Investment Company Institute; and Member of Executive Board, SMU Cox School of Business
Formerly: Chairman and Chief Executive Officer, Invesco Advisers, Inc. (registered investment adviser); Director, Chairman, Chief Executive Officer and President, IVZ Inc. (holding company), INVESCO Group Services, Inc. (service provider) and Invesco North American Holdings, Inc. (holding company); Director, Chief Executive Officer and President, Invesco Holding Company Limited (parent of Invesco and a global investment management firm); Director, Invesco Ltd.; Chairman, Investment Company Institute and President, Co-Chief Executive Officer, Co-President, Chief Operating Officer and Chief Financial Officer, Franklin Resources, Inc. (global investment management organization) | 117 | None | ||||
Philip A. Taylor2 — 1954 Trustee, President and Principal Executive Officer | 2006 | Head of North American Retail and Senior Managing Director, Invesco Ltd.; Director, Co-Chairman, Co-President and Co-Chief Executive Officer, Invesco Advisers, Inc. (formerly known as Invesco Institutional (N.A.), Inc.) (registered investment adviser); Director, Chairman, Chief Executive Officer and President, Invesco Management Group, Inc. (formerly known as Invesco Aim Management Group, Inc.) (financial services holding company); Director and President, INVESCO Funds Group, Inc. (registered investment adviser and registered transfer agent); Director and Chairman, Invesco Investment Services, Inc. (formerly known as Invesco Aim Investment Services, Inc.) (registered transfer agent) and IVZ Distributors, Inc. (formerly known as INVESCO Distributors, Inc.) (registered broker dealer); Director, President and Chairman, Invesco Inc. (holding company) and Invesco Canada Holdings Inc. (holding company); Chief Executive Officer, Invesco Corporate Class Inc. (corporate mutual fund company) and Invesco Canada Fund Inc. (corporate mutual fund company); Director, Chairman and Chief Executive Officer, Invesco Canada Ltd. (formerly known as Invesco Trimark Ltd./Invesco Trimark Ltèe) (registered investment adviser and registered transfer agent); Trustee, President and Principal Executive Officer, The Invesco Funds (other than AIM Treasurer’s Series Trust (Invesco Treasurer’s Series Trust) and Short-Term Investments Trust); Trustee and Executive Vice President, The Invesco Funds (AIM Treasurer’s Series Trust (Invesco Treasurer’s Series Trust) and Short-Term Investments Trust only); Director, Invesco Investment Advisers LLC (formerly known as Van Kampen Asset Management); Director, Chief Executive Officer and President, Van Kampen Exchange Corp.
Formerly: Director and Chairman, Van Kampen Investor Services Inc.: Director, Chief Executive Officer and President, 1371 Preferred Inc. (holding company); and Van Kampen Investments Inc.; Director and President, AIM GP Canada Inc. (general partner for limited partnerships); and Van Kampen Advisors, Inc.; Director and Chief Executive Officer, Invesco Trimark Dealer Inc. (registered broker dealer); Director, Invesco Distributors, Inc. (formerly known as Invesco Aim Distributors, Inc.) (registered broker dealer); Manager, Invesco PowerShares Capital Management LLC; Director, Chief Executive Officer and President, Invesco Advisers, Inc.; Director, Chairman, Chief Executive Officer and President, Invesco Aim Capital Management, Inc.; President, Invesco Trimark Dealer Inc. and Invesco Trimark Ltd./Invesco Trimark Ltèe; Director and President, AIM Trimark Corporate Class Inc. and AIM Trimark Canada Fund Inc.; Senior Managing Director, Invesco Holding Company Limited; Trustee and Executive Vice President, Tax-Free Investments Trust; Director and Chairman, Fund Management Company (former registered broker dealer); President and Principal Executive Officer, The Invesco Funds (AIM Treasurer’s Series Trust (Invesco Treasurer’s Series Trust), Short-Term Investments Trust and Tax-Free Investments Trust only); President, AIM Trimark Global Fund Inc. and AIM Trimark Canada Fund Inc. | 117 | None | ||||
Wayne W. Whalen3 — 1939 Trustee | 2010 | Of Counsel, and prior to 2010, partner in the law firm of Skadden, Arps, Slate, Meagher & Flom LLP, legal counsel to certain funds in the Fund Complex | 130 | Director of the Mutual Fund Directors Forum, a nonprofit membership organization for investment directors; Chairman and Director of the Abraham Lincoln Presidential Library Foundation; and Director of the Stevenson Center for Democracy |
| 1 | Mr. Flanagan is considered an interested person of the Trust because he is an officer of the adviser to the Trust, and an officer and a director of Invesco Ltd., ultimate parent of the adviser to the Trust. |
| 2 | Mr. Taylor is considered an interested person of the Trust because he is an officer and a director of the adviser to, and a director of the principal underwriter of, the Trust. |
| 3 | Mr. Whalen is considered an “interested person” (within the meaning of Section 2(a)(19) of the 1940 Act) of certain Funds in the Invesco Fund Complex because he and his firm currently provide legal services as legal counsel to such Funds. |
T-1 Invesco Asia Pacific Growth Fund
Trustees and Officers—(continued)
Name, Year of Birth and Position(s) Held with the Trust | Trustee and/ or Officer Since | Principal Occupation(s) During Past 5 Years | Number of Funds in Fund Complex Overseen by Trustee | Other Directorship(s) Held by Trustee During Past 5 Years | ||||
| Independent Trustees | ||||||||
Bruce L. Crockett — 1944 Trustee and Chair | 1992 | Chairman, Crockett Technologies Associates (technology consulting company)
Formerly: Director, Captaris (unified messaging provider); Director, President and Chief Executive Officer COMSAT Corporation; and Chairman, Board of Governors of INTELSAT (international communications company) | 117 | ACE Limited (insurance company); Investment Company Institute | ||||
David C. Arch — 1945 Trustee | 2010 | Chairman and Chief Executive Officer of Blistex Inc., (consumer health care products manufacturer)
Formerly: Member of the Heartland Alliance Advisory Board, a nonprofit organization serving human needs based in Chicago | 130 | Board member of the Illinois Manufacturers’ Association; Member of the Board of Visitors, Institute for the Humanities, University of Michigan | ||||
Frank S. Bayley — 1939 Trustee | 2001 | Retired
Formerly: Director, Badgley Funds, Inc. (registered investment company) (2 portfolios) and General Partner and Of Counsel, law firm of Baker & McKenzie, LLP | 117 | Director and Chairman, C.D. Stimson Company (a real estate investment company); Trustee and Overseer, The Curtis Institute of Music | ||||
James T. Bunch — 1942 Trustee | 2003 | Managing Member, Grumman Hill Group LLC (family office private equity management)
Formerly: Founder, Green, Manning & Bunch Ltd. (investment banking firm)(1988-2010); Executive Committee, United States Golf Association; and Director, Policy Studies, Inc. and Van Gilder Insurance Corporation | 117 | Chairman, Board of Governors, Western Golf Association; Chairman-elect, Evans Scholars Foundation; and Director, Denver Film Society | ||||
Rodney F. Dammeyer — 1940 Trustee | 2010 | Chairman of CAC, LLC, (private company offering capital investment and management advisory services)
Formerly: Prior to 2001, Managing Partner at Equity Group Corporate Investments; Prior to 1995, Chief Executive Officer of Itel Corporation (formerly Anixter International); Prior to 1985, experience includes Senior Vice President and Chief Financial Officer of Household International, Inc., Executive Vice President and Chief Financial Officer of Northwest Industries, Inc. and Partner of Arthur Andersen & Co.; From 1987 to 2010, Director/Trustee of investment companies in the Van Kampen Funds complex | 117 | Director of Quidel Corporation and Stericycle, Inc.; Prior to May 2008, Trustee of The Scripps Research Institute; Prior to February 2008, Director of Ventana Medical Systems, Inc. | ||||
Albert R. Dowden — 1941 Trustee | 2000 | Director of a number of public and private business corporations, including the Boss Group, Ltd. (private investment and management); and Reich & Tang Funds (5 portfolios) (registered investment company)
Formerly: Director, Homeowners of America Holding Corporation/Homeowners of America Insurance Company (property casualty company); Director, Continental Energy Services, LLC (oil and gas pipeline service); Director, CompuDyne Corporation (provider of product and services to the public security market) and Director, Annuity and Life Re (Holdings), Ltd. (reinsurance company); Director, President and Chief Executive Officer, Volvo Group North America, Inc.; Senior Vice President, AB Volvo; Director of various public and private corporations; Chairman, DHJ Media, Inc.; Director, Magellan Insurance Company; and Director, The Hertz Corporation, Genmar Corporation (boat manufacturer), National Media Corporation; Advisory Board of Rotary Power International (designer, manufacturer, and seller of rotary power engines); and Chairman, Cortland Trust, Inc. (registered investment company) | 117 | Director of Nature’s Sunshine Products, Inc. | ||||
Jack M. Fields — 1952 Trustee | 1997 | Chief Executive Officer, Twenty First Century Group, Inc. (government affairs company); Owner and Chief Executive Officer, Dos Angeles Ranch, L.P. (cattle, hunting, corporate entertainment); and Discovery Global Education Fund (non-profit)
Formerly: Chief Executive Officer, Texana Timber LP (sustainable forestry company); Director of Cross Timbers Quail Research Ranch (non-profit); and member of the U.S. House of Representatives | 117 | Insperity, Inc. (formerly known as Administaff) | ||||
Prema Mathai-Davis — 1950 Trustee | 1998 | Retired
Formerly: Chief Executive Officer, YWCA of the U.S.A. | 117 | None | ||||
Larry Soll — 1942 Trustee | 2003 | Retired
Formerly: Chairman, Chief Executive Officer and President, Synergen Corp. (a biotechnology company) | 117 | None | ||||
Hugo F. Sonnenschein — 1940 Trustee | 2010 | Distinguished Service Professor and President Emeritus of the University of Chicago and the Adam Smith Distinguished Service Professor in the Department of Economics at the University of Chicago
Formerly: President of the University of Chicago | 130 | Trustee of the University of Rochester and a member of its investment committee. Member of the National Academy of Sciences, the American Philosophical Society and a fellow of the American Academy of Arts and Sciences | ||||
Raymond Stickel, Jr. — 1944 Trustee | 2005 | Retired
Formerly: Director, Mainstay VP Series Funds, Inc. (25 portfolios) and Partner, Deloitte & Touche | 117 | None |
T-2 Invesco Asia Pacific Growth Fund
Trustees and Officers—(continued)
Name, Year of Birth and Position(s) Held with the Trust | Trustee and/ or Officer Since | Principal Occupation(s) During Past 5 Years | Number of Funds in Fund Complex Overseen by Trustee | Other Directorship(s) Held by Trustee During Past 5 Years | ||||
| Other Officers | ||||||||
Russell C. Burk — 1958 Senior Vice President and Senior Officer | 2005 | Senior Vice President and Senior Officer, The Invesco Funds | N/A | N/A | ||||
John M. Zerr — 1962 Senior Vice President, Chief Legal Officer and Secretary | 2006 | Director, Senior Vice President, Secretary and General Counsel, Invesco Management Group, Inc. (formerly known as Invesco Aim Management Group, Inc.) and Van Kampen Exchange Corp.; Senior Vice President, Invesco Advisers, Inc. (formerly known as Invesco Institutional (N.A.), Inc.) (registered investment adviser); Senior Vice President and Secretary, Invesco Distributors, Inc. (formerly known as Invesco Aim Distributors, Inc.); Director, Vice President and Secretary, Invesco Investment Services, Inc. (formerly known as Invesco Aim Investment Services, Inc.) and IVZ Distributors, Inc. (formerly known as INVESCO Distributors, Inc.); Director and Vice President, INVESCO Funds Group, Inc.; Senior Vice President, Chief Legal Officer and Secretary, The Invesco Funds; Manager, Invesco PowerShares Capital Management LLC; Director, Secretary and General Counsel, Invesco Investment Advisers LLC (formerly known as Van Kampen Asset Management); Secretary and General Counsel, Invesco Capital Markets, Inc. (formerly known as Van Kampen Funds Inc.) and Chief Legal Officer, PowerShares Exchange-Traded Fund Trust, PowerShares Exchange-Traded Fund Trust II, PowerShares India Exchange-Traded Fund Trust and PowerShares Actively Managed Exchange-Traded Fund Trust
Formerly: Director and Vice President, Van Kampen Advisors Inc.; Director, Vice President, Secretary and General Counsel, Van Kampen Investor Services Inc.; Director, Invesco Distributors, Inc. (formerly known as Invesco Aim Distributors, Inc.); Director, Senior Vice President, General Counsel and Secretary, Invesco Aim Advisers, Inc. and Van Kampen Investments Inc.; Director, Vice President and Secretary, Fund Management Company; Director, Senior Vice President, Secretary, General Counsel and Vice President, Invesco Aim Capital Management, Inc.; Chief Operating Officer and General Counsel, Liberty Ridge Capital, Inc. (an investment adviser); Vice President and Secretary, PBHG Funds (an investment company) and PBHG Insurance Series Fund (an investment company); Chief Operating Officer, General Counsel and Secretary, Old Mutual Investment Partners (a broker-dealer); General Counsel and Secretary, Old Mutual Fund Services (an administrator) and Old Mutual Shareholder Services (a shareholder servicing center); Executive Vice President, General Counsel and Secretary, Old Mutual Capital, Inc. (an investment adviser); and Vice President and Secretary, Old Mutual Advisors Funds (an investment company) | N/A | N/A | ||||
Karen Dunn Kelley — 1960 Vice President | 2004 | Senior Managing Director, Investments; Director, Co-President, Co-Chief Executive Officer, and Co-Chairman, Invesco Advisers, Inc. (formerly known as Invesco Institutional (N.A.), Inc.) (registered investment adviser); Chairman, Invesco Senior Secured Management, Inc.; Senior Vice President, Invesco Management Group, Inc. (formerly known as Invesco Aim Management Group, Inc.); Executive Vice President, Invesco Distributors, Inc. (formerly known as Invesco Aim Distributors, Inc.); Director, Invesco Mortgage Capital Inc., and Invesco Management Company Limited; Director and President, INVESCO Asset Management (Bermuda) Ltd., Vice President, The Invesco Funds (other than AIM Treasurer’s Series Trust (Invesco Treasurer’s Series Trust) and Short-Term Investments Trust); and President and Principal Executive Officer, The Invesco Funds (AIM Treasurer’s Series Trust (Invesco Treasurer’s Series Trust) and Short-Term Investments Trust only)
Formerly: Director, INVESCO Global Asset Management Limited and INVESCO Management S.A.; Senior Vice President, Van Kampen Investments Inc. and Invesco Advisers, Inc. (formerly known as Invesco Institutional (N.A.), Inc.) (registered investment adviser); Vice President, Invesco Advisers, Inc. (formerly known as Invesco Institutional (N.A.), Inc.); Director of Cash Management and Senior Vice President, Invesco Advisers, Inc. and Invesco Aim Capital Management, Inc.; President and Principal Executive Officer, Tax-Free Investments Trust; Director and President, Fund Management Company; Chief Cash Management Officer, Director of Cash Management, Senior Vice President, and Managing Director, Invesco Aim Capital Management, Inc.; Director of Cash Management, Senior Vice President, and Vice President, Invesco Advisers, Inc. and The Invesco Funds (AIM Treasurer’s Series Trust (Invesco Treasurer’s Series Trust), Short-Term Investments Trust and Tax-Free Investments Trust only) | N/A | N/A |
T-3 Invesco Asia Pacific Growth Fund
Trustees and Officers—(continued)
Name, Year of Birth and Position(s) Held with the Trust | Trustee and/ or Officer Since | Principal Occupation(s) During Past 5 Years | Number of Funds in Fund Complex Overseen by Trustee | Other Directorship(s) Held by Trustee During Past 5 Years | ||||
| Other Officers—(continued) | ||||||||
Sheri Morris — 1964 Vice President, Treasurer and Principal Financial Officer | 1999 | Vice President, Treasurer and Principal Financial Officer, The Invesco Funds; Vice President, Invesco Advisers, Inc. (formerly known as Invesco Institutional (N.A.), Inc.) (registered investment adviser); and Vice President, PowerShares Exchange-Traded Fund Trust, PowerShares Exchange-Traded Fund Trust II, PowerShares India Exchange-Traded Fund Trust and PowerShares Actively Managed Exchange-Traded Fund Trust
Formerly: Vice President, Invesco Aim Advisers, Inc., Invesco Aim Capital Management, Inc. and Invesco Aim Private Asset Management, Inc.; Assistant Vice President and Assistant Treasurer, The Invesco Funds and Assistant Vice President, Invesco Advisers, Inc., Invesco Aim Capital Management, Inc. and Invesco Aim Private Asset Management, Inc.; and Treasurer, PowerShares Exchange-Traded Fund Trust, PowerShares Exchange-Traded Fund Trust II, PowerShares India Exchange-Traded Fund Trust and PowerShares Actively Managed Exchange-Traded Fund Trust | N/A | N/A | ||||
Crissie M. Wisdom — 1969 Anti-Money Laundering Compliance Officer | 2013 | Anti-Money Laundering Compliance Officer, Invesco Advisers, Inc. (formerly known as Invesco Institutional (N.A.), Inc.) (registered investment adviser), Invesco Capital Markets, Inc. (formerly known as Van Kampen Funds Inc.), Invesco Distributors, Inc., Invesco Investment Services, Inc., Invesco Management Group, Inc., Van Kampen Exchange Corp., The Invesco Funds, Invesco Funds (Chicago), and PowerShares Exchange-Traded Fund Trust, PowerShares Exchange-Traded Fund Trust II, PowerShares India Exchange-Traded Fund Trust, and PowerShares Actively Managed Exchange-Traded Fund Trust; and Fraud Prevention Manager and Controls and Risk Analysis Manager for Invesco Investment Services, Inc. | N/A | N/A | ||||
Todd L. Spillane — 1958 Chief Compliance Officer | 2006 | Senior Vice President, Invesco Management Group, Inc. (formerly known as Invesco Aim Management Group, Inc.) and Van Kampen Exchange Corp.; Senior Vice President and Chief Compliance Officer, Invesco Advisers, Inc. (registered investment adviser) (formerly known as Invesco Institutional (N.A.), Inc.); Chief Compliance Officer, The Invesco Funds; Vice President, Invesco Distributors, Inc. (formerly known as Invesco Aim Distributors, Inc.) and Invesco Investment Services, Inc. (formerly known as Invesco Aim Investment Services, Inc.)
Formerly: Chief Compliance Officer, Invesco Funds (Chicago); Senior Vice President, Van Kampen Investments Inc.; Senior Vice President and Chief Compliance Officer, Invesco Aim Advisers, Inc. and Invesco Aim Capital Management, Inc.; Chief Compliance Officer, INVESCO Private Capital Investments, Inc. (holding company), Invesco Private Capital, Inc. (registered investment adviser), Invesco Global Asset Management (N.A.), Inc., Invesco Senior Secured Management, Inc. (registered investment adviser), Van Kampen Investor Services Inc., PowerShares Exchange-Traded Fund Trust, PowerShares Exchange-Traded Fund Trust II, PowerShares India Exchange-Traded Fund Trust and PowerShares Actively Managed Exchange-Traded Fund Trust; and Vice President, Invesco Aim Capital Management, Inc. and Fund Management Company | N/A | N/A |
The Statement of Additional Information of the Trust includes additional information about the Fund’s Trustees and is available upon request, without charge, by calling 1.800.959.4246. Please refer to the Fund’s prospectus for information on the Fund’s sub-advisers.
Office of the Fund 11 Greenway Plaza, Suite 1000 Houston, TX 77046-1173 | Investment Adviser Invesco Advisers, Inc. 1555 Peachtree Street, N.E. Atlanta, GA 30309 | Distributor Invesco Distributors, Inc. 11 Greenway Plaza, Suite 1000 Houston, TX 77046-1173 | Auditors PricewaterhouseCoopers LLP 1201 Louisiana Street, Suite 2900 Houston, TX 77002-5678 | |||
Counsel to the Fund Stradley Ronon Stevens & Young, LLP 2005 Market Street, Suite 2600 Philadelphia, PA 19103-7018 | Counsel to the Independent Trustees Goodwin Procter LLP 901 New York Avenue, N.W. Washington, D.C. 20001 | Transfer Agent Invesco Investment Services, Inc. 11 Greenway Plaza, Suite 1000 Houston, TX 77046-1173 | Custodian State Street Bank and Trust Company 225 Franklin Street Boston, MA 02110-2801 | |||
T-4 Invesco Asia Pacific Growth Fund

Invesco mailing information
Send general correspondence to Invesco Investment Services, Inc., P.O. Box 219078, Kansas City, MO 64121-9078.
Invesco privacy policy
You share personal and financial information with us that is necessary for your transactions and your account records. We take very seriously the obligation to keep that information confidential and private.
Invesco collects nonpublic personal information about you from account applications or other forms you complete and from your transactions with us or our affiliates. We do not disclose information about you or our former customers to service providers or other third parties except to the extent necessary to service your account and in other limited circumstances as permitted by law. For example, we use this information to facilitate the delivery of transaction confirmations, financial reports, prospectuses and tax forms.
Even within Invesco, only people involved in the servicing of your accounts and compliance monitoring have access to your information. To ensure the highest level of confidentiality and security, Invesco maintains physical, electronic and procedural safeguards that meet or exceed federal standards. Special measures, such as data encryption and authentication, apply to your communications with us on our website. More detail is available to you at invesco.com/privacy.
Important notice regarding delivery of security holder documents
To reduce Fund expenses, only one copy of most shareholder documents may be mailed to shareholders with multiple accounts at the same address (Householding). Mailing of your shareholder documents may be householded indefinitely unless you instruct us otherwise. If you do not want the mailing of these documents to be combined with those for other members of your household, please contact Invesco Investment Services, Inc. at 800 959 4246 or contact your financial institution. We will begin sending you individual copies for each account within 30 days after receiving your request.
Fund holdings and proxy voting information
The Fund provides a complete list of its holdings four times in each fiscal year, at the quarter ends. For the second and fourth quarters, the lists appear in the Fund’s semiannual and annual reports to shareholders. For the first and third quarters, the Fund files the lists with the Securities and Exchange Commission (SEC) on Form N-Q. The most recent list of portfolio holdings is available at invesco.com/completeqtrholdings. Shareholders can also look up the Fund’s Forms N-Q on the SEC website at sec.gov. Copies of the Fund’s Forms N-Q may be reviewed and copied at the SEC Public Reference Room in Washington, D.C. You can obtain information on the operation of the Public Reference Room, including information about duplicating fee charges, by calling 202 551 8090 or 800 732 0330, or by electronic request at the following email address: publicinfo@sec.gov. The SEC file numbers for the Fund are shown below.
A description of the policies and procedures that the Fund uses to determine how to vote proxies relating to portfolio securities is available without charge, upon request, from our Client Services department at 800 959 4246 or at invesco.com/proxyguidelines. The information is also available on the SEC website, sec.gov.
Information regarding how the Fund voted proxies related to its portfolio securities during the most recent 12-month period ended June 30 is available at invesco.com/proxysearch. The information is also available on the SEC website, sec.gov. Invesco Advisers, Inc. is an investment adviser; it provides investment advisory services to individual and institutional clients and does not sell securities. Invesco Distributors, Inc. is the US distributor for Invesco Ltd.’s retail mutual funds, exchange-traded funds and institutional money market funds. Both are wholly owned, indirect subsidiaries of Invesco Ltd. |  | |
| SEC file numbers: 811-06463 and 033-44611 APG-AR-1 Invesco Distributors, Inc. | ||
Letters to Shareholders
| Dear Shareholders: Enclosed in this annual report, you’ll find information about your Fund and the factors that affected its performance during the reporting period. Inside, you’ll also find a discussion from your portfolio managers about how they managed your Fund, as well as performance data for your Fund, a complete list of your Fund’s investments as of the close of the reporting period and other important information. I hope you find this report of interest. During the reporting period covered by this report, major US equity indexes made multiyear or even all-time highs.1 Economic data were generally positive; housing and consumer spending data were particularly encouraging. Nonetheless, economic uncertainty and concern about continuing political and budget gridlock in Washington persisted. The US Federal Reserve’s deliberate vagueness about when, and to what degree, it might begin to curtail its extraordinarily accommodative monetary policies affected fixed income and equity | |
markets alike. Most developed, non-US stock markets remained positive for the first half of 2013, despite a difficult second quarter. Periods of market volatility and economic uncertainty can weaken the will of even the most resolute investor. That’s why Invesco believes it’s often helpful to work with a skilled and trusted financial adviser who can emphasize the importance of adhering to an investment plan designed to achieve long-term goals rather than being sidetracked by short-term uncertainty that can result in inaction. A financial adviser who is familiar with your individual financial situation, investment goals and risk tolerance can be an invaluable partner as you work toward your financial goals. He or she can provide insight and perspective when markets are volatile; encouragement and reassurance when times are uncertain; and advice and guidance when your financial situation or investment goals change. Our website, invesco.com/us, is another source of timely insight and information for investors. On the website, you’ll find fund-specific as well as more general information from many of Invesco’s investment professionals. You’ll find in-depth articles, video clips and audio commentaries – and, of course, you also can access information about your Invesco account whenever it’s convenient for you. | ||

What we mean by Intentional Investing
At Invesco, all of our people and all of our resources are dedicated to helping investors achieve their financial objectives. It’s a philosophy we call Intentional Investing, and it guides the way we:
| n | Manage investments – Our dedicated investment professionals search the world for the best opportunities, and each investment team follows a clear, disciplined process to build portfolios and mitigate risk. |
| n | Provide choices – We offer multiple investment strategies, allowing you and your financial adviser to build a portfolio that’s purpose-built for your needs. |
| n | Connect with you – We’re committed to giving you the expert insights you need to make informed investing decisions, and we are well-equipped to provide high-quality support for investors and advisers. |
At Invesco, we believe in putting investors first. That’s why investment management is all we do. Our sole focus on managing your money allows you and your financial adviser to build a portfolio of Invesco funds appropriate for your investment needs and goals today and when your circumstances change.
Have questions?
For questions about your account, feel free to contact an Invesco client services representative at 800 959 4246. For Invesco-related questions or comments, please email me directly at phil@invesco.com.
All of us at Invesco look forward to serving your investment management needs for many years to come. Thank you for investing with us.
Sincerely,

Philip Taylor
Senior Managing Director, Invesco Ltd.
| 1 | Source: Reuters |
| 2 | Invesco European Growth Fund |
 | Dear Fellow Shareholders: The Invesco Funds Board has worked on a variety of issues over the last several months, and I’d like to take this opportunity to discuss two that affect you and our fellow fund shareholders. The first issue on which your Board has been working is our annual review of the funds’ advisory and sub-advisory contracts with Invesco Advisers and its affiliates. This annual review, which is required by the Investment Company Act of 1940, focuses on the nature and quality of the services Invesco provides as adviser to the Invesco Funds and the reasonableness of the fees that it charges for those services. Each year, we spend months reviewing detailed information that we request from Invesco that allows us to evaluate its services and fees. We also use information from many independent sources, including materials provided by the independent Senior Officer of the Invesco Funds, who reports directly to the independent Trustees on the Board. Additionally, we meet with independent | |
| legal counsel and review performance and fee data prepared by Lipper Inc., an independent, third-party firm widely recognized as a leader in its field. | ||
I’m pleased to report that the Board determined in June that renewing the investment advisory agreement and the sub-advisory contracts with Invesco Advisers and its affiliates would serve the best interests of each fund and its shareholders.
The second area of focus to highlight is the Board’s efforts to ensure that we provide a lineup of funds that allow financial advisers to build portfolios that meet shareholders’ changing financial needs and goals. Today, more and more investors are reaching, or approaching, retirement. But interest rates remain low, making it difficult for many investors to generate the income they need, or will soon need, in their retirement years.
The members of your Board think about these things, too, and we’ve worked with Invesco Advisers to provide more income-generating options in the Invesco Funds lineup to help shareholders potentially meet their income needs. Your Board recently approved changes to three existing equity mutual funds, increasing their focus on generating income while also seeking to provide long-term growth of capital.
As a result of these changes, the funds and their respective management teams now have more flexibility to invest in the types of securities that could meet investors’ growing need for income generation, and in some cases, also help investors diversify their sources of income. These equity funds complement an array of fixed-income, asset allocation and alternative investment options in the Invesco Funds lineup designed to accommodate a variety of risk tolerances.
Be assured that your Board will continue working on behalf of fund shareholders, keeping your needs and interests uppermost in our minds.
As always, please contact me at bruce@brucecrockett.com with any questions or concerns you may have. On behalf of the Board, we look forward to continuing to represent your interests and serving your needs.
Sincerely,

Bruce L. Crockett
Independent Chair
Invesco Funds Board of Trustees
| 3 | Invesco European Growth Fund |
Management’s Discussion of Fund Performance
Performance summary
For the fiscal year ended October 31, 2013, Invesco European Growth Fund, at net asset value (NAV), delivered double-digit returns but underperformed its style-specific benchmark, the MSCI Europe Growth Index. The Fund delivered positive returns across all major invested markets; however, a higher-than-average cash position during a period when markets were up double digits detracted from relative returns.
Your Fund’s long-term performance appears later in this report.
Fund vs. Indexes
Total returns, 10/31/12 to 10/31/13, at net asset value (NAV). Performance shown does not include applicable contingent deferred sales charges (CDSC) or front-end sales charges, which would have reduced performance.
| Class A Shares | 23.72 | % | ||
| Class B Shares | 22.78 | |||
| Class C Shares | 22.80 | |||
| Class R Shares | 23.42 | |||
| Class Y Shares | 24.01 | |||
| Investor Class Shares | 23.74 | |||
| MSCI EAFE Index‚ (Broad Market Index) | 26.88 | |||
| MSCI Europe Growth Indexn (Style-Specific Index) | 25.89 | |||
| Lipper European Funds Index (Peer Group Index)n | 31.58 |
Source(s): ‚Invesco, MSCI via FactSet Research Systems Inc.; nLipper Inc.
How we invest
When selecting stocks for your Fund, we use a disciplined investment strategy that emphasizes fundamental research to identify quality growth companies. This strategy is supported by quantitative analysis, portfolio construction and risk management techniques. Our EQV (earnings, quality and valuation) strategy focuses on identifying stocks that we believe have sustainable above-average earnings growth, efficient capital allocation and attractive prices.
While research responsibilities within the portfolio management team are focused by geographic region, we select investments for the Fund using a bottom-up investment approach, which means we construct the Fund primarily on a stock-by-stock basis. We focus on the strengths of individual companies rather than sectors, countries or market-cap trends.
We believe disciplined sell decisions are the key to successful investing. We consider selling a stock for several reasons, including when:
| n | Its price changes such that we believe it has become too expensive. |
| n | The original investment thesis for the company is no longer valid. |
| n | A more compelling investment opportunity is identified. |
Market conditions and your Fund
The fiscal year ended October 31, 2013, saw slow but steady improvement in global economies and strong US and global equity market returns.
Improving macroeconomic data and a continued reduction in political uncertainty buoyed European equity markets as the reporting period progressed. UK equities ended the reporting period strongly across many sectors, spurred by improv-
ing housing and employment data. Continental Europe posted strong gains for the reporting period as well; indeed, the eurozone officially exited recession in August or September. Overall, major US and global stock market indexes rose throughout 2013, hitting multiyear or all-time highs.1
As always, regardless of the macroeconomic environment, we remained focused on our bottom-up investment approach of identifying attractive companies that fit our EQV process.
The Fund delivered positive returns across all 10 invested sectors with holdings in the consumer discretionary and health care sectors contributing the most to absolute results. Relative to the index, stock selection combined with underweight exposure in the consumer staples sector was the largest contributor to relative results. A continued underweight position in the generally-weaker materials sector, predominantly in the metals and mining industry, was supportive as well. Elsewhere, overweight exposure in one of the reporting period’s strongest sectors, consumer discretionary, provided added support to relative results.
In contrast, the Fund’s low double-digit cash position throughout the fiscal year detracted from performance as markets continued to rally over the reporting period. It is important to note that we do not use cash for “top-down” tactical asset allocation purposes. Historically, when the portfolio’s cash position has been higher than average, it has reflected a lack of good EQV investment opportunities in the marketplace, rather than an overall negative opinion on markets. We deployed some cash during the reporting period ending the fiscal year with cash at approximately 13% of total net assets.
In broad geographic terms, the Fund benefited most significantly from strong out performance in Sweden, France, the
| Portfolio Composition | ||||
| By sector | ||||
| Consumer Discretionary | 18.0 | % | ||
| Industrials | 17.1 | |||
| Financials | 14.6 | |||
| Consumer Staples | 9.9 | |||
| Energy | 8.1 | |||
| Health Care | 7.4 | |||
| Information Technology | 4.1 | |||
| Materials | 2.9 | |||
| Telecommunication Services | 1.0 | |||
| Utilities | 1.0 | |||
| Money Market Funds | ||||
| Plus Other Assets Less Liabilities | 15.9 | |||
| Top 10 Equity Holdings* | ||||||
1. | Aryzta AG | 2.8 | % | |||
2. | DCC PLC | 2.1 | ||||
3. | British American Tobacco PLC | 2.0 | ||||
4. | Compass Group PLC | 2.0 | ||||
5. | Roche Holding AG | 1.9 | ||||
6. | SAP AG | 1.8 | ||||
7. | MorphoSys AG | 1.8 | ||||
8. | British Sky Broadcasting Group PLC | 1.8 | ||||
9. | Informa PLC | 1.7 | ||||
10. | Reed Elsevier PLC | 1.7 | ||||
| Top Five Countries* | ||||||
1. | UnitedKingdom | 30.0 | % | |||
2. | Switzerland | 13.9 | ||||
3. | Germany | 12.2 | ||||
4. | France | 5.7 | ||||
5. | Sweden | 4.8 | ||||
| Total Net Assets | $ | 1.4 billion | ||
| Total Number of Holdings* | 75 | |||
The Fund’s holdings are subject to change, and there is no assurance that the Fund will continue to hold any particular security.
* Excluding money market fund holdings.
| 4 | Invesco European Growth Fund |
United Kingdom and Germany. Key stock-specific contributors from these markets included, MorphoSys, Intrum Justitia and ARYZTA.
MorphoSys is a German biotechnology company with a proprietary technology to develop human antibodies for specific diseases. Unlike many one-product biotechs, MorphoSys has a diversified portfolio of clinical compounds. The company signed two out-licensing deals with GlaxoSmithKline and Celgene (not Fund holdings) for its proprietary compounds, providing outside validation for its technology as well as upfront cash and future royalty payments.
Sweden-based Intrum Justitia, Europe’s largest credit management services company, demonstrated steady and attractive margins in its core business through a time of macroeconomic challenges.
ARYZTA, a Switzerland-based global food company and par-baking leader, continued to execute well over the period, and enjoyed robust revenue growth and margin expansion.
In contrast, exposure in certain markets not included in the index, including Turkey and Israel, detracted from both absolute and relative results. Key detractors from these markets included, Haci Omer Sabanci Holding and Israel Chemicals.
Haci Omer Sabanci Holding is a multi-business enterprise operating in Turkey. Its main operation areas are financial services, energy, cement, retail and industrial. There was nothing company-specific behind the stock weakness of this conservative holding company. Rather, the weakness stemmed from negative investor sentiment toward Turkey and emerging markets in general. Riots in Turkey earlier this year highlighted some underlying societal tensions and provided a catalyst for investors to reduce exposure to this market. Despite market volatility, we maintained our position in this name. Israel Chemicals is a company that extracts minerals from the Dead Sea to make fertilizers and potash. The company’s share price declined over the reporting period along with other potash miners as Uralkali (not a Fund holding), the world’s biggest potash producer, suddenly abandoned limits on output, which underpinned prices. With the potash cartel broken, investors worried that a flood of supplies may lead to lower potash prices.
As mentioned above, stock selection in the portfolio is driven by the underlying fundamentals of each individual company, not by any top-down macroeconomic
views. This focus on bottom-up stock selection is the key driver of the portfolio’s overall profile. The Fund ended the reporting period with overweight exposure (relative to the Fund’s style-specific benchmark) in the consumer discretionary, financials, energy, industrials and utilities sectors. The Fund had underweight exposure in the consumer staples, materials, health care, telecommunication services and information technology services sectors.
Over the reporting period, the Fund provided double-digit returns at NAV. While we are pleased to provide shareholders with this performance, it would be imprudent for us to suggest that the strong returns over the long term are repeatable. With market volatility likely to continue for some time, our focus remains on ensuring that our portfolio is comprised of high-quality, reasonably valued companies capable of sustained earnings growth. We believe that this balanced EQV-focused approach may help deliver attractive returns over the long term.
We thank you for your continued investment in Invesco European Growth Fund.
| 1 | Source: Reuters |
The views and opinions expressed in management’s discussion of Fund performance are those of Invesco Advisers, Inc. These views and opinions are subject to change at any time based on factors such as market and economic conditions. These views and opinions may not be relied upon as investment advice or recommendations, or as an offer for a particular security. The information is not a complete analysis of every aspect of any market, country, industry, security or the Fund. Statements of fact are from sources considered reliable, but Invesco Advisers, Inc. makes no representation or warranty as to their completeness or accuracy. Although historical performance is no guarantee of future results, these insights may help you understand our investment management philosophy.
See important Fund and, if applicable, index disclosures later in this report.
 | Jason Holzer Chartered Financial Analyst, portfolio manager, is lead manager of Invesco European Growth Fund with respect | |
| to the Fund’s small and mid-cap investments. He joined Invesco in 1996. Mr. Holzer earned a BA in quantitative economics and an MS in engineering economic systems from Stanford University. | ||
 | Clas Olsson Portfolio manager and chief investment officer of Invesco’s international growth investments team, is lead manager of | |
| Invesco European Growth Fund with respect to the Fund’s large-cap investments. He joined Invesco in 1994. Mr. Olsson became a commissioned officer at the Royal Swedish Naval Academy in 1988. He also earned a BBA from The University of Texas at Austin. | ||
 | Matthew Dennis Chartered Financial Analyst, portfolio manager, is manager of Invesco European Growth Fund. He joined Invesco in | |
| 2000. Mr. Dennis earned a BA in economics from The University of Texas at Austin and an MS in finance from Texas A&M University. | ||
 | Borge Endresen Chartered Financial Analyst, portfolio manager, is manager of Invesco European Growth Fund. He joined Invesco in | |
| 1999. Mr. Endresen earned a BS in finance from the University of Oregon and an MBA from The University of Texas at Austin. | ||
 | Richard Nield Chartered Financial Analyst, portfolio manager, is manager of Invesco European Growth Fund. He joined Invesco in | |
| 2000. Mr. Nield earned a Bachelor of Commerce degree in finance and international business from McGill University in Montreal. | ||
| 5 | Invesco European Growth Fund |
Your Fund’s Long-Term Performance
Results of a $10,000 Investment – Oldest Share Class(es)
Fund and index data from 10/31/03
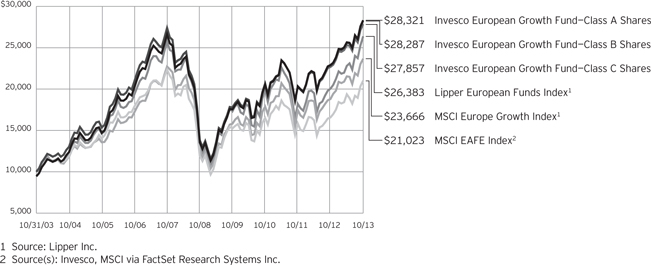
Past performance cannot guarantee comparable future results.
The data shown in the chart include reinvested distributions, applicable sales charges and Fund expenses including management fees. Results for Class B shares are calculated as if a hypothetical
shareholder had liquidated his entire investment in the Fund at the close of the reporting period and paid the contingent deferred sales charges, if applicable. Index results include reinvested dividends, but they do not reflect sales charges. Performance of the peer group,
if applicable, reflects fund expenses and management fees; performance of a market index does not. Performance shown in the chart and table(s) does not reflect deduction of taxes a shareholder would pay on Fund distributions or sale of Fund shares.
continued from page 8
lines, markets, management and financial resources. The securities of small- and mid-sized companies may be more volatile due to less market interest and less publicly available information about the issuer.
They also may be illiquid or restricted as to resale, or may trade less frequently and in smaller volumes, all of which may cause difficulty when establishing or closing a position at a desirable price.
About indexes used in this report
| n | The MSCI EAFE® Index is an unmanaged index considered representative of stocks of Europe, Australasia and the Far East. The index is computed using the net return, which withholds applicable taxes for non-resident investors. |
| n | The MSCI Europe Growth Index is an unmanaged index considered representative of European growth stocks. The index is computed using the net return, which withholds applicable taxes for non-resident investors. |
| n | The Lipper European Funds Index is an unmanaged index considered representative of European funds tracked by Lipper. |
| n | The Fund is not managed to track the performance of any particular index, including the index(es) described here, and consequently, the performance of the Fund may deviate significantly from the performance of the index(es). |
| n | A direct investment cannot be made in an index. Unless otherwise indicated, index results include reinvested dividends, and they do not reflect sales charges. Performance of the peer group, if applicable, reflects fund expenses; performance of a market index does not. |
Other information
| n | The returns shown in management’s discussion of Fund performance are based on net asset values calculated for shareholder transactions. Generally accepted accounting principles require adjustments to be made to the net assets of the Fund at period end for financial reporting purposes, and as such, the net asset values for shareholder transactions and the returns based on those net asset values may differ from the net asset values and returns reported in the Financial Highlights. |
| n | Industry classifications used in this report are generally according to the Global Industry Classification Standard, which was developed by and is the exclusive property and a service mark of MSCI Inc. and Standard & Poor’s. |
| 6 | Invesco European Growth Fund |
| Average Annual Total Returns | |||||
As of 10/31/13, including maximum applicable sales charges |
| ||||
| Class A Shares | |||||
| Inception (11/3/97) | 11.47 | % | |||
| 10 Years | 10.97 | ||||
| 5 Years | 14.60 | ||||
| 1 Year | 16.92 | ||||
| Class B Shares | |||||
| Inception (11/3/97) | 11.48 | % | |||
| 10 Years | 10.96 | ||||
| 5 Years | 14.81 | ||||
| 1 Year | 17.78 | ||||
| Class C Shares | |||||
| Inception (11/3/97) | 11.07 | % | |||
| 10 Years | 10.79 | ||||
| 5 Years | 15.03 | ||||
| 1 Year | 21.80 | ||||
| Class R Shares | |||||
| Inception (6/3/02) | 10.70 | % | |||
| 10 Years | 11.35 | ||||
| 5 Years | 15.62 | ||||
| 1 Year | 23.42 | ||||
| Class Y Shares | |||||
| 10 Years | 11.75 | % | |||
| 5 Years | 16.20 | ||||
| 1 Year | 24.01 | ||||
| Investor Class Shares | |||||
| Inception (9/30/03) | 12.22 | % | |||
| 10 Years | 11.65 | ||||
| 5 Years | 15.94 | ||||
| 1 Year | 23.74 | ||||
Class Y shares incepted on October 3, 2008. Performance shown prior to that date is that of Class A shares and includes the 12b-1 fees applicable to Class A shares. Class A share performance reflects any applicable fee waivers or expense reimbursements.
The performance data quoted represent past performance and cannot guarantee comparable future results; current performance may be lower or higher. Please visit invesco.com/performance for the most recent month-end performance. Performance figures reflect reinvested distributions, changes in net asset value and the effect of the maximum sales charge unless otherwise stated. Investment return and principal value will fluctuate so that you may have a gain or loss when you sell shares.
| Average Annual Total Returns | ||||
As of 9/30/13, the most recent calendar quarter end, including maximum applicable sales charges |
| |||
| Class A Shares | ||||
| Inception (11/3/97) | 11.35 | % | ||
| 10 Years | 11.35 | |||
| 5 Years | 8.45 | |||
| 1 Year | 14.61 | |||
| Class B Shares | ||||
| Inception (11/3/97) | 11.36 | % | ||
| 10 Years | 11.34 | |||
| 5 Years | 8.58 | |||
| 1 Year | 15.35 | |||
| Class C Shares | ||||
| Inception (11/3/97) | 10.95 | % | ||
| 10 Years | 11.18 | |||
| 5 Years | 8.87 | |||
| 1 Year | 19.40 | |||
| Class R Shares | ||||
| Inception (6/3/02) | 10.52 | % | ||
| 10 Years | 11.73 | |||
| 5 Years | 9.42 | |||
| 1 Year | 20.98 | |||
| Class Y Shares | ||||
| 10 Years | 12.13 | % | ||
| 5 Years | 9.97 | |||
| 1 Year | 21.62 | |||
| Investor Class Shares | ||||
| Inception (9/30/03) | 12.03 | % | ||
| 10 Years | 12.03 | |||
| 5 Years | 9.72 | |||
| 1 Year | 21.30 | |||
The total annual Fund operating expense ratio set forth in the most recent Fund prospectus as of the date of this report for Class A, Class B, Class C, Class R, Class Y and Investor Class shares was 1.48%, 2.23%, 2.23%, 1.73%, 1.23% and 1.42%, respectively. The expense ratios presented above may vary from the expense ratios presented in other sections of this report that are based on expenses incurred during the period covered by this report.
Class A share performance reflects the maximum 5.50% sales charge, and Class B and Class C share performance reflects the applicable contingent deferred sales charge (CDSC) for the period involved. The CDSC on Class B shares declines from 5% beginning at the time of purchase to 0% at the
beginning of the seventh year. The CDSC on Class C shares is 1% for the first year after purchase. Class R shares, Class Y shares and Investor Class shares do not have a front-end sales charge or a CDSC; therefore, performance is at net asset value.
The performance of the Fund’s share classes will differ primarily due to different sales charge structures and class expenses.
| 7 | Invesco European Growth Fund |
Invesco European Growth Fund’s investment objective is long-term growth of capital.
| n | Unless otherwise stated, information presented in this report is as of October 31, 2013, and is based on total net assets. |
| n | Unless otherwise noted, all data provided by Invesco. |
| n | To access your Fund’s reports/prospectus, visit invesco.com/fundreports. |
About share classes
| n | Class B shares may not be purchased for new or additional investments. Please see the prospectus for more information. |
| n | Class R shares are generally available only to employer sponsored retirement and benefit plans. Please see the prospectus for more information. |
| n | Class Y shares are available only to certain investors. Please see the prospectus for more information. |
| n | Investor Class shares are closed to new investors. Contact your financial adviser about purchasing our other share classes. Please see the prospectus for more information. |
Principal risks of investing in the Fund
| n | Depositary receipts risk. Depositary receipts involve many of the same risks as those associated with direct investment in foreign securities. In addition, the underlying issuers of certain depositary receipts, particularly unsponsored or unregistered depositary receipts, are under no obligation to distribute shareholder communications to the holders of such receipts or to pass through to them any voting rights with respect to the deposited securities. |
| n | Derivatives risk. The performance of derivative instruments is tied to the performance of an underlying currency, security, index, commodity or other asset. In addition to risks relating to their underlying assets, the use of derivatives may include other, possibly greater, risks. Derivatives involve costs, may be volatile, and may involve a small initial investment relative to the risk assumed. Risks associated with the use of derivatives may include counterparty, margin, leverage, correlation, liquidity, tax, market, interest rate and management risks, as well as the risk of potential increased regulation of derivatives. Derivatives may |
also be more difficult to purchase, sell or value than other investments. The Fund may lose more than the cash amount invested on investments in derivatives. Each of these risks is greater for the Fund than mutual funds that do not use derivatives to implement their investment strategy. |
| n | Developing/emerging markets securities risk. The prices of securities issued by foreign companies and governments located in developing/emerging markets countries may be affected more negatively by inflation, devaluation of their currencies, higher transaction costs, delays in settlement, adverse political developments, the introduction of capital controls, withholding taxes, nationalization of private assets, expropriation, social unrest, war or lack of timely information than those in developed countries. |
| n | Foreign securities risk. The Fund’s foreign investments may be affected by changes in a foreign country’s exchange rates, political and social instability, changes in economic or taxation policies, difficulties when enforcing obligations, decreased liquidity, and increased volatility. Foreign companies may be subject to less regulation resulting in less publicly available information about the companies. |
| n | Geographic focus risk. From time to time the Fund may invest a substantial amount of its assets in securities of issuers located in a single country or a limited number of countries. If the Fund focuses its investments in this manner, it assumes the risk that economic, political and social conditions in those countries will have a significant impact on its investment performance. The Fund’s investment performance may also be more volatile if it focuses its investments in certain countries, especially emerging markets countries. |
| n | Growth investing risk. Growth stocks tend to be more expensive relative to their earnings or assets compared with |
other types of stock. As a result they tend to be more sensitive to changes in their earnings and can be more volatile. |
| n | Investing in the European Union risk. Many countries in the European Union are susceptible to high economic risks associated with high levels of debt, notably due to investments in sovereign debts of European countries such as Greece, Italy and Spain. One or more member states might exit the European Union, placing its currency and banking system in jeopardy. The European Union faces major issues involving its membership, structure, procedures and policies, including the adoption, abandonment or adjustment of the new constitutional treaty, the European Union’s enlargement to the south and east, and resolution of the European Union’s problematic fiscal and democratic accountability. Efforts of the member states to further unify their economic and monetary policies may increase the potential for the downward movement of one member state’s market to cause a similar effect on other member states’ markets. European countries that are part of the European Economic and Monetary Union may be significantly affected by the tight fiscal and monetary controls that the union seeks to impose on its members. |
| n | Management risk. The investment techniques and risk analysis used by the Fund’s portfolio managers may not produce the desired results. |
| n | Market risk. The prices of and the income generated by the Fund’s securities may decline in response to, among other things, investor sentiment, general economic and market conditions, regional or global instability, and currency and interest rate fluctuations. |
| n | Small- and mid-capitalization risks. Stocks of small- and mid-sized companies tend to be more vulnerable to adverse developments and may have little or no operating history or track record of success, and limited product |
continued on page 6
This report must be accompanied or preceded by a currently effective Fund prospectus, which contains more complete information, including sales charges and expenses. Investors should read it carefully before investing.
NOT FDIC INSURED | MAY LOSE VALUE | NO BANK GUARANTEE
| Fund Nasdaq Symbols | ||||
Class A Shares | AEDAX | |||
Class B Shares | AEDBX | |||
Class C Shares | AEDCX | |||
Class R Shares | AEDRX | |||
Class Y Shares | AEDYX | |||
Investor Class Shares | EGINX | |||
| 8 | Invesco European Growth Fund |
Schedule of Investments
October 31, 2013
| Shares | Value | |||||||
Common Stocks & Other Equity Interests–84.09% |
| |||||||
| Belgium–1.92% | ||||||||
Anheuser-Busch InBev N.V. | 171,565 | $ | 17,810,380 | |||||
S.A. D’Ieteren N.V. | 193,095 | 9,094,840 | ||||||
| 26,905,220 | ||||||||
| Denmark–1.80% | ||||||||
Carlsberg AS–Class B | 102,510 | 10,235,511 | ||||||
Novo Nordisk AS–Class B | 90,006 | 14,993,110 | ||||||
| 25,228,621 | ||||||||
| France–5.65% | ||||||||
Metropole Television S.A. | 398,824 | 9,191,680 | ||||||
Publicis Groupe S.A. | 239,673 | 19,940,855 | ||||||
Schneider Electric S.A. | 182,045 | 15,306,895 | ||||||
Total S.A. | 328,842 | 20,168,304 | ||||||
Vicat S.A. | 193,585 | 14,468,811 | ||||||
| 79,076,545 | ||||||||
| Germany–12.22% | ||||||||
Allianz S.E. | 121,988 | 20,520,703 | ||||||
Brenntag AG | 40,878 | 6,926,408 | ||||||
Deutsche Boerse AG | 269,459 | 20,286,077 | ||||||
Deutsche Post AG | 419,581 | 14,198,903 | ||||||
Deutsche Telekom AG | 892,879 | 14,062,237 | ||||||
GEA Group AG | 325,837 | 14,178,564 | ||||||
MorphoSys AG(a) | 323,074 | 25,050,592 | ||||||
MTU Aero Engines AG | 178,710 | 17,855,478 | ||||||
SAP AG | 322,182 | 25,309,497 | ||||||
Volkswagen AG–Preference Shares | 49,867 | 12,674,269 | ||||||
| 171,062,728 | ||||||||
| Ireland–3.24% | ||||||||
DCC PLC | 667,195 | 29,941,288 | ||||||
Shire PLC | 348,779 | 15,459,360 | ||||||
| 45,400,648 | ||||||||
| Israel–0.79% | ||||||||
Israel Chemicals Ltd. | 1,337,198 | 11,065,577 | ||||||
| Italy–1.99% | ||||||||
Ansaldo STS S.p.A. | 629,896 | 6,687,360 | ||||||
Danieli & C. Officine Meccaniche S.p.A.–Savings Shares | 415,963 | 8,595,370 | ||||||
Saipem S.p.A | 535,242 | 12,542,809 | ||||||
| 27,825,539 | ||||||||
| Netherlands–1.36% | ||||||||
Aalberts Industries N.V. | 208,593 | 6,229,723 | ||||||
Unilever N.V. | 322,406 | 12,768,602 | ||||||
| 18,998,325 | ||||||||
| Shares | Value | |||||||
| Norway–2.31% | ||||||||
Prosafe S.E. | 2,304,988 | $ | 19,765,115 | |||||
TGS Nopec Geophysical Co. ASA | 454,854 | 12,514,712 | ||||||
| 32,279,827 | ||||||||
| Spain–0.73% | ||||||||
Construcciones y Auxiliar de Ferrocarriles S.A. | 19,715 | 10,247,767 | ||||||
| Sweden–4.81% | ||||||||
Intrum Justitia AB | 810,101 | 21,563,525 | ||||||
Investment AB Kinnevik–Class B | 362,647 | 13,341,494 | ||||||
Investor AB–Class B | 385,306 | 12,378,784 | ||||||
Swedbank AB–Class A | 386,207 | 10,071,596 | ||||||
Telefonaktiebolaget LM Ericsson–Class B | 839,069 | 10,014,966 | ||||||
| 67,370,365 | ||||||||
| Switzerland–13.85% | ||||||||
ABB Ltd. | 725,718 | 18,481,846 | ||||||
Aryzta AG | 530,940 | 39,620,871 | ||||||
Dufry AG(a) | 132,312 | 21,390,975 | ||||||
Julius Baer Group Ltd. | 232,304 | 11,377,818 | ||||||
Kuoni Reisen Holding AG | 35,798 | 15,149,253 | ||||||
Nestle S.A. | 204,581 | 14,767,529 | ||||||
Novartis AG | 148,122 | 11,481,394 | ||||||
Roche Holding AG | 93,913 | 25,948,454 | ||||||
Syngenta AG | 38,431 | 15,522,329 | ||||||
Tecan Group AG | 102,845 | 10,747,593 | ||||||
UBS AG | 489,864 | 9,448,259 | ||||||
| 193,936,321 | ||||||||
| Turkey–2.04% | ||||||||
Haci Omer Sabanci Holding A.S. | 4,007,679 | 18,955,275 | ||||||
Tupras-Turkiye Petrol Rafinerileri A.S. | 427,216 | 9,693,406 | ||||||
| 28,648,681 | ||||||||
| Turkmenistan–1.36% | ||||||||
Dragon Oil PLC | 2,016,748 | 19,045,033 | ||||||
| United Kingdom–30.02% | ||||||||
Aberdeen Asset Management PLC | 2,781,743 | 19,753,201 | ||||||
Amlin PLC | 2,634,357 | 18,013,430 | ||||||
Balfour Beatty PLC | 3,014,609 | 13,808,803 | ||||||
British American Tobacco PLC | 499,565 | 27,520,730 | ||||||
British Sky Broadcasting Group PLC | 1,662,289 | 24,985,762 | ||||||
Bunzl PLC | 614,939 | 13,576,279 | ||||||
Catlin Group Ltd. | 1,966,594 | 16,186,717 | ||||||
Centrica PLC | 2,377,728 | 13,492,967 | ||||||
Chemring Group PLC | 2,074,110 | 7,232,790 | ||||||
Compass Group PLC | 1,900,121 | 27,326,782 | ||||||
Halma PLC | 929,823 | 8,158,591 | ||||||
Homeserve PLC | 2,134,883 | 8,023,179 | ||||||
See accompanying Notes to Financial Statements which are an integral part of the financial statements.
9 Invesco European Growth Fund
| Shares | Value | |||||||
| United Kingdom–(continued) | ||||||||
IG Group Holdings PLC | 2,126,224 | $ | 20,914,061 | |||||
Imperial Tobacco Group PLC | 412,627 | 15,434,471 | ||||||
Informa PLC | 2,732,797 | 24,460,230 | ||||||
Kingfisher PLC | 1,736,011 | 10,478,743 | ||||||
Lancashire Holdings Ltd. | 989,069 | 12,891,231 | ||||||
Micro Focus International PLC | 1,079,484 | 14,144,533 | ||||||
Next PLC | 116,688 | 10,166,819 | ||||||
Reed Elsevier PLC | 1,741,689 | 24,372,821 | ||||||
Royal Dutch Shell PLC–Class B | 567,729 | 19,619,873 | ||||||
Smiths Group PLC | 491,182 | 11,300,799 | ||||||
UBM PLC | 954,395 | 10,458,791 | ||||||
Ultra Electronics Holdings PLC | 504,333 | 15,658,566 | ||||||
William Hill PLC | 1,316,338 | 8,460,933 | ||||||
| Shares | Value | |||||||
| United Kingdom–(continued) | ||||||||
WPP PLC | 1,128,531 | $ | 24,057,728 | |||||
| 420,498,830 | ||||||||
Total Common Stocks & Other Equity Interests (Cost $811,107,483) |
| 1,177,590,027 | ||||||
Money Market Funds–15.66% |
| |||||||
Liquid Assets Portfolio–Institutional Class(b) | 109,627,859 | 109,627,859 | ||||||
Premier Portfolio–Institutional Class(b) | 109,627,859 | 109,627,859 | ||||||
Total Money Market Funds |
| 219,255,718 | ||||||
TOTAL INVESTMENTS–99.75% |
| 1,396,845,745 | ||||||
OTHER ASSETS LESS LIABILITIES–0.25% |
| 3,574,763 | ||||||
NET ASSETS–100.00% |
| $ | 1,400,420,508 | |||||
Notes to Schedule of Investments:
| (a) | Non-income producing security. |
| (b) | The money market fund and the Fund are affiliated by having the same investment adviser. |
See accompanying Notes to Financial Statements which are an integral part of the financial statements.
10 Invesco European Growth Fund
Statement of Assets and Liabilities
October 31, 2013
Assets: |
| |||
Investments, at value (Cost $811,107,483) | $ | 1,177,590,027 | ||
Investments in affiliated money market funds, at value and cost | 219,255,718 | |||
Total investments, at value (Cost $1,030,363,201) | 1,396,845,745 | |||
Foreign currencies, at value (Cost $79,391) | 73,500 | |||
Receivable for: | ||||
Fund shares sold | 7,120,841 | |||
Dividends | 3,707,821 | |||
Investment for trustee deferred compensation and retirement plans | 74,458 | |||
Other assets | 51,106 | |||
Total assets | 1,407,873,471 | |||
Liabilities: |
| |||
Payable for: | ||||
Investments purchased | 4,492,163 | |||
Fund shares reacquired | 1,928,793 | |||
Accrued fees to affiliates | 605,848 | |||
Accrued trustees’ and officers’ fees and benefits | 3,111 | |||
Accrued other operating expenses | 199,482 | |||
Trustee deferred compensation and retirement plans | 223,566 | |||
Total liabilities | 7,452,963 | |||
Net assets applicable to shares outstanding | $ | 1,400,420,508 | ||
Net assets consist of: |
| |||
Shares of beneficial interest | $ | 993,110,552 | ||
Undistributed net investment income | 13,332,425 | |||
Undistributed net realized gain | 27,450,028 | |||
Net unrealized appreciation | 366,527,503 | |||
| $ | 1,400,420,508 | |||
Net Assets: |
| |||
Class A | $ | 494,360,118 | ||
Class B | $ | 12,343,328 | ||
Class C | $ | 55,760,297 | ||
Class R | $ | 16,136,565 | ||
Class Y | $ | 624,165,641 | ||
Investor Class | $ | 197,654,559 | ||
Shares outstanding, $0.001 par value per share, |
| |||
Class A | 12,620,266 | |||
Class B | 336,239 | |||
Class C | 1,517,500 | |||
Class R | 413,548 | |||
Class Y | 15,890,044 | |||
Investor Class | 5,058,141 | |||
Class A: | ||||
Net asset value per share | $ | 39.17 | ||
Maximum offering price per share | ||||
(Net asset value of $39.17 ¸ 94.50%) | $ | 41.45 | ||
Class B: | ||||
Net asset value and offering price per share | $ | 36.71 | ||
Class C: | ||||
Net asset value and offering price per share | $ | 36.74 | ||
Class R: | ||||
Net asset value and offering price per share | $ | 39.02 | ||
Class Y: | ||||
Net asset value and offering price per share | $ | 39.28 | ||
Investor Class: | ||||
Net asset value and offering price per share | $ | 39.08 | ||
See accompanying Notes to Financial Statements which are an integral part of the financial statements.
11 Invesco European Growth Fund
Statement of Operations
For the year ended October 31, 2013
Investment income: |
| |||
Dividends (net of foreign withholding taxes of $1,819,984) | $ | 28,519,134 | ||
Dividends from affiliated money market funds | 111,239 | |||
Total investment income | 28,630,373 | |||
Expenses: | ||||
Advisory fees | 9,408,255 | |||
Administrative services fees | 264,915 | |||
Custodian fees | 333,583 | |||
Distribution fees: | ||||
Class A | 1,035,439 | |||
Class B | 135,206 | |||
Class C | 427,852 | |||
Class R | 73,430 | |||
Investor Class | 411,148 | |||
Transfer agent fees | 1,681,462 | |||
Trustees’ and officers’ fees and benefits | 59,236 | |||
Other | 367,067 | |||
Total expenses | 14,197,593 | |||
Less: Fees waived and expense offset arrangement(s) | (196,684 | ) | ||
Net expenses | 14,000,909 | |||
Net investment income | 14,629,464 | |||
Realized and unrealized gain (loss) from: | ||||
Net realized gain (loss) from: | ||||
Investment securities | 27,652,895 | |||
Foreign currencies | (159,784 | ) | ||
| 27,493,111 | ||||
Change in net unrealized appreciation of: | ||||
Investment securities | 183,947,767 | |||
Foreign currencies | 53,719 | |||
| 184,001,486 | ||||
Net realized and unrealized gain | 211,494,597 | |||
Net increase in net assets resulting from operations | $ | 226,124,061 | ||
See accompanying Notes to Financial Statements which are an integral part of the financial statements.
12 Invesco European Growth Fund
Statement of Changes in Net Assets
For the years ended October 31, 2013 and 2012
| 2013 | 2012 | |||||||
Operations: |
| |||||||
Net investment income | $ | 14,629,464 | $ | 15,670,517 | ||||
Net realized gain | 27,493,111 | 43,057,529 | ||||||
Change in net unrealized appreciation | 184,001,486 | 34,601,330 | ||||||
Net increase in net assets resulting from operations | 226,124,061 | 93,329,376 | ||||||
Distributions to shareholders from net investment income: | ||||||||
Class A | (6,852,015 | ) | (11,239,209 | ) | ||||
Class B | (183,960 | ) | (459,400 | ) | ||||
Class C | (487,737 | ) | (883,408 | ) | ||||
Class R | (209,318 | ) | (411,620 | ) | ||||
Class Y | (5,374,817 | ) | (7,626,755 | ) | ||||
Investor Class | (2,895,808 | ) | (4,892,756 | ) | ||||
Total distributions from net investment income | (16,003,655 | ) | (25,513,148 | ) | ||||
Distributions to shareholders from net realized gains: | ||||||||
Class A | (6,911,369 | ) | — | |||||
Class B | (281,354 | ) | — | |||||
Class C | (745,958 | ) | — | |||||
Class R | (238,372 | ) | — | |||||
Class Y | (4,888,767 | ) | — | |||||
Investor Class | (2,846,909 | ) | — | |||||
Total distributions from net realized gains | (15,912,729 | ) | — | |||||
Share transactions–net: | ||||||||
Class A | 41,814,991 | (15,931,363 | ) | |||||
Class B | (5,042,754 | ) | (7,474,488 | ) | ||||
Class C | 9,812,963 | (6,007,219 | ) | |||||
Class R | 320,311 | (2,777,150 | ) | |||||
Class Y | 287,835,044 | 26,320,670 | ||||||
Investor Class | 11,131,571 | (11,292,427 | ) | |||||
Net increase (decrease) in net assets resulting from share transactions | 345,872,126 | (17,161,977 | ) | |||||
Net increase in net assets | 540,079,803 | 50,654,251 | ||||||
Net assets: | ||||||||
Beginning of year | 860,340,705 | 809,686,454 | ||||||
End of year (includes undistributed net investment income of $13,332,425 and $14,866,400, respectively) | $ | 1,400,420,508 | $ | 860,340,705 | ||||
Notes to Financial Statements
October 31, 2013
NOTE 1—Significant Accounting Policies
Invesco European Growth Fund (the “Fund”) is a series portfolio of AIM International Mutual Funds (Invesco International Mutual Funds) (the “Trust”). The Trust is a Delaware statutory trust registered under the Investment Company Act of 1940, as amended (the “1940 Act”), as an open-end series management investment company consisting of eight separate portfolios, each authorized to issue an unlimited number of shares of beneficial interest. The assets, liabilities and operations of each portfolio are accounted for separately. Information presented in these financial statements pertains only to the Fund. Matters affecting each portfolio or class will be voted on exclusively by the shareholders of such portfolio or class.
The Fund’s investment objective is long-term growth of capital.
The Fund currently consists of six different classes of shares: Class A, Class B, Class C, Class R, Class Y and Investor Class. Investor Class shares of the Fund are offered only to certain grandfathered investors. Class A shares are sold with a front-end sales charge unless certain waiver criteria are met and under certain circumstances load waived shares may be subject to contingent deferred sales charges (“CDSC”). Class C shares are sold with a CDSC. Class R, Class Y and Investor Class shares are sold at net asset value. Effective November 30, 2010, new or additional investments in Class B shares are no longer permitted. Existing shareholders of Class B shares may continue to reinvest dividends and capital gains distributions in Class B shares until they convert to Class A shares. Also, shareholders in Class B shares will be able to exchange those shares for Class B shares of other
13 Invesco European Growth Fund
Invesco Funds offering such shares until they convert to Class A shares. Generally, Class B shares will automatically convert to Class A shares on or about the month-end, which is at least eight years after the date of purchase. Redemption of Class B shares prior to the conversion date will be subject to a CDSC.
The following is a summary of the significant accounting policies followed by the Fund in the preparation of its financial statements.
| A. | Security Valuations — Securities, including restricted securities, are valued according to the following policy. |
A security listed or traded on an exchange (except convertible bonds) is valued at its last sales price or official closing price as of the close of the customary trading session on the exchange where the security is principally traded, or lacking any sales or official closing price on a particular day, the security may be valued at the closing bid price on that day. Securities traded in the over-the-counter market are valued based on prices furnished by independent pricing services or market makers. When such securities are valued by an independent pricing service they may be considered fair valued. Futures contracts are valued at the final settlement price set by an exchange on which they are principally traded. Listed options are valued at the mean between the last bid and ask prices from the exchange on which they are principally traded. Options not listed on an exchange are valued by an independent source at the mean between the last bid and ask prices. For purposes of determining net asset value per share, futures and option contracts generally are valued 15 minutes after the close of the customary trading session of the New York Stock Exchange (“NYSE”).
Investments in open-end and closed-end registered investment companies that do not trade on an exchange are valued at the end of day net asset value per share. Investments in open-end and closed-end registered investment companies that trade on an exchange are valued at the last sales price or official closing price as of the close of the customary trading session on the exchange where the security is principally traded.
Debt obligations (including convertible bonds) and unlisted equities are fair valued using an evaluated quote provided by an independent pricing service. Evaluated quotes provided by the pricing service may be determined without exclusive reliance on quoted prices, and may reflect appropriate factors such as institution-size trading in similar groups of securities, developments related to specific securities, dividend rate (for unlisted equities), yield (for debt obligations), quality, type of issue, coupon rate (for debt obligations), maturity (for debt obligations), individual trading characteristics and other market data. Debt obligations are subject to interest rate and credit risks. In addition, all debt obligations involve some risk of default with respect to interest and/or principal payments.
Foreign securities’ (including foreign exchange contracts) prices are converted into U.S. dollar amounts using the applicable exchange rates as of the close of the NYSE. If market quotations are available and reliable for foreign exchange-traded equity securities, the securities will be valued at the market quotations. Because trading hours for certain foreign securities end before the close of the NYSE, closing market quotations may become unreliable. If between the time trading ends on a particular security and the close of the customary trading session on the NYSE, events occur that the Adviser determines are significant and make the closing price unreliable, the Fund may fair value the security. If the event is likely to have affected the closing price of the security, the security will be valued at fair value in good faith using procedures approved by the Board of Trustees. Adjustments to closing prices to reflect fair value may also be based on a screening process of an independent pricing service to indicate the degree of certainty, based on historical data, that the closing price in the principal market where a foreign security trades is not the current value as of the close of the NYSE. Foreign securities’ prices meeting the approved degree of certainty that the price is not reflective of current value will be priced at the indication of fair value from the independent pricing service. Multiple factors may be considered by the independent pricing service in determining adjustments to reflect fair value and may include information relating to sector indices, American Depositary Receipts and domestic and foreign index futures. Foreign securities may have additional risks including exchange rate changes, potential for sharply devalued currencies and high inflation, political and economic upheaval, the relative lack of issuer information, relatively low market liquidity and the potential lack of strict financial and accounting controls and standards.
Securities for which market prices are not provided by any of the above methods may be valued based upon quotes furnished by independent sources. The last bid price may be used to value equity securities. The mean between the last bid and asked prices is used to value debt obligations, including corporate loans.
Securities for which market quotations are not readily available or became unreliable are valued at fair value as determined in good faith by or under the supervision of the Trust’s officers following procedures approved by the Board of Trustees. Issuer specific events, market trends, bid/ask quotes of brokers and information providers and other market data may be reviewed in the course of making a good faith determination of a security’s fair value.
Valuations change in response to many factors including the historical and prospective earnings of the issuer, the value of the issuer’s assets, general economic conditions, interest rates, investor perceptions and market liquidity. Because of the inherent uncertainties of valuation, the values reflected in the financial statements may materially differ from the value received upon actual sale of those investments.
| B. | Securities Transactions and Investment Income — Securities transactions are accounted for on a trade date basis. Realized gains or losses on sales are computed on the basis of specific identification of the securities sold. Interest income is recorded on the accrual basis from settlement date. Dividend income (net of withholding tax, if any) is recorded on the ex-dividend date. |
The Fund may periodically participate in litigation related to Fund investments. As such, the Fund may receive proceeds from litigation settlements. Any proceeds received are included in the Statement of Operations as realized gain (loss) for investments no longer held and as unrealized gain (loss) for investments still held.
Brokerage commissions and mark ups are considered transaction costs and are recorded as an increase to the cost basis of securities purchased and/or a reduction of proceeds on a sale of securities. Such transaction costs are included in the determination of net realized and unrealized gain (loss) from investment securities reported in the Statement of Operations and the Statement of Changes in Net Assets and the net realized and unrealized gains (losses) on securities per share in the Financial Highlights. Transaction costs are included in the calculation of the Fund’s net asset value and, accordingly, they reduce the Fund’s total returns. These transaction costs are not considered operating expenses and are not reflected in net investment income reported in the Statement of Operations and Statement of Changes in Net Assets, or the net investment income per share and ratios of expenses and net investment income reported in the Financial Highlights, nor are they limited by any expense limitation arrangements between the Fund and the investment adviser.
The Fund allocates income and realized and unrealized capital gains and losses to a class based on the relative net assets of each class.
| C. | Country Determination — For the purposes of making investment selection decisions and presentation in the Schedule of Investments, the investment adviser may determine the country in which an issuer is located and/or credit risk exposure based on various factors. These factors include the laws of the country under which the issuer is organized, where the issuer maintains a principal office, the country in which the issuer |
14 Invesco European Growth Fund
| derives 50% or more of its total revenues and the country that has the primary market for the issuer’s securities, as well as other criteria. Among the other criteria that may be evaluated for making this determination are the country in which the issuer maintains 50% or more of its assets, the type of security, financial guarantees and enhancements, the nature of the collateral and the sponsor organization. Country of issuer and/or credit risk exposure has been determined to be the United States of America, unless otherwise noted. |
| D. | Distributions — Distributions from income and net realized capital gain, if any, are generally declared and paid annually and recorded on the ex-dividend date. The Fund may elect to treat a portion of the proceeds from redemptions as distributions for federal income tax purposes. |
| E. | Federal Income Taxes — The Fund intends to comply with the requirements of Subchapter M of the Internal Revenue Code of 1986, as amended (the “Internal Revenue Code”), necessary to qualify as a regulated investment company and to distribute substantially all of the Fund’s taxable earnings to shareholders. As such, the Fund will not be subject to federal income taxes on otherwise taxable income (including net realized capital gain) that is distributed to shareholders. Therefore, no provision for federal income taxes is recorded in the financial statements. |
The Fund files tax returns in the U.S. Federal jurisdiction and certain other jurisdictions. Generally, the Fund is subject to examinations by such taxing authorities for up to three years after the filing of the return for the tax period.
| F. | Expenses — Fees provided for under the Rule 12b-1 plan of a particular class of the Fund and which are directly attributable to that class are charged to the operations of such class. All other expenses are allocated among the classes based on relative net assets. |
| G. | Accounting Estimates — The preparation of financial statements in conformity with accounting principles generally accepted in the United States of America (“GAAP”) requires management to make estimates and assumptions that affect the reported amounts of assets and liabilities at the date of the financial statements and the reported amounts of revenues and expenses during the reporting period including estimates and assumptions related to taxation. Actual results could differ from those estimates by a significant amount. In addition, the Fund monitors for material events or transactions that may occur or become known after the period-end date and before the date the financial statements are released to print. |
| H. | Indemnifications — Under the Trust’s organizational documents, each Trustee, officer, employee or other agent of the Trust is indemnified against certain liabilities that may arise out of the performance of their duties to the Fund. Additionally, in the normal course of business, the Fund enters into contracts, including the Fund’s servicing agreements, that contain a variety of indemnification clauses. The Fund’s maximum exposure under these arrangements is unknown as this would involve future claims that may be made against the Fund that have not yet occurred. The risk of material loss as a result of such indemnification claims is considered remote. |
| I. | Foreign Currency Translations — Foreign currency is valued at the close of the NYSE based on quotations posted by banks and major currency dealers. Portfolio securities and other assets and liabilities denominated in foreign currencies are translated into U.S. dollar amounts at date of valuation. Purchases and sales of portfolio securities (net of foreign taxes withheld on disposition) and income items denominated in foreign currencies are translated into U.S. dollar amounts on the respective dates of such transactions. The Fund does not separately account for the portion of the results of operations resulting from changes in foreign exchange rates on investments and the fluctuations arising from changes in market prices of securities held. The combined results of changes in foreign exchange rates and the fluctuation of market prices on investments (net of estimated foreign tax withholding) are included with the net realized and unrealized gain or loss from investments in the Statement of Operations. Reported net realized foreign currency gains or losses arise from (1) sales of foreign currencies, (2) currency gains or losses realized between the trade and settlement dates on securities transactions, and (3) the difference between the amounts of dividends, interest, and foreign withholding taxes recorded on the Fund’s books and the U.S. dollar equivalent of the amounts actually received or paid. Net unrealized foreign currency gains and losses arise from changes in the fair values of assets and liabilities, other than investments in securities at fiscal period end, resulting from changes in exchange rates. |
The Fund may invest in foreign securities which may be subject to foreign taxes on income, gains on investments or currency repatriation, a portion of which may be recoverable.
| J. | Foreign Currency Contracts — The Fund may enter into foreign currency contracts to manage or minimize currency or exchange rate risk. The Fund may also enter into foreign currency contracts for the purchase or sale of a security denominated in a foreign currency in order to “lock in” the U.S. dollar price of that security. A foreign currency contract is an obligation to purchase or sell a specific currency for an agreed-upon price at a future date. The use of foreign currency contracts does not eliminate fluctuations in the price of the underlying securities the Fund owns or intends to acquire but establishes a rate of exchange in advance. Fluctuations in the value of these contracts are measured by the difference in the contract date and reporting date exchange rates and are recorded as unrealized appreciation (depreciation) until the contracts are closed. When the contracts are closed, realized gains (losses) are recorded. Realized and unrealized gains (losses) on the contracts are included in the Statement of Operations. The primary risks associated with foreign currency contracts include failure of the counterparty to meet the terms of the contract and the value of the foreign currency changing unfavorably. These risks may be in excess of the amounts reflected in the Statement of Assets and Liabilities. |
NOTE 2—Advisory Fees and Other Fees Paid to Affiliates
The Trust has entered into a master investment advisory agreement with Invesco Advisers, Inc. (the “Adviser” or “Invesco”). Under the terms of the investment advisory agreement, the Fund pays an advisory fee to the Adviser based on the annual rate of the Fund’s average daily net assets as follows:
| Average Daily Net Assets | Rate | |||||
First $250 million | 0 | .935% | ||||
Next $250 million | 0 | .91% | ||||
Next $500 million | 0 | .885% | ||||
Next $1.5 billion | 0 | .86% | ||||
Next $2.5 billion | 0 | .835% | ||||
Next $2.5 billion | 0 | .81% | ||||
Next $2.5 billion | 0 | .785% | ||||
Over $10 billion | 0 | .76% | ||||
15 Invesco European Growth Fund
Under the terms of a master sub-advisory agreement between the Adviser and each of Invesco Asset Management Deutschland GmbH, Invesco Asset Management Limited, Invesco Asset Management (Japan) Limited, Invesco Australia Limited, Invesco Hong Kong Limited, Invesco Senior Secured Management, Inc. and Invesco Canada Ltd. (collectively, the “Affiliated Sub-Advisers”) the Adviser, not the Fund, may pay 40% of the fees paid to the Adviser to any such Affiliated Sub-Adviser(s) that provide(s) discretionary investment management services to the Fund based on the percentage of assets allocated to such Sub-Adviser(s).
The Adviser has contractually agreed, through at least June 30, 2014, to waive advisory fees and/or reimburse expenses of all shares to the extent necessary to limit total annual fund operating expenses after fee waiver and/or expense reimbursement (excluding certain items discussed below) of Class A, Class B, Class C, Class R, Class Y and Investor Class shares to 2.25%, 3.00%, 3.00%, 2.50%, 2.00% and 2.25%, respectively, of average daily net assets. In determining the Adviser’s obligation to waive advisory fees and/or reimburse expenses, the following expenses are not taken into account, and could cause the total annual fund operating expenses after fee waiver and/or expense reimbursement to exceed the numbers reflected above: (1) interest; (2) taxes; (3) dividend expense on short sales; (4) extraordinary or non-routine items, including litigation expenses; and (5) expenses that the Fund has incurred but did not actually pay because of an expense offset arrangement. Unless Invesco continues the fee waiver agreement, it will terminate on June 30, 2014. The fee waiver agreement cannot be terminated during this term. The Adviser did not waive fees and/or reimburse expenses during the period under this expense limitation.
Further, the Adviser has contractually agreed, through June 30, 2014, to waive the advisory fee payable by the Fund in an amount equal to 100% of the net advisory fees the Adviser receives from the affiliated money market funds on investments by the Fund of uninvested cash in such affiliated money market funds.
For the year ended October 31, 2013, the Adviser waived advisory fees of $192,542.
The Trust has entered into a master administrative services agreement with Invesco pursuant to which the Fund has agreed to pay Invesco for certain administrative costs incurred in providing accounting services to the Fund. For the year ended October 31, 2013, expenses incurred under the agreement are shown in the Statement of Operations as Administrative services fees.
The Trust has entered into a transfer agency and service agreement with Invesco Investment Services, Inc. (“IIS”) pursuant to which the Fund has agreed to pay IIS a fee for providing transfer agency and shareholder services to the Fund and reimburse IIS for certain expenses incurred by IIS in the course of providing such services. IIS may make payments to intermediaries that provide omnibus account services, sub-accounting services and/or networking services. All fees payable by IIS to intermediaries that provide omnibus account services or sub-accounting are charged back to the Fund, subject to certain limitations approved by the Trust’s Board of Trustees. For the year ended October 31, 2013, expenses incurred under the agreement are shown in the Statement of Operations as Transfer agent fees.
The Trust has entered into master distribution agreements with Invesco Distributors, Inc. (“IDI”) to serve as the distributor for the Class A, Class B, Class C, Class R, Class Y and Investor Class shares of the Fund. The Trust has adopted plans pursuant to Rule 12b-1 under the 1940 Act with respect to the Fund’s Class A, Class B, Class C, Class R and Investor Class shares (collectively, the “Plans”). The Fund, pursuant to the Plans, pays IDI compensation at the annual rate of 0.25% of the Fund’s average daily net assets of Class A shares, 1.00% of the average daily net assets of Class B and Class C shares and 0.50% of the average daily net assets of Class R shares. The Fund, pursuant to the Investor Class Plan, reimburses IDI for its allocated share of expenses incurred pursuant to the Investor Class Plan for the period, up to a maximum annual rate of 0.25% of the average daily net assets of Investor Class shares. Of the Plan payments, up to 0.25% of the average daily net assets of each class of shares may be paid to furnish continuing personal shareholder services to customers who purchase and own shares of such classes. Any amounts not paid as a service fee under the Plans would constitute an asset-based sales charge. Rules of the Financial Industry Regulatory Authority (“FINRA”) impose a cap on the total sales charges, including asset-based sales charges, that may be paid by any class of shares of the Fund. For the year ended October 31, 2013, expenses incurred under the Plans are shown in the Statement of Operations as Distribution fees.
Front-end sales commissions and CDSC (collectively, the “sales charges”) are not recorded as expenses of the Fund. Front-end sales commissions are deducted from proceeds from the sales of Fund shares prior to investment in Class A shares of the Fund. CDSC are deducted from redemption proceeds prior to remittance to the shareholder. During the year ended October 31, 2013, IDI advised the Fund that IDI retained $88,057 in front-end sales commissions from the sale of Class A shares and $36, $9,354 and $4,254 from Class A, Class B and Class C shares, respectively, for CDSC imposed on redemptions by shareholders.
Certain officers and trustees of the Trust are officers and directors of the Adviser, IIS and/or IDI.
NOTE 3—Additional Valuation Information
GAAP defines fair value as the price that would be received to sell an asset or paid to transfer a liability in an orderly transaction between market participants at the measurement date, under current market conditions. GAAP establishes a hierarchy that prioritizes the inputs to valuation methods, giving the highest priority to readily available unadjusted quoted prices in an active market for identical assets (Level 1) and the lowest priority to significant unobservable inputs (Level 3), generally when market prices are not readily available or are unreliable. Based on the valuation inputs, the securities or other investments are tiered into one of three levels. Changes in valuation methods may result in transfers in or out of an investment’s assigned level:
| Level 1 — | Prices are determined using quoted prices in an active market for identical assets. |
| Level 2 — | Prices are determined using other significant observable inputs. Observable inputs are inputs that other market participants may use in pricing a security. These may include quoted prices for similar securities, interest rates, prepayment speeds, credit risk, yield curves, loss severities, default rates, discount rates, volatilities and others. |
| Level 3 — | Prices are determined using significant unobservable inputs. In situations where quoted prices or observable inputs are unavailable (for example, when there is little or no market activity for an investment at the end of the period), unobservable inputs may be used. Unobservable inputs reflect the Fund’s own assumptions about the factors market participants would use in determining fair value of the securities or instruments and would be based on the best available information. |
The following is a summary of the tiered valuation input levels, as of October 31, 2013. The level assigned to the securities valuations may not be an indication of the risk or liquidity associated with investing in those securities. Because of the inherent uncertainties of valuation, the values reflected in the financial statements may materially differ from the value received upon actual sale of those investments.
16 Invesco European Growth Fund
During the year ended October 31, 2013, there were transfers from Level 1 to Level 2 of $59,168,042 and from Level 2 to Level 1 of $246,704,538, due to foreign fair value adjustments.
| Level 1 | Level 2 | Level 3 | Total | |||||||||||||
Belgium | $ | — | $ | 26,905,220 | $ | — | $ | 26,905,220 | ||||||||
Denmark | 10,235,511 | 14,993,110 | — | 25,228,621 | ||||||||||||
France | 23,660,491 | 55,416,054 | — | 79,076,545 | ||||||||||||
Germany | 171,062,728 | — | — | 171,062,728 | ||||||||||||
Ireland | 29,941,288 | 15,459,360 | — | 45,400,648 | ||||||||||||
Israel | 11,065,577 | — | — | 11,065,577 | ||||||||||||
Italy | 12,542,809 | 15,282,730 | — | 27,825,539 | ||||||||||||
Netherlands | 12,768,602 | 6,229,723 | — | 18,998,325 | ||||||||||||
Norway | 32,279,827 | — | — | 32,279,827 | ||||||||||||
Spain | 10,247,767 | — | — | 10,247,767 | ||||||||||||
Sweden | 54,028,871 | 13,341,494 | — | 67,370,365 | ||||||||||||
Switzerland | 66,830,086 | 127,106,235 | — | 193,936,321 | ||||||||||||
Turkey | 9,693,406 | 18,955,275 | — | 28,648,681 | ||||||||||||
Turkmenistan | 19,045,033 | — | — | 19,045,033 | ||||||||||||
United Kingdom | 193,362,110 | 227,136,720 | — | 420,498,830 | ||||||||||||
United States | 219,255,718 | — | — | 219,255,718 | ||||||||||||
Total Investments | $ | 876,019,824 | $ | 520,825,921 | $ | — | $ | 1,396,845,745 | ||||||||
NOTE 4—Expense Offset Arrangement(s)
The expense offset arrangement is comprised of transfer agency credits which result from balances in demand deposit accounts used by the transfer agent for clearing shareholder transactions. For the year ended October 31, 2013, the Fund received credits from this arrangement, which resulted in the reduction of the Fund’s total expenses of $4,142.
NOTE 5—Trustees’ and Officers’ Fees and Benefits
Trustees’ and Officers’ Fees and Benefits include amounts accrued by the Fund to pay remuneration to certain Trustees and Officers of the Fund. Trustees have the option to defer compensation payable by the Fund, and Trustees’ and Officers’ Fees and Benefits also include amounts accrued by the Fund to fund such deferred compensation amounts. Those Trustees who defer compensation have the option to select various Invesco Funds in which their deferral accounts shall be deemed to be invested. Finally, certain current Trustees are eligible to participate in a retirement plan that provides for benefits to be paid upon retirement to Trustees over a period of time based on the number of years of service. The Fund may have certain former Trustees who also participate in a retirement plan and receive benefits under such plan. Trustees’ and Officers’ Fees and Benefits include amounts accrued by the Fund to fund such retirement benefits. Obligations under the deferred compensation and retirement plans represent unsecured claims against the general assets of the Fund.
NOTE 6—Cash Balances
The Fund is permitted to temporarily carry a negative or overdrawn balance in its account with State Street Bank and Trust Company, the custodian bank. Such balances, if any at period end, are shown in the Statement of Assets and Liabilities under the payable caption Amount due custodian. To compensate the custodian bank for such overdrafts, the overdrawn Fund may either (1) leave funds as a compensating balance in the account so the custodian bank can be compensated by earning the additional interest; or (2) compensate by paying the custodian bank at a rate agreed upon by the custodian bank and Invesco, not to exceed the contractually agreed upon rate.
17 Invesco European Growth Fund
NOTE 7—Distributions to Shareholders and Tax Components of Net Assets
Tax Character of Distributions to Shareholders Paid During the Years Ended October 31, 2013 and 2012:
| 2013 | 2012 | |||||||
Ordinary income | $ | 16,003,655 | $ | 25,513,148 | ||||
Long-term capital gain | 15,912,729 | — | ||||||
Total distributions | $ | 31,916,384 | $ | 25,513,148 | ||||
Tax Components of Net Assets at Period-End:
| 2013 | ||||
Undistributed ordinary income | $ | 18,047,405 | ||
Undistributed long-term gain | 27,872,604 | |||
Net unrealized appreciation — investments | 361,553,058 | |||
Net unrealized appreciation — other investments | 44,959 | |||
Temporary book/tax differences | (208,070 | ) | ||
Shares of beneficial interest | 993,110,552 | |||
Total net assets | $ | 1,400,420,508 | ||
The difference between book-basis and tax-basis unrealized appreciation (depreciation) is due to differences in the timing of recognition of gains and losses on investments for tax and book purposes. The Fund’s net unrealized appreciation difference is attributable primarily to passive foreign investment companies and wash sales.
The temporary book/tax differences are a result of timing differences between book and tax recognition of income and/or expenses. The Fund’s temporary book/tax differences are the result of the trustee deferral of compensation and retirement plan benefits.
Capital loss carryforward is calculated and reported as of a specific date. Results of transactions and other activity after that date may affect the amount of capital loss carryforward actually available for the Fund to utilize. Capital losses generated in years beginning after December 22, 2010 can be carried forward for an unlimited period, whereas previous losses expire in 8 tax years. Capital losses with an expiration period may not be used to offset capital gains until all net capital losses without an expiration date have been utilized. Capital loss carryforwards with no expiration date will retain their character as either short-term or long-term capital losses instead of as short-term capital losses as under prior law. The ability to utilize capital loss carryforward in the future may be limited under the Internal Revenue Code and related regulations based on the results of future transactions.
The Fund does not have a capital loss carryforward as of October 31, 2013.
NOTE 8—Investment Securities
The aggregate amount of investment securities (other than short-term securities, U.S. Treasury obligations and money market funds, if any) purchased and sold by the Fund during the year ended October 31, 2013 was $339,226,639 and $130,775,811, respectively. Cost of investments on a tax basis includes the adjustments for financial reporting purposes as of the most recently completed federal income tax reporting period-end.
| Unrealized Appreciation (Depreciation) of Investment Securities on a Tax Basis | ||||
Aggregate unrealized appreciation of investment securities | $ | 377,236,577 | ||
Aggregate unrealized (depreciation) of investment securities | (15,683,519 | ) | ||
Net unrealized appreciation of investment securities | $ | 361,553,058 | ||
Cost of investments for tax purposes is $1,035,292,687.
NOTE 9—Reclassification of Permanent Differences
Primarily as a result of differing book/tax treatment of foreign currency transactions, on October 31, 2013, undistributed net investment income was decreased by $159,784 and undistributed net realized gain was increased by $159,784. This reclassification had no effect on the net assets of the Fund.
18 Invesco European Growth Fund
NOTE 10—Share Information
| Summary of Share Activity | ||||||||||||||||
| Years ended October 31, | ||||||||||||||||
| 2013(a) | 2012 | |||||||||||||||
| Shares | Amount | Shares | Amount | |||||||||||||
Sold: | ||||||||||||||||
Class A | 3,051,834 | $ | 110,544,363 | 1,667,254 | $ | 52,045,582 | ||||||||||
Class B | 13,038 | 444,040 | 8,002 | 226,660 | ||||||||||||
Class C | 472,914 | 16,366,896 | 131,641 | 3,886,628 | ||||||||||||
Class R | 167,063 | 5,906,853 | 121,098 | 3,709,154 | ||||||||||||
Class Y | 8,950,533 | 324,100,471 | 2,643,233 | 80,565,699 | ||||||||||||
Investor Class | 712,095 | 25,579,255 | 288,800 | 8,904,572 | ||||||||||||
Issued as reinvestment of dividends: | ||||||||||||||||
Class A | 413,345 | 13,363,444 | 357,870 | 10,163,502 | ||||||||||||
Class B | 15,041 | 458,756 | 16,360 | 439,761 | ||||||||||||
Class C | 38,712 | 1,181,877 | 28,397 | 764,153 | ||||||||||||
Class R | 13,827 | 446,317 | 14,430 | 409,395 | ||||||||||||
Class Y | 311,924 | 10,090,743 | 260,086 | 7,386,427 | ||||||||||||
Investor Class | 172,999 | 5,579,228 | 165,958 | 4,701,609 | ||||||||||||
Automatic conversion of Class B shares to Class A shares: | ||||||||||||||||
Class A | 99,082 | 3,489,071 | 112,206 | 3,417,979 | ||||||||||||
Class B | (105,372 | ) | (3,489,071 | ) | (118,999 | ) | (3,417,979 | ) | ||||||||
Reacquired:(b) | ||||||||||||||||
Class A | (2,433,163 | ) | (85,581,887 | ) | (2,694,743 | ) | (81,558,426 | ) | ||||||||
Class B | (75,199 | ) | (2,456,479 | ) | (165,750 | ) | (4,722,930 | ) | ||||||||
Class C | (232,876 | ) | (7,735,810 | ) | (373,019 | ) | (10,658,000 | ) | ||||||||
Class R | (170,746 | ) | (6,032,859 | ) | (229,222 | ) | (6,895,699 | ) | ||||||||
Class Y | (1,297,649 | ) | (46,356,170 | ) | (2,116,547 | ) | (61,631,456 | ) | ||||||||
Investor Class | (573,336 | ) | (20,026,912 | ) | (825,387 | ) | (24,898,608 | ) | ||||||||
Net increase (decrease) in share activity | 9,544,066 | $ | 345,872,126 | (708,332 | ) | $ | (17,161,977 | ) | ||||||||
| (a) | There are entities that are record owners of more than 5% of the outstanding shares of the Fund and in the aggregate own 55% of the outstanding shares of the Fund. IDI has an agreement with these entities to sell Fund shares. The Fund, Invesco and/or Invesco affiliates may make payments to these entities, which are considered to be related to the Fund, for providing services to the Fund, Invesco and/or Invesco affiliates including but not limited to services such as securities brokerage, distribution, third party record keeping and account servicing. The Fund has no knowledge as to whether all or any portion of the shares owned of record by these entities are also owned beneficially. |
| (b) | Net of redemption fees of $618 allocated among the classes based on relative net assets of each class for the year ended October 31, 2012. |
19 Invesco European Growth Fund
NOTE 11—Financial Highlights
The following schedule presents financial highlights for a share of the Fund outstanding throughout the periods indicated.
| Net asset value, beginning of period | Net investment income(a) | Net gains (losses) on securities (both realized and unrealized) | Total from investment operations | Dividends from net investment income | Distributions from net realized gains | Total distributions | Net asset value, end of period(b) | Total return(c) | Net assets, end of period (000’s omitted) | Ratio of expenses to average net assets with fee waivers and/or expenses absorbed | Ratio of expenses to average net assets without fee waivers and/or expenses absorbed | Ratio of net investment income to average net assets | Portfolio turnover(d) | |||||||||||||||||||||||||||||||||||||||||||
Class A |
| |||||||||||||||||||||||||||||||||||||||||||||||||||||||
Year ended 10/31/13 | $ | 32.84 | $ | 0.48 | $ | 7.06 | $ | 7.54 | $ | (0.60 | ) | $ | (0.61 | ) | $ | (1.21 | ) | $ | 39.17 | 23.72 | % | $ | 494,360 | 1.39 | %(e) | 1.41 | %(e) | 1.35 | %(e) | 15 | % | |||||||||||||||||||||||||
Year ended 10/31/12 | 30.13 | 0.59 | 3.07 | (f) | 3.66 | (0.95 | ) | — | (0.95 | ) | 32.84 | 12.64 | (f) | 377,331 | 1.47 | 1.48 | 1.94 | 14 | ||||||||||||||||||||||||||||||||||||||
Year ended 10/31/11 | 30.81 | 0.58 | (0.89 | )(f) | (0.31 | ) | (0.37 | ) | — | (0.37 | ) | 30.13 | (1.02 | )(f) | 362,913 | 1.44 | 1.45 | 1.84 | 21 | |||||||||||||||||||||||||||||||||||||
Year ended 10/31/10 | 26.66 | 0.29 | 4.23 | 4.52 | (0.37 | ) | — | (0.37 | ) | 30.81 | 17.12 | 433,347 | 1.50 | 1.51 | 1.07 | 25 | ||||||||||||||||||||||||||||||||||||||||
Year ended 10/31/09 | 22.86 | 0.32 | 5.64 | 5.96 | (0.78 | ) | (1.38 | ) | (2.16 | ) | 26.66 | 29.54 | 443,525 | 1.64 | 1.65 | 1.48 | 21 | |||||||||||||||||||||||||||||||||||||||
Class B |
| |||||||||||||||||||||||||||||||||||||||||||||||||||||||
Year ended 10/31/13 | 30.87 | 0.20 | 6.64 | 6.84 | (0.39 | ) | (0.61 | ) | (1.00 | ) | 36.71 | 22.82 | 12,343 | 2.14 | (e) | 2.16 | (e) | 0.60 | (e) | 15 | ||||||||||||||||||||||||||||||||||||
Year ended 10/31/12 | 28.27 | 0.34 | 2.90 | (f) | 3.24 | (0.64 | ) | — | (0.64 | ) | 30.87 | 11.80 | (f) | 15,089 | 2.22 | 2.23 | 1.19 | 14 | ||||||||||||||||||||||||||||||||||||||
Year ended 10/31/11 | 28.92 | 0.32 | (0.84 | )(f) | (0.52 | ) | (0.13 | ) | — | (0.13 | ) | 28.27 | (1.78 | )(f) | 21,177 | 2.19 | 2.20 | 1.09 | 21 | |||||||||||||||||||||||||||||||||||||
Year ended 10/31/10 | 25.06 | 0.08 | 3.97 | 4.05 | (0.19 | ) | — | (0.19 | ) | 28.92 | 16.24 | 31,767 | 2.25 | 2.26 | 0.32 | 25 | ||||||||||||||||||||||||||||||||||||||||
Year ended 10/31/09 | 21.37 | 0.15 | 5.33 | 5.48 | (0.41 | ) | (1.38 | ) | (1.79 | ) | 25.06 | 28.60 | 39,459 | 2.39 | 2.40 | 0.73 | 21 | |||||||||||||||||||||||||||||||||||||||
Class C |
| |||||||||||||||||||||||||||||||||||||||||||||||||||||||
Year ended 10/31/13 | 30.90 | 0.20 | 6.64 | 6.84 | (0.39 | ) | (0.61 | ) | (1.00 | ) | 36.74 | 22.80 | 55,760 | 2.14 | (e) | 2.16 | (e) | 0.60 | (e) | 15 | ||||||||||||||||||||||||||||||||||||
Year ended 10/31/12 | 28.30 | 0.34 | 2.90 | (f) | 3.24 | (0.64 | ) | — | (0.64 | ) | 30.90 | 11.79 | (f) | 38,282 | 2.22 | 2.23 | 1.19 | 14 | ||||||||||||||||||||||||||||||||||||||
Year ended 10/31/11 | 28.95 | 0.32 | (0.84 | )(f) | (0.52 | ) | (0.13 | ) | — | (0.13 | ) | 28.30 | (1.78 | )(f) | 41,078 | 2.19 | 2.20 | 1.09 | 21 | |||||||||||||||||||||||||||||||||||||
Year ended 10/31/10 | 25.08 | 0.08 | 3.98 | 4.06 | (0.19 | ) | — | (0.19 | ) | 28.95 | 16.27 | 56,637 | 2.25 | 2.26 | 0.32 | 25 | ||||||||||||||||||||||||||||||||||||||||
Year ended 10/31/09 | 21.39 | 0.15 | 5.33 | 5.48 | (0.41 | ) | (1.38 | ) | (1.79 | ) | 25.08 | 28.57 | 59,971 | 2.39 | 2.40 | 0.73 | 21 | |||||||||||||||||||||||||||||||||||||||
Class R |
| |||||||||||||||||||||||||||||||||||||||||||||||||||||||
Year ended 10/31/13 | 32.73 | 0.39 | 7.04 | 7.43 | (0.53 | ) | (0.61 | ) | (1.14 | ) | 39.02 | 23.42 | 16,137 | 1.64 | (e) | 1.66 | (e) | 1.10 | (e) | 15 | ||||||||||||||||||||||||||||||||||||
Year ended 10/31/12 | 30.00 | 0.51 | 3.07 | (f) | 3.58 | (0.85 | ) | — | (0.85 | ) | 32.73 | 12.36 | (f) | 13,204 | 1.72 | 1.73 | 1.69 | 14 | ||||||||||||||||||||||||||||||||||||||
Year ended 10/31/11 | 30.68 | 0.50 | (0.89 | )(f) | (0.39 | ) | (0.29 | ) | — | (0.29 | ) | 30.00 | (1.28 | )(f) | 14,911 | 1.69 | 1.70 | 1.59 | 21 | |||||||||||||||||||||||||||||||||||||
Year ended 10/31/10 | 26.56 | 0.22 | 4.21 | 4.43 | (0.31 | ) | — | (0.31 | ) | 30.68 | 16.82 | 17,578 | 1.75 | 1.76 | 0.82 | 25 | ||||||||||||||||||||||||||||||||||||||||
Year ended 10/31/09 | 22.70 | 0.27 | 5.63 | 5.90 | (0.66 | ) | (1.38 | ) | (2.04 | ) | 26.56 | 29.24 | 16,933 | 1.89 | 1.90 | 1.23 | 21 | |||||||||||||||||||||||||||||||||||||||
Class Y |
| |||||||||||||||||||||||||||||||||||||||||||||||||||||||
Year ended 10/31/13 | 32.92 | 0.57 | 7.07 | 7.64 | (0.67 | ) | (0.61 | ) | (1.28 | ) | 39.28 | 24.01 | 624,166 | 1.14 | (e) | 1.16 | (e) | 1.60 | (e) | 15 | ||||||||||||||||||||||||||||||||||||
Year ended 10/31/12 | 30.22 | 0.67 | 3.08 | (f) | 3.75 | (1.05 | ) | — | (1.05 | ) | 32.92 | 12.96 | (f) | 260,860 | 1.22 | 1.23 | 2.19 | 14 | ||||||||||||||||||||||||||||||||||||||
Year ended 10/31/11 | 30.91 | 0.66 | (0.91 | )(f) | (0.25 | ) | (0.44 | ) | — | (0.44 | ) | 30.22 | (0.80 | )(f) | 215,716 | 1.19 | 1.20 | 2.09 | 21 | |||||||||||||||||||||||||||||||||||||
Year ended 10/31/10 | 26.73 | 0.36 | 4.25 | 4.61 | (0.43 | ) | — | (0.43 | ) | 30.91 | 17.44 | 190,994 | 1.25 | 1.26 | 1.32 | 25 | ||||||||||||||||||||||||||||||||||||||||
Year ended 10/31/09 | 22.87 | 0.42 | 5.61 | 6.03 | (0.79 | ) | (1.38 | ) | (2.17 | ) | 26.73 | 29.84 | 84,793 | 1.39 | 1.40 | 1.73 | 21 | |||||||||||||||||||||||||||||||||||||||
Investor Class |
| |||||||||||||||||||||||||||||||||||||||||||||||||||||||
Year ended 10/31/13 | 32.78 | 0.48 | 7.04 | 7.52 | (0.61 | ) | (0.61 | ) | (1.22 | ) | 39.08 | 23.74 | 197,655 | 1.38 | (e) | 1.40 | (e) | 1.36 | (e) | 15 | ||||||||||||||||||||||||||||||||||||
Year ended 10/31/12 | 30.07 | 0.61 | 3.07 | (f) | 3.68 | (0.97 | ) | — | (0.97 | ) | 32.78 | 12.75 | (f) | 155,575 | 1.41 | 1.42 | 2.00 | 14 | ||||||||||||||||||||||||||||||||||||||
Year ended 10/31/11 | 30.76 | 0.60 | (0.92 | )(f) | (0.32 | ) | (0.37 | ) | — | (0.37 | ) | 30.07 | (1.03 | )(f) | 153,892 | 1.38 | 1.39 | 1.90 | 21 | |||||||||||||||||||||||||||||||||||||
Year ended 10/31/10 | 26.61 | 0.30 | 4.22 | 4.52 | (0.37 | ) | — | (0.37 | ) | 30.76 | 17.16 | 175,069 | 1.47 | 1.48 | 1.10 | 25 | ||||||||||||||||||||||||||||||||||||||||
Year ended 10/31/09 | 22.83 | 0.32 | 5.64 | 5.96 | (0.80 | ) | (1.38 | ) | (2.18 | ) | 26.61 | 29.58 | 178,106 | 1.64 | 1.65 | 1.48 | 21 | |||||||||||||||||||||||||||||||||||||||
| (a) | Calculated using average shares outstanding. |
| (b) | Includes redemption fees added to shares of beneficial interest which were less than $0.005 per share for fiscal years ended October 31, 2012 and prior. |
| (c) | Includes adjustments in accordance with accounting principles generally accepted in the United States of America and as such, the net asset value for financial reporting purposes and the returns based upon those net asset values may differ from the net asset value and returns for shareholder transactions. Does not include sales charges and is not annualized for periods less than one year, if applicable. |
| (d) | Portfolio turnover is calculated at the fund level and is not annualized for periods less than one year, if applicable. |
| (e) | Ratios are based on average daily net assets (000’s omitted) of $414,176, $13,521, $42,785, $14,686, $386,887 and $171,057 for Class A, Class B, Class C, Class R, Class Y and Investor Class shares, respectively. |
| (f) | Includes litigation proceeds received during the period. Had the litigation proceeds not been received, Net gains (losses) on securities (both realized and unrealized) per share, for the year ended October 31, 2012, would have been $2.96, $2.79, $2.79, $2.95, $2.97 and $2.96 for Class A, Class B, Class C, Class R, Class Y and Investor Class shares, respectively and total return would have been lower. Net gains (losses) on securities (both realized and unrealized) per share, for the year ended October 31, 2011, would have been $(1.11), $(1.06), $(1.06), $(1.11), $(1.13) and $(1.14) for Class A, Class B, Class C, Class R, Class Y and Investor Class shares, respectively, and total returns would have been lower. |
20 Invesco European Growth Fund
Report of Independent Registered Public Accounting Firm
To the Board of Trustees of AIM International Mutual Funds (Invesco International Mutual Funds)
and Shareholders of Invesco European Growth Fund:
In our opinion, the accompanying statement of assets and liabilities, including the schedule of investments, and the related statements of operations and of changes in net assets and the financial highlights present fairly, in all material respects, the financial position of Invesco European Growth Fund (one of the funds constituting AIM International Mutual Funds (Invesco International Mutual Funds), hereafter referred to as the “Fund”) at October 31, 2013, the results of its operations for the year then ended, the changes in its net assets for each of the two years in the period then ended and the financial highlights for each of the five years in the period then ended, in conformity with accounting principles generally accepted in the United States of America. These financial statements and financial highlights (hereafter referred to as “financial statements”) are the responsibility of the Fund’s management; our responsibility is to express an opinion on these financial statements based on our audits. We conducted our audits of these financial statements in accordance with the standards of the Public Company Accounting Oversight Board (United States). Those standards require that we plan and perform the audit to obtain reasonable assurance about whether the financial statements are free of material misstatement. An audit includes examining, on a test basis, evidence supporting the amounts and disclosures in the financial statements, assessing the accounting principles used and significant estimates made by management, and evaluating the overall financial statement presentation. We believe that our audits, which included confirmation of securities at October 31, 2013 by correspondence with the custodian and brokers, provide a reasonable basis for our opinion.
PRICEWATERHOUSECOOPERS LLP
December 23, 2013
Houston, Texas
21 Invesco European Growth Fund
Calculating your ongoing Fund expenses
Example
As a shareholder of the Fund, you incur two types of costs: (1) transaction costs, which may include sales charges (loads) on purchase payments or contingent deferred sales charges on redemptions, if any; and (2) ongoing costs, including management fees, distribution and/or service (12b-1) fees, and other Fund expenses. This example is intended to help you understand your ongoing costs (in dollars) of investing in the Fund and to compare these costs with ongoing costs of investing in other mutual funds. The example is based on an investment of $1,000 invested at the beginning of the period and held for the entire period May 1, 2013 through October 31, 2013.
Actual expenses
The table below provides information about actual account values and actual expenses. You may use the information in this table, together with the amount you invested, to estimate the expenses that you paid over the period. Simply divide your account value by $1,000 (for example, an $8,600 account value divided by $1,000 = 8.6), then multiply the result by the number in the table under the heading entitled “Actual Expenses Paid During Period” to estimate the expenses you paid on your account during this period.
Hypothetical example for comparison purposes
The table below also provides information about hypothetical account values and hypothetical expenses based on the Fund’s actual expense ratio and an assumed rate of return of 5% per year before expenses, which is not the Fund’s actual return.
The hypothetical account values and expenses may not be used to estimate the actual ending account balance or expenses you paid for the period. You may use this information to compare the ongoing costs of investing in the Fund and other funds. To do so, compare this 5% hypothetical example with the 5% hypothetical examples that appear in the shareholder reports of the other funds.
Please note that the expenses shown in the table are meant to highlight your ongoing costs only and do not reflect any transaction costs, such as sales charges (loads) on purchase payments or contingent deferred sales charges on redemptions, if any. Therefore, the hypothetical information is useful in comparing ongoing costs only, and will not help you determine the relative total costs of owning different funds. In addition, if these transaction costs were included, your costs would have been higher.
| Class | Beginning Account Value (05/01/13) | ACTUAL | HYPOTHETICAL (5% annual return before | Annualized Expense Ratio | ||||||||||||||||||||
Ending Account Value (10/31/13)1 | Expenses Paid During Period2 | Ending Account Value (10/31/13) | Expenses Paid During Period2 | |||||||||||||||||||||
| A | $ | 1,000.00 | $ | 1,104.60 | $ | 7.32 | $ | 1,018.25 | $ | 7.02 | 1.38 | % | ||||||||||||
| B | 1,000.00 | 1,100.70 | 11.28 | 1,014.47 | 10.82 | 2.13 | ||||||||||||||||||
| C | 1,000.00 | 1,100.30 | 11.28 | 1,014.47 | 10.82 | 2.13 | ||||||||||||||||||
| R | 1,000.00 | 1,103.50 | 8.64 | 1,016.99 | 8.29 | 1.63 | ||||||||||||||||||
| Y | 1,000.00 | 1,106.20 | 6.00 | 1,019.51 | 5.75 | 1.13 | ||||||||||||||||||
| Investor | 1,000.00 | 1,104.90 | 7.27 | 1,018.30 | 6.97 | 1.37 | ||||||||||||||||||
| 1 | The actual ending account value is based on the actual total return of the Fund for the period May 1, 2013 through October 31, 2013, after actual expenses and will differ from the hypothetical ending account value which is based on the Fund’s expense ratio and a hypothetical annual return of 5% before expenses. |
| 2 | Expenses are equal to the Fund’s annualized expense ratio as indicated above multiplied by the average account value over the period, multiplied by 184/365 to reflect the most recent fiscal half year. |
22 Invesco European Growth Fund
Approval of Investment Advisory and Sub-Advisory Contracts
The Board of Trustees (the Board) of AIM International Mutual Funds (Invesco International Mutual Funds) is required under the Investment Company Act of 1940, as amended, to approve annually the renewal of Invesco European Growth Fund’s (the Fund) investment advisory agreement with Invesco Advisers, Inc. (Invesco Advisers) and the Master Intergroup Sub-Advisory Contract for Mutual Funds (the sub-advisory contracts) with Invesco Asset Management Deutschland GmbH, Invesco Asset Management Limited, Invesco Asset Management (Japan) Limited, Invesco Australia Limited, Invesco Hong Kong Limited, Invesco Senior Secured Management, Inc. and Invesco Canada Ltd. (collectively, the Affiliated Sub-Advisers). During contract renewal meetings held on June 17-19, 2013, the Board as a whole, and the disinterested or “independent” Trustees, who comprise over 75% of the Board, voting separately, approved the continuance of the Fund’s investment advisory agreement and the sub-advisory contracts for another year, effective July 1, 2013. The Board determined that the continuation of the Fund’s investment advisory agreement and the sub-advisory contracts are in the best interests of the Fund and its shareholders and the compensation payable to Invesco Advisers and the Affiliated Sub-Advisers under the agreements is fair and reasonable.
The Board’s Fund Evaluation Process
The Board’s Investments Committee has established three Sub-Committees, each of which is primarily responsible for overseeing the management of a number of the funds advised by Invesco Advisers (the Invesco Funds). The Sub-Committees meet throughout the year to review the performance of their Invesco Funds, including reviewing materials prepared under the direction of the independent Senior Officer, an officer of the Invesco Funds who reports directly to the independent Trustees. Over the course of each year, the Sub-Committees meet with portfolio managers for their assigned Invesco Funds and other members of management to review the performance, investment objective(s), policies, strategies, limitations and investment risks of these funds. The Sub-Committees meet regularly and at designated contract renewal meetings each year to conduct a review of the performance, fees, expenses and other matters related to their assigned Invesco Funds. Each Sub-Committee recommends to the Investments Committee, which in turn recommends to the full Board, whether and on what terms to approve the continuance of each Invesco Fund’s investment advisory agreement and sub-advisory contracts for another year.
During the contract renewal process, the Trustees receive comparative performance and fee data regarding the Invesco Funds prepared
by Invesco Advisers and Lipper Inc. (Lipper), an independent provider of investment company data. The Trustees also receive an independent written evaluation from the Senior Officer. The Senior Officer’s evaluation is prepared as part of his responsibility to manage the process by which the Invesco Funds’ proposed management fees are negotiated during the annual contract renewal process to ensure they are negotiated in a manner that is at arms’ length and reasonable. The independent Trustees are assisted in their annual evaluation of the Fund’s investment advisory agreement by the Senior Officer and by independent legal counsel. In addition to meetings with Invesco Advisers and fund counsel, the independent Trustees also discuss the continuance of the investment advisory agreement and sub-advisory contracts in separate sessions with the Senior Officer and with independent legal counsel.
In evaluating the fairness and reasonableness of compensation under the Fund’s investment advisory agreement and sub-advisory contracts, the Board considered, among other things, the factors discussed below. The Trustees recognized that the advisory fee rates for the Invesco Funds are, in many cases, the result of years of review and negotiation between the Trustees and Invesco Advisers as well as advisory fees previously approved by different predecessor boards. The Trustees’ deliberations and conclusions in a particular year may be based in part on their deliberations and conclusions regarding these same arrangements throughout the year and in prior years. The Trustees’ review and conclusions are based on the comprehensive consideration of all information presented to them and are not the result of any single determinative factor. Moreover, one Trustee may have weighed a particular piece of information or factor differently than another Trustee.
The discussion below serves as the Senior Officer’s independent written evaluation with respect to the Fund’s investment advisory agreement as well as a discussion of the material factors and related conclusions that formed the basis for the Board’s approval of the Fund’s investment advisory agreement and sub-advisory contracts. Unless otherwise stated, this information is current as of June 19, 2013, and may not reflect consideration of factors that became known to the Board after that date, including, for example, changes to the Fund’s performance, advisory fees, expense limitations and/or fee waivers.
Factors and Conclusions and Summary of Independent Written Fee Evaluation
| A. | Nature, Extent and Quality of Services Provided by Invesco Advisers and the Affiliated Sub-Advisers |
The Board reviewed the advisory services provided to the Fund by Invesco Advisers under the Fund’s investment advisory agreement, the
performance of Invesco Advisers in providing these services, and the credentials and experience of the officers and employees of Invesco Advisers who provide these services, including the Fund’s portfolio manager or managers, with whom the Sub-Committees met during the year. The Board’s review of the qualifications of Invesco Advisers to provide advisory services included the Board’s consideration of Invesco Advisers’ investment process oversight, independent credit analysis and investment risk management.
In determining whether to continue the Fund’s investment advisory agreement, the Board considered the benefits of reapproving an existing relationship and the greater uncertainty that may be associated with entering into a new relationship. The Board also considered non-advisory services that Invesco Advisers and its affiliates provide to the Invesco Funds such as various back office support functions, equity and fixed income trading operations, internal audit, distribution and legal and compliance. The Board concluded that the nature, extent and quality of the services provided to the Fund by Invesco Advisers are appropriate and satisfactory and consistent with the terms of the Fund’s investment advisory agreement.
The Board reviewed the services that may be provided by the Affiliated Sub-Advisers under the sub-advisory contracts and the credentials and experience of the officers and employees of the Affiliated Sub-Advisers who provide these services. The Board noted that the Affiliated Sub-Advisers have offices and personnel that are located in financial centers around the world. As a result, the Affiliated Sub-Advisers can provide research and investment analysis on the markets and economies of various countries in which the Fund may invest, make recommendations regarding securities and assist with security trades. The Board concluded that the sub-advisory contracts benefit the Fund and its shareholders by permitting Invesco Advisers to use the resources and talents of the Affiliated Sub-Advisers in managing the Fund. The Board concluded that the nature, extent and quality of the services that may be provided by the Affiliated Sub-Advisers are appropriate and satisfactory and consistent with the terms of the Fund’s sub-advisory contracts.
| B. | Fund Performance |
The Board considered Fund performance as a relevant factor in considering whether to approve the investment advisory agreement. The Board did not view Fund performance as a relevant factor in considering whether to approve the sub-advisory contracts for the Fund, as no Affiliated Sub-Adviser currently manages assets of the Fund.
The Board compared the Fund’s performance during the past one, three and five calendar years to the performance of funds in the Lipper performance universe and against the Lipper
23 Invesco European Growth Fund
European Funds Index. The Board noted that performance of Class A shares of the Fund was in the fourth quintile of the performance universe for the one year period, the first quintile for the three year period and the second quintile for the five year period (the first quintile being the best performing funds and the fifth quintile being the worst performing funds). The Board noted that performance of Class A shares of the Fund was below the performance of the Index for the one year period and above the performance of the Index for the three and five year periods. The Trustees also reviewed more recent Fund performance and this review did not change their conclusions.
| C. | Advisory and Sub-Advisory Fees |
The Board compared the Fund’s contractual management fee rate to the contractual management fee rates of funds in the Fund’s Lipper expense group at a common asset level. The Board noted that the contractual management fee rate for Class A shares of the Fund was above the median contractual management fee rate of funds in the expense group. The Board noted that the term “contractual management fee” may include both advisory and certain administrative services fees and that Invesco does not charge the Invesco Funds for the administrative services included in the term as defined by Lipper. The Board also reviewed the methodology used by Lipper in providing expense group information, which includes using each fund’s contractual management fee schedule (including any applicable breakpoints) as reported in the most recent prospectus or statement of additional information for each fund in the expense group.
The Board also compared the Fund’s effective advisory fee rate (the advisory fee rate after advisory fee waivers and before other expense limitations/waivers) to the effective advisory fee rates of other funds advised by Invesco Advisers and its affiliates with investment strategies comparable to those of the Fund. The Board noted that Invesco Advisers sub-advises two off-shore funds with investment strategies comparable to the Fund, each of which had an effective advisory fee rate before waivers higher than the Fund’s rate.
The Board also considered the services that may be provided by the Affiliated Sub-Advisers pursuant to the sub-advisory contracts, as well as the fees payable by Invesco Advisers to the Affiliated Sub-Advisers pursuant to the sub-advisory contracts. The Board also noted that the sub-advisory fees are not paid directly by the Fund, but rather, are payable by Invesco Advisers to the Affiliated Sub-Advisers.
Based upon the information and considerations described above, the Board concluded compensation payable to Invesco Advisers and the Affiliated Sub-Advisers is fair and reasonable.
| D. | Economies of Scale and Breakpoints |
The Board considered the extent to which there are economies of scale in the provision of advisory services to the Fund. The Board also
considered whether the Fund benefits from economies of scale through contractual breakpoints in the Fund’s advisory fee schedule and was assisted in this review by a report from the Senior Officer. The Board also noted that the Fund shares directly in economies of scale through lower fees charged by third party service providers based on the combined size of the Invesco Funds and other clients advised by Invesco Advisers.
| E. | Profitability and Financial Resources |
The Board reviewed information from Invesco Advisers concerning the costs of the advisory and other services that Invesco Advisers and its affiliates provide to the Fund and the profitability of Invesco Advisers and its affiliates in providing these services for the year ended December 31, 2012. The Board received information from Invesco Advisers about the methodology used to prepare the profitability information. The Board considered the profitability of Invesco Advisers in managing the Fund and the Invesco Funds. The Board noted that Invesco Advisers continues to operate at a net profit from services Invesco Advisers and its subsidiaries provide to the Invesco Funds and the Fund. The Board did not deem the level of profits realized by Invesco Advisers and its affiliates from providing services to the Fund to be excessive given the nature, quality and extent of the services provided to the Invesco Funds. The Board received and accepted information from Invesco Advisers demonstrating that Invesco Advisers and each Affiliated Sub-Adviser are financially sound and have the resources necessary to perform their obligations under the investment advisory agreement and sub-advisory contracts.
| F. | Collateral Benefits to Invesco Advisers and its Affiliates |
The Board considered various other benefits received by Invesco Advisers and its affiliates from the relationship with the Fund, including the fees received for their provision of transfer agency and distribution services to the Fund. The Board considered comparative information regarding fees charged for these services, including information provided by Lipper and other independent sources. The Board considered the performance of Invesco Advisers and its affiliates in providing these services and the organizational structure employed to provide these services. The Board also considered that these services are provided to the Fund pursuant to written contracts that are reviewed and approved on an annual basis by the Board; that the services are required for the operation of the Fund; that Invesco Advisers and its affiliates can provide services, the nature and quality of which are at least equal to those provided by others offering the same or similar services; and that the fees for such services are fair and reasonable in light of the usual and customary charges by others for services of the same nature and quality.
The Board considered the benefits realized by Invesco Advisers and the Affiliated Sub-Advisers as a result of portfolio brokerage transactions
executed through “soft dollar” arrangements. The Board noted that soft dollar arrangements shift the payment obligation for research services from Invesco Advisers and the Affiliated Sub-Advisers to the Invesco Funds and that the research may be used with other clients of Invesco Advisers and may reduce Invesco Advisers’ and the Affiliated Sub-Advisers’ expenses. The Board also considered periodic reports from the Chief Compliance Officer of the Invesco Funds demonstrating that these arrangements are consistent with regulatory requirements. The Board did not deem the soft dollar arrangements to be inappropriate.
The Board considered that the Fund’s uninvested cash and cash collateral from any securities lending arrangements may be invested in money market funds advised by Invesco Advisers pursuant to procedures approved by the Board. The Board noted that Invesco Advisers receives advisory fees from these affiliated money market funds attributable to such investments, although Invesco Advisers has contractually agreed to waive through varying periods the advisory fees payable by the Invesco Funds. The waiver is in an amount equal to 100% of the net advisory fee Invesco Advisers receives from the affiliated money market funds with respect to the Fund’s investment in the affiliated money market funds of uninvested cash, but not cash collateral. The Board concluded that the Fund’s investment of uninvested cash and cash collateral from any securities lending arrangements in the affiliated money market funds is in the best interests of the Fund and its shareholders.
The Board also considered use of an affiliated broker to execute certain trades for the Fund to among other things, control information leakage, and were advised that such trades are executed in compliance with rules under the Investment Company Act of 1940, as amended.
24 Invesco European Growth Fund
Tax Information
Form 1099-DIV, Form 1042-S and other year–end tax information provide shareholders with actual calendar year amounts that should be included in their tax returns. Shareholders should consult their tax advisors.
The following distribution information is being provided as required by the Internal Revenue Code or to meet a specific state’s requirement.
The Fund designates the following amounts or, if subsequently determined to be different, the maximum amount allowable for its fiscal year ended October 31, 2013:
Federal and State Income Tax | ||||
Long-Term Capital Gain Distributions | $ | 15,912,728 | ||
Qualified Dividend Income* | 100 | % | ||
Corporate Dividends Received Deduction* | 0.44 | % | ||
Foreign Taxes | $ | 0.0480 | per share | |
Foreign Source Income | $ | 0.7993 | per share | |
| * | The above percentages are based on ordinary income dividends paid to shareholders during the Fund’s fiscal year. |
25 Invesco European Growth Fund
Trustees and Officers
The address of each trustee and officer is AIM International Mutual Funds (Invesco International Mutual Funds) (the “Trust”), 11 Greenway Plaza, Suite 1000, Houston, Texas 77046-1173. The trustees serve for the life of the Trust, subject to their earlier death, incapacitation, resignation, retirement or removal as more specifically provided in the Trust’s organizational documents. Each officer serves for a one year term or until their successors are elected and qualified. Column two below includes length of time served with predecessor entities, if any.
Name, Year of Birth and Position(s) Held with the Trust | Trustee and/ or Officer Since | Principal Occupation(s) During Past 5 Years | Number of Funds in Fund Complex Overseen by Trustee | Other Directorship(s) Held by Trustee During Past 5 Years | ||||
| Interested Persons | ||||||||
| Martin L. Flanagan1 — 1960 Trustee | 2007 | Executive Director, Chief Executive Officer and President, Invesco Ltd. (ultimate parent of Invesco and a global investment management firm); Advisor to the Board, Invesco Advisers, Inc. (formerly known as Invesco Institutional (N.A.), Inc.); Trustee, The Invesco Funds; Vice Chair, Investment Company Institute; and Member of Executive Board, SMU Cox School of Business
Formerly: Chairman and Chief Executive Officer, Invesco Advisers, Inc. (registered investment adviser); Director, Chairman, Chief Executive Officer and President, IVZ Inc. (holding company), INVESCO Group Services, Inc. (service provider) and Invesco North American Holdings, Inc. (holding company); Director, Chief Executive Officer and President, Invesco Holding Company Limited (parent of Invesco and a global investment management firm); Director, Invesco Ltd.; Chairman, Investment Company Institute and President, Co-Chief Executive Officer, Co-President, Chief Operating Officer and Chief Financial Officer, Franklin Resources, Inc. (global investment management organization) | 117 | None | ||||
Philip A. Taylor2 — 1954 Trustee, President and Principal Executive Officer | 2006 | Head of North American Retail and Senior Managing Director, Invesco Ltd.; Director, Co-Chairman, Co-President and Co-Chief Executive Officer, Invesco Advisers, Inc. (formerly known as Invesco Institutional (N.A.), Inc.) (registered investment adviser); Director, Chairman, Chief Executive Officer and President, Invesco Management Group, Inc. (formerly known as Invesco Aim Management Group, Inc.) (financial services holding company); Director and President, INVESCO Funds Group, Inc. (registered investment adviser and registered transfer agent); Director and Chairman, Invesco Investment Services, Inc. (formerly known as Invesco Aim Investment Services, Inc.) (registered transfer agent) and IVZ Distributors, Inc. (formerly known as INVESCO Distributors, Inc.) (registered broker dealer); Director, President and Chairman, Invesco Inc. (holding company) and Invesco Canada Holdings Inc. (holding company); Chief Executive Officer, Invesco Corporate Class Inc. (corporate mutual fund company) and Invesco Canada Fund Inc. (corporate mutual fund company); Director, Chairman and Chief Executive Officer, Invesco Canada Ltd. (formerly known as Invesco Trimark Ltd./Invesco Trimark Ltèe) (registered investment adviser and registered transfer agent); Trustee, President and Principal Executive Officer, The Invesco Funds (other than AIM Treasurer’s Series Trust (Invesco Treasurer’s Series Trust) and Short-Term Investments Trust); Trustee and Executive Vice President, The Invesco Funds (AIM Treasurer’s Series Trust (Invesco Treasurer’s Series Trust) and Short-Term Investments Trust only); Director, Invesco Investment Advisers LLC (formerly known as Van Kampen Asset Management); Director, Chief Executive Officer and President, Van Kampen Exchange Corp.
Formerly: Director and Chairman, Van Kampen Investor Services Inc.: Director, Chief Executive Officer and President, 1371 Preferred Inc. (holding company); and Van Kampen Investments Inc.; Director and President, AIM GP Canada Inc. (general partner for limited partnerships); and Van Kampen Advisors, Inc.; Director and Chief Executive Officer, Invesco Trimark Dealer Inc. (registered broker dealer); Director, Invesco Distributors, Inc. (formerly known as Invesco Aim Distributors, Inc.) (registered broker dealer); Manager, Invesco PowerShares Capital Management LLC; Director, Chief Executive Officer and President, Invesco Advisers, Inc.; Director, Chairman, Chief Executive Officer and President, Invesco Aim Capital Management, Inc.; President, Invesco Trimark Dealer Inc. and Invesco Trimark Ltd./Invesco Trimark Ltèe; Director and President, AIM Trimark Corporate Class Inc. and AIM Trimark Canada Fund Inc.; Senior Managing Director, Invesco Holding Company Limited; Trustee and Executive Vice President, Tax-Free Investments Trust; Director and Chairman, Fund Management Company (former registered broker dealer); President and Principal Executive Officer, The Invesco Funds (AIM Treasurer’s Series Trust (Invesco Treasurer’s Series Trust), Short-Term Investments Trust and Tax-Free Investments Trust only); President, AIM Trimark Global Fund Inc. and AIM Trimark Canada Fund Inc. | 117 | None | ||||
Wayne W. Whalen3 — 1939 Trustee | 2010 | Of Counsel, and prior to 2010, partner in the law firm of Skadden, Arps, Slate, Meagher & Flom LLP, legal counsel to certain funds in the Fund Complex | 130 | Director of the Mutual Fund Directors Forum, a nonprofit membership organization for investment directors; Chairman and Director of the Abraham Lincoln Presidential Library Foundation; and Director of the Stevenson Center for Democracy |
| 1 | Mr. Flanagan is considered an interested person of the Trust because he is an officer of the adviser to the Trust, and an officer and a director of Invesco Ltd., ultimate parent of the adviser to the Trust. |
| 2 | Mr. Taylor is considered an interested person of the Trust because he is an officer and a director of the adviser to, and a director of the principal underwriter of, the Trust. |
| 3 | Mr. Whalen is considered an “interested person” (within the meaning of Section 2(a)(19) of the 1940 Act) of certain Funds in the Invesco Fund Complex because he and his firm currently provide legal services as legal counsel to such Funds. |
T-1 Invesco European Growth Fund
Trustees and Officers—(continued)
Name, Year of Birth and Position(s) Held with the Trust | Trustee and/ or Officer Since | Principal Occupation(s) During Past 5 Years | Number of Funds in Fund Complex Overseen by Trustee | Other Directorship(s) Held by Trustee During Past 5 Years | ||||
| Independent Trustees | ||||||||
Bruce L. Crockett — 1944 Trustee and Chair | 1992 | Chairman, Crockett Technologies Associates (technology consulting company)
Formerly: Director, Captaris (unified messaging provider); Director, President and Chief Executive Officer COMSAT Corporation; and Chairman, Board of Governors of INTELSAT (international communications company) | 117 | ACE Limited (insurance company); Investment Company Institute | ||||
David C. Arch — 1945 Trustee | 2010 | Chairman and Chief Executive Officer of Blistex Inc., (consumer health care products manufacturer)
Formerly: Member of the Heartland Alliance Advisory Board, a nonprofit organization serving human needs based in Chicago | 130 | Board member of the Illinois Manufacturers’ Association; Member of the Board of Visitors, Institute for the Humanities, University of Michigan | ||||
Frank S. Bayley — 1939 Trustee | 2001 | Retired
Formerly: Director, Badgley Funds, Inc. (registered investment company) (2 portfolios) and General Partner and Of Counsel, law firm of Baker & McKenzie, LLP | 117 | Director and Chairman, C.D. Stimson Company (a real estate investment company); Trustee and Overseer, The Curtis Institute of Music | ||||
James T. Bunch — 1942 Trustee | 2003 | Managing Member, Grumman Hill Group LLC (family office private equity management)
Formerly: Founder, Green, Manning & Bunch Ltd. (investment banking firm)(1988-2010); Executive Committee, United States Golf Association; and Director, Policy Studies, Inc. and Van Gilder Insurance Corporation | 117 | Chairman, Board of Governors, Western Golf Association; Chairman-elect, Evans Scholars Foundation; and Director, Denver Film Society | ||||
Rodney F. Dammeyer — 1940 Trustee | 2010 | Chairman of CAC, LLC, (private company offering capital investment and management advisory services)
Formerly: Prior to 2001, Managing Partner at Equity Group Corporate Investments; Prior to 1995, Chief Executive Officer of Itel Corporation (formerly Anixter International); Prior to 1985, experience includes Senior Vice President and Chief Financial Officer of Household International, Inc., Executive Vice President and Chief Financial Officer of Northwest Industries, Inc. and Partner of Arthur Andersen & Co.; From 1987 to 2010, Director/Trustee of investment companies in the Van Kampen Funds complex | 117 | Director of Quidel Corporation and Stericycle, Inc.; Prior to May 2008, Trustee of The Scripps Research Institute; Prior to February 2008, Director of Ventana Medical Systems, Inc. | ||||
Albert R. Dowden — 1941 Trustee | 2000 | Director of a number of public and private business corporations, including the Boss Group, Ltd. (private investment and management); and Reich & Tang Funds (5 portfolios) (registered investment company)
Formerly: Director, Homeowners of America Holding Corporation/Homeowners of America Insurance Company (property casualty company); Director, Continental Energy Services, LLC (oil and gas pipeline service); Director, CompuDyne Corporation (provider of product and services to the public security market) and Director, Annuity and Life Re (Holdings), Ltd. (reinsurance company); Director, President and Chief Executive Officer, Volvo Group North America, Inc.; Senior Vice President, AB Volvo; Director of various public and private corporations; Chairman, DHJ Media, Inc.; Director, Magellan Insurance Company; and Director, The Hertz Corporation, Genmar Corporation (boat manufacturer), National Media Corporation; Advisory Board of Rotary Power International (designer, manufacturer, and seller of rotary power engines); and Chairman, Cortland Trust, Inc. (registered investment company) | 117 | Director of Nature’s Sunshine Products, Inc. | ||||
Jack M. Fields — 1952 Trustee | 1997 | Chief Executive Officer, Twenty First Century Group, Inc. (government affairs company); Owner and Chief Executive Officer, Dos Angeles Ranch, L.P. (cattle, hunting, corporate entertainment); and Discovery Global Education Fund (non-profit)
Formerly: Chief Executive Officer, Texana Timber LP (sustainable forestry company); Director of Cross Timbers Quail Research Ranch (non-profit); and member of the U.S. House of Representatives | 117 | Insperity, Inc. (formerly known as Administaff) | ||||
Prema Mathai-Davis — 1950 Trustee | 1998 | Retired
Formerly: Chief Executive Officer, YWCA of the U.S.A. | 117 | None | ||||
Larry Soll — 1942 Trustee | 2003 | Retired
Formerly: Chairman, Chief Executive Officer and President, Synergen Corp. (a biotechnology company) | 117 | None | ||||
Hugo F. Sonnenschein — 1940 Trustee | 2010 | Distinguished Service Professor and President Emeritus of the University of Chicago and the Adam Smith Distinguished Service Professor in the Department of Economics at the University of Chicago
Formerly: President of the University of Chicago | 130 | Trustee of the University of Rochester and a member of its investment committee. Member of the National Academy of Sciences, the American Philosophical Society and a fellow of the American Academy of Arts and Sciences | ||||
Raymond Stickel, Jr. — 1944 Trustee | 2005 | Retired
Formerly: Director, Mainstay VP Series Funds, Inc. (25 portfolios) and Partner, Deloitte & Touche | 117 | None |
T-2 Invesco European Growth Fund
Trustees and Officers—(continued)
Name, Year of Birth and Position(s) Held with the Trust | Trustee and/ or Officer Since | Principal Occupation(s) During Past 5 Years | Number of Funds in Fund Complex Overseen by Trustee | Other Directorship(s) Held by Trustee During Past 5 Years | ||||
| Other Officers | ||||||||
Russell C. Burk — 1958 Senior Vice President and Senior Officer | 2005 | Senior Vice President and Senior Officer, The Invesco Funds | N/A | N/A | ||||
John M. Zerr — 1962 Senior Vice President, Chief Legal Officer and Secretary | 2006 | Director, Senior Vice President, Secretary and General Counsel, Invesco Management Group, Inc. (formerly known as Invesco Aim Management Group, Inc.) and Van Kampen Exchange Corp.; Senior Vice President, Invesco Advisers, Inc. (formerly known as Invesco Institutional (N.A.), Inc.) (registered investment adviser); Senior Vice President and Secretary, Invesco Distributors, Inc. (formerly known as Invesco Aim Distributors, Inc.); Director, Vice President and Secretary, Invesco Investment Services, Inc. (formerly known as Invesco Aim Investment Services, Inc.) and IVZ Distributors, Inc. (formerly known as INVESCO Distributors, Inc.); Director and Vice President, INVESCO Funds Group, Inc.; Senior Vice President, Chief Legal Officer and Secretary, The Invesco Funds; Manager, Invesco PowerShares Capital Management LLC; Director, Secretary and General Counsel, Invesco Investment Advisers LLC (formerly known as Van Kampen Asset Management); Secretary and General Counsel, Invesco Capital Markets, Inc. (formerly known as Van Kampen Funds Inc.) and Chief Legal Officer, PowerShares Exchange-Traded Fund Trust, PowerShares Exchange-Traded Fund Trust II, PowerShares India Exchange-Traded Fund Trust and PowerShares Actively Managed Exchange-Traded Fund Trust
Formerly: Director and Vice President, Van Kampen Advisors Inc.; Director, Vice President, Secretary and General Counsel, Van Kampen Investor Services Inc.; Director, Invesco Distributors, Inc. (formerly known as Invesco Aim Distributors, Inc.); Director, Senior Vice President, General Counsel and Secretary, Invesco Aim Advisers, Inc. and Van Kampen Investments Inc.; Director, Vice President and Secretary, Fund Management Company; Director, Senior Vice President, Secretary, General Counsel and Vice President, Invesco Aim Capital Management, Inc.; Chief Operating Officer and General Counsel, Liberty Ridge Capital, Inc. (an investment adviser); Vice President and Secretary, PBHG Funds (an investment company) and PBHG Insurance Series Fund (an investment company); Chief Operating Officer, General Counsel and Secretary, Old Mutual Investment Partners (a broker-dealer); General Counsel and Secretary, Old Mutual Fund Services (an administrator) and Old Mutual Shareholder Services (a shareholder servicing center); Executive Vice President, General Counsel and Secretary, Old Mutual Capital, Inc. (an investment adviser); and Vice President and Secretary, Old Mutual Advisors Funds (an investment company) | N/A | N/A | ||||
Karen Dunn Kelley — 1960 Vice President | 2004 | Senior Managing Director, Investments; Director, Co-President, Co-Chief Executive Officer, and Co-Chairman, Invesco Advisers, Inc. (formerly known as Invesco Institutional (N.A.), Inc.) (registered investment adviser); Chairman, Invesco Senior Secured Management, Inc.; Senior Vice President, Invesco Management Group, Inc. (formerly known as Invesco Aim Management Group, Inc.); Executive Vice President, Invesco Distributors, Inc. (formerly known as Invesco Aim Distributors, Inc.); Director, Invesco Mortgage Capital Inc., and Invesco Management Company Limited; Director and President, INVESCO Asset Management (Bermuda) Ltd., Vice President, The Invesco Funds (other than AIM Treasurer’s Series Trust (Invesco Treasurer’s Series Trust) and Short-Term Investments Trust); and President and Principal Executive Officer, The Invesco Funds (AIM Treasurer’s Series Trust (Invesco Treasurer’s Series Trust) and Short-Term Investments Trust only)
Formerly: Director, INVESCO Global Asset Management Limited and INVESCO Management S.A.; Senior Vice President, Van Kampen Investments Inc. and Invesco Advisers, Inc. (formerly known as Invesco Institutional (N.A.), Inc.) (registered investment adviser); Vice President, Invesco Advisers, Inc. (formerly known as Invesco Institutional (N.A.), Inc.); Director of Cash Management and Senior Vice President, Invesco Advisers, Inc. and Invesco Aim Capital Management, Inc.; President and Principal Executive Officer, Tax-Free Investments Trust; Director and President, Fund Management Company; Chief Cash Management Officer, Director of Cash Management, Senior Vice President, and Managing Director, Invesco Aim Capital Management, Inc.; Director of Cash Management, Senior Vice President, and Vice President, Invesco Advisers, Inc. and The Invesco Funds (AIM Treasurer’s Series Trust (Invesco Treasurer’s Series Trust), Short-Term Investments Trust and Tax-Free Investments Trust only) | N/A | N/A |
T-3 Invesco European Growth Fund
Trustees and Officers—(continued)
Name, Year of Birth and Position(s) Held with the Trust | Trustee and/ or Officer Since | Principal Occupation(s) During Past 5 Years | Number of Funds in Fund Complex Overseen by Trustee | Other Directorship(s) Held by Trustee During Past 5 Years | ||||
| Other Officers—(continued) | ||||||||
Sheri Morris — 1964 Vice President, Treasurer and Principal Financial Officer | 1999 | Vice President, Treasurer and Principal Financial Officer, The Invesco Funds; Vice President, Invesco Advisers, Inc. (formerly known as Invesco Institutional (N.A.), Inc.) (registered investment adviser); and Vice President, PowerShares Exchange-Traded Fund Trust, PowerShares Exchange-Traded Fund Trust II, PowerShares India Exchange-Traded Fund Trust and PowerShares Actively Managed Exchange-Traded Fund Trust
Formerly: Vice President, Invesco Aim Advisers, Inc., Invesco Aim Capital Management, Inc. and Invesco Aim Private Asset Management, Inc.; Assistant Vice President and Assistant Treasurer, The Invesco Funds and Assistant Vice President, Invesco Advisers, Inc., Invesco Aim Capital Management, Inc. and Invesco Aim Private Asset Management, Inc.; and Treasurer, PowerShares Exchange-Traded Fund Trust, PowerShares Exchange-Traded Fund Trust II, PowerShares India Exchange-Traded Fund Trust and PowerShares Actively Managed Exchange-Traded Fund Trust | N/A | N/A | ||||
Crissie M. Wisdom — 1969 Anti-Money Laundering Compliance Officer | 2013 | Anti-Money Laundering Compliance Officer, Invesco Advisers, Inc. (formerly known as Invesco Institutional (N.A.), Inc.) (registered investment adviser), Invesco Capital Markets, Inc. (formerly known as Van Kampen Funds Inc.), Invesco Distributors, Inc., Invesco Investment Services, Inc., Invesco Management Group, Inc., Van Kampen Exchange Corp., The Invesco Funds, Invesco Funds (Chicago), and PowerShares Exchange-Traded Fund Trust, PowerShares Exchange-Traded Fund Trust II, PowerShares India Exchange-Traded Fund Trust, and PowerShares Actively Managed Exchange-Traded Fund Trust; and Fraud Prevention Manager and Controls and Risk Analysis Manager for Invesco Investment Services, Inc. | N/A | N/A | ||||
Todd L. Spillane — 1958 Chief Compliance Officer | 2006 | Senior Vice President, Invesco Management Group, Inc. (formerly known as Invesco Aim Management Group, Inc.) and Van Kampen Exchange Corp.; Senior Vice President and Chief Compliance Officer, Invesco Advisers, Inc. (registered investment adviser) (formerly known as Invesco Institutional (N.A.), Inc.); Chief Compliance Officer, The Invesco Funds; Vice President, Invesco Distributors, Inc. (formerly known as Invesco Aim Distributors, Inc.) and Invesco Investment Services, Inc. (formerly known as Invesco Aim Investment Services, Inc.)
Formerly: Chief Compliance Officer, Invesco Funds (Chicago); Senior Vice President, Van Kampen Investments Inc.; Senior Vice President and Chief Compliance Officer, Invesco Aim Advisers, Inc. and Invesco Aim Capital Management, Inc.; Chief Compliance Officer, INVESCO Private Capital Investments, Inc. (holding company), Invesco Private Capital, Inc. (registered investment adviser), Invesco Global Asset Management (N.A.), Inc., Invesco Senior Secured Management, Inc. (registered investment adviser), Van Kampen Investor Services Inc., PowerShares Exchange-Traded Fund Trust, PowerShares Exchange-Traded Fund Trust II, PowerShares India Exchange-Traded Fund Trust and PowerShares Actively Managed Exchange-Traded Fund Trust; and Vice President, Invesco Aim Capital Management, Inc. and Fund Management Company | N/A | N/A |
The Statement of Additional Information of the Trust includes additional information about the Fund’s Trustees and is available upon request, without charge, by calling 1.800.959.4246. Please refer to the Fund’s prospectus for information on the Fund’s sub-advisers.
Office of the Fund 11 Greenway Plaza, Suite 1000 Houston, TX 77046-1173 | Investment Adviser Invesco Advisers, Inc. 1555 Peachtree Street, N.E. Atlanta, GA 30309 | Distributor Invesco Distributors, Inc. 11 Greenway Plaza, Suite 1000 Houston, TX 77046-1173 | Auditors PricewaterhouseCoopers LLP 1201 Louisiana Street, Suite 2900 Houston, TX 77002-5678 | |||
Counsel to the Fund Stradley Ronon Stevens & Young, LLP 2005 Market Street, Suite 2600 Philadelphia, PA 19103-7018 | Counsel to the Independent Trustees Goodwin Procter LLP 901 New York Avenue, N.W. Washington, D.C. 20001 | Transfer Agent Invesco Investment Services, Inc. 11 Greenway Plaza, Suite 1000 Houston, TX 77046-1173 | Custodian State Street Bank and Trust Company 225 Franklin Street Boston, MA 02110-2801 | |||
T-4 Invesco European Growth Fund

Invesco mailing information
Send general correspondence to Invesco Investment Services, Inc., P.O. Box 219078, Kansas City, MO 64121-9078.
Invesco privacy policy
You share personal and financial information with us that is necessary for your transactions and your account records. We take very seriously the obligation to keep that information confidential and private.
Invesco collects nonpublic personal information about you from account applications or other forms you complete and from your transactions with us or our affiliates. We do not disclose information about you or our former customers to service providers or other third parties except to the extent necessary to service your account and in other limited circumstances as permitted by law. For example, we use this information to facilitate the delivery of transaction confirmations, financial reports, prospectuses and tax forms.
Even within Invesco, only people involved in the servicing of your accounts and compliance monitoring have access to your information. To ensure the highest level of confidentiality and security, Invesco maintains physical, electronic and procedural safeguards that meet or exceed federal standards. Special measures, such as data encryption and authentication, apply to your communications with us on our website. More detail is available to you at invesco.com/privacy.
Important notice regarding delivery of security holder documents
To reduce Fund expenses, only one copy of most shareholder documents may be mailed to shareholders with multiple accounts at the same address (Householding). Mailing of your shareholder documents may be householded indefinitely unless you instruct us otherwise. If you do not want the mailing of these documents to be combined with those for other members of your household, please contact Invesco Investment Services, Inc. at 800 959 4246 or contact your financial institution. We will begin sending you individual copies for each account within 30 days after receiving your request.
Fund holdings and proxy voting information
The Fund provides a complete list of its holdings four times in each fiscal year, at the quarter ends. For the second and fourth quarters, the lists appear in the Fund’s semiannual and annual reports to shareholders. For the first and third quarters, the Fund files the lists with the Securities and Exchange Commission (SEC) on Form N-Q. The most recent list of portfolio holdings is available at invesco.com/completeqtrholdings. Shareholders can also look up the Fund’s Forms N-Q on the SEC website at sec.gov. Copies of the Fund’s Forms N-Q may be reviewed and copied at the SEC Public Reference Room in Washington, D.C. You can obtain information on the operation of the Public Reference Room, including information about duplicating fee charges, by calling 202 551 8090 or 800 732 0330, or by electronic request at the following email address: publicinfo@sec.gov. The SEC file numbers for the Fund are shown below.
A description of the policies and procedures that the Fund uses to determine how to vote proxies relating to portfolio securities is available without charge, upon request, from our Client Services department at 800 959 4246 or at invesco.com/proxyguidelines. The information is also available on the SEC website, sec.gov.
Information regarding how the Fund voted proxies related to its portfolio securities during the most recent 12-month period ended June 30 is available at invesco.com/proxysearch. The information is also available on the SEC website, sec.gov. Invesco Advisers, Inc. is an investment adviser; it provides investment advisory services to individual and institutional clients and does not sell securities. Invesco Distributors, Inc. is the US distributor for Invesco Ltd.’s retail mutual funds, exchange-traded funds and institutional money market funds. Both are wholly owned, indirect subsidiaries of Invesco Ltd. |  |
SEC file numbers: 811-06463 and 033-44611 EGR-AR-1 Invesco Distributors, Inc.
| ||||||
| Annual Report to Shareholders
|
| October 31, 2013
|
| ||
| ||||||
Invesco Global Growth Fund |
| |||||
Nasdaq: |
| |||||
| A: AGGAX n B: AGGBX n C: AGGCX n Y: AGGYX n R5: GGAIX n R6: AGGFX | ||||||


Letters to Shareholders
Philip Taylor | Dear Shareholders: Enclosed in this annual report, you’ll find information about your Fund and the factors that affected its performance during the reporting period. Inside, you’ll also find a discussion from your portfolio managers about how they managed your Fund, as well as performance data for your Fund, a complete list of your Fund’s investments as of the close of the reporting period and other important information. I hope you find this report of interest. During the reporting period covered by this report, major US equity indexes made multiyear or even all-time highs.1 Economic data were generally positive; housing and consumer spending data were particularly encouraging. Nonetheless, economic uncertainty and concern about continuing political and budget gridlock in Washington persisted. The US Federal Reserve’s deliberate vagueness about when, and to what degree, it might begin to curtail its extraordinarily accommodative monetary policies affected fixed income and equity markets alike. Most | |

developed, non-US stock markets remained positive for the first half of 2013, despite a difficult second quarter.
Periods of market volatility and economic uncertainty can weaken the will of even the most resolute investor. That’s why Invesco believes it’s often helpful to work with a skilled and trusted financial adviser who can emphasize the importance of adhering to an investment plan designed to achieve long-term goals rather than being sidetracked by short-term uncertainty that can result in inaction. A financial adviser who is familiar with your individual financial situation, investment goals and risk tolerance can be an invaluable partner as you work toward your financial goals. He or she can provide insight and perspective when markets are volatile; encouragement and reassurance when times are uncertain; and advice and guidance when your financial situation or investment goals change.
Our website, invesco.com/us, is another source of timely insight and information for investors. On the website, you’ll find fund-specific as well as more general information from many of Invesco’s investment professionals. You’ll find in-depth articles, video clips and audio commentaries – and, of course, you also can access information about your Invesco account whenever it’s convenient for you.
What we mean by Intentional Investing
At Invesco, all of our people and all of our resources are dedicated to helping investors achieve their financial objectives. It’s a philosophy we call Intentional Investing, and it guides the way we:
| n | Manage investments – Our dedicated investment professionals search the world for the best opportunities, and each investment team follows a clear, disciplined process to build portfolios and mitigate risk. |
| n | Provide choices – We offer multiple investment strategies, allowing you and your financial adviser to build a portfolio that’s purpose-built for your needs. |
| n | Connect with you – We’re committed to giving you the expert insights you need to make informed investing decisions, and we are well-equipped to provide high-quality support for investors and advisers. |
At Invesco, we believe in putting investors first. That’s why investment management is all we do. Our sole focus on managing your money allows you and your financial adviser to build a portfolio of Invesco funds appropriate for your investment needs and goals today and when your circumstances change.
Have questions?
For questions about your account, feel free to contact an Invesco client services representative at 800 959 4246. For Invesco-related questions or comments, please email me directly at phil@invesco.com.
All of us at Invesco look forward to serving your investment management needs for many years to come. Thank you for investing with us.
Sincerely,

Philip Taylor
Senior Managing Director, Invesco Ltd.
| 1 | Source: Reuters |
2 Invesco Global Growth Fund
Bruce Crockett | Dear Fellow Shareholders: The Invesco Funds Board has worked on a variety of issues over the last several months, and I’d like to take this opportunity to discuss two that affect you and our fellow fund shareholders. The first issue on which your Board has been working is our annual review of the funds’ advisory and sub-advisory contracts with Invesco Advisers and its affiliates. This annual review, which is required by the Investment Company Act of 1940, focuses on the nature and quality of the services Invesco provides as adviser to the Invesco Funds and the reasonableness of the fees that it charges for those services. Each year, we spend months reviewing detailed information that we request from Invesco that allows us to evaluate its services and fees. We also use information from many independent sources, including materials provided by the independent Senior Officer of the Invesco Funds, who reports directly to the independent Trustees on the Board. Additionally, we meet with independent legal counsel and | |

review performance and fee data prepared by Lipper Inc., an independent, third-party firm widely recognized as a leader in its field.
I’m pleased to report that the Board determined in June that renewing the investment advisory agreement and the sub-advisory contracts with Invesco Advisers and its affiliates would serve the best interests of each fund and its shareholders.
The second area of focus to highlight is the Board’s efforts to ensure that we provide a lineup of funds that allow financial advisers to build portfolios that meet shareholders’ changing financial needs and goals. Today, more and more investors are reaching, or approaching, retirement. But interest rates remain low, making it difficult for many investors to generate the income they need, or will soon need, in their retirement years.
The members of your Board think about these things, too, and we’ve worked with Invesco Advisers to provide more income-generating options in the Invesco Funds lineup to help shareholders potentially meet their income needs. Your Board recently approved changes to three existing equity mutual funds, increasing their focus on generating income while also seeking to provide long-term growth of capital.
As a result of these changes, the funds and their respective management teams now have more flexibility to invest in the types of securities that could meet investors’ growing need for income generation, and in some cases, also help investors diversify their sources of income. These equity funds complement an array of fixed-income, asset allocation and alternative investment options in the Invesco Funds lineup designed to accommodate a variety of risk tolerances.
Be assured that your Board will continue working on behalf of fund shareholders, keeping your needs and interests uppermost in our minds.
As always, please contact me at bruce@brucecrockett.com with any questions or concerns you may have. On behalf of the Board, we look forward to continuing to represent your interests and serving your needs.
Sincerely,

Bruce L. Crockett
Independent Chair
Invesco Funds Board of Trustees
3 Invesco Global Growth Fund
Management’s Discussion of Fund Performance
Performance summary
For the fiscal year ended October 31, 2013, Invesco Global Growth Fund, at net asset value (NAV), delivered double-digit positive returns and performed relatively in line with its style-specific benchmark, the MSCI World Growth Index. The Fund’s investments in Europe provided the largest positive contribution to relative Fund performance, with the Fund’s exposure to Sweden and the UK leading the gains. In contrast, our underweight exposure to Japan was a drag on relative results.
Your Fund’s long-term performance appears later in this report.
Fund vs. Indexes
Total returns, 10/31/12 to 10/31/13, at net asset value (NAV). Performance shown does not include applicable contingent deferred sales charges (CDSC) or front-end sales charges, which would have reduced performance.
| Class A Shares | 24.96 | % | ||
| Class B Shares | 24.03 | |||
| Class C Shares | 24.03 | |||
| Class Y Shares | 25.27 | |||
| Class R5 Shares | 25.51 | |||
| Class R6 Shares | 25.52 | |||
| MSCI World Index‚(Broad Market Index) | 25.77 | |||
| MSCI World Growth Indexn (Style-Specific Index) | 25.22 | |||
| Lipper Global Large-Cap Growth Funds Indexn (Peer Group Index) | 23.46 |
Source(s): ‚Invesco, MSCI via FactSet Research Systems Inc.; nLipper Inc.
How we invest
When selecting stocks for your Fund, we use a disciplined investment strategy that emphasizes fundamental research to identify quality growth companies. This strategy is supported by quantitative analysis, portfolio construction and risk management techniques. Our EQV (earnings, quality and valuation) strategy focuses on identifying stocks that we believe have sustainable above-average earnings growth, efficient capital allocation and attractive prices.
While research responsibilities within the portfolio management team are focused by geographic region, we select investments for the Fund using a bottom-up investment approach, which means we construct the Fund primarily on a stock-by-stock basis. We focus on the strengths of individual companies rather than sectors, countries or market-cap trends.
We believe disciplined sell decisions are the key to successful investing. We consider selling a stock for several reasons, including when:
| n | Its price changes such that we believe it has become too expensive. |
| n | The original investment thesis for the company is no longer valid. |
| n | A more compelling investment opportunity is identified. |
Market conditions and your Fund
The fiscal year ended October 31, 2013, saw slow but steady improvement in global economies and strong US and global equity market returns. In late 2012 and early 2013, consumer confidence trended higher based on the recovery of the US housing market, but uncertainty surrounding the outcome of tax and spending negotiations between the White House and Congress – and
implementation of sequestration spending cuts – left many businesses hesitant to spend.
Asian equity markets (excluding Japan) experienced a volatile fiscal year but generally ended the reporting period on a positive note. Certain emerging Asian markets struggled, however, on the back of continued sensitivity to the global liquidity environment.
Japanese equities rose sharply, based on investors’ hopes that the new government led by Prime Minister Shinzo Abe, along with a “regime-changed” Bank of Japan, would finally arrest deflation. However, the market consolidated in May amid a tug of war between investors’ optimistic view about Abe’s leadership and the potential of “Abenomics” versus concerns about overseas uncertainties, particularly in the US, China and emerging economies.
Improving macroeconomic data and a continued reduction in political uncertainty buoyed European equity markets as the reporting period progressed. UK equities ended the reporting period strongly across many sectors, spurred by improving housing and employment data. Continental Europe posted strong gains for the reporting period as well; indeed, the eurozone officially exited recession in August or September.
Overall, major US and global stock market indexes rose throughout 2013, hitting multiyear or all-time highs.1
We continued to construct the Fund’s portfolio on a bottom-up basis, selecting stocks on an individual basis. From a sector perspective, the Fund delivered positive returns across nine of 10 invested sectors. Stock selection in the information technology (IT) sector contributed favorably to both absolute and relative returns. Particular strength was seen in the IT services and software industries. A top contributor in this sector was Baidu, an Internet search engine company
Portfolio Composition | |||||
| By sector | |||||
Information Technology | 24.0 | % | |||
| Consumer Discretionary | 23.0 | ||||
| Financials | 13.9 | ||||
| Health Care | 9.8 | ||||
| Industrials | 8.4 | ||||
| Energy | 8.0 | ||||
| Consumer Staples | 5.8 | ||||
| Materials | 1.5 | ||||
| Telecommunication Services | 1.4 | ||||
| Utilities | 0.9 | ||||
| Money Market Funds | |||||
| Plus Other Assets Less Liabilities | 3.3 |
Top 10 Equity Holdings*
| |||||
| 1. Reed Elsevier PLC | 2.0 | % | |||
| 2. Apple Inc. | 1.8 | ||||
| 3. WPP PLC | 1.8 | ||||
| 4. BM&FBovespa S.A. | 1.7 | ||||
| 5. SAP AG | 1.7 | ||||
6. Amadeus IT Holding S.A.- Class A | 1.7 | ||||
| 7. Google Inc.-Class A | 1.7 | ||||
| 8. Gilead Sciences, Inc. | 1.5 | ||||
| 9. Teva Pharmaceutical | |||||
| Industries Ltd.-ADR | 1.5 | ||||
| 10. Roche Holding AG | 1.5 | ||||
| Total Net Assets | $362.5 million | ||||
| Total Number of Holdings* | 93 | ||||
The Fund’s holdings are subject to change, and there is no assurance that the Fund will continue to hold any particular security.
*Excluding money market fund holdings.
4 Invesco Global Growth Fund
based in China. Stabilizing margins and growing mobile revenues supported the stock over the reporting period. An overweight position (relative to the style-specific index) in the strong consumer discretionary sector was supportive on a relative basis as well. The Fund’s holdings in the media, retailing, and hotels, restaurants and leisure industries were particularly strong. Top contributors in this sector included UK-based professional information solutions publisher Reed Elsevier and Macau-based casino Galaxy Entertainment.
In contrast, stock selection in the energy sector was a drag on relative results; the Fund’s lack of exposure to several strong-performing stocks included in the index, particularly in the oil services industry, detracted from relative performance. Although the Fund’s underweight position in the materials sector was supportive of relative results, stock selection in this sector detracted from absolute results. One of the Fund’s largest stock level detractors over the reporting period was Potash, a Canadian potash and fertilizer company. The company’s stock and the fertilizer business was weak on the surprise news that Ural-kali (not a Fund holding), the world’s biggest potash producer, suddenly abandoned limits on output, which underpinned prices. With the potash cartel broken, investors worried that a flood of supplies may lead to lower potash prices.
In broad geographic terms, the Fund benefited most significantly from strong outperformance in Sweden, Hong Kong, Canada and the UK. Among our UK holdings, a significant contributor to Fund performance included Reed Elsevier. This company performed well as it reported stronger-than-expected earnings, raised its dividend and share buy-back program, and provided further evidence that it continues to expand its electronic publishing and professional events (exhibitions and conferences) businesses faster than its print revenues decline.
In contrast, relative gains for the Fund were modestly offset by the negative impact of underweight exposure in Japan. Although the Japanese market delivered strong results over the reporting period, identifying Japanese companies that meet our EQV criteria was challenging; in particular, “quality” companies
remained hard to find. Increased Japanese market earnings expectations were largely currency related, and underlying improvements in businesses were not apparent. Due to this, the Fund had a limited 5% position in Japanese equities versus the index weight of 18%.
The Fund’s positioning is driven by our stock selection process as opposed to top-down allocation decisions. In terms of sector positioning at fiscal year end, the Fund’s largest absolute and overweight positions were in the IT, consumer discretionary, energy and financials sectors. The Fund ended the reporting period underweight relative to the benchmark in the consumer staples, materials, industrials and health care sectors. From a geographic perspective, the Fund ended the fiscal year with overweight exposure to Europe and Asia relative to the index. Our allocation to the US remained underweight despite the addition of several new US holdings to the portfolio during the reporting period.
With market volatility likely to continue for some time, our focus remains on ensuring that our portfolio is comprised of high-quality, reasonably valued companies capable of sustained earnings growth. We believe that this balanced EQV-focused approach may help deliver attractive returns over the long term.
We thank you for your continued investment in Invesco Global Growth Fund.
| 1 | Source: Reuters |
The views and opinions expressed in management’s discussion of Fund performance are those of Invesco Advisers, Inc. These views and opinions are subject to change at any time based on factors such as market and economic conditions. These views and opinions may not be relied upon as investment advice or recommendations, or as an offer for a particular security. The information is not a complete analysis of every aspect of any market, country, industry, security or the Fund. Statements of fact are from sources considered reliable, but Invesco Advisers, Inc. makes no representation or warranty as to their completeness or accuracy. Although historical performance is no guarantee of future results, these insights may help you understand our investment management philosophy.
See important Fund and, if applicable, index disclosures later in this report.
 | Matthew Dennis Chartered Financial Analyst, portfolio manager, is lead manager of Invesco Global Growth | |
| Fund. He joined Invesco in 2000. Mr. Dennis earned a BA in economics from The University of Texas at Austin and an MS in finance from Texas A&M University. | ||
 | Ryan Amerman Chartered Financial Analyst, portfolio manager, is manager of Invesco Global Growth Fund. | |
| He joined Invesco in 1996. Mr. Amerman earned a BBA from Stephen F. Austin State University and an MBA from the University of St. Thomas. | ||
 | Mark Jason Chartered Financial Analyst, portfolio manager, is manager of Invesco Global Growth Fund. | |
| He joined Invesco in 2001. Mr. Jason earned a BS in finance and a BS in real estate from California State University, Northridge. | ||
| 5 Invesco Global Growth Fund |
Your Fund’s Long-Term Performance
Results of a $10,000 Investment – Oldest Share Class(es)
Fund and index data from 10/31/03
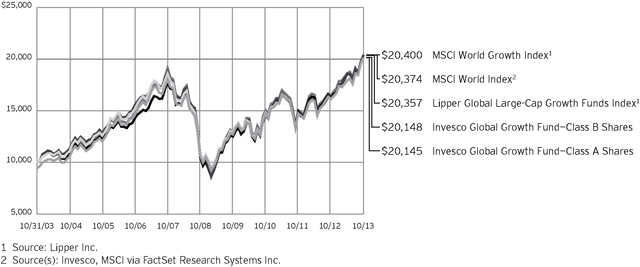
Past performance cannot guarantee comparable future results.
The data shown in the chart include reinvested distributions, applicable sales charges and Fund expenses including management fees. Results for Class B shares are calculated as if a hypothetical
shareholder had liquidated his entire investment in the Fund at the close of the reporting period and paid the contingent deferred sales charges, if applicable. Index results include reinvested dividends, but they do not reflect sales charges. Performance of the peer group,
if applicable, reflects fund expenses and management fees; performance of a market index does not. Performance shown in the chart and table(s) does not reflect deduction of taxes a shareholder would pay on Fund distributions or sale of Fund shares.
continued from page 8
volatile due to less market interest and less publicly available information about the issuer. They also may be illiquid or restricted as to resale, or may trade less frequently and in smaller volumes, all of which may cause difficulty when establishing or closing a position at a desirable price.
About indexes used in this report
| n | The MSCI World IndexSM is an unmanaged index considered representative of stocks of developed countries. The index is computed using the net return, which withholds applicable taxes for non-resident investors. |
| n | The MSCI World Growth Index is an unmanaged index considered representative of growth stocks of developed countries. The index is computed using the net return, which withholds applicable taxes for non-resident investors. |
| n | The Lipper Global Large-Cap Growth Funds Index is an unmanaged index considered representative of global large-cap growth funds tracked by Lipper. |
| n | The Fund is not managed to track the performance of any particular index, including the index(es) described here, and consequently, the performance of the Fund may deviate significantly from the performance of the index(es). |
| n | A direct investment cannot be made in an index. Unless otherwise indicated, index results include reinvested dividends, and they do not reflect sales charges. Performance of the peer group, if applicable, reflects fund expenses; performance of a market index does not. |
Other information
| n | The returns shown in management’s discussion of Fund performance are based on net asset values calculated for shareholder transactions. Generally accepted accounting principles require adjustments to be made to the net assets of the Fund at period end for financial reporting purposes, and as such, the net asset values for shareholder transactions and the returns based on those net asset values may differ from the net asset values and returns reported in the Financial Highlights. |
| n | Industry classifications used in this report are generally according to the Global Industry Classification Standard, which was developed by and is the exclusive property and a service mark of MSCI Inc. and Standard & Poor’s. |
6 Invesco Global Growth Fund
| Average Annual Total Returns | |||||
As of 10/31/13, including maximum applicable sales charges | |||||
Class A Shares | |||||
| Inception (9/15/94) | 6.61 | % | |||
| 10 Years | 7.25 | ||||
| 5 Years | 12.36 | ||||
| 1 Year | 18.08 | ||||
| Class B Shares | |||||
| Inception (9/15/94) | 6.68 | % | |||
| 10 Years | 7.26 | ||||
| 5 Years | 12.54 | ||||
| 1 Year | 19.03 | ||||
| Class C Shares | |||||
| Inception (8/4/97) | 3.70 | % | |||
| 10 Years | 7.10 | ||||
| 5 Years | 12.78 | ||||
| 1 Year | 23.03 | ||||
| Class Y Shares | |||||
| 10 Years | 8.00 | % | |||
| 5 Years | 13.91 | ||||
| 1 Year | 25.27 | ||||
| Class R5 Shares | |||||
| 10 Years | 8.23 | % | |||
| 5 Years | 14.24 | ||||
| 1 Year | 25.51 | ||||
| Class R6 Shares | |||||
| 10 Years | 7.92 | % | |||
| 5 Years | 13.74 | ||||
1 Year | 25.52 | ||||
Class Y shares incepted on October 3, 2008. Performance shown prior to that date is that of Class A shares and includes the 12b-1 fees applicable to Class A shares. Class A share performance reflects any applicable fee waivers or expense reimbursements.
Class R5 shares incepted on September 28, 2007. Performance shown prior to that date is that of Class A shares and includes the 12b-1 fees applicable to Class A shares. Class A share performance reflects any applicable fee waivers or expense reimbursements.
Class R6 shares incepted on September 24, 2012. Performance shown prior to that date is that of Class A shares and includes the 12b-1 fees applicable to Class A shares. Class A share performance reflects any applicable fee waivers or expense reimbursements.
The performance data quoted represent past performance and cannot guarantee comparable future results; current performance
| Average Annual Total Returns | |||||
As of 9/30/13, the most recent calendar quarter end, including maximum applicable sales charges | |||||
| Class A Shares | |||||
| Inception (9/15/94) | 6.48 | % | |||
| 10 Years | 7.59 | ||||
| 5 Years | 7.44 | ||||
| 1 Year | 13.12 | ||||
| Class B Shares | |||||
| Inception (9/15/94) | 6.56 | % | |||
| 10 Years | 7.59 | ||||
| 5 Years | 7.56 | ||||
| 1 Year | 13.81 | ||||
| Class C Shares | |||||
| Inception (8/4/97) | 3.54 | % | |||
| 10 Years | 7.42 | ||||
| 5 Years | 7.86 | ||||
| 1 Year | 17.76 | ||||
| Class Y Shares | |||||
| 10 Years | 8.34 | % | |||
| 5 Years | 8.94 | ||||
| 1 Year | 19.97 | ||||
| Class R5 Shares | |||||
| 10 Years | 8.56 | % | |||
| 5 Years | 9.25 | ||||
| 1 Year | 20.19 | ||||
| Class R6 Shares | |||||
| 10 Years | 8.25 | % | |||
| 5 Years | 8.76 | ||||
| 1 Year | 20.20 | ||||
may be lower or higher. Please visit invesco.com/performance for the most recent month-end performance. Performance figures reflect reinvested distributions, changes in net asset value and the effect of the maximum sales charge unless otherwise stated. Investment return and principal value will fluctuate so that you may have a gain or loss when you sell shares.
The total annual Fund operating expense ratio set forth in the most recent Fund prospectus as of the date of this report for Class A, Class B, Class C,
Class Y, Class R5 and Class R6 shares was 1.56%, 2.31%, 2.31%, 1.31%, 0.99% and 0.98%, respectively. The expense ratios presented above may vary from the expense ratios presented in other sections of this report that are based on expenses incurred during the period covered by this report.
Class A share performance reflects the maximum 5.50% sales charge, and Class B and Class C share performance reflects the applicable contingent
deferred sales charge (CDSC) for the period involved. The CDSC on Class B shares declines from 5% beginning at the time of purchase to 0% at the beginning of the seventh year. The CDSC on Class C shares is 1% for the first year after purchase. Class Y, Class R5 and Class R6 shares do not have a front-end sales charge or a CDSC; therefore, performance is at net asset value.
The performance of the Fund’s share classes will differ primarily due to different sales charge structures and class expenses.
7 Invesco Global Growth Fund
Invesco Global Growth Fund’s investment objective is long-term growth of capital.
| n | Unless otherwise stated, information presented in this report is as of October 31, 2013, and is based on total net assets. |
| n | Unless otherwise noted, all data provided by Invesco. |
| n | To access your Fund’s reports/prospectus, visit invesco.com/fundreports. |
About share classes
| n | Class B shares may not be purchased for new or additional investments. Please see the prospectus for more information. |
| n | Class Y shares are available to only certain investors. Please see the prospectus for more information. |
| n | Class R5 shares and Class R6 shares are primarily intended for employer sponsored retirement and benefit plans that meet certain standards and for institutional investors. On September 24, 2012, Institutional Class shares were renamed Class R5 shares. Please see the prospectus for more information. |
Principal risks of investing in the Fund
| n | Depositary receipts risk. Depositary receipts involve many of the same risks as those associated with direct investments in foreign securities. In addition, the underlying issuers of certain depositary receipts, particularly unsponsored or unregistered depositary receipts, are under no obligation to distribute shareholder communications to the holders of such receipts, or to pass through to them any voting rights with respect to the deposited securities. |
| n | Derivatives risk. The performance of derivative instruments is tied to the performance of an underlying currency, security, index, commodity or other asset. In addition to risks relating to their underlying assets, the use of derivatives may include other, possibly greater, risks. Derivatives involve costs, may be volatile, and may involve a small initial investment relative to the risk assumed. Risks associated with the use of derivatives may include counterparty, margin, leverage, correlation, liquidity, tax, market, interest rate and management risks, as well as the risk of potential increased regulation of derivatives. Derivatives may also be more difficult to purchase, sell or value than other investments. The Fund may lose more |
than the cash amount invested on investments in derivatives. Each of these risks is greater for the Fund than mutual funds that do not use derivatives to implement their investment strategy.
| n | Developing/emerging markets securities risk. Securities issued by foreign companies and governments located in developing/emerging markets countries may be affected more negatively by inflation, devaluation of their currencies, higher transaction costs, delays in settlement, adverse political developments, the introduction of capital controls, withholding taxes, nationalization of private assets, expropriation, social unrest, war or lack of timely information than those in developed countries. |
| n | Foreign securities risk. The Fund’s foreign investments may be affected by changes in a foreign country’s exchange rates, political and social instability, changes in economic or taxation policies, difficulties when enforcing obligations, decreased liquidity, and increased volatility. Foreign companies may be subject to less regulation resulting in less publicly available information about the companies. |
| n | Geographic focus risk. From time to time the Fund may invest a substantial amount of its assets in securities of issuers located in a single country or a limited number of countries. If the Fund focuses its investments in this manner, it assumes the risk that economic, political and social conditions in those countries will have a significant impact on its investment performance. The Fund’s investment performance may also be more volatile if it focuses its investments in certain countries, especially emerging markets countries. |
| n | Growth investing risk. Growth stocks tend to be more expensive relative to their earnings or assets compared with other types of stock. As a result they tend to be more sensitive to changes in their earnings and can be more volatile. |
| n | Investing in the European Union risk. Many countries in the European Union are susceptible to high economic risks associated with high levels of debt, notably due to investments in sovereign debts of European countries such as Greece, Italy and Spain. One or more member states might exit the European Union, placing its currency and banking system in jeopardy. The European Union faces major issues involving its membership, structure, procedures and policies, including the adoption, abandonment or adjustment of the new constitutional treaty, the European Union’s enlargement to the south and east, and resolution of the European Union’s problematic fiscal and democratic accountability. Efforts of the member states to further unify their economic and monetary policies may increase the potential for the downward movement of one member state’s market to cause a similar effect on other member states’ markets. European countries that are part of the European Economic and Monetary Union may be significantly affected by the tight fiscal and monetary controls that the union seeks to impose on its members. |
| n | Management risk. The investment techniques and risk analysis used by the Fund’s portfolio managers may not produce the desired results. |
| n | Market risk. The prices of and the income generated by the Fund’s securities may decline in response to, among other things, investor sentiment, general economic and market conditions, regional or global instability, and currency and interest rate fluctuations. |
| n | Small- and mid-capitalization risks. Stocks of small- and mid-sized companies tend to be more vulnerable to adverse developments and may have little or no operating history or track record of success, and limited product lines, markets, management and financial resources. The securities of small- and mid-sized companies may be more |
continued on page 6
This report must be accompanied or preceded by a currently effective Fund prospectus, which contains more complete information, including sales charges and expenses. Investors should read it carefully before investing.
NOT FDIC INSURED | MAY LOSE VALUE | NO BANK GUARANTEE
Fund Nasdaq Symbols
Class A Shares | AGGAX | ||||
Class B Shares | AGGBX | ||||
Class C Shares | AGGCX | ||||
Class Y Shares | AGGYX | ||||
Class R5 Shares | GGAIX | ||||
Class R6 Shares | AGGFX |
8 Invesco Global Growth Fund
Schedule of Investments
October 31, 2013
| Shares | Value | |||||||
Common Stocks & Other Equity Interests–96.70% |
| |||||||
| Australia–1.37% | ||||||||
Brambles Ltd. | 296,261 | $ | 2,604,241 | |||||
WorleyParsons Ltd. | 112,588 | 2,347,585 | ||||||
| 4,951,826 | ||||||||
| Belgium–1.36% | ||||||||
Anheuser-Busch InBev N.V. | 47,400 | 4,920,654 | ||||||
| Brazil–3.74% | ||||||||
Banco Bradesco S.A.–ADR | 310,721 | 4,480,597 | ||||||
BM&FBovespa S.A. | 1,102,300 | 6,215,755 | ||||||
Cielo S.A. | 94,832 | 2,879,086 | ||||||
| 13,575,438 | ||||||||
| Canada–3.08% | ||||||||
CGI Group Inc.–Class A(a) | 131,209 | 4,402,159 | ||||||
Potash Corp. of Saskatchewan Inc. | 46,146 | 1,434,040 | ||||||
Suncor Energy, Inc. | 146,919 | 5,339,307 | ||||||
| 11,175,506 | ||||||||
| China–6.02% | ||||||||
Baidu, Inc.–ADR(a) | 32,213 | 5,183,072 | ||||||
Belle International Holdings Ltd. | 2,162,000 | 3,050,726 | ||||||
China Mobile Ltd. | 206,000 | 2,142,408 | ||||||
CNOOC Ltd. | 2,421,000 | 4,920,690 | ||||||
Industrial & Commercial Bank of China Ltd.–Class H | 5,680,000 | 3,978,125 | ||||||
NetEase, Inc.–ADR | 37,886 | 2,557,684 | ||||||
| 21,832,705 | ||||||||
| Denmark–1.64% | ||||||||
Carlsberg AS–Class B | 26,722 | 2,668,163 | ||||||
Novo Nordisk AS–Class B | 19,632 | 3,270,279 | ||||||
| 5,938,442 | ||||||||
| France–3.20% | ||||||||
Publicis Groupe S.A. | 34,682 | 2,885,551 | ||||||
Schneider Electric S.A. | 49,512 | 4,163,119 | ||||||
Total S.A. | 74,369 | 4,561,147 | ||||||
| 11,609,817 | ||||||||
| Germany–6.47% | ||||||||
Adidas AG | 37,589 | 4,290,988 | ||||||
Deutsche Boerse AG | 54,247 | 4,083,956 | ||||||
Deutsche Post AG | 75,507 | 2,555,208 | ||||||
Deutsche Telekom AG | 177,480 | 2,795,189 | ||||||
SAP AG | 77,740 | 6,106,984 | ||||||
Volkswagen AG–Preference Shares | 14,200 | 3,609,093 | ||||||
| 23,441,418 | ||||||||
| Hong Kong–2.24% | ||||||||
Galaxy Entertainment Group Ltd.(a) | 592,000 | 4,409,474 | ||||||
| Shares | Value | |||||||
| Hong Kong–(continued) | ||||||||
Hutchison Whampoa Ltd. | 299,000 | $ | 3,725,448 | |||||
| 8,134,922 | ||||||||
| Indonesia–0.87% | ||||||||
PT Bank Mandiri Persero Tbk | 4,123,500 | 3,137,779 | ||||||
| Israel–2.46% | ||||||||
Check Point Software Technologies Ltd.(a) | 59,602 | 3,458,108 | ||||||
Teva Pharmaceutical Industries Ltd.–ADR | 147,464 | 5,469,440 | ||||||
| 8,927,548 | ||||||||
| Japan–3.37% | ||||||||
Fanuc Corp. | 25,000 | 4,009,859 | ||||||
Keyence Corp. | 6,900 | 2,955,739 | ||||||
Komatsu Ltd. | 101,600 | 2,223,045 | ||||||
Toyota Motor Corp. | 46,500 | 3,016,954 | ||||||
| 12,205,597 | ||||||||
| Mexico–0.89% | ||||||||
Grupo Televisa S.A.B.–ADR | 105,687 | 3,217,112 | ||||||
| Netherlands–0.90% | ||||||||
Unilever N.V. | 82,134 | 3,252,844 | ||||||
| Singapore–0.70% | ||||||||
United Overseas Bank Ltd. | 151,000 | 2,529,769 | ||||||
| South Korea–2.77% | ||||||||
Hyundai Mobis | 17,233 | 4,865,784 | ||||||
NHN Entertainment Corp.(a) | 2,463 | 263,545 | ||||||
Samsung Electronics Co., Ltd. | 3,545 | �� | 4,912,404 | |||||
| 10,041,733 | ||||||||
| Spain–1.66% | ||||||||
Amadeus IT Holding S.A.–Class A | 161,809 | 6,008,469 | ||||||
| Sweden–2.51% | ||||||||
Investment AB Kinnevik–Class B | 90,343 | 3,323,647 | ||||||
Swedbank AB–Class A | 91,415 | 2,383,942 | ||||||
Telefonaktiebolaget LM Ericsson–Class B | 284,708 | 3,398,220 | ||||||
| 9,105,809 | ||||||||
| Switzerland–7.25% | ||||||||
ABB Ltd. | 206,812 | 5,266,877 | ||||||
Julius Baer Group Ltd. | 73,187 | 3,584,563 | ||||||
Nestle S.A. | 33,008 | 2,382,658 | ||||||
Novartis AG | 40,693 | 3,154,240 | ||||||
Roche Holding AG | 19,709 | 5,445,658 | ||||||
Syngenta AG | 10,039 | 4,054,765 | ||||||
UBS AG | 124,376 | 2,398,904 | ||||||
| 26,287,665 | ||||||||
| Taiwan–1.02% | ||||||||
Taiwan Semiconductor Manufacturing Co. Ltd. | 1,000,428 | 3,696,909 | ||||||
See accompanying Notes to Financial Statements which are an integral part of the financial statements.
9 Invesco Global Growth Fund
| Shares | Value | |||||||
| Turkey–0.76% | ||||||||
Akbank T.A.S. | 702,752 | $ | 2,741,313 | |||||
| United Kingdom–13.90% | ||||||||
Aberdeen Asset Management PLC | 297,811 | 2,114,761 | ||||||
Aon PLC | 42,349 | 3,349,382 | ||||||
British American Tobacco PLC | 70,301 | 3,872,839 | ||||||
British Sky Broadcasting Group PLC | 244,110 | 3,669,202 | ||||||
Centrica PLC | 582,851 | 3,307,523 | ||||||
Compass Group PLC | 311,316 | 4,477,223 | ||||||
Imperial Tobacco Group PLC | 101,616 | 3,800,985 | ||||||
Kingfisher PLC | 455,720 | 2,750,773 | ||||||
Next PLC | 31,741 | 2,765,537 | ||||||
Reed Elsevier PLC | 507,601 | 7,103,259 | ||||||
Royal Dutch Shell PLC–Class B | 127,164 | 4,394,599 | ||||||
Smith & Nephew PLC | 181,594 | 2,316,518 | ||||||
WPP PLC | 302,458 | 6,447,720 | ||||||
| 50,370,321 | ||||||||
| United States–28.52% | ||||||||
Accenture PLC–Class A | 28,312 | 2,080,932 | ||||||
Apple Inc. | 12,502 | 6,530,420 | ||||||
Avago Technologies Ltd. | 103,409 | 4,697,871 | ||||||
Cameron International Corp.(a) | 76,598 | 4,202,166 | ||||||
Cardinal Health, Inc. | 51,393 | 3,014,713 | ||||||
Celgene Corp.(a) | 24,603 | 3,653,299 | ||||||
Cisco Systems, Inc. | 200,112 | 4,502,520 | ||||||
Citrix Systems, Inc.(a) | 63,073 | 3,581,285 | ||||||
Comcast Corp.–Class A | 86,245 | 4,103,537 | ||||||
DIRECTV(a) | 67,223 | 4,200,765 | ||||||
| Shares | Value | |||||||
| United States–(continued) | ||||||||
Dollar General Corp.(a) | 48,484 | $ | 2,801,406 | |||||
EMC Corp. | 199,154 | 4,793,637 | ||||||
Expedia, Inc. | 74,823 | 4,405,578 | ||||||
Express Scripts Holding Co.(a) | 62,186 | 3,887,869 | ||||||
First Republic Bank | 61,803 | 3,156,279 | ||||||
Garmin Ltd. | 77,530 | 3,624,528 | ||||||
Gilead Sciences, Inc.(a) | 77,171 | 5,478,369 | ||||||
Google Inc.–Class A(a) | 5,818 | 5,995,914 | ||||||
Ingersoll-Rand PLC(a) | 54,037 | 3,649,119 | ||||||
Joy Global Inc. | 38,318 | 2,174,546 | ||||||
JPMorgan Chase & Co. | 57,000 | 2,937,780 | ||||||
Macy’s, Inc. | 95,653 | 4,410,560 | ||||||
Microsoft Corp. | 144,233 | 5,098,637 | ||||||
Occidental Petroleum Corp. | 33,568 | 3,225,213 | ||||||
QUALCOMM, Inc. | 57,463 | 3,991,955 | ||||||
Scripps Networks Interactive Inc.–Class A | 39,206 | 3,156,083 | ||||||
| 103,354,981 | ||||||||
Total Common Stocks & Other Equity Interests |
| 350,458,577 | ||||||
Money Market Funds–3.27% |
| |||||||
Liquid Assets Portfolio–Institutional Class(b) | 5,933,782 | 5,933,782 | ||||||
Premier Portfolio–Institutional Class(b) | 5,933,781 | 5,933,781 | ||||||
Total Money Market Funds | 11,867,563 | |||||||
TOTAL INVESTMENTS–99.97% |
| 362,326,140 | ||||||
OTHER ASSETS LESS LIABILITIES–0.03% |
| 124,021 | ||||||
NET ASSETS–100.00% |
| $ | 362,450,161 | |||||
Investment Abbreviations:
ADR – American Depositary Receipt
Notes to Schedule of Investments:
| (a) | Non-income producing security. |
| (b) | The money market fund and the Fund are affiliated by having the same investment adviser. |
See accompanying Notes to Financial Statements which are an integral part of the financial statements.
10 Invesco Global Growth Fund
Statement of Assets and Liabilities
October 31, 2013
Assets: |
| |||
Investments, at value (Cost $252,283,834) | $ | 350,458,577 | ||
Investments in affiliated money market funds, at value and cost | 11,867,563 | |||
Total investments, at value (Cost $264,151,397) | 362,326,140 | |||
Foreign currencies, at value (Cost $237,794) | 238,253 | |||
Receivable for: | ||||
Fund shares sold | 130,751 | |||
Dividends | 579,405 | |||
Investment for trustee deferred compensation and retirement plans | 74,961 | |||
Other assets | 26,731 | |||
Total assets | 363,376,241 | |||
Liabilities: |
| |||
Payable for: | ||||
Fund shares reacquired | 383,469 | |||
Accrued fees to affiliates | 305,927 | |||
Accrued trustees’ and officers’ fees and benefits | 2,306 | |||
Accrued other operating expenses | 87,339 | |||
Trustee deferred compensation and retirement plans | 147,039 | |||
Total liabilities | 926,080 | |||
Net assets applicable to shares outstanding | $ | 362,450,161 | ||
Net assets consist of: |
| |||
Shares of beneficial interest | $ | 252,744,105 | ||
Undistributed net investment income | 1,475,482 | |||
Undistributed net realized gain | 10,049,268 | |||
Net unrealized appreciation | 98,181,306 | |||
| $ | 362,450,161 | |||
Net Assets: |
| |||
Class A | $ | 325,318,613 | ||
Class B | $ | 7,975,430 | ||
Class C | $ | 25,174,612 | ||
Class Y | $ | 3,144,452 | ||
Class R5 | $ | 825,045 | ||
Class R6 | $ | 12,009 | ||
Shares outstanding, $0.001 par value per share, |
| |||
Class A | 10,900,403 | |||
Class B | 286,139 | |||
Class C | 903,150 | |||
Class Y | 105,038 | |||
Class R5 | 27,671 | |||
Class R6 | 403 | |||
Class A: | ||||
Net asset value per share | $ | 29.84 | ||
Maximum offering price per share | ||||
(Net asset value of $29.84 ¸ 94.50%) | $ | 31.58 | ||
Class B: | ||||
Net asset value and offering price per share | $ | 27.87 | ||
Class C: | ||||
Net asset value and offering price per share | $ | 27.87 | ||
Class Y: | ||||
Net asset value and offering price per share | $ | 29.94 | ||
Class R5: | ||||
Net asset value and offering price per share | $ | 29.82 | ||
Class R6: | ||||
Net asset value and offering price per share | $ | 29.80 | ||
See accompanying Notes to Financial Statements which are an integral part of the financial statements.
11 Invesco Global Growth Fund
Statement of Operations
For the year ended October 31, 2013
Investment income: |
| |||
Dividends (net of foreign withholding taxes of $480,615) | $ | 6,474,373 | ||
Dividends from affiliated money market funds | 7,763 | |||
Total investment income | 6,482,136 | |||
Expenses: | ||||
Advisory fees | 2,579,451 | |||
Administrative services fees | 99,586 | |||
Custodian fees | 116,044 | |||
Distribution fees: | ||||
Class A | 723,470 | |||
Class B | 85,648 | |||
Class C | 229,505 | |||
Transfer agent fees — A, B, C and Y | 782,089 | |||
Transfer agent fees — R5 | 37 | |||
Transfer agent fees — R6 | 1 | |||
Trustees’ and officers’ fees and benefits | 35,043 | |||
Other | 359,219 | |||
Total expenses | 5,010,093 | |||
Less: Fees waived, expenses reimbursed and expense offset arrangement(s) | (129,231 | ) | ||
Net expenses | 4,880,862 | |||
Net investment income | 1,601,274 | |||
Realized and unrealized gain (loss) from: | ||||
Net realized gain (loss) from: | ||||
Investment securities | 16,492,431 | |||
Foreign currencies | (5,310 | ) | ||
| 16,487,121 | ||||
Change in net unrealized appreciation of: | ||||
Investment securities | 54,393,193 | |||
Foreign currencies | 10,032 | |||
| 54,403,225 | ||||
Net realized and unrealized gain | 70,890,346 | |||
Net increase in net assets resulting from operations | $ | 72,491,620 | ||
See accompanying Notes to Financial Statements which are an integral part of the financial statements.
12 Invesco Global Growth Fund
Statement of Changes in Net Assets
For the years ended October 31, 2013 and 2012
| 2013 | 2012 | |||||||
Operations: |
| |||||||
Net investment income | $ | 1,601,274 | $ | 2,313,148 | ||||
Net realized gain | 16,487,121 | 18,277,924 | ||||||
Change in net unrealized appreciation | 54,403,225 | 14,405,843 | ||||||
Net increase in net assets resulting from operations | 72,491,620 | 34,996,915 | ||||||
Distributions to shareholders from net investment income: | ||||||||
Class A | (2,395,341 | ) | (1,135,136 | ) | ||||
Class B | (15,637 | ) | — | |||||
Class C | (37,417 | ) | — | |||||
Class Y | (26,329 | ) | (13,183 | ) | ||||
Class R5 | (4,626 | ) | (4,589 | ) | ||||
Class R6 | (123 | ) | — | |||||
Total distributions from net investment income | (2,479,473 | ) | (1,152,908 | ) | ||||
Distributions to shareholders from net realized gains: | ||||||||
Class A | (1,505,256 | ) | — | |||||
Class B | (53,432 | ) | — | |||||
Class C | (127,872 | ) | — | |||||
Class Y | (12,951 | ) | — | |||||
Class R5 | (2,094 | ) | — | |||||
Class R6 | (54 | ) | — | |||||
Total distributions from net realized gains | (1,701,659 | ) | — | |||||
Share transactions–net: | ||||||||
Class A | (13,001,461 | ) | 61,731,699 | |||||
Class B | (3,152,701 | ) | (2,448,098 | ) | ||||
Class C | (1,434,446 | ) | 8,505,195 | |||||
Class Y | 177,617 | 754,792 | ||||||
Class R5 | 306,498 | 42,272 | ||||||
Class R6 | — | 10,000 | ||||||
Net increase (decrease) in net assets resulting from share transactions | (17,104,493 | ) | 68,595,860 | |||||
Net increase in net assets | 51,205,995 | 102,439,867 | ||||||
Net assets: | ||||||||
Beginning of year | 311,244,166 | 208,804,299 | ||||||
End of year (includes undistributed net investment income of $1,475,482 and $2,318,624, respectively) | $ | 362,450,161 | $ | 311,244,166 | ||||
Notes to Financial Statements
October 31, 2013
NOTE 1—Significant Accounting Policies
Invesco Global Growth Fund (the “Fund”) is a series portfolio of AIM International Mutual Funds (Invesco International Mutual Funds) (the “Trust”). The Trust is a Delaware statutory trust registered under the Investment Company Act of 1940, as amended (the “1940 Act”), as an open-end series management investment company consisting of eight separate portfolios, each authorized to issue an unlimited number of shares of beneficial interest. The assets, liabilities and operations of each portfolio are accounted for separately. Information presented in these financial statements pertains only to the Fund. Matters affecting each portfolio or class will be voted on exclusively by the shareholders of such portfolio or class.
The Fund’s investment objective is long-term growth of capital.
The Fund currently consists of six different classes of shares: Class A, Class B, Class C, Class Y, Class R5 and Class R6. Class A shares are sold with a front-end sales charge unless certain waiver criteria are met and under certain circumstances load waived shares may be subject to contingent deferred sales charges (“CDSC”). Class C shares are sold with a CDSC. Class Y, Class R5 and Class R6 shares are sold at net asset value. Effective November 30, 2010, new or additional investments in Class B shares are no longer permitted. Existing shareholders of Class B shares may continue to reinvest dividends and capital gains distributions in Class B shares until they convert to Class A shares. Also, shareholders in Class B shares will be able to exchange those shares for Class B shares of other Invesco Funds offering such shares until they convert to Class A shares. Generally, Class B
13 Invesco Global Growth Fund
shares will automatically convert to Class A shares on or about the month-end, which is at least eight years after the date of purchase. Redemption of Class B shares prior to the conversion date will be subject to a CDSC.
The following is a summary of the significant accounting policies followed by the Fund in the preparation of its financial statements.
| A. | Security Valuations — Securities, including restricted securities, are valued according to the following policy. |
A security listed or traded on an exchange (except convertible bonds) is valued at its last sales price or official closing price as of the close of the customary trading session on the exchange where the security is principally traded, or lacking any sales or official closing price on a particular day, the security may be valued at the closing bid price on that day. Securities traded in the over-the-counter market are valued based on prices furnished by independent pricing services or market makers. When such securities are valued by an independent pricing service they may be considered fair valued. Futures contracts are valued at the final settlement price set by an exchange on which they are principally traded. Listed options are valued at the mean between the last bid and ask prices from the exchange on which they are principally traded. Options not listed on an exchange are valued by an independent source at the mean between the last bid and ask prices. For purposes of determining net asset value per share, futures and option contracts generally are valued 15 minutes after the close of the customary trading session of the New York Stock Exchange (“NYSE”).
Investments in open-end and closed-end registered investment companies that do not trade on an exchange are valued at the end of day net asset value per share. Investments in open-end and closed-end registered investment companies that trade on an exchange are valued at the last sales price or official closing price as of the close of the customary trading session on the exchange where the security is principally traded.
Debt obligations (including convertible bonds) and unlisted equities are fair valued using an evaluated quote provided by an independent pricing service. Evaluated quotes provided by the pricing service may be determined without exclusive reliance on quoted prices, and may reflect appropriate factors such as institution-size trading in similar groups of securities, developments related to specific securities, dividend rate (for unlisted equities), yield (for debt obligations), quality, type of issue, coupon rate (for debt obligations), maturity (for debt obligations), individual trading characteristics and other market data. Debt obligations are subject to interest rate and credit risks. In addition, all debt obligations involve some risk of default with respect to interest and/or principal payments.
Foreign securities’ (including foreign exchange contracts) prices are converted into U.S. dollar amounts using the applicable exchange rates as of the close of the NYSE. If market quotations are available and reliable for foreign exchange-traded equity securities, the securities will be valued at the market quotations. Because trading hours for certain foreign securities end before the close of the NYSE, closing market quotations may become unreliable. If between the time trading ends on a particular security and the close of the customary trading session on the NYSE, events occur that the Adviser determines are significant and make the closing price unreliable, the Fund may fair value the security. If the event is likely to have affected the closing price of the security, the security will be valued at fair value in good faith using procedures approved by the Board of Trustees. Adjustments to closing prices to reflect fair value may also be based on a screening process of an independent pricing service to indicate the degree of certainty, based on historical data, that the closing price in the principal market where a foreign security trades is not the current value as of the close of the NYSE. Foreign securities’ prices meeting the approved degree of certainty that the price is not reflective of current value will be priced at the indication of fair value from the independent pricing service. Multiple factors may be considered by the independent pricing service in determining adjustments to reflect fair value and may include information relating to sector indices, American Depositary Receipts and domestic and foreign index futures. Foreign securities may have additional risks including exchange rate changes, potential for sharply devalued currencies and high inflation, political and economic upheaval, the relative lack of issuer information, relatively low market liquidity and the potential lack of strict financial and accounting controls and standards.
Securities for which market prices are not provided by any of the above methods may be valued based upon quotes furnished by independent sources. The last bid price may be used to value equity securities. The mean between the last bid and asked prices is used to value debt obligations, including corporate loans.
Securities for which market quotations are not readily available or became unreliable are valued at fair value as determined in good faith by or under the supervision of the Trust’s officers following procedures approved by the Board of Trustees. Issuer specific events, market trends, bid/ask quotes of brokers and information providers and other market data may be reviewed in the course of making a good faith determination of a security’s fair value.
Valuations change in response to many factors including the historical and prospective earnings of the issuer, the value of the issuer’s assets, general economic conditions, interest rates, investor perceptions and market liquidity. Because of the inherent uncertainties of valuation, the values reflected in the financial statements may materially differ from the value received upon actual sale of those investments.
| B. | Securities Transactions and Investment Income — Securities transactions are accounted for on a trade date basis. Realized gains or losses on sales are computed on the basis of specific identification of the securities sold. Interest income is recorded on the accrual basis from settlement date. Dividend income (net of withholding tax, if any) is recorded on the ex-dividend date. |
The Fund may periodically participate in litigation related to Fund investments. As such, the Fund may receive proceeds from litigation settlements. Any proceeds received are included in the Statement of Operations as realized gain (loss) for investments no longer held and as unrealized gain (loss) for investments still held.
Brokerage commissions and mark ups are considered transaction costs and are recorded as an increase to the cost basis of securities purchased and/or a reduction of proceeds on a sale of securities. Such transaction costs are included in the determination of net realized and unrealized gain (loss) from investment securities reported in the Statement of Operations and the Statement of Changes in Net Assets and the net realized and unrealized gains (losses) on securities per share in the Financial Highlights. Transaction costs are included in the calculation of the Fund’s net asset value and, accordingly, they reduce the Fund’s total returns. These transaction costs are not considered operating expenses and are not reflected in net investment income reported in the Statement of Operations and Statement of Changes in Net Assets, or the net investment income per share and ratios of expenses and net investment income reported in the Financial Highlights, nor are they limited by any expense limitation arrangements between the Fund and the investment adviser.
The Fund allocates income and realized and unrealized capital gains and losses to a class based on the relative net assets of each class.
| C. | Country Determination — For the purposes of making investment selection decisions and presentation in the Schedule of Investments, the investment adviser may determine the country in which an issuer is located and/or credit risk exposure based on various factors. These factors include the laws of the country under which the issuer is organized, where the issuer maintains a principal office, the country in which the issuer |
14 Invesco Global Growth Fund
| derives 50% or more of its total revenues and the country that has the primary market for the issuer’s securities, as well as other criteria. Among the other criteria that may be evaluated for making this determination are the country in which the issuer maintains 50% or more of its assets, the type of security, financial guarantees and enhancements, the nature of the collateral and the sponsor organization. Country of issuer and/or credit risk exposure has been determined to be the United States of America, unless otherwise noted. |
| D. | Distributions — Distributions from income and net realized capital gain, if any, are generally declared and paid annually and recorded on the ex-dividend date. The Fund may elect to treat a portion of the proceeds from redemptions as distributions for federal income tax purposes. |
| E. | Federal Income Taxes — The Fund intends to comply with the requirements of Subchapter M of the Internal Revenue Code of 1986, as amended (the “Internal Revenue Code”), necessary to qualify as a regulated investment company and to distribute substantially all of the Fund’s taxable earnings to shareholders. As such, the Fund will not be subject to federal income taxes on otherwise taxable income (including net realized capital gain) that is distributed to shareholders. Therefore, no provision for federal income taxes is recorded in the financial statements. |
The Fund files tax returns in the U.S. Federal jurisdiction and certain other jurisdictions. Generally, the Fund is subject to examinations by such taxing authorities for up to three years after the filing of the return for the tax period.
| F. | Expenses — Fees provided for under the Rule 12b-1 plan of a particular class of the Fund are charged to the operations of such class. Transfer agency fees and expenses and other shareholder recordkeeping fees and expenses attributable to Class R5 and Class R6 are allocated to each share class based on relative net assets. Sub-accounting fees attributable to Class R5 are charged to the operations of the class. Transfer agency fees and expenses and other shareholder recordkeeping fees and expenses relating to all other classes are allocated among those classes based on relative net assets. All other expenses are allocated among the classes based on relative net assets. |
| G. | Accounting Estimates — The preparation of financial statements in conformity with accounting principles generally accepted in the United States of America (“GAAP”) requires management to make estimates and assumptions that affect the reported amounts of assets and liabilities at the date of the financial statements and the reported amounts of revenues and expenses during the reporting period including estimates and assumptions related to taxation. Actual results could differ from those estimates by a significant amount. In addition, the Fund monitors for material events or transactions that may occur or become known after the period-end date and before the date the financial statements are released to print. |
| H. | Indemnifications — Under the Trust’s organizational documents, each Trustee, officer, employee or other agent of the Trust is indemnified against certain liabilities that may arise out of the performance of their duties to the Fund. Additionally, in the normal course of business, the Fund enters into contracts, including the Fund’s servicing agreements, that contain a variety of indemnification clauses. The Fund’s maximum exposure under these arrangements is unknown as this would involve future claims that may be made against the Fund that have not yet occurred. The risk of material loss as a result of such indemnification claims is considered remote. |
| I. | Foreign Currency Translations — Foreign currency is valued at the close of the NYSE based on quotations posted by banks and major currency dealers. Portfolio securities and other assets and liabilities denominated in foreign currencies are translated into U.S. dollar amounts at date of valuation. Purchases and sales of portfolio securities (net of foreign taxes withheld on disposition) and income items denominated in foreign currencies are translated into U.S. dollar amounts on the respective dates of such transactions. The Fund does not separately account for the portion of the results of operations resulting from changes in foreign exchange rates on investments and the fluctuations arising from changes in market prices of securities held. The combined results of changes in foreign exchange rates and the fluctuation of market prices on investments (net of estimated foreign tax withholding) are included with the net realized and unrealized gain or loss from investments in the Statement of Operations. Reported net realized foreign currency gains or losses arise from (1) sales of foreign currencies, (2) currency gains or losses realized between the trade and settlement dates on securities transactions, and (3) the difference between the amounts of dividends, interest, and foreign withholding taxes recorded on the Fund’s books and the U.S. dollar equivalent of the amounts actually received or paid. Net unrealized foreign currency gains and losses arise from changes in the fair values of assets and liabilities, other than investments in securities at fiscal period end, resulting from changes in exchange rates. |
The Fund may invest in foreign securities which may be subject to foreign taxes on income, gains on investments or currency repatriation, a portion of which may be recoverable.
| J. | Foreign Currency Contracts — The Fund may enter into foreign currency contracts to manage or minimize currency or exchange rate risk. The Fund may also enter into foreign currency contracts for the purchase or sale of a security denominated in a foreign currency in order to “lock in” the U.S. dollar price of that security. A foreign currency contract is an obligation to purchase or sell a specific currency for an agreed-upon price at a future date. The use of foreign currency contracts does not eliminate fluctuations in the price of the underlying securities the Fund owns or intends to acquire but establishes a rate of exchange in advance. Fluctuations in the value of these contracts are measured by the difference in the contract date and reporting date exchange rates and are recorded as unrealized appreciation (depreciation) until the contracts are closed. When the contracts are closed, realized gains (losses) are recorded. Realized and unrealized gains (losses) on the contracts are included in the Statement of Operations. The primary risks associated with foreign currency contracts include failure of the counterparty to meet the terms of the contract and the value of the foreign currency changing unfavorably. These risks may be in excess of the amounts reflected in the Statement of Assets and Liabilities. |
15 Invesco Global Growth Fund
NOTE 2—Advisory Fees and Other Fees Paid to Affiliates
The Trust has entered into a master investment advisory agreement with Invesco Advisers, Inc. (the “Adviser” or “Invesco”). Under the terms of the investment advisory agreement, the Fund pays an advisory fee to the Adviser based on the annual rate of the Fund’s average daily net assets as follows:
| Average Daily Net Assets | Rate | |||
First $250 million | 0.80% | |||
Next $250 million | 0.78% | |||
Next $500 million | 0.76% | |||
Next $1.5 billion | 0.74% | |||
Next $2.5 billion | 0.72% | |||
Next $2.5 billion | 0.70% | |||
Next $2.5 billion | 0.68% | |||
Over $10 billion | 0.66% | |||
Under the terms of a master sub-advisory agreement between the Adviser and each of Invesco Asset Management Deutschland GmbH, Invesco Asset Management Limited, Invesco Asset Management (Japan) Limited, Invesco Australia Limited, Invesco Hong Kong Limited, Invesco Senior Secured Management, Inc., Invesco Canada Ltd. and Invesco PowerShares Capital Management LLC (collectively, the “Affiliated Sub-Advisers”) the Adviser, not the Fund, may pay 40% of the fees paid to the Adviser to any such Affiliated Sub-Adviser(s) that provide(s) discretionary investment management services to the Fund based on the percentage of assets allocated to such Sub-Adviser(s).
Effective January 1, 2013, the Adviser has contractually agreed, through at least June 30, 2014, to waive advisory fees and/or reimburse expenses of all shares to the extent necessary to limit total annual fund operating expenses after fee waiver and/or expense reimbursement (excluding certain items discussed below) of Class A, Class B, Class C, Class Y, Class R5 and Class R6 shares to 2.25%, 3.00%, 3.00%, 2.00%, 2.00% and 2.00%, respectively, of average daily net assets. Prior to January 1, 2013, the Adviser had contractually agreed to waive advisory fees and/or reimburse expenses of all shares to the extent necessary to limit total annual fund operating expenses after fee waiver and/or expense reimbursement (excluding certain items discussed below) of Class A, Class B, Class C, Class Y, Class R5 and Class R6 shares to 1.32%, 2.07%, 2.07%, 1.07%, 1.07% and 1.07%%, respectively, of average daily net assets. In determining the Adviser’s obligation to waive advisory fees and/or reimburse expenses, the following expenses are not taken into account, and could cause the total annual fund operating expenses after fee waiver and/or expense reimbursement to exceed the numbers reflected above: (1) interest; (2) taxes; (3) dividend expense on short sales; (4) extraordinary or non-routine items, litigation expenses; and (5) expenses that the Fund has incurred but did not actually pay because of an expense offset arrangement. Unless Invesco continues the fee waiver agreement, it will terminate on June 30, 2014. The fee waiver agreement cannot be terminated during its term.
Further, the Adviser has contractually agreed, through June 30, 2014, to waive the advisory fee payable by the Fund in an amount equal to 100% of the net advisory fees the Adviser receives from the affiliated money market funds on investments by the Fund of uninvested cash in such affiliated money market funds.
For the year ended October 31, 2013, the Adviser waived advisory fees of $13,108 and reimbursed class level expenses of $101,673, $3,009, $8,064 and $964 for Class A, Class B, Class C and Class Y shares, respectively.
The Trust has entered into a transfer agency and service agreement with Invesco Investment Services, Inc. (“IIS”) pursuant to which the Fund has agreed to pay IIS a fee for providing transfer agency and shareholder services to the Fund and reimburse IIS for certain expenses incurred by IIS in the course of providing such services. IIS may make payments to intermediaries that provide omnibus account services, sub-accounting services and/or networking services. All fees payable by IIS to intermediaries that provide omnibus account services or sub-accounting are charged back to the Fund, subject to certain limitations approved by the Trust’s Board of Trustees. For the year ended October 31, 2013, expenses incurred under the agreement are shown in the Statement of Operations as Transfer agent fees.
The Trust has entered into a master administrative services agreement with Invesco pursuant to which the Fund has agreed to pay Invesco for certain administrative costs incurred in providing accounting services to the Fund. For the year ended October 31, 2013, expenses incurred under the agreement are shown in the Statement of Operations as Administrative services fees.
The Trust has entered into master distribution agreements with Invesco Distributors, Inc. (“IDI”) to serve as the distributor for the Class A, Class B, Class C, Class Y, Class R5 and Class R6 shares of the Fund. The Trust has adopted plans pursuant to Rule 12b-1 under the 1940 Act with respect to the Fund’s Class A, Class B and Class C shares (collectively, the “Plans”). The Fund, pursuant to the Plans, pays IDI compensation at the annual rate of 0.25% of the Fund’s average daily net assets of Class A shares and 1.00% of the average daily net assets of Class B and Class C shares. Of the Plan payments, up to 0.25% of the average daily net assets of each class of shares may be paid to furnish continuing personal shareholder services to customers who purchase and own shares of such classes. Any amounts not paid as a service fee under the Plans would constitute an asset-based sales charge. Rules of the Financial Industry Regulatory Authority (“FINRA”) impose a cap on the total sales charges, including asset-based sales charges, that may be paid by any class of shares of the Fund. For the year ended October 31, 2013, expenses incurred under the Plans are shown in the Statement of Operations as Distribution fees.
Front-end sales commissions and CDSC (collectively, the “sales charges”) are not recorded as expenses of the Fund. Front-end sales commissions are deducted from proceeds from the sales of Fund shares prior to investment in Class A shares of the Fund. CDSC are deducted from redemption proceeds prior to remittance to the shareholder. During the year ended October 31, 2013, IDI advised the Fund that IDI retained $21,395 in front-end sales commissions from the sale of Class A shares and $3, $4,443 and $619 from Class A, Class B and Class C shares, respectively, for CDSC imposed on redemptions by shareholders.
Certain officers and trustees of the Trust are officers and directors of the Adviser, IIS and/or IDI.
16 Invesco Global Growth Fund
NOTE 3—Additional Valuation Information
GAAP defines fair value as the price that would be received to sell an asset or paid to transfer a liability in an orderly transaction between market participants at the measurement date, under current market conditions. GAAP establishes a hierarchy that prioritizes the inputs to valuation methods, giving the highest priority to readily available unadjusted quoted prices in an active market for identical assets (Level 1) and the lowest priority to significant unobservable inputs (Level 3), generally when market prices are not readily available or are unreliable. Based on the valuation inputs, the securities or other investments are tiered into one of three levels. Changes in valuation methods may result in transfers in or out of an investment’s assigned level:
| Level 1 — | Prices are determined using quoted prices in an active market for identical assets. |
| Level 2 — | Prices are determined using other significant observable inputs. Observable inputs are inputs that other market participants may use in pricing a security. These may include quoted prices for similar securities, interest rates, prepayment speeds, credit risk, yield curves, loss severities, default rates, discount rates, volatilities and others. |
| Level 3 — | Prices are determined using significant unobservable inputs. In situations where quoted prices or observable inputs are unavailable (for example, when there is little or no market activity for an investment at the end of the period), unobservable inputs may be used. Unobservable inputs reflect the Fund’s own assumptions about the factors market participants would use in determining fair value of the securities or instruments and would be based on the best available information. |
The following is a summary of the tiered valuation input levels, as of October 31, 2013. The level assigned to the securities valuations may not be an indication of the risk or liquidity associated with investing in those securities. Because of the inherent uncertainties of valuation, the values reflected in the financial statements may materially differ from the value received upon actual sale of those investments.
During the year ended October 31, 2013, there were transfers from Level 1 to Level 2 of $8,062,362 and from Level 2 to Level 1 of $43,001,900, due to foreign fair value adjustments.
| Level 1 | Level 2 | Level 3 | Total | |||||||||||||
Australia | $ | 4,951,826 | $ | — | $ | — | $ | 4,951,826 | ||||||||
Belgium | — | 4,920,654 | — | 4,920,654 | ||||||||||||
Brazil | 13,575,438 | — | — | 13,575,438 | ||||||||||||
Canada | 11,175,506 | — | — | 11,175,506 | ||||||||||||
China | 14,769,607 | 7,063,098 | — | 21,832,705 | ||||||||||||
Denmark | 2,668,163 | 3,270,279 | — | 5,938,442 | ||||||||||||
France | — | 11,609,817 | — | 11,609,817 | ||||||||||||
Germany | 23,441,418 | — | — | 23,441,418 | ||||||||||||
Hong Kong | 3,725,448 | 4,409,474 | — | 8,134,922 | ||||||||||||
Indonesia | — | 3,137,779 | — | 3,137,779 | ||||||||||||
Israel | 8,927,548 | — | — | 8,927,548 | ||||||||||||
Japan | — | 12,205,597 | — | 12,205,597 | ||||||||||||
Mexico | 3,217,112 | — | — | 3,217,112 | ||||||||||||
Netherlands | 3,252,844 | — | — | 3,252,844 | ||||||||||||
Singapore | — | 2,529,769 | — | 2,529,769 | ||||||||||||
South Korea | 5,129,329 | 4,912,404 | — | 10,041,733 | ||||||||||||
Spain | 6,008,469 | — | — | 6,008,469 | ||||||||||||
Sweden | 5,782,162 | 3,323,647 | — | 9,105,809 | ||||||||||||
Switzerland | 6,437,423 | 19,850,242 | — | 26,287,665 | ||||||||||||
Taiwan | — | 3,696,909 | — | 3,696,909 | ||||||||||||
Turkey | — | 2,741,313 | — | 2,741,313 | ||||||||||||
United Kingdom | 17,483,407 | 32,886,914 | — | 50,370,321 | ||||||||||||
United States | 115,222,544 | — | — | 115,222,544 | ||||||||||||
Total Investments | $ | 245,768,244 | $ | 116,557,896 | $ | — | $ | 362,326,140 | ||||||||
NOTE 4—Expense Offset Arrangement(s)
The expense offset arrangement is comprised of transfer agency credits which result from balances in demand deposit accounts used by the transfer agent for clearing shareholder transactions. For the year ended October 31, 2013, the Fund received credits from this arrangement, which resulted in the reduction of the Fund’s total expenses of $2,413.
NOTE 5—Trustees’ and Officers’ Fees and Benefits
Trustees’ and Officers’ Fees and Benefits include amounts accrued by the Fund to pay remuneration to certain Trustees and Officers of the Fund. Trustees have the option to defer compensation payable by the Fund, and Trustees’ and Officers’ Fees and Benefits also include amounts accrued by the Fund to fund such deferred compensation amounts. Those Trustees who defer compensation have the option to select various Invesco Funds in which their deferral accounts shall be deemed to be invested. Finally, certain current Trustees are eligible to participate in a retirement plan that provides for benefits to be paid upon retirement to Trustees over a period of time based on the number of years of service. The Fund may have certain former Trustees who also participate in a retirement plan and receive benefits under such plan. Trustees’ and Officers’ Fees and Benefits include amounts accrued by the Fund to fund such retirement benefits. Obligations under the deferred compensation and retirement plans represent unsecured claims against the general assets of the Fund.
17 Invesco Global Growth Fund
NOTE 6—Cash Balances
The Fund is permitted to temporarily carry a negative or overdrawn balance in its account with State Street Bank and Trust Company, the custodian bank. Such balances, if any at period end, are shown in the Statement of Assets and Liabilities under the payable caption Amount due custodian. To compensate the custodian bank for such overdrafts, the overdrawn Fund may either (1) leave funds as a compensating balance in the account so the custodian bank can be compensated by earning the additional interest; or (2) compensate by paying the custodian bank at a rate agreed upon by the custodian bank and Invesco, not to exceed the contractually agreed upon rate.
NOTE 7—Distributions to Shareholders and Tax Components of Net Assets
Tax Character of Distributions to Shareholders Paid During the Years Ended October 31, 2013 and 2012:
| 2013 | 2012 | |||||||
Ordinary income | $ | 2,479,473 | $ | 1,152,908 | ||||
Long-term capital gain | 1,701,659 | — | ||||||
Total distributions | $ | 4,181,132 | $ | 1,152,908 | ||||
Tax Components of Net Assets at Period-End:
| 2013 | ||||
Undistributed ordinary income | $ | 1,606,725 | ||
Undistributed long-term gain | 10,136,465 | |||
Net unrealized appreciation — investments | 98,087,546 | |||
Net unrealized appreciation — other investments | 6,563 | |||
Temporary book/tax differences | (131,243 | ) | ||
Shares of beneficial interest | 252,744,105 | |||
Total net assets | $ | 362,450,161 | ||
The difference between book-basis and tax-basis unrealized appreciation (depreciation) is due to differences in the timing of recognition of gains and losses on investments for tax and book purposes. The Fund’s net unrealized appreciation difference is attributable primarily to wash sales.
The temporary book/tax differences are a result of timing differences between book and tax recognition of income and/or expenses. The Fund’s temporary book/tax differences are the result of the trustee deferral of compensation and retirement plan benefits.
Capital loss carryforward is calculated and reported as of a specific date. Results of transactions and other activity after that date may affect the amount of capital loss carryforward actually available for the Fund to utilize. Capital losses generated in years beginning after December 22, 2010 can be carried forward for an unlimited period, whereas previous losses expire in 8 tax years. Capital losses with an expiration period may not be used to offset capital gains until all net capital losses without an expiration date have been utilized. Capital loss carryforwards with no expiration date will retain their character as either short-term or long-term capital losses instead of as short-term capital losses as under prior law. The ability to utilize capital loss carryforward in the future may be limited under the Internal Revenue Code and related regulations based on the results of future transactions.
The Fund utilized $4,698,550 of capital loss carryforward in the current period to offset net realized capital gain for federal income tax purposes.
The Fund does not have a capital loss carryforward as of October 31, 2013.
NOTE 8—Investment Securities
The aggregate amount of investment securities (other than short-term securities, U.S. Treasury obligations and money market funds, if any) purchased and sold by the Fund during the year ended October 31, 2013 was $92,374,913 and $116,070,258, respectively. Cost of investments on a tax basis includes the adjustments for financial reporting purposes as of the most recently completed federal income tax reporting period-end.
| Unrealized Appreciation (Depreciation) of Investment Securities on a Tax Basis | ||||
Aggregate unrealized appreciation of investment securities | $ | 100,864,699 | ||
Aggregate unrealized (depreciation) of investment securities | (2,777,153 | ) | ||
Net unrealized appreciation of investment securities | $ | 98,087,546 | ||
Cost of investments for tax purposes is $264,238,594.
NOTE 9—Reclassification of Permanent Differences
Primarily as a result of differing book/tax treatment of foreign currency transactions and return of capital distributions, on October 31, 2013, undistributed net investment income was increased by $35,057, undistributed net realized gain was increased by $3,682 and shares of beneficial interest was decreased by $38,739. This reclassification had no effect on the net assets of the Fund.
18 Invesco Global Growth Fund
NOTE 10—Share Information
| Summary of Share Activity | ||||||||||||||||
| Years ended October 31, | ||||||||||||||||
| 2013(a) | 2012 | |||||||||||||||
| Shares | Amount | Shares | Amount | |||||||||||||
Sold: | ||||||||||||||||
Class A | 956,280 | $ | 26,752,277 | 424,833 | $ | 9,696,259 | ||||||||||
Class B | 7,664 | 190,510 | 4,614 | 119,211 | ||||||||||||
Class C | 77,900 | 1,962,790 | 42,154 | 1,009,559 | ||||||||||||
Class Y | 49,882 | 1,325,358 | 47,573 | 1,087,732 | ||||||||||||
Class R5 | 11,730 | 299,943 | 3,216 | 71,604 | ||||||||||||
Class R6(b) | — | — | 403 | 10,000 | ||||||||||||
Issued as reinvestment of dividends: | ||||||||||||||||
Class A | 144,891 | 3,528,101 | 41,209 | 894,871 | ||||||||||||
Class B | 2,889 | 66,151 | — | — | ||||||||||||
Class C | 6,632 | 151,871 | — | — | ||||||||||||
Class Y | 1,408 | 34,337 | 542 | 11,768 | ||||||||||||
Class R5 | 271 | 6,555 | 173 | 3,741 | ||||||||||||
Issued in connection with acquisitions:(c) | ||||||||||||||||
Class A | — | — | 4,430,742 | 92,331,215 | ||||||||||||
Class B | — | — | 117,982 | 2,312,153 | ||||||||||||
Class C | — | — | 569,039 | 11,161,203 | ||||||||||||
Class Y | — | — | 17,363 | 362,039 | ||||||||||||
Automatic conversion of Class B shares to Class A shares: | ||||||||||||||||
Class A | 90,938 | 2,400,034 | 134,939 | 3,098,956 | ||||||||||||
Class B | (97,048 | ) | (2,400,034 | ) | (145,256 | ) | (3,098,956 | ) | ||||||||
Reacquired:(d) | ||||||||||||||||
Class A | (1,740,636 | ) | (45,681,873 | ) | (1,916,101 | ) | (44,289,602 | ) | ||||||||
Class B | (41,159 | ) | (1,009,328 | ) | (80,980 | ) | (1,780,506 | ) | ||||||||
Class C | (144,223 | ) | (3,549,107 | ) | (168,757 | ) | (3,665,567 | ) | ||||||||
Class Y | (43,887 | ) | (1,182,078 | ) | (30,523 | ) | (706,747 | ) | ||||||||
Class R5 | — | — | (1,415 | ) | (33,073 | ) | ||||||||||
Net increase (decrease) in share activity | (716,468 | ) | $ | (17,104,493 | ) | 3,491,750 | $ | 68,595,860 | ||||||||
| (a) | There are entities that are record owners of more than 5% of the outstanding shares of the Fund and in the aggregate own 41% of the outstanding shares of the Fund. IDI has an agreement with these entities to sell Fund shares. The Fund, Invesco and/or Invesco affiliates may make payments to these entities, which are considered to be related to the Fund, for providing services to the Fund, Invesco and/or Invesco affiliates including but not limited to services such as securities brokerage, distribution, third party record keeping and account servicing. The Fund has no knowledge as to whether all or any portion of the shares owned of record by these entities are also owned beneficially. |
| (b) | Commencement date of September 24, 2012. |
| (c) | As of the opening of business on December 19, 2011, the Fund acquired all the net assets of Invesco Global Advantage Fund (the “Target Fund”) pursuant to a plan of reorganization approved by the Trustees of the Fund on November 10, 2010 and by the shareholders of the Target Fund on November 28, 2011. The acquisition was accomplished by a tax-free exchange of 5,135,126 shares of the Fund for 10,335,183 shares outstanding of the Target Fund as of the close of business on December 16, 2011. Each class of the Target Fund was exchanged for the like class of shares of the Fund based on the relative net asset value of the Target Fund to the net asset value of the Fund at the close of business on December 16, 2011. The Target Fund’s net assets at that date of $106,166,610, including $5,789,863 of unrealized appreciation, were combined with those of the Fund. The net assets of the Fund immediately before the acquisition were $193,640,137 and $299,806,747 immediately after the acquisition. |
| The pro forma results of operations for the year ended October 31, 2012 assuming the reorganization had been completed on November 1, 2011, the beginning of the annual reporting period are as follows: |
Net investment income | $ | 2,329,861 | ||
Net realized/unrealized gains | 26,252,977 | |||
Change in net assets resulting from operations | $ | 28,582,838 |
| The combined investment portfolios have been managed as a single integrated portfolio since the acquisition was completed, it is not practicable to separate the amounts of revenue and earnings of the Target Fund that has been included in the Fund’s Statement of Operations since December 19, 2011. |
| (d) | Net of redemption fees of $496 allocated among the classes based on relative net assets of each class for the year ended October 31, 2012. |
19 Invesco Global Growth Fund
NOTE 11—Financial Highlights
The following schedule presents financial highlights for a share of the Fund outstanding throughout the periods indicated.
| Net asset value, beginning of period | Net (loss)(a) | Net gains (losses) on securities | Total from investment operations | Dividends from net investment income | Distributions from net realized gains | Total distributions | Net asset value, end of period(b) | Total return(c) | Net assets, end of period (000’s omitted) | Ratio of absorbed | Ratio of absorbed | Ratio of net to average | Portfolio turnover(d) | |||||||||||||||||||||||||||||||||||||||||||
Class A | ||||||||||||||||||||||||||||||||||||||||||||||||||||||||
Year ended 10/31/13 | $ | 24.22 | $ | 0.15 | $ | 5.82 | $ | 5.97 | $ | (0.22 | ) | $ | (0.13 | ) | $ | (0.35 | ) | $ | 29.84 | 24.96 | % | $ | 325,319 | 1.43 | %(e) | 1.47 | %(e) | 0.56 | %(e) | 29 | % | |||||||||||||||||||||||||
Year ended 10/31/12 | 22.26 | 0.20 | 1.90 | 2.10 | (0.14 | ) | — | (0.14 | ) | 24.22 | 9.50 | 277,313 | 1.34 | 1.56 | 0.85 | 33 | ||||||||||||||||||||||||||||||||||||||||
Year ended 10/31/11 | 22.30 | 0.12 | (0.02 | ) | 0.10 | (0.14 | ) | — | (0.14 | ) | 22.26 | 0.41 | 185,484 | 1.62 | 1.63 | 0.50 | 28 | |||||||||||||||||||||||||||||||||||||||
Year ended 10/31/10 | 19.51 | 0.09 | 2.88 | 2.97 | (0.18 | ) | — | (0.18 | ) | 22.30 | 15.33 | 208,436 | 1.62 | 1.63 | 0.44 | 41 | ||||||||||||||||||||||||||||||||||||||||
Year ended 10/31/09 | 16.56 | 0.14 | 3.05 | (f) | 3.19 | (0.24 | ) | — | (0.24 | ) | 19.51 | 19.62 | (f) | 204,605 | 1.79 | 1.80 | 0.83 | 40 | ||||||||||||||||||||||||||||||||||||||
Class B | ||||||||||||||||||||||||||||||||||||||||||||||||||||||||
Year ended 10/31/13 | 22.64 | (0.05 | ) | 5.45 | 5.40 | (0.04 | ) | (0.13 | ) | (0.17 | ) | 27.87 | 24.03 | 7,975 | 2.18 | (e) | 2.22 | (e) | (0.19 | )(e) | 29 | |||||||||||||||||||||||||||||||||||
Year ended 10/31/12 | 20.83 | 0.02 | 1.79 | 1.81 | — | — | — | 22.64 | 8.69 | 9,368 | 2.09 | 2.31 | 0.10 | 33 | ||||||||||||||||||||||||||||||||||||||||||
Year ended 10/31/11 | 20.90 | (0.05 | ) | (0.02 | ) | (0.07 | ) | — | — | — | 20.83 | (0.33 | ) | 10,776 | 2.37 | 2.38 | (0.25 | ) | 28 | |||||||||||||||||||||||||||||||||||||
Year ended 10/31/10 | 18.29 | (0.06 | ) | 2.71 | 2.65 | (0.04 | ) | — | (0.04 | ) | 20.90 | 14.53 | 15,713 | 2.37 | 2.38 | (0.31 | ) | 41 | ||||||||||||||||||||||||||||||||||||||
Year ended 10/31/09 | 15.42 | 0.01 | 2.86 | (f) | 2.87 | (0.00 | ) | — | (0.00 | ) | 18.29 | 18.64 | (f) | 19,325 | 2.54 | 2.55 | 0.08 | 40 | ||||||||||||||||||||||||||||||||||||||
Class C | ||||||||||||||||||||||||||||||||||||||||||||||||||||||||
Year ended 10/31/13 | 22.64 | (0.05 | ) | 5.45 | 5.40 | (0.04 | ) | (0.13 | ) | (0.17 | ) | 27.87 | 24.03 | 25,175 | 2.18 | (e) | 2.22 | (e) | (0.19 | )(e) | 29 | |||||||||||||||||||||||||||||||||||
Year ended 10/31/12 | 20.83 | 0.02 | 1.79 | 1.81 | — | — | — | 22.64 | 8.69 | 21,803 | 2.09 | 2.31 | 0.10 | 33 | ||||||||||||||||||||||||||||||||||||||||||
Year ended 10/31/11 | 20.90 | (0.05 | ) | (0.02 | ) | (0.07 | ) | — | — | — | 20.83 | (0.33 | ) | 10,838 | 2.37 | 2.38 | (0.25 | ) | 28 | |||||||||||||||||||||||||||||||||||||
Year ended 10/31/10 | 18.30 | (0.06 | ) | 2.70 | 2.64 | (0.04 | ) | — | (0.04 | ) | 20.90 | 14.47 | 12,893 | 2.37 | 2.38 | (0.31 | ) | 41 | ||||||||||||||||||||||||||||||||||||||
Year ended 10/31/09 | 15.42 | 0.01 | 2.87 | (f) | 2.88 | (0.00 | ) | — | (0.00 | ) | 18.30 | 18.71 | (f) | 13,192 | 2.54 | 2.55 | 0.08 | 40 | ||||||||||||||||||||||||||||||||||||||
Class Y | ||||||||||||||||||||||||||||||||||||||||||||||||||||||||
Year ended 10/31/13 | 24.29 | 0.22 | 5.83 | 6.05 | (0.27 | ) | (0.13 | ) | (0.40 | ) | 29.94 | 25.31 | 3,144 | 1.18 | (e) | 1.22 | (e) | 0.81 | (e) | 29 | ||||||||||||||||||||||||||||||||||||
Year ended 10/31/12 | 22.33 | 0.25 | 1.91 | 2.16 | (0.20 | ) | — | (0.20 | ) | 24.29 | 9.78 | 2,372 | 1.09 | 1.31 | 1.10 | 33 | ||||||||||||||||||||||||||||||||||||||||
Year ended 10/31/11 | 22.37 | 0.17 | (0.02 | ) | 0.15 | (0.19 | ) | — | (0.19 | ) | 22.33 | 0.66 | 1,400 | 1.37 | 1.38 | 0.75 | 28 | |||||||||||||||||||||||||||||||||||||||
Year ended 10/31/10 | 19.57 | 0.14 | 2.89 | 3.03 | (0.23 | ) | — | (0.23 | ) | 22.37 | 15.58 | 1,123 | 1.37 | 1.38 | 0.69 | 41 | ||||||||||||||||||||||||||||||||||||||||
Year ended 10/31/09 | 16.57 | 0.19 | 3.05 | (f) | 3.24 | (0.24 | ) | — | (0.24 | ) | 19.57 | 19.93 | (f) | 1,395 | 1.54 | 1.55 | 1.08 | 40 | ||||||||||||||||||||||||||||||||||||||
Class R5 | ||||||||||||||||||||||||||||||||||||||||||||||||||||||||
Year ended 10/31/13 | 24.18 | 0.27 | 5.80 | 6.07 | (0.30 | ) | (0.13 | ) | (0.43 | ) | 29.82 | 25.51 | 825 | 0.99 | (e) | 0.99 | (e) | 1.00 | (e) | 29 | ||||||||||||||||||||||||||||||||||||
Year ended 10/31/12 | 22.33 | 0.28 | 1.90 | 2.18 | (0.33 | ) | — | (0.33 | ) | 24.18 | 9.95 | 379 | 0.99 | 0.99 | 1.20 | 33 | ||||||||||||||||||||||||||||||||||||||||
Year ended 10/31/11 | 22.37 | 0.28 | (0.06 | ) | 0.22 | (0.26 | ) | — | (0.26 | ) | 22.33 | 0.95 | 306 | 0.82 | 0.83 | 1.30 | 28 | |||||||||||||||||||||||||||||||||||||||
Year ended 10/31/10 | 19.59 | 0.20 | 2.89 | 3.09 | (0.31 | ) | — | (0.31 | ) | 22.37 | 15.93 | 9 | 1.07 | 1.08 | 0.99 | 41 | ||||||||||||||||||||||||||||||||||||||||
Year ended 10/31/09 | 16.65 | 0.26 | 3.05 | (f) | 3.31 | (0.37 | ) | — | (0.37 | ) | 19.59 | 20.49 | (f) | 1,013 | 1.07 | 1.08 | 1.55 | 40 | ||||||||||||||||||||||||||||||||||||||
Class R6 | ||||||||||||||||||||||||||||||||||||||||||||||||||||||||
Year ended 10/31/13 | 24.17 | 0.27 | 5.79 | 6.06 | (0.30 | ) | (0.13 | ) | (0.43 | ) | 29.80 | 25.52 | 12 | 0.99 | (e) | 0.99 | (e) | 1.00 | (e) | 29 | ||||||||||||||||||||||||||||||||||||
Period ended 10/31/12(g) | 24.84 | 0.03 | (0.70 | ) | (0.67 | ) | — | — | — | 24.17 | (2.70 | ) | 10 | 0.95 | (h) | 0.96 | (h) | 1.24 | (h) | 33 | ||||||||||||||||||||||||||||||||||||
| (a) | Calculated using average shares outstanding. |
| (b) | Includes redemption fees added to shares of beneficial interest for Class A, Class B, Class C, Class Y and Class R5 shares, which were less than $0.005 per share for the fiscal years ended October 31, 2012 and prior. |
| (c) | Includes adjustments in accordance with accounting principles generally accepted in the United States of America and as such, the net asset value for financial reporting purposes and the returns based upon those net asset values may differ from the net asset value and returns for shareholder transactions. Does not include sales charges and is not annualized for periods less than one year, if applicable. |
| (d) | Portfolio turnover is calculated at the fund level and is not annualized for periods less than one year, if applicable. For the period ended October 31, 2012, the portfolio turnover calculation excludes the value of securities purchased of $92,850,953 and sold of $35,562,826 in effect to realign the Fund’s portfolio after the reorganization of Invesco Global Advantage Fund into the Fund. |
| (e) | Ratios are based on average daily net assets (000’s) of $289,388, $8,565, $22,951, $2,743, $632 and $11 for Class A, Class B, Class C, Class Y, Class R5 and Class R6 shares, respectively. |
| (f) | Includes litigation proceeds received during the period. Had the litigation proceeds not been received, net gains (losses) on securities (both realized and unrealized) per share would have been $2.93, $2.74, $2.75, $2.93 and $2.93 for Class A, Class B, Class C, Class Y and Class R5 shares, respectively and total returns would have been lower. |
| (g) | Commencement date of September 24, 2012. |
| (h) | Annualized. |
20 Invesco Global Growth Fund
Report of Independent Registered Public Accounting Firm
To the Board of Trustees of AIM International Mutual Funds (Invesco International Mutual Funds)
and Shareholders of Invesco Global Growth Fund:
In our opinion, the accompanying statement of assets and liabilities, including the schedule of investments, and the related statements of operations and of changes in net assets and the financial highlights present fairly, in all material respects, the financial position of Invesco Global Growth Fund (one of the funds constituting AIM International Mutual Funds (Invesco International Mutual Funds), hereafter referred to as the “Fund”) at October 31, 2013, the results of its operations for the year then ended, the changes in its net assets for each of the two years in the period then ended and the financial highlights for each of the five years in the period then ended, in conformity with accounting principles generally accepted in the United States of America. These financial statements and financial highlights (hereafter referred to as “financial statements”) are the responsibility of the Fund’s management; our responsibility is to express an opinion on these financial statements based on our audits. We conducted our audits of these financial statements in accordance with the standards of the Public Company Accounting Oversight Board (United States). Those standards require that we plan and perform the audit to obtain reasonable assurance about whether the financial statements are free of material misstatement. An audit includes examining, on a test basis, evidence supporting the amounts and disclosures in the financial statements, assessing the accounting principles used and significant estimates made by management, and evaluating the overall financial statement presentation. We believe that our audits, which included confirmation of securities at October 31, 2013 by correspondence with the custodian and brokers, provide a reasonable basis for our opinion.
PricewaterhouseCoopers LLP
December 23, 2013
Houston, Texas
21 Invesco Global Growth Fund
Calculating your ongoing Fund expenses
Example
As a shareholder of the Fund, you incur two types of costs: (1) transaction costs, which may include sales charges (loads) on purchase payments or contingent deferred sales charges on redemptions, if any; and (2) ongoing costs, including management fees, distribution and/or service (12b-1) fees, and other Fund expenses. This example is intended to help you understand your ongoing costs (in dollars) of investing in the Fund and to compare these costs with ongoing costs of investing in other mutual funds. The example is based on an investment of $1,000 invested at the beginning of the period and held for the entire period May 1, 2013 through October 31, 2013.
Actual expenses
The table below provides information about actual account values and actual expenses. You may use the information in this table, together with the amount you invested, to estimate the expenses that you paid over the period. Simply divide your account value by $1,000 (for example, an $8,600 account value divided by $1,000 = 8.6), then multiply the result by the number in the table under the heading entitled “Actual Expenses Paid During Period” to estimate the expenses you paid on your account during this period.
Hypothetical example for comparison purposes
The table below also provides information about hypothetical account values and hypothetical expenses based on the Fund’s actual expense ratio and an assumed rate of return of 5% per year before expenses, which is not the Fund’s actual return.
The hypothetical account values and expenses may not be used to estimate the actual ending account balance or expenses you paid for the period. You may use this information to compare the ongoing costs of investing in the Fund and other funds. To do so, compare this 5% hypothetical example with the 5% hypothetical examples that appear in the shareholder reports of the other funds.
Please note that the expenses shown in the table are meant to highlight your ongoing costs only and do not reflect any transaction costs, such as sales charges (loads) on purchase payments or contingent deferred sales charges on redemptions, if any. Therefore, the hypothetical information is useful in comparing ongoing costs only, and will not help you determine the relative total costs of owning different funds. In addition, if these transaction costs were included, your costs would have been higher.
| Class | Beginning Account Value (05/01/13) | ACTUAL | HYPOTHETICAL (5% annual return before expenses) | Annualized Expense Ratio | ||||||||||||||||||||
Ending Account Value (10/31/13)1 | Expenses Paid During Period2 | Ending Account Value (10/31/13) | Expenses Paid During Period2 | |||||||||||||||||||||
| A | $ | 1,000.00 | $ | 1,125.20 | $ | 7.93 | $ | 1,017.74 | $ | 7.53 | 1.48 | % | ||||||||||||
| B | 1,000.00 | 1,121.10 | 11.92 | 1,013.96 | 11.32 | 2.23 | ||||||||||||||||||
| C | 1,000.00 | 1,120.60 | 11.92 | 1,013.96 | 11.32 | 2.23 | ||||||||||||||||||
| Y | 1,000.00 | 1,126.40 | 6.59 | 1,019.00 | 6.26 | 1.23 | ||||||||||||||||||
| R5 | 1,000.00 | 1,128.30 | 5.47 | 1,020.06 | 5.19 | 1.02 | ||||||||||||||||||
| R6 | 1,000.00 | 1,127.90 | 5.47 | 1,020.06 | 5.19 | 1.02 | ||||||||||||||||||
| 1 | The actual ending account value is based on the actual total return of the Fund for the period May 1, 2013 through October 31, 2013, after actual expenses and will differ from the hypothetical ending account value which is based on the Fund’s expense ratio and a hypothetical annual return of 5% before expenses. |
| 2 | Expenses are equal to the Fund’s annualized expense ratio as indicated above multiplied by the average account value over the period, multiplied by 184/365 to reflect the most recent fiscal half year. |
22 Invesco Global Growth Fund
Approval of Investment Advisory and Sub-Advisory Contracts
The Board of Trustees (the Board) of AIM International Mutual Funds (Invesco International Mutual Funds) is required under the Investment Company Act of 1940, as amended, to approve annually the renewal of Invesco Global Growth Fund’s (the Fund) investment advisory agreement with Invesco Advisers, Inc. (Invesco Advisers) and the Master Intergroup Sub-Advisory Contract for Mutual Funds (the sub-advisory contracts) with Invesco Asset Management Deutschland GmbH, Invesco Asset Management Limited, Invesco Asset Management (Japan) Limited, Invesco Australia Limited, Invesco Hong Kong Limited, Invesco Senior Secured Management, Inc. and Invesco Canada Ltd. (collectively, the Affiliated Sub-Advisers). During contract renewal meetings held on June 17-19, 2013, the Board as a whole, and the disinterested or “independent” Trustees, who comprise over 75% of the Board, voting separately, approved the continuance of the Fund’s investment advisory agreement and the sub-advisory contracts for another year, effective July 1, 2013. The Board determined that the continuation of the Fund’s investment advisory agreement and the sub-advisory contracts are in the best interests of the Fund and its shareholders and the compensation payable to Invesco Advisers and the Affiliated Sub-Advisers under the agreements is fair and reasonable.
The Board’s Fund Evaluation Process
The Board’s Investments Committee has established three Sub-Committees, each of which is primarily responsible for overseeing the management of a number of the funds advised by Invesco Advisers (the Invesco Funds). The Sub-Committees meet throughout the year to review the performance of their assigned Invesco Funds, including reviewing materials prepared under the direction of the independent Senior Officer, an officer of the Invesco Funds who reports directly to the independent Trustees. Over the course of each year, the Sub-Committees meet with portfolio managers for their assigned Invesco Funds and other members of management to review the performance, investment objective(s), policies, strategies, limitations and investment risks of these funds. The Sub-Committees meet regularly and at designated contract renewal meetings each year to conduct a review of the performance, fees, expenses and other matters related to their assigned Invesco Funds. Each Sub-Committee recommends to the Investments Committee, which in turn recommends to the full Board, whether and on what terms to approve the continuance of each Invesco Fund’s investment advisory agreement and sub-advisory contracts for another year.
During the contract renewal process, the Trustees receive comparative performance and fee data regarding the Invesco Funds prepared
by Invesco Advisers and Lipper Inc. (Lipper), an independent provider of investment company data. The Trustees also receive an independent written evaluation from the Senior Officer. The Senior Officer’s evaluation is prepared as part of his responsibility to manage the process by which the Invesco Funds’ proposed management fees are negotiated during the annual contract renewal process to ensure they are negotiated in a manner that is at arms’ length and reasonable. The independent Trustees are assisted in their annual evaluation of the Fund’s investment advisory agreement by the Senior Officer and by independent legal counsel. In addition to meetings with Invesco Advisers and fund counsel, the independent Trustees also discuss the continuance of the investment advisory agreement and sub-advisory contracts in separate sessions with the Senior Officer and with independent legal counsel.
In evaluating the fairness and reasonableness of compensation under the Fund’s investment advisory agreement and sub-advisory contracts, the Board considered, among other things, the factors discussed below. The Trustees recognized that the advisory fee rates for the Invesco Funds are, in many cases, the result of years of review and negotiation between the Trustees and Invesco Advisers as well as advisory fees previously approved by different predecessor boards. The Trustees’ deliberations and conclusions in a particular year may be based in part on their deliberations and conclusions regarding these same arrangements throughout the year and in prior years. The Trustees’ review and conclusions are based on the comprehensive consideration of all information presented to them and are not the result of any single determinative factor. Moreover, one Trustee may have weighed a particular piece of information or factor differently than another Trustee.
The discussion below serves as the Senior Officer’s independent written evaluation with respect to the Fund’s investment advisory agreement as well as a discussion of the material factors and related conclusions that formed the basis for the Board’s approval of the Fund’s investment advisory agreement and sub-advisory contracts. Unless otherwise stated, this information is current as of June 19, 2013, and may not reflect consideration of factors that became known to the Board after that date, including, for example, changes to the Fund’s performance, advisory fees, expense limitations and/or fee waivers.
Factors and Conclusions and Summary of Independent Written Fee Evaluation
| A. | Nature, Extent and Quality of Services Provided by Invesco Advisers and the Affiliated Sub-Advisers |
The Board reviewed the advisory services provided to the Fund by Invesco Advisers under
the Fund’s investment advisory agreement, the performance of Invesco Advisers in providing these services, and the credentials and experience of the officers and employees of Invesco Advisers who provide these services, including the Fund’s portfolio manager or managers, with whom the Sub-Committees met during the year. The Board’s review of the qualifications of Invesco Advisers to provide advisory services included the Board’s consideration of Invesco Advisers’ investment process oversight, independent credit analysis and investment risk management.
In determining whether to continue the Fund’s investment advisory agreement, the Board considered the benefits of reapproving an existing relationship and the greater uncertainty that may be associated with entering into a new relationship. The Board also considered non-advisory services that Invesco Advisers and its affiliates provide to the Invesco Funds such as various back office support functions, equity and fixed income trading operations, internal audit, distribution and legal and compliance. The Board concluded that the nature, extent and quality of the services provided to the Fund by Invesco Advisers are appropriate and satisfactory and consistent with the terms of the Fund’s investment advisory agreement.
The Board reviewed the services that may be provided by the Affiliated Sub-Advisers under the sub-advisory contracts and the credentials and experience of the officers and employees of the Affiliated Sub-Advisers who provide these services. The Board noted that the Affiliated Sub-Advisers have offices and personnel that are located in financial centers around the world. As a result, the Affiliated Sub-Advisers can provide research and investment analysis on the markets and economies of various countries in which the Fund may invest, make recommendations regarding securities and assist with security trades. The Board concluded that the sub-advisory contracts benefit the Fund and its shareholders by permitting Invesco Advisers to use the resources and talents of the Affiliated Sub-Advisers in managing the Fund. The Board concluded that the nature, extent and quality of the services that may be provided by the Affiliated Sub-Advisers are appropriate and satisfactory and consistent with the terms of the Fund’s sub-advisory contracts.
| B. | Fund Performance |
The Board considered Fund performance as a relevant factor in considering whether to approve the investment advisory agreement. The Board did not view Fund performance as a relevant factor in considering whether to approve the sub-advisory contracts for the Fund, as no Affiliated Sub-Adviser currently manages assets of the Fund.
The Board compared the Fund’s performance during the past one, three and five calendar years to the performance of funds in the Lipper
23 Invesco Global Growth Fund
performance universe and against the Lipper Global Large-Cap Growth Funds Index. The Board noted that performance of Class A shares of the Fund was in the fourth quintile of the performance universe for the one and three year periods and the third quintile for the five year period (the first quintile being the best performing funds and the fifth quintile being the worst performing funds). The Board noted that performance of Class A shares of the Fund was below the performance of the Index for the one and three year periods and above the performance of the Index for the five year period. Invesco Advisers noted that two separate investment teams manage the Fund with an allocation to at least three countries, including the U.S. An underweight to the U.S. may have affected performance. The Trustees also reviewed more recent Fund performance and this review did not change their conclusions.
| C. | Advisory and Sub-Advisory Fees |
The Board compared the Fund’s contractual management fee rate to the contractual management fee rates of funds in the Fund’s Lipper expense group at a common asset level. The Board noted that the contractual management fee rate for Class A shares of the Fund was below the median contractual management fee rate of funds in the expense group. The Board noted that the term “contractual management fee” may include both advisory and certain administrative services fees and that Invesco does not charge the Invesco Funds for the administrative services included in the term as defined by Lipper. The Board also reviewed the methodology used by Lipper in providing expense group information, which includes using each fund’s contractual management fee schedule (including any applicable breakpoints) as reported in the most recent prospectus or statement of additional information for each fund in the expense group.
The Board also compared the Fund’s effective advisory fee rate (the advisory fee rate after advisory fee waivers and before other expense limitations/waivers) to the effective advisory fee rates of other funds advised by Invesco Advisers and its affiliates with investment strategies comparable to those of the Fund. The Board noted that Invesco Advisers advises one off-shore fund with comparable investment strategies, which had an effective advisory fee rate before waivers higher than the Fund’s rate. The Board noted that Invesco Advisers and its affiliates do not advise other funds or client accounts with investment strategies comparable to those of the Fund.
The Board also considered the services that may be provided by the Affiliated Sub-Advisers pursuant to the sub-advisory contracts, as well as the fees payable by Invesco Advisers to the Affiliated Sub-Advisers pursuant to the sub-advisory contracts. The Board also noted that the sub-advisory fees are not paid directly by the Fund, but rather, are payable by Invesco Advisers to the Affiliated Sub-Advisers.
Based upon the information and considerations described above, the Board concluded that the compensation payable to Invesco Adviser and the Affiliated Sub-Advisers is fair and reasonable.
| D. | Economies of Scale and Breakpoints |
The Board considered the extent to which there are economies of scale in the provision of advisory services to the Fund. The Board also considered whether the Fund benefits from economies of scale through contractual breakpoints in the Fund’s advisory fee schedule and was assisted in this review by a report from the Senior Officer. The Board also noted that the Fund shares directly in economies of scale through lower fees charged by third party service providers based on the combined size of the Invesco Funds and other clients advised by Invesco Advisers.
| E. | Profitability and Financial Resources |
The Board reviewed information from Invesco Advisers concerning the costs of the advisory and other services that Invesco Advisers and its affiliates provide to the Fund and the profitability of Invesco Advisers and its affiliates in providing these services for the year ended December 31, 2012. The Board received information from Invesco Advisers about the methodology used to prepare the profitability information. The Board considered the profitability of Invesco Advisers in managing the Fund and the Invesco Funds. The Board noted that Invesco Advisers continues to operate at a net profit from services Invesco Advisers and its subsidiaries provide to the Invesco Funds and the Fund. The Board did not deem the level of profits realized by Invesco Advisers and its affiliates from providing services to the Fund to be excessive given the nature, quality and extent of the services provided to the Invesco Funds. The Board received and accepted information from Invesco Advisers demonstrating that Invesco Advisers and each Affiliated Sub-Adviser are financially sound and have the resources necessary to perform their obligations under the investment advisory agreement and sub-advisory contracts.
| F. | Collateral Benefits to Invesco Advisers and its Affiliates |
The Board considered various other benefits received by Invesco Advisers and its affiliates from the relationship with the Fund, including the fees received for their provision of transfer agency and distribution services to the Fund. The Board considered comparative information regarding fees charged for these services, including information provided by Lipper and other independent sources. The Board considered the performance of Invesco Advisers and its affiliates in providing these services and the organizational structure employed to provide these services. The Board also considered that these services are provided to the Fund pursuant to written contracts that are reviewed and approved on an annual basis by the Board; that the services are required for the operation of the Fund; that Invesco Advisers and its affiliates can provide services, the
nature and quality of which are at least equal to those provided by others offering the same or similar services; and that the fees for such services are fair and reasonable in light of the usual and customary charges by others for services of the same nature and quality.
The Board considered the benefits realized by Invesco Advisers and the Affiliated Sub-Advisers as a result of portfolio brokerage transactions executed through “soft dollar” arrangements. The Board noted that soft dollar arrangements shift the payment obligation for research services from Invesco Advisers and the Affiliated Sub-Advisers to the Invesco Funds and that the research received may be used with other clients of Invesco Advisers and may reduce Invesco Advisers’ and the Affiliated Sub-Advisers’ expenses. The Board also considered periodic reports from the Chief Compliance Officer of the Invesco Funds demonstrating that these arrangements are consistent with regulatory requirements. The Board did not deem the soft dollar arrangements to be inappropriate.
The Board considered that the Fund’s uninvested cash and cash collateral from any securities lending arrangements may be invested in money market funds advised by Invesco Advisers pursuant to procedures approved by the Board. The Board noted that Invesco Advisers receives advisory fees from these affiliated money market funds attributable to such investments, although Invesco Advisers has contractually agreed to waive through varying periods the advisory fees payable by the Invesco Funds. The waiver is in an amount equal to 100% of the net advisory fee Invesco Advisers receives from the affiliated money market funds with respect to the Fund’s investment in the affiliated money market funds of uninvested cash, but not cash collateral. The Board concluded that the Fund’s investment of uninvested cash and cash collateral from any securities lending arrangements in the affiliated money market funds is in the best interests of the Fund and its shareholders.
The Board also considered use of an affiliated broker to execute certain trades for the Fund to among other things, control information leakage, and were advised that such trades are executed in compliance with rules under the Investment Company Act of 1940, as amended.
24 Invesco Global Growth Fund
Tax Information
Form 1099-DIV, Form 1042-S and other year–end tax information provide shareholders with actual calendar year amounts that should be included in their tax returns. Shareholders should consult their tax advisors.
The following distribution information is being provided as required by the Internal Revenue Code or to meet a specific state’s requirement.
The Fund designates the following amounts or, if subsequently determined to be different, the maximum amount allowable for its fiscal year ended October 31, 2013:
Federal and State Income Tax | ||||
Long-Term Capital Gain Distributions | $ | 1,701,659 | ||
Qualified Dividend Income* | 1.45 | % | ||
Corporate Dividends Received Deduction* | 0.22 | % | ||
| * | The above percentages are based on ordinary income dividends paid to shareholders during the Fund’s fiscal year. |
25 Invesco Global Growth Fund
Trustees and Officers
The address of each trustee and officer is AIM International Mutual Funds (Invesco International Mutual Funds) (the “Trust”), 11 Greenway Plaza, Suite 1000, Houston, Texas 77046-1173. The trustees serve for the life of the Trust, subject to their earlier death, incapacitation, resignation, retirement or removal as more specifically provided in the Trust’s organizational documents. Each officer serves for a one year term or until their successors are elected and qualified. Column two below includes length of time served with predecessor entities, if any.
Name, Year of Birth and Position(s) Held with the Trust | Trustee and/ or Officer Since | Principal Occupation(s) During Past 5 Years | Number of Funds in Fund Complex Overseen by Trustee | Other Directorship(s) Held by Trustee During Past 5 Years | ||||
| Interested Persons | ||||||||
| Martin L. Flanagan1 — 1960 Trustee | 2007 | Executive Director, Chief Executive Officer and President, Invesco Ltd. (ultimate parent of Invesco and a global investment management firm); Advisor to the Board, Invesco Advisers, Inc. (formerly known as Invesco Institutional (N.A.), Inc.); Trustee, The Invesco Funds; Vice Chair, Investment Company Institute; and Member of Executive Board, SMU Cox School of Business
Formerly: Chairman and Chief Executive Officer, Invesco Advisers, Inc. (registered investment adviser); Director, Chairman, Chief Executive Officer and President, IVZ Inc. (holding company), INVESCO Group Services, Inc. (service provider) and Invesco North American Holdings, Inc. (holding company); Director, Chief Executive Officer and President, Invesco Holding Company Limited (parent of Invesco and a global investment management firm); Director, Invesco Ltd.; Chairman, Investment Company Institute and President, Co-Chief Executive Officer, Co-President, Chief Operating Officer and Chief Financial Officer, Franklin Resources, Inc. (global investment management organization) | 117 | None | ||||
Philip A. Taylor2 — 1954 Trustee, President and Principal Executive Officer | 2006 | Head of North American Retail and Senior Managing Director, Invesco Ltd.; Director, Co-Chairman, Co-President and Co-Chief Executive Officer, Invesco Advisers, Inc. (formerly known as Invesco Institutional (N.A.), Inc.) (registered investment adviser); Director, Chairman, Chief Executive Officer and President, Invesco Management Group, Inc. (formerly known as Invesco Aim Management Group, Inc.) (financial services holding company); Director and President, INVESCO Funds Group, Inc. (registered investment adviser and registered transfer agent); Director and Chairman, Invesco Investment Services, Inc. (formerly known as Invesco Aim Investment Services, Inc.) (registered transfer agent) and IVZ Distributors, Inc. (formerly known as INVESCO Distributors, Inc.) (registered broker dealer); Director, President and Chairman, Invesco Inc. (holding company) and Invesco Canada Holdings Inc. (holding company); Chief Executive Officer, Invesco Corporate Class Inc. (corporate mutual fund company) and Invesco Canada Fund Inc. (corporate mutual fund company); Director, Chairman and Chief Executive Officer, Invesco Canada Ltd. (formerly known as Invesco Trimark Ltd./Invesco Trimark Ltèe) (registered investment adviser and registered transfer agent); Trustee, President and Principal Executive Officer, The Invesco Funds (other than AIM Treasurer’s Series Trust (Invesco Treasurer’s Series Trust) and Short-Term Investments Trust); Trustee and Executive Vice President, The Invesco Funds (AIM Treasurer’s Series Trust (Invesco Treasurer’s Series Trust) and Short-Term Investments Trust only); Director, Invesco Investment Advisers LLC (formerly known as Van Kampen Asset Management); Director, Chief Executive Officer and President, Van Kampen Exchange Corp.
Formerly: Director and Chairman, Van Kampen Investor Services Inc.: Director, Chief Executive Officer and President, 1371 Preferred Inc. (holding company); and Van Kampen Investments Inc.; Director and President, AIM GP Canada Inc. (general partner for limited partnerships); and Van Kampen Advisors, Inc.; Director and Chief Executive Officer, Invesco Trimark Dealer Inc. (registered broker dealer); Director, Invesco Distributors, Inc. (formerly known as Invesco Aim Distributors, Inc.) (registered broker dealer); Manager, Invesco PowerShares Capital Management LLC; Director, Chief Executive Officer and President, Invesco Advisers, Inc.; Director, Chairman, Chief Executive Officer and President, Invesco Aim Capital Management, Inc.; President, Invesco Trimark Dealer Inc. and Invesco Trimark Ltd./Invesco Trimark Ltèe; Director and President, AIM Trimark Corporate Class Inc. and AIM Trimark Canada Fund Inc.; Senior Managing Director, Invesco Holding Company Limited; Trustee and Executive Vice President, Tax-Free Investments Trust; Director and Chairman, Fund Management Company (former registered broker dealer); President and Principal Executive Officer, The Invesco Funds (AIM Treasurer’s Series Trust (Invesco Treasurer’s Series Trust), Short-Term Investments Trust and Tax-Free Investments Trust only); President, AIM Trimark Global Fund Inc. and AIM Trimark Canada Fund Inc. | 117 | None | ||||
Wayne W. Whalen3 — 1939 Trustee | 2010 | Of Counsel, and prior to 2010, partner in the law firm of Skadden, Arps, Slate, Meagher & Flom LLP, legal counsel to certain funds in the Fund Complex | 130 | Director of the Mutual Fund Directors Forum, a nonprofit membership organization for investment directors; Chairman and Director of the Abraham Lincoln Presidential Library Foundation; and Director of the Stevenson Center for Democracy |
| 1 | Mr. Flanagan is considered an interested person of the Trust because he is an officer of the adviser to the Trust, and an officer and a director of Invesco Ltd., ultimate parent of the adviser to the Trust. |
| 2 | Mr. Taylor is considered an interested person of the Trust because he is an officer and a director of the adviser to, and a director of the principal underwriter of, the Trust. |
| 3 | Mr. Whalen is considered an “interested person” (within the meaning of Section 2(a)(19) of the 1940 Act) of certain Funds in the Invesco Fund Complex because he and his firm currently provide legal services as legal counsel to such Funds. |
T-1 Invesco Global Growth Fund
Trustees and Officers—(continued)
Name, Year of Birth and Position(s) Held with the Trust | Trustee and/ or Officer Since | Principal Occupation(s) During Past 5 Years | Number of Funds in Fund Complex Overseen by Trustee | Other Directorship(s) Held by Trustee During Past 5 Years | ||||
| Independent Trustees | ||||||||
Bruce L. Crockett — 1944 Trustee and Chair | 1992 | Chairman, Crockett Technologies Associates (technology consulting company)
Formerly: Director, Captaris (unified messaging provider); Director, President and Chief Executive Officer COMSAT Corporation; and Chairman, Board of Governors of INTELSAT (international communications company) | 117 | ACE Limited (insurance company); Investment Company Institute | ||||
David C. Arch — 1945 Trustee | 2010 | Chairman and Chief Executive Officer of Blistex Inc., (consumer health care products manufacturer)
Formerly: Member of the Heartland Alliance Advisory Board, a nonprofit organization serving human needs based in Chicago | 130 | Board member of the Illinois Manufacturers’ Association; Member of the Board of Visitors, Institute for the Humanities, University of Michigan | ||||
Frank S. Bayley — 1939 Trustee | 2001 | Retired
Formerly: Director, Badgley Funds, Inc. (registered investment company) (2 portfolios) and General Partner and Of Counsel, law firm of Baker & McKenzie, LLP | 117 | Director and Chairman, C.D. Stimson Company (a real estate investment company); Trustee and Overseer, The Curtis Institute of Music | ||||
James T. Bunch — 1942 Trustee | 2003 | Managing Member, Grumman Hill Group LLC (family office private equity management)
Formerly: Founder, Green, Manning & Bunch Ltd. (investment banking firm)(1988-2010); Executive Committee, United States Golf Association; and Director, Policy Studies, Inc. and Van Gilder Insurance Corporation | 117 | Chairman, Board of Governors, Western Golf Association; Chairman-elect, Evans Scholars Foundation; and Director, Denver Film Society | ||||
Rodney F. Dammeyer — 1940 Trustee | 2010 | Chairman of CAC, LLC, (private company offering capital investment and management advisory services)
Formerly: Prior to 2001, Managing Partner at Equity Group Corporate Investments; Prior to 1995, Chief Executive Officer of Itel Corporation (formerly Anixter International); Prior to 1985, experience includes Senior Vice President and Chief Financial Officer of Household International, Inc., Executive Vice President and Chief Financial Officer of Northwest Industries, Inc. and Partner of Arthur Andersen & Co.; From 1987 to 2010, Director/Trustee of investment companies in the Van Kampen Funds complex | 117 | Director of Quidel Corporation and Stericycle, Inc.; Prior to May 2008, Trustee of The Scripps Research Institute; Prior to February 2008, Director of Ventana Medical Systems, Inc. | ||||
Albert R. Dowden — 1941 Trustee | 2000 | Director of a number of public and private business corporations, including the Boss Group, Ltd. (private investment and management); and Reich & Tang Funds (5 portfolios) (registered investment company)
Formerly: Director, Homeowners of America Holding Corporation/Homeowners of America Insurance Company (property casualty company); Director, Continental Energy Services, LLC (oil and gas pipeline service); Director, CompuDyne Corporation (provider of product and services to the public security market) and Director, Annuity and Life Re (Holdings), Ltd. (reinsurance company); Director, President and Chief Executive Officer, Volvo Group North America, Inc.; Senior Vice President, AB Volvo; Director of various public and private corporations; Chairman, DHJ Media, Inc.; Director, Magellan Insurance Company; and Director, The Hertz Corporation, Genmar Corporation (boat manufacturer), National Media Corporation; Advisory Board of Rotary Power International (designer, manufacturer, and seller of rotary power engines); and Chairman, Cortland Trust, Inc. (registered investment company) | 117 | Director of Nature’s Sunshine Products, Inc. | ||||
Jack M. Fields — 1952 Trustee | 1997 | Chief Executive Officer, Twenty First Century Group, Inc. (government affairs company); Owner and Chief Executive Officer, Dos Angeles Ranch, L.P. (cattle, hunting, corporate entertainment); and Discovery Global Education Fund (non-profit)
Formerly: Chief Executive Officer, Texana Timber LP (sustainable forestry company); Director of Cross Timbers Quail Research Ranch (non-profit); and member of the U.S. House of Representatives | 117 | Insperity, Inc. (formerly known as Administaff) | ||||
Prema Mathai-Davis — 1950 Trustee | 1998 | Retired
Formerly: Chief Executive Officer, YWCA of the U.S.A. | 117 | None | ||||
Larry Soll — 1942 Trustee | 2003 | Retired
Formerly: Chairman, Chief Executive Officer and President, Synergen Corp. (a biotechnology company) | 117 | None | ||||
Hugo F. Sonnenschein — 1940 Trustee | 2010 | Distinguished Service Professor and President Emeritus of the University of Chicago and the Adam Smith Distinguished Service Professor in the Department of Economics at the University of Chicago
Formerly: President of the University of Chicago | 130 | Trustee of the University of Rochester and a member of its investment committee. Member of the National Academy of Sciences, the American Philosophical Society and a fellow of the American Academy of Arts and Sciences | ||||
Raymond Stickel, Jr. — 1944 Trustee | 2005 | Retired
Formerly: Director, Mainstay VP Series Funds, Inc. (25 portfolios) and Partner, Deloitte & Touche | 117 | None |
T-2 Invesco Global Growth Fund
Trustees and Officers—(continued)
Name, Year of Birth and Position(s) Held with the Trust | Trustee and/ or Officer Since | Principal Occupation(s) During Past 5 Years | Number of Funds in Fund Complex Overseen by Trustee | Other Directorship(s) Held by Trustee During Past 5 Years | ||||
| Other Officers | ||||||||
Russell C. Burk — 1958 Senior Vice President and Senior Officer | 2005 | Senior Vice President and Senior Officer, The Invesco Funds | N/A | N/A | ||||
John M. Zerr — 1962 Senior Vice President, Chief Legal Officer and Secretary | 2006 | Director, Senior Vice President, Secretary and General Counsel, Invesco Management Group, Inc. (formerly known as Invesco Aim Management Group, Inc.) and Van Kampen Exchange Corp.; Senior Vice President, Invesco Advisers, Inc. (formerly known as Invesco Institutional (N.A.), Inc.) (registered investment adviser); Senior Vice President and Secretary, Invesco Distributors, Inc. (formerly known as Invesco Aim Distributors, Inc.); Director, Vice President and Secretary, Invesco Investment Services, Inc. (formerly known as Invesco Aim Investment Services, Inc.) and IVZ Distributors, Inc. (formerly known as INVESCO Distributors, Inc.); Director and Vice President, INVESCO Funds Group, Inc.; Senior Vice President, Chief Legal Officer and Secretary, The Invesco Funds; Manager, Invesco PowerShares Capital Management LLC; Director, Secretary and General Counsel, Invesco Investment Advisers LLC (formerly known as Van Kampen Asset Management); Secretary and General Counsel, Invesco Capital Markets, Inc. (formerly known as Van Kampen Funds Inc.) and Chief Legal Officer, PowerShares Exchange-Traded Fund Trust, PowerShares Exchange-Traded Fund Trust II, PowerShares India Exchange-Traded Fund Trust and PowerShares Actively Managed Exchange-Traded Fund Trust
Formerly: Director and Vice President, Van Kampen Advisors Inc.; Director, Vice President, Secretary and General Counsel, Van Kampen Investor Services Inc.; Director, Invesco Distributors, Inc. (formerly known as Invesco Aim Distributors, Inc.); Director, Senior Vice President, General Counsel and Secretary, Invesco Aim Advisers, Inc. and Van Kampen Investments Inc.; Director, Vice President and Secretary, Fund Management Company; Director, Senior Vice President, Secretary, General Counsel and Vice President, Invesco Aim Capital Management, Inc.; Chief Operating Officer and General Counsel, Liberty Ridge Capital, Inc. (an investment adviser); Vice President and Secretary, PBHG Funds (an investment company) and PBHG Insurance Series Fund (an investment company); Chief Operating Officer, General Counsel and Secretary, Old Mutual Investment Partners (a broker-dealer); General Counsel and Secretary, Old Mutual Fund Services (an administrator) and Old Mutual Shareholder Services (a shareholder servicing center); Executive Vice President, General Counsel and Secretary, Old Mutual Capital, Inc. (an investment adviser); and Vice President and Secretary, Old Mutual Advisors Funds (an investment company) | N/A | N/A | ||||
Karen Dunn Kelley — 1960 Vice President | 2004 | Senior Managing Director, Investments; Director, Co-President, Co-Chief Executive Officer, and Co-Chairman, Invesco Advisers, Inc. (formerly known as Invesco Institutional (N.A.), Inc.) (registered investment adviser); Chairman, Invesco Senior Secured Management, Inc.; Senior Vice President, Invesco Management Group, Inc. (formerly known as Invesco Aim Management Group, Inc.); Executive Vice President, Invesco Distributors, Inc. (formerly known as Invesco Aim Distributors, Inc.); Director, Invesco Mortgage Capital Inc., and Invesco Management Company Limited; Director and President, INVESCO Asset Management (Bermuda) Ltd., Vice President, The Invesco Funds (other than AIM Treasurer’s Series Trust (Invesco Treasurer’s Series Trust) and Short-Term Investments Trust); and President and Principal Executive Officer, The Invesco Funds (AIM Treasurer’s Series Trust (Invesco Treasurer’s Series Trust) and Short-Term Investments Trust only)
Formerly: Director, INVESCO Global Asset Management Limited and INVESCO Management S.A.; Senior Vice President, Van Kampen Investments Inc. and Invesco Advisers, Inc. (formerly known as Invesco Institutional (N.A.), Inc.) (registered investment adviser); Vice President, Invesco Advisers, Inc. (formerly known as Invesco Institutional (N.A.), Inc.); Director of Cash Management and Senior Vice President, Invesco Advisers, Inc. and Invesco Aim Capital Management, Inc.; President and Principal Executive Officer, Tax-Free Investments Trust; Director and President, Fund Management Company; Chief Cash Management Officer, Director of Cash Management, Senior Vice President, and Managing Director, Invesco Aim Capital Management, Inc.; Director of Cash Management, Senior Vice President, and Vice President, Invesco Advisers, Inc. and The Invesco Funds (AIM Treasurer’s Series Trust (Invesco Treasurer’s Series Trust), Short-Term Investments Trust and Tax-Free Investments Trust only) | N/A | N/A |
T-3 Invesco Global Growth Fund
Trustees and Officers—(continued)
Name, Year of Birth and Position(s) Held with the Trust | Trustee and/ or Officer Since | Principal Occupation(s) During Past 5 Years | Number of Funds in Fund Complex Overseen by Trustee | Other Directorship(s) Held by Trustee During Past 5 Years | ||||
| Other Officers—(continued) | �� | |||||||
Sheri Morris — 1964 Vice President, Treasurer and Principal Financial Officer | 1999 | Vice President, Treasurer and Principal Financial Officer, The Invesco Funds; Vice President, Invesco Advisers, Inc. (formerly known as Invesco Institutional (N.A.), Inc.) (registered investment adviser); and Vice President, PowerShares Exchange-Traded Fund Trust, PowerShares Exchange-Traded Fund Trust II, PowerShares India Exchange-Traded Fund Trust and PowerShares Actively Managed Exchange-Traded Fund Trust
Formerly: Vice President, Invesco Aim Advisers, Inc., Invesco Aim Capital Management, Inc. and Invesco Aim Private Asset Management, Inc.; Assistant Vice President and Assistant Treasurer, The Invesco Funds and Assistant Vice President, Invesco Advisers, Inc., Invesco Aim Capital Management, Inc. and Invesco Aim Private Asset Management, Inc.; and Treasurer, PowerShares Exchange-Traded Fund Trust, PowerShares Exchange-Traded Fund Trust II, PowerShares India Exchange-Traded Fund Trust and PowerShares Actively Managed Exchange-Traded Fund Trust | N/A | N/A | ||||
Crissie M. Wisdom — 1969 Anti-Money Laundering Compliance Officer | 2013 | Anti-Money Laundering Compliance Officer, Invesco Advisers, Inc. (formerly known as Invesco Institutional (N.A.), Inc.) (registered investment adviser), Invesco Capital Markets, Inc. (formerly known as Van Kampen Funds Inc.), Invesco Distributors, Inc., Invesco Investment Services, Inc., Invesco Management Group, Inc., Van Kampen Exchange Corp., The Invesco Funds, Invesco Funds (Chicago), and PowerShares Exchange-Traded Fund Trust, PowerShares Exchange-Traded Fund Trust II, PowerShares India Exchange-Traded Fund Trust, and PowerShares Actively Managed Exchange-Traded Fund Trust; and Fraud Prevention Manager and Controls and Risk Analysis Manager for Invesco Investment Services, Inc. | N/A | N/A | ||||
Todd L. Spillane — 1958 Chief Compliance Officer | 2006 | Senior Vice President, Invesco Management Group, Inc. (formerly known as Invesco Aim Management Group, Inc.) and Van Kampen Exchange Corp.; Senior Vice President and Chief Compliance Officer, Invesco Advisers, Inc. (registered investment adviser) (formerly known as Invesco Institutional (N.A.), Inc.); Chief Compliance Officer, The Invesco Funds; Vice President, Invesco Distributors, Inc. (formerly known as Invesco Aim Distributors, Inc.) and Invesco Investment Services, Inc. (formerly known as Invesco Aim Investment Services, Inc.)
Formerly: Chief Compliance Officer, Invesco Funds (Chicago); Senior Vice President, Van Kampen Investments Inc.; Senior Vice President and Chief Compliance Officer, Invesco Aim Advisers, Inc. and Invesco Aim Capital Management, Inc.; Chief Compliance Officer, INVESCO Private Capital Investments, Inc. (holding company), Invesco Private Capital, Inc. (registered investment adviser), Invesco Global Asset Management (N.A.), Inc., Invesco Senior Secured Management, Inc. (registered investment adviser), Van Kampen Investor Services Inc., PowerShares Exchange-Traded Fund Trust, PowerShares Exchange-Traded Fund Trust II, PowerShares India Exchange-Traded Fund Trust and PowerShares Actively Managed Exchange-Traded Fund Trust; and Vice President, Invesco Aim Capital Management, Inc. and Fund Management Company | N/A | N/A |
The Statement of Additional Information of the Trust includes additional information about the Fund’s Trustees and is available upon request, without charge, by calling 1.800.959.4246. Please refer to the Fund’s prospectus for information on the Fund’s sub-advisers.
Office of the Fund 11 Greenway Plaza, Suite 1000 Houston, TX 77046-1173 | Investment Adviser Invesco Advisers, Inc. 1555 Peachtree Street, N.E. Atlanta, GA 30309 | Distributor Invesco Distributors, Inc. 11 Greenway Plaza, Suite 1000 Houston, TX 77046-1173 | Auditors PricewaterhouseCoopers LLP 1201 Louisiana Street, Suite 2900 Houston, TX 77002-5678 | |||
Counsel to the Fund Stradley Ronon Stevens & Young, LLP 2005 Market Street, Suite 2600 Philadelphia, PA 19103-7018 | Counsel to the Independent Trustees Goodwin Procter LLP 901 New York Avenue, N.W. Washington, D.C. 20001 | Transfer Agent Invesco Investment Services, Inc. 11 Greenway Plaza, Suite 1000 Houston, TX 77046-1173 | Custodian State Street Bank and Trust Company 225 Franklin Street Boston, MA 02110-2801 | |||
T-4 Invesco Global Growth Fund

Invesco mailing information
Send general correspondence to Invesco Investment Services, Inc., P.O. Box 219078, Kansas City, MO 64121-9078.
Invesco privacy policy
You share personal and financial information with us that is necessary for your transactions and your account records. We take very seriously the obligation to keep that information confidential and private.
Invesco collects nonpublic personal information about you from account applications or other forms you complete and from your transactions with us or our affiliates. We do not disclose information about you or our former customers to service providers or other third parties except to the extent necessary to service your account and in other limited circumstances as permitted by law. For example, we use this information to facilitate the delivery of transaction confirmations, financial reports, prospectuses and tax forms.
Even within Invesco, only people involved in the servicing of your accounts and compliance monitoring have access to your information. To ensure the highest level of confidentiality and security, Invesco maintains physical, electronic and procedural safeguards that meet or exceed federal standards. Special measures, such as data encryption and authentication, apply to your communications with us on our website. More detail is available to you at invesco.com/privacy.
Important notice regarding delivery of security holder documents
To reduce Fund expenses, only one copy of most shareholder documents may be mailed to shareholders with multiple accounts at the same address (Householding). Mailing of your shareholder documents may be householded indefinitely unless you instruct us otherwise. If you do not want the mailing of these documents to be combined with those for other members of your household, please contact Invesco Investment Services, Inc. at 800 959 4246 or contact your financial institution. We will begin sending you individual copies for each account within 30 days after receiving your request.
Fund holdings and proxy voting information
The Fund provides a complete list of its holdings four times in each fiscal year, at the quarter ends. For the second and fourth quarters, the lists appear in the Fund’s semiannual and annual reports to shareholders. For the first and third quarters, the Fund files the lists with the Securities and Exchange Commission (SEC) on Form N-Q. The most recent list of portfolio holdings is available at invesco.com/completeqtrholdings. Shareholders can also look up the Fund’s Forms N-Q on the SEC website at sec.gov. Copies of the Fund’s Forms N-Q may be reviewed and copied at the SEC Public Reference Room in Washington, D.C. You can obtain information on the operation of the Public Reference Room, including information about duplicating fee charges, by calling 202 551 8090 or 800 732 0330, or by electronic request at the following email address: publicinfo@sec.gov. The SEC file numbers for the Fund are shown below.
A description of the policies and procedures that the Fund uses to determine how to vote proxies relating to portfolio securities is available without charge, upon request, from our Client Services department at 800 959 4246 or at invesco.com/proxyguidelines. The information is also available on the SEC website, sec.gov.
Information regarding how the Fund voted proxies related to its portfolio securities during the most recent 12-month period ended June 30 is available at invesco.com/proxysearch. The information is also available on the SEC website, sec.gov. Invesco Advisers, Inc. is an investment adviser; it provides investment advisory services to individual and institutional clients and does not sell securities. Invesco Distributors, Inc. is the US distributor for Invesco Ltd.’s retail mutual funds, exchange-traded funds and institutional money market funds. Both are wholly owned, indirect subsidiaries of Invesco Ltd. |  |
| SEC file numbers: 811-06463 and 033-44611 | GLG-AR-1 | Invesco Distributors, Inc. |
| ||||
 | Annual Report to Shareholders
| October 31, 2013 | ||
| ||||
Invesco Global Opportunities Fund
| ||||
| Nasdaq: | ||||
| A: IAOPX n C: ICOPX n R: IROPX n Y: IYOPX n R5: IIOPX n R6: IFOPX | ||||
Letters to Shareholders
Philip Taylor | Dear Shareholders: Enclosed in this annual report, you’ll find information about your Fund and the factors that affected its performance during the reporting period. Inside, you’ll also find a discussion from your portfolio managers about how they managed your Fund, as well as performance data for your Fund, a complete list of your Fund’s investments as of the close of the reporting period and other important information. I hope you find this report of interest. During the reporting period covered by this report, major US equity indexes made multiyear or even all-time highs.1 Economic data were generally positive; housing and consumer spending data were particularly encouraging. Nonetheless, economic uncertainty and concern about continuing political and budget gridlock in Washington persisted. The US Federal Reserve’s deliberate vagueness about when, and to what degree, it might begin to curtail its extraordinarily |

accommodative monetary policies affected fixed income and equity markets alike. Most developed, non-US stock markets remained positive for the first half of 2013, despite a difficult second quarter.
Periods of market volatility and economic uncertainty can weaken the will of even the most resolute investor. That’s why Invesco believes it’s often helpful to work with a skilled and trusted financial adviser who can emphasize the importance of adhering to an investment plan designed to achieve long-term goals rather than being sidetracked by short-term uncertainty that can result in inaction. A financial adviser who is familiar with your individual financial situation, investment goals and risk tolerance can be an invaluable partner as you work toward your financial goals. He or she can provide insight and perspective when markets are volatile; encouragement and reassurance when times are uncertain; and advice and guidance when your financial situation or investment goals change.
Our website, invesco.com/us, is another source of timely insight and information for investors. On the website, you’ll find fund-specific as well as more general information from many of Invesco’s investment professionals. You’ll find in-depth articles, video clips and audio commentaries – and, of course, you also can access information about your Invesco account whenever it’s convenient for you.
What we mean by Intentional Investing
At Invesco, all of our people and all of our resources are dedicated to helping investors achieve their financial objectives. It’s a philosophy we call Intentional Investing, and it guides the way we:
| n | Manage investments - Our dedicated investment professionals search the world for the best opportunities, and each investment team follows a clear, disciplined process to build portfolios and mitigate risk. |
| n | Provide choices - We offer multiple investment strategies, allowing you and your financial adviser to build a portfolio that’s purpose-built for your needs. |
| n | Connect with you - We’re committed to giving you the expert insights you need to make informed investing decisions, and we are well-equipped to provide high-quality support for investors and advisers. |
At Invesco, we believe in putting investors first. That’s why investment management is all we do. Our sole focus on managing your money allows you and your financial adviser to build a portfolio of Invesco funds appropriate for your investment needs and goals today and when your circumstances change.
Have questions?
For questions about your account, feel free to contact an Invesco client services representative at 800 959 4246. For Invesco-related questions or comments, please email me directly at phil@invesco.com.
All of us at Invesco look forward to serving your investment management needs for many years to come. Thank you for investing with us.
Sincerely,

Philip Taylor
Senior Managing Director, Invesco Ltd.
1 Source: Reuters
2 Invesco Global Opportunities Fund
Bruce Crockett | Dear Fellow Shareholders: The Invesco Funds Board has worked on a variety of issues over the last several months, and I’d like to take this opportunity to discuss two that affect you and our fellow fund shareholders. The first issue on which your Board has been working is our annual review of the funds’ advisory and sub-advisory contracts with Invesco Advisers and its affiliates. This annual review, which is required by the Investment Company Act of 1940, focuses on the nature and quality of the services Invesco provides as adviser to the Invesco Funds and the reasonableness of the fees that it charges for those services. Each year, we spend months reviewing detailed information that we request from Invesco that allows us to evaluate its services and fees. We also use information from many independent sources, including materials provided by the independent Senior Officer of the Invesco Funds, who reports directly to the independent |

Trustees on the Board. Additionally, we meet with independent legal counsel and review performance and fee data prepared by Lipper Inc., an independent, third-party firm widely recognized as a leader in its field.
I’m pleased to report that the Board determined in June that renewing the investment advisory agreement and the sub-advisory contracts with Invesco Advisers and its affiliates would serve the best interests of each fund and its shareholders.
The second area of focus to highlight is the Board’s efforts to ensure that we provide a lineup of funds that allow financial advisers to build portfolios that meet shareholders’ changing financial needs and goals. Today, more and more investors are reaching, or approaching, retirement. But interest rates remain low, making it difficult for many investors to generate the income they need, or will soon need, in their retirement years.
The members of your Board think about these things, too, and we’ve worked with Invesco Advisers to provide more income-generating options in the Invesco Funds lineup to help shareholders potentially meet their income needs. Your Board recently approved changes to three existing equity mutual funds, increasing their focus on generating income while also seeking to provide long-term growth of capital.
As a result of these changes, the funds and their respective management teams now have more flexibility to invest in the types of securities that could meet investors’ growing need for income generation, and in some cases, also help investors diversify their sources of income. These equity funds complement an array of fixed-income, asset allocation and alternative investment options in the Invesco Funds lineup designed to accommodate a variety of risk tolerances.
Be assured that your Board will continue working on behalf of fund shareholders, keeping your needs and interests uppermost in our minds.
As always, please contact me at bruce@brucecrockett.com with any questions or concerns you may have. On behalf of the Board, we look forward to continuing to represent your interests and serving your needs.
Sincerely,

Bruce L. Crockett
Independent Chair
Invesco Funds Board of Trustees
3 Invesco Global Opportunities Fund
Management’s Discussion of Fund Performance
Performance summary
For the reporting period ended October 31, 2013, the Fund, at net asset value (NAV), outperformed the MSCI All Country World Index and the Lipper Global Large-Cap Core Funds Index, the Fund’s broad market/style-specific and peer group indexes, respectively. Drivers of Fund performance were largely stock specific. Stock selection in Europe, particularly in the consumer discretionary and financials sectors, was strong.
Your Fund’s long-term performance appears later in this report.
Fund vs. Indexes
Total returns, 10/31/12 to 10/31/13, at net asset value (NAV). Performance shown does not include applicable contingent deferred sales charges (CDSC) or front-end sales charges, which would have reduced performance.
| Class A Shares | 40.94 | % | |||
| Class C Shares | 39.85 | ||||
| Class R Shares | 40.59 | ||||
| Class Y Shares | 41.21 | ||||
| Class R5 Shares | 41.21 | ||||
| Class R6 Shares | 41.34 | ||||
| MSCI All Country World Index‚ (Broad Market/Style-Specific Index) | 23.29 | ||||
| Lipper Global Large-Cap Core Funds Index‚ (Peer Group Index) | 26.61 | ||||
| Source(s): ‚Lipper Inc. |
How we invest
The Fund is driven by high conviction, unconstrained stock selection. In managing the Fund, our primary focus is to seek out the best investment ideas from around the world, building a concentrated portfolio of stocks that we believe has the potential to deliver attractive returns over the long term. We seek to invest in companies that are trading below our view of their intrinsic value, sustainably growing their business and generating returns above their cost of capital – or that have the potential to do so.
The Fund’s research process is a fundamentally driven bottom-up approach focused on valuation, complemented by top-down considerations. Initial stock ideas originate with multiple sources including Invesco Perpetual’s regional equity investment teams, market screens, brokerage houses, independent research firms and company visits.† Stock ideas are then subject to further fundamental analysis to assess the attractiveness of long-term valuation. This analysis focuses on three specific areas: financials; company management;
and macroeconomic/industry considerations. The objective of financial analysis is to assess the financial stability and future prospects of a company. Significant time is spent trying to understand the outlook for revenues, margins, return on capital and cash generation. Meetings with company management are a critical component of the proprietary research process, allowing us an opportunity to challenge management assumptions and forecasts, assess the quality of the management team and identify the difference between short-term consensus expectations and what the company expects to achieve in the long term. When evaluating a company, we consider how the economic environment might impact its cost structure and revenue stream. We believe that understanding the economic environment and industry dynamics within which a stock operates is crucial to making sound judgments on valuation.
We typically consider selling a security in any of four circumstances:
| n | A more attractive investment opportunity is identified. |
| n | The full value of the investment is deemed to have been realized. |
| n | There has been a fundamental negative change in the management strategy of the company. |
| n | There has been a fundamental negative change in the competitive environment. |
Portfolio Composition | |||||
By sector
| |||||
| Industrials | 17.3 | % | |||
| Consumer Discretionary | 17.1 | ||||
| Financials | 16.8 | ||||
| Information Technology | 16.0 | ||||
| Health Care | 11.3 | ||||
| Consumer Staples | 6.6 | ||||
| Materials | 5.5 | ||||
| Energy | 3.9 | ||||
| Telecommunication Services | 1.7 | ||||
Money Market Funds Plus Other Assets Less Liabilities | 3.8 |
Top 10 Equity Holdings* | |||||
| 1. Thomas Cook Group PLC | 6.1 | % | |||
| 2. Citigroup Inc. | 5.0 | ||||
| 3. Novartis AG | 4.2 | ||||
| 4. McGraw Hill Financial, Inc. | 4.2 | ||||
| 5. Roche Holding AG | 4.0 | ||||
| 6. SAP AG | 3.8 | ||||
| 7. JPMorgan Chase & Co. | 3.2 | ||||
| 8. Microsoft Corp. | 3.0 | ||||
| 9. Abbott Laboratories | 3.0 | ||||
| 10. Beiersdorf AG | 3.0 |
Top Five Countries* | |||||
| 1. United States | 31.8 | % | |||
| 2. United Kingdom | 26.4 | ||||
| 3. Switzerland | 8.3 | ||||
| 4. Germany | 6.8 | ||||
| 5. Spain | 5.1 |
| Total Net Assets | $17.7 million | ||||
| Total Number of Holdings* | 39 | ||||
The Fund’s holdings are subject to change, and there is no assurance that the Fund will continue to hold any particular security.
*Excluding money market fund holdings.
4 Invesco Global Opportunities Fund
Market conditions and your Fund
The fiscal year ended October 31, 2013, saw slow but steady improvement in the US economy and strong US and global equity market returns. Major US and global stock market indexes rose throughout 2013, hitting multiyear or all-time highs.1 Equity markets focused more on longer term fundamentals, rather than short-term volatility driven by negative fiscal policy-related headline events. In the meantime, economic sentiment in Europe improved. Strong macroeconomic data and a continued reduction in political uncertainty which had characterized much of 2012 buoyed European equity markets as the reporting period progressed. The rally was led by banks, the peripheral economies and domestic European plays.
From late May through June, capital markets declined following US Federal Reserve (the Fed) Chairman Ben Bernanke’s comments suggesting the time had come to begin reducing the Fed’s extraordinary stimulus policies. This news, combined with data showing a slowdown in China’s economy, led to a sharp correction in non-US stocks from their mid-May peak. The hardest-hit segments of the market were interest rate-sensitive and commodity-related sectors, as well as emerging markets. Markets stabilized in mid-summer, and despite some volatility in August surrounding a potential US military reaction to instability in Syria, they generally moved higher through the end of the fiscal year.
The Fund benefited from its relatively high exposure to Europe generally, and more specifically to the consumer discretionary and industrials sectors. Also contributing to performance was stock selection in the financials sector and the Fund’s exposure to Japan.
The largest contributors to performance were undervalued “compounders,” a group of high quality companies that have the ability to generate earnings growth, which are subsequently reinvested to generate further earnings, “compounding” returns over time. The market has reappraised their valuation as these companies have continued to meet or exceed expectations.
The single biggest contributor to performance during the reporting period was UK-based tour promoter Thomas Cook Group, which surged from recent lows as the company implemented an aggressive restructuring plan that began to deliver strong results during the reporting period, with higher operating performance and profit estimates.
Resolution, a UK-based life insurer, is another turnaround story that contributed to Fund performance. The company has undergone significant changes including moving away from acquisitions, adding new business and implementing a simplified governance structure and enhanced shareholder information. Swiss pharmaceutical rivals Roche Holding and Novartis both contributed to performance as markets favored long-term compounders.
Over the reporting period, developing markets, particularly in Asia, under-performed developed markets due to narrowing differentials in the growth rates of gross domestic product. In addition, the threat of tapering asset purchases by the Fed created market volatility, particularly in emerging markets. The largest detractors from Fund performance included stocks from developing Asia, such as Daphne International Holdings, Hon Hai Precision and YGM Trading. We sold our positions in Daphne International Holdings and Hon Hai Precision before the close of the reporting period.
We seek companies with sound fundamentals, good management, strong balance sheets and attractive valuations, regardless of their location. As bottom-up stock pickers, we seek out the most attractive and compelling investment opportunities from around the world, unconstrained by limitations on market capitalization, style or sector. We will continue to do so.
We thank you for your investment in Invesco Global Opportunities Fund.
| 1 | Source: Reuters |
| † | Invesco Perpetual is a business name of Invesco Asset Management Limited (IAML), an investment adviser. Invesco Distributors, Inc., Invesco Advisers, Inc. and IAML are each wholly owned, indirect subsidiaries of Invesco Ltd. |
The views and opinions expressed in management’s discussion of Fund performance are those of Invesco Advisers, Inc. These views and opinions are subject to change at any time based on factors such as market and economic conditions. These views and opinions may not be relied upon as investment advice or recommendations, or as an offer for a particular security. The information is not a complete analysis of every aspect of any market, country, industry, security or the Fund. Statements of fact are from sources considered reliable, but Invesco Advisers, Inc. makes no representation or warranty as to their completeness or accuracy. Although historical performance is no guarantee of future results, these insights may help you understand our investment management philosophy.
See important Fund and, if applicable, index disclosures later in this report.
 | Stephen Anness Portfolio manager, is manager of Invesco Global Opportunities Fund. He joined Invesco in 2002. | |
| Mr. Anness earned a BSc in economics from the University of Swansea, the Securities Institute Diploma and the Investment Management Certificate. | ||
5 Invesco Global Opportunities Fund
Your Fund’s Long-Term Performance
Results of a $10,000 Investment – Oldest Share Class(es) since Inception
Fund data from 8/3/12; index data from 7/31/12
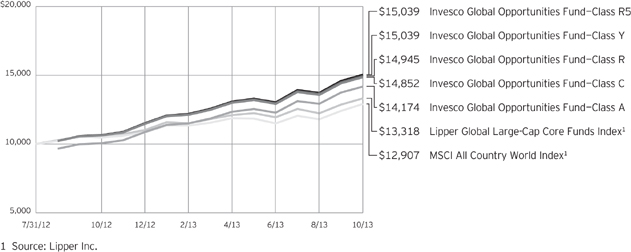
Past performance cannot guarantee comparable future results.
The data shown in the chart include reinvested distributions, applicable sales charges and Fund expenses including
management fees. Index results include reinvested dividends, but they do not reflect sales charges. Performance of the peer group, if applicable, reflects fund expenses and management fees;
performance of a market index does not. Performance shown in the chart and table(s) does not reflect deduction of taxes a shareholder would pay on Fund distributions or sale of Fund shares.
6 Invesco Global Opportunities Fund
| Average Annual Total Returns | |||||
As of 10/31/13, including maximum applicable sales charges
|
| ||||
| Class A Shares | |||||
| Inception (8/3/12) | 32.37 | % | |||
| 1 Year | 33.18 | ||||
| Class C Shares | |||||
| Inception (8/3/12) | 37.44 | % | |||
| 1 Year | 38.85 | ||||
| Class R Shares | |||||
| Inception (8/3/12) | 38.13 | % | |||
| 1 Year | 40.59 | ||||
| Class Y Shares | |||||
| Inception (8/3/12) | 38.83 | % | |||
| 1 Year | 41.21 | ||||
| Class R5 Shares | |||||
| Inception (8/3/12) | 38.83 | % | |||
| 1 Year | 41.21 | ||||
| Class R6 Shares | |||||
| Inception | 38.83 | % | |||
| 1 Year | 41.34 | ||||
Class R6 shares incepted on September 24, 2012. Performance shown prior to that date is that of Class A shares and includes the 12b-1 fees applicable to Class A shares. Class A share performance reflects any applicable fee waivers or expense reimbursements.
The performance data quoted represent past performance and cannot guarantee comparable future results; current performance may be lower or higher. Please visit invesco.com/performance for the most recent month-end performance. Performance figures reflect reinvested distributions, changes in net asset value and the effect of the maximum sales charge unless otherwise stated. Investment return and principal value will fluctuate so that you may have a gain or loss when you sell shares.
The net annual Fund operating expense ratio set forth in the most recent Fund prospectus as of the date of this report for Class A, Class C, Class R, Class Y, Class R5 and Class R6 shares was 1.36%, 2.11%, 1.61%, 1.11%, 1.11% and 1.11%, respectively.1 The total annual Fund operating expense ratio set forth in the most recent Fund prospectus as of the date of this report for Class A, Class C, Class R, Class Y, Class R5 and Class R6 shares was 3.49%, 4.24%, 3.74%, 3.24%, 3.11% and 3.07%, respec-
| Average Annual Total Returns | |||||
| As of 9/30/13, the most recent calendar quarter end, including maximum applicable sales charges | |||||
| Class A Shares | |||||
| Inception (8/3/12) | 31.59 | % | |||
| 1 Year | 29.97 | ||||
| Class C Shares | |||||
| Inception (8/3/12) | 37.06 | % | |||
| 1 Year | 35.45 | ||||
| Class R Shares | |||||
| Inception (8/3/12) | 37.73 | % | |||
| 1 Year | 37.10 | ||||
| Class Y Shares | |||||
| Inception (8/3/12) | 38.50 | % | |||
| 1 Year | 37.86 | ||||
| Class R5 Shares | |||||
| Inception (8/3/12) | 38.50 | % | |||
| 1 Year | 37.86 | ||||
| Class R6 Shares | |||||
| Inception | 38.42 | % | |||
| 1 Year | 37.89 | ||||
tively. The expense ratios presented above may vary from the expense ratios presented in other sections of this report that are based on expenses incurred during the period covered by this report.
Class A share performance reflects the maximum 5.50% sales charge, and Class C share performance reflects the applicable contingent deferred sales charge (CDSC) for the period involved. The CDSC on Class C shares is 1% for the first year after purchase. Class R, Class Y, Class R5 and Class R6 class shares do not have a front-end sales charge or a CDSC; therefore, performance is at net asset value.
The performance of the Fund’s share classes will differ primarily due to different sales charge structures and class expenses.
Had the adviser not waived fees and/ or reimbursed expenses, performance would have been lower.
| 1 | Total annual Fund operating expenses after any contractual fee waivers and/or expense reimbursements by the adviser in effect through at least February 28, 2014. See current prospectus for more information. |
7 Invesco Global Opportunities Fund
Invesco Global Opportunities Fund’s investment objective is long-term growth of capital.
| n | Unless otherwise stated, information presented in this report is as of October 31, 2013, and is based on total net assets. |
| n | Unless otherwise noted, all data provided by Invesco. |
| n | To access your Fund’s reports/prospectus, visit invesco.com/fundreports. |
About share classes
| n | Class R shares are generally available only to employer sponsored retirement and benefit plans. Please see the prospectus for more information. |
| n | Class Y shares are available only to certain investors. Please see the prospectus for more information. |
| n | Class R5 shares and Class R6 shares are primarily intended for employer sponsored retirement and benefit plans that meet certain standards and for institutional investors. On September 24, 2012, Institutional Class shares were renamed Class R5 shares. Please see the prospectus for more information. |
Principal risks of investing in the Fund
| n | Developing/emerging markets securities risk. The prices of securities issued by foreign companies and governments located in developing/emerging markets countries may be affected more negatively by inflation, devaluation of their currencies, higher transaction costs, delays in settlement, adverse political developments, the introduction of capital controls, withholding taxes, nationalization of private assets, expropriation, social unrest, war or lack of timely information than those in developed countries. |
| n | Foreign securities risk. The Fund’s foreign investments may be affected by changes in a foreign country’s exchange rates, political and social instability, changes in economic or taxation policies, difficulties when enforcing obligations, decreased liquidity, and increased volatility. Foreign companies may be subject to less regulation resulting in less publicly available information about the companies. |
| n | Management risk. The investment techniques and risk analysis used by the Fund’s portfolio managers may not produce the desired results. |
| n | Market risk. The prices of and the income generated by the Fund’s securities may decline in response to, among other things, investor sentiment, general economic and market conditions, regional or global instability, and currency and interest rate fluctuations. |
| n | Small- and mid-capitalization risk. Stocks of small- and mid-sized companies tend to be more vulnerable to adverse developments and may have little or no operating history or track record of success, and limited product lines, markets, management and financial resources. The securities of small- and mid-sized companies may be more volatile due to less market interest and less publicly available information about the issuer. They also may be illiquid or restricted as to resale, or may trade less frequently and in smaller volumes, all of which may cause difficulty when establishing or closing a position at a desirable price. |
About indexes used in this report
| n | The MSCI All Country World Index is an index considered representative of stock markets of developed and emerging markets. The index is computed using the net return, which withholds applicable taxes for non-resident investors. |
| n | The Lipper Global Large-Cap Core Funds Index is an unmanaged index considered representative of global large-cap core funds tracked by Lipper. |
| n | The Fund is not managed to track the performance of any particular index, including the index(es) described here, and consequently, the performance of the Fund may deviate significantly from the performance of the index(es). |
| n | A direct investment cannot be made in an index. Unless otherwise indicated, index results include reinvested dividends, and they do not reflect sales charges. Performance of the peer group, if applicable, reflects fund expenses; performance of a market index does not. |
Other information
| n | The returns shown in management’s discussion of Fund performance are based on net asset values calculated for shareholder transactions. Generally accepted accounting principles require adjustments to be made to the net assets of the Fund at period end for financial reporting purposes, and as such, the net asset values for shareholder transactions and the returns based on those net asset values may differ from the net asset values and returns reported in the Financial Highlights. |
| n | Industry classifications used in this report are generally according to the Global Industry Classification Standard, which was developed by and is the exclusive property and a service mark of MSCI Inc. and Standard & Poor’s. |
This report must be accompanied or preceded by a currently effective Fund prospectus, which contains more complete information, including sales charges and expenses. Investors should read it carefully before investing.
NOT FDIC INSURED | MAY LOSE VALUE | NO BANK GUARANTEE
Fund Nasdaq Symbols
| |||||
Class A Shares | IAOPX | ||||
Class C Shares | ICOPX | ||||
Class R Shares | IROPX | ||||
Class Y Shares | IYOPX | ||||
Class R5 Shares | IIOPX | ||||
Class R6 Shares | IFOPX | ||||
8 Invesco Global Opportunities Fund
Schedule of Investments
October 31, 2013
| Shares | Value | |||||||
Common Stocks & Other Equity Interests–96.19% |
| |||||||
| Australia–2.94% | ||||||||
Rio Tinto Ltd. | 8,609 | $ | 520,702 | |||||
| Cambodia–1.50% | ||||||||
NagaCorp Ltd. | 288,000 | 265,972 | ||||||
| China–3.08% | ||||||||
Baidu, Inc.–ADR(a) | 1,556 | 250,360 | ||||||
NetEase, Inc.–ADR | 4,357 | 294,141 | ||||||
| 544,501 | ||||||||
| France–2.07% | ||||||||
Safran S.A. | 5,725 | 365,584 | ||||||
| Germany–6.80% | ||||||||
Beiersdorf AG | 5,524 | 526,375 | ||||||
SAP AG | 8,610 | 676,372 | ||||||
| 1,202,747 | ||||||||
| Hong Kong–4.94% | ||||||||
Hutchison Whampoa Ltd. | 33,000 | 411,170 | ||||||
Samsonite International S.A. | 120,300 | 328,951 | ||||||
YGM Trading Ltd. | 60,000 | 133,884 | ||||||
| 874,005 | ||||||||
| Japan–2.62% | ||||||||
Sumitomo Mitsui Financial Group, Inc. | 4,500 | 216,737 | ||||||
Toyota Motor Corp. | 3,800 | 246,547 | ||||||
| 463,284 | ||||||||
| Netherlands–2.05% | ||||||||
Nutreco N.V. | 7,388 | 362,258 | ||||||
| South Korea–2.32% | ||||||||
Samsung Electronics Co., Ltd. | 296 | 410,175 | ||||||
| Spain–5.12% | ||||||||
Indra Sistemas, S.A. | 18,762 | 310,008 | ||||||
Mediaset Espana Comunicacion S.A.(a) | 18,871 | 230,591 | ||||||
Obrascon Huarte Lain, S.A. | 8,689 | 364,194 | ||||||
| 904,793 | ||||||||
| Switzerland–8.25% | ||||||||
Novartis AG | 9,643 | 747,459 | ||||||
Roche Holding AG | 2,576 | 711,757 | ||||||
| 1,459,216 | ||||||||
| Shares | Value | |||||||
| United Kingdom–26.36% | ||||||||
BAE Systems PLC | 48,992 | $ | 356,811 | |||||
BG Group PLC | 22,216 | 452,557 | ||||||
Booker Group PLC | 116,005 | 278,579 | ||||||
BT Group PLC | 49,028 | 297,075 | ||||||
DS Smith PLC | 92,496 | 448,170 | ||||||
HSBC Holdings PLC | 47,200 | 520,217 | ||||||
International Consolidated Airlines Group S.A.(a) | 55,912 | 310,488 | ||||||
Rentokil Initial PLC | 253,583 | 424,865 | ||||||
Resolution Ltd. | 85,040 | 487,296 | ||||||
Thomas Cook Group PLC(a) | 471,495 | 1,085,692 | ||||||
| 4,661,750 | ||||||||
| United States–28.14% | ||||||||
Abbott Laboratories | 14,521 | 530,743 | ||||||
Apache Corp. | 2,733 | 242,690 | ||||||
Citigroup Inc. | 18,233 | 889,406 | ||||||
Google Inc.–Class A(a) | 349 | 359,672 | ||||||
JPMorgan Chase & Co. | 11,133 | 573,795 | ||||||
McGraw Hill Financial, Inc. | 10,598 | 738,469 | ||||||
Microsoft Corp. | 15,038 | 531,593 | ||||||
United Technologies Corp. | 3,678 | 390,788 | ||||||
WESCO International, Inc.(a) | 5,151 | 440,204 | ||||||
World Acceptance Corp.(a) | 2,685 | 279,562 | ||||||
| 4,976,922 | ||||||||
Total Common Stocks & Other Equity Interests |
| 17,011,909 | ||||||
Money Market Funds–3.65% |
| |||||||
Liquid Assets Portfolio–Institutional Class(b) | 323,073 | 323,073 | ||||||
Premier Portfolio–Institutional Class(b) | 323,074 | 323,074 | ||||||
Total Money Market Funds |
| 646,147 | ||||||
TOTAL INVESTMENTS–99.84% |
| 17,658,056 | ||||||
OTHER ASSETS LESS LIABILITIES–0.16% |
| 28,968 | ||||||
NET ASSETS–100.00% |
| $ | 17,687,024 | |||||
Investment Abbreviations:
| ADR | – American Depositary Receipt |
Notes to Schedule of Investments:
| (a) | Non-income producing security. |
| (b) | The money market fund and the Fund are affiliated by having the same investment adviser. |
See accompanying Notes to Financial Statements which are an integral part of the financial statements.
9 Invesco Global Opportunities Fund
Statement of Assets and Liabilities
October 31, 2013
Assets: |
| |||
Investments, at value (Cost $14,874,721) | $ | 17,011,909 | ||
Investments in affiliated money market funds, at value and cost | 646,147 | |||
Total investments, at value (Cost $15,520,868) | 17,658,056 | |||
Receivable for: | ||||
Investments sold | 537,826 | |||
Fund shares sold | 71,991 | |||
Dividends | 31,489 | |||
Investment for trustee deferred compensation and retirement plans | 5,814 | |||
Other assets | 28,209 | |||
Total assets | 18,333,385 | |||
Liabilities: |
| |||
Payable for: | ||||
Investments purchased | 536,168 | |||
Fund shares reacquired | 37,797 | |||
Accrued fees to affiliates | 22,574 | |||
Accrued trustees’ and officers’ fees and benefits | 2,021 | |||
Accrued other operating expenses | 41,987 | |||
Trustee deferred compensation and retirement plans | 5,814 | |||
Total liabilities | 646,361 | |||
Net assets applicable to shares outstanding | $ | 17,687,024 | ||
Net assets consist of: |
| |||
Shares of beneficial interest | $ | 14,924,556 | ||
Undistributed net investment income | 80,387 | |||
Undistributed net realized gain | 544,200 | |||
Net unrealized appreciation | 2,137,881 | |||
| $ | 17,687,024 | |||
Net Assets: |
| |||
Class A | $ | 10,912,489 | ||
Class C | $ | 1,291,755 | ||
Class R | $ | 40,003 | ||
Class Y | $ | 5,413,929 | ||
Class R5 | $ | 14,958 | ||
Class R6 | $ | 13,890 | ||
Shares outstanding, $0.001 par value per share, |
| |||
Class A | 732,456 | |||
Class C | 87,515 | |||
Class R | 2,693 | |||
Class Y | 362,292 | |||
Class R5 | 1,001 | |||
Class R6 | 930 | |||
Class A: | ||||
Net asset value per share | $ | 14.90 | ||
Maximum offering price per share | ||||
(Net asset value of $14.90 ¸ 94.50%) | $ | 15.77 | ||
Class C: | ||||
Net asset value and offering price per share | $ | 14.76 | ||
Class R: | ||||
Net asset value and offering price per share | $ | 14.85 | ||
Class Y: | ||||
Net asset value and offering price per share | $ | 14.94 | ||
Class R5: | ||||
Net asset value and offering price per share | $ | 14.94 | ||
Class R6: | ||||
Net asset value and offering price per share | $ | 14.94 | ||
See accompanying Notes to Financial Statements which are an integral part of the financial statements.
10 Invesco Global Opportunities Fund
Statement of Operations
For the year ended October 31, 2013
Investment income: |
| |||
Dividends (net of foreign withholding taxes of $10,038) | $ | 190,086 | ||
Dividends from affiliated money market funds | 197 | |||
Total investment income | 190,283 | |||
Expenses: | ||||
Advisory fees | 65,347 | |||
Administrative services fees | 50,000 | |||
Custodian fees | 27,336 | |||
Distribution fees: | ||||
Class A | 12,923 | |||
Class C | 3,536 | |||
Class R | 79 | |||
Transfer agent fees — A, C, R and Y | 10,070 | |||
Transfer agent fees — R5 | 13 | |||
Transfer agent fees — R6 | 12 | |||
Trustees’ and officers’ fees and benefits | 23,126 | |||
Filing fees | 111,507 | |||
Professional fees | 52,935 | |||
Other | 31,652 | |||
Total expenses | 388,536 | |||
Less: Fees waived and expense reimbursed | (281,667 | ) | ||
Net expenses | 106,869 | |||
Net investment income | 83,414 | |||
Realized and unrealized gain from: | ||||
Net realized gain from: | ||||
Investment securities | 546,514 | |||
Foreign currencies | 929 | |||
| 547,443 | ||||
Change in net unrealized appreciation of: | ||||
Investment securities | 1,935,533 | |||
Foreign currencies | 1,001 | |||
| 1,936,534 | ||||
Net realized and unrealized gain | 2,483,977 | |||
Net increase in net assets resulting from operations | $ | 2,567,391 | ||
See accompanying Notes to Financial Statements which are an integral part of the financial statements.
11 Invesco Global Opportunities Fund
Statement of Changes in Net Assets
For the year ended October 31, 2013 and the period August 3, 2012 (commencement date) through October 31, 2012
| October 31, 2013 | Period August 3, 2012 (commencement date) through October 31, 2012 | |||||||
Operations: | ||||||||
Net investment income | $ | 83,414 | $ | 7,250 | ||||
Net realized gain (loss) | 547,443 | (15,991 | ) | |||||
Change in net unrealized appreciation | 1,936,534 | 201,347 | ||||||
Net increase in net assets resulting from operations | 2,567,391 | 192,606 | ||||||
Distributions to shareholders from net investment income: | ||||||||
Class A | (11,076 | ) | — | |||||
Class C | (149 | ) | — | |||||
Class R | (70 | ) | — | |||||
Class Y | (10,751 | ) | — | |||||
Class R5 | (73 | ) | — | |||||
Class R6 | (67 | ) | — | |||||
Total distributions from net investment income | (22,186 | ) | — | |||||
Share transactions–net: | ||||||||
Class A | 7,678,774 | 1,562,957 | ||||||
Class C | 1,172,984 | 13,860 | ||||||
Class R | 24,088 | 10,010 | ||||||
Class Y | 2,981,520 | 1,485,010 | ||||||
Class R5 | — | 10,010 | ||||||
Class R6 | — | 10,000 | ||||||
Net increase in net assets resulting from share transactions | 11,857,366 | 3,091,847 | ||||||
Net increase in net assets | 14,402,571 | 3,284,453 | ||||||
Net assets: | ||||||||
Beginning of year | 3,284,453 | — | ||||||
End of year (includes undistributed net investment income of $80,387 and $18,231, respectively) | $ | 17,687,024 | $ | 3,284,453 | ||||
Notes to Financial Statements
October 31, 2013
NOTE 1—Significant Accounting Policies
Invesco Global Opportunities Fund (the “Fund”) is a series portfolio of AIM International Mutual Funds (Invesco International Mutual Funds) (the “Trust”). The Trust is a Delaware statutory trust registered under the Investment Company Act of 1940, as amended (the “1940 Act”), as an open-end series management investment company consisting of eight separate portfolios, each authorized to issue an unlimited number of shares of beneficial interest. The assets, liabilities and operations of each portfolio are accounted for separately. Information presented in these financial statements pertains only to the Fund. Matters affecting each portfolio or class will be voted on exclusively by the shareholders of such portfolio or class.
The Fund’s investment objective is long-term growth of capital.
The Fund currently consists of six different classes of shares: Class A, Class C, Class R, Class Y, Class R5 and Class R6. Class A shares are sold with a front-end sales charge unless certain waiver criteria are met and under certain circumstances load waiver shares may be subject to contingent deferred sales charges (“CDSC”). Class C shares are sold with a CDSC. Class R, Class Y, Class R5 and Class R6 shares are sold at net asset value.
The following is a summary of the significant accounting policies followed by the Fund in the preparation of its financial statements.
| A. | Security Valuations — Securities, including restricted securities, are valued according to the following policy. |
A security listed or traded on an exchange (except convertible bonds) is valued at its last sales price or official closing price as of the close of the customary trading session on the exchange where the security is principally traded, or lacking any sales or official closing price on a particular day, the security may be valued at the closing bid price on that day. Securities traded in the over-the-counter market are valued based on prices furnished by independent pricing services or market makers. When such securities are valued by an independent pricing service they may be considered fair valued. Futures contracts are valued at the final settlement price set by an exchange on which they are principally traded. Listed options are valued at the mean between the last bid and ask prices from the exchange on which they are principally traded. Options not listed on an exchange are valued by an independent source at the mean between the last bid and ask prices. For purposes of determining net asset value
12 Invesco Global Opportunities Fund
per share, futures and option contracts generally are valued 15 minutes after the close of the customary trading session of the New York Stock Exchange (“NYSE”).
Investments in open-end and closed-end registered investment companies that do not trade on an exchange are valued at the end of day net asset value per share. Investments in open-end and closed-end registered investment companies that trade on an exchange are valued at the last sales price or official closing price as of the close of the customary trading session on the exchange where the security is principally traded.
Debt obligations (including convertible bonds) and unlisted equities are fair valued using an evaluated quote provided by an independent pricing service. Evaluated quotes provided by the pricing service may be determined without exclusive reliance on quoted prices, and may reflect appropriate factors such as institution-size trading in similar groups of securities, developments related to specific securities, dividend rate (for unlisted equities), yield (for debt obligations), quality, type of issue, coupon rate (for debt obligations), maturity (for debt obligations), individual trading characteristics and other market data. Debt obligations are subject to interest rate and credit risks. In addition, all debt obligations involve some risk of default with respect to interest and/or principal payments.
Foreign securities’ (including foreign exchange contracts) prices are converted into U.S. dollar amounts using the applicable exchange rates as of the close of the NYSE. If market quotations are available and reliable for foreign exchange-traded equity securities, the securities will be valued at the market quotations. Because trading hours for certain foreign securities end before the close of the NYSE, closing market quotations may become unreliable. If between the time trading ends on a particular security and the close of the customary trading session on the NYSE, events occur that the Adviser determines are significant and make the closing price unreliable, the Fund may fair value the security. If the event is likely to have affected the closing price of the security, the security will be valued at fair value in good faith using procedures approved by the Board of Trustees. Adjustments to closing prices to reflect fair value may also be based on a screening process of an independent pricing service to indicate the degree of certainty, based on historical data, that the closing price in the principal market where a foreign security trades is not the current value as of the close of the NYSE. Foreign securities’ prices meeting the approved degree of certainty that the price is not reflective of current value will be priced at the indication of fair value from the independent pricing service. Multiple factors may be considered by the independent pricing service in determining adjustments to reflect fair value and may include information relating to sector indices, American Depositary Receipts and domestic and foreign index futures. Foreign securities may have additional risks including exchange rate changes, potential for sharply devalued currencies and high inflation, political and economic upheaval, the relative lack of issuer information, relatively low market liquidity and the potential lack of strict financial and accounting controls and standards.
Securities for which market prices are not provided by any of the above methods may be valued based upon quotes furnished by independent sources. The last bid price may be used to value equity securities. The mean between the last bid and asked prices is used to value debt obligations, including corporate loans.
Securities for which market quotations are not readily available or became unreliable are valued at fair value as determined in good faith by or under the supervision of the Trust’s officers following procedures approved by the Board of Trustees. Issuer specific events, market trends, bid/ask quotes of brokers and information providers and other market data may be reviewed in the course of making a good faith determination of a security’s fair value.
Valuations change in response to many factors including the historical and prospective earnings of the issuer, the value of the issuer’s assets, general economic conditions, interest rates, investor perceptions and market liquidity. Because of the inherent uncertainties of valuation, the values reflected in the financial statements may materially differ from the value received upon actual sale of those investments.
| B. | Securities Transactions and Investment Income — Securities transactions are accounted for on a trade date basis. Realized gains or losses on sales are computed on the basis of specific identification of the securities sold. Interest income is recorded on the accrual basis from settlement date. Dividend income (net of withholding tax, if any) is recorded on the ex-dividend date. |
The Fund may periodically participate in litigation related to Fund investments. As such, the Fund may receive proceeds from litigation settlements. Any proceeds received are included in the Statement of Operations as realized gain (loss) for investments no longer held and as unrealized gain (loss) for investments still held.
Brokerage commissions and mark ups are considered transaction costs and are recorded as an increase to the cost basis of securities purchased and/or a reduction of proceeds on a sale of securities. Such transaction costs are included in the determination of net realized and unrealized gain (loss) from investment securities reported in the Statement of Operations and the Statement of Changes in Net Assets and the net realized and unrealized gains (losses) on securities per share in the Financial Highlights. Transaction costs are included in the calculation of the Fund’s net asset value and, accordingly, they reduce the Fund’s total returns. These transaction costs are not considered operating expenses and are not reflected in net investment income reported in the Statement of Operations and Statement of Changes in Net Assets, or the net investment income per share and ratios of expenses and net investment income reported in the Financial Highlights, nor are they limited by any expense limitation arrangements between the Fund and the investment adviser.
The Fund allocates income and realized and unrealized capital gains and losses to a class based on the relative net assets of each class.
| C. | Country Determination — For the purposes of making investment selection decisions and presentation in the Schedule of Investments, the investment adviser may determine the country in which an issuer is located and/or credit risk exposure based on various factors. These factors include the laws of the country under which the issuer is organized, where the issuer maintains a principal office, the country in which the issuer derives 50% or more of its total revenues and the country that has the primary market for the issuer’s securities, as well as other criteria. Among the other criteria that may be evaluated for making this determination are the country in which the issuer maintains 50% or more of its assets, the type of security, financial guarantees and enhancements, the nature of the collateral and the sponsor organization. Country of issuer and/or credit risk exposure has been determined to be the United States of America, unless otherwise noted. |
| D. | Distributions — Distributions from income and net realized capital gain, if any, are generally declared and paid annually and recorded on the ex-dividend date. The Fund may elect to treat a portion of the proceeds from redemptions as distributions for federal income tax purposes. |
| E. | Federal Income Taxes — The Fund intends to comply with the requirements of Subchapter M of the Internal Revenue Code of 1986, as amended (the “Internal Revenue Code”), necessary to qualify as a regulated investment company and to distribute substantially all of the Fund’s taxable earnings to shareholders. As such, the Fund will not be subject to federal income taxes on otherwise taxable income (including net realized capital gain) that is distributed to shareholders. Therefore, no provision for federal income taxes is recorded in the financial statements. |
13 Invesco Global Opportunities Fund
The Fund files tax returns in the U.S. Federal jurisdiction and certain other jurisdictions. Generally, the Fund is subject to examinations by such taxing authorities for up to three years after the filing of the return for the tax period.
| F. | Expenses — Fees provided for under the Rule 12b-1 plan of a particular class of the Fund are charged to the operations of such class. Transfer agency fees and expenses and other shareholder recordkeeping fees and expenses attributable to Class R5 and Class R6 are allocated to each share class based on relative net assets. Sub-accounting fees attributable to Class R5 are charged to the operations of the class. Transfer agency fees and expenses and other shareholder recordkeeping fees and expenses relating to all other classes are allocated among those classes based on relative net assets. All other expenses are allocated among the classes based on relative net assets. |
| G. | Accounting Estimates — The preparation of financial statements in conformity with accounting principles generally accepted in the United States of America (“GAAP”) requires management to make estimates and assumptions that affect the reported amounts of assets and liabilities at the date of the financial statements and the reported amounts of revenues and expenses during the reporting period including estimates and assumptions related to taxation. Actual results could differ from those estimates by a significant amount. In addition, the Fund monitors for material events or transactions that may occur or become known after the period-end date and before the date the financial statements are released to print. |
| H. | Indemnifications — Under the Trust’s organizational documents, each Trustee, officer, employee or other agent of the Trust is indemnified against certain liabilities that may arise out of the performance of their duties to the Fund. Additionally, in the normal course of business, the Fund enters into contracts, including the Fund’s servicing agreements, that contain a variety of indemnification clauses. The Fund’s maximum exposure under these arrangements is unknown as this would involve future claims that may be made against the Fund that have not yet occurred. The risk of material loss as a result of such indemnification claims is considered remote. |
| I. | Foreign Currency Translations — Foreign currency is valued at the close of the NYSE based on quotations posted by banks and major currency dealers. Portfolio securities and other assets and liabilities denominated in foreign currencies are translated into U.S. dollar amounts at date of valuation. Purchases and sales of portfolio securities (net of foreign taxes withheld on disposition) and income items denominated in foreign currencies are translated into U.S. dollar amounts on the respective dates of such transactions. The Fund does not separately account for the portion of the results of operations resulting from changes in foreign exchange rates on investments and the fluctuations arising from changes in market prices of securities held. The combined results of changes in foreign exchange rates and the fluctuation of market prices on investments (net of estimated foreign tax withholding) are included with the net realized and unrealized gain or loss from investments in the Statement of Operations. Reported net realized foreign currency gains or losses arise from (1) sales of foreign currencies, (2) currency gains or losses realized between the trade and settlement dates on securities transactions, and (3) the difference between the amounts of dividends, interest, and foreign withholding taxes recorded on the Fund’s books and the U.S. dollar equivalent of the amounts actually received or paid. Net unrealized foreign currency gains and losses arise from changes in the fair values of assets and liabilities, other than investments in securities at fiscal period end, resulting from changes in exchange rates. |
The Fund may invest in foreign securities which may be subject to foreign taxes on income, gains on investments or currency repatriation, a portion of which may be recoverable.
| J. | Foreign Currency Contracts — The Fund may enter into foreign currency contracts to manage or minimize currency or exchange rate risk. The Fund may also enter into foreign currency contracts for the purchase or sale of a security denominated in a foreign currency in order to “lock in” the U.S. dollar price of that security. A foreign currency contract is an obligation to purchase or sell a specific currency for an agreed-upon price at a future date. The use of foreign currency contracts does not eliminate fluctuations in the price of the underlying securities the Fund owns or intends to acquire but establishes a rate of exchange in advance. Fluctuations in the value of these contracts are measured by the difference in the contract date and reporting date exchange rates and are recorded as unrealized appreciation (depreciation) until the contracts are closed. When the contracts are closed, realized gains (losses) are recorded. Realized and unrealized gains (losses) on the contracts are included in the Statement of Operations. The primary risks associated with foreign currency contracts include failure of the counterparty to meet the terms of the contract and the value of the foreign currency changing unfavorably. These risks may be in excess of the amounts reflected in the Statement of Assets and Liabilities. |
NOTE 2—Advisory Fees and Other Fees Paid to Affiliates
The Trust has entered into a master investment advisory agreement with Invesco Advisers, Inc. (the “Adviser” or “Invesco”). Under the terms of the investment advisory agreement, the Fund pays an advisory fee to the Adviser based on the annual rate of the Fund’s average daily net assets as follows:
| Average Daily Net Assets | Rate | |||||
First $250 million | 0 | .80% | ||||
Next $250 million | 0 | .78% | ||||
Next $500 million | 0 | .76% | ||||
Next $1.5 billion | 0 | .74% | ||||
Next $2.5 billion | 0 | .72% | ||||
Next $2.5 billion | 0 | .70% | ||||
Next $2.5 billion | 0 | .68% | ||||
Over $10 billion | 0 | .66% | ||||
Under the terms of a master sub-advisory agreement between the Adviser and each of Invesco Asset Management Deutschland GmbH, Invesco Asset Management Limited, Invesco Asset Management (Japan) Limited, Invesco Australia Limited, Invesco Hong Kong Limited, Invesco Senior Secured Management, Inc., Invesco Canada Ltd. and Invesco PowerShares Capital Management LLC (collectively, the “Affiliated Sub-Advisers”) the Adviser, not the Fund, may pay 40% of the fees paid to the Adviser to any such Affiliated Sub-Adviser(s) that provide(s) discretionary investment management services to the Fund based on the percentage of assets allocated to such Sub-Adviser(s).
14 Invesco Global Opportunities Fund
The Adviser has contractually agreed, through February 28, 2014, to waive advisory fees and/or reimburse expenses of all shares to the extent necessary to limit total annual fund operating expenses after fee waiver and/or expense reimbursement (excluding certain items discussed below) of Class A, Class C, Class R, Class Y, Class R5 and Class R6 shares to 1.36%, 2.11%, 1.61%, 1.11%, 1.11% and 1.11%, respectively, of average daily net assets. In determining the Adviser’s obligation to waive advisory fees and/or reimburse expenses, the following expenses are not taken into account, and could cause the total annual fund operating expenses after fee waiver and/or expense reimbursement to exceed the numbers reflected above: (1) interest; (2) taxes; (3) dividend expense on short sales; (4) extraordinary or non-routine items, litigation expenses; and (5) expenses that the Fund has incurred but did not actually pay because of an expense offset arrangement.
Further, the Adviser has contractually agreed, through June 30, 2014, to waive the advisory fee payable by the Fund in an amount equal to 100% of the net advisory fees the Adviser receives from the affiliated money market funds on investments by the Fund of uninvested cash in such affiliated money market funds.
For the year ended October 31, 2013, the Adviser waived advisory fees and reimbursed fund level expenses of $271,572 and reimbursed class level expenses of $6,392, $437, $20, $3,221, $13 and $12 for Class A, Class C, Class R, Class Y, Class R5 and Class R6 shares, respectively.
The Trust has entered into a transfer agency and service agreement with Invesco Investment Services, Inc. (“IIS”) pursuant to which the Fund has agreed to pay IIS a fee for providing transfer agency and shareholder services to the Fund and reimburse IIS for certain expenses incurred by IIS in the course of providing such services. IIS may make payments to intermediaries that provide omnibus account services, sub-accounting services and/or networking services. All fees payable by IIS to intermediaries that provide omnibus account services or sub-accounting are charged back to the Fund, subject to certain limitations approved by the Trust’s Board of Trustees. For the year ended October 31, 2013, expenses incurred under the agreement are shown in the Statement of Operations as Transfer agent fees.
The Trust has entered into a master administrative services agreement with Invesco pursuant to which the Fund has agreed to pay Invesco for certain administrative costs incurred in providing accounting services to the Fund. For the year ended October 31, 2013, expenses incurred under the agreement are shown in the Statement of Operations as Administrative services fees.
The Trust has entered into master distribution agreements with Invesco Distributors, Inc. (“IDI”) to serve as the distributor for the Class A, Class C, Class R, Class Y, Class R5 and Class R6 shares of the Fund. The Trust has adopted plans pursuant to Rule 12b-1 under the 1940 Act with respect to the Fund’s Class A, Class C and Class R shares (collectively, the “Plans”). The Fund, pursuant to the Plans, pays IDI compensation at the annual rate of 0.25% of the Fund’s average daily net assets of Class A shares, 1.00% of the average daily net assets of Class C shares and 0.50% of the average daily net assets of Class R shares. Of the Plan payments, up to 0.25% of the average daily net assets of each class of shares may be paid to furnish continuing personal shareholder services to customers who purchase and own shares of such classes. Any amounts not paid as a service fee under the Plans would constitute an asset-based sales charge. Rules of the Financial Industry Regulatory Authority (“FINRA”) impose a cap on the total sales charges, including asset-based sales charges, that may be paid by any class of shares of the Fund. For the year ended October 31, 2013, expenses incurred under the Plans are shown in the Statement of Operations as Distribution fees.
Front-end sales commissions and CDSC (collectively, the “sales charges”) are not recorded as expenses of the Fund. Front-end sales commissions are deducted from proceeds from the sales of Fund shares prior to investment in Class A shares of the Fund. CDSC are deducted from redemption proceeds prior to remittance to the shareholder. During the year ended October 31, 2013, IDI advised the Fund that IDI retained $10,484 in front-end sales commissions from the sale of Class A shares and $8 from Class C shares for CDSC imposed upon redemptions by shareholders.
Certain officers and trustees of the Trust are officers and directors of the Adviser, IIS and/or IDI.
NOTE 3—Additional Valuation Information
GAAP defines fair value as the price that would be received to sell an asset or paid to transfer a liability in an orderly transaction between market participants at the measurement date, under current market conditions. GAAP establishes a hierarchy that prioritizes the inputs to valuation methods, giving the highest priority to readily available unadjusted quoted prices in an active market for identical assets (Level 1) and the lowest priority to significant unobservable inputs (Level 3), generally when market prices are not readily available or are unreliable. Based on the valuation inputs, the securities or other investments are tiered into one of three levels. Changes in valuation methods may result in transfers in or out of an investment’s assigned level:
| Level 1 — | Prices are determined using quoted prices in an active market for identical assets. |
| Level 2 — | Prices are determined using other significant observable inputs. Observable inputs are inputs that other market participants may use in pricing a security. These may include quoted prices for similar securities, interest rates, prepayment speeds, credit risk, yield curves, loss severities, default rates, discount rates, volatilities and others. |
| Level 3 — | Prices are determined using significant unobservable inputs. In situations where quoted prices or observable inputs are unavailable (for example, when there is little or no market activity for an investment at the end of the period), unobservable inputs may be used. Unobservable inputs reflect the Fund’s own assumptions about the factors market participants would use in determining fair value of the securities or instruments and would be based on the best available information. |
The following is a summary of the tiered valuation input levels, as of October 31, 2013. The level assigned to the securities valuations may not be an indication of the risk or liquidity associated with investing in those securities. Because of the inherent uncertainties of valuation, the values reflected in the financial statements may materially differ from the value received upon actual sale of those investments.
15 Invesco Global Opportunities Fund
During the year ended October 31, 2013, there were transfers from Level 1 to Level 2 of $1,860,061 and from Level 2 to Level 1 of $931,387, due to foreign fair value adjustments.
| Level 1 | Level 2 | Level 3 | Total | |||||||||||||
Australia | $ | 520,702 | $ | — | $ | — | $ | 520,702 | ||||||||
Cambodia | 265,972 | — | — | 265,972 | ||||||||||||
China | 544,501 | — | — | 544,501 | ||||||||||||
France | — | 365,584 | — | 365,584 | ||||||||||||
Germany | 676,372 | 526,375 | — | 1,202,747 | ||||||||||||
Hong Kong | 874,005 | — | — | 874,005 | ||||||||||||
Japan | — | 463,284 | — | 463,284 | ||||||||||||
Netherlands | 362,258 | — | — | 362,258 | ||||||||||||
South Korea | — | 410,175 | — | 410,175 | ||||||||||||
Spain | 540,599 | 364,194 | — | 904,793 | ||||||||||||
Switzerland | — | 1,459,216 | — | 1,459,216 | ||||||||||||
United Kingdom | 1,432,378 | 3,229,372 | — | 4,661,750 | ||||||||||||
United States | 5,623,069 | — | — | 5,623,069 | ||||||||||||
| $ | 10,839,856 | $ | 6,818,200 | $ | — | $ | 17,658,056 | |||||||||
NOTE 4—Trustees’ and Officers’ Fees and Benefits
Trustees’ and Officers’ Fees and Benefits include amounts accrued by the Fund to pay remuneration to certain Trustees and Officers of the Fund. Trustees have the option to defer compensation payable by the Fund, and Trustees’ and Officers’ Fees and Benefits also include amounts accrued by the Fund to fund such deferred compensation amounts. Those Trustees who defer compensation have the option to select various Invesco Funds in which their deferral accounts shall be deemed to be invested. Finally, certain current Trustees are eligible to participate in a retirement plan that provides for benefits to be paid upon retirement to Trustees over a period of time based on the number of years of service. The Fund may have certain former Trustees who also participate in a retirement plan and receive benefits under such plan. Trustees’ and Officers’ Fees and Benefits include amounts accrued by the Fund to fund such retirement benefits. Obligations under the deferred compensation and retirement plans represent unsecured claims against the general assets of the Fund.
NOTE 5—Cash Balances
The Fund is permitted to temporarily carry a negative or overdrawn balance in its account with State Street Bank and Trust Company, the custodian bank. Such balances, if any at period end, are shown in the Statement of Assets and Liabilities under the payable caption Amount due custodian. To compensate the custodian bank for such overdrafts, the overdrawn Fund may either (1) leave funds as a compensating balance in the account so the custodian bank can be compensated by earning the additional interest; or (2) compensate by paying the custodian bank at a rate agreed upon by the custodian bank and Invesco, not to exceed the contractually agreed upon rate.
NOTE 6—Distributions to Shareholders and Tax Components of Net Assets
Tax Character of Distributions to Shareholders Paid During the Year Ended October 31, 2013 and the Period August 3, 2012 (commencement date) through October 31, 2012:
| 2013 | 2012 | |||||||
Ordinary income | $ | 22,186 | $ | — | ||||
Tax Components of Net Assets at Period-End:
| 2013 | ||||
Undistributed ordinary income | $ | 551,922 | ||
Undistributed long-term gain | 105,983 | |||
Net unrealized appreciation — investments | 2,108,459 | |||
Net unrealized appreciation — other investments | 693 | |||
Temporary book/tax differences | (4,589 | ) | ||
Shares of beneficial interest | 14,924,556 | |||
Total net assets | $ | 17,687,024 | ||
The difference between book-basis and tax-basis unrealized appreciation (depreciation) is due to differences in the timing of recognition of gains and losses on investments for tax and book purposes. The Fund’s net unrealized appreciation difference is attributable primarily to wash sales.
The temporary book/tax differences are a result of timing differences between book and tax recognition of income and/or expenses. The Fund’s temporary book/tax differences are the result of the trustee deferral of compensation and retirement plan benefits.
16 Invesco Global Opportunities Fund
Capital loss carryforward is calculated and reported as of a specific date. Results of transactions and other activity after that date may affect the amount of capital loss carryforward actually available for the Fund to utilize. Capital losses generated in years beginning after December 22, 2010 can be carried forward for an unlimited period, whereas previous losses expire in 8 tax years. Capital losses with an expiration period may not be used to offset capital gains until all net capital losses without an expiration date have been utilized. Capital loss carryforwards with no expiration date will retain their character as either short-term or long-term capital losses instead of as short-term capital losses as under prior law. The ability to utilize capital loss carryforward in the future may be limited under the Internal Revenue Code and related regulations based on the results of future transactions.
The Fund utilized $2,315 of capital loss carryforward in the current period to offset net realized capital gain for federal income tax purposes. The Fund does not have a capital loss carryforward as of October 31, 2013.
NOTE 7—Investment Securities
The aggregate amount of investment securities (other than short-term securities, U.S. Treasury obligations and money market funds, if any) purchased and sold by the Fund during the year ended October 31, 2013 was $17,547,944 and $6,176,103, respectively. Cost of investments on a tax basis includes the adjustments for financial reporting purposes as of the most recently completed federal income tax reporting period-end.
| Unrealized Appreciation (Depreciation) of Investment Securities on a Tax Basis | ||||
Aggregate unrealized appreciation of investment securities | $ | 2,166,720 | ||
Aggregate unrealized (depreciation) of investment securities | (58,261 | ) | ||
Net unrealized appreciation of investment securities | $ | 2,108,459 | ||
Cost of investments for tax purposes is $15,549,597.
NOTE 8—Reclassification of Permanent Differences
Primarily as a result of differing book/tax treatment of foreign currency transactions, on October 31, 2013, undistributed net investment income was increased by $928 and undistributed net realized gain was decreased by $928. This reclassification had no effect on the net assets of the Fund.
NOTE 9—Share Information
| Summary of Share Activity | ||||||||||||||||
| Year ended October 31, 2013(a) | August 3, 2012 (commencement date) to October 31, 2012 | |||||||||||||||
| Shares | Amount | Shares | Amount | |||||||||||||
Sold: | ||||||||||||||||
Class A | 945,762 | $ | 12,451,560 | 157,740 | $ | 1,583,061 | ||||||||||
Class C | 89,846 | 1,225,373 | 1,364 | 13,860 | ||||||||||||
Class R | 1,692 | 24,088 | 1,001 | 10,010 | ||||||||||||
Class Y | 223,414 | 3,118,586 | 148,501 | 1,485,010 | ||||||||||||
Class R5 | — | — | 1,001 | 10,010 | ||||||||||||
Class R6(b) | — | — | 930 | 10,000 | ||||||||||||
Issued as reinvestment of dividends: | ||||||||||||||||
Class A | 50 | 547 | — | — | ||||||||||||
Class C | 7 | 80 | — | — | ||||||||||||
Reacquired: | ||||||||||||||||
Class A | (369,206 | ) | (4,773,333 | ) | (1,890 | ) | (20,104 | ) | ||||||||
Class C | (3,702 | ) | (52,469 | ) | — | — | ||||||||||
Class Y | (9,623 | ) | (137,066 | ) | — | — | ||||||||||
Net increase in share activity | 878,240 | $ | 11,857,366 | 308,647 | $ | 3,091,847 | ||||||||||
| (a) | There are entities that are record owners of more than 5% of the outstanding shares of the Fund and in the aggregate owns 37% of the outstanding shares of the Fund. IDI has an agreement with these entities to sell Fund shares. The Fund, Invesco and/or Invesco affiliates may make payments to these entities, which are considered to be related to the Fund, for providing services to the Fund, Invesco and/or Invesco affiliates including but not limited to services such as securities brokerage, distribution, third party record keeping and account servicing. The Fund has no knowledge as to whether all or any portion of the shares owned of record by these entities are also owned beneficially. |
| In addition, 25% of the outstanding shares of the Fund are owned by the Adviser. |
| (b) | Commencement date of September 24, 2012. |
17 Invesco Global Opportunities Fund
NOTE 10—Financial Highlights
The following schedule presents financial highlights for a share of the Fund outstanding throughout the periods indicated.
| Net asset value, beginning of period | Net investment income(a) | Net gains (losses) on securities (both realized and unrealized) | Total from investment operations | Dividends from net investment income | Net asset value, end of period | Total return(b) | Net assets, end of period (000’s omitted) | Ratio of expenses to average net assets with fee waivers and/or expenses absorbed | Ratio of expenses to average net assets without fee waivers and/or expenses absorbed | Ratio of net investment income to average net assets | Portfolio turnover(c) | |||||||||||||||||||||||||||||||||||||
Class A | ||||||||||||||||||||||||||||||||||||||||||||||||
Year ended 10/31/13 | $ | 10.64 | $ | 0.13 | $ | 4.20 | $ | 4.33 | $ | (0.07 | ) | $ | 14.90 | 40.94 | % | $ | 10,912 | 1.36 | %(d) | 4.80 | %(d) | 0.97 | %(d) | 76 | % | |||||||||||||||||||||||
Period ended 10/31/12(e) | 10.00 | 0.02 | 0.62 | 0.64 | — | 10.64 | 6.40 | 1,658 | 1.35 | (f) | 11.20 | (f) | 0.80 | (f) | 9 | |||||||||||||||||||||||||||||||||
Class C | ||||||||||||||||||||||||||||||||||||||||||||||||
Year ended 10/31/13 | 10.62 | 0.03 | 4.18 | 4.21 | (0.07 | ) | 14.76 | 39.85 | 1,292 | 2.11 | (d) | 5.55 | (d) | 0.22 | (d) | 76 | ||||||||||||||||||||||||||||||||
Period ended 10/31/12(e) | 10.00 | 0.00 | 0.62 | 0.62 | — | 10.62 | 6.20 | 14 | 2.10 | (f) | 11.95 | (f) | 0.05 | (f) | 9 | |||||||||||||||||||||||||||||||||
Class R | ||||||||||||||||||||||||||||||||||||||||||||||||
Year ended 10/31/13 | 10.63 | 0.09 | 4.20 | 4.29 | (0.07 | ) | 14.85 | 40.59 | 40 | 1.61 | (d) | 5.05 | (d) | 0.72 | (d) | 76 | ||||||||||||||||||||||||||||||||
Period ended 10/31/12(e) | 10.00 | 0.01 | 0.62 | 0.63 | — | 10.63 | 6.30 | 11 | 1.60 | (f) | 11.45 | (f) | 0.55 | (f) | 9 | |||||||||||||||||||||||||||||||||
Class Y | ||||||||||||||||||||||||||||||||||||||||||||||||
Year ended 10/31/13 | 10.65 | 0.16 | 4.20 | 4.36 | (0.07 | ) | 14.94 | 41.21 | 5,414 | 1.11 | (d) | 4.55 | (d) | 1.22 | (d) | 76 | ||||||||||||||||||||||||||||||||
Period ended 10/31/12(e) | 10.00 | 0.03 | 0.62 | 0.65 | — | 10.65 | 6.50 | 1,581 | 1.10 | (f) | 10.95 | (f) | 1.05 | (f) | 9 | |||||||||||||||||||||||||||||||||
Class R5 | ||||||||||||||||||||||||||||||||||||||||||||||||
Year ended 10/31/13 | 10.64 | 0.16 | 4.21 | 4.37 | (0.07 | ) | 14.94 | 41.34 | 15 | 1.11 | (d) | 4.53 | (d) | 1.22 | (d) | 76 | ||||||||||||||||||||||||||||||||
Period ended 10/31/12(e) | 10.00 | 0.03 | 0.61 | 0.64 | — | 10.64 | 6.40 | 11 | 1.10 | (f) | 11.00 | (f) | 1.05 | (f) | 9 | |||||||||||||||||||||||||||||||||
Class R6 | ||||||||||||||||||||||||||||||||||||||||||||||||
Year ended 10/31/13 | 10.64 | 0.16 | 4.21 | 4.37 | (0.07 | ) | 14.94 | 41.34 | 14 | 1.11 | (d) | 4.53 | (d) | 1.22 | (d) | 76 | ||||||||||||||||||||||||||||||||
Period ended 10/31/12(e) | 10.76 | 0.01 | (0.13 | ) | (0.12 | ) | — | 10.64 | (1.12 | ) | 10 | 1.10 | (f) | 8.37 | (f) | 1.05 | (f) | 9 | ||||||||||||||||||||||||||||||
| (a) | Calculated using average shares outstanding. |
| (b) | Includes adjustments in accordance with accounting principles generally accepted in the United States of America and as such, the net asset value for financial reporting purposes and the returns based upon those net asset values may differ from the net asset value and returns for shareholder transactions. Does not include sales charges and is not annualized for periods less than one year, if applicable. |
| (c) | Portfolio turnover is calculated at the fund level and is not annualized for periods less than one year, if applicable. |
| (d) | Ratios are based on average daily net assets (000’s omitted) of $5,169, $354, $16, $2,605, $13 and $12 for Class A, Class C, Class R, Class Y, Class R5 and Class R6 shares, respectively. |
| (e) | Commencement date of August 3, 2012 for Class A, Class C, Class R, Class Y and Class R5 shares and September 24, 2012 for Class R6 shares. |
| (f) | Annualized. |
18 Invesco Global Opportunities Fund
Report of Independent Registered Public Accounting Firm
To the Board of Trustees of AIM International Mutual Funds (Invesco International Mutual Funds)
and Shareholders of Invesco Global Opportunities Fund:
In our opinion, the accompanying statement of assets and liabilities, including the schedule of investments, and the related statements of operations and of changes in net assets and the financial highlights present fairly, in all material respects, the financial position of Invesco Global Opportunities Fund (one of the funds constituting AIM International Mutual Funds (Invesco International Mutual Funds), hereafter referred to as the “Fund”) at October 31, 2013, the results of its operations for the year then ended, the changes in its net assets and financial highlights for the year ended October 31, 2013 and for the period August 3, 2012 (commencement date) through October 31, 2012, in conformity with accounting principles generally accepted in the United States of America. These financial statements and financial highlights (hereafter referred to as “financial statements”) are the responsibility of the Fund’s management; our responsibility is to express an opinion on these financial statements based on our audits. We conducted our audits of these financial statements in accordance with the standards of the Public Company Accounting Oversight Board (United States). Those standards require that we plan and perform the audit to obtain reasonable assurance about whether the financial statements are free of material misstatement. An audit includes examining, on a test basis, evidence supporting the amounts and disclosures in the financial statements, assessing the accounting principles used and significant estimates made by management, and evaluating the overall financial statement presentation. We believe that our audits, which included confirmation of securities at October 31, 2013 by correspondence with the custodian and brokers, provide a reasonable basis for our opinion.
PRICEWATERHOUSECOOPERS LLP
December 23, 2013
Houston, Texas
19 Invesco Global Opportunities Fund
Calculating your ongoing Fund expenses
Example
As a shareholder of the Fund, you incur two types of costs: (1) transaction costs, which may include sales charges (loads) on purchase payments or contingent deferred sales charges on redemptions, if any; and (2) ongoing costs, including management fees, distribution and/or service (12b-1) fees, and other Fund expenses. This example is intended to help you understand your ongoing costs (in dollars) of investing in the Fund and to compare these costs with ongoing costs of investing in other mutual funds. The example is based on an investment of $1,000 invested at the beginning of the period and held for the entire period May 1, 2013 through October 31, 2013.
Actual expenses
The table below provides information about actual account values and actual expenses. You may use the information in this table, together with the amount you invested, to estimate the expenses that you paid over the period. Simply divide your account value by $1,000 (for example, an $8,600 account value divided by $1,000 = 8.6), then multiply the result by the number in the table under the heading entitled “Actual Expenses Paid During Period” to estimate the expenses you paid on your account during this period.
Hypothetical example for comparison purposes
The table below also provides information about hypothetical account values and hypothetical expenses based on the Fund’s actual expense ratio and an assumed rate of return of 5% per year before expenses, which is not the Fund’s actual return.
The hypothetical account values and expenses may not be used to estimate the actual ending account balance or expenses you paid for the period. You may use this information to compare the ongoing costs of investing in the Fund and other funds. To do so, compare this 5% hypothetical example with the 5% hypothetical examples that appear in the shareholder reports of the other funds.
Please note that the expenses shown in the table are meant to highlight your ongoing costs only and do not reflect any transaction costs, such as sales charges (loads) on purchase payments or contingent deferred sales charges on redemptions, if any. Therefore, the hypothetical information is useful in comparing ongoing costs only, and will not help you determine the relative total costs of owning different funds. In addition, if these transaction costs were included, your costs would have been higher.
| Class | Beginning Account Value (05/01/13) | ACTUAL | HYPOTHETICAL (5% annual return before expenses) | Annualized Expense Ratio | ||||||||||||||||||||
| Ending Account Value (10/31/13)1 | Expenses Paid During Period2 | Ending Account Value (10/31/13) | Expenses Paid During Period2 | |||||||||||||||||||||
A | $ | 1,000.00 | $ | 1,147.90 | $ | 7.36 | $ | 1,018.35 | $ | 6.92 | 1.36 | % | ||||||||||||
C | 1,000.00 | 1,143.30 | 11.40 | 1,014.57 | 10.71 | 2.11 | ||||||||||||||||||
R | 1,000.00 | 1,145.80 | 8.71 | 1,017.09 | 8.19 | 1.61 | ||||||||||||||||||
Y | 1,000.00 | 1,149.20 | 6.01 | 1,019.61 | 5.65 | 1.11 | ||||||||||||||||||
R5 | 1,000.00 | 1,149.20 | 6.01 | 1,019.61 | 5.65 | 1.11 | ||||||||||||||||||
R6 | 1,000.00 | 1,149.20 | 6.01 | 1,019.61 | 5.65 | 1.11 | ||||||||||||||||||
| 1 | The actual ending account value is based on the actual total return of the Fund for the period May 1, 2013 through October 31, 2013, after actual expenses and will differ from the hypothetical ending account value which is based on the Fund’s expense ratio and a hypothetical annual return of 5% before expenses. |
| 2 | Expenses are equal to the Fund’s annualized expense ratio as indicated above multiplied by the average account value over the period, multiplied by 184/365 to reflect the most recent fiscal half year. |
20 Invesco Global Opportunities Fund
Approval of Investment Advisory and Sub-Advisory Contracts
The Board of Trustees (the Board) of AIM International Mutual Funds (Invesco International Mutual Funds) is required under the Investment Company Act of 1940, as amended, to approve annually the renewal of Invesco Global Opportunities Fund’s (the Fund) (i) investment advisory agreement with Invesco Advisers, Inc. (Invesco Advisers), (ii) the Master Intergroup Sub-Advisory Contract for Mutual Funds with Invesco Asset Management Deutschland GmbH, Invesco Asset Management Limited, Invesco Asset Management (Japan) Limited, Invesco Australia Limited, Invesco Hong Kong Limited, Invesco Senior Secured Management, Inc. and Invesco Canada Ltd. and (iii) a Sub-Advisory Contract (together with the contracts referenced in (ii) above, the sub-advisory contracts) with Invesco PowerShares Capital Management LLC (together with the entities referenced in (ii) above, the Affiliated Sub-Advisers). During contract renewal meetings held on June 17-19, 2013, the Board as a whole, and the disinterested or “independent” Trustees, who comprise over 75% of the Board, voting separately, approved the continuance of the Fund’s investment advisory agreement and the sub-advisory contracts for another year, effective July 1, 2013. The Board determined that continuation of the Fund’s investment advisory agreement and the sub-advisory contracts are in the best interests of the Fund and its shareholders and the compensation payable to Invesco Advisers and the Affiliated Sub-Advisers under the agreements is fair and reasonable.
The Board’s Fund Evaluation Process
The Board’s Investments Committee has established three Sub-Committees, each of which is primarily responsible for overseeing the management of a number of the funds advised by Invesco Advisers (the Invesco Funds). The Sub-Committees meet throughout the year to review the performance of their assigned Invesco Funds, including reviewing materials prepared under the direction of the independent Senior Officer, an officer of the Invesco Funds who reports directly to the independent Trustees. Over the course of each year, the Sub-Committees meet with portfolio managers for their assigned Invesco Funds and other members of management to review the performance, investment objective(s), policies, strategies, limitations and investment risks of these funds. The Sub-Committees meet regularly and at designated contract renewal meetings each year to conduct a review of the performance, fees, expenses and other matters related to their assigned Invesco Funds. Each Sub-Committee recommends to the Investments Committee, which in turn recommends to the full Board, whether and on what terms to approve the continuance of each Invesco Fund’s
investment advisory agreement and sub-advisory contracts for another year.
During the contract renewal process, the Trustees receive comparative performance and fee data regarding the Invesco Funds prepared by Invesco Advisers and Lipper Inc. (Lipper), an independent provider of investment company data. The Trustees also receive an independent written evaluation from the Senior Officer. The Senior Officer’s evaluation is prepared as part of his responsibility to manage the process by which the Invesco Funds’ proposed management fees are negotiated during the annual contract renewal process to ensure they are negotiated in a manner that is at arms’ length and reasonable. The independent Trustees are assisted in their annual evaluation of the Fund’s investment advisory agreement by the Senior Officer and by independent legal counsel. In addition to meetings with Invesco Advisers and fund counsel, the independent Trustees also discuss the continuance of the investment advisory agreement and sub-advisory contracts in separate sessions with the Senior Officer and with independent legal counsel.
In evaluating the fairness and reasonableness of compensation under the Fund’s investment advisory agreement and sub-advisory contracts, the Board considered, among other things, the factors discussed below. The Trustees recognized that the advisory fee rates for the Invesco Funds are, in many cases, the result of years of review and negotiation between the Trustees and Invesco Advisers as well as advisory fees previously approved by different predecessor boards. The Trustees’ deliberations and conclusions in a particular year may be based in part on their deliberations and conclusions regarding these same arrangements throughout the year and in prior years. The Trustees’ review and conclusions are based on the comprehensive consideration of all information presented to them and are not the result of any single determinative factor. Moreover, one Trustee may have weighed a particular piece of information or factor differently than another Trustee.
The discussion below serves as the Senior Officer’s independent written evaluation with respect to the Fund’s investment advisory agreement as well as a discussion of the material factors and related conclusions that formed the basis for the Board’s approval of the Fund’s investment advisory agreement and sub-advisory contracts. Unless otherwise stated, this information is current as of June 19, 2013, and may not reflect consideration of factors that became known to the Board after that date, including, for example, changes to the Fund’s performance, advisory fees, expense limitations and/or fee waivers.
Factors and Conclusions and Summary of Independent Written Fee Evaluation
| A. | Nature, Extent and Quality of Services Provided by Invesco Advisers and the Affiliated Sub-Advisers |
The Board reviewed the advisory services provided to the Fund by Invesco Advisers under the Fund’s investment advisory agreement, the performance of Invesco Advisers in providing these services, and the credentials and experience of the officers and employees of Invesco Advisers who provide these services, including the Fund’s portfolio manager or managers, with whom the Sub-Committees met during the year. The Board’s review of the qualifications of Invesco Advisers to provide advisory services included the Board’s consideration of Invesco Advisers’ investment process oversight, independent credit analysis and investment risk management.
In determining whether to continue the Fund’s investment advisory agreement, the Board considered the benefits of reapproving an existing relationship and the greater uncertainty that may be associated with entering into a new relationship. The Board also considered non-advisory services that Invesco Advisers and its affiliates provide to the Invesco Funds such as various back office support functions, equity and fixed income trading operations, internal audit, distribution and legal and compliance. The Board concluded that the nature, extent and quality of the services provided to the Fund by Invesco Advisers are appropriate and satisfactory and consistent with the terms of the Fund’s investment advisory agreement.
The Board reviewed the services provided by the Affiliated Sub-Advisers under the sub-advisory contracts and the credentials and experience of the officers and employees of the Affiliated Sub-Advisers who provide these services. The Board noted that the Affiliated Sub-Advisers have offices and personnel that are located in financial centers around the world. As a result, the Affiliated Sub-Advisers can provide research and investment analysis on the markets and economies of various countries in which the Fund may invest, make recommendations regarding securities and assist with security trades. The Board concluded that the sub-advisory contracts benefit the Fund and its shareholders by permitting Invesco Advisers to use the resources and talents of the Affiliated Sub-Advisers in managing the Fund. The Board concluded that the nature, extent and quality of the services provided by the Affiliated Sub-Advisers are appropriate and satisfactory and consistent with the terms of the Fund’s sub-advisory contracts.
| B. | Fund Performance |
Because the Fund was launched at the end of 2012, the Board did not consider Fund performance as a relevant factor in considering whether to approve the investment advisory
21 Invesco Global Opportunities Fund
agreement. For the same reason, the Board did not view Fund performance as a relevant factor in considering whether to approve the sub-advisory contracts for the Fund, notwithstanding that Invesco Asset Management Limited currently manages a portion of the assets of the Fund.
| C. | Advisory and Sub-Advisory Fees |
The Board compared the Fund’s effective advisory fee rate (the advisory fee rate after advisory fee waivers and before other expense limitations/waivers) to the effective advisory fee rates of other mutual funds advised by Invesco Advisers and its affiliates with investment strategies comparable to those of the Fund. The Board compared the Fund’s effective advisory fee rate to the effective advisory fee rate of an offshore fund advised by Invesco Advisers and its affiliates with investment strategies comparable to those of the Fund. The Board noted that the Fund’s effective advisory fee rate was lower than the effective advisory fee rate of the offshore fund.
Other than the fund described above, the Board noted that Invesco Advisers and the Affiliated Sub-Advisers do not advise other client accounts with investment strategies comparable to those of the Fund.
The Board noted that Invesco Advisers has contractually agreed to limit expenses of the Fund through at least February 28, 2014 in an amount necessary to limit total annual operating expenses to a specified percentage of average daily net assets for each class of the Fund.
The Board also considered the services provided by the Affiliated Sub-Advisers pursuant to the sub-advisory contracts, as well as the fees payable by Invesco Advisers to the Affiliated Sub-Advisers pursuant to the sub-advisory contracts. The Board noted that Invesco Advisers retains overall responsibility for, and provides services to, sub-advised Invesco Funds, including oversight of the Affiliated Sub-Advisers as well as the additional services described herein other than day-to-day portfolio management. The Board also noted that the sub-advisory fees are not paid directly by the Fund, but rather, are payable by Invesco Advisers to the Affiliated Sub-Advisers.
Based upon the information and considerations described above, the Board concluded that the compensation payable to Invesco Advisers and the Affiliated Sub-Advisers is fair and reasonable.
| D. | Economies of Scale and Breakpoints |
The Board considered the extent to which there are economies of scale in the provision of advisory services to the Fund. The Board also considered whether the Fund benefits from economies of scale through contractual breakpoints in the Fund’s advisory fee schedule and was assisted in this review by a report from the Senior Officer. The Board also noted that the Fund shares directly in economies of scale through lower fees charged by third party service providers based on the combined size of
the Invesco Funds and other clients advised by Invesco Advisers.
| E. | Profitability and Financial Resources |
The Board reviewed information from Invesco Advisers concerning the costs of the advisory and other services that Invesco Advisers and its affiliates provide to the Fund and the profitability of Invesco Advisers and its affiliates in providing these services for the year ended December 31, 2012. The Board received information from Invesco Advisers about the methodology used to prepare the profitability information. The Board considered the profitability of Invesco Advisers in managing the Fund and the Invesco Funds. The Board noted that Invesco Advisers continues to operate at a net profit from services Invesco Advisers and its subsidiaries provide to the Invesco Funds. The Board noted that Invesco Advisers and its subsidiaries did not make a profit from managing the Fund as a result of expense waivers. The Board received and accepted information from Invesco Advisers demonstrating that Invesco Advisers and each Affiliated Sub-Adviser are financially sound and have the resources necessary to perform their obligations under the investment advisory agreement and sub-advisory contracts.
| F. | Collateral Benefits to Invesco Advisers and its Affiliates |
The Board considered various other benefits received by Invesco Advisers and its affiliates from the relationship with the Fund, including the fees received for their provision of transfer agency and distribution services to the Fund. The Board considered comparative information regarding fees charged for these services, including information provided by Lipper and other independent sources. The Board considered the performance of Invesco Advisers and its affiliates in providing these services and the organizational structure employed to provide these services. The Board also considered that these services are provided to the Fund pursuant to written contracts that are reviewed and approved on an annual basis by the Board; that the services are required for the operation of the Fund; that Invesco Advisers and its affiliates can provide services, the nature and quality of which are at least equal to those provided by others offering the same or similar services; and that the fees for such services are fair and reasonable in light of the usual and customary charges by others for services of the same nature and quality.
The Board considered the benefits realized by Invesco Advisers and the Affiliated Sub-Advisers as a result of portfolio brokerage transactions executed through “soft dollar” arrangements. The Board noted that soft dollar arrangements shift the payment obligation for research services from Invesco Advisers and the Affiliated Sub-Advisers to the Invesco Funds and that the research received may be used with other clients of Invesco Advisers and may reduce Invesco Advisers’ and the Affiliated Sub-Advisers’ expenses. The Board also considered periodic reports from the Chief
Compliance Officer of the Invesco Funds demonstrating that these arrangements are consistent with regulatory requirements. The Board did not deem the soft dollar arrangements to be inappropriate.
The Board considered that the Fund’s uninvested cash and cash collateral from any securities lending arrangements may be invested in money market funds advised by Invesco Advisers pursuant to procedures approved by the Board. The Board noted that Invesco Advisers receives advisory fees from these affiliated money market funds attributable to such investments, although Invesco Advisers has contractually agreed to waive through varying periods the advisory fees payable by the Invesco Funds. The waiver is in an amount equal to 100% of the net advisory fee Invesco Advisers receives from the affiliated money market funds with respect to the Fund’s investment in the affiliated money market funds of uninvested cash, but not cash collateral. The Board concluded that the Fund’s investment of uninvested cash and cash collateral from any securities lending arrangements in the affiliated money market funds is in the best interests of the Fund and its shareholders.
The Board also considered use of an affiliated broker to execute certain trades for the Fund to among other things, control information leakage, and were advised that such trades are executed in compliance with rules under the Investment Company Act of 1940, as amended.
22 Invesco Global Opportunities Fund
Tax Information
Form 1099-DIV, Form 1042-S and other year–end tax information provide shareholders with actual calendar year amounts that should be included in their tax returns. Shareholders should consult their tax advisors.
The following distribution information is being provided as required by the Internal Revenue Code or to meet a specific state’s requirement.
The Fund designates the following amounts or, if subsequently determined to be different, the maximum amount allowable for its fiscal year ended October 31, 2013:
Federal and State Income Tax | ||||
Qualified Dividend Income* | 67.22 | % | ||
Corporate Dividends Received Deduction* | 23.89 | % | ||
| * | The above percentages are based on ordinary income dividends paid to shareholders during the Fund’s fiscal year. |
23 Invesco Global Opportunities Fund
Trustees and Officers
The address of each trustee and officer is AIM International Mutual Funds (Invesco International Mutual Funds) (the “Trust”), 11 Greenway Plaza, Suite 1000, Houston, Texas 77046-1173. The trustees serve for the life of the Trust, subject to their earlier death, incapacitation, resignation, retirement or removal as more specifically provided in the Trust’s organizational documents. Each officer serves for a one year term or until their successors are elected and qualified. Column two below includes length of time served with predecessor entities, if any.
Name, Year of Birth and Position(s) Held with the Trust | Trustee and/ or Officer Since | Principal Occupation(s) During Past 5 Years | Number of Funds in Fund Complex Overseen by Trustee | Other Directorship(s) Held by Trustee During Past 5 Years | ||||
| Interested Persons | ||||||||
| Martin L. Flanagan1 — 1960 Trustee | 2007 | Executive Director, Chief Executive Officer and President, Invesco Ltd. (ultimate parent of Invesco and a global investment management firm); Advisor to the Board, Invesco Advisers, Inc. (formerly known as Invesco Institutional (N.A.), Inc.); Trustee, The Invesco Funds; Vice Chair, Investment Company Institute; and Member of Executive Board, SMU Cox School of Business
Formerly: Chairman and Chief Executive Officer, Invesco Advisers, Inc. (registered investment adviser); Director, Chairman, Chief Executive Officer and President, IVZ Inc. (holding company), INVESCO Group Services, Inc. (service provider) and Invesco North American Holdings, Inc. (holding company); Director, Chief Executive Officer and President, Invesco Holding Company Limited (parent of Invesco and a global investment management firm); Director, Invesco Ltd.; Chairman, Investment Company Institute and President, Co-Chief Executive Officer, Co-President, Chief Operating Officer and Chief Financial Officer, Franklin Resources, Inc. (global investment management organization) | 117 | None | ||||
Philip A. Taylor2 — 1954 Trustee, President and Principal Executive Officer | 2006 | Head of North American Retail and Senior Managing Director, Invesco Ltd.; Director, Co-Chairman, Co-President and Co-Chief Executive Officer, Invesco Advisers, Inc. (formerly known as Invesco Institutional (N.A.), Inc.) (registered investment adviser); Director, Chairman, Chief Executive Officer and President, Invesco Management Group, Inc. (formerly known as Invesco Aim Management Group, Inc.) (financial services holding company); Director and President, INVESCO Funds Group, Inc. (registered investment adviser and registered transfer agent); Director and Chairman, Invesco Investment Services, Inc. (formerly known as Invesco Aim Investment Services, Inc.) (registered transfer agent) and IVZ Distributors, Inc. (formerly known as INVESCO Distributors, Inc.) (registered broker dealer); Director, President and Chairman, Invesco Inc. (holding company) and Invesco Canada Holdings Inc. (holding company); Chief Executive Officer, Invesco Corporate Class Inc. (corporate mutual fund company) and Invesco Canada Fund Inc. (corporate mutual fund company); Director, Chairman and Chief Executive Officer, Invesco Canada Ltd. (formerly known as Invesco Trimark Ltd./Invesco Trimark Ltèe) (registered investment adviser and registered transfer agent); Trustee, President and Principal Executive Officer, The Invesco Funds (other than AIM Treasurer’s Series Trust (Invesco Treasurer’s Series Trust) and Short-Term Investments Trust); Trustee and Executive Vice President, The Invesco Funds (AIM Treasurer’s Series Trust (Invesco Treasurer’s Series Trust) and Short-Term Investments Trust only); Director, Invesco Investment Advisers LLC (formerly known as Van Kampen Asset Management); Director, Chief Executive Officer and President, Van Kampen Exchange Corp.
Formerly: Director and Chairman, Van Kampen Investor Services Inc.: Director, Chief Executive Officer and President, 1371 Preferred Inc. (holding company); and Van Kampen Investments Inc.; Director and President, AIM GP Canada Inc. (general partner for limited partnerships); and Van Kampen Advisors, Inc.; Director and Chief Executive Officer, Invesco Trimark Dealer Inc. (registered broker dealer); Director, Invesco Distributors, Inc. (formerly known as Invesco Aim Distributors, Inc.) (registered broker dealer); Manager, Invesco PowerShares Capital Management LLC; Director, Chief Executive Officer and President, Invesco Advisers, Inc.; Director, Chairman, Chief Executive Officer and President, Invesco Aim Capital Management, Inc.; President, Invesco Trimark Dealer Inc. and Invesco Trimark Ltd./Invesco Trimark Ltèe; Director and President, AIM Trimark Corporate Class Inc. and AIM Trimark Canada Fund Inc.; Senior Managing Director, Invesco Holding Company Limited; Trustee and Executive Vice President, Tax-Free Investments Trust; Director and Chairman, Fund Management Company (former registered broker dealer); President and Principal Executive Officer, The Invesco Funds (AIM Treasurer’s Series Trust (Invesco Treasurer’s Series Trust), Short-Term Investments Trust and Tax-Free Investments Trust only); President, AIM Trimark Global Fund Inc. and AIM Trimark Canada Fund Inc. | 117 | None | ||||
Wayne W. Whalen3 — 1939 Trustee | 2010 | Of Counsel, and prior to 2010, partner in the law firm of Skadden, Arps, Slate, Meagher & Flom LLP, legal counsel to certain funds in the Fund Complex | 130 | Director of the Mutual Fund Directors Forum, a nonprofit membership organization for investment directors; Chairman and Director of the Abraham Lincoln Presidential Library Foundation; and Director of the Stevenson Center for Democracy |
| 1 | Mr. Flanagan is considered an interested person of the Trust because he is an officer of the adviser to the Trust, and an officer and a director of Invesco Ltd., ultimate parent of the adviser to the Trust. |
| 2 | Mr. Taylor is considered an interested person of the Trust because he is an officer and a director of the adviser to, and a director of the principal underwriter of, the Trust. |
| 3 | Mr. Whalen is considered an “interested person” (within the meaning of Section 2(a)(19) of the 1940 Act) of certain Funds in the Invesco Fund Complex because he and his firm currently provide legal services as legal counsel to such Funds. |
T-1 Invesco Global Opportunities Fund
Trustees and Officers—(continued)
Name, Year of Birth and Position(s) Held with the Trust | Trustee and/ or Officer Since | Principal Occupation(s) During Past 5 Years | Number of Funds in Fund Complex Overseen by Trustee | Other Directorship(s) Held by Trustee During Past 5 Years | ||||
| Independent Trustees | ||||||||
Bruce L. Crockett — 1944 Trustee and Chair | 1992 | Chairman, Crockett Technologies Associates (technology consulting company)
Formerly: Director, Captaris (unified messaging provider); Director, President and Chief Executive Officer COMSAT Corporation; and Chairman, Board of Governors of INTELSAT (international communications company) | 117 | ACE Limited (insurance company); Investment Company Institute | ||||
David C. Arch — 1945 Trustee | 2010 | Chairman and Chief Executive Officer of Blistex Inc., (consumer health care products manufacturer)
Formerly: Member of the Heartland Alliance Advisory Board, a nonprofit organization serving human needs based in Chicago | 130 | Board member of the Illinois Manufacturers’ Association; Member of the Board of Visitors, Institute for the Humanities, University of Michigan | ||||
Frank S. Bayley — 1939 Trustee | 2001 | Retired
Formerly: Director, Badgley Funds, Inc. (registered investment company) (2 portfolios) and General Partner and Of Counsel, law firm of Baker & McKenzie, LLP | 117 | Director and Chairman, C.D. Stimson Company (a real estate investment company); Trustee and Overseer, The Curtis Institute of Music | ||||
James T. Bunch — 1942 Trustee | 2003 | Managing Member, Grumman Hill Group LLC (family office private equity management)
Formerly: Founder, Green, Manning & Bunch Ltd. (investment banking firm)(1988-2010); Executive Committee, United States Golf Association; and Director, Policy Studies, Inc. and Van Gilder Insurance Corporation | 117 | Chairman, Board of Governors, Western Golf Association; Chairman-elect, Evans Scholars Foundation; and Director, Denver Film Society | ||||
Rodney F. Dammeyer — 1940 Trustee | 2010 | Chairman of CAC, LLC, (private company offering capital investment and management advisory services)
Formerly: Prior to 2001, Managing Partner at Equity Group Corporate Investments; Prior to 1995, Chief Executive Officer of Itel Corporation (formerly Anixter International); Prior to 1985, experience includes Senior Vice President and Chief Financial Officer of Household International, Inc., Executive Vice President and Chief Financial Officer of Northwest Industries, Inc. and Partner of Arthur Andersen & Co.; From 1987 to 2010, Director/Trustee of investment companies in the Van Kampen Funds complex | 117 | Director of Quidel Corporation and Stericycle, Inc.; Prior to May 2008, Trustee of The Scripps Research Institute; Prior to February 2008, Director of Ventana Medical Systems, Inc. | ||||
Albert R. Dowden — 1941 Trustee | 2000 | Director of a number of public and private business corporations, including the Boss Group, Ltd. (private investment and management); and Reich & Tang Funds (5 portfolios) (registered investment company)
Formerly: Director, Homeowners of America Holding Corporation/Homeowners of America Insurance Company (property casualty company); Director, Continental Energy Services, LLC (oil and gas pipeline service); Director, CompuDyne Corporation (provider of product and services to the public security market) and Director, Annuity and Life Re (Holdings), Ltd. (reinsurance company); Director, President and Chief Executive Officer, Volvo Group North America, Inc.; Senior Vice President, AB Volvo; Director of various public and private corporations; Chairman, DHJ Media, Inc.; Director, Magellan Insurance Company; and Director, The Hertz Corporation, Genmar Corporation (boat manufacturer), National Media Corporation; Advisory Board of Rotary Power International (designer, manufacturer, and seller of rotary power engines); and Chairman, Cortland Trust, Inc. (registered investment company) | 117 | Director of Nature’s Sunshine Products, Inc. | ||||
Jack M. Fields — 1952 Trustee | 1997 | Chief Executive Officer, Twenty First Century Group, Inc. (government affairs company); Owner and Chief Executive Officer, Dos Angeles Ranch, L.P. (cattle, hunting, corporate entertainment); and Discovery Global Education Fund (non-profit)
Formerly: Chief Executive Officer, Texana Timber LP (sustainable forestry company); Director of Cross Timbers Quail Research Ranch (non-profit); and member of the U.S. House of Representatives | 117 | Insperity, Inc. (formerly known as Administaff) | ||||
Prema Mathai-Davis — 1950 Trustee | 1998 | Retired
Formerly: Chief Executive Officer, YWCA of the U.S.A. | 117 | None | ||||
Larry Soll — 1942 Trustee | 2003 | Retired
Formerly: Chairman, Chief Executive Officer and President, Synergen Corp. (a biotechnology company) | 117 | None | ||||
Hugo F. Sonnenschein — 1940 Trustee | 2010 | Distinguished Service Professor and President Emeritus of the University of Chicago and the Adam Smith Distinguished Service Professor in the Department of Economics at the University of Chicago
Formerly: President of the University of Chicago | 130 | Trustee of the University of Rochester and a member of its investment committee. Member of the National Academy of Sciences, the American Philosophical Society and a fellow of the American Academy of Arts and Sciences | ||||
Raymond Stickel, Jr. — 1944 Trustee | 2005 | Retired
Formerly: Director, Mainstay VP Series Funds, Inc. (25 portfolios) and Partner, Deloitte & Touche | 117 | None |
T-2 Invesco Global Opportunities Fund
Trustees and Officers—(continued)
Name, Year of Birth and Position(s) Held with the Trust | Trustee and/ or Officer Since | Principal Occupation(s) During Past 5 Years | Number of Funds in Fund Complex Overseen by Trustee | Other Directorship(s) Held by Trustee During Past 5 Years | ||||
| Other Officers | ||||||||
Russell C. Burk — 1958 Senior Vice President and Senior Officer | 2005 | Senior Vice President and Senior Officer, The Invesco Funds | N/A | N/A | ||||
John M. Zerr — 1962 Senior Vice President, Chief Legal Officer and Secretary | 2006 | Director, Senior Vice President, Secretary and General Counsel, Invesco Management Group, Inc. (formerly known as Invesco Aim Management Group, Inc.) and Van Kampen Exchange Corp.; Senior Vice President, Invesco Advisers, Inc. (formerly known as Invesco Institutional (N.A.), Inc.) (registered investment adviser); Senior Vice President and Secretary, Invesco Distributors, Inc. (formerly known as Invesco Aim Distributors, Inc.); Director, Vice President and Secretary, Invesco Investment Services, Inc. (formerly known as Invesco Aim Investment Services, Inc.) and IVZ Distributors, Inc. (formerly known as INVESCO Distributors, Inc.); Director and Vice President, INVESCO Funds Group, Inc.; Senior Vice President, Chief Legal Officer and Secretary, The Invesco Funds; Manager, Invesco PowerShares Capital Management LLC; Director, Secretary and General Counsel, Invesco Investment Advisers LLC (formerly known as Van Kampen Asset Management); Secretary and General Counsel, Invesco Capital Markets, Inc. (formerly known as Van Kampen Funds Inc.) and Chief Legal Officer, PowerShares Exchange-Traded Fund Trust, PowerShares Exchange-Traded Fund Trust II, PowerShares India Exchange-Traded Fund Trust and PowerShares Actively Managed Exchange-Traded Fund Trust
Formerly: Director and Vice President, Van Kampen Advisors Inc.; Director, Vice President, Secretary and General Counsel, Van Kampen Investor Services Inc.; Director, Invesco Distributors, Inc. (formerly known as Invesco Aim Distributors, Inc.); Director, Senior Vice President, General Counsel and Secretary, Invesco Aim Advisers, Inc. and Van Kampen Investments Inc.; Director, Vice President and Secretary, Fund Management Company; Director, Senior Vice President, Secretary, General Counsel and Vice President, Invesco Aim Capital Management, Inc.; Chief Operating Officer and General Counsel, Liberty Ridge Capital, Inc. (an investment adviser); Vice President and Secretary, PBHG Funds (an investment company) and PBHG Insurance Series Fund (an investment company); Chief Operating Officer, General Counsel and Secretary, Old Mutual Investment Partners (a broker-dealer); General Counsel and Secretary, Old Mutual Fund Services (an administrator) and Old Mutual Shareholder Services (a shareholder servicing center); Executive Vice President, General Counsel and Secretary, Old Mutual Capital, Inc. (an investment adviser); and Vice President and Secretary, Old Mutual Advisors Funds (an investment company) | N/A | N/A | ||||
Karen Dunn Kelley — 1960 Vice President | 2004 | Senior Managing Director, Investments; Director, Co-President, Co-Chief Executive Officer, and Co-Chairman, Invesco Advisers, Inc. (formerly known as Invesco Institutional (N.A.), Inc.) (registered investment adviser); Chairman, Invesco Senior Secured Management, Inc.; Senior Vice President, Invesco Management Group, Inc. (formerly known as Invesco Aim Management Group, Inc.); Executive Vice President, Invesco Distributors, Inc. (formerly known as Invesco Aim Distributors, Inc.); Director, Invesco Mortgage Capital Inc., and Invesco Management Company Limited; Director and President, INVESCO Asset Management (Bermuda) Ltd., Vice President, The Invesco Funds (other than AIM Treasurer’s Series Trust (Invesco Treasurer’s Series Trust) and Short-Term Investments Trust); and President and Principal Executive Officer, The Invesco Funds (AIM Treasurer’s Series Trust (Invesco Treasurer’s Series Trust) and Short-Term Investments Trust only)
Formerly: Director, INVESCO Global Asset Management Limited and INVESCO Management S.A.; Senior Vice President, Van Kampen Investments Inc. and Invesco Advisers, Inc. (formerly known as Invesco Institutional (N.A.), Inc.) (registered investment adviser); Vice President, Invesco Advisers, Inc. (formerly known as Invesco Institutional (N.A.), Inc.); Director of Cash Management and Senior Vice President, Invesco Advisers, Inc. and Invesco Aim Capital Management, Inc.; President and Principal Executive Officer, Tax-Free Investments Trust; Director and President, Fund Management Company; Chief Cash Management Officer, Director of Cash Management, Senior Vice President, and Managing Director, Invesco Aim Capital Management, Inc.; Director of Cash Management, Senior Vice President, and Vice President, Invesco Advisers, Inc. and The Invesco Funds (AIM Treasurer’s Series Trust (Invesco Treasurer’s Series Trust), Short-Term Investments Trust and Tax-Free Investments Trust only) | N/A | N/A |
T-3 Invesco Global Opportunities Fund
Trustees and Officers—(continued)
Name, Year of Birth and Position(s) Held with the Trust | Trustee and/ or Officer Since | Principal Occupation(s) During Past 5 Years | Number of Funds in Fund Complex Overseen by Trustee | Other Directorship(s) Held by Trustee During Past 5 Years | ||||
| Other Officers—(continued) | ||||||||
Sheri Morris — 1964 Vice President, Treasurer and Principal Financial Officer | 1999 | Vice President, Treasurer and Principal Financial Officer, The Invesco Funds; Vice President, Invesco Advisers, Inc. (formerly known as Invesco Institutional (N.A.), Inc.) (registered investment adviser); and Vice President, PowerShares Exchange-Traded Fund Trust, PowerShares Exchange-Traded Fund Trust II, PowerShares India Exchange-Traded Fund Trust and PowerShares Actively Managed Exchange-Traded Fund Trust
Formerly: Vice President, Invesco Aim Advisers, Inc., Invesco Aim Capital Management, Inc. and Invesco Aim Private Asset Management, Inc.; Assistant Vice President and Assistant Treasurer, The Invesco Funds and Assistant Vice President, Invesco Advisers, Inc., Invesco Aim Capital Management, Inc. and Invesco Aim Private Asset Management, Inc.; and Treasurer, PowerShares Exchange-Traded Fund Trust, PowerShares Exchange-Traded Fund Trust II, PowerShares India Exchange-Traded Fund Trust and PowerShares Actively Managed Exchange-Traded Fund Trust | N/A | N/A | ||||
Crissie M. Wisdom — 1969 Anti-Money Laundering Compliance Officer | 2013 | Anti-Money Laundering Compliance Officer, Invesco Advisers, Inc. (formerly known as Invesco Institutional (N.A.), Inc.) (registered investment adviser), Invesco Capital Markets, Inc. (formerly known as Van Kampen Funds Inc.), Invesco Distributors, Inc., Invesco Investment Services, Inc., Invesco Management Group, Inc., Van Kampen Exchange Corp., The Invesco Funds, Invesco Funds (Chicago), and PowerShares Exchange-Traded Fund Trust, PowerShares Exchange-Traded Fund Trust II, PowerShares India Exchange-Traded Fund Trust, and PowerShares Actively Managed Exchange-Traded Fund Trust; and Fraud Prevention Manager and Controls and Risk Analysis Manager for Invesco Investment Services, Inc. | N/A | N/A | ||||
Todd L. Spillane — 1958 Chief Compliance Officer | 2006 | Senior Vice President, Invesco Management Group, Inc. (formerly known as Invesco Aim Management Group, Inc.) and Van Kampen Exchange Corp.; Senior Vice President and Chief Compliance Officer, Invesco Advisers, Inc. (registered investment adviser) (formerly known as Invesco Institutional (N.A.), Inc.); Chief Compliance Officer, The Invesco Funds; Vice President, Invesco Distributors, Inc. (formerly known as Invesco Aim Distributors, Inc.) and Invesco Investment Services, Inc. (formerly known as Invesco Aim Investment Services, Inc.)
Formerly: Chief Compliance Officer, Invesco Funds (Chicago); Senior Vice President, Van Kampen Investments Inc.; Senior Vice President and Chief Compliance Officer, Invesco Aim Advisers, Inc. and Invesco Aim Capital Management, Inc.; Chief Compliance Officer, INVESCO Private Capital Investments, Inc. (holding company), Invesco Private Capital, Inc. (registered investment adviser), Invesco Global Asset Management (N.A.), Inc., Invesco Senior Secured Management, Inc. (registered investment adviser), Van Kampen Investor Services Inc., PowerShares Exchange-Traded Fund Trust, PowerShares Exchange-Traded Fund Trust II, PowerShares India Exchange-Traded Fund Trust and PowerShares Actively Managed Exchange-Traded Fund Trust; and Vice President, Invesco Aim Capital Management, Inc. and Fund Management Company | N/A | N/A |
The Statement of Additional Information of the Trust includes additional information about the Fund’s Trustees and is available upon request, without charge, by calling 1.800.959.4246. Please refer to the Fund’s prospectus for information on the Fund’s sub-advisers.
Office of the Fund 11 Greenway Plaza, Suite 1000 Houston, TX 77046-1173 | Investment Adviser Invesco Advisers, Inc. 1555 Peachtree Street, N.E. Atlanta, GA 30309 | Distributor Invesco Distributors, Inc. 11 Greenway Plaza, Suite 1000 Houston, TX 77046-1173 | Auditors PricewaterhouseCoopers LLP 1201 Louisiana Street, Suite 2900 Houston, TX 77002-5678 | |||
Counsel to the Fund Stradley Ronon Stevens & Young, LLP 2005 Market Street, Suite 2600 Philadelphia, PA 19103-7018 | Counsel to the Independent Trustees Goodwin Procter LLP 901 New York Avenue, N.W. Washington, D.C. 20001 | Transfer Agent Invesco Investment Services, Inc. 11 Greenway Plaza, Suite 1000 Houston, TX 77046-1173 | Custodian State Street Bank and Trust Company 225 Franklin Street Boston, MA 02110-2801 | |||
T-4 Invesco Global Opportunities Fund

Invesco mailing information
Send general correspondence to Invesco Investment Services, Inc., P.O. Box 219078, Kansas City, MO 64121-9078.
Invesco privacy policy
You share personal and financial information with us that is necessary for your transactions and your account records. We take very seriously the obligation to keep that information confidential and private.
Invesco collects nonpublic personal information about you from account applications or other forms you complete and from your transactions with us or our affiliates. We do not disclose information about you or our former customers to service providers or other third parties except to the extent necessary to service your account and in other limited circumstances as permitted by law. For example, we use this information to facilitate the delivery of transaction confirmations, financial reports, prospectuses and tax forms.
Even within Invesco, only people involved in the servicing of your accounts and compliance monitoring have access to your information. To ensure the highest level of confidentiality and security, Invesco maintains physical, electronic and procedural safeguards that meet or exceed federal standards. Special measures, such as data encryption and authentication, apply to your communications with us on our website. More detail is available to you at invesco.com/privacy.
Important notice regarding delivery of security holder documents
To reduce Fund expenses, only one copy of most shareholder documents may be mailed to shareholders with multiple accounts at the same address (Householding). Mailing of your shareholder documents may be householded indefinitely unless you instruct us otherwise. If you do not want the mailing of these documents to be combined with those for other members of your household, please contact Invesco Investment Services, Inc. at 800 959 4246 or contact your financial institution. We will begin sending you individual copies for each account within 30 days after receiving your request.
Fund holdings and proxy voting information
The Fund provides a complete list of its holdings four times in each fiscal year, at the quarter ends. For the second and fourth quarters, the lists appear in the Fund’s semiannual and annual reports to shareholders. For the first and third quarters, the Fund files the lists with the Securities and Exchange Commission (SEC) on Form N-Q. The most recent list of portfolio holdings is available at invesco.com/completeqtrholdings. Shareholders can also look up the Fund’s Forms N-Q on the SEC website at sec.gov. Copies of the Fund’s Forms N-Q may be reviewed and copied at the SEC Public Reference Room in Washington, D.C. You can obtain information on the operation of the Public Reference Room, including information about duplicating fee charges, by calling 202 551 8090 or 800 732 0330, or by electronic request at the following email address: publicinfo@sec.gov. The SEC file numbers for the Fund are shown below.
A description of the policies and procedures that the Fund uses to determine how to vote proxies relating to portfolio securities is available without charge, upon request, from our Client Services department at 800 959 4246 or at invesco.com/proxyguidelines. The information is also available on the SEC website, sec.gov.
Information regarding how the Fund voted proxies related to its portfolio securities during the most recent 12-month period ended June 30 is available at invesco.com/proxysearch. The information is also available on the SEC website, sec.gov. Invesco Advisers, Inc. is an investment adviser; it provides investment advisory services to individual and institutional clients and does not sell securities. Invesco Distributors, Inc. is the US distributor for Invesco Ltd.’s retail mutual funds, exchange-traded funds and institutional money market funds. Both are wholly owned, indirect subsidiaries of Invesco Ltd. |  |
SEC file numbers: 811-06463 and 033-44611 | GLOPP-AR-1 | Invesco Distributors, Inc. |
| ||||
| Annual Report to Shareholders
| �� | October 31, 2013 | |
| ||||
| Invesco Global Small & Mid Cap Growth Fund | ||||
Nasdaq: A: AGAAX ¡ B: AGABX ¡ C: AGACX ¡ Y: AGAYX ¡ R5: GAIIX | ||||


Letters to Shareholders
Philip Taylor | Dear Shareholders: Enclosed in this annual report, you’ll find information about your Fund and the factors that affected its performance during the reporting period. Inside, you’ll also find a discussion from your portfolio managers about how they managed your Fund, as well as performance data for your Fund, a complete list of your Fund’s investments as of the close of the reporting period and other important information. I hope you find this report of interest. During the reporting period covered by this report, major US equity indexes made multiyear or even all-time highs.1 Economic data were generally positive; housing and consumer spending data were particularly encouraging. Nonetheless, economic uncertainty and concern about continuing political and budget gridlock in Washington persisted. The US Federal Reserve’s deliberate vagueness about when, and to what degree, it might begin to curtail its extraordinarily accommodative monetary policies affected fixed income and equity markets alike. Most developed, non-US stock markets remained positive for the first half of 2013, despite a difficult second quarter. |

Periods of market volatility and economic uncertainty can weaken the will of even the most resolute investor. That’s why Invesco believes it’s often helpful to work with a skilled and trusted financial adviser who can emphasize the importance of adhering to an investment plan designed to achieve long-term goals rather than being sidetracked by short-term uncertainty that can result in inaction. A financial adviser who is familiar with your individual financial situation, investment goals and risk tolerance can be an invaluable partner as you work toward your financial goals. He or she can provide insight and perspective when markets are volatile; encouragement and reassurance when times are uncertain; and advice and guidance when your financial situation or investment goals change.
Our website, invesco.com/us, is another source of timely insight and information for investors. On the website, you’ll find fund-specific as well as more general information from many of Invesco’s investment professionals. You’ll find in-depth articles, video clips and audio commentaries – and, of course, you also can access information about your Invesco account whenever it’s convenient for you.
What we mean by Intentional Investing
At Invesco, all of our people and all of our resources are dedicated to helping investors achieve their financial objectives. It’s a philosophy we call Intentional Investing, and it guides the way we:
| n | Manage investments – Our dedicated investment professionals search the world for the best opportunities, and each investment team follows a clear, disciplined process to build portfolios and mitigate risk. |
| n | Provide choices – We offer multiple investment strategies, allowing you and your financial adviser to build a portfolio that’s purpose-built for your needs. |
| n | Connect with you – We’re committed to giving you the expert insights you need to make informed investing decisions, and we are well-equipped to provide high-quality support for investors and advisers. |
At Invesco, we believe in putting investors first. That’s why investment management is all we do. Our sole focus on managing your money allows you and your financial adviser to build a portfolio of Invesco funds appropriate for your investment needs and goals today and when your circumstances change.
Have questions?
For questions about your account, feel free to contact an Invesco client services representative at 800 959 4246. For Invesco-related questions or comments, please email me directly at phil@invesco.com.
All of us at Invesco look forward to serving your investment management needs for many years to come. Thank you for investing with us.
Sincerely,

Philip Taylor
Senior Managing Director, Invesco Ltd.
| 1 Source: | Reuters |
| 2 Invesco Global Small & Mid Cap Growth Fund |
Bruce Crockett | Dear Fellow Shareholders: The Invesco Funds Board has worked on a variety of issues over the last several months, and I’d like to take this opportunity to discuss two that affect you and our fellow fund shareholders. The first issue on which your Board has been working is our annual review of the funds’ advisory and sub-advisory contracts with Invesco Advisers and its affiliates. This annual review, which is required by the Investment Company Act of 1940, focuses on the nature and quality of the services Invesco provides as adviser to the Invesco Funds and the reasonableness of the fees that it charges for those services. Each year, we spend months reviewing detailed information that we request from Invesco that allows us to evaluate its services and fees. We also use information from many independent sources, including materials provided by the independent Senior Officer of the Invesco Funds, who |

reports directly to the independent Trustees on the Board. Additionally, we meet with independent legal counsel and review performance and fee data prepared by Lipper Inc., an independent, third-party firm widely recognized as a leader in its field.
I’m pleased to report that the Board determined in June that renewing the investment advisory agreement and the sub-advisory contracts with Invesco Advisers and its affiliates would serve the best interests of each fund and its shareholders.
The second area of focus to highlight is the Board’s efforts to ensure that we provide a lineup of funds that allow financial advisers to build portfolios that meet shareholders’ changing financial needs and goals. Today, more and more investors are reaching, or approaching, retirement. But interest rates remain low, making it difficult for many investors to generate the income they need, or will soon need, in their retirement years.
The members of your Board think about these things, too, and we’ve worked with Invesco Advisers to provide more income-generating options in the Invesco Funds lineup to help shareholders potentially meet their income needs. Your Board recently approved changes to three existing equity mutual funds, increasing their focus on generating income while also seeking to provide long-term growth of capital.
As a result of these changes, the funds and their respective management teams now have more flexibility to invest in the types of securities that could meet investors’ growing need for income generation, and in some cases, also help investors diversify their sources of income. These equity funds complement an array of fixed-income, asset allocation and alternative investment options in the Invesco Funds lineup designed to accommodate a variety of risk tolerances.
Be assured that your Board will continue working on behalf of fund shareholders, keeping your needs and interests uppermost in our minds.
As always, please contact me at bruce@brucecrockett.com with any questions or concerns you may have. On behalf of the Board, we look forward to continuing to represent your interests and serving your needs.
Sincerely,

Bruce L. Crockett
Independent Chair
Invesco Funds Board of Trustees
| 3 Invesco Global Small & Mid Cap Growth Fund |
Management’s Discussion of Fund Performance
Performance summary
Invesco Global Small & Mid Cap Growth Fund, at net asset value (NAV), delivered double-digit returns for the fiscal year ended October 31, 2013, and outperformed its style-specific benchmark, the MSCI World Growth Index. Relative outperformance was driven by strong stock selection in the US, Canada and Germany. The Fund’s emerging market exposure and modest cash position were the largest detractors from relative performance. Underweight exposure to Japan hurt relative results as well.
Your Fund’s long-term performance appears later in this report.
Fund vs. Indexes
Total returns, 10/31/12 to 10/31/13, at net asset value (NAV). Performance shown does not include applicable contingent deferred sales charges (CDSC) or front-end sales charges, which would have reduced performance.
Class A Shares | 26.56 | % | ||
Class B Shares | 25.58 | |||
Class C Shares | 25.56 | |||
Class Y Shares | 26.87 | |||
Class R5 Shares | 27.05 | |||
MSCI World Indexq (Broad Market Index) | 25.77 | |||
MSCI World Growth Indexn (Style-Specific Index) | 25.22 | |||
Lipper Global Small/Mid-Cap Funds Classification Averagen (Peer Group) | 28.47 |
Source(s): qInvesco, MSCI via FactSet Research Systems Inc.; nLipper Inc.
How we invest
When selecting stocks for your Fund, we use a disciplined investment strategy that emphasizes fundamental research to identify quality growth companies. This strategy is supported by quantitative analysis, portfolio construction and risk management techniques. Our EQV (earnings, quality and valuation) strategy focuses on identifying stocks that we believe have sustainable above-average earnings growth, efficient capital allocation and attractive prices.
While research responsibilities within the portfolio management team are focused by geographic region, we select investments for the Fund using a bottom-up investment approach, which means we construct the Fund primarily on a stock-by-stock basis. We focus on the strengths of individual companies rather than sectors, countries or market-cap
trends. We believe disciplined sell decisions are the key to successful investing. We consider selling a stock for several reasons, including when:
| n | Its price changes such that we believe it has become too expensive. |
| n | The original investment thesis for the company is no longer valid. |
| n | A more compelling investment opportunity is identified. |
Market conditions and your Fund
The fiscal year ended October 31, 2013, saw slow but steady improvement in global economies and strong US and global equity market returns. In late 2012 and early 2013, consumer confidence trended higher based on the recovery of the US housing market, but uncertainty surrounding the outcome of tax and spending negotiations between the White House and Congress – and
implementation of sequestration spending cuts – left many businesses hesitant to spend.
Asian equity markets (excluding Japan) experienced a volatile fiscal year but generally ended the reporting period on a positive note. Certain emerging Asian markets struggled, however, on the back of continued sensitivity to the global liquidity environment.
Japanese equities rose sharply, based on investors’ hopes that the new government led by Prime Minister Shinzo Abe, along with a “regime-changed” Bank of Japan, would finally stop deflation. However, the market consolidated in May amid a tug of war between investors’ optimistic view about Abe’s leadership and the potential of “Abenomics” and concerns about overseas uncertainties, particularly in the US, China and emerging economies.
Improving macroeconomic data and a continued reduction in political uncertainty buoyed European equity markets as the reporting period progressed. UK equities ended the reporting period strongly across many sectors, spurred by improving housing and employment data. Continental Europe posted strong gains for the reporting period as well; indeed the eurozone officially exited recession in August or September.
Overall, major US and global stock market indexes rose throughout 2013, hitting multiyear or all-time highs.1 In this environment, the Fund, at NAV, outperformed its style-specific benchmark, the MSCI World Growth Index. From a geographic perspective, favorable stock selection in the US was the largest contributor to relative results. The Fund’s top individual contributor to absolute and relative performance was Tesla Motors. The US-based electric car manufacturer benefited from higher-than-expected sales and profits during the reporting period.
Portfolio Composition
By sector
Financials | 21.0 | % | ||
Industrials | 17.0 | |||
Consumer Discretionary | 15.5 | |||
Information Technology | 12.7 | |||
Energy | 8.5 | |||
Health Care | 7.0 | |||
Materials | 5.4 | |||
Consumer Staples | 4.1 | |||
Utilities | 1.9 | |||
Telecommunication Services | 0.5 | |||
Money Market Funds | ||||
Plus Other Assets Less Liabilities | 6.4 |
Top 10 Equity Holdings*
1. DCC PLC | 2.6 | % | ||
2. Aryzta AG | 2.6 | |||
3. Onex Corp. | 2.6 | |||
4. IG Group Holdings PLC | 2.6 | |||
5. Informa PLC | 2.4 | |||
6. Cielo S.A. | 2.3 | |||
7. MorphoSys AG | 2.0 | |||
8. Micro Focus International PLC | 1.9 | |||
9. Siam Commercial Bank PCL | 1.9 | |||
10. Deutsche Boerse AG | 1.8 |
Total Net Assets | $ | 627.6 million | ||
Total Number of Holdings* | 100 | |||
The Fund’s holdings are subject to change, and there is no assurance that the Fund will continue to hold any particular security.
* Excluding money market fund holdings.
| 4 Invesco Global Small & Mid Cap Growth Fund |
Stock selection in Germany was the second-leading contributor to the Fund’s outperformance at NAV for the reporting period. MorphoSys, a German biotechnology company, was one of the leading contributors to relative performance. The company has a proprietary technology to develop human antibodies for specific diseases. Unlike many one-product biotechs, MorphoSys has a diversified portfolio of clinical compounds. The company was helped during the reporting period by signing two out-licensing deals with GlaxoSmithKline and Celgene (not Fund holdings) for their proprietary compounds, providing outside validation for its technology as well as upfront cash and future royalty payments. Select holdings in Canada and stock selection in the UK helped as well.
As mentioned earlier, however, the Fund’s exposure to several emerging markets, including Turkey, Tanzania and Thailand was a drag on relative performance. The benchmark had no exposure to these countries. African Barrick Gold, a gold mining company in Tanzania, was one of the leading individual detractors from Fund performance. Barrick, the world’s largest gold producer, was hurt this year as the price of gold depreciated. Fund holdings of Barrick were sold during the reporting period. The Fund’s underweight exposure to Japan hurt relative results as well.
At the sector level, the information technology sector was the leading contributor to relative results. Fund holdings in the software and services industry were the top contributors in the sector. Brazil’s biggest processor of credit card payments, Cielo, was one of the leading individual contributors during the reporting period. Strong stock selection in the consumer staples and health care sectors helped relative results as well. In contrast, overweight exposure and stock selection in the utilities sector was the leading detractor from relative performance. Energy Development, an energy company in the Philippines, was the largest detractor in the sector for the reporting period. Stock selection in the telecommunication services sector and a modest cash position also hurt Fund performance.
The Fund’s positioning is driven by our stock selection process, as opposed to any top-down or macro-based allocation criteria. At the end of the reporting period the Fund’s most significant overweight exposures versus the benchmark were in the UK and Canada. The most significant underweight exposures were in the US
and Japan. At the sector level, the most significant overweight positions were in the financials and industrials sectors. The most significant underweight exposure was in the consumer staples sector.
Over the reporting period, the Fund provided double-digit returns at NAV. While we are pleased to provide shareholders with this performance, it would be imprudent for us to suggest that such a level of return is sustainable over the long term. With market volatility likely to continue for some time, our focus remains on ensuring that our portfolio is comprised of high-quality, reasonably valued companies capable of sustained earnings growth. We believe that this balanced, EQV-focused approach may help deliver attractive returns over the long term. We thank you for your continued investment in Invesco Global Small & Mid Cap Growth Fund.
| 1 Source: Reuters |
The views and opinions expressed in management’s discussion of Fund performance are those of Invesco Advisers, Inc. These views and opinions are subject to change at any time based on factors such as market and economic conditions. These views and opinions may not be relied upon as investment advice or recommendations, or as an offer for a particular security. The information is not a complete analysis of every aspect of any market, country, industry, security or the Fund. Statements of fact are from sources considered reliable, but Invesco Advisers, Inc. makes no representation or warranty as to their completeness or accuracy. Although historical performance is no guarantee of future results, these insights may help you understand our investment management philosophy.
See important Fund and, if applicable, index disclosures later in this report.
 | Shuxin (Steve) Cao Chartered Financial Analyst, portfolio manager, is lead manager of Invesco Global Small & Mid | |
Cap Growth Fund with respect to the Fund’s investments in Asia Pacific and Latin America. He joined Invesco in 1997. Mr. Cao earned a BA in English from the Tianjin Foreign Language Institute and an MBA from Texas A&M University. He is also a Certified Public Accountant. | ||
| Jason Holzer Chartered Financial Analyst, portfolio manager, is lead manager of Invesco Global Small & Mid | |
| Cap Growth Fund with respect to the Fund’s investments in Europe and Canada. He joined Invesco in 1996. Mr. Holzer earned a BA in quantitative economics and an MS in engineering economic systems from Stanford University. | ||

| Jim Leach Chartered Financial Analyst, portfolio manager, is lead manager of Invesco Global Small & Mid | |
| Cap Growth Fund with respect to the domestic portion of the Fund’s portfolio. He joined Invesco in 2011. Mr. Leach earned a BS in mechanical engineering from the University of California and an MBA from New York University Stern School of Business. | ||

| Borge Endresen Chartered Financial Analyst, portfolio manager, is manager of Invesco Global Small & Mid | |
| Cap Growth Fund. He joined Invesco in 1999. Mr. Endresen earned a BS in finance from the University of Oregon and an MBA from The University of Texas at Austin. | ||

| 5 Invesco Global Small & Mid Cap Growth Fund |
Your Fund’s Long-Term Performance
Results of a $10,000 Investment – Oldest Share Class(es)
Fund and index data from 10/31/03
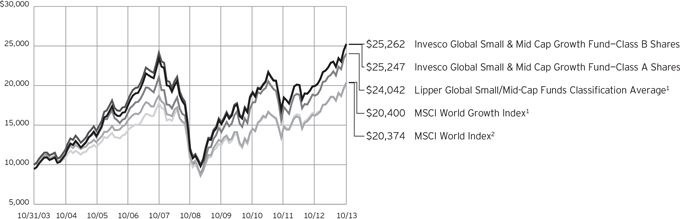
1 Source: Lipper Inc.
2 Source(s): Invesco, MSCI via FactSet Research Systems Inc.
Past performance cannot guarantee comparable future results.
The data shown in the chart include reinvested distributions, applicable sales charges and Fund expenses including management fees. Results for Class B shares are calculated as if a hypothetical
shareholder had liquidated his entire investment in the Fund at the close of the reporting period and paid the contingent deferred sales charges, if applicable. Index results include reinvested dividends, but they do not reflect sales charges. Performance of the peer group,
if applicable, reflects fund expenses and management fees; performance of a market index does not. Performance shown in the chart and table(s) does not reflect deduction of taxes a shareholder would pay on Fund distributions or sale of Fund shares.
continued from page 8
| n | The Fund is not managed to track the performance of any particular index, including the index(es) described here, and consequently, the performance of the Fund may deviate significantly from the performance of the index(es). |
| n | A direct investment cannot be made in an index. Unless otherwise indicated, index results include reinvested dividends, and they do not reflect sales charges. Performance of the peer group, if applicable, reflects fund expenses; performance of a market index does not. |
Other information
| n | CPA® and Certified Public Accountant® are trademarks owned by the American Institute of Certified Public Accountants. |
| n | The returns shown in management’s discussion of Fund performance are based on net asset values calculated for shareholder transactions. Generally accepted accounting principles require adjustments to be made to the net assets of the Fund at period end for financial reporting purposes, and as such, the net asset values for shareholder transactions and the returns based on those net asset values may differ from the net asset values and returns reported in the Financial Highlights. |
| n | Industry classifications used in this report are generally according to the Global Industry Classification Standard, which was developed by and is the exclusive property and a service mark of MSCI Inc. and Standard & Poor’s. |
| 6 Invesco Global Small & Mid Cap Growth Fund |
Average Annual Total Returns As of 10/31/13, including maximum applicable sales charges
|
| |||
Class A Shares | ||||
Inception (9/15/94) | 8.54 | % | ||
10 Years | 9.70 | |||
5 Years | 15.14 | |||
1 Year | 19.60 | |||
Class B Shares | ||||
Inception (9/15/94) | 8.62 | % | ||
10 Years | 9.71 | |||
5 Years | 15.36 | |||
1 Year | 20.58 | |||
Class C Shares | ||||
Inception (8/4/97) | 5.64 | % | ||
10 Years | 9.54 | |||
5 Years | 15.57 | |||
1 Year | 24.56 | |||
Class Y Shares | ||||
10 Years | 10.47 | % | ||
5 Years | 16.74 | |||
1 Year | 26.87 | |||
Class R5 Shares | ||||
10 Years | 10.68 | % | ||
5 Years | 17.04 | |||
1 Year | 27.05 | |||
Class Y shares incepted on October 3, 2008. Performance shown prior to that date is that of Class A shares and includes the 12b-1 fees applicable to Class A shares. Class A share performance reflects any applicable fee waivers or expense reimbursements.
Class R5 shares incepted on September 28, 2007. Performance shown prior to that date is that of Class A shares and includes the 12b-1 fees applicable to Class A shares. Class A share performance reflects any applicable fee waivers or expense reimbursements.
The performance data quoted represent past performance and cannot guarantee comparable future results; current performance may be lower or higher. Please visit invesco.com/performance for the most recent month-end performance. Performance figures reflect reinvested distributions, changes in net asset value and the effect of the maximum sales charge unless otherwise stated. Investment return and principal value will fluctuate so that you may have a gain or loss when you sell shares.
Average Annual Total Returns As of 9/30/13, the most recent calendar quarter end, including maximum applicable sales charges
|
| |||
Class A Shares | ||||
Inception (9/15/94) | 8.39 | % | ||
10 Years | 10.08 | |||
5 Years | 8.79 | |||
1 Year | 16.01 | |||
Class B Shares | ||||
Inception (9/15/94) | 8.47 | % | ||
10 Years | 10.08 | |||
5 Years | 8.92 | |||
1 Year | 16.90 | |||
Class C Shares | ||||
Inception (8/4/97) | 5.46 | % | ||
10 Years | 9.91 | |||
5 Years | 9.19 | |||
1 Year | 20.88 | |||
Class Y Shares | ||||
10 Years | 10.84 | % | ||
5 Years | 10.30 | |||
1 Year | 23.10 | |||
Class R5 Shares | ||||
10 Years | 11.06 | % | ||
5 Years | 10.59 | |||
1 Year | 23.33 | |||
The total annual Fund operating expense ratio set forth in the most recent Fund prospectus as of the date of this report for Class A, Class B, Class C, Class Y and Class R5 shares was 1.43%, 2.18%, 2.18%, 1.18% and 0.95%, respectively. The expense ratios presented above may vary from the expense ratios presented in other sections of this report that are based on expenses incurred during the period covered by this report.
Class A share performance reflects the maximum 5.50% sales charge, and Class B and Class C share performance reflects the applicable contingent deferred sales charge (CDSC) for the period involved. The CDSC on Class B shares declines from 5% beginning at the time of purchase to 0% at the beginning of the seventh year. The CDSC on Class C shares is 1% for the first year after purchase. Class Y and Class R5 shares do not have a front-end sales charge or a CDSC; therefore, performance is at net asset value.
The performance of the Fund’s share classes will differ primarily due to different sales charge structures and class expenses.
| 7 Invesco Global Small & Mid Cap Growth Fund |
Invesco Global Small & Mid Cap Growth Fund’s investment objective is long-term growth of capital.
| n | Unless otherwise stated, information presented in this report is as of October 31, 2013, and is based on total net assets. |
| n | Unless otherwise noted, all data provided by Invesco. |
| n | To access your Fund’s reports/prospectus, visit invesco.com/fundreports. |
About share classes
| n | Class B shares may not be purchased for new or additional investments. Please see the prospectus for more information. |
| n | Class Y shares are available only to certain investors. Please see the prospectus for more information. |
| n | Class R5 shares are primarily intended for employer sponsored retirement and benefit plans that meet certain standards and for institutional investors. On September 24, 2012, Institutional Class shares were renamed Class R5 shares. Please see the prospectus for more information. |
Principal risks of investing in the Fund
| n | Depositary receipts risk. Depositary receipts involve many of the same risks as those associated with direct investment in foreign securities. In addition, the underlying issuers of certain depositary receipts, particularly unsponsored or unregistered depositary receipts, are under no obligation to distribute shareholder communications to the holders of such receipts or to pass through to them any voting rights with respect to the deposited securities. |
| n | Derivatives risk. The performance of derivative instruments is tied to the performance of an underlying currency, security, index, commodity or other asset. In addition to risks relating to their underlying assets, the use of derivatives may include other, possibly greater, risks. Derivatives involve costs, may be volatile, and may involve a small initial investment relative to the risk assumed. Risks associated with the use of derivatives may include counterparty, margin, leverage, correlation, liquidity, tax, market, interest rate and management risks, as well as the risk of potential increased regulation of derivatives. Derivatives may also be more difficult to purchase, sell or value than other |
investments. The Fund may lose more than the cash amount invested on investments in derivatives. Each of these risks is greater for the Fund than mutual funds that do not use derivatives to implement their investment strategy. |
| n | Developing/emerging markets securities risk. The prices of securities issued by foreign companies and governments located in developing/emerging markets countries may be affected more negatively by inflation, devaluation of their currencies, higher transaction costs, delays in settlement, adverse political developments, the introduction of capital controls, withholding taxes, nationalization of private assets, expropriation, social unrest, war or lack of timely information than those in developed countries. |
| n | Foreign securities risk. The Fund’s foreign investments may be affected by changes in a foreign country’s exchange rates, political and social instability, changes in economic or taxation policies, difficulties when enforcing obligations, decreased liquidity, and increased volatility. Foreign companies may be subject to less regulation resulting in less publicly available information about the companies. |
| n | Geographic focus risk. From time to time the Fund may invest a substantial amount of its assets in securities of issuers located in a single country or a limited number of countries. If the Fund focuses its investments in this manner, it assumes the risk that economic, political and social conditions in those countries will have a significant impact on its investment performance. The Fund’s investment performance may also be more volatile if it focuses its investments in certain countries, especially emerging markets countries. |
| n | Growth investing risk. Growth stocks tend to be more expensive relative to their earnings or assets compared with other types of stock. As a result they |
tend to be more sensitive to changes in their earnings and can be more volatile. |
| n | Management risk. The investment techniques and risk analysis used by the Fund’s portfolio managers may not produce the desired results. |
| n | Market risk. The prices of and the income generated by the Fund’s securities may decline in response to, among other things, investor sentiment, general economic and market conditions, regional or global instability, and currency and interest rate fluctuations. |
| n | Small-and mid-capitalization risks. Stocks of small-and mid-sized companies tend to be more vulnerable to adverse developments and may have little or no operating history or track record of success, and limited product lines, markets, management and financial resources. The securities of small- and mid-sized companies may be more volatile due to less market interest and less publicly available information about the issuer. They also may be illiquid or restricted as to resale, or may trade less frequently and in smaller volumes, all of which may cause difficulty when establishing or closing a position at a desirable price. |
About indexes used in this report
| n | The MSCI World IndexSM is an unmanaged index considered representative of stocks of developed countries. The index is computed using the net return, which withholds applicable taxes for non-resident investors. |
| n | The MSCI World Growth Index is an unmanaged index considered representative of growth stocks of developed countries. The index is computed using the net return, which withholds applicable taxes for non-resident investors. |
| n | The Lipper Global Small/Mid-Cap Funds Classification Average represents an average of all funds in the Lipper Global Small/Mid-Cap Funds classification. |
continued on page 6
This report must be accompanied or preceded by a currently effective Fund prospectus, which contains more complete information, including sales charges and expenses. Investors should read it carefully before investing.
NOT FDIC INSURED | MAY LOSE VALUE | NO BANK GUARANTEE
Fund Nasdaq Symbols
Class A Shares | AGAAX | |
Class B Shares | AGABX | |
Class C Shares | AGACX | |
Class Y Shares | AGAYX | |
Class R5 Shares | GAIIX | |
| 8 Invesco Global Small & Mid Cap Growth Fund |
Schedule of Investments
October 31, 2013
| Shares | Value | |||||||
Common Stocks & Other Equity Interests–93.60% |
| |||||||
| Australia–1.26% | ||||||||
Computershare Ltd. | 779,807 | $ | 7,916,170 | |||||
| Belgium–0.65% | ||||||||
S.A. D’Ieteren N.V. | 86,244 | 4,062,122 | ||||||
| Brazil–5.30% | ||||||||
CETIP S.A.–Mercados Organizados | 767,200 | 8,508,460 | ||||||
Cielo S.A. | 473,226 | 14,367,072 | ||||||
Duratex S.A. | 1,661,694 | 10,364,258 | ||||||
| 33,239,790 | ||||||||
| Canada–9.30% | ||||||||
Fairfax Financial Holdings Ltd. | 20,671 | 9,021,009 | ||||||
MacDonald, Dettwiler and Associates Ltd. | 62,200 | 4,745,837 | ||||||
Onex Corp. | 302,723 | 15,995,598 | ||||||
Open Text Corp. | 102,645 | 7,543,315 | ||||||
Paramount Resources Ltd.–Class A(a) | 296,410 | 10,271,718 | ||||||
Precision Drilling Corp. | 870,962 | 9,214,187 | ||||||
TransForce, Inc. | 72,826 | 1,607,998 | ||||||
| 58,399,662 | ||||||||
| China–2.28% | ||||||||
Lee & Man Paper Manufacturing Ltd. | 12,159,000 | 8,737,323 | ||||||
NetEase, Inc.–ADR | 82,500 | 5,569,575 | ||||||
| 14,306,898 | ||||||||
| Germany–5.19% | ||||||||
Brenntag AG | 29,717 | 5,035,277 | ||||||
Deutsche Boerse AG | 151,855 | 11,432,322 | ||||||
MorphoSys AG(a) | 157,821 | 12,237,164 | ||||||
MTU Aero Engines AG | 39,000 | 3,896,613 | ||||||
| 32,601,376 | ||||||||
| Hong Kong–1.52% | ||||||||
Hongkong Land Holdings Ltd. | 1,545,000 | 9,517,200 | ||||||
| Indonesia–0.84% | ||||||||
PT Perusahaan Gas Negara Persero Tbk | 11,638,000 | 5,264,662 | ||||||
| Ireland–3.76% | ||||||||
DCC PLC | 366,961 | 16,467,877 | ||||||
Shire PLC | 161,020 | 7,137,087 | ||||||
| 23,604,964 | ||||||||
| Israel–0.82% | ||||||||
Israel Chemicals Ltd. | 624,624 | 5,168,887 | ||||||
| Italy–1.04% | ||||||||
Saipem S.p.A. | 279,763 | 6,555,939 | ||||||
| Japan–3.06% | ||||||||
EXEDY Corp. | 339,300 | 10,073,539 | ||||||
THK Co., Ltd. | 417,300 | 9,100,476 | ||||||
| 19,174,015 | ||||||||
| Shares | Value | |||||||
| Netherlands–0.56% | ||||||||
NXP Semiconductors N.V.(a) | 82,827 | $ | 3,488,673 | |||||
| Philippines–1.89% | ||||||||
Ayala Corp. | 364,019 | 5,079,923 | ||||||
Energy Development Corp. | 50,672,100 | 6,801,624 | ||||||
| 11,881,547 | ||||||||
| South Africa–1.72% | ||||||||
Naspers Ltd.–Class N | 115,538 | 10,807,087 | ||||||
| South Korea–0.15% | ||||||||
NHN Entertainment Corp.(a) | 8,869 | 948,999 | ||||||
| Sweden–1.30% | ||||||||
Investment AB Kinnevik–Class B | 221,178 | 8,136,962 | ||||||
| Switzerland–3.41% | ||||||||
Aryzta AG | 217,713 | 16,246,617 | ||||||
Tecan Group AG | 49,036 | 5,124,401 | ||||||
| 21,371,018 | ||||||||
| Thailand–1.93% | ||||||||
Siam Commercial Bank PCL (The) | 2,302,100 | 12,104,593 | ||||||
| Turkey–3.02% | ||||||||
Haci Omer Sabanci Holding A.S. | 1,770,697 | 8,374,934 | ||||||
Koza Altin Isletmeleri A.S. | 130,000 | 2,299,276 | ||||||
Tupras-Turkiye Petrol Rafinerileri A.S. | 363,635 | 8,250,772 | ||||||
| 18,924,982 | ||||||||
| Turkmenistan–1.27% | ||||||||
Dragon Oil PLC | 847,085 | 7,999,394 | ||||||
| United Kingdom–16.97% | ||||||||
Aberdeen Asset Management PLC | 611,000 | 4,338,720 | ||||||
Bunzl PLC | 355,093 | 7,839,545 | ||||||
Chemring Group PLC | 928,643 | 3,238,343 | ||||||
Compass Group PLC | 458,704 | 6,596,898 | ||||||
Homeserve PLC | 1,650,642 | 6,203,336 | ||||||
IG Group Holdings PLC | 1,623,859 | 15,972,676 | ||||||
Informa PLC | 1,662,227 | 14,877,964 | ||||||
Lancashire Holdings Ltd. | 637,330 | 8,306,770 | ||||||
Micro Focus International PLC | 927,956 | 12,159,058 | ||||||
Smiths Group PLC | 396,534 | 9,123,198 | ||||||
UBM PLC | 424,848 | 4,655,720 | ||||||
Ultra Electronics Holdings PLC | 266,074 | 8,261,084 | ||||||
William Hill PLC | 769,250 | 4,944,454 | ||||||
| 106,517,766 | ||||||||
| United States–26.36% | ||||||||
Actavis PLC(a) | 13,349 | 2,063,488 | ||||||
Affiliated Managers Group, Inc.(a) | 29,897 | 5,902,864 | ||||||
Alliance Data Systems Corp.(a) | 12,619 | 2,991,460 | ||||||
See accompanying Notes to Financial Statements which are an integral part of the financial statements.
9 Invesco Global Small & Mid Cap Growth Fund
| Shares | Value | |||||||
| United States–(continued) | ||||||||
AMETEK, Inc. | 97,106 | $ | 4,644,580 | |||||
Amphenol Corp.–Class A | 51,953 | 4,171,306 | ||||||
Applied Materials, Inc. | 70,517 | 1,258,728 | ||||||
Aspen Technology, Inc.(a) | 107,829 | 4,122,303 | ||||||
B/E Aerospace, Inc.(a) | 66,986 | 5,436,584 | ||||||
Best Buy Co., Inc. | 115,392 | 4,938,778 | ||||||
BioMarin Pharmaceutical Inc.(a) | 50,272 | 3,158,087 | ||||||
Cadence Design Systems, Inc.(a) | 215,241 | 2,791,676 | ||||||
Catamaran Corp.(a) | 61,113 | 2,869,866 | ||||||
Church & Dwight Co., Inc. | 34,987 | 2,279,403 | ||||||
Cinemark Holdings, Inc. | 161,260 | 5,290,941 | ||||||
Cummins Inc. | 20,951 | 2,661,196 | ||||||
Dick’s Sporting Goods, Inc. | 86,571 | 4,606,443 | ||||||
Discover Financial Services | 65,493 | 3,397,777 | ||||||
Dresser-Rand Group, Inc.(a) | 38,803 | 2,358,058 | ||||||
EQT Corp. | 37,376 | 3,199,759 | ||||||
F5 Networks, Inc.(a) | 24,281 | 1,979,144 | ||||||
Fastenal Co. | 80,039 | 3,985,942 | ||||||
Gulfport Energy Corp.(a) | 46,915 | 2,753,441 | ||||||
Harman International Industries, Inc. | 44,439 | 3,600,448 | ||||||
IntercontinentalExchange Group, Inc.(a) | 13,231 | 2,550,011 | ||||||
Kansas City Southern | 24,711 | 3,002,881 | ||||||
KAR Auction Services Inc. | 64,564 | 1,918,842 | ||||||
Lennox International Inc. | 41,565 | 3,244,564 | ||||||
MasTec Inc.(a) | 95,281 | 3,046,134 | ||||||
Mead Johnson Nutrition Co. | 56,586 | 4,620,813 | ||||||
Medivation Inc.(a) | 40,298 | 2,412,238 | ||||||
Michael Kors Holdings Ltd.(a) | 54,682 | 4,207,780 | ||||||
O’Reilly Automotive, Inc.(a) | 26,564 | 3,288,889 | ||||||
Omnicare, Inc. | 74,055 | 4,084,133 | ||||||
| Shares | Value | |||||||
| United States–(continued) | ||||||||
Pentair Ltd. | 38,357 | $ | 2,573,371 | |||||
Pioneer Natural Resources Co. | 12,072 | 2,472,104 | ||||||
PPG Industries, Inc. | 40,584 | 7,409,827 | ||||||
PVH Corp. | 36,391 | 4,533,227 | ||||||
Salesforce.com, Inc.(a) | 54,389 | 2,902,197 | ||||||
SBA Communications Corp.–Class A(a) | 34,956 | 3,057,601 | ||||||
Sprouts Farmers Market, Inc.(a) | 61,871 | 2,849,778 | ||||||
Tesla Motors, Inc.(a) | 13,648 | 2,182,861 | ||||||
Tractor Supply Co. | 33,964 | 2,423,331 | ||||||
Triumph Group, Inc. | 27,358 | 1,960,201 | ||||||
Under Armour, Inc.–Class A(a) | 27,099 | 2,199,084 | ||||||
Universal Health Services, Inc.–Class B | 63,007 | 5,075,844 | ||||||
Vanitv, Inc.–Class A(a) | 91,000 | 2,502,500 | ||||||
Verisk Analytics, Inc.–Class A(a) | 47,943 | 3,285,054 | ||||||
Waste Connections, Inc. | 74,751 | 3,194,858 | ||||||
Wynn Resorts Ltd. | 23,721 | 3,943,616 | ||||||
| 165,404,011 | ||||||||
Total Common Stocks & Other Equity Interests |
| 587,396,717 | ||||||
Money Market Funds–6.73% |
| |||||||
Liquid Assets Portfolio–Institutional | 21,114,248 | 21,114,248 | ||||||
Premier Portfolio–Institutional | 21,114,247 | 21,114,247 | ||||||
Total Money Market Funds |
| 42,228,495 | ||||||
TOTAL INVESTMENTS–100.33% |
| 629,625,212 | ||||||
OTHER ASSETS LESS LIABILITIES–(0.33)% |
| (2,058,708 | ) | |||||
NET ASSETS–100.00% |
| $ | 627,566,504 | |||||
Investment Abbreviations:
| ADR | – American Depositary Receipt |
Notes to Schedule of Investments:
| (a) | Non-income producing security. |
| (b) | The money market fund and the Fund are affiliated by having the same investment adviser. |
See accompanying Notes to Financial Statements which are an integral part of the financial statements.
10 Invesco Global Small & Mid Cap Growth Fund
Statement of Assets and Liabilities
October 31, 2013
Assets: |
| |||
Investments, at value (Cost $389,357,716) | $ | 587,396,717 | ||
Investments in affiliated money market funds, at value and cost | 42,228,495 | |||
Total investments, at value (Cost $431,586,211) | 629,625,212 | |||
Foreign currencies, at value (Cost $68,059) | 68,124 | |||
Receivable for: | ||||
Investments sold | 1,058,826 | |||
Fund shares sold | 254,370 | |||
Dividends | 1,660,764 | |||
Investment for trustee deferred compensation and retirement plans | 87,673 | |||
Other assets | 25,086 | |||
Total assets | 632,780,055 | |||
Liabilities: |
| |||
Payable for: | ||||
Investments purchased | 2,689,657 | |||
Fund shares reacquired | 465,103 | |||
Accrued foreign taxes | 1,344,317 | |||
Accrued fees to affiliates | 414,197 | |||
Accrued trustees’ and officers’ fees and benefits | 2,739 | |||
Accrued other operating expenses | 63,854 | |||
Trustee deferred compensation and retirement plans | 233,684 | |||
Total liabilities | 5,213,551 | |||
Net assets applicable to shares outstanding | $ | 627,566,504 | ||
Net assets consist of: |
| |||
Shares of beneficial interest | $ | 372,896,258 | ||
Undistributed net investment income | 4,572,759 | |||
Undistributed net realized gain | 52,071,127 | |||
Net unrealized appreciation | 198,026,360 | |||
| $ | 627,566,504 | |||
Net Assets: |
| |||
Class A | $ | 550,526,333 | ||
Class B | $ | 15,404,756 | ||
Class C | $ | 28,504,611 | ||
Class Y | $ | 10,545,803 | ||
Class R5 | $ | 22,585,001 | ||
Shares outstanding, $0.001 par value per share, |
| |||
Class A | 24,903,851 | |||
Class B | 803,236 | |||
Class C | 1,485,186 | |||
Class Y | 475,551 | |||
Class R5 | 1,022,798 | |||
Class A: | ||||
Net asset value per share | $ | 22.11 | ||
Maximum offering price per share | ||||
(Net asset value of $22.11 ¸ 94.50%) | $ | 23.40 | ||
Class B: | ||||
Net asset value and offering price per share | $ | 19.18 | ||
Class C: | ||||
Net asset value and offering price per share | $ | 19.19 | ||
Class Y: | ||||
Net asset value and offering price per share | $ | 22.18 | ||
Class R5: | ||||
Net asset value and offering price per share | $ | 22.08 | ||
See accompanying Notes to Financial Statements which are an integral part of the financial statements.
11 Invesco Global Small & Mid Cap Growth Fund
Statement of Operations
For the year ended October 31, 2013
Investment income: |
| |||
Dividends (net of foreign withholding taxes of $617,794) | $ | 13,020,437 | ||
Dividends from affiliated money market funds | 22,816 | |||
Total investment income | 13,043,253 | |||
Expenses: | ||||
Advisory fees | 4,567,369 | |||
Administrative services fees | 153,684 | |||
Custodian fees | 204,564 | |||
Distribution fees: | ||||
Class A | 1,273,610 | |||
Class B | 162,602 | |||
Class C | 251,694 | |||
Transfer agent fees — A, B, C and Y | 1,294,487 | |||
Transfer agent fees — R5 | 12,415 | |||
Trustees’ and officers’ fees and benefits | 43,896 | |||
Other | 281,075 | |||
Total expenses | 8,245,396 | |||
Less: Fees waived and expense offset arrangement(s) | (45,072 | ) | ||
Net expenses | 8,200,324 | |||
Net investment income | 4,842,929 | |||
Realized and unrealized gain (loss) from: | ||||
Net realized gain (loss) from: | ||||
Investment securities | 52,931,440 | |||
Foreign currencies | (6,879 | ) | ||
| 52,924,561 | ||||
Change in net unrealized appreciation (depreciation) of: | ||||
Investment securities (net of foreign taxes on holdings of $(11,766)) | 78,881,616 | |||
Foreign currencies | (9,893 | ) | ||
| 78,871,723 | ||||
Net realized and unrealized gain | 131,796,284 | |||
Net increase in net assets resulting from operations | $ | 136,639,213 | ||
See accompanying Notes to Financial Statements which are an integral part of the financial statements.
12 Invesco Global Small & Mid Cap Growth Fund
Statement of Changes in Net Assets
For the years ended October 31, 2013 and 2012
| 2013 | 2012 | |||||||
Operations: |
| |||||||
Net investment income | $ | 4,842,929 | $ | 5,450,446 | ||||
Net realized gain | 52,924,561 | 8,335,540 | ||||||
Change in net unrealized appreciation | 78,871,723 | 28,821,103 | ||||||
Net increase in net assets resulting from operations | 136,639,213 | 42,607,089 | ||||||
Distributions to shareholders from net investment income: | ||||||||
Class A | (4,227,552 | ) | (6,820,626 | ) | ||||
Class B | (57,975 | ) | (108,863 | ) | ||||
Class C | (77,135 | ) | (111,931 | ) | ||||
Class Y | (79,225 | ) | (127,196 | ) | ||||
Class R5 | (261,890 | ) | (454,708 | ) | ||||
Total distributions from net investment income | (4,703,777 | ) | (7,623,324 | ) | ||||
Distributions to shareholders from net realized gains: | ||||||||
Class A | (6,624,317 | ) | (30,688,616 | ) | ||||
Class B | (269,646 | ) | (1,557,807 | ) | ||||
Class C | (358,765 | ) | (1,601,713 | ) | ||||
Class Y | (100,004 | ) | (461,675 | ) | ||||
Class R5 | (280,332 | ) | (1,386,928 | ) | ||||
Total distributions from net realized gains | (7,633,064 | ) | (35,696,739 | ) | ||||
Share transactions–net: | ||||||||
Class A | (40,619,630 | ) | (26,615,988 | ) | ||||
Class B | (5,498,523 | ) | (5,249,848 | ) | ||||
Class C | 787,053 | (811,631 | ) | |||||
Class Y | 1,252,481 | (148,594 | ) | |||||
Class R5 | (2,525,975 | ) | (2,384,743 | ) | ||||
Net increase (decrease) in net assets resulting from share transactions | (46,604,594 | ) | (35,210,804 | ) | ||||
Net increase (decrease) in net assets | 77,697,778 | (35,923,778 | ) | |||||
Net assets: | ||||||||
Beginning of year | 549,868,726 | 585,792,504 | ||||||
End of year (includes undistributed net investment income of $4,572,759 and $4,440,486, respectively) | $ | 627,566,504 | $ | 549,868,726 | ||||
Notes to Financial Statements
October 31, 2013
NOTE 1—Significant Accounting Policies
Invesco Global Small & Mid Cap Growth Fund (the “Fund”) is a series portfolio of AIM International Mutual Funds (Invesco International Mutual Funds) (the “Trust”). The Trust is a Delaware statutory trust registered under the Investment Company Act of 1940, as amended (the “1940 Act”), as an open-end series management investment company consisting of eight separate portfolios, each authorized to issue an unlimited number of shares of beneficial interest. The assets, liabilities and operations of each portfolio are accounted for separately. Information presented in these financial statements pertains only to the Fund. Matters affecting each portfolio or class will be voted on exclusively by the shareholders of such portfolio or class.
The Fund’s investment objective is long-term growth of capital.
The Fund currently consists of five different classes of shares: Class A, Class B, Class C, Class Y and Class R5. Class A shares are sold with a front-end sales charge unless certain waiver criteria are met and under certain circumstances load waived shares may be subject to contingent deferred sales charges (“CDSC”). Class C shares are sold with a CDSC. Class Y and Class R5 shares are sold at net asset value. Effective November 30, 2010, new or additional investments in Class B shares are no longer permitted. Existing shareholders of Class B shares may continue to reinvest dividends and capital gains distributions in Class B shares until they convert to Class A shares. Also, shareholders in Class B shares will be able to exchange those shares for Class B shares of other Invesco Funds offering such shares until they convert to Class A shares. Generally, Class B shares will automatically convert to Class A shares on or about the month-end, which is at least eight years after the date of purchase. Redemption of Class B shares prior to the conversion date will be subject to a CDSC.
13 Invesco Global Small & Mid Cap Growth Fund
The following is a summary of the significant accounting policies followed by the Fund in the preparation of its financial statements.
| A. | Security Valuations — Securities, including restricted securities, are valued according to the following policy. |
A security listed or traded on an exchange (except convertible bonds) is valued at its last sales price or official closing price as of the close of the customary trading session on the exchange where the security is principally traded, or lacking any sales or official closing price on a particular day, the security may be valued at the closing bid price on that day. Securities traded in the over-the-counter market are valued based on prices furnished by independent pricing services or market makers. When such securities are valued by an independent pricing service they may be considered fair valued. Futures contracts are valued at the final settlement price set by an exchange on which they are principally traded. Listed options are valued at the mean between the last bid and ask prices from the exchange on which they are principally traded. Options not listed on an exchange are valued by an independent source at the mean between the last bid and ask prices. For purposes of determining net asset value per share, futures and option contracts generally are valued 15 minutes after the close of the customary trading session of the New York Stock Exchange (“NYSE”).
Investments in open-end and closed-end registered investment companies that do not trade on an exchange are valued at the end of day net asset value per share. Investments in open-end and closed-end registered investment companies that trade on an exchange are valued at the last sales price or official closing price as of the close of the customary trading session on the exchange where the security is principally traded.
Debt obligations (including convertible bonds) and unlisted equities are fair valued using an evaluated quote provided by an independent pricing service. Evaluated quotes provided by the pricing service may be determined without exclusive reliance on quoted prices, and may reflect appropriate factors such as institution-size trading in similar groups of securities, developments related to specific securities, dividend rate (for unlisted equities), yield (for debt obligations), quality, type of issue, coupon rate (for debt obligations), maturity (for debt obligations), individual trading characteristics and other market data. Debt obligations are subject to interest rate and credit risks. In addition, all debt obligations involve some risk of default with respect to interest and/or principal payments.
Foreign securities’ (including foreign exchange contracts) prices are converted into U.S. dollar amounts using the applicable exchange rates as of the close of the NYSE. If market quotations are available and reliable for foreign exchange-traded equity securities, the securities will be valued at the market quotations. Because trading hours for certain foreign securities end before the close of the NYSE, closing market quotations may become unreliable. If between the time trading ends on a particular security and the close of the customary trading session on the NYSE, events occur that the Adviser determines are significant and make the closing price unreliable, the Fund may fair value the security. If the event is likely to have affected the closing price of the security, the security will be valued at fair value in good faith using procedures approved by the Board of Trustees. Adjustments to closing prices to reflect fair value may also be based on a screening process of an independent pricing service to indicate the degree of certainty, based on historical data, that the closing price in the principal market where a foreign security trades is not the current value as of the close of the NYSE. Foreign securities’ prices meeting the approved degree of certainty that the price is not reflective of current value will be priced at the indication of fair value from the independent pricing service. Multiple factors may be considered by the independent pricing service in determining adjustments to reflect fair value and may include information relating to sector indices, American Depositary Receipts and domestic and foreign index futures. Foreign securities may have additional risks including exchange rate changes, potential for sharply devalued currencies and high inflation, political and economic upheaval, the relative lack of issuer information, relatively low market liquidity and the potential lack of strict financial and accounting controls and standards.
Securities for which market prices are not provided by any of the above methods may be valued based upon quotes furnished by independent sources. The last bid price may be used to value equity securities. The mean between the last bid and asked prices is used to value debt obligations, including corporate loans.
Securities for which market quotations are not readily available or became unreliable are valued at fair value as determined in good faith by or under the supervision of the Trust’s officers following procedures approved by the Board of Trustees. Issuer specific events, market trends, bid/ask quotes of brokers and information providers and other market data may be reviewed in the course of making a good faith determination of a security’s fair value.
Valuations change in response to many factors including the historical and prospective earnings of the issuer, the value of the issuer’s assets, general economic conditions, interest rates, investor perceptions and market liquidity. Because of the inherent uncertainties of valuation, the values reflected in the financial statements may materially differ from the value received upon actual sale of those investments.
| B. | Securities Transactions and Investment Income — Securities transactions are accounted for on a trade date basis. Realized gains or losses on sales are computed on the basis of specific identification of the securities sold. Interest income is recorded on the accrual basis from settlement date. Dividend income (net of withholding tax, if any) is recorded on the ex-dividend date. |
The Fund may periodically participate in litigation related to Fund investments. As such, the Fund may receive proceeds from litigation settlements. Any proceeds received are included in the Statement of Operations as realized gain (loss) for investments no longer held and as unrealized gain (loss) for investments still held.
Brokerage commissions and mark ups are considered transaction costs and are recorded as an increase to the cost basis of securities purchased and/or a reduction of proceeds on a sale of securities. Such transaction costs are included in the determination of net realized and unrealized gain (loss) from investment securities reported in the Statement of Operations and the Statement of Changes in Net Assets and the net realized and unrealized gains (losses) on securities per share in the Financial Highlights. Transaction costs are included in the calculation of the Fund’s net asset value and, accordingly, they reduce the Fund’s total returns. These transaction costs are not considered operating expenses and are not reflected in net investment income reported in the Statement of Operations and Statement of Changes in Net Assets, or the net investment income per share and ratios of expenses and net investment income reported in the Financial Highlights, nor are they limited by any expense limitation arrangements between the Fund and the investment adviser.
The Fund allocates income and realized and unrealized capital gains and losses to a class based on the relative net assets of each class.
| C. | Country Determination — For the purposes of making investment selection decisions and presentation in the Schedule of Investments, the investment adviser may determine the country in which an issuer is located and/or credit risk exposure based on various factors. These factors include the laws of the country under which the issuer is organized, where the issuer maintains a principal office, the country in which the issuer derives 50% or more of its total revenues and the country that has the primary market for the issuer’s securities, as well as other criteria. Among the other criteria that may be evaluated for making this determination are the country in which the issuer maintains 50% or more of its assets, |
14 Invesco Global Small & Mid Cap Growth Fund
| the type of security, financial guarantees and enhancements, the nature of the collateral and the sponsor organization. Country of issuer and/or credit risk exposure has been determined to be the United States of America, unless otherwise noted. |
| D. | Distributions — Distributions from income and net realized capital gain, if any, are generally declared and paid annually and recorded on the ex-dividend date. The Fund may elect to treat a portion of the proceeds from redemptions as distributions for federal income tax purposes. |
| E. | Federal Income Taxes — The Fund intends to comply with the requirements of Subchapter M of the Internal Revenue Code of 1986, as amended (the “Internal Revenue Code”), necessary to qualify as a regulated investment company and to distribute substantially all of the Fund’s taxable earnings to shareholders. As such, the Fund will not be subject to federal income taxes on otherwise taxable income (including net realized capital gain) that is distributed to shareholders. Therefore, no provision for federal income taxes is recorded in the financial statements. |
The Fund files tax returns in the U.S. Federal jurisdiction and certain other jurisdictions. Generally, the Fund is subject to examinations by such taxing authorities for up to three years after the filing of the return for the tax period.
| F. | Expenses — Fees provided for under the Rule 12b-1 plan of a particular class of the Fund are charged to the operations of such class. Transfer agency fees and expenses and other shareholder recordkeeping fees and expenses attributable to Class R5 are charged to such class. Transfer agency fees and expenses and other shareholder recordkeeping fees and expenses relating to all other classes are allocated among those classes based on relative net assets. All other expenses are allocated among the classes based on relative net assets. |
| G. | Accounting Estimates — The preparation of financial statements in conformity with accounting principles generally accepted in the United States of America (“GAAP”) requires management to make estimates and assumptions that affect the reported amounts of assets and liabilities at the date of the financial statements and the reported amounts of revenues and expenses during the reporting period including estimates and assumptions related to taxation. Actual results could differ from those estimates by a significant amount. In addition, the Fund monitors for material events or transactions that may occur or become known after the period-end date and before the date the financial statements are released to print. |
| H. | Indemnifications — Under the Trust’s organizational documents, each Trustee, officer, employee or other agent of the Trust is indemnified against certain liabilities that may arise out of the performance of their duties to the Fund. Additionally, in the normal course of business, the Fund enters into contracts, including the Fund’s servicing agreements, that contain a variety of indemnification clauses. The Fund’s maximum exposure under these arrangements is unknown as this would involve future claims that may be made against the Fund that have not yet occurred. The risk of material loss as a result of such indemnification claims is considered remote. |
| I. | Foreign Currency Translations — Foreign currency is valued at the close of the NYSE based on quotations posted by banks and major currency dealers. Portfolio securities and other assets and liabilities denominated in foreign currencies are translated into U.S. dollar amounts at date of valuation. Purchases and sales of portfolio securities (net of foreign taxes withheld on disposition) and income items denominated in foreign currencies are translated into U.S. dollar amounts on the respective dates of such transactions. The Fund does not separately account for the portion of the results of operations resulting from changes in foreign exchange rates on investments and the fluctuations arising from changes in market prices of securities held. The combined results of changes in foreign exchange rates and the fluctuation of market prices on investments (net of estimated foreign tax withholding) are included with the net realized and unrealized gain or loss from investments in the Statement of Operations. Reported net realized foreign currency gains or losses arise from (1) sales of foreign currencies, (2) currency gains or losses realized between the trade and settlement dates on securities transactions, and (3) the difference between the amounts of dividends, interest, and foreign withholding taxes recorded on the Fund’s books and the U.S. dollar equivalent of the amounts actually received or paid. Net unrealized foreign currency gains and losses arise from changes in the fair values of assets and liabilities, other than investments in securities at fiscal period end, resulting from changes in exchange rates. |
The Fund may invest in foreign securities which may be subject to foreign taxes on income, gains on investments or currency repatriation, a portion of which may be recoverable.
| J. | Foreign Currency Contracts — The Fund may enter into foreign currency contracts to manage or minimize currency or exchange rate risk. The Fund may also enter into foreign currency contracts for the purchase or sale of a security denominated in a foreign currency in order to “lock in” the U.S. dollar price of that security. A foreign currency contract is an obligation to purchase or sell a specific currency for an agreed-upon price at a future date. The use of foreign currency contracts does not eliminate fluctuations in the price of the underlying securities the Fund owns or intends to acquire but establishes a rate of exchange in advance. Fluctuations in the value of these contracts are measured by the difference in the contract date and reporting date exchange rates and are recorded as unrealized appreciation (depreciation) until the contracts are closed. When the contracts are closed, realized gains (losses) are recorded. Realized and unrealized gains (losses) on the contracts are included in the Statement of Operations. The primary risks associated with foreign currency contracts include failure of the counterparty to meet the terms of the contract and the value of the foreign currency changing unfavorably. These risks may be in excess of the amounts reflected in the Statement of Assets and Liabilities. |
NOTE 2—Advisory Fees and Other Fees Paid to Affiliates
The Trust has entered into a master investment advisory agreement with Invesco Advisers, Inc. (the “Adviser” or “Invesco”). Under the terms of the investment advisory agreement, the Fund pays an advisory fee to the Adviser based on the annual rate of the Fund’s average daily net assets as follows:
| Average Daily Net Assets | Rate | |||
First $250 million | 0.80% | |||
Next $250 million | 0.78% | |||
Next $500 million | 0.76% | |||
Next $1.5 billion | 0.74% | |||
Next $2.5 billion | 0.72% | |||
Next $2.5 billion | 0.70% | |||
Next $2.5 billion | 0.68% | |||
Over $10 billion | 0.66% | |||
15 Invesco Global Small & Mid Cap Growth Fund
Under the terms of a master sub-advisory agreement between the Adviser and each of Invesco Asset Management Deutschland GmbH, Invesco Asset Management Limited, Invesco Asset Management (Japan) Limited, Invesco Australia Limited, Invesco Hong Kong Limited, Invesco Senior Secured Management, Inc. and Invesco Canada Ltd. (collectively, the “Affiliated Sub-Advisers”) the Adviser, not the Fund, may pay 40% of the fees paid to the Adviser to any such Affiliated Sub-Adviser(s) that provide(s) discretionary investment management services to the Fund based on the percentage of assets allocated to such Sub-Adviser(s).
The Adviser has contractually agreed, through at least June 30, 2014, to waive advisory fees and/or reimburse expenses of all shares to the extent necessary to limit total annual fund operating expenses after fee waiver and/or expense reimbursement (excluding certain items discussed below) of Class A, Class B, Class C, Class Y and Class R5 shares to 2.25%, 3.00%, 3.00%, 2.00% and 2.00%, respectively, of average daily net assets. In determining the Adviser’s obligation to waive advisory fees and/or reimburse expenses, the following expenses are not taken into account, and could cause the total annual fund operating expenses after fee waiver and/or expense reimbursement to exceed the numbers reflected above: (1) interest; (2) taxes; (3) dividend expense on short sales; (4) extraordinary or non-routine items, including litigation expenses; and (5) expenses that the Fund has incurred but did not actually pay because of an expense offset arrangement. Unless Invesco continues the fee waiver agreement, it will terminate on June 30, 2014. The fee waiver agreement cannot be terminated during its term. The Adviser did not waive fees and/or reimburse expenses during the period under this expense limitation.
Further, the Adviser has contractually agreed, through June 30, 2014, to waive the advisory fee payable by the Fund in an amount equal to 100% of the net advisory fees the Adviser receives from the affiliated money market funds on investments by the Fund of uninvested cash in such affiliated money market funds.
For the year ended October 31, 2013, the Adviser waived advisory fees of $40,726.
The Trust has entered into a master administrative services agreement with Invesco pursuant to which the Fund has agreed to pay Invesco for certain administrative costs incurred in providing accounting services to the Fund. For the year ended October 31, 2013, expenses incurred under the agreement are shown in the Statement of Operations as Administrative services fees.
The Trust has entered into a transfer agency and service agreement with Invesco Investment Services, Inc. (“IIS”) pursuant to which the Fund has agreed to pay IIS a fee for providing transfer agency and shareholder services to the Fund and reimburse IIS for certain expenses incurred by IIS in the course of providing such services. IIS may make payments to intermediaries that provide omnibus account services, sub-accounting services and/or networking services. All fees payable by IIS to intermediaries that provide omnibus account services or sub-accounting are charged back to the Fund, subject to certain limitations approved by the Trust’s Board of Trustees. For the year ended October 31, 2013, expenses incurred under the agreement are shown in the Statement of Operations as Transfer agent fees.
The Trust has entered into master distribution agreements with Invesco Distributors, Inc. (“IDI”) to serve as the distributor for the Class A, Class B, Class C, Class Y and Class R5 shares of the Fund. The Trust has adopted plans pursuant to Rule 12b-1 under the 1940 Act with respect to the Fund’s Class A, Class B and Class C shares (collectively, the “Plans”). The Fund, pursuant to the Plans, pays IDI compensation at the annual rate of 0.25% of the Fund’s average daily net assets of Class A shares and 1.00% of the average daily net assets of Class B and Class C shares. Of the Plan payments, up to 0.25% of the average daily net assets of each class of shares may be paid to furnish continuing personal shareholder services to customers who purchase and own shares of such classes. Any amounts not paid as a service fee under the Plans would constitute an asset-based sales charge. Rules of the Financial Industry Regulatory Authority (“FINRA”) impose a cap on the total sales charges, including asset-based sales charges, that may be paid by any class of shares of the Fund. For the year ended October 31, 2013, expenses incurred under the Plans are shown in the Statement of Operations as Distribution fees.
Front-end sales commissions and CDSC (collectively, the “sales charges”) are not recorded as expenses of the Fund. Front-end sales commissions are deducted from proceeds from the sales of Fund shares prior to investment in Class A shares of the Fund. CDSC are deducted from redemption proceeds prior to remittance to the shareholder. During the year ended October 31, 2013, IDI advised the Fund that IDI retained $51,938 in front-end sales commissions from the sale of Class A shares and $5, $14,183 and $2,367 from Class A, Class B and Class C shares, respectively, for CDSC imposed on redemptions by shareholders.
For the year ended October 31, 2013, the Fund incurred $1,766 in brokerage commissions with Invesco Capital Markets, Inc., an affiliate of the Adviser and IDI, for portfolio transactions executed on behalf of the Fund.
Certain officers and trustees of the Trust are officers and directors of the Adviser, IIS and/or IDI.
NOTE 3—Additional Valuation Information
GAAP defines fair value as the price that would be received to sell an asset or paid to transfer a liability in an orderly transaction between market participants at the measurement date, under current market conditions. GAAP establishes a hierarchy that prioritizes the inputs to valuation methods, giving the highest priority to readily available unadjusted quoted prices in an active market for identical assets (Level 1) and the lowest priority to significant unobservable inputs (Level 3), generally when market prices are not readily available or are unreliable. Based on the valuation inputs, the securities or other investments are tiered into one of three levels. Changes in valuation methods may result in transfers in or out of an investment’s assigned level:
| Level 1 — | Prices are determined using quoted prices in an active market for identical assets. |
| Level 2 — | Prices are determined using other significant observable inputs. Observable inputs are inputs that other market participants may use in pricing a security. These may include quoted prices for similar securities, interest rates, prepayment speeds, credit risk, yield curves, loss severities, default rates, discount rates, volatilities and others. |
| Level 3 — | Prices are determined using significant unobservable inputs. In situations where quoted prices or observable inputs are unavailable (for example, when there is little or no market activity for an investment at the end of the period), unobservable inputs may be used. Unobservable inputs reflect the Fund’s own assumptions about the factors market participants would use in determining fair value of the securities or instruments and would be based on the best available information. |
The following is a summary of the tiered valuation input levels, as of October 31, 2013. The level assigned to the securities valuations may not be an indication of the risk or liquidity associated with investing in those securities. Because of the inherent uncertainties of valuation, the values reflected in the financial statements may materially differ from the value received upon actual sale of those investments.
16 Invesco Global Small & Mid Cap Growth Fund
During the year ended October 31, 2013, there were transfers from Level 1 to Level 2 of $46,646,090 and from Level 2 to Level 1 of $57,309,688, due to foreign fair value adjustments.
| Level 1 | Level 2 | Level 3 | Total | |||||||||||||
Australia | $ | 7,916,170 | $ | — | $ | — | $ | 7,916,170 | ||||||||
Belgium | — | 4,062,122 | — | 4,062,122 | ||||||||||||
Brazil | 33,239,790 | — | — | 33,239,790 | ||||||||||||
Canada | 58,399,662 | — | — | 58,399,662 | ||||||||||||
China | 5,569,575 | 8,737,323 | — | 14,306,898 | ||||||||||||
Germany | 32,601,376 | — | — | 32,601,376 | ||||||||||||
Hong Kong | 9,517,200 | — | — | 9,517,200 | ||||||||||||
Indonesia | 5,264,662 | — | — | 5,264,662 | ||||||||||||
Ireland | 16,467,877 | 7,137,087 | — | 23,604,964 | ||||||||||||
Israel | 5,168,887 | — | — | 5,168,887 | ||||||||||||
Italy | 6,555,939 | — | — | 6,555,939 | ||||||||||||
Japan | — | 19,174,015 | — | 19,174,015 | ||||||||||||
Netherlands | 3,488,673 | — | — | 3,488,673 | ||||||||||||
Philippines | 11,881,547 | — | — | 11,881,547 | ||||||||||||
South Africa | 10,807,087 | — | — | 10,807,087 | ||||||||||||
South Korea | 948,999 | — | — | 948,999 | ||||||||||||
Sweden | — | 8,136,962 | — | 8,136,962 | ||||||||||||
Switzerland | — | 21,371,018 | — | 21,371,018 | ||||||||||||
Thailand | — | 12,104,593 | — | 12,104,593 | ||||||||||||
Turkey | 8,250,772 | 10,674,210 | — | 18,924,982 | ||||||||||||
Turkmenistan | 7,999,394 | — | — | 7,999,394 | ||||||||||||
United Kingdom | 62,912,890 | 43,604,876 | — | 106,517,766 | ||||||||||||
United States | 207,632,506 | — | — | 207,632,506 | ||||||||||||
Total Investments | $ | 494,623,006 | $ | 135,002,206 | $ | — | $ | 629,625,212 | ||||||||
NOTE 4—Expense Offset Arrangement(s)
The expense offset arrangement is comprised of transfer agency credits which result from balances in demand deposit accounts used by the transfer agent for clearing shareholder transactions. For the year ended October 31, 2013, the Fund received credits from this arrangement, which resulted in the reduction of the Fund’s total expenses of $4,346.
NOTE 5—Trustees’ and Officers’ Fees and Benefits
Trustees’ and Officers’ Fees and Benefits include amounts accrued by the Fund to pay remuneration to certain Trustees and Officers of the Fund. Trustees have the option to defer compensation payable by the Fund, and Trustees’ and Officers’ Fees and Benefits also include amounts accrued by the Fund to fund such deferred compensation amounts. Those Trustees who defer compensation have the option to select various Invesco Funds in which their deferral accounts shall be deemed to be invested. Finally, certain current Trustees are eligible to participate in a retirement plan that provides for benefits to be paid upon retirement to Trustees over a period of time based on the number of years of service. The Fund may have certain former Trustees who also participate in a retirement plan and receive benefits under such plan. Trustees’ and Officers’ Fees and Benefits include amounts accrued by the Fund to fund such retirement benefits. Obligations under the deferred compensation and retirement plans represent unsecured claims against the general assets of the Fund.
NOTE 6—Cash Balances
The Fund is permitted to temporarily carry a negative or overdrawn balance in its account with State Street Bank and Trust Company, the custodian bank. Such balances, if any at period end, are shown in the Statement of Assets and Liabilities under the payable caption Amount due custodian. To compensate the custodian bank for such overdrafts, the overdrawn Fund may either (1) leave funds as a compensating balance in the account so the custodian bank can be compensated by earning the additional interest; or (2) compensate by paying the custodian bank at a rate agreed upon by the custodian bank and Invesco, not to exceed the contractually agreed upon rate.
17 Invesco Global Small & Mid Cap Growth Fund
NOTE 7—Distributions to Shareholders and Tax Components of Net Assets
Tax Character of Distributions to Shareholders Paid During the Years Ended October 31, 2013 and 2012:
| 2013 | 2012 | |||||||
Ordinary income | $ | 4,703,777 | $ | 7,623,324 | ||||
Long-term capital gain | 7,633,064 | 35,696,739 | ||||||
Total distributions | $ | 12,336,841 | $ | 43,320,063 | ||||
Tax Components of Net Assets at Period-End:
| 2013 | ||||
Undistributed ordinary income | $ | 9,113,813 | ||
Undistributed long-term gain | 48,692,838 | |||
Net unrealized appreciation — investments | 197,091,446 | |||
Net unrealized appreciation (depreciation) — other investments | (12,641 | ) | ||
Temporary book/tax differences | (215,210 | ) | ||
Shares of beneficial interest | 372,896,258 | |||
Total net assets | $ | 627,566,504 | ||
The difference between book-basis and tax-basis unrealized appreciation (depreciation) is due to differences in the timing of recognition of gains and losses on investments for tax and book purposes. The Fund’s net unrealized appreciation difference is attributable primarily to wash sales.
The temporary book/tax differences are a result of timing differences between book and tax recognition of income and/or expenses. The Fund’s temporary book/tax differences are the result of the trustee deferral of compensation and retirement plan benefits.
Capital loss carryforward is calculated and reported as of a specific date. Results of transactions and other activity after that date may affect the amount of capital loss carryforward actually available for the Trust to utilize. Capital losses generated in years beginning after December 22, 2010 can be carried forward for an unlimited period, whereas previous losses expire in 8 tax years. Capital losses with an expiration period may not be used to offset capital gains until all net capital losses without an expiration date have been utilized. Capital loss carryforwards with no expiration date will retain their character as either short-term or long-term capital losses instead of as short-term capital losses as under prior law. The ability to utilize capital loss carryforward in the future may be limited under the Internal Revenue Code and related regulations based on the results of future transactions.
The Fund does not have a capital loss carryforward as of October 31, 2013.
NOTE 8—Investment Securities
The aggregate amount of investment securities (other than short-term securities, U.S. Treasury obligations and money market funds, if any) purchased and sold by the Fund during the year ended October 31, 2013 was $145,578,413 and $208,721,876, respectively. Cost of investments on a tax basis includes the adjustments for financial reporting purposes as of the most recently completed federal income tax reporting period-end.
| Unrealized Appreciation (Depreciation) of Investment Securities on a Tax Basis | ||||
Aggregate unrealized appreciation of investment securities | $ | 210,518,294 | ||
Aggregate unrealized (depreciation) of investment securities | (13,426,848 | ) | ||
Net unrealized appreciation of investment securities | $ | 197,091,446 | ||
Cost of investments for tax purposes is $432,533,766.
NOTE 9—Reclassification of Permanent Differences
Primarily as a result of differing book/tax treatment of foreign currency transactions, on October 31, 2013, undistributed net investment income was decreased by $6,879 and undistributed net realized gain was increased by $6,879. This reclassification had no effect on the net assets of the Fund.
18 Invesco Global Small & Mid Cap Growth Fund
NOTE 10—Share Information
| Summary of Share Activity | ||||||||||||||||
| Years ended October 31, | ||||||||||||||||
| 2013(a) | 2012 | |||||||||||||||
| Shares | Amount | Shares | Amount | |||||||||||||
Sold: | ||||||||||||||||
Class A | 1,296,133 | $ | 25,675,345 | 1,205,494 | $ | 20,836,098 | ||||||||||
Class B | 32,838 | 561,476 | 39,260 | 595,951 | ||||||||||||
Class C | 275,489 | 4,731,339 | 231,133 | 3,457,433 | ||||||||||||
Class Y | 166,646 | 3,283,683 | 123,609 | 2,150,277 | ||||||||||||
Class R5 | 99,367 | 1,906,509 | 141,555 | 2,354,943 | ||||||||||||
Issued as reinvestment of dividends: | ||||||||||||||||
Class A | 593,803 | 10,599,391 | 2,215,027 | 35,684,100 | ||||||||||||
Class B | 20,760 | 323,648 | 114,873 | 1,623,294 | ||||||||||||
Class C | 27,510 | 429,152 | 114,861 | 1,624,132 | ||||||||||||
Class Y | 9,591 | 171,400 | 33,655 | 542,517 | ||||||||||||
Class R5 | 13,878 | 246,478 | 38,004 | 609,207 | ||||||||||||
Automatic conversion of Class B shares to Class A shares: | ||||||||||||||||
Class A | 182,103 | 3,563,679 | 267,381 | 4,592,844 | ||||||||||||
Class B | (209,171 | ) | (3,563,679 | ) | (323,642 | ) | (4,592,844 | ) | ||||||||
Reacquired:(b) | ||||||||||||||||
Class A | (4,142,993 | ) | (80,458,045 | ) | (5,084,143 | ) | (87,729,030 | ) | ||||||||
Class B | (167,221 | ) | (2,819,968 | ) | (173,772 | ) | (2,876,249 | ) | ||||||||
Class C | (255,740 | ) | (4,373,438 | ) | (391,865 | ) | (5,893,196 | ) | ||||||||
Class Y | (113,951 | ) | �� | (2,202,602 | ) | (165,677 | ) | (2,841,388 | ) | |||||||
Class R5 | (237,867 | ) | (4,678,962 | ) | (308,651 | ) | (5,348,893 | ) | ||||||||
Net increase (decrease) in share activity | (2,408,825 | ) | $ | (46,604,594 | ) | (1,922,898 | ) | $ | (35,210,804 | ) | ||||||
| (a) | There are entities that are record owners of more than 5% of the outstanding shares of the Fund and in the aggregate own 32% of the outstanding shares of the Fund. IDI has an agreement with these entities to sell Fund shares. The Fund, Invesco and/or Invesco affiliates may make payments to these entities, which are considered to be related to the Fund, for providing services to the Fund, Invesco and/or Invesco affiliates including but not limited to services such as securities brokerage, distribution, third party record keeping and account servicing. The Fund has no knowledge as to whether all or any portion of the shares owned of record by these entities are also owned beneficially. |
| (b) | Net of redemption fees of $1,482 allocated among the classes based on relative net assets of each class for the year ended October 31, 2012. |
19 Invesco Global Small & Mid Cap Growth Fund
NOTE 11—Financial Highlights
The following schedule presents financial highlights for a share of the Fund outstanding throughout the periods indicated.
| Net asset value, beginning of period | Net investment income (loss)(a) | Net gains (losses) on securities (both realized and unrealized) | Total from investment operations | Dividends from net investment income | Distributions from net realized gains | Total distributions | Net asset value, end of period(e) | Total return(b) | Net assets, end of period (000’s omitted) | Ratio of expenses to average net assets with fee waivers and/or expenses absorbed | Ratio of expenses to average net assets without fee waivers and/or expenses absorbed | Ratio of net investment income (loss) to average net assets | Portfolio turnover(c) | |||||||||||||||||||||||||||||||||||||||||||
Class A |
| |||||||||||||||||||||||||||||||||||||||||||||||||||||||
Year ended 10/31/13 | $ | 17.87 | $ | 0.17 | $ | 4.48 | $ | 4.65 | $ | (0.16 | ) | $ | (0.25 | ) | $ | (0.41 | ) | $ | 22.11 | 26.56 | % | $ | 550,526 | 1.37 | %(d) | 1.38 | %(d) | 0.87 | %(d) | 26 | % | |||||||||||||||||||||||||
Year ended 10/31/12 | 17.93 | 0.17 | 1.10 | 1.27 | (0.24 | ) | (1.09 | ) | (1.33 | ) | 17.87 | 7.94 | 482,051 | 1.42 | 1.43 | 1.00 | 37 | |||||||||||||||||||||||||||||||||||||||
Year ended 10/31/11 | 18.57 | 0.18 | (0.74 | ) | (0.56 | ) | (0.08 | ) | — | (0.08 | ) | 17.93 | (3.05 | ) | 508,794 | 1.40 | 1.41 | 0.95 | 58 | |||||||||||||||||||||||||||||||||||||
Year ended 10/31/10 | 14.79 | 0.06 | 3.78 | 3.84 | (0.06 | ) | — | (0.06 | ) | 18.57 | 26.07 | 589,712 | 1.45 | 1.46 | 0.37 | 39 | ||||||||||||||||||||||||||||||||||||||||
Year ended 10/31/09 | 12.87 | 0.05 | 3.07 | 3.12 | (0.15 | ) | (1.05 | ) | (1.20 | ) | 14.79 | 28.24 | 521,223 | 1.61 | 1.62 | 0.40 | 54 | |||||||||||||||||||||||||||||||||||||||
Class B | ||||||||||||||||||||||||||||||||||||||||||||||||||||||||
Year ended 10/31/13 | 15.57 | 0.02 | 3.89 | 3.91 | (0.05 | ) | (0.25 | ) | (0.30 | ) | 19.18 | 25.58 | 15,405 | 2.12 | (d) | 2.13 | (d) | 0.12 | (d) | 26 | ||||||||||||||||||||||||||||||||||||
Year ended 10/31/12 | 15.74 | 0.04 | 0.96 | 1.00 | (0.08 | ) | (1.09 | ) | (1.17 | ) | 15.57 | 7.12 | 17,529 | 2.17 | 2.18 | 0.25 | 37 | |||||||||||||||||||||||||||||||||||||||
Year ended 10/31/11 | 16.36 | 0.03 | (0.65 | ) | (0.62 | ) | — | — | — | 15.74 | (3.79 | ) | 23,124 | 2.15 | 2.16 | 0.20 | 58 | |||||||||||||||||||||||||||||||||||||||
Year ended 10/31/10 | 13.07 | (0.05 | ) | 3.34 | 3.29 | — | — | — | 16.36 | 25.17 | 34,439 | 2.20 | 2.21 | (0.38 | ) | 39 | ||||||||||||||||||||||||||||||||||||||||
Year ended 10/31/09 | 11.43 | (0.04 | ) | 2.73 | 2.69 | — | (1.05 | ) | (1.05 | ) | 13.07 | 27.33 | 38,709 | 2.36 | 2.37 | (0.35 | ) | 54 | ||||||||||||||||||||||||||||||||||||||
Class C | ||||||||||||||||||||||||||||||||||||||||||||||||||||||||
Year ended 10/31/13 | 15.58 | 0.02 | 3.89 | 3.91 | (0.05 | ) | (0.25 | ) | (0.30 | ) | 19.19 | 25.56 | 28,505 | 2.12 | (d) | 2.13 | (d) | 0.12 | (d) | 26 | ||||||||||||||||||||||||||||||||||||
Year ended 10/31/12 | 15.75 | 0.04 | 0.96 | 1.00 | (0.08 | ) | (1.09 | ) | (1.17 | ) | 15.58 | 7.11 | 22,401 | 2.17 | 2.18 | 0.25 | 37 | |||||||||||||||||||||||||||||||||||||||
Year ended 10/31/11 | 16.37 | 0.03 | (0.65 | ) | (0.62 | ) | — | — | — | 15.75 | (3.79 | ) | 23,368 | 2.15 | 2.16 | 0.20 | 58 | |||||||||||||||||||||||||||||||||||||||
Year ended 10/31/10 | 13.08 | (0.05 | ) | 3.34 | 3.29 | — | — | — | 16.37 | 25.15 | 26,369 | 2.20 | 2.21 | (0.38 | ) | 39 | ||||||||||||||||||||||||||||||||||||||||
Year ended 10/31/09 | 11.43 | (0.04 | ) | 2.74 | 2.70 | — | (1.05 | ) | (1.05 | ) | 13.08 | 27.41 | 20,802 | 2.36 | 2.37 | (0.35 | ) | 54 | ||||||||||||||||||||||||||||||||||||||
Class Y | ||||||||||||||||||||||||||||||||||||||||||||||||||||||||
Year ended 10/31/13 | 17.92 | 0.22 | 4.49 | 4.71 | (0.20 | ) | (0.25 | ) | (0.45 | ) | 22.18 | 26.87 | 10,546 | 1.12 | (d) | 1.13 | (d) | 1.12 | (d) | 26 | ||||||||||||||||||||||||||||||||||||
Year ended 10/31/12 | 18.00 | 0.22 | 1.09 | 1.31 | (0.30 | ) | (1.09 | ) | (1.39 | ) | 17.92 | 8.18 | 7,406 | 1.17 | 1.18 | 1.25 | 37 | |||||||||||||||||||||||||||||||||||||||
Year ended 10/31/11 | 18.64 | 0.23 | (0.75 | ) | (0.52 | ) | (0.12 | ) | — | (0.12 | ) | 18.00 | (2.81 | ) | 7,589 | 1.15 | 1.16 | 1.20 | 58 | |||||||||||||||||||||||||||||||||||||
Year ended 10/31/10 | 14.84 | 0.10 | 3.80 | 3.90 | (0.10 | ) | — | (0.10 | ) | 18.64 | 26.38 | 7,944 | 1.20 | 1.21 | 0.62 | 39 | ||||||||||||||||||||||||||||||||||||||||
Year ended 10/31/09 | 12.87 | 0.09 | 3.09 | 3.18 | (0.16 | ) | (1.05 | ) | (1.21 | ) | 14.84 | 28.70 | 4,715 | 1.36 | 1.37 | 0.65 | 54 | |||||||||||||||||||||||||||||||||||||||
Class R5 | ||||||||||||||||||||||||||||||||||||||||||||||||||||||||
Year ended 10/31/13 | 17.85 | 0.25 | 4.46 | 4.71 | (0.23 | ) | (0.25 | ) | (0.48 | ) | 22.08 | 27.05 | 22,585 | 0.95 | (d) | 0.96 | (d) | 1.29 | (d) | 26 | ||||||||||||||||||||||||||||||||||||
Year ended 10/31/12 | 17.95 | 0.25 | 1.10 | 1.35 | (0.36 | ) | (1.09 | ) | (1.45 | ) | 17.85 | 8.46 | 20,481 | 0.94 | 0.95 | 1.48 | 37 | |||||||||||||||||||||||||||||||||||||||
Year ended 10/31/11 | 18.59 | 0.27 | (0.74 | ) | (0.47 | ) | (0.17 | ) | — | (0.17 | ) | 17.95 | (2.57 | ) | 22,918 | 0.91 | 0.92 | 1.44 | 58 | |||||||||||||||||||||||||||||||||||||
Year ended 10/31/10 | 14.81 | 0.15 | 3.78 | 3.93 | (0.15 | ) | — | (0.15 | ) | 18.59 | 26.72 | 27,683 | 0.92 | 0.93 | 0.90 | 39 | ||||||||||||||||||||||||||||||||||||||||
Year ended 10/31/09 | 12.93 | 0.13 | 3.07 | 3.20 | (0.27 | ) | (1.05 | ) | (1.32 | ) | 14.81 | 29.20 | 23,859 | 0.96 | 0.97 | 1.05 | 54 | |||||||||||||||||||||||||||||||||||||||
| (a) | Calculated using average shares outstanding. |
| (b) | Includes adjustments in accordance with accounting principles generally accepted in the United States of America and as such, the net asset value for financial reporting purposes and the returns based upon those net asset values may differ from the net asset value and returns for shareholder transactions. Does not include sales charges and is not annualized for periods less than one year, if applicable. |
| (c) | Portfolio turnover is calculated at the fund level and is not annualized for periods less than one year, if applicable. |
| (d) | Ratios are based on average daily net assets (000’s omitted) of $509,444, $16,260, $25,169, $8,724 and $21,635 for Class A, Class B, Class C, Class Y and Class R5 shares, respectively. |
| (e) | Includes redemption fees added to shares of beneficial interest for Class A, Class B, Class C, Class Y and Class R5 shares, which were less than $0.005 per share for the fiscal years ended October 31, 2012 and prior. |
20 Invesco Global Small & Mid Cap Growth Fund
Report of Independent Registered Public Accounting Firm
To the Board of Trustees of AIM International Mutual Funds (Invesco International Mutual Funds)
and Shareholders of Invesco Global Small & Mid Cap Growth Fund:
In our opinion, the accompanying statement of assets and liabilities, including the schedule of investments, and the related statements of operations and of changes in net assets and the financial highlights present fairly, in all material respects, the financial position of Invesco Global Small & Mid Cap Growth Fund (one of the funds constituting AIM International Mutual Funds (Invesco International Mutual Funds), hereafter referred to as the “Fund”) at October 31, 2013, the results of its operations for the year then ended, the changes in its net assets for each of the two years in the period then ended and the financial highlights for each of the five years in the period then ended, in conformity with accounting principles generally accepted in the United States of America. These financial statements and financial highlights (hereafter referred to as “financial statements”) are the responsibility of the Fund’s management; our responsibility is to express an opinion on these financial statements based on our audits. We conducted our audits of these financial statements in accordance with the standards of the Public Company Accounting Oversight Board (United States). Those standards require that we plan and perform the audit to obtain reasonable assurance about whether the financial statements are free of material misstatement. An audit includes examining, on a test basis, evidence supporting the amounts and disclosures in the financial statements, assessing the accounting principles used and significant estimates made by management, and evaluating the overall financial statement presentation. We believe that our audits, which included confirmation of securities at October 31, 2013 by correspondence with the custodian and brokers, provide a reasonable basis for our opinion.
PRICEWATERHOUSECOOPERS LLP
December 23, 2013
Houston, Texas
21 Invesco Global Small & Mid Cap Growth Fund
Calculating your ongoing Fund expenses
Example
As a shareholder of the Fund, you incur two types of costs: (1) transaction costs, which may include sales charges (loads) on purchase payments or contingent deferred sales charges on redemptions, if any; and (2) ongoing costs, including management fees, distribution and/or service (12b-1) fees, and other Fund expenses. This example is intended to help you understand your ongoing costs (in dollars) of investing in the Fund and to compare these costs with ongoing costs of investing in other mutual funds. The example is based on an investment of $1,000 invested at the beginning of the period and held for the entire period May 1, 2013 through October 31, 2013.
Actual expenses
The table below provides information about actual account values and actual expenses. You may use the information in this table, together with the amount you invested, to estimate the expenses that you paid over the period. Simply divide your account value by $1,000 (for example, an $8,600 account value divided by $1,000 = 8.6), then multiply the result by the number in the table under the heading entitled “Actual Expenses Paid During Period” to estimate the expenses you paid on your account during this period.
Hypothetical example for comparison purposes
The table below also provides information about hypothetical account values and hypothetical expenses based on the Fund’s actual expense ratio and an assumed rate of return of 5% per year before expenses, which is not the Fund’s actual return.
The hypothetical account values and expenses may not be used to estimate the actual ending account balance or expenses you paid for the period. You may use this information to compare the ongoing costs of investing in the Fund and other funds. To do so, compare this 5% hypothetical example with the 5% hypothetical examples that appear in the shareholder reports of the other funds.
Please note that the expenses shown in the table are meant to highlight your ongoing costs only and do not reflect any transaction costs, such as sales charges (loads) on purchase payments or contingent deferred sales charges on redemptions, if any. Therefore, the hypothetical information is useful in comparing ongoing costs only, and will not help you determine the relative total costs of owning different funds. In addition, if these transaction costs were included, your costs would have been higher.
| Class | Beginning Account Value (05/01/13) | ACTUAL | HYPOTHETICAL (5% annual return before expenses) | Annualized Expense Ratio | ||||||||||||||||||||
| Ending Account Value (10/31/13)1 | Expenses Paid During Period2 | Ending Account Value (10/31/13) | Expenses Paid During Period2 | |||||||||||||||||||||
A | $ | 1,000.00 | $ | 1,103.80 | $ | 7.21 | $ | 1,018.35 | $ | 6.92 | 1.36 | % | ||||||||||||
B | 1,000.00 | 1,099.80 | 11.17 | 1,014.57 | 10.71 | 2.11 | ||||||||||||||||||
C | 1,000.00 | 1,099.10 | 11.16 | 1,014.57 | 10.71 | 2.11 | ||||||||||||||||||
Y | 1,000.00 | 1,105.10 | 5.89 | 1,019.61 | 5.65 | 1.11 | ||||||||||||||||||
R5 | 1,000.00 | 1,105.70 | 5.10 | 1,020.37 | 4.89 | 0.96 | ||||||||||||||||||
| 1 | The actual ending account value is based on the actual total return of the Fund for the period May 1, 2013 through October 31, 2013, after actual expenses and will differ from the hypothetical ending account value which is based on the Fund’s expense ratio and a hypothetical annual return of 5% before expenses. |
| 2 | Expenses are equal to the Fund’s annualized expense ratio as indicated above multiplied by the average account value over the period, multiplied by 184/365 to reflect the most recent fiscal half year. |
22 Invesco Global Small & Mid Cap Growth Fund
Approval of Investment Advisory and Sub-Advisory Contracts
The Board of Trustees (the Board) of AIM International Mutual Funds (Invesco International Mutual Funds) is required under the Investment Company Act of 1940, as amended, to approve annually the renewal of Invesco Global Small & Mid Cap Growth Fund’s (the Fund) investment advisory agreement with Invesco Advisers, Inc. (Invesco Advisers) and the Master Intergroup Sub-Advisory Contract for Mutual Funds (the sub-advisory contracts) with Invesco Asset Management Deutschland GmbH, Invesco Asset Management Limited, Invesco Asset Management (Japan) Limited, Invesco Australia Limited, Invesco Hong Kong Limited, Invesco Senior Secured Management, Inc. and Invesco Canada Ltd. (collectively, the Affiliated Sub-Advisers). During contract renewal meetings held on June 17-19, 2012, the Board as a whole, and the disinterested or “independent” Trustees, who comprise over 75% of the Board, voting separately, approved the continuance of the Fund’s investment advisory agreement and the sub-advisory contracts for another year, effective July 1, 2013. The Board determined that the continuation of the Fund’s investment advisory agreement and the sub-advisory contracts are in the best interests of the Fund and its shareholders and the compensation payable to Invesco Advisers and the Affiliated Sub-Advisers under the agreements is fair and reasonable.
The Board’s Fund Evaluation Process
The Board’s Investments Committee has established three Sub-Committees, each of which is primarily responsible for overseeing the management of a number of the funds advised by Invesco Advisers (the Invesco Funds). The Sub-Committees meet throughout the year to review the performance of their assigned Invesco Funds, including reviewing materials prepared under the direction of the independent Senior Officer, an officer of the Invesco Funds who reports directly to the independent Trustees. Over the course of each year, the Sub-Committees meet with portfolio managers for their assigned Invesco Funds and other members of management to review the performance, investment objective(s), policies, strategies, limitations and investment risks of these funds. The Sub-Committees meet regularly and at designated contract renewal meetings each year to conduct a review of the performance, fees, expenses and other matters related to their assigned Invesco Funds. Each Sub-Committee recommends to the Investments Committee, which in turn recommends to the full Board, whether and on what terms to approve the continuance of each Invesco Fund’s investment advisory agreement and sub-advisory contracts for another year.
During the contract renewal process, the Trustees receive comparative performance and fee data regarding the Invesco Funds prepared
by Invesco Advisers and Lipper Inc. (Lipper), an independent provider of investment company data. The Trustees also receive an independent written evaluation from the Senior Officer. The Senior Officer’s evaluation is prepared as part of his responsibility to manage the process by which the Invesco Funds’ proposed management fees are negotiated during the annual contract renewal process to ensure they are negotiated in a manner that is at arms’ length and reasonable. The independent Trustees are assisted in their annual evaluation of the Fund’s investment advisory agreement by the Senior Officer and by independent legal counsel. In addition to meetings with Invesco Advisers and fund counsel, the independent Trustees also discuss the continuance of the investment advisory agreement and sub-advisory contracts in separate sessions with the Senior Officer and with independent legal counsel.
In evaluating the fairness and reasonableness of compensation under the Fund’s investment advisory agreement and sub-advisory contracts, the Board considered, among other things, the factors discussed below. The Trustees recognized that the advisory fee rates for the Invesco Funds are, in many cases, the result of years of review and negotiation between the Trustees and Invesco Advisers as well as advisory fees previously approved by predecessor boards. The Trustees’ deliberations and conclusions in a particular year may be based in part on their deliberations and conclusions regarding these same arrangements throughout the year and in prior years. The Trustees’ review and conclusions are based on the comprehensive consideration of all information presented to them and are not the result of any single determinative factor. Moreover, one Trustee may have weighed a particular piece of information or factor differently than another Trustee.
The discussion below serves as the Senior Officer’s independent written evaluation with respect to the Fund’s investment advisory agreement as well as a discussion of the material factors and related conclusions that formed the basis for the Board’s approval of the Fund’s investment advisory agreement and sub-advisory contracts. Unless otherwise stated, this information is current as of June 19, 2013, and may not reflect consideration of factors that became known to the Board after that date, including, for example, changes to the Fund’s performance, advisory fees, expense limitations and/or fee waivers.
Factors and Conclusions and Summary of Independent Written Fee Evaluation
| A. | Nature, Extent and Quality of Services Provided by Invesco Advisers and the Affiliated Sub-Advisers |
The Board reviewed the advisory services provided to the Fund by Invesco Advisers under
the Fund’s investment advisory agreement, the performance of Invesco Advisers in providing these services, and the credentials and experience of the officers and employees of Invesco Advisers who provide these services, including the Fund’s portfolio manager or managers, with whom the Sub-Committees met during the year. The Board’s review of the qualifications of Invesco Advisers to provide advisory services included the Board’s consideration of Invesco Advisers’ investment process oversight, independent credit analysis and investment risk management.
In determining whether to continue the Fund’s investment advisory agreement, the Board considered the benefits of reapproving an existing relationship and the greater uncertainty that may be associated with entering into a new relationship. The Board also considered non-advisory services that Invesco Advisers and its affiliates provide to the Invesco Funds such as various back office support functions, equity and fixed income trading operations, internal audit, distribution and legal and compliance. The Board concluded that the nature, extent and quality of the services provided to the Fund by Invesco Advisers are appropriate and satisfactory and consistent with the terms of the Fund’s investment advisory agreement.
The Board reviewed the services that may be provided by the Affiliated Sub-Advisers under the sub-advisory contracts and the credentials and experience of the officers and employees of the Affiliated Sub-Advisers who provide these services. The Board noted that the Affiliated Sub-Advisers have offices and personnel that are located in financial centers around the world. As a result, the Affiliated Sub-Advisers can provide research and investment analysis on the markets and economies of various countries in which the Fund may invest, make recommendations regarding securities and assist with security trades. The Board concluded that the sub-advisory contracts benefit the Fund and its shareholders by permitting Invesco Advisers to use the resources and talents of the Affiliated Sub-Advisers in managing the Fund. The Board concluded that the nature, extent and quality of the services that may be provided by the Affiliated Sub-Advisers are appropriate and satisfactory and consistent with the terms of the Fund’s sub-advisory contracts.
| B. | Fund Performance |
The Board considered Fund performance as a relevant factor in considering whether to approve the investment advisory agreement. The Board did not view Fund performance as a relevant factor in considering whether to approve the sub-advisory contracts for the Fund, as no Affiliated Sub-Adviser currently manages assets of the Fund.
The Board compared the Fund’s performance during the past one, three and five calendar years to the performance of funds in the Lipper
23 Invesco Global Small & Mid Cap Growth Fund
performance universe and against the Lipper Global Small/Mid-Cap Funds Index. The Board noted that performance of Class A shares of the Fund was in the third quintile of the performance universe for the one and three year periods and the fifth quintile for the five year period (the first quintile being the best performing funds and the fifth quintile being the worst performing funds). The Board noted that performance of the Class A shares of the Fund was above the performance of the Index for the one and three year periods and below the performance of the Index for the five year period. Invesco Advisers noted that two separate investment teams manage the Fund with an allocation to at least three countries, including the U.S. An underweight to the U.S. may have affected performance. The Trustees also reviewed more recent Fund performance and this review did not change their conclusions.
| C. | Advisory and Sub-Advisory Fees |
The Board compared the Fund’s contractual management fee rate to the contractual management fee rates of funds in the Fund’s Lipper expense group at a common asset level. The Board noted that the contractual management fee rate for Class A shares of the Fund was below the median contractual management fee rate of funds in the expense group. The Board noted that the term “contractual management fee” may include both advisory and certain administrative services fees and that the Invesco does not charge the Invesco Funds for the administrative services included in the term as defined by Lipper. The Board also reviewed the methodology used by Lipper in providing expense group information, which includes using each fund’s contractual management fee schedule (including any applicable breakpoints) as reported in the most recent prospectus or statement of additional information for each fund in the expense group.
The Board also compared the Fund’s effective advisory fee rate (the advisory fee rate after advisory fee rate waivers and before other expense limitations/waivers) to the effective advisory fee rates of other funds advised by Invesco Advisers and its affiliates with investment strategies comparable to those of the Fund. The Board noted that Invesco Advisers sub-advises an off-shore fund with comparable investment strategies, which had an effective advisory fee rate before waivers higher than the Fund’s rate. The Board noted that Invesco Advisers and its affiliates do not advise other funds or client accounts with investment strategies comparable to those of the Fund.
The Board also considered the services that may be provided by the Affiliated Sub-Advisers pursuant to the sub-advisory contracts, as well as the fees payable by Invesco Advisers to the Affiliated Sub-Advisers pursuant to the sub-advisory contracts. The Board also noted that the sub-advisory fees are not paid directly by the Fund, but rather, are payable by Invesco Advisers to the Affiliated Sub-Advisers.
Based upon the information and considerations described above, the Board concluded that the compensation payable to Invesco Advisers and the Affiliated Sub-Advisers is fair and reasonable.
| D. | Economies of Scale and Breakpoints |
The Board considered the extent to which there are economies of scale in the provision of advisory services to the Fund. The Board also considered whether the Fund benefits from economies of scale through contractual breakpoints in the Fund’s advisory fee schedule and was assisted in this review by a report from the Senior Officer. The Board also noted that the Fund shares directly in economies of scale through lower fees charged by third party service providers based on the combined size of the Invesco Funds and other clients advised by Invesco Advisers.
| E. | Profitability and Financial Resources |
The Board reviewed information from Invesco Advisers concerning the costs of the advisory and other services that Invesco Advisers and its affiliates provide to the Fund and the profitability of Invesco Advisers and its affiliates in providing these services for the year ended December 31, 2012. The Board received information from Invesco Advisers about the methodology used to prepare the profitability information. The Board considered the profitability of Invesco Advisers in managing the Fund and the Invesco Funds. The Board noted that Invesco Advisers continues to operate at a net profit from services Invesco Advisers and its subsidiaries provide to the Invesco Funds and the Fund. The Board did not deem the level of profits realized by Invesco Advisers and its affiliates from providing services to the Fund to be excessive given the nature, quality and extent of the services provided to the Invesco Funds. The Board received and accepted information from Invesco Advisers demonstrating that Invesco Advisers and each Affiliated Sub-Adviser are financially sound and have the resources necessary to perform their obligations under the investment advisory agreement and sub-advisory contracts.
| F. | Collateral Benefits to Invesco Advisers and its Affiliates |
The Board considered various other benefits received by Invesco Advisers and its affiliates from the relationship with the Fund, including the fees received for their provision of transfer agency and distribution services to the Fund. The Board considered comparative information regarding fees charged for these services, including information provided by Lipper and other independent sources. The Board considered the performance of Invesco Advisers and its affiliates in providing these services and the organizational structure employed to provide these services. The Board also considered that these services are provided to the Fund pursuant to written contracts that are reviewed and approved on an annual basis by the Board; that the services are required for the operation of the Fund; that Invesco Advisers and its affiliates can provide services, the
nature and quality of which are at least equal to those provided by others offering the same or similar services; and that the fees for such services are fair and reasonable in light of the usual and customary charges by others for services of the same nature and quality.
The Board considered the benefits realized by Invesco Advisers and the Affiliated Sub-Advisers as a result of portfolio brokerage transactions executed through “soft dollar” arrangements. The Board noted that soft dollar arrangements shift the payment obligation for research services from Invesco Advisers and the Affiliated Sub-Advisers to the Invesco Funds and that the research received may be used with other clients of Invesco Advisers and may reduce Invesco Advisers’ and the Affiliated Sub-Advisers’ expenses. The Board also considered periodic reports from the Chief Compliance Officer of the Invesco Funds demonstrating that these arrangements are consistent with regulatory requirements. The Board did not deem the soft dollar arrangements to be inappropriate.
The Board considered that the Fund’s uninvested cash and cash collateral from any securities lending arrangements may be invested in money market funds advised by Invesco Advisers pursuant to procedures approved by the Board. The Board noted that Invesco Advisers receives advisory fees from these affiliated money market funds attributable to such investments, although Invesco Advisers has contractually agreed to waive through varying periods the advisory fees payable by the Invesco Funds. The waiver is in an amount equal to 100% of the net advisory fee Invesco Advisers receives from the affiliated money market funds with respect to the Fund’s investment in the affiliated money market funds of uninvested cash, but not cash collateral. The Board concluded that the Fund’s investment of uninvested cash and cash collateral from any securities lending arrangements in the affiliated money market funds is in the best interests of the Fund and its shareholders.
The Board also considered use of an affiliated broker to execute certain trades for the Fund to among other things, control information leakage, and were advised that such trades are executed in compliance with rules under the Investment Company Act of 1940, as amended.
24 Invesco Global Small & Mid Cap Growth Fund
Tax Information
Form 1099-DIV, Form 1042-S and other year-end tax information provide shareholders with actual calendar year amounts that should be included in their tax returns. Shareholders should consult their tax advisors.
The following distribution information is being provided as required by the Internal Revenue Code or to meet a specific state’s requirement.
The Fund designates the following amounts or, if subsequently determined to be different, the maximum amount allowable for its fiscal year ended October 31, 2013:
Federal and State Income Tax | ||||
Long-Term Capital Gain Distributions | $ | 7,633,064 | ||
Qualified Dividend Income* | 100.00 | % | ||
Corporate Dividends Received Deduction* | 18.50 | % | ||
| * | The above percentages are based on ordinary income dividends paid to shareholders during the Fund’s fiscal year. |
25 Invesco Global Small & Mid Cap Growth Fund
Trustees and Officers
The address of each trustee and officer is AIM International Mutual Funds (Invesco International Mutual Funds) (the “Trust”), 11 Greenway Plaza, Suite 1000, Houston, Texas 77046-1173. The trustees serve for the life of the Trust, subject to their earlier death, incapacitation, resignation, retirement or removal as more specifically provided in the Trust’s organizational documents. Each officer serves for a one year term or until their successors are elected and qualified. Column two below includes length of time served with predecessor entities, if any.
Name, Year of Birth and Position(s) Held with the Trust | Trustee and/ or Officer Since | Principal Occupation(s) During Past 5 Years | Number of Funds in Fund Complex Overseen by Trustee | Other Directorship(s) Held by Trustee During Past 5 Years | ||||
| Interested Persons | ||||||||
| Martin L. Flanagan1 — 1960 Trustee | 2007 | Executive Director, Chief Executive Officer and President, Invesco Ltd. (ultimate parent of Invesco and a global investment management firm); Advisor to the Board, Invesco Advisers, Inc. (formerly known as Invesco Institutional (N.A.), Inc.); Trustee, The Invesco Funds; Vice Chair, Investment Company Institute; and Member of Executive Board, SMU Cox School of Business
Formerly: Chairman and Chief Executive Officer, Invesco Advisers, Inc. (registered investment adviser); Director, Chairman, Chief Executive Officer and President, IVZ Inc. (holding company), INVESCO Group Services, Inc. (service provider) and Invesco North American Holdings, Inc. (holding company); Director, Chief Executive Officer and President, Invesco Holding Company Limited (parent of Invesco and a global investment management firm); Director, Invesco Ltd.; Chairman, Investment Company Institute and President, Co-Chief Executive Officer, Co-President, Chief Operating Officer and Chief Financial Officer, Franklin Resources, Inc. (global investment management organization) | 117 | None | ||||
Philip A. Taylor2 — 1954 Trustee, President and Principal Executive Officer | 2006 | Head of North American Retail and Senior Managing Director, Invesco Ltd.; Director, Co-Chairman, Co-President and Co-Chief Executive Officer, Invesco Advisers, Inc. (formerly known as Invesco Institutional (N.A.), Inc.) (registered investment adviser); Director, Chairman, Chief Executive Officer and President, Invesco Management Group, Inc. (formerly known as Invesco Aim Management Group, Inc.) (financial services holding company); Director and President, INVESCO Funds Group, Inc. (registered investment adviser and registered transfer agent); Director and Chairman, Invesco Investment Services, Inc. (formerly known as Invesco Aim Investment Services, Inc.) (registered transfer agent) and IVZ Distributors, Inc. (formerly known as INVESCO Distributors, Inc.) (registered broker dealer); Director, President and Chairman, Invesco Inc. (holding company) and Invesco Canada Holdings Inc. (holding company); Chief Executive Officer, Invesco Corporate Class Inc. (corporate mutual fund company) and Invesco Canada Fund Inc. (corporate mutual fund company); Director, Chairman and Chief Executive Officer, Invesco Canada Ltd. (formerly known as Invesco Trimark Ltd./Invesco Trimark Ltèe) (registered investment adviser and registered transfer agent); Trustee, President and Principal Executive Officer, The Invesco Funds (other than AIM Treasurer’s Series Trust (Invesco Treasurer’s Series Trust) and Short-Term Investments Trust); Trustee and Executive Vice President, The Invesco Funds (AIM Treasurer’s Series Trust (Invesco Treasurer’s Series Trust) and Short-Term Investments Trust only); Director, Invesco Investment Advisers LLC (formerly known as Van Kampen Asset Management); Director, Chief Executive Officer and President, Van Kampen Exchange Corp.
Formerly: Director and Chairman, Van Kampen Investor Services Inc.: Director, Chief Executive Officer and President, 1371 Preferred Inc. (holding company); and Van Kampen Investments Inc.; Director and President, AIM GP Canada Inc. (general partner for limited partnerships); and Van Kampen Advisors, Inc.; Director and Chief Executive Officer, Invesco Trimark Dealer Inc. (registered broker dealer); Director, Invesco Distributors, Inc. (formerly known as Invesco Aim Distributors, Inc.) (registered broker dealer); Manager, Invesco PowerShares Capital Management LLC; Director, Chief Executive Officer and President, Invesco Advisers, Inc.; Director, Chairman, Chief Executive Officer and President, Invesco Aim Capital Management, Inc.; President, Invesco Trimark Dealer Inc. and Invesco Trimark Ltd./Invesco Trimark Ltèe; Director and President, AIM Trimark Corporate Class Inc. and AIM Trimark Canada Fund Inc.; Senior Managing Director, Invesco Holding Company Limited; Trustee and Executive Vice President, Tax-Free Investments Trust; Director and Chairman, Fund Management Company (former registered broker dealer); President and Principal Executive Officer, The Invesco Funds (AIM Treasurer’s Series Trust (Invesco Treasurer’s Series Trust), Short-Term Investments Trust and Tax-Free Investments Trust only); President, AIM Trimark Global Fund Inc. and AIM Trimark Canada Fund Inc. | 117 | None | ||||
Wayne W. Whalen3 — 1939 Trustee | 2010 | Of Counsel, and prior to 2010, partner in the law firm of Skadden, Arps, Slate, Meagher & Flom LLP, legal counsel to certain funds in the Fund Complex | 130 | Director of the Mutual Fund Directors Forum, a nonprofit membership organization for investment directors; Chairman and Director of the Abraham Lincoln Presidential Library Foundation; and Director of the Stevenson Center for Democracy |
| 1 | Mr. Flanagan is considered an interested person of the Trust because he is an officer of the adviser to the Trust, and an officer and a director of Invesco Ltd., ultimate parent of the adviser to the Trust. |
| 2 | Mr. Taylor is considered an interested person of the Trust because he is an officer and a director of the adviser to, and a director of the principal underwriter of, the Trust. |
| 3 | Mr. Whalen is considered an “interested person” (within the meaning of Section 2(a)(19) of the 1940 Act) of certain Funds in the Invesco Fund Complex because he and his firm currently provide legal services as legal counsel to such Funds. |
T-1 Invesco Global Small & Mid Cap Growth Fund
Trustees and Officers—(continued)
Name, Year of Birth and Position(s) Held with the Trust | Trustee and/ or Officer Since | Principal Occupation(s) During Past 5 Years | Number of Funds in Fund Complex Overseen by Trustee | Other Directorship(s) Held by Trustee During Past 5 Years | ||||
| Independent Trustees | ||||||||
Bruce L. Crockett — 1944 Trustee and Chair | 1992 | Chairman, Crockett Technologies Associates (technology consulting company)
Formerly: Director, Captaris (unified messaging provider); Director, President and Chief Executive Officer COMSAT Corporation; and Chairman, Board of Governors of INTELSAT (international communications company) | 117 | ACE Limited (insurance company); Investment Company Institute | ||||
David C. Arch — 1945 Trustee | 2010 | Chairman and Chief Executive Officer of Blistex Inc., (consumer health care products manufacturer)
Formerly: Member of the Heartland Alliance Advisory Board, a nonprofit organization serving human needs based in Chicago | 130 | Board member of the Illinois Manufacturers’ Association; Member of the Board of Visitors, Institute for the Humanities, University of Michigan | ||||
Frank S. Bayley — 1939 Trustee | 2001 | Retired
Formerly: Director, Badgley Funds, Inc. (registered investment company) (2 portfolios) and General Partner and Of Counsel, law firm of Baker & McKenzie, LLP | 117 | Director and Chairman, C.D. Stimson Company (a real estate investment company); Trustee and Overseer, The Curtis Institute of Music | ||||
James T. Bunch — 1942 Trustee | 2003 | Managing Member, Grumman Hill Group LLC (family office private equity management)
Formerly: Founder, Green, Manning & Bunch Ltd. (investment banking firm)(1988-2010); Executive Committee, United States Golf Association; and Director, Policy Studies, Inc. and Van Gilder Insurance Corporation | 117 | Chairman, Board of Governors, Western Golf Association; Chairman-elect, Evans Scholars Foundation; and Director, Denver Film Society | ||||
Rodney F. Dammeyer — 1940 Trustee | 2010 | Chairman of CAC, LLC, (private company offering capital investment and management advisory services)
Formerly: Prior to 2001, Managing Partner at Equity Group Corporate Investments; Prior to 1995, Chief Executive Officer of Itel Corporation (formerly Anixter International); Prior to 1985, experience includes Senior Vice President and Chief Financial Officer of Household International, Inc., Executive Vice President and Chief Financial Officer of Northwest Industries, Inc. and Partner of Arthur Andersen & Co.; From 1987 to 2010, Director/Trustee of investment companies in the Van Kampen Funds complex | 117 | Director of Quidel Corporation and Stericycle, Inc.; Prior to May 2008, Trustee of The Scripps Research Institute; Prior to February 2008, Director of Ventana Medical Systems, Inc. | ||||
Albert R. Dowden — 1941 Trustee | 2000 | Director of a number of public and private business corporations, including the Boss Group, Ltd. (private investment and management); and Reich & Tang Funds (5 portfolios) (registered investment company)
Formerly: Director, Homeowners of America Holding Corporation/Homeowners of America Insurance Company (property casualty company); Director, Continental Energy Services, LLC (oil and gas pipeline service); Director, CompuDyne Corporation (provider of product and services to the public security market) and Director, Annuity and Life Re (Holdings), Ltd. (reinsurance company); Director, President and Chief Executive Officer, Volvo Group North America, Inc.; Senior Vice President, AB Volvo; Director of various public and private corporations; Chairman, DHJ Media, Inc.; Director, Magellan Insurance Company; and Director, The Hertz Corporation, Genmar Corporation (boat manufacturer), National Media Corporation; Advisory Board of Rotary Power International (designer, manufacturer, and seller of rotary power engines); and Chairman, Cortland Trust, Inc. (registered investment company) | 117 | Director of Nature’s Sunshine Products, Inc. | ||||
Jack M. Fields — 1952 Trustee | 1997 | Chief Executive Officer, Twenty First Century Group, Inc. (government affairs company); Owner and Chief Executive Officer, Dos Angeles Ranch, L.P. (cattle, hunting, corporate entertainment); and Discovery Global Education Fund (non-profit)
Formerly: Chief Executive Officer, Texana Timber LP (sustainable forestry company); Director of Cross Timbers Quail Research Ranch (non-profit); and member of the U.S. House of Representatives | 117 | Insperity, Inc. (formerly known as Administaff) | ||||
Prema Mathai-Davis — 1950 Trustee | 1998 | Retired
Formerly: Chief Executive Officer, YWCA of the U.S.A. | 117 | None | ||||
Larry Soll — 1942 Trustee | 2003 | Retired
Formerly: Chairman, Chief Executive Officer and President, Synergen Corp. (a biotechnology company) | 117 | None | ||||
Hugo F. Sonnenschein — 1940 Trustee | 2010 | Distinguished Service Professor and President Emeritus of the University of Chicago and the Adam Smith Distinguished Service Professor in the Department of Economics at the University of Chicago
Formerly: President of the University of Chicago | 130 | Trustee of the University of Rochester and a member of its investment committee. Member of the National Academy of Sciences, the American Philosophical Society and a fellow of the American Academy of Arts and Sciences | ||||
Raymond Stickel, Jr. — 1944 Trustee | 2005 | Retired
Formerly: Director, Mainstay VP Series Funds, Inc. (25 portfolios) and Partner, Deloitte & Touche | 117 | None |
T-2 Invesco Global Small & Mid Cap Growth Fund
Trustees and Officers—(continued)
Name, Year of Birth and Position(s) Held with the Trust | Trustee and/ or Officer Since | Principal Occupation(s) During Past 5 Years | Number of Funds in Fund Complex Overseen by Trustee | Other Directorship(s) Held by Trustee During Past 5 Years | ||||
| Other Officers | ||||||||
Russell C. Burk — 1958 Senior Vice President and Senior Officer | 2005 | Senior Vice President and Senior Officer, The Invesco Funds | N/A | N/A | ||||
John M. Zerr — 1962 Senior Vice President, Chief Legal Officer and Secretary | 2006 | Director, Senior Vice President, Secretary and General Counsel, Invesco Management Group, Inc. (formerly known as Invesco Aim Management Group, Inc.) and Van Kampen Exchange Corp.; Senior Vice President, Invesco Advisers, Inc. (formerly known as Invesco Institutional (N.A.), Inc.) (registered investment adviser); Senior Vice President and Secretary, Invesco Distributors, Inc. (formerly known as Invesco Aim Distributors, Inc.); Director, Vice President and Secretary, Invesco Investment Services, Inc. (formerly known as Invesco Aim Investment Services, Inc.) and IVZ Distributors, Inc. (formerly known as INVESCO Distributors, Inc.); Director and Vice President, INVESCO Funds Group, Inc.; Senior Vice President, Chief Legal Officer and Secretary, The Invesco Funds; Manager, Invesco PowerShares Capital Management LLC; Director, Secretary and General Counsel, Invesco Investment Advisers LLC (formerly known as Van Kampen Asset Management); Secretary and General Counsel, Invesco Capital Markets, Inc. (formerly known as Van Kampen Funds Inc.) and Chief Legal Officer, PowerShares Exchange-Traded Fund Trust, PowerShares Exchange-Traded Fund Trust II, PowerShares India Exchange-Traded Fund Trust and PowerShares Actively Managed Exchange-Traded Fund Trust
Formerly: Director and Vice President, Van Kampen Advisors Inc.; Director, Vice President, Secretary and General Counsel, Van Kampen Investor Services Inc.; Director, Invesco Distributors, Inc. (formerly known as Invesco Aim Distributors, Inc.); Director, Senior Vice President, General Counsel and Secretary, Invesco Aim Advisers, Inc. and Van Kampen Investments Inc.; Director, Vice President and Secretary, Fund Management Company; Director, Senior Vice President, Secretary, General Counsel and Vice President, Invesco Aim Capital Management, Inc.; Chief Operating Officer and General Counsel, Liberty Ridge Capital, Inc. (an investment adviser); Vice President and Secretary, PBHG Funds (an investment company) and PBHG Insurance Series Fund (an investment company); Chief Operating Officer, General Counsel and Secretary, Old Mutual Investment Partners (a broker-dealer); General Counsel and Secretary, Old Mutual Fund Services (an administrator) and Old Mutual Shareholder Services (a shareholder servicing center); Executive Vice President, General Counsel and Secretary, Old Mutual Capital, Inc. (an investment adviser); and Vice President and Secretary, Old Mutual Advisors Funds (an investment company) | N/A | N/A | ||||
Karen Dunn Kelley — 1960 Vice President | 2004 | Senior Managing Director, Investments; Director, Co-President, Co-Chief Executive Officer, and Co-Chairman, Invesco Advisers, Inc. (formerly known as Invesco Institutional (N.A.), Inc.) (registered investment adviser); Chairman, Invesco Senior Secured Management, Inc.; Senior Vice President, Invesco Management Group, Inc. (formerly known as Invesco Aim Management Group, Inc.); Executive Vice President, Invesco Distributors, Inc. (formerly known as Invesco Aim Distributors, Inc.); Director, Invesco Mortgage Capital Inc., and Invesco Management Company Limited; Director and President, INVESCO Asset Management (Bermuda) Ltd., Vice President, The Invesco Funds (other than AIM Treasurer’s Series Trust (Invesco Treasurer’s Series Trust) and Short-Term Investments Trust); and President and Principal Executive Officer, The Invesco Funds (AIM Treasurer’s Series Trust (Invesco Treasurer’s Series Trust) and Short-Term Investments Trust only)
Formerly: Director, INVESCO Global Asset Management Limited and INVESCO Management S.A.; Senior Vice President, Van Kampen Investments Inc. and Invesco Advisers, Inc. (formerly known as Invesco Institutional (N.A.), Inc.) (registered investment adviser); Vice President, Invesco Advisers, Inc. (formerly known as Invesco Institutional (N.A.), Inc.); Director of Cash Management and Senior Vice President, Invesco Advisers, Inc. and Invesco Aim Capital Management, Inc.; President and Principal Executive Officer, Tax-Free Investments Trust; Director and President, Fund Management Company; Chief Cash Management Officer, Director of Cash Management, Senior Vice President, and Managing Director, Invesco Aim Capital Management, Inc.; Director of Cash Management, Senior Vice President, and Vice President, Invesco Advisers, Inc. and The Invesco Funds (AIM Treasurer’s Series Trust (Invesco Treasurer’s Series Trust), Short-Term Investments Trust and Tax-Free Investments Trust only) | N/A | N/A |
T-3 Invesco Global Small & Mid Cap Growth Fund
Trustees and Officers—(continued)
Name, Year of Birth and Position(s) Held with the Trust | Trustee and/ or Officer Since | Principal Occupation(s) During Past 5 Years | Number of Funds in Fund Complex Overseen by Trustee | Other Directorship(s) Held by Trustee During Past 5 Years | ||||
| Other Officers—(continued) | ||||||||
Sheri Morris — 1964 Vice President, Treasurer and Principal Financial Officer | 1999 | Vice President, Treasurer and Principal Financial Officer, The Invesco Funds; Vice President, Invesco Advisers, Inc. (formerly known as Invesco Institutional (N.A.), Inc.) (registered investment adviser); and Vice President, PowerShares Exchange-Traded Fund Trust, PowerShares Exchange-Traded Fund Trust II, PowerShares India Exchange-Traded Fund Trust and PowerShares Actively Managed Exchange-Traded Fund Trust
Formerly: Vice President, Invesco Aim Advisers, Inc., Invesco Aim Capital Management, Inc. and Invesco Aim Private Asset Management, Inc.; Assistant Vice President and Assistant Treasurer, The Invesco Funds and Assistant Vice President, Invesco Advisers, Inc., Invesco Aim Capital Management, Inc. and Invesco Aim Private Asset Management, Inc.; and Treasurer, PowerShares Exchange-Traded Fund Trust, PowerShares Exchange-Traded Fund Trust II, PowerShares India Exchange-Traded Fund Trust and PowerShares Actively Managed Exchange-Traded Fund Trust | N/A | N/A | ||||
Crissie M. Wisdom — 1969 Anti-Money Laundering Compliance Officer | 2013 | Anti-Money Laundering Compliance Officer, Invesco Advisers, Inc. (formerly known as Invesco Institutional (N.A.), Inc.) (registered investment adviser), Invesco Capital Markets, Inc. (formerly known as Van Kampen Funds Inc.), Invesco Distributors, Inc., Invesco Investment Services, Inc., Invesco Management Group, Inc., Van Kampen Exchange Corp., The Invesco Funds, Invesco Funds (Chicago), and PowerShares Exchange-Traded Fund Trust, PowerShares Exchange-Traded Fund Trust II, PowerShares India Exchange-Traded Fund Trust, and PowerShares Actively Managed Exchange-Traded Fund Trust; and Fraud Prevention Manager and Controls and Risk Analysis Manager for Invesco Investment Services, Inc. | N/A | N/A | ||||
Todd L. Spillane — 1958 Chief Compliance Officer | 2006 | Senior Vice President, Invesco Management Group, Inc. (formerly known as Invesco Aim Management Group, Inc.) and Van Kampen Exchange Corp.; Senior Vice President and Chief Compliance Officer, Invesco Advisers, Inc. (registered investment adviser) (formerly known as Invesco Institutional (N.A.), Inc.); Chief Compliance Officer, The Invesco Funds; Vice President, Invesco Distributors, Inc. (formerly known as Invesco Aim Distributors, Inc.) and Invesco Investment Services, Inc. (formerly known as Invesco Aim Investment Services, Inc.)
Formerly: Chief Compliance Officer, Invesco Funds (Chicago); Senior Vice President, Van Kampen Investments Inc.; Senior Vice President and Chief Compliance Officer, Invesco Aim Advisers, Inc. and Invesco Aim Capital Management, Inc.; Chief Compliance Officer, INVESCO Private Capital Investments, Inc. (holding company), Invesco Private Capital, Inc. (registered investment adviser), Invesco Global Asset Management (N.A.), Inc., Invesco Senior Secured Management, Inc. (registered investment adviser), Van Kampen Investor Services Inc., PowerShares Exchange-Traded Fund Trust, PowerShares Exchange-Traded Fund Trust II, PowerShares India Exchange-Traded Fund Trust and PowerShares Actively Managed Exchange-Traded Fund Trust; and Vice President, Invesco Aim Capital Management, Inc. and Fund Management Company | N/A | N/A |
The Statement of Additional Information of the Trust includes additional information about the Fund’s Trustees and is available upon request, without charge, by calling 1.800.959.4246. Please refer to the Fund’s prospectus for information on the Fund’s sub-advisers.
Office of the Fund 11 Greenway Plaza, Suite 1000 Houston, TX 77046-1173 | Investment Adviser Invesco Advisers, Inc. 1555 Peachtree Street, N.E. Atlanta, GA 30309 | Distributor Invesco Distributors, Inc. 11 Greenway Plaza, Suite 1000 Houston, TX 77046-1173 | Auditors PricewaterhouseCoopers LLP 1201 Louisiana Street, Suite 2900 Houston, TX 77002-5678 | |||
Counsel to the Fund Stradley Ronon Stevens & Young, LLP 2005 Market Street, Suite 2600 Philadelphia, PA 19103-7018 | Counsel to the Independent Trustees Goodwin Procter LLP 901 New York Avenue, N.W. Washington, D.C. 20001 | Transfer Agent Invesco Investment Services, Inc. 11 Greenway Plaza, Suite 1000 Houston, TX 77046-1173 | Custodian State Street Bank and Trust Company 225 Franklin Street Boston, MA 02110-2801 | |||
T-4 Invesco Global Small & Mid Cap Growth Fund

Go Paperless with eDelivery Visit invesco.com/edelivery to receive quarterly statements, tax forms, fund reports and prospectuses with a service that’s all about eeees: | ||
- environmentally friendly. Go green by reducing the number of trees used to produce paper. | - efficient. Stop waiting for regular mail. Your documents will be sent via email as soon as they’re available. | |
- economical. Help reduce your fund’s printing and delivery expenses and put more capital back in your fund’s returns. |
- easy. Download, save and print files using your home computer with a few clicks of your mouse. | |
This service is provided by Invesco Investment Services, Inc.
| ||
Invesco mailing information
Send general correspondence to Invesco Investment Services, Inc., P.O. Box 219078, Kansas City, MO 64121-9078.
Invesco privacy policy
You share personal and financial information with us that is necessary for your transactions and your account records. We take very seriously the obligation to keep that information confidential and private.
Invesco collects nonpublic personal information about you from account applications or other forms you complete and from your transactions with us or our affiliates. We do not disclose information about you or our former customers to service providers or other third parties except to the extent necessary to service your account and in other limited circumstances as permitted by law. For example, we use this information to facilitate the delivery of transaction confirmations, financial reports, prospectuses and tax forms.
Even within Invesco, only people involved in the servicing of your accounts and compliance monitoring have access to your information. To ensure the highest level of confidentiality and security, Invesco maintains physical, electronic and procedural safeguards that meet or exceed federal standards. Special measures, such as data encryption and authentication, apply to your communications with us on our website. More detail is available to you at invesco.com/privacy.
Important notice regarding delivery of security holder documents
To reduce Fund expenses, only one copy of most shareholder documents may be mailed to shareholders with multiple accounts at the same address (Householding). Mailing of your shareholder documents may be householded indefinitely unless you instruct us otherwise. If you do not want the mailing of these documents to be combined with those for other members of your household, please contact Invesco Investment Services, Inc. at 800 959 4246 or contact your financial institution. We will begin sending you individual copies for each account within 30 days after receiving your request.
Fund holdings and proxy voting information
The Fund provides a complete list of its holdings four times in each fiscal year, at the quarter ends. For the second and fourth quarters, the lists appear in the Fund’s semiannual and annual reports to shareholders. For the first and third quarters, the Fund files the lists with the Securities and Exchange Commission (SEC) on Form N-Q. The most recent list of portfolio holdings is available at invesco.com/completeqtrholdings. Shareholders can also look up the Fund’s Forms N-Q on the SEC website at sec.gov. Copies of the Fund’s Forms N-Q may be reviewed and copied at the SEC Public Reference Room in Washington, D.C. You can obtain information on the operation of the Public Reference Room, including information about duplicating fee charges, by calling 202 551 8090 or 800 732 0330, or by electronic request at the following email address: publicinfo@sec.gov. The SEC file numbers for the Fund are shown below.
A description of the policies and procedures that the Fund uses to determine how to vote proxies relating to portfolio securities is available without charge, upon request, from our Client Services department at 800 959 4246 or at invesco.com/proxyguidelines. The information is also available on the SEC website, sec.gov.
Information regarding how the Fund voted proxies related to its portfolio securities during the most recent 12-month period ended June 30 is available at invesco.com/proxysearch. The information is also available on the SEC website, sec.gov. Invesco Advisers, Inc. is an investment adviser; it provides investment advisory services to individual and institutional clients and does not sell securities. Invesco Distributors, Inc. is the US distributor for Invesco Ltd.’s retail mutual funds, exchange-traded funds and institutional money market funds. Both are wholly owned, indirect subsidiaries of Invesco Ltd. |  |
| SEC file numbers: 811-06463 and 033-44611 | GSMG-AR-1 | Invesco Distributors, Inc. |
 |
Annual Report to Shareholders
| October 31, 2013 | ||
Invesco International Core Equity Fund | ||||
Nasdaq: A: IBVAX n B: IBVBX n C: IBVCX n R: IIBRX n Y: IBVYX Investor: IIBCX n R5: IBVIX n R6: IBVFX | ||||

Letters to Shareholders
Philip Taylor | Dear Shareholders: Enclosed in this annual report, you’ll find information about your Fund and the factors that affected its performance during the reporting period. Inside, you’ll also find a discussion from your portfolio managers about how they managed your Fund, as well as performance data for your Fund, a complete list of your Fund’s investments as of the close of the reporting period and other important information. I hope you find this report of interest. During the reporting period covered by this report, major US equity indexes made multiyear or even all-time highs.1 Economic data were generally positive; housing and consumer spending data were particularly encouraging. Nonetheless, economic uncertainty and concern about continuing political and budget gridlock in Washington persisted. The US Federal Reserve’s deliberate vagueness about when, and to what degree, it might begin to curtail its extraordinarily accommodative | |
monetary policies affected fixed income and equity markets alike. Most developed, non-US stock markets remained positive for the first half of 2013, despite a difficult second quarter. Periods of market volatility and economic uncertainty can weaken the will of even the most resolute investor. That’s why Invesco believes it’s often helpful to work with a skilled and trusted financial adviser who can emphasize the importance of adhering to an investment plan designed to achieve long-term goals rather than being sidetracked by short-term uncertainty that can result in inaction. A financial adviser who is familiar with your individual financial situation, investment goals and risk tolerance can be an invaluable partner as you work toward your financial goals. He or she can provide insight and perspective when markets are volatile; encouragement and reassurance when times are uncertain; and advice and guidance when your financial situation or investment goals change. Our website, invesco.com/us, is another source of timely insight and information for investors. On the website, you’ll find fund-specific as well as more general information from many of Invesco’s investment professionals. You’ll find in-depth articles, video clips and audio commentaries – and, of course, you also can access information about your Invesco account whenever it’s convenient for you. | ||

What we mean by Intentional Investing
At Invesco, all of our people and all of our resources are dedicated to helping investors achieve their financial objectives. It’s a philosophy we call Intentional Investing, and it guides the way we:
| n | Manage investments - Our dedicated investment professionals search the world for the best opportunities, and each investment team follows a clear, disciplined process to build portfolios and mitigate risk. |
| n | Provide choices - We offer multiple investment strategies, allowing you and your financial adviser to build a portfolio that’s purpose-built for your needs. |
| n | Connect with you - We’re committed to giving you the expert insights you need to make informed investing decisions, and we are well-equipped to provide high-quality support for investors and advisers. |
At Invesco, we believe in putting investors first. That’s why investment management is all we do. Our sole focus on managing your money allows you and your financial adviser to build a portfolio of Invesco funds appropriate for your investment needs and goals today and when your circumstances change.
Have questions?
For questions about your account, feel free to contact an Invesco client services representative at 800 959 4246. For Invesco-related questions or comments, please email me directly at phil@invesco.com.
All of us at Invesco look forward to serving your investment management needs for many years to come. Thank you for investing with us.
Sincerely,
|
 |
| Philip Taylor |
| Senior Managing Director, Invesco Ltd. |
| 1 | Source: Reuters |
2 Invesco International Core Equity Fund
Bruce Crockett | Dear Fellow Shareholders: The Invesco Funds Board has worked on a variety of issues over the last several months, and I’d like to take this opportunity to discuss two that affect you and our fellow fund shareholders. The first issue on which your Board has been working is our annual review of the funds’ advisory and sub-advisory contracts with Invesco Advisers and its affiliates. This annual review, which is required by the Investment Company Act of 1940, focuses on the nature and quality of the services Invesco provides as adviser to the Invesco Funds and the reasonableness of the fees that it charges for those services. Each year, we spend months reviewing detailed information that we request from Invesco that allows us to evaluate its services and fees. We also use information from many independent sources, including materials provided by the independent Senior Officer of the Invesco Funds, who reports directly to the independent Trustees on the Board. Additionally, we meet with | |
independent legal counsel and review performance and fee data prepared by Lipper Inc., an independent, third-party firm widely recognized as a leader in its field. I’m pleased to report that the Board determined in June that renewing the investment advisory agreement and the sub-advisory contracts with Invesco Advisers and its affiliates would serve the best interests of each fund and its shareholders. The second area of focus to highlight is the Board’s efforts to ensure that we provide a lineup of funds that allow financial advisers to build portfolios that meet shareholders’ changing financial needs and goals. Today, more and more investors are reaching, or approaching, retirement. But interest rates remain low, making it difficult for many investors to generate the income they need, or will soon need, in their retirement years. The members of your Board think about these things, too, and we’ve worked with Invesco Advisers to provide more income-generating options in the Invesco Funds lineup to help shareholders potentially meet their income needs. Your Board recently approved changes to three existing equity mutual funds, increasing their focus on generating income while also seeking to provide long-term growth of capital. As a result of these changes, the funds and their respective management teams now have more flexibility to invest in the types of securities that could meet investors’ growing need for income generation, and in some cases, also help investors diversify their sources of income. These equity funds complement an array of fixed-income, asset allocation and alternative investment options in the Invesco Funds lineup designed to accommodate a variety of risk tolerances. Be assured that your Board will continue working on behalf of fund shareholders, keeping your needs and interests uppermost in our minds. As always, please contact me at bruce@brucecrockett.com with any questions or concerns you may have. On behalf of the Board, we look forward to continuing to represent your interests and serving your needs. | ||

| Sincerely, |
 |
| Bruce L. Crockett |
| Independent Chair |
| Invesco Funds Board of Trustees |
3 Invesco International Core Equity Fund
Management’s Discussion of Fund Performance
| Performance summary | ||
For the fiscal year ended October 31, 2013, Invesco International Core Equity Fund underperformed its benchmarks. Stock selection in the energy, health care and industrials sectors contributed positively to Fund performance, while holdings in the consumer discretionary, consumer staples, financials, information technology (IT), and materials sectors detracted from performance for the reporting period. Your Fund’s long-term performance appears later in this report.
| ||
Fund vs. Indexes | ||
Total returns, 10/31/12 to 10/31/13, at net asset value (NAV). Performance shown does not include applicable contingent deferred sales charges (CDSC) or front-end sales charges, which would have reduced performance.
|
| Class A Shares | 18.11 | % | |||
| Class B Shares | 17.35 | ||||
| Class C Shares | 17.30 | ||||
| Class R Shares | 17.87 | ||||
| Class Y Shares | 18.53 | ||||
Investor Class Shares | 18.14 | ||||
| Class R5 Shares | 18.71 | ||||
| Class R6 Shares | 18.84 | ||||
MSCI EAFE Index‚ (Broad Market/Style-Specific Index) | 26.88 | ||||
Lipper International Large-Cap Core Funds Indexn (Peer Group Index) | 25.29 | ||||
| Source(s): ‚Invesco, MSCI via FactSet Research Systems Inc.; nLipper Inc. |
How we invest
The Fund invests primarily in stocks of mid- and large-cap foreign companies with attractive relative valuations and quality characteristics. Our investment process includes a proprietary valuation assessment, fundamental research and team-based portfolio decisions. We are committed to a long-term investment horizon resulting in low rates of portfolio turnover. Our risk management efforts seek to ensure that the largest single component of active risk is security-specific, which is consistent with stock selection being the sole targeted area of excess return. We strive to maintain a consistent investment discipline through varying market conditions and an appropriate level of overall portfolio diversification. Individual holdings are selected based on their own merits, and not on projections of country or sector performance.
Our sell discipline replicates our security selection process in that we look to trim or liquidate positions in the portfolio based on valuations, fundamentals or portfolio design considerations.
Market conditions and your Fund
The fiscal year saw slow but steady improvement in global economies and strong US and global equity market returns. In late 2012 and early 2013, consumer confidence trended higher based on the recovery of the US housing market, but uncertainty surrounding the outcome of tax and spending negotiations between the White House and Congress – and implementation of sequestration spending cuts – left many businesses hesitant to spend.
Asian equity markets (excluding Japan) experienced a volatile fiscal year but generally ended the reporting period on a
positive note. Certain emerging Asian markets struggled, however, on the back of continued sensitivity to the global liquidity environment.
Japanese equities rose sharply, based on investors’ hopes that the new government led by Prime Minister Shinzo Abe, along with a “regime-changed” Bank of Japan, would finally stop deflation. However, the market consolidated in May, amid a tug of war between investors’ optimistic views about Abe’s leadership and the potential of “Abenomics” and concerns about overseas uncertainties, particularly in the US, China and emerging economies.
Strong macroeconomic data and a continued reduction in political uncertainty buoyed European equity markets as the period progressed. UK equities ended the reporting period strongly across many sectors, spurred by improving housing and employment data. Continental Europe posted strong gains for the reporting period as well. Indeed, the eurozone officially exited recession around August and September.
Overall, major US and global stock market indexes rose throughout 2013, hitting multiyear or all-time highs.1
From late May through June, capital markets declined following US Federal Reserve (the Fed) Chairman Ben Bernanke’s comments suggesting the time had come to begin reducing the Fed’s extraordinary stimulus policies. This news, combined with data showing a slowdown in China’s economy, led to a sharp correction in non-US stocks from their mid-May peak. The hardest-hit segments of the market were interest rate-sensitive and commodity-related sectors, as well as emerging markets. Markets stabilized in mid-summer, and despite some volatility in August surrounding a potential US military reaction to instability in Syria, they generally moved higher through the end of the fiscal year.
Portfolio Composition | |||||
By sector
| |||||
| Financials | 25.8 | % | |||
| Energy | 12.6 | ||||
| Telecommunication Services | 10.7 | ||||
| Consumer Staples | 9.4 | ||||
| Materials | 8.2 | ||||
| Consumer Discretionary | 8.1 | ||||
| Industrials | 7.4 | ||||
| Health Care | 6.6 | ||||
| Information Technology | 3.8 | ||||
| Utilities | 3.0 | ||||
| Money Market Funds | |||||
| Plus Other Assets Less Liabilities | 4.4 |
Top 10 Equity Holdings*
| |||||
| 1. Total S.A.-ADR | 3.0 | % | |||
| 2. Swisscom AG | 2.9 | ||||
| 3. Sanofi | 2.7 | ||||
| 4. Imperial Tobacco Group PLC | 2.5 | ||||
| 5. Mitsubishi UFJ Financial Group, Inc. | 2.4 | ||||
| 6. BNP Paribas S.A. | 2.4 | ||||
| 7. Barclays PLC | 2.3 | ||||
| 8. Zurich Insurance Group AG | 2.3 | ||||
| 9. Standard Chartered PLC | 2.2 | ||||
| 10. AMEC PLC | 2.0 | ||||
Top Five Countries*
| |||||
| 1. Japan | 18.4 | % | |||
| 2. United Kingdom | 16.6 | ||||
| 3. France | 11.1 | ||||
| 4. Australia | 10.3 | ||||
| 5. Switzerland | 7.3 | ||||
| Total Net Assets | $136 million | ||||
| Total Number of Holdings* | 109 | ||||
The Fund’s holdings are subject to change, and there is no assurance that the Fund will continue to hold any particular security.
*Excluding money market fund holdings.
| 4 Invesco International Core Equity Fund |
The Fund stayed true to its process and benefited from its quality orientation in stock selection. Our stock selection within the energy, health care and industrials sectors made the largest contribution to the Fund’s relative results. The largest contributor during the fiscal year was Porsche Automobil as litigation risk associated with complaints of market manipulation in its merger with Volkswagen diminished and expectations of punitive damages declined. This has unlocked some value offered by Porsche shares which had been burdened with legal uncertainty. Within the energy sector, Vallourec was a top contributor. After disappointing performance in prior years, Vallourec rebounded strongly in late 2012 and the first part of 2013. The company was previously weighed down by facility cost overruns as it ramped up production in Brazil. However, with these issues largely behind it, and with an uptick in sales of its steel tubing to its energy clients, Vallourec’s stock price began to more fully reflect the company’s true value.
Detracting from the Fund’s relative performance was our stock selection in the consumer discretionary, consumer staples, financials, IT and materials sectors. DeNA, a Japanese-based on-line gaming company, struggled due to expansion plans that failed to materialize as quickly as the company and investors had hoped, leading to a pullback in the company’s share price. Also hampering the Fund’s performance was Yamada Denki. The Japanese retailer experienced slumping sales which resulted in lowered earnings guidance and weighed on the share price.
From a geographic perspective, the Fund’s exposure to the Asia Pacific region and Europe detracted from Fund performance during the fiscal year. Specifically, stock selection in Italy, the UK, Norway and Japan negatively affected Fund performance. Conversely, stock selection in Australia, Denmark, and France added to performance versus the Fund’s broad-based/style-specific benchmark.
At the close of the reporting period, the Fund maintained overweight positions in emerging markets, Australia, and Canada, while being modestly underweight in German and UK securities, relative to the Fund’s broad-based/ style-specific benchmark. In addition, the Fund was slightly overweight in France and Japan.
The Fund maintained an overweight position in the energy, materials, and telecommunication services sectors. Conversely, in the consumer staples, consumer discretionary, financials,
health care, industrials, IT and utilities sectors, the Fund maintained an underweight position compared to its broad-based/style-specific benchmark.
During the fiscal year, we initiated positions in several telecommunication companies, including TDC and Rogers Communications. Other purchases included AMEC, an energy engineering consultant and manager, Tate & Lyle, an ingredient provider for the food and beverage industry, Boskalis Westminster, a Netherlands-based port construction company, ComfortDelGro, a transportation-focused industrial company in Singapore and Woodside Petroleum, an Australian oil and gas producer.
We liquidated our holdings in NSK and Repsol after a recent rally in their share prices. We also sold our holdings in Danske Bank, Nippon Yusen, Toyota, and Barrick Gold as their relative attractiveness deteriorated in our view and fundamentals became a concern. Within the industrial sector, both ABB and Salzgitter were sold.
Investors are faced with several macroeconomic issues which could increase near-term market volatility, including a less than stable European economic recovery and uncertainty regarding the timing of the long awaited tapering by the US Fed and its impact on interest rates globally. We will continue to closely monitor each of these factors and maintain a long-term view for opportunities in which to invest.
Despite the very strong gains achieved during the reporting period, valuations are still quite attractive, particularly with a long-term perspective. Invesco’s bottom-up approach to stock selection continues to provide us with such investment opportunities. Our focus on building well diversified portfolios with above-average profitability and valuation characteristics has not generated satisfactory returns for the past few quarters, but we believe it is well positioned for the long term.
Thank you for your investment in Invesco International Core Equity Fund.
1 Source: Reuters
The views and opinions expressed in management’s discussion of Fund performance are those of Invesco Advisers, Inc. These views and opinions are subject to change at any time based on factors such as market and economic conditions. These views and opinions may not be relied upon as investment advice or recommendations, or as an offer for a particular security. The information is not a complete analysis of every aspect of any market, country, industry, security or the Fund. Statements of fact are from sources considered reliable, but Invesco Advisers, Inc. makes no representation or warranty as to their completeness or accuracy. Although historical performance is no guarantee of future results, these insights may help you understand our investment management philosophy.
See important Fund and, if applicable, index disclosures later in this report.
 | Ingrid Baker Chartered Financial Analyst, portfolio manager, is manager of Invesco International Core Equity Fund. | |
| She joined Invesco in 1999. Ms. Baker earned a BA in international politics from Oberlin College and an MBA in finance from the University of Navarra. | ||
| W. Lindsay Davidson Portfolio manager, is manager of Invesco International Core Equity Fund. | |
| He joined Invesco in 1984. Mr. Davidson earned an economics degree from Edinburgh University. | ||

 | Anuja Singha Chartered Financial Analyst, portfolio manager, is manager of Invesco International Core Equity Fund. | |
| She joined Invesco in 1998. Ms. Singha earned a BA in economics from Mills College and a PhD in economics from Emory University. | ||
| Stephen Thomas Chartered Financial Analyst, portfolio manager, is manager of Invesco International Core Equity Fund. | |
| He joined Invesco in 2000. Mr. Thomas earned a BBA in banking and finance and an MBA from the University of Mississippi. | ||

5 Invesco International Core Equity Fund
Your Fund’s Long-Term Performance
Results of a $10,000 Investment – Oldest Share Class(es)
Fund and index data from 10/31/03
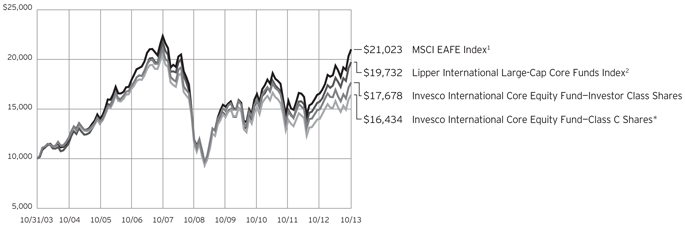
1 Source(s): Invesco, MSCI via FactSet Research Systems Inc.
2 Source: Lipper Inc.
*The Fund’s oldest share class (Investor) does not have a sales charge, therefore, the second oldest share class with a sales charge (Class C) is also included in the chart.
Past performance cannot guarantee comparable future results.
The data shown in the chart include reinvested distributions, applicable sales charges and Fund expenses including
management fees. Index results include reinvested dividends, but they do not reflect sales charges. Performance of the peer group, if applicable, reflects fund expenses and management fees; perfor-
mance of a market index does not. Performance shown in the chart and table(s) does not reflect deduction of taxes a shareholder would pay on Fund distributions or sale of Fund shares.
continued from page 8
About indexes used in this report
| n | The MSCI EAFE® Index is an unmanaged index considered representative of stocks of Europe, Australasia and the Far East. The index is computed using the net return, which withholds applicable taxes for non-resident investors. |
| n | The Lipper International Large-Cap Core Funds Index is an unmanaged index considered representative of international large-cap core funds tracked by Lipper. |
| n | The Fund is not managed to track the performance of any particular index, including the index(es) described here, and consequently, the performance of the Fund may deviate significantly from the performance of the index(es). |
| n | A direct investment cannot be made in an index. Unless otherwise indicated, index results include reinvested dividends, and they do not reflect sales charges. Performance of the peer group, if applicable, reflects fund expenses; performance of a market index does not. |
Other information
| n | The returns shown in management’s discussion of Fund performance are based on net asset values calculated for shareholder transactions. Generally accepted accounting principles require adjustments to be made to the net assets of the Fund at period end for financial reporting purposes, and as such, the net asset values for share- |
holder transactions and the returns based on those net asset values may differ from the net asset values and returns reported in the Financial Highlights. |
| n | Industry classifications used in this report are generally according to the Global Industry Classification Standard, which was developed by and is the exclusive property and a service mark of MSCI Inc. and Standard & Poor’s. |
6 Invesco International Core Equity Fund
| Average Annual Total Returns | ||
As of 10/31/13, including maximum applicable sales charges | ||
Class A Shares | ||
|
| |
Inception (3/28/02) | 4.32% | |
|
| |
10 Years | 5.25 | |
|
| |
5 Years | 7.00 | |
|
| |
1 Year | 11.66 | |
|
| |
Class B Shares | ||
|
| |
Inception (3/28/02) | 4.37% | |
|
| |
10 Years | 5.23 | |
|
| |
5 Years | 7.10 | |
|
| |
1 Year | 12.35 | |
|
| |
Class C Shares | ||
|
| |
Inception (2/14/00) | 1.78% | |
|
| |
10 Years | 5.09 | |
|
| |
5 Years | 7.39 | |
|
| |
1 Year | 16.30 | |
|
| |
Class R Shares | ||
|
| |
Inception (11/24/03) | 5.46% | |
|
| |
5 Years | 7.94 | |
|
| |
1 Year | 17.87 | |
|
| |
Class Y Shares | ||
|
| |
10 Years | 6.00% | |
|
| |
5 Years | 8.49 | |
|
| |
1 Year | 18.53 | |
|
| |
Investor Class Shares | ||
|
| |
Inception (10/28/98) | 3.87% | |
|
| |
10 Years | 5.86 | |
|
| |
5 Years | 8.22 | |
|
| |
1 Year | 18.14 | |
|
| |
Class R5 Shares | ||
|
| |
Inception (4/30/04) | 5.52% | |
|
| |
5 Years | 8.89 | |
|
| |
1 Year | 18.71 | |
|
| |
Class R6 Shares | ||
|
| |
10 Years | 5.93% | |
|
| |
5 Years | 8.36 | |
|
| |
1 Year | 18.84 | |
Class Y shares incepted on October 3, 2008. Performance shown prior to that date is that of Investor Class shares and includes the 12b-1 fees applicable to Investor Class shares. Investor Class share performance reflects any applicable fee waivers or expense reimbursements.
Class R6 shares incepted on September 24, 2012. Performance shown prior to that date is that of Investor Class shares and includes the 12b-1 fees applicable to Investor Class shares. Investor Class share performance reflects any applicable fee waivers or expense reimbursements.
| Average Annual Total Returns | ||
As of 9/30/13, the most recent calendar quarter end, including maximum applicable sales charges | ||
Class A Shares | ||
|
| |
Inception (3/28/02) | 4.08% | |
|
| |
10 Years | 5.43 | |
|
| |
5 Years | 1.79 | |
|
| |
1 Year | 8.98 | |
|
| |
Class B Shares | ||
|
| |
Inception (3/28/02) | 4.13% | |
|
| |
10 Years | 5.42 | |
|
| |
5 Years | 1.84 | |
|
| |
1 Year | 9.45 | |
|
| |
Class C Shares | ||
|
| |
Inception (2/14/00) | 1.57% | |
|
| |
10 Years | 5.29 | |
|
| |
5 Years | 2.21 | |
|
| |
1 Year | 13.53 | |
|
| |
Class R Shares | ||
|
| |
Inception (11/24/03) | 5.19% | |
|
| |
5 Years | 2.73 | |
|
| |
1 Year | 15.08 | |
|
| |
Class Y Shares | ||
|
| |
10 Years | 6.19% | |
|
| |
5 Years | 3.24 | |
|
| |
1 Year | 15.66 | |
|
| |
Investor Class Shares | ||
|
| |
Inception (10/28/98) | 3.68% | |
|
| |
10 Years | 6.06 | |
|
| |
5 Years | 2.99 | |
|
| |
1 Year | 15.38 | |
|
| |
Class R5 Shares | ||
|
| |
Inception (4/30/04) | 5.22% | |
|
| |
5 Years | 3.62 | |
|
| |
1 Year | 15.90 | |
|
| |
Class R6 Shares | ||
|
| |
10 Years | 6.12% | |
|
| |
5 Years | 3.10 | |
|
| |
1 Year | 15.91 | |
The performance data quoted represent past performance and cannot guarantee comparable future results; current performance may be lower or higher. Please visit invesco.com/performance for the most recent month-end performance. Performance figures reflect reinvested distributions, changes in net asset value and the effect of the maximum sales charge unless otherwise stated. Investment return and principal value will fluctuate so that you may have a gain or loss when you sell shares.
The total annual Fund operating expense ratio set forth in the most recent Fund prospectus as of the date of this report for Class A, Class B, Class C, Class R, Class Y, Investor Class, Class R5 and Class R6 shares was 1.59%, 2.34%, 2.34%, 1.84%, 1.34%, 1.59%, 0.90% and 0.90%, respectively. The expense ratios presented above may vary from the expense ratios presented in other sections of this report that are based on expenses incurred during the period covered by this report.
Class A share performance reflects the maximum 5.50% sales charge, and Class B and Class C share performance reflects the applicable contingent deferred sales charge (CDSC) for the period involved. The CDSC on Class B shares declines from 5% beginning at the time of purchase to 0% at the beginning of the seventh year. The CDSC on Class C shares is 1% for the first year after purchase. Class R, Class Y, Investor Class, Class R5 and Class R6 shares do not have a front-end sales charge or a CDSC; therefore, performance is at net asset value.
The performance of the Fund’s share classes will differ primarily due to different sales charge structures and class expenses.
Had the adviser not waived fees and/ or reimbursed expenses in the past for Class C shares, performance would have been lower.
| 7 Invesco International Core Equity Fund |
Invesco International Core Equity Fund’s investment objective is long-term growth of capital.
| n | Unless otherwise stated, information presented in this report is as of October 31, 2013, and is based on total net assets. |
| n | Unless otherwise noted, all data provided by Invesco. |
| n | To access your Fund’s reports/prospectus, visit invesco.com/fundreports. |
About share classes
| n | Class B shares may not be purchased for new or additional investments. Please see the prospectus for more information. |
| n | Class R shares are generally available only to employer sponsored retirement and benefit plans. Please see the prospectus for more information. |
| n | Class Y shares are available only to certain investors. Please see the prospectus for more information. |
| n | Investor Class shares are closed to new investors. Contact your financial adviser about purchasing our other share classes. Please see the prospectus for more information. |
| n | Class R5 shares and Class R6 shares are primarily intended for employer sponsored retirement and benefit plans that meet certain standards and for institutional investors. On September 24, 2012, Institutional Class shares were renamed Class R5 shares. Please see the prospectus for more information. |
Principal risks of investing
in the Fund
| n | Depositary receipts risk. Depositary receipts involve many of the same risks as those associated with direct investment in foreign securities. In addition, the underlying issuers of certain depositary receipts, particularly unsponsored or unregistered depositary receipts, are under no obligation to distribute shareholder communications to the holders of such receipts or to pass through to them any voting rights with respect to the deposited securities. |
| n | Derivatives risk. The performance of derivative instruments is tied to the performance of an underlying currency, security, index, commodity or other asset. In addition to risks relating to their underlying assets, the use of derivatives may include other, possibly greater, risks. Derivatives involving costs, may be volatile, and |
may involve a small initial investment relative to the risk assumed. Risks associated with the use of derivatives may include counterparty, margin, leverage, correlation, liquidity, tax, market, interest rate and management risks, as well as the risk of potential increased regulation of derivatives. Derivatives may also be more difficult to purchase, sell or value than other investments. The Fund may lose more than the cash amount invested on investments in derivatives. Each of these risks is greater for the Fund than mutual funds that do not use derivatives to implement their investment strategy. |
| n | Developing/emerging markets securities risk. The prices of securities issued by foreign companies and governments located in developing/emerging markets countries may be affected more negatively by inflation, devaluation of their currencies, higher transaction costs, delays in settlement, adverse political developments, the introduction of capital controls, withholding taxes, nationalization of private assets, expropriation, social unrest, war or lack of timely information than those in developed countries. |
| n | Foreign securities risk. The Fund’s foreign investments may be affected by changes in a foreign country’s exchange rates, political and social instability, changes in economic or taxation policies, difficulties when enforcing obligations, decreased liquidity, and increased volatility. Foreign companies may be subject to less regulation resulting in less publicly available information about the companies. |
| n | Geographic focus risk. From time to time the Fund may invest a substantial amount of its assets in securities of issuers located in a single country or a limited number of countries. If the Fund focuses its investments in this manner, it assumes the risk that economic, |
political and social conditions in those countries will have a significant impact on its investment performance. The Fund’s investment performance may also be more volatile if it focuses its investments in certain countries, especially emerging markets countries. |
| n | Investing in the European Union risk. Many countries in the European Union are susceptible to high economic risks associated with high levels of debt, notably due to investments in sovereign debts of European countries such as Greece, Italy and Spain. One or more member states might exit the European Union, placing its currency and banking system in jeopardy. The European Union faces major issues involving its membership, structure, procedures and policies, including the adoption, abandonment or adjustment of the new constitutional treaty, the European Union’s enlargement to the south and east, and resolution of the European Union’s problematic fiscal and democratic accountability. Efforts of the member states to further unify their economic and monetary policies may increase the potential for the downward movement of one member state’s market to cause a similar effect on other member states’ markets. European countries that are part of the European Economic and Monetary Union may be significantly affected by the tight fiscal and monetary controls that the union seeks to impose on its members. |
| n | Management risk. The investment techniques and risk analysis used by the Fund’s portfolio managers may not produce the desired results. |
| n | Market risk. The prices of and the income generated by the Fund’s securities may decline in response to, among other things, investor sentiment, general economic and market conditions, regional or global instability, and currency and interest rate fluctuations. |
continued on page 6
Fund Nasdaq Symbols | ||||
This report must be accompanied or preceded by a currently effective Fund prospectus, which contains more complete information, including sales charges and expenses. Investors should read it carefully before investing.
| Class A Shares | IBVAX | ||
Class B Shares | IBVBX | |||
Class C Shares | IBVCX | |||
Class R Shares | IIBRX | |||
| Class Y Shares | IBVYX | ||
Investor Class Shares | IIBCX | |||
| NOT FDIC INSURED | MAY LOSE VALUE | NO BANK GUARANTEE | Class R5 Shares | IBVIX | ||
Class R6 Shares | IBVFX | |||
8 Invesco International Core Equity Fund
Schedule of Investments
October 31, 2013
| Shares | Value | |||||||
Common Stocks & Other Equity Interests–95.57% |
| |||||||
| Australia–10.33% | ||||||||
Australia & New Zealand Banking Group Ltd. | 74,874 | $ | 2,394,887 | |||||
BHP Billiton Ltd. | 74,635 | 2,640,814 | ||||||
Macquarie Group Ltd. | 55,212 | 2,658,896 | ||||||
Suncorp Group Ltd. | 215,585 | 2,726,455 | ||||||
Telstra Corp. Ltd. | 258,343 | 1,264,882 | ||||||
Woodside Petroleum Ltd. | 64,670 | 2,372,915 | ||||||
| 14,058,849 | ||||||||
| Brazil–1.00% | ||||||||
Banco do Brasil S.A. | 14,400 | 191,267 | ||||||
Companhia de Saneamento de Minas Gerais–Copasa MG | 6,500 | 104,996 | ||||||
Companhia Paranaense de Energia–Copel–Class B–Preference Shares | 8,900 | 124,134 | ||||||
Grendene S.A. | 12,300 | 111,479 | ||||||
Itau Unibanco Holding S.A.–Preference Shares | 14,420 | 222,757 | ||||||
Petroleo Brasileiro S.A.–ADR | 13,813 | 240,761 | ||||||
Telefonica Brasil S.A.–Preference Shares | 7,500 | 165,316 | ||||||
Vale S.A.–ADR | 12,616 | 201,982 | ||||||
| 1,362,692 | ||||||||
| Canada–3.72% | ||||||||
Rogers Communications, Inc.–Class B | 45,037 | 2,044,073 | ||||||
Suncor Energy, Inc. | 47,251 | 1,717,188 | ||||||
Toronto-Dominion Bank (The) | 14,215 | 1,303,974 | ||||||
| 5,065,235 | ||||||||
| China–1.07% | ||||||||
China Agri-Industries Holdings Ltd. | 251,000 | 117,843 | ||||||
China Communications Construction Co. Ltd.–Class H | 65,000 | 52,813 | ||||||
China Construction Bank Corp.–Class H | 326,000 | 253,130 | ||||||
China Mobile Ltd. | 42,500 | 442,002 | ||||||
China Shenhua Energy Co. Ltd.–Class H | 36,000 | 109,583 | �� | |||||
CNOOC Ltd. | 132,800 | 269,917 | ||||||
KWG Property Holding Ltd. | 110,500 | 71,548 | ||||||
Lenovo Group Ltd. | 136,000 | 145,595 | ||||||
| 1,462,431 | ||||||||
| Denmark–1.07% | ||||||||
TDC A/S | 160,763 | 1,449,326 | ||||||
| France–11.13% | ||||||||
BNP Paribas S.A. | 44,534 | 3,292,255 | ||||||
Bouygues S.A. | 47,025 | 1,838,122 | ||||||
Cie Generale des Etablissements Michelin | 21,713 | 2,266,760 | ||||||
Sanofi | 34,190 | 3,655,838 | ||||||
Total S.A.–ADR | 66,866 | 4,090,862 | ||||||
| 15,143,837 | ||||||||
| Germany–6.19% | ||||||||
Deutsche Bank AG | 39,553 | 1,913,370 | ||||||
Deutsche Lufthansa AG(a) | 67,395 | 1,305,279 | ||||||
Muenchener Rueckversicherungs-Gesellschaft AG | 6,056 | 1,265,401 | ||||||
Porsche Automobil Holding SE–Preference Shares | 22,756 | 2,131,503 | ||||||
| Shares | Value | |||||||
| Germany–(continued) | ||||||||
Volkswagen AG | 7,399 | $ | 1,813,235 | |||||
| 8,428,788 | ||||||||
| Hong Kong–4.64% | ||||||||
Cheung Kong (Holdings) Ltd. | 101,000 | 1,578,898 | ||||||
First Pacific Co. Ltd. | 116,000 | 131,482 | ||||||
Henderson Land Development Co. Ltd. | 268,600 | 1,591,922 | ||||||
Standard Chartered PLC | 125,447 | 3,015,932 | ||||||
| 6,318,234 | ||||||||
| India–0.32% | ||||||||
Grasim Industries Ltd. | 3,866 | 176,373 | ||||||
Oil and Natural Gas Corp. Ltd. | 14,530 | 69,395 | ||||||
Tata Motors Ltd. | 30,758 | 192,079 | ||||||
| 437,847 | ||||||||
| Indonesia–0.27% | ||||||||
PT Bank Rakyat Indonesia (Persero) Tbk | 167,500 | 117,372 | ||||||
PT Indocement Tunggal Prakarsa Tbk | 16,500 | 30,588 | ||||||
PT Telekomunikasi Indonesia Persero Tbk | 540,000 | 112,560 | ||||||
PT United Tractors Tbk | 64,500 | 100,120 | ||||||
| 360,640 | ||||||||
| Italy–1.59% | ||||||||
Eni S.p.A.–ADR(b) | 42,736 | 2,170,989 | ||||||
| Japan–18.41% | ||||||||
Asahi Group Holdings, Ltd. | 86,600 | 2,340,282 | ||||||
DeNA Co., Ltd.(b) | 111,200 | 2,419,211 | ||||||
JSR Corp. | 85,200 | 1,620,000 | ||||||
Komatsu Ltd. | 73,400 | 1,606,019 | ||||||
Mitsubishi Corp. | 87,600 | 1,771,744 | ||||||
Mitsubishi UFJ Financial Group, Inc. | 524,200 | 3,315,808 | ||||||
Nippon Telegraph & Telephone Corp. | 27,500 | 1,428,895 | ||||||
Nissan Motor Co., Ltd. | 248,100 | 2,484,008 | ||||||
Nitto Denko Corp. | 25,500 | 1,339,185 | ||||||
NTT DoCoMo, Inc. | 79,100 | 1,253,123 | ||||||
Seven & I Holdings Co., Ltd. | 33,500 | 1,238,992 | ||||||
Shin-Etsu Chemical Co., Ltd. | 21,100 | 1,190,391 | ||||||
Toyo Suisan Kaisha, Ltd. | 56,000 | 1,781,794 | ||||||
Yamada Denki Co., Ltd.(b) | 453,500 | 1,268,435 | ||||||
| 25,057,887 | ||||||||
| Mexico–0.18% | ||||||||
America Movil S.A.B. de C.V.–Series L | 229,900 | 246,149 | ||||||
| Netherlands–1.52% | ||||||||
Koninklijke Boskalis Westminster N.V. | 42,911 | 2,066,492 | ||||||
| Norway–2.12% | ||||||||
Statoil ASA | 43,774 | 1,036,741 | ||||||
Yara International ASA | 43,010 | 1,853,208 | ||||||
| 2,889,949 | ||||||||
| Poland–0.08% | ||||||||
KGHM Polska Miedz S.A. | 2,723 | 109,726 | ||||||
See accompanying Notes to Financial Statements which are an integral part of the financial statements.
9 Invesco International Core Equity Fund
| Shares | Value | |||||||
| Russia–0.64% | ||||||||
Gazprom OAO–ADR | 15,950 | $ | 149,515 | |||||
Magnitogorsk Iron & Steel Works– | 27,066 | 87,397 | ||||||
Rosneft Oil Co.–REGS–GDR(c) | 24,789 | 194,934 | ||||||
Sberbank of Russia–ADR | 19,690 | 251,441 | ||||||
Sistema JSFC–REGS–GDR(c) | 6,746 | 180,793 | ||||||
| 864,080 | ||||||||
| Singapore–0.94% | ||||||||
ComfortDelGro Corp. Ltd. | 826,000 | 1,278,539 | ||||||
| South Africa–0.42% | ||||||||
Sasol Ltd. | 3,053 | 155,983 | ||||||
Standard Bank Group Ltd. | 10,585 | 134,305 | ||||||
Steinhoff International Holdings Ltd. | 41,580 | 160,541 | ||||||
Tiger Brands Ltd. | 4,043 | 118,477 | ||||||
| 569,306 | ||||||||
| South Korea–1.37% | ||||||||
Dongbu Insurance Co., Ltd. | 5,066 | 226,619 | ||||||
Hyundai Mobis | 1,060 | 299,294 | ||||||
Hyundai Motor Co. | 645 | 154,217 | ||||||
KT&G Corp. | 2,453 | 179,223 | ||||||
POSCO | 539 | 160,547 | ||||||
Samsung Electronics Co., Ltd. | 333 | 461,447 | ||||||
Shinhan Financial Group Co., Ltd. | 5,657 | 245,850 | ||||||
SK Telecom Co., Ltd. | 615 | 133,530 | ||||||
| 1,860,727 | ||||||||
| Spain–2.57% | ||||||||
Iberdrola S.A. | 246,070 | 1,546,165 | ||||||
Telefonica S.A. | 110,582 | 1,944,533 | ||||||
| 3,490,698 | ||||||||
| Switzerland–7.28% | ||||||||
Actelion Ltd. | 12,543 | 969,155 | ||||||
Credit Suisse Group AG | 60,704 | 1,888,554 | ||||||
Swisscom AG | 7,685 | 3,922,111 | ||||||
Zurich Insurance Group AG | 11,314 | 3,119,588 | ||||||
| 9,899,408 | ||||||||
| Taiwan–0.39% | ||||||||
Hon Hai Precision Industry Co., Ltd. | 82,500 | 208,886 | ||||||
Taiwan Semiconductor Manufacturing Co. Ltd. | 87,000 | 321,493 | ||||||
| 530,379 | ||||||||
| Shares | Value | |||||||
| Thailand–0.28% | ||||||||
Bangkok Bank PCL–NVDR | 32,900 | $ | 217,329 | |||||
PTT PCL | 16,400 | 166,708 | ||||||
| 384,037 | ||||||||
| Turkey–0.16% | ||||||||
TAV Havalimanlari Holding A.S. | 13,089 | 94,738 | ||||||
Tofas Turk Otomobil Fabrikasi A.S. | 18,135 | 120,123 | ||||||
| 214,861 | ||||||||
| Turkmenistan–0.15% | ||||||||
Dragon Oil PLC(b) | 22,179 | 209,446 | ||||||
| United Kingdom–16.58% | ||||||||
AMEC PLC | 145,081 | 2,737,800 | ||||||
AstraZeneca PLC | 31,015 | 1,640,897 | ||||||
Barclays PLC | 745,520 | 3,150,790 | ||||||
GlaxoSmithKline PLC | 100,990 | 2,658,713 | ||||||
Imperial Tobacco Group PLC | 89,088 | 3,332,371 | ||||||
National Grid PLC | 179,590 | 2,262,549 | ||||||
Rio Tinto PLC | 36,052 | 1,825,393 | ||||||
Royal Dutch Shell PLC–ADR | 21,233 | 1,415,392 | ||||||
Tate & Lyle PLC | 94,224 | 1,194,097 | ||||||
Tesco PLC | 401,206 | 2,337,665 | ||||||
| 22,555,667 | ||||||||
| United States–1.15% | ||||||||
Avago Technologies Ltd. | 34,351 | 1,560,566 | ||||||
Total Common Stocks & Other Equity Interests |
| 130,046,785 | ||||||
Money Market Funds–3.47% | ||||||||
Liquid Assets Portfolio– | 2,363,639 | 2,363,639 | ||||||
Premier Portfolio–Institutional Class(d) | 2,363,639 | 2,363,639 | ||||||
Total Money Market Funds |
| 4,727,278 | ||||||
TOTAL INVESTMENTS (excluding investments purchased with cash collateral from securities on loan)–99.04% |
| 134,774,063 | ||||||
Investments Purchased with Cash |
| |||||||
Liquid Assets Portfolio– | 4,433,529 | 4,433,529 | ||||||
TOTAL INVESTMENTS–102.30% |
| 139,207,592 | ||||||
OTHER ASSETS LESS LIABILITIES–(2.30)% |
| (3,134,448 | ) | |||||
NET ASSETS–100.00% |
| $ | 136,073,144 | |||||
Investment Abbreviations:
| ADR | – American Depositary Receipt | |
| GDR | – Global Depositary Receipt | |
| NVDR | – Non-Voting Depositary Receipt | |
| REGS | – Regulation S |
Notes to Schedule of Investments:
| (a) | Non-income producing security. |
| (b) | All or a portion of this security was out on loan at October 31, 2013. |
| (c) | Security purchased or received in a transaction exempt from registration under the Securities Act of 1933, as amended (the “1933 Act”). The security may be resold pursuant to an exemption from registration under the 1933 Act, typically to qualified institutional buyers. The aggregate value of these securities at October 31, 2013 was $463,124, which represented less than 1% of the Fund’s Net Assets. |
| (d) | The money market fund and the Fund are affiliated by having the same investment adviser. |
| (e) | The security has been segregated to satisfy the commitment to return the cash collateral received in securities lending transactions upon the borrower’s return of the securities loaned. See Note 1I. |
See accompanying Notes to Financial Statements which are an integral part of the financial statements.
10 Invesco International Core Equity Fund
Statement of Assets and Liabilities
October 31, 2013
Assets: |
| |||
Investments, at value (Cost $119,021,022)* | $ | 130,046,785 | ||
Investments in affiliated money market funds, at value and cost | 9,160,807 | |||
Total investments, at value (Cost $128,181,829) | 139,207,592 | |||
Foreign currencies, at value (Cost $381,519) | 381,723 | |||
Receivable for: | ||||
Investments sold | 850,378 | |||
Fund shares sold | 93,799 | |||
Dividends | 645,452 | |||
Investment for trustee deferred compensation and retirement plans | 53,987 | |||
Other assets | 22,873 | |||
Total assets | 141,255,804 | |||
Liabilities: |
| |||
Payable for: | ||||
Investments purchased | 413,431 | |||
Fund shares reacquired | 78,546 | |||
Collateral upon return of securities loaned | 4,433,529 | |||
Accrued fees to affiliates | 75,366 | |||
Accrued trustees’ and officers’ fees and benefits | 2,196 | |||
Accrued other operating expenses | 69,254 | |||
Trustee deferred compensation and retirement plans | 110,338 | |||
Total liabilities | 5,182,660 | |||
Net assets applicable to shares outstanding | $ | 136,073,144 | ||
Net assets consist of: |
| |||
Shares of beneficial interest | $ | 140,905,141 | ||
Undistributed net investment income | 1,782,505 | |||
Undistributed net realized gain (loss) | (17,686,694 | ) | ||
Net unrealized appreciation | 11,072,192 | |||
| $ | 136,073,144 | |||
Net Assets: |
| |||
Class A | $ | 42,703,339 | ||
Class B | $ | 2,487,506 | ||
Class C | $ | 12,457,877 | ||
Class R | $ | 2,016,105 | ||
Class Y | $ | 1,284,161 | ||
Investor Class | $ | 14,725,920 | ||
Class R5 | $ | 3,009,790 | ||
Class R6 | $ | 57,388,446 | ||
Shares outstanding, $0.001 par value per share, |
| |||
Class A | 3,728,436 | |||
Class B | 216,939 | |||
Class C | 1,115,929 | |||
Class R | 175,744 | |||
Class Y | 110,241 | |||
Investor Class | 1,265,823 | |||
Class R5 | 262,970 | |||
Class R6 | 5,011,698 | |||
Class A: | ||||
Net asset value per share | $ | 11.45 | ||
Maximum offering price per share | ||||
(Net asset value of $11.45 ¸ 94.50%) | $ | 12.12 | ||
Class B: | ||||
Net asset value and offering price per share | $ | 11.47 | ||
Class C: | ||||
Net asset value and offering price per share | $ | 11.16 | ||
Class R: | ||||
Net asset value and offering price per share | $ | 11.47 | ||
Class Y: | ||||
Net asset value and offering price per share | $ | 11.65 | ||
Investor Class: | ||||
Net asset value and offering price per share | $ | 11.63 | ||
Class R5: | ||||
Net asset value and offering price per share | $ | 11.45 | ||
Class R6: | ||||
Net asset value and offering price per share | $ | 11.45 | ||
| * | At October 31, 2013, securities with an aggregate value of $4,278,121 were on loan to brokers. |
See accompanying Notes to Financial Statements which are an integral part of the financial statements.
11 Invesco International Core Equity Fund
Statement of Operations
For the year ended October 31, 2013
Investment income: |
| |||
Dividends (net of foreign withholding taxes of $381,885) | $ | 4,788,541 | ||
Dividends from affiliated money market funds (includes securities lending income of $121,353) | 123,977 | |||
Total investment income | 4,912,518 | |||
Expenses: | ||||
Advisory fees | 1,294,686 | |||
Administrative services fees | 50,000 | |||
Custodian fees | 88,965 | |||
Distribution fees: | ||||
Class A | 101,070 | |||
Class B | 27,291 | |||
Class C | 117,640 | |||
Class R | 9,938 | |||
Investor Class | 36,161 | |||
Transfer agent fees — A, B, C, R, Y and Investor | 273,021 | |||
Transfer agent fees — R5 | 418 | |||
Transfer agent fees — R6 | 1,020 | |||
Trustees’ and officers’ fees and benefits | 31,039 | |||
Professional services fees | 132,148 | |||
Other | 175,428 | |||
Total expenses | 2,338,825 | |||
Less: Fees waived and expense offset arrangement(s) | (5,402 | ) | ||
Net expenses | 2,333,423 | |||
Net investment income | 2,579,095 | |||
Realized and unrealized gain (loss) from: | ||||
Net realized gain (loss) from: | ||||
Investment securities (Net of foreign taxes of $38,058) | 37,215,771 | |||
Foreign currencies | (117,084 | ) | ||
| 37,098,687 | ||||
Change in net unrealized appreciation (depreciation) of: | ||||
Investment securities (Net of foreign taxes on holdings of $35,234) | (1,314,080 | ) | ||
Foreign currencies | 22,864 | |||
| (1,291,216 | ) | |||
Net realized and unrealized gain | 35,807,471 | |||
Net increase in net assets resulting from operations | $ | 38,386,566 | ||
See accompanying Notes to Financial Statements which are an integral part of the financial statements.
12 Invesco International Core Equity Fund
Statement of Changes in Net Assets
For the years ended October 31, 2013 and 2012
| 2013 | 2012 | |||||||
Operations: | ||||||||
Net investment income | $ | 2,579,095 | $ | 6,546,284 | ||||
Net realized gain (loss) | 37,098,687 | (9,630,124 | ) | |||||
Change in net unrealized appreciation (depreciation) | (1,291,216 | ) | 9,253,160 | |||||
Net increase in net assets resulting from operations | 38,386,566 | 6,169,320 | ||||||
Distributions to shareholders from net investment income: | ||||||||
Class A | (710,340 | ) | (1,194,907 | ) | ||||
Class B | (30,084 | ) | (85,504 | ) | ||||
Class C | (118,668 | ) | (295,545 | ) | ||||
Class R | (31,854 | ) | (71,058 | ) | ||||
Class Y | (28,913 | ) | (38,444 | ) | ||||
Investor Class | (255,659 | ) | (428,804 | ) | ||||
Class R5 | (197,847 | ) | (7,206,076 | ) | ||||
Class R6 | (5,230,104 | ) | — | |||||
Total distributions from net investment income | (6,603,469 | ) | (9,320,338 | ) | ||||
Share transactions–net: | ||||||||
Class A | (2,345,965 | ) | (4,194,169 | ) | ||||
Class B | (1,013,721 | ) | (1,465,367 | ) | ||||
Class C | (1,189,913 | ) | (3,368,728 | ) | ||||
Class R | (302,488 | ) | (826,663 | ) | ||||
Class Y | (321,805 | ) | 87,877 | |||||
Investor Class | (1,607,037 | ) | (1,507,656 | ) | ||||
Class R5 | (5,431,002 | ) | (202,598,493 | ) | ||||
Class R6 | (166,619,388 | ) | 207,367,842 | |||||
Net increase (decrease) in net assets resulting from share transactions | (178,831,319 | ) | (6,505,357 | ) | ||||
Net increase (decrease) in net assets | (147,048,222 | ) | (9,656,375 | ) | ||||
Net assets: | ||||||||
Beginning of year | 283,121,366 | 292,777,741 | ||||||
End of year (includes undistributed net investment income of $1,782,505 and $5,891,323, respectively) | $ | 136,073,144 | $ | 283,121,366 | ||||
Notes to Financial Statements
October 31, 2013
NOTE 1—Significant Accounting Policies
Invesco International Core Equity Fund (the “Fund”) is a series portfolio of AIM International Mutual Funds (Invesco International Mutual Funds) (the “Trust”). The Trust is a Delaware statutory trust registered under the Investment Company Act of 1940, as amended (the “1940 Act”), as an open-end series management investment company consisting of eight separate portfolios, each authorized to issue an unlimited number of shares of beneficial interest. The assets, liabilities and operations of each portfolio are accounted for separately. Information presented in these financial statements pertains only to the Fund. Matters affecting each portfolio or class will be voted on exclusively by the shareholders of such portfolio or class.
The Fund’s investment objective is long-term growth of capital.
The Fund currently consists of eight different classes of shares: Class A, Class B, Class C, Class R, Class Y, Investor Class, Class R5 and Class R6. Investor Class shares of the Fund are offered only to certain grandfathered investors. Class A shares are sold with a front-end sales charge unless certain waiver criteria are met and under certain circumstances load waived shares may be subject to contingent deferred sales charges (“CDSC”). Class C shares are sold with a CDSC. Class R, Class Y, Investor Class, Class R5 and Class R6 shares are sold at net asset value. Effective November 30, 2010, new or additional investments in Class B shares are no longer permitted. Existing shareholders of Class B shares may continue to reinvest dividends and capital gains distributions in Class B shares until they convert to Class A shares. Also, shareholders in Class B shares will be able to exchange those shares for Class B shares of other Invesco Funds offering such shares until they convert to Class A shares. Generally, Class B shares will automatically convert to Class A shares on or about the month-end, which is at least eight years after the date of purchase. Redemption of Class B shares prior to the conversion date will be subject to a CDSC.
13 Invesco International Core Equity Fund
The following is a summary of the significant accounting policies followed by the Fund in the preparation of its financial statements.
| A. | Security Valuations — Securities, including restricted securities, are valued according to the following policy. |
A security listed or traded on an exchange (except convertible bonds) is valued at its last sales price or official closing price as of the close of the customary trading session on the exchange where the security is principally traded, or lacking any sales or official closing price on a particular day, the security may be valued at the closing bid price on that day. Securities traded in the over-the-counter market are valued based on prices furnished by independent pricing services or market makers. When such securities are valued by an independent pricing service they may be considered fair valued. Futures contracts are valued at the final settlement price set by an exchange on which they are principally traded. Listed options are valued at the mean between the last bid and ask prices from the exchange on which they are principally traded. Options not listed on an exchange are valued by an independent source at the mean between the last bid and ask prices. For purposes of determining net asset value per share, futures and option contracts generally are valued 15 minutes after the close of the customary trading session of the New York Stock Exchange (“NYSE”).
Investments in open-end and closed-end registered investment companies that do not trade on an exchange are valued at the end of day net asset value per share. Investments in open-end and closed-end registered investment companies that trade on an exchange are valued at the last sales price or official closing price as of the close of the customary trading session on the exchange where the security is principally traded.
Debt obligations (including convertible bonds) and unlisted equities are fair valued using an evaluated quote provided by an independent pricing service. Evaluated quotes provided by the pricing service may be determined without exclusive reliance on quoted prices, and may reflect appropriate factors such as institution-size trading in similar groups of securities, developments related to specific securities, dividend rate (for unlisted equities), yield (for debt obligations), quality, type of issue, coupon rate (for debt obligations), maturity (for debt obligations), individual trading characteristics and other market data. Debt obligations are subject to interest rate and credit risks. In addition, all debt obligations involve some risk of default with respect to interest and/or principal payments.
Foreign securities’ (including foreign exchange contracts) prices are converted into U.S. dollar amounts using the applicable exchange rates as of the close of the NYSE. If market quotations are available and reliable for foreign exchange-traded equity securities, the securities will be valued at the market quotations. Because trading hours for certain foreign securities end before the close of the NYSE, closing market quotations may become unreliable. If between the time trading ends on a particular security and the close of the customary trading session on the NYSE, events occur that the Adviser determines are significant and make the closing price unreliable, the Fund may fair value the security. If the event is likely to have affected the closing price of the security, the security will be valued at fair value in good faith using procedures approved by the Board of Trustees. Adjustments to closing prices to reflect fair value may also be based on a screening process of an independent pricing service to indicate the degree of certainty, based on historical data, that the closing price in the principal market where a foreign security trades is not the current value as of the close of the NYSE. Foreign securities’ prices meeting the approved degree of certainty that the price is not reflective of current value will be priced at the indication of fair value from the independent pricing service. Multiple factors may be considered by the independent pricing service in determining adjustments to reflect fair value and may include information relating to sector indices, American Depositary Receipts and domestic and foreign index futures. Foreign securities may have additional risks including exchange rate changes, potential for sharply devalued currencies and high inflation, political and economic upheaval, the relative lack of issuer information, relatively low market liquidity and the potential lack of strict financial and accounting controls and standards.
Securities for which market prices are not provided by any of the above methods may be valued based upon quotes furnished by independent sources. The last bid price may be used to value equity securities. The mean between the last bid and asked prices is used to value debt obligations, including corporate loans.
Securities for which market quotations are not readily available or became unreliable are valued at fair value as determined in good faith by or under the supervision of the Trust’s officers following procedures approved by the Board of Trustees. Issuer specific events, market trends, bid/ask quotes of brokers and information providers and other market data may be reviewed in the course of making a good faith determination of a security’s fair value.
Valuations change in response to many factors including the historical and prospective earnings of the issuer, the value of the issuer’s assets, general economic conditions, interest rates, investor perceptions and market liquidity. Because of the inherent uncertainties of valuation, the values reflected in the financial statements may materially differ from the value received upon actual sale of those investments.
| B. | Securities Transactions and Investment Income — Securities transactions are accounted for on a trade date basis. Realized gains or losses on sales are computed on the basis of specific identification of the securities sold. Interest income is recorded on the accrual basis from settlement date. Dividend income (net of withholding tax, if any) is recorded on the ex-dividend date. |
The Fund may periodically participate in litigation related to Fund investments. As such, the Fund may receive proceeds from litigation settlements. Any proceeds received are included in the Statement of Operations as realized gain (loss) for investments no longer held and as unrealized gain (loss) for investments still held.
Brokerage commissions and mark ups are considered transaction costs and are recorded as an increase to the cost basis of securities purchased and/or a reduction of proceeds on a sale of securities. Such transaction costs are included in the determination of net realized and unrealized gain (loss) from investment securities reported in the Statement of Operations and the Statement of Changes in Net Assets and the net realized and unrealized gains (losses) on securities per share in the Financial Highlights. Transaction costs are included in the calculation of the Fund’s net asset value and, accordingly, they reduce the Fund’s total returns. These transaction costs are not considered operating expenses and are not reflected in net investment income reported in the Statement of Operations and Statement of Changes in Net Assets, or the net investment income per share and ratios of expenses and net investment income reported in the Financial Highlights, nor are they limited by any expense limitation arrangements between the Fund and the investment adviser.
The Fund allocates income and realized and unrealized capital gains and losses to a class based on the relative net assets of each class.
| C. | Country Determination — For the purposes of making investment selection decisions and presentation in the Schedule of Investments, the investment adviser may determine the country in which an issuer is located and/or credit risk exposure based on various factors. These factors include the laws of the country under which the issuer is organized, where the issuer maintains a principal office, the country in which the issuer derives 50% or more of its total revenues and the country that has the primary market for the issuer’s securities, as well as other criteria. Among the other criteria that may be evaluated for making this determination are the country in which the issuer maintains 50% or more of its assets, |
14 Invesco International Core Equity Fund
| the type of security, financial guarantees and enhancements, the nature of the collateral and the sponsor organization. Country of issuer and/or credit risk exposure has been determined to be the United States of America, unless otherwise noted. |
| D. | Distributions — Distributions from income and net realized capital gain, if any, are generally declared and paid annually and recorded on the ex-dividend date. The Fund may elect to treat a portion of the proceeds from redemptions as distributions for federal income tax purposes. |
| E. | Federal Income Taxes — The Fund intends to comply with the requirements of Subchapter M of the Internal Revenue Code of 1986, as amended (the “Internal Revenue Code”), necessary to qualify as a regulated investment company and to distribute substantially all of the Fund’s taxable earnings to shareholders. As such, the Fund will not be subject to federal income taxes on otherwise taxable income (including net realized capital gain) that is distributed to shareholders. Therefore, no provision for federal income taxes is recorded in the financial statements. |
The Fund files tax returns in the U.S. Federal jurisdiction and certain other jurisdictions. Generally, the Fund is subject to examinations by such taxing authorities for up to three years after the filing of the return for the tax period.
| F. | Expenses — Fees provided for under the Rule 12b-1 plan of a particular class of the Fund are charged to the operations of such class. Transfer agency fees and expenses and other shareholder recordkeeping fees and expenses attributable to Class R5 and Class R6 are allocated to each share class based on relative net assets. Sub-accounting fees attributable to Class R5 are charged to the operations of the class. Transfer agency fees and expenses and other shareholder recordkeeping fees and expenses relating to all other classes are allocated among those classes based on relative net assets. All other expenses are allocated among the classes based on relative net assets. |
| G. | Accounting Estimates — The preparation of financial statements in conformity with accounting principles generally accepted in the United States of America (“GAAP”) requires management to make estimates and assumptions that affect the reported amounts of assets and liabilities at the date of the financial statements and the reported amounts of revenues and expenses during the reporting period including estimates and assumptions related to taxation. Actual results could differ from those estimates by a significant amount. In addition, the Fund monitors for material events or transactions that may occur or become known after the period-end date and before the date the financial statements are released to print. |
| H. | Indemnifications — Under the Trust’s organizational documents, each Trustee, officer, employee or other agent of the Trust is indemnified against certain liabilities that may arise out of the performance of their duties to the Fund. Additionally, in the normal course of business, the Fund enters into contracts, including the Fund’s servicing agreements, that contain a variety of indemnification clauses. The Fund’s maximum exposure under these arrangements is unknown as this would involve future claims that may be made against the Fund that have not yet occurred. The risk of material loss as a result of such indemnification claims is considered remote. |
| I. | Securities Lending — The Fund may lend portfolio securities having a market value up to one-third of the Fund’s total assets. Such loans are secured by collateral equal to no less than the market value of the loaned securities determined daily by the securities lending provider. Such collateral will be cash or debt securities issued or guaranteed by the U.S. Government or any of its sponsored agencies. Cash collateral received in connection with these loans is invested in short-term money market instruments or affiliated money market funds and is shown as such on the Schedule of Investments. It is the Fund’s policy to obtain additional collateral from or return excess collateral to the borrower by the end of the next business day, following the valuation date of the securities loaned. Therefore, the value of the collateral held may be temporarily less than the value of the securities on loan. Lending securities entails a risk of loss to the Fund if, and to the extent that, the market value of the securities loaned were to increase and the borrower did not increase the collateral accordingly, and the borrower failed to return the securities. Upon the failure of the borrower to return the securities, collateral may be liquidated and the securities may be purchased on the open market to replace the loaned securities. The Fund could experience delays and costs in gaining access to the collateral. The Fund bears the risk of any deficiency in the amount of the collateral available for return to the borrower due to any loss on the collateral invested. Dividends received on cash collateral investments for securities lending transactions, which are net of compensation to counterparties, is included in Dividends from affiliated money market funds on the Statement of Operations. The aggregate value of securities out on loan is shown as a footnote on the Statement of Assets and Liabilities, if any. |
| J. | Foreign Currency Translations — Foreign currency is valued at the close of the NYSE based on quotations posted by banks and major currency dealers. Portfolio securities and other assets and liabilities denominated in foreign currencies are translated into U.S. dollar amounts at date of valuation. Purchases and sales of portfolio securities (net of foreign taxes withheld on disposition) and income items denominated in foreign currencies are translated into U.S. dollar amounts on the respective dates of such transactions. The Fund does not separately account for the portion of the results of operations resulting from changes in foreign exchange rates on investments and the fluctuations arising from changes in market prices of securities held. The combined results of changes in foreign exchange rates and the fluctuation of market prices on investments (net of estimated foreign tax withholding) are included with the net realized and unrealized gain or loss from investments in the Statement of Operations. Reported net realized foreign currency gains or losses arise from (1) sales of foreign currencies, (2) currency gains or losses realized between the trade and settlement dates on securities transactions, and (3) the difference between the amounts of dividends, interest, and foreign withholding taxes recorded on the Fund’s books and the U.S. dollar equivalent of the amounts actually received or paid. Net unrealized foreign currency gains and losses arise from changes in the fair values of assets and liabilities, other than investments in securities at fiscal period end, resulting from changes in exchange rates. |
The Fund may invest in foreign securities which may be subject to foreign taxes on income, gains on investments or currency repatriation, a portion of which may be recoverable.
| K. | Foreign Currency Contracts — The Fund may enter into foreign currency contracts to manage or minimize currency or exchange rate risk. The Fund may also enter into foreign currency contracts for the purchase or sale of a security denominated in a foreign currency in order to “lock in” the U.S. dollar price of that security. A foreign currency contract is an obligation to purchase or sell a specific currency for an agreed-upon price at a future date. The use of foreign currency contracts does not eliminate fluctuations in the price of the underlying securities the Fund owns or intends to acquire but establishes a rate of exchange in advance. Fluctuations in the value of these contracts are measured by the difference in the contract date and reporting date exchange rates and are recorded as unrealized appreciation (depreciation) until the contracts are closed. When the contracts are closed, realized gains (losses) are recorded. Realized and unrealized gains (losses) on the contracts are included in the Statement of Operations. The primary risks associated with foreign currency contracts include failure of the counterparty to meet the terms of the contract and the value of the foreign currency changing unfavorably. These risks may be in excess of the amounts reflected in the Statement of Assets and Liabilities. |
15 Invesco International Core Equity Fund
NOTE 2—Advisory Fees and Other Fees Paid to Affiliates
The Trust has entered into a master investment advisory agreement with Invesco Advisers, Inc. (the “Adviser” or “Invesco”). Under the terms of the investment advisory agreement, the Fund pays an advisory fee to the Adviser based on the annual rate of the Fund’s average daily net assets as follows:
| Average Daily Net Assets | Rate | |||||
First $500 million | 0 | .75% | ||||
Next $500 million | 0 | .65% | ||||
From $1 billion | 0 | .55% | ||||
From $2 billion | 0 | .45% | ||||
From $4 billion | 0 | .40% | ||||
From $6 billion | 0 | .375% | ||||
Over $8 billion | 0 | .35% | ||||
Under the terms of a master sub-advisory agreement between the Adviser and each of Invesco Asset Management Deutschland GmbH, Invesco Asset Management Limited, Invesco Asset Management (Japan) Limited, Invesco Australia Limited, Invesco Hong Kong Limited, Invesco Senior Secured Management, Inc. and Invesco Canada Ltd. (collectively, the “Affiliated Sub-Advisers”) the Adviser, not the Fund, may pay 40% of the fees paid to the Adviser to any such Affiliated Sub-Adviser(s) that provide(s) discretionary investment management services to the Fund based on the percentage of assets allocated to such Sub-Adviser(s).
The Adviser has contractually agreed, through at least June 30, 2014, to waive advisory fees and/or reimburse expenses of all shares to the extent necessary to limit total annual fund operating expenses after fee waiver and/or expense reimbursement (excluding certain items discussed below) of Class A, Class B, Class C, Class R, Class Y, Investor Class, Class R5 and Class R6 shares to 2.25%, 3.00%, 3.00%, 2.50%, 2.00%, 2.25%, 2.00% and 2.00%, respectively, of average daily net assets. In determining the Adviser’s obligation to waive advisory fees and/or reimburse expenses, the following expenses are not taken into account, and could cause the total annual fund operating expenses after fee waiver and/or expense reimbursement to exceed the numbers reflected above: (1) interest; (2) taxes; (3) dividend expense on short sales; (4) extraordinary or non-routine items, including litigation expenses; and (5) expenses that the Fund has incurred but did not actually pay because of an expense offset arrangement. Unless Invesco continues the fee waiver agreement, it will terminate on June 30, 2014. The fee waiver agreement cannot be terminated during its term. The Adviser did not waive fees and/or reimburse expenses during the period under this expense limitation.
Further, the Adviser has contractually agreed, through June 30, 2014, to waive the advisory fee payable by the Fund in an amount equal to 100% of the net advisory fees the Adviser receives from the affiliated money market funds on investments by the Fund of uninvested cash (excluding investments of cash collateral from securities lending) in such affiliated money market funds.
For the year ended October 31, 2013, the Adviser waived advisory fees of $4,316.
The Trust has entered into a master administrative services agreement with Invesco pursuant to which the Fund has agreed to pay Invesco for certain administrative costs incurred in providing accounting services to the Fund. For the year ended October 31, 2013, expenses incurred under the agreement are shown in the Statement of Operations as Administrative services fees.
The Trust has entered into a transfer agency and service agreement with Invesco Investment Services, Inc. (“IIS”) pursuant to which the Fund has agreed to pay IIS a fee for providing transfer agency and shareholder services to the Fund and reimburse IIS for certain expenses incurred by IIS in the course of providing such services. IIS may make payments to intermediaries that provide omnibus account services, sub-accounting services and/or networking services. All fees payable by IIS to intermediaries that provide omnibus account services or sub-accounting are charged back to the Fund, subject to certain limitations approved by the Trust’s Board of Trustees. For the year ended October 31, 2013, expenses incurred under the agreement are shown in the Statement of Operations as Transfer agent fees.
The Trust has entered into master distribution agreements with Invesco Distributors, Inc. (“IDI”) to serve as the distributor for the Class A, Class B, Class C, Class R, Class Y, Investor Class, Class R5 and Class R6 shares of the Fund. The Trust has adopted plans pursuant to Rule 12b-1 under the 1940 Act with respect to the Fund’s Class A, Class B, Class C, Class R and Investor Class shares (collectively, the “Plans”). The Fund, pursuant to the Plans, pays IDI compensation at the annual rate of 0.25% of the Fund’s average daily net assets of Class A shares, 1.00% of the average daily net assets of Class B and Class C shares, 0.50% of the average daily net assets of Class R shares and 0.25% of the average daily net assets of Investor Class shares. Of the Plan payments, up to 0.25% of the average daily net assets of each class of shares may be paid to furnish continuing personal shareholder services to customers who purchase and own shares of such classes. Any amounts not paid as a service fee under the Plans would constitute an asset-based sales charge. Rules of the Financial Industry Regulatory Authority (“FINRA”) impose a cap on the total sales charges, including asset-based sales charges, that may be paid by any class of shares of the Fund. For the year ended October 31, 2013, expenses incurred under the Plans are shown in the Statement of Operations as Distribution fees
Front-end sales commissions and CDSC (collectively, the “sales charges”) are not recorded as expenses of the Fund. Front-end sales commissions are deducted from proceeds from the sales of Fund shares prior to investment in Class A shares of the Fund. CDSC are deducted from redemption proceeds prior to remittance to the shareholder. During the year ended October 31, 2013, IDI advised the Fund that IDI retained $8,077 in front-end sales commissions from the sale of Class A shares and $118, $3,374 and $1,023 from Class A, Class B and Class C shares, respectively, for CDSC imposed on redemptions by shareholders.
Certain officers and trustees of the Trust are officers and directors of the Adviser, IIS and/or IDI.
NOTE 3—Additional Valuation Information
GAAP defines fair value as the price that would be received to sell an asset or paid to transfer a liability in an orderly transaction between market participants at the measurement date, under current market conditions. GAAP establishes a hierarchy that prioritizes the inputs to valuation methods, giving the highest priority to readily available unadjusted quoted prices in an active market for identical assets (Level 1) and the lowest priority to significant unobservable inputs (Level 3), generally when market prices are not readily available or are unreliable. Based on the valuation inputs, the
16 Invesco International Core Equity Fund
securities or other investments are tiered into one of three levels. Changes in valuation methods may result in transfers in or out of an investment’s assigned level:
| Level 1 — | Prices are determined using quoted prices in an active market for identical assets. |
| Level 2 — | Prices are determined using other significant observable inputs. Observable inputs are inputs that other market participants may use in pricing a security. These may include quoted prices for similar securities, interest rates, prepayment speeds, credit risk, yield curves, loss severities, default rates, discount rates, volatilities and others. |
| Level 3 — | Prices are determined using significant unobservable inputs. In situations where quoted prices or observable inputs are unavailable (for example, when there is little or no market activity for an investment at the end of the period), unobservable inputs may be used. Unobservable inputs reflect the Fund’s own assumptions about the factors market participants would use in determining fair value of the securities or instruments and would be based on the best available information. |
The following is a summary of the tiered valuation input levels, as of October 31, 2013. The level assigned to the securities valuations may not be an indication of the risk or liquidity associated with investing in those securities. Because of the inherent uncertainties of valuation, the values reflected in the financial statements may materially differ from the value received upon actual sale of those investments.
During the year ended October 31, 2013, there were transfers from Level 1 to Level 2 of $24,120,630 and from Level 2 to Level 1 of $22,829,236, due to foreign fair value adjustments.
| Level 1 | Level 2 | Level 3 | Total | |||||||||||||
Australia | $ | 11,418,035 | $ | 2,640,814 | $ | — | $ | 14,058,849 | ||||||||
Brazil | 1,362,692 | — | — | 1,362,692 | ||||||||||||
Canada | 5,065,235 | — | — | 5,065,235 | ||||||||||||
China | 697,699 | 764,732 | — | 1,462,431 | ||||||||||||
Denmark | — | 1,449,326 | — | 1,449,326 | ||||||||||||
France | 5,928,984 | 9,214,853 | — | 15,143,837 | ||||||||||||
Germany | 8,428,788 | — | — | 8,428,788 | ||||||||||||
Hong Kong | 6,186,752 | 131,482 | — | 6,318,234 | ||||||||||||
India | 69,395 | 368,452 | — | 437,847 | ||||||||||||
Indonesia | 360,640 | — | — | 360,640 | ||||||||||||
Italy | 2,170,989 | — | — | 2,170,989 | ||||||||||||
Japan | 3,687,646 | 21,370,241 | — | 25,057,887 | ||||||||||||
Mexico | 246,149 | — | — | 246,149 | ||||||||||||
Netherlands | 2,066,492 | — | — | 2,066,492 | ||||||||||||
Norway | 1,036,741 | 1,853,208 | — | 2,889,949 | ||||||||||||
Poland | — | 109,726 | — | 109,726 | ||||||||||||
Russia | 432,234 | 431,846 | — | 864,080 | ||||||||||||
Singapore | — | 1,278,539 | — | 1,278,539 | ||||||||||||
South Africa | 274,460 | 294,846 | — | 569,306 | ||||||||||||
South Korea | 705,136 | 1,155,591 | — | 1,860,727 | ||||||||||||
Spain | 1,546,165 | 1,944,533 | — | 3,490,698 | ||||||||||||
Switzerland | 5,810,665 | 4,088,743 | — | 9,899,408 | ||||||||||||
Taiwan | 208,886 | 321,493 | — | 530,379 | ||||||||||||
Thailand | 217,329 | 166,708 | — | 384,037 | ||||||||||||
Turkey | — | 214,861 | — | 214,861 | ||||||||||||
Turkmenistan | 209,446 | — | — | 209,446 | ||||||||||||
United Kingdom | 9,129,375 | 13,426,292 | — | 22,555,667 | ||||||||||||
United States | 10,721,373 | — | — | 10,721,373 | ||||||||||||
Total Investments | $ | 77,981,306 | $ | 61,226,286 | $ | — | $ | 139,207,592 | ||||||||
NOTE 4—Expense Offset Arrangement(s)
The expense offset arrangement is comprised of transfer agency credits which result from balances in demand deposit accounts used by the transfer agent for clearing shareholder transactions. For the year ended October 31, 2013, the Fund received credits from this arrangement, which resulted in the reduction of the Fund’s total expenses of $1,086.
NOTE 5—Trustees’ and Officers’ Fees and Benefits
Trustees’ and Officers’ Fees and Benefits include amounts accrued by the Fund to pay remuneration to certain Trustees and Officers of the Fund. Trustees have the option to defer compensation payable by the Fund, and Trustees’ and Officers’ Fees and Benefits also include amounts accrued by the Fund to fund such deferred compensation amounts. Those Trustees who defer compensation have the option to select various Invesco Funds in which their deferral accounts shall be deemed to be invested. Finally, certain current Trustees are eligible to participate in a retirement plan that provides
17 Invesco International Core Equity Fund
for benefits to be paid upon retirement to Trustees over a period of time based on the number of years of service. The Fund may have certain former Trustees who also participate in a retirement plan and receive benefits under such plan. Trustees’ and Officers’ Fees and Benefits include amounts accrued by the Fund to fund such retirement benefits. Obligations under the deferred compensation and retirement plans represent unsecured claims against the general assets of the Fund.
NOTE 6—Cash Balances
The Fund is permitted to temporarily carry a negative or overdrawn balance in its account with State Street Bank and Trust Company, the custodian bank. Such balances, if any at period end, are shown in the Statement of Assets and Liabilities under the payable caption Amount due custodian. To compensate the custodian bank for such overdrafts, the overdrawn Fund may either (1) leave funds as a compensating balance in the account so the custodian bank can be compensated by earning the additional interest; or (2) compensate by paying the custodian bank at a rate agreed upon by the custodian bank and Invesco, not to exceed the contractually agreed upon rate.
NOTE 7—Distributions to Shareholders and Tax Components of Net Assets
Tax Character of Distributions to Shareholders Paid During the Years Ended October 31, 2013 and 2012:
| 2013 | 2012 | |||||||
Ordinary income | $ | 6,603,469 | $ | 9,320,338 | ||||
Tax Components of Net Assets at Period-End:
| 2013 | ||||
Undistributed ordinary income | $ | 1,881,500 | ||
Net unrealized appreciation — investments | 10,473,540 | |||
Net unrealized appreciation — other investments | 46,429 | |||
Temporary book/tax differences | (98,996 | ) | ||
Capital loss carryforward | (17,134,470 | ) | ||
Shares of beneficial interest | 140,905,141 | |||
Total net assets | $ | 136,073,144 | ||
The difference between book-basis and tax-basis unrealized appreciation (depreciation) is due to differences in the timing of recognition of gains and losses on investments for tax and book purposes. The Fund’s net unrealized appreciation difference is attributable primarily to wash sales.
The temporary book/tax differences are a result of timing differences between book and tax recognition of income and/or expenses. The Fund’s temporary book/tax differences are the result of the trustee deferral of compensation and retirement plan benefits.
Capital loss carryforward is calculated and reported as of a specific date. Results of transactions and other activity after that date may affect the amount of capital loss carryforward actually available for the Fund to utilize. Capital losses generated in years beginning after December 22, 2010 can be carried forward for an unlimited period, whereas previous losses expire in 8 tax years. Capital losses with an expiration period may not be used to offset capital gains until all net capital losses without an expiration date have been utilized. Capital loss carryforwards with no expiration date will retain their character as either short-term or long-term capital losses instead of as short-term capital losses as under prior law. The ability to utilize capital loss carryforward in the future may be limited under the Internal Revenue Code and related regulations based on the results of future transactions.
The Fund utilized $3,909,819 of capital loss carryforward in the current period to offset net realized capital gain for federal income tax purposes. The Fund has a capital loss carryforward as of October 31, 2013, which expires as follows:
| Capital Loss Carryforward* | ||||||||||||
| Expiration | Short-Term | Long-Term | Total | |||||||||
October 31, 2017 | $ | 11,001,492 | $ | — | $ | 11,001,492 | ||||||
Not subject to expiration | 4,572,292 | 1,560,686 | 6,132,978 | |||||||||
| 15,573,784 | 1,560,686 | 17,134,470 | ||||||||||
| * | Capital loss carryforward as of the date listed above is reduced for limitations, if any, to the extent required by the Internal Revenue Code. |
On October 31, 2013, a total of 14,744,208 Class R6 shares of the Fund valued at $157,173,254 were redeemed by significant shareholders and settled through a redemption-in-kind transaction, which resulted in a realized gain of $32,793,008 to the Fund for book purposes. From a federal income tax perspective, the realized gains are not recognized.
NOTE 8—Investment Securities
The aggregate amount of investment securities (other than short-term securities, U.S. Treasury obligations and money market funds, if any) purchased and sold by the Fund during the year ended October 31, 2013 was $42,262,844 and $227,476,317, respectively. Cost of investments on a tax basis includes the adjustments for financial reporting purposes as of the most recently completed federal income tax reporting period-end.
18 Invesco International Core Equity Fund
| Unrealized Appreciation (Depreciation) of Investment Securities on a Tax Basis | ||||
Aggregate unrealized appreciation of investment securities | $ | 20,012,280 | ||
Aggregate unrealized (depreciation) of investment securities | (9,538,740 | ) | ||
Net unrealized appreciation of investment securities | $ | 10,473,540 | ||
Cost of investments for tax purposes is $128,734,052.
NOTE 9—Reclassification of Permanent Differences
Primarily as a result of differing book/tax treatment of foreign currency transactions, capital loss carryforward and redemption in kind activity, on October 31, 2013, undistributed net investment income was decreased by $84,444, undistributed net realized gain (loss) was increased by $29,371,246 and shares of beneficial interest was decreased by $29,286,802. This reclassification had no effect on the net assets of the Fund.
NOTE 10—Share Information
| Summary of Share Activity | ||||||||||||||||
| Years ended October 31, | ||||||||||||||||
| 2013(a) | 2012 | |||||||||||||||
| Shares | Amount | Shares | Amount | |||||||||||||
Sold: | ||||||||||||||||
Class A | 555,347 | $ | 5,942,173 | 575,295 | $ | 5,527,199 | ||||||||||
Class B | 17,830 | 190,884 | 28,628 | 282,638 | ||||||||||||
Class C | 186,878 | 1,971,690 | 105,635 | 996,063 | ||||||||||||
Class R | 51,394 | 545,008 | 70,699 | 677,226 | ||||||||||||
Class Y | 40,986 | 443,049 | 42,853 | 425,170 | ||||||||||||
Investor Class | 77,150 | 849,117 | 64,957 | 636,710 | ||||||||||||
Class R5 | 5,211 | 62,790 | 3,199,332 | 29,178,405 | ||||||||||||
Class R6(b) | 303,590 | 3,190,475 | 20,951,195 | 210,629,278 | ||||||||||||
Issued as reinvestment of dividends: | ||||||||||||||||
Class A | 67,198 | 679,375 | 124,973 | 1,180,999 | ||||||||||||
Class B | 2,866 | 29,204 | 8,828 | 83,953 | ||||||||||||
Class C | 10,612 | 105,270 | 29,526 | 273,705 | ||||||||||||
Class R | 3,138 | 31,854 | 7,496 | 71,058 | ||||||||||||
Class Y | 2,676 | 27,450 | 3,796 | 36,365 | ||||||||||||
Investor Class | 24,114 | 247,648 | 43,718 | 419,256 | ||||||||||||
Class R5 | 19,646 | 197,834 | 765,787 | 7,206,058 | ||||||||||||
Class R6 | 519,891 | 5,230,104 | — | — | ||||||||||||
Automatic conversion of Class B shares to Class A shares: | ||||||||||||||||
Class A | 63,299 | 673,135 | 106,817 | 1,021,343 | ||||||||||||
Class B | (63,015 | ) | (673,135 | ) | (106,504 | ) | (1,021,343 | ) | ||||||||
Reacquired:(c) | ||||||||||||||||
Class A | (913,757 | ) | (9,640,648 | ) | (1,241,662 | ) | (11,923,710 | ) | ||||||||
Class B | (53,237 | ) | (560,674 | ) | (83,859 | ) | (810,615 | ) | ||||||||
Class C | (318,934 | ) | (3,266,873 | ) | (498,561 | ) | (4,638,496 | ) | ||||||||
Class R | (82,934 | ) | (879,350 | ) | (162,168 | ) | (1,574,947 | ) | ||||||||
Class Y | (74,071 | ) | (792,304 | ) | (38,980 | ) | (373,658 | ) | ||||||||
Investor Class | (250,611 | ) | (2,703,802 | ) | (268,692 | ) | (2,563,622 | ) | ||||||||
Class R5 | (536,200 | ) | (5,691,626 | ) | (23,944,212 | ) | (238,982,956 | ) | ||||||||
Class R6 | (16,433,366 | ) | (175,039,967 | ) | (329,612 | ) | (3,261,436 | ) | ||||||||
Net increase (decrease) in share activity | (16,774,299 | ) | $ | (178,831,319 | ) | (544,715 | ) | $ | (6,505,357 | ) | ||||||
| (a) | There is an entity that is a record owner of more than 5% of the outstanding shares of the Fund and owns 5% of the outstanding shares of the Fund. IDI has an agreement with this entity to sell Fund shares. The Fund, Invesco and/or Invesco affiliates may make payments to this entity, which is considered to be related to the Fund, for providing services to the Fund, Invesco and/or Invesco affiliates including but not limited to services such as, securities brokerage, distribution, third party record keeping and account servicing. The Fund has no knowledge as to whether all or any portion of the shares owned of record by this entity is also owned beneficially. |
| In addition, 44% of the outstanding shares of the Fund are owned by affiliated mutual funds. Affiliated mutual funds are mutual funds that are advised by Invesco. |
| (b) | Commencement date of September 24, 2012. |
| (c) | Net of redemption fees of $131 allocated among the classes based on relative net assets of each class for the year ended October 31, 2012. |
19 Invesco International Core Equity Fund
NOTE 11—Financial Highlights
The following schedule presents financial highlights for a share of the Fund outstanding throughout the periods indicated.
| Net asset value, beginning of period | Net investment income(a) | Net gains (losses) on securities (both realized and unrealized) | Total from investment operations | Dividends from net investment income | Net asset value, end of period(b) | Total return(c) | Net assets, end of period (000’s omitted) | Ratio of expenses to average net assets with fee waivers and/or expenses absorbed | Ratio of expenses to average net assets without fee waivers and/or expenses absorbed | Ratio of net investment income to average net assets | Portfolio turnover(d) | |||||||||||||||||||||||||||||||||||||
Class A | ||||||||||||||||||||||||||||||||||||||||||||||||
Year ended 10/31/13 | $ | 9.87 | $ | 0.13 | $ | 1.63 | $ | 1.76 | $ | (0.18 | ) | $ | 11.45 | 18.11 | % | $ | 42,703 | 1.65 | %(e) | 1.65 | %(e) | 1.20 | %(e) | 25 | % | |||||||||||||||||||||||
Year ended 10/31/12 | 10.02 | 0.18 | (0.05 | ) | 0.13 | (0.28 | ) | 9.87 | 1.40 | 39,044 | 1.59 | 1.59 | 1.86 | 20 | ||||||||||||||||||||||||||||||||||
Year ended 10/31/11 | 10.96 | 0.30 | (1.11 | ) | (0.81 | ) | (0.13 | ) | 10.02 | (7.46 | ) | 43,983 | 1.54 | 1.54 | 2.71 | 26 | ||||||||||||||||||||||||||||||||
Year ended 10/31/10 | 10.34 | 0.17 | 0.62 | 0.79 | (0.17 | ) | 10.96 | 7.68 | 40,422 | 1.51 | 1.51 | 1.59 | 39 | |||||||||||||||||||||||||||||||||||
Year ended 10/31/09 | 8.63 | 0.14 | 1.87 | 2.01 | (0.30 | ) | 10.34 | 24.35 | 61,810 | 1.62 | 1.62 | 1.63 | 43 | |||||||||||||||||||||||||||||||||||
Class B | ||||||||||||||||||||||||||||||||||||||||||||||||
Year ended 10/31/13 | 9.87 | 0.05 | 1.65 | 1.70 | (0.10 | ) | 11.47 | 17.35 | 2,488 | 2.40 | (e) | 2.40 | (e) | 0.45 | (e) | 25 | ||||||||||||||||||||||||||||||||
Year ended 10/31/12 | 10.00 | 0.11 | (0.05 | ) | 0.06 | (0.19 | ) | 9.87 | 0.67 | 3,085 | 2.34 | 2.34 | 1.11 | 20 | ||||||||||||||||||||||||||||||||||
Year ended 10/31/11 | 10.92 | 0.22 | (1.11 | ) | (0.89 | ) | (0.03 | ) | 10.00 | (8.16 | ) | 4,654 | 2.29 | 2.29 | 1.96 | 26 | ||||||||||||||||||||||||||||||||
Year ended 10/31/10 | 10.30 | 0.09 | 0.62 | 0.71 | (0.09 | ) | 10.92 | 6.88 | 6,906 | 2.26 | 2.26 | 0.84 | 39 | |||||||||||||||||||||||||||||||||||
Year ended 10/31/09 | 8.54 | 0.08 | 1.86 | 1.94 | (0.18 | ) | 10.30 | 23.26 | 9,864 | 2.37 | 2.37 | 0.88 | 43 | |||||||||||||||||||||||||||||||||||
Class C | ||||||||||||||||||||||||||||||||||||||||||||||||
Year ended 10/31/13 | 9.61 | 0.05 | 1.60 | 1.65 | (0.10 | ) | 11.16 | 17.30 | 12,458 | 2.40 | (e) | 2.40 | (e) | 0.45 | (e) | 25 | ||||||||||||||||||||||||||||||||
Year ended 10/31/12 | 9.74 | 0.11 | (0.05 | ) | 0.06 | (0.19 | ) | 9.61 | 0.69 | 11,896 | 2.34 | 2.34 | 1.11 | 20 | ||||||||||||||||||||||||||||||||||
Year ended 10/31/11 | 10.65 | 0.21 | (1.09 | ) | (0.88 | ) | (0.03 | ) | 9.74 | (8.28 | ) | 15,597 | 2.29 | 2.29 | 1.96 | 26 | ||||||||||||||||||||||||||||||||
Year ended 10/31/10 | 10.04 | 0.09 | 0.61 | 0.70 | (0.09 | ) | 10.65 | 6.96 | 20,110 | 2.26 | 2.26 | 0.84 | 39 | |||||||||||||||||||||||||||||||||||
Year ended 10/31/09 | 8.33 | 0.07 | 1.82 | 1.89 | (0.18 | ) | 10.04 | 23.25 | 22,854 | 2.37 | 2.37 | 0.88 | 43 | |||||||||||||||||||||||||||||||||||
Class R | ||||||||||||||||||||||||||||||||||||||||||||||||
Year ended 10/31/13 | 9.88 | 0.10 | 1.65 | 1.75 | (0.16 | ) | 11.47 | 17.87 | 2,016 | 1.90 | (e) | 1.90 | (e) | 0.95 | (e) | 25 | ||||||||||||||||||||||||||||||||
Year ended 10/31/12 | 10.01 | 0.15 | (0.03 | ) | 0.12 | (0.25 | ) | 9.88 | 1.29 | 2,016 | 1.84 | 1.84 | 1.61 | 20 | ||||||||||||||||||||||||||||||||||
Year ended 10/31/11 | 10.95 | 0.27 | (1.11 | ) | (0.84 | ) | (0.10 | ) | 10.01 | (7.76 | ) | 2,885 | 1.79 | 1.79 | 2.46 | 26 | ||||||||||||||||||||||||||||||||
Year ended 10/31/10 | 10.33 | 0.14 | 0.62 | 0.76 | (0.14 | ) | 10.95 | 7.41 | 3,028 | 1.76 | 1.76 | 1.34 | 39 | |||||||||||||||||||||||||||||||||||
Year ended 10/31/09 | 8.61 | 0.12 | 1.86 | 1.98 | (0.26 | ) | 10.33 | 23.88 | 2,697 | 1.87 | 1.87 | 1.38 | 43 | |||||||||||||||||||||||||||||||||||
Class Y | ||||||||||||||||||||||||||||||||||||||||||||||||
Year ended 10/31/13 | 10.03 | 0.16 | 1.67 | 1.83 | (0.21 | ) | 11.65 | 18.53 | 1,284 | 1.40 | (e) | 1.40 | (e) | 1.45 | (e) | 25 | ||||||||||||||||||||||||||||||||
Year ended 10/31/12 | 10.18 | 0.21 | (0.05 | ) | 0.16 | (0.31 | ) | 10.03 | 1.67 | 1,411 | 1.34 | 1.34 | 2.11 | 20 | ||||||||||||||||||||||||||||||||||
Year ended 10/31/11 | 11.14 | 0.33 | (1.12 | ) | (0.79 | ) | (0.17 | ) | 10.18 | (7.23 | ) | 1,354 | 1.29 | 1.29 | 2.96 | 26 | ||||||||||||||||||||||||||||||||
Year ended 10/31/10 | 10.51 | 0.19 | 0.64 | 0.83 | (0.20 | ) | 11.14 | 7.91 | 1,839 | 1.26 | 1.26 | 1.84 | 39 | |||||||||||||||||||||||||||||||||||
Year ended 10/31/09 | 8.75 | 0.18 | 1.88 | 2.06 | (0.30 | ) | 10.51 | 24.61 | 1,983 | 1.37 | 1.37 | 1.88 | 43 | |||||||||||||||||||||||||||||||||||
Investor Class | ||||||||||||||||||||||||||||||||||||||||||||||||
Year ended 10/31/13 | 10.02 | 0.13 | 1.66 | 1.79 | (0.18 | ) | 11.63 | 18.14 | 14,726 | 1.65 | (e) | 1.65 | (e) | 1.20 | (e) | 25 | ||||||||||||||||||||||||||||||||
Year ended 10/31/12 | 10.16 | 0.18 | (0.04 | ) | 0.14 | (0.28 | ) | 10.02 | 1.48 | 14,181 | 1.59 | 1.59 | 1.86 | 20 | ||||||||||||||||||||||||||||||||||
Year ended 10/31/11 | 11.12 | 0.30 | (1.13 | ) | (0.83 | ) | (0.13 | ) | 10.16 | (7.53 | ) | 16,009 | 1.54 | 1.54 | 2.71 | 26 | ||||||||||||||||||||||||||||||||
Year ended 10/31/10 | 10.49 | 0.17 | 0.63 | 0.80 | (0.17 | ) | 11.12 | 7.67 | 19,438 | 1.51 | 1.51 | 1.59 | 39 | |||||||||||||||||||||||||||||||||||
Year ended 10/31/09 | 8.75 | 0.14 | 1.90 | 2.04 | (0.30 | ) | 10.49 | 24.35 | 21,500 | 1.62 | 1.62 | 1.63 | 43 | |||||||||||||||||||||||||||||||||||
Class R5 | ||||||||||||||||||||||||||||||||||||||||||||||||
Year ended 10/31/13 | 9.89 | 0.19 | 1.63 | 1.82 | (0.26 | ) | 11.45 | 18.71 | 3,010 | 1.04 | (e) | 1.04 | (e) | 1.81 | (e) | 25 | ||||||||||||||||||||||||||||||||
Year ended 10/31/12 | 10.04 | 0.24 | (0.04 | ) | 0.20 | (0.35 | ) | 9.89 | 2.15 | 7,656 | 0.90 | 0.90 | 2.55 | 20 | ||||||||||||||||||||||||||||||||||
Year ended 10/31/11 | 10.99 | 0.37 | (1.11 | ) | (0.74 | ) | (0.21 | ) | 10.04 | (6.85 | ) | 208,295 | 0.91 | 0.91 | 3.34 | 26 | ||||||||||||||||||||||||||||||||
Year ended 10/31/10 | 10.37 | 0.23 | 0.63 | 0.86 | (0.24 | ) | 10.99 | 8.35 | 228,027 | 0.91 | 0.91 | 2.19 | 39 | |||||||||||||||||||||||||||||||||||
Year ended 10/31/09 | 8.70 | 0.20 | 1.86 | 2.06 | (0.39 | ) | 10.37 | 25.10 | 241,432 | 0.94 | 0.94 | 2.31 | 43 | |||||||||||||||||||||||||||||||||||
Class R6 | ||||||||||||||||||||||||||||||||||||||||||||||||
Year ended 10/31/13 | 9.88 | 0.19 | 1.64 | 1.83 | (0.26 | ) | 11.45 | 18.84 | 57,388 | 1.03 | (e) | 1.03 | (e) | 1.82 | (e) | 25 | ||||||||||||||||||||||||||||||||
Period ended 10/31/12(f) | 10.05 | 0.03 | (0.20 | ) | (0.17 | ) | — | 9.88 | (1.69 | ) | 203,831 | 0.87 | (g) | 0.87 | (g) | 2.58 | (g) | 20 | ||||||||||||||||||||||||||||||
| (a) | Calculated using average shares outstanding. |
| (b) | Includes redemption fees added to shares of beneficial interest for Class A, Class B, Class C, Class R, Class Y, Investor Class and Class R5 shares, which were less than $0.005 per share for the fiscal years ended October 31, 2012 and prior. |
| (c) | Includes adjustments in accordance with accounting principles generally accepted in the United States of America and as such, the net asset value for financial reporting purposes and the returns based upon those net asset values may differ from the net asset value and returns for shareholder transactions. Does not include sales charges and is not annualized for periods less than one year, if applicable. |
| (d) | Portfolio turnover is calculated at the fund level and is not annualized for periods less than one year, if applicable. |
| (e) | Ratios are based on average daily net assets (000’s omitted) of $40,428, $2,729, $11,764, $1,988, $1,244, $14,465, $4,265 and $95,742 for Class A, Class B, Class C, Class R, Class Y, Investor Class, Class R5 and Class R6 shares, respectively. |
| (f) | Commencement date of September 24, 2012 for Class R6 shares. |
| (g) | Annualized. |
20 Invesco International Core Equity Fund
Report of Independent Registered Public Accounting Firm
To the Board of Trustees of AIM International Mutual Funds (Invesco International Mutual Funds)
and Shareholders of Invesco International Core Equity Fund:
In our opinion, the accompanying statement of assets and liabilities, including the schedule of investments, and the related statements of operations and of changes in net assets and the financial highlights present fairly, in all material respects, the financial position of Invesco International Core Equity Fund (one of the funds constituting AIM International Mutual Funds (Invesco International Mutual Funds), hereafter referred to as the “Fund”) at October 31, 2013, the results of its operations for the year then ended, the changes in its net assets for each of the two years in the period then ended and the financial highlights for each of the five years in the period then ended, in conformity with accounting principles generally accepted in the United States of America. These financial statements and financial highlights (hereafter referred to as “financial statements”) are the responsibility of the Fund’s management; our responsibility is to express an opinion on these financial statements based on our audits. We conducted our audits of these financial statements in accordance with the standards of the Public Company Accounting Oversight Board (United States). Those standards require that we plan and perform the audit to obtain reasonable assurance about whether the financial statements are free of material misstatement. An audit includes examining, on a test basis, evidence supporting the amounts and disclosures in the financial statements, assessing the accounting principles used and significant estimates made by management, and evaluating the overall financial statement presentation. We believe that our audits, which included confirmation of securities at October 31, 2013 by correspondence with the custodian and brokers, provide a reasonable basis for our opinion.
PRICEWATERHOUSECOOPERS LLP
December 23, 2013
Houston, Texas
21 Invesco International Core Equity Fund
Calculating your ongoing Fund expenses
Example
As a shareholder of the Fund, you incur two types of costs: (1) transaction costs, which may include sales charges (loads) on purchase payments or contingent deferred sales charges on redemptions, if any; and (2) ongoing costs, including management fees, distribution and/or service (12b-1) fees, and other Fund expenses. This example is intended to help you understand your ongoing costs (in dollars) of investing in the Fund and to compare these costs with ongoing costs of investing in other mutual funds. The example is based on an investment of $1,000 invested at the beginning of the period and held for the entire period May 1, 2013 through October 31, 2013.
Actual expenses
The table below provides information about actual account values and actual expenses. You may use the information in this table, together with the amount you invested, to estimate the expenses that you paid over the period. Simply divide your account value by $1,000 (for example, an $8,600 account value divided by $1,000 = 8.6), then multiply the result by the number in the table under the heading entitled “Actual Expenses Paid During Period” to estimate the expenses you paid on your account during this period.
Hypothetical example for comparison purposes
The table below also provides information about hypothetical account values and hypothetical expenses based on the Fund’s actual expense ratio and an assumed rate of return of 5% per year before expenses, which is not the Fund’s actual return.
The hypothetical account values and expenses may not be used to estimate the actual ending account balance or expenses you paid for the period. You may use this information to compare the ongoing costs of investing in the Fund and other funds. To do so, compare this 5% hypothetical example with the 5% hypothetical examples that appear in the shareholder reports of the other funds.
Please note that the expenses shown in the table are meant to highlight your ongoing costs only and do not reflect any transaction costs, such as sales charges (loads) on purchase payments or contingent deferred sales charges on redemptions, if any. Therefore, the hypothetical information is useful in comparing ongoing costs only, and will not help you determine the relative total costs of owning different funds. In addition, if these transaction costs were included, your costs would have been higher.
| Class | Beginning Account Value (05/01/13) | ACTUAL | HYPOTHETICAL (5% annual return before expenses) | Annualized Expense Ratio | ||||||||||||||||||||
| Ending Account Value (10/31/13)1 | Expenses Paid During Period2 | Ending Account Value (10/31/13) | Expenses Paid During Period2 | |||||||||||||||||||||
| A | $ | 1,000.00 | $ | 1,043.80 | $ | 9.17 | $ | 1,016.23 | $ | 9.05 | 1.78 | % | ||||||||||||
| B | 1,000.00 | 1,040.80 | 13.01 | 1,012.45 | 12.83 | 2.53 | ||||||||||||||||||
| C | 1,000.00 | 1,040.10 | 13.01 | 1,012.45 | 12.83 | 2.53 | ||||||||||||||||||
| R | 1,000.00 | 1,042.70 | 10.45 | 1,014.97 | 10.31 | 2.03 | ||||||||||||||||||
| Y | 1,000.00 | 1,045.80 | 7.89 | 1,017.49 | 7.78 | 1.53 | ||||||||||||||||||
| Investor | 1,000.00 | 1,044.00 | 9.17 | 1,016.23 | 9.05 | 1.78 | ||||||||||||||||||
| R5 | 1,000.00 | 1,046.60 | 5.83 | 1,019.51 | 5.75 | 1.13 | ||||||||||||||||||
| R6 | 1,000.00 | 1,047.60 | 5.99 | 1,019.36 | 5.90 | 1.16 | ||||||||||||||||||
| 1 | The actual ending account value is based on the actual total return of the Fund for the period May 1, 2013 through October 31, 2013, after actual expenses and will differ from the hypothetical ending account value which is based on the Fund’s expense ratio and a hypothetical annual return of 5% before expenses. |
| 2 | Expenses are equal to the Fund’s annualized expense ratio as indicated above multiplied by the average account value over the period, multiplied by 184/365 to reflect the most recent fiscal half year. |
22 Invesco International Core Equity Fund
Approval of Investment Advisory and Sub-Advisory Contracts
The Board of Trustees (the Board) of AIM International Mutual Funds (Invesco International Mutual Funds) is required under the Investment Company Act of 1940, as amended, to approve annually the renewal of Invesco International Core Equity Fund’s (the Fund) investment advisory agreement with Invesco Advisers, Inc. (Invesco Advisers) and the Master Intergroup Sub-Advisory Contract for Mutual Funds (the sub-advisory contracts) with Invesco Asset Management Deutschland GmbH, Invesco Asset Management Limited, Invesco Asset Management (Japan) Limited, Invesco Australia Limited, Invesco Hong Kong Limited, Invesco Senior Secured Management, Inc. and Invesco Canada Ltd. (collectively, the Affiliated Sub-Advisers). During contract renewal meetings held on June 17-19, 2013, the Board as a whole, and the disinterested or “independent” Trustees, who comprise over 75% of the Board, voting separately, approved the continuance of the Fund’s investment advisory agreement and the sub-advisory contracts for another year, effective July 1, 2013. The Board determined that continuation of the Fund’s investment advisory agreement and the sub-advisory contracts are in the best interests of the Fund and its shareholders and the compensation payable to Invesco Advisers and the Affiliated Sub-Advisers under the agreements is fair and reasonable.
The Board’s Fund Evaluation Process
The Board’s Investments Committee has established three Sub-Committees, each of which is primarily responsible for overseeing the management of a number of the funds advised by Invesco Advisers (the Invesco Funds). The Sub-Committees meet throughout the year to review the performance of their assigned Invesco Funds, including reviewing materials prepared under the direction of the independent Senior Officer, an officer of the Invesco Funds who reports directly to the independent Trustees. Over the course of each year, the Sub-Committees meet with portfolio managers for their assigned Invesco Funds and other members of management to review the performance, investment objective(s), policies, strategies, limitations and investment risks of these funds. The Sub-Committees meet regularly and at designated contract renewal meetings each year to conduct a review of the performance, fees, expenses and other matters related to their assigned Invesco Funds. Each Sub-Committee recommends to the Investments Committee, which in turn recommends to the full Board, whether and on what terms to approve the continuance of each Invesco Fund’s investment advisory agreement and sub-advisory contracts for another year.
During the contract renewal process, the Trustees receive comparative performance and fee data regarding the Invesco Funds prepared by Invesco Advisers and Lipper Inc. (Lipper), an independent provider of investment company
data. The Trustees also receive an independent written evaluation from the Senior Officer. The Senior Officer’s evaluation is prepared as part of his responsibility to manage the process by which the Invesco Funds’ proposed management fees are negotiated during the annual contract renewal process to ensure they are negotiated in a manner that is at arms’ length and reasonable. The independent Trustees are assisted in their annual evaluation of the Fund’s investment advisory agreement by the Senior Officer and by independent legal counsel. In addition to meetings with Invesco Advisers and fund counsel, the independent Trustees also discuss the continuance of the investment advisory agreement and sub-advisory contracts in separate sessions with the Senior Officer and with independent legal counsel.
In evaluating the fairness and reasonableness of compensation under the Fund’s investment advisory agreement and sub-advisory contracts, the Board considered, among other things, the factors discussed below. The Trustees recognized that the advisory fee rates for the Invesco Funds are, in many cases, the result of years of review and negotiation between the Trustees and Invesco Advisers as well as advisory fees previously approved by different predecessor boards. The Trustees’ deliberations and conclusions in a particular year may be based in part on their deliberations and conclusions regarding these same arrangements throughout the year and in prior years. The Trustees’ review and conclusions are based on the comprehensive consideration of all information presented to them and are not the result of any single determinative factor. Moreover, one Trustee may have weighed a particular piece of information or factor differently than another Trustee.
The discussion below serves as the Senior Officer’s independent written evaluation with respect to the Fund’s investment advisory agreement as well as a discussion of the material factors and related conclusions that formed the basis for the Board’s approval of the Fund’s investment advisory agreement and sub-advisory contracts. Unless otherwise stated, this information is current as of June 19, 2013, and may not reflect consideration of factors that became known to the Board after that date, including, for example, changes to the Fund’s performance, advisory fees, expense limitations and/or fee waivers.
Factors and Conclusions and Summary of Independent Written Fee Evaluation
| A. | Nature, Extent and Quality of Services Provided by Invesco Advisers and the Affiliated Sub-Advisers |
The Board reviewed the advisory services provided to the Fund by Invesco Advisers under the Fund’s investment advisory agreement, the performance of Invesco Advisers in providing these services, and the credentials and
experience of the officers and employees of Invesco Advisers who provide these services, including the Fund’s portfolio manager or managers, with whom the Sub-Committees met during the year. The Board’s review of the qualifications of Invesco Advisers to provide advisory services included the Board’s consideration of Invesco Advisers’ investment process oversight, independent credit analysis and investment risk management.
In determining whether to continue the Fund’s investment advisory agreement, the Board considered the benefits of reapproving an existing relationship and the greater uncertainty that may be associated with entering into a new relationship. The Board also considered non-advisory services that Invesco Advisers and its affiliates provide to the Invesco Funds such as various back office support functions, equity and fixed income trading operations, internal audit, distribution and legal and compliance. The Board concluded that the nature, extent and quality of the services provided to the Fund by Invesco Advisers are appropriate and satisfactory and consistent with the terms of the Fund’s investment advisory agreement.
The Board reviewed the services that may be provided by the Affiliated Sub-Advisers under the sub-advisory contracts and the credentials and experience of the officers and employees of the Affiliated Sub-Advisers who provide these services. The Board noted that the Affiliated Sub-Advisers have offices and personnel that are located in financial centers around the world. As a result, the Affiliated Sub-Advisers can provide research and investment analysis on the markets and economies of various countries in which the Fund may invest, make recommendations regarding securities and assist with security trades. The Board concluded that the sub-advisory contracts benefit the Fund and its shareholders by permitting Invesco Advisers to use the resources and talents of the Affiliated Sub-Advisers in managing the Fund. The Board concluded that the nature, extent and quality of the services that may be provided by the Affiliated Sub-Advisers are appropriate and satisfactory and consistent with the terms of the Fund’s sub-advisory contracts.
| B. | Fund Performance |
The Board considered Fund performance as a relevant factor in considering whether to approve the investment advisory agreement. The Board did not view Fund performance as a relevant factor in considering whether to approve the sub-advisory contracts for the Fund, as no Affiliated Sub-Adviser currently manages assets of the Fund.
The Board compared the Fund’s performance during the past one, three and five calendar years to the performance of all funds in the Lipper performance universe and against the Lipper International Large-Cap Core Funds Index. The Board noted that performance of Investor Class shares of the Fund was in the fifth quintile of the
23 Invesco International Core Equity Fund
performance universe for the one and three year periods and the fourth quintile for the five year period (the first quintile being the best performing funds and the fifth quintile being the worst performing funds). The Board noted that performance of Investor Class shares of the Fund was below the performance of the Index for the one, three and five year periods. Invesco Advisers advised the Board that performance continues to be affected by the high-quality, large-cap bias of the Fund, as well as stock selection. The Trustees also reviewed more recent Fund performance and information regarding the Fund from the Senior Officer.
| C. | Advisory and Sub-Advisory Fees |
The Board compared the Fund’s contractual management fee rate to the contractual management fee rates of funds in the Fund’s Lipper expense group at a common asset level. The Board noted that the contractual management fee rate for Investor Class shares of the Fund was at the median contractual management fee rate of funds in the expense group. The Board noted that the term “contractual management fee” may include both advisory and certain administrative services fees and that Invesco Advisers does not charge the Invesco Funds for the administrative services included in the term as defined by Lipper. The Board also reviewed the methodology used by Lipper in providing expense group information, which includes using each fund’s contractual management fee schedule (including any applicable breakpoints) as reported in the most recent prospectus or statement of additional information for each fund in the expense group.
The Board noted that Invesco Advisers and the Affiliated Sub-Advisers sub-advise one other mutual fund with investment strategies comparable to those of the Fund. The Fund’s effective advisory fee rate was above the sub-adviser effective advisory fee rate of the sub-advised fund.
The Board also considered the fees charged by Invesco Advisers and the Affiliated Sub-Advisers to other client accounts with investment strategies comparable to those of the Fund. The Board noted that Invesco Advisers or the Affiliated Sub-Advisers may charge lower fees to large institutional clients. Invesco Advisers reviewed with the Board the significantly greater scope of services it provides to the Invesco Funds relative to certain other client accounts. These additional services include provision of administrative services, officers and office space, oversight of service providers, preparation of annual registration statement updates and financial information and regulatory compliance under the Investment Company Act of 1940, as amended. Invesco Advisers also reviewed generally the higher frequency of shareholder purchases and redemptions in the Invesco Funds relative to the flow of assets for other client accounts. Invesco Advisers advised the Board that advance notice of redemptions is often provided to Invesco Advisers by institutional clients. The Board did note that sub-advisory fee rates charged by the Affiliated Sub-Advisers to manage the Invesco Funds and to
manage other client accounts tended to be more comparable, reflecting a more comparable scope of services. The Board concluded that the aggregate services provided to the Invesco Funds were sufficiently different from those provided to institutional clients, and the Board did not place significant weight on these fee comparisons.
The Board also considered the services that may be provided by the Affiliated Sub-Advisers pursuant to the sub-advisory contracts, as well as the fees payable by Invesco Advisers to the Affiliated Sub-Advisers pursuant to the sub-advisory contracts. The Board also noted that the sub-advisory fees are not paid directly by the Fund, but rather, are payable by Invesco Advisers to the Affiliated Sub-Advisers.
Based upon the information and considerations described above, the Board concluded that the compensation payable to Invesco Advisers and the Affiliated Sub-Advisers is fair and reasonable.
| D. | Economies of Scale and Breakpoints |
The Board considered the extent to which there are economies of scale in the provision of advisory services to the Fund. The Board also considered whether the Fund benefits from economies of scale through contractual breakpoints in the Fund’s advisory fee schedule and was assisted in this review by a report from the Senior Officer. The Board also noted that the Fund shares directly in economies of scale through lower fees charged by third party service providers based on the combined size of the Invesco Funds and other clients advised by Invesco Advisers.
| E. | Profitability and Financial Resources |
The Board reviewed information from Invesco Advisers concerning the costs of the advisory and other services that Invesco Advisers and its affiliates provide to the Fund and the profitability of Invesco Advisers and its affiliates in providing these services for the year ended December 31, 2012. The Board received information from Invesco Advisers about the methodology used to prepare the profitability information. The Board considered the profitability of Invesco Advisers in managing the Fund and the Invesco Funds. The Board noted that Invesco Advisers continues to operate at a net profit from services Invesco Advisers and its subsidiaries provide to the Invesco Funds and the Fund. The Board did not deem the level of profits realized by Invesco Advisers and its affiliates from providing services to the Fund to be excessive given the nature, quality and extent of the services provided to the Invesco Funds. The Board received and accepted information from Invesco Advisers demonstrating that Invesco Advisers and each Affiliated Sub-Adviser are financially sound and have the resources necessary to perform their obligations under the investment advisory agreement and sub-advisory contracts.
| F. | Collateral Benefits to Invesco Advisers and its Affiliates |
The Board considered various other benefits received by Invesco Advisers and its affiliates from the relationship with the Fund, including the fees received for their provision of transfer agency and distribution services to the Fund. The
Board considered comparative information regarding fees charged for these services, including information provided by Lipper and other independent sources. The Board considered the performance of Invesco Advisers and its affiliates in providing these services and the organizational structure employed to provide these services. The Board also considered that these services are provided to the Fund pursuant to written contracts that are reviewed and approved on an annual basis by the Board; that the services are required for the operation of the Fund; that Invesco Advisers and its affiliates can provide services, the nature and quality of which are at least equal to those provided by others offering the same or similar services; and that the fees for such services are fair and reasonable in light of the usual and customary charges by others for services of the same nature and quality.
The Board considered the benefits realized by Invesco Advisers and the Affiliated Sub-Advisers as a result of portfolio brokerage transactions executed through “soft dollar” arrangements. The Board noted that soft dollar arrangements shift the payment obligation for research services from Invesco Advisers and the Affiliated Sub-Advisers to the Invesco Funds and that the research received may be used with other clients of Invesco Advisers and may reduce Invesco Advisers’ and the Affiliated Sub-Advisers’ expenses. The Board also considered periodic reports from the Chief Compliance Officer of the Invesco Funds demonstrating that these arrangements are consistent with regulatory requirements. The Board did not deem the soft dollar arrangements to be inappropriate.
The Board considered that the Fund’s uninvested cash and cash collateral from any securities lending arrangements may be invested in money market funds advised by Invesco Advisers pursuant to procedures approved by the Board. The Board noted that Invesco Advisers receives advisory fees from these affiliated money market funds attributable to such investments, although Invesco Advisers has contractually agreed to waive through varying periods the advisory fees payable by the Invesco Funds. The waiver is in an amount equal to 100% of the net advisory fee Invesco Advisers receives from the affiliated money market funds with respect to the Fund’s investment in the affiliated money market funds of uninvested cash, but not cash collateral. The Board concluded that the Fund’s investment of uninvested cash and cash collateral from any securities lending arrangements in the affiliated money market funds is in the best interests of the Fund and its shareholders.
The Board also considered use of an affiliated broker to execute certain trades for the Fund to among other things, control information leakage, and were advised that such trades are executed in compliance with rules under the Investment Company Act of 1940, as amended.
24 Invesco International Core Equity Fund
Tax Information
Form 1099-DIV, Form 1042-S and other year–end tax information provide shareholders with actual calendar year amounts that should be included in their tax returns. Shareholders should consult their tax advisors.
The following distribution information is being provided as required by the Internal Revenue Code or to meet a specific state’s requirement.
The Fund designates the following amounts or, if subsequently determined to be different, the maximum amount allowable for its fiscal year ended October 31, 2013:
Federal and State Income Tax | ||||||||
Qualified Dividend Income* | 100 | % | ||||||
Corporate Dividends Received Deduction* | 15.11 | % | ||||||
Foreign Taxes | $ | 0.0323 | per share | |||||
Foreign Source Income | $ | 0.4354 | per share | |||||
| * | The above percentages are based on ordinary income dividends paid to shareholders during the Fund’s fiscal year. |
25 Invesco International Core Equity Fund
Trustees and Officers
The address of each trustee and officer is AIM International Mutual Funds (Invesco International Mutual Funds) (the “Trust”), 11 Greenway Plaza, Suite 1000, Houston, Texas 77046-1173. The trustees serve for the life of the Trust, subject to their earlier death, incapacitation, resignation, retirement or removal as more specifically provided in the Trust’s organizational documents. Each officer serves for a one year term or until their successors are elected and qualified. Column two below includes length of time served with predecessor entities, if any.
Name, Year of Birth and Position(s) Held with the Trust | Trustee and/ or Officer Since | Principal Occupation(s) During Past 5 Years | Number of Funds in Fund Complex Overseen by Trustee | Other Directorship(s) Held by Trustee During Past 5 Years | ||||
| Interested Persons | ||||||||
| Martin L. Flanagan1 — 1960 Trustee | 2007 | Executive Director, Chief Executive Officer and President, Invesco Ltd. (ultimate parent of Invesco and a global investment management firm); Advisor to the Board, Invesco Advisers, Inc. (formerly known as Invesco Institutional (N.A.), Inc.); Trustee, The Invesco Funds; Vice Chair, Investment Company Institute; and Member of Executive Board, SMU Cox School of Business
Formerly: Chairman and Chief Executive Officer, Invesco Advisers, Inc. (registered investment adviser); Director, Chairman, Chief Executive Officer and President, IVZ Inc. (holding company), INVESCO Group Services, Inc. (service provider) and Invesco North American Holdings, Inc. (holding company); Director, Chief Executive Officer and President, Invesco Holding Company Limited (parent of Invesco and a global investment management firm); Director, Invesco Ltd.; Chairman, Investment Company Institute and President, Co-Chief Executive Officer, Co-President, Chief Operating Officer and Chief Financial Officer, Franklin Resources, Inc. (global investment management organization) | 117 | None | ||||
Philip A. Taylor2 — 1954 Trustee, President and Principal Executive Officer | 2006 | Head of North American Retail and Senior Managing Director, Invesco Ltd.; Director, Co-Chairman, Co-President and Co-Chief Executive Officer, Invesco Advisers, Inc. (formerly known as Invesco Institutional (N.A.), Inc.) (registered investment adviser); Director, Chairman, Chief Executive Officer and President, Invesco Management Group, Inc. (formerly known as Invesco Aim Management Group, Inc.) (financial services holding company); Director and President, INVESCO Funds Group, Inc. (registered investment adviser and registered transfer agent); Director and Chairman, Invesco Investment Services, Inc. (formerly known as Invesco Aim Investment Services, Inc.) (registered transfer agent) and IVZ Distributors, Inc. (formerly known as INVESCO Distributors, Inc.) (registered broker dealer); Director, President and Chairman, Invesco Inc. (holding company) and Invesco Canada Holdings Inc. (holding company); Chief Executive Officer, Invesco Corporate Class Inc. (corporate mutual fund company) and Invesco Canada Fund Inc. (corporate mutual fund company); Director, Chairman and Chief Executive Officer, Invesco Canada Ltd. (formerly known as Invesco Trimark Ltd./Invesco Trimark Ltèe) (registered investment adviser and registered transfer agent); Trustee, President and Principal Executive Officer, The Invesco Funds (other than AIM Treasurer’s Series Trust (Invesco Treasurer’s Series Trust) and Short-Term Investments Trust); Trustee and Executive Vice President, The Invesco Funds (AIM Treasurer’s Series Trust (Invesco Treasurer’s Series Trust) and Short-Term Investments Trust only); Director, Invesco Investment Advisers LLC (formerly known as Van Kampen Asset Management); Director, Chief Executive Officer and President, Van Kampen Exchange Corp.
Formerly: Director and Chairman, Van Kampen Investor Services Inc.: Director, Chief Executive Officer and President, 1371 Preferred Inc. (holding company); and Van Kampen Investments Inc.; Director and President, AIM GP Canada Inc. (general partner for limited partnerships); and Van Kampen Advisors, Inc.; Director and Chief Executive Officer, Invesco Trimark Dealer Inc. (registered broker dealer); Director, Invesco Distributors, Inc. (formerly known as Invesco Aim Distributors, Inc.) (registered broker dealer); Manager, Invesco PowerShares Capital Management LLC; Director, Chief Executive Officer and President, Invesco Advisers, Inc.; Director, Chairman, Chief Executive Officer and President, Invesco Aim Capital Management, Inc.; President, Invesco Trimark Dealer Inc. and Invesco Trimark Ltd./Invesco Trimark Ltèe; Director and President, AIM Trimark Corporate Class Inc. and AIM Trimark Canada Fund Inc.; Senior Managing Director, Invesco Holding Company Limited; Trustee and Executive Vice President, Tax-Free Investments Trust; Director and Chairman, Fund Management Company (former registered broker dealer); President and Principal Executive Officer, The Invesco Funds (AIM Treasurer’s Series Trust (Invesco Treasurer’s Series Trust), Short-Term Investments Trust and Tax-Free Investments Trust only); President, AIM Trimark Global Fund Inc. and AIM Trimark Canada Fund Inc. | 117 | None | ||||
Wayne W. Whalen3 — 1939 Trustee | 2010 | Of Counsel, and prior to 2010, partner in the law firm of Skadden, Arps, Slate, Meagher & Flom LLP, legal counsel to certain funds in the Fund Complex | 130 | Director of the Mutual Fund Directors Forum, a nonprofit membership organization for investment directors; Chairman and Director of the Abraham Lincoln Presidential Library Foundation; and Director of the Stevenson Center for Democracy |
| 1 | Mr. Flanagan is considered an interested person of the Trust because he is an officer of the adviser to the Trust, and an officer and a director of Invesco Ltd., ultimate parent of the adviser to the Trust. |
| 2 | Mr. Taylor is considered an interested person of the Trust because he is an officer and a director of the adviser to, and a director of the principal underwriter of, the Trust. |
| 3 | Mr. Whalen is considered an “interested person” (within the meaning of Section 2(a)(19) of the 1940 Act) of certain Funds in the Invesco Fund Complex because he and his firm currently provide legal services as legal counsel to such Funds. |
T-1 Invesco International Core Equity Fund
Trustees and Officers—(continued)
Name, Year of Birth and Position(s) Held with the Trust | Trustee and/ or Officer Since | Principal Occupation(s) During Past 5 Years | Number of Funds in Fund Complex Overseen by Trustee | Other Directorship(s) Held by Trustee During Past 5 Years | ||||
| Independent Trustees | ||||||||
Bruce L. Crockett — 1944 Trustee and Chair | 1992 | Chairman, Crockett Technologies Associates (technology consulting company)
Formerly: Director, Captaris (unified messaging provider); Director, President and Chief Executive Officer COMSAT Corporation; and Chairman, Board of Governors of INTELSAT (international communications company) | 117 | ACE Limited (insurance company); Investment Company Institute | ||||
David C. Arch — 1945 Trustee | 2010 | Chairman and Chief Executive Officer of Blistex Inc., (consumer health care products manufacturer)
Formerly: Member of the Heartland Alliance Advisory Board, a nonprofit organization serving human needs based in Chicago | 130 | Board member of the Illinois Manufacturers’ Association; Member of the Board of Visitors, Institute for the Humanities, University of Michigan | ||||
Frank S. Bayley — 1939 Trustee | 2001 | Retired
Formerly: Director, Badgley Funds, Inc. (registered investment company) (2 portfolios) and General Partner and Of Counsel, law firm of Baker & McKenzie, LLP | 117 | Director and Chairman, C.D. Stimson Company (a real estate investment company); Trustee and Overseer, The Curtis Institute of Music | ||||
James T. Bunch — 1942 Trustee | 2003 | Managing Member, Grumman Hill Group LLC (family office private equity management)
Formerly: Founder, Green, Manning & Bunch Ltd. (investment banking firm)(1988-2010); Executive Committee, United States Golf Association; and Director, Policy Studies, Inc. and Van Gilder Insurance Corporation | 117 | Chairman, Board of Governors, Western Golf Association; Chairman-elect, Evans Scholars Foundation; and Director, Denver Film Society | ||||
Rodney F. Dammeyer — 1940 Trustee | 2010 | Chairman of CAC, LLC, (private company offering capital investment and management advisory services)
Formerly: Prior to 2001, Managing Partner at Equity Group Corporate Investments; Prior to 1995, Chief Executive Officer of Itel Corporation (formerly Anixter International); Prior to 1985, experience includes Senior Vice President and Chief Financial Officer of Household International, Inc., Executive Vice President and Chief Financial Officer of Northwest Industries, Inc. and Partner of Arthur Andersen & Co.; From 1987 to 2010, Director/Trustee of investment companies in the Van Kampen Funds complex | 117 | Director of Quidel Corporation and Stericycle, Inc.; Prior to May 2008, Trustee of The Scripps Research Institute; Prior to February 2008, Director of Ventana Medical Systems, Inc. | ||||
Albert R. Dowden — 1941 Trustee | 2000 | Director of a number of public and private business corporations, including the Boss Group, Ltd. (private investment and management); and Reich & Tang Funds (5 portfolios) (registered investment company)
Formerly: Director, Homeowners of America Holding Corporation/Homeowners of America Insurance Company (property casualty company); Director, Continental Energy Services, LLC (oil and gas pipeline service); Director, CompuDyne Corporation (provider of product and services to the public security market) and Director, Annuity and Life Re (Holdings), Ltd. (reinsurance company); Director, President and Chief Executive Officer, Volvo Group North America, Inc.; Senior Vice President, AB Volvo; Director of various public and private corporations; Chairman, DHJ Media, Inc.; Director, Magellan Insurance Company; and Director, The Hertz Corporation, Genmar Corporation (boat manufacturer), National Media Corporation; Advisory Board of Rotary Power International (designer, manufacturer, and seller of rotary power engines); and Chairman, Cortland Trust, Inc. (registered investment company) | 117 | Director of Nature’s Sunshine Products, Inc. | ||||
Jack M. Fields — 1952 Trustee | 1997 | Chief Executive Officer, Twenty First Century Group, Inc. (government affairs company); Owner and Chief Executive Officer, Dos Angeles Ranch, L.P. (cattle, hunting, corporate entertainment); and Discovery Global Education Fund (non-profit)
Formerly: Chief Executive Officer, Texana Timber LP (sustainable forestry company); Director of Cross Timbers Quail Research Ranch (non-profit); and member of the U.S. House of Representatives | 117 | Insperity, Inc. (formerly known as Administaff) | ||||
Prema Mathai-Davis — 1950 Trustee | 1998 | Retired
Formerly: Chief Executive Officer, YWCA of the U.S.A. | 117 | None | ||||
Larry Soll — 1942 Trustee | 2003 | Retired
Formerly: Chairman, Chief Executive Officer and President, Synergen Corp. (a biotechnology company) | 117 | None | ||||
Hugo F. Sonnenschein — 1940 Trustee | 2010 | Distinguished Service Professor and President Emeritus of the University of Chicago and the Adam Smith Distinguished Service Professor in the Department of Economics at the University of Chicago
Formerly: President of the University of Chicago | 130 | Trustee of the University of Rochester and a member of its investment committee. Member of the National Academy of Sciences, the American Philosophical Society and a fellow of the American Academy of Arts and Sciences | ||||
Raymond Stickel, Jr. — 1944 Trustee | 2005 | Retired
Formerly: Director, Mainstay VP Series Funds, Inc. (25 portfolios) and Partner, Deloitte & Touche | 117 | None |
T-2 Invesco International Core Equity Fund
Trustees and Officers—(continued)
Name, Year of Birth and Position(s) Held with the Trust | Trustee and/ or Officer Since | Principal Occupation(s) During Past 5 Years | Number of Funds in Fund Complex Overseen by Trustee | Other Directorship(s) Held by Trustee During Past 5 Years | ||||
| Other Officers | ||||||||
Russell C. Burk — 1958 Senior Vice President and Senior Officer | 2005 | Senior Vice President and Senior Officer, The Invesco Funds | N/A | N/A | ||||
John M. Zerr — 1962 Senior Vice President, Chief Legal Officer and Secretary | 2006 | Director, Senior Vice President, Secretary and General Counsel, Invesco Management Group, Inc. (formerly known as Invesco Aim Management Group, Inc.) and Van Kampen Exchange Corp.; Senior Vice President, Invesco Advisers, Inc. (formerly known as Invesco Institutional (N.A.), Inc.) (registered investment adviser); Senior Vice President and Secretary, Invesco Distributors, Inc. (formerly known as Invesco Aim Distributors, Inc.); Director, Vice President and Secretary, Invesco Investment Services, Inc. (formerly known as Invesco Aim Investment Services, Inc.) and IVZ Distributors, Inc. (formerly known as INVESCO Distributors, Inc.); Director and Vice President, INVESCO Funds Group, Inc.; Senior Vice President, Chief Legal Officer and Secretary, The Invesco Funds; Manager, Invesco PowerShares Capital Management LLC; Director, Secretary and General Counsel, Invesco Investment Advisers LLC (formerly known as Van Kampen Asset Management); Secretary and General Counsel, Invesco Capital Markets, Inc. (formerly known as Van Kampen Funds Inc.) and Chief Legal Officer, PowerShares Exchange-Traded Fund Trust, PowerShares Exchange-Traded Fund Trust II, PowerShares India Exchange-Traded Fund Trust and PowerShares Actively Managed Exchange-Traded Fund Trust
Formerly: Director and Vice President, Van Kampen Advisors Inc.; Director, Vice President, Secretary and General Counsel, Van Kampen Investor Services Inc.; Director, Invesco Distributors, Inc. (formerly known as Invesco Aim Distributors, Inc.); Director, Senior Vice President, General Counsel and Secretary, Invesco Aim Advisers, Inc. and Van Kampen Investments Inc.; Director, Vice President and Secretary, Fund Management Company; Director, Senior Vice President, Secretary, General Counsel and Vice President, Invesco Aim Capital Management, Inc.; Chief Operating Officer and General Counsel, Liberty Ridge Capital, Inc. (an investment adviser); Vice President and Secretary, PBHG Funds (an investment company) and PBHG Insurance Series Fund (an investment company); Chief Operating Officer, General Counsel and Secretary, Old Mutual Investment Partners (a broker-dealer); General Counsel and Secretary, Old Mutual Fund Services (an administrator) and Old Mutual Shareholder Services (a shareholder servicing center); Executive Vice President, General Counsel and Secretary, Old Mutual Capital, Inc. (an investment adviser); and Vice President and Secretary, Old Mutual Advisors Funds (an investment company) | N/A | N/A | ||||
Karen Dunn Kelley — 1960 Vice President | 2004 | Senior Managing Director, Investments; Director, Co-President, Co-Chief Executive Officer, and Co-Chairman, Invesco Advisers, Inc. (formerly known as Invesco Institutional (N.A.), Inc.) (registered investment adviser); Chairman, Invesco Senior Secured Management, Inc.; Senior Vice President, Invesco Management Group, Inc. (formerly known as Invesco Aim Management Group, Inc.); Executive Vice President, Invesco Distributors, Inc. (formerly known as Invesco Aim Distributors, Inc.); Director, Invesco Mortgage Capital Inc., and Invesco Management Company Limited; Director and President, INVESCO Asset Management (Bermuda) Ltd., Vice President, The Invesco Funds (other than AIM Treasurer’s Series Trust (Invesco Treasurer’s Series Trust) and Short-Term Investments Trust); and President and Principal Executive Officer, The Invesco Funds (AIM Treasurer’s Series Trust (Invesco Treasurer’s Series Trust) and Short-Term Investments Trust only)
Formerly: Director, INVESCO Global Asset Management Limited and INVESCO Management S.A.; Senior Vice President, Van Kampen Investments Inc. and Invesco Advisers, Inc. (formerly known as Invesco Institutional (N.A.), Inc.) (registered investment adviser); Vice President, Invesco Advisers, Inc. (formerly known as Invesco Institutional (N.A.), Inc.); Director of Cash Management and Senior Vice President, Invesco Advisers, Inc. and Invesco Aim Capital Management, Inc.; President and Principal Executive Officer, Tax-Free Investments Trust; Director and President, Fund Management Company; Chief Cash Management Officer, Director of Cash Management, Senior Vice President, and Managing Director, Invesco Aim Capital Management, Inc.; Director of Cash Management, Senior Vice President, and Vice President, Invesco Advisers, Inc. and The Invesco Funds (AIM Treasurer’s Series Trust (Invesco Treasurer’s Series Trust), Short-Term Investments Trust and Tax-Free Investments Trust only) | N/A | N/A |
T-3 Invesco International Core Equity Fund
Trustees and Officers—(continued)
Name, Year of Birth and Position(s) Held with the Trust | Trustee and/ or Officer Since | Principal Occupation(s) During Past 5 Years | Number of Funds in Fund Complex Overseen by Trustee | Other Directorship(s) Held by Trustee During Past 5 Years | ||||
| Other Officers—(continued) | ||||||||
Sheri Morris — 1964 Vice President, Treasurer and Principal Financial Officer | 1999 | Vice President, Treasurer and Principal Financial Officer, The Invesco Funds; Vice President, Invesco Advisers, Inc. (formerly known as Invesco Institutional (N.A.), Inc.) (registered investment adviser); and Vice President, PowerShares Exchange-Traded Fund Trust, PowerShares Exchange-Traded Fund Trust II, PowerShares India Exchange-Traded Fund Trust and PowerShares Actively Managed Exchange-Traded Fund Trust
Formerly: Vice President, Invesco Aim Advisers, Inc., Invesco Aim Capital Management, Inc. and Invesco Aim Private Asset Management, Inc.; Assistant Vice President and Assistant Treasurer, The Invesco Funds and Assistant Vice President, Invesco Advisers, Inc., Invesco Aim Capital Management, Inc. and Invesco Aim Private Asset Management, Inc.; and Treasurer, PowerShares Exchange-Traded Fund Trust, PowerShares Exchange-Traded Fund Trust II, PowerShares India Exchange-Traded Fund Trust and PowerShares Actively Managed Exchange-Traded Fund Trust | N/A | N/A | ||||
Crissie M. Wisdom — 1969 Anti-Money Laundering Compliance Officer | 2013 | Anti-Money Laundering Compliance Officer, Invesco Advisers, Inc. (formerly known as Invesco Institutional (N.A.), Inc.) (registered investment adviser), Invesco Capital Markets, Inc. (formerly known as Van Kampen Funds Inc.), Invesco Distributors, Inc., Invesco Investment Services, Inc., Invesco Management Group, Inc., Van Kampen Exchange Corp., The Invesco Funds, Invesco Funds (Chicago), and PowerShares Exchange-Traded Fund Trust, PowerShares Exchange-Traded Fund Trust II, PowerShares India Exchange-Traded Fund Trust, and PowerShares Actively Managed Exchange-Traded Fund Trust; and Fraud Prevention Manager and Controls and Risk Analysis Manager for Invesco Investment Services, Inc. | N/A | N/A | ||||
Todd L. Spillane — 1958 Chief Compliance Officer | 2006 | Senior Vice President, Invesco Management Group, Inc. (formerly known as Invesco Aim Management Group, Inc.) and Van Kampen Exchange Corp.; Senior Vice President and Chief Compliance Officer, Invesco Advisers, Inc. (registered investment adviser) (formerly known as Invesco Institutional (N.A.), Inc.); Chief Compliance Officer, The Invesco Funds; Vice President, Invesco Distributors, Inc. (formerly known as Invesco Aim Distributors, Inc.) and Invesco Investment Services, Inc. (formerly known as Invesco Aim Investment Services, Inc.)
Formerly: Chief Compliance Officer, Invesco Funds (Chicago); Senior Vice President, Van Kampen Investments Inc.; Senior Vice President and Chief Compliance Officer, Invesco Aim Advisers, Inc. and Invesco Aim Capital Management, Inc.; Chief Compliance Officer, INVESCO Private Capital Investments, Inc. (holding company), Invesco Private Capital, Inc. (registered investment adviser), Invesco Global Asset Management (N.A.), Inc., Invesco Senior Secured Management, Inc. (registered investment adviser), Van Kampen Investor Services Inc., PowerShares Exchange-Traded Fund Trust, PowerShares Exchange-Traded Fund Trust II, PowerShares India Exchange-Traded Fund Trust and PowerShares Actively Managed Exchange-Traded Fund Trust; and Vice President, Invesco Aim Capital Management, Inc. and Fund Management Company | N/A | N/A |
The Statement of Additional Information of the Trust includes additional information about the Fund’s Trustees and is available upon request, without charge, by calling 1.800.959.4246. Please refer to the Fund’s prospectus for information on the Fund’s sub-advisers.
Office of the Fund 11 Greenway Plaza, Suite 1000 Houston, TX 77046-1173 | Investment Adviser Invesco Advisers, Inc. 1555 Peachtree Street, N.E. Atlanta, GA 30309 | Distributor Invesco Distributors, Inc. 11 Greenway Plaza, Suite 1000 Houston, TX 77046-1173 | Auditors PricewaterhouseCoopers LLP 1201 Louisiana Street, Suite 2900 Houston, TX 77002-5678 | |||
Counsel to the Fund Stradley Ronon Stevens & Young, LLP 2005 Market Street, Suite 2600 Philadelphia, PA 19103-7018 | Counsel to the Independent Trustees Goodwin Procter LLP 901 New York Avenue, N.W. Washington, D.C. 20001 | Transfer Agent Invesco Investment Services, Inc. 11 Greenway Plaza, Suite 1000 Houston, TX 77046-1173 | Custodian State Street Bank and Trust Company 225 Franklin Street Boston, MA 02110-2801 | |||
T-4 Invesco International Core Equity Fund

Invesco mailing information
Send general correspondence to Invesco Investment Services, Inc., P.O. Box 219078, Kansas City, MO 64121-9078.
Invesco privacy policy
You share personal and financial information with us that is necessary for your transactions and your account records. We take very seriously the obligation to keep that information confidential and private.
Invesco collects nonpublic personal information about you from account applications or other forms you complete and from your transactions with us or our affiliates. We do not disclose information about you or our former customers to service providers or other third parties except to the extent necessary to service your account and in other limited circumstances as permitted by law. For example, we use this information to facilitate the delivery of transaction confirmations, financial reports, prospectuses and tax forms.
Even within Invesco, only people involved in the servicing of your accounts and compliance monitoring have access to your information. To ensure the highest level of confidentiality and security, Invesco maintains physical, electronic and procedural safeguards that meet or exceed federal standards. Special measures, such as data encryption and authentication, apply to your communications with us on our website. More detail is available to you at invesco.com/privacy.
Important notice regarding delivery of security holder documents
To reduce Fund expenses, only one copy of most shareholder documents may be mailed to shareholders with multiple accounts at the same address (Householding). Mailing of your shareholder documents may be householded indefinitely unless you instruct us otherwise. If you do not want the mailing of these documents to be combined with those for other members of your household, please contact Invesco Investment Services, Inc. at 800 959 4246 or contact your financial institution. We will begin sending you individual copies for each account within 30 days after receiving your request.
Fund holdings and proxy voting information
The Fund provides a complete list of its holdings four times in each fiscal year, at the quarter ends. For the second and fourth quarters, the lists appear in the Fund’s semiannual and annual reports to shareholders. For the first and third quarters, the Fund files the lists with the Securities and Exchange Commission (SEC) on Form N-Q. The most recent list of portfolio holdings is available at invesco.com/completeqtrholdings. Shareholders can also look up the Fund’s Forms N-Q on the SEC website at sec.gov. Copies of the Fund’s Forms N-Q may be reviewed and copied at the SEC Public Reference Room in Washington, D.C. You can obtain information on the operation of the Public Reference Room, including information about duplicating fee charges, by calling 202 551 8090 or 800 732 0330, or by electronic request at the following email address: publicinfo@sec.gov. The SEC file numbers for the Fund are shown below.
A description of the policies and procedures that the Fund uses to determine how to vote proxies relating to portfolio securities is available without charge, upon request, from our Client Services department at 800 959 4246 or at invesco.com/proxyguidelines. The information is also available on the SEC website, sec.gov.
Information regarding how the Fund voted proxies related to its portfolio securities during the most recent 12-month period ended June 30 is available at invesco.com/proxysearch. The information is also available on the SEC website, sec.gov. Invesco Advisers, Inc. is an investment adviser; it provides investment advisory services to individual and institutional clients and does not sell securities. Invesco Distributors, Inc. is the US distributor for Invesco Ltd.’s retail mutual funds, exchange-traded funds and institutional money market funds. Both are wholly owned, indirect subsidiaries of Invesco Ltd.
|
| |
| SEC file numbers: 811-06463 and 033-44611 I-ICE-AR-1 Invesco Distributors, Inc. |
| ||||||
| Annual Report to Shareholders
| October 31, 2013
| ||||
| ||||||
| Invesco International Growth Fund | ||||||
Nasdaq: A: AIIEX ¡ B: AIEBX ¡ C: AIECX ¡ R: AIERX ¡ Y: AIIYX ¡ R5: AIEVX ¡ R6: IGFRX | ||||||

Letters to Shareholders
 | Dear Shareholders: Enclosed in this annual report, you’ll find information about your Fund and the factors that affected its performance during the reporting period. Inside, you’ll also find a discussion from your portfolio managers about how they managed your Fund, as well as performance data for your Fund, a complete list of your Fund’s investments as of the close of the reporting period and other important information. I hope you find this report of interest. During the reporting period covered by this report, major US equity indexes made multiyear or even all-time highs.1 Economic data were generally positive; housing and consumer spending data were particularly encouraging. Nonetheless, economic uncertainty and concern about continuing political and budget gridlock in Washington persisted. The US Federal Reserve’s deliberate vagueness about when, and to what degree, it might begin to curtail its extraordinarily accommodative monetary policies affected fixed income and equity markets alike. Most developed, non-US stock markets remained positive for the first half of 2013, despite a difficult second quarter. | |
Periods of market volatility and economic uncertainty can weaken the will of even the most resolute investor. That’s why Invesco believes it’s often helpful to work with a skilled and trusted financial adviser who can emphasize the importance of adhering to an investment plan designed to achieve long-term goals rather than being sidetracked by short-term uncertainty that can result in inaction. A financial adviser who is familiar with your individual financial situation, investment goals and risk tolerance can be an invaluable partner as you work toward your financial goals. He or she can provide insight and perspective when markets are volatile; encouragement and reassurance when times are uncertain; and advice and guidance when your financial situation or investment goals change.
Our website, invesco.com/us, is another source of timely insight and information for investors. On the website, you’ll find fund-specific as well as more general information from many of Invesco’s investment professionals. You’ll find in-depth articles, video clips and audio commentaries – and, of course, you also can access information about your Invesco account whenever it’s convenient for you.
What we mean by Intentional Investing
At Invesco, all of our people and all of our resources are dedicated to helping investors achieve their financial objectives. It’s a philosophy we call Intentional Investing, and it guides the way we:
| ¡ | Manage investments - Our dedicated investment professionals search the world for the best opportunities, and each investment team follows a clear, disciplined process to build portfolios and mitigate risk. |
| ¡ | Provide choices - We offer multiple investment strategies, allowing you and your financial adviser to build a portfolio that’s purpose-built for your needs. |
| ¡ | Connect with you - We’re committed to giving you the expert insights you need to make informed investing decisions, and we are well-equipped to provide high-quality support for investors and advisers. |
At Invesco, we believe in putting investors first. That’s why investment management is all we do. Our sole focus on managing your money allows you and your financial adviser to build a portfolio of Invesco funds appropriate for your investment needs and goals today and when your circumstances change.
Have questions?
For questions about your account, feel free to contact an Invesco client services representative at 800 959 4246. For Invesco-related questions or comments, please email me directly at phil@invesco.com.
All of us at Invesco look forward to serving your investment management needs for many years to come. Thank you for investing with us.
Sincerely,

Philip Taylor
Senior Managing Director, Invesco Ltd.
1 Source: Reuters
2 Invesco International Growth Fund
| Dear Fellow Shareholders: The Invesco Funds Board has worked on a variety of issues over the last several months, and I’d like to take this opportunity to discuss two that affect you and our fellow fund shareholders. The first issue on which your Board has been working is our annual review of the funds’ advisory and sub-advisory contracts with Invesco Advisers and its affiliates. This annual review, which is required by the Investment Company Act of 1940, focuses on the nature and quality of the services Invesco provides as adviser to the Invesco Funds and the reasonableness of the fees that it charges for those services. Each year, we spend months reviewing detailed information that we request from Invesco that allows us to evaluate its services and fees. We also use information from many independent sources, including materials provided by the independent Senior Officer of the Invesco Funds, who reports directly to the independent Trustees on the Board. Additionally, we meet with independent legal counsel and review performance and fee data prepared by Lipper Inc., an independent, third-party firm widely recognized as a leader in its field. | |

I’m pleased to report that the Board determined in June that renewing the investment advisory agreement and the sub-advisory contracts with Invesco Advisers and its affiliates would serve the best interests of each fund and its shareholders.
The second area of focus to highlight is the Board’s efforts to ensure that we provide a lineup of funds that allow financial advisers to build portfolios that meet shareholders’ changing financial needs and goals. Today, more and more investors are reaching, or approaching, retirement. But interest rates remain low, making it difficult for many investors to generate the income they need, or will soon need, in their retirement years.
The members of your Board think about these things, too, and we’ve worked with Invesco Advisers to provide more income-generating options in the Invesco Funds lineup to help shareholders potentially meet their income needs. Your Board recently approved changes to three existing equity mutual funds, increasing their focus on generating income while also seeking to provide long-term growth of capital.
As a result of these changes, the funds and their respective management teams now have more flexibility to invest in the types of securities that could meet investors’ growing need for income generation, and in some cases, also help investors diversify their sources of income. These equity funds complement an array of fixed-income, asset allocation and alternative investment options in the Invesco Funds lineup designed to accommodate a variety of risk tolerances.
Be assured that your Board will continue working on behalf of fund shareholders, keeping your needs and interests uppermost in our minds.
As always, please contact me at bruce@brucecrockett.com with any questions or concerns you may have. On behalf of the Board, we look forward to continuing to represent your interests and serving your needs.
Sincerely,

Bruce L. Crockett
Independent Chair
Invesco Funds Board of Trustees
3 Invesco International Growth Fund
Management’s Discussion of Fund Performance
Performance summary
For the fiscal year ended October 31, 2013, Invesco International Growth Fund, at net asset value (NAV), delivered positive double-digit returns but underperformed its style-specific benchmark, the Custom International Growth Index. The Fund’s higher-than-average cash position through the course of the year, a period of strong equity returns, was the largest detractor from relative results.
Your Fund’s long-term performance appears later in this report.
Fund vs. Indexes
Total returns, 10/31/12 to 10/31/13, at net asset value (NAV). Performance shown does not include applicable contingent deferred sales charges (CDSC) or front-end sales charges, which would have reduced performance.
Class A Shares | 20.31 | % | ||
Class B Shares | 19.41 | |||
Class C Shares | 19.44 | |||
Class R Shares | 20.03 | |||
Class Y Shares | 20.59 | |||
Class R5 Shares | 20.74 | |||
Class R6 Shares | 20.85 | |||
MSCI EAFE Indexq (Broad Market Index) | 26.88 | |||
Custom International Growth Indexq (Style-Specific Index)* | 21.69 | |||
MSCI EAFE Growth Indexq (Former Style-Specific Index)* | 25.96 | |||
Lipper International Multi-Cap Growth Funds Indexn (Peer Group Index) | 22.94 |
Source(s): q Invesco, MSCI via FactSet Research Systems Inc.; nLipper Inc.
| * | During the reporting period, the Fund has elected to use the Custom International Growth Index as its style-specific index rather than the MSCI EAFE Growth Index because the new index is more aligned with the market allocations of the Fund and therefore a more appropriate benchmark by which to measure relative allocations and performance. |
How we invest When selecting stocks for your Fund, we use a disciplined investment strategy that emphasizes fundamental research to identify quality growth companies. This strategy is supported by quantitative analysis, portfolio construction and risk management techniques. Our EQV (earnings, quality and valuation) strategy focuses on identifying stocks that we believe have sustainable above-average earnings growth, efficient capital allocation and attractive prices. While research responsibilities within the portfolio management team are focused by geographic region, we select investments for the Fund using a bottom-up investment approach, which means we construct the Fund primarily on a stock-by-stock basis. We focus on the | strengths of individual companies rather than sectors, countries or market-cap trends. We believe disciplined sell decisions are the key to successful investing. We consider selling a stock for several reasons, including when: ¡Its price changes such that we believe it has become too expensive. ¡The original investment thesis for the company is no longer valid. ¡A more compelling investment opportunity is identified.
Market conditions and your Fund The fiscal year ended October 31, 2013, saw slow but steady improvement in the US economy and strong US and global equity market returns. Despite several headline events, equity markets focused |
more on longer term fundamentals. Major US and global stock market indexes rose throughout 2013, hitting multiyear or all-time highs.1
From late May through June, capital markets declined following US Federal Reserve (the Fed) Chairman Ben Bernanke’s comments suggesting the time had come to begin reducing the Fed’s extraordinary stimulus policies. This news, combined with data showing a slowdown in China’s economy, led to a correction in non-US stocks from the mid-May peak of the market. The most significantly impacted segments of the market were interest rate-sensitive and commodity-related sectors, as well as emerging markets. Markets stabilized in mid-summer, and despite some volatility in August surrounding a potential US military reaction to instability in Syria, they generally moved higher through the end of the fiscal year.
We continued to construct the Fund’s portfolio on a bottom-up basis, selecting stocks on an individual basis. The Fund delivered positive absolute returns in eight of 10 invested sectors with holdings in the consumer discretionary sector, the Fund’s largest sector allocation, taking the lead. Stock selection in the information technology (IT) sector was the largest contributor to performance. Particular strength was seen in the IT services and software industries. A top contributor in this sector was Baidu, an Internet search engine company based in China. Stabilizing margins and growing mobile revenues supported the stock over the reporting period.
Fund performance benefited from an underweight position in the materials sector, as continued concerns regarding slowing Chinese and emerging market growth led to cuts in demand and commodity price forecasts. A strong consumer discretionary sector was supportive to Fund performance on a relative basis as well. Top contributors in this sector included UK-based professional information solutions publisher Reed Elsevier and Macau-based casino Galaxy Entertainment.
| Portfolio Composition | Top 10 Equity Holdings* | Total Net Assets | $ | 7.3 billion | ||||||||||||||||||
By sector | Total Number of Holdings* | 76 | ||||||||||||||||||||
Consumer Discretionary | 22.8 | % | 1. | Reed Elsevier PLC | 2.7 | % | The Fund’s holdings are subject to change, and there is no assurance that the Fund will continue to hold any particular security. *Excluding money market fund holdings. |
| ||||||||||||||
Financials | 15.5 | 2. | Compass Group PLC | 2.2 | ||||||||||||||||||
Information Technology | 13.1 | 3. | British American Tobacco PLC | 2.1 | ||||||||||||||||||
Industrials | 10.5 | 4. | Suncor Energy, Inc. | 2.1 | ||||||||||||||||||
Consumer Staples | 8.6 | 5. | Roche Holding AG | 2.0 | ||||||||||||||||||
Energy | 8.3 | 6. | SAP AG | 2.0 | ||||||||||||||||||
Health Care | 8.1 | 7. | British Sky Broadcasting Group PLC | 1.9 | ||||||||||||||||||
Materials | 2.4 | 8. | WPP PLC | 1.9 | ||||||||||||||||||
Telecommunication Services | 2.3 | 9. | Baidu, Inc.-ADR | 1.8 | ||||||||||||||||||
Utilities | 1.0 | 10. | Publicis Groupe S.A. | 1.7 | ||||||||||||||||||
Money Market Funds | ||||||||||||||||||||||
Plus Other Assets Less Liabilities | 7.4 | |||||||||||||||||||||
4 Invesco International Growth Fund
Galaxy Entertainment, a leading developer and operator of casinos in Macau, reported good second-quarter results, helped by strong growth in the “mass” market (as opposed to the “VIP” market).
In broad geographic terms, the Fund delivered positive absolute returns in all major regions with Fund holdings in Europe and Asia contributing positively to relative results as well. Top country performers included the UK, Sweden, Hong Kong, China and South Korea.
In contrast, the Fund’s low double-digit cash position throughout the fiscal year detracted from performance as markets continued to rally over the reporting period. It is important to note that we do not use cash for “top-down” tactical asset allocation purposes. Historically, when the portfolio’s cash position has been higher than average, it has reflected a lack of good EQV investment opportunities in the marketplace, rather than an overall negative opinion on markets. However, we did take the chance to deploy cash when markets became more volatile toward the middle of the reporting period. The Fund ended the reporting period with cash accounting for 8.6% of total net assets.
From a sector perspective, the Fund’s exposure in the telecommunication services, health care and industrials sectors were a drag on relative results. Some of the largest stock level detractors included America Movil, Potash and WorleyParsons.
The Fund’s continued underweight exposure in Japan was the largest country-level detractor from performance. Although this market delivered strong results over the reporting period, identifying Japanese companies that meet our EQV criteria was challenging because “quality” companies remained hard to find. Increased earnings expectations were largely currency related, and underlying improvements in businesses were not apparent. Due to these factors, at the close of the reporting period, the Fund had a 5% weighting in Japanese equities while the style-specific index had an 18% weighting.
As mentioned above, stock selection in the portfolio is driven by the underlying fundamentals of each individual company, not by any top-down macroeconomic views. This focus on bottom-up stock selection is the key driver of the portfolio’s overall profile. Over the reporting period, we initiated positions in 12 new stocks, including several in Asia and Latin America, where we used share-price weakness in emerging markets to initiate holdings such as South Korea-based global electronics conglomerate Samsung Electronics, China’s dominant footwear manufacturer and distributor
Belle International and Brazilian-based BM&F Bovespa, which operates Latin America’s largest derivatives exchange.
Over the reporting period, the Fund’s financials exposure saw a marked increase with the purchase of emerging market and European financial firms, including BM&F Bovespa, Allianz Se and Aberdeen. On the flip side, we reduced and/or exited consumer staples positions based on rich valuations versus better opportunities elsewhere. The Fund ended the reporting period with overweight positions in the consumer discretionary, IT and energy sectors, but underweight exposure to the consumer staples, materials, health care, industrials, financials, telecommunication services and utilities sectors.
Over the reporting period, the Fund provided double-digit returns at NAV. While we are pleased to provide shareholders with this performance, it would be imprudent for us to suggest that such a level of return is sustainable over the long term. With market volatility likely to continue for some time, our focus remains on ensuring that our portfolio is comprised of high-quality, reasonably valued companies capable of sustained earnings growth. We believe that this balanced EQV-focused approach may help deliver attractive returns over the long term.
We thank you for your continued investment in Invesco International Growth Fund.
| 1 | Source: Reuters |
The views and opinions expressed in management’s discussion of Fund performance are those of Invesco Advisers, Inc. These views and opinions are subject to change at any time based on factors such as market and economic conditions. These views and opinions may not be relied upon as investment advice or recommendations, or as an offer for a particular security. The information is not a complete analysis of every aspect of any market, country, industry, security or the Fund. Statements of fact are from sources considered reliable, but Invesco Advisers, Inc. makes no representation or warranty as to their completeness or accuracy. Although historical performance is no guarantee of future results, these insights may help you understand our investment management philosophy.
See important Fund and, if applicable, index disclosures later in this report.
| Clas Olsson Portfolio manager and chief investment officer of Invesco’s international growth investments team, is | |
| lead manager of Invesco International Growth Fund. He joined Invesco in 1994. Mr. Olsson became a commissioned officer at the Royal Swedish Naval Academy in 1988. He also earned a BBA from The University of Texas at Austin. | ||

| Brent Bates Chartered Financial Analyst, portfolio manager, is manager of Invesco International Growth Fund. He joined Invesco in 1996. | |
Mr. Bates earned a BBA from Texas A&M University and is a Certified Public Accountant.
| ||
| Shuxin (Steve) Cao Chartered Financial Analyst, portfolio manager, is manager of Invesco International Growth Fund. He joined Invesco in 1997. | |
Mr. Cao earned a BA in English from the Tianjin Foreign Language Institute and an MBA from Texas A&M University. He is also a Certified Public Accountant.
| ||
| Matthew Dennis Chartered Financial Analyst, portfolio manager, is manager of Invesco International Growth Fund. | |
He joined Invesco in 2000. Mr. Dennis earned a BA in economics from The University of Texas at Austin and an MS in finance from Texas A&M University.
| ||
| Jason Holzer Chartered Financial Analyst, portfolio manager, is manager of Invesco International Growth Fund. | |
He joined Invesco in 1996. Mr. Holzer earned a BA in quantitative economics and an MS in engineering economic systems from Stanford University.
| ||
| Mark Jason Chartered Financial Analyst, portfolio manager, is manager of Invesco International Growth Fund. | |
| He joined Invesco in 2001. Mr. Jason earned a BS in finance and a BS in real estate from California State University, Northridge. | ||
|
Richard Nield Chartered Financial Analyst, portfolio manager, is manager of Invesco International Growth Fund. He joined Invesco in 2000. | |
| Mr. Nield earned a Bachelor of Commerce degree in finance and international business from McGill University in Montreal. | ||


5 Invesco International Growth Fund
Your Fund’s Long-Term Performance
Results of a $10,000 Investment – Oldest Share Class(es)
Fund and index data from 10/31/03

| 1 Source: | Lipper Inc. |
2 Source(s): Invesco, MSCI via FactSet Research Systems Inc.
Past performance cannot guarantee comparable future results.
During the reporting period, the Fund has elected to use the Custom International Growth Index as its style-specific index rather than the MSCI EAFE Growth Index because the new index is more aligned with the market allocations of the Fund and therefore a more appropriate benchmark by which to measure
relative allocations and performance. Because this is the first reporting period since we have adopted the new index, SEC guidelines require that we compare performance to both the old and new indexes.
The data shown in the chart include reinvested distributions, applicable sales charges and Fund expenses including
management fees. Index results include reinvested dividends, but they do not reflect sales charges. Performance of the peer group, if applicable, reflects fund expenses and management fees; performance of a market index does not. Performance shown in the chart and table(s) does not reflect deduction of taxes a shareholder would pay on Fund distributions or sale of Fund shares.
continued from page 8
lines, markets, management and financial resources. The securities of small- and mid-sized companies may be more volatile due to less market interest and less publicly available information about the issuer. They also may be illiquid or restricted as to resale, or may trade less frequently and in smaller volumes, all of which may cause difficulty when establishing or closing a position at a desirable price.
About indexes used in this report
| ¡ | The MSCI EAFE® Index is an unmanaged index considered representative of stocks of Europe, Australasia and the Far East. The index is computed using the net return, which withholds applicable taxes for non-resident investors. |
| ¡ | The Custom International Growth Index is an index comprised of the MSCI EAFE Growth Index through February 28, 2013, and the MSCI AC World ex US Growth Index thereafter. |
| ¡ | The Lipper International Multi-Cap Growth Funds Index is an unmanaged index considered representative of international multi-cap growth funds tracked by Lipper. |
| ¡ | The MSCI AC World ex US Growth Index is a market capitalization weighted index that includes growth companies in developed and emerging markets throughout the world, excluding the United States. The index is computed using the net return, which withholds applicable taxes for non-resident investors. |
| ¡ | The MSCI EAFE® Growth Index is an unmanaged index considered representative of growth stocks of Europe, Australasia and the Far East. The index is computed using the net return, which withholds applicable taxes for non-resident investors. |
| ¡ | The Fund is not managed to track the performance of any particular index, including the index(es) described here, and consequently, the performance of the Fund may deviate significantly from the performance of the index(es). |
| ¡ | A direct investment cannot be made in an index. Unless otherwise indicated, index results include reinvested dividends, and they do not reflect sales charges. Performance of the peer group, if applicable, reflects fund expenses; performance of a market index does not. |
continued on page 7
6 Invesco International Growth Fund
Average Annual Total Returns As of 10/31/13, including maximum applicable sales charges |
| |||
Class A Shares | ||||
Inception (4/7/92) | 8.00 | % | ||
10 Years | 9.11 | |||
5 Years | 12.04 | |||
1 Year | 13.68 | |||
Class B Shares | ||||
Inception (9/15/94) | 6.61 | % | ||
10 Years | 9.09 | |||
5 Years | 12.22 | |||
1 Year | 14.41 | |||
Class C Shares | ||||
Inception (8/4/97) | 4.88 | % | ||
10 Years | 8.93 | |||
5 Years | 12.48 | |||
1 Year | 18.44 | |||
Class R Shares | ||||
Inception (6/3/02) | 8.16 | % | ||
10 Years | 9.46 | |||
5 Years | 13.05 | |||
1 Year | 20.03 | |||
Class Y Shares | ||||
10 Years | 9.88 | % | ||
5 Years | 13.62 | |||
1 Year | 20.59 | |||
Class R5 Shares | ||||
Inception (3/15/02) | 8.91 | % | ||
10 Years | 10.23 | |||
5 Years | 13.79 | |||
1 Year | 20.74 | |||
Class R6 Shares | ||||
10 Years | 9.78 | % | ||
5 Years | 13.43 | |||
1 Year | 20.85 | |||
Class Y shares incepted on October 3, 2008. Performance shown prior to that date is that of Class A shares and includes the 12b-1 fees applicable to Class A shares. Class A share performance reflects any applicable fee waivers or expense reimbursements.
Average Annual Total Returns As of 9/30/13, the most recent calendar quarter end, including maximum applicable sales charges |
| |||
Class A Shares | ||||
Inception (4/7/92) | 7.89 | % | ||
10 Years | 9.50 | |||
5 Years | 6.72 | |||
1 Year | 10.06 | |||
Class B Shares | ||||
Inception (9/15/94) | 6.48 | % | ||
10 Years | 9.47 | |||
5 Years | 6.82 | |||
1 Year | 10.56 | |||
Class C Shares | ||||
Inception (8/4/97) | 4.73 | % | ||
10 Years | 9.31 | |||
5 Years | 7.13 | |||
1 Year | 14.58 | |||
Class R Shares | ||||
Inception (6/3/02) | 7.96 | % | ||
10 Years | 9.84 | |||
5 Years | 7.67 | |||
1 Year | 16.16 | |||
Class Y Shares | ||||
10 Years | 10.26 | % | ||
5 Years | 8.21 | |||
1 Year | 16.74 | |||
Class R5 Shares | ||||
Inception (3/15/02) | 8.71 | % | ||
10 Years | 10.63 | |||
5 Years | 8.38 | |||
1 Year | 16.89 | |||
Class R6 Shares | ||||
10 Years | 10.17 | % | ||
5 Years | 8.03 | |||
1 Year | 16.95 | |||
Class R6 shares incepted on September 24, 2012. Performance shown prior to that date is that of Class A shares and includes the 12b-1 fees applicable to Class A shares. Class A share performance reflects any applicable fee waivers or expense reimbursements.
The performance data quoted represent past performance and cannot guarantee comparable future results; current performance may be lower or higher. Please visit invesco.com/performance for the most recent month-end performance. Performance figures reflect reinvested distributions, changes in net asset value and the effect of the maximum sales charge unless otherwise stated. Investment return and principal value will fluctuate so that you may have a gain or loss when you sell shares.
The total annual Fund operating expense ratio set forth in the most recent Fund prospectus as of the date of this report for Class A, Class B, Class C, Class R, Class Y, Class R5 and Class R6 shares was 1.38%, 2.13%, 2.13%, 1.63%, 1.13%, 1.00% and 0.93%, respectively. The expense ratios presented above may vary from the expense ratios presented in other sections of this report that are based on expenses incurred during the period covered by this report.
Class A share performance reflects the maximum 5.50% sales charge, and Class B and Class C share performance reflects the applicable contingent deferred sales charge (CDSC) for the period involved. The CDSC on Class B shares declines from 5% beginning at the time of purchase to 0% at the beginning of the seventh year. The CDSC on Class C shares is 1% for the first year after purchase. Class R, Class Y, Class R5 and Class R6 shares do not have a front-end sales charge or a CDSC; therefore, performance is at net asset value.
The performance of the Fund’s share classes will differ primarily due to different sales charge structures and class expenses.
continued from page 6
Other information
| ¡ | CPA® and Certified Public Accountant® are trademarks owned by the American Institute of Certified Public Accountants. |
| ¡ | The returns shown in management’s discussion of Fund performance are based on net asset values calculated for shareholder transactions. Generally accepted accounting principles require |
adjustments to be made to the net assets of the Fund at period end for financial reporting purposes, and as such, the net asset values for shareholder transactions and the returns based on those net asset values may differ from the net asset values and returns reported in the Financial Highlights.
| ¡ | Industry classifications used in this report are generally according to the Global Industry Classification Standard, which was developed by and is the exclusive property and a service mark of MSCI Inc. and Standard & Poor’s. |
7 Invesco International Growth Fund
Invesco International Growth Fund’s investment objective is long-term growth of capital.
| ¡ | Unless otherwise stated, information presented in this report is as of October 31, 2013, and is based on total net assets. |
| ¡ | Unless otherwise noted, all data provided by Invesco. |
| ¡ | To access your Fund’s reports/prospectus, visit invesco.com/fundreports. |
About share classes
| ¡ | Class B shares may not be purchased for new or additional investments. Please see the prospectus for more information. |
| ¡ | Class R shares are generally available only to employer sponsored retirement and benefit plans. Please see the prospectus for more information. |
| ¡ | Class Y shares are available only to certain investors. Please see the prospectus for more information. |
| ¡ | Class R5 shares and Class R6 shares are primarily intended for employer sponsored retirement and benefit plans that meet certain standards and for institutional investors. On September 24 2012, Institutional Class shares were renamed Class R5 shares. Please see the prospectus for more information. |
Principal risks of investing in the Fund
| ¡ | Depositary receipts risk. Depositary receipts involve many of the same risks as those associated with direct investment in foreign securities. In addition, the underlying issuers of certain depositary receipts, particularly unsponsored or unregistered depositary receipts, are under no obligation to distribute shareholder communications to the holders of such receipts or to pass through to them any voting rights with respect to the deposited securities. |
| ¡ | Derivatives risk. The performance of derivative instruments is tied to the performance of an underlying currency, security, index, commodity or other asset. In addition to risks relating to their underlying assets, the use of derivatives may include other, possibly greater, risks. Derivatives involve costs, may be volatile, and may involve a small initial investment relative to the risk assumed. Risks associated with the use of derivatives may include counterparty, margin, leverage, correlation, liquidity, tax, market, interest rate and management risks, as well as the risk of potential increased regulation of derivatives. Derivatives may also be more |
difficult to purchase, sell or value than other investments. The Fund may lose more than the cash amount invested on investments in derivatives. Each of these risks is greater for the Fund than mutual funds that do not use derivatives to implement their investment strategy. |
| ¡ | Developing/emerging markets securities risk. The prices of securities issued by foreign companies and governments located in developing/emerging markets countries may be affected more negatively by inflation, devaluation of their currencies, higher transaction costs, delays in settlement, adverse political developments, the introduction of capital controls, withholding taxes, nationalization of private assets, expropriation, social unrest, war or lack of timely information than those in developed countries. |
| ¡ | Foreign securities risk. The Fund’s foreign investments may be affected by changes in a foreign country’s exchange rates, political and social instability, changes in economic or taxation policies, difficulties when enforcing obligations, decreased liquidity, and increased volatility. Foreign companies may be subject to less regulation resulting in less publicly available information about the companies. |
| ¡ | Geographic focus risk. From time to time the Fund may invest a substantial amount of its assets in securities of issuers located in a single country or a limited number of countries. If the Fund focuses its investments in this manner, it assumes the risk that economic, political and social conditions in those countries will have a significant impact on its investment performance. The Fund’s investment performance may also be more volatile if it focuses its investments in certain countries, especially emerging markets countries. |
| ¡ | Growth investing risk. Growth stocks tend to be more expensive relative to their earnings or assets compared with other types of stock. As a result they tend to be |
more sensitive to changes in their earnings and can be more volatile. |
| ¡ | Investing in the European Union risk. Many countries in the European Union are susceptible to high economic risks associated with high levels of debt, notably due to investments in sovereign debts of European countries such as Greece, Italy and Spain. One or more member states might exit the European Union, placing its currency and banking system in jeopardy. The European Union faces major issues involving its membership, structure, procedures and policies, including the adoption, abandonment or adjustment of the new constitutional treaty, the European Union’s enlargement to the south and east, and resolution of the European Union’s problematic fiscal and democratic accountability. Efforts of the member states to further unify their economic and monetary policies may increase the potential for the downward movement of one member state’s market to cause a similar effect on other member states’ markets. European countries that are part of the European Economic and Monetary Union may be significantly affected by the tight fiscal and monetary controls that the union seeks to impose on its members. |
| ¡ | Management risk. The investment techniques and risk analysis used by the Fund’s portfolio managers may not produce the desired results. |
| ¡ | Market risk. The prices of and the income generated by the Fund’s securities may decline in response to, among other things, investor sentiment, general economic and market conditions, regional or global instability, and currency and interest rate fluctuations. |
| ¡ | Small- and mid-capitalization risks. Stocks of small- and mid-sized companies tend to be more vulnerable to adverse developments and may have little or no operating history or track record of success, and limited product |
continued on page 6
This report must be accompanied or preceded by a currently effective Fund prospectus, which contains more complete information, including sales charges and expenses. Investors should read it carefully before investing.
|
NOT FDIC INSURED | MAY LOSE VALUE | NO BANK GUARANTEE |
Fund Nasdaq Symbols
Class A Shares | AIIEX | |||
Class B Shares | AIEBX | |||
Class C Shares | AIECX | |||
Class R Shares | AIERX | |||
Class Y Shares | AIIYX | |||
Class R5 Shares | AIEVX | |||
Class R6 Shares | IGFRX |
8 Invesco International Growth Fund
Schedule of Investments
October 31, 2013
| Shares | Value | |||||||
Common Stocks & Other Equity Interests–92.61% |
| |||||||
| Australia–2.74% | ||||||||
Brambles Ltd. | 10,022,992 | $ | 88,105,708 | |||||
CSL Ltd. | 845,551 | 55,545,429 | ||||||
WorleyParsons Ltd. | 2,761,987 | 57,590,500 | ||||||
| 201,241,637 | ||||||||
| Belgium–1.54% | ||||||||
Anheuser-Busch InBev N.V. | 1,093,468 | 113,514,300 | ||||||
| Brazil–3.18% | ||||||||
Banco Bradesco S.A.–ADR | 7,546,196 | 108,816,146 | ||||||
BM&F Bovespa S.A. | 22,132,400 | 124,802,309 | ||||||
| 233,618,455 | ||||||||
| Canada–7.26% | ||||||||
Agrium Inc. | 548,659 | 46,835,460 | ||||||
Canadian National Railway Co. | 557,228 | 61,222,393 | ||||||
Cenovus Energy Inc. | 2,202,169 | 65,435,638 | ||||||
CGI Group Inc.–Class A(a) | 2,922,354 | 98,047,135 | ||||||
Fairfax Financial Holdings Ltd. | 165,460 | 72,208,230 | ||||||
Potash Corp. of Saskatchewan Inc. | 1,270,000 | 39,466,718 | ||||||
Suncor Energy, Inc. | 4,142,920 | 150,561,326 | ||||||
| 533,776,900 | ||||||||
| China–6.00% | ||||||||
Baidu, Inc.–ADR(a) | 834,256 | 134,231,790 | ||||||
Belle International Holdings Ltd. | 44,590,000 | 62,919,464 | ||||||
China Mobile Ltd. | 4,687,466 | 48,749,829 | ||||||
CNOOC Ltd. | 56,113,093 | 114,050,047 | ||||||
Industrial & Commercial Bank of China Ltd.–Class H | 115,342,461 | 80,782,866 | ||||||
| 440,733,996 | ||||||||
| Denmark–1.60% | ||||||||
Carlsberg A/S–Class B | 521,448 | 52,066,013 | ||||||
Novo Nordisk AS–Class B | 391,451 | 65,207,519 | ||||||
| 117,273,532 | ||||||||
| France–4.39% | ||||||||
Publicis Groupe S.A. | 1,524,328 | 126,824,481 | ||||||
Schneider Electric S.A. | 973,546 | 81,858,696 | ||||||
Total S.A. | 1,862,204 | 114,211,371 | ||||||
| 322,894,548 | ||||||||
| Germany–9.19% | ||||||||
Adidas AG | 837,975 | 95,659,385 | ||||||
Allianz S.E. | 606,518 | 102,027,870 | ||||||
Deutsche Boerse AG | 1,054,678 | 79,400,869 | ||||||
Deutsche Post AG | 2,608,686 | 88,279,688 | ||||||
Deutsche Telekom AG | 5,237,594 | 82,488,544 | ||||||
SAP AG | 1,847,100 | 145,101,752 | ||||||
| Shares | Value | |||||||
| Germany–(continued) | ||||||||
Volkswagen AG–Preference Shares | 324,488 | $ | 82,472,337 | |||||
| 675,430,445 | ||||||||
| Hong Kong–2.84% | ||||||||
Galaxy Entertainment Group Ltd.(a) | 13,899,090 | 103,526,477 | ||||||
Hutchison Whampoa Ltd. | 8,429,590 | 105,030,103 | ||||||
| 208,556,580 | ||||||||
| Ireland–1.22% | ||||||||
Shire PLC | 2,016,239 | 89,368,240 | ||||||
| Israel–1.41% | ||||||||
Teva Pharmaceutical Industries | 2,787,155 | 103,375,579 | ||||||
| Japan–5.45% | ||||||||
Denso Corp. | 1,172,947 | 56,375,431 | ||||||
Fanuc Corp. | 580,212 | 93,062,735 | ||||||
Keyence Corp. | 214,527 | 91,896,494 | ||||||
Komatsu Ltd. | 2,086,428 | 45,651,813 | ||||||
Toyota Motor Corp. | 1,746,530 | 113,316,146 | ||||||
| 400,302,619 | ||||||||
| Mexico–2.30% | ||||||||
America Movil S.A.B. de C.V.– | 1,861,435 | 39,853,323 | ||||||
Fomento Economico Mexicano, S.A.B. de C.V.–ADR | 362,191 | 33,792,420 | ||||||
Grupo Televisa S.A.B.–ADR | 3,145,479 | 95,748,381 | ||||||
| 169,394,124 | ||||||||
| Netherlands–1.15% | ||||||||
Unilever N.V. | 2,144,252 | 84,921,190 | ||||||
| Singapore–2.46% | ||||||||
Keppel Corp. Ltd. | 11,453,313 | 100,039,000 | ||||||
United Overseas Bank Ltd. | 4,809,166 | 80,570,046 | ||||||
| 180,609,046 | ||||||||
| South Korea–3.23% | ||||||||
Hyundai Mobis | 410,895 | 116,017,321 | ||||||
NHN Entertainment Corp.(a) | 53,750 | 5,751,346 | ||||||
Samsung Electronics Co., Ltd. | 83,514 | 115,727,655 | ||||||
| 237,496,322 | ||||||||
| Spain–1.59% | ||||||||
Amadeus IT Holding S.A.–Class A | 3,142,452 | 116,688,969 | ||||||
| Sweden–3.58% | ||||||||
Investment AB Kinnevik–Class B | 1,618,178 | 59,531,478 | ||||||
Investor AB–Class B | 2,686,589 | 86,312,450 | ||||||
Swedbank AB–Class A | 2,486,643 | 64,847,260 | ||||||
Telefonaktiebolaget LM Ericsson–Class B | 4,373,180 | 52,197,434 | ||||||
| 262,888,622 | ||||||||
See accompanying Notes to Financial Statements which are an integral part of the financial statements.
9 Invesco International Growth Fund
| Shares | Value | |||||||
| Switzerland–8.96% | ||||||||
ABB Ltd. | 4,246,752 | $ | 108,151,952 | |||||
Julius Baer Group Ltd. | 1,723,487 | 84,413,187 | ||||||
Nestle S.A. | 1,363,674 | 98,435,802 | ||||||
Novartis AG | 1,008,767 | 78,192,647 | ||||||
Roche Holding AG | 541,969 | 149,747,722 | ||||||
Syngenta AG | 229,533 | 92,708,667 | ||||||
UBS AG | 2,412,791 | 46,536,740 | ||||||
| 658,186,717 | ||||||||
| Taiwan–1.28% | ||||||||
Taiwan Semiconductor Manufacturing Co. Ltd. | 25,550,887 | 94,418,890 | ||||||
| Turkey–0.98% | ||||||||
Akbank T.A.S. | 18,395,073 | 71,755,962 | ||||||
| United Kingdom–18.78% | ||||||||
Aberdeen Asset Management PLC | 11,017,904 | 78,238,309 | ||||||
British American Tobacco PLC | 2,739,427 | 150,913,357 | ||||||
British Sky Broadcasting Group PLC | 9,414,579 | 141,509,949 | ||||||
Centrica PLC | 12,352,162 | 70,095,200 | ||||||
Compass Group PLC | 11,013,103 | 158,386,053 | ||||||
Imperial Tobacco Group PLC | 2,590,987 | 96,916,858 | ||||||
Informa PLC | 7,124,832 | 63,771,670 | ||||||
| Shares | Value | |||||||
| United Kingdom–(continued) | ||||||||
Kingfisher PLC | 11,073,999 | $ | 66,843,807 | |||||
Next PLC | 656,715 | 57,218,415 | ||||||
Reed Elsevier PLC | 14,018,219 | 196,167,936 | ||||||
Royal Dutch Shell PLC–Class B | 3,029,770 | 104,704,361 | ||||||
Smith & Nephew PLC | 4,499,698 | 57,400,748 | ||||||
WPP PLC | 6,472,423 | 137,977,419 | ||||||
| 1,380,144,082 | ||||||||
| United States–1.48% | ||||||||
Avago Technologies Ltd. | 2,400,418 | 109,050,990 | ||||||
Total Common Stocks & Other Equity Interests |
| 6,805,641,745 | ||||||
Money Market Funds–7.19% |
| |||||||
Liquid Assets Portfolio–Institutional Class(b) | 264,107,672 | 264,107,672 | ||||||
Premier Portfolio–Institutional Class(b) | 264,107,672 | 264,107,672 | ||||||
Total Money Market Funds |
| 528,215,344 | ||||||
TOTAL INVESTMENTS–99.80% |
| 7,333,857,089 | ||||||
OTHER ASSETS LESS LIABILITIES–0.20% |
| 14,962,442 | ||||||
NET ASSETS–100.00% |
| $ | 7,348,819,531 | |||||
Investment Abbreviations:
| ADR | — American Depositary Receipt |
Notes to Schedule of Investments:
| (a) | Non-income producing security. |
| (b) | The money market fund and the Fund are affiliated by having the same investment adviser. |
See accompanying Notes to Financial Statements which are an integral part of the financial statements.
10 Invesco International Growth Fund
Statement of Assets and Liabilities
October 31, 2013
Assets: |
| |||
Investments, at value (Cost $4,812,227,890) | $ | 6,805,641,745 | ||
Investments in affiliated money market funds, at value and cost | 528,215,344 | |||
Total investments, at value (Cost $5,340,443,234) | 7,333,857,089 | |||
Foreign currencies, at value (Cost $6,103,082) | 6,098,793 | |||
Receivable for: | ||||
Fund shares sold | 18,748,809 | |||
Dividends | 11,535,834 | |||
Investment for trustee deferred compensation and retirement plans | 189,670 | |||
Other assets | 88,612 | |||
Total assets | 7,370,518,807 | |||
Liabilities: |
| |||
Payable for: | ||||
Fund shares reacquired | 17,165,815 | |||
Accrued fees to affiliates | 3,151,496 | |||
Accrued trustees’ and officers’ fees and benefits | 9,437 | |||
Accrued other operating expenses | 576,981 | |||
Trustee deferred compensation and retirement plans | 795,547 | |||
Total liabilities | 21,699,276 | |||
Net assets applicable to shares outstanding | $ | 7,348,819,531 | ||
Net assets consist of: |
| |||
Shares of beneficial interest | $ | 5,469,239,307 | ||
Undistributed net investment income | 58,778,653 | |||
Undistributed net realized gain (loss) | (172,747,293 | ) | ||
Net unrealized appreciation | 1,993,548,864 | |||
| $ | 7,348,819,531 | |||
Net Assets: |
| |||
Class A | $ | 2,662,961,598 | ||
Class B | $ | 38,858,174 | ||
Class C | $ | 154,312,965 | ||
Class R | $ | 104,712,423 | ||
Class Y | $ | 2,188,960,244 | ||
Class R5 | $ | 1,899,116,593 | ||
Class R6 | $ | 299,897,534 | ||
Shares outstanding, $0.001 par value per share, |
| |||
Class A | 79,963,205 | |||
Class B | 1,266,107 | |||
Class C | 5,022,933 | |||
Class R | 3,181,619 | |||
Class Y | 65,492,534 | |||
Class R5 | 56,120,458 | |||
Class R6 | 8,862,076 | |||
Class A: | ||||
Net asset value per share | $ | 33.30 | ||
Maximum offering price per share | ||||
(Net asset value of $33.30 ¸ 94.50%) | $ | 35.24 | ||
Class B: | ||||
Net asset value and offering price per share | $ | 30.69 | ||
Class C: | ||||
Net asset value and offering price per share | $ | 30.72 | ||
Class R: | ||||
Net asset value and offering price per share | $ | 32.91 | ||
Class Y: | ||||
Net asset value and offering price per share | $ | 33.42 | ||
Class R5: | ||||
Net asset value and offering price per share | $ | 33.84 | ||
Class R6: | ||||
Net asset value and offering price per share | $ | 33.84 | ||
See accompanying Notes to Financial Statements which are an integral part of the financial statements.
11 Invesco International Growth Fund
Statement of Operations
For the year ended October 31, 2013
Investment income: |
| |||
Dividends (net of foreign withholding taxes of $12,120,204) | $ | 137,553,459 | ||
Dividends from affiliated money market funds | 440,670 | |||
Interest | 8,692 | |||
Total investment income | 138,002,821 | |||
Expenses: | ||||
Advisory fees | 53,033,951 | |||
Administrative services fees | 667,857 | |||
Custodian fees | 1,809,165 | |||
Distribution fees: | ||||
Class A | 5,892,691 | |||
Class B | 414,392 | |||
Class C | 1,391,900 | |||
Class R | 479,155 | |||
Transfer agent fees — A, B, C, R and Y | 8,202,650 | |||
Transfer agent fees — R5 | 1,177,610 | |||
Transfer agent fees — R6 | 10,935 | |||
Trustees’ and officers’ fees and benefits | 240,965 | |||
Other | 1,054,948 | |||
Total expenses | 74,376,219 | |||
Less: Fees waived and expense offset arrangement(s) | (775,684 | ) | ||
Net expenses | 73,600,535 | |||
Net investment income | 64,402,286 | |||
Realized and unrealized gain (loss) from: | ||||
Net realized gain (loss) from: | ||||
Investment securities | 128,596,113 | |||
Foreign currencies | (819,597 | ) | ||
| 127,776,516 | ||||
Change in net unrealized appreciation of: | ||||
Investment securities | 996,188,355 | |||
Foreign currencies | 197,021 | |||
| 996,385,376 | ||||
Net realized and unrealized gain | 1,124,161,892 | |||
Net increase in net assets resulting from operations | $ | 1,188,564,178 | ||
See accompanying Notes to Financial Statements which are an integral part of the financial statements.
12 Invesco International Growth Fund
Statement of Changes in Net Assets
For the years ended October 31, 2013 and 2012
| 2013 | 2012 | |||||||
Operations: |
| |||||||
Net investment income | $ | 64,402,286 | $ | 56,582,481 | ||||
Net realized gain | 127,776,516 | 65,564,918 | ||||||
Change in net unrealized appreciation | 996,385,376 | 237,733,804 | ||||||
Net increase in net assets resulting from operations | 1,188,564,178 | 359,881,203 | ||||||
Distributions to shareholders from net investment income: | ||||||||
Class A | (21,975,533 | ) | (24,794,919 | ) | ||||
Class B | (188,836 | ) | (297,285 | ) | ||||
Class C | (568,367 | ) | (754,132 | ) | ||||
Class R | (724,598 | ) | (1,093,679 | ) | ||||
Class Y | (18,141,196 | ) | (11,922,825 | ) | ||||
Class R5 | (17,685,492 | ) | (24,768,329 | ) | ||||
Class R6 | (3,042,814 | ) | — | |||||
Total distributions from net investment income | (62,326,836 | ) | (63,631,169 | ) | ||||
Share transactions-net: | ||||||||
Class A | 109,823,580 | (42,994,301 | ) | |||||
Class B | (13,117,436 | ) | (15,485,476 | ) | ||||
Class C | (3,624,211 | ) | (19,800,385 | ) | ||||
Class R | (856,318 | ) | (27,645,778 | ) | ||||
Class Y | 397,523,737 | 629,419,616 | ||||||
Class R5 | 330,067,322 | (245,281,401 | ) | |||||
Class R6 | 26,805,828 | 229,878,780 | ||||||
Net increase in net assets resulting from share transactions | 846,622,502 | 508,091,055 | ||||||
Net increase in net assets | 1,972,859,844 | 804,341,089 | ||||||
Net assets: | ||||||||
Beginning of year | 5,375,959,687 | 4,571,618,598 | ||||||
End of year (includes undistributed net investment income of $58,778,653 and $57,403,616, respectively) | $ | 7,348,819,531 | $ | 5,375,959,687 | ||||
Notes to Financial Statements
October 31, 2013
NOTE 1—Significant Accounting Policies
Invesco International Growth Fund (the “Fund”) is a series portfolio of AIM International Mutual Funds (Invesco International Mutual Funds) (the “Trust”). The Trust is a Delaware statutory trust registered under the Investment Company Act of 1940, as amended (the “1940 Act”), as an open-end series management investment company consisting of eight separate portfolios, each authorized to issue an unlimited number of shares of beneficial interest. The assets, liabilities and operations of each portfolio are accounted for separately. Information presented in these financial statements pertains only to the Fund. Matters affecting each portfolio or class will be voted on exclusively by the shareholders of such portfolio or class.
The Fund’s investment objective is long-term growth of capital.
The Fund currently consists of seven different classes of shares: Class A, Class B, Class C, Class R, Class Y, Class R5 and Class R6. Class A shares are sold with a front-end sales charge unless certain waiver criteria are met and under certain circumstances load waived shares may be subject to contingent deferred sales charges (“CDSC”). Class C shares are sold with a CDSC. Class R, Class Y, Class R5 and Class R6 shares are sold at net asset value. Effective November 30, 2010, new or additional investments in Class B shares are no longer permitted. Existing shareholders of Class B shares may continue to reinvest dividends and capital gains distributions in Class B shares until they convert to Class A shares. Also, shareholders in Class B shares will be able to exchange those shares for Class B shares of other Invesco Funds offering such shares until they convert to Class A shares. Generally, Class B shares will automatically convert to Class A shares on or about the month-end, which is at least eight years after the date of purchase. Redemption of Class B shares prior to the conversion date will be subject to a CDSC.
The following is a summary of the significant accounting policies followed by the Fund in the preparation of its financial statements.
| A. | Security Valuations — Securities, including restricted securities, are valued according to the following policy. |
A security listed or traded on an exchange (except convertible bonds) is valued at its last sales price or official closing price as of the close of the customary trading session on the exchange where the security is principally traded, or lacking any sales or official closing price on a particular
13 Invesco International Growth Fund
day, the security may be valued at the closing bid price on that day. Securities traded in the over-the-counter market are valued based on prices furnished by independent pricing services or market makers. When such securities are valued by an independent pricing service they may be considered fair valued. Futures contracts are valued at the final settlement price set by an exchange on which they are principally traded. Listed options are valued at the mean between the last bid and ask prices from the exchange on which they are principally traded. Options not listed on an exchange are valued by an independent source at the mean between the last bid and ask prices. For purposes of determining net asset value per share, futures and option contracts generally are valued 15 minutes after the close of the customary trading session of the New York Stock Exchange (“NYSE”).
Investments in open-end and closed-end registered investment companies that do not trade on an exchange are valued at the end of day net asset value per share. Investments in open-end and closed-end registered investment companies that trade on an exchange are valued at the last sales price or official closing price as of the close of the customary trading session on the exchange where the security is principally traded.
Debt obligations (including convertible bonds) and unlisted equities are fair valued using an evaluated quote provided by an independent pricing service. Evaluated quotes provided by the pricing service may be determined without exclusive reliance on quoted prices, and may reflect appropriate factors such as institution-size trading in similar groups of securities, developments related to specific securities, dividend rate (for unlisted equities), yield (for debt obligations), quality, type of issue, coupon rate (for debt obligations), maturity (for debt obligations), individual trading characteristics and other market data. Debt obligations are subject to interest rate and credit risks. In addition, all debt obligations involve some risk of default with respect to interest and/or principal payments.
Foreign securities’ (including foreign exchange contracts) prices are converted into U.S. dollar amounts using the applicable exchange rates as of the close of the NYSE. If market quotations are available and reliable for foreign exchange-traded equity securities, the securities will be valued at the market quotations. Because trading hours for certain foreign securities end before the close of the NYSE, closing market quotations may become unreliable. If between the time trading ends on a particular security and the close of the customary trading session on the NYSE, events occur that the Adviser determines are significant and make the closing price unreliable, the Fund may fair value the security. If the event is likely to have affected the closing price of the security, the security will be valued at fair value in good faith using procedures approved by the Board of Trustees. Adjustments to closing prices to reflect fair value may also be based on a screening process of an independent pricing service to indicate the degree of certainty, based on historical data, that the closing price in the principal market where a foreign security trades is not the current value as of the close of the NYSE. Foreign securities’ prices meeting the approved degree of certainty that the price is not reflective of current value will be priced at the indication of fair value from the independent pricing service. Multiple factors may be considered by the independent pricing service in determining adjustments to reflect fair value and may include information relating to sector indices, American Depositary Receipts and domestic and foreign index futures. Foreign securities may have additional risks including exchange rate changes, potential for sharply devalued currencies and high inflation, political and economic upheaval, the relative lack of issuer information, relatively low market liquidity and the potential lack of strict financial and accounting controls and standards.
Securities for which market prices are not provided by any of the above methods may be valued based upon quotes furnished by independent sources. The last bid price may be used to value equity securities. The mean between the last bid and asked prices is used to value debt obligations, including corporate loans.
Securities for which market quotations are not readily available or became unreliable are valued at fair value as determined in good faith by or under the supervision of the Trust’s officers following procedures approved by the Board of Trustees. Issuer specific events, market trends, bid/ask quotes of brokers and information providers and other market data may be reviewed in the course of making a good faith determination of a security’s fair value.
Valuations change in response to many factors including the historical and prospective earnings of the issuer, the value of the issuer’s assets, general economic conditions, interest rates, investor perceptions and market liquidity. Because of the inherent uncertainties of valuation, the values reflected in the financial statements may materially differ from the value received upon actual sale of those investments.
| B. | Securities Transactions and Investment Income — Securities transactions are accounted for on a trade date basis. Realized gains or losses on sales are computed on the basis of specific identification of the securities sold. Interest income is recorded on the accrual basis from settlement date. Dividend income (net of withholding tax, if any) is recorded on the ex-dividend date. |
The Fund may periodically participate in litigation related to Fund investments. As such, the Fund may receive proceeds from litigation settlements. Any proceeds received are included in the Statement of Operations as realized gain (loss) for investments no longer held and as unrealized gain (loss) for investments still held.
Brokerage commissions and mark ups are considered transaction costs and are recorded as an increase to the cost basis of securities purchased and/or a reduction of proceeds on a sale of securities. Such transaction costs are included in the determination of net realized and unrealized gain (loss) from investment securities reported in the Statement of Operations and the Statement of Changes in Net Assets and the net realized and unrealized gains (losses) on securities per share in the Financial Highlights. Transaction costs are included in the calculation of the Fund’s net asset value and, accordingly, they reduce the Fund’s total returns. These transaction costs are not considered operating expenses and are not reflected in net investment income reported in the Statement of Operations and Statement of Changes in Net Assets, or the net investment income per share and ratios of expenses and net investment income reported in the Financial Highlights, nor are they limited by any expense limitation arrangements between the Fund and the investment adviser.
The Fund allocates income and realized and unrealized capital gains and losses to a class based on the relative net assets of each class.
| C. | Country Determination — For the purposes of making investment selection decisions and presentation in the Schedule of Investments, the investment adviser may determine the country in which an issuer is located and/or credit risk exposure based on various factors. These factors include the laws of the country under which the issuer is organized, where the issuer maintains a principal office, the country in which the issuer derives 50% or more of its total revenues and the country that has the primary market for the issuer’s securities, as well as other criteria. Among the other criteria that may be evaluated for making this determination are the country in which the issuer maintains 50% or more of its assets, the type of security, financial guarantees and enhancements, the nature of the collateral and the sponsor organization. Country of issuer and/or credit risk exposure has been determined to be the United States of America, unless otherwise noted. |
| D. | Distributions — Distributions from income and net realized capital gain, if any, are generally declared and paid annually and recorded on the ex-dividend date. The Fund may elect to treat a portion of the proceeds from redemptions as distributions for federal income tax purposes. |
14 Invesco International Growth Fund
| E. | Federal Income Taxes — The Fund intends to comply with the requirements of Subchapter M of the Internal Revenue Code of 1986, as amended (the “Internal Revenue Code”), necessary to qualify as a regulated investment company and to distribute substantially all of the Fund’s taxable earnings to shareholders. As such, the Fund will not be subject to federal income taxes on otherwise taxable income (including net realized capital gain) that is distributed to shareholders. Therefore, no provision for federal income taxes is recorded in the financial statements. |
The Fund files tax returns in the U.S. Federal jurisdiction and certain other jurisdictions. Generally, the Fund is subject to examinations by such taxing authorities for up to three years after the filing of the return for the tax period.
| F. | Expenses — Fees provided for under the Rule 12b-1 plan of a particular class of the Fund are charged to the operations of such class. Transfer agency fees and expenses and other shareholder recordkeeping fees and expenses attributable to Class R5 and Class R6 are allocated to each share class based on relative net assets. Sub-accounting fees attributable to Class R5 are charged to the operations of the class. Transfer agency fees and expenses and other shareholder recordkeeping fees and expenses relating to all other classes are allocated among those classes based on relative net assets. All other expenses are allocated among the classes based on relative net assets. |
| G. | Accounting Estimates — The preparation of financial statements in conformity with accounting principles generally accepted in the United States of America (“GAAP”) requires management to make estimates and assumptions that affect the reported amounts of assets and liabilities at the date of the financial statements and the reported amounts of revenues and expenses during the reporting period including estimates and assumptions related to taxation. Actual results could differ from those estimates by a significant amount. In addition, the Fund monitors for material events or transactions that may occur or become known after the period-end date and before the date the financial statements are released to print. |
| H. | Indemnifications — Under the Trust’s organizational documents, each Trustee, officer, employee or other agent of the Trust is indemnified against certain liabilities that may arise out of the performance of their duties to the Fund. Additionally, in the normal course of business, the Fund enters into contracts, including the Fund’s servicing agreements, that contain a variety of indemnification clauses. The Fund’s maximum exposure under these arrangements is unknown as this would involve future claims that may be made against the Fund that have not yet occurred. The risk of material loss as a result of such indemnification claims is considered remote. |
| I. | Foreign Currency Translations — Foreign currency is valued at the close of the NYSE based on quotations posted by banks and major currency dealers. Portfolio securities and other assets and liabilities denominated in foreign currencies are translated into U.S. dollar amounts at date of valuation. Purchases and sales of portfolio securities (net of foreign taxes withheld on disposition) and income items denominated in foreign currencies are translated into U.S. dollar amounts on the respective dates of such transactions. The Fund does not separately account for the portion of the results of operations resulting from changes in foreign exchange rates on investments and the fluctuations arising from changes in market prices of securities held. The combined results of changes in foreign exchange rates and the fluctuation of market prices on investments (net of estimated foreign tax withholding) are included with the net realized and unrealized gain or loss from investments in the Statement of Operations. Reported net realized foreign currency gains or losses arise from (1) sales of foreign currencies, (2) currency gains or losses realized between the trade and settlement dates on securities transactions, and (3) the difference between the amounts of dividends, interest, and foreign withholding taxes recorded on the Fund’s books and the U.S. dollar equivalent of the amounts actually received or paid. Net unrealized foreign currency gains and losses arise from changes in the fair values of assets and liabilities, other than investments in securities at fiscal period end, resulting from changes in exchange rates. |
The Fund may invest in foreign securities which may be subject to foreign taxes on income, gains on investments or currency repatriation, a portion of which may be recoverable.
| J. | Foreign Currency Contracts — The Fund may enter into foreign currency contracts to manage or minimize currency or exchange rate risk. The Fund may also enter into foreign currency contracts for the purchase or sale of a security denominated in a foreign currency in order to “lock in” the U.S. dollar price of that security. A foreign currency contract is an obligation to purchase or sell a specific currency for an agreed-upon price at a future date. The use of foreign currency contracts does not eliminate fluctuations in the price of the underlying securities the Fund owns or intends to acquire but establishes a rate of exchange in advance. Fluctuations in the value of these contracts are measured by the difference in the contract date and reporting date exchange rates and are recorded as unrealized appreciation (depreciation) until the contracts are closed. When the contracts are closed, realized gains (losses) are recorded. Realized and unrealized gains (losses) on the contracts are included in the Statement of Operations. The primary risks associated with foreign currency contracts include failure of the counterparty to meet the terms of the contract and the value of the foreign currency changing unfavorably. These risks may be in excess of the amounts reflected in the Statement of Assets and Liabilities. |
15 Invesco International Growth Fund
NOTE 2—Advisory Fees and Other Fees Paid to Affiliates
The Trust has entered into a master investment advisory agreement with Invesco Advisers, Inc. (the “Adviser” or “Invesco”). Under the terms of the investment advisory agreement, the Fund pays an advisory fee to the Adviser based on the annual rate of the Fund’s average daily net assets as follows:
| Average Daily Net Assets | Rate | |||||
First $250 million | 0 | .935% | ||||
Next $250 million | 0 | .91% | ||||
Next $500 million | 0 | .885% | ||||
Next $1.5 billion | 0 | .86% | ||||
Next $2.5 billion | 0 | .835% | ||||
Next $2.5 billion | 0 | .81% | ||||
Next $2.5 billion | 0 | .785% | ||||
Over $10 billion | 0 | .76% | ||||
Under the terms of a master sub-advisory agreement between the Adviser and each of Invesco Asset Management Deutschland GmbH, Invesco Asset Management Limited, Invesco Asset Management (Japan) Limited, Invesco Australia Limited, Invesco Hong Kong Limited, Invesco Senior Secured Management, Inc. and Invesco Canada Ltd. (collectively, the “Affiliated Sub-Advisers”) the Adviser, not the Fund, may pay 40% of the fees paid to the Adviser to any such Affiliated Sub-Adviser(s) that provide(s) discretionary investment management services to the Fund based on the percentage of assets allocated to such Sub-Adviser(s).
Effective July 1, 2013, the Adviser has contractually agreed, through at least June 30, 2014, to waive advisory fees and/or reimburse expenses of all shares to the extent necessary to limit total annual fund operating expenses after fee waiver and/or expense reimbursement (excluding certain items discussed below) of Class A, Class B, Class C, Class R, Class Y, Class R5 and Class R6 shares to 2.25%, 3.00%, 3.00%, 2.50%, 2.00%, 2.00% and 2.00%, respectively, of average daily net assets. Prior to July 1, 2013, the Adviser had contractually agreed to waive advisory fees and/or reimburse expenses of all shares to the extent necessary to limit total annual fund operating expenses after fee waiver and/or expense reimbursement (excluding certain items discussed below) of Class A, Class B, Class C, Class R, Class Y, Class R5 and Class R6 shares to 1.40%, 2.15%, 2.15%, 1.65%, 1.15%, 1.15% and 1.15%, respectively, of average daily net assets. In determining the Adviser’s obligation to waive advisory fees and/or reimburse expenses, the following expenses are not taken into account, and could cause the total annual fund operating expenses after fee waiver and/or expense reimbursement to exceed the numbers reflected above: (1) interest; (2) taxes; (3) dividend expense on short sales; (4) extraordinary or non-routine items, including litigation expenses; and (5) expenses that the Fund has incurred but did not actually pay because of an expense offset arrangement. Unless Invesco continues the fee waiver agreement, it will terminate on June 30, 2014. The fee waiver agreement cannot be terminated during its term. The Adviser did not waive fees and/or reimburse expenses under this expense limitation.
Further, the Adviser has contractually agreed, through June 30, 2014, to waive the advisory fee payable by the Fund in an amount equal to 100% of the net advisory fees the Adviser receives from the affiliated money market funds on investments by the Fund of uninvested cash in such affiliated money market funds.
For the year ended October 31, 2013, the Adviser waived advisory fees of $767,547.
The Trust has entered into a master administrative services agreement with Invesco pursuant to which the Fund has agreed to pay Invesco for certain administrative costs incurred in providing accounting services to the Fund. For the year ended October 31, 2013, expenses incurred under the agreement are shown in the Statement of Operations as Administrative services fees.
The Trust has entered into a transfer agency and service agreement with Invesco Investment Services, Inc. (“IIS”) pursuant to which the Fund has agreed to pay IIS a fee for providing transfer agency and shareholder services to the Fund and reimburse IIS for certain expenses incurred by IIS in the course of providing such services. IIS may make payments to intermediaries that provide omnibus account services, sub-accounting services and/or networking services. All fees payable by IIS to intermediaries that provide omnibus account services or sub-accounting are charged back to the Fund, subject to certain limitations approved by the Trust’s Board of Trustees. For the year ended October 31, 2013, expenses incurred under the agreement are shown in the Statement of Operations as Transfer agent fees.
The Trust has entered into master distribution agreements with Invesco Distributors, Inc. (“IDI”) to serve as the distributor for the Class A, Class B, Class C, Class R, Class Y, Class R5 and Class R6 shares of the Fund. The Trust has adopted plans pursuant to Rule 12b-1 under the 1940 Act with respect to the Fund’s Class A, Class B, Class C and Class R shares (collectively, the “Plans”). The Fund, pursuant to the Plans, pays IDI compensation at the annual rate of 0.25% of the Fund’s average daily net assets of Class A shares, 1.00% of the average daily net assets of Class B and Class C shares and 0.50% of the average daily net assets of Class R shares. Of the Plan payments, up to 0.25% of the average daily net assets of each class of shares may be paid to furnish continuing personal shareholder services to customers who purchase and own shares of such classes. Any amounts not paid as a service fee under the Plans would constitute an asset-based sales charge. Rules of the Financial Industry Regulatory Authority (“FINRA”) impose a cap on the total sales charges, including asset-based sales charges, that may be paid by any class of shares of the Fund. For the year ended October 31, 2013, expenses incurred under the Plans are shown in the Statement of Operations as Distribution fees.
Front-end sales commissions and CDSC (collectively, the “sales charges”) are not recorded as expenses of the Fund. Front-end sales commissions are deducted from proceeds from the sales of Fund shares prior to investment in Class A shares of the Fund. CDSC are deducted from redemption proceeds prior to remittance to the shareholder. During the year ended October 31, 2013, IDI advised the Fund that IDI retained $613,989 in front-end sales commissions from the sale of Class A shares and $3,943, $37,966 and $5,890 from Class A, Class B and Class C shares, respectively, for CDSC imposed on redemptions by shareholders.
Certain officers and trustees of the Trust are officers and directors of the Adviser, IIS and/or IDI.
16 Invesco International Growth Fund
NOTE 3—Additional Valuation Information
GAAP defines fair value as the price that would be received to sell an asset or paid to transfer a liability in an orderly transaction between market participants at the measurement date, under current market conditions. GAAP establishes a hierarchy that prioritizes the inputs to valuation methods, giving the highest priority to readily available unadjusted quoted prices in an active market for identical assets (Level 1) and the lowest priority to significant unobservable inputs (Level 3), generally when market prices are not readily available or are unreliable. Based on the valuation inputs, the securities or other investments are tiered into one of three levels. Changes in valuation methods may result in transfers in or out of an investment’s assigned level:
| Level 1 — | Prices are determined using quoted prices in an active market for identical assets. |
| Level 2 — | Prices are determined using other significant observable inputs. Observable inputs are inputs that other market participants may use in pricing a security. These may include quoted prices for similar securities, interest rates, prepayment speeds, credit risk, yield curves, loss severities, default rates, discount rates, volatilities and others. |
| Level 3 — | Prices are determined using significant unobservable inputs. In situations where quoted prices or observable inputs are unavailable (for example, when there is little or no market activity for an investment at the end of the period), unobservable inputs may be used. Unobservable inputs reflect the Fund’s own assumptions about the factors market participants would use in determining fair value of the securities or instruments and would be based on the best available information. |
The following is a summary of the tiered valuation input levels, as of October 31, 2013. The level assigned to the securities valuations may not be an indication of the risk or liquidity associated with investing in those securities. Because of the inherent uncertainties of valuation, the values reflected in the financial statements may materially differ from the value received upon actual sale of those investments.
During the year ended October 31, 2013, there were transfers from Level 1 to Level 2 of $406,320,165 and from Level 2 to Level 1 of $1,401,827,806, due to foreign fair value adjustments.
| Level 1 | Level 2 | Level 3 | Total | |||||||||||||
Australia | $ | 201,241,637 | $ | — | $ | — | $ | 201,241,637 | ||||||||
Belgium | — | 113,514,300 | — | 113,514,300 | ||||||||||||
Brazil | 233,618,455 | — | — | 233,618,455 | ||||||||||||
Canada | 533,776,900 | — | — | 533,776,900 | ||||||||||||
China | 277,934,120 | 162,799,876 | — | 440,733,996 | ||||||||||||
Denmark | 52,066,013 | 65,207,519 | — | 117,273,532 | ||||||||||||
France | — | 322,894,548 | — | 322,894,548 | ||||||||||||
Germany | 675,430,445 | — | — | 675,430,445 | ||||||||||||
Hong Kong | 105,030,103 | 103,526,477 | — | 208,556,580 | ||||||||||||
Ireland | — | 89,368,240 | — | 89,368,240 | ||||||||||||
Israel | 103,375,579 | — | — | 103,375,579 | ||||||||||||
Japan | — | 400,302,619 | — | 400,302,619 | ||||||||||||
Mexico | 169,394,124 | — | — | 169,394,124 | ||||||||||||
Netherlands | 84,921,190 | — | — | 84,921,190 | ||||||||||||
Singapore | 100,039,000 | 80,570,046 | — | 180,609,046 | ||||||||||||
South Korea | 121,768,667 | 115,727,655 | — | 237,496,322 | ||||||||||||
Spain | 116,688,969 | — | — | 116,688,969 | �� | |||||||||||
Sweden | 203,357,144 | 59,531,478 | — | 262,888,622 | ||||||||||||
Switzerland | 191,144,469 | 467,042,248 | — | 658,186,717 | ||||||||||||
Taiwan | — | 94,418,890 | — | 94,418,890 | ||||||||||||
Turkey | — | 71,755,962 | — | 71,755,962 | ||||||||||||
United Kingdom | 529,047,668 | 851,096,414 | — | 1,380,144,082 | ||||||||||||
United States | 637,266,334 | — | — | 637,266,334 | ||||||||||||
Total Investments | $ | 4,336,100,817 | $ | 2,997,756,272 | $ | — | $ | 7,333,857,089 | ||||||||
NOTE 4—Expense Offset Arrangement(s)
The expense offset arrangement is comprised of transfer agency credits which result from balances in demand deposit accounts used by the transfer agent for clearing shareholder transactions. For the year ended October 31, 2013, the Fund received credits from this arrangement, which resulted in the reduction of the Fund’s total expenses of $8,137.
17 Invesco International Growth Fund
NOTE 5—Trustees’ and Officers’ Fees and Benefits
Trustees’ and Officers’ Fees and Benefits include amounts accrued by the Fund to pay remuneration to certain Trustees and Officers of the Fund. Trustees have the option to defer compensation payable by the Fund, and Trustees’ and Officers’ Fees and Benefits also include amounts accrued by the Fund to fund such deferred compensation amounts. Those Trustees who defer compensation have the option to select various Invesco Funds in which their deferral accounts shall be deemed to be invested. Finally, certain current Trustees are eligible to participate in a retirement plan that provides for benefits to be paid upon retirement to Trustees over a period of time based on the number of years of service. The Fund may have certain former Trustees who also participate in a retirement plan and receive benefits under such plan. Trustees’ and Officers’ Fees and Benefits include amounts accrued by the Fund to fund such retirement benefits. Obligations under the deferred compensation and retirement plans represent unsecured claims against the general assets of the Fund.
NOTE 6—Cash Balances
The Fund is permitted to temporarily carry a negative or overdrawn balance in its account with State Street Bank and Trust Company, the custodian bank. Such balances, if any at period end, are shown in the Statement of Assets and Liabilities under the payable caption Amount due custodian. To compensate the custodian bank for such overdrafts, the overdrawn Fund may either (1) leave funds as a compensating balance in the account so the custodian bank can be compensated by earning the additional interest; or (2) compensate by paying the custodian bank at a rate agreed upon by the custodian bank and Invesco, not to exceed the contractually agreed upon rate.
NOTE 7—Distributions to Shareholders and Tax Components of Net Assets
Tax Character of Distributions to Shareholders Paid During the Years Ended October 31, 2013 and 2012:
| 2013 | 2012 | |||||||
Ordinary income | $ | 62,326,836 | $ | 63,631,169 | ||||
Tax Components of Net Assets at Period-End:
| 2013 | ||||
Undistributed ordinary income | $ | 89,592,153 | ||
Net unrealized appreciation — investments | 1,960,377,071 | |||
Net unrealized appreciation — other investments | 135,009 | |||
Temporary book/tax differences | (755,581 | ) | ||
Capital loss carryforward | (169,768,428 | ) | ||
Shares of beneficial interest | 5,469,239,307 | |||
Total net assets | $ | 7,348,819,531 | ||
The difference between book-basis and tax-basis unrealized appreciation (depreciation) is due to differences in the timing of recognition of gains and losses on investments for tax and book purposes. The Fund’s net unrealized appreciation difference is attributable primarily to wash sales and the recognition of unrealized gain on passive foreign investment company.
The temporary book/tax differences are a result of timing differences between book and tax recognition of income and/or expenses. The Fund’s temporary book/tax differences are the result of the trustee deferral of compensation and retirement plan benefits.
Capital loss carryforward is calculated and reported as of a specific date. Results of transactions and other activity after that date may affect the amount of capital loss carryforward actually available for the Fund to utilize. Capital losses generated in years beginning after December 22, 2010 can be carried forward for an unlimited period, whereas previous losses expired in 8 tax years. Capital losses with an expiration period may not be used to offset capital gains until all net capital losses without an expiration date have been utilized. Capital loss carryforwards with no expiration date will retain their character as either short-term or long-term capital losses instead of as short-term capital losses as under prior law. The ability to utilize capital loss carryforward in the future may be limited under the Internal Revenue Code and related regulations based on the results of future transactions.
The Fund utilized $127,841,018 of capital loss carryforward in the current period to offset net realized capital gain for federal income tax purposes. The Fund has a capital loss carryforward as of October 31, 2013, which expires as follows:
| Capital Loss Carryforward* | ||||||||||||
| Expiration | Short-Term | Long-Term | Total | |||||||||
October 31, 2017 | $ | 169,768,428 | $ | — | $ | 169,768,428 | ||||||
| * | Capital loss carryforward as of the date listed above is reduced for limitations, if any, to the extent required by the Internal Revenue Code. To the extent that unrealized gains as of May 23, 2011, the date of reorganization of Invesco Van Kampen International Advantage Fund and Invesco Van Kampen International Growth Fund into the Fund, are realized on securities held in each fund at such date of reorganization, the capital loss carryforward may be further limited for up to five years from the date of the reorganization. |
18 Invesco International Growth Fund
NOTE 8—Investment Securities
The aggregate amount of investment securities (other than short-term securities, U.S. Treasury obligations and money market funds, if any) purchased and sold by the Fund during the year ended October 31, 2013 was $1,979,722,717 and $1,213,879,813, respectively. Cost of investments on a tax basis includes the adjustments for financial reporting purposes as of the most recently completed federal income tax reporting period-end.
| Unrealized Appreciation (Depreciation) of Investment Securities on a Tax Basis | ||||
Aggregate unrealized appreciation of investment securities | $ | 2,006,390,657 | ||
Aggregate unrealized (depreciation) of investment securities | (46,013,586 | ) | ||
Net unrealized appreciation of investment securities | $ | 1,960,377,071 | ||
Cost of investments for tax purposes is $5,373,480,018.
NOTE 9—Reclassification of Permanent Differences
Primarily as a result of differing book/tax treatment of foreign currency transactions and passive foreign investment companies, on October 31, 2013, undistributed net investment income was decreased by $700,413 and undistributed net realized gain (loss) was increased by $700,413. This reclassification had no effect on the net assets of the Fund.
NOTE 10—Share Information
| Summary of Share Activity | ||||||||||||||||
| Years ended October 31, | ||||||||||||||||
| 2013(a) | 2012 | |||||||||||||||
| Shares | Amount | Shares | Amount | |||||||||||||
Sold: | ||||||||||||||||
Class A | 19,383,355 | $ | 583,441,582 | 16,612,668 | $ | 444,317,637 | ||||||||||
Class B | 57,203 | 1,594,247 | 71,411 | 1,773,811 | ||||||||||||
Class C | 941,432 | 26,514,706 | 565,753 | 14,000,364 | ||||||||||||
Class R | 1,097,072 | 32,445,830 | 1,103,953 | 29,258,707 | ||||||||||||
Class Y | 25,383,682 | 765,865,426 | 35,037,135 | 918,964,925 | ||||||||||||
Class R5 | 20,803,776 | 634,081,306 | 22,915,486 | 616,373,073 | ||||||||||||
Class R6(b) | 3,109,748 | 95,344,081 | 8,072,691 | 232,732,447 | ||||||||||||
Issued as reinvestment of dividends: | ||||||||||||||||
Class A | 761,301 | 21,575,264 | 884,535 | 22,608,705 | ||||||||||||
Class B | 7,035 | 184,937 | 11,852 | 281,496 | ||||||||||||
Class C | 20,481 | 539,064 | 28,863 | 686,093 | ||||||||||||
Class R | 25,521 | 716,367 | 42,777 | 1,083,548 | ||||||||||||
Class Y | 514,305 | 14,595,975 | 347,894 | 8,899,120 | ||||||||||||
Class R5 | 544,290 | 15,626,551 | 844,709 | 21,844,184 | ||||||||||||
Class R6 | 106,058 | 3,042,814 | — | — | ||||||||||||
Automatic conversion of Class B shares to Class A shares: | ||||||||||||||||
Class A | 235,973 | 7,101,209 | 291,534 | 7,771,380 | ||||||||||||
Class B | (255,211 | ) | (7,101,209 | ) | (314,740 | ) | (7,771,380 | ) | ||||||||
Reacquired:(c) | ||||||||||||||||
Class A | (16,687,815 | ) | (502,294,475 | ) | (19,338,411 | ) | (517,692,023 | ) | ||||||||
Class B | (281,625 | ) | (7,795,411 | ) | (393,138 | ) | (9,769,403 | ) | ||||||||
Class C | (1,107,919 | ) | (30,677,981 | ) | (1,399,533 | ) | (34,486,842 | ) | ||||||||
Class R | (1,150,554 | ) | (34,018,515 | ) | (2,226,283 | ) | (57,988,033 | ) | ||||||||
Class Y | (12,615,179 | ) | (382,937,664 | ) | (11,123,652 | ) | (298,444,429 | ) | ||||||||
Class R5 | (10,518,958 | ) | (319,640,535 | ) | (32,738,845 | ) | (883,498,658 | ) | ||||||||
Class R6 | (2,326,358 | ) | (71,581,067 | ) | (100,063 | ) | (2,853,667 | ) | ||||||||
Net increase in share activity | 28,047,613 | $ | 846,622,502 | 19,196,596 | $ | 508,091,055 | ||||||||||
| (a) | There are entities that are record owners of more than 5% of the outstanding shares of the Fund and in the aggregate own 46% of the outstanding shares of the Fund. IDI has an agreement with these entities to sell Fund shares. The Fund, Invesco and/or Invesco affiliates may make payments to these entities, which are considered to be related to the Fund, for providing services to the Fund, Invesco and/or Invesco affiliates including but not limited to services such as securities brokerage, distribution, third party record keeping and account servicing. The Fund has no knowledge as to whether all or any portion of the shares owned of record by these entities are also owned beneficially. |
| (b) | Commencement date of September 24, 2012. |
| (c) | Net of redemption fees of $21,765 allocated among the classes based on relative net assets of each class for the year ended October 31, 2012. |
19 Invesco International Growth Fund
NOTE 11—Financial Highlights
The following schedule presents financial highlights for a share of the Fund outstanding throughout the periods indicated.
| Net asset value, beginning of period | Net investment income(a) | Net gains (losses) on securities (both realized and unrealized) | Total from investment operations | Dividends from net investment income | Net asset value, end of period(b) | Total return(c) | Net assets, end of period (000’s omitted) | Ratio of expenses to average net assets with fee waivers and/or expenses absorbed | Ratio of expenses to average net assets without fee waivers and/or expenses absorbed | Ratio of net investment income to average net assets | Portfolio turnover(d) | |||||||||||||||||||||||||||||||||||||
Class A | ||||||||||||||||||||||||||||||||||||||||||||||||
Year ended 10/31/13 | $ | 27.96 | $ | 0.26 | $ | 5.37 | $ | 5.63 | $ | (0.29 | ) | $ | 33.30 | 20.31 | % | $ | 2,662,962 | 1.33 | %(e) | 1.34 | %(e) | 0.87 | %(e) | 21 | % | |||||||||||||||||||||||
Year ended 10/31/12 | 26.43 | 0.26 | 1.59 | 1.85 | (0.32 | ) | 27.96 | 7.13 | 2,132,503 | 1.37 | 1.38 | 0.99 | 21 | |||||||||||||||||||||||||||||||||||
Year ended 10/31/11 | 26.99 | 0.36 | (0.65 | ) | (0.29 | ) | (0.27 | ) | 26.43 | (1.10 | ) | 2,056,979 | 1.38 | 1.39 | 1.29 | 25 | ||||||||||||||||||||||||||||||||
Year ended 10/31/10 | 23.41 | 0.21 | 3.66 | 3.87 | (0.29 | ) | 26.99 | 16.68 | 1,958,940 | 1.43 | 1.44 | 0.85 | 25 | |||||||||||||||||||||||||||||||||||
Year ended 10/31/09 | 19.04 | 0.24 | 4.52 | 4.76 | (0.39 | ) | 23.41 | 25.65 | 1,734,895 | 1.49 | 1.51 | 1.24 | 26 | |||||||||||||||||||||||||||||||||||
Class B | ||||||||||||||||||||||||||||||||||||||||||||||||
Year ended 10/31/13 | 25.81 | 0.03 | 4.96 | 4.99 | (0.11 | ) | 30.69 | 19.41 | 38,858 | 2.08 | (e) | 2.09 | (e) | 0.12 | (e) | 21 | ||||||||||||||||||||||||||||||||
Year ended 10/31/12 | 24.41 | 0.06 | 1.47 | 1.53 | (0.13 | ) | 25.81 | 6.31 | 44,873 | 2.12 | 2.13 | 0.24 | 21 | |||||||||||||||||||||||||||||||||||
Year ended 10/31/11 | 24.95 | 0.14 | (0.60 | ) | (0.46 | ) | (0.08 | ) | 24.41 | (1.85 | ) | 57,683 | 2.13 | 2.14 | 0.54 | 25 | ||||||||||||||||||||||||||||||||
Year ended 10/31/10 | 21.68 | 0.02 | 3.40 | 3.42 | (0.15 | ) | 24.95 | 15.83 | 51,950 | 2.18 | 2.19 | 0.10 | 25 | |||||||||||||||||||||||||||||||||||
Year ended 10/31/09 | 17.52 | 0.09 | 4.20 | 4.29 | (0.13 | ) | 21.68 | 24.72 | 61,649 | 2.24 | 2.26 | 0.49 | 26 | |||||||||||||||||||||||||||||||||||
Class C | ||||||||||||||||||||||||||||||||||||||||||||||||
Year ended 10/31/13 | 25.83 | 0.03 | 4.97 | 5.00 | (0.11 | ) | 30.72 | 19.44 | 154,313 | 2.08 | (e) | 2.09 | (e) | 0.12 | (e) | 21 | ||||||||||||||||||||||||||||||||
Year ended 10/31/12 | 24.43 | 0.06 | 1.47 | 1.53 | (0.13 | ) | 25.83 | 6.31 | 133,529 | 2.12 | 2.13 | 0.24 | 21 | |||||||||||||||||||||||||||||||||||
Year ended 10/31/11 | 24.97 | 0.14 | (0.60 | ) | (0.46 | ) | (0.08 | ) | 24.43 | (1.85 | ) | 145,944 | 2.13 | 2.14 | 0.54 | 25 | ||||||||||||||||||||||||||||||||
Year ended 10/31/10 | 21.70 | 0.02 | 3.40 | 3.42 | (0.15 | ) | 24.97 | 15.81 | 142,898 | 2.18 | 2.19 | 0.10 | 25 | |||||||||||||||||||||||||||||||||||
Year ended 10/31/09 | 17.53 | 0.09 | 4.21 | 4.30 | (0.13 | ) | 21.70 | 24.76 | 139,000 | 2.24 | 2.26 | 0.49 | 26 | |||||||||||||||||||||||||||||||||||
Class R | ||||||||||||||||||||||||||||||||||||||||||||||||
Year ended 10/31/13 | 27.64 | 0.19 | 5.31 | 5.50 | (0.23 | ) | 32.91 | 20.03 | 104,712 | 1.58 | (e) | 1.59 | (e) | 0.62 | (e) | 21 | ||||||||||||||||||||||||||||||||
Year ended 10/31/12 | 26.13 | 0.20 | 1.57 | 1.77 | (0.26 | ) | 27.64 | 6.85 | 88,726 | 1.62 | 1.63 | 0.74 | 21 | |||||||||||||||||||||||||||||||||||
Year ended 10/31/11 | 26.70 | 0.28 | (0.64 | ) | (0.36 | ) | (0.21 | ) | 26.13 | (1.38 | ) | 112,091 | 1.63 | 1.64 | 1.04 | 25 | ||||||||||||||||||||||||||||||||
Year ended 10/31/10 | 23.18 | 0.15 | 3.62 | 3.77 | (0.25 | ) | 26.70 | 16.36 | 115,237 | 1.68 | 1.69 | 0.60 | 25 | |||||||||||||||||||||||||||||||||||
Year ended 10/31/09 | 18.80 | 0.20 | 4.49 | 4.69 | (0.31 | ) | 23.18 | 25.44 | 63,544 | 1.74 | 1.76 | 0.99 | 26 | |||||||||||||||||||||||||||||||||||
Class Y | ||||||||||||||||||||||||||||||||||||||||||||||||
Year ended 10/31/13 | 28.05 | 0.34 | 5.37 | 5.71 | (0.34 | ) | 33.42 | 20.59 | 2,188,960 | 1.08 | (e) | 1.09 | (e) | 1.12 | (e) | 21 | ||||||||||||||||||||||||||||||||
Year ended 10/31/12 | 26.53 | 0.33 | 1.59 | 1.92 | (0.40 | ) | 28.05 | 7.39 | 1,464,295 | 1.12 | 1.13 | 1.24 | 21 | |||||||||||||||||||||||||||||||||||
Year ended 10/31/11 | 27.08 | 0.42 | (0.64 | ) | (0.22 | ) | (0.33 | ) | 26.53 | (0.83 | ) | 741,428 | 1.13 | 1.14 | 1.54 | 25 | ||||||||||||||||||||||||||||||||
Year ended 10/31/10 | 23.48 | 0.27 | 3.67 | 3.94 | (0.34 | ) | 27.08 | 16.94 | 173,313 | 1.18 | 1.19 | 1.10 | 25 | |||||||||||||||||||||||||||||||||||
Year ended 10/31/09 | 19.04 | 0.32 | 4.52 | 4.84 | (0.40 | ) | 23.48 | 26.05 | 62,343 | 1.24 | 1.26 | 1.49 | 26 | |||||||||||||||||||||||||||||||||||
Class R5 | ||||||||||||||||||||||||||||||||||||||||||||||||
Year ended 10/31/13 | 28.39 | 0.38 | 5.44 | 5.82 | (0.37 | ) | 33.84 | 20.74 | 1,899,117 | 0.97 | (e) | 0.98 | (e) | 1.23 | (e) | 21 | ||||||||||||||||||||||||||||||||
Year ended 10/31/12 | 26.86 | 0.37 | 1.61 | 1.98 | (0.45 | ) | 28.39 | 7.52 | 1,285,743 | 0.99 | 1.00 | 1.37 | 21 | |||||||||||||||||||||||||||||||||||
Year ended 10/31/11 | 27.41 | 0.48 | (0.66 | ) | (0.18 | ) | (0.37 | ) | 26.86 | (0.68 | ) | 1,457,494 | 0.97 | 0.98 | 1.70 | 25 | ||||||||||||||||||||||||||||||||
Year ended 10/31/10 | 23.77 | 0.31 | 3.72 | 4.03 | (0.39 | ) | 27.41 | 17.12 | 1,228,916 | 1.02 | 1.03 | 1.26 | 25 | |||||||||||||||||||||||||||||||||||
Year ended 10/31/09 | 19.36 | 0.35 | 4.58 | 4.93 | (0.52 | ) | 23.77 | 26.32 | 917,297 | 1.01 | 1.03 | 1.72 | 26 | |||||||||||||||||||||||||||||||||||
Class R6 | ||||||||||||||||||||||||||||||||||||||||||||||||
Year ended 10/31/13 | 28.38 | 0.40 | 5.45 | 5.85 | (0.39 | ) | 33.84 | 20.85 | 299,898 | 0.90 | (e) | 0.91 | (e) | 1.30 | (e) | 21 | ||||||||||||||||||||||||||||||||
Year ended 10/31/12(f) | 28.83 | 0.04 | (0.49 | ) | (0.45 | ) | — | 28.38 | (1.56 | ) | 226,291 | 0.92 | (g) | 0.93 | (g) | 1.44 | (g) | 21 | ||||||||||||||||||||||||||||||
| (a) | Calculated using average shares outstanding. |
| (b) | Includes redemption fees added to shares of beneficial interest for Class A, Class B, Class C, Class R, Class Y, and Class R5 shares, which were less than $0.005 per share for the fiscal years ended October 31, 2012 and prior. |
| (c) | Includes adjustments in accordance with accounting principles generally accepted in the United States of America and as such, the net asset value for financial reporting purposes and the returns based upon those net asset values may differ from the net asset value and returns for shareholder transactions. Does not include sales charges and is not annualized for periods less than one year, if applicable. |
| (d) | Portfolio turnover is calculated at the fund level and is not annualized for periods less than one year, if applicable. For the period ended October 31, 2011, the portfolio turnover calculation excludes the value of securities purchased of $690,712,747 and sold of $131,009,072 in the effort to realign the Fund’s portfolio holdings after the reorganization of Invesco Van Kampen International Growth Advantage Fund and Invesco Van Kampen International Growth Fund into the Fund. |
| (e) | Ratios are based on average daily net assets (000’s omitted) of $2,357,077, $41,439, $139,190, $95,831, $1,831,349, $1,543,206 and $253,816 for Class A, Class B, Class C, Class R, Class Y, Class R5 and Class R6 shares, respectively. |
| (f) | Commencement date of September 24, 2012 for Class R6 shares. |
| (g) | Annualized. |
20 Invesco International Growth Fund
Report of Independent Registered Public Accounting Firm
To the Board of Trustees of AIM International Mutual Funds (Invesco International Mutual Funds)
and Shareholders of Invesco International Growth Fund:
In our opinion, the accompanying statement of assets and liabilities, including the schedule of investments, and the related statements of operations and of changes in net assets and the financial highlights present fairly, in all material respects, the financial position of Invesco International Growth Fund (one of the funds constituting AIM International Mutual Funds (Invesco International Mutual Funds), hereafter referred to as the “Fund”) at October 31, 2013, the results of its operations for the year then ended, the changes in its net assets for each of the two years in the period then ended and the financial highlights for each of the five years in the period then ended, in conformity with accounting principles generally accepted in the United States of America. These financial statements and financial highlights (hereafter referred to as “financial statements”) are the responsibility of the Fund’s management; our responsibility is to express an opinion on these financial statements based on our audits. We conducted our audits of these financial statements in accordance with the standards of the Public Company Accounting Oversight Board (United States). Those standards require that we plan and perform the audit to obtain reasonable assurance about whether the financial statements are free of material misstatement. An audit includes examining, on a test basis, evidence supporting the amounts and disclosures in the financial statements, assessing the accounting principles used and significant estimates made by management, and evaluating the overall financial statement presentation. We believe that our audits, which included confirmation of securities at October 31, 2013 by correspondence with the custodian, provide a reasonable basis for our opinion.
PRICEWATERHOUSECOOPERS LLP
December 23, 2013
Houston, Texas
21 Invesco International Growth Fund
Calculating your ongoing Fund expenses
Example
As a shareholder of the Fund, you incur two types of costs: (1) transaction costs, which may include sales charges (loads) on purchase payments or contingent deferred sales charges on redemptions, if any; and (2) ongoing costs, including management fees, distribution and/or service (12b-1) fees, and other Fund expenses. This example is intended to help you understand your ongoing costs (in dollars) of investing in the Fund and to compare these costs with ongoing costs of investing in other mutual funds. The example is based on an investment of $1,000 invested at the beginning of the period and held for the entire period May 1, 2013 through October 31, 2013.
Actual expenses
The table below provides information about actual account values and actual expenses. You may use the information in this table, together with the amount you invested, to estimate the expenses that you paid over the period. Simply divide your account value by $1,000 (for example, an $8,600 account value divided by $1,000 = 8.6), then multiply the result by the number in the table under the heading entitled “Actual Expenses Paid During Period” to estimate the expenses you paid on your account during this period.
Hypothetical example for comparison purposes
The table below also provides information about hypothetical account values and hypothetical expenses based on the Fund’s actual expense ratio and an assumed rate of return of 5% per year before expenses, which is not the Fund’s actual return.
The hypothetical account values and expenses may not be used to estimate the actual ending account balance or expenses you paid for the period. You may use this information to compare the ongoing costs of investing in the Fund and other funds. To do so, compare this 5% hypothetical example with the 5% hypothetical examples that appear in the shareholder reports of the other funds.
Please note that the expenses shown in the table are meant to highlight your ongoing costs only and do not reflect any transaction costs, such as sales charges (loads) on purchase payments or contingent deferred sales charges on redemptions, if any. Therefore, the hypothetical information is useful in comparing ongoing costs only, and will not help you determine the relative total costs of owning different funds. In addition, if these transaction costs were included, your costs would have been higher.
| Class | Beginning Account Value (05/01/13) | ACTUAL | HYPOTHETICAL (5% annual return before | Annualized Expense Ratio | ||||||||||||||||||||
| Ending Account Value (10/31/13)1 | Expenses Paid During Period2 | Ending Account Value (10/31/13) | Expenses Paid During Period2 | |||||||||||||||||||||
| A | $ | 1,000.00 | $ | 1,097.20 | $ | 7.03 | $ | 1,018.50 | $ | 6.77 | 1.33 | % | ||||||||||||
| B | 1,000.00 | 1,093.30 | 10.97 | 1,014.72 | 10.56 | 2.08 | ||||||||||||||||||
| C | 1,000.00 | 1,093.20 | 10.97 | 1,014.72 | 10.56 | 2.08 | ||||||||||||||||||
| R | 1,000.00 | 1,095.90 | 8.35 | 1,017.24 | 8.03 | 1.58 | ||||||||||||||||||
| Y | 1,000.00 | 1,098.60 | 5.71 | 1,019.76 | 5.50 | 1.08 | ||||||||||||||||||
| R5 | 1,000.00 | 1,099.10 | 5.19 | 1,020.27 | 4.99 | 0.98 | ||||||||||||||||||
| R6 | 1,000.00 | 1,099.80 | 4.76 | 1,020.67 | 4.58 | 0.90 | ||||||||||||||||||
| 1 | The actual ending account value is based on the actual total return of the Fund for the period May 1, 2013 through October 31, 2013, after actual expenses and will differ from the hypothetical ending account value which is based on the Fund’s expense ratio and a hypothetical annual return of 5% before expenses. |
| 2 | Expenses are equal to the Fund’s annualized expense ratio as indicated above multiplied by the average account value over the period, multiplied by 184/365 to reflect the most recent fiscal half year. |
22 Invesco International Growth Fund
Approval of Investment Advisory and Sub-Advisory Contracts
The Board of Trustees (the Board) of AIM International Mutual Funds (Invesco International Mutual Funds) is required under the Investment Company Act of 1940, as amended, to approve annually the renewal of Invesco International Growth Fund’s (the Fund) investment advisory agreement with Invesco Advisers, Inc. (Invesco Advisers) and the Master Intergroup Sub-Advisory Contract for Mutual Funds (the sub-advisory contracts) with Invesco Asset Management Deutschland GmbH, Invesco Asset Management Limited, Invesco Asset Management (Japan) Limited, Invesco Australia Limited, Invesco Hong Kong Limited, Invesco Senior Secured Management, Inc. and Invesco Canada Ltd. (collectively, the Affiliated Sub-Advisers). During contract renewal meetings held on June 17-19, 2013, the Board as a whole, and the disinterested or “independent” Trustees, who comprise over 75% of the Board, voting separately, approved the continuance of the Fund’s investment advisory agreement and the sub-advisory contracts for another year, effective July 1, 2013. The Board determined that the continuation of the Fund’s investment advisory agreement and the sub-advisory contracts are in the best interests of the Fund and its shareholders and the compensation payable to Invesco Advisers and the Affiliated Sub-Advisers under the agreements is fair and reasonable.
The Board’s Fund Evaluation Process
The Board’s Investments Committee has established three Sub-Committees, each of which is primarily responsible for overseeing the management of a number of the funds advised by Invesco Advisers (the Invesco Funds). The Sub-Committees meet throughout the year to review the performance of their assigned Invesco Funds, including reviewing materials prepared under the direction of the independent Senior Officer, an officer of the Invesco Funds who reports directly to the independent Trustees. Over the course of each year, the Sub-Committees meet with portfolio managers for their assigned Invesco Funds and other members of management to review the performance, investment objective(s), policies, strategies, limitations and investment risks of these funds. The Sub-Committees meet regularly and at designated contract renewal meetings each year to conduct a review of the performance, fees, expenses and other matters related to their assigned Invesco Funds. Each Sub-Committee recommends to the Investments Committee, which in turn recommends to the full Board, whether and on what terms to approve the continuance of each Invesco Fund’s investment advisory agreement and sub-advisory contracts for another year.
During the contract renewal process, the Trustees receive comparative performance and fee data regarding the Invesco Funds prepared by Invesco Advisers and Lipper Inc. (Lipper), an independent provider of investment company
data. The Trustees also receive an independent written evaluation from the Senior Officer. The Senior Officer’s evaluation is prepared as part of his responsibility to manage the process by which the Invesco Funds’ proposed management fees are negotiated during the annual contract renewal process to ensure they are negotiated in a manner that is at arms’ length and reasonable. The independent Trustees are assisted in their annual evaluation of the Fund’s investment advisory agreement by the Senior Officer and by independent legal counsel. In addition to meetings with Invesco Advisers and fund counsel, the independent Trustees also discuss the continuance of the investment advisory agreement and sub-advisory contracts in separate sessions with the Senior Officer and with independent legal counsel.
In evaluating the fairness and reasonableness of compensation under the Fund’s investment advisory agreement and sub-advisory contracts, the Board considered, among other things, the factors discussed below. The Trustees recognized that the advisory fee rates for the Invesco Funds are, in many cases, the result of years of review and negotiation between the Trustees and Invesco Advisers as well as advisory fees previously approved by different predecessor boards. The Trustees’ deliberations and conclusions in a particular year may be based in part on their deliberations and conclusions regarding these same arrangements throughout the year and in prior years. The Trustees’ review and conclusions are based on the comprehensive consideration of all information presented to them and are not the result of any single determinative factor. Moreover, one Trustee may have weighed a particular piece of information or factor differently than another Trustee.
The discussion below serves as the Senior Officer’s independent written evaluation with respect to the Fund’s investment advisory agreement as well as a discussion of the material factors and related conclusions that formed the basis for the Board’s approval of the Fund’s investment advisory agreement and sub-advisory contracts. Unless otherwise stated, this information is current as of June 19, 2013, and may not reflect consideration of factors that became known to the Board after that date, including, for example, changes to the Fund’s performance, advisory fees, expense limitations and/or fee waivers.
Factors and Conclusions and Summary of Independent Written Fee Evaluation
| A. | Nature, Extent and Quality of Services Provided by Invesco Advisers and the Affiliated Sub-Advisers |
The Board reviewed the advisory services provided to the Fund by Invesco Advisers under the Fund’s investment advisory agreement, the performance of Invesco Advisers in providing these services, and the credentials and
experience of the officers and employees of Invesco Advisers who provide these services, including the Fund’s portfolio manager or managers, with whom the Sub-Committees met during the year. The Board’s review of the qualifications of Invesco Advisers to provide advisory services included the Board’s consideration of Invesco Advisers’ investment process oversight, independent credit analysis and investment risk management.
In determining whether to continue the Fund’s investment advisory agreement, the Board considered the benefits of reapproving an existing relationship and the greater uncertainty that may be associated with entering into a new relationship. The Board also considered non-advisory services that Invesco Advisers and its affiliates provide to the Invesco Funds such as various back office support functions, equity and fixed income trading operations, internal audit, distribution and legal and compliance. The Board concluded that the nature, extent and quality of the services provided to the Fund by Invesco Advisers are appropriate and satisfactory and consistent with the terms of the Fund’s investment advisory agreement.
The Board reviewed the services that may be provided by the Affiliated Sub-Advisers under the sub-advisory contracts and the credentials and experience of the officers and employees of the Affiliated Sub-Advisers who provide these services. The Board noted that the Affiliated Sub-Advisers have offices and personnel that are located in financial centers around the world. As a result, the Affiliated Sub-Advisers can provide research and investment analysis on the markets and economies of various countries in which the Fund may invest, make recommendations regarding securities and assist with security trades. The Board concluded that the sub-advisory contracts benefit the Fund and its shareholders by permitting Invesco Advisers to use the resources and talents of the Affiliated Sub-Advisers in managing the Fund. The Board concluded that the nature, extent and quality of the services that may be provided by the Affiliated Sub-Advisers are appropriate and satisfactory and consistent with the terms of the Fund’s sub-advisory contracts.
| B. | Fund Performance |
The Board considered Fund performance as a relevant factor in considering whether to approve the investment advisory agreement. The Board did not view Fund performance as a relevant factor in considering whether to approve the sub-advisory contracts for the Fund, as no Affiliated Sub-Adviser currently manages assets of the Fund.
The Board compared the Fund’s performance during the past one, three and five calendar years to the performance of funds in the Lipper performance universe and against the Lipper International Large-Cap Growth Funds Index. The Board noted that performance of Class A shares of the Fund was in the fifth quintile of the performance universe for the one period, the
23 Invesco International Growth Fund
second quintile for the three year period and the first quintile for the five year period (the first quintile being the best performing funds and the fifth quintile being the worst performing funds). The Board noted that performance of Class A shares of the Fund was below the performance of the Index for the one year period and above the performance of the Index for the three and five year periods. The Trustees also reviewed more recent Fund performance and this review did not change their conclusions.
| C. | Advisory and Sub-Advisory Fees |
The Board compared the Fund’s contractual management fee rate to the contractual management fee rates of funds in the Fund’s Lipper expense group at a common asset level. The Board noted that the contractual management fee rate for Class A shares of the Fund was above the median contractual management fee rate of funds in the expense group. The Board noted that the term “contractual management fee” may include both advisory and certain administrative services fees and that Invesco does not charge the Invesco Funds for the administrative services included in the term as defined by Lipper. The Board also reviewed the methodology used by Lipper in providing expense group information, which includes using each fund’s contractual management fee schedule (including any applicable breakpoints) as reported in the most recent prospectus or statement of additional information for each fund in the expense group.
The Board also compared the Fund’s effective advisory fee rate (the advisory fee rate after advisory fee waivers and before other expense limitations/waivers) to the effective advisory fee rates of other mutual funds advised by Invesco Advisers and its affiliates with investment strategies comparable to those of the Fund. The Board noted that Invesco Advisers sub-advises mutual funds sponsored by third parties with investment strategies similar to the Fund and that the sub-advisory effective fee rates are below the effective advisory fee rate of the Fund.
The Board also considered the fees charged by Invesco Advisers and the Affiliated Sub-Advisers to other client accounts with investment strategies comparable to those of the Fund. The Board noted that Invesco Advisers or the Affiliated Sub-Advisers may charge lower fees to large institutional clients. Invesco Advisers reviewed with the Board the significantly greater scope of services it provides to the Invesco Funds relative to certain other client accounts. These additional services include provision of administrative services, officers and office space, oversight of service providers, preparation of annual registration statement updates and financial information and regulatory compliance under the Investment Company Act of 1940, as amended. Invesco Advisers also reviewed generally the higher frequency of shareholder purchases and redemptions in the Invesco Funds relative to the flow of assets for other client accounts. Invesco Advisers advised the Board that advance notice of redemptions is often provided to Invesco Advisers by institutional clients. The Board did note that
sub-advisory fee rates charged by the Affiliated Sub-Advisers to manage the Invesco Funds and to manage other client accounts tended to be more comparable, reflecting a more comparable scope of services. The Board concluded that the aggregate services provided to the Invesco Funds were sufficiently different from those provided to institutional clients, and the Board did not place significant weight on these fee comparisons.
The Board also considered the services that may be provided by the Affiliated Sub-Advisers pursuant to the sub-advisory contracts, as well as the fees payable by Invesco Advisers to the Affiliated Sub-Advisers pursuant to the sub-advisory contracts. The Board also noted that the sub-advisory fees are not paid directly by the Fund, but rather, are payable by Invesco Advisers to the Affiliated Sub-Advisers.
Based upon the information and considerations described above, the Board concluded that the compensation payable to Invesco Advisers and the Affiliated Sub-Advisers is fair and reasonable.
| D. | Economies of Scale and Breakpoints |
The Board considered the extent to which there are economies of scale in the provision of advisory services to the Fund. The Board also considered whether the Fund benefits from economies of scale through contractual breakpoints in the Fund’s advisory fee schedule and was assisted in this review by a report from the Senior Officer. The Board also noted that the Fund shares directly in economies of scale through lower fees charged by third party service providers based on the combined size of the Invesco Funds and other clients advised by Invesco Advisers.
| E. | Profitability and Financial Resources |
The Board reviewed information from Invesco Advisers concerning the costs of the advisory and other services that Invesco Advisers and its affiliates provide to the Fund and the profitability of Invesco Advisers and its affiliates in providing these services for the year ended December 31, 2012. The Board received information from Invesco Advisers about the methodology used to prepare the profitability information. The Board considered the profitability of Invesco Advisers in managing the Fund and the Invesco Funds. The Board noted that Invesco Advisers continues to operate at a net profit from services Invesco Advisers and its subsidiaries provide to the Invesco Funds and the Fund. The Board did not deem the level of profits realized by Invesco Advisers and its affiliates from providing services to the Fund to be excessive given the nature, quality and extent of the services provided to the Invesco Funds. The Board received and accepted information from Invesco Advisers demonstrating that Invesco Advisers and each Affiliated Sub-Adviser are financially sound and have the resources necessary to perform their obligations under the investment advisory agreement and sub-advisory contracts.
| F. | Collateral Benefits to Invesco Advisers and its Affiliates |
The Board considered various other benefits received by Invesco Advisers and its affiliates from the relationship with the Fund, including the
fees received for their provision of transfer agency and distribution services to the Fund. The Board considered comparative information regarding fees charged for these services, including information provided by Lipper and other independent sources. The Board considered the performance of Invesco Advisers and its affiliates in providing these services and the organizational structure employed to provide these services. The Board also considered that these services are provided to the Fund pursuant to written contracts that are reviewed and approved on an annual basis by the Board; that the services are required for the operation of the Fund; that Invesco Advisers and its affiliates can provide services, the nature and quality of which are at least equal to those provided by others offering the same or similar services; and that the fees for such services are fair and reasonable in light of the usual and customary charges by others for services of the same nature and quality.
The Board considered the benefits realized by Invesco Advisers and the Affiliated Sub-Advisers as a result of portfolio brokerage transactions executed through “soft dollar” arrangements. The Board noted that soft dollar arrangements shift the payment obligation for research services from Invesco Advisers and the Affiliated Sub-Advisers to the Invesco Funds and that the research received may be used with other clients of Invesco Advisers and may reduce Invesco Advisers’ and the Affiliated Sub-Advisers’ expenses. The Board also considered periodic reports from the Chief Compliance Officer of the Invesco Funds demonstrating that these arrangements are consistent with regulatory requirements. The Board did not deem the soft dollar arrangements to be inappropriate.
The Board considered that the Fund’s uninvested cash and cash collateral from any securities lending arrangements may be invested in money market funds advised by Invesco Advisers pursuant to procedures approved by the Board. The Board noted that Invesco Advisers receives advisory fees from these affiliated money market funds attributable to such investments, although Invesco Advisers has contractually agreed to waive through varying periods the advisory fees payable by the Invesco Funds. The waiver is in an amount equal to 100% of the net advisory fee Invesco Advisers receives from the affiliated money market funds with respect to the Fund’s investment in the affiliated money market funds of uninvested cash, but not cash collateral. The Board concluded that the Fund’s investment of uninvested cash and cash collateral from any securities lending arrangements in the affiliated money market funds is in the best interests of the Fund and its shareholders.
The Board also considered use of an affiliated broker to execute certain trades for the Fund to among other things, control information leakage, and were advised that such trades are executed in compliance with rules under the Investment Company Act of 1940, as amended.
24 Invesco International Growth Fund
Tax Information
Form 1099-DIV, Form 1042-S and other year–end tax information provide shareholders with actual calendar year amounts that should be included in their tax returns. Shareholders should consult their tax advisors.
The following distribution information is being provided as required by the Internal Revenue Code or to meet a specific state’s requirement.
The Fund designates the following amounts or, if subsequently determined to be different, the maximum amount allowable for its fiscal year ended October 31, 2013:
Federal and State Income Tax | ||||
Qualified Dividend Income* | 100 | % | ||
Corporate Dividends Received Deduction* | 0 | % | ||
Foreign Tax Credit | $ | 0.0551 | per share | |
Foreign Source Income | $ | 0.6834 | per share | |
| * | The above percentages are based on ordinary income dividends paid to shareholders during the Fund’s fiscal year. |
25 Invesco International Growth Fund
Trustees and Officers
The address of each trustee and officer is AIM International Mutual Funds (Invesco International Mutual Funds) (the “Trust”), 11 Greenway Plaza, Suite 1000, Houston, Texas 77046-1173. The trustees serve for the life of the Trust, subject to their earlier death, incapacitation, resignation, retirement or removal as more specifically provided in the Trust’s organizational documents. Each officer serves for a one year term or until their successors are elected and qualified. Column two below includes length of time served with predecessor entities, if any.
Name, Year of Birth and Position(s) Held with the Trust | Trustee and/ or Officer Since | Principal Occupation(s) During Past 5 Years | Number of Funds in Fund Complex Overseen by Trustee | Other Directorship(s) Held by Trustee During Past 5 Years | ||||
| Interested Persons | ||||||||
| Martin L. Flanagan1 — 1960 Trustee | 2007 | Executive Director, Chief Executive Officer and President, Invesco Ltd. (ultimate parent of Invesco and a global investment management firm); Advisor to the Board, Invesco Advisers, Inc. (formerly known as Invesco Institutional (N.A.), Inc.); Trustee, The Invesco Funds; Vice Chair, Investment Company Institute; and Member of Executive Board, SMU Cox School of Business
Formerly: Chairman and Chief Executive Officer, Invesco Advisers, Inc. (registered investment adviser); Director, Chairman, Chief Executive Officer and President, IVZ Inc. (holding company), INVESCO Group Services, Inc. (service provider) and Invesco North American Holdings, Inc. (holding company); Director, Chief Executive Officer and President, Invesco Holding Company Limited (parent of Invesco and a global investment management firm); Director, Invesco Ltd.; Chairman, Investment Company Institute and President, Co-Chief Executive Officer, Co-President, Chief Operating Officer and Chief Financial Officer, Franklin Resources, Inc. (global investment management organization) | 117 | None | ||||
Philip A. Taylor2 — 1954 Trustee, President and Principal Executive Officer | 2006 | Head of North American Retail and Senior Managing Director, Invesco Ltd.; Director, Co-Chairman, Co-President and Co-Chief Executive Officer, Invesco Advisers, Inc. (formerly known as Invesco Institutional (N.A.), Inc.) (registered investment adviser); Director, Chairman, Chief Executive Officer and President, Invesco Management Group, Inc. (formerly known as Invesco Aim Management Group, Inc.) (financial services holding company); Director and President, INVESCO Funds Group, Inc. (registered investment adviser and registered transfer agent); Director and Chairman, Invesco Investment Services, Inc. (formerly known as Invesco Aim Investment Services, Inc.) (registered transfer agent) and IVZ Distributors, Inc. (formerly known as INVESCO Distributors, Inc.) (registered broker dealer); Director, President and Chairman, Invesco Inc. (holding company) and Invesco Canada Holdings Inc. (holding company); Chief Executive Officer, Invesco Corporate Class Inc. (corporate mutual fund company) and Invesco Canada Fund Inc. (corporate mutual fund company); Director, Chairman and Chief Executive Officer, Invesco Canada Ltd. (formerly known as Invesco Trimark Ltd./Invesco Trimark Ltèe) (registered investment adviser and registered transfer agent); Trustee, President and Principal Executive Officer, The Invesco Funds (other than AIM Treasurer’s Series Trust (Invesco Treasurer’s Series Trust) and Short-Term Investments Trust); Trustee and Executive Vice President, The Invesco Funds (AIM Treasurer’s Series Trust (Invesco Treasurer’s Series Trust) and Short-Term Investments Trust only); Director, Invesco Investment Advisers LLC (formerly known as Van Kampen Asset Management); Director, Chief Executive Officer and President, Van Kampen Exchange Corp.
Formerly: Director and Chairman, Van Kampen Investor Services Inc.: Director, Chief Executive Officer and President, 1371 Preferred Inc. (holding company); and Van Kampen Investments Inc.; Director and President, AIM GP Canada Inc. (general partner for limited partnerships); and Van Kampen Advisors, Inc.; Director and Chief Executive Officer, Invesco Trimark Dealer Inc. (registered broker dealer); Director, Invesco Distributors, Inc. (formerly known as Invesco Aim Distributors, Inc.) (registered broker dealer); Manager, Invesco PowerShares Capital Management LLC; Director, Chief Executive Officer and President, Invesco Advisers, Inc.; Director, Chairman, Chief Executive Officer and President, Invesco Aim Capital Management, Inc.; President, Invesco Trimark Dealer Inc. and Invesco Trimark Ltd./Invesco Trimark Ltèe; Director and President, AIM Trimark Corporate Class Inc. and AIM Trimark Canada Fund Inc.; Senior Managing Director, Invesco Holding Company Limited; Trustee and Executive Vice President, Tax-Free Investments Trust; Director and Chairman, Fund Management Company (former registered broker dealer); President and Principal Executive Officer, The Invesco Funds (AIM Treasurer’s Series Trust (Invesco Treasurer’s Series Trust), Short-Term Investments Trust and Tax-Free Investments Trust only); President, AIM Trimark Global Fund Inc. and AIM Trimark Canada Fund Inc. | 117 | None | ||||
Wayne W. Whalen3 — 1939 Trustee | 2010 | Of Counsel, and prior to 2010, partner in the law firm of Skadden, Arps, Slate, Meagher & Flom LLP, legal counsel to certain funds in the Fund Complex | 130 | Director of the Mutual Fund Directors Forum, a nonprofit membership organization for investment directors; Chairman and Director of the Abraham Lincoln Presidential Library Foundation; and Director of the Stevenson Center for Democracy |
| 1 | Mr. Flanagan is considered an interested person of the Trust because he is an officer of the adviser to the Trust, and an officer and a director of Invesco Ltd., ultimate parent of the adviser to the Trust. |
| 2 | Mr. Taylor is considered an interested person of the Trust because he is an officer and a director of the adviser to, and a director of the principal underwriter of, the Trust. |
| 3 | Mr. Whalen is considered an “interested person” (within the meaning of Section 2(a)(19) of the 1940 Act) of certain Funds in the Invesco Fund Complex because he and his firm currently provide legal services as legal counsel to such Funds. |
T-1 Invesco International Growth Fund
Trustees and Officers—(continued)
Name, Year of Birth and Position(s) Held with the Trust | Trustee and/ or Officer Since | Principal Occupation(s) During Past 5 Years | Number of Funds in Fund Complex Overseen by Trustee | Other Directorship(s) Held by Trustee During Past 5 Years | ||||
| Independent Trustees | ||||||||
Bruce L. Crockett — 1944 Trustee and Chair | 1992 | Chairman, Crockett Technologies Associates (technology consulting company)
Formerly: Director, Captaris (unified messaging provider); Director, President and Chief Executive Officer COMSAT Corporation; and Chairman, Board of Governors of INTELSAT (international communications company) | 117 | ACE Limited (insurance company); Investment Company Institute | ||||
David C. Arch — 1945 Trustee | 2010 | Chairman and Chief Executive Officer of Blistex Inc., (consumer health care products manufacturer)
Formerly: Member of the Heartland Alliance Advisory Board, a nonprofit organization serving human needs based in Chicago | 130 | Board member of the Illinois Manufacturers’ Association; Member of the Board of Visitors, Institute for the Humanities, University of Michigan | ||||
Frank S. Bayley — 1939 Trustee | 2001 | Retired
Formerly: Director, Badgley Funds, Inc. (registered investment company) (2 portfolios) and General Partner and Of Counsel, law firm of Baker & McKenzie, LLP | 117 | Director and Chairman, C.D. Stimson Company (a real estate investment company); Trustee and Overseer, The Curtis Institute of Music | ||||
James T. Bunch — 1942 Trustee | 2003 | Managing Member, Grumman Hill Group LLC (family office private equity management)
Formerly: Founder, Green, Manning & Bunch Ltd. (investment banking firm)(1988-2010); Executive Committee, United States Golf Association; and Director, Policy Studies, Inc. and Van Gilder Insurance Corporation | 117 | Chairman, Board of Governors, Western Golf Association; Chairman-elect, Evans Scholars Foundation; and Director, Denver Film Society | ||||
Rodney F. Dammeyer — 1940 Trustee | 2010 | Chairman of CAC, LLC, (private company offering capital investment and management advisory services)
Formerly: Prior to 2001, Managing Partner at Equity Group Corporate Investments; Prior to 1995, Chief Executive Officer of Itel Corporation (formerly Anixter International); Prior to 1985, experience includes Senior Vice President and Chief Financial Officer of Household International, Inc., Executive Vice President and Chief Financial Officer of Northwest Industries, Inc. and Partner of Arthur Andersen & Co.; From 1987 to 2010, Director/Trustee of investment companies in the Van Kampen Funds complex | 117 | Director of Quidel Corporation and Stericycle, Inc.; Prior to May 2008, Trustee of The Scripps Research Institute; Prior to February 2008, Director of Ventana Medical Systems, Inc. | ||||
Albert R. Dowden — 1941 Trustee | 2000 | Director of a number of public and private business corporations, including the Boss Group, Ltd. (private investment and management); and Reich & Tang Funds (5 portfolios) (registered investment company)
Formerly: Director, Homeowners of America Holding Corporation/Homeowners of America Insurance Company (property casualty company); Director, Continental Energy Services, LLC (oil and gas pipeline service); Director, CompuDyne Corporation (provider of product and services to the public security market) and Director, Annuity and Life Re (Holdings), Ltd. (reinsurance company); Director, President and Chief Executive Officer, Volvo Group North America, Inc.; Senior Vice President, AB Volvo; Director of various public and private corporations; Chairman, DHJ Media, Inc.; Director, Magellan Insurance Company; and Director, The Hertz Corporation, Genmar Corporation (boat manufacturer), National Media Corporation; Advisory Board of Rotary Power International (designer, manufacturer, and seller of rotary power engines); and Chairman, Cortland Trust, Inc. (registered investment company) | 117 | Director of Nature’s Sunshine Products, Inc. | ||||
Jack M. Fields — 1952 Trustee | 1997 | Chief Executive Officer, Twenty First Century Group, Inc. (government affairs company); Owner and Chief Executive Officer, Dos Angeles Ranch, L.P. (cattle, hunting, corporate entertainment); and Discovery Global Education Fund (non-profit)
Formerly: Chief Executive Officer, Texana Timber LP (sustainable forestry company); Director of Cross Timbers Quail Research Ranch (non-profit); and member of the U.S. House of Representatives | 117 | Insperity, Inc. (formerly known as Administaff) | ||||
Prema Mathai-Davis — 1950 Trustee | 1998 | Retired
Formerly: Chief Executive Officer, YWCA of the U.S.A. | 117 | None | ||||
Larry Soll — 1942 Trustee | 2003 | Retired
Formerly: Chairman, Chief Executive Officer and President, Synergen Corp. (a biotechnology company) | 117 | None | ||||
Hugo F. Sonnenschein — 1940 Trustee | 2010 | Distinguished Service Professor and President Emeritus of the University of Chicago and the Adam Smith Distinguished Service Professor in the Department of Economics at the University of Chicago
Formerly: President of the University of Chicago | 130 | Trustee of the University of Rochester and a member of its investment committee. Member of the National Academy of Sciences, the American Philosophical Society and a fellow of the American Academy of Arts and Sciences | ||||
Raymond Stickel, Jr. — 1944 Trustee | 2005 | Retired
Formerly: Director, Mainstay VP Series Funds, Inc. (25 portfolios) and Partner, Deloitte & Touche | 117 | None |
T-2 Invesco International Growth Fund
Trustees and Officers—(continued)
Name, Year of Birth and Position(s) Held with the Trust | Trustee and/ or Officer Since | Principal Occupation(s) During Past 5 Years | Number of Funds in Fund Complex Overseen by Trustee | Other Directorship(s) Held by Trustee During Past 5 Years | ||||
| Other Officers | ||||||||
Russell C. Burk — 1958 Senior Vice President and Senior Officer | 2005 | Senior Vice President and Senior Officer, The Invesco Funds | N/A | N/A | ||||
John M. Zerr — 1962 Senior Vice President, Chief Legal Officer and Secretary | 2006 | Director, Senior Vice President, Secretary and General Counsel, Invesco Management Group, Inc. (formerly known as Invesco Aim Management Group, Inc.) and Van Kampen Exchange Corp.; Senior Vice President, Invesco Advisers, Inc. (formerly known as Invesco Institutional (N.A.), Inc.) (registered investment adviser); Senior Vice President and Secretary, Invesco Distributors, Inc. (formerly known as Invesco Aim Distributors, Inc.); Director, Vice President and Secretary, Invesco Investment Services, Inc. (formerly known as Invesco Aim Investment Services, Inc.) and IVZ Distributors, Inc. (formerly known as INVESCO Distributors, Inc.); Director and Vice President, INVESCO Funds Group, Inc.; Senior Vice President, Chief Legal Officer and Secretary, The Invesco Funds; Manager, Invesco PowerShares Capital Management LLC; Director, Secretary and General Counsel, Invesco Investment Advisers LLC (formerly known as Van Kampen Asset Management); Secretary and General Counsel, Invesco Capital Markets, Inc. (formerly known as Van Kampen Funds Inc.) and Chief Legal Officer, PowerShares Exchange-Traded Fund Trust, PowerShares Exchange-Traded Fund Trust II, PowerShares India Exchange-Traded Fund Trust and PowerShares Actively Managed Exchange-Traded Fund Trust
Formerly: Director and Vice President, Van Kampen Advisors Inc.; Director, Vice President, Secretary and General Counsel, Van Kampen Investor Services Inc.; Director, Invesco Distributors, Inc. (formerly known as Invesco Aim Distributors, Inc.); Director, Senior Vice President, General Counsel and Secretary, Invesco Aim Advisers, Inc. and Van Kampen Investments Inc.; Director, Vice President and Secretary, Fund Management Company; Director, Senior Vice President, Secretary, General Counsel and Vice President, Invesco Aim Capital Management, Inc.; Chief Operating Officer and General Counsel, Liberty Ridge Capital, Inc. (an investment adviser); Vice President and Secretary, PBHG Funds (an investment company) and PBHG Insurance Series Fund (an investment company); Chief Operating Officer, General Counsel and Secretary, Old Mutual Investment Partners (a broker-dealer); General Counsel and Secretary, Old Mutual Fund Services (an administrator) and Old Mutual Shareholder Services (a shareholder servicing center); Executive Vice President, General Counsel and Secretary, Old Mutual Capital, Inc. (an investment adviser); and Vice President and Secretary, Old Mutual Advisors Funds (an investment company) | N/A | N/A | ||||
Karen Dunn Kelley — 1960 Vice President | 2004 | Senior Managing Director, Investments; Director, Co-President, Co-Chief Executive Officer, and Co-Chairman, Invesco Advisers, Inc. (formerly known as Invesco Institutional (N.A.), Inc.) (registered investment adviser); Chairman, Invesco Senior Secured Management, Inc.; Senior Vice President, Invesco Management Group, Inc. (formerly known as Invesco Aim Management Group, Inc.); Executive Vice President, Invesco Distributors, Inc. (formerly known as Invesco Aim Distributors, Inc.); Director, Invesco Mortgage Capital Inc., and Invesco Management Company Limited; Director and President, INVESCO Asset Management (Bermuda) Ltd., Vice President, The Invesco Funds (other than AIM Treasurer’s Series Trust (Invesco Treasurer’s Series Trust) and Short-Term Investments Trust); and President and Principal Executive Officer, The Invesco Funds (AIM Treasurer’s Series Trust (Invesco Treasurer’s Series Trust) and Short-Term Investments Trust only)
Formerly: Director, INVESCO Global Asset Management Limited and INVESCO Management S.A.; Senior Vice President, Van Kampen Investments Inc. and Invesco Advisers, Inc. (formerly known as Invesco Institutional (N.A.), Inc.) (registered investment adviser); Vice President, Invesco Advisers, Inc. (formerly known as Invesco Institutional (N.A.), Inc.); Director of Cash Management and Senior Vice President, Invesco Advisers, Inc. and Invesco Aim Capital Management, Inc.; President and Principal Executive Officer, Tax-Free Investments Trust; Director and President, Fund Management Company; Chief Cash Management Officer, Director of Cash Management, Senior Vice President, and Managing Director, Invesco Aim Capital Management, Inc.; Director of Cash Management, Senior Vice President, and Vice President, Invesco Advisers, Inc. and The Invesco Funds (AIM Treasurer’s Series Trust (Invesco Treasurer’s Series Trust), Short-Term Investments Trust and Tax-Free Investments Trust only) | N/A | N/A |
T-3 Invesco International Growth Fund
Trustees and Officers—(continued)
Name, Year of Birth and Position(s) Held with the Trust | Trustee and/ or Officer Since | Principal Occupation(s) During Past 5 Years | Number of Funds in Fund Complex Overseen by Trustee | Other Directorship(s) Held by Trustee During Past 5 Years | ||||
| Other Officers—(continued) | ||||||||
Sheri Morris — 1964 Vice President, Treasurer and Principal Financial Officer | 1999 | Vice President, Treasurer and Principal Financial Officer, The Invesco Funds; Vice President, Invesco Advisers, Inc. (formerly known as Invesco Institutional (N.A.), Inc.) (registered investment adviser); and Vice President, PowerShares Exchange-Traded Fund Trust, PowerShares Exchange-Traded Fund Trust II, PowerShares India Exchange-Traded Fund Trust and PowerShares Actively Managed Exchange-Traded Fund Trust
Formerly: Vice President, Invesco Aim Advisers, Inc., Invesco Aim Capital Management, Inc. and Invesco Aim Private Asset Management, Inc.; Assistant Vice President and Assistant Treasurer, The Invesco Funds and Assistant Vice President, Invesco Advisers, Inc., Invesco Aim Capital Management, Inc. and Invesco Aim Private Asset Management, Inc.; and Treasurer, PowerShares Exchange-Traded Fund Trust, PowerShares Exchange-Traded Fund Trust II, PowerShares India Exchange-Traded Fund Trust and PowerShares Actively Managed Exchange-Traded Fund Trust | N/A | N/A | ||||
Crissie M. Wisdom — 1969 Anti-Money Laundering Compliance Officer | 2013 | Anti-Money Laundering Compliance Officer, Invesco Advisers, Inc. (formerly known as Invesco Institutional (N.A.), Inc.) (registered investment adviser), Invesco Capital Markets, Inc. (formerly known as Van Kampen Funds Inc.), Invesco Distributors, Inc., Invesco Investment Services, Inc., Invesco Management Group, Inc., Van Kampen Exchange Corp., The Invesco Funds, Invesco Funds (Chicago), and PowerShares Exchange-Traded Fund Trust, PowerShares Exchange-Traded Fund Trust II, PowerShares India Exchange-Traded Fund Trust, and PowerShares Actively Managed Exchange-Traded Fund Trust; and Fraud Prevention Manager and Controls and Risk Analysis Manager for Invesco Investment Services, Inc. | N/A | N/A | ||||
Todd L. Spillane — 1958 Chief Compliance Officer | 2006 | Senior Vice President, Invesco Management Group, Inc. (formerly known as Invesco Aim Management Group, Inc.) and Van Kampen Exchange Corp.; Senior Vice President and Chief Compliance Officer, Invesco Advisers, Inc. (registered investment adviser) (formerly known as Invesco Institutional (N.A.), Inc.); Chief Compliance Officer, The Invesco Funds; Vice President, Invesco Distributors, Inc. (formerly known as Invesco Aim Distributors, Inc.) and Invesco Investment Services, Inc. (formerly known as Invesco Aim Investment Services, Inc.)
Formerly: Chief Compliance Officer, Invesco Funds (Chicago); Senior Vice President, Van Kampen Investments Inc.; Senior Vice President and Chief Compliance Officer, Invesco Aim Advisers, Inc. and Invesco Aim Capital Management, Inc.; Chief Compliance Officer, INVESCO Private Capital Investments, Inc. (holding company), Invesco Private Capital, Inc. (registered investment adviser), Invesco Global Asset Management (N.A.), Inc., Invesco Senior Secured Management, Inc. (registered investment adviser), Van Kampen Investor Services Inc., PowerShares Exchange-Traded Fund Trust, PowerShares Exchange-Traded Fund Trust II, PowerShares India Exchange-Traded Fund Trust and PowerShares Actively Managed Exchange-Traded Fund Trust; and Vice President, Invesco Aim Capital Management, Inc. and Fund Management Company | N/A | N/A |
The Statement of Additional Information of the Trust includes additional information about the Fund’s Trustees and is available upon request, without charge, by calling 1.800.959.4246. Please refer to the Fund’s prospectus for information on the Fund’s sub-advisers.
Office of the Fund 11 Greenway Plaza, Suite 1000 Houston, TX 77046-1173 | Investment Adviser Invesco Advisers, Inc. 1555 Peachtree Street, N.E. Atlanta, GA 30309 | Distributor Invesco Distributors, Inc. 11 Greenway Plaza, Suite 1000 Houston, TX 77046-1173 | Auditors PricewaterhouseCoopers LLP 1201 Louisiana Street, Suite 2900 Houston, TX 77002-5678 | |||
Counsel to the Fund Stradley Ronon Stevens & Young, LLP 2005 Market Street, Suite 2600 Philadelphia, PA 19103-7018 | Counsel to the Independent Trustees Goodwin Procter LLP 901 New York Avenue, N.W. Washington, D.C. 20001 | Transfer Agent Invesco Investment Services, Inc. 11 Greenway Plaza, Suite 1000 Houston, TX 77046-1173 | Custodian State Street Bank and Trust Company 225 Franklin Street Boston, MA 02110-2801 | |||
T-4 Invesco International Growth Fund

Go Paperless with eDelivery | ||
Visit invesco.com/edelivery to receive quarterly statements, tax forms, fund reports and prospectuses with a service that’s all about eeees: | ||
- environmentally friendly. Go green by reducing the number of trees used to produce paper. | - efficient. Stop waiting for regular mail. Your documents will be sent via email as soon as they’re available. | |
- economical. Help reduce your fund’s printing and delivery expenses and put more capital back in your fund’s returns. | - easy. Download, save and print files using your home computer with a few clicks of your mouse. | |
This service is provided by Invesco Investment Services, Inc.
| ||
Invesco mailing information
Send general correspondence to Invesco Investment Services, Inc., P.O. Box 219078, Kansas City, MO 64121-9078.
Invesco privacy policy
You share personal and financial information with us that is necessary for your transactions and your account records. We take very seriously the obligation to keep that information confidential and private.
Invesco collects nonpublic personal information about you from account applications or other forms you complete and from your transactions with us or our affiliates. We do not disclose information about you or our former customers to service providers or other third parties except to the extent necessary to service your account and in other limited circumstances as permitted by law. For example, we use this information to facilitate the delivery of transaction confirmations, financial reports, prospectuses and tax forms.
Even within Invesco, only people involved in the servicing of your accounts and compliance monitoring have access to your information. To ensure the highest level of confidentiality and security, Invesco maintains physical, electronic and procedural safeguards that meet or exceed federal standards. Special measures, such as data encryption and authentication, apply to your communications with us on our website. More detail is available to you at invesco.com/privacy.
Important notice regarding delivery of security holder documents
To reduce Fund expenses, only one copy of most shareholder documents may be mailed to shareholders with multiple accounts at the same address (Householding). Mailing of your shareholder documents may be householded indefinitely unless you instruct us otherwise. If you do not want the mailing of these documents to be combined with those for other members of your household, please contact Invesco Investment Services, Inc. at 800 959 4246 or contact your financial institution. We will begin sending you individual copies for each account within 30 days after receiving your request.
Fund holdings and proxy voting information
The Fund provides a complete list of its holdings four times in each fiscal year, at the quarter ends. For the second and fourth quarters, the lists appear in the Fund’s semiannual and annual reports to shareholders. For the first and third quarters, the Fund files the lists with the Securities and Exchange Commission (SEC) on Form N-Q. The most recent list of portfolio holdings is available at invesco.com/completeqtrholdings. Shareholders can also look up the Fund’s Forms N-Q on the SEC website at sec.gov. Copies of the Fund’s Forms N-Q may be reviewed and copied at the SEC Public Reference Room in Washington, D.C. You can obtain information on the operation of the Public Reference Room, including information about duplicating fee charges, by calling 202 551 8090 or 800 732 0330, or by electronic request at the following email address: publicinfo@sec.gov. The SEC file numbers for the Fund are shown below.
A description of the policies and procedures that the Fund uses to determine how to vote proxies relating to portfolio securities is available without charge, upon request, from our Client Services department at 800 959 4246 or at invesco.com/proxyguidelines. The information is also available on the SEC website, sec.gov.
Information regarding how the Fund voted proxies related to its portfolio securities during the most recent 12-month period ended June 30 is available at invesco.com/proxysearch. The information is also available on the SEC website, sec.gov. |  | |
Invesco Advisers, Inc. is an investment adviser; it provides investment advisory services to individual and institutional clients and does not sell securities. Invesco Distributors, Inc. is the US distributor for Invesco Ltd.’s retail mutual funds, exchange-traded funds and institutional money market funds. Both are wholly owned, indirect subsidiaries of Invesco Ltd. |
| SEC file numbers: 811-06463 and 033-44611 | IGR-AR-1 | Invesco Distributors, Inc. |
Letters to Shareholders
 | Dear Shareholders: Enclosed in this annual report, you’ll find information about your Fund and the factors that affected its performance during the reporting period. Inside, you’ll also find a discussion from your portfolio managers about how they managed your Fund, as well as performance data for your Fund, a complete list of your Fund’s investments as of the close of the reporting period and other important information. I hope you find this report of interest. During the reporting period covered by this report, major US equity indexes made multiyear or even all-time highs.1 Economic data were generally positive; housing and consumer spending data were particularly encouraging. Nonetheless, economic uncertainty and concern about continuing political and budget gridlock in Washington persisted. The US Federal Reserve’s deliberate vagueness about when, and to what degree, it might begin to curtail its | |
| extraordinarily accommodative monetary policies affected fixed income and equity markets alike. Most developed, non-US stock markets remained positive for the first half of 2013, despite a difficult second quarter. | ||
Periods of market volatility and economic uncertainty can weaken the will of even the most resolute investor. That’s why Invesco believes it’s often helpful to work with a skilled and trusted financial adviser who can emphasize the importance of adhering to an investment plan designed to achieve long-term goals rather than being sidetracked by short-term uncertainty that can result in inaction. A financial adviser who is familiar with your individual financial situation, investment goals and risk tolerance can be an invaluable partner as you work toward your financial goals. He or she can provide insight and perspective when markets are volatile; encouragement and reassurance when times are uncertain; and advice and guidance when your financial situation or investment goals change. Our website, invesco.com/us, is another source of timely insight and information for investors. On the website, you’ll find fund-specific as well as more general information from many of Invesco’s investment professionals. You’ll find in-depth articles, video clips and audio commentaries – and, of course, you also can access information about your Invesco account whenever it’s convenient for you. | ||
What we mean by Intentional Investing
At Invesco, all of our people and all of our resources are dedicated to helping investors achieve their financial objectives. It’s a philosophy we call Intentional Investing, and it guides the way we:
| n | Manage investments – Our dedicated investment professionals search the world for the best opportunities, and each investment team follows a clear, disciplined process to build portfolios and mitigate risk. |
| n | Provide choices – We offer multiple investment strategies, allowing you and your financial adviser to build a portfolio that’s purpose-built for your needs. |
| n | Connect with you – We’re committed to giving you the expert insights you need to make informed investing decisions, and we are well-equipped to provide high-quality support for investors and advisers. |
At Invesco, we believe in putting investors first. That’s why investment management is all we do. Our sole focus on managing your money allows you and your financial adviser to build a portfolio of Invesco funds appropriate for your investment needs and goals today and when your circumstances change.
Have questions?
For questions about your account, feel free to contact an Invesco client services representative at 800 959 4246. For Invesco-related questions or comments, please email me directly at phil@invesco.com.
All of us at Invesco look forward to serving your investment management needs for many years to come. Thank you for investing with us.
Sincerely,

Philip Taylor
Senior Managing Director, Invesco Ltd.
| 1 | Source: Reuters |
| 2 | Invesco Select Opportunities Fund |
| Dear Fellow Shareholders: The Invesco Funds Board has worked on a variety of issues over the last several months, and I’d like to take this opportunity to discuss two that affect you and our fellow fund shareholders. The first issue on which your Board has been working is our annual review of the funds’ advisory and sub-advisory contracts with Invesco Advisers and its affiliates. This annual review, which is required by the Investment Company Act of 1940, focuses on the nature and quality of the services Invesco provides as adviser to the Invesco Funds and the reasonableness of the fees that it charges for those services. Each year, we spend months reviewing detailed information that we request from Invesco that allows us to evaluate its services and fees. We also use information from many independent sources, including materials provided by the independent Senior Officer of the Invesco Funds, who reports directly to the independent Trustees on the Board. Additionally, we meet with independent | |
| legal counsel and review performance and fee data prepared by Lipper Inc., an independent, third-party firm widely recognized as a leader in its field. | ||

I’m pleased to report that the Board determined in June that renewing the investment advisory agreement and the sub-advisory contracts with Invesco Advisers and its affiliates would serve the best interests of each fund and its shareholders.
The second area of focus to highlight is the Board’s efforts to ensure that we provide a lineup of funds that allow financial advisers to build portfolios that meet shareholders’ changing financial needs and goals. Today, more and more investors are reaching, or approaching, retirement. But interest rates remain low, making it difficult for many investors to generate the income they need, or will soon need, in their retirement years.
The members of your Board think about these things, too, and we’ve worked with Invesco Advisers to provide more income-generating options in the Invesco Funds lineup to help shareholders potentially meet their income needs. Your Board recently approved changes to three existing equity mutual funds, increasing their focus on generating income while also seeking to provide long-term growth of capital.
As a result of these changes, the funds and their respective management teams now have more flexibility to invest in the types of securities that could meet investors’ growing need for income generation, and in some cases, also help investors diversify their sources of income. These equity funds complement an array of fixed-income, asset allocation and alternative investment options in the Invesco Funds lineup designed to accommodate a variety of risk tolerances.
Be assured that your Board will continue working on behalf of fund shareholders, keeping your needs and interests uppermost in our minds.
As always, please contact me at bruce@brucecrockett.com with any questions or concerns you may have. On behalf of the Board, we look forward to continuing to represent your interests and serving your needs.
Sincerely,

Bruce L. Crockett
Independent Chair
Invesco Funds Board of Trustees
| 3 | Invesco Select Opportunities Fund |
Management’s Discussion of Fund Performance
Performance summary
For the fiscal year ended October 31, 2013, Invesco Select Opportunities Fund, at net asset value (NAV), outperformed its broad market and peer group benchmarks and underperformed its style-specific benchmark.
Drivers of performance were largely stock specific. We attribute the Fund’s outperformance mainly to above market returns from select investments in the health care and information technology (IT) sectors. Alternatively, one holding in the energy sector was the largest detractor from performance during the fiscal year. The Fund’s cash position also hurt performance relative to its benchmarks in a rising market environment.
Your Fund’s long-term performance appears later in this report.
Fund vs. Indexes
Total returns, 10/31/12 to 10/31/13, at net asset value (NAV). Performance shown does not include applicable contingent deferred sales charges (CDSC) or front-end sales charges, which would have reduced performance.
Class A Shares | 30.75 | % | ||
Class C Shares | 29.87 | |||
Class R Shares | 30.35 | |||
Class Y Shares | 31.11 | |||
Class R5 Shares | 31.12 | |||
Class R6 Shares | 31.02 | |||
MSCI World Index‚ (Broad Market Index) | 25.77 | |||
MSCI World Small Cap Index‚ (Style-Specific Index) | 32.31 | |||
Lipper Global Small/Mid-Cap Funds Classification Averagen (Peer Group) | 28.47 | |||
Source(s): ‚Invesco, MSCI via FactSet Research Systems Inc.; nLipper Inc. |
How we invest
We view ourselves as business people buying businesses, and we consider the purchase of a stock as an ownership interest in a business. We strive to develop a proprietary view of a business through in-depth, fundamental research that includes careful financial statement analysis and meetings with company management teams. We then seek to purchase businesses whose stock prices are below what we have calculated to be the true value of the company based on its future cash flows, management performance and business fundamentals.
In conducting a comprehensive analysis of a company, we strive to identify primarily global stocks which have:
| n | Sustainable competitive advantages. |
| n | Strong growth prospects. |
| n | High barriers to entry. |
| n | Honest and capable management teams. |
Central to our discipline is our adherence to an investment horizon of three to five years. We use this long-term approach because we believe good business strategies usually take that amount of time to implement and produce strong earnings growth. We also use a concentrated portfolio approach, constructing a portfolio of about 20 to 40 stocks. We believe this allows each investment opportunity to materially impact the Fund’s performance.
While deliberate efforts are made to manage risk through industry diversification, our primary method of attempting to mitigate risk is to purchase businesses that are trading below their estimated intrinsic value.
Holdings are considered for sale if:
| n | A more attractive investment opportunity exists. |
| n | Full value of the investment is deemed to have been realized. |
Holdings are also considered for sale if the original thesis for buying the company changes due to a fundamental negative change in management strategy or a fundamental negative change in the competitive environment.
Market conditions and your Fund
The fiscal year ended October 31, 2013, saw slow but steady improvement in the US economy and strong US and global equity market returns. Businesses and consumers began the reporting period by digesting the results of the 2012 presidential election and contemplating its impact on their wallets. In late 2012 and early 2013, consumer confidence trended higher based on the recovery of the US housing market, but uncertainty surrounding the outcome of tax and spending negotiations between the White House and Congress – and implementation of sequestration spending cuts – left many businesses hesitant to spend.
Despite these headline events, equity markets focused more on longer term fundamentals. Major US and global stock market indexes rose throughout 2013, hitting multiyear or all-time highs.1
From late May through June, capital markets declined following US Federal Reserve (the Fed) Chairman Ben Bernanke’s comments suggesting the time had come to begin reducing the Fed’s extraordinary stimulus policies. This news, combined with data showing a slowdown in China’s economy, led to a correction in non-US stocks from the mid-May peak of the market. The most significantly impacted segments of the market were interest rate sensitive and commodity related sectors, as well as emerging markets. Markets stabilized in mid-summer and, despite some volatility in August surrounding a potential US military reaction
Portfolio Composition By sector | ||||
Information Technology | 24.5 | % | ||
Industrials | 9.7 | |||
Consumer Discretionary | 8.8 | |||
Energy | 7.9 | |||
Health Care | 7.8 | |||
Financials | 7.0 | |||
Materials | 5.2 | |||
Money Market Funds | ||||
Plus Other Assets Less Liabilities | 29.1 | |||
Top 10 Equity Holdings*
|
| |||||
1. | Hollysys Automation Technologies Ltd. | 4.4 | % | |||
2. | UDG Healthcare PLC | 4.0 | ||||
3. | Global Payments Inc. | 3.9 | ||||
4. | Rovi Corp. | 3.9 | ||||
5. | CETIP S.A. – Mercados Organizados | 3.9 | ||||
6. | Ipsos | 3.9 | ||||
7. | Ultra Petroleum Corp. | 3.7 | ||||
8. | DCC PLC | 3.3 | ||||
9. | ION Geophysical Corp. | 3.3 | ||||
10. | AastraTechnologies Ltd. | 3.2 | ||||
Total Net Assets | $ | 9.3 million | ||
Total Number of Holdings* | 26 | |||
The Fund’s holdings are subject to change, and there is no assurance that the Fund will continue to hold any particular security.
* Excluding money market fund holdings.
| 4 | Invesco Select Opportunities Fund |
to instability in Syria, they generally moved higher through the end of the fiscal year.
Our investment approach focuses on individual businesses rather than market sectors. Therefore, your Fund shares little in common with sector and regional weightings of various market indexes. However, if we were to broadly categorize businesses with which we had the most success during the reporting period, our investments in select health care and IT stocks were the largest contributors to Fund performance. One particular holding in the energy sector was the largest detractor. From a regional perspective, we had the most success in North American and European investments and the least success in Latin America and the Asia Pacific region. Our cash position hurt the Fund’s performance relative to its benchmarks in a rising market environment.
UDG Healthcare (formerly United Drug) was the largest contributor to Fund performance during the fiscal year. The company is a provider of outsourced services to pharmaceutical companies including distribution, contract sales and packaging. We first started monitoring this Irish company over seven years ago. At the time, we believed UDG Healthcare had a leading competitive position, was a dominant player in the Irish drug distribution market, was well managed and had nascent growth opportunities, but were concerned about the company’s valuation. We added the stock to the Fund’s portfolio because the company remained a leader in its sector, had capitalized on some of its growth opportunities and had additional opportunities to exhaust. The purchase was made at what we believed was an attractive valuation despite the fact that its valuation had been weighed down by negative investor sentiment toward Ireland, as well as the Irish government’s reduction of drug reimbursements due to budgetary pressures. We ignored the short-term noise and focused on the company’s long-term prospects. Ireland represents only about 30% of UDG Healthcare’s profits today, and the company still has attractive growth levers. Shares of the company rose during the reporting period as investors increasingly recognized the inherent value of this business. The company has made a number of attractively priced acquisitions that are aligned with its strategic vision. Investors have also become increasingly positive about UDG Healthcare’s wholesale business, which hasn’t deteriorated as fast as previously expected.
Another large contributor to Fund performance was Aastra Technologies, a European leader in enterprise-based phones, handsets and PBXs (telephone exchanges that serve a particular business or office). We believe the company can benefit in the long term from the secular trend that is underway to replace legacy analog and digital PBX with Internet-protocol PBX. The company’s share price appreciated after the Aastra Technologies management team announced a special dividend that represented approximately 25% of the company’s market capitalization at the time of the announcement.
ION Geophysical was the only detractor from absolute Fund performance during the fiscal year. ION Geophysical is a leader in small niches in offshore seismic activity for the oil and gas industry. The company is building its own library of data in areas that are typically very difficult to explore (e.g., the Arctic), yet represent some of the largest areas of undiscovered oil and gas on the planet. The company is exhibiting strong performance in this segment, which continues to grow at double-digit rates. Shares of ION Geophysical declined over the reporting period after the company’s management team announced disappointing operating results, largely a result of cost overruns involving a recently completed acquisition of its first 3-D marine program. We continue to believe in the long-term growth prospects of the business and took the opportunity to purchase more shares on ION Geophysical’s stock-price weakness. The company’s onshore seismic business entered a joint venture with a large Chinese services firm a few years ago and has gone from a money loser to modestly profitable while reinvigorating research and development.
While the rising market environment made it difficult for us to find new investment opportunities, we did make a few new investments and added to some of our existing holdings during periods of volatility. We also sold several holdings based on valuations and other factors.
During the fiscal year, we focused on finding quality businesses trading at attractive values relative to what we believe are their long-term prospects. In contrast, the market is often driven by short-term events or outlooks in both good times and bad. Market volatility allows us to take advantage of investment opportunities we believe will benefit your Fund in the long term.
While we can never predict future Fund performance, we pledge to you that we will
adhere to our discipline of being business people who buy businesses. We will continually strive to upgrade the quality of your Fund’s portfolio.
Thank you for your investment in Invesco Select Opportunities Fund.
| 1 | Source: Reuters |
The views and opinions expressed in management’s discussion of Fund performance are those of Invesco Advisers, Inc. These views and opinions are subject to change at any time based on factors such as market and economic conditions. These views and opinions may not be relied upon as investment advice or recommendations, or as an offer for a particular security. The information is not a complete analysis of every aspect of any market, country, industry, security or the Fund. Statements of fact are from sources considered reliable, but Invesco Advisers, Inc. makes no representation or warranty as to their completeness or accuracy. Although historical performance is no guarantee of future results, these insights may help you understand our investment management philosophy.
See important Fund and, if applicable, index disclosures later in this report.
 | Virginia Au Chartered Financial Analyst, portfolio manager, is lead manager of Invesco Select Opportunities Fund. She joined Invesco in 2006. | |
| Ms. Au earned a Bachelor of Commerce degree in finance from The University of British Columbia. | ||
 | Robert Mikalachki Chartered Financial Analyst, portfolio manager, is manager of Invesco Select Opportunities Fund. He joined Invesco in 1999. Mr. Mikalachki | |
| earned a business degree from Wilfrid Laurier University. | ||
 | Jason Whiting Chartered Financial Analyst, portfolio manager, is manager of Invesco Select Opportunities Fund. He joined Invesco in 2003. | |
| Mr. Whiting earned a BBA from Wilfrid Laurier University. | ||
| 5 | Invesco Select Opportunities Fund |
Your Fund’s Long-Term Performance
Results of a $10,000 Investment – Oldest Share Class(es) since Inception
Fund data from 8/3/12; index data from 7/31/12
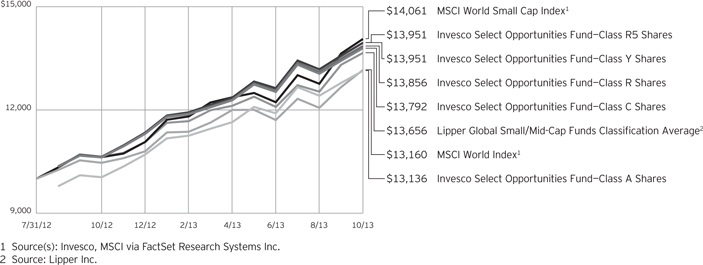
Past performance cannot guarantee comparable future results.
The data shown in the chart include reinvested distributions, applicable sales charges and Fund expenses including
management fees. Index results include reinvested dividends, but they do not reflect sales charges. Performance of the peer group, if applicable, reflects fund expenses and management fees;
performance of a market index does not. Performance shown in the chart and table(s) does not reflect deduction of taxes a shareholder would pay on Fund distributions or sale of Fund shares.
| 6 | Invesco Select Opportunities Fund |
| Average Annual Total Returns | |||||
| As of 10/31/13, including maximum applicable sales charges | |||||
| Class A Shares | |||||
| Inception (8/3/12) | 24.52 | % | |||
| 1 Year | 23.54 | ||||
| Class C Shares | |||||
| Inception (8/3/12) | 29.49 | % | |||
| 1 Year | 28.87 | ||||
| Class R Shares | |||||
| Inception (8/3/12) | 29.98 | % | |||
| 1 Year | 30.35 | ||||
| Class Y Shares | |||||
| Inception (8/3/12) | 30.69 | % | |||
| 1 Year | 31.11 | ||||
| Class R5 Shares | |||||
| Inception (8/3/12) | 30.69 | % | |||
| 1 Year | 31.12 | ||||
| Class R6 Shares | |||||
| Inception | 30.62 | % | |||
| 1 Year | 31.02 | ||||
Class R6 shares incepted on September 24, 2012. Performance shown prior to that date is that of Class A shares and includes the 12b-1 fees applicable to Class A shares. Class A share performance reflects any applicable fee waivers or expense reimbursements.
The performance data quoted represent past performance and cannot guarantee comparable future results; current performance may be lower or higher. Please visit invesco.com/performance for the most recent month-end performance. Performance figures reflect reinvested distributions, changes in net asset value and the effect of the maximum sales charge unless otherwise stated. Investment return and principal value will fluctuate so that you may have a gain or loss when you sell shares.
The net annual Fund operating expense ratio set forth in the most recent Fund prospectus as of the date of this report for Class A, Class C, Class R, Class Y, Class R5 and Class R6 shares was 1.51%, 2.26%, 1.76%, 1.26%, 1.26%, and 1.26%, respectively.1 The total annual Fund operating expense ratio set forth in the most recent Fund prospectus as of the date of this report for Class A, Class C, Class R, Class Y, Class R5 and Class R6 shares was 2.76%, 3.51%, 3.01%, 2.51%, 2.39% and 2.35%, respectively. The expense ratios presented
| Average Annual Total Returns | ||||
| As of 9/30/13, the most recent calendar quarter end, including maximum applicable sales charges | ||||
| Class A Shares | ||||
| Inception (8/3/12) | 23.66 | % | ||
| 1 Year | 19.65 | |||
| Class C Shares | ||||
| Inception (8/3/12) | 28.95 | % | ||
| 1 Year | 24.83 | |||
| Class R Shares | ||||
| Inception (8/3/12) | 29.48 | % | ||
| 1 Year | 26.32 | |||
| Class Y Shares | ||||
| Inception (8/3/12) | 30.09 | % | ||
| 1 Year | 26.89 | |||
| Class R5 Shares | ||||
| Inception (8/3/12) | 30.18 | % | ||
| 1 Year | 26.99 | |||
| Class R6 Shares | ||||
| Inception | 30.10 | % | ||
| 1 Year | 26.89 | |||
above may vary from the expense ratios presented in other sections of this report that are based on expenses incurred during the period covered by this report.
Class A share performance reflects the maximum 5.50% sales charge, and Class C share performance reflects the applicable contingent deferred sales charge (CDSC) for the period involved. The CDSC on Class C shares is 1% for the first year after purchase. Class R, Class Y, Class R5 and Class R6 shares do not have a front-end sales charge or a CDSC; therefore, performance is at net asset value.
The performance of the Fund’s share classes will differ primarily due to different sales charge structures and class expenses.
Had the adviser not waived fees and/or reimbursed expenses, performance would have been lower.
| 1 | Total annual Fund operating expenses after any contractual fee waivers and/or expense reimbursements by the adviser in effect through at least February 28, 2014. See current prospectus for more information. |
| 7 | Invesco Select Opportunities Fund |
Invesco Select Opportunities Fund’s investment objective is long-term growth of capital.
| n | Unless otherwise stated, information presented in this report is as of October 31, 2013, and is based on total net assets. |
| n | Unless otherwise noted, all data provided by Invesco. |
| n | To access your Fund’s reports/prospectus, visit invesco.com/fundreports. |
About share classes
| n | Class R shares are generally available only to employer sponsored retirement and benefit plans. Please see the prospectus for more information. |
| n | Class Y shares are available only to certain investors. Please see the prospectus for more information. |
| n | Class R5 shares and Class R6 shares are primarily intended for employer sponsored retirement and benefit plans that meet certain standards and for institutional investors. On September 24, 2012, Institutional Class shares were renamed Class R5 shares. Please see the prospectus for more information. |
Principal risks of investing in the Fund
| n | Cash/cash equivalents risk. Holding cash or cash equivalents may negatively affect performance. |
| n | Debt securities risk. The Fund may invest in debt securities that are affected by changing interest rates and changes in their effective maturities and credit quality. |
| n | Depository receipts risk. Depositary receipts involve many of the same risks as those associated with direct investment in foreign securities. In addition, the underlying issuers of certain depositary receipts, particularly unsponsored or unregistered depositary receipts, are under no obligation to distribute shareholder communications to the holders of such receipts or to pass through to them any voting rights with respect to the deposited securities. |
| n | Developing/emerging markets securities risk. The prices of securities issued by foreign companies and governments located in developing/emerging markets countries may be affected more negatively by inflation, devaluation of their currencies, higher transaction costs, delays in settlement, adverse political developments, the introduction of capital controls, withholding taxes, nationalization of private assets, expropriation, social unrest, war or lack of timely information than those in developed countries. |
| n | Foreign securities risk. The Fund’s foreign investments may be affected by changes in a foreign country’s exchange rates, political and social instability, changes in economic or taxation policies, difficulties when enforcing obligations, decreased liquidity, and increased volatility. Foreign companies may be subject to less regulation resulting in less publicly available information about the companies. |
| n | Management risk. The investment techniques and risk analysis used by the Fund’s portfolio managers may not produce the desired results. |
| n | Market risk. The prices of and the income generated by the Fund’s securities may decline in response to, among other things, investor sentiment, general economic and market conditions, regional or global instability, and currency and interest rate fluctuations. |
| n | Non-diversification risk. The Fund is non-diversified and can invest a greater portion of its assets in a small number of issuers or a single issuer. A change in the value of the issuer could affect the value of the Fund more than if it was a diversified fund. |
| n | Small- and mid-capitalization risk. Stocks of small- and mid-sized companies tend to be more vulnerable to adverse developments and may have little or no operating history or track record of success, and limited product lines, markets, management and financial resources. The securities of small- and mid-sized companies may be more volatile due to less market interest and less publicly available information about the issuer. They also may be illiquid or restricted as to resale, or may trade less frequently and in smaller volumes, all of which may cause difficulty when establishing or closing a position at a desirable price. |
| n | US government obligations risk. The Fund may invest in obligations issued by US government agencies and instrumentalities that may receive varying levels of support from the government, which could affect the Fund’s ability to recover should they default. |
About indexes used in this report
| n | The MSCI World IndexSM is an unmanaged index considered representative of stocks of developed countries. The index is computed using the net return, which withholds applicable taxes for non-resident investors. |
| n | The MSCI World Small Cap Index is an unmanaged index considered representative of small-cap stocks of global developed markets. The index is computed using the net return, which withholds applicable taxes for non-resident investors. |
| n | The Lipper Global Small/Mid-Cap Funds Classification Average represents an average of all funds in the Lipper Global Small/Mid-Cap Funds classification. |
| n | The Fund is not managed to track the performance of any particular index, including the index(es) described here, and consequently, the performance of the Fund may deviate significantly from the performance of the index(es). |
| n | A direct investment cannot be made in an index. Unless otherwise indicated, index results include reinvested dividends, and they do not reflect sales charges. Performance of the peer group, if applicable, reflects fund expenses; performance of a market index does not. |
Other information
| n | The returns shown in management’s discussion of Fund performance are based on net asset values calculated for shareholder transactions. Generally accepted accounting principles require adjustments to be made to the net assets of the Fund at period end for financial reporting purposes, and as such, the net asset values for shareholder transactions and the returns based on those net asset values may differ from the net asset values and returns reported in the Financial Highlights. |
| n | Industry classifications used in this report are generally according to the Global Industry Classification Standard, which was developed by and is the exclusive property and a service mark of MSCI Inc. and Standard & Poor’s. |
This report must be accompanied or preceded by a currently effective Fund prospectus, which contains more complete information, including sales charges and expenses. Investors should read it carefully before investing.
NOT FDIC INSURED | MAY LOSE VALUE | NO BANK GUARANTEE
| Fund Nasdaq Symbols | ||||
Class A Shares | IZSAX | |||
Class C Shares | IZSCX | |||
Class R Shares | IZSRX | |||
Class Y Shares | IZSYX | |||
Class R5 Shares | IZSIX | |||
Class R6 Shares | IZFSX | |||
| 8 | Invesco Select Opportunities Fund |
Schedule of Investments
October 31, 2013
| Shares | Value | |||||||
Common Stocks & Other Equity Interests–70.88% |
| |||||||
| Brazil–3.87% | ||||||||
CETIP S.A.–Mercados Organizados | 32,400 | $ | 359,324 | |||||
| Canada–3.86% | ||||||||
Aastra Technologies Ltd. | 10,978 | 298,615 | ||||||
MEGA Brands Inc.(a) | 3,944 | 59,391 | ||||||
| 358,006 | ||||||||
| China–4.35% | ||||||||
Hollysys Automation Technologies Ltd.(a) | 24,106 | 404,258 | ||||||
| France–8.07% | ||||||||
Euler Hermes S.A. | 1,153 | 152,222 | ||||||
Ipsos | 8,465 | 357,028 | ||||||
Vicat S.A. | 3,217 | 240,443 | ||||||
| 749,693 | ||||||||
| Hong Kong–1.72% | ||||||||
Fairwood Holdings Ltd. | 78,000 | 159,763 | ||||||
| Ireland–8.77% | ||||||||
DCC PLC | 6,909 | 310,051 | ||||||
Grafton Group PLC(b) | 13,462 | 128,423 | ||||||
UDG Healthcare PLC | 75,035 | 375,347 | ||||||
| 813,821 | ||||||||
| Netherlands–5.31% | ||||||||
Aalberts Industries N.V. | 8,389 | 250,541 | ||||||
Kendrion N.V. | 7,718 | 242,059 | ||||||
| 492,600 | ||||||||
| Norway–0.92% | ||||||||
Prosafe S.E. | 9,946 | 85,286 | ||||||
| Shares | Value | |||||||
| Sweden–1.05% | ||||||||
Biotage AB | 62,766 | $ | 97,822 | |||||
| United Kingdom–1.53% | ||||||||
Charles Taylor PLC | 39,867 | 141,609 | ||||||
| United States–31.43% | ||||||||
Alere, Inc.(a) | 7,493 | 252,739 | ||||||
Alliance Data Systems Corp.(a) | 1,256 | 297,747 | ||||||
American Public Education Inc.(a) | 5,932 | 237,458 | ||||||
Booz Allen Hamilton Holding Corp. | 14,656 | 290,189 | ||||||
Cubic Corp. | 3,995 | 209,738 | ||||||
Global Payments Inc. | 6,153 | 365,980 | ||||||
International Rectifier Corp.(a) | 9,846 | 256,390 | ||||||
ION Geophysical Corp.(a) | 65,797 | 305,298 | ||||||
Rovi Corp.(a) | 21,484 | 360,072 | ||||||
Ultra Petroleum Corp.(a) | 18,630 | 342,047 | ||||||
| 2,917,658 | ||||||||
Total Common Stocks & Other Equity Interests |
| 6,579,840 | ||||||
Money Market Funds–29.70% |
| |||||||
Liquid Assets Portfolio–Institutional Class(c) | 1,378,473 | 1,378,473 | ||||||
Premier Portfolio–Institutional Class(c) | 1,378,473 | 1,378,473 | ||||||
Total Money Market Funds |
| 2,756,946 | ||||||
TOTAL INVESTMENTS–100.58% |
| 9,336,786 | ||||||
OTHER ASSETS LESS LIABILITIES–(0.58)% |
| (53,371 | ) | |||||
NET ASSETS–100.00% |
| $ | 9,283,415 | |||||
Notes to Schedule of Investments:
| (a) | Non-income producing security. |
| (b) | Each unit represents one ordinary share, seventeen Class A shares and one Class C share. |
| (c) | The money market fund and the Fund are affiliated by having the same investment adviser. |
See accompanying Notes to Financial Statements which are an integral part of the financial statements.
9 Invesco Select Opportunities Fund
Statement of Assets and Liabilities
October 31, 2013
Assets: |
| |||
Investments, at value (Cost $5,273,359) | $ | 6,579,840 | ||
Investments in affiliated money market funds, at value and cost | 2,756,946 | |||
Total investments, at value (Cost $8,030,305) | 9,336,786 | |||
Cash | 134,073 | |||
Foreign currencies, at value (Cost $120,066) | 117,717 | |||
Receivable for: | ||||
Fund shares sold | 172,853 | |||
Dividends | 5,038 | |||
Investment for trustee deferred compensation and retirement plans | 5,808 | |||
Other assets | 27,290 | |||
Total assets | 9,799,565 | |||
Liabilities: |
| |||
Payable for: | ||||
Investments purchased | 401,611 | |||
Fund shares reacquired | 46,899 | |||
Accrued fees to affiliates | 22,426 | |||
Accrued trustees’ and officers’ fees and benefits | 1,965 | |||
Accrued other operating expenses | 37,441 | |||
Trustee deferred compensation and retirement plans | 5,808 | |||
Total liabilities | 516,150 | |||
Net assets applicable to shares outstanding | $ | 9,283,415 | ||
Net assets consist of: |
| |||
Shares of beneficial interest | $ | 7,844,034 | ||
Undistributed net investment income | 46,400 | |||
Undistributed net realized gain | 86,681 | |||
Net unrealized appreciation | 1,306,300 | |||
| $ | 9,283,415 | |||
Net Assets: |
| |||
Class A | $ | 5,018,865 | ||
Class C | $ | 527,327 | ||
Class R | $ | 67,635 | ||
Class Y | $ | 3,610,498 | ||
Class R5 | $ | 46,372 | ||
Class R6 | $ | 12,718 | ||
Shares outstanding, $0.001 par value per share, |
| |||
Class A | 366,464 | |||
Class C | 38,806 | |||
Class R | 4,953 | |||
Class Y | 262,826 | |||
Class R5 | 3,375 | |||
Class R6 | 926 | |||
Class A: | ||||
Net asset value per share | $ | 13.70 | ||
Maximum offering price per share | ||||
(Net asset value of $13.70 ¸ 94.50%) | $ | 14.50 | ||
Class C: | ||||
Net asset value and offering price per share | $ | 13.59 | ||
Class R: | ||||
Net asset value and offering price per share | $ | 13.66 | ||
Class Y: | ||||
Net asset value and offering price per share | $ | 13.74 | ||
Class R5: | ||||
Net asset value and offering price per share | $ | 13.74 | ||
Class R6: | ||||
Net asset value and offering price per share | $ | 13.73 | ||
See accompanying Notes to Financial Statements which are an integral part of the financial statements.
10 Invesco Select Opportunities Fund
Statement of Operations
For the year ended October 31, 2013
Investment income: |
| |||
Dividends (net of foreign withholding taxes of $15,897) | $ | 122,338 | ||
Dividends from affiliated money market funds | 1,259 | |||
Total investment income | 123,597 | |||
Expenses: | ||||
Advisory fees | 42,725 | |||
Administrative services fees | 50,000 | |||
Custodian fees | 6,383 | |||
Distribution fees: | ||||
Class A | 6,846 | |||
Class C | 1,784 | |||
Class R | 155 | |||
Transfer agent fees — A, B, C, R and Y | 6,267 | |||
Transfer agent fees — R5 | 32 | |||
Transfer agent fees — R6 | 10 | |||
Trustees’ and officers’ fees and benefits | 22,955 | |||
Registration and filing fees | 110,693 | |||
Professional services fees | 50,235 | |||
Other | 26,959 | |||
Total expenses | 325,044 | |||
Less: Fees waived and expenses reimbursed | (251,314 | ) | ||
Net expenses | 73,730 | |||
Net investment income | 49,867 | |||
Realized and unrealized gain from: | ||||
Net realized gain from: | ||||
Investment securities | 87,066 | |||
Foreign currencies | 401 | |||
| 87,467 | ||||
Change in net unrealized appreciation (depreciation) of: | ||||
Investment securities | 1,192,216 | |||
Foreign currencies | (227 | ) | ||
| 1,191,989 | ||||
Net realized and unrealized gain | 1,279,456 | |||
Net increase in net assets resulting from operations | $ | 1,329,323 | ||
See accompanying Notes to Financial Statements which are an integral part of the financial statements.
11 Invesco Select Opportunities Fund
Statement of Changes in Net Assets
For the year ended October 31, 2013 and the period August 3, 2012 (commencement date) through October 31, 2012
| 2013 | August 3, 2012 (commencement date) to October 31,2012 | |||||||
Operations: |
| |||||||
Net investment income | $ | 49,867 | $ | 203 | ||||
Net realized gain | 87,467 | 9,977 | ||||||
Change in net unrealized appreciation | 1,191,989 | 114,311 | ||||||
Net increase in net assets resulting from operations | 1,329,323 | 124,491 | ||||||
Distributions to shareholders from net investment income: | ||||||||
Class A | (9,673 | ) | — | |||||
Class C | (244 | ) | — | |||||
Class R | (76 | ) | — | |||||
Class Y | (7,928 | ) | — | |||||
Class R5 | (78 | ) | — | |||||
Class R6 | (73 | ) | — | |||||
Total distributions from net investment income | (18,072 | ) | — | |||||
Distributions to shareholders from net realized gains: | ||||||||
Class A | (11,089 | ) | — | |||||
Class C | (296 | ) | — | |||||
Class R | (88 | ) | — | |||||
Class Y | (8,938 | ) | — | |||||
Class R5 | (89 | ) | — | |||||
Class R6 | (82 | ) | — | |||||
Total distributions from net realized gains | (20,582 | ) | — | |||||
Share transactions–net: | ||||||||
Class A | 3,169,496 | 1,124,851 | ||||||
Class C | 395,832 | 90,586 | ||||||
Class R | 48,911 | 10,010 | ||||||
Class Y | 1,993,912 | 986,510 | ||||||
Class R5 | 28,137 | 10,010 | ||||||
Class R6 | — | 10,000 | ||||||
Net increase in net assets resulting from share transactions | 5,636,288 | 2,231,967 | ||||||
Net increase in net assets | 6,926,957 | 2,356,458 | ||||||
Net assets: | ||||||||
Beginning of year | 2,356,458 | — | ||||||
End of year (includes undistributed net investment income of $46,400 and $14,204, respectively) | $ | 9,283,415 | $ | 2,356,458 | ||||
Notes to Financial Statements
October 31, 2013
NOTE 1—Significant Accounting Policies
Invesco Select Opportunities Fund (the “Fund”) is a series portfolio of AIM International Mutual Funds (Invesco International Mutual Funds) (the “Trust”). The Trust is a Delaware statutory trust registered under the Investment Company Act of 1940, as amended (the “1940 Act”), as an open-end series management investment company consisting of eight separate portfolios, each authorized to issue an unlimited number of shares of beneficial interest. The assets, liabilities and operations of each portfolio are accounted for separately. Information presented in these financial statements pertains only to the Fund. Matters affecting each portfolio or class will be voted on exclusively by the shareholders of such portfolio or class.
The Fund’s investment objective is long-term growth of capital.
The Fund currently consists of six different classes of shares: Class A, Class C, Class R, Class Y, Class R5 and Class R6. Class A shares are sold with a front-end sales charge unless certain waiver criteria are met and under certain circumstances load waiver shares may be subject to contingent deferred sales charges (“CDSC”). Class C shares are sold with a CDSC. Class R, Class Y, Class R5 and Class R6 shares are sold at net asset value.
12 Invesco Select Opportunities Fund
The following is a summary of the significant accounting policies followed by the Fund in the preparation of its financial statements.
| A. | Security Valuations — Securities, including restricted securities, are valued according to the following policy. |
A security listed or traded on an exchange (except convertible bonds) is valued at its last sales price or official closing price as of the close of the customary trading session on the exchange where the security is principally traded, or lacking any sales or official closing price on a particular day, the security may be valued at the closing bid price on that day. Securities traded in the over-the-counter market are valued based on prices furnished by independent pricing services or market makers. When such securities are valued by an independent pricing service they may be considered fair valued. Futures contracts are valued at the final settlement price set by an exchange on which they are principally traded. Listed options are valued at the mean between the last bid and ask prices from the exchange on which they are principally traded. Options not listed on an exchange are valued by an independent source at the mean between the last bid and ask prices. For purposes of determining net asset value per share, futures and option contracts generally are valued 15 minutes after the close of the customary trading session of the New York Stock Exchange (“NYSE”).
Investments in open-end and closed-end registered investment companies that do not trade on an exchange are valued at the end of day net asset value per share. Investments in open-end and closed-end registered investment companies that trade on an exchange are valued at the last sales price or official closing price as of the close of the customary trading session on the exchange where the security is principally traded.
Debt obligations (including convertible bonds) and unlisted equities are fair valued using an evaluated quote provided by an independent pricing service. Evaluated quotes provided by the pricing service may be determined without exclusive reliance on quoted prices, and may reflect appropriate factors such as institution-size trading in similar groups of securities, developments related to specific securities, dividend rate (for unlisted equities), yield (for debt obligations), quality, type of issue, coupon rate (for debt obligations), maturity (for debt obligations), individual trading characteristics and other market data. Debt obligations are subject to interest rate and credit risks. In addition, all debt obligations involve some risk of default with respect to interest and/or principal payments.
Foreign securities’ (including foreign exchange contracts) prices are converted into U.S. dollar amounts using the applicable exchange rates as of the close of the NYSE. If market quotations are available and reliable for foreign exchange-traded equity securities, the securities will be valued at the market quotations. Because trading hours for certain foreign securities end before the close of the NYSE, closing market quotations may become unreliable. If between the time trading ends on a particular security and the close of the customary trading session on the NYSE, events occur that the Adviser determines are significant and make the closing price unreliable, the Fund may fair value the security. If the event is likely to have affected the closing price of the security, the security will be valued at fair value in good faith using procedures approved by the Board of Trustees. Adjustments to closing prices to reflect fair value may also be based on a screening process of an independent pricing service to indicate the degree of certainty, based on historical data, that the closing price in the principal market where a foreign security trades is not the current value as of the close of the NYSE. Foreign securities’ prices meeting the approved degree of certainty that the price is not reflective of current value will be priced at the indication of fair value from the independent pricing service. Multiple factors may be considered by the independent pricing service in determining adjustments to reflect fair value and may include information relating to sector indices, American Depositary Receipts and domestic and foreign index futures. Foreign securities may have additional risks including exchange rate changes, potential for sharply devalued currencies and high inflation, political and economic upheaval, the relative lack of issuer information, relatively low market liquidity and the potential lack of strict financial and accounting controls and standards.
Securities for which market prices are not provided by any of the above methods may be valued based upon quotes furnished by independent sources. The last bid price may be used to value equity securities. The mean between the last bid and asked prices is used to value debt obligations, including corporate loans.
Securities for which market quotations are not readily available or became unreliable are valued at fair value as determined in good faith by or under the supervision of the Trust’s officers following procedures approved by the Board of Trustees. Issuer specific events, market trends, bid/ask quotes of brokers and information providers and other market data may be reviewed in the course of making a good faith determination of a security’s fair value.
Valuations change in response to many factors including the historical and prospective earnings of the issuer, the value of the issuer’s assets, general economic conditions, interest rates, investor perceptions and market liquidity. Because of the inherent uncertainties of valuation, the values reflected in the financial statements may materially differ from the value received upon actual sale of those investments.
| B. | Securities Transactions and Investment Income — Securities transactions are accounted for on a trade date basis. Realized gains or losses on sales are computed on the basis of specific identification of the securities sold. Interest income is recorded on the accrual basis from settlement date. Dividend income (net of withholding tax, if any) is recorded on the ex-dividend date. |
The Fund may periodically participate in litigation related to Fund investments. As such, the Fund may receive proceeds from litigation settlements. Any proceeds received are included in the Statement of Operations as realized gain (loss) for investments no longer held and as unrealized gain (loss) for investments still held.
Brokerage commissions and mark ups are considered transaction costs and are recorded as an increase to the cost basis of securities purchased and/or a reduction of proceeds on a sale of securities. Such transaction costs are included in the determination of net realized and unrealized gain (loss) from investment securities reported in the Statement of Operations and the Statement of Changes in Net Assets and the net realized and unrealized gains (losses) on securities per share in the Financial Highlights. Transaction costs are included in the calculation of the Fund’s net asset value and, accordingly, they reduce the Fund’s total returns. These transaction costs are not considered operating expenses and are not reflected in net investment income reported in the Statement of Operations and Statement of Changes in Net Assets, or the net investment income per share and ratios of expenses and net investment income reported in the Financial Highlights, nor are they limited by any expense limitation arrangements between the Fund and the investment adviser.
The Fund allocates income and realized and unrealized capital gains and losses to a class based on the relative net assets of each class.
| C. | Country Determination — For the purposes of making investment selection decisions and presentation in the Schedule of Investments, the investment adviser may determine the country in which an issuer is located and/or credit risk exposure based on various factors. These factors include the laws of the country under which the issuer is organized, where the issuer maintains a principal office, the country in which the issuer derives 50% or more of its total revenues and the country that has the primary market for the issuer’s securities, as well as other criteria. Among the other criteria that may be evaluated for making this determination are the country in which the issuer maintains 50% or more of its assets, |
13 Invesco Select Opportunities Fund
| the type of security, financial guarantees and enhancements, the nature of the collateral and the sponsor organization. Country of issuer and/or credit risk exposure has been determined to be the United States of America, unless otherwise noted. |
| D. | Distributions — Distributions from income and net realized capital gain, if any, are generally declared and paid annually and recorded on the ex-dividend date. The Fund may elect to treat a portion of the proceeds from redemptions as distributions for federal income tax purposes. |
| E. | Federal Income Taxes — The Fund intends to comply with the requirements of Subchapter M of the Internal Revenue Code of 1986, as amended (the “Internal Revenue Code”), necessary to qualify as a regulated investment company and to distribute substantially all of the Fund’s taxable earnings to shareholders. As such, the Fund will not be subject to federal income taxes on otherwise taxable income (including net realized capital gain) that is distributed to shareholders. Therefore, no provision for federal income taxes is recorded in the financial statements. |
The Fund files tax returns in the U.S. Federal jurisdiction and certain other jurisdictions. Generally, the Fund is subject to examinations by such taxing authorities for up to three years after the filing of the return for the tax period.
| F. | Expenses — Fees provided for under the Rule 12b-1 plan of a particular class of the Fund are charged to the operations of such class. Transfer agency fees and expenses and other shareholder recordkeeping fees and expenses attributable to Class R5 and Class R6 are allocated to each share class based on relative net assets. Sub-accounting fees attributable to Class R5 are charged to the operations of the class. Transfer agency fees and expenses and other shareholder recordkeeping fees and expenses relating to all other classes are allocated among those classes based on relative net assets. All other expenses are allocated among the classes based on relative net assets. |
| G. | Accounting Estimates — The preparation of financial statements in conformity with accounting principles generally accepted in the United States of America (“GAAP”) requires management to make estimates and assumptions that affect the reported amounts of assets and liabilities at the date of the financial statements and the reported amounts of revenues and expenses during the reporting period including estimates and assumptions related to taxation. Actual results could differ from those estimates by a significant amount. In addition, the Fund monitors for material events or transactions that may occur or become known after the period-end date and before the date the financial statements are released to print. |
| H. | Indemnifications — Under the Trust’s organizational documents, each Trustee, officer, employee or other agent of the Trust is indemnified against certain liabilities that may arise out of the performance of their duties to the Fund. Additionally, in the normal course of business, the Fund enters into contracts, including the Fund’s servicing agreements, that contain a variety of indemnification clauses. The Fund’s maximum exposure under these arrangements is unknown as this would involve future claims that may be made against the Fund that have not yet occurred. The risk of material loss as a result of such indemnification claims is considered remote. |
| I. | Foreign Currency Translations — Foreign currency is valued at the close of the NYSE based on quotations posted by banks and major currency dealers. Portfolio securities and other assets and liabilities denominated in foreign currencies are translated into U.S. dollar amounts at date of valuation. Purchases and sales of portfolio securities (net of foreign taxes withheld on disposition) and income items denominated in foreign currencies are translated into U.S. dollar amounts on the respective dates of such transactions. The Fund does not separately account for the portion of the results of operations resulting from changes in foreign exchange rates on investments and the fluctuations arising from changes in market prices of securities held. The combined results of changes in foreign exchange rates and the fluctuation of market prices on investments (net of estimated foreign tax withholding) are included with the net realized and unrealized gain or loss from investments in the Statement of Operations. Reported net realized foreign currency gains or losses arise from (1) sales of foreign currencies, (2) currency gains or losses realized between the trade and settlement dates on securities transactions, and (3) the difference between the amounts of dividends, interest, and foreign withholding taxes recorded on the Fund’s books and the U.S. dollar equivalent of the amounts actually received or paid. Net unrealized foreign currency gains and losses arise from changes in the fair values of assets and liabilities, other than investments in securities at fiscal period end, resulting from changes in exchange rates. |
The Fund may invest in foreign securities which may be subject to foreign taxes on income, gains on investments or currency repatriation, a portion of which may be recoverable.
| J. | Foreign Currency Contracts — The Fund may enter into foreign currency contracts to manage or minimize currency or exchange rate risk. The Fund may also enter into foreign currency contracts for the purchase or sale of a security denominated in a foreign currency in order to “lock in” the U.S. dollar price of that security. A foreign currency contract is an obligation to purchase or sell a specific currency for an agreed-upon price at a future date. The use of foreign currency contracts does not eliminate fluctuations in the price of the underlying securities the Fund owns or intends to acquire but establishes a rate of exchange in advance. Fluctuations in the value of these contracts are measured by the difference in the contract date and reporting date exchange rates and are recorded as unrealized appreciation (depreciation) until the contracts are closed. When the contracts are closed, realized gains (losses) are recorded. Realized and unrealized gains (losses) on the contracts are included in the Statement of Operations. The primary risks associated with foreign currency contracts include failure of the counterparty to meet the terms of the contract and the value of the foreign currency changing unfavorably. These risks may be in excess of the amounts reflected in the Statement of Assets and Liabilities. |
14 Invesco Select Opportunities Fund
NOTE 2—Advisory Fees and Other Fees Paid to Affiliates
The Trust has entered into a master investment advisory agreement with Invesco Advisers, Inc. (the “Adviser” or “Invesco”). Under the terms of the investment advisory agreement, the Fund pays an advisory fee to the Adviser based on the annual rate of the Fund’s average daily net assets as follows:
| Average Daily Net Assets | Rate | |||
First $250 million | 0.80% | |||
Next $250 million | 0.78% | |||
Next $500 million | 0.76% | |||
Next $1.5 billion | 0.74% | |||
Next $2.5 billion | 0.72% | |||
Next $2.5 billion | 0.70% | |||
Next $2.5 billion | 0.68% | |||
Over $10 billion | 0.66% | |||
Under the terms of a master sub-advisory agreement between the Adviser and each of Invesco Asset Management Deutschland GmbH, Invesco Asset Management Limited, Invesco Asset Management (Japan) Limited, Invesco Australia Limited, Invesco Hong Kong Limited, Invesco Senior Secured Management, Inc., Invesco Canada Ltd. and Invesco PowerShares Capital Management LLC (collectively, the “Affiliated Sub-Advisers”) the Adviser, not the Fund, may pay 40% of the fees paid to the Adviser to any such Affiliated Sub-Adviser(s) that provide(s) discretionary investment management services to the Fund based on the percentage of assets allocated to such Sub-Adviser(s).
The Adviser has contractually agreed, through February 28, 2014, to waive advisory fees and/or reimburse expenses of all shares to the extent necessary to limit total annual fund operating expenses after fee waiver and/or expense reimbursement (excluding certain items discussed below) of Class A, Class C, Class R, Class Y, Class R5 and Class R6 shares to 1.51%, 2.26%, 1.76%, 1.26%, 1.26% and 1.26%, respectively, of average daily net assets. In determining the Adviser’s obligation to waive advisory fees and/or reimburse expenses, the following expenses are not taken into account, and could cause the total annual fund operating expenses after fee waiver and/or expense reimbursement to exceed the numbers reflected above: (1) interest; (2) taxes; (3) dividend expense on short sales; (4) extraordinary or non-routine items, litigation expenses; and (5) expenses that the Fund has incurred but did not actually pay because of an expense offset arrangement.
Further, the Adviser has contractually agreed, through June 30, 2014, to waive the advisory fee payable by the Fund in an amount equal to 100% of the net advisory fees the Adviser receives from the affiliated money market funds on investments by the Fund of uninvested cash in such affiliated money market funds.
For the year ended October 31, 2013, the Adviser waived advisory fees and reimbursed fund level expenses of $245,005 and reimbursed class level expenses of $3,239, $211, $37, $2,780, $32 and $10 for Class A, Class C, Class R, Class Y, Class R5 and Class R6 shares, respectively.
The Trust has entered into a transfer agency and service agreement with Invesco Investment Services, Inc. (“IIS”) pursuant to which the Fund has agreed to pay IIS a fee for providing transfer agency and shareholder services to the Fund and reimburse IIS for certain expenses incurred by IIS in the course of providing such services. IIS may make payments to intermediaries that provide omnibus account services, sub-accounting services and/or networking services. All fees payable by IIS to intermediaries that provide omnibus account services or sub-accounting are charged back to the Fund, subject to certain limitations approved by the Trust’s Board of Trustees. For the year ended October 31, 2013, expenses incurred under the agreement are shown in the Statement of Operations as Transfer agent fees.
The Trust has entered into a master administrative services agreement with Invesco pursuant to which the Fund has agreed to pay Invesco for certain administrative costs incurred in providing accounting services to the Fund. For the year ended October 31, 2013, expenses incurred under the agreement are shown in the Statement of Operations as Administrative services fees.
The Trust has entered into master distribution agreements with Invesco Distributors, Inc. (“IDI”) to serve as the distributor for the Class A, Class C, Class R, Class Y, Class R5 and Class R6 shares of the Fund. The Trust has adopted plans pursuant to Rule 12b-1 under the 1940 Act with respect to the Fund’s Class A, Class C and Class R shares (collectively, the “Plans”). The Fund, pursuant to the Plans, pays IDI compensation at the annual rate of 0.25% of the Fund’s average daily net assets of Class A shares, 1.00% of the average daily net assets of Class C shares and 0.50% of the average daily net assets of Class R shares. Of the Plan payments, up to 0.25% of the average daily net assets of each class of shares may be paid to furnish continuing personal shareholder services to customers who purchase and own shares of such classes. Any amounts not paid as a service fee under the Plans would constitute an asset-based sales charge. Rules of the Financial Industry Regulatory Authority (“FINRA”) impose a cap on the total sales charges, including asset-based sales charges, that may be paid by any class of shares of the Fund. For the year ended October 31, 2013, expenses incurred under the Plans are shown in the Statement of Operations as Distribution fees.
Front-end sales commissions and CDSC (collectively, the “sales charges”) are not recorded as expenses of the Fund. Front-end sales commissions are deducted from proceeds from the sales of Fund shares prior to investment in Class A shares of the Fund. CDSC are deducted from redemption proceeds prior to remittance to the shareholder. During the year ended October 31, 2013, IDI advised the Fund that IDI retained $2,710 in front-end sales commissions from the sale of Class A shares and $31 from Class C shares, for CDSC imposed upon redemptions by shareholders.
Certain officers and trustees of the Trust are officers and directors of the Adviser, IIS and/or IDI.
15 Invesco Select Opportunities Fund
NOTE 3—Additional Valuation Information
GAAP defines fair value as the price that would be received to sell an asset or paid to transfer a liability in an orderly transaction between market participants at the measurement date, under current market conditions. GAAP establishes a hierarchy that prioritizes the inputs to valuation methods, giving the highest priority to readily available unadjusted quoted prices in an active market for identical assets (Level 1) and the lowest priority to significant unobservable inputs (Level 3), generally when market prices are not readily available or are unreliable. Based on the valuation inputs, the securities or other investments are tiered into one of three levels. Changes in valuation methods may result in transfers in or out of an investment’s assigned level:
| Level 1 — | Prices are determined using quoted prices in an active market for identical assets. |
| Level 2 — | Prices are determined using other significant observable inputs. Observable inputs are inputs that other market participants may use in pricing a security. These may include quoted prices for similar securities, interest rates, prepayment speeds, credit risk, yield curves, loss severities, default rates, discount rates, volatilities and others. |
| Level 3 — | Prices are determined using significant unobservable inputs. In situations where quoted prices or observable inputs are unavailable (for example, when there is little or no market activity for an investment at the end of the period), unobservable inputs may be used. Unobservable inputs reflect the Fund’s own assumptions about the factors market participants would use in determining fair value of the securities or instruments and would be based on the best available information. |
The following is a summary of the tiered valuation input levels, as of October 31, 2013. The level assigned to the securities valuations may not be an indication of the risk or liquidity associated with investing in those securities. Because of the inherent uncertainties of valuation, the values reflected in the financial statements may materially differ from the value received upon actual sale of those investments.
During the year ended October 31, 2013, there were transfers from Level 1 to Level 2 of $141,609 and from Level 2 to Level 1 of $237,509, due to foreign fair value adjustments.
| Level 1 | Level 2 | Level 3 | Total | |||||||||||||
Brazil | $ | 359,324 | $ | — | $ | — | $ | 359,324 | ||||||||
Canada | 358,006 | — | — | 358,006 | ||||||||||||
China | 404,258 | — | — | 404,258 | ||||||||||||
France | 749,693 | — | — | 749,693 | ||||||||||||
Hong Kong | 159,763 | — | — | 159,763 | ||||||||||||
Ireland | 813,821 | — | — | 813,821 | ||||||||||||
Netherlands | 242,059 | 250,541 | — | 492,600 | ||||||||||||
Norway | 85,286 | — | — | 85,286 | ||||||||||||
Sweden | 97,822 | — | — | 97,822 | ||||||||||||
United Kingdom | — | 141,609 | — | 141,609 | ||||||||||||
United States | 5,674,604 | — | — | 5,674,604 | ||||||||||||
Total Investments | $ | 8,944,636 | $ | 392,150 | $ | — | $ | 9,336,786 | ||||||||
NOTE 4—Trustees’ and Officers’ Fees and Benefits
Trustees’ and Officers’ Fees and Benefits include amounts accrued by the Fund to pay remuneration to certain Trustees and Officers of the Fund. Trustees have the option to defer compensation payable by the Fund, and Trustees’ and Officers’ Fees and Benefits also include amounts accrued by the Fund to fund such deferred compensation amounts. Those Trustees who defer compensation have the option to select various Invesco Funds in which their deferral accounts shall be deemed to be invested. Finally, certain current Trustees are eligible to participate in a retirement plan that provides for benefits to be paid upon retirement to Trustees over a period of time based on the number of years of service. The Fund may have certain former Trustees who also participate in a retirement plan and receive benefits under such plan. Trustees’ and Officers’ Fees and Benefits include amounts accrued by the Fund to fund such retirement benefits. Obligations under the deferred compensation and retirement plans represent unsecured claims against the general assets of the Fund.
NOTE 5—Cash Balances
The Fund is permitted to temporarily carry a negative or overdrawn balance in its account with State Street Bank and Trust Company, the custodian bank. Such balances, if any at period end, are shown in the Statement of Assets and Liabilities under the payable caption Amount due custodian. To compensate the custodian bank for such overdrafts, the overdrawn Fund may either (1) leave funds as a compensating balance in the account so the custodian bank can be compensated by earning the additional interest; or (2) compensate by paying the custodian bank at a rate agreed upon by the custodian bank and Invesco, not to exceed the contractually agreed upon rate.
16 Invesco Select Opportunities Fund
NOTE 6—Distributions to Shareholders and Tax Components of Net Assets
Tax Character of Distributions to Shareholders Paid During the Year Ended October 31, 2013 and the Period August 3, 2012 (commencement date) through October 31, 2012:
| 2013 | 2012 | |||||||
Ordinary income | $ | 38,654 | $ | — | ||||
Tax Components of Net Assets at Period-End:
| 2013 | ||||
Undistributed ordinary income | $ | 137,666 | ||
Net unrealized appreciation — investments | 1,306,481 | |||
Net unrealized appreciation (depreciation) — other investments | (181 | ) | ||
Temporary book/tax differences | (4,585 | ) | ||
Shares of beneficial interest | 7,844,034 | |||
Total net assets | $ | 9,283,415 | ||
The temporary book/tax differences are a result of timing differences between book and tax recognition of income and/or expenses. The Fund’s temporary book/tax differences are the result of the trustee deferral of compensation and retirement plan benefits.
Capital loss carryforward is calculated and reported as of a specific date. Results of transactions and other activity after that date may affect the amount of capital loss carryforward actually available for the Fund to utilize. Capital losses generated in years beginning after December 22, 2010 can be carried forward for an unlimited period, whereas previous losses expire in 8 tax years. Capital losses with an expiration period may not be used to offset capital gains until all net capital losses without an expiration date have been utilized. Capital loss carryforwards with no expiration date will retain their character as either short-term or long-term capital losses instead of as short-term capital losses as under prior law. The ability to utilize capital loss carryforward in the future may be limited under the Internal Revenue Code and related regulations based on the results of future transactions.
The Fund does not have a capital loss carryforward as of October 31, 2013.
NOTE 7—Investment Securities
The aggregate amount of investment securities (other than short-term securities, U.S. Treasury obligations and money market funds, if any) purchased and sold by the Fund during the year ended October 31, 2013 was $4,023,201 and $366,243, respectively. Cost of investments on a tax basis includes the adjustments for financial reporting purposes as of the most recently completed federal income tax reporting period-end.
| Unrealized Appreciation (Depreciation) of Investment Securities on a Tax Basis | ||||
Aggregate unrealized appreciation of investment securities | $ | 1,405,172 | ||
Aggregate unrealized (depreciation) of investment securities | (98,691 | ) | ||
Net unrealized appreciation of investment securities | $ | 1,306,481 | ||
Investments have the same cost for tax and financial reporting purposes.
NOTE 8—Reclassification of Permanent Differences
Primarily as a result of differing book/tax treatment of foreign currency transactions, on October 31, 2013, undistributed net investment income was increased by $401 and undistributed net realized gain was decreased by $401. This reclassification had no effect on the net assets of the Fund.
17 Invesco Select Opportunities Fund
NOTE 9—Share Information
| Summary of Share Activity | ||||||||||||||||
| Year ended October 31, 2013(a) | August 3, 2012 (commencement date) to October 31, 2012 | |||||||||||||||
| Shares | Amount | Shares | Amount | |||||||||||||
Sold: | ||||||||||||||||
Class A | 294,065 | $ | 3,669,108 | 111,561 | $ | 1,124,935 | ||||||||||
Class C | 40,288 | 508,655 | 8,462 | 90,586 | ||||||||||||
Class R | 4,190 | 52,101 | 1,001 | 10,010 | ||||||||||||
Class Y | 178,443 | 2,176,694 | 98,638 | 986,510 | ||||||||||||
Class R5 | 2,374 | 28,137 | 1,001 | 10,010 | ||||||||||||
Class R6(b) | — | — | 926 | 10,000 | ||||||||||||
Issued as reinvestment of dividends: | ||||||||||||||||
Class A | 321 | 3,496 | — | — | ||||||||||||
Class C | 35 | 379 | — | — | ||||||||||||
Class Y | 38 | 416 | — | — | ||||||||||||
Reacquired: | ||||||||||||||||
Class A | (39,476 | ) | (503,108 | ) | (7 | ) | (84 | ) | ||||||||
Class C | (9,979 | ) | (113,202 | ) | — | — | ||||||||||
Class R | (238 | ) | (3,190 | ) | — | — | ||||||||||
Class Y | (14,293 | ) | (183,198 | ) | — | — | ||||||||||
Net increase in share activity | 455,768 | $ | 5,636,288 | 221,582 | $ | 2,231,967 | ||||||||||
| (a) | There are entities that are record owners of more than 5% of the outstanding shares of the Fund and in the aggregate own 45% of the outstanding shares of the Fund. IDI has an agreement with these entities to sell Fund shares. The Fund, Invesco and/or Invesco affiliates may make payments to these entities, which are considered to be related to the Fund, for providing services to the Fund, Invesco and/or Invesco affiliates including but not limited to services such as securities brokerage, distribution, third party record keeping and account servicing. The Fund has no knowledge as to whether all or any portion of the shares owned of record by these entities are also owned beneficially. |
| In addition, 30% of the outstanding shares of the Fund are owned by the Adviser. |
| (b) | Commencement date of September 24, 2012. |
18 Invesco Select Opportunities Fund
NOTE 10—Financial Highlights
The following schedule presents financial highlights for a share of the Fund outstanding throughout the periods indicated.
| Net asset value, beginning of period | Net investment income (loss)(a) | Net gains (losses) on securities (both realized and unrealized) | Total from investment operations | Dividends from net investment income | Distributions from net realized gains | Total distributions | Net asset value, end of period | Total return(b) | Net assets, end of period (000’s omitted) | Ratio of expenses to average net assets with fee waivers and/or expenses absorbed | Ratio of expenses to average net assets without fee waivers and/or expenses absorbed | Ratio of net investment income (loss) to average net assets | Portfolio turnover(c) | |||||||||||||||||||||||||||||||||||||||||||
Class A |
| |||||||||||||||||||||||||||||||||||||||||||||||||||||||
Year ended 10/31/13 | $ | 10.63 | $ | 0.11 | (d) | $ | 3.13 | $ | 3.24 | $ | (0.08 | ) | $ | (0.09 | ) | $ | (0.17 | ) | $ | 13.70 | 30.84 | % | $ | 5,019 | 1.47 | %(e) | 6.17 | %(e) | 0.84 | %(d)(e) | 10 | % | ||||||||||||||||||||||||
Period ended 10/31/12(f) | 10.00 | (0.00 | ) | 0.63 | 0.63 | — | — | — | 10.63 | 6.30 | 1,186 | 1.48 | (g) | 15.54 | (g) | (0.07 | )(g) | 7 | ||||||||||||||||||||||||||||||||||||||
Class C |
| |||||||||||||||||||||||||||||||||||||||||||||||||||||||
Year ended 10/31/13 | 10.62 | 0.01 | (d) | 3.12 | 3.13 | (0.07 | ) | (0.09 | ) | (0.16 | ) | 13.59 | 29.87 | 527 | 2.22 | (e) | 6.92 | (e) | 0.09 | (d)(e) | 10 | |||||||||||||||||||||||||||||||||||
Period ended 10/31/12(f) | 10.00 | (0.02 | ) | 0.64 | 0.62 | — | — | — | 10.62 | 6.20 | 90 | 2.23 | (g) | 16.29 | (g) | (0.82 | )(g) | 7 | ||||||||||||||||||||||||||||||||||||||
Class R |
| |||||||||||||||||||||||||||||||||||||||||||||||||||||||
Year ended 10/31/13 | 10.63 | 0.07 | (d) | 3.12 | 3.19 | (0.07 | ) | (0.09 | ) | (0.16 | ) | 13.66 | 30.44 | 68 | 1.72 | (e) | 6.42 | (e) | 0.59 | (d)(e) | 10 | |||||||||||||||||||||||||||||||||||
Period ended 10/31/12(f) | 10.00 | (0.01 | ) | 0.64 | 0.63 | — | — | — | 10.63 | 6.30 | 11 | 1.73 | (g) | 15.79 | (g) | (0.32 | )(g) | 7 | ||||||||||||||||||||||||||||||||||||||
Class Y |
| |||||||||||||||||||||||||||||||||||||||||||||||||||||||
Year ended 10/31/13 | 10.64 | 0.14 | (d) | 3.13 | 3.27 | (0.08 | ) | (0.09 | ) | (0.17 | ) | 13.74 | 31.11 | 3,610 | 1.22 | (e) | 5.92 | (e) | 1.09 | (d)(e) | 10 | |||||||||||||||||||||||||||||||||||
Period ended 10/31/12(f) | 10.00 | 0.00 | 0.64 | 0.64 | — | — | — | 10.64 | 6.40 | 1,049 | 1.23 | (g) | 15.29 | (g) | 0.18 | (g) | 7 | |||||||||||||||||||||||||||||||||||||||
Class R5 |
| |||||||||||||||||||||||||||||||||||||||||||||||||||||||
Year ended 10/31/13 | 10.64 | 0.14 | (d) | 3.13 | 3.27 | (0.08 | ) | (0.09 | ) | (0.17 | ) | 13.74 | 31.12 | 46 | 1.22 | (e) | 5.90 | (e) | 1.09 | (d)(e) | 10 | |||||||||||||||||||||||||||||||||||
Period ended 10/31/12(f) | 10.00 | 0.00 | 0.64 | 0.64 | — | — | — | 10.64 | 6.40 | 11 | 1.23 | (g) | 15.35 | (g) | 0.18 | (g) | 7 | |||||||||||||||||||||||||||||||||||||||
Class R6 |
| |||||||||||||||||||||||||||||||||||||||||||||||||||||||
Year ended 10/31/13 | 10.64 | 0.13 | (d) | 3.13 | 3.26 | (0.08 | ) | (0.09 | ) | (0.17 | ) | 13.73 | 31.02 | 13 | 1.22 | (e) | 5.89 | (e) | 1.09 | (d)(e) | 10 | |||||||||||||||||||||||||||||||||||
Period ended 10/31/12(f) | 10.80 | 0.00 | (0.16 | ) | (0.16 | ) | — | — | — | 10.64 | (1.48 | ) | 10 | 1.23 | (g) | 11.37 | (g) | 0.18 | (g) | 7 | ||||||||||||||||||||||||||||||||||||
| (a) | Calculated using average shares outstanding. |
| (b) | Includes adjustments in accordance with accounting principles generally accepted in the United States of America and as such, the net asset value for financial reporting purposes and the returns based upon those net asset values may differ from the net asset value and returns for shareholder transactions. Does not include sales charges and is not annualized for periods less than one year, if applicable. |
| (c) | Portfolio turnover is calculated at the fund level and is not annualized for periods less than one year, if applicable. |
| (d) | Net investment income (loss) per share and the ratio of net investment income (loss) to average net assets includes significant dividends received during the period. Net investment income (loss) per share and the ratio of net investment income (loss) to average net assets excluding the significant dividends are $(0.04) and (0.37)%, $(0.14) and (1.12)%, $(0.08) and (0.62)%, $(0.01) and (0.12)%, $(0.01) and (0.12)%, $(0.02) and (0.12)% for Class A, Class C, Class R, Class Y, Class R5 and Class R6 shares, respectively. |
| (e) | Ratios are based on average daily net assets (000’s omitted) of $2,738, $178, $31, $2,350, $32 and $11 for Class A, Class C, Class R, Class Y, Class R5 and Class R6 shares, respectively. |
| (f) | Commencement date of August 3, 2012 for Class A, Class C, Class R, Class Y, Class R5 shares and September 24, 2012 for Class R6 shares, respectively. |
| (g) | Annualized. |
19 Invesco Select Opportunities Fund
Report of Independent Registered Public Accounting Firm
To the Board of Trustees of AIM International Mutual Funds (Invesco International Mutual Funds)
and Shareholders of Invesco Select Opportunities Fund:
In our opinion, the accompanying statement of assets and liabilities, including the schedule of investments, and the related statements of operations and of changes in net assets and the financial highlights present fairly, in all material respects, the financial position of Invesco Select Opportunities Fund (one of the funds constituting AIM International Mutual Funds (Invesco International Mutual Funds), hereafter referred to as the “Fund”) at October 31, 2013, the results of its operations for the year then ended, the changes in its net assets and financial highlights for the year ended October 31, 2013 and for the period August 3, 2012 (commencement date) through October 31, 2012, in conformity with accounting principles generally accepted in the United States of America. These financial statements and financial highlights (hereafter referred to as “financial statements”) are the responsibility of the Fund’s management; our responsibility is to express an opinion on these financial statements based on our audits. We conducted our audits of these financial statements in accordance with the standards of the Public Company Accounting Oversight Board (United States). Those standards require that we plan and perform the audit to obtain reasonable assurance about whether the financial statements are free of material misstatement. An audit includes examining, on a test basis, evidence supporting the amounts and disclosures in the financial statements, assessing the accounting principles used and significant estimates made by management, and evaluating the overall financial statement presentation. We believe that our audits, which included confirmation of securities at October 31, 2013 by correspondence with the custodian and brokers, provide a reasonable basis for our opinion.
PRICEWATERHOUSECOOPERS LLP
December 23, 2013
Houston, Texas
20 Invesco Select Opportunities Fund
Calculating your ongoing Fund expenses
Example
As a shareholder of the Fund, you incur two types of costs: (1) transaction costs, which may include sales charges (loads) on purchase payments or contingent deferred sales charges on redemptions, if any; and (2) ongoing costs, including management fees, distribution and/or service (12b-1) fees, and other Fund expenses. This example is intended to help you understand your ongoing costs (in dollars) of investing in the Fund and to compare these costs with ongoing costs of investing in other mutual funds. The example is based on an investment of $1,000 invested at the beginning of the period and held for the entire period May 1, 2013 through October 31, 2013.
Actual expenses
The table below provides information about actual account values and actual expenses. You may use the information in this table, together with the amount you invested, to estimate the expenses that you paid over the period. Simply divide your account value by $1,000 (for example, an $8,600 account value divided by $1,000 = 8.6), then multiply the result by the number in the table under the heading entitled “Actual Expenses Paid During Period” to estimate the expenses you paid on your account during this period.
Hypothetical example for comparison purposes
The table below also provides information about hypothetical account values and hypothetical expenses based on the Fund’s actual expense ratio and an assumed rate of return of 5% per year before expenses, which is not the Fund’s actual return.
The hypothetical account values and expenses may not be used to estimate the actual ending account balance or expenses you paid for the period. You may use this information to compare the ongoing costs of investing in the Fund and other funds. To do so, compare this 5% hypothetical example with the 5% hypothetical examples that appear in the shareholder reports of the other funds.
Please note that the expenses shown in the table are meant to highlight your ongoing costs only and do not reflect any transaction costs, such as sales charges (loads) on purchase payments or contingent deferred sales charges on redemptions, if any. Therefore, the hypothetical information is useful in comparing ongoing costs only, and will not help you determine the relative total costs of owning different funds. In addition, if these transaction costs were included, your costs would have been higher.
| Class | Beginning Account Value (05/01/13) | ACTUAL | HYPOTHETICAL (5% annual return before expenses) | Annualized Expense Ratio | ||||||||||||||||||||
| Ending Account Value (10/31/13)1 | Expenses Paid During Period2 | Ending Account Value (10/31/13) | Expenses Paid During Period2 | |||||||||||||||||||||
| A | $ | 1,000.00 | $ | 1,127.70 | $ | 7.88 | $ | 1,017.80 | $ | 7.48 | 1.47 | % | ||||||||||||
| C | 1,000.00 | 1,123.10 | 11.88 | 1,014.01 | 11.27 | 2.22 | ||||||||||||||||||
| R | 1,000.00 | 1,126.20 | 9.22 | 1,016.53 | 8.74 | 1.72 | ||||||||||||||||||
| Y | 1,000.00 | 1,129.00 | 6.55 | 1,019.06 | 6.21 | 1.22 | ||||||||||||||||||
| R5 | 1,000.00 | 1,129.00 | 6.55 | 1,019.06 | 6.21 | 1.22 | ||||||||||||||||||
| R6 | 1,000.00 | 1,129.10 | 6.55 | 1,019.06 | 6.21 | 1.22 | ||||||||||||||||||
| 1 | The actual ending account value is based on the actual total return of the Fund for the period May 1, 2013 through October 31, 2013, after actual expenses and will differ from the hypothetical ending account value which is based on the Fund’s expense ratio and a hypothetical annual return of 5% before expenses. |
| 2 | Expenses are equal to the Fund’s annualized expense ratio as indicated above multiplied by the average account value over the period, multiplied by 184/365 to reflect the most recent fiscal half year. |
21 Invesco Select Opportunities Fund
Approval of Investment Advisory and Sub-Advisory Contracts
The Board of Trustees (the Board) of AIM International Mutual Funds (Invesco International Mutual Funds) is required under the Investment Company Act of 1940, as amended, to approve annually the renewal of Invesco Select Opportunities Fund’s (the Fund) (i) investment advisory agreement with Invesco Advisers, Inc. (Invesco Advisers), (ii) the Master Intergroup Sub-Advisory Contract for Mutual Funds with Invesco Asset Management Deutschland GmbH, Invesco Asset Management Limited, Invesco Asset Management (Japan) Limited, Invesco Australia Limited, Invesco Hong Kong Limited, Invesco Senior Secured Management, Inc. and Invesco Canada Ltd. and (iii) a Sub-Advisory Contract (together with the contracts referenced in (ii) above, the sub-advisory contracts) with Invesco PowerShares Capital Management LLC (together with the entities referenced in (ii) above, the Affiliated Sub-Advisers). During contract renewal meetings held on June 17-19, 2013, the Board as a whole, and the disinterested or “independent” Trustees, who comprise over 75% of the Board, voting separately, approved the continuance of the Fund’s investment advisory agreement and the sub-advisory contracts for another year, effective July 1, 2013. The Board determined that continuation of the Fund’s investment advisory agreement and the sub-advisory contracts are in the best interests of the Fund and its shareholders and the compensation payable to Invesco Advisers and the Affiliated Sub-Advisers under the agreements is fair and reasonable.
The Board’s Fund Evaluation Process
The Board’s Investments Committee has established three Sub-Committees, each of which is primarily responsible for overseeing the management of a number of the funds advised by Invesco Advisers (the Invesco Funds). The Sub-Committees meet throughout the year to review the performance of their assigned Invesco Funds, including reviewing materials prepared under the direction of the independent Senior Officer, an officer of the Invesco Funds who reports directly to the independent Trustees. Over the course of each year, the Sub-Committees meet with portfolio managers for their assigned Invesco Funds and other members of management to review the performance, investment objective(s), policies, strategies, limitations and investment risks of these funds. The Sub-Committees meet regularly and at designated contract renewal meetings each year to conduct a review of the performance, fees, expenses and other matters related to their assigned Invesco Funds. Each Sub-Committee recommends to the Investments Committee, which in turn recommends to the full Board, whether and on what terms to approve the continuance of each Invesco Fund’s
investment advisory agreement and sub-advisory contracts for another year.
During the contract renewal process, the Trustees receive comparative performance and fee data regarding the Invesco Funds prepared by Invesco Advisers and Lipper Inc. (Lipper), an independent provider of investment company data. The Trustees also receive an independent written evaluation from the Senior Officer. The Senior Officer’s evaluation is prepared as part of his responsibility to manage the process by which the Invesco Funds’ proposed management fees are negotiated during the annual contract renewal process to ensure they are negotiated in a manner that is at arms’ length and reasonable. The independent Trustees are assisted in their annual evaluation of the Fund’s investment advisory agreement by the Senior Officer and by independent legal counsel. In addition to meetings with Invesco Advisers and fund counsel, the independent Trustees also discuss the continuance of the investment advisory agreement and sub-advisory contracts in separate sessions with the Senior Officer and with independent legal counsel.
In evaluating the fairness and reasonableness of compensation under the Fund’s investment advisory agreement and sub-advisory contracts, the Board considered, among other things, the factors discussed below. The Trustees recognized that the advisory fee rates for the Invesco Funds are, in many cases, the result of years of review and negotiation between the Trustees and Invesco Advisers as well as advisory fees previously approved by different predecessor boards. The Trustees’ deliberations and conclusions in a particular year may be based in part on their deliberations and conclusions regarding these same arrangements throughout the year and in prior years. The Trustees’ review and conclusions are based on the comprehensive consideration of all information presented to them and are not the result of any single determinative factor. Moreover, one Trustee may have weighed a particular piece of information or factor differently than another Trustee.
The discussion below serves as the Senior Officer’s independent written evaluation with respect to the Fund’s investment advisory agreement as well as a discussion of the material factors and related conclusions that formed the basis for the Board’s approval of the Fund’s investment advisory agreement and sub-advisory contracts. Unless otherwise stated, this information is current as of June 19, 2013, and may not reflect consideration of factors that became known to the Board after that date, including, for example, changes to the Fund’s performance, advisory fees, expense limitations and/or fee waivers.
Factors and Conclusions and Summary of Independent Written Fee Evaluation
| A. | Nature, Extent and Quality of Services Provided by Invesco Advisers and the Affiliated Sub-Advisers |
The Board reviewed the advisory services provided to the Fund by Invesco Advisers under the Fund’s investment advisory agreement, the performance of Invesco Advisers in providing these services, and the credentials and experience of the officers and employees of Invesco Advisers who provide these services, including the Fund’s portfolio manager or managers, with whom the Sub-Committees met during the year. The Board’s review of the qualifications of Invesco Advisers to provide advisory services included the Board’s consideration of Invesco Advisers’ investment process oversight, independent credit analysis and investment risk management.
In determining whether to continue the Fund’s investment advisory agreement, the Board considered the benefits of reapproving an existing relationship and the greater uncertainty that may be associated with entering into a new relationship. The Board also considered non-advisory services that Invesco Advisers and its affiliates provide to the Invesco Funds such as various back office support functions, equity and fixed income trading operations, internal audit, distribution and legal and compliance. The Board concluded that the nature, extent and quality of the services provided to the Fund by Invesco Advisers are appropriate and satisfactory and consistent with the terms of the Fund’s investment advisory agreement.
The Board reviewed the services provided by the Affiliated Sub-Advisers under the sub-advisory contracts and the credentials and experience of the officers and employees of the Affiliated Sub-Advisers who provide these services. The Board noted that the Affiliated Sub-Advisers have offices and personnel that are located in financial centers around the world. As a result, the Affiliated Sub-Advisers can provide research and investment analysis on the markets and economies of various countries in which the Fund may invest, make recommendations regarding securities and assist with security trades. The Board concluded that the sub-advisory contracts benefit the Fund and its shareholders by permitting Invesco Advisers to use the resources and talents of the Affiliated Sub-Advisers in managing the Fund. The Board concluded that the nature, extent and quality of the services provided by the Affiliated Sub-Advisers are appropriate and satisfactory and consistent with the terms of the Fund’s sub-advisory contracts.
| B. | Fund Performance |
Because the Fund was launched at the end of 2012, the Board did not consider Fund performance as a relevant factor in considering whether to approve the investment advisory
22 Invesco Select Opportunities Fund
agreement. For the same reason, the Board did not view Fund performance as a relevant factor in considering whether to approve the sub-advisory contracts for the Fund, notwithstanding that Invesco Canada Limited currently manages the assets of the Fund.
| C. | Advisory and Sub-Advisory Fees |
The Board compared the Fund’s effective advisory fee rate (the advisory fee rate after advisory fee waivers and before other expense limitations/waivers) to the effective advisory fee rates of other mutual funds advised by Invesco Advisers and its affiliates with investment strategies comparable to those of the Fund. The Board compared the Fund’s effective advisory fee rate to the effective advisory fee rate of a Canadian fund advised by Invesco Advisers and its affiliates with investment strategies comparable to those of the Fund. The Board noted that the Fund’s effective advisory fee rate was lower than the effective advisory fee rate of the Canadian fund.
Other than the fund described above, the Board noted that Invesco Advisers and the Affiliated Sub-Advisers do not advise other client accounts with investment strategies comparable to those of the Fund.
The Board noted that Invesco Advisers has contractually agreed to waive fees and/or limit expenses of the Fund through at least February 28, 2014 in an amount necessary to limit total annual operating expenses to a specified percentage of average daily net assets for each class of the Fund.
The Board also considered the services provided by the Affiliated Sub-Advisers pursuant to the sub-advisory contracts, as well as the fees payable by Invesco Advisers to the Affiliated Sub-Advisers pursuant to the sub-advisory contracts. The Board noted that Invesco Advisers retains overall responsibility for, and provides services to, sub-advised Invesco Funds, including oversight of the Affiliated Sub-Advisers as well as the additional services described herein other than day-to-day portfolio management. The Board also noted that the sub-advisory fees are not paid directly by the Fund, but rather, are payable by Invesco Advisers to the Affiliated Sub-Advisers.
Based upon the information and considerations described above, the Board concluded that the compensation payable to Invesco Advisers and the Affiliated Sub-Advisers is fair and reasonable.
| D. | Economies of Scale and Breakpoints |
The Board considered the extent to which there are economies of scale in the provision of advisory services to the Fund. The Board also considered whether the Fund benefits from economies of scale through contractual breakpoints in the Fund’s advisory fee schedule and was assisted in this review by a report from the Senior Officer. The Board also noted that the Fund shares directly in economies of scale through lower fees charged by third party service providers based on the combined size of the Invesco Funds and other clients advised by Invesco Advisers.
| E. | Profitability and Financial Resources |
The Board reviewed information from Invesco Advisers concerning the costs of the advisory and other services that Invesco Advisers and its affiliates provide to the Fund and the profitability of Invesco Advisers and its affiliates in providing these services for the year ended December 31, 2012. The Board received information from Invesco Advisers about the methodology used to prepare the profitability information. The Board considered the profitability of Invesco Advisers in managing the Fund and the Invesco Funds. The Board noted that Invesco Advisers continues to operate at a net profit from services Invesco Advisers and its subsidiaries provide to the Invesco Funds. The Board noted that Invesco Advisers and its subsidiaries did not make a profit from managing the Fund as a result of expense waivers. The Board received and accepted information from Invesco Advisers demonstrating that Invesco Advisers and each Affiliated Sub-Adviser are financially sound and have the resources necessary to perform their obligations under the investment advisory agreement and sub-advisory contracts.
| F. | Collateral Benefits to Invesco Advisers and its Affiliates |
The Board considered various other benefits received by Invesco Advisers and its affiliates from the relationship with the Fund, including the fees received for their provision of administrative, transfer agency and distribution services to the Fund. The Board considered comparative information regarding fees charged for these services, including information provided by Lipper and other independent sources. The Board considered the performance of Invesco Advisers and its affiliates in providing these services and the organizational structure employed to provide these services. The Board also considered that these services are provided to the Fund pursuant to written contracts that are reviewed and approved on an annual basis by the Board; that the services are required for the operation of the Fund; that Invesco Advisers and its affiliates can provide services, the nature and quality of which are at least equal to those provided by others offering the same or similar services; and that the fees for such services are fair and reasonable in light of the usual and customary charges by others for services of the same nature and quality.
The Board considered the benefits realized by Invesco Advisers and the Affiliated Sub-Advisers as a result of portfolio brokerage transactions executed through “soft dollar” arrangements. The Board noted that soft dollar arrangements shift the payment obligation for research services from Invesco Advisers and the Affiliated Sub-Advisers to the Invesco Funds and that the research received may be used with other clients of Invesco Advisers and may reduce Invesco Advisers’ and the Affiliated Sub-Advisers’ expenses. The Board also considered periodic reports from the Chief Compliance Officer of the Invesco Funds demonstrating that
these arrangements are consistent with regulatory requirements. The Board did not deem the soft dollar arrangements to be inappropriate.
The Board considered that the Fund’s uninvested cash and cash collateral from any securities lending arrangements may be invested in money market funds advised by Invesco Advisers pursuant to procedures approved by the Board. The Board noted that Invesco Advisers receives advisory fees from these affiliated money market funds attributable to such investments, although Invesco Advisers has contractually agreed to waive through varying periods the advisory fees payable by the Invesco Funds. The waiver is in an amount equal to 100% of the net advisory fee Invesco Advisers receives from the affiliated money market funds with respect to the Fund’s investment in the affiliated money market funds of uninvested cash, but not cash collateral. The Board concluded that the Fund’s investment of uninvested cash and cash collateral from any securities lending arrangements in the affiliated money market funds is in the best interests of the Fund and its shareholders.
The Board also considered use of an affiliated broker to execute certain trades for the Fund to among other things, control information leakage, and were advised that such trades are executed in compliance with rules under the Investment Company Act of 1940, as amended.
23 Invesco Select Opportunities Fund
Tax Information
Form 1099-DIV, Form 1042-S and other year–end tax information provide shareholders with actual calendar year amounts that should be included in their tax returns. Shareholders should consult their tax advisors.
The following distribution information is being provided as required by the Internal Revenue Code or to meet a specific state’s requirement.
The Fund designates the following amounts or, if subsequently determined to be different, the maximum amount allowable for its fiscal year ended October 31, 2013:
Federal and State Income Tax | ||||
Qualified Dividend Income* | 27.62 | % | ||
Corporate Dividends Received Deduction* | 0.28 | % | ||
| * | The above percentages are based on ordinary income dividends paid to shareholders during the Fund’s fiscal year. |
24 Invesco Select Opportunities Fund
Trustees and Officers
The address of each trustee and officer is AIM International Mutual Funds (Invesco International Mutual Funds) (the “Trust”), 11 Greenway Plaza, Suite 1000, Houston, Texas 77046-1173. The trustees serve for the life of the Trust, subject to their earlier death, incapacitation, resignation, retirement or removal as more specifically provided in the Trust’s organizational documents. Each officer serves for a one year term or until their successors are elected and qualified. Column two below includes length of time served with predecessor entities, if any.
Name, Year of Birth and Position(s) Held with the Trust | Trustee and/ or Officer Since | Principal Occupation(s) During Past 5 Years | Number of Funds in Fund Complex Overseen by Trustee | Other Directorship(s) Held by Trustee During Past 5 Years | ||||
| Interested Persons | ||||||||
| Martin L. Flanagan1 — 1960 Trustee | 2007 | Executive Director, Chief Executive Officer and President, Invesco Ltd. (ultimate parent of Invesco and a global investment management firm); Advisor to the Board, Invesco Advisers, Inc. (formerly known as Invesco Institutional (N.A.), Inc.); Trustee, The Invesco Funds; Vice Chair, Investment Company Institute; and Member of Executive Board, SMU Cox School of Business
Formerly: Chairman and Chief Executive Officer, Invesco Advisers, Inc. (registered investment adviser); Director, Chairman, Chief Executive Officer and President, IVZ Inc. (holding company), INVESCO Group Services, Inc. (service provider) and Invesco North American Holdings, Inc. (holding company); Director, Chief Executive Officer and President, Invesco Holding Company Limited (parent of Invesco and a global investment management firm); Director, Invesco Ltd.; Chairman, Investment Company Institute and President, Co-Chief Executive Officer, Co-President, Chief Operating Officer and Chief Financial Officer, Franklin Resources, Inc. (global investment management organization) | 117 | None | ||||
Philip A. Taylor2 — 1954 Trustee, President and Principal Executive Officer | 2006 | Head of North American Retail and Senior Managing Director, Invesco Ltd.; Director, Co-Chairman, Co-President and Co-Chief Executive Officer, Invesco Advisers, Inc. (formerly known as Invesco Institutional (N.A.), Inc.) (registered investment adviser); Director, Chairman, Chief Executive Officer and President, Invesco Management Group, Inc. (formerly known as Invesco Aim Management Group, Inc.) (financial services holding company); Director and President, INVESCO Funds Group, Inc. (registered investment adviser and registered transfer agent); Director and Chairman, Invesco Investment Services, Inc. (formerly known as Invesco Aim Investment Services, Inc.) (registered transfer agent) and IVZ Distributors, Inc. (formerly known as INVESCO Distributors, Inc.) (registered broker dealer); Director, President and Chairman, Invesco Inc. (holding company) and Invesco Canada Holdings Inc. (holding company); Chief Executive Officer, Invesco Corporate Class Inc. (corporate mutual fund company) and Invesco Canada Fund Inc. (corporate mutual fund company); Director, Chairman and Chief Executive Officer, Invesco Canada Ltd. (formerly known as Invesco Trimark Ltd./Invesco Trimark Ltèe) (registered investment adviser and registered transfer agent); Trustee, President and Principal Executive Officer, The Invesco Funds (other than AIM Treasurer’s Series Trust (Invesco Treasurer’s Series Trust) and Short-Term Investments Trust); Trustee and Executive Vice President, The Invesco Funds (AIM Treasurer’s Series Trust (Invesco Treasurer’s Series Trust) and Short-Term Investments Trust only); Director, Invesco Investment Advisers LLC (formerly known as Van Kampen Asset Management); Director, Chief Executive Officer and President, Van Kampen Exchange Corp.
Formerly: Director and Chairman, Van Kampen Investor Services Inc.: Director, Chief Executive Officer and President, 1371 Preferred Inc. (holding company); and Van Kampen Investments Inc.; Director and President, AIM GP Canada Inc. (general partner for limited partnerships); and Van Kampen Advisors, Inc.; Director and Chief Executive Officer, Invesco Trimark Dealer Inc. (registered broker dealer); Director, Invesco Distributors, Inc. (formerly known as Invesco Aim Distributors, Inc.) (registered broker dealer); Manager, Invesco PowerShares Capital Management LLC; Director, Chief Executive Officer and President, Invesco Advisers, Inc.; Director, Chairman, Chief Executive Officer and President, Invesco Aim Capital Management, Inc.; President, Invesco Trimark Dealer Inc. and Invesco Trimark Ltd./Invesco Trimark Ltèe; Director and President, AIM Trimark Corporate Class Inc. and AIM Trimark Canada Fund Inc.; Senior Managing Director, Invesco Holding Company Limited; Trustee and Executive Vice President, Tax-Free Investments Trust; Director and Chairman, Fund Management Company (former registered broker dealer); President and Principal Executive Officer, The Invesco Funds (AIM Treasurer’s Series Trust (Invesco Treasurer’s Series Trust), Short-Term Investments Trust and Tax-Free Investments Trust only); President, AIM Trimark Global Fund Inc. and AIM Trimark Canada Fund Inc. | 117 | None | ||||
Wayne W. Whalen3 — 1939 Trustee | 2010 | Of Counsel, and prior to 2010, partner in the law firm of Skadden, Arps, Slate, Meagher & Flom LLP, legal counsel to certain funds in the Fund Complex | 130 | Director of the Mutual Fund Directors Forum, a nonprofit membership organization for investment directors; Chairman and Director of the Abraham Lincoln Presidential Library Foundation; and Director of the Stevenson Center for Democracy |
| 1 | Mr. Flanagan is considered an interested person of the Trust because he is an officer of the adviser to the Trust, and an officer and a director of Invesco Ltd., ultimate parent of the adviser to the Trust. |
| 2 | Mr. Taylor is considered an interested person of the Trust because he is an officer and a director of the adviser to, and a director of the principal underwriter of, the Trust. |
| 3 | Mr. Whalen is considered an “interested person” (within the meaning of Section 2(a)(19) of the 1940 Act) of certain Funds in the Invesco Fund Complex because he and his firm currently provide legal services as legal counsel to such Funds. |
T-1 Invesco Select Opportunities Fund
Trustees and Officers—(continued)
Name, Year of Birth and Position(s) Held with the Trust | Trustee and/ or Officer Since | Principal Occupation(s) During Past 5 Years | Number of Funds in Fund Complex Overseen by Trustee | Other Directorship(s) Held by Trustee During Past 5 Years | ||||
| Independent Trustees | ||||||||
Bruce L. Crockett — 1944 Trustee and Chair | 1992 | Chairman, Crockett Technologies Associates (technology consulting company)
Formerly: Director, Captaris (unified messaging provider); Director, President and Chief Executive Officer COMSAT Corporation; and Chairman, Board of Governors of INTELSAT (international communications company) | 117 | ACE Limited (insurance company); Investment Company Institute | ||||
David C. Arch — 1945 Trustee | 2010 | Chairman and Chief Executive Officer of Blistex Inc., (consumer health care products manufacturer)
Formerly: Member of the Heartland Alliance Advisory Board, a nonprofit organization serving human needs based in Chicago | 130 | Board member of the Illinois Manufacturers’ Association; Member of the Board of Visitors, Institute for the Humanities, University of Michigan | ||||
Frank S. Bayley — 1939 Trustee | 2001 | Retired
Formerly: Director, Badgley Funds, Inc. (registered investment company) (2 portfolios) and General Partner and Of Counsel, law firm of Baker & McKenzie, LLP | 117 | Director and Chairman, C.D. Stimson Company (a real estate investment company); Trustee and Overseer, The Curtis Institute of Music | ||||
James T. Bunch — 1942 Trustee | 2003 | Managing Member, Grumman Hill Group LLC (family office private equity management)
Formerly: Founder, Green, Manning & Bunch Ltd. (investment banking firm)(1988-2010); Executive Committee, United States Golf Association; and Director, Policy Studies, Inc. and Van Gilder Insurance Corporation | 117 | Chairman, Board of Governors, Western Golf Association; Chairman-elect, Evans Scholars Foundation; and Director, Denver Film Society | ||||
Rodney F. Dammeyer — 1940 Trustee | 2010 | Chairman of CAC, LLC, (private company offering capital investment and management advisory services)
Formerly: Prior to 2001, Managing Partner at Equity Group Corporate Investments; Prior to 1995, Chief Executive Officer of Itel Corporation (formerly Anixter International); Prior to 1985, experience includes Senior Vice President and Chief Financial Officer of Household International, Inc., Executive Vice President and Chief Financial Officer of Northwest Industries, Inc. and Partner of Arthur Andersen & Co.; From 1987 to 2010, Director/Trustee of investment companies in the Van Kampen Funds complex | 117 | Director of Quidel Corporation and Stericycle, Inc.; Prior to May 2008, Trustee of The Scripps Research Institute; Prior to February 2008, Director of Ventana Medical Systems, Inc. | ||||
Albert R. Dowden — 1941 Trustee | 2000 | Director of a number of public and private business corporations, including the Boss Group, Ltd. (private investment and management); and Reich & Tang Funds (5 portfolios) (registered investment company)
Formerly: Director, Homeowners of America Holding Corporation/Homeowners of America Insurance Company (property casualty company); Director, Continental Energy Services, LLC (oil and gas pipeline service); Director, CompuDyne Corporation (provider of product and services to the public security market) and Director, Annuity and Life Re (Holdings), Ltd. (reinsurance company); Director, President and Chief Executive Officer, Volvo Group North America, Inc.; Senior Vice President, AB Volvo; Director of various public and private corporations; Chairman, DHJ Media, Inc.; Director, Magellan Insurance Company; and Director, The Hertz Corporation, Genmar Corporation (boat manufacturer), National Media Corporation; Advisory Board of Rotary Power International (designer, manufacturer, and seller of rotary power engines); and Chairman, Cortland Trust, Inc. (registered investment company) | 117 | Director of Nature’s Sunshine Products, Inc. | ||||
Jack M. Fields — 1952 Trustee | 1997 | Chief Executive Officer, Twenty First Century Group, Inc. (government affairs company); Owner and Chief Executive Officer, Dos Angeles Ranch, L.P. (cattle, hunting, corporate entertainment); and Discovery Global Education Fund (non-profit)
Formerly: Chief Executive Officer, Texana Timber LP (sustainable forestry company); Director of Cross Timbers Quail Research Ranch (non-profit); and member of the U.S. House of Representatives | 117 | Insperity, Inc. (formerly known as Administaff) | ||||
Prema Mathai-Davis — 1950 Trustee | 1998 | Retired
Formerly: Chief Executive Officer, YWCA of the U.S.A. | 117 | None | ||||
Larry Soll — 1942 Trustee | 2003 | Retired
Formerly: Chairman, Chief Executive Officer and President, Synergen Corp. (a biotechnology company) | 117 | None | ||||
Hugo F. Sonnenschein — 1940 Trustee | 2010 | Distinguished Service Professor and President Emeritus of the University of Chicago and the Adam Smith Distinguished Service Professor in the Department of Economics at the University of Chicago
Formerly: President of the University of Chicago | 130 | Trustee of the University of Rochester and a member of its investment committee. Member of the National Academy of Sciences, the American Philosophical Society and a fellow of the American Academy of Arts and Sciences | ||||
Raymond Stickel, Jr. — 1944 Trustee | 2005 | Retired
Formerly: Director, Mainstay VP Series Funds, Inc. (25 portfolios) and Partner, Deloitte & Touche | 117 | None |
T-2 Invesco Select Opportunities Fund
Trustees and Officers—(continued)
Name, Year of Birth and Position(s) Held with the Trust | Trustee and/ or Officer Since | Principal Occupation(s) During Past 5 Years | Number of Funds in Fund Complex Overseen by Trustee | Other Directorship(s) Held by Trustee During Past 5 Years | ||||
| Other Officers | ||||||||
Russell C. Burk — 1958 Senior Vice President and Senior Officer | 2005 | Senior Vice President and Senior Officer, The Invesco Funds | N/A | N/A | ||||
John M. Zerr — 1962 Senior Vice President, Chief Legal Officer and Secretary | 2006 | Director, Senior Vice President, Secretary and General Counsel, Invesco Management Group, Inc. (formerly known as Invesco Aim Management Group, Inc.) and Van Kampen Exchange Corp.; Senior Vice President, Invesco Advisers, Inc. (formerly known as Invesco Institutional (N.A.), Inc.) (registered investment adviser); Senior Vice President and Secretary, Invesco Distributors, Inc. (formerly known as Invesco Aim Distributors, Inc.); Director, Vice President and Secretary, Invesco Investment Services, Inc. (formerly known as Invesco Aim Investment Services, Inc.) and IVZ Distributors, Inc. (formerly known as INVESCO Distributors, Inc.); Director and Vice President, INVESCO Funds Group, Inc.; Senior Vice President, Chief Legal Officer and Secretary, The Invesco Funds; Manager, Invesco PowerShares Capital Management LLC; Director, Secretary and General Counsel, Invesco Investment Advisers LLC (formerly known as Van Kampen Asset Management); Secretary and General Counsel, Invesco Capital Markets, Inc. (formerly known as Van Kampen Funds Inc.) and Chief Legal Officer, PowerShares Exchange-Traded Fund Trust, PowerShares Exchange-Traded Fund Trust II, PowerShares India Exchange-Traded Fund Trust and PowerShares Actively Managed Exchange-Traded Fund Trust
Formerly: Director and Vice President, Van Kampen Advisors Inc.; Director, Vice President, Secretary and General Counsel, Van Kampen Investor Services Inc.; Director, Invesco Distributors, Inc. (formerly known as Invesco Aim Distributors, Inc.); Director, Senior Vice President, General Counsel and Secretary, Invesco Aim Advisers, Inc. and Van Kampen Investments Inc.; Director, Vice President and Secretary, Fund Management Company; Director, Senior Vice President, Secretary, General Counsel and Vice President, Invesco Aim Capital Management, Inc.; Chief Operating Officer and General Counsel, Liberty Ridge Capital, Inc. (an investment adviser); Vice President and Secretary, PBHG Funds (an investment company) and PBHG Insurance Series Fund (an investment company); Chief Operating Officer, General Counsel and Secretary, Old Mutual Investment Partners (a broker-dealer); General Counsel and Secretary, Old Mutual Fund Services (an administrator) and Old Mutual Shareholder Services (a shareholder servicing center); Executive Vice President, General Counsel and Secretary, Old Mutual Capital, Inc. (an investment adviser); and Vice President and Secretary, Old Mutual Advisors Funds (an investment company) | N/A | N/A | ||||
Karen Dunn Kelley — 1960 Vice President | 2004 | Senior Managing Director, Investments; Director, Co-President, Co-Chief Executive Officer, and Co-Chairman, Invesco Advisers, Inc. (formerly known as Invesco Institutional (N.A.), Inc.) (registered investment adviser); Chairman, Invesco Senior Secured Management, Inc.; Senior Vice President, Invesco Management Group, Inc. (formerly known as Invesco Aim Management Group, Inc.); Executive Vice President, Invesco Distributors, Inc. (formerly known as Invesco Aim Distributors, Inc.); Director, Invesco Mortgage Capital Inc., and Invesco Management Company Limited; Director and President, INVESCO Asset Management (Bermuda) Ltd., Vice President, The Invesco Funds (other than AIM Treasurer’s Series Trust (Invesco Treasurer’s Series Trust) and Short-Term Investments Trust); and President and Principal Executive Officer, The Invesco Funds (AIM Treasurer’s Series Trust (Invesco Treasurer’s Series Trust) and Short-Term Investments Trust only)
Formerly: Director, INVESCO Global Asset Management Limited and INVESCO Management S.A.; Senior Vice President, Van Kampen Investments Inc. and Invesco Advisers, Inc. (formerly known as Invesco Institutional (N.A.), Inc.) (registered investment adviser); Vice President, Invesco Advisers, Inc. (formerly known as Invesco Institutional (N.A.), Inc.); Director of Cash Management and Senior Vice President, Invesco Advisers, Inc. and Invesco Aim Capital Management, Inc.; President and Principal Executive Officer, Tax-Free Investments Trust; Director and President, Fund Management Company; Chief Cash Management Officer, Director of Cash Management, Senior Vice President, and Managing Director, Invesco Aim Capital Management, Inc.; Director of Cash Management, Senior Vice President, and Vice President, Invesco Advisers, Inc. and The Invesco Funds (AIM Treasurer’s Series Trust (Invesco Treasurer’s Series Trust), Short-Term Investments Trust and Tax-Free Investments Trust only) | N/A | N/A |
T-3 Invesco Select Opportunities Fund
Trustees and Officers—(continued)
Name, Year of Birth and Position(s) Held with the Trust | Trustee and/ or Officer Since | Principal Occupation(s) During Past 5 Years | Number of Funds in Fund Complex Overseen by Trustee | Other Directorship(s) Held by Trustee During Past 5 Years | ||||
| Other Officers—(continued) | ||||||||
Sheri Morris — 1964 Vice President, Treasurer and Principal Financial Officer | 1999 | Vice President, Treasurer and Principal Financial Officer, The Invesco Funds; Vice President, Invesco Advisers, Inc. (formerly known as Invesco Institutional (N.A.), Inc.) (registered investment adviser); and Vice President, PowerShares Exchange-Traded Fund Trust, PowerShares Exchange-Traded Fund Trust II, PowerShares India Exchange-Traded Fund Trust and PowerShares Actively Managed Exchange-Traded Fund Trust
Formerly: Vice President, Invesco Aim Advisers, Inc., Invesco Aim Capital Management, Inc. and Invesco Aim Private Asset Management, Inc.; Assistant Vice President and Assistant Treasurer, The Invesco Funds and Assistant Vice President, Invesco Advisers, Inc., Invesco Aim Capital Management, Inc. and Invesco Aim Private Asset Management, Inc.; and Treasurer, PowerShares Exchange-Traded Fund Trust, PowerShares Exchange-Traded Fund Trust II, PowerShares India Exchange-Traded Fund Trust and PowerShares Actively Managed Exchange-Traded Fund Trust | N/A | N/A | ||||
Crissie M. Wisdom — 1969 Anti-Money Laundering Compliance Officer | 2013 | Anti-Money Laundering Compliance Officer, Invesco Advisers, Inc. (formerly known as Invesco Institutional (N.A.), Inc.) (registered investment adviser), Invesco Capital Markets, Inc. (formerly known as Van Kampen Funds Inc.), Invesco Distributors, Inc., Invesco Investment Services, Inc., Invesco Management Group, Inc., Van Kampen Exchange Corp., The Invesco Funds, Invesco Funds (Chicago), and PowerShares Exchange-Traded Fund Trust, PowerShares Exchange-Traded Fund Trust II, PowerShares India Exchange-Traded Fund Trust, and PowerShares Actively Managed Exchange-Traded Fund Trust; and Fraud Prevention Manager and Controls and Risk Analysis Manager for Invesco Investment Services, Inc. | N/A | N/A | ||||
Todd L. Spillane — 1958 Chief Compliance Officer | 2006 | Senior Vice President, Invesco Management Group, Inc. (formerly known as Invesco Aim Management Group, Inc.) and Van Kampen Exchange Corp.; Senior Vice President and Chief Compliance Officer, Invesco Advisers, Inc. (registered investment adviser) (formerly known as Invesco Institutional (N.A.), Inc.); Chief Compliance Officer, The Invesco Funds; Vice President, Invesco Distributors, Inc. (formerly known as Invesco Aim Distributors, Inc.) and Invesco Investment Services, Inc. (formerly known as Invesco Aim Investment Services, Inc.)
Formerly: Chief Compliance Officer, Invesco Funds (Chicago); Senior Vice President, Van Kampen Investments Inc.; Senior Vice President and Chief Compliance Officer, Invesco Aim Advisers, Inc. and Invesco Aim Capital Management, Inc.; Chief Compliance Officer, INVESCO Private Capital Investments, Inc. (holding company), Invesco Private Capital, Inc. (registered investment adviser), Invesco Global Asset Management (N.A.), Inc., Invesco Senior Secured Management, Inc. (registered investment adviser), Van Kampen Investor Services Inc., PowerShares Exchange-Traded Fund Trust, PowerShares Exchange-Traded Fund Trust II, PowerShares India Exchange-Traded Fund Trust and PowerShares Actively Managed Exchange-Traded Fund Trust; and Vice President, Invesco Aim Capital Management, Inc. and Fund Management Company | N/A | N/A |
The Statement of Additional Information of the Trust includes additional information about the Fund’s Trustees and is available upon request, without charge, by calling 1.800.959.4246. Please refer to the Fund’s prospectus for information on the Fund’s sub-advisers.
Office of the Fund 11 Greenway Plaza, Suite 1000 Houston, TX 77046-1173 | Investment Adviser Invesco Advisers, Inc. 1555 Peachtree Street, N.E. Atlanta, GA 30309 | Distributor Invesco Distributors, Inc. 11 Greenway Plaza, Suite 1000 Houston, TX 77046-1173 | Auditors PricewaterhouseCoopers LLP 1201 Louisiana Street, Suite 2900 Houston, TX 77002-5678 | |||
Counsel to the Fund Stradley Ronon Stevens & Young, LLP 2005 Market Street, Suite 2600 Philadelphia, PA 19103-7018 | Counsel to the Independent Trustees Goodwin Procter LLP 901 New York Avenue, N.W. Washington, D.C. 20001 | Transfer Agent Invesco Investment Services, Inc. 11 Greenway Plaza, Suite 1000 Houston, TX 77046-1173 | Custodian State Street Bank and Trust Company 225 Franklin Street Boston, MA 02110-2801 | |||
T-4 Invesco Select Opportunities Fund

Invesco mailing information
Send general correspondence to Invesco Investment Services, Inc., P.O. Box 219078, Kansas City, MO 64121-9078.
Invesco privacy policy
You share personal and financial information with us that is necessary for your transactions and your account records. We take very seriously the obligation to keep that information confidential and private.
Invesco collects nonpublic personal information about you from account applications or other forms you complete and from your transactions with us or our affiliates. We do not disclose information about you or our former customers to service providers or other third parties except to the extent necessary to service your account and in other limited circumstances as permitted by law. For example, we use this information to facilitate the delivery of transaction confirmations, financial reports, prospectuses and tax forms.
Even within Invesco, only people involved in the servicing of your accounts and compliance monitoring have access to your information. To ensure the highest level of confidentiality and security, Invesco maintains physical, electronic and procedural safeguards that meet or exceed federal standards. Special measures, such as data encryption and authentication, apply to your communications with us on our website. More detail is available to you at invesco.com/privacy.
Important notice regarding delivery of security holder documents
To reduce Fund expenses, only one copy of most shareholder documents may be mailed to shareholders with multiple accounts at the same address (Householding). Mailing of your shareholder documents may be householded indefinitely unless you instruct us otherwise. If you do not want the mailing of these documents to be combined with those for other members of your household, please contact Invesco Investment Services, Inc. at 800 959 4246 or contact your financial institution. We will begin sending you individual copies for each account within 30 days after receiving your request.
Fund holdings and proxy voting information
The Fund provides a complete list of its holdings four times in each fiscal year, at the quarter ends. For the second and fourth quarters, the lists appear in the Fund’s semiannual and annual reports to shareholders. For the first and third quarters, the Fund files the lists with the Securities and Exchange Commission (SEC) on Form N-Q. The most recent list of portfolio holdings is available at invesco.com/completeqtrholdings. Shareholders can also look up the Fund’s Forms N-Q on the SEC website at sec.gov. Copies of the Fund’s Forms N-Q may be reviewed and copied at the SEC Public Reference Room in Washington, D.C. You can obtain information on the operation of the Public Reference Room, including information about duplicating fee charges, by calling 202 551 8090 or 800 732 0330, or by electronic request at the following email address: publicinfo@sec.gov. The SEC file numbers for the Fund are shown below.
A description of the policies and procedures that the Fund uses to determine how to vote proxies relating to portfolio securities is available without charge, upon request, from our Client Services department at 800 959 4246 or at invesco.com/proxyguidelines. The information is also available on the SEC website, sec.gov.
Information regarding how the Fund voted proxies related to its portfolio securities during the most recent 12-month period ended June 30 is available at invesco.com/proxysearch. The information is also available on the SEC website, sec.gov. Invesco Advisers, Inc. is an investment adviser; it provides investment advisory services to individual and institutional clients and does not sell securities. Invesco Distributors, Inc. is the US distributor for Invesco Ltd.’s retail mutual funds, exchange-traded funds and institutional money market funds. Both are wholly owned, indirect subsidiaries of Invesco Ltd. |  |
SEC file numbers: 811-06463 and 033-44611 SOPP-AR-1 Invesco Distributors, Inc.
| ITEM 2. | CODE OF ETHICS. |
There were no amendments to the Code of Ethics (the “Code”) that applies to the Registrant’s Principal Executive Officer (“PEO”) and Principal Financial Officer (“PFO”) during the period covered by the report. The Registrant did not grant any waivers, including implicit waivers, from any provisions of the Code to the PEO or PFO during the period covered by this report.
| ITEM 3. | AUDIT COMMITTEE FINANCIAL EXPERT. |
The Board of Trustees has determined that the Registrant has at least one audit committee financial expert serving on its Audit Committee. The Audit Committee financial expert is Raymond Stickel, Jr. Mr. Stickel is “independent” within the meaning of that term as used in Form N-CSR.
| ITEM 4. | PRINCIPAL ACCOUNTANT FEES AND SERVICES. |
(a) to (d)
Fees Billed by PWC Related to the Registrant
PWC billed the Registrant aggregate fees for services rendered to the Registrant for the last two fiscal years as follows:
| Fees Billed for Services Rendered to the Registrant for fiscal year end 2013 | (e)(2) Percentage of Fees Billed Applicable to Non-Audit Services Provided for fiscal year end 2013 Pursuant to Waiver of Pre-Approval Requirement(1) | Fees Billed for Services Rendered to the Registrant for fiscal year end 2012 | (e)(2) Percentage of Fees Billed Applicable to Non-Audit Services Provided for fiscal year end 2012 Pursuant to Waiver of Pre-Approval Requirement(1) | |||||||||||||
Audit Fees | $ | 266,250 | N/A | $ | 258.126 | N/A | ||||||||||
Audit-Related Fees(2) | $ | 0 | 0 | % | $ | 5,000 | 0 | % | ||||||||
Tax Fees(3) | $ | 165,182 | 0 | % | $ | 162,344 | 0 | % | ||||||||
All Other Fees | $ | 0 | 0 | % | $ | 0 | 0 | % | ||||||||
|
|
|
| |||||||||||||
Total Fees | $ | 431,432 | 0 | % | $ | 425,470 | 0 | % | ||||||||
(g) PWC billed the Registrant aggregate non-audit fees of $165,182 for the fiscal year ended 2013, and $167,344
for the fiscal year ended 2012, for non-audit services rendered to the Registrant.
| (1) | With respect to the provision of non-audit services, the pre-approval requirement is waived pursuant to a de minimis exception if (i) such services were not recognized as non-audit services by the Registrant at the time of engagement, (ii) the aggregate amount of all such services provided is no more than 5% of the aggregate audit and non-audit fees paid by the Registrant to PWC during a fiscal year; and (iii) such services are promptly brought to the attention of the Registrant’s Audit Committee and approved by the Registrant’s Audit Committee prior to the completion of the audit. |
| (2) | Audit-Related fees for the fiscal year end 2012 include fees billed for agreed upon procedures related to fund mergers. |
| (3) | Tax fees for the fiscal year end 2013 include fees billed for reviewing tax returns and consultation services. Tax fees for the fiscal year end 2012 includes fees billed for reviewing tax returns and consultation services. |
Fees Billed by PWC Related to Invesco and Invesco Affiliates
PWC billed Invesco Advisers, Inc. (“Invesco”), the Registrant’s adviser, and any entity controlling, controlled by or under common control with Invesco that provides ongoing services to the Registrant (“Invesco Affiliates”) aggregate fees for pre-approved non-audit services rendered to Invesco and Invesco Affiliates for the last two fiscal years as follows:
| Fees Billed for Non- Audit Services Rendered to Invesco and Invesco Affiliates for fiscal year end 2013 That Were Required to be Pre-Approved by the Registrant’s Audit Committee | (e)(2) Percentage of Fees Billed Applicable to Non-Audit Services Provided for fiscal year end 2013 Pursuant to Waiver of Pre-Approval Requirement(1) | Fees Billed for Non- Audit Services Rendered to Invesco and Invesco Affiliates for fiscal year end 2012 That Were Required to be Pre-Approved by the Registrant’s Audit Committee | (e)(2) Percentage of Fees Billed Applicable to Non-Audit Services Provided for fiscal year end 2012 Pursuant to Waiver of Pre-Approval Requirement(1) | |||||||||||||
Audit-Related Fees | $ | 574,000 | 0 | % | $ | 0 | 0 | % | ||||||||
Tax Fees | $ | 0 | 0 | % | $ | 0 | 0 | % | ||||||||
All Other Fees | $ | 0 | 0 | % | $ | 0 | 0 | % | ||||||||
|
|
|
| |||||||||||||
Total Fees(2) | $ | 574,000 | 0 | % | $ | 0 | 0 | % | ||||||||
| (1) | With respect to the provision of non-audit services, the pre-approval requirement is waived pursuant to a de minimis exception if (i) such services were not recognized as non-audit services by the Registrant at the time of engagement, (ii) the aggregate amount of all such services provided is no more than 5% of the aggregate audit and non-audit fees paid by the Registrant, Invesco and Invesco Affiliates to PWC during a fiscal year; and (iii) such services are promptly brought to the attention of the Registrant’s Audit Committee and approved by the Registrant’s Audit Committee prior to the completion of the audit. |
| (2) | Audit-Related fees for the year end 2013 include fees billed related to reviewing controls at a service organization. |
(g) Including the fees for services not required to be pre-approved by the registrant’s audit committee, PWC billed Invesco and Invesco Affiliates aggregate non-audit fees of $1,248,475 for the fiscal year ended 2013, and $0 for the fiscal year ended 2012, for non-audit services rendered to Invesco and Invesco Affiliates.
(h) The Audit Committee also has considered whether the provision of non-audit services that were rendered to Invesco and Invesco Affiliates that were not required to be pre-approved pursuant to SEC regulations, if any, is compatible with maintaining PWC’s independence. To the extent that such services were provided, the Audit Committee determined that the provision of such services is compatible with PWC maintaining independence with respect to the Registrant.
(f) Not applicable.
(e)(1)
PRE-APPROVAL OF AUDIT AND NON-AUDIT SERVICES
POLICIES AND PROCEDURES
As adopted by the Audit Committees of
the Invesco Funds (the “Funds”)
Last Amended May 4, 2010
Statement of Principles
Under the Sarbanes-Oxley Act of 2002 and rules adopted by the Securities and Exchange Commission (“SEC”) (“Rules”), the Audit Committees of the Funds’ (the “Audit Committees”) Board of Trustees (the “Board”) are responsible for the appointment, compensation and oversight of the work of independent accountants (an “Auditor”). As part of this responsibility and to assure that the Auditor’s independence is not impaired, the Audit Committees pre-approve the audit and non-audit services provided to the Funds by each Auditor, as well as all non-audit services provided by the Auditor to the Funds’ investment adviser and to affiliates of the adviser that provide ongoing services to the Funds (“Service Affiliates”) if the services directly impact the Funds’ operations or financial reporting. The SEC Rules also specify the types of services that an Auditor may not provide to its audit client. The following policies and procedures comply with the requirements for pre-approval and provide a mechanism by which management of the Funds may request and secure pre-approval of audit and non-audit services in an orderly manner with minimal disruption to normal business operations.
Proposed services either may be pre-approved without consideration of specific case-by-case services by the Audit Committees (“general pre-approval”) or require the specific pre-approval of the Audit Committees (“specific pre-approval”). As set forth in these policies and procedures, unless a type of service has received general pre-approval, it will require specific pre-approval by the Audit Committees. Additionally, any fees exceeding 110% of estimated pre-approved fee levels provided at the time the service was pre-approved will also require specific approval by the Audit Committees before payment is made. The Audit Committees will also consider the impact of additional fees on the Auditor’s independence when determining whether to approve any additional fees for previously pre-approved services.
The Audit Committees will annually review and generally pre-approve the services that may be provided by each Auditor without obtaining specific pre-approval from the Audit Committee generally on an annual basis. The term of any general pre-approval runs from the date of such pre-approval through September 30th of the following year, unless the Audit Committees consider a different period and state otherwise. The Audit Committees will add to or subtract from the list of general pre-approved services from time to time, based on subsequent determinations.
The purpose of these policies and procedures is to set forth the guidelines to assist the Audit Committees in fulfilling their responsibilities.
Delegation
The Audit Committees may from time to time delegate pre-approval authority to one or more of its members who are Independent Trustees. All decisions to pre-approve a service by a delegated member shall be reported to the Audit Committees at the next quarterly meeting.
Audit Services
The annual audit services engagement terms will be subject to specific pre-approval of the Audit Committees. Audit services include the annual financial statement audit and other procedures such as tax provision work that is required to be performed by the independent auditor to be able to form an opinion on the Funds’ financial statements. The Audit Committees will obtain, review and consider sufficient information concerning the proposed Auditor to make a reasonable evaluation of the Auditor’s qualifications and independence.
In addition to the annual Audit services engagement, the Audit Committees may grant either general or specific pre-approval of other audit services, which are those services that only the independent auditor reasonably can provide. Other Audit services may include services such as issuing consents for the inclusion of audited financial statements with SEC registration statements, periodic reports and other documents filed with the SEC or other documents issued in connection with securities offerings.
Non-Audit Services
The Audit Committees may provide either general or specific pre-approval of any non-audit services to the Funds and its Service Affiliates if the Audit Committees believe that the provision of the service will not impair the independence of the Auditor, is consistent with the SEC’s Rules on auditor independence, and otherwise conforms to the Audit Committees’ general principles and policies as set forth herein.
Audit-Related Services
“Audit-related services” are assurance and related services that are reasonably related to the performance of the audit or review of the Fund’s financial statements or that are traditionally performed by the independent auditor. Audit-related services include, among others, accounting consultations related to accounting, financial reporting or disclosure matters not classified as “Audit services”; assistance with understanding and implementing new accounting and financial reporting guidance from rulemaking authorities; and agreed-upon procedures related to mergers, compliance with ratings agency requirements and interfund lending activities.
Tax Services
“Tax services” include, but are not limited to, the review and signing of the Funds’ federal tax returns, the review of required distributions by the Funds and consultations regarding tax matters such as the tax treatment of new investments or the impact of new regulations. The Audit Committees will scrutinize carefully the retention of the Auditor in connection with a transaction initially recommended by the Auditor, the major business purpose of which may be tax avoidance or the tax treatment of which may not be supported in the Internal Revenue Code and related regulations. The Audit Committees will consult with the Funds’ Treasurer (or his or her designee) and may consult with outside counsel or advisors as necessary to ensure the consistency of Tax services rendered by the Auditor with the foregoing policy.
No Auditor shall represent any Fund or any Service Affiliate before a tax court, district court or federal court of claims.
Under rules adopted by the Public Company Accounting Oversight Board and approved by the SEC, in connection with seeking Audit Committees’ pre-approval of permissible Tax services, the Auditor shall:
| 1. | Describe in writing to the Audit Committees, which writing may be in the form of the proposed engagement letter: |
| a. | The scope of the service, the fee structure for the engagement, and any side letter or amendment to the engagement letter, or any other agreement between the Auditor and the Fund, relating to the service; and |
| b. | Any compensation arrangement or other agreement, such as a referral agreement, a referral fee or fee-sharing arrangement, between the Auditor and any person (other than the Fund) with respect to the promoting, marketing, or recommending of a transaction covered by the service; |
| 2. | Discuss with the Audit Committees the potential effects of the services on the independence of the Auditor; and |
| 3. | Document the substance of its discussion with the Audit Committees. |
All Other Auditor Services
The Audit Committees may pre-approve non-audit services classified as “All other services” that are not categorically prohibited by the SEC, as listed in Exhibit 1 to this policy.
Pre-Approval Fee Levels or Established Amounts
Pre-approval of estimated fees or established amounts for services to be provided by the Auditor under general or specific pre-approval policies will be set periodically by the Audit Committees. Any proposed fees exceeding 110% of the maximum estimated pre-approved fees or established amounts for pre-approved audit and non-audit services will be reported to the Audit Committees at the quarterly Audit Committees meeting and will require specific approval by the Audit Committees before payment is made. The Audit Committees will always factor in the overall relationship of fees for audit and non-audit services in determining whether to pre-approve any such services and in determining whether to approve any additional fees exceeding 110% of the maximum pre-approved fees or established amounts for previously pre-approved services.
Procedures
Generally on an annual basis, Invesco Advisers, Inc. (“Invesco”) will submit to the Audit Committees for general pre-approval, a list of non-audit services that the Funds or Service Affiliates of the Funds may request from the Auditor. The list will describe the non-audit services in reasonable detail and will include an estimated range of fees and such other information as the Audit Committee may request.
Each request for services to be provided by the Auditor under the general pre-approval of the Audit Committees will be submitted to the Funds’ Treasurer (or his or her designee) and must include a detailed description of the services to be rendered. The Treasurer or his or her designee will ensure that such services are included within the list of services that have received the general pre-approval of the Audit Committees. The Audit Committees will be informed at the next quarterly scheduled Audit Committees meeting of any such services for which the Auditor rendered an invoice and whether such services and fees had been pre-approved and if so, by what means.
Each request to provide services that require specific approval by the Audit Committees shall be submitted to the Audit Committees jointly by the Fund’s Treasurer or his or her designee and the Auditor, and must include a joint statement that, in their view, such request is consistent with the policies and procedures and the SEC Rules.
Each request to provide tax services under either the general or specific pre-approval of the Audit Committees will describe in writing: (i) the scope of the service, the fee structure for the engagement, and any side letter or amendment to the engagement letter, or any other agreement between the Auditor and the audit client, relating to the service; and (ii) any compensation arrangement or other agreement between the Auditor and any person (other than the audit client) with respect to the promoting, marketing, or recommending of a transaction covered by the service. The Auditor will discuss with the Audit Committees the potential effects of the services on the Auditor’s independence and will document the substance of the discussion.
Non-audit services pursuant to the de minimis exception provided by the SEC Rules will be promptly brought to the attention of the Audit Committees for approval, including documentation that each of the conditions for this exception, as set forth in the SEC Rules, has been satisfied.
On at least an annual basis, the Auditor will prepare a summary of all the services provided to any entity in the investment company complex as defined in section 2-01(f)(14) of Regulation S-X in sufficient detail as to the nature of the engagement and the fees associated with those services.
The Audit Committees have designated the Funds’ Treasurer to monitor the performance of all services provided by the Auditor and to ensure such services are in compliance with these policies and procedures. The Funds’ Treasurer will report to the Audit Committees on a periodic basis as to the results of such monitoring. Both the Funds’ Treasurer and management of Invesco will immediately report to the chairman of the Audit Committees any breach of these policies and procedures that comes to the attention of the Funds’ Treasurer or senior management of Invesco.
Exhibit 1 to Pre-Approval of Audit and Non-Audit Services Policies and Procedures
Conditionally Prohibited Non-Audit Services (not prohibited if the Fund can reasonably conclude that the results of the service would not be subject to audit procedures in connection with the audit of the Fund’s financial statements)
| • | Bookkeeping or other services related to the accounting records or financial statements of the audit client |
| • | Financial information systems design and implementation |
| • | Appraisal or valuation services, fairness opinions, or contribution-in-kind reports |
| • | Actuarial services |
| • | Internal audit outsourcing services |
Categorically Prohibited Non-Audit Services
| • | Management functions |
| • | Human resources |
| • | Broker-dealer, investment adviser, or investment banking services |
| • | Legal services |
| • | Expert services unrelated to the audit |
| • | Any service or product provided for a contingent fee or a commission |
| • | Services related to marketing, planning, or opining in favor of the tax treatment of confidential transactions or aggressive tax position transactions, a significant purpose of which is tax avoidance |
| • | Tax services for persons in financial reporting oversight roles at the Fund |
| • | Any other service that the Public Company Oversight Board determines by regulation is impermissible. |
| ITEM 5. | AUDIT COMMITTEE OF LISTED REGISTRANTS. |
Not applicable.
| ITEM 6. | SCHEDULE OF INVESTMENTS. |
Investments in securities of unaffiliated issuers is included as part of the reports to stockholders filed under Item 1 of this Form.
| ITEM 7. | DISCLOSURE OF PROXY VOTING POLICIES AND PROCEDURES FOR CLOSED-END MANAGEMENT INVESTMENT COMPANIES. |
Not applicable.
| ITEM 8. | PORTFOLIO MANAGERS OF CLOSED-END MANAGEMENT COMPANIES. |
Not applicable.
| ITEM 9. | PURCHASES OF EQUITY SECURITIES BY CLOSED-END MANAGEMENT INVESTMENT COMPANY AND AFFILIATED PURCHASERS. |
Not applicable.
| ITEM 10. | SUBMISSION OF MATTERS TO A VOTE OF SECURITY HOLDERS. |
None
| ITEM 11. | CONTROLS AND PROCEDURES. |
| (a) | As of November 19, 2013, an evaluation was performed under the supervision and with the participation of the officers of the Registrant, including the PEO and PFO, to assess the effectiveness of the Registrant’s disclosure controls and procedures, as that term is defined in Rule 30a-3(c) under the Investment Company Act of 1940 (the “Act”), as amended. Based on that evaluation, the Registrant’s officers, including the PEO and PFO, concluded that, as of November 19, 2013, the Registrant’s disclosure controls and procedures were reasonably designed to ensure: (1) that information required to be disclosed by the Registrant on Form N-CSR is recorded, processed, summarized and reported within the time periods specified by the rules and forms of the Securities and Exchange Commission; and (2) that material information relating to the Registrant is made known to the PEO and PFO as appropriate to allow timely decisions regarding required disclosure. |
| (b) | There have been no changes in the Registrant’s internal control over financial reporting (as defined in Rule 30a-3(d) under the Act) that occurred during the second fiscal quarter of the period covered by this report that have materially affected, or are reasonably likely to materially affect, the Registrant’s internal control over financial reporting. |
| ITEM 12. | EXHIBITS. |
| 12(a) (1) | Code of Ethics. |
| 12(a) (2) | Certifications of principal executive officer and principal financial officer as required by Rule 30a-2(a) under the Investment Company Act of 1940. |
| 12(a) (3) | Not applicable. |
| 12(b) | Certifications of principal executive officer and principal financial officer as required by Rule 30a-2(b) under the Investment Company Act of 1940. |
SIGNATURES
Pursuant to the requirements of the Securities Exchange Act of 1934 and the Investment Company Act of 1940, the Registrant has duly caused this report to be signed on its behalf by the undersigned, thereunto duly authorized.
Registrant: AIM International Mutual Funds (Invesco International Mutual Funds)
| By: | /s/ Philip A. Taylor | |
| Philip A. Taylor | ||
| Principal Executive Officer | ||
| Date: | January 9, 2014 | |
Pursuant to the requirements of the Securities and Exchange Act of 1934 and the Investment Company Act of 1940, this report has been signed below by the following persons on behalf of the Registrant and in the capacities and on the dates indicated.
| By: | /s/ Philip A. Taylor | |
| Philip A. Taylor | ||
| Principal Executive Officer | ||
| Date: | January 9, 2014 | |
| By: | /s/ Sheri Morris | |
| Sheri Morris | ||
| Principal Financial Officer | ||
| Date: | January 9, 2014 | |
EXHIBIT INDEX
| 12(a) (1) | Code of Ethics. | |
| 12(a) (2) | Certifications of principal executive officer and principal financial officer as required by Rule 30a-2(a) under the Investment Company Act of 1940. | |
| 12(a) (3) | Not applicable. | |
| 12(b) | Certifications of principal executive officer and principal financial officer as required by Rule 30a-2(b) under the Investment Company Act of 1940. | |