| OMB APPROVAL | ||
OMB Number: 3235-0570 Expires: January 31, 2017 Estimated average burden hours per response: 20.6 |
UNITED STATES
SECURITIES AND EXCHANGE COMMISSION
Washington, D.C. 20549
FORM N-CSR
CERTIFIED SHAREHOLDER REPORT OF REGISTERED
MANAGEMENT INVESTMENT COMPANIES
| Investment Company Act file number | 811-06463 |
AIM International Mutual Funds (Invesco International Mutual Funds)
(Exact name of registrant as specified in charter)
11 Greenway Plaza, Suite 1000 Houston, Texas 77046
(Address of principal executive offices) (Zip code)
Philip A. Taylor 11 Greenway Plaza, Suite 1000 Houston, Texas 77046
(Name and address of agent for service)
| Registrant’s telephone number, including area code: | (713) 626-1919 | |||
| Date of fiscal year end: 10/31 | ||||
| Date of reporting period: 10/31/15 | ||||
Item 1. Report to Stockholders.
| ||||||
 | Annual Report to Shareholders
| October 31, 2015 | ||||
| ||||||
Invesco Asia Pacific Growth Fund
| ||||||
| Nasdaq: | ||||||
| A: ASIAX n B: ASIBX n C: ASICX n Y: ASIYX | ||||||

Letters to Shareholders
Philip Taylor | Dear Shareholders: This annual report includes information about your Fund, including performance data and a complete list of its investments as of the close of the reporting period. Inside is a discussion of how your Fund was managed and the factors that affected its performance during the reporting period. I hope you find this report of interest. The US economy expanded and unemployment declined throughout the reporting period. Continuing low energy prices benefited consumers, but a strong US dollar crimped corporate profits. The US Federal Reserve signaled that it was increasingly likely to raise interest rates, based on generally positive economic data, but uncertainty remained about when it might act. Overseas, the story was much different. Low energy prices hurt the economies of some oil-producing nations, such as Brazil and Russia. During the reporting period, the European Central |

Bank as well as central banks in China and Japan – among other countries – either instituted or maintained extraordinarily accommodative monetary policies in response to economic weakness.
Investor uncertainty, such as we saw for much of the reporting period – and market volatility, such as we saw at the end of the reporting period – are unfortunate facts of life when it comes to investing. Some investors use these things as excuses to delay saving and investing for their long-term financial goals. That’s why Invesco encourages investors to work with a professional financial adviser who can stress the importance of starting to save and invest early and the importance of adhering to a disciplined investment plan – when times are good and when they’re uncertain. A financial adviser who knows your unique financial situation, investment goals and risk tolerance can be an invaluable partner as you seek to achieve your financial goals. He or she can offer a long-term perspective when markets are volatile and time-tested advice and guidance when your financial situation or investment goals change.
Timely information when and where you want it
Invesco’s efforts to help investors achieve their financial objectives include providing individual investors and financial professionals with timely information about the markets, the economy and investing – whenever and wherever they want it.
Our website, invesco.com/us, offers a wide range of market insights and investment perspectives. On the website, you’ll find detailed information about our funds, including prices, performance, holdings and portfolio manager commentaries. You can access information about your account by completing a simple, secure online registration. Click on the “Need to register” link in the “Account Access” box on our homepage to get started.
Invesco’s mobile apps for iPhone® and iPad® (both available free from the App StoreSM) allow you to obtain the same detailed information, monitor your account and create customizable watch lists. Also, they allow you to access investment insights from our investment leaders, market strategists, economists and retirement experts. You can sign up to be alerted when new commentary is added, and you can watch portfolio manager videos and have instant access to Invesco news and updates wherever you may be.
In addition to the resources accessible on our website and through our mobile app, you can obtain timely updates to help you stay informed about the markets, the economy and investing by connecting with Invesco on Twitter, LinkedIn or Facebook. You can access our blog at blog.invesco.us.com. Our goal is to provide you the information you want, when and where you want it.
Have questions?
For questions about your account, feel free to contact an Invesco client services representative at 800 959 4246. For Invesco-related questions or comments, please email me directly at phil@invesco.com.
All of us at Invesco look forward to serving your investment management needs for many years to come. Thank you for investing with us.
Sincerely,

Philip Taylor
Senior Managing Director, Invesco Ltd.
iPhone and iPad are trademarks of Apple Inc., registered in the US and other countries. App Store is a service mark of Apple Inc. Invesco Distributors, Inc. is not affiliated with Apple Inc.
2 Invesco Asia Pacific Growth Fund
Bruce Crockett | Dear Fellow Shareholders: Among the many important lessons I’ve learned in more than 40 years in a variety of business endeavors is the value of a trusted advocate. As independent chair of the Invesco Funds Board, I can assure you that the members of the Board are strong advocates for the interests of investors in Invesco’s mutual funds. We work hard to represent your interests through oversight of the quality of the investment management services your funds receive and other matters important to your investment, including but not limited to: n Ensuring that Invesco offers a diverse lineup of mutual funds that your financial adviser can use to strive to meet your financial needs as your investment goals change over time. n Monitoring how the portfolio management teams of the Invesco funds are performing in light of changing economic and market conditions. |

| n | Assessing each portfolio management team’s investment performance within the context of the investment strategy described in the fund’s prospectus. |
| n | Monitoring for potential conflicts of interests that may impact the nature of the services that your funds receive. |
We believe one of the most important services we provide our fund shareholders is the annual review of the funds’ advisory and sub-advisory contracts with Invesco Advisers and its affiliates. This review is required by the Investment Company Act of 1940 and focuses on the nature and quality of the services Invesco provides as the adviser to the Invesco funds and the reasonableness of the fees that it charges for those services. Each year, we spend months carefully reviewing information received from Invesco and a variety of independent sources, such as performance and fee data prepared by Lipper Inc., an independent, third-party firm widely recognized as a leader in its field. We also meet with our independent legal counsel and other independent advisers to review and help us assess the information that we have received. Our goal is to assure that you receive quality investment management services for a reasonable fee.
I trust the measures outlined above provide assurance that you have a worthy advocate when it comes to choosing the Invesco Funds.
As always, please contact me at bruce@brucecrockett.com with any questions or concerns you may have. On behalf of the Board, we look forward to continuing to represent your interests and serving your needs.
Sincerely,

Bruce L. Crockett
Independent Chair
Invesco Funds Board of Trustees
3 Invesco Asia Pacific Growth Fund
Management’s Discussion of Fund Performance
Performance summary
For the fiscal year ended October 31, 2015, Class A shares of Invesco Asia Pacific Growth Fund (the Fund), at net asset value (NAV), outperformed the MSCI All Country Asia Pacific ex-Japan Index, the Fund’s broad market/style-specific benchmark.
Your Fund’s long-term performance appears later in this report.
Fund vs. Indexes
Total returns, 10/31/14 to 10/31/15, at net asset value (NAV). Performance shown does not include applicable contingent deferred sales charges (CDSC) or front-end sales charges, which would have reduced performance.
Class A Shares | -8.32 | % | |||
Class B Shares | -8.99 | ||||
Class C Shares | -8.98 | ||||
Class Y Shares | -8.09 | ||||
| MSCI All Country Asia Pacific ex-Japan Index▼ (Broad Market/Style-Specific Index)* | -10.46 | ||||
| MSCI EAFE Index▼ (Former Broad Market Index)* | -0.07 | ||||
| Lipper Pacific Region ex-Japan Funds Index¢ (Peer Group Index) | -6.01 |
Source(s): ▼FactSet Research Systems Inc.; ¢Lipper Inc. * The Fund has elected to use the MSCI All Country Asia Pacific ex-Japan Index to represent its broad market/style-specific benchmark rather than the MSCI EAFE Index because the MSCI All Country Asia Pacific ex-Japan Index more closely reflects the performance of the types of securities in which the Fund invests. | |||||
Market conditions and your Fund
International markets experienced increased volatility during the fiscal year ended October 31, 2015, driven largely by the continued slowdown in energy markets and the economic downturn in China. Developed markets were generally able to withstand these headwinds, even as more fragile emerging markets began to falter. Economic growth continued to decelerate across the Asia Pacific region over the reporting period. Asian economies were not robust enough to offset weakness in commodities and exports, and many Asian companies saw their revenue and earnings expectations adjusted downward over the fiscal year.
In the summer of 2015, Asian economies were particularly volatile as fears of a potential economic slowdown in China dominated headlines. The combination of a slowing Chinese economy, a sharp
sell-off in domestic Chinese equities and the devaluation of China’s currency, the renminbi, contributed to a strong correction in global equity markets. Emerging markets, in particular, were hard hit by events in China and by continued weak commodity prices – as well as by the US Federal Reserve’s decision to delay raising interest rates, which increased investor uncertainty and market volatility.
Significant volatility across equities, commodities and currencies led to declines for almost all broad-market/style-specific index sectors during the reporting period. The Fund was not immune to this broad-based decline.
On a geographic basis, the Fund’s holdings in Australia, Hong Kong and Malaysia outperformed those of the broad market/style-specific benchmark and were among the most significant contributors to the Fund’s relative performance for the
fiscal year. Underweight exposure to one of the reporting period’s weakest-performing markets, Australia, benefited the Fund’s relative performance.
The Fund’s Indonesian holdings, however, underperformed those of the broad market/style-specific benchmark over the fiscal year and were among the most significant detractors from relative results. In addition, the Fund’s underweight allocation to South Korea, one of the reporting period’s better-performing markets, detracted from the Fund’s relative performance.
From a sector perspective, the Fund’s holdings in the materials and consumer discretionary sectors outperformed those of the broad market/style-specific benchmark and were among the most significant contributors to the Fund’s relative performance for the reporting period. Underweight exposure to the reporting period’s weakest sector, energy, aided the Fund’s relative performance, as well. The Fund’s holdings in the utilities and financials sectors, however, underperformed those of the broad market/style-specific benchmark and were the most significant detractors from the Fund’s relative performance for the reporting period.
As a reminder, the Fund’s country and sector exposures are shaped by the stocks we select based on their own investment merits, rather than by making “top-down” allocation decisions.
Avago Technologies, a Singapore-based semiconductor company, was one of the Fund’s most significant contributors over the fiscal year. The market was pleasantly surprised by the speed and integration of the company’s acquisition of LSI (not a Fund holding). In addition, the company’s stock price rallied on the belief that the company would provide more components for the latest version of the Apple iPhone.
| Portfolio Composition | ||||||
| By sector | % of total net assets
|
| ||||
Financials | 29.4% | |||||
| Consumer Discretionary | 14.1 | |||||
| Information Technology | 12.2 | |||||
| Consumer Staples | 10.4 | |||||
| Industrials | 9.0 | |||||
| Materials | 7.0 | |||||
| Telecommunication Services | 6.1 | |||||
| Utilities | 3.9 | |||||
| Health Care | 3.5 | |||||
| Energy | 0.9 | |||||
| Money Market Funds Plus Other Assets Less Liabilities | 3.5 | |||||
| Top 10 Equity Holdings* | ||||||||
% of total net assets
|
| |||||||
1. | CK Hutchison Holdings Ltd. | 5.3% | ||||||
2. | Lee & Man Paper Manufacturing Ltd. | 4.4 | ||||||
3. | Hongkong Land Holdings Ltd. | 4.0 | ||||||
4. | Minth Group Ltd. | 3.6 | ||||||
5. | Stella International Holdings Ltd. | 3.6 | ||||||
6. | Industrial & Commercial Bank of China Ltd.-Class H | 3.4 | ||||||
7. | Metro Pacific Investments Corp. | 3.2 | ||||||
8. | China Mobile Ltd. | 3.1 | ||||||
9. | Cheung Kong Property Holdings Ltd. | 3.1 | ||||||
10. | Kasikornbank PCL | 3.0 | ||||||
Total Net Assets | $823.9 million | ||||
| Total Number of Holdings* | 48 | ||||
The Fund’s holdings are subject to change, and there is no assurance that the Fund will continue to hold any particular security.
*Excluding money market fund holdings.
Data presented here are as of October 31, 2015.
| 4 Invesco Asia Pacific Growth Fund |
In contrast, Kasikornbank, a conservatively-run bank in Thailand, was a significant detractor from Fund performance over the reporting period. Kasikornbank was negatively affected by an uptick in non-performing loans, which resulted from Thailand’s prolonged economic weakness.
Over the reporting period, we continued to look for opportunities to improve the growth potential and quality of the Fund’s portfolio by adding companies based on our earnings, quality and valuation (EQV) outlook for each company. As disconcerting as volatility may be, we believe it tends to create long-term opportunities for our shareholders. It’s rare to find a thriving business at a compelling valuation when everything is going right; those valuations typically occur when fear dominates the market. On a stock-by-stock basis, we saw the general market decline over the past year as a buying opportunity.
For example, the pullback in China allowed us to add a China-based beverage manufacturer, Kweichow Moutai, to the portfolio during the reporting period. Moutai is the premier brand in Chinese spirits and is an integral part of Chinese culture. The business was started during the Qing dynasty hundreds of years ago, and today, the company has a significant share of the high-end spirits market in China. The company had net cash on its books, an operating margin of approximately 70%1 and traded at a significant discount to its own history and to global peers. The sell-off in China local shares provided us with an opportunity to initiate a new position in this company.
Additional companies we purchased for the portfolio over the fiscal year included Thailand-based grocery retailer Big C Supercenter; Australia’s largest producer of farmed Atlantic salmon, Tassal Group; and Australian rail freight company Aurizon Holdings. During the fiscal year, we also trimmed or sold some of the Fund’s holdings with EQV characteristics that were no longer as compelling as when we first bought them, including First Pacific Company, Ayala Corporation and Keppel Corporation.
As always, regardless of the macroeconomic environment, we remain focused on a bottom-up investment approach of identifying attractive companies that fit our EQV-focused investment process. We continue to look for high-quality growth companies that exhibit the following characteristics: strong organic revenue growth; high returns on capital; pricing power; strong balance sheets; cash
generation; and reasonable valuations. In addition, we continue to favor companies that are able to consistently generate cash during weak economic environments. We believe that this balanced EQV-focused approach may help deliver attractive returns over the long term.
We thank you for your continued investment in Invesco Asia Pacific Growth Fund.
| 1 | Source: Merrill Lynch |
The views and opinions expressed in management’s discussion of Fund performance are those of Invesco Advisers, Inc. These views and opinions are subject to change at any time based on factors such as market and economic conditions. These views and opinions may not be relied upon as investment advice or recommendations, or as an offer for a particular security. The information is not a complete analysis of every aspect of any market, country, industry, security or the Fund. Statements of fact are from sources considered reliable, but Invesco Advisers, Inc. makes no representation or warranty as to their completeness or accuracy. Although historical performance is no guarantee of future results, these insights may help you understand our investment management philosophy.
See important Fund and, if applicable, index disclosures later in this report.
 | Shuxin (Steve) Cao Chartered Financial Analyst, Portfolio Manager, is lead manager of Invesco Asia Pacific Growth Fund. He joined | |
| Invesco in 1997. Mr. Cao earned a BA in English from the Tianjin Foreign Language Institute and an MBA from Texas A&M University. He is also a Certified Public Accountant. | ||
 | Brent Bates Chartered Financial Analyst, Portfolio Manager, is manager of Invesco Asia Pacific Growth Fund. He joined Invesco | |
| in 1996. Mr. Bates earned a BBA from Texas A&M University and is a Certified Public Accountant. | ||
 | Mark Jason Chartered Financial Analyst, Portfolio Manager, is manager of Invesco Asia Pacific Growth Fund. He joined Invesco in | |
| 2001. Mr. Jason earned a BS in finance and a BS in real estate from California State University, Northridge. | ||
| 5 Invesco Asia Pacific Growth Fund |
Your Fund’s Long-Term Performance
Results of a $10,000 Investment – Oldest Share Class(es)
Fund and index data from 10/31/05
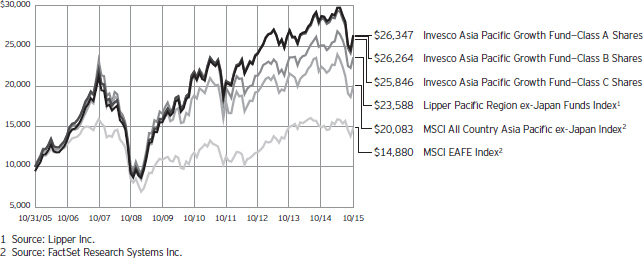
Past performance cannot guarantee comparable future results.
During the reporting period, the Fund elected to use the MSCI All Country Asia Pacific ex-Japan Index to represent its broad market/style-specific benchmark rather than the MSCI EAFE Index because the MSCI All Country Asia Pacific ex-Japan Index more closely reflects the performance of the types of securities in which the Fund invests. Because this is the first reporting period since we have
adopted the new index, SEC guidelines require that we compare performance to both the old and new indexes.
The data shown in the chart include reinvested distributions, applicable sales charges and Fund expenses including management fees. Results for Class B shares are calculated as if a hypothetical shareholder had liquidated his entire investment in the Fund at the close of the reporting period and paid the contingent deferred sales charges, if applicable.
Index results include reinvested dividends, but they do not reflect sales charges. Performance of the peer group, if applicable, reflects fund expenses and management fees; performance of a market index does not. Performance shown in the chart and table(s) does not reflect deduction of taxes a shareholder would pay on Fund distributions or sale of Fund shares.
continued from page 8
About indexes used in this report
| n | The MSCI All Country Asia Pacific ex-Japan Index is an unmanaged index considered representative of Pacific region stock markets, excluding Japan. The index is computed using the net return, which withholds applicable taxes for non-resident investors. |
| n | The MSCI EAFE® Index is an unmanaged index considered representative of stocks of Europe, Australasia and the Far East. The index is computed using the net return, which withholds applicable taxes for non-resident investors. |
| n | The Lipper Pacific Region ex-Japan Funds Index is an unmanaged index considered representative of Pacific region ex-Japan funds tracked by Lipper. |
| n | The Fund is not managed to track the performance of any particular index, including the index(es) described here, |
and consequently, the performance of the Fund may deviate significantly from the performance of the index(es). |
| n | A direct investment cannot be made in an index. Unless otherwise indicated, index results include reinvested dividends, and they do not reflect sales charges. Performance of the peer group, if applicable, reflects fund expenses; performance of a market index does not. |
Other information
| n | CPA® and Certified Public Accountant® are trademarks owned by the American Institute of Certified Public Accountants. |
| n | The returns shown in management’s discussion of Fund performance are based on net asset values (NAVs) calculated for shareholder transactions. Generally accepted accounting principles require adjustments to be made to |
the net assets of the Fund at period end for financial reporting purposes, and as such, the NAVs for shareholder transactions and the returns based on those NAVs may differ from the NAVs and returns reported in the Financial Highlights. |
| n | Industry classifications used in this report are generally according to the Global Industry Classification Standard, which was developed by and is the exclusive property and a service mark of MSCI Inc. and Standard & Poor’s. |
| 6 Invesco Asia Pacific Growth Fund |
Average Annual Total Returns As of 10/31/15, including maximum applicable | |||||
| Class A Shares | |||||
| Inception (11/3/97) | 8.53 | % | |||
| 10 Years | 10.17 | ||||
| 5 Years | 3.06 | ||||
| 1 Year | -13.37 | ||||
| Class B Shares | |||||
| Inception (11/3/97) | 8.54 | % | |||
| 10 Years | 10.14 | ||||
| 5 Years | 3.11 | ||||
| 1 Year | -13.37 | ||||
| Class C Shares | |||||
| Inception (11/3/97) | 8.07 | % | |||
| 10 Years | 9.96 | ||||
| 5 Years | 3.45 | ||||
| 1 Year | -9.86 | ||||
| Class Y Shares | |||||
| 10 Years | 10.99 | % | |||
| 5 Years | 4.49 | ||||
| 1 Year | -8.09 | ||||
Class Y shares incepted on October 3, 2008. Performance shown prior to that date is that of Class A shares and includes the 12b-1 fees applicable to Class A shares.
The performance data quoted represent past performance and cannot guarantee comparable future results; current performance may be lower or higher. Please visit invesco.com/performance for the most recent month-end performance. Performance figures reflect reinvested distributions, changes in net asset value and the effect of the maximum sales charge unless otherwise stated. Investment return and principal value will fluctuate so that you may have a gain or loss when you sell shares.
The net annual Fund operating expense ratio set forth in the most recent Fund prospectus as of the date of this report for Class A, Class B, Class C and Class Y shares was 1.49%, 2.24%, 2.24% and 1.24%, respectively.1 The total annual Fund operating expense ratio set forth in the most recent Fund prospectus as of the date of this report for Class A, Class B, Class C and Class Y shares was 1.50%, 2.25%, 2.25% and 1.25%, respectively. The expense ratios presented above may vary from the expense ratios presented in other sections of this report that are based on expenses incurred during the period covered by this report.
| Average Annual Total Returns As of 9/30/15, the most recent calendar quarter | |||||
| Class A Shares | |||||
| Inception (11/3/97) | 8.14 | % | |||
| 10 Years | 8.67 | ||||
| 5 Years | 2.10 | ||||
| 1 Year | -17.28 | ||||
| Class B Shares | |||||
| Inception (11/3/97) | 8.16 | % | |||
| 10 Years | 8.63 | ||||
| 5 Years | 2.15 | ||||
| 1 Year | -17.30 | ||||
| Class C Shares | |||||
| Inception (11/3/97) | 7.69 | % | |||
| 10 Years | 8.46 | ||||
| 5 Years | 2.49 | ||||
| 1 Year | -13.93 | ||||
| Class Y Shares | |||||
| 10 Years | 9.47 | % | |||
| 5 Years | 3.52 | ||||
| 1 Year | -12.23 | ||||
Class A share performance reflects the maximum 5.50% sales charge, and Class B and Class C share performance reflects the applicable contingent deferred sales charge (CDSC) for the period involved. The CDSC on Class B shares declines from 5% beginning at the time of purchase to 0% at the beginning of the seventh year. The CDSC on Class C shares is 1% for the first year after purchase. Class Y shares do not have a front-end sales charge or a CDSC; therefore, performance is at net asset value.
The performance of the Fund’s share classes will differ primarily due to different sales charge structures and class expenses.
Fund performance reflects any applicable fee waivers and/or expense reimbursements. Had the adviser not waived fees and/or reimbursed expenses currently or in the past, returns would have been lower. See current prospectus for more information.
| 1 | Total annual Fund operating expenses after any contractual fee waivers and/or expense reimbursements by the adviser in effect through at least June 30, 2017. See current prospectus for more information. |
| 7 Invesco Asia Pacific Growth Fund |
Invesco Asia Pacific Growth Fund’s investment objective is long-term growth of capital.
| n | Unless otherwise stated, information presented in this report is as of October 31, 2015, and is based on total net assets. |
| n | Unless otherwise noted, all data provided by Invesco. |
| n | To access your Fund’s reports/prospectus, visit invesco.com/fundreports. |
About share classes
| n | Class B shares may not be purchased for new or additional investments. Please see the prospectus for more information. |
| n | Class Y shares are available to only certain investors. Please see the prospectus for more information. |
Principal risks of investing in the Fund
| n | Depositary receipts risk. Depositary receipts involve many of the same risks as those associated with direct investment in foreign securities. In addition, the underlying issuers of certain depositary receipts, particularly unsponsored or unregistered depositary receipts, are under no obligation to distribute shareholder communications to the holders of such receipts or to pass through to them any voting rights with respect to the deposited securities. |
| n | Derivatives risk. The value of a derivative instrument depends largely on (and is derived from) the value of an underlying security, currency, commodity, interest rate, index or other asset (each referred to as an underlying asset). In addition to risks relating to the underlying assets, the use of derivatives may include other, possibly greater, risks, including counterparty, leverage and liquidity risks. Counterparty risk is the risk that the counterparty to the derivative contract will default on its obligation to pay the Fund the amount owed or otherwise perform under the derivative contract. Derivatives create leverage risk because they do not require payment up front equal to the economic exposure created by owning the derivative. As a result, an adverse change in the value of the underlying asset could result in the Fund sustaining a loss that is substantially greater than the amount invested in the derivative, which may make the Fund’s returns more volatile and increase the risk of loss. Derivative instruments may also be less liquid than more traditional investments and |
the Fund may be unable to sell or close out its derivative positions at a desirable time or price. This risk may be more acute under adverse market conditions, during which the Fund may be most in need of liquidating its derivative positions. Derivatives may also be harder to value, less tax efficient and subject to changing government regulation that could impact the Fund’s ability to use certain derivatives or their cost. Also, derivatives used for hedging or to gain or limit exposure to a particular market segment may not provide the expected benefits, particularly during adverse market conditions.
| n | Developing/emerging markets securities risk. The prices of securities issued by foreign companies and governments located in developing/emerging markets countries may be affected more negatively by inflation, devaluation of their currencies, higher transaction costs, delays in settlement, adverse political developments, the introduction of capital controls, withholding taxes, nationalization of private assets, expropriation, social unrest, war or lack of timely information than those in developed countries. |
| n | Foreign securities risk. The Fund’s foreign investments may be affected by changes in a foreign country’s exchange rates, political and social instability, changes in economic or taxation policies, difficulties when enforcing obligations, decreased liquidity, and increased volatility. Foreign companies may be subject to less regulation resulting in less publicly available information about the companies. |
| n | Geographic focus risk. From time to time the Fund may invest a substantial amount of its assets in securities of issuers located in a single country or a limited number of countries. If the Fund focuses its investments in this manner, it assumes the risk that economic, political and social conditions in those countries will have a significant impact on its investment performance. The Fund’s investment performance may |
also be more volatile if it focuses its investments in certain countries, especially emerging markets countries. |
| n | Growth investing risk. Growth stocks tend to be more expensive relative to their earnings or assets compared with other types of stock. As a result they tend to be more sensitive to changes in their earnings and can be more volatile. |
| n | Management risk. The investment techniques and risk analysis used by the Fund’s portfolio managers may not produce the desired results. |
| n | Market risk. The prices of and the income generated by the Fund’s securities may decline in response to, among other things, investor sentiment, general economic and market conditions, regional or global instability, and currency and interest rate fluctuations. |
| n | Preferred securities risk. Preferred securities may include provisions that permit the issuer, in its discretion, to defer or omit distributions for a certain period of time. If the Fund owns a security that is deferring or omitting its distributions, the Fund may be required to report the distribution on its tax returns, even though it may not have received this income. Further, preferred securities may lose substantial value due to the omission or deferment of dividend payments. |
| n | Small- and mid-capitalization risks. Stocks of small- and mid-sized companies tend to be more vulnerable to adverse developments and may have little or no operating history or track record of success, and limited product lines, markets, management and financial resources. The securities of small- and mid-sized companies may be more volatile due to less market interest and less publicly available information about the issuer. They also may be illiquid or restricted as to resale, or may trade less frequently and in smaller volumes, all of which may cause difficulty when establishing or closing a position at a desirable price. |
continued on page 6
This report must be accompanied or preceded by a currently effective Fund prospectus, which contains more complete information, including sales charges and expenses. Investors should read it carefully before investing.
|
|
| NOT FDIC INSURED | MAY LOSE VALUE | NO BANK GUARANTEE |
| 8 Invesco Asia Pacific Growth Fund |
Schedule of Investments
October 31, 2015
| Shares | Value | |||||||
Common Stocks & Other Equity Interests–96.47% |
| |||||||
| Australia–12.45% | ||||||||
Amcor Ltd. | 2,258,043 | $ | 21,847,980 | |||||
Aurizon Holdings Ltd. | 3,692,446 | 13,613,040 | ||||||
Brambles Ltd. | 1,327,434 | 9,825,637 | ||||||
Coca-Cola Amatil Ltd. | 1,116,507 | 7,253,210 | ||||||
Computershare Ltd. | 1,248,780 | 9,626,359 | ||||||
CSL Ltd. | 301,579 | 20,029,294 | ||||||
Tassal Group Ltd. | 6,797,342 | 20,393,630 | ||||||
| 102,589,150 | ||||||||
| China–28.77% | ||||||||
Baidu, Inc.–ADR(a) | 85,273 | 15,986,129 | ||||||
Belle International Holdings Ltd. | 11,103,000 | 10,801,308 | ||||||
China Mobile Ltd. | 2,125,000 | 25,279,287 | ||||||
CNOOC Ltd. | 6,165,500 | 7,012,476 | ||||||
Golden Eagle Retail Group Ltd. | 4,739,000 | 6,096,022 | ||||||
Industrial & Commercial Bank of China Ltd.–Class H | 44,689,000 | 28,357,739 | ||||||
Kweichow Moutai Co., Ltd.–Class A | 417,686 | 14,097,622 | ||||||
Lee & Man Paper Manufacturing Ltd. | 57,590,000 | 35,814,896 | ||||||
Minth Group Ltd. | 14,428,000 | 29,803,210 | ||||||
NetEase, Inc.–ADR | 129,815 | 18,762,162 | ||||||
Stella International Holdings Ltd. | 12,067,000 | 29,783,628 | ||||||
Want Want China Holdings Ltd. | 18,419,000 | 15,290,700 | ||||||
| 237,085,179 | ||||||||
| Hong Kong–15.49% | ||||||||
Cheung Kong Property Holdings Ltd. | 3,618,660 | 25,273,752 | ||||||
CK Hutchison Holdings Ltd. | 3,221,160 | 44,003,413 | ||||||
Galaxy Entertainment Group Ltd. | 1,663,000 | 5,658,811 | ||||||
Hongkong Land Holdings Ltd. | 4,423,500 | 33,117,369 | ||||||
WH Group Ltd.(a)(b) | 35,412,500 | 19,533,803 | ||||||
| 127,587,148 | ||||||||
| Indonesia–5.65% | ||||||||
PT Bank Central Asia Tbk | 16,935,900 | 15,903,115 | ||||||
PT Bank Mandiri Persero Tbk | 15,012,100 | 9,495,530 | ||||||
PT Perusahaan Gas Negara Persero Tbk | 29,758,700 | 6,480,757 | ||||||
PT Telekomunikasi Indonesia Persero Tbk | 74,163,200 | 14,674,160 | ||||||
| 46,553,562 | ||||||||
| Malaysia–3.84% | ||||||||
Kossan Rubber Industries Berhad | 4,750,200 | 9,000,774 | ||||||
Public Bank Berhad | 5,388,600 | 22,620,533 | ||||||
| 31,621,307 | ||||||||
| Shares | Value | |||||||
| Philippines–10.15% | ||||||||
Energy Development Corp. | 127,116,950 | $ | 17,933,796 | |||||
First Gen Corp. | 14,732,989 | 7,940,542 | ||||||
GMA Holdings, Inc.–PDR | 21,483,600 | 3,266,153 | ||||||
Metro Pacific Investments Corp. | 237,494,800 | 26,393,237 | ||||||
Philippine Long Distance Telephone Co. | 221,240 | 10,428,550 | ||||||
SM Investments Corp. | 357,811 | 6,661,512 | ||||||
SM Prime Holdings Inc. | 24,057,800 | 11,045,697 | ||||||
| 83,669,487 | ||||||||
| Singapore–7.36% | ||||||||
Avago Technologies Ltd. | 169,559 | 20,877,800 | ||||||
Keppel REIT | 30,822,700 | 21,191,784 | ||||||
United Overseas Bank Ltd. | 1,278,600 | 18,555,170 | ||||||
| 60,624,754 | ||||||||
| South Korea–2.96% | ||||||||
Hyundai Department Store Co., Ltd. | 115,780 | 12,683,369 | ||||||
Samsung Electronics Co., Ltd. | 9,805 | 11,740,336 | ||||||
| 24,423,705 | ||||||||
| Taiwan–2.90% | ||||||||
Taiwan Semiconductor Manufacturing Co. Ltd. | 5,675,464 | 23,890,947 | ||||||
| Thailand–6.90% | ||||||||
Big C Supercenter PCL–NVDR | 1,554,900 | 8,724,365 | ||||||
Kasikornbank PCL | 5,052,900 | 24,452,946 | ||||||
Major Cineplex Group PCL | 15,531,900 | 13,507,895 | ||||||
Siam Commercial Bank PCL (The) | 1,511,700 | 5,640,340 | ||||||
Thai Stanley Electric PCL | 911,800 | 4,527,664 | ||||||
| 56,853,210 | ||||||||
Total Common Stocks & Other Equity Interests |
| 794,898,449 | ||||||
Money Market Funds–4.12% |
| |||||||
Liquid Assets Portfolio–Institutional Class, 0.16%(c) | 16,952,163 | 16,952,163 | ||||||
Premier Portfolio–Institutional Class, 0.12%(c) | 16,952,162 | 16,952,162 | ||||||
Total Money Market Funds |
| 33,904,325 | ||||||
TOTAL INVESTMENTS–100.59% |
| 828,802,774 | ||||||
OTHER ASSETS LESS LIABILITIES–(0.59)% |
| (4,854,606 | ) | |||||
NET ASSETS–100.00% |
| $ | 823,948,168 | |||||
Investment Abbreviations:
| ADR | – American Depositary Receipt | |
| NVDR | – Non-Voting Depositary Receipt |
| PDR | – Philippine Depositary Receipt | |
| REIT | – Real Estate Investment Trust |
Notes to Schedule of Investments:
| (a) | Non-income producing security. |
| (b) | Security purchased or received in transaction exempt from registration under the Securities Act of 1933, as amended (the “1933 Act”). The security may be resold pursuant to an exemption from registration under the 1933 Act, typically to qualified institutional buyers. The value of this security at October 31, 2015 represented 2.37% of the Fund’s Net Assets. |
| (c) | The money market fund and the Fund are affiliated by having the same investment adviser. The rate shown is the 7-day SEC standardized yield as of October 31, 2015. |
See accompanying Notes to Financial Statements which are an integral part of the financial statements.
9 Invesco Asia Pacific Growth Fund
Statement of Assets and Liabilities
October 31, 2015
Assets: |
| |||
Investments, at value (Cost $674,731,726) | $ | 794,898,449 | ||
Investments in affiliated money market funds, at value and cost | 33,904,325 | |||
Total investments, at value (Cost $708,636,051) | 828,802,774 | |||
Foreign currencies, at value (Cost $774,197) | 760,580 | |||
Receivable for: | ||||
Investments sold | 476,324 | |||
Fund shares sold | 1,479,109 | |||
Dividends | 377,519 | |||
Investment for trustee deferred compensation and retirement plans | 122,430 | |||
Other assets | 33,840 | |||
Total assets | 832,052,576 | |||
Liabilities: |
| |||
Payable for: | ||||
Fund shares reacquired | 3,742,132 | |||
Accrued foreign taxes | 3,550,570 | |||
Accrued fees to affiliates | 478,758 | |||
Accrued trustees’ and officers’ fees and benefits | 2,323 | |||
Accrued other operating expenses | 192,873 | |||
Trustee deferred compensation and retirement plans | 137,752 | |||
Total liabilities | 8,104,408 | |||
Net assets applicable to shares outstanding | $ | 823,948,168 | ||
Net assets consist of: |
| |||
Shares of beneficial interest | $ | 694,430,855 | ||
Undistributed net investment income | 24,578,659 | |||
Undistributed net realized gain (loss) | (15,209,990 | ) | ||
Net unrealized appreciation | 120,148,644 | |||
| $ | 823,948,168 | |||
Net Assets: |
| |||
Class A | $ | 468,366,000 | ||
Class B | $ | 6,757,248 | ||
Class C | $ | 79,991,483 | ||
Class Y | $ | 268,833,437 | ||
Shares outstanding, $0.001 par value per share, |
| |||
Class A | 15,960,170 | |||
Class B | 247,774 | |||
Class C | 2,951,217 | |||
Class Y | 9,127,943 | |||
Class A: | ||||
Net asset value per share | $ | 29.35 | ||
Maximum offering price per share | ||||
(Net asset value of $29.35 ¸ 94.50%) | $ | 31.06 | ||
Class B: | ||||
Net asset value and offering price per share | $ | 27.27 | ||
Class C: | ||||
Net asset value and offering price per share | $ | 27.10 | ||
Class Y: | ||||
Net asset value and offering price per share | $ | 29.45 | ||
See accompanying Notes to Financial Statements which are an integral part of the financial statements.
10 Invesco Asia Pacific Growth Fund
Statement of Operations
For the year ended October 31, 2015
Investment income: |
| |||
Dividends (net of foreign withholding taxes of $1,901,436) | $ | 40,515,336 | ||
Dividends from affiliated money market funds | 53,355 | |||
Total investment income | 40,568,691 | |||
Expenses: | ||||
Advisory fees | 9,003,913 | |||
Administrative services fees | 244,127 | |||
Custodian fees | 689,432 | |||
Distribution fees: | ||||
Class A | 1,339,374 | |||
Class B | 106,145 | |||
Class C | 919,413 | |||
Transfer agent fees | 1,731,003 | |||
Trustees’ and officers’ fees and benefits | 34,197 | |||
Other | 276,967 | |||
Total expenses | 14,344,571 | |||
Less: Fees waived and expense offset arrangement(s) | (126,541 | ) | ||
Net expenses | 14,218,030 | |||
Net investment income | 26,350,661 | |||
Realized and unrealized gain (loss) from: | ||||
Net realized gain (loss) from: | ||||
Investment securities (net of foreign taxes on holdings $982,900) | (15,673,469 | ) | ||
Foreign currencies | (570,368 | ) | ||
| (16,243,837 | ) | |||
Change in net unrealized appreciation (depreciation) of: | ||||
Investment securities (net of foreign taxes on holdings $2,305,470) | (104,437,429 | ) | ||
Foreign currencies | 127,068 | |||
| (104,310,361 | ) | |||
Net realized and unrealized gain (loss) | (120,554,198 | ) | ||
Net increase (decrease) in net assets resulting from operations | $ | (94,203,537 | ) | |
See accompanying Notes to Financial Statements which are an integral part of the financial statements.
11 Invesco Asia Pacific Growth Fund
Statement of Changes in Net Assets
For the years ended October 31, 2015 and 2014
| 2015 | 2014 | |||||||
Operations: |
| |||||||
Net investment income | $ | 26,350,661 | $ | 12,018,802 | ||||
Net realized gain (loss) | (16,243,837 | ) | 26,542,554 | |||||
Change in net unrealized appreciation (depreciation) | (104,310,361 | ) | 15,006,092 | |||||
Net increase (decrease) in net assets resulting from operations | (94,203,537 | ) | 53,567,448 | |||||
Distributions to shareholders from net investment income: | ||||||||
Class A | (6,938,903 | ) | (4,576,835 | ) | ||||
Class B | (81,066 | ) | (30,319 | ) | ||||
Class C | (554,964 | ) | (134,057 | ) | ||||
Class Y | (3,930,309 | ) | (1,264,757 | ) | ||||
Total distributions from net investment income | (11,505,242 | ) | (6,005,968 | ) | ||||
Distributions to shareholders from net realized gains: | ||||||||
Class A | (15,905,754 | ) | (28,052,371 | ) | ||||
Class B | (427,032 | ) | (1,182,957 | ) | ||||
Class C | (2,923,423 | ) | (5,230,262 | ) | ||||
Class Y | (7,560,901 | ) | (6,036,431 | ) | ||||
Total distributions from net realized gains | (26,817,110 | ) | (40,502,021 | ) | ||||
Share transactions–net: | ||||||||
Class A | (14,351,854 | ) | (3,644,054 | ) | ||||
Class B | (6,636,896 | ) | (7,240,752 | ) | ||||
Class C | (3,037,408 | ) | (854,323 | ) | ||||
Class Y | 60,513,827 | 129,189,934 | ||||||
Net increase in net assets resulting from share transactions | 36,487,669 | 117,450,805 | ||||||
Net increase (decrease) in net assets | (96,038,220 | ) | 124,510,264 | |||||
Net assets: | ||||||||
Beginning of year | 919,986,388 | 795,476,124 | ||||||
End of year (includes undistributed net investment income of $24,578,659 and $11,301,321, respectively) | $ | 823,948,168 | $ | 919,986,388 | ||||
Notes to Financial Statements
October 31, 2015
NOTE 1—Significant Accounting Policies
Invesco Asia Pacific Growth Fund (the “Fund”) is a series portfolio of AIM International Mutual Funds (Invesco International Mutual Funds) (the “Trust”). The Trust is a Delaware statutory trust registered under the Investment Company Act of 1940, as amended (the “1940 Act”), as an open-end series management investment company consisting of eight separate portfolios, each authorized to issue an unlimited number of shares of beneficial interest. The assets, liabilities and operations of each portfolio are accounted for separately. Information presented in these financial statements pertains only to the Fund. Matters affecting each portfolio or class will be voted on exclusively by the shareholders of such portfolio or class.
The Fund’s investment objective is long-term growth of capital.
The Fund currently consists of four different classes of shares: Class A, Class B, Class C and Class Y. Class A shares are sold with a front-end sales charge unless certain waiver criteria are met and under certain circumstances load waived shares may be subject to contingent deferred sales charges (“CDSC”). Class C shares are sold with a CDSC. Class Y shares are sold at net asset value. Effective November 30, 2010, new or additional investments in Class B shares are no longer permitted. Existing shareholders of Class B shares may continue to reinvest dividends and capital gains distributions in Class B shares until they convert to Class A shares. Also, shareholders in Class B shares will be able to exchange those shares for Class B shares of other Invesco Funds offering such shares until they convert to Class A shares. Generally, Class B shares will automatically convert to Class A shares on or about the month-end, which is at least eight years after the date of purchase. Redemption of Class B shares prior to the conversion date will be subject to a CDSC.
The following is a summary of the significant accounting policies followed by the Fund in the preparation of its financial statements.
| A. | Security Valuations — Securities, including restricted securities, are valued according to the following policy. |
A security listed or traded on an exchange (except convertible securities) is valued at its last sales price or official closing price as of the close of the customary trading session on the exchange where the security is principally traded, or lacking any sales or official closing price on a particular day, the security may be valued at the closing bid price on that day. Securities traded in the over-the-counter market are valued based
12 Invesco Asia Pacific Growth Fund
on prices furnished by independent pricing services or market makers. When such securities are valued by an independent pricing service they may be considered fair valued. Futures contracts are valued at the final settlement price set by an exchange on which they are principally traded. Listed options are valued at the mean between the last bid and asked prices from the exchange on which they are principally traded. Options not listed on an exchange are valued by an independent source at the mean between the last bid and asked prices. For purposes of determining net asset value (“NAV”) per share, futures and option contracts generally are valued 15 minutes after the close of the customary trading session of the New York Stock Exchange (“NYSE”).
Investments in open-end and closed-end registered investment companies that do not trade on an exchange are valued at the end-of-day net asset value per share. Investments in open-end and closed-end registered investment companies that trade on an exchange are valued at the last sales price or official closing price as of the close of the customary trading session on the exchange where the security is principally traded.
Debt obligations (including convertible securities) and unlisted equities are fair valued using an evaluated quote provided by an independent pricing service. Evaluated quotes provided by the pricing service may be determined without exclusive reliance on quoted prices, and may reflect appropriate factors such as institution-size trading in similar groups of securities, developments related to specific securities, dividend rate (for unlisted equities), yield (for debt obligations), quality, type of issue, coupon rate (for debt obligations), maturity (for debt obligations), individual trading characteristics and other market data. Debt obligations are subject to interest rate and credit risks. In addition, all debt obligations involve some risk of default with respect to interest and/or principal payments.
Foreign securities’ (including foreign exchange contracts) prices are converted into U.S. dollar amounts using the applicable exchange rates as of the close of the NYSE. If market quotations are available and reliable for foreign exchange-traded equity securities, the securities will be valued at the market quotations. Because trading hours for certain foreign securities end before the close of the NYSE, closing market quotations may become unreliable. If between the time trading ends on a particular security and the close of the customary trading session on the NYSE, events occur that the Adviser determines are significant and make the closing price unreliable, the Fund may fair value the security. If the event is likely to have affected the closing price of the security, the security will be valued at fair value in good faith using procedures approved by the Board of Trustees. Adjustments to closing prices to reflect fair value may also be based on a screening process of an independent pricing service to indicate the degree of certainty, based on historical data, that the closing price in the principal market where a foreign security trades is not the current value as of the close of the NYSE. Foreign securities’ prices meeting the approved degree of certainty that the price is not reflective of current value will be priced at the indication of fair value from the independent pricing service. Multiple factors may be considered by the independent pricing service in determining adjustments to reflect fair value and may include information relating to sector indices, American Depositary Receipts and domestic and foreign index futures. Foreign securities may have additional risks including exchange rate changes, potential for sharply devalued currencies and high inflation, political and economic upheaval, the relative lack of issuer information, relatively low market liquidity and the potential lack of strict financial and accounting controls and standards.
Securities for which market prices are not provided by any of the above methods may be valued based upon quotes furnished by independent sources. The last bid price may be used to value equity securities. The mean between the last bid and asked prices is used to value debt obligations, including corporate loans.
Securities for which market quotations are not readily available or became unreliable are valued at fair value as determined in good faith by or under the supervision of the Trust’s officers following procedures approved by the Board of Trustees. Issuer specific events, market trends, bid/asked quotes of brokers and information providers and other market data may be reviewed in the course of making a good faith determination of a security’s fair value.
The Fund may invest in securities that are subject to interest rate risk, meaning the risk that the prices will generally fall as interest rates rise and, conversely, the prices will generally rise as interest rates fall. Specific securities differ in their sensitivity to changes in interest rates depending on their individual characteristics. Changes in interest rates may result in increased market volatility, which may affect the value and/or liquidity of certain Fund investments.
Valuations change in response to many factors including the historical and prospective earnings of the issuer, the value of the issuer’s assets, general economic conditions, interest rates, investor perceptions and market liquidity. Because of the inherent uncertainties of valuation, the values reflected in the financial statements may materially differ from the value received upon actual sale of those investments.
| B. | Securities Transactions and Investment Income — Securities transactions are accounted for on a trade date basis. Realized gains or losses on sales are computed on the basis of specific identification of the securities sold. Interest income (net of withholding tax, if any) is recorded on the accrual basis from settlement date. Dividend income (net of withholding tax, if any) is recorded on the ex-dividend date. |
The Fund may periodically participate in litigation related to Fund investments. As such, the Fund may receive proceeds from litigation settlements. Any proceeds received are included in the Statement of Operations as realized gain (loss) for investments no longer held and as unrealized gain (loss) for investments still held.
Brokerage commissions and mark ups are considered transaction costs and are recorded as an increase to the cost basis of securities purchased and/or a reduction of proceeds on a sale of securities. Such transaction costs are included in the determination of net realized and unrealized gain (loss) from investment securities reported in the Statement of Operations and the Statement of Changes in Net Assets and the net realized and unrealized gains (losses) on securities per share in the Financial Highlights. Transaction costs are included in the calculation of the Fund’s net asset value and, accordingly, they reduce the Fund’s total returns. These transaction costs are not considered operating expenses and are not reflected in net investment income reported in the Statement of Operations and the Statement of Changes in Net Assets, or the net investment income per share and the ratios of expenses and net investment income reported in the Financial Highlights, nor are they limited by any expense limitation arrangements between the Fund and the investment adviser.
The Fund allocates income and realized and unrealized capital gains and losses to a class based on the relative net assets of each class.
| C. | Country Determination — For the purposes of making investment selection decisions and presentation in the Schedule of Investments, the investment adviser may determine the country in which an issuer is located and/or credit risk exposure based on various factors. These factors include the laws of the country under which the issuer is organized, where the issuer maintains a principal office, the country in which the issuer derives 50% or more of its total revenues and the country that has the primary market for the issuer’s securities, as well as other criteria. Among the other criteria that may be evaluated for making this determination are the country in which the issuer maintains 50% or more of its assets, |
13 Invesco Asia Pacific Growth Fund
| the type of security, financial guarantees and enhancements, the nature of the collateral and the sponsor organization. Country of issuer and/or credit risk exposure has been determined to be the United States of America, unless otherwise noted. |
| D. | Distributions — Distributions from net investment income and net realized capital gain, if any, are generally declared and paid annually and recorded on the ex-dividend date. The Fund may elect to treat a portion of the proceeds from redemptions as distributions for federal income tax purposes. |
| E. | Federal Income Taxes — The Fund intends to comply with the requirements of Subchapter M of the Internal Revenue Code of 1986, as amended (the “Internal Revenue Code”), necessary to qualify as a regulated investment company and to distribute substantially all of the Fund’s taxable earnings to shareholders. As such, the Fund will not be subject to federal income taxes on otherwise taxable income (including net realized capital gain) that is distributed to shareholders. Therefore, no provision for federal income taxes is recorded in the financial statements. |
The Fund recognizes the tax benefits of uncertain tax positions only when the position is more likely than not to be sustained. Management has analyzed the Fund’s uncertain tax positions and concluded that no liability for unrecognized tax benefits should be recorded related to uncertain tax positions. Management is not aware of any tax positions for which it is reasonably possible that the total amounts of unrecognized tax benefits will change materially in the next 12 months.
The Fund files tax returns in the U.S. Federal jurisdiction and certain other jurisdictions. Generally, the Fund is subject to examinations by such taxing authorities for up to three years after the filing of the return for the tax period.
| F. | Expenses — Fees provided for under the Rule 12b-1 plan of a particular class of the Fund and which are directly attributable to that class are charged to the operations of such class. All other expenses are allocated among the classes based on relative net assets. |
| G. | Accounting Estimates — The preparation of financial statements in conformity with accounting principles generally accepted in the United States of America (“GAAP”) requires management to make estimates and assumptions that affect the reported amounts of assets and liabilities at the date of the financial statements and the reported amounts of revenues and expenses during the reporting period including estimates and assumptions related to taxation. Actual results could differ from those estimates by a significant amount. In addition, the Fund monitors for material events or transactions that may occur or become known after the period-end date and before the date the financial statements are released to print. |
| H. | Indemnifications — Under the Trust’s organizational documents, each Trustee, officer, employee or other agent of the Trust is indemnified against certain liabilities that may arise out of the performance of their duties to the Fund. Additionally, in the normal course of business, the Fund enters into contracts, including the Fund’s servicing agreements, that contain a variety of indemnification clauses. The Fund’s maximum exposure under these arrangements is unknown as this would involve future claims that may be made against the Fund that have not yet occurred. The risk of material loss as a result of such indemnification claims is considered remote. |
| I. | Foreign Currency Translations — Foreign currency is valued at the close of the NYSE based on quotations posted by banks and major currency dealers. Portfolio securities and other assets and liabilities denominated in foreign currencies are translated into U.S. dollar amounts at date of valuation. Purchases and sales of portfolio securities (net of foreign taxes withheld on disposition) and income items denominated in foreign currencies are translated into U.S. dollar amounts on the respective dates of such transactions. The Fund does not separately account for the portion of the results of operations resulting from changes in foreign exchange rates on investments and the fluctuations arising from changes in market prices of securities held. The combined results of changes in foreign exchange rates and the fluctuation of market prices on investments (net of estimated foreign tax withholding) are included with the net realized and unrealized gain or loss from investments in the Statement of Operations. Reported net realized foreign currency gains or losses arise from (1) sales of foreign currencies, (2) currency gains or losses realized between the trade and settlement dates on securities transactions, and (3) the difference between the amounts of dividends, interest, and foreign withholding taxes recorded on the Fund’s books and the U.S. dollar equivalent of the amounts actually received or paid. Net unrealized foreign currency gains and losses arise from changes in the fair values of assets and liabilities, other than investments in securities at fiscal period end, resulting from changes in exchange rates. |
The Fund may invest in foreign securities, which may be subject to foreign taxes on income, gains on investments or currency repatriation, a portion of which may be recoverable. Foreign taxes, if any, are recorded based on the tax regulations and rates that exist in the foreign markets in which the Fund invests and are shown in the Statement of Operations.
| J. | Forward Foreign Currency Contracts — The Fund may engage in foreign currency transactions either on a spot (i.e. for prompt delivery and settlement) basis, or through forward foreign currency contracts, to manage or minimize currency or exchange rate risk. |
The Fund may also enter into forward foreign currency contracts for the purchase or sale of a security denominated in a foreign currency in order to “lock in” the U.S. dollar price of that security, or the Fund may also enter into forward foreign currency contracts that do not provide for physical settlement of the two currencies, but instead are settled by a single cash payment calculated as the difference between the agreed upon exchange rate and the spot rate at settlement based upon an agreed upon notional amount (non-deliverable forwards). The Fund will set aside liquid assets in an amount equal to daily mark-to-market obligation for forward foreign currency contracts.
A forward foreign currency contract is an obligation between two parties (“Counterparties”) to purchase or sell a specific currency for an agreed-upon price at a future date. The use of forward foreign currency contracts does not eliminate fluctuations in the price of the underlying securities the Fund owns or intends to acquire but establishes a rate of exchange in advance. Fluctuations in the value of these contracts are measured by the difference in the contract date and reporting date exchange rates and are recorded as unrealized appreciation (depreciation) until the contracts are closed. When the contracts are closed, realized gains (losses) are recorded. Realized and unrealized gains (losses) on the contracts are included in the Statement of Operations. The primary risks associated with forward foreign currency contracts include failure of the Counterparty to meet the terms of the contract and the value of the foreign currency changing unfavorably. These risks may be in excess of the amounts reflected in the Statement of Assets and Liabilities.
14 Invesco Asia Pacific Growth Fund
NOTE 2—Advisory Fees and Other Fees Paid to Affiliates
The Trust has entered into a master investment advisory agreement with Invesco Advisers, Inc. (the “Adviser” or “Invesco”). Under the terms of the investment advisory agreement, the Fund pays an advisory fee to the Adviser based on the annual rate of the Fund’s average daily net assets as follows:
| Average Daily Net Assets | Rate | |||||
First $250 million | 0 | .935% | ||||
Next $250 million | 0 | .91% | ||||
Next $500 million | 0 | .885% | ||||
Next $1.5 billion | 0 | .86% | ||||
Next $2.5 billion | 0 | .835% | ||||
Next $2.5 billion | 0 | .81% | ||||
Next $2.5 billion | 0 | .785% | ||||
Over $10 billion | 0 | .76% | ||||
For the year ended October 31, 2015, the effective advisory fees incurred by the Fund was 0.90%.
Under the terms of a master sub-advisory agreement between the Adviser and each of Invesco Asset Management Deutschland GmbH, Invesco Asset Management Limited, Invesco Asset Management (Japan) Limited, Invesco Hong Kong Limited, Invesco Senior Secured Management, Inc. and Invesco Canada Ltd. (collectively, the “Affiliated Sub-Advisers”) the Adviser, not the Fund, may pay 40% of the fees paid to the Adviser to any such Affiliated Sub-Adviser(s) that provide(s) discretionary investment management services to the Fund based on the percentage of assets allocated to such Affiliated Sub-Adviser(s).
The Adviser has contractually agreed, through at least June 30, 2016, to waive advisory fees and/or reimburse expenses of all shares to the extent necessary to limit total annual fund operating expenses after fee waiver and/or expense reimbursement (excluding certain items discussed below) of Class A, Class B, Class C and Class Y shares to 2.25%, 3.00%, 3.00% and 2.00%, respectively, of average daily net assets. In determining the Adviser’s obligation to waive advisory fees and/or reimburse expenses, the following expenses are not taken into account, and could cause the total annual fund operating expenses after fee waiver and/or expense reimbursement to exceed the numbers reflected above: (1) interest; (2) taxes; (3) dividend expense on short sales; (4) extraordinary or non-routine items; and (5) expenses that the Fund has incurred but did not actually pay because of an expense offset arrangement. Unless Invesco continues the fee waiver agreement, it will terminate on June 30, 2016. The fee waiver agreement cannot be terminated during its term. The Adviser did not waive fees and/or reimburse expenses during the period under this expense limitation.
Further, the Adviser has contractually agreed, through at least June 30, 2017, to waive the advisory fee payable by the Fund in an amount equal to 100% of the net advisory fees the Adviser receives from the affiliated money market funds on investments by the Fund of uninvested cash in such affiliated money market funds.
For the year ended October 31, 2015, the Adviser waived advisory fees of $122,595.
The Trust has entered into a master administrative services agreement with Invesco pursuant to which the Fund has agreed to pay Invesco for certain administrative costs incurred in providing accounting services to the Fund. For the year ended October 31, 2015, expenses incurred under the agreement are shown in the Statement of Operations as Administrative services fees.
The Trust has entered into a transfer agency and service agreement with Invesco Investment Services, Inc. (“IIS”) pursuant to which the Fund has agreed to pay IIS a fee for providing transfer agency and shareholder services to the Fund and reimburse IIS for certain expenses incurred by IIS in the course of providing such services. IIS may make payments to intermediaries that provide omnibus account services, sub-accounting services and/or networking services. All fees payable by IIS to intermediaries that provide omnibus account services or sub-accounting are charged back to the Fund, subject to certain limitations approved by the Trust’s Board of Trustees. For the year ended October 31, 2015, the expenses incurred under the agreement are shown in the Statement of Operations as Transfer agent fees.
The Trust has entered into master distribution agreements with Invesco Distributors, Inc. (“IDI”) to serve as the distributor for the Class A, Class B, Class C and Class Y shares of the Fund. The Trust has adopted plans pursuant to Rule 12b-1 under the 1940 Act with respect to the Fund’s Class A, Class B and Class C shares (collectively, the “Plans”). The Fund, pursuant to the Plans, pays IDI compensation at the annual rate of 0.25% of the Fund’s average daily net assets of Class A shares and 1.00% of the average daily net assets of each class of Class B and Class C shares. Of the Plan payments, up to 0.25% of the average daily net assets of each class of shares may be paid to furnish continuing personal shareholder services to customers who purchase and own shares of such classes. Any amounts not paid as a service fee under the Plans would constitute an asset-based sales charge. Rules of the Financial Industry Regulatory Authority (“FINRA”) impose a cap on the total sales charges, including asset-based sales charges, that may be paid by any class of shares of the Fund. For the year ended October 31, 2015, expenses incurred under the Plans are shown in the Statement of Operations as Distribution fees.
Front-end sales commissions and CDSC (collectively, the “sales charges”) are not recorded as expenses of the Fund. Front-end sales commissions are deducted from proceeds from the sales of Fund shares prior to investment in Class A shares of the Fund. CDSC are deducted from redemption proceeds prior to remittance to the shareholder. During the year ended October 31, 2015, IDI advised the Fund that IDI retained $162,590 in front-end sales commissions from the sale of Class A shares and $2,131, $3,323 and $4,132 from Class A, Class B and Class C shares, respectively, for CDSC imposed on redemptions by shareholders.
Certain officers and trustees of the Trust are officers and directors of the Adviser, IIS and/or IDI.
15 Invesco Asia Pacific Growth Fund
NOTE 3—Additional Valuation Information
GAAP defines fair value as the price that would be received to sell an asset or paid to transfer a liability in an orderly transaction between market participants at the measurement date, under current market conditions. GAAP establishes a hierarchy that prioritizes the inputs to valuation methods, giving the highest priority to readily available unadjusted quoted prices in an active market for identical assets (Level 1) and the lowest priority to significant unobservable inputs (Level 3), generally when market prices are not readily available or are unreliable. Based on the valuation inputs, the securities or other investments are tiered into one of three levels. Changes in valuation methods may result in transfers in or out of an investment’s assigned level:
| Level 1 — | Prices are determined using quoted prices in an active market for identical assets. |
| Level 2 — | Prices are determined using other significant observable inputs. Observable inputs are inputs that other market participants may use in pricing a security. These may include quoted prices for similar securities, interest rates, prepayment speeds, credit risk, yield curves, loss severities, default rates, discount rates, volatilities and others. |
| Level 3 — | Prices are determined using significant unobservable inputs. In situations where quoted prices or observable inputs are unavailable (for example, when there is little or no market activity for an investment at the end of the period), unobservable inputs may be used. Unobservable inputs reflect the Fund’s own assumptions about the factors market participants would use in determining fair value of the securities or instruments and would be based on the best available information. |
The following is a summary of the tiered valuation input levels, as of October 31, 2015. The level assigned to the securities valuations may not be an indication of the risk or liquidity associated with investing in those securities. Because of the inherent uncertainties of valuation, the values reflected in the financial statements may materially differ from the value received upon actual sale of those investments.
During the year ended October 31, 2015, there were transfers from Level 1 to Level 2 of $208,773,513 and from Level 2 to Level 1 of $69,713,322, due to foreign fair value adjustments.
| Level 1 | Level 2 | Level 3 | Total | |||||||||||||
Australia | $ | 40,318,246 | $ | 62,270,904 | $ | — | $ | 102,589,150 | ||||||||
China | 51,645,621 | 185,439,558 | — | 237,085,179 | ||||||||||||
Hong Kong | — | 127,587,148 | — | 127,587,148 | ||||||||||||
Indonesia | — | 46,553,562 | — | 46,553,562 | ||||||||||||
Malaysia | 9,000,774 | 22,620,533 | — | 31,621,307 | ||||||||||||
Philippines | — | 83,669,487 | — | 83,669,487 | ||||||||||||
Singapore | 39,432,970 | 21,191,784 | — | 60,624,754 | ||||||||||||
South Korea | — | 24,423,705 | — | 24,423,705 | ||||||||||||
Taiwan | — | 23,890,947 | — | 23,890,947 | ||||||||||||
Thailand | 51,212,870 | 5,640,340 | — | 56,853,210 | ||||||||||||
United States | 33,904,325 | — | — | 33,904,325 | ||||||||||||
Total Investments | $ | 225,514,806 | $ | 603,287,968 | $ | — | $ | 828,802,774 | ||||||||
NOTE 4—Expense Offset Arrangement(s)
The expense offset arrangement is comprised of transfer agency credits which result from balances in demand deposit accounts used by the transfer agent for clearing shareholder transactions. For the year ended October 31, 2015, the Fund received credits from this arrangement, which resulted in the reduction of the Fund’s total expenses of $3,946.
NOTE 5—Trustees’ and Officers’ Fees and Benefits
Trustees’ and Officers’ Fees and Benefits include amounts accrued by the Fund to pay remuneration to certain Trustees and Officers of the Fund. Trustees have the option to defer compensation payable by the Fund, and Trustees’ and Officers’ Fees and Benefits also include amounts accrued by the Fund to fund such deferred compensation amounts. Those Trustees who defer compensation have the option to select various Invesco Funds in which their deferral accounts shall be deemed to be invested. Finally, certain current Trustees were eligible to participate in a retirement plan that provided for benefits to be paid upon retirement to Trustees over a period of time based on the number of years of service. The Fund may have certain former Trustees who also participate in a retirement plan and receive benefits under such plan. Trustees’ and Officers’ Fees and Benefits include amounts accrued by the Fund to fund such retirement benefits. Obligations under the deferred compensation and retirement plans represent unsecured claims against the general assets of the Fund.
NOTE 6—Cash Balances
The Fund is permitted to temporarily carry a negative or overdrawn balance in its account with State Street Bank and Trust Company, the custodian bank. Such balances, if any at period end, are shown in the Statement of Assets and Liabilities under the payable caption Amount due custodian. To compensate the custodian bank for such overdrafts, the overdrawn Fund may either (1) leave funds as a compensating balance in the account so the custodian bank can be compensated by earning the additional interest; or (2) compensate by paying the custodian bank at a rate agreed upon by the custodian bank and Invesco, not to exceed the contractually agreed upon rate.
16 Invesco Asia Pacific Growth Fund
NOTE 7—Distributions to Shareholders and Tax Components of Net Assets
Tax Character of Distributions to Shareholders Paid During the Fiscal Years Ended October 31, 2015 and 2014:
| 2015 | 2014 | |||||||
Ordinary income | $ | 11,520,054 | $ | 6,005,968 | ||||
Long-term capital gain | 26,802,298 | 40,502,021 | ||||||
Total distributions | $ | 38,322,352 | $ | 46,507,989 | ||||
Tax Components of Net Assets at Period-End:
| 2015 | ||||
Undistributed ordinary income | $ | 24,719,050 | ||
Net unrealized appreciation — investments | 119,363,386 | |||
Net unrealized appreciation (depreciation) — other investments | (18,079 | ) | ||
Temporary book/tax differences | (136,748 | ) | ||
Capital loss carryover | (14,410,296 | ) | ||
Shares of beneficial interest | 694,430,855 | |||
Total net assets | $ | 823,948,168 | ||
The difference between book-basis and tax-basis unrealized appreciation (depreciation) is due to differences in the timing of recognition of gains and losses on investments for tax and book purposes. The Fund’s net unrealized appreciation difference is attributable primarily to wash sales.
The temporary book/tax differences are a result of timing differences between book and tax recognition of income and/or expenses. The Fund’s temporary book/tax differences are the result of the trustee deferral of compensation and retirement plan benefits.
Capital loss carryforward is calculated and reported as of a specific date. Results of transactions and other activity after that date may affect the amount of capital loss carryforward actually available for the Fund to utilize. Capital losses generated in years beginning after December 22, 2010 can be carried forward for an unlimited period, whereas previous losses expire in eight tax years. Capital losses with an expiration period may not be used to offset capital gains until all net capital losses without an expiration date have been utilized. Capital loss carryforwards with no expiration date will retain their character as either short-term or long-term capital losses instead of as short-term capital losses as under prior law. The ability to utilize capital loss carryforwards in the future may be limited under the Internal Revenue Code and related regulations based on the results of future transactions.
The Fund has a capital loss carryforward as of October 31, 2015, which expires as follows:
| Capital Loss Carryforward* | ||||||||||||
| Expiration | Short-Term | Long-Term | Total | |||||||||
Not subject to expiration | $ | 14,410,296 | $ | — | $ | 14,410,296 | ||||||
| * | Capital loss carryforward as of the date listed above is reduced for limitations, if any, to the extent required by the Internal Revenue Code and may be further limited depending upon a variety of factors, including the realization of net unrealized gains or losses as of the date of any reorganization. |
NOTE 8—Investment Securities
The aggregate amount of investment securities (other than short-term securities, U.S. Treasury obligations and money market funds, if any) purchased and sold by the Fund during the year ended October 31, 2015 was $283,062,598 and $210,985,912, respectively. Cost of investments on a tax basis includes the adjustments for financial reporting purposes as of the most recently completed federal income tax reporting period-end.
| Unrealized Appreciation (Depreciation) of Investment Securities on a Tax Basis | ||||
Aggregate unrealized appreciation of investment securities | $ | 151,910,332 | ||
Aggregate unrealized (depreciation) of investment securities | (32,546,946 | ) | ||
Net unrealized appreciation of investment securities | $ | 119,363,386 | ||
Cost of investments for tax purposes is $709,439,388.
NOTE 9—Reclassification of Permanent Differences
Primarily as a result of differing book/tax treatment of foreign currency transactions and foreign capital gain taxes, on October 31, 2015, undistributed net investment income was decreased by $1,568,081 and undistributed net realized gain (loss) was increased by $1,568,081. This reclassification had no effect on the net assets of the Fund.
17 Invesco Asia Pacific Growth Fund
NOTE 10—Share Information
| Summary of Share Activity | ||||||||||||||||
| Years ended October 31, | ||||||||||||||||
| 2015(a) | 2014 | |||||||||||||||
| Shares | Amount | Shares | Amount | |||||||||||||
Sold: | ||||||||||||||||
Class A | 3,322,479 | $ | 105,532,830 | 3,593,919 | $ | 115,311,135 | ||||||||||
Class B | 10,622 | 320,599 | 13,322 | 396,533 | ||||||||||||
Class C | 454,728 | 13,459,302 | 522,102 | 15,457,978 | ||||||||||||
Class Y | 10,006,164 | 319,095,160 | 5,784,873 | 182,921,092 | ||||||||||||
Issued as reinvestment of dividends: | ||||||||||||||||
Class A | 726,443 | 22,556,041 | 986,444 | 29,474,930 | ||||||||||||
Class B | 17,252 | 501,161 | 39,872 | 1,117,602 | ||||||||||||
Class C | 117,502 | 3,392,286 | 178,309 | 4,967,702 | ||||||||||||
Class Y | 245,080 | 7,619,531 | 206,630 | 6,182,381 | ||||||||||||
Automatic conversion of Class B shares to Class A shares: | ||||||||||||||||
Class A | 173,093 | 5,502,079 | 154,084 | 4,883,279 | ||||||||||||
Class B | (185,570 | ) | (5,502,079 | ) | (164,822 | ) | (4,883,279 | ) | ||||||||
Reacquired: | ||||||||||||||||
Class A | (4,761,851 | ) | (147,942,804 | ) | (4,840,275 | ) | (153,313,398 | ) | ||||||||
Class B | (66,916 | ) | (1,956,577 | ) | (132,579 | ) | (3,871,608 | ) | ||||||||
Class C | (698,211 | ) | (19,888,996 | ) | (725,341 | ) | (21,280,003 | ) | ||||||||
Class Y | (8,827,917 | ) | (266,200,864 | ) | (1,892,515 | ) | (59,913,539 | ) | ||||||||
Net increase in share activity | 532,898 | $ | 36,487,669 | 3,724,023 | $ | 117,450,805 | ||||||||||
| (a) | There are entities that are record owners of more than 5% of the outstanding shares of the Fund and in the aggregate own 34% of the outstanding shares of the Fund. IDI has an agreement with these entities to sell Fund shares. The Fund, Invesco and/or Invesco affiliates may make payments to these entities, which are considered to be related to the Fund, for providing services to the Fund, Invesco and/or Invesco affiliates including but not limited to services such as securities brokerage, distribution, third party record keeping and account servicing. The Fund has no knowledge as to whether all or any portion of the shares owned of record by these entities are also owned beneficially. |
18 Invesco Asia Pacific Growth Fund
NOTE 11—Financial Highlights
The following schedule presents financial highlights for a share of the Fund outstanding throughout the periods indicated.
| Net asset value, beginning of period | Net investment income(a) | Net gains (losses) on securities (both realized and unrealized) | Total from investment operations | Dividends from net investment income | Distributions from net realized gains | Total distributions | Net asset value, end of period(b) | Total return(c) | Net assets, end of period (000’s omitted) | Ratio of expenses to average net assets with fee waivers and/or expenses absorbed | Ratio of expenses to average net assets without fee waivers and/or expenses absorbed | Ratio of net investment income to average net assets | Portfolio turnover(d) | |||||||||||||||||||||||||||||||||||||||||||
Class A | ||||||||||||||||||||||||||||||||||||||||||||||||||||||||
Year ended 10/31/15 | $ | 33.43 | $ | 0.83 | (e) | $ | (3.54 | ) | $ | (2.71 | ) | $ | (0.41 | ) | $ | (0.96 | ) | $ | (1.37 | ) | $ | 29.35 | (8.32 | )% | $ | 468,366 | 1.44 | %(f) | 1.45 | %(f) | 2.63 | %(e)(f) | 23 | % | ||||||||||||||||||||||
Year ended 10/31/14 | 33.45 | 0.48 | 1.47 | 1.95 | (0.27 | ) | (1.70 | ) | (1.97 | ) | 33.43 | 6.54 | 551,539 | 1.47 | 1.48 | 1.52 | 15 | |||||||||||||||||||||||||||||||||||||||
Year ended 10/31/13 | 30.65 | 0.30 | 3.35 | 3.65 | (0.20 | ) | (0.65 | ) | (0.85 | ) | 33.45 | 12.16 | 555,505 | 1.47 | 1.49 | 0.95 | 18 | |||||||||||||||||||||||||||||||||||||||
Year ended 10/31/12 | 28.42 | 0.26 | 4.34 | 4.60 | (0.27 | ) | (2.10 | ) | (2.37 | ) | 30.65 | 17.77 | 457,964 | 1.54 | 1.55 | 0.89 | 16 | |||||||||||||||||||||||||||||||||||||||
Year ended 10/31/11 | 30.30 | 0.28 | (1.68 | ) | (1.40 | ) | (0.23 | ) | (0.25 | ) | (0.48 | ) | 28.42 | (4.67 | ) | 385,828 | 1.53 | 1.55 | 0.93 | 27 | ||||||||||||||||||||||||||||||||||||
Class B | ||||||||||||||||||||||||||||||||||||||||||||||||||||||||
Year ended 10/31/15 | 31.15 | 0.56 | (e) | (3.30 | ) | (2.74 | ) | (0.18 | ) | (0.96 | ) | (1.14 | ) | 27.27 | (9.03 | ) | 6,757 | 2.19 | (f) | 2.20 | (f) | 1.88 | (e)(f) | 23 | ||||||||||||||||||||||||||||||||
Year ended 10/31/14 | 31.29 | 0.23 | 1.37 | 1.60 | (0.04 | ) | (1.70 | ) | (1.74 | ) | 31.15 | 5.74 | 14,714 | 2.22 | 2.23 | 0.77 | 15 | |||||||||||||||||||||||||||||||||||||||
Year ended 10/31/13 | 28.74 | 0.06 | 3.14 | 3.20 | — | (0.65 | ) | (0.65 | ) | 31.29 | 11.32 | 22,421 | 2.22 | 2.24 | 0.20 | 18 | ||||||||||||||||||||||||||||||||||||||||
Year ended 10/31/12 | 26.73 | 0.04 | 4.10 | 4.14 | (0.03 | ) | (2.10 | ) | (2.13 | ) | 28.74 | 16.94 | 27,112 | 2.29 | 2.30 | 0.14 | 16 | |||||||||||||||||||||||||||||||||||||||
Year ended 10/31/11 | 28.58 | 0.05 | (1.59 | ) | (1.54 | ) | (0.06 | ) | (0.25 | ) | (0.31 | ) | 26.73 | (5.41 | ) | 30,394 | 2.28 | 2.30 | 0.18 | 27 | ||||||||||||||||||||||||||||||||||||
Class C | ||||||||||||||||||||||||||||||||||||||||||||||||||||||||
Year ended 10/31/15 | 30.96 | 0.55 | (e) | (3.27 | ) | (2.72 | ) | (0.18 | ) | (0.96 | ) | (1.14 | ) | 27.10 | (9.02 | ) | 79,991 | 2.19 | (f) | 2.20 | (f) | 1.88 | (e)(f) | 23 | ||||||||||||||||||||||||||||||||
Year ended 10/31/14 | 31.11 | 0.23 | 1.36 | 1.59 | (0.04 | ) | (1.70 | ) | (1.74 | ) | 30.96 | 5.73 | 95,277 | 2.22 | 2.23 | 0.77 | 15 | |||||||||||||||||||||||||||||||||||||||
Year ended 10/31/13 | 28.58 | 0.06 | 3.12 | 3.18 | — | (0.65 | ) | (0.65 | ) | 31.11 | 11.31 | 96,520 | 2.22 | 2.24 | 0.20 | 18 | ||||||||||||||||||||||||||||||||||||||||
Year ended 10/31/12 | 26.60 | 0.04 | 4.07 | 4.11 | (0.03 | ) | (2.10 | ) | (2.13 | ) | 28.58 | 16.91 | 79,959 | 2.29 | 2.30 | 0.14 | 16 | |||||||||||||||||||||||||||||||||||||||
Year ended 10/31/11 | 28.44 | 0.05 | (1.58 | ) | (1.53 | ) | (0.06 | ) | (0.25 | ) | (0.31 | ) | 26.60 | (5.41 | ) | 76,962 | 2.28 | 2.30 | 0.18 | 27 | ||||||||||||||||||||||||||||||||||||
Class Y | ||||||||||||||||||||||||||||||||||||||||||||||||||||||||
Year ended 10/31/15 | 33.55 | 0.91 | (e) | (3.55 | ) | (2.64 | ) | (0.50 | ) | (0.96 | ) | (1.46 | ) | 29.45 | (8.12 | ) | 268,833 | 1.19 | (f) | 1.20 | (f) | 2.88 | (e)(f) | 23 | ||||||||||||||||||||||||||||||||
Year ended 10/31/14 | 33.57 | 0.57 | 1.47 | 2.04 | (0.36 | ) | (1.70 | ) | (2.06 | ) | 33.55 | 6.80 | 258,457 | 1.22 | 1.23 | 1.77 | 15 | |||||||||||||||||||||||||||||||||||||||
Year ended 10/31/13 | 30.75 | 0.39 | 3.35 | 3.74 | (0.27 | ) | (0.65 | ) | (0.92 | ) | 33.57 | 12.43 | 121,030 | 1.22 | 1.24 | 1.20 | 18 | |||||||||||||||||||||||||||||||||||||||
Year ended 10/31/12 | 28.52 | 0.33 | 4.35 | 4.68 | (0.35 | ) | (2.10 | ) | (2.45 | ) | 30.75 | 18.07 | 58,843 | 1.29 | 1.30 | 1.14 | 16 | |||||||||||||||||||||||||||||||||||||||
Year ended 10/31/11 | 30.39 | 0.35 | (1.68 | ) | (1.33 | ) | (0.29 | ) | (0.25 | ) | (0.54 | ) | 28.52 | (4.43 | ) | 35,862 | 1.28 | 1.30 | 1.18 | 27 | ||||||||||||||||||||||||||||||||||||
| (a) | Calculated using average shares outstanding. |
| (b) | Includes redemption fees added to shares of beneficial interest which were less than $0.005 per share for the fiscal years ended October 31, 2012 and prior. |
| (c) | Includes adjustments in accordance with accounting principles generally accepted in the United States of America and as such, the net asset value for financial reporting purposes and the returns based upon those net asset values may differ from the net asset value and returns for shareholder transactions. Does not include sales charges and is not annualized for periods less than one year, if applicable. |
| (d) | Portfolio turnover is calculated at the fund level and is not annualized for periods less than one year, if applicable. |
| (e) | Net investment income per share and the ratio of net investment income to average net assets include significant dividends received during the period. Net investment income per share and the ratio of net investment income to average net assets excluding the significant dividends are $0.38 and 1.18%, $0.11 and 0.43%, $0.10 and 0.43% and 0.46 and 1.43% for Class A, Class B, Class C and Class Y shares, respectively. |
| (f) | Ratios are based on average daily net assets (000’s omitted) of $535,749, $10,615, $91,941 and $357,900 for Class A, Class B, Class C and Class Y shares, respectively. |
19 Invesco Asia Pacific Growth Fund
Report of Independent Registered Public Accounting Firm
To the Board of Trustees of AIM International Mutual Funds (Invesco International Mutual Funds)
and Shareholders of Invesco Asia Pacific Growth Fund:
In our opinion, the accompanying statement of assets and liabilities, including the schedule of investments, and the related statements of operations and of changes in net assets and the financial highlights present fairly, in all material respects, the financial position of Invesco Asia Pacific Growth Fund (one of the funds constituting AIM International Mutual Funds (Invesco International Mutual Funds), hereafter referred to as the “Fund”) at October 31, 2015, the results of its operations for the year then ended, the changes in its net assets for each of the two years in the period then ended and the financial highlights for each of the five years in the period then ended, in conformity with accounting principles generally accepted in the United States of America. These financial statements and financial highlights (hereafter referred to as “financial statements”) are the responsibility of the Fund’s management. Our responsibility is to express an opinion on these financial statements based on our audits. We conducted our audits of these financial statements in accordance with the standards of the Public Company Accounting Oversight Board (United States). Those standards require that we plan and perform the audit to obtain reasonable assurance about whether the financial statements are free of material misstatement. An audit includes examining, on a test basis, evidence supporting the amounts and disclosures in the financial statements, assessing the accounting principles used and significant estimates made by management, and evaluating the overall financial statement presentation. We believe that our audits, which included confirmation of securities at October 31, 2015 by correspondence with the custodian, provide a reasonable basis for our opinion.
PRICEWATERHOUSECOOPERS LLP
December 23, 2015
Houston, Texas
20 Invesco Asia Pacific Growth Fund
Calculating your ongoing Fund expenses
Example
As a shareholder of the Fund, you incur two types of costs: (1) transaction costs, which may include sales charges (loads) on purchase payments or contingent deferred sales charges on redemptions, if any; and (2) ongoing costs, including management fees, distribution and/or service (12b-1) fees, and other Fund expenses. This example is intended to help you understand your ongoing costs (in dollars) of investing in the Fund and to compare these costs with ongoing costs of investing in other mutual funds. The example is based on an investment of $1,000 invested at the beginning of the period and held for the entire period May 1, 2015 through October 31, 2015.
Actual expenses
The table below provides information about actual account values and actual expenses. You may use the information in this table, together with the amount you invested, to estimate the expenses that you paid over the period. Simply divide your account value by $1,000 (for example, an $8,600 account value divided by $1,000 = 8.6), then multiply the result by the number in the table under the heading entitled “Actual Expenses Paid During Period” to estimate the expenses you paid on your account during this period.
Hypothetical example for comparison purposes
The table below also provides information about hypothetical account values and hypothetical expenses based on the Fund’s actual expense ratio and an assumed rate of return of 5% per year before expenses, which is not the Fund’s actual return.
The hypothetical account values and expenses may not be used to estimate the actual ending account balance or expenses you paid for the period. You may use this information to compare the ongoing costs of investing in the Fund and other funds. To do so, compare this 5% hypothetical example with the 5% hypothetical examples that appear in the shareholder reports of the other funds.
Please note that the expenses shown in the table are meant to highlight your ongoing costs only and do not reflect any transaction costs, such as sales charges (loads) on purchase payments or contingent deferred sales charges on redemptions, if any. Therefore, the hypothetical information is useful in comparing ongoing costs only, and will not help you determine the relative total costs of owning different funds. In addition, if these transaction costs were included, your costs would have been higher.
| Class | Beginning Account Value (05/01/15) | ACTUAL | HYPOTHETICAL (5% annual return before | Annualized Expense Ratio | ||||||||||||||||||||
| Ending Account Value (10/31/15)1 | Expenses Paid During Period2 | Ending Account Value (10/31/15) | Expenses Paid During Period2 | |||||||||||||||||||||
| A | $ | 1,000.00 | $ | 884.30 | $ | 6.93 | $ | 1,017.85 | $ | 7.43 | 1.46 | % | ||||||||||||
| B | 1,000.00 | 881.10 | 10.48 | 1,014.06 | 11.22 | 2.21 | ||||||||||||||||||
| C | 1,000.00 | 881.00 | 10.48 | 1,014.06 | 11.22 | 2.21 | ||||||||||||||||||
| Y | 1,000.00 | 885.70 | 5.75 | 1,019.11 | 6.16 | 1.21 | ||||||||||||||||||
| 1 | The actual ending account value is based on the actual total return of the Fund for the period May 1, 2015 through October 31, 2015, after actual expenses and will differ from the hypothetical ending account value which is based on the Fund’s expense ratio and a hypothetical annual return of 5% before expenses. |
| 2 | Expenses are equal to the Fund’s annualized expense ratio as indicated above multiplied by the average account value over the period, multiplied by 184/365 to reflect the most recent fiscal half year. |
21 Invesco Asia Pacific Growth Fund
Approval of Investment Advisory and Sub-Advisory Contracts
The Board of Trustees (the Board) of AIM International Mutual Funds (Invesco International Mutual Funds) is required under the Investment Company Act of 1940, as amended, to approve annually the renewal of Invesco Asia Pacific Growth Fund’s (the Fund) investment advisory agreements. During contract renewal meetings held on June 9-10, 2015, the Board as a whole, and the disinterested or “independent” Trustees, who comprise over 75% of the Board, voting separately, approved the continuance for the Fund of the Master Investment Advisory Agreement with Invesco Advisers, Inc. (Invesco Advisers and the investment advisory agreement) and the Master Intergroup Sub-Advisory Contract for Mutual Funds with Invesco Asset Management Deutschland GmbH, Invesco Asset Management Limited, Invesco Asset Management (Japan) Limited, Invesco Hong Kong Limited, Invesco Senior Secured Management, Inc. and Invesco Canada Ltd. (collectively, the Affiliated Sub-Advisers and the sub-advisory contracts) for another year effective July 1, 2015.
In evaluating the fairness and reasonableness of compensation under the Fund’s investment advisory agreement and sub-advisory contracts, the Board considered, among other things, the factors discussed below. The Board determined that continuation of the Fund’s investment advisory agreement and the sub-advisory contracts is in the best interest of the Fund and its shareholders and that the compensation payable to Invesco Advisers and the Affiliated Sub-Advisers under the agreements is fair and reasonable.
The Board’s Fund Evaluation Process
The Board’s Investments Committee has established three Sub-Committees, each of which is primarily responsible for overseeing the performance and investment management services provided by Invesco Advisers and the Affiliated Sub-Advisers to a number of the funds advised by Invesco Advisers (the Invesco Funds). The Sub-Committees meet throughout the year to review the performance of their assigned Invesco Funds, including reviewing materials prepared under the direction of the independent Senior Officer, an officer of the Invesco Funds who reports directly to the independent Trustees. Over the course of each year, the Sub-Committees meet with portfolio managers for their assigned Invesco Funds and other members of management to review the performance, investment objective(s), policies, strategies, limitations and investment risks of these funds. The Board had the benefit of reports from the Sub-Committees and Investments Committee throughout the year in considering approval of the continuance of each Invesco Fund’s investment advisory agreement and sub-advisory contracts for another year.
During the contract renewal process, the Board receives comparative performance and fee data regarding the Invesco Funds prepared by Invesco Advisers and Lipper Inc. (Lipper), an independent provider of investment company data. The Board also receives a report and this independent written evaluation from the Senior Officer. The Senior Officer’s evaluation is prepared as part of his responsibility to manage the process by which the Invesco Funds’ proposed management fees are negotiated during the annual contract renewal process to ensure they are negotiated in a manner that is at arms’ length and reasonable. In addition to meetings with Invesco Advisers and fund counsel, the independent Trustees also discuss the continuance of the investment advisory agreement and sub-advisory contracts in separate sessions with the Senior Officer and with independent legal counsel.
The Trustees recognized that the advisory fee rates for the Invesco Funds are, in many cases, the result of years of review and negotiation. The Trustees’ deliberations and conclusions in a particular year may be based in part on their deliberations and conclusions regarding these arrangements throughout the year and in prior years. The Trustees’ review and conclusions are based on the comprehensive consideration of all information presented to them and are not the result of any single determinative factor. Moreover, one Trustee may have weighed a particular piece of information or factor differently than another Trustee.
The discussion below is a summary of the Senior Officer’s independent written evaluation with respect to the Fund’s investment advisory agreement as well as a discussion of the material factors and related conclusions that formed the basis for the Board’s approval of the Fund’s investment advisory agreement and sub-advisory contracts. Unless otherwise stated, this information is current as of June 10, 2015, and does not reflect consideration of factors that became known to the Board after that date.
Factors and Conclusions and Summary of Independent Written Fee Evaluation
| A. | Nature, Extent and Quality of Services Provided by Invesco Advisers and the Affiliated Sub-Advisers |
The Board reviewed the advisory services provided to the Fund by Invesco Advisers under the Fund’s investment advisory agreement, the performance of Invesco Advisers in providing these services, and the credentials and experience of the officers and employees of Invesco Advisers who provide these services, including the Fund’s portfolio manager or managers. The Board’s review of the qualifications of Invesco Advisers to provide advisory services included the Board’s consideration of Invesco Advisers’ investment process oversight, independent credit analysis
and investment risk management. The Board also considered non-advisory services that Invesco Advisers and its affiliates provide to the Invesco Funds such as various back office support functions, equity and fixed income trading operations, internal audit, distribution, valuation and legal and compliance.
In determining whether to continue the Fund’s investment advisory agreement, the Board considered the benefits of reapproving an existing relationship and the greater uncertainty that may be associated with entering into a new relationship. The Board concluded that the nature, extent and quality of the services provided to the Fund by Invesco Advisers are appropriate and satisfactory and consistent with the terms of the Fund’s investment advisory agreement.
The Board reviewed the services that may be provided by the Affiliated Sub-Advisers under the sub-advisory contracts and the credentials and experience of the officers and employees of the Affiliated Sub-Advisers who provide these services. The Board noted that the Affiliated Sub-Advisers have offices and personnel that are located in financial centers around the world. As a result, the Affiliated Sub-Advisers can provide research and investment analysis on the markets and economies of various countries in which the Fund may invest, make recommendations regarding securities and assist with security trades. The Board concluded that the sub-advisory contracts benefit the Fund and its shareholders by permitting Invesco Advisers to use the resources and talents of the Affiliated Sub-Advisers in managing the Fund. The Board concluded that the nature, extent and quality of the services that may be provided by the Affiliated Sub-Advisers are appropriate and satisfactory and consistent with the terms of the Fund’s sub-advisory contracts.
| B. | Fund Performance |
The Board considered Fund performance as a relevant factor in considering whether to approve the investment advisory agreement. The Board did not view Fund performance as a relevant factor in considering whether to approve the sub-advisory contracts for the Fund, as no Affiliated Sub-Adviser currently manages assets of the Fund.
The Board compared the Fund’s performance during the past one, three and five calendar years to the performance of funds in the Lipper performance universe and against the Lipper Pacific Region Ex-Japan Funds Index. The Board noted that performance of Class A shares of the Fund was in the second quintile of its performance universe for the one and three year periods and the first quintile for the five year period (the first quintile being the best performing funds and the fifth quintile being the worst performing funds). The Board noted that performance of Class A shares of the Fund was above the performance of the Index for the one,
22 Invesco Asia Pacific Growth Fund
three and five year periods. The Trustees also reviewed more recent Fund performance and this review did not change their conclusions.
| C. | Advisory and Sub-Advisory Fees |
The Board compared the Fund’s contractual management fee rate to the contractual management fee rates of funds in the Fund’s Lipper expense group at a common asset level. The Board noted that the contractual management fee rate for Class A shares of the Fund was below the median contractual management fee rate of funds in its expense group. The Board noted that the term “contractual management fee” may include both advisory and certain administrative services fees, but that Lipper does not provide information on a fund by fund basis as to what is included. The Board noted that Invesco Advisers does not charge the Invesco Funds for the administrative services included in the term as defined by Lipper. The Board also reviewed the methodology used by Lipper in providing expense group information, which includes using each fund’s contractual management fee schedule (including any applicable breakpoints) as reported in the most recent prospectus or statement of additional information for each fund in the expense group.
The Board noted that Invesco Advisers and the Affiliated Sub-Advisers do not manage other mutual funds or client accounts with investment strategies comparable to those of the Fund.
The Board also considered the services that may be provided by the Affiliated Sub-Advisers pursuant to the sub-advisory contracts, as well as the fees payable by Invesco Advisers to the Affiliated Sub-Advisers pursuant to the sub-advisory contracts. The Board also noted that the sub-advisory fees are not paid directly by the Fund, but rather, are payable by Invesco Advisers to the Affiliated Sub-Advisers.
| D. | Economies of Scale and Breakpoints |
The Board considered the extent to which there are economies of scale in the provision of advisory services to the Fund. The Board also considered whether the Fund benefits from economies of scale through contractual breakpoints in the Fund’s advisory fee schedule. The Board also noted that the Fund shares directly in economies of scale through lower fees charged by third party service providers based on the combined size of the Invesco Funds and other clients advised by Invesco Advisers.
| E. | Profitability and Financial Resources |
The Board reviewed information from Invesco Advisers concerning the costs of the advisory and other services that Invesco Advisers and its affiliates provide to the Fund and the Invesco Funds and the profitability of Invesco Advisers and its affiliates in providing these services. The Board received information from Invesco Advisers about the methodology used to prepare the profitability information. The Board noted that Invesco Advisers continues to operate at a net profit from services Invesco Advisers and its affiliates provide to the Invesco Funds and the Fund. The Board did not deem the
level of profits realized by Invesco Advisers and its affiliates from providing services to the Fund to be excessive given the nature, quality and extent of the services provided. to the Fund, although the Fund does incur its share of underlying fund fees and other allocable costs. The Board received and accepted information from Invesco Advisers demonstrating that Invesco Advisers and each Affiliated Sub-Adviser are financially sound and have the resources necessary to perform their obligations under the investment advisory agreement and sub-advisory contracts.
| F. | Collateral Benefits to Invesco Advisers and its Affiliates |
The Board considered various other benefits received by Invesco Advisers and its affiliates from the relationship with the Fund, including the fees received for providing transfer agency and distribution services to the Fund. The Board considered comparative information regarding fees charged for these services, including information provided by Lipper and other independent sources. The Board considered the performance of Invesco Advisers and its affiliates in providing these services and the organizational structure employed to provide these services. The Board also considered that these services are provided to the Fund pursuant to written contracts that are reviewed and approved on an annual basis by the Board; and that the services are required for the operation of the Fund.
The Board considered the benefits realized by Invesco Advisers and the Affiliated Sub-Advisers as a result of portfolio brokerage transactions executed through “soft dollar” arrangements. The Board noted that soft dollar arrangements shift the payment obligation for research services from Invesco Advisers and the Affiliated Sub-Advisers to the Invesco Funds and that the research received may be used with other clients of Invesco Advisers and may reduce Invesco Advisers’ and the Affiliated Sub-Advisers’ expenses. The Board also considered that it receives periodic reports from the Chief Compliance Officer of the Invesco Funds demonstrating that these arrangements are consistent with regulatory requirements. The Board did not deem the soft dollar arrangements to be inappropriate.
The Board considered that the Fund’s uninvested cash and cash collateral from any securities lending arrangements may be invested in money market funds advised by Invesco Advisers pursuant to procedures approved by the Board. The Board noted that Invesco Advisers receives advisory fees from these affiliated money market funds attributable to such investments, although Invesco Advisers has contractually agreed to waive through varying periods the advisory fees payable by the Invesco Funds with respect to investments in the affiliated money market funds. The waiver is in an amount equal to 100% of the net advisory fee Invesco Advisers receives from the affiliated money market funds with respect to the Fund’s investment in the
affiliated money market funds of uninvested cash, but not cash collateral. The Board concluded that the amount of advisory fees received by Invesco Advisors from the Fund’s investment of cash collateral from any securities lending arrangements in the affiliated money market funds is fair and reasonable.
The Board also considered the Fund may use an affiliated broker to execute certain trades for the Fund to, among other things, control information leakage, and were advised that such trades would be executed in compliance with rules under the Investment Company Act of 1940, as amended, and consistent with best execution obligations.
23 Invesco Asia Pacific Growth Fund
Tax Information
Form 1099-DIV, Form 1042-S and other year-end tax information provide shareholders with actual calendar year amounts that should be included in their tax returns. Shareholders should consult their tax advisors.
The following distribution information is being provided as required by the Internal Revenue Code or to meet a specific state’s requirement.
The Fund designates the following amounts or, if subsequently determined to be different, the maximum amount allowable for its fiscal year ended October 31, 2015:
Federal and State Income Tax | ||||
Long-Term Capital Gain Distributions | $ | 26,802,298 | ||
Qualified Dividend Income* | 96.07 | % | ||
Corporate Dividends Received Deduction* | 0.00 | % | ||
U.S. Treasury Obligations* | 0.00 | % | ||
Foreign Taxes | $ | 0.0630 per share | ||
Foreign Source Income | $ | 1.5151 per share | ||
| * | The above percentages are based on ordinary income dividends paid to shareholders during the Fund’s fiscal year. |
24 Invesco Asia Pacific Growth Fund
Trustees and Officers
The address of each trustee and officer is AIM International Mutual Funds (Invesco International Mutual Funds) (the “Trust”), 11 Greenway Plaza, Suite 1000, Houston, Texas 77046-1173. The trustees serve for the life of the Trust, subject to their earlier death, incapacitation, resignation, retirement or removal as more specifically provided in the Trust’s organizational documents. Each officer serves for a one year term or until their successors are elected and qualified. Column two below includes length of time served with predecessor entities, if any.
| Name, Year of Birth and Position(s) Held with the Trust | Trustee and/ or Officer Since | Principal Occupation(s) During Past 5 Years | Number of Funds in Fund Complex Overseen by Trustee | Other Directorship(s) Past 5 Years | ||||
| Interested Persons | ||||||||
Martin L. Flanagan1 — 1960 Trustee | 2007 | Executive Director, Chief Executive Officer and President, Invesco Ltd. (ultimate parent of Invesco and a global investment management firm); Advisor to the Board, Invesco Advisers, Inc. (formerly known as Invesco Institutional (N.A.), Inc.); Trustee, The Invesco Funds; Vice Chair, Investment Company Institute; and Member of Executive Board, SMU Cox School of Business
Formerly: Chairman and Chief Executive Officer, Invesco Advisers, Inc. (registered investment adviser); Director, Chairman, Chief Executive Officer and President, IVZ Inc. (holding company), INVESCO Group Services, Inc. (service provider) and Invesco North American Holdings, Inc. (holding company); Director, Chief Executive Officer and President, Invesco Holding Company Limited (parent of Invesco and a global investment management firm); Director, Invesco Ltd.; Chairman, Investment Company Institute and President, Co-Chief Executive Officer, Co-President, Chief Operating Officer and Chief Financial Officer, Franklin Resources, Inc. (global investment management organization). | 145 | None | ||||
Philip A. Taylor2 — 1954 Trustee, President and Principal Executive Officer | 2006 | Head of North American Retail and Senior Managing Director, Invesco Ltd.; Director, Co-Chairman, Co-President and Co-Chief Executive Officer, Invesco Advisers, Inc. (formerly known as Invesco Institutional (N.A.), Inc.) (registered investment adviser); Director, Chairman, Chief Executive Officer and President, Invesco Management Group, Inc. (formerly known as Invesco Aim Management Group, Inc.) (financial services holding company); Director and President, INVESCO Funds Group, Inc. (registered investment adviser and registered transfer agent); Director and Chairman, Invesco Investment Services, Inc. (formerly known as Invesco Aim Investment Services, Inc.) (registered transfer agent) and IVZ Distributors, Inc. (formerly known as INVESCO Distributors, Inc.) (registered broker dealer); Chief Executive Officer, Invesco Corporate Class Inc. (corporate mutual fund company) Director, Chairman and Chief Executive Officer, Invesco Canada Ltd. (formerly known as Invesco Trimark Ltd./Invesco Trimark Ltèe) (registered investment adviser and registered transfer agent); Trustee, President and Principal Executive Officer, The Invesco Funds (other than AIM Treasurer’s Series Trust (Invesco Treasurer’s Series Trust), Short-Term Investments Trust and Invesco Management Trust); Trustee and Executive Vice President, The Invesco Funds (AIM Treasurer’s Series Trust (Invesco Treasurer’s Series Trust), Short-Term Investments Trust and Invesco Management Trust only); Director, Invesco Investment Advisers LLC (formerly known as Van Kampen Asset Management); Director, Chief Executive Officer and President, Van Kampen Exchange Corp.
Formerly: Director, President and Chairman, Invesco Inc. (holding company), Invesco Canada Holdings Inc. (holding company), Trimark Investments Ltd./Placements Trimark Ltèe and Invesco Financial Services Ltd/Services Financiers Invesco Ltèe; Chiief Executive Officer, Invesco Canada Fund Inc (corporate mutual fund company); Director and Chairman, Van Kampen Investor Services Inc.; Director, Chief Executive Officer and President, 1371 Preferred Inc. (holding company) and Van Kampen Investments Inc.; Director and President, AIM GP Canada Inc. (general partner for limited partnerships) and Van Kampen Advisors, Inc.; Director and Chief Executive Officer, Invesco Trimark Dealer Inc. (registered broker dealer); Director, Invesco Distributors, Inc. (formerly known as Invesco Aim Distributors, Inc.) (registered broker dealer); Manager, Invesco PowerShares Capital Management LLC; Director, Chief Executive Officer and President, Invesco Advisers, Inc.; Director, Chairman, Chief Executive Officer and President, Invesco Aim Capital Management, Inc.; President, Invesco Trimark Dealer Inc. and Invesco Trimark Ltd./Invesco Trimark Ltèe; Director and President, AIM Trimark Corporate Class Inc. and AIM Trimark Canada Fund Inc.; Senior Managing Director, Invesco Holding Company Limited; Director and Chairman, Fund Management Company (former registered broker dealer); President and Principal Executive Officer, The Invesco Funds (AIM Treasurer’s Series Trust (Invesco Treasurer’s Series Trust), and Short-Term Investments Trust only); President, AIM Trimark Global Fund Inc. and AIM Trimark Canada Fund Inc.. | 145 | None |
| 1 | Mr. Flanagan is considered an interested person (within the meaning of Section 2(a)(19) of the 1940 Act) of the Trust because he is an officer of the Adviser to the Trust, and an officer and a director of Invesco Ltd., ultimate parent of the Adviser. |
| 2 | Mr. Taylor is considered an interested person (within the meaning of Section 2(a)(19) of the 1940 Act) of the Trust because he is an officer and a director of the Adviser. |
T-1 Invesco Asia Pacific Growth Fund
Trustees and Officers—(continued)
| Name, Year of Birth and Position(s) Held with the Trust | Trustee and/ or Officer Since | Principal Occupation(s) During Past 5 Years | Number of Funds in Fund Complex Overseen by Trustee | Other Directorship(s) Past 5 Years | ||||
| Independent Trustees | ||||||||
Bruce L. Crockett — 1944 Trustee and Chair | 2003 | Chairman, Crockett Technologies Associates (technology consulting company)
Formerly: Director, Captaris (unified messaging provider); Director, President and Chief Executive Officer, COMSAT Corporation; Chairman, Board of Governors of INTELSAT (international communications company); ACE Limited (insurance company); Independent Directors Council and Investment Company Institute | 145 | ALPS (Attorneys Liability Protection Society) (insurance company) and Globe Specialty Metals, Inc. (metallurgical company) | ||||
David C. Arch — 1945 Trustee | 2010 | Chairman of Blistex Inc., a consumer health care products manufacturer | 145 | Board member of the Illinois Manufacturers’ Association; Member of the Board of Visitors, Institute for the Humanities, University of Michigan; Member of the Audit Committee of the Edward-Elmhurst Hospital | ||||
James T. Bunch — 1942 Trustee | 2000 | Managing Member, Grumman Hill Group LLC (family office/private equity investments)
Formerly: Founder, Green Manning & Bunch Ltd. (investment banking firm) (1988-2010); Executive Committee, United States Golf Association; and Chairman, Board of Governors, Western Golf Association | 145 | Chairman of the Board of Trustees, Evans Scholars Foundation; and Chairman of the Board, Denver Film Society | ||||
Rodney F. Dammeyer — 1940 Trustee | 2010 | Chairman of CAC, LLC, (private company offering capital investment and management advisory services)
Formerly: Prior to 2001, Managing Partner at Equity Group Corporate Investments; Prior to 1995, Chief Executive Officer of Itel Corporation (formerly Anixter International); Prior to 1985, experience includes Senior Vice President and Chief Financial Officer of Household International, Inc., Executive Vice President and Chief Financial Officer of Northwest Industries, Inc. and Partner of Arthur Andersen & Co.; From 1987 to 2010, Director/Trustee of investment companies in the Van Kampen Funds complex | 145 | Director of Quidel Corporation and Stericycle, Inc. | ||||
Albert R. Dowden — 1941 Trustee | 2003 | Director of a number of public and private business corporations, including the Boss Group, Ltd. (private investment and management); Nature’s Sunshine Products, Inc. and Reich & Tang Funds (5 portfolios) (registered investment company)
Formerly: Director, Homeowners of America Holding Corporation/Homeowners of America Insurance Company (property casualty company); Director, Continental Energy Services, LLC (oil and gas pipeline service); Director, CompuDyne Corporation (provider of product and services to the public security market) and Director, Annuity and Life Re (Holdings), Ltd. (reinsurance company); Director, President and Chief Executive Officer, Volvo Group North America, Inc.; Senior Vice President, AB Volvo; Director of various public and private corporations; Chairman, DHJ Media, Inc.; Director, Magellan Insurance Company; and Director, The Hertz Corporation, Genmar Corporation (boat manufacturer), National Media Corporation; Advisory Board of Rotary Power International (designer, manufacturer, and seller of rotary power engines); and Chairman, Cortland Trust, Inc. (registered investment company) | 145 | Director of: Nature’s Sunshine Products, Inc., Reich & Tang Funds, Homeowners of America Holding Corporation/ Homeowners of America Insurance Company, the Boss Group | ||||
Jack M. Fields — 1952 Trustee | 2003 | Chief Executive Officer, Twenty First Century Group, Inc. (government affairs company); Owner and Chief Executive Officer, Dos Angeles Ranch, L.P. (cattle, hunting, corporate entertainment); and Discovery Global Education Fund (non-profit)
Formerly: Chief Executive Officer, Texana Timber LP (sustainable forestry company); Director of Cross Timbers Quail Research Ranch (non-profit); and member of the U.S. House of Representatives | 145 | Insperity, Inc. (formerly known as Administaff) | ||||
Prema Mathai-Davis — 1950 Trustee | 2003 | Retired. Formerly: Chief Executive Officer, YWCA of the U.S.A. | 145 | None | ||||
Larry Soll — 1942 Trustee | 1997 | Retired. Formerly: Chairman, Chief Executive Officer and President, Synergen Corp. (a biotechnology company) | 145 | None | ||||
Hugo F. Sonnenschein — 1940 Trustee | 2010 | President Emeritus and Honorary Trustee of the University of Chicago and the Adam Smith Distinguished Service Professor in the Department of Economics at the University of Chicago. Prior to 2000, President of the University of Chicago | 145 | Trustee of the University of Rochester and a member of its investment committee; Member of the National Academy of Sciences and the American Philosophical Society; Fellow of the American Academy of Arts and Sciences | ||||
Raymond Stickel, Jr. — 1944 Trustee | 2005 | Retired. Formerly: Director, Mainstay VP Series Funds, Inc. (25 portfolios) and Partner, Deloitte & Touche | 145 | None |
T-2 Invesco Asia Pacific Growth Fund
Trustees and Officers—(continued)
| Name, Year of Birth and Position(s) Held with the Trust | Trustee and/ or Officer Since | Principal Occupation(s) During Past 5 Years | Number of Funds in Fund Complex Overseen by Trustee | Other Directorship(s) Past 5 Years | ||||
| Independent Trustees—(continued) | ||||||||
Suzanne H. Woolsey — 1941 Trustee | 2014 | Chief Executive Officer of Woolsey Partners LLC | 145 | Emeritus Chair of the Board of Trustees of the Institute for Defense Analyses; Trustee of Colorado College; Trustee of California Institute of Technology; Prior to 2014, Director of Fluor Corp.; Prior to 2010, Trustee of the German Marshall Fund of the United States; Prior to 2010 Trustee of the Rocky Mountain Institute | ||||
| Other Officers | ||||||||
Russell C. Burk — 1958 Senior Vice President and Senior Officer | 2005 | Senior Vice President and Senior Officer, The Invesco Funds | N/A | N/A | ||||
John M. Zerr — 1962 Senior Vice President, Chief Legal Officer and Secretary | 2006 | Director, Senior Vice President, Secretary and General Counsel, Invesco Management Group, Inc. (formerly known as Invesco Aim Management Group, Inc.) and Van Kampen Exchange Corp.; Senior Vice President, Invesco Advisers, Inc. (formerly known as Invesco Institutional (N.A.), Inc.) (registered investment adviser); Senior Vice President and Secretary, Invesco Distributors, Inc. (formerly known as Invesco Aim Distributors, Inc.); Director, Vice President and Secretary, Invesco Investment Services, Inc. (formerly known as Invesco Aim Investment Services, Inc.) and IVZ Distributors, Inc. (formerly known as INVESCO Distributors, Inc.); Director and Vice President, INVESCO Funds Group, Inc.; Senior Vice President, Chief Legal Officer and Secretary, The Invesco Funds; Managing Director, Invesco PowerShares Capital Management LLC; Director, Secretary and General Counsel, Invesco Investment Advisers LLC (formerly known as Van Kampen Asset Management); Secretary and General Counsel, Invesco Capital Markets, Inc. (formerly known as Van Kampen Funds Inc.) and Chief Legal Officer, PowerShares Exchange-Traded Fund Trust, PowerShares Exchange-Traded Fund Trust II, PowerShares India Exchange-Traded Fund Trust, PowerShares Actively Managed Exchange-Traded Fund Trust, and PowerShares Actively Managed Exchange-Traded Commodity Fund Trust
Formerly: Director and Vice President, Van Kampen Advisors Inc.; Director, Vice President, Secretary and General Counsel, Van Kampen Investor Services Inc.; Director, Invesco Distributors, Inc. (formerly known as Invesco Aim Distributors, Inc.); Director, Senior Vice President, General Counsel and Secretary, Invesco Aim Advisers, Inc. and Van Kampen Investments Inc.; Director, Vice President and Secretary, Fund Management Company; Director, Senior Vice President, Secretary, General Counsel and Vice President, Invesco Aim Capital Management, Inc.; Chief Operating Officer and General Counsel, Liberty Ridge Capital, Inc. (an investment adviser); Vice President and Secretary, PBHG Funds (an investment company) and PBHG Insurance Series Fund (an investment company); Chief Operating Officer, General Counsel and Secretary, Old Mutual Investment Partners (a broker-dealer); General Counsel and Secretary, Old Mutual Fund Services (an administrator) and Old Mutual Shareholder Services (a shareholder servicing center); Executive Vice President, General Counsel and Secretary, Old Mutual Capital, Inc. (an investment adviser); and Vice President and Secretary, Old Mutual Advisors Funds (an investment company) | N/A | N/A | ||||
Sheri Morris — 1964 Vice President, Treasurer and Principal Financial Officer | 2003 | Vice President, Treasurer and Principal Financial Officer, The Invesco Funds; Vice President, Invesco Advisers, Inc. (formerly known as Invesco Institutional (N.A.), Inc.) (registered investment adviser); and Vice President, PowerShares Exchange-Traded Fund Trust, PowerShares Exchange-Traded Fund Trust II, PowerShares India Exchange-Traded Fund Trust, PowerShares Actively Managed Exchange-Traded Fund Trust, and PowerShares Actively Managed Exchange-Traded Commodity Fund Trust
Formerly: Vice President, Invesco Aim Advisers, Inc., Invesco Aim Capital Management, Inc. and Invesco Aim Private Asset Management, Inc.; Assistant Vice President and Assistant Treasurer, The Invesco Funds and Assistant Vice President, Invesco Advisers, Inc., Invesco Aim Capital Management, Inc. and Invesco Aim Private Asset Management, Inc.; and Treasurer, PowerShares Exchange-Traded Fund Trust, PowerShares Exchange-Traded Fund Trust II, PowerShares India Exchange-Traded Fund Trust and PowerShares Actively Managed Exchange-Traded Fund Trust | N/A | N/A | ||||
T-3 Invesco Asia Pacific Growth Fund
Trustees and Officers—(continued)
| Name, Year of Birth and Position(s) Held with the Trust | Trustee and/ or Officer Since | Principal Occupation(s) During Past 5 Years | Number of Funds in Fund Complex Overseen by Trustee | Other Directorship(s) Past 5 Years | ||||
| Other Officers—(continued) | ||||||||
Karen Dunn Kelley — 1960 Vice President | 2003 | Senior Managing Director, Investments, Invesco Ltd.; Director, Co-President, Co-Chief Executive Officer, and Co-Chairman, Invesco Advisers, Inc. (formerly known as Invesco Institutional (N.A.), Inc.) (registered investment adviser); Chairman, Invesco Senior Secured Management, Inc.; Senior Vice President, Invesco Management Group, Inc. (formerly known as Invesco Aim Management Group, Inc.); Executive Vice President, Invesco Distributors, Inc. (formerly known as Invesco Aim Distributors, Inc.); Director, Invesco Mortgage Capital Inc. and Invesco Management Company Limited; Vice President, The Invesco Funds (other than AIM Treasurer’s Series Trust (Invesco Treasurer’s Series Trust), Short-Term Investments Trust and Invesco Management Trust); and President and Principal Executive Officer, The Invesco Funds (AIM Treasurer’s Series Trust (Invesco Treasurer’s Series Trust), Short-Term Investments Trust and Invesco Management Trust only)
Formerly: Director and President, INVESCO Asset Management (Bermuda) Ltd., Director, INVESCO Global Asset Management Limited and INVESCO Management S.A.; Senior Vice President, Van Kampen Investments Inc. and Invesco Advisers, Inc. (formerly known as Invesco Institutional (N.A.), Inc.) (registered investment adviser); Vice President, Invesco Advisers, Inc. (formerly known as Invesco Institutional (N.A.), Inc.); Director of Cash Management and Senior Vice President, Invesco Advisers, Inc. and Invesco Aim Capital Management, Inc.; Director and President, Fund Management Company; Chief Cash Management Officer, Director of Cash Management, Senior Vice President, and Managing Director, Invesco Aim Capital Management, Inc.; Director of Cash Management, Senior Vice President, and Vice President, Invesco Advisers, Inc. and The Invesco Funds (AIM Treasurer’s Series Trust (Invesco Treasurer’s Series Trust), and Short-Term Investments Trust only) | N/A | N/A | ||||
Crissie M. Wisdom — 1969 Anti-Money Laundering Compliance Officer | 2013 | Anti-Money Laundering Compliance Officer, Invesco Advisers, Inc. (formerly known as Invesco Institutional (N.A.), Inc.) (registered investment adviser), Invesco Capital Markets, Inc. (formerly known as Van Kampen Funds Inc.), Invesco Distributors, Inc., Invesco Investment Services, Inc., Invesco Management Group, Inc., Van Kampen Exchange Corp., The Invesco Funds, and PowerShares Exchange-Traded Fund Trust, PowerShares Exchange-Traded Fund Trust II, PowerShares India Exchange-Traded Fund Trust, PowerShares Actively Managed Exchange-Traded Fund Trust and PowerShares Actively Managed Exchange-Traded Commodity Fund Trust; Anti-Money Laundering Compliance Officer and Bank Secrecy Act Officer, INVESCO National Trust Company and Invesco Trust Company; and Fraud Prevention Manager and Controls and Risk Analysis Manager for Invesco Investment Services, Inc.. | N/A | N/A | ||||
Lisa O. Brinkley — 1959 Chief Compliance Officer | 2015 | Senior Vice President and Chief Compliance Officer, Invesco Advisers, Inc. (registered investment adviser) (formerly known as Invesco Institutional (N.A., Inc.); and Chief Compliance Officer, The Invesco Funds
Formerly: Global Assurance Officer, Invesco Ltd. and Vice President, The Invesco Funds; Chief Compliance Officer, Invesco Distributors, Inc. (formerly known as Invesco Aim Distributors, Inc.), Invesco Investment Services, Inc.(formerly known as Invesco Aim Investment Services, Inc.) and Van Kampen Investor Services Inc.; Senior Vice President, Invesco Management Group, Inc.; Senior Vice President and Chief Compliance Officer, Invesco Advisers, Inc. and The Invesco Funds; Vice President and Chief Compliance Officer, Invesco Aim Capital Management, Inc. and Invesco Distributors, Inc.; Vice President, Invesco Investment Services, Inc. and Fund Management Company. | N/A | N/A |
The Statement of Additional Information of the Trust includes additional information about the Fund’s Trustees and is available upon request, without charge, by calling 1.800.959.4246. Please refer to the Fund’s prospectus for information on the Fund’s sub-advisers.
Office of the Fund 11 Greenway Plaza, Suite 1000 Houston, TX 77046-1173 | Investment Adviser Invesco Advisers, Inc. 1555 Peachtree Street, N.E. Atlanta, GA 30309 | Distributor Invesco Distributors, Inc. 11 Greenway Plaza, Suite 1000 Houston, TX 77046-1173 | Auditors PricewaterhouseCoopers LLP 1000 Louisiana Street, Suite 5800 Houston, TX 77002-5678 | |||
Counsel to the Fund Stradley Ronon Stevens & Young, LLP 2005 Market Street, Suite 2600 Philadelphia, PA 19103-7018 | Counsel to the Independent Trustees Goodwin Procter LLP 901 New York Avenue, N.W. Washington, D.C. 20001 | Transfer Agent Invesco Investment Services, Inc. 11 Greenway Plaza, Suite 1000 Houston, TX 77046-1173 | Custodian State Street Bank and Trust Company 225 Franklin Street Boston, MA 02110-2801 | |||
T-4 Invesco Asia Pacific Growth Fund

Invesco mailing information
Send general correspondence to Invesco Investment Services, Inc., P.O. Box 219078, Kansas City, MO 64121-9078.
Important notice regarding delivery of security holder documents
To reduce Fund expenses, only one copy of most shareholder documents may be mailed to shareholders with multiple accounts at the same address (Householding). Mailing of your shareholder documents may be householded indefinitely unless you instruct us otherwise. If you do not want the mailing of these documents to be combined with those for other members of your household, please contact Invesco Investment Services, Inc. at 800 959 4246 or contact your financial institution. We will begin sending you individual copies for each account within 30 days after receiving your request.
Fund holdings and proxy voting information
The Fund provides a complete list of its holdings four times in each fiscal year, at the quarter ends. For the second and fourth quarters, the lists appear in the Fund’s semiannual and annual reports to shareholders. For the first and third quarters, the Fund files the lists with the Securities and Exchange Commission (SEC) on Form N-Q. The most recent list of portfolio holdings is available at invesco.com/completeqtrholdings. Shareholders can also look up the Fund’s Forms N-Q on the SEC website at sec.gov. Copies of the Fund’s Forms N-Q may be reviewed and copied at the SEC Public Reference Room in Washington, D.C. You can obtain information on the operation of the Public Reference Room, including information about duplicating fee charges, by calling 202 551 8090 or 800 732 0330, or by electronic request at the following email address: publicinfo@sec.gov. The SEC file numbers for the Fund are shown below.
A description of the policies and procedures that the Fund uses to determine how to vote proxies relating to portfolio securities is available without charge, upon request, from our Client Services department at 800 959 4246 or at invesco.com/proxyguidelines. The information is also available on the SEC website, sec.gov.
Information regarding how the Fund voted proxies related to its portfolio securities during the most recent 12-month period ended June 30 is available at invesco.com/proxysearch. The information is also available on the SEC website, sec.gov. Invesco Advisers, Inc. is an investment adviser; it provides investment advisory services to individual and institutional clients and does not sell securities. Invesco Distributors, Inc. is the US distributor for Invesco Ltd.’s retail mutual funds, exchange-traded funds and institutional money market funds. Both are wholly owned, indirect subsidiaries of Invesco Ltd. |  |
SEC file numbers: 811-06463 and 033-44611 APG-AR-1 Invesco Distributors, Inc.
| ||||
 | Annual Report to Shareholders
| October 31, 2015 | ||
| ||||
Invesco European Growth Fund
| ||||
| Nasdaq: | ||||
| A: AEDAX n B: AEDBX n C: AEDCX n R: AEDRX n Y: AEDYX n Investor: EGINX | ||||

Letters to Shareholders
Philip Taylor | Dear Shareholders: This annual report includes information about your Fund, including performance data and a complete list of its investments as of the close of the reporting period. Inside is a discussion of how your Fund was managed and the factors that affected its performance during the reporting period. I hope you find this report of interest. The US economy expanded and unemployment declined throughout the reporting period. Continuing low energy prices benefited consumers, but a strong US dollar crimped corporate profits. The US Federal Reserve signaled that it was increasingly likely to raise interest rates, based on generally positive economic data, but uncertainty remained about when it might act. Overseas, the story was much different. Low energy prices hurt the economies of some oil-producing nations, such as Brazil and Russia. During the reporting period, the European Central | |
Bank as well as central banks in China and Japan – among other countries – either instituted or maintained extraordinarily accommodative monetary policies in response to economic weakness. Investor uncertainty, such as we saw for much of the reporting period – and market volatility, such as we saw at the end of the reporting period – are unfortunate facts of life when it comes to investing. Some investors use these things as excuses to delay saving and investing for their long-term financial goals. That’s why Invesco encourages investors to work with a professional financial adviser who can stress the importance of starting to save and invest early and the importance of adhering to a disciplined investment plan – when times are good and when they’re uncertain. A financial adviser who knows your unique financial situation, investment goals and risk tolerance can be an invaluable partner as you seek to achieve your financial goals. He or she can offer a long-term perspective when markets are volatile and time-tested advice and guidance when your financial situation or investment goals change. | ||

Timely information when and where you want it
Invesco’s efforts to help investors achieve their financial objectives include providing individual investors and financial professionals with timely information about the markets, the economy and investing – whenever and wherever they want it.
Our website, invesco.com/us, offers a wide range of market insights and investment perspectives. On the website, you’ll find detailed information about our funds, including prices, performance, holdings and portfolio manager commentaries. You can access information about your account by completing a simple, secure online registration. Click on the “Need to register” link in the “Account Access” box on our homepage to get started.
Invesco’s mobile apps for iPhone® and iPad® (both available free from the App StoreSM) allow you to obtain the same detailed information, monitor your account and create customizable watch lists. Also, they allow you to access investment insights from our investment leaders, market strategists, economists and retirement experts. You can sign up to be alerted when new commentary is added, and you can watch portfolio manager videos and have instant access to Invesco news and updates wherever you may be.
In addition to the resources accessible on our website and through our mobile app, you can obtain timely updates to help you stay informed about the markets, the economy and investing by connecting with Invesco on Twitter, LinkedIn or Facebook. You can access our blog at blog.invesco.us.com. Our goal is to provide you the information you want, when and where you want it.
Have questions?
For questions about your account, feel free to contact an Invesco client services representative at 800 959 4246. For Invesco-related questions or comments, please email me directly at phil@invesco.com.
All of us at Invesco look forward to serving your investment management needs for many years to come. Thank you for investing with us.
Sincerely,

Philip Taylor
Senior Managing Director, Invesco Ltd.
iPhone and iPad are trademarks of Apple Inc., registered in the US and other countries. App Store is a service mark of Apple Inc. Invesco Distributors, Inc. is not affiliated with Apple Inc.
2 Invesco European Growth Fund
Bruce Crockett | Dear Fellow Shareholders: Among the many important lessons I’ve learned in more than 40 years in a variety of business endeavors is the value of a trusted advocate. As independent chair of the Invesco Funds Board, I can assure you that the members of the Board are strong advocates for the interests of investors in Invesco’s mutual funds. We work hard to represent your interests through oversight of the quality of the investment management services your funds receive and other matters important to your investment, including but not limited to: n Ensuring that Invesco offers a diverse lineup of mutual funds that your financial adviser can use to strive to meet your financial needs as your investment goals change over time. n Monitoring how the portfolio management teams of the Invesco funds are performing in light of changing economic and market conditions. |

| n | Assessing each portfolio management team’s investment performance within the context of the investment strategy described in the fund’s prospectus. |
| n | Monitoring for potential conflicts of interests that may impact the nature of the services that your funds receive. |
We believe one of the most important services we provide our fund shareholders is the annual review of the funds’ advisory and sub-advisory contracts with Invesco Advisers and its affiliates. This review is required by the Investment Company Act of 1940 and focuses on the nature and quality of the services Invesco provides as the adviser to the Invesco funds and the reasonableness of the fees that it charges for those services. Each year, we spend months carefully reviewing information received from Invesco and a variety of independent sources, such as performance and fee data prepared by Lipper Inc., an independent, third-party firm widely recognized as a leader in its field. We also meet with our independent legal counsel and other independent advisers to review and help us assess the information that we have received. Our goal is to assure that you receive quality investment management services for a reasonable fee.
I trust the measures outlined above provide assurance that you have a worthy advocate when it comes to choosing the Invesco Funds.
As always, please contact me at bruce@brucecrockett.com with any questions or concerns you may have. On behalf of the Board, we look forward to continuing to represent your interests and serving your needs.
Sincerely,

Bruce L. Crockett
Independent Chair
Invesco Funds Board of Trustees
3 Invesco European Growth Fund
Management’s Discussion of Fund Performance
Performance summary
For the fiscal year ended October 31, 2015, Class A shares of Invesco European Growth Fund (the Fund), at net asset value (NAV), underperformed the MSCI Europe Growth Index, the Fund’s style-specific benchmark.
Your Fund’s long-term performance appears later in this report.
Fund vs. Indexes
Total returns, 10/31/14 to 10/31/15, at net asset value (NAV). Performance shown does not include applicable contingent deferred sales charges (CDSC) or front-end sales charges, which would have reduced performance.
Class A Shares | 4.18 | % | |||
Class B Shares | 3.43 | ||||
Class C Shares | 3.42 | ||||
Class R Shares | 3.93 | ||||
Class Y Shares | 4.46 | ||||
Investor Class Shares | 4.24 | ||||
| MSCI Europe Index▼ (Broad Market Index)* | -0.20 | ||||
| MSCI EAFE Index▼ (Former Broad Market Index)* | -0.07 | ||||
| MSCI Europe Growth Index▼ (Style-Specific Index) | 6.58 | ||||
| Lipper European Funds Index¢ (Peer Group Index) | 3.09 |
Source(s): ▼FactSet Research Systems Inc.; ¢Lipper Inc. * The Fund has elected to use the MSCI Europe Index to represent its broad market benchmark rather than the MSCI EAFE Index because the MSCI Europe Index more closely reflects the performance of the types of securities in which the Fund invests. | |||||
Market conditions and your Fund
International markets experienced increased volatility during the fiscal year ended October 31, 2015, driven largely by the continued slowdown in energy markets and the economic downturn in China. Developed markets were generally able to withstand these headwinds, even as more fragile emerging markets began to falter.
As the reporting period began in late 2014, international equity markets moved higher, although economic growth appeared to be somewhat stronger in the US than in the rest of the world. Equity markets globally were recovering from the initial crash of oil prices when OPEC added additional uncertainty by deciding to maintain high production despite low prices and slowing global growth. In this environment, commodity-based economies and most currencies
underperformed those of the US.
Global markets were rattled again amid growing concerns that Greece and the eurozone would fail to reach an agreement on a financial bailout plan. However, those fears subsided when a bailout was ultimately approved. The eurozone also benefited from generally positive economic data, which helped markets weather subsequent economic volatility.
In the summer of 2015, fears of a potential economic slowdown in China dominated headlines. The combination of a slowing Chinese economy, a sharp sell-off in domestic Chinese equities and the devaluation of China’s currency, the renminbi, contributed to a strong correction in global equity markets. Emerging markets, in particular, were hard hit by events in China and by continued weak commodity prices – as well as by the US Federal Reserve’s decision to delay
raising interest rates, which increased investor uncertainty and market volatility.
Fund holdings in the financials sector outperformed those of the Fund’s style-specific benchmark and were among the strongest contributors to the Fund’s relative performance. The Fund’s meaningful underweight allocation to the consumer staples sector, an area of strength in the benchmark, combined with weaker-than-benchmark performance in that sector, were key detractors from the Fund’s relative results. Since the European market was relatively strong for the reporting period, the Fund’s modest cash exposure dragged on relative returns, as well. As a reminder, cash is a residual of our bottom-up stock selection process, not the result of any top-down or risk management allocation decision.
On a geographic basis, the Fund’s holdings in the UK and Ireland outperformed those of the style-specific benchmark and were among the most significant contributors to Fund performance. The Fund’s exposure in France and Italy, however, underperformed those of the MSCI Europe Growth Index over the reporting period and were among the most significant detractors from relative results.
As a reminder, the Fund’s country and sector exposures are shaped by the stocks we select based on their own investment merits, rather than by making top-down/ macro-based allocation decisions.
From an individual securities perspective, Sky and Dragon Oil were among the most significant contributors to Fund performance during the fiscal year. Sky, a British-based, pan-European broadcasting company, reported solid results over the reporting period with revenues and margins beating consensus expectations. The company’s strong management team executed its business plan well and the company’s cost discipline was clearly evident in its latest results. We believe the
| Portfolio Composition | ||||||
By sector
| % of total net assets | |||||
Financials | 23.1 | % | ||
Consumer Discretionary | 21.8 | |||
Industrials | 15.6 | |||
Health Care | 7.4 | |||
Consumer Staples | 7.3 | |||
Information Technology | 5.4 | |||
Energy | 4.2 | |||
Materials | 3.2 | |||
| Money Market Funds Plus Other Assets Less Liabilities | 12.0 |
| Top 10 Equity Holdings* | ||||
% of total net assets
| ||||
1. | Sky PLC | 3.6 | % | |||
2. | DCC PLC | 3.5 | ||||
3. | Deutsche Boerse AG | 2.6 | ||||
4. | IG Group Holdings PLC | 2.4 | ||||
5. | British American Tobacco PLC | 2.2 | ||||
6. | RELX PLC | 2.2 | ||||
7. | WPP PLC | 2.1 | ||||
8. | Sberbank of Russia-Preference Shares | 2.1 | ||||
9. | Intrum Justitia AB | 1.9 | ||||
10. | UBS Group AG | 1.8 |
Total Net Assets | $1.6 billion | ||||
| Total Number of Holdings* | 70 | ||||
The Fund’s holdings are subject to change, and there is no assurance that the Fund will continue to hold any particular security.
*Excluding money market fund holdings.
Data presented here are as of October 31, 2015.
| 4 Invesco European Growth Fund |
stock remains attractively valued given the growth potential over the next three to five years. Dragon Oil, an independent oil and gas company that was listed on the Irish stock exchange, was acquired by Emirates National Oil (not a Fund holding) at an attractive price during the fiscal year and we sold the Fund’s shares.
In contrast, Haci Omer Sabanci Holding and MorphoSys were among the most significant detractors from Fund performance over the reporting period. Haci Omer Sabanci Holding is a conservatively-managed Turkish holding company, of which Akbank T.A.S. is its largest holding. The company suffered during the reporting period from a weakening Turkish lira and a general investor exodus from emerging markets. The company controls a diverse portfolio of companies, many of which are market leaders in their respective industries, including banking, cement, tobacco, energy and retail. The conglomerate has a strong competitive position and trades at a very attractive valuation. MorphoSys is a German biotechnology company with a proprietary technology to develop human antibodies for specific diseases. Shares of the company dropped when it announced that its partnership with Celgene (not a Fund holding) for a multiple myeloma drug candidate was ending. There was, however, nothing to suggest any negative surprises in MorphoSys’ drug trials. With a deep pipeline of over 100 drug compounds, the company has many transformative opportunities. We added to the Fund’s position in MorphoSys on share-price weakness.
Over the reporting period, we continued to look for opportunities to improve the growth and quality characteristics of the Fund. As disconcerting as volatility may be, we believe it creates long-term opportunities for our shareholders. It’s rare to find a thriving business at a compelling valuation when everything is going right; rather, those valuations typically occur when fear dominates the market. At the stock level, we saw the decline over the past year in global equities as a buying opportunity.
New additions to the portfolio included British retail and commercial bank Lloyds Bank, Switzerland-based global luxury consumer goods holding company Cie Financière Richemont, Germany-based global courier company Deutsche Post, Swiss watch manufacturer The Swatch Group and UK-based interdealer brokerage company Tullett Prebon.
We trimmed or sold some of the Fund’s holdings with earnings, quality and valuation (EQV) characteristics that were no
longer as compelling as when we first initiated Fund positions in them, including Total and Dufry. We also sold Catlin Group after a takeover bid. In addition, as noted earlier, we tendered shares of international oil and gas exploration and production company Dragon Oil as it was acquired by the Emirates National Oil at an attractive price.
As always, regardless of the macroeconomic environment, we remain focused on a bottom-up investment approach of identifying attractive companies that fit our EQV-focused investment process. We continue to look for high-quality growth companies that exhibit the following characteristics: strong organic revenue growth; high returns on capital; pricing power; strong balance sheets; cash generation; effective capital allocation and reasonable valuations. In addition, we continue to favor companies that are resilient in weak economic environments. We believe that this balanced EQV-focused approach may help deliver attractive returns over the long term.
The strong market in recent years, aided by accommodative monetary policy that has kept interest rates very low, has displaced the normal Darwinian “survival of the fittest” contest of capitalism. In doing so, it has negated the advantages that less-leveraged companies derive from their balance sheets, both as a bulwark against economic weakness, but also as an offensive tool to take advantage of stressed competitors. At some point, interest rates should normalize and our preference for companies with strong balance sheets may be rewarded.
We thank you for your continued investment in Invesco European Growth Fund.
The views and opinions expressed in management’s discussion of Fund performance are those of Invesco Advisers, Inc. These views and opinions are subject to change at any time based on factors such as market and economic conditions. These views and opinions may not be relied upon as investment advice or recommendations, or as an offer for a particular security. The information is not a complete analysis of every aspect of any market, country, industry, security or the Fund. Statements of fact are from sources considered reliable, but Invesco Advisers, Inc. makes no representation or warranty as to their completeness or accuracy. Although historical performance is no guarantee of future results, these insights may help you understand our investment management philosophy.
See important Fund and, if applicable, index disclosures later in this report.
 | Jason Holzer Chartered Financial Analyst, Portfolio Manager, is lead manager of Invesco European Growth Fund with respect to | |
the Fund’s small and mid-cap investments. He joined Invesco in 1996. Mr. Holzer earned a BA in quantitative economics and an MS in engineering economic systems from Stanford University.
| ||
 | Clas Olsson Portfolio Manager and Chief Investment Officer of Invesco’s international growth investments team, is lead manager of | |
Invesco European Growth Fund with respect to the Fund’s small and mid-cap investments. He joined Invesco in 1994. Mr. Olsson became a commissioned officer at the Royal Swedish Naval Academy in 1988. He also earned a BBA from The University of Texas at Austin.
| ||
 | Matthew Dennis Chartered Financial Analyst, Portfolio Manager, is manager of Invesco European Growth Fund. He joined Invesco in 2000. | |
Mr. Dennis earned a BA in economics from The University of Texas at Austin and an MS in finance from Texas A&M University.
| ||
 | Borge Endresen Chartered Financial Analyst, Portfolio Manager, is manager of Invesco European Growth Fund. He joined Invesco in 1999. | |
Mr. Endresen earned a BS in finance from the University of Oregon and an MBA from The University of Texas at Austin.
| ||
 | Richard Nield Chartered Financial Analyst, Portfolio Manager, is manager of Invesco European Growth Fund. He joined Invesco in 2000. | |
| Mr. Nield earned a Bachelor of Commerce degree in finance and international business from McGill University in Montreal. | ||
| 5 Invesco European Growth Fund |
Your Fund’s Long-Term Performance
Results of a $10,000 Investment – Oldest Share Class(es)
Fund and index data from 10/31/05
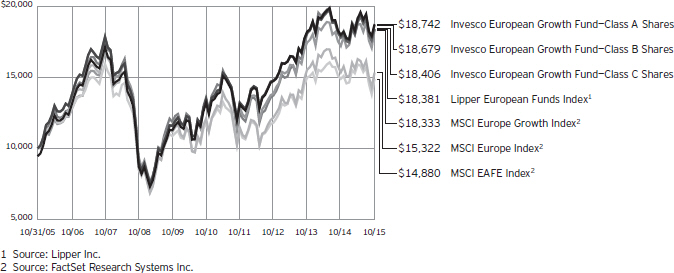
Past performance cannot guarantee comparable future results.
During the reporting period, the Fund elected to use the MSCI Europe Index to represent its broad market benchmark rather than the MSCI EAFE Index because the MSCI Europe Index more closely reflects the performance of the types of securities in which the Fund invests. Because this is the first reporting period since we have adopted the new index,
SEC guidelines require that we compare performance to both the old and new indexes.
The data shown in the chart include reinvested distributions, applicable sales charges and Fund expenses including management fees. Results for Class B shares are calculated as if a hypothetical shareholder had liquidated his entire investment in the Fund at the close of the reporting period and paid the contingent
deferred sales charges, if applicable. Index results include reinvested dividends, but they do not reflect sales charges. Performance of the peer group, if applicable, reflects fund expenses and management fees; performance of a market index does not. Performance shown in the chart and table(s) does not reflect deduction of taxes a shareholder would pay on Fund distributions or sale of Fund shares.
| 6 Invesco European Growth Fund |
Average Annual Total Returns As of 10/31/15, including maximum applicable | |||||
| Class A Shares | |||||
| Inception (11/3/97) | 10.31 | % | |||
| 10 Years | 6.48 | ||||
| 5 Years | 6.05 | ||||
| 1 Year | -1.54 | ||||
| Class B Shares | |||||
| Inception (11/3/97) | 10.32 | % | |||
| 10 Years | 6.45 | ||||
| 5 Years | 6.15 | ||||
| 1 Year | -1.44 | ||||
| Class C Shares | |||||
| Inception (11/3/97) | 9.87 | % | |||
| 10 Years | 6.29 | ||||
| 5 Years | 6.46 | ||||
| 1 Year | 2.45 | ||||
| Class R Shares | |||||
| Inception (6/3/02) | 9.23 | % | |||
| 10 Years | 6.82 | ||||
| 5 Years | 6.99 | ||||
| 1 Year | 3.93 | ||||
| Class Y Shares | |||||
| 10 Years | 7.28 | % | |||
| 5 Years | 7.53 | ||||
| 1 Year | 4.46 | ||||
| Investor Class Shares | |||||
| Inception (9/30/03) | 10.37 | % | |||
| 10 Years | 7.12 | ||||
| 5 Years | 7.30 | ||||
| 1 Year | 4.24 | ||||
Class Y shares incepted on October 3, 2008. Performance shown prior to that date is that of Class A shares and includes the 12b-1 fees applicable to Class A shares.
The performance data quoted represent past performance and cannot guarantee comparable future results; current performance may be lower or higher. Please visit invesco.com/performance for the most recent month-end performance. Performance figures reflect reinvested distributions, changes in net asset value and the effect of the maximum sales charge unless otherwise stated. Investment return and principal value will fluctuate so that you may have a gain or loss when you sell shares.
The net annual Fund operating expense ratio set forth in the most recent Fund prospectus as of the date of this report for Class A, Class B, Class C, Class R, Class Y and Investor Class shares was 1.36%, 2.11%, 2.11%, 1.61%, 1.11% and 1.33%,
| Average Annual Total Returns As of 9/30/15, the most recent calendar quarter | |||||
| Class A Shares | |||||
| Inception (11/3/97) | 10.08 | % | |||
| 10 Years | 5.53 | ||||
| 5 Years | 6.18 | ||||
| 1 Year | -7.47 | ||||
| Class B Shares | |||||
| Inception (11/3/97) | 10.09 | % | |||
| 10 Years | 5.49 | ||||
| 5 Years | 6.27 | ||||
| 1 Year | -7.37 | ||||
| Class C Shares | |||||
| Inception (11/3/97) | 9.64 | % | |||
| 10 Years | 5.33 | ||||
| 5 Years | 6.58 | ||||
| 1 Year | -3.71 | ||||
| Class R Shares | |||||
| Inception (6/3/02) | 8.91 | % | |||
| 10 Years | 5.86 | ||||
| 5 Years | 7.11 | ||||
| 1 Year | -2.32 | ||||
| Class Y Shares | |||||
| 10 Years | 6.31 | % | |||
| 5 Years | 7.66 | ||||
| 1 Year | -1.79 | ||||
| Investor Class Shares | |||||
| Inception (9/30/03) | 10.02 | % | |||
| 10 Years | 6.15 | ||||
| 5 Years | 7.42 | ||||
| 1 Year | -2.04 | ||||
respectively.1 The total annual Fund operating expense ratio set forth in the most recent Fund prospectus as of the date of this report for Class A, Class B, Class C, Class R, Class Y and Investor Class shares was 1.38%, 2.13%, 2.13%, 1.63%, 1.13% and 1.35%, respectively. The expense ratios presented above may vary from the expense ratios presented in other sections of this report that are based on expenses incurred during the period covered by this report.
Class A share performance reflects the maximum 5.50% sales charge, and Class B and Class C share performance reflects the applicable contingent deferred sales charge (CDSC) for the period involved. The CDSC on Class B shares declines from 5% beginning at the time of purchase to 0% at the beginning of the seventh year. The CDSC on Class C shares is 1% for the first year after purchase. Class R shares, Class Y shares and Investor
Class shares do not have a front-end sales charge or a CDSC; therefore, performance is at net asset value.
The performance of the Fund’s share classes will differ primarily due to different sales charge structures and class expenses.
Fund performance reflects any applicable fee waivers and/or expense reimbursements. Had the adviser not waived fees and/or reimbursed expenses currently or in the past, returns would have been lower. See current prospectus for more information.
| 1 | Total annual Fund operating expenses after any contractual fee waivers and/or expense reimbursements by the adviser in effect through at least June 30, 2017. See current prospectus for more information. |
| 7 Invesco European Growth Fund |
Invesco European Growth Fund’s investment objective is long-term growth of capital.
| n | Unless otherwise stated, information presented in this report is as of October 31, 2015, and is based on total net assets. |
| n | Unless otherwise noted, all data provided by Invesco. |
| n | To access your Fund’s reports/prospectus, visit invesco.com/fundreports. |
About share classes
| n | Class B shares may not be purchased for new or additional investments. Please see the prospectus for more information. |
| n | Class R shares are generally available only to employer sponsored retirement and benefit plans. Please see the prospectus for more information. |
| n | Class Y shares are available only to certain investors. Please see the prospectus for more information. |
| n | Investor Class shares are closed to new investors. Contact your financial adviser about purchasing our other share classes. Please see the prospectus for more information. |
Principal risks of investing in the Fund
| n | Depositary receipts risk. Depositary receipts involve many of the same risks as those associated with direct investment in foreign securities. In addition, the underlying issuers of certain depositary receipts, particularly unsponsored or unregistered depositary receipts, are under no obligation to distribute shareholder communications to the holders of such receipts or to pass through to them any voting rights with respect to the deposited securities. |
| n | Derivatives risk. The value of a derivative instrument depends largely on (and is derived from) the value of an underlying security, currency, commodity, interest rate, index or other asset (each referred to as an underlying asset). In addition to risks relating to the underlying assets, the use of derivatives may include other, possibly greater, risks, including counterparty, leverage and liquidity risks. Counterparty risk is the risk that the counterparty to the derivative contract will default on its obligation to pay the Fund the amount owed or otherwise perform under the derivative contract. Derivatives create leverage risk because they do not require payment up front equal to the economic exposure created by owning the derivative. As a |
| result, an adverse change in the value of the underlying asset could result in the Fund sustaining a loss that is substantially greater than the amount invested in the derivative, which may make the Fund’s returns more volatile and increase the risk of loss. Derivative instruments may also be less liquid than more traditional investments and the Fund may be unable to sell or close out its derivative positions at a desirable time or price. This risk may be more acute under adverse market conditions, during which the Fund may be most in need of liquidating its derivative positions. Derivatives may also be harder to value, less tax efficient and subject to changing government regulation that could impact the Fund’s ability to use certain derivatives or their cost. Also, derivatives used for hedging or to gain or limit exposure to a particular market segment may not provide the expected benefits, particularly during adverse market conditions. |
| n | Developing/emerging markets securities risk. The prices of securities issued by foreign companies and governments located in developing/emerging markets countries may be affected more negatively by inflation, devaluation of their currencies, higher transaction costs, delays in settlement, adverse political developments, the introduction of capital controls, withholding taxes, nationalization of private assets, expropriation, social unrest, war or lack of timely information than those in developed countries. |
| n | Foreign securities risk. The Fund’s foreign investments may be affected by changes in a foreign country’s exchange rates, political and social instability, changes in economic or taxation policies, difficulties when enforcing obligations, decreased liquidity, and increased volatility. Foreign companies may be subject to less regulation resulting in less publicly available information about the companies. |
| n | Geographic focus risk. From time to time the Fund may invest a substantial |
amount of its assets in securities of issuers located in a single country or a limited number of countries. If the Fund focuses its investments in this manner, it assumes the risk that economic, political and social conditions in those countries will have a significant impact on its investment performance. The Fund’s investment performance may also be more volatile if it focuses its investments in certain countries, especially emerging markets countries. |
| n | Growth investing risk. Growth stocks tend to be more expensive relative to their earnings or assets compared with other types of stock. As a result they tend to be more sensitive to changes in their earnings and can be more volatile. |
| n | Investing in the European Union risk. Many countries in the European Union are susceptible to high economic risks associated with high levels of debt, notably due to investments in sovereign debts of European countries such as Greece, Italy and Spain. One or more member states might exit the Europe-an Union, placing its currency and banking system in jeopardy. The European Union faces major issues involving its membership, structure, procedures and policies, including the adoption, abandonment or adjustment of the new constitutional treaty, the European Union’s enlargement to the south and east, and resolution of the European Union’s problematic fiscal and democratic accountability. Efforts of the member states to further unify their economic and monetary policies may increase the potential for the downward movement of one member state’s market to cause a similar effect on other member states’ markets. European countries that are part of the European Economic and Monetary Union may be significantly affected by the tight fiscal and monetary controls that the union seeks to impose on its members. |
| n | Management risk. The investment techniques and risk analysis used by the Fund’s portfolio managers may not produce the desired results. |
| n | Market risk. The prices of and the income generated by the Fund’s securities may decline in response to, among other things, investor sentiment, general economic and market conditions, |
This report must be accompanied or preceded by a currently effective Fund prospectus, which contains more complete information, including sales charges and expenses. Investors should read it carefully before investing.
|
|
| NOT FDIC INSURED | MAY LOSE VALUE | NO BANK GUARANTEE |
| 8 Invesco European Growth Fund |
| regional or global instability, and currency and interest rate fluctuations. |
| n | Preferred securities risk. Preferred securities may include provisions that permit the issuer, in its discretion, to defer or omit distributions for a certain period of time. If the Fund owns a security that is deferring or omitting its distributions, the Fund may be required to report the distribution on its tax returns, even though it may not have received this income. Further, preferred securities may lose substantial value due to the omission or deferment of dividend payments. |
| n | Small- and mid-capitalization risks. Stocks of small- and mid-sized companies tend to be more vulnerable to adverse developments and may have little or no operating history or track record of success, and limited product lines, markets, management and financial resources. The securities of small- and mid-sized companies may be more volatile due to less market interest and less publicly available information about the issuer. They also may be illiquid or restricted as to resale, or may trade less |
| frequently and in smaller volumes, all of which may cause difficulty when establishing or closing a position at a desirable price. |
About indexes used in this report
| n | The MSCI Europe Index captures large and mid-cap representation across 15 Developed Markets countries in Europe. The index is computed using the net return, which withholds applicable taxes for non-resident investors. |
| n | The MSCI EAFE® Index is an unmanaged index considered representative of stocks of Europe, Australasia and the Far East. The index is computed using the net return, which withholds applicable taxes for non-resident investors. |
| n | The MSCI Europe Growth Index is an unmanaged index considered representative of European growth stocks. The index is computed using the net return, which withholds applicable taxes for non-resident investors. |
| n | The Lipper European Funds Index is an unmanaged index considered representative of European funds tracked by Lipper. |
| n | The Fund is not managed to track the performance of any particular index, |
including the index(es) described here, and consequently, the performance of the Fund may deviate significantly from the performance of the index(es). |
| n | A direct investment cannot be made in an index. Unless otherwise indicated, index results include reinvested dividends, and they do not reflect sales charges. Performance of the peer group, if applicable, reflects fund expenses; performance of a market index does not. |
Other information
| n | The returns shown in management’s discussion of Fund performance are based on net asset values (NAVs) calculated for shareholder transactions. Generally accepted accounting principles require adjustments to be made to the net assets of the Fund at period end for financial reporting purposes, and as such, the NAVs for shareholder transactions and the returns based on those NAVs may differ from the NAVs and returns reported in the Financial Highlights. |
| n | Industry classifications used in this report are generally according to the Global Industry Classification Standard, which was developed by and is the exclusive property and a service mark of MSCI Inc. and Standard & Poor’s. |
| 9 Invesco European Growth Fund |
Schedule of Investments
October 31, 2015
| Shares | Value | |||||||
Common Stocks & Other Equity Interests–87.98% |
| |||||||
| Belgium–1.02% | ||||||||
Anheuser-Busch InBev SA/NV | 136,055 | $ | 16,227,245 | |||||
| Denmark–2.43% | ||||||||
Carlsberg A/S–Class B | 284,537 | 23,281,471 | ||||||
Novo Nordisk A/S–Class B | 288,518 | 15,285,103 | ||||||
| 38,566,574 | ||||||||
| France–5.68% | ||||||||
Bollore S.A. | 2,464,200 | 12,199,883 | ||||||
Metropole Television S.A. | 592,016 | 11,396,455 | ||||||
Publicis Groupe S.A. | 394,351 | 25,612,420 | ||||||
Schneider Electric S.E. | 400,979 | 24,246,649 | ||||||
Vicat S.A. | 256,660 | 16,455,117 | ||||||
| 89,910,524 | ||||||||
| Germany–11.09% | ||||||||
Allianz S.E. | 127,912 | 22,414,940 | ||||||
Deutsche Boerse AG | 453,500 | 41,767,293 | ||||||
Deutsche Post AG | 389,337 | 11,590,126 | ||||||
GEA Group AG | 241,466 | 9,667,352 | ||||||
MorphoSys AG(a) | 330,115 | 20,427,555 | ||||||
MTU Aero Engines AG | 223,860 | 20,720,873 | ||||||
ProSiebenSat.1 Media SE | 437,477 | 23,664,987 | ||||||
SAP S.E. | 320,676 | 25,348,295 | ||||||
| 175,601,421 | ||||||||
| Ireland–0.69% | ||||||||
Origin Enterprises PLC | 1,455,000 | 10,928,434 | ||||||
| Israel–1.51% | ||||||||
Israel Chemicals Ltd. | 2,345,805 | 12,978,703 | ||||||
Israel Discount Bank Ltd.–Class A(a) | 5,994,564 | 10,933,569 | ||||||
| 23,912,272 | ||||||||
| Italy–1.69% | ||||||||
Danieli & C. Officine Meccaniche S.p.A.–Savings Shares | 1,109,202 | 16,784,303 | ||||||
Prada S.p.A. | 2,446,900 | 9,944,695 | ||||||
| 26,728,998 | ||||||||
| Netherlands–0.54% | ||||||||
Aalberts Industries N.V. | 262,699 | 8,518,402 | ||||||
| Norway–0.86% | ||||||||
Prosafe S.E. | 4,929,845 | 13,690,703 | ||||||
| Russia–2.11% | ||||||||
Sberbank PAO–Preference Shares(a) | 31,092,640 | 33,351,365 | ||||||
| Spain–0.61% | ||||||||
Construcciones y Auxiliar de Ferrocarriles S.A. | 34,764 | 9,706,590 | ||||||
| Shares | Value | |||||||
| Sweden–6.06% | ||||||||
Getinge AB–Class B | 633,410 | $ | 15,812,964 | |||||
Intrum Justitia AB | 827,756 | 29,597,750 | ||||||
Investor AB–Class B | 611,985 | 22,658,871 | ||||||
Sandvik AB | 780,415 | 7,299,660 | ||||||
Telefonaktiebolaget LM Ericsson– | 2,113,057 | 20,549,821 | ||||||
| 95,919,066 | ||||||||
| Switzerland–10.75% | ||||||||
Aryzta AG | 267,249 | 12,060,412 | ||||||
Cie Financiere Richemont S.A. | 151,256 | 12,939,174 | ||||||
Julius Baer Group Ltd. | 513,511 | 25,448,537 | ||||||
Kuoni Reisen Holding AG | 66,248 | 13,728,210 | ||||||
Novartis AG | 97,949 | 8,881,993 | ||||||
Roche Holding AG | 88,381 | 23,942,694 | ||||||
Swatch Group AG (The) | 24,928 | 9,733,312 | ||||||
Syngenta AG | 61,764 | 20,752,228 | ||||||
Tecan Group AG | 105,086 | 14,333,292 | ||||||
UBS Group AG | 1,429,341 | 28,530,944 | ||||||
| 170,350,796 | ||||||||
| Turkey–2.47% | ||||||||
Haci Omer Sabanci Holding A.S. | 8,101,545 | 25,688,357 | ||||||
Tupras-Turkiye Petrol Rafinerileri A.S.(a) | 511,845 | 13,517,652 | ||||||
| 39,206,009 | ||||||||
| United Kingdom–40.47% | ||||||||
Aberdeen Asset Management PLC | 4,651,214 | 24,818,638 | ||||||
Amlin PLC | 1,782,194 | 18,092,034 | ||||||
British American Tobacco PLC | 595,967 | 35,378,399 | ||||||
Compass Group PLC | 1,269,337 | 21,868,446 | ||||||
DCC PLC | 681,736 | 54,642,546 | ||||||
Halma PLC | 1,116,661 | 13,127,360 | ||||||
HomeServe PLC | 1,804,139 | 11,234,969 | ||||||
IG Group Holdings PLC | 3,194,258 | 37,161,051 | ||||||
Informa PLC | 2,792,356 | 24,399,216 | ||||||
John Wood Group PLC | 2,295,120 | 21,063,492 | ||||||
Jupiter Fund Management PLC | 2,667,666 | 18,484,703 | ||||||
Kingfisher PLC | 3,749,791 | 20,382,192 | ||||||
Lancashire Holdings Ltd. | 1,171,980 | 12,855,398 | ||||||
Lloyds Banking Group PLC | 14,613,038 | 16,583,162 | ||||||
Micro Focus International PLC | 1,410,849 | 27,321,102 | ||||||
Next PLC | 125,220 | 15,413,612 | ||||||
RELX PLC | 1,971,889 | 35,252,272 | ||||||
Royal Dutch Shell PLC–Class B | 672,852 | 17,577,215 | ||||||
Savills PLC | 1,423,820 | 20,070,104 | ||||||
Sky PLC | 3,421,905 | 57,707,968 | ||||||
Smith & Nephew PLC | 1,086,071 | 18,538,188 | ||||||
Smiths Group PLC | 883,201 | 13,099,740 | ||||||
Tullett Prebon PLC | 1,334,437 | 7,238,056 | ||||||
UBM PLC | 1,081,397 | 8,516,129 | ||||||
See accompanying Notes to Financial Statements which are an integral part of the financial statements.
10 Invesco European Growth Fund
| Shares | Value | |||||||
| United Kingdom–(continued) | ||||||||
Ultra Electronics Holdings PLC | 690,708 | $ | 17,922,832 | |||||
Unilever N.V. | 405,926 | 18,297,833 | ||||||
William Hill PLC | 4,133,916 | 20,210,913 | ||||||
WPP PLC | 1,511,102 | 33,872,296 | ||||||
| 641,129,866 | ||||||||
Total Common Stocks & Other Equity Interests |
| 1,393,748,265 | ||||||
| Shares | Value | |||||||
Money Market Funds–11.57% |
| |||||||
Liquid Assets Portfolio–Institutional Class, 0.16%(b) | 91,616,957 | $ | 91,616,957 | |||||
Premier Portfolio–Institutional Class, 0.12%(b) | 91,616,956 | 91,616,956 | ||||||
Total Money Market Funds |
| 183,233,913 | ||||||
TOTAL INVESTMENTS–99.55% |
| 1,576,982,178 | ||||||
OTHER ASSETS LESS LIABILITIES–0.45% |
| 7,200,936 | ||||||
NET ASSETS–100.00% |
| $ | 1,584,183,114 | |||||
Notes to Schedule of Investments:
| (a) | Non-income producing security. |
| (b) | The money market fund and the Fund are affiliated by having the same investment adviser. The rate shown is the 7-day SEC standardized yield as of October 31, 2015. |
See accompanying Notes to Financial Statements which are an integral part of the financial statements.
11 Invesco European Growth Fund
Statement of Assets and Liabilities
October 31, 2015
Assets: |
| |||
Investments, at value (Cost $1,171,922,810) | $ | 1,393,748,265 | ||
Investments in affiliated money market funds, at value and cost | 183,233,913 | |||
Total investments, at value (Cost $1,355,156,723) | 1,576,982,178 | |||
Foreign currencies, at value (Cost $1,715,540) | 1,723,097 | |||
Receivable for: | ||||
Investments sold | 427,769 | |||
Fund shares sold | 3,855,237 | |||
Dividends | 4,321,724 | |||
Investment for trustee deferred compensation and retirement plans | 199,623 | |||
Other assets | 46,735 | |||
Total assets | 1,587,556,363 | |||
Liabilities: |
| |||
Payable for: | ||||
Fund shares reacquired | 2,195,500 | |||
Accrued fees to affiliates | 760,814 | |||
Accrued trustees’ and officers’ fees and benefits | 2,835 | |||
Accrued other operating expenses | 187,237 | |||
Trustee deferred compensation and retirement plans | 226,863 | |||
Total liabilities | 3,373,249 | |||
Net assets applicable to shares outstanding | $ | 1,584,183,114 | ||
Net assets consist of: |
| |||
Shares of beneficial interest | $ | 1,294,451,952 | ||
Undistributed net investment income | 18,553,174 | |||
Undistributed net realized gain | 49,432,287 | |||
Net unrealized appreciation | 221,745,701 | |||
| $ | 1,584,183,114 | |||
Net Assets: |
| |||
Class A | $ | 575,257,789 | ||
Class B | $ | 4,828,625 | ||
Class C | $ | 115,058,351 | ||
Class R | $ | 15,280,026 | ||
Class Y | $ | 695,156,609 | ||
Investor Class | $ | 178,601,714 | ||
Shares outstanding, $0.001 par value per share, |
| |||
Class A | 15,695,751 | |||
Class B | 141,669 | |||
Class C | 3,372,189 | |||
Class R | 418,909 | |||
Class Y | 18,912,269 | |||
Investor Class | 4,885,446 | |||
Class A: | ||||
Net asset value per share | $ | 36.65 | ||
Maximum offering price per share | ||||
(Net asset value of $36.65 ¸ 94.50%) | $ | 38.78 | ||
Class B: | ||||
Net asset value and offering price per share | $ | 34.08 | ||
Class C: | ||||
Net asset value and offering price per share | $ | 34.12 | ||
Class R: | ||||
Net asset value and offering price per share | $ | 36.48 | ||
Class Y: | ||||
Net asset value and offering price per share | $ | 36.76 | ||
Investor Class: | ||||
Net asset value and offering price per share | $ | 36.56 | ||
See accompanying Notes to Financial Statements which are an integral part of the financial statements.
12 Invesco European Growth Fund
Statement of Operations
For the year ended October 31, 2015
Investment income: |
| |||
Dividends (net of foreign withholding taxes of $2,073,664) | $ | 42,236,174 | ||
Dividends from affiliated money market funds | 91,306 | |||
Interest | 8,129 | |||
Total investment income | 42,335,609 | |||
Expenses: | ||||
Advisory fees | 13,508,522 | |||
Administrative services fees | 372,585 | |||
Custodian fees | 468,450 | |||
Distribution fees: | ||||
Class A | 1,364,558 | |||
Class B | 64,826 | |||
Class C | 1,019,487 | |||
Class R | 78,094 | |||
Investor Class | 388,423 | |||
Transfer agent fees | 2,433,064 | |||
Trustees’ and officers’ fees and benefits | 43,378 | |||
Other | 410,990 | |||
Total expenses | 20,152,377 | |||
Less: Fees waived and expense offset arrangement(s) | (163,094 | ) | ||
Net expenses | 19,989,283 | |||
Net investment income | 22,346,326 | |||
Realized and unrealized gain (loss) from: | ||||
Net realized gain from: | ||||
Investment securities | 51,742,051 | |||
Foreign currencies | 796,890 | |||
| 52,538,941 | ||||
Change in net unrealized appreciation (depreciation) of: | ||||
Investment securities | (21,230,571 | ) | ||
Foreign currencies | 90,166 | |||
| (21,140,405 | ) | |||
Net realized and unrealized gain | 31,398,536 | |||
Net increase in net assets resulting from operations | $ | 53,744,862 | ||
See accompanying Notes to Financial Statements which are an integral part of the financial statements.
13 Invesco European Growth Fund
Statement of Changes in Net Assets
For the years ended October 31, 2015 and 2014
| 2015 | 2014 | |||||||
Operations: |
| |||||||
Net investment income | $ | 22,346,326 | $ | 26,106,567 | ||||
Net realized gain | 52,538,941 | 67,578,375 | ||||||
Change in net unrealized appreciation (depreciation) | (21,140,405 | ) | (123,641,397 | ) | ||||
Net increase (decrease) in net assets resulting from operations | 53,744,862 | (29,956,455 | ) | |||||
Distributions to shareholders from net investment income: | ||||||||
Class A | (9,316,870 | ) | (5,988,738 | ) | ||||
Class B | (97,767 | ) | (82,972 | ) | ||||
Class C | (1,093,697 | ) | (439,511 | ) | ||||
Class R | (252,936 | ) | (161,586 | ) | ||||
Class Y | (16,031,370 | ) | (9,199,162 | ) | ||||
Investor Class | (3,212,811 | ) | (2,330,739 | ) | ||||
Total distributions from net investment income | (30,005,451 | ) | (18,202,708 | ) | ||||
Distributions to shareholders from net realized gains: | ||||||||
Class A | (21,258,619 | ) | (9,666,633 | ) | ||||
Class B | (364,390 | ) | (243,679 | ) | ||||
Class C | (4,076,344 | ) | (1,290,802 | ) | ||||
Class R | (664,482 | ) | (308,730 | ) | ||||
Class Y | (31,703,920 | ) | (12,656,807 | ) | ||||
Investor Class | (7,187,120 | ) | (3,737,516 | ) | ||||
Total distributions from net realized gains | (65,254,875 | ) | (27,904,167 | ) | ||||
Share transactions–net: | ||||||||
Class A | 52,656,852 | 64,738,152 | ||||||
Class B | (3,571,332 | ) | (3,373,210 | ) | ||||
Class C | 24,123,562 | 43,024,873 | ||||||
Class R | (613,277 | ) | 855,728 | |||||
Class Y | (81,492,161 | ) | 212,747,518 | |||||
Investor Class | 7,144,300 | (14,899,605 | ) | |||||
Net increase (decrease) in net assets resulting from share transactions | (1,752,056 | ) | 303,093,456 | |||||
Net increase (decrease) in net assets | (43,267,520 | ) | 227,030,126 | |||||
Net assets: | ||||||||
Beginning of year | 1,627,450,634 | 1,400,420,508 | ||||||
End of year (includes undistributed net investment income of $18,553,174 and $23,615,947, respectively) | $ | 1,584,183,114 | $ | 1,627,450,634 | ||||
Notes to Financial Statements
October 31, 2015
NOTE 1—Significant Accounting Policies
Invesco European Growth Fund (the “Fund”) is a series portfolio of AIM International Mutual Funds (Invesco International Mutual Funds) (the “Trust”). The Trust is a Delaware statutory trust registered under the Investment Company Act of 1940, as amended (the “1940 Act”), as an open-end series management investment company consisting of eight separate portfolios, each authorized to issue an unlimited number of shares of beneficial interest. The assets, liabilities and operations of each portfolio are accounted for separately. Information presented in these financial statements pertains only to the Fund. Matters affecting each portfolio or class will be voted on exclusively by the shareholders of such portfolio or class.
The Fund’s investment objective is long-term growth of capital.
The Fund currently consists of six different classes of shares: Class A, Class B, Class C, Class R, Class Y and Investor Class. Investor Class shares of the Fund are offered only to certain grandfathered investors. Class A shares are sold with a front-end sales charge unless certain waiver criteria are met and under certain circumstances load waived shares may be subject to contingent deferred sales charges (“CDSC”). Class C shares are sold with a CDSC. Class R, Class Y and Investor Class shares are sold at net asset value. Effective November 30, 2010, new or additional investments in Class B shares are no longer permitted. Existing shareholders of Class B shares may continue to reinvest dividends and capital gains distributions in Class B shares until they convert to Class A shares. Also, shareholders in Class B shares will be able to exchange those shares for Class B shares of other
14 Invesco European Growth Fund
Invesco Funds offering such shares until they convert to Class A shares. Generally, Class B shares will automatically convert to Class A shares on or about the month-end, which is at least eight years after the date of purchase. Redemption of Class B shares prior to the conversion date will be subject to a CDSC.
The following is a summary of the significant accounting policies followed by the Fund in the preparation of its financial statements.
| A. | Security Valuations — Securities, including restricted securities, are valued according to the following policy. |
A security listed or traded on an exchange (except convertible securities) is valued at its last sales price or official closing price as of the close of the customary trading session on the exchange where the security is principally traded, or lacking any sales or official closing price on a particular day, the security may be valued at the closing bid price on that day. Securities traded in the over-the-counter market are valued based on prices furnished by independent pricing services or market makers. When such securities are valued by an independent pricing service they may be considered fair valued. Futures contracts are valued at the final settlement price set by an exchange on which they are principally traded. Listed options are valued at the mean between the last bid and asked prices from the exchange on which they are principally traded. Options not listed on an exchange are valued by an independent source at the mean between the last bid and asked prices. For purposes of determining net asset value (“NAV”) per share, futures and option contracts generally are valued 15 minutes after the close of the customary trading session of the New York Stock Exchange (“NYSE”).
Investments in open-end and closed-end registered investment companies that do not trade on an exchange are valued at the end-of-day net asset value per share. Investments in open-end and closed-end registered investment companies that trade on an exchange are valued at the last sales price or official closing price as of the close of the customary trading session on the exchange where the security is principally traded.
Debt obligations (including convertible securities) and unlisted equities are fair valued using an evaluated quote provided by an independent pricing service. Evaluated quotes provided by the pricing service may be determined without exclusive reliance on quoted prices, and may reflect appropriate factors such as institution-size trading in similar groups of securities, developments related to specific securities, dividend rate (for unlisted equities), yield (for debt obligations), quality, type of issue, coupon rate (for debt obligations), maturity (for debt obligations), individual trading characteristics and other market data. Debt obligations are subject to interest rate and credit risks. In addition, all debt obligations involve some risk of default with respect to interest and/or principal payments.
Foreign securities’ (including foreign exchange contracts) prices are converted into U.S. dollar amounts using the applicable exchange rates as of the close of the NYSE. If market quotations are available and reliable for foreign exchange-traded equity securities, the securities will be valued at the market quotations. Because trading hours for certain foreign securities end before the close of the NYSE, closing market quotations may become unreliable. If between the time trading ends on a particular security and the close of the customary trading session on the NYSE, events occur that the Adviser determines are significant and make the closing price unreliable, the Fund may fair value the security. If the event is likely to have affected the closing price of the security, the security will be valued at fair value in good faith using procedures approved by the Board of Trustees. Adjustments to closing prices to reflect fair value may also be based on a screening process of an independent pricing service to indicate the degree of certainty, based on historical data, that the closing price in the principal market where a foreign security trades is not the current value as of the close of the NYSE. Foreign securities’ prices meeting the approved degree of certainty that the price is not reflective of current value will be priced at the indication of fair value from the independent pricing service. Multiple factors may be considered by the independent pricing service in determining adjustments to reflect fair value and may include information relating to sector indices, American Depositary Receipts and domestic and foreign index futures. Foreign securities may have additional risks including exchange rate changes, potential for sharply devalued currencies and high inflation, political and economic upheaval, the relative lack of issuer information, relatively low market liquidity and the potential lack of strict financial and accounting controls and standards.
Securities for which market prices are not provided by any of the above methods may be valued based upon quotes furnished by independent sources. The last bid price may be used to value equity securities. The mean between the last bid and asked prices is used to value debt obligations, including corporate loans.
Securities for which market quotations are not readily available or became unreliable are valued at fair value as determined in good faith by or under the supervision of the Trust’s officers following procedures approved by the Board of Trustees. Issuer specific events, market trends, bid/asked quotes of brokers and information providers and other market data may be reviewed in the course of making a good faith determination of a security’s fair value.
The Fund may invest in securities that are subject to interest rate risk, meaning the risk that the prices will generally fall as interest rates rise and, conversely, the prices will generally rise as interest rates fall. Specific securities differ in their sensitivity to changes in interest rates depending on their individual characteristics. Changes in interest rates may result in increased market volatility, which may affect the value and/or liquidity of certain Fund investments.
Valuations change in response to many factors including the historical and prospective earnings of the issuer, the value of the issuer’s assets, general economic conditions, interest rates, investor perceptions and market liquidity. Because of the inherent uncertainties of valuation, the values reflected in the financial statements may materially differ from the value received upon actual sale of those investments.
| B. | Securities Transactions and Investment Income — Securities transactions are accounted for on a trade date basis. Realized gains or losses on sales are computed on the basis of specific identification of the securities sold. Interest income (net of withholding tax, if any) is recorded on the accrual basis from settlement date. Dividend income (net of withholding tax, if any) is recorded on the ex-dividend date. |
The Fund may periodically participate in litigation related to Fund investments. As such, the Fund may receive proceeds from litigation settlements. Any proceeds received are included in the Statement of Operations as realized gain (loss) for investments no longer held and as unrealized gain (loss) for investments still held.
Brokerage commissions and mark ups are considered transaction costs and are recorded as an increase to the cost basis of securities purchased and/or a reduction of proceeds on a sale of securities. Such transaction costs are included in the determination of net realized and unrealized gain (loss) from investment securities reported in the Statement of Operations and the Statement of Changes in Net Assets and the net realized and unrealized gains (losses) on securities per share in the Financial Highlights. Transaction costs are included in the calculation of the Fund’s net asset value and, accordingly, they reduce the Fund’s total returns. These transaction costs are not considered operating expenses and are not reflected in net investment income reported in the Statement of Operations and the Statement of Changes in Net Assets, or the net
15 Invesco European Growth Fund
investment income per share and the ratios of expenses and net investment income reported in the Financial Highlights, nor are they limited by any expense limitation arrangements between the Fund and the investment adviser.
The Fund allocates income and realized and unrealized capital gains and losses to a class based on the relative net assets of each class.
| C. | Country Determination — For the purposes of making investment selection decisions and presentation in the Schedule of Investments, the investment adviser may determine the country in which an issuer is located and/or credit risk exposure based on various factors. These factors include the laws of the country under which the issuer is organized, where the issuer maintains a principal office, the country in which the issuer derives 50% or more of its total revenues and the country that has the primary market for the issuer’s securities, as well as other criteria. Among the other criteria that may be evaluated for making this determination are the country in which the issuer maintains 50% or more of its assets, the type of security, financial guarantees and enhancements, the nature of the collateral and the sponsor organization. Country of issuer and/or credit risk exposure has been determined to be the United States of America, unless otherwise noted. |
| D. | Distributions — Distributions from net investment income and net realized capital gain, if any, are generally declared and paid annually and recorded on the ex-dividend date. The Fund may elect to treat a portion of the proceeds from redemptions as distributions for federal income tax purposes. |
| E. | Federal Income Taxes — The Fund intends to comply with the requirements of Subchapter M of the Internal Revenue Code of 1986, as amended (the “Internal Revenue Code”), necessary to qualify as a regulated investment company and to distribute substantially all of the Fund’s taxable earnings to shareholders. As such, the Fund will not be subject to federal income taxes on otherwise taxable income (including net realized capital gain) that is distributed to shareholders. Therefore, no provision for federal income taxes is recorded in the financial statements. |
The Fund recognizes the tax benefits of uncertain tax positions only when the position is more likely than not to be sustained. Management has analyzed the Fund’s uncertain tax positions and concluded that no liability for unrecognized tax benefits should be recorded related to uncertain tax positions. Management is not aware of any tax positions for which it is reasonably possible that the total amounts of unrecognized tax benefits will change materially in the next 12 months.
The Fund files tax returns in the U.S. Federal jurisdiction and certain other jurisdictions. Generally, the Fund is subject to examinations by such taxing authorities for up to three years after the filing of the return for the tax period.
| F. | Expenses — Fees provided for under the Rule 12b-1 plan of a particular class of the Fund and which are directly attributable to that class are charged to the operations of such class. All other expenses are allocated among the classes based on relative net assets. |
| G. | Accounting Estimates — The preparation of financial statements in conformity with accounting principles generally accepted in the United States of America (“GAAP”) requires management to make estimates and assumptions that affect the reported amounts of assets and liabilities at the date of the financial statements and the reported amounts of revenues and expenses during the reporting period including estimates and assumptions related to taxation. Actual results could differ from those estimates by a significant amount. In addition, the Fund monitors for material events or transactions that may occur or become known after the period-end date and before the date the financial statements are released to print. |
| H. | Indemnifications — Under the Trust’s organizational documents, each Trustee, officer, employee or other agent of the Trust is indemnified against certain liabilities that may arise out of the performance of their duties to the Fund. Additionally, in the normal course of business, the Fund enters into contracts, including the Fund’s servicing agreements, that contain a variety of indemnification clauses. The Fund’s maximum exposure under these arrangements is unknown as this would involve future claims that may be made against the Fund that have not yet occurred. The risk of material loss as a result of such indemnification claims is considered remote. |
| I. | Foreign Currency Translations — Foreign currency is valued at the close of the NYSE based on quotations posted by banks and major currency dealers. Portfolio securities and other assets and liabilities denominated in foreign currencies are translated into U.S. dollar amounts at date of valuation. Purchases and sales of portfolio securities (net of foreign taxes withheld on disposition) and income items denominated in foreign currencies are translated into U.S. dollar amounts on the respective dates of such transactions. The Fund does not separately account for the portion of the results of operations resulting from changes in foreign exchange rates on investments and the fluctuations arising from changes in market prices of securities held. The combined results of changes in foreign exchange rates and the fluctuation of market prices on investments (net of estimated foreign tax withholding) are included with the net realized and unrealized gain or loss from investments in the Statement of Operations. Reported net realized foreign currency gains or losses arise from (1) sales of foreign currencies, (2) currency gains or losses realized between the trade and settlement dates on securities transactions, and (3) the difference between the amounts of dividends, interest, and foreign withholding taxes recorded on the Fund’s books and the U.S. dollar equivalent of the amounts actually received or paid. Net unrealized foreign currency gains and losses arise from changes in the fair values of assets and liabilities, other than investments in securities at fiscal period end, resulting from changes in exchange rates. |
The Fund may invest in foreign securities, which may be subject to foreign taxes on income, gains on investments or currency repatriation, a portion of which may be recoverable. Foreign taxes, if any, are recorded based on the tax regulations and rates that exist in the foreign markets in which the Fund invests and are shown in the Statement of Operations.
| J. | Forward Foreign Currency Contracts — The Fund may engage in foreign currency transactions either on a spot (i.e. for prompt delivery and settlement) basis, or through forward foreign currency contracts, to manage or minimize currency or exchange rate risk. |
The Fund may also enter into forward foreign currency contracts for the purchase or sale of a security denominated in a foreign currency in order to “lock in” the U.S. dollar price of that security, or the Fund may also enter into forward foreign currency contracts that do not provide for physical settlement of the two currencies, but instead are settled by a single cash payment calculated as the difference between the agreed upon exchange rate and the spot rate at settlement based upon an agreed upon notional amount (non-deliverable forwards). The Fund will set aside liquid assets in an amount equal to daily mark-to-market obligation for forward foreign currency contracts.
A forward foreign currency contract is an obligation between two parties (“Counterparties”) to purchase or sell a specific currency for an agreed-upon price at a future date. The use of forward foreign currency contracts does not eliminate fluctuations in the price of the underlying securities the Fund owns or intends to acquire but establishes a rate of exchange in advance. Fluctuations in the value of these contracts are measured by the difference in the contract date and reporting date exchange rates and are recorded as unrealized appreciation (depreciation) until the contracts are closed. When the contracts are closed, realized gains (losses) are recorded. Realized and unrealized gains (losses) on the contracts are included in the Statement of Operations. The primary risks associated with forward foreign currency contracts include failure of the
16 Invesco European Growth Fund
Counterparty to meet the terms of the contract and the value of the foreign currency changing unfavorably. These risks may be in excess of the amounts reflected in the Statement of Assets and Liabilities.
NOTE 2—Advisory Fees and Other Fees Paid to Affiliates
The Trust has entered into a master investment advisory agreement with Invesco Advisers, Inc. (the “Adviser” or “Invesco”). Under the terms of the investment advisory agreement, the Fund pays an advisory fee to the Adviser based on the annual rate of the Fund’s average daily net assets as follows:
| Average Daily Net Assets | Rate | |||||
First $250 million | 0 | .935% | ||||
Next $250 million | 0 | .91% | ||||
Next $500 million | 0 | .885% | ||||
Next $1.5 billion | 0 | .86% | ||||
Next $2.5 billion | 0 | .835% | ||||
Next $2.5 billion | 0 | .81% | ||||
Next $2.5 billion | 0 | .785% | ||||
Over $10 billion | 0 | .76% | ||||
For the year ended October 31, 2015, the effective advisory fees incurred by the Fund was 0.89%.
Under the terms of a master sub-advisory agreement between the Adviser and each of Invesco Asset Management Deutschland GmbH, Invesco Asset Management Limited, Invesco Asset Management (Japan) Limited, Invesco Hong Kong Limited, Invesco Senior Secured Management, Inc. and Invesco Canada Ltd. (collectively, the “Affiliated Sub-Advisers”) the Adviser, not the Fund, may pay 40% of the fees paid to the Adviser to any such Affiliated Sub-Adviser(s) that provide(s) discretionary investment management services to the Fund based on the percentage of assets allocated to such Affiliated Sub-Adviser(s).
The Adviser has contractually agreed, through at least June 30, 2016, to waive advisory fees and/or reimburse expenses of all shares to the extent necessary to limit total annual fund operating expenses after fee waiver and/or expense reimbursement (excluding certain items discussed below) of Class A, Class B, Class C, Class R, Class Y and Investor Class shares to 2.25%, 3.00%, 3.00%, 2.50%, 2.00% and 2.25%, respectively, of average daily net assets. In determining the Adviser’s obligation to waive advisory fees and/or reimburse expenses, the following expenses are not taken into account, and could cause the total annual fund operating expenses after fee waiver and/or expense reimbursement to exceed the numbers reflected above: (1) interest; (2) taxes; (3) dividend expense on short sales; (4) extraordinary or non-routine items, including litigation expenses; and (5) expenses that the Fund has incurred but did not actually pay because of an expense offset arrangement. Unless Invesco continues the fee waiver agreement, it will terminate on June 30, 2016. The fee waiver agreement cannot be terminated during its term. The Adviser did not waive fees and/or reimburse expenses during the period under this expense limitation.
Further, the Adviser has contractually agreed, through at least June 30, 2017, to waive the advisory fee payable by the Fund in an amount equal to 100% of the net advisory fees the Adviser receives from the affiliated money market funds on investments by the Fund of uninvested cash in such affiliated money market funds.
For the year ended October 31, 2015, the Adviser waived advisory fees of $158,147.
The Trust has entered into a master administrative services agreement with Invesco pursuant to which the Fund has agreed to pay Invesco for certain administrative costs incurred in providing accounting services to the Fund. For the year ended October 31, 2015, expenses incurred under the agreement are shown in the Statement of Operations as Administrative services fees.
The Trust has entered into a transfer agency and service agreement with Invesco Investment Services, Inc. (“IIS”) pursuant to which the Fund has agreed to pay IIS a fee for providing transfer agency and shareholder services to the Fund and reimburse IIS for certain expenses incurred by IIS in the course of providing such services. IIS may make payments to intermediaries that provide omnibus account services, sub-accounting services and/or networking services. All fees payable by IIS to intermediaries that provide omnibus account services or sub-accounting are charged back to the Fund, subject to certain limitations approved by the Trust’s Board of Trustees. For the year ended October 31, 2015, expenses incurred under the agreement are shown in the Statement of Operations as Transfer agent fees.
The Trust has entered into master distribution agreements with Invesco Distributors, Inc. (“IDI”) to serve as the distributor for the Class A, Class B, Class C, Class R, Class Y and Investor Class shares of the Fund. The Trust has adopted plans pursuant to Rule 12b-1 under the 1940 Act with respect to the Fund’s Class A, Class B, Class C, Class R and Investor Class shares (collectively, the “Plans”). The Fund, pursuant to the Plans, pays IDI compensation at the annual rate of 0.25% of the Fund’s average daily net assets of Class A shares, 1.00% of the average daily net assets of Class B and Class C shares and 0.50% of the average daily net assets of Class R shares. The Fund, pursuant to the Investor Class Plan, reimburses IDI for its allocated share of expenses incurred pursuant to the Investor Class Plan for the period, up to a maximum annual rate of 0.25% of the average daily net assets of Investor Class shares. Of the Plan payments, up to 0.25% of the average daily net assets of each class of shares may be paid to furnish continuing personal shareholder services to customers who purchase and own shares of such classes. Any amounts not paid as a service fee under the Plans would constitute an asset-based sales charge. Rules of the Financial Industry Regulatory Authority (“FINRA”) impose a cap on the total sales charges, including asset-based sales charges, that may be paid by any class of shares of the Fund. For the year ended October 31, 2015, expenses incurred under the Plans are shown in the Statement of Operations as Distribution fees.
Front-end sales commissions and CDSC (collectively, the “sales charges”) are not recorded as expenses of the Fund. Front-end sales commissions are deducted from proceeds from the sales of Fund shares prior to investment in Class A shares of the Fund. CDSC are deducted from redemption proceeds prior to remittance to the shareholder. During the year ended October 31, 2015, IDI advised the Fund that IDI retained $144,818 in front-end sales commissions from the sale of Class A shares and $41,311, $1,657 and $31,673 from Class A, Class B and Class C shares, respectively, for CDSC imposed on redemptions by shareholders.
Certain officers and trustees of the Trust are officers and directors of the Adviser, IIS and/or IDI.
17 Invesco European Growth Fund
NOTE 3—Additional Valuation Information
GAAP defines fair value as the price that would be received to sell an asset or paid to transfer a liability in an orderly transaction between market participants at the measurement date, under current market conditions. GAAP establishes a hierarchy that prioritizes the inputs to valuation methods, giving the highest priority to readily available unadjusted quoted prices in an active market for identical assets (Level 1) and the lowest priority to significant unobservable inputs (Level 3), generally when market prices are not readily available or are unreliable. Based on the valuation inputs, the securities or other investments are tiered into one of three levels. Changes in valuation methods may result in transfers in or out of an investment’s assigned level:
| Level 1 — | Prices are determined using quoted prices in an active market for identical assets. |
| Level 2 — | Prices are determined using other significant observable inputs. Observable inputs are inputs that other market participants may use in pricing a security. These may include quoted prices for similar securities, interest rates, prepayment speeds, credit risk, yield curves, loss severities, default rates, discount rates, volatilities and others. |
| Level 3 — | Prices are determined using significant unobservable inputs. In situations where quoted prices or observable inputs are unavailable (for example, when there is little or no market activity for an investment at the end of the period), unobservable inputs may be used. Unobservable inputs reflect the Fund’s own assumptions about the factors market participants would use in determining fair value of the securities or instruments and would be based on the best available information. |
The following is a summary of the tiered valuation input levels, as of October 31, 2015. The level assigned to the securities valuations may not be an indication of the risk or liquidity associated with investing in those securities. Because of the inherent uncertainties of valuation, the values reflected in the financial statements may materially differ from the value received upon actual sale of those investments.
During the year ended October 31, 2015, there were transfers from Level 1 to Level 2 of $229,856,275 and from Level 2 to Level 1 of $105,511,458, due to foreign fair value adjustments.
| Level 1 | Level 2 | Level 3 | Total | |||||||||||||
Belgium | $ | — | $ | 16,227,245 | $ | — | $ | 16,227,245 | ||||||||
Denmark | — | 38,566,574 | — | 38,566,574 | ||||||||||||
France | 65,663,875 | 24,246,649 | — | 89,910,524 | ||||||||||||
Germany | 165,934,069 | 9,667,352 | — | 175,601,421 | ||||||||||||
Ireland | 10,928,434 | — | — | 10,928,434 | ||||||||||||
Israel | 23,912,272 | — | — | 23,912,272 | ||||||||||||
Italy | 26,728,998 | — | — | 26,728,998 | ||||||||||||
Netherlands | — | 8,518,402 | — | 8,518,402 | ||||||||||||
Norway | — | 13,690,703 | — | 13,690,703 | ||||||||||||
Russia | — | 33,351,365 | — | 33,351,365 | ||||||||||||
Spain | 9,706,590 | — | — | 9,706,590 | ||||||||||||
Sweden | 7,299,660 | 88,619,406 | — | 95,919,066 | ||||||||||||
Switzerland | 40,121,914 | 130,228,882 | — | 170,350,796 | ||||||||||||
Turkey | 13,517,652 | 25,688,357 | — | 39,206,009 | ||||||||||||
United Kingdom | 97,027,612 | 544,102,254 | — | 641,129,866 | ||||||||||||
United States | 183,233,913 | — | — | 183,233,913 | ||||||||||||
Total Investments | $ | 644,074,989 | $ | 932,907,189 | $ | — | $ | 1,576,982,178 | ||||||||
NOTE 4—Expense Offset Arrangement(s)
The expense offset arrangement is comprised of transfer agency credits which result from balances in demand deposit accounts used by the transfer agent for clearing shareholder transactions. For the year ended October 31, 2015, the Fund received credits from this arrangement, which resulted in the reduction of the Fund’s total expenses of $4,947.
NOTE 5—Trustees’ and Officers’ Fees and Benefits
Trustees’ and Officers’ Fees and Benefits include amounts accrued by the Fund to pay remuneration to certain Trustees and Officers of the Fund. Trustees have the option to defer compensation payable by the Fund, and Trustees’ and Officers’ Fees and Benefits also include amounts accrued by the Fund to fund such deferred compensation amounts. Those Trustees who defer compensation have the option to select various Invesco Funds in which their deferral accounts shall be deemed to be invested. Finally, certain current Trustees were eligible to participate in a retirement plan that provided for benefits to be paid upon retirement to Trustees over a period of time based on the number of years of service. The Fund may have certain former Trustees who also participate in a retirement plan and receive benefits under such plan. Trustees’ and Officers’ Fees and Benefits include amounts accrued by the Fund to fund such retirement benefits. Obligations under the deferred compensation and retirement plans represent unsecured claims against the general assets of the Fund.
18 Invesco European Growth Fund
NOTE 6—Cash Balances
The Fund is permitted to temporarily carry a negative or overdrawn balance in its account with State Street Bank and Trust Company, the custodian bank. Such balances, if any at period end, are shown in the Statement of Assets and Liabilities under the payable caption Amount due custodian. To compensate the custodian bank for such overdrafts, the overdrawn Fund may either (1) leave funds as a compensating balance in the account so the custodian bank can be compensated by earning the additional interest; or (2) compensate by paying the custodian bank at a rate agreed upon by the custodian bank and Invesco, not to exceed the contractually agreed upon rate.
NOTE 7—Distributions to Shareholders and Tax Components of Net Assets
Tax Character of Distributions to Shareholders Paid During the Fiscal Years Ended October 31, 2015 and 2014:
| 2015 | 2014 | |||||||
Ordinary income | $ | 30,005,451 | $ | 18,202,708 | ||||
Long-term capital gain | 65,254,875 | 27,904,167 | ||||||
Total distributions | $ | 95,260,326 | $ | 46,106,875 | ||||
Tax Components of Net Assets at Period-End:
| 2015 | ||||
Undistributed ordinary income | $ | 22,901,045 | ||
Undistributed long-term gain | 49,945,756 | |||
Net unrealized appreciation — investments | 217,190,480 | |||
Net unrealized appreciation (depreciation) — other investments | (79,754 | ) | ||
Temporary book/tax differences | (226,365 | ) | ||
Shares of beneficial interest | 1,294,451,952 | |||
Total net assets | $ | 1,584,183,114 | ||
The difference between book-basis and tax-basis unrealized appreciation (depreciation) is due to differences in the timing of recognition of gains and losses on investments for tax and book purposes. The Fund’s net unrealized appreciation difference is attributable primarily to passive foreign investment companies and wash sales.
The temporary book/tax differences are a result of timing differences between book and tax recognition of income and/or expenses. The Fund’s temporary book/tax differences are the result of the trustee deferral of compensation and retirement plan benefits.
Capital loss carryforward is calculated and reported as of a specific date. Results of transactions and other activity after that date may affect the amount of capital loss carryforward actually available for the Fund to utilize. Capital losses generated in years beginning after December 22, 2010 can be carried forward for an unlimited period, whereas previous losses expire in eight tax years. Capital losses with an expiration period may not be used to offset capital gains until all net capital losses without an expiration date have been utilized. Capital loss carryforwards with no expiration date will retain their character as either short-term or long-term capital losses instead of as short-term capital losses as under prior law. The ability to utilize capital loss carryforwards in the future may be limited under the Internal Revenue Code and related regulations based on the results of future transactions.
The Fund does not have a capital loss carryforward as of October 31, 2015.
NOTE 8—Investment Securities
The aggregate amount of investment securities (other than short-term securities, U.S. Treasury obligations and money market funds, if any) purchased and sold by the Fund during the year ended October 31, 2015 was $196,256,988 and $393,894,849, respectively. Cost of investments on a tax basis includes the adjustments for financial reporting purposes as of the most recently completed federal income tax reporting period-end.
| Unrealized Appreciation (Depreciation) of Investment Securities on a Tax Basis | ||||
Aggregate unrealized appreciation of investment securities | $ | 324,498,810 | ||
Aggregate unrealized (depreciation) of investment securities | (107,308,330 | ) | ||
Net unrealized appreciation of investment securities | $ | 217,190,480 | ||
Cost of investments for tax purposes is $1,359,791,698.
NOTE 9—Reclassification of Permanent Differences
Primarily as a result of differing book/tax treatment of passive foreign investment companies and foreign currency transactions, on October 31, 2015, undistributed net investment income was increased by $2,596,352 and undistributed net realized gain was decreased by $2,596,352. This reclassification had no effect on the net assets of the Fund.
19 Invesco European Growth Fund
NOTE 10—Share Information
| Summary of Share Activity | ||||||||||||||||
| Years ended October 31, | ||||||||||||||||
| 2015(a) | 2014 | |||||||||||||||
| Shares | Amount | Shares | Amount | |||||||||||||
Sold: | ||||||||||||||||
Class A | 4,654,916 | $ | 170,740,866 | 6,165,588 | $ | 243,448,178 | ||||||||||
Class B | 20,364 | 694,603 | 35,238 | 1,296,324 | ||||||||||||
Class C | 1,328,418 | 45,715,887 | 1,603,861 | 59,196,274 | ||||||||||||
Class R | 121,174 | 4,437,729 | 168,060 | 6,615,797 | ||||||||||||
Class Y | 7,599,065 | 278,772,181 | 15,858,930 | 622,152,874 | ||||||||||||
Investor Class | 590,425 | 21,781,441 | 474,978 | 18,621,091 | ||||||||||||
Issued as reinvestment of dividends: | ||||||||||||||||
Class A | 801,716 | 27,330,500 | 384,642 | 14,469,995 | ||||||||||||
Class B | 13,788 | 439,987 | 8,937 | 314,423 | ||||||||||||
Class C | 146,579 | 4,683,191 | 44,935 | 1,582,625 | ||||||||||||
Class R | 26,937 | 915,848 | 12,556 | 468,963 | ||||||||||||
Class Y | 987,757 | 33,692,395 | 373,625 | 14,003,465 | ||||||||||||
Investor Class | 289,107 | 9,826,733 | 152,084 | 5,678,807 | ||||||||||||
Automatic conversion of Class B shares to Class A shares: | ||||||||||||||||
Class A | 92,918 | 3,406,347 | 73,141 | 2,879,386 | ||||||||||||
Class B | (99,558 | ) | (3,406,347 | ) | (78,092 | ) | (2,879,386 | ) | ||||||||
Reacquired: | ||||||||||||||||
Class A | (4,081,743 | ) | (148,820,861 | ) | (5,015,693 | ) | (196,059,407 | ) | ||||||||
Class B | (38,169 | ) | (1,299,575 | ) | (57,078 | ) | (2,104,571 | ) | ||||||||
Class C | (776,008 | ) | (26,275,516 | ) | (493,096 | ) | (17,754,026 | ) | ||||||||
Class R | (163,463 | ) | (5,966,854 | ) | (159,903 | ) | (6,229,032 | ) | ||||||||
Class Y | (10,945,885 | ) | (393,956,737 | ) | (10,851,267 | ) | (423,408,821 | ) | ||||||||
Investor Class | (675,275 | ) | (24,463,874 | ) | (1,004,014 | ) | (39,199,503 | ) | ||||||||
Net increase (decrease) in share activity | (106,937 | ) | $ | (1,752,056 | ) | 7,697,432 | $ | 303,093,456 | ||||||||
| (a) | There are entities that are record owners of more than 5% of the outstanding shares of the Fund and in the aggregate own 48% of the outstanding shares of the Fund. IDI has an agreement with these entities to sell Fund shares. The Fund, Invesco and/or Invesco affiliates may make payments to these entities, which are considered to be related to the Fund, for providing services to the Fund, Invesco and/or Invesco affiliates including but not limited to services such as securities brokerage, distribution, third party record keeping and account servicing. The Fund has no knowledge as to whether all or any portion of the shares owned of record by these entities are also owned beneficially. |
20 Invesco European Growth Fund
NOTE 11—Financial Highlights
The following schedule presents financial highlights for a share of the Fund outstanding throughout the periods indicated.
| Net asset value, beginning of period | Net investment income(a) | Net gains on securities (both | Total from investment operations | Dividends from net investment income | Distributions from net realized gains | Total distributions | Net asset value, end of period(b) | Total return(c) | Net assets, end of period (000’s omitted) | Ratio of expenses to average net assets with fee waivers and/or expenses absorbed | Ratio of expenses to average net assets without fee waivers and/or expenses absorbed | Ratio of net to average | Portfolio turnover(d) | |||||||||||||||||||||||||||||||||||||||||||
Class A |
| |||||||||||||||||||||||||||||||||||||||||||||||||||||||
Year ended 10/31/15 | $ | 37.50 | $ | 0.52 | $ | 0.88 | $ | 1.40 | $ | (0.69 | ) | $ | (1.56 | ) | $ | (2.25 | ) | $ | 36.65 | 4.18 | % | $ | 575,258 | 1.37 | %(e) | 1.38 | %(e) | 1.41 | %(e) | 14 | % | |||||||||||||||||||||||||
Year ended 10/31/14 | 39.17 | 0.54 | (1.02 | ) | (0.48 | ) | (0.45 | ) | (0.74 | ) | (1.19 | ) | 37.50 | (1.22 | ) | 533,550 | 1.34 | 1.36 | 1.38 | 18 | ||||||||||||||||||||||||||||||||||||
Year ended 10/31/13 | 32.84 | 0.48 | 7.06 | 7.54 | (0.60 | ) | (0.61 | ) | (1.21 | ) | 39.17 | 23.72 | 494,360 | 1.39 | 1.41 | 1.35 | 15 | |||||||||||||||||||||||||||||||||||||||
Year ended 10/31/12 | 30.13 | 0.59 | 3.07 | (f) | 3.66 | (0.95 | ) | — | (0.95 | ) | 32.84 | 12.64 | (f) | 377,331 | 1.47 | 1.48 | 1.94 | 14 | ||||||||||||||||||||||||||||||||||||||
Year ended 10/31/11 | 30.81 | 0.58 | (0.89 | )(f) | (0.31 | ) | (0.37 | ) | — | (0.37 | ) | 30.13 | (1.02 | )(f) | 362,913 | 1.44 | 1.45 | 1.84 | 21 | |||||||||||||||||||||||||||||||||||||
Class B |
| |||||||||||||||||||||||||||||||||||||||||||||||||||||||
Year ended 10/31/15 | 35.01 | 0.22 | 0.83 | 1.05 | (0.42 | ) | (1.56 | ) | �� | (1.98 | ) | 34.08 | 3.40 | 4,829 | 2.12 | (e) | 2.13 | (e) | 0.66 | (e) | 14 | |||||||||||||||||||||||||||||||||||
Year ended 10/31/14 | 36.71 | 0.23 | (0.94 | ) | (0.71 | ) | (0.25 | ) | (0.74 | ) | (0.99 | ) | 35.01 | (1.96 | ) | 8,586 | 2.09 | 2.11 | 0.63 | 18 | ||||||||||||||||||||||||||||||||||||
Year ended 10/31/13 | 30.87 | 0.20 | 6.64 | 6.84 | (0.39 | ) | (0.61 | ) | (1.00 | ) | 36.71 | 22.82 | 12,343 | 2.14 | 2.16 | 0.60 | 15 | |||||||||||||||||||||||||||||||||||||||
Year ended 10/31/12 | 28.27 | 0.34 | 2.90 | (f) | 3.24 | (0.64 | ) | — | (0.64 | ) | 30.87 | 11.80 | (f) | 15,089 | 2.22 | 2.23 | 1.19 | 14 | ||||||||||||||||||||||||||||||||||||||
Year ended 10/31/11 | 28.92 | 0.32 | (0.84 | )(f) | (0.52 | ) | (0.13 | ) | — | (0.13 | ) | 28.27 | (1.78 | )(f) | 21,177 | 2.19 | 2.20 | 1.09 | 21 | |||||||||||||||||||||||||||||||||||||
Class C |
| |||||||||||||||||||||||||||||||||||||||||||||||||||||||
Year ended 10/31/15 | 35.04 | 0.22 | 0.84 | 1.06 | (0.42 | ) | (1.56 | ) | (1.98 | ) | 34.12 | 3.42 | 115,058 | 2.12 | (e) | 2.13 | (e) | 0.66 | (e) | 14 | ||||||||||||||||||||||||||||||||||||
Year ended 10/31/14 | 36.74 | 0.23 | (0.94 | ) | (0.71 | ) | (0.25 | ) | (0.74 | ) | (0.99 | ) | 35.04 | (1.96 | ) | 93,680 | 2.09 | 2.11 | 0.63 | 18 | ||||||||||||||||||||||||||||||||||||
Year ended 10/31/13 | 30.90 | 0.20 | 6.64 | 6.84 | (0.39 | ) | (0.61 | ) | (1.00 | ) | 36.74 | 22.80 | 55,760 | 2.14 | 2.16 | 0.60 | 15 | |||||||||||||||||||||||||||||||||||||||
Year ended 10/31/12 | 28.30 | 0.34 | 2.90 | (f) | 3.24 | (0.64 | ) | — | (0.64 | ) | 30.90 | 11.79 | (f) | 38,282 | 2.22 | 2.23 | 1.19 | 14 | ||||||||||||||||||||||||||||||||||||||
Year ended 10/31/11 | 28.95 | 0.32 | (0.84 | )(f) | (0.52 | ) | (0.13 | ) | — | (0.13 | ) | 28.30 | (1.78 | )(f) | 41,078 | 2.19 | 2.20 | 1.09 | 21 | |||||||||||||||||||||||||||||||||||||
Class R |
| |||||||||||||||||||||||||||||||||||||||||||||||||||||||
Year ended 10/31/15 | 37.33 | 0.42 | 0.89 | 1.31 | (0.60 | ) | (1.56 | ) | (2.16 | ) | 36.48 | 3.93 | 15,280 | 1.62 | (e) | 1.63 | (e) | 1.16 | (e) | 14 | ||||||||||||||||||||||||||||||||||||
Year ended 10/31/14 | 39.02 | 0.44 | (1.01 | ) | (0.57 | ) | (0.38 | ) | (0.74 | ) | (1.12 | ) | 37.33 | (1.46 | ) | 16,210 | 1.59 | 1.61 | 1.13 | 18 | ||||||||||||||||||||||||||||||||||||
Year ended 10/31/13 | 32.73 | 0.39 | 7.04 | 7.43 | (0.53 | ) | (0.61 | ) | (1.14 | ) | 39.02 | 23.42 | 16,137 | 1.64 | 1.66 | 1.10 | 15 | |||||||||||||||||||||||||||||||||||||||
Year ended 10/31/12 | 30.00 | 0.51 | 3.07 | (f) | 3.58 | (0.85 | ) | — | (0.85 | ) | 32.73 | 12.36 | (f) | 13,204 | 1.72 | 1.73 | 1.69 | 14 | ||||||||||||||||||||||||||||||||||||||
Year ended 10/31/11 | 30.68 | 0.50 | (0.89 | )(f) | (0.39 | ) | (0.29 | ) | — | (0.29 | ) | 30.00 | (1.28 | )(f) | 14,911 | 1.69 | 1.70 | 1.59 | 21 | |||||||||||||||||||||||||||||||||||||
Class Y |
| |||||||||||||||||||||||||||||||||||||||||||||||||||||||
Year ended 10/31/15 | 37.62 | 0.61 | 0.88 | 1.49 | (0.79 | ) | (1.56 | ) | (2.35 | ) | 36.76 | 4.46 | 695,157 | 1.12 | (e) | 1.13 | (e) | 1.66 | (e) | 14 | ||||||||||||||||||||||||||||||||||||
Year ended 10/31/14 | 39.28 | 0.64 | (1.03 | ) | (0.39 | ) | (0.53 | ) | (0.74 | ) | (1.27 | ) | 37.62 | (0.98 | ) | 800,278 | 1.09 | 1.11 | 1.63 | 18 | ||||||||||||||||||||||||||||||||||||
Year ended 10/31/13 | 32.92 | 0.57 | 7.07 | 7.64 | (0.67 | ) | (0.61 | ) | (1.28 | ) | 39.28 | 24.01 | 624,166 | 1.14 | 1.16 | 1.60 | 15 | |||||||||||||||||||||||||||||||||||||||
Year ended 10/31/12 | 30.22 | 0.67 | 3.08 | (f) | 3.75 | (1.05 | ) | — | (1.05 | ) | 32.92 | 12.96 | (f) | 260,860 | 1.22 | 1.23 | 2.19 | 14 | ||||||||||||||||||||||||||||||||||||||
Year ended 10/31/11 | 30.91 | 0.66 | (0.91 | )(f) | (0.25 | ) | (0.44 | ) | — | (0.44 | ) | 30.22 | (0.80 | )(f) | 215,716 | 1.19 | 1.20 | 2.09 | 21 | |||||||||||||||||||||||||||||||||||||
Investor Class |
| |||||||||||||||||||||||||||||||||||||||||||||||||||||||
Year ended 10/31/15 | 37.42 | 0.52 | 0.88 | 1.40 | (0.70 | ) | (1.56 | ) | (2.26 | ) | 36.56 | 4.21 | (g) | 178,602 | 1.35 | (e)(g) | 1.36 | (e)(g) | 1.43 | (e)(g) | 14 | |||||||||||||||||||||||||||||||||||
Year ended 10/31/14 | 39.08 | 0.55 | (1.02 | ) | (0.47 | ) | (0.45 | ) | (0.74 | ) | (1.19 | ) | 37.42 | (1.19 | )(g) | 175,148 | 1.31 | (g) | 1.33 | (g) | 1.41 | (g) | 18 | |||||||||||||||||||||||||||||||||
Year ended 10/31/13 | 32.78 | 0.48 | 7.04 | 7.52 | (0.61 | ) | (0.61 | ) | (1.22 | ) | 39.08 | 23.74 | 197,655 | 1.38 | 1.40 | 1.36 | 15 | |||||||||||||||||||||||||||||||||||||||
Year ended 10/31/12 | 30.07 | 0.61 | 3.07 | (f) | 3.68 | (0.97 | ) | — | (0.97 | ) | 32.78 | 12.75 | (f) | 155,575 | 1.41 | 1.42 | 2.00 | 14 | ||||||||||||||||||||||||||||||||||||||
Year ended 10/31/11 | 30.76 | 0.60 | (0.92 | )(f) | (0.32 | ) | (0.37 | ) | — | (0.37 | ) | 30.07 | (1.03 | )(f) | 153,892 | 1.38 | 1.39 | 1.90 | 21 | |||||||||||||||||||||||||||||||||||||
| (a) | Calculated using average shares outstanding. |
| (b) | Includes redemption fees added to shares of beneficial interest which were less than $0.005 per share for fiscal years ended October 31, 2012 and prior. |
| (c) | Includes adjustments in accordance with accounting principles generally accepted in the United States of America and as such, the net asset value for financial reporting purposes and the returns based upon those net asset values may differ from the net asset value and returns for shareholder transactions. Does not include sales charges and is not annualized for periods less than one year, if applicable. |
| (d) | Portfolio turnover is calculated at the fund level and is not annualized for periods less than one year, if applicable. |
| (e) | Ratios are based on average daily net assets (000’s omitted) of $545,823, $6,483, $101,949, $15,619, $674,642 and $175,371 for Class A, Class B, Class C, Class R, Y and Investor Class shares, respectively. |
| (f) | Includes litigation proceeds received during the period. Had the litigation proceeds not been received Net gains (losses) on securities (both realized and unrealized) per share, for the year ended October 31, 2012, would have been $2.96, $2.79, $2.79, $2.95, $2.97 and $2.96 for Class A, Class B, Class C, Class R, Class Y and Investor Class shares, respectively, and total returns would have been lower. Net gains (losses) on securities (both realized and unrealized) per share, for the year ended October 31, 2011, would have been $(1.11), $(1.06), $(1.06), $(1.11), $(1.13) and $(1.14) for Class A, Class B, Class C, Class R, Class Y and Investor Class shares, respectively, and total returns would have been lower. |
| (g) | The total return, ratio of expenses to average net assets and ratio of net investment income (loss) to average net assets reflect actual 12b-1 fees of 0.22% for the year ended October 31, 2015 and 0.21% for the year ended October 31, 2014. |
21 Invesco European Growth Fund
Report of Independent Registered Public Accounting Firm
To the Board of Trustees of AIM International Mutual Funds (Invesco International Mutual Funds)
and Shareholders of Invesco European Growth Fund:
In our opinion, the accompanying statement of assets and liabilities, including the schedule of investments, and the related statements of operations and of changes in net assets and the financial highlights present fairly, in all material respects, the financial position of Invesco European Growth Fund (one of the funds constituting AIM International Mutual Funds (Invesco International Mutual Funds), hereafter referred to as the “Fund”) at October 31, 2015, the results of its operations for the year then ended, the changes in its net assets for each of the two years in the period then ended and the financial highlights for each of the five years in the period then ended, in conformity with accounting principles generally accepted in the United States of America. These financial statements and financial highlights (hereafter referred to as “financial statements”) are the responsibility of the Fund’s management. Our responsibility is to express an opinion on these financial statements based on our audits. We conducted our audits of these financial statements in accordance with the standards of the Public Company Accounting Oversight Board (United States). Those standards require that we plan and perform the audit to obtain reasonable assurance about whether the financial statements are free of material misstatement. An audit includes examining, on a test basis, evidence supporting the amounts and disclosures in the financial statements, assessing the accounting principles used and significant estimates made by management, and evaluating the overall financial statement presentation. We believe that our audits, which included confirmation of securities at October 31, 2015 by correspondence with the custodian, provide a reasonable basis for our opinion.
PRICEWATERHOUSECOOPERS LLP
December 23, 2015
Houston, Texas
22 Invesco European Growth Fund
Calculating your ongoing Fund expenses
Example
As a shareholder of the Fund, you incur two types of costs: (1) transaction costs, which may include sales charges (loads) on purchase payments or contingent deferred sales charges on redemptions, if any; and (2) ongoing costs, including management fees, distribution and/or service (12b-1) fees, and other Fund expenses. This example is intended to help you understand your ongoing costs (in dollars) of investing in the Fund and to compare these costs with ongoing costs of investing in other mutual funds. The example is based on an investment of $1,000 invested at the beginning of the period and held for the entire period May 1, 2015 through October 31, 2015.
Actual expenses
The table below provides information about actual account values and actual expenses. You may use the information in this table, together with the amount you invested, to estimate the expenses that you paid over the period. Simply divide your account value by $1,000 (for example, an $8,600 account value divided by $1,000 = 8.6), then multiply the result by the number in the table under the heading entitled “Actual Expenses Paid During Period” to estimate the expenses you paid on your account during this period.
Hypothetical example for comparison purposes
The table below also provides information about hypothetical account values and hypothetical expenses based on the Fund’s actual expense ratio and an assumed rate of return of 5% per year before expenses, which is not the Fund’s actual return.
The hypothetical account values and expenses may not be used to estimate the actual ending account balance or expenses you paid for the period. You may use this information to compare the ongoing costs of investing in the Fund and other funds. To do so, compare this 5% hypothetical example with the 5% hypothetical examples that appear in the shareholder reports of the other funds.
Please note that the expenses shown in the table are meant to highlight your ongoing costs only and do not reflect any transaction costs, such as sales charges (loads) on purchase payments or contingent deferred sales charges on redemptions, if any. Therefore, the hypothetical information is useful in comparing ongoing costs only, and will not help you determine the relative total costs of owning different funds. In addition, if these transaction costs were included, your costs would have been higher.
| Class | Beginning Account Value (05/01/15) | ACTUAL | HYPOTHETICAL (5% annual return before expenses) | Annualized Expense Ratio | ||||||||||||||||||||
| Ending Account Value (10/31/15)1 | Expenses Paid During Period2 | Ending Account Value (10/31/15) | Expenses Paid During Period2 | |||||||||||||||||||||
| A | $ | 1,000.00 | $ | 979.20 | $ | 6.73 | $ | 1,018.40 | $ | 6.87 | 1.35 | % | ||||||||||||
| B | 1,000.00 | 975.70 | 10.46 | 1,014.62 | 10.66 | 2.10 | ||||||||||||||||||
| C | 1,000.00 | 975.70 | 10.46 | 1,014.62 | 10.66 | 2.10 | ||||||||||||||||||
| R | 1,000.00 | 978.30 | 7.98 | 1,017.14 | 8.13 | 1.60 | ||||||||||||||||||
| Y | 1,000.00 | 980.50 | 5.49 | 1,019.66 | 5.60 | 1.10 | ||||||||||||||||||
| Investor | 1,000.00 | 979.40 | 6.64 | 1,018.50 | 6.77 | 1.33 | ||||||||||||||||||
| 1 | The actual ending account value is based on the actual total return of the Fund for the period May 1, 2015 through October 31, 2015, after actual expenses and will differ from the hypothetical ending account value which is based on the Fund’s expense ratio and a hypothetical annual return of 5% before expenses. |
| 2 | Expenses are equal to the Fund’s annualized expense ratio as indicated above multiplied by the average account value over the period, multiplied by 184/365 to reflect the most recent fiscal half year. |
23 Invesco European Growth Fund
Approval of Investment Advisory and Sub-Advisory Contracts
The Board of Trustees (the Board) of AIM International Mutual Funds (Invesco International Mutual Funds) is required under the Investment Company Act of 1940, as amended, to approve annually the renewal of Invesco European Growth Fund’s (the Fund) investment advisory agreements. During contract renewal meetings held on June 9-10, 2015, the Board as a whole, and the disinterested or “independent” Trustees, who comprise over 75% of the Board, voting separately, approved the continuance for the Fund of the Master Investment Advisory Agreement with Invesco Advisers, Inc. (Invesco Advisers and the investment advisory agreement) and the Master Intergroup Sub-Advisory Contract for Mutual Funds with Invesco Asset Management Deutschland GmbH, Invesco Asset Management Limited, Invesco Asset Management (Japan) Limited, Invesco Hong Kong Limited, Invesco Senior Secured Management, Inc. and Invesco Canada Ltd. (collectively, the Affiliated Sub-Advisers and the sub-advisory contracts) for another year, effective July 1, 2015.
In evaluating the fairness and reasonableness of compensation under the Fund’s investment advisory agreement and sub-advisory contracts, the Board considered, among other things, the factors discussed below. The Board determined that continuation of the Fund’s investment advisory agreement and the sub-advisory contracts is in the best interest of the Fund and its shareholders and that the compensation payable to Invesco Advisers and the Affiliated Sub-Advisers under the agreements is fair and reasonable.
The Board’s Fund Evaluation Process
The Board’s Investments Committee has established three Sub-Committees, each of which is primarily responsible for overseeing the performance and investment management services provided by Invesco Advisers and the Affiliated Sub-Advisers to a number of the funds advised by Invesco Advisers (the Invesco Funds). The Sub-Committees meet throughout the year to review the performance of their assigned Invesco Funds, including reviewing materials prepared under the direction of the independent Senior Officer, an officer of the Invesco Funds who reports directly to the independent Trustees. Over the course of each year, the Sub-Committees meet with portfolio managers for their assigned Invesco Funds and other members of management to review the performance, investment objective(s), policies, strategies, limitations and investment risks of these funds. The Board had the benefit of reports from the Sub-Committees and Investments Committee throughout the year in considering approval of the continuance of each Invesco Fund’s investment advisory agreement and sub-advisory contracts for another year.
During the contract renewal process, the Board receives comparative performance and fee data regarding the Invesco Funds prepared by Invesco Advisers and Lipper Inc. (Lipper), an independent provider of investment company data. The Board also receives a report and this independent written evaluation from the Senior Officer. The Senior Officer’s evaluation is prepared as part of his responsibility to manage the process by which the Invesco Funds’ proposed management fees are negotiated during the annual contract renewal process to ensure they are negotiated in a manner that is at arms’ length and reasonable. In addition to meetings with Invesco Advisers and fund counsel, the independent Trustees also discuss the continuance of the investment advisory agreement and sub-advisory contracts in separate sessions with the Senior Officer and with independent legal counsel.
The Trustees recognized that the advisory fee rates for the Invesco Funds are, in many cases, the result of years of review and negotiation. The Trustees’ deliberations and conclusions in a particular year may be based in part on their deliberations and conclusions regarding these arrangements throughout the year and in prior years. The Trustees’ review and conclusions are based on the comprehensive consideration of all information presented to them and are not the result of any single determinative factor. Moreover, one Trustee may have weighed a particular piece of information or factor differently than another Trustee.
The discussion below is a summary of the Senior Officer’s independent written evaluation with respect to the Fund’s investment advisory agreement as well as a discussion of the material factors and related conclusions that formed the basis for the Board’s approval of the Fund’s investment advisory agreement and sub-advisory contracts. Unless otherwise stated, this information is current as of June 10, 2015, and does not reflect consideration of factors that became known to the Board after that date.
Factors and Conclusions and Summary of Independent Written Fee Evaluation
| A. | Nature, Extent and Quality of Services Provided by Invesco Advisers and the Affiliated Sub-Advisers |
The Board reviewed the advisory services provided to the Fund by Invesco Advisers under the Fund’s investment advisory agreement, the performance of Invesco Advisers in providing these services, and the credentials and experience of the officers and employees of Invesco Advisers who provide these services, including the Fund’s portfolio manager or managers. The Board’s review of the qualifications of Invesco Advisers to provide advisory services included the Board’s consideration of Invesco Advisers’ investment
process oversight, independent credit analysis and investment risk management. The Board also considered non-advisory services that Invesco Advisers and its affiliates provide to the Invesco Funds such as various back office support functions, equity and fixed income trading operations, internal audit, distribution, valuation and legal and compliance.
In determining whether to continue the Fund’s investment advisory agreement, the Board considered the benefits of reapproving an existing relationship and the greater uncertainty that may be associated with entering into a new relationship. The Board concluded that the nature, extent and quality of the services provided to the Fund by Invesco Advisers are appropriate and satisfactory and consistent with the terms of the Fund’s investment advisory agreement.
The Board reviewed the services that may be provided by the Affiliated Sub-Advisers under the sub-advisory contracts and the credentials and experience of the officers and employees of the Affiliated Sub-Advisers who provide these services. The Board noted that the Affiliated Sub-Advisers have offices and personnel that are located in financial centers around the world. As a result, the Affiliated Sub-Advisers can provide research and investment analysis on the markets and economies of various countries in which the Fund may invest, make recommendations regarding securities and assist with security trades. The Board concluded that the sub-advisory contracts benefit the Fund and its shareholders by permitting Invesco Advisers to use the resources and talents of the Affiliated Sub-Advisers in managing the Fund. The Board concluded that the nature, extent and quality of the services that may be provided by the Affiliated Sub-Advisers are appropriate and satisfactory and consistent with the terms of the Fund’s sub-advisory contracts.
| B. | Fund Performance |
The Board considered Fund performance as a relevant factor in considering whether to approve the investment advisory agreement. The Board did not view Fund performance as a relevant factor in considering whether to approve the sub-advisory contracts for the Fund, as no Affiliated Sub-Adviser currently manages assets of the Fund.
The Board compared the Fund’s performance during the past one, three and five calendar years to the performance of funds in the Lipper performance universe and against the Lipper European Funds Index. The Board noted that performance of Class A shares of the Fund was in the second quintile of its performance universe for the one and five year periods and the fourth quintile for the three year period (the first quintile being the best performing funds and the fifth quintile being the worst performing funds). The Board noted that performance of Class A shares of the Fund was above the
24 Invesco European Growth Fund
performance of the Index for the one and five year periods and below the performance of the Index for the three year period. The Trustees also reviewed more recent Fund performance and this review did not change their conclusions.
| C. | Advisory and Sub-Advisory Fees |
The Board compared the Fund’s contractual management fee rate to the contractual management fee rates of funds in the Fund’s Lipper expense group at a common asset level. The Board noted that the contractual management fee rate for Class A shares of the Fund was above the median contractual management fee rate of funds in its expense group. The Board noted that the term “contractual management fee” may include both advisory and certain administrative services fees, but that Lipper does not provide information on a fund by fund basis as to what is included. The Board noted that Invesco Advisers does not charge the Invesco Funds for the administrative services included in the term as defined by Lipper. The Board also reviewed the methodology used by Lipper in providing expense group information, which includes using each fund’s contractual management fee schedule (including any applicable breakpoints) as reported in the most recent prospectus or statement of additional information for each fund in the expense group.
The Board also compared the Fund’s effective advisory fee rate (the advisory fee rate after advisory fee waivers and before other expense limitations/waivers) to the effective advisory fee rates of other funds advised by Invesco Advisers and its affiliates with investment strategies comparable to those of the Fund. The Board noted that the Fund’s rate was below the rates of two such funds. The Board noted that Invesco Advisers and the Affiliated Sub-Advisers do not manage other client accounts with investment strategies comparable to those of the Fund.
The Board also considered the services that may be provided by the Affiliated Sub-Advisers pursuant to the sub-advisory contracts, as well as the fees payable by Invesco Advisers to the Affiliated Sub-Advisers pursuant to the sub-advisory contracts. The Board also noted that the sub-advisory fees are not paid directly by the Fund, but rather, are payable by Invesco Advisers to the Affiliated Sub-Advisers.
| D. | Economies of Scale and Breakpoints |
The Board considered the extent to which there are economies of scale in the provision of advisory services to the Fund. The Board also considered whether the Fund benefits from economies of scale through contractual breakpoints in the Fund’s advisory fee schedule. The Board also noted that the Fund shares directly in economies of scale through lower fees charged by third party service providers based on the combined size of the Invesco Funds and other clients advised by Invesco Advisers.
| E. | Profitability and Financial Resources |
The Board reviewed information from Invesco Advisers concerning the costs of the advisory
and other services that Invesco Advisers and its affiliates provide to the Fund and the Invesco Funds and the profitability of Invesco Advisers and its affiliates in providing these services. The Board received information from Invesco Advisers about the methodology used to prepare the profitability information. The Board noted that Invesco Advisers continues to operate at a net profit from services Invesco Advisers and its affiliates provide to the Invesco Funds and the Fund. The Board did not deem the level of profits realized by Invesco Advisers and its affiliates from providing services to the Fund to be excessive given the nature, quality and extent of the services provided. The Board received and accepted information from Invesco Advisers demonstrating that Invesco Advisers and each Affiliated Sub-Adviser are financially sound and have the resources necessary to perform their obligations under the investment advisory agreement and sub-advisory contracts.
| F. | Collateral Benefits to Invesco Advisers and its Affiliates |
The Board considered various other benefits received by Invesco Advisers and its affiliates from the relationship with the Fund, including the fees received for providing transfer agency and distribution services to the Fund. The Board considered comparative information regarding fees charged for these services, including information provided by Lipper and other independent sources. The Board considered the performance of Invesco Advisers and its affiliates in providing these services and the organizational structure employed to provide these services. The Board also considered that these services are provided to the Fund pursuant to written contracts that are reviewed and approved on an annual basis by the Board; and that the services are required for the operation of the Fund.
The Board considered the benefits realized by Invesco Advisers and the Affiliated Sub-Advisers as a result of portfolio brokerage transactions executed through “soft dollar” arrangements. The Board noted that soft dollar arrangements shift the payment obligation for research services from Invesco Advisers and the Affiliated Sub-Advisers to the Invesco Funds and that the research received may be used with other clients of Invesco Advisers and may reduce Invesco Advisers’ and the Affiliated Sub-Advisers’ expenses. The Board also considered that it receives periodic reports from the Chief Compliance Officer of the Invesco Funds demonstrating that these arrangements are consistent with regulatory requirements. The Board did not deem the soft dollar arrangements to be inappropriate.
The Board considered that the Fund’s uninvested cash and cash collateral from any securities lending arrangements may be invested in money market funds advised by Invesco Advisers pursuant to procedures approved by the Board. The Board noted that Invesco Advisers receives advisory fees from these affiliated money market funds attributable to such investments, although
Invesco Advisers has contractually agreed to waive through varying periods the advisory fees payable by the Invesco Funds with respect to investments in the affiliated money market funds. The waiver is in an amount equal to 100% of the net advisory fee Invesco Advisers receives from the affiliated money market funds with respect to the Fund’s investment in the affiliated money market funds of uninvested cash, but not cash collateral. The Board concluded that the amount of advisory fees received by Invesco Advisors from the Fund’s investment of cash collateral from any securities lending arrangements in the affiliated money market funds is fair and reasonable.
The Board also considered the Fund may use an affiliated broker to execute certain trades for the Fund to, among other things, control information leakage, and were advised that such trades would be executed in compliance with rules under the Investment Company Act of 1940, as amended, and consistent with best execution obligations.
25 Invesco European Growth Fund
Tax Information
Form 1099-DIV, Form 1042-S and other year–end tax information provide shareholders with actual calendar year amounts that should be included in their tax returns. Shareholders should consult their tax advisors.
The following distribution information is being provided as required by the Internal Revenue Code or to meet a specific state’s requirement.
The Fund designates the following amounts or, if subsequently determined to be different, the maximum amount allowable for its fiscal year ended October 31, 2015:
Federal and State Income Tax | ||||
Long-Term Capital Gain Distributions | $ | 65,254,874 | ||
Qualified Dividend Income* | 100 | % | ||
Corporate Dividends Received Deduction* | 0 | % | ||
U.S. Treasury Obligations* | 0 | % | ||
Foreign Taxes | $ | 0.0476 | per share | |
Foreign Source Income | $ | 1.0161 | per share | |
| * | The above percentages are based on ordinary income dividends paid to shareholders during the Fund’s fiscal year. |
26 Invesco European Growth Fund
Trustees and Officers
The address of each trustee and officer is AIM International Mutual Funds (Invesco International Mutual Funds) (the “Trust”), 11 Greenway Plaza, Suite 1000, Houston, Texas 77046-1173. The trustees serve for the life of the Trust, subject to their earlier death, incapacitation, resignation, retirement or removal as more specifically provided in the Trust’s organizational documents. Each officer serves for a one year term or until their successors are elected and qualified. Column two below includes length of time served with predecessor entities, if any.
| Name, Year of Birth and Position(s) Held with the Trust | Trustee and/ or Officer Since | Principal Occupation(s) During Past 5 Years | Number of Funds in Fund Complex Overseen by Trustee | Other Directorship(s) Past 5 Years | ||||
| Interested Persons | ||||||||
Martin L. Flanagan1 — 1960 Trustee | 2007 | Executive Director, Chief Executive Officer and President, Invesco Ltd. (ultimate parent of Invesco and a global investment management firm); Advisor to the Board, Invesco Advisers, Inc. (formerly known as Invesco Institutional (N.A.), Inc.); Trustee, The Invesco Funds; Vice Chair, Investment Company Institute; and Member of Executive Board, SMU Cox School of Business
Formerly: Chairman and Chief Executive Officer, Invesco Advisers, Inc. (registered investment adviser); Director, Chairman, Chief Executive Officer and President, IVZ Inc. (holding company), INVESCO Group Services, Inc. (service provider) and Invesco North American Holdings, Inc. (holding company); Director, Chief Executive Officer and President, Invesco Holding Company Limited (parent of Invesco and a global investment management firm); Director, Invesco Ltd.; Chairman, Investment Company Institute and President, Co-Chief Executive Officer, Co-President, Chief Operating Officer and Chief Financial Officer, Franklin Resources, Inc. (global investment management organization). | 145 | None | ||||
Philip A. Taylor2 — 1954 Trustee, President and Principal Executive Officer | 2006 | Head of North American Retail and Senior Managing Director, Invesco Ltd.; Director, Co-Chairman, Co-President and Co-Chief Executive Officer, Invesco Advisers, Inc. (formerly known as Invesco Institutional (N.A.), Inc.) (registered investment adviser); Director, Chairman, Chief Executive Officer and President, Invesco Management Group, Inc. (formerly known as Invesco Aim Management Group, Inc.) (financial services holding company); Director and President, INVESCO Funds Group, Inc. (registered investment adviser and registered transfer agent); Director and Chairman, Invesco Investment Services, Inc. (formerly known as Invesco Aim Investment Services, Inc.) (registered transfer agent) and IVZ Distributors, Inc. (formerly known as INVESCO Distributors, Inc.) (registered broker dealer); Chief Executive Officer, Invesco Corporate Class Inc. (corporate mutual fund company) Director, Chairman and Chief Executive Officer, Invesco Canada Ltd. (formerly known as Invesco Trimark Ltd./Invesco Trimark Ltèe) (registered investment adviser and registered transfer agent); Trustee, President and Principal Executive Officer, The Invesco Funds (other than AIM Treasurer’s Series Trust (Invesco Treasurer’s Series Trust), Short-Term Investments Trust and Invesco Management Trust); Trustee and Executive Vice President, The Invesco Funds (AIM Treasurer’s Series Trust (Invesco Treasurer’s Series Trust), Short-Term Investments Trust and Invesco Management Trust only); Director, Invesco Investment Advisers LLC (formerly known as Van Kampen Asset Management); Director, Chief Executive Officer and President, Van Kampen Exchange Corp.
Formerly: Director, President and Chairman, Invesco Inc. (holding company), Invesco Canada Holdings Inc. (holding company), Trimark Investments Ltd./Placements Trimark Ltèe and Invesco Financial Services Ltd/Services Financiers Invesco Ltèe; Chiief Executive Officer, Invesco Canada Fund Inc (corporate mutual fund company); Director and Chairman, Van Kampen Investor Services Inc.; Director, Chief Executive Officer and President, 1371 Preferred Inc. (holding company) and Van Kampen Investments Inc.; Director and President, AIM GP Canada Inc. (general partner for limited partnerships) and Van Kampen Advisors, Inc.; Director and Chief Executive Officer, Invesco Trimark Dealer Inc. (registered broker dealer); Director, Invesco Distributors, Inc. (formerly known as Invesco Aim Distributors, Inc.) (registered broker dealer); Manager, Invesco PowerShares Capital Management LLC; Director, Chief Executive Officer and President, Invesco Advisers, Inc.; Director, Chairman, Chief Executive Officer and President, Invesco Aim Capital Management, Inc.; President, Invesco Trimark Dealer Inc. and Invesco Trimark Ltd./Invesco Trimark Ltèe; Director and President, AIM Trimark Corporate Class Inc. and AIM Trimark Canada Fund Inc.; Senior Managing Director, Invesco Holding Company Limited; Director and Chairman, Fund Management Company (former registered broker dealer); President and Principal Executive Officer, The Invesco Funds (AIM Treasurer’s Series Trust (Invesco Treasurer’s Series Trust), and Short-Term Investments Trust only); President, AIM Trimark Global Fund Inc. and AIM Trimark Canada Fund Inc.. | 145 | None |
| 1 | Mr. Flanagan is considered an interested person (within the meaning of Section 2(a)(19) of the 1940 Act) of the Trust because he is an officer of the Adviser to the Trust, and an officer and a director of Invesco Ltd., ultimate parent of the Adviser. |
| 2 | Mr. Taylor is considered an interested person (within the meaning of Section 2(a)(19) of the 1940 Act) of the Trust because he is an officer and a director of the Adviser. |
T-1 Invesco European Growth Fund
Trustees and Officers—(continued)
| Name, Year of Birth and Position(s) Held with the Trust | Trustee and/ or Officer Since | Principal Occupation(s) During Past 5 Years | Number of Funds in Fund Complex Overseen by Trustee | Other Directorship(s) Past 5 Years | ||||
| Independent Trustees | ||||||||
Bruce L. Crockett — 1944 Trustee and Chair | 2003 | Chairman, Crockett Technologies Associates (technology consulting company)
Formerly: Director, Captaris (unified messaging provider); Director, President and Chief Executive Officer, COMSAT Corporation; Chairman, Board of Governors of INTELSAT (international communications company); ACE Limited (insurance company); Independent Directors Council and Investment Company Institute | 145 | ALPS (Attorneys Liability Protection Society) (insurance company) and Globe Specialty Metals, Inc. (metallurgical company) | ||||
David C. Arch — 1945 Trustee | 2010 | Chairman of Blistex Inc., a consumer health care products manufacturer | 145 | Board member of the Illinois Manufacturers’ Association; Member of the Board of Visitors, Institute for the Humanities, University of Michigan; Member of the Audit Committee of the Edward-Elmhurst Hospital | ||||
James T. Bunch — 1942 Trustee | 2000 | Managing Member, Grumman Hill Group LLC (family office/private equity investments)
Formerly: Founder, Green Manning & Bunch Ltd. (investment banking firm) (1988-2010); Executive Committee, United States Golf Association; and Chairman, Board of Governors, Western Golf Association | 145 | Chairman of the Board of Trustees, Evans Scholars Foundation; and Chairman of the Board, Denver Film Society | ||||
Rodney F. Dammeyer — 1940 Trustee | 2010 | Chairman of CAC, LLC, (private company offering capital investment and management advisory services)
Formerly: Prior to 2001, Managing Partner at Equity Group Corporate Investments; Prior to 1995, Chief Executive Officer of Itel Corporation (formerly Anixter International); Prior to 1985, experience includes Senior Vice President and Chief Financial Officer of Household International, Inc., Executive Vice President and Chief Financial Officer of Northwest Industries, Inc. and Partner of Arthur Andersen & Co.; From 1987 to 2010, Director/Trustee of investment companies in the Van Kampen Funds complex | 145 | Director of Quidel Corporation and Stericycle, Inc. | ||||
Albert R. Dowden — 1941 Trustee | 2003 | Director of a number of public and private business corporations, including the Boss Group, Ltd. (private investment and management); Nature’s Sunshine Products, Inc. and Reich & Tang Funds (5 portfolios) (registered investment company)
Formerly: Director, Homeowners of America Holding Corporation/Homeowners of America Insurance Company (property casualty company); Director, Continental Energy Services, LLC (oil and gas pipeline service); Director, CompuDyne Corporation (provider of product and services to the public security market) and Director, Annuity and Life Re (Holdings), Ltd. (reinsurance company); Director, President and Chief Executive Officer, Volvo Group North America, Inc.; Senior Vice President, AB Volvo; Director of various public and private corporations; Chairman, DHJ Media, Inc.; Director, Magellan Insurance Company; and Director, The Hertz Corporation, Genmar Corporation (boat manufacturer), National Media Corporation; Advisory Board of Rotary Power International (designer, manufacturer, and seller of rotary power engines); and Chairman, Cortland Trust, Inc. (registered investment company) | 145 | Director of: Nature’s Sunshine Products, Inc., Reich & Tang Funds, Homeowners of America Holding Corporation/ Homeowners of America Insurance Company, the Boss Group | ||||
Jack M. Fields — 1952 Trustee | 2003 | Chief Executive Officer, Twenty First Century Group, Inc. (government affairs company); Owner and Chief Executive Officer, Dos Angeles Ranch, L.P. (cattle, hunting, corporate entertainment); and Discovery Global Education Fund (non-profit)
Formerly: Chief Executive Officer, Texana Timber LP (sustainable forestry company); Director of Cross Timbers Quail Research Ranch (non-profit); and member of the U.S. House of Representatives | 145 | Insperity, Inc. (formerly known as Administaff) | ||||
Prema Mathai-Davis — 1950 Trustee | 2003 | Retired. Formerly: Chief Executive Officer, YWCA of the U.S.A. | 145 | None | ||||
Larry Soll — 1942 Trustee | 1997 | Retired. Formerly: Chairman, Chief Executive Officer and President, Synergen Corp. (a biotechnology company) | 145 | None | ||||
Hugo F. Sonnenschein — 1940 Trustee | 2010 | President Emeritus and Honorary Trustee of the University of Chicago and the Adam Smith Distinguished Service Professor in the Department of Economics at the University of Chicago. Prior to 2000, President of the University of Chicago | 145 | Trustee of the University of Rochester and a member of its investment committee; Member of the National Academy of Sciences and the American Philosophical Society; Fellow of the American Academy of Arts and Sciences | ||||
Raymond Stickel, Jr. — 1944 Trustee | 2005 | Retired. Formerly: Director, Mainstay VP Series Funds, Inc. (25 portfolios) and Partner, Deloitte & Touche | 145 | None |
T-2 Invesco European Growth Fund
Trustees and Officers—(continued)
| Name, Year of Birth and Position(s) Held with the Trust | Trustee and/ or Officer Since | Principal Occupation(s) During Past 5 Years | Number of Funds in Fund Complex Overseen by Trustee | Other Directorship(s) Past 5 Years | ||||
| Independent Trustees—(continued) | ||||||||
Suzanne H. Woolsey — 1941 Trustee | 2014 | Chief Executive Officer of Woolsey Partners LLC | 145 | Emeritus Chair of the Board of Trustees of the Institute for Defense Analyses; Trustee of Colorado College; Trustee of California Institute of Technology; Prior to 2014, Director of Fluor Corp.; Prior to 2010, Trustee of the German Marshall Fund of the United States; Prior to 2010 Trustee of the Rocky Mountain Institute | ||||
| Other Officers | ||||||||
Russell C. Burk — 1958 Senior Vice President and Senior Officer | 2005 | Senior Vice President and Senior Officer, The Invesco Funds | N/A | N/A | ||||
John M. Zerr — 1962 Senior Vice President, Chief Legal Officer and Secretary | 2006 | Director, Senior Vice President, Secretary and General Counsel, Invesco Management Group, Inc. (formerly known as Invesco Aim Management Group, Inc.) and Van Kampen Exchange Corp.; Senior Vice President, Invesco Advisers, Inc. (formerly known as Invesco Institutional (N.A.), Inc.) (registered investment adviser); Senior Vice President and Secretary, Invesco Distributors, Inc. (formerly known as Invesco Aim Distributors, Inc.); Director, Vice President and Secretary, Invesco Investment Services, Inc. (formerly known as Invesco Aim Investment Services, Inc.) and IVZ Distributors, Inc. (formerly known as INVESCO Distributors, Inc.); Director and Vice President, INVESCO Funds Group, Inc.; Senior Vice President, Chief Legal Officer and Secretary, The Invesco Funds; Managing Director, Invesco PowerShares Capital Management LLC; Director, Secretary and General Counsel, Invesco Investment Advisers LLC (formerly known as Van Kampen Asset Management); Secretary and General Counsel, Invesco Capital Markets, Inc. (formerly known as Van Kampen Funds Inc.) and Chief Legal Officer, PowerShares Exchange-Traded Fund Trust, PowerShares Exchange-Traded Fund Trust II, PowerShares India Exchange-Traded Fund Trust, PowerShares Actively Managed Exchange-Traded Fund Trust, and PowerShares Actively Managed Exchange-Traded Commodity Fund Trust
Formerly: Director and Vice President, Van Kampen Advisors Inc.; Director, Vice President, Secretary and General Counsel, Van Kampen Investor Services Inc.; Director, Invesco Distributors, Inc. (formerly known as Invesco Aim Distributors, Inc.); Director, Senior Vice President, General Counsel and Secretary, Invesco Aim Advisers, Inc. and Van Kampen Investments Inc.; Director, Vice President and Secretary, Fund Management Company; Director, Senior Vice President, Secretary, General Counsel and Vice President, Invesco Aim Capital Management, Inc.; Chief Operating Officer and General Counsel, Liberty Ridge Capital, Inc. (an investment adviser); Vice President and Secretary, PBHG Funds (an investment company) and PBHG Insurance Series Fund (an investment company); Chief Operating Officer, General Counsel and Secretary, Old Mutual Investment Partners (a broker-dealer); General Counsel and Secretary, Old Mutual Fund Services (an administrator) and Old Mutual Shareholder Services (a shareholder servicing center); Executive Vice President, General Counsel and Secretary, Old Mutual Capital, Inc. (an investment adviser); and Vice President and Secretary, Old Mutual Advisors Funds (an investment company) | N/A | N/A | ||||
Sheri Morris — 1964 Vice President, Treasurer and Principal Financial Officer | 2003 | Vice President, Treasurer and Principal Financial Officer, The Invesco Funds; Vice President, Invesco Advisers, Inc. (formerly known as Invesco Institutional (N.A.), Inc.) (registered investment adviser); and Vice President, PowerShares Exchange-Traded Fund Trust, PowerShares Exchange-Traded Fund Trust II, PowerShares India Exchange-Traded Fund Trust, PowerShares Actively Managed Exchange-Traded Fund Trust, and PowerShares Actively Managed Exchange-Traded Commodity Fund Trust
Formerly: Vice President, Invesco Aim Advisers, Inc., Invesco Aim Capital Management, Inc. and Invesco Aim Private Asset Management, Inc.; Assistant Vice President and Assistant Treasurer, The Invesco Funds and Assistant Vice President, Invesco Advisers, Inc., Invesco Aim Capital Management, Inc. and Invesco Aim Private Asset Management, Inc.; and Treasurer, PowerShares Exchange-Traded Fund Trust, PowerShares Exchange-Traded Fund Trust II, PowerShares India Exchange-Traded Fund Trust and PowerShares Actively Managed Exchange-Traded Fund Trust | N/A | N/A | ||||
T-3 Invesco European Growth Fund
Trustees and Officers—(continued)
| Name, Year of Birth and Position(s) Held with the Trust | Trustee and/ or Officer Since | Principal Occupation(s) During Past 5 Years | Number of Funds in Fund Complex Overseen by Trustee | Other Directorship(s) Past 5 Years | ||||
| Other Officers—(continued) | ||||||||
Karen Dunn Kelley — 1960 Vice President | 2003 | Senior Managing Director, Investments, Invesco Ltd.; Director, Co-President, Co-Chief Executive Officer, and Co-Chairman, Invesco Advisers, Inc. (formerly known as Invesco Institutional (N.A.), Inc.) (registered investment adviser); Chairman, Invesco Senior Secured Management, Inc.; Senior Vice President, Invesco Management Group, Inc. (formerly known as Invesco Aim Management Group, Inc.); Executive Vice President, Invesco Distributors, Inc. (formerly known as Invesco Aim Distributors, Inc.); Director, Invesco Mortgage Capital Inc. and Invesco Management Company Limited; Vice President, The Invesco Funds (other than AIM Treasurer’s Series Trust (Invesco Treasurer’s Series Trust), Short-Term Investments Trust and Invesco Management Trust); and President and Principal Executive Officer, The Invesco Funds (AIM Treasurer’s Series Trust (Invesco Treasurer’s Series Trust), Short-Term Investments Trust and Invesco Management Trust only)
Formerly: Director and President, INVESCO Asset Management (Bermuda) Ltd., Director, INVESCO Global Asset Management Limited and INVESCO Management S.A.; Senior Vice President, Van Kampen Investments Inc. and Invesco Advisers, Inc. (formerly known as Invesco Institutional (N.A.), Inc.) (registered investment adviser); Vice President, Invesco Advisers, Inc. (formerly known as Invesco Institutional (N.A.), Inc.); Director of Cash Management and Senior Vice President, Invesco Advisers, Inc. and Invesco Aim Capital Management, Inc.; Director and President, Fund Management Company; Chief Cash Management Officer, Director of Cash Management, Senior Vice President, and Managing Director, Invesco Aim Capital Management, Inc.; Director of Cash Management, Senior Vice President, and Vice President, Invesco Advisers, Inc. and The Invesco Funds (AIM Treasurer’s Series Trust (Invesco Treasurer’s Series Trust), and Short-Term Investments Trust only) | N/A | N/A | ||||
Crissie M. Wisdom — 1969 Anti-Money Laundering Compliance Officer | 2013 | Anti-Money Laundering Compliance Officer, Invesco Advisers, Inc. (formerly known as Invesco Institutional (N.A.), Inc.) (registered investment adviser), Invesco Capital Markets, Inc. (formerly known as Van Kampen Funds Inc.), Invesco Distributors, Inc., Invesco Investment Services, Inc., Invesco Management Group, Inc., Van Kampen Exchange Corp., The Invesco Funds, and PowerShares Exchange-Traded Fund Trust, PowerShares Exchange-Traded Fund Trust II, PowerShares India Exchange-Traded Fund Trust, PowerShares Actively Managed Exchange-Traded Fund Trust and PowerShares Actively Managed Exchange-Traded Commodity Fund Trust; Anti-Money Laundering Compliance Officer and Bank Secrecy Act Officer, INVESCO National Trust Company and Invesco Trust Company; and Fraud Prevention Manager and Controls and Risk Analysis Manager for Invesco Investment Services, Inc.. | N/A | N/A | ||||
Lisa O. Brinkley — 1959 Chief Compliance Officer | 2015 | Senior Vice President and Chief Compliance Officer, Invesco Advisers, Inc. (registered investment adviser) (formerly known as Invesco Institutional (N.A., Inc.); and Chief Compliance Officer, The Invesco Funds
Formerly: Global Assurance Officer, Invesco Ltd. and Vice President, The Invesco Funds; Chief Compliance Officer, Invesco Distributors, Inc. (formerly known as Invesco Aim Distributors, Inc.), Invesco Investment Services, Inc.(formerly known as Invesco Aim Investment Services, Inc.) and Van Kampen Investor Services Inc.; Senior Vice President, Invesco Management Group, Inc.; Senior Vice President and Chief Compliance Officer, Invesco Advisers, Inc. and The Invesco Funds; Vice President and Chief Compliance Officer, Invesco Aim Capital Management, Inc. and Invesco Distributors, Inc.; Vice President, Invesco Investment Services, Inc. and Fund Management Company. | N/A | N/A |
The Statement of Additional Information of the Trust includes additional information about the Fund’s Trustees and is available upon request, without charge, by calling 1.800.959.4246. Please refer to the Fund’s prospectus for information on the Fund’s sub-advisers.
Office of the Fund 11 Greenway Plaza, Suite 1000 Houston, TX 77046-1173 | Investment Adviser Invesco Advisers, Inc. 1555 Peachtree Street, N.E. Atlanta, GA 30309 | Distributor Invesco Distributors, Inc. 11 Greenway Plaza, Suite 1000 Houston, TX 77046-1173 | Auditors PricewaterhouseCoopers LLP 1000 Louisiana Street, Suite 5800 Houston, TX 77002-5678 | |||
Counsel to the Fund Stradley Ronon Stevens & Young, LLP 2005 Market Street, Suite 2600 Philadelphia, PA 19103-7018 | Counsel to the Independent Trustees Goodwin Procter LLP 901 New York Avenue, N.W. Washington, D.C. 20001 | Transfer Agent Invesco Investment Services, Inc. 11 Greenway Plaza, Suite 1000 Houston, TX 77046-1173 | Custodian State Street Bank and Trust Company 225 Franklin Street Boston, MA 02110-2801 | |||
T-4 Invesco European Growth Fund

Invesco mailing information
Send general correspondence to Invesco Investment Services, Inc., P.O. Box 219078, Kansas City, MO 64121-9078.
Important notice regarding delivery of security holder documents
To reduce Fund expenses, only one copy of most shareholder documents may be mailed to shareholders with multiple accounts at the same address (Householding). Mailing of your shareholder documents may be householded indefinitely unless you instruct us otherwise. If you do not want the mailing of these documents to be combined with those for other members of your household, please contact Invesco Investment Services, Inc. at 800 959 4246 or contact your financial institution. We will begin sending you individual copies for each account within 30 days after receiving your request.
Fund holdings and proxy voting information
The Fund provides a complete list of its holdings four times in each fiscal year, at the quarter ends. For the second and fourth quarters, the lists appear in the Fund’s semiannual and annual reports to shareholders. For the first and third quarters, the Fund files the lists with the Securities and Exchange Commission (SEC) on Form N-Q. The most recent list of portfolio holdings is available at invesco.com/completeqtrholdings. Shareholders can also look up the Fund’s Forms N-Q on the SEC website at sec.gov. Copies of the Fund’s Forms N-Q may be reviewed and copied at the SEC Public Reference Room in Washington, D.C. You can obtain information on the operation of the Public Reference Room, including information about duplicating fee charges, by calling 202 551 8090 or 800 732 0330, or by electronic request at the following email address: publicinfo@sec.gov. The SEC file numbers for the Fund are shown below.
A description of the policies and procedures that the Fund uses to determine how to vote proxies relating to portfolio securities is available without charge, upon request, from our Client Services department at 800 959 4246 or at invesco.com/proxyguidelines. The information is also available on the SEC website, sec.gov.
Information regarding how the Fund voted proxies related to its portfolio securities during the most recent 12-month period ended June 30 is available at invesco.com/proxysearch. The information is also available on the SEC website, sec.gov. Invesco Advisers, Inc. is an investment adviser; it provides investment advisory services to individual and institutional clients and does not sell securities. Invesco Distributors, Inc. is the US distributor for Invesco Ltd.’s retail mutual funds, exchange-traded funds and institutional money market funds. Both are wholly owned, indirect subsidiaries of Invesco Ltd. |  |
SEC file numbers: 811-06463 and 033-44611 EGR-AR-1 Invesco Distributors, Inc.
| ||||
 | Annual Report to Shareholders
| October 31, 2015 | ||
| ||||
Invesco Global Growth Fund
| ||||
| Nasdaq: | ||||
| A: AGGAX n B: AGGBX n C: AGGCX n Y: AGGYX n R5: GGAIX n R6: AGGFX | ||||

Letters to Shareholders
Philip Taylor | Dear Shareholders: This annual report includes information about your Fund, including performance data and a complete list of its investments as of the close of the reporting period. Inside is a discussion of how your Fund was managed and the factors that affected its performance during the reporting period. I hope you find this report of interest. The US economy expanded and unemployment declined throughout the reporting period. Continuing low energy prices benefited consumers, but a strong US dollar crimped corporate profits. The US Federal Reserve signaled that it was increasingly likely to raise interest rates, based on generally positive economic data, but uncertainty remained about when it might act. Overseas, the story was much different. Low energy prices hurt the economies of some oil-producing nations, such as Brazil and Russia. During the reporting period, the European Central | |
Bank as well as central banks in China and Japan – among other countries – either instituted or maintained extraordinarily accommodative monetary policies in response to economic weakness. Investor uncertainty, such as we saw for much of the reporting period – and market volatility, such as we saw at the end of the reporting period – are unfortunate facts of life when it comes to investing. Some investors use these things as excuses to delay saving and investing for their long-term financial goals. That’s why Invesco encourages investors to work with a professional financial adviser who can stress the importance of starting to save and invest early and the importance of adhering to a disciplined investment plan – when times are good and when they’re uncertain. A financial adviser who knows your unique financial situation, investment goals and risk tolerance can be an invaluable partner as you seek to achieve your financial goals. He or she can offer a long-term perspective when markets are volatile and time-tested advice and guidance when your financial situation or investment goals change. | ||

Timely information when and where you want it
Invesco’s efforts to help investors achieve their financial objectives include providing individual investors and financial professionals with timely information about the markets, the economy and investing – whenever and wherever they want it.
Our website, invesco.com/us, offers a wide range of market insights and investment perspectives. On the website, you’ll find detailed information about our funds, including prices, performance, holdings and portfolio manager commentaries. You can access information about your account by completing a simple, secure online registration. Click on the “Need to register” link in the “Account Access” box on our homepage to get started.
Invesco’s mobile apps for iPhone® and iPad® (both available free from the App StoreSM) allow you to obtain the same detailed information, monitor your account and create customizable watch lists. Also, they allow you to access investment insights from our investment leaders, market strategists, economists and retirement experts. You can sign up to be alerted when new commentary is added, and you can watch portfolio manager videos and have instant access to Invesco news and updates wherever you may be.
In addition to the resources accessible on our website and through our mobile app, you can obtain timely updates to help you stay informed about the markets, the economy and investing by connecting with Invesco on Twitter, LinkedIn or Facebook. You can access our blog at blog.invesco.us.com. Our goal is to provide you the information you want, when and where you want it.
Have questions?
For questions about your account, feel free to contact an Invesco client services representative at 800 959 4246. For Invesco-related questions or comments, please email me directly at phil@invesco.com.
All of us at Invesco look forward to serving your investment management needs for many years to come. Thank you for investing with us.
Sincerely,

Philip Taylor
Senior Managing Director, Invesco Ltd.
iPhone and iPad are trademarks of Apple Inc., registered in the US and other countries. App Store is a service mark of Apple Inc. Invesco Distributors, Inc. is not affiliated with Apple Inc.
2 Invesco Global Growth Fund
Bruce Crockett | Dear Fellow Shareholders: Among the many important lessons I’ve learned in more than 40 years in a variety of business endeavors is the value of a trusted advocate. As independent chair of the Invesco Funds Board, I can assure you that the members of the Board are strong advocates for the interests of investors in Invesco’s mutual funds. We work hard to represent your interests through oversight of the quality of the investment management services your funds receive and other matters important to your investment, including but not limited to: n Ensuring that Invesco offers a diverse lineup of mutual funds that your financial adviser can use to strive to meet your financial needs as your investment goals change over time. n Monitoring how the portfolio management teams of the Invesco funds are performing in light of changing economic and market conditions. |

| n | Assessing each portfolio management team’s investment performance within the context of the investment strategy described in the fund’s prospectus. |
| n | Monitoring for potential conflicts of interests that may impact the nature of the services that your funds receive. |
We believe one of the most important services we provide our fund shareholders is the annual review of the funds’ advisory and sub-advisory contracts with Invesco Advisers and its affiliates. This review is required by the Investment Company Act of 1940 and focuses on the nature and quality of the services Invesco provides as the adviser to the Invesco funds and the reasonableness of the fees that it charges for those services. Each year, we spend months carefully reviewing information received from Invesco and a variety of independent sources, such as performance and fee data prepared by Lipper Inc., an independent, third-party firm widely recognized as a leader in its field. We also meet with our independent legal counsel and other independent advisers to review and help us assess the information that we have received. Our goal is to assure that you receive quality investment management services for a reasonable fee.
I trust the measures outlined above provide assurance that you have a worthy advocate when it comes to choosing the Invesco Funds.
As always, please contact me at bruce@brucecrockett.com with any questions or concerns you may have. On behalf of the Board, we look forward to continuing to represent your interests and serving your needs.
Sincerely,

Bruce L. Crockett
Independent Chair
Invesco Funds Board of Trustees
3 Invesco Global Growth Fund
Management’s Discussion of Fund Performance
Performance summary
For the fiscal year ended October 31, 2015, Class A shares of Invesco Global Growth Fund (the Fund), at net asset value (NAV), underperformed the MSCI All Country World Growth Index, the Fund’s style-specific benchmark.
Your Fund’s long-term performance appears later in this report.
Fund vs. Indexes
Total returns, 10/31/14 to 10/31/15, at net asset value (NAV). Performance shown does not include applicable contingent deferred sales charges (CDSC) or front-end sales charges, which would have reduced performance.
Class A Shares | 0.02 | % | |||
Class B Shares | -0.70 | ||||
Class C Shares | -0.74 | ||||
Class Y Shares | 0.26 | ||||
Class R5 Shares | 0.42 | ||||
Class R6 Shares | 0.46 | ||||
| MSCI All Country World Index▼ (Broad Market Index) | -0.03 | ||||
| MSCI All Country World Growth Index▼ (Style-Specific Index) | 4.09 | ||||
| Lipper Global Multi-Cap Growth Funds Index¢ (Peer Group Index)* | 1.95 | ||||
| Lipper Global Large-Cap Growth Funds Index¢ (Former Peer Group Index)* | 4.34 |
Source(s): ▼FactSet Research Systems Inc.; ¢Lipper Inc.. * The Fund has elected to use the Lipper Global Multi-Cap Growth Funds Index to represent its peer group benchmark rather than the Lipper Global Large-Cap Growth Funds Index because the Lipper Global Multi-Cap Growth Funds Index more closely reflects the performance of the types of securities in which the Fund invests. | |||||
Market conditions and your Fund
International markets experienced increased volatility during the fiscal year ended October 31, 2015, driven largely by the continued slowdown in energy markets and the economic downturn in China. Developed markets were generally able to withstand these headwinds, even as more fragile emerging markets began to falter.
As the reporting period began in late 2014, international equity markets moved higher, although economic growth appeared to be somewhat stronger in the US than in the rest of the world. Equity markets globally were recovering from the initial crash of oil prices when OPEC added additional uncertainty by deciding to maintain high production despite low prices and slowing global growth. In this environment, commodity-based
economies and most currencies underperformed those of the US.
Global markets were rattled again amid growing concerns that Greece and the eurozone would fail to reach an agreement on a financial bailout plan. However, those fears subsided when a bailout was ultimately approved. The eurozone also benefited from generally positive economic data, which helped markets weather subsequent economic volatility.
In the summer of 2015, fears of a potential economic slowdown in China dominated headlines. The combination of a slowing Chinese economy, a sharp sell-off in domestic Chinese equities and the devaluation of China’s currency, the renminbi, contributed to a strong correction in global equity markets. Emerging markets, in particular, were hard hit by events in China and by continued weak commodity prices – as well as by the US
Federal Reserve’s decision to delay raising interest rates, which increased investor uncertainty and market volatility.
Fund holdings in the information technology and materials sectors outperformed those of the style-specific benchmark and were among the most significant contributors to the Fund’s relative performance. The Fund’s holdings in the consumer discretionary, financials and consumer staples sectors, however, underperformed those of the style-specific benchmark and were the most significant detractors from the Fund’s relative performance.
On a geographic basis, the Fund’s holdings in Germany and the UK outperformed those of the style-specific benchmark and were among the most significant contributors to Fund performance. The Fund’s holdings in Brazil and Canada, however, underperformed those of the style-specific benchmark over the reporting period and were among the most significant detractors from relative results. Although Fund holdings in the US delivered a positive return, the portfolio’s meaningful underweight allocation to the strong-performing US market detracted from relative performance.
From an individual securities perspective, Sky was one of the most significant contributors to Fund performance during the fiscal year. Sky, a British-based pan-European broadcasting company, reported solid results over the reporting period with revenues and margins beating consensus expectations. The company’s strong management team executed well and their cost discipline was clearly evident in their latest results. We believe the stock remained attractively valued given potential for good growth over the next three to five years.
As noted previously, the Fund’s financials exposure was a key area of absolute and relative weakness. The portfolio’s emerging market bank stocks,
| Portfolio Composition | ||||||
By sector
| % of total net assets | |||||
Consumer Discretionary | 25.1 | % | ||
Information Technology | 23.5 | |||
| Financials | 12.8 | |||
| Health Care | 11.3 | |||
| Consumer Staples | 8.8 | |||
| Industrials | 7.7 | |||
| Energy | 4.6 | |||
| Materials | 2.0 | |||
| Money Market Funds Plus Other Assets Less Liabilities | 4.2 |
| Top 10 Equity Holdings* | ||||
% of total net assets
| ||||
1. | Sky PLC | 2.0 | % | |||
2. | Apple Inc. | 2.0 | ||||
3. | Gilead Sciences, Inc. | 1.9 | ||||
4. | Teva Pharmaceutical Industries Ltd.–ADR | 1.9 | ||||
5. | Citrix Systems, Inc. | 1.5 | ||||
6. | EMC Corp. | 1.5 | ||||
7. | Cisco Systems, Inc. | 1.5 | ||||
8. | RELX PLC | 1.5 | ||||
9. | Comcast Corp.–Class A | 1.4 | ||||
10. | CGI Group Inc.–Class A | 1.4 |
Total Net Assets | $347.1 million | ||||
| Total Number of Holdings* | 97 | ||||
The Fund’s holdings are subject to change, and there is no assurance that the Fund will continue to hold any particular security.
*Excluding money market fund holdings.
Data presented here are as of October 31, 2015.
| 4 Invesco Global Growth Fund |
including Brazil-based Banco Bradesco and Thailand-based Kasikornbank, showed particular weakness. Banco Bradesco is one of the largest banking and financial services companies in Brazil. The bank was hurt by deterioration in credit quality, impacting profitability. Further concerns over additional deterioration led us to sell out of the company in the latter part of the reporting period.
As bottom-up investors, our primary focus is on finding high-quality growth companies that are trading at attractive valuations through a process we call earnings, quality and valuation (EQV). Macro and political movements are not our primary concern and do not drive our stock selection decisions.
Over the reporting period, we continued to look for opportunities to improve the growth potential and quality of the Fund’s portfolio by adding companies based on our EQV outlook for each company. As disconcerting as volatility may be, we believe it tends to create long-term opportunities for our shareholders. It’s rare to find a thriving business at a compelling valuation when everything is going right; those valuations typically occur when fear dominates the market. On a stock-by-stock basis, we saw the decline over the past year in broad global equities as a buying opportunity.
For example, the pullback in China allowed us to add a China-based beverage manufacturer, Kweichow Moutai, to the portfolio. Moutai is the premier brand in Chinese spirits and is an integral part of Chinese culture. The business was started during the Qing dynasty hundreds of years ago, and today, the company has a significant share of the high-end spirits market in China. The company had net cash on its books, an operating margin of approximately 70%1 and traded a significant discount to its own history and to global peers. The sell-off in China local shares provided us with an opportunity to initiate a new position in this company.
Additional companies we purchased for the portfolio over the fiscal year included (but not limited to) UK-based global multinational information and measurement company, Nielsen Holdings; Switzerland-based global luxury consumer goods holding company Cie Financière Richemont; US toy manufacturing company, Mattel and China-based meat processing company, WH Group.
We sold some of the Fund’s holdings with EQV characteristics that were no longer as compelling as when we first initiated Fund positions in them, including
(but not limited to) Brazilian bank, Banco Bradesco; Canada-based natural gas and oil company, Encana; US-based navigation and communications devices company Garmin and Japan-based manufacturer of construction, mining and industrial machinery, Komatsu.
As always, regardless of the macroeconomic environment, we remain focused on a bottom-up investment approach of identifying attractive companies that fit our EQV-focused investment process. We continue to look for high-quality growth companies that exhibit the following characteristics: strong organic revenue growth; high returns on capital; pricing power; strong balance sheets; cash generation; and reasonable valuations. In addition, we continue to favor companies that are able to consistently generate cash during weak economic environments. We believe that this balanced EQV-focused approach may help deliver attractive returns over the long term.
We thank you for your continued investment in Invesco Global Growth Fund.
| 1 | Source: Merrill Lynch |
The views and opinions expressed in management’s discussion of Fund performance are those of Invesco Advisers, Inc. These views and opinions are subject to change at any time based on factors such as market and economic conditions. These views and opinions may not be relied upon as investment advice or recommendations, or as an offer for a particular security. The information is not a complete analysis of every aspect of any market, country, industry, security or the Fund. Statements of fact are from sources considered reliable, but Invesco Advisers, Inc. makes no representation or warranty as to their completeness or accuracy. Although historical performance is no guarantee of future results, these insights may help you understand our investment management philosophy.
See important Fund and, if applicable, index disclosures later in this report.
 | Matthew Dennis Chartered Financial Analyst, Portfolio Manager, is lead manager of Invesco Global Growth Fund. He joined Invesco in 2000. | |
| Mr. Dennis earned a BA in economics from The University of Texas at Austin and an MS in finance from Texas A&M University. | ||
 | Ryan Amerman Chartered Financial Analyst, Portfolio Manager, is manager of Invesco Global Growth Fund. He joined Invesco in 1996. | |
| Mr. Amerman earned a BBA from Stephen F. Austin State University and an MBA from the University of St. Thomas. | ||
 | Mark Jason Chartered Financial Analyst, Portfolio Manager, is manager of Invesco Global Growth Fund. He joined Invesco in 2001. | |
| Mr. Jason earned a BS in finance and a BS in real estate from California State University, Northridge. | ||
| 5 Invesco Global Growth Fund |
Your Fund’s Long-Term Performance
Results of a $10,000 Investment – Oldest Share Class(es)
Fund and index data from 10/31/05
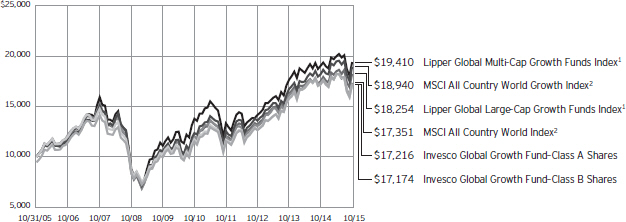
1 Source: Lipper Inc.
2 Source: FactSet Research Systems Inc.
Past performance cannot guarantee comparable future results.
During the reporting period, the Fund elected to use the Lipper Global Multi-Cap Growth Funds Index to represent its peer group benchmark rather than the Lipper Global Large-Cap Growth Funds Index because the Lipper Global Multi-Cap Growth Funds Index more closely reflects the performance of the types of securities in which the Fund invests. Because this is the first reporting period since we
have adopted the new index, SEC guidelines require that we compare performance to both the old and new indexes.
The data shown in the chart include reinvested distributions, applicable sales charges and Fund expenses including management fees. Results for Class B shares are calculated as if a hypothetical shareholder had liquidated his entire investment in the Fund at the close of the reporting period and paid the contingent deferred sales charges, if applicable.
Index results include reinvested dividends, but they do not reflect sales charges. Performance of the peer group, if applicable, reflects fund expenses and management fees; performance of a market index does not. Performance shown in the chart and table(s) does not reflect deduction of taxes a shareholder would pay on Fund distributions or sale of Fund shares.
| 6 Invesco Global Growth Fund |
Average Annual Total Returns As of 10/31/15, including maximum applicable | |||||
| Class A Shares | |||||
| Inception (9/15/94) | 6.40 | % | |||
| 10 Years | 5.58 | ||||
| 5 Years | 7.20 | ||||
| 1 Year | -5.48 | ||||
| Class B Shares | |||||
| Inception (9/15/94) | 6.47 | % | |||
| 10 Years | 5.56 | ||||
| 5 Years | 7.32 | ||||
| 1 Year | -5.26 | ||||
| Class C Shares | |||||
| Inception (8/4/97) | 3.69 | % | |||
| 10 Years | 5.39 | ||||
| 5 Years | 7.62 | ||||
| 1 Year | -1.65 | ||||
| Class Y Shares | |||||
| 10 Years | 6.37 | % | |||
| 5 Years | 8.69 | ||||
| 1 Year | 0.26 | ||||
| Class R5 Shares | |||||
| 10 Years | 6.63 | % | |||
| 5 Years | 8.90 | ||||
| 1 Year | 0.42 | ||||
| Class R6 Shares | |||||
| 10 Years | 6.33 | % | |||
| 5 Years | 8.73 | ||||
| 1 Year | 0.46 | ||||
Class Y shares incepted on October 3, 2008. Performance shown prior to that date is that of Class A shares and includes the 12b-1 fees applicable to Class A shares.
Class R5 shares incepted on September 28, 2007. Performance shown prior to that date is that of Class A shares and includes the 12b-1 fees applicable to Class A shares.
Class R6 shares incepted on September 24, 2012. Performance shown prior to that date is that of Class A shares and includes the 12b-1 fees applicable to Class A shares.
The performance data quoted represent past performance and cannot guarantee comparable future results; current performance may be lower or higher. Please visit invesco.com/performance for the most recent month-end performance. Performance figures reflect reinvested distributions, changes in net asset value and the effect of the maximum sales charge unless otherwise stated. Investment return and principal value will fluctuate
| Average Annual Total Returns As of 9/30/15, the most recent calendar quarter | |||||
| Class A Shares | |||||
| Inception (9/15/94) | 6.04 | % | |||
| 10 Years | 4.54 | ||||
| 5 Years | 6.57 | ||||
| 1 Year | -11.71 | ||||
| Class B Shares | |||||
| Inception (9/15/94) | 6.10 | % | |||
| 10 Years | 4.51 | ||||
| 5 Years | 6.68 | ||||
| 1 Year | -11.51 | ||||
| Class C Shares | |||||
| Inception (8/4/97) | 3.28 | % | |||
| 10 Years | 4.35 | ||||
| 5 Years | 6.99 | ||||
| 1 Year | -8.10 | ||||
| Class Y Shares | |||||
| 10 Years | 5.32 | % | |||
| 5 Years | 8.05 | ||||
| 1 Year | -6.33 | ||||
| Class R5 Shares | |||||
| 10 Years | 5.58 | % | |||
| 5 Years | 8.26 | ||||
| 1 Year | -6.19 | ||||
| Class R6 Shares | |||||
| 10 Years | 5.28 | % | |||
| 5 Years | 8.09 | ||||
| 1 Year | -6.16 | ||||
so that you may have a gain or loss when you sell shares.
The net annual Fund operating expense ratio set forth in the most recent Fund prospectus as of the date of this report for Class A, Class B, Class C, Class Y, Class R5 and Class R6 shares was 1.31%, 2.06%, 2.06%, 1.06%, 0.94% and 0.94%, respectively.1 The total annual Fund operating expense ratio set forth in the most recent Fund prospectus as of the date of this report for Class A, Class B, Class C, Class Y, Class R5 and Class R6 shares was 1.43%, 2.18%, 2.18%, 1.18%, 0.94% and 0.94%, respectively. The expense ratios presented above may vary from the expense ratios presented in other sections of this report that are based on expenses incurred during the period covered by this report.
Class A share performance reflects the maximum 5.50% sales charge, and Class B and Class C share performance reflects the applicable contingent deferred sales charge (CDSC) for the
period involved. The CDSC on Class B shares declines from 5% beginning at the time of purchase to 0% at the beginning of the seventh year. The CDSC on Class C shares is 1% for the first year after purchase. Class Y, Class R5 and Class R6 shares do not have a front-end sales charge or a CDSC; therefore, performance is at net asset value.
The performance of the Fund’s share classes will differ primarily due to different sales charge structures and class expenses.
Fund performance reflects any applicable fee waivers and/or expense reimbursements. Had the adviser not waived fees and/or reimbursed expenses currently or in the past, returns would have been lower. See current prospectus for more information.
| 1 | Total annual Fund operating expenses after any contractual fee waivers and/or expense reimbursements by the adviser in effect through at least February 28, 2017. See current prospectus for more information. |
| 7 Invesco Global Growth Fund |
Invesco Global Growth Fund’s investment objective is long-term growth of capital.
| n | Unless otherwise stated, information presented in this report is as of October 31, 2015, and is based on total net assets. |
| n | Unless otherwise noted, all data provided by Invesco. |
| n | To access your Fund’s reports/prospectus, visit invesco.com/fundreports. |
About share classes
| n | Class B shares may not be purchased for new or additional investments. Please see the prospectus for more information. |
| n | Class Y shares are available to only certain investors. Please see the prospectus for more information. |
| n | Class R5 shares and Class R6 shares are primarily intended for employer sponsored retirement and benefit plans that meet certain standards and for institutional investors. Please see the prospectus for more information. |
Principal risks of investing in the Fund
| n | Depositary receipts risk. Depositary receipts involve many of the same risks as those associated with direct investment in foreign securities. In addition, the underlying issuers of certain depositary receipts, particularly unsponsored or unregistered depositary receipts, are under no obligation to distribute shareholder communications to the holders of such receipts or to pass through to them any voting rights with respect to the deposited securities. |
| n | Derivatives risk. The value of a derivative instrument depends largely on (and is derived from) the value of an underlying security, currency, commodity, interest rate, index or other asset (each referred to as an underlying asset). In addition to risks relating to the underlying assets, the use of derivatives may include other, possibly greater, risks, including counterparty, leverage and liquidity risks. Counter party risk is the risk that the counter party to the derivative contract will default on its obligation to pay the Fund the amount owed or otherwise perform under the derivative contract. Derivatives create leverage risk because they do not require payment up front equal to the economic exposure created by owning the derivative. As a result, an adverse change in the value of the underlying asset could result in the Fund sustaining a loss that is substantially |
greater than the amount invested in the derivative, which may make the Fund’s returns more volatile and increase the risk of loss. Derivative instruments may also be less liquid than more traditional investments and the Fund may be unable to sell or close out its derivative positions at a desirable time or price. This risk may be more acute under adverse market conditions, during which the Fund may be most in need of liquidating its derivative positions. Derivatives may also be harder to value, less tax efficient and subject to changing government regulation that could impact the Fund’s ability to use certain derivatives or their cost. Also, derivatives used for hedging or to gain or limit exposure to a particular market segment may not provide the expected benefits, particularly during adverse market conditions.
| n | Developing/emerging markets securities risk. The prices of securities issued by foreign companies and governments located in developing/emerging markets countries may be affected more negatively by inflation, devaluation of their currencies, higher transaction costs, delays in settlement, adverse political developments, the introduction of capital controls, withholding taxes, nationalization of private assets, expropriation, social unrest, war or lack of timely information than those in developed countries. |
| n | Foreign securities risk. The Fund’s foreign investments may be affected by changes in a foreign country’s exchange rates, political and social instability, changes in economic or taxation policies, difficulties when enforcing obligations, decreased liquidity, and increased volatility. Foreign companies may be subject to less regulation resulting in less publicly available information about the companies. |
| n | Geographic focus risk. From time to time the Fund may invest a substantial amount of its assets in securities of issuers located in a single country or a limited number of countries. If the Fund |
focuses its investments in this manner, it assumes the risk that economic, political and social conditions in those countries will have a significant impact on its investment performance. The Fund’s investment performance may also be more volatile if it focuses its investments in certain countries, especially emerging markets countries.
| n | Growth investing risk. Growth stocks tend to be more expensive relative to their earnings or assets compared with other types of stock. As a result they tend to be more sensitive to changes in their earnings and can be more volatile. |
| n | Investing in the European Union risk. Many countries in the European Union are susceptible to high economic risks associated with high levels of debt, notably due to investments in sovereign debts of European countries such as Greece, Italy and Spain. One or more member states might exit the European Union, placing its currency and banking system in jeopardy. The European Union faces major issues involving its membership, structure, procedures and policies, including the adoption, abandonment or adjustment of the new constitutional treaty, the European Union’s enlargement to the south and east, and resolution of the European Union’s problematic fiscal and democratic accountability. Efforts of the member states to further unify their economic and monetary policies may increase the potential for the downward movement of one member state’s market to cause a similar effect on other member states’ markets. European countries that are part of the European Economic and Monetary Union may be significantly affected by the tight fiscal and monetary controls that the union seeks to impose on its members. |
| n | Management risk. The investment techniques and risk analysis used by the Fund’s portfolio managers may not produce the desired results. |
| n | Market risk. The prices of and the income generated by the Fund’s securities may decline in response to, among other things, investor sentiment, general economic and market conditions, regional or global instability, and currency and interest rate fluctuations. |
This report must be accompanied or preceded by a currently effective Fund prospectus, which contains more complete information, including sales charges and expenses. Investors should read it carefully before investing.
|
|
| NOT FDIC INSURED | MAY LOSE VALUE | NO BANK GUARANTEE |
8 Invesco Global Growth Fund |
| n | Mid-capitalization risk. Stocks of mid-sized companies tend to be more vulnerable to adverse developments and may have little or no operating history or track record of success, and limited product lines, markets, management and financial resources. The securities of mid-sized companies may be more volatile due to less market interest and less publicly available information about the issuer. They also may be illiquid or restricted as to resale, or may trade less frequently and in smaller volumes, all of which may cause difficulty when establishing or closing a position at a desirable price. |
| n | Preferred securities risk. Preferred securities may include provisions that permit the issuer, in its discretion, to defer or omit distributions for a certain period of time. If the Fund owns a security that is deferring or omitting its distributions, the Fund may be required to report the distribution on its tax returns, even though it may not have received this income. Further, preferred securities may lose substantial value due to the omission or deferment of dividend payments. |
About indexes used in this report
| n | The MSCI All Country World Index is a free float-adjusted market capitalization index that is designed to measure equity market performance of developed and emerging markets. The index is computed using the net return, which withholds applicable taxes for nonresident investors. |
| n | The MSCI All Country World Growth Index captures large- and mid-cap securities exhibiting overall growth style characteristics across 23 developed markets countries and 21 emerging markets countries. The index is computed using the net return, which with-holds applicable taxes for non-resident investors. |
| n | The Lipper Global Multi-Cap Growth Funds Index is an unmanaged index considered representative of global multi-cap growth funds tracked by Lipper. |
| n | The Lipper Global Large-Cap Growth Funds Index is an unmanaged index considered representative of global large-cap growth funds tracked by Lipper. |
| n | The Fund is not managed to track the performance of any particular index, including the index(es) described here, and consequently, the performance of the Fund may deviate significantly from the performance of the index(es). |
| n | A direct investment cannot be made in an index. Unless otherwise indicated, index results include reinvested dividends, and they do not reflect sales charges. Performance of the peer group, if applicable, reflects fund expenses; performance of a market index does not. |
Other information
| n | The returns shown in management’s discussion of Fund performance are based on net asset values (NAVs) calculated for shareholder transactions. Generally accepted accounting principles require adjustments to be made to the net assets of the Fund at period end for financial reporting purposes, and as such, the NAVs for shareholder transactions and the returns based on those NAVs may differ from the NAVs and returns reported in the Financial Highlights. |
| n | Industry classifications used in this report are generally according to the Global Industry Classification Standard, which was developed by and is the exclusive property and a service mark of MSCI Inc. and Standard & Poor’s. |
9 Invesco Global Growth Fund
Schedule of Investments
October 31, 2015
| Shares | Value | |||||||
Common Stocks & Other Equity Interests–95.86% |
| |||||||
| Australia–1.06% | ||||||||
Amcor Ltd. | 378,992 | $ | 3,666,985 | |||||
| Belgium–0.90% | ||||||||
Anheuser-Busch InBev SA/NV | 26,117 | 3,114,968 | ||||||
| Brazil–2.18% | ||||||||
BM&FBOVESPA S.A. | 1,342,831 | 3,971,430 | ||||||
BRF S.A. | 115,941 | 1,807,724 | ||||||
Cielo S.A. | 190,436 | 1,808,712 | ||||||
| 7,587,866 | ||||||||
| Canada–3.02% | ||||||||
Cenovus Energy Inc. | 150,658 | 2,244,259 | ||||||
CGI Group Inc.–Class A(a) | 126,178 | 4,686,446 | ||||||
Suncor Energy, Inc. | 119,685 | 3,561,171 | ||||||
| 10,491,876 | ||||||||
| China–4.69% | ||||||||
Baidu, Inc.–ADR(a) | 16,250 | 3,046,387 | ||||||
Great Wall Motor Co. Ltd.–Class H | 2,349,000 | 2,847,644 | ||||||
Industrial & Commercial Bank of China Ltd.–Class H | 3,044,000 | 1,931,593 | ||||||
Kweichow Moutai Co., Ltd.–Class A | 135,794 | 4,583,281 | ||||||
NetEase, Inc.–ADR | 26,668 | 3,854,326 | ||||||
| 16,263,231 | ||||||||
| Denmark–1.98% | ||||||||
Carlsberg A/S–Class B | 54,508 | 4,459,970 | ||||||
Novo Nordisk A/S–Class B | 45,515 | 2,411,293 | ||||||
| 6,871,263 | ||||||||
| France–1.67% | ||||||||
Publicis Groupe S.A. | 44,708 | 2,903,708 | ||||||
Schneider Electric S.E. | 47,790 | 2,889,796 | ||||||
| 5,793,504 | ||||||||
| Germany–3.38% | ||||||||
Deutsche Boerse AG | 49,647 | 4,572,481 | ||||||
ProSiebenSat.1 Media SE | 75,748 | 4,097,531 | ||||||
SAP S.E. | 38,921 | 3,076,566 | ||||||
| 11,746,578 | ||||||||
| Hong Kong–3.06% | ||||||||
CK Hutchison Holdings Ltd. | 340,732 | 4,654,650 | ||||||
Galaxy Entertainment Group Ltd. | 497,000 | 1,691,178 | ||||||
WH Group Ltd.(a)(b) | 7,732,500 | 4,265,305 | ||||||
| 10,611,133 | ||||||||
| Indonesia–0.55% | ||||||||
PT Bank Mandiri Persero Tbk | 3,020,000 | 1,910,226 | ||||||
| Shares | Value | |||||||
| Israel–2.63% | ||||||||
Check Point Software Technologies Ltd.(a) | 29,732 | $ | 2,525,436 | |||||
Teva Pharmaceutical Industries Ltd.–ADR | 111,663 | 6,609,333 | ||||||
| 9,134,769 | ||||||||
| Italy–0.47% | ||||||||
Prada S.p.A. | 400,900 | 1,629,338 | ||||||
| Japan–4.14% | ||||||||
FANUC Corp. | 14,600 | 2,569,277 | ||||||
Japan Tobacco, Inc. | 107,700 | 3,720,722 | ||||||
Keyence Corp. | 2,800 | 1,453,258 | ||||||
Toyota Motor Corp. | 42,100 | 2,577,807 | ||||||
Yahoo Japan Corp. | 954,300 | 4,035,699 | ||||||
| 14,356,763 | ||||||||
| Mexico–0.64% | ||||||||
Grupo Televisa S.A.B.–ADR | 76,636 | 2,233,173 | ||||||
| Singapore–1.92% | ||||||||
Avago Technologies Ltd. | 30,693 | 3,779,229 | ||||||
United Overseas Bank Ltd. | 199,900 | 2,900,969 | ||||||
| 6,680,198 | ||||||||
| South Korea–0.98% | ||||||||
Samsung Electronics Co., Ltd. | 2,830 | 3,388,593 | ||||||
| Spain–0.83% | ||||||||
Amadeus IT Holding S.A.–Class A | 67,961 | 2,892,004 | ||||||
| Sweden–2.65% | ||||||||
Getinge AB–Class B | 144,091 | 3,597,205 | ||||||
Sandvik AB | 169,053 | 1,581,248 | ||||||
Telefonaktiebolaget LM Ericsson–Class B | 413,629 | 4,022,609 | ||||||
| 9,201,062 | ||||||||
| Switzerland–5.81% | ||||||||
Cie Financiere Richemont S.A. | 29,337 | 2,509,630 | ||||||
Julius Baer Group Ltd. | 57,999 | 2,874,310 | ||||||
Novartis AG | 21,860 | 1,982,260 | ||||||
Roche Holding AG | 15,661 | 4,242,615 | ||||||
Swatch Group AG (The) | 5,679 | 2,217,405 | ||||||
Syngenta AG | 9,762 | 3,279,957 | ||||||
UBS Group AG | 154,068 | 3,075,337 | ||||||
| 20,181,514 | ||||||||
| Taiwan–1.32% | ||||||||
Taiwan Semiconductor Manufacturing Co. Ltd. | 1,085,428 | 4,569,125 | ||||||
| Thailand–0.94% | ||||||||
Kasikornbank PCL–NVDR | 672,500 | 3,246,564 | ||||||
See accompanying Notes to Financial Statements which are an integral part of the financial statements.
10 Invesco Global Growth Fund
| Shares | Value | |||||||
| Turkey–0.46% | ||||||||
Akbank T.A.S. | 621,710 | $ | 1,597,135 | |||||
| United Kingdom–12.30% | ||||||||
Aberdeen Asset Management PLC | 463,057 | 2,470,848 | ||||||
British American Tobacco PLC | 50,973 | 3,025,911 | ||||||
Compass Group PLC | 147,863 | 2,547,420 | ||||||
Kingfisher PLC | 614,332 | 3,339,235 | ||||||
Lloyds Banking Group PLC | 2,127,084 | 2,413,857 | ||||||
Next PLC | 23,015 | 2,832,968 | ||||||
RELX PLC | 281,410 | 5,030,883 | ||||||
Royal Dutch Shell PLC–Class B | 117,576 | 3,071,491 | ||||||
Sky PLC | 415,916 | 7,014,124 | ||||||
Smith & Nephew PLC | 217,910 | 3,719,514 | ||||||
Unilever N.V. | 59,559 | 2,684,727 | ||||||
WPP PLC | 202,547 | 4,540,218 | ||||||
| 42,691,196 | ||||||||
| United States–38.28% | ||||||||
Alphabet Inc.–Class A(a) | 6,119 | 4,512,089 | ||||||
Alphabet Inc.–Class C(a) | 4,506 | 3,202,910 | ||||||
Aon PLC | 25,002 | 2,332,937 | ||||||
Apple Inc. | 58,386 | 6,977,127 | ||||||
BB&T Corp. | 101,451 | 3,768,905 | ||||||
Cadence Design Systems, Inc.(a) | 197,422 | 4,386,717 | ||||||
Cameron International Corp.(a) | 66,125 | 4,497,161 | ||||||
Cardinal Health, Inc. | 20,130 | 1,654,686 | ||||||
Celgene Corp.(a) | 30,548 | 3,748,545 | ||||||
Cisco Systems, Inc. | 177,396 | 5,117,875 | ||||||
Citrix Systems, Inc.(a) | 63,107 | 5,181,085 | ||||||
Comcast Corp.–Class A | 77,539 | 4,855,492 | ||||||
Discovery Communications, Inc.–Class A(a) | 129,518 | 3,813,010 | ||||||
Dollar General Corp. | 55,787 | 3,780,685 | ||||||
EMC Corp. | 195,643 | 5,129,759 | ||||||
Expedia, Inc. | 23,472 | 3,199,234 | ||||||
| Shares | Value | |||||||
| United States–(continued) | ||||||||
Express Scripts Holding Co.(a) | 52,857 | $ | 4,565,788 | |||||
First Republic Bank | 47,774 | 3,120,120 | ||||||
Gilead Sciences, Inc. | 61,384 | 6,637,452 | ||||||
IHS Inc.–Class A(a) | 28,689 | 3,429,483 | ||||||
Ingersoll-Rand PLC | 61,819 | 3,663,394 | ||||||
JPMorgan Chase & Co. | 64,589 | 4,149,843 | ||||||
Kansas City Southern | 30,696 | 2,540,401 | ||||||
Kennametal Inc. | 73,723 | 2,073,091 | ||||||
Las Vegas Sands Corp. | 47,046 | 2,329,247 | ||||||
Macy’s, Inc. | 47,132 | 2,402,789 | ||||||
Mattel, Inc. | 178,014 | 4,375,584 | ||||||
Mead Johnson Nutrition Co. | 33,740 | 2,766,680 | ||||||
Microsoft Corp. | 76,286 | 4,015,695 | ||||||
Newell Rubbermaid Inc. | 103,446 | 4,389,214 | ||||||
Nielsen Holdings PLC | 72,441 | 3,441,672 | ||||||
Occidental Petroleum Corp. | 36,466 | 2,718,176 | ||||||
Priceline Group Inc. (The)(a) | 2,181 | 3,171,697 | ||||||
Scripps Networks Interactive Inc.–Class A | 51,784 | 3,111,183 | ||||||
Urban Outfitters, Inc.(a) | 132,372 | 3,785,839 | ||||||
| 132,845,565 | ||||||||
Total Common Stocks & Other Equity Interests |
| 332,704,629 | ||||||
Money Market Funds–3.83% |
| |||||||
Liquid Assets Portfolio–Institutional Class, 0.16%(c) | 6,648,443 | 6,648,443 | ||||||
Premier Portfolio–Institutional Class, 0.12%(c) | 6,648,442 | 6,648,442 | ||||||
Total Money Market Funds | 13,296,885 | |||||||
TOTAL INVESTMENTS–99.69% |
| 346,001,514 | ||||||
OTHER ASSETS LESS LIABILITIES–0.31% |
| 1,071,117 | ||||||
NET ASSETS–100.00% |
| $ | 347,072,631 | |||||
Investment Abbreviations:
| ADR | – American Depositary Receipt | |
| NVDR | – Non-Voting Depositary Receipt |
Notes to Schedule of Investments:
| (a) | Non-income producing security. |
| (b) | Security purchased or received in transaction exempt from registration under the Securities Act of 1933, as amended (the “1933 Act”). The security may be resold pursuant to an exemption from registration under the 1933 Act, typically to qualified institutional buyers. The value of this security at October 31, 2015 represented 1.23% of the Fund’s Net Assets. |
| (c) | The money market fund and the Fund are affiliated by having the same investment adviser. The rate shown is the 7-day SEC standardized yield as of October 31, 2015. |
See accompanying Notes to Financial Statements which are an integral part of the financial statements.
11 Invesco Global Growth Fund
Statement of Assets and Liabilities
October 31, 2015
Assets: |
| |||
Investments, at value (Cost $248,673,553) | $ | 332,704,629 | ||
Investments in affiliated money market funds, at value and cost | 13,296,885 | |||
Total investments, at value (Cost $261,970,438) | 346,001,514 | |||
Foreign currencies, at value (Cost $96,561) | 98,744 | |||
Receivable for: | ||||
Investments sold | 974,754 | |||
Fund shares sold | 813,925 | |||
Dividends | 574,912 | |||
Investment for trustee deferred compensation and retirement plans | 128,509 | |||
Other assets | 28,138 | |||
Total assets | 348,620,496 | |||
Liabilities: |
| |||
Payable for: | ||||
Investments purchased | 696,984 | |||
Fund shares reacquired | 281,375 | |||
Accrued fees to affiliates | 319,832 | |||
Accrued trustees’ and officers’ fees and benefits | 1,864 | |||
Accrued other operating expenses | 105,253 | |||
Trustee deferred compensation and retirement plans | 142,557 | |||
Total liabilities | 1,547,865 | |||
Net assets applicable to shares outstanding | $ | 347,072,631 | ||
Net assets consist of: |
| |||
Shares of beneficial interest | $ | 249,684,746 | ||
Undistributed net investment income | 1,534,201 | |||
Undistributed net realized gain | 11,837,367 | |||
Net unrealized appreciation | 84,016,317 | |||
| $ | 347,072,631 | |||
Net Assets: |
| |||
Class A | $ | 308,939,521 | ||
Class B | $ | 3,595,243 | ||
Class C | $ | 25,529,561 | ||
Class Y | $ | 7,723,684 | ||
Class R5 | $ | 10,970 | ||
Class R6 | $ | 1,273,652 | ||
Shares outstanding, $0.001 par value per share, |
| |||
Class A | 10,791,210 | |||
Class B | 135,962 | |||
Class C | 965,307 | |||
Class Y | 268,892 | |||
Class R5 | 384 | |||
Class R6 | 44,588 | |||
Class A: | ||||
Net asset value per share | $ | 28.63 | ||
Maximum offering price per share | ||||
(Net asset value of $28.63 ¸ 94.50%) | $ | 30.30 | ||
Class B: | ||||
Net asset value and offering price per share | $ | 26.44 | ||
Class C: | ||||
Net asset value and offering price per share | $ | 26.45 | ||
Class Y: | ||||
Net asset value and offering price per share | $ | 28.72 | ||
Class R5: | ||||
Net asset value and offering price per share | $ | 28.57 | ||
Class R6: | ||||
Net asset value and offering price per share | $ | 28.56 | ||
See accompanying Notes to Financial Statements which are an integral part of the financial statements.
12 Invesco Global Growth Fund
Statement of Operations
For the year ended October 31, 2015
Investment income: |
| |||
Dividends (net of foreign withholding taxes of $445,379) | $ | 6,837,685 | ||
Dividends from affiliated money market funds | 7,633 | |||
Total investment income | 6,845,318 | |||
Expenses: | ||||
Advisory fees | 2,792,502 | |||
Administrative services fees | 105,869 | |||
Custodian fees | 128,415 | |||
Distribution fees: | ||||
Class A | 784,872 | |||
Class B | 46,032 | |||
Class C | 259,037 | |||
Transfer Agent Fees — A, B, C and Y | 827,072 | |||
Transfer agent fees — R5 | 85 | |||
Transfer agent fees — R6 | 350 | |||
Trustees’ and officers’ fees and benefits | 26,107 | |||
Other | 235,465 | |||
Total expenses | 5,205,806 | |||
Less: Fees waived, expenses reimbursed and expense offset arrangement(s) | (58,031 | ) | ||
Net expenses | 5,147,775 | |||
Net investment income | 1,697,543 | |||
Realized and unrealized gain (loss) from: | ||||
Net realized gain (loss) from: | ||||
Investment securities (net of foreign taxes of $5,085) | 12,093,174 | |||
Foreign currencies | (59,201 | ) | ||
| 12,033,973 | ||||
Change in net unrealized appreciation (depreciation) of: | ||||
Investment securities (net of foreign taxes on holdings of $149,291) | (14,236,962 | ) | ||
Foreign currencies | 13,055 | |||
| (14,223,907 | ) | |||
Net realized and unrealized gain (loss) | (2,189,934 | ) | ||
Net increase (decrease) in net assets resulting from operations | $ | (492,391 | ) | |
See accompanying Notes to Financial Statements which are an integral part of the financial statements.
13 Invesco Global Growth Fund
Statement of Changes in Net Assets
For the years ended October 31, 2015 and 2014
| 2015 | 2014 | |||||||
Operations: |
| |||||||
Net investment income | $ | 1,697,543 | $ | 2,494,276 | ||||
Net realized gain | 12,033,973 | 27,985,355 | ||||||
Change in net unrealized appreciation (depreciation) | (14,223,907 | ) | 58,918 | |||||
Net increase (decrease) in net assets resulting from operations | (492,391 | ) | 30,538,549 | |||||
Distributions to shareholders from net investment income: | ||||||||
Class A | (1,810,977 | ) | (2,140,605 | ) | ||||
Class B | — | (4,867 | ) | |||||
Class C | — | (15,887 | ) | |||||
Class Y | (34,501 | ) | (30,510 | ) | ||||
Class R5 | (11,226 | ) | (9,515 | ) | ||||
Class R6 | (126 | ) | (139 | ) | ||||
Total distributions from net investment income | (1,856,830 | ) | (2,201,523 | ) | ||||
Distributions to shareholders from net realized gains: | ||||||||
Class A | (23,403,048 | ) | (10,686,960 | ) | ||||
Class B | (432,841 | ) | (275,973 | ) | ||||
Class C | (2,070,354 | ) | (900,875 | ) | ||||
Class Y | (326,031 | ) | (108,786 | ) | ||||
Class R5 | (84,043 | ) | (27,580 | ) | ||||
Class R6 | (944 | ) | (402 | ) | ||||
Total distributions from net realized gains | (26,317,261 | ) | (12,000,576 | ) | ||||
Share transactions–net: | ||||||||
Class A | 19,626,739 | (25,348,475 | ) | |||||
Class B | (1,557,277 | ) | (2,699,528 | ) | ||||
Class C | 1,958,192 | (384,084 | ) | |||||
Class Y | 3,756,458 | 1,053,144 | ||||||
Class R5 | (1,012,643 | ) | 240,932 | |||||
Class R6 | 1,319,044 | — | ||||||
Net increase (decrease) in net assets resulting from share transactions | 24,090,513 | (27,138,011 | ) | |||||
Net increase (decrease) in net assets | (4,575,969 | ) | (10,801,561 | ) | ||||
Net assets: | ||||||||
Beginning of year | 351,648,600 | 362,450,161 | ||||||
End of year (includes undistributed net investment income of $1,534,201 and $1,716,269, respectively) | $ | 347,072,631 | $ | 351,648,600 | ||||
Notes to Financial Statements
October 31, 2015
NOTE 1—Significant Accounting Policies
Invesco Global Growth Fund (the “Fund”) is a series portfolio of AIM International Mutual Funds (Invesco International Mutual Funds) (the “Trust”). The Trust is a Delaware statutory trust registered under the Investment Company Act of 1940, as amended (the “1940 Act”), as an open-end series management investment company consisting of eight separate portfolios, each authorized to issue an unlimited number of shares of beneficial interest. The assets, liabilities and operations of each portfolio are accounted for separately. Information presented in these financial statements pertains only to the Fund. Matters affecting each portfolio or class will be voted on exclusively by the shareholders of such portfolio or class.
The Fund’s investment objective is long-term growth of capital.
The Fund currently consists of six different classes of shares: Class A, Class B, Class C, Class Y, Class R5 and Class R6. Class A shares are sold with a front-end sales charge unless certain waiver criteria are met and under certain circumstances load waived shares may be subject to contingent deferred sales charges (“CDSC”). Class C shares are sold with a CDSC. Class Y, Class R5 and Class R6 shares are sold at net asset value. Effective November 30, 2010, new or additional investments in Class B shares are no longer permitted. Existing shareholders of Class B shares may continue to reinvest dividends and capital gains distributions in Class B shares until they convert to Class A shares. Also, shareholders in Class B shares will be
14 Invesco Global Growth Fund
able to exchange those shares for Class B shares of other Invesco Funds offering such shares until they convert to Class A shares. Generally, Class B shares will automatically convert to Class A shares on or about the month-end, which is at least eight years after the date of purchase. Redemption of Class B shares prior to the conversion date will be subject to a CDSC.
The following is a summary of the significant accounting policies followed by the Fund in the preparation of its financial statements.
| A. | Security Valuations — Securities, including restricted securities, are valued according to the following policy. |
A security listed or traded on an exchange (except convertible securities) is valued at its last sales price or official closing price as of the close of the customary trading session on the exchange where the security is principally traded, or lacking any sales or official closing price on a particular day, the security may be valued at the closing bid price on that day. Securities traded in the over-the-counter market are valued based on prices furnished by independent pricing services or market makers. When such securities are valued by an independent pricing service they may be considered fair valued. Futures contracts are valued at the final settlement price set by an exchange on which they are principally traded. Listed options are valued at the mean between the last bid and asked prices from the exchange on which they are principally traded. Options not listed on an exchange are valued by an independent source at the mean between the last bid and asked prices. For purposes of determining net asset value (“NAV”) per share, futures and option contracts generally are valued 15 minutes after the close of the customary trading session of the New York Stock Exchange (“NYSE”).
Investments in open-end and closed-end registered investment companies that do not trade on an exchange are valued at the end-of-day net asset value per share. Investments in open-end and closed-end registered investment companies that trade on an exchange are valued at the last sales price or official closing price as of the close of the customary trading session on the exchange where the security is principally traded.
Debt obligations (including convertible securities) and unlisted equities are fair valued using an evaluated quote provided by an independent pricing service. Evaluated quotes provided by the pricing service may be determined without exclusive reliance on quoted prices, and may reflect appropriate factors such as institution-size trading in similar groups of securities, developments related to specific securities, dividend rate (for unlisted equities), yield (for debt obligations), quality, type of issue, coupon rate (for debt obligations), maturity (for debt obligations), individual trading characteristics and other market data. Debt obligations are subject to interest rate and credit risks. In addition, all debt obligations involve some risk of default with respect to interest and/or principal payments.
Foreign securities’ (including foreign exchange contracts) prices are converted into U.S. dollar amounts using the applicable exchange rates as of the close of the NYSE. If market quotations are available and reliable for foreign exchange-traded equity securities, the securities will be valued at the market quotations. Because trading hours for certain foreign securities end before the close of the NYSE, closing market quotations may become unreliable. If between the time trading ends on a particular security and the close of the customary trading session on the NYSE, events occur that the Adviser determines are significant and make the closing price unreliable, the Fund may fair value the security. If the event is likely to have affected the closing price of the security, the security will be valued at fair value in good faith using procedures approved by the Board of Trustees. Adjustments to closing prices to reflect fair value may also be based on a screening process of an independent pricing service to indicate the degree of certainty, based on historical data, that the closing price in the principal market where a foreign security trades is not the current value as of the close of the NYSE. Foreign securities’ prices meeting the approved degree of certainty that the price is not reflective of current value will be priced at the indication of fair value from the independent pricing service. Multiple factors may be considered by the independent pricing service in determining adjustments to reflect fair value and may include information relating to sector indices, American Depositary Receipts and domestic and foreign index futures. Foreign securities may have additional risks including exchange rate changes, potential for sharply devalued currencies and high inflation, political and economic upheaval, the relative lack of issuer information, relatively low market liquidity and the potential lack of strict financial and accounting controls and standards.
Securities for which market prices are not provided by any of the above methods may be valued based upon quotes furnished by independent sources. The last bid price may be used to value equity securities. The mean between the last bid and asked prices is used to value debt obligations, including corporate loans.
Securities for which market quotations are not readily available or became unreliable are valued at fair value as determined in good faith by or under the supervision of the Trust’s officers following procedures approved by the Board of Trustees. Issuer specific events, market trends, bid/asked quotes of brokers and information providers and other market data may be reviewed in the course of making a good faith determination of a security’s fair value.
The Fund may invest in securities that are subject to interest rate risk, meaning the risk that the prices will generally fall as interest rates rise and, conversely, the prices will generally rise as interest rates fall. Specific securities differ in their sensitivity to changes in interest rates depending on their individual characteristics. Changes in interest rates may result in increased market volatility, which may affect the value and/or liquidity of certain Fund investments.
Valuations change in response to many factors including the historical and prospective earnings of the issuer, the value of the issuer’s assets, general economic conditions, interest rates, investor perceptions and market liquidity. Because of the inherent uncertainties of valuation, the values reflected in the financial statements may materially differ from the value received upon actual sale of those investments.
| B. | Securities Transactions and Investment Income — Securities transactions are accounted for on a trade date basis. Realized gains or losses on sales are computed on the basis of specific identification of the securities sold. Interest income (net of withholding tax, if any) is recorded on the accrual basis from settlement date. Dividend income (net of withholding tax, if any) is recorded on the ex-dividend date. |
The Fund may periodically participate in litigation related to Fund investments. As such, the Fund may receive proceeds from litigation settlements. Any proceeds received are included in the Statement of Operations as realized gain (loss) for investments no longer held and as unrealized gain (loss) for investments still held.
Brokerage commissions and mark ups are considered transaction costs and are recorded as an increase to the cost basis of securities purchased and/or a reduction of proceeds on a sale of securities. Such transaction costs are included in the determination of net realized and unrealized gain (loss) from investment securities reported in the Statement of Operations and the Statement of Changes in Net Assets and the net realized and unrealized gains (losses) on securities per share in the Financial Highlights. Transaction costs are included in the calculation of the Fund’s net asset value and, accordingly, they reduce the Fund’s total returns. These transaction costs are not considered operating expenses and are not reflected in net investment income reported in the Statement of Operations and the Statement of Changes in Net Assets, or the net
15 Invesco Global Growth Fund
investment income per share and the ratios of expenses and net investment income reported in the Financial Highlights, nor are they limited by any expense limitation arrangements between the Fund and the investment adviser.
The Fund allocates income and realized and unrealized capital gains and losses to a class based on the relative net assets of each class.
| C. | Country Determination — For the purposes of making investment selection decisions and presentation in the Schedule of Investments, the investment adviser may determine the country in which an issuer is located and/or credit risk exposure based on various factors. These factors include the laws of the country under which the issuer is organized, where the issuer maintains a principal office, the country in which the issuer derives 50% or more of its total revenues and the country that has the primary market for the issuer’s securities, as well as other criteria. Among the other criteria that may be evaluated for making this determination are the country in which the issuer maintains 50% or more of its assets, the type of security, financial guarantees and enhancements, the nature of the collateral and the sponsor organization. Country of issuer and/or credit risk exposure has been determined to be the United States of America, unless otherwise noted. |
| D. | Distributions — Distributions from net investment income and net realized capital gain, if any, are generally declared and paid annually and recorded on the ex-dividend date. The Fund may elect to treat a portion of the proceeds from redemptions as distributions for federal income tax purposes. |
| E. | Federal Income Taxes — The Fund intends to comply with the requirements of Subchapter M of the Internal Revenue Code of 1986, as amended (the “Internal Revenue Code”), necessary to qualify as a regulated investment company and to distribute substantially all of the Fund’s taxable earnings to shareholders. As such, the Fund will not be subject to federal income taxes on otherwise taxable income (including net realized capital gain) that is distributed to shareholders. Therefore, no provision for federal income taxes is recorded in the financial statements. |
The Fund recognizes the tax benefits of uncertain tax positions only when the position is more likely than not to be sustained. Management has analyzed the Fund’s uncertain tax positions and concluded that no liability for unrecognized tax benefits should be recorded related to uncertain tax positions. Management is not aware of any tax positions for which it is reasonably possible that the total amounts of unrecognized tax benefits will change materially in the next 12 months.
The Fund files tax returns in the U.S. Federal jurisdiction and certain other jurisdictions. Generally, the Fund is subject to examinations by such taxing authorities for up to three years after the filing of the return for the tax period.
| F. | Expenses — Fees provided for under the Rule 12b-1 plan of a particular class of the Fund are charged to the operations of such class. Transfer agency fees and expenses and other shareholder recordkeeping fees and expenses attributable to Class R5 and Class R6 are allocated to each share class based on relative net assets. Sub-accounting fees attributable to Class R5 are charged to the operations of the class. Transfer agency fees and expenses and other shareholder recordkeeping fees and expenses relating to all other classes are allocated among those classes based on relative net assets. All other expenses are allocated among the classes based on relative net assets. |
| G. | Accounting Estimates — The preparation of financial statements in conformity with accounting principles generally accepted in the United States of America (“GAAP”) requires management to make estimates and assumptions that affect the reported amounts of assets and liabilities at the date of the financial statements and the reported amounts of revenues and expenses during the reporting period including estimates and assumptions related to taxation. Actual results could differ from those estimates by a significant amount. In addition, the Fund monitors for material events or transactions that may occur or become known after the period-end date and before the date the financial statements are released to print. |
| H. | Indemnifications — Under the Trust’s organizational documents, each Trustee, officer, employee or other agent of the Trust is indemnified against certain liabilities that may arise out of the performance of their duties to the Fund. Additionally, in the normal course of business, the Fund enters into contracts, including the Fund’s servicing agreements, that contain a variety of indemnification clauses. The Fund’s maximum exposure under these arrangements is unknown as this would involve future claims that may be made against the Fund that have not yet occurred. The risk of material loss as a result of such indemnification claims is considered remote. |
| I. | Foreign Currency Translations — Foreign currency is valued at the close of the NYSE based on quotations posted by banks and major currency dealers. Portfolio securities and other assets and liabilities denominated in foreign currencies are translated into U.S. dollar amounts at date of valuation. Purchases and sales of portfolio securities (net of foreign taxes withheld on disposition) and income items denominated in foreign currencies are translated into U.S. dollar amounts on the respective dates of such transactions. The Fund does not separately account for the portion of the results of operations resulting from changes in foreign exchange rates on investments and the fluctuations arising from changes in market prices of securities held. The combined results of changes in foreign exchange rates and the fluctuation of market prices on investments (net of estimated foreign tax withholding) are included with the net realized and unrealized gain or loss from investments in the Statement of Operations. Reported net realized foreign currency gains or losses arise from (1) sales of foreign currencies, (2) currency gains or losses realized between the trade and settlement dates on securities transactions, and (3) the difference between the amounts of dividends, interest, and foreign withholding taxes recorded on the Fund’s books and the U.S. dollar equivalent of the amounts actually received or paid. Net unrealized foreign currency gains and losses arise from changes in the fair values of assets and liabilities, other than investments in securities at fiscal period end, resulting from changes in exchange rates. |
The Fund may invest in foreign securities, which may be subject to foreign taxes on income, gains on investments or currency repatriation, a portion of which may be recoverable. Foreign taxes, if any, are recorded based on the tax regulations and rates that exist in the foreign markets in which the Fund invests and are shown in the Statement of Operations.
| J. | Forward Foreign Currency Contracts — The Fund may engage in foreign currency transactions either on a spot (i.e. for prompt delivery and settlement) basis, or through forward foreign currency contracts, to manage or minimize currency or exchange rate risk. |
The Fund may also enter into forward foreign currency contracts for the purchase or sale of a security denominated in a foreign currency in order to “lock in” the U.S. dollar price of that security, or the Fund may also enter into forward foreign currency contracts that do not provide for physical settlement of the two currencies, but instead are settled by a single cash payment calculated as the difference between the agreed upon exchange rate and the spot rate at settlement based upon an agreed upon notional amount (non-deliverable forwards). The Fund will set aside liquid assets in an amount equal to daily mark-to-market obligation for forward foreign currency contracts.
A forward foreign currency contract is an obligation between two parties (“Counterparties”) to purchase or sell a specific currency for an agreed-upon price at a future date. The use of forward foreign currency contracts does not eliminate fluctuations in the price of the underlying securities the Fund owns or intends to acquire but establishes a rate of exchange in advance. Fluctuations in the value of these contracts are
16 Invesco Global Growth Fund
measured by the difference in the contract date and reporting date exchange rates and are recorded as unrealized appreciation (depreciation) until the contracts are closed. When the contracts are closed, realized gains (losses) are recorded. Realized and unrealized gains (losses) on the contracts are included in the Statement of Operations. The primary risks associated with forward foreign currency contracts include failure of the Counterparty to meet the terms of the contract and the value of the foreign currency changing unfavorably. These risks may be in excess of the amounts reflected in the Statement of Assets and Liabilities.
NOTE 2—Advisory Fees and Other Fees Paid to Affiliates
The Trust has entered into a master investment advisory agreement with Invesco Advisers, Inc. (the “Adviser” or “Invesco”). Under the terms of the investment advisory agreement, the Fund pays an advisory fee to the Adviser based on the annual rate of the Fund’s average daily net assets as follows:
| Average Daily Net Assets | Rate | |||
First $250 million | 0.80% | |||
Next $250 million | 0.78% | |||
Next $500 million | 0.76% | |||
Next $1.5 billion | 0.74% | |||
Next $2.5 billion | 0.72% | |||
Next $2.5 billion | 0.70% | |||
Next $2.5 billion | 0.68% | |||
Over $10 billion | 0.66% | |||
For the year ended October 31, 2015, the effective advisory fees incurred by the Fund was 0.79%.
Under the terms of a master sub-advisory agreement between the Adviser and each of Invesco Asset Management Deutschland GmbH, Invesco Asset Management Limited, Invesco Asset Management (Japan) Limited, Invesco Hong Kong Limited, Invesco Senior Secured Management, Inc., Invesco Canada Ltd. and Invesco PowerShares Capital Management LLC (collectively, the “Affiliated Sub-Advisers”) the Adviser, not the Fund, may pay 40% of the fees paid to the Adviser to any such Affiliated Sub-Adviser(s) that provide(s) discretionary investment management services to the Fund based on the percentage of assets allocated to such Affiliated Sub-Adviser(s).
Effective October 1, 2015, the Adviser has contractually agreed, through February 28, 2017, to waive advisory fees and/or reimburse expenses to the extent necessary to limit total annual fund operating expenses after fee waiver and/or expense reimbursement (excluding certain items discussed below) of Class A, Class B, Class C, Class Y, Class R5 and Class R6 shares to 1.31%, 2.06%, 2.06%, 1.06%, 1.06% and 1.06%, respectively, of average daily net assets. Prior to October 1, 2015, the Adviser had contractually agreed to waive advisory fees and/or reimburse expenses of all shares to the extent necessary to limit total annual fund operating expenses after fee waiver and/or expense reimbursement (excluding certain items discussed below) of Class A, Class B, Class C, Class Y, Class R5 and Class R6 shares to 2.25%, 3.00%, 3.00%, 2.00%, 2.00% and 2.00%, respectively, of average daily net assets. In determining the Adviser’s obligation to waive advisory fees and/or reimburse expenses, the following expenses are not taken into account, and could cause the total annual fund operating expenses after fee waiver and/or expense reimbursement to exceed the numbers reflected above: (1) interest; (2) taxes; (3) dividend expense on short sales; (4) extraordinary or non-routine items, litigation expenses; and (5) expenses that the Fund has incurred but did not actually pay because of an expense offset arrangement. Unless Invesco continues the fee waiver agreement, it will terminate on February 28, 2017. The fee waiver agreement cannot be terminated during its term.
Further, the Adviser has contractually agreed, through at least June 30, 2017, to waive the advisory fee payable by the Fund in an amount equal to 100% of the net advisory fees the Adviser receives from the affiliated money market funds on investments by the Fund of uninvested cash in such affiliated money market funds.
For the year ended October 31, 2015, the Adviser waived advisory fees of $15,692 and reimbursed class level expenses of $35,451, $520, $2,925 and $711 of Class A, Class B, Class C and Class Y shares, respectively.
The Trust has entered into a transfer agency and service agreement with Invesco Investment Services, Inc. (“IIS”) pursuant to which the Fund has agreed to pay IIS a fee for providing transfer agency and shareholder services to the Fund and reimburse IIS for certain expenses incurred by IIS in the course of providing such services. IIS may make payments to intermediaries that provide omnibus account services, sub-accounting services and/or networking services. All fees payable by IIS to intermediaries that provide omnibus account services or sub-accounting are charged back to the Fund, subject to certain limitations approved by the Trust’s Board of Trustees. For the year ended October 31, 2015, expenses incurred under the agreement are shown in the Statement of Operations as Transfer agent fees.
The Trust has entered into a master administrative services agreement with Invesco pursuant to which the Fund has agreed to pay Invesco for certain administrative costs incurred in providing accounting services to the Fund. For the year ended October 31, 2015, expenses incurred under the agreement are shown in the Statement of Operations as Administrative services fees.
The Trust has entered into master distribution agreements with Invesco Distributors, Inc. (“IDI”) to serve as the distributor for the Class A, Class B, Class C, Class Y, Class R5 and Class R6 shares of the Fund. The Trust has adopted plans pursuant to Rule 12b-1 under the 1940 Act with respect to the Fund’s Class A, Class B and Class C shares (collectively, the “Plans”). The Fund, pursuant to the Plans, pays IDI compensation at the annual rate of 0.25% of the Fund’s average daily net assets of Class A shares and 1.00% of the average daily net assets of Class B and Class C shares. Of the Plan payments, up to 0.25% of the average daily net assets of each class of shares may be paid to furnish continuing personal shareholder services to customers who purchase and own shares of such classes. Any amounts not paid as a service fee under the Plans would constitute an asset-based sales charge. Rules of the Financial Industry Regulatory Authority (“FINRA”) impose a cap on the total sales charges, including asset-based sales charges, that may be paid by any class of shares of the Fund. For the year ended October 31, 2015, expenses incurred under the Plans are shown in the Statement of Operations as Distribution fees.
Front-end sales commissions and CDSC (collectively, the “sales charges”) are not recorded as expenses of the Fund. Front-end sales commissions are deducted from proceeds from the sales of Fund shares prior to investment in Class A shares of the Fund. CDSC are deducted from redemption
17 Invesco Global Growth Fund
proceeds prior to remittance to the shareholder. During the year ended October 31, 2015, IDI advised the Fund that IDI retained $54,108 in front-end sales commissions from the sale of Class A shares and $130, $1,155 and $746 from Class A, Class B and Class C shares, respectively, for CDSC imposed on redemptions by shareholders.
Certain officers and trustees of the Trust are officers and directors of the Adviser, IIS and/or IDI.
NOTE 3—Additional Valuation Information
GAAP defines fair value as the price that would be received to sell an asset or paid to transfer a liability in an orderly transaction between market participants at the measurement date, under current market conditions. GAAP establishes a hierarchy that prioritizes the inputs to valuation methods, giving the highest priority to readily available unadjusted quoted prices in an active market for identical assets (Level 1) and the lowest priority to significant unobservable inputs (Level 3), generally when market prices are not readily available or are unreliable. Based on the valuation inputs, the securities or other investments are tiered into one of three levels. Changes in valuation methods may result in transfers in or out of an investment’s assigned level:
| Level 1 — | Prices are determined using quoted prices in an active market for identical assets. |
| Level 2 — | Prices are determined using other significant observable inputs. Observable inputs are inputs that other market participants may use in pricing a security. These may include quoted prices for similar securities, interest rates, prepayment speeds, credit risk, yield curves, loss severities, default rates, discount rates, volatilities and others. |
| Level 3 — | Prices are determined using significant unobservable inputs. In situations where quoted prices or observable inputs are unavailable (for example, when there is little or no market activity for an investment at the end of the period), unobservable inputs may be used. Unobservable inputs reflect the Fund’s own assumptions about the factors market participants would use in determining fair value of the securities or instruments and would be based on the best available information. |
The following is a summary of the tiered valuation input levels, as of October 31, 2015. The level assigned to the securities valuations may not be an indication of the risk or liquidity associated with investing in those securities. Because of the inherent uncertainties of valuation, the values reflected in the financial statements may materially differ from the value received upon actual sale of those investments.
During the year ended October 31, 2015, there were transfers from Level 1 to Level 2 of $17,944,509 and from Level 2 to Level 1 of $11,531,546, due to foreign fair value adjustments.
| Level 1 | Level 2 | Level 3 | Total | |||||||||||||
Australia | $ | — | $ | 3,666,985 | $ | — | $ | 3,666,985 | ||||||||
Belgium | — | 3,114,968 | — | 3,114,968 | ||||||||||||
Brazil | 7,587,866 | — | — | 7,587,866 | ||||||||||||
Canada | 10,491,876 | — | — | 10,491,876 | ||||||||||||
China | 6,900,713 | 9,362,518 | — | 16,263,231 | ||||||||||||
Denmark | — | 6,871,263 | — | 6,871,263 | ||||||||||||
France | 2,903,708 | 2,889,796 | — | 5,793,504 | ||||||||||||
Germany | 11,746,578 | — | — | 11,746,578 | ||||||||||||
Hong Kong | — | 10,611,133 | — | 10,611,133 | ||||||||||||
Indonesia | — | 1,910,226 | — | 1,910,226 | ||||||||||||
Israel | 9,134,769 | — | — | 9,134,769 | ||||||||||||
Italy | 1,629,338 | — | — | 1,629,338 | ||||||||||||
Japan | — | 14,356,763 | — | 14,356,763 | ||||||||||||
Mexico | 2,233,173 | — | — | 2,233,173 | ||||||||||||
Singapore | 6,680,198 | — | — | 6,680,198 | ||||||||||||
South Korea | — | 3,388,593 | — | 3,388,593 | ||||||||||||
Spain | — | 2,892,004 | — | 2,892,004 | ||||||||||||
Sweden | 1,581,248 | 7,619,814 | — | 9,201,062 | ||||||||||||
Switzerland | — | 20,181,514 | — | 20,181,514 | ||||||||||||
Taiwan | — | 4,569,125 | — | 4,569,125 | ||||||||||||
Thailand | — | 3,246,564 | — | 3,246,564 | ||||||||||||
Turkey | 1,597,135 | — | — | 1,597,135 | ||||||||||||
United Kingdom | — | 42,691,196 | — | 42,691,196 | ||||||||||||
United States | 146,142,450 | — | — | 146,142,450 | ||||||||||||
Total Investments | $ | 208,629,052 | $ | 137,372,462 | $ | — | $ | 346,001,514 | ||||||||
NOTE 4—Expense Offset Arrangement(s)
The expense offset arrangement is comprised of transfer agency credits which result from balances in demand deposit accounts used by the transfer agent for clearing shareholder transactions. For the year ended October 31, 2015, the Fund received credits from this arrangement, which resulted in the reduction of the Fund’s total expenses of $2,732.
18 Invesco Global Growth Fund
NOTE 5—Trustees’ and Officers’ Fees and Benefits
Trustees’ and Officers’ Fees and Benefits include amounts accrued by the Fund to pay remuneration to certain Trustees and Officers of the Fund. Trustees have the option to defer compensation payable by the Fund, and Trustees’ and Officers’ Fees and Benefits also include amounts accrued by the Fund to fund such deferred compensation amounts. Those Trustees who defer compensation have the option to select various Invesco Funds in which their deferral accounts shall be deemed to be invested. Finally, certain current Trustees were eligible to participate in a retirement plan that provided for benefits to be paid upon retirement to Trustees over a period of time based on the number of years of service. The Fund may have certain former Trustees who also participate in a retirement plan and receive benefits under such plan. Trustees’ and Officers’ Fees and Benefits include amounts accrued by the Fund to fund such retirement benefits. Obligations under the deferred compensation and retirement plans represent unsecured claims against the general assets of the Fund.
NOTE 6—Cash Balances
The Fund is permitted to temporarily carry a negative or overdrawn balance in its account with State Street Bank and Trust Company, the custodian bank. Such balances, if any at period end, are shown in the Statement of Assets and Liabilities under the payable caption Amount due custodian. To compensate the custodian bank for such overdrafts, the overdrawn Fund may either (1) leave funds as a compensating balance in the account so the custodian bank can be compensated by earning the additional interest; or (2) compensate by paying the custodian bank at a rate agreed upon by the custodian bank and Invesco, not to exceed the contractually agreed upon rate.
NOTE 7—Distributions to Shareholders and Tax Components of Net Assets
Tax Character of Distributions to Shareholders Paid During the Fiscal Years Ended October 31, 2015 and 2014:
| 2015 | 2014 | |||||||
Ordinary income | $ | 3,785,605 | $ | 2,201,523 | ||||
Long-term capital gain | 24,388,486 | 12,000,576 | ||||||
Total distributions | $ | 28,174,091 | $ | 14,202,099 | ||||
Tax Components of Net Assets at Period-End:
| 2015 | ||||
Undistributed ordinary income | $ | 1,879,926 | ||
Undistributed long-term gain | 11,965,510 | |||
Net unrealized appreciation — investments | 83,697,514 | |||
Net unrealized appreciation (depreciation) — other investments | (14,759 | ) | ||
Temporary book/tax differences | (140,306 | ) | ||
Shares of beneficial interest | 249,684,746 | |||
Total net assets | $ | 347,072,631 | ||
The difference between book-basis and tax-basis unrealized appreciation (depreciation) is due to differences in the timing of recognition of gains and losses on investments for tax and book purposes. The Fund’s net unrealized appreciation difference is attributable primarily to wash sales.
The temporary book/tax differences are a result of timing differences between book and tax recognition of income and/or expenses. The Fund’s temporary book/tax differences are the result of the trustee deferral of compensation and retirement plan benefits.
Capital loss carryforward is calculated and reported as of a specific date. Results of transactions and other activity after that date may affect the amount of capital loss carryforward actually available for the Fund to utilize. Capital losses generated in years beginning after December 22, 2010 can be carried forward for an unlimited period, whereas previous losses expire in eight tax years. Capital losses with an expiration period may not be used to offset capital gains until all net capital losses without an expiration date have been utilized. Capital loss carryforwards with no expiration date will retain their character as either short-term or long-term capital losses instead of as short-term capital losses as under prior law. The ability to utilize capital loss carryforwards in the future may be limited under the Internal Revenue Code and related regulations based on the results of future transactions.
The Fund does not have a capital loss carryforward as of October 31, 2015.
NOTE 8—Investment Securities
The aggregate amount of investment securities (other than short-term securities, U.S. Treasury obligations and money market funds, if any) purchased and sold by the Fund during the year ended October 31, 2015 was $81,556,443 and $87,510,642, respectively. Cost of investments on a tax basis includes the adjustments for financial reporting purposes as of the most recently completed federal income tax reporting period-end.
| Unrealized Appreciation (Depreciation) of Investment Securities on a Tax Basis | ||||
Aggregate unrealized appreciation of investment securities | $ | 97,560,442 | ||
Aggregate unrealized (depreciation) of investment securities | (13,862,928 | ) | ||
Net unrealized appreciation of investment securities | $ | 83,697,514 | ||
Cost of investments for tax purposes is $262,304,000.
19 Invesco Global Growth Fund
NOTE 9—Reclassification of Permanent Differences
Primarily as a result of differing book/tax treatment of foreign currency transactions and fair funds settlement, on October 31, 2015, undistributed net investment income was decreased by $22,781 and undistributed net realized gain was increased by $22,781. This reclassification had no effect on the net assets of the Fund.
NOTE 10—Share Information
| Summary of Share Activity | ||||||||||||||||
| Years ended October 31, | ||||||||||||||||
| 2015(a) | 2014 | |||||||||||||||
| Shares | Amount | Shares | Amount | |||||||||||||
Sold: | ||||||||||||||||
Class A | 1,012,086 | $ | 29,592,895 | 489,665 | $ | 14,890,326 | ||||||||||
Class B | 6,896 | 188,022 | 11,127 | 311,076 | ||||||||||||
Class C | 124,459 | 3,408,293 | 89,429 | 2,522,033 | ||||||||||||
Class Y | 171,444 | 4,995,873 | 78,631 | 2,411,319 | ||||||||||||
Class R5 | — | — | 9,250 | 275,709 | ||||||||||||
Class R6 | 46,005 | 1,373,476 | — | — | ||||||||||||
Issued as reinvestment of dividends: | ||||||||||||||||
Class A | 822,495 | 22,996,947 | 411,588 | 11,705,557 | ||||||||||||
Class B | 16,087 | 418,265 | 10,187 | 271,391 | ||||||||||||
Class C | 75,132 | 1,953,418 | 32,091 | 854,895 | ||||||||||||
Class Y | 10,816 | 302,732 | 3,967 | 112,890 | ||||||||||||
Class R5 | 3,389 | 94,247 | 1,293 | 36,579 | ||||||||||||
Automatic conversion of Class B shares to Class A shares: | ||||||||||||||||
Class A | 47,369 | 1,393,135 | 73,470 | 2,249,836 | ||||||||||||
Class B | (51,097 | ) | (1,393,135 | ) | (78,694 | ) | (2,249,836 | ) | ||||||||
Reacquired: | ||||||||||||||||
Class A | (1,172,589 | ) | (34,356,238 | ) | (1,793,277 | ) | (54,194,194 | ) | ||||||||
Class B | (28,216 | ) | (770,429 | ) | (36,467 | ) | (1,032,159 | ) | ||||||||
Class C | (125,853 | ) | (3,403,519 | ) | (133,101 | ) | (3,761,012 | ) | ||||||||
Class Y | (52,578 | ) | (1,542,147 | ) | (48,426 | ) | (1,471,065 | ) | ||||||||
Class R5 | (38,874 | ) | (1,106,890 | ) | (2,345 | ) | (71,356 | ) | ||||||||
Class R6 | (1,820 | ) | (54,432 | ) | — | — | ||||||||||
Net increase (decrease) in share activity | 865,151 | $ | 24,090,513 | (881,612 | ) | $ | (27,138,011 | ) | ||||||||
| (a) | There are entities that are record owners of more than 5% of the outstanding shares of the Fund and in the aggregate own 38% of the outstanding shares of the Fund. IDI has an agreement with these entities to sell Fund shares. The Fund, Invesco and/or Invesco affiliates may make payments to these entities, which are considered to be related to the Fund, for providing services to the Fund, Invesco and/or Invesco affiliates including but not limited to services such as securities brokerage, distribution, third party record keeping and account servicing. The Fund has no knowledge as to whether all or any portion of the shares owned of record by these entities are also owned beneficially. |
20 Invesco Global Growth Fund
NOTE 11—Financial Highlights
The following schedule presents financial highlights for a share of the Fund outstanding throughout the periods indicated.
| Net asset value, beginning of period | Net investment income (loss)(a) | Net gains (losses) on securities (both realized and unrealized) | Total from investment operations | Dividends from net investment income | Distributions from net realized gains | Total distributions | Net asset value, end of period(b) | Total return(c) | Net assets, end of period (000’s omitted) | Ratio of expenses to average net assets with fee waivers and/or expenses absorbed | Ratio of expenses to average net assets without fee waivers and/or expenses absorbed | Ratio of net investment income (loss) to average net assets | Portfolio turnover(d) | |||||||||||||||||||||||||||||||||||||||||||
Class A | ||||||||||||||||||||||||||||||||||||||||||||||||||||||||
Year ended 10/31/15 | $ | 31.21 | $ | 0.16 | $ | (0.21 | ) | $ | (0.05 | ) | $ | (0.18 | ) | $ | (2.35 | ) | $ | (2.53 | ) | $ | 28.63 | 0.02 | % | $ | 308,940 | 1.40 | %(e) | 1.42 | %(e) | 0.55 | %(e) | 24 | % | |||||||||||||||||||||||
Year ended 10/31/14 | 29.84 | 0.23 | 2.34 | 2.57 | (0.20 | ) | (1.00 | ) | (1.20 | ) | 31.21 | 9.00 | 314,679 | 1.43 | 1.43 | 0.76 | 27 | |||||||||||||||||||||||||||||||||||||||
Year ended 10/31/13 | 24.22 | 0.15 | 5.82 | 5.97 | (0.22 | ) | (0.13 | ) | (0.35 | ) | 29.84 | 24.96 | 325,319 | 1.43 | 1.47 | 0.56 | 29 | |||||||||||||||||||||||||||||||||||||||
Year ended 10/31/12 | 22.26 | 0.20 | 1.90 | 2.10 | (0.14 | ) | — | (0.14 | ) | 24.22 | 9.50 | 277,313 | 1.34 | 1.56 | 0.85 | 33 | ||||||||||||||||||||||||||||||||||||||||
Year ended 10/31/11 | 22.30 | 0.12 | (0.02 | ) | 0.10 | (0.14 | ) | — | (0.14 | ) | 22.26 | 0.41 | 185,484 | 1.62 | 1.63 | 0.50 | 28 | |||||||||||||||||||||||||||||||||||||||
Class B | ||||||||||||||||||||||||||||||||||||||||||||||||||||||||
Year ended 10/31/15 | 29.04 | (0.06 | ) | (0.19 | ) | (0.25 | ) | — | (2.35 | ) | (2.35 | ) | 26.44 | (0.74 | ) | 3,595 | 2.15 | (e) | 2.17 | (e) | (0.20 | )(e) | 24 | |||||||||||||||||||||||||||||||||
Year ended 10/31/14 | 27.87 | 0.01 | 2.18 | 2.19 | (0.02 | ) | (1.00 | ) | (1.02 | ) | 29.04 | 8.17 | 5,585 | 2.18 | 2.18 | 0.01 | 27 | |||||||||||||||||||||||||||||||||||||||
Year ended 10/31/13 | 22.64 | (0.05 | ) | 5.45 | 5.40 | (0.04 | ) | (0.13 | ) | (0.17 | ) | 27.87 | 24.03 | 7,975 | 2.18 | 2.22 | (0.19 | ) | 29 | |||||||||||||||||||||||||||||||||||||
Year ended 10/31/12 | 20.83 | 0.02 | 1.79 | 1.81 | — | — | — | 22.64 | 8.69 | 9,368 | 2.09 | 2.31 | 0.10 | 33 | ||||||||||||||||||||||||||||||||||||||||||
Year ended 10/31/11 | 20.90 | (0.05 | ) | (0.02 | ) | (0.07 | ) | — | — | — | 20.83 | (0.33 | ) | 10,776 | 2.37 | 2.38 | (0.25 | ) | 28 | |||||||||||||||||||||||||||||||||||||
Class C | ||||||||||||||||||||||||||||||||||||||||||||||||||||||||
Year ended 10/31/15 | 29.05 | (0.06 | ) | (0.19 | ) | (0.25 | ) | — | (2.35 | ) | (2.35 | ) | 26.45 | (0.74 | ) | 25,530 | 2.15 | (e) | 2.17 | (e) | (0.20 | )(e) | 24 | |||||||||||||||||||||||||||||||||
Year ended 10/31/14 | 27.87 | 0.01 | 2.19 | 2.20 | (0.02 | ) | (1.00 | ) | (1.02 | ) | 29.05 | 8.21 | 25,896 | 2.18 | 2.18 | 0.01 | 27 | |||||||||||||||||||||||||||||||||||||||
Year ended 10/31/13 | 22.64 | (0.05 | ) | 5.45 | 5.40 | (0.04 | ) | (0.13 | ) | (0.17 | ) | 27.87 | 24.03 | 25,175 | 2.18 | 2.22 | (0.19 | ) | 29 | |||||||||||||||||||||||||||||||||||||
Year ended 10/31/12 | 20.83 | 0.02 | 1.79 | 1.81 | — | — | — | 22.64 | 8.69 | 21,803 | 2.09 | 2.31 | 0.10 | 33 | ||||||||||||||||||||||||||||||||||||||||||
Year ended 10/31/11 | 20.90 | (0.05 | ) | (0.02 | ) | (0.07 | ) | — | — | — | 20.83 | (0.33 | ) | �� | 10,838 | 2.37 | 2.38 | (0.25 | ) | 28 | ||||||||||||||||||||||||||||||||||||
Class Y | ||||||||||||||||||||||||||||||||||||||||||||||||||||||||
Year ended 10/31/15 | 31.30 | 0.23 | (0.21 | ) | 0.02 | (0.25 | ) | (2.35 | ) | (2.60 | ) | 28.72 | 0.26 | 7,724 | 1.15 | (e) | 1.17 | (e) | 0.80 | (e) | 24 | |||||||||||||||||||||||||||||||||||
Year ended 10/31/14 | 29.94 | 0.31 | 2.33 | 2.64 | (0.28 | ) | (1.00 | ) | (1.28 | ) | 31.30 | 9.24 | 4,358 | 1.18 | 1.18 | 1.01 | 27 | |||||||||||||||||||||||||||||||||||||||
Year ended 10/31/13 | 24.29 | 0.22 | 5.83 | 6.05 | (0.27 | ) | (0.13 | ) | (0.40 | ) | 29.94 | 25.31 | 3,144 | 1.18 | 1.22 | 0.81 | 29 | |||||||||||||||||||||||||||||||||||||||
Year ended 10/31/12 | 22.33 | 0.25 | 1.91 | 2.16 | (0.20 | ) | — | (0.20 | ) | 24.29 | 9.78 | 2,372 | 1.09 | 1.31 | 1.10 | 33 | ||||||||||||||||||||||||||||||||||||||||
Year ended 10/31/11 | 22.37 | 0.17 | (0.02 | ) | 0.15 | (0.19 | ) | — | (0.19 | ) | 22.33 | 0.66 | 1,400 | 1.37 | 1.38 | 0.75 | 28 | |||||||||||||||||||||||||||||||||||||||
Class R5 | ||||||||||||||||||||||||||||||||||||||||||||||||||||||||
Year ended 10/31/15 | 31.17 | 0.30 | (0.24 | ) | 0.06 | (0.31 | ) | (2.35 | ) | (2.66 | ) | 28.57 | 0.42 | 11 | 0.99 | (e) | 0.99 | (e) | 0.96 | (e) | 24 | |||||||||||||||||||||||||||||||||||
Year ended 10/31/14 | 29.82 | 0.38 | 2.31 | 2.69 | (0.34 | ) | (1.00 | ) | (1.34 | ) | 31.17 | 9.49 | 1,118 | 0.94 | 0.94 | 1.25 | 27 | |||||||||||||||||||||||||||||||||||||||
Year ended 10/31/13 | 24.18 | 0.27 | 5.80 | 6.07 | (0.30 | ) | (0.13 | ) | (0.43 | ) | 29.82 | 25.51 | 825 | 0.99 | 0.99 | 1.00 | 29 | |||||||||||||||||||||||||||||||||||||||
Year ended 10/31/12 | 22.33 | 0.28 | 1.90 | 2.18 | (0.33 | ) | — | (0.33 | ) | 24.18 | 9.95 | 379 | 0.99 | 0.99 | 1.20 | 33 | ||||||||||||||||||||||||||||||||||||||||
Year ended 10/31/11 | 22.37 | 0.28 | (0.06 | ) | 0.22 | (0.26 | ) | — | (0.26 | ) | 22.33 | 0.95 | 306 | 0.82 | 0.83 | 1.30 | 28 | |||||||||||||||||||||||||||||||||||||||
Class R6 | ||||||||||||||||||||||||||||||||||||||||||||||||||||||||
Year ended 10/31/15 | 31.16 | 0.28 | (0.22 | ) | 0.06 | (0.31 | ) | (2.35 | ) | (2.66 | ) | 28.56 | 0.42 | 1,274 | 0.99 | (e) | 0.99 | (e) | 0.96 | (e) | 24 | |||||||||||||||||||||||||||||||||||
Year ended 10/31/14 | 29.80 | 0.38 | 2.32 | 2.70 | (0.34 | ) | (1.00 | ) | (1.34 | ) | 31.16 | 9.53 | 13 | 0.94 | 0.94 | 1.25 | 27 | |||||||||||||||||||||||||||||||||||||||
Year ended 10/31/13 | 24.17 | 0.27 | 5.79 | 6.06 | (0.30 | ) | (0.13 | ) | (0.43 | ) | 29.80 | 25.52 | 12 | 0.99 | 0.99 | 1.00 | 29 | |||||||||||||||||||||||||||||||||||||||
Year ended 10/31/12(f) | 24.84 | 0.03 | (0.70 | ) | (0.67 | ) | — | — | — | 24.17 | (2.70 | ) | 10 | 0.95 | (g) | 0.96 | (g) | 1.24 | (g) | 33 | ||||||||||||||||||||||||||||||||||||
| (a) | Calculated using average shares outstanding. |
| (b) | Includes redemption fees added to shares of beneficial interest for Class A, Class B, Class C, Class Y and Class R5, which were less than $0.005 per share for the fiscal years ended October 31, 2012 and prior. |
| (c) | Includes adjustments in accordance with accounting principles generally accepted in the United States of America and as such, the net asset value for financial reporting purposes and the returns based upon those net asset values may differ from the net asset value and returns for shareholder transactions. Does not include sales charges and is not annualized for periods less than one year, if applicable. |
| (d) | Portfolio turnover is calculated at the fund level and is not annualized for periods less than one year, if applicable. For the period ended October 31, 2012, the portfolio turnover calculation excludes the value of securities purchased of $92,850,953 and sold of $35,562,826 in the effort to realign the Fund’s portfolio holdings after the reorganization of Invesco Global Advantage into the Fund. |
| (e) | Ratios are based on average daily net assets (000’s omitted) of $313,949, $4,603, $25,904, $6,297, $166 and $684 for Class A, Class B, Class C, Class Y, Class R5 and Class R6 shares, respectively. |
| (f) | Commencement date of September 24, 2012. |
| (g) | Annualized. |
21 Invesco Global Growth Fund
Report of Independent Registered Public Accounting Firm
To the Board of Trustees of AIM International Mutual Funds (Invesco International Mutual Funds)
and Shareholders of Invesco Global Growth Fund:
In our opinion, the accompanying statement of assets and liabilities, including the schedule of investments, and the related statements of operations and of changes in net assets and the financial highlights present fairly, in all material respects, the financial position of Invesco Global Growth Fund (one of the funds constituting AIM International Mutual Funds (Invesco International Mutual Funds), hereafter referred to as the “Fund”) at October 31, 2015, the results of its operations for the year then ended, the changes in its net assets for each of the two years in the period then ended and the financial highlights for each of the five years in the period then ended, in conformity with accounting principles generally accepted in the United States of America. These financial statements and financial highlights (hereafter referred to as “financial statements”) are the responsibility of the Fund’s management. Our responsibility is to express an opinion on these financial statements based on our audits. We conducted our audits of these financial statements in accordance with the standards of the Public Company Accounting Oversight Board (United States). Those standards require that we plan and perform the audit to obtain reasonable assurance about whether the financial statements are free of material misstatement. An audit includes examining, on a test basis, evidence supporting the amounts and disclosures in the financial statements, assessing the accounting principles used and significant estimates made by management, and evaluating the overall financial statement presentation. We believe that our audits, which included confirmation of securities at October 31, 2015 by correspondence with the custodian and brokers, and the application of alternative auditing procedures where confirmations of security purchases have not been received, provide a reasonable basis for our opinion.
PRICEWATERHOUSECOOPERS LLP
December 23, 2015
Houston, Texas
22 Invesco Global Growth Fund
Calculating your ongoing Fund expenses
Example
As a shareholder of the Fund, you incur two types of costs: (1) transaction costs, which may include sales charges (loads) on purchase payments or contingent deferred sales charges on redemptions, if any; and (2) ongoing costs, including management fees, distribution and/or service (12b-1) fees, and other Fund expenses. This example is intended to help you understand your ongoing costs (in dollars) of investing in the Fund and to compare these costs with ongoing costs of investing in other mutual funds. The example is based on an investment of $1,000 invested at the beginning of the period and held for the entire period May 1, 2015 through October 31, 2015.
Actual expenses
The table below provides information about actual account values and actual expenses. You may use the information in this table, together with the amount you invested, to estimate the expenses that you paid over the period. Simply divide your account value by $1,000 (for example, an $8,600 account value divided by $1,000 = 8.6), then multiply the result by the number in the table under the heading entitled “Actual Expenses Paid During Period” to estimate the expenses you paid on your account during this period.
Hypothetical example for comparison purposes
The table below also provides information about hypothetical account values and hypothetical expenses based on the Fund’s actual expense ratio and an assumed rate of return of 5% per year before expenses, which is not the Fund’s actual return.
The hypothetical account values and expenses may not be used to estimate the actual ending account balance or expenses you paid for the period. You may use this information to compare the ongoing costs of investing in the Fund and other funds. To do so, compare this 5% hypothetical example with the 5% hypothetical examples that appear in the shareholder reports of the other funds.
Please note that the expenses shown in the table are meant to highlight your ongoing costs only and do not reflect any transaction costs, such as sales charges (loads) on purchase payments or contingent deferred sales charges on redemptions, if any. Therefore, the hypothetical information is useful in comparing ongoing costs only, and will not help you determine the relative total costs of owning different funds. In addition, if these transaction costs were included, your costs would have been higher.
| Class | Beginning Account Value (05/01/15) | ACTUAL | HYPOTHETICAL (5% annual return before | Annualized Expense Ratio2 | ||||||||||||||||||||
| Ending Account Value (10/31/15)1 | Expenses Paid During Period3 | Ending Account Value (10/31/15) | Expenses Paid During Period4 | |||||||||||||||||||||
| A | $ | 1,000.00 | $ | 944.30 | $ | 6.71 | $ | 1,018.30 | $ | 6.97 | 1.37 | % | ||||||||||||
| B | 1,000.00 | 941.00 | 10.37 | 1,014.52 | 10.76 | 2.12 | ||||||||||||||||||
| C | 1,000.00 | 941.00 | 10.37 | 1,014.52 | 10.76 | 2.12 | ||||||||||||||||||
| Y | 1,000.00 | 945.30 | 5.49 | 1,019.56 | 5.70 | 1.12 | ||||||||||||||||||
| R5 | 1,000.00 | 946.00 | 4.81 | 1,020.27 | 4.99 | 0.98 | ||||||||||||||||||
| R6 | 1,000.00 | 946.40 | 4.81 | 1,020.27 | 4.99 | 0.98 | ||||||||||||||||||
| 1 | The actual ending account value is based on the actual total return of the Fund for the period May 1, 2015 through October 31, 2015, after actual expenses and will differ from the hypothetical ending account value which is based on the Fund’s expense ratio and a hypothetical annual return of 5% before expenses. |
| 2 | Expenses are equal to the Fund’s annualized expense ratio as indicated above multiplied by the average account value over the period, multiplied by 184/365 to reflect the most recent fiscal half year. Effective October 1, 2015, the Fund’s adviser has contractually agreed to waive advisory fees and/or reimburse expenses to the extent necessary to limit total annual fund operating expense of Class A, Class B, Class C, Class Y, Class R5 and Class R6 shares to 1.31%, 2.06%, 2.06%, 1.06%, 1.06% and 1.06% of average daily net assets, respectively. The annualized expense ratios restated as if these agreements had been in effect throughout the entire most recent fiscal half year are 1.31%, 2.06%, 2.06%, 1.06%, 0.98% and 0.98% for Class A, Class B, Class C, Class Y, Class R5 and Class R6 shares, respectively. |
| 3 | The actual expenses paid restated as if the changes discussed above had been in effect throughout the entire most recent fiscal half year are $6.42, $10.08, $10.08, $5.20, $4.81 and $4.81 for Class A, Class B, Class C, Class Y, Class R5 and Class R6 shares, respectively. |
| 4 | The hypothetical expenses paid restated as if the changes discussed above had been in effect throughout the entire most recent fiscal half year are $6.67, $10.46, $10.46, $5.40, $4.99 and $4.99 for Class A, Class B, Class C, Class Y, Class R5 and Class R6 shares, respectively. |
23 Invesco Global Growth Fund
Approval of Investment Advisory and Sub-Advisory Contracts
The Board of Trustees (the Board) of AIM International Mutual Funds (Invesco International Mutual Funds) is required under the Investment Company Act of 1940, as amended, to approve annually the renewal of Invesco Global Growth Fund’s (the Fund) investment advisory agreements. During contract renewal meetings held on June 9-10, 2015, the Board as a whole, and the disinterested or “independent” Trustees, who comprise over 75% of the Board, voting separately, approved the continuance for the Fund of the Master Investment Advisory Agreement with Invesco Advisers, Inc. (Invesco Advisers and the investment advisory agreement) and the Master Intergroup Sub-Advisory Contract for Mutual Funds with Invesco Asset Management Deutschland GmbH, Invesco Asset Management Limited, Invesco Asset Management (Japan) Limited, Invesco Hong Kong Limited, Invesco Senior Secured Management, Inc. and Invesco Canada Ltd. (collectively, the Affiliated Sub-Advisers and the sub-advisory contracts) for another year, effective July 1, 2015.
In evaluating the fairness and reasonableness of compensation under the Fund’s investment advisory agreement and sub-advisory contracts, the Board considered, among other things, the factors discussed below. The Board determined that continuation of the Fund’s investment advisory agreement and the sub-advisory contracts is in the best interest of the Fund and its shareholders and that the compensation payable to Invesco Advisers and the Affiliated Sub-Advisers under the agreements is fair and reasonable.
The Board’s Fund Evaluation Process
The Board’s Investments Committee has established three Sub-Committees, each of which is primarily responsible for overseeing the performance and investment management services provided by Invesco Advisers and the Affiliated Sub-Advisers to a number of the funds advised by Invesco Advisers (the Invesco Funds). The Sub-Committees meet throughout the year to review the performance of their assigned Invesco Funds, including reviewing materials prepared under the direction of the independent Senior Officer, an officer of the Invesco Funds who reports directly to the independent Trustees. Over the course of each year, the Sub-Committees meet with portfolio managers for their assigned Invesco Funds and other members of management to review the performance, investment objective(s), policies, strategies, limitations and investment risks of these funds. The Board had the benefit of reports from the Sub-Committees and Investments Committee throughout the year in considering approval of the continuance of each Invesco Fund’s investment advisory agreement and sub-advisory contracts for another year.
During the contract renewal process, the Board receives comparative performance and fee data regarding the Invesco Funds prepared by Invesco Advisers and Lipper Inc. (Lipper), an independent provider of investment company data. The Board also receives a report and this independent written evaluation from the Senior Officer. The Senior Officer’s evaluation is prepared as part of his responsibility to manage the process by which the Invesco Funds’ proposed management fees are negotiated during the annual contract renewal process to ensure they are negotiated in a manner that is at arms’ length and reasonable. In addition to meetings with Invesco Advisers and fund counsel, the independent Trustees also discuss the continuance of the investment advisory agreement and sub-advisory contracts in separate sessions with the Senior Officer and with independent legal counsel.
The Trustees recognized that the advisory fee rates for the Invesco Funds are, in many cases, the result of years of review and negotiation. The Trustees’ deliberations and conclusions in a particular year may be based in part on their deliberations and conclusions regarding these arrangements throughout the year and in prior years. The Trustees’ review and conclusions are based on the comprehensive consideration of all information presented to them and are not the result of any single determinative factor. Moreover, one Trustee may have weighed a particular piece of information or factor differently than another Trustee.
The discussion below is a summary of the Senior Officer’s independent written evaluation with respect to the Fund’s investment advisory agreement as well as a discussion of the material factors and related conclusions that formed the basis for the Board’s approval of the Fund’s investment advisory agreement and sub-advisory contracts. Unless otherwise stated, this information is current as of June 10, 2015, and does not reflect consideration of factors that became known to the Board after that date.
Factors and Conclusions and Summary of Independent Written Fee Evaluation
| A. | Nature, Extent and Quality of Services Provided by Invesco Advisers and the Affiliated Sub-Advisers |
The Board reviewed the advisory services provided to the Fund by Invesco Advisers under the Fund’s investment advisory agreement, the performance of Invesco Advisers in providing these services, and the credentials and experience of the officers and employees of Invesco Advisers who provide these services, including the Fund’s portfolio manager or managers. The Board’s review of the qualifications of Invesco Advisers to provide advisory services included the Board’s consideration of Invesco Advisers’ investment
process oversight, independent credit analysis and investment risk management. The Board also considered non-advisory services that Invesco Advisers and its affiliates provide to the Invesco Funds such as various back office support functions, equity and fixed income trading operations, internal audit, distribution, valuation and legal and compliance.
In determining whether to continue the Fund’s investment advisory agreement, the Board considered the benefits of reapproving an existing relationship and the greater uncertainty that may be associated with entering into a new relationship. The Board concluded that the nature, extent and quality of the services provided to the Fund by Invesco Advisers are appropriate and satisfactory and consistent with the terms of the Fund’s investment advisory agreement.
The Board reviewed the services that may be provided by the Affiliated Sub-Advisers under the sub-advisory contracts and the credentials and experience of the officers and employees of the Affiliated Sub-Advisers who provide these services. The Board noted that the Affiliated Sub-Advisers have offices and personnel that are located in financial centers around the world. As a result, the Affiliated Sub-Advisers can provide research and investment analysis on the markets and economies of various countries in which the Fund may invest, make recommendations regarding securities and assist with security trades. The Board concluded that the sub-advisory contracts benefit the Fund and its shareholders by permitting Invesco Advisers to use the resources and talents of the Affiliated Sub-Advisers in managing the Fund. The Board concluded that the nature, extent and quality of the services that may be provided by the Affiliated Sub-Advisers are appropriate and satisfactory and consistent with the terms of the Fund’s sub-advisory contracts.
| B. | Fund Performance |
The Board considered Fund performance as a relevant factor in considering whether to approve the investment advisory agreement. The Board did not view Fund performance as a relevant factor in considering whether to approve the sub-advisory contracts for the Fund, as no Affiliated Sub-Adviser currently manages assets of the Fund.
The Board compared the Fund’s performance during the past one, three and five calendar years to the performance of funds in the Lipper performance universe and against the Lipper Global Multi-Cap Growth Funds Index. The Board noted that performance of Class A shares of the Fund was in the second quintile of its performance universe for the one year period and the third quintile for the three and five year periods (the first quintile being the best performing funds and the fifth quintile being the worst performing funds). The Board noted that performance of Class A shares of the Fund was
24 Invesco Global Growth Fund
above the performance of the Index for the one, three and five year periods. The Trustees also reviewed more recent Fund performance and this review did not change their conclusions.
| C. | Advisory and Sub-Advisory Fees |
The Board compared the Fund’s contractual management fee rate to the contractual management fee rates of funds in the Fund’s Lipper expense group at a common asset level. The Board noted that the contractual management fee rate for Class A shares of the Fund was below the median contractual management fee rate of funds in its expense group. The Board noted that the term “contractual management fee” may include both advisory and certain administrative services fees, but that Lipper does not provide information on a fund by fund basis as to what is included. The Board noted that Invesco Advisers does not charge the Invesco Funds for the administrative services included in the term as defined by Lipper. The Board also reviewed the methodology used by Lipper in providing expense group information, which includes using each fund’s contractual management fee schedule (including any applicable breakpoints) as reported in the most recent prospectus or statement of additional information for each fund in the expense group.
The Board also compared the Fund’s effective advisory fee rate (the advisory fee rate after advisory fee waivers and before other expense limitations/waivers) to the effective advisory fee rates of other funds advised by Invesco Advisers and its affiliates with investment strategies comparable to those of the Fund. The Board noted that the Fund’s rate was below the rate of one such fund. The Board noted that Invesco Advisers and the Affiliated Sub-Advisers do not manage other client accounts with investment strategies comparable to those of the Fund.
The Board also considered the services that may be provided by the Affiliated Sub-Advisers pursuant to the sub-advisory contracts, as well as the fees payable by Invesco Advisers to the Affiliated Sub-Advisers pursuant to the sub-advisory contracts. The Board also noted that the sub-advisory fees are not paid directly by the Fund, but rather, are payable by Invesco Advisers to the Affiliated Sub-Advisers.
| D. | Economies of Scale and Breakpoints |
The Board considered the extent to which there are economies of scale in the provision of advisory services to the Fund. The Board also considered whether the Fund benefits from economies of scale through contractual breakpoints in the Fund’s advisory fee schedule. The Board also noted that the Fund shares directly in economies of scale through lower fees charged by third party service providers based on the combined size of the Invesco Funds and other clients advised by Invesco Advisers.
| E. | Profitability and Financial Resources |
The Board reviewed information from Invesco Advisers concerning the costs of the advisory and other services that Invesco Advisers and its affiliates provide to the Fund and the Invesco
Funds and the profitability of Invesco Advisers and its affiliates in providing these services. The Board received information from Invesco Advisers about the methodology used to prepare the profitability information. The Board noted that Invesco Advisers continues to operate at a net profit from services Invesco Advisers and its affiliates provide to the Invesco Funds and the Fund. The Board did not deem the level of profits realized by Invesco Advisers and its affiliates from providing services to the Fund to be excessive given the nature, quality and extent of the services provided. The Board received and accepted information from Invesco Advisers demonstrating that Invesco Advisers and each Affiliated Sub-Adviser are financially sound and have the resources necessary to perform their obligations under the investment advisory agreement and sub-advisory contracts.
| F. | Collateral Benefits to Invesco Advisers and its Affiliates |
The Board considered various other benefits received by Invesco Advisers and its affiliates from the relationship with the Fund, including the fees received for providing transfer agency and distribution services to the Fund. The Board considered comparative information regarding fees charged for these services, including information provided by Lipper and other independent sources. The Board considered the performance of Invesco Advisers and its affiliates in providing these services and the organizational structure employed to provide these services. The Board also considered that these services are provided to the Fund pursuant to written contracts that are reviewed and approved on an annual basis by the Board; and that the services are required for the operation of the Fund.
The Board considered the benefits realized by Invesco Advisers and the Affiliated Sub-Advisers as a result of portfolio brokerage transactions executed through “soft dollar” arrangements. The Board noted that soft dollar arrangements shift the payment obligation for research services from Invesco Advisers and the Affiliated Sub-Advisers to the Invesco Funds and that the research received may be used with other clients of Invesco Advisers and may reduce Invesco Advisers’ and the Affiliated Sub-Advisers’ expenses. The Board also considered that it receives periodic reports from the Chief Compliance Officer of the Invesco Funds demonstrating that these arrangements are consistent with regulatory requirements. The Board did not deem the soft dollar arrangements to be inappropriate.
The Board considered that the Fund’s uninvested cash and cash collateral from any securities lending arrangements may be invested in money market funds advised by Invesco Advisers pursuant to procedures approved by the Board. The Board noted that Invesco Advisers receives advisory fees from these affiliated money market funds attributable to such investments, although Invesco Advisers has contractually agreed to waive through varying periods the advisory fees
payable by the Invesco Funds with respect to investments in the affiliated money market funds. The waiver is in an amount equal to 100% of the net advisory fee Invesco Advisers receives from the affiliated money market funds with respect to the Fund’s investment in the affiliated money market funds of uninvested cash, but not cash collateral. The Board concluded that the amount of advisory fees received by Invesco Advisors from the Fund’s investment of cash collateral from any securities lending arrangements in the affiliated money market funds is fair and reasonable.
The Board also considered the Funds may use an affiliated broker to execute certain trades for the Fund to, among other things, control information leakage, and were advised that such trades would be executed in compliance with rules under the Investment Company Act of 1940, as amended, and consistent with best execution obligations.
25 Invesco Global Growth Fund
Tax Information
Form 1099-DIV, Form 1042-S and other year-end tax information provide shareholders with actual calendar year amounts that should be included in their tax returns. Shareholders should consult their tax advisors.
The following distribution information is being provided as required by the Internal Revenue Code or to meet a specific state’s requirement.
The Fund designates the following amounts or, if subsequently determined to be different, the maximum amount allowable for its fiscal year ended October 31, 2015:
Federal and State Income Tax | ||||
Long-Term Capital Gain Distributions | $ | 24,388,486 | ||
Qualified Dividend Income* | 100.00 | % | ||
Corporate Dividends Received Deduction* | 27.00 | % | ||
U.S. Treasury Obligations* | 0.00 | % | ||
| * | The above percentages are based on ordinary income dividends paid to shareholders during the Fund’s fiscal year. |
Non-Resident Alien Shareholders | ||||
Qualified Short-Term Gains | $ | 1,928,775 | ||
26 Invesco Global Growth Fund
Trustees and Officers
The address of each trustee and officer is AIM International Mutual Funds (Invesco International Mutual Funds) (the “Trust”), 11 Greenway Plaza, Suite 1000, Houston, Texas 77046-1173. The trustees serve for the life of the Trust, subject to their earlier death, incapacitation, resignation, retirement or removal as more specifically provided in the Trust’s organizational documents. Each officer serves for a one year term or until their successors are elected and qualified. Column two below includes length of time served with predecessor entities, if any.
| Name, Year of Birth and Position(s) Held with the Trust | Trustee and/ or Officer Since | Principal Occupation(s) During Past 5 Years | Number of Funds in Fund Complex Overseen by Trustee | Other Directorship(s) Past 5 Years | ||||
| Interested Persons | ||||||||
Martin L. Flanagan1 — 1960 Trustee | 2007 | Executive Director, Chief Executive Officer and President, Invesco Ltd. (ultimate parent of Invesco and a global investment management firm); Advisor to the Board, Invesco Advisers, Inc. (formerly known as Invesco Institutional (N.A.), Inc.); Trustee, The Invesco Funds; Vice Chair, Investment Company Institute; and Member of Executive Board, SMU Cox School of Business
Formerly: Chairman and Chief Executive Officer, Invesco Advisers, Inc. (registered investment adviser); Director, Chairman, Chief Executive Officer and President, IVZ Inc. (holding company), INVESCO Group Services, Inc. (service provider) and Invesco North American Holdings, Inc. (holding company); Director, Chief Executive Officer and President, Invesco Holding Company Limited (parent of Invesco and a global investment management firm); Director, Invesco Ltd.; Chairman, Investment Company Institute and President, Co-Chief Executive Officer, Co-President, Chief Operating Officer and Chief Financial Officer, Franklin Resources, Inc. (global investment management organization). | 145 | None | ||||
Philip A. Taylor2 — 1954 Trustee, President and Principal Executive Officer | 2006 | Head of North American Retail and Senior Managing Director, Invesco Ltd.; Director, Co-Chairman, Co-President and Co-Chief Executive Officer, Invesco Advisers, Inc. (formerly known as Invesco Institutional (N.A.), Inc.) (registered investment adviser); Director, Chairman, Chief Executive Officer and President, Invesco Management Group, Inc. (formerly known as Invesco Aim Management Group, Inc.) (financial services holding company); Director and President, INVESCO Funds Group, Inc. (registered investment adviser and registered transfer agent); Director and Chairman, Invesco Investment Services, Inc. (formerly known as Invesco Aim Investment Services, Inc.) (registered transfer agent) and IVZ Distributors, Inc. (formerly known as INVESCO Distributors, Inc.) (registered broker dealer); Chief Executive Officer, Invesco Corporate Class Inc. (corporate mutual fund company) Director, Chairman and Chief Executive Officer, Invesco Canada Ltd. (formerly known as Invesco Trimark Ltd./Invesco Trimark Ltèe) (registered investment adviser and registered transfer agent); Trustee, President and Principal Executive Officer, The Invesco Funds (other than AIM Treasurer’s Series Trust (Invesco Treasurer’s Series Trust), Short-Term Investments Trust and Invesco Management Trust); Trustee and Executive Vice President, The Invesco Funds (AIM Treasurer’s Series Trust (Invesco Treasurer’s Series Trust), Short-Term Investments Trust and Invesco Management Trust only); Director, Invesco Investment Advisers LLC (formerly known as Van Kampen Asset Management); Director, Chief Executive Officer and President, Van Kampen Exchange Corp.
Formerly: Director, President and Chairman, Invesco Inc. (holding company), Invesco Canada Holdings Inc. (holding company), Trimark Investments Ltd./Placements Trimark Ltèe and Invesco Financial Services Ltd/Services Financiers Invesco Ltèe; Chiief Executive Officer, Invesco Canada Fund Inc (corporate mutual fund company); Director and Chairman, Van Kampen Investor Services Inc.; Director, Chief Executive Officer and President, 1371 Preferred Inc. (holding company) and Van Kampen Investments Inc.; Director and President, AIM GP Canada Inc. (general partner for limited partnerships) and Van Kampen Advisors, Inc.; Director and Chief Executive Officer, Invesco Trimark Dealer Inc. (registered broker dealer); Director, Invesco Distributors, Inc. (formerly known as Invesco Aim Distributors, Inc.) (registered broker dealer); Manager, Invesco PowerShares Capital Management LLC; Director, Chief Executive Officer and President, Invesco Advisers, Inc.; Director, Chairman, Chief Executive Officer and President, Invesco Aim Capital Management, Inc.; President, Invesco Trimark Dealer Inc. and Invesco Trimark Ltd./Invesco Trimark Ltèe; Director and President, AIM Trimark Corporate Class Inc. and AIM Trimark Canada Fund Inc.; Senior Managing Director, Invesco Holding Company Limited; Director and Chairman, Fund Management Company (former registered broker dealer); President and Principal Executive Officer, The Invesco Funds (AIM Treasurer’s Series Trust (Invesco Treasurer’s Series Trust), and Short-Term Investments Trust only); President, AIM Trimark Global Fund Inc. and AIM Trimark Canada Fund Inc.. | 145 | None |
| 1 | Mr. Flanagan is considered an interested person (within the meaning of Section 2(a)(19) of the 1940 Act) of the Trust because he is an officer of the Adviser to the Trust, and an officer and a director of Invesco Ltd., ultimate parent of the Adviser. |
| 2 | Mr. Taylor is considered an interested person (within the meaning of Section 2(a)(19) of the 1940 Act) of the Trust because he is an officer and a director of the Adviser. |
T-1 Invesco Global Growth Fund
Trustees and Officers—(continued)
| Name, Year of Birth and Position(s) Held with the Trust | Trustee and/ or Officer Since | Principal Occupation(s) During Past 5 Years | Number of Funds in Fund Complex Overseen by Trustee | Other Directorship(s) Past 5 Years | ||||
| Independent Trustees | ||||||||
Bruce L. Crockett — 1944 Trustee and Chair | 2003 | Chairman, Crockett Technologies Associates (technology consulting company)
Formerly: Director, Captaris (unified messaging provider); Director, President and Chief Executive Officer, COMSAT Corporation; Chairman, Board of Governors of INTELSAT (international communications company); ACE Limited (insurance company); Independent Directors Council and Investment Company Institute | 145 | ALPS (Attorneys Liability Protection Society) (insurance company) and Globe Specialty Metals, Inc. (metallurgical company) | ||||
David C. Arch — 1945 Trustee | 2010 | Chairman of Blistex Inc., a consumer health care products manufacturer | 145 | Board member of the Illinois Manufacturers’ Association; Member of the Board of Visitors, Institute for the Humanities, University of Michigan; Member of the Audit Committee of the Edward-Elmhurst Hospital | ||||
James T. Bunch — 1942 Trustee | 2000 | Managing Member, Grumman Hill Group LLC (family office/private equity investments)
Formerly: Founder, Green Manning & Bunch Ltd. (investment banking firm) (1988-2010); Executive Committee, United States Golf Association; and Chairman, Board of Governors, Western Golf Association | 145 | Chairman of the Board of Trustees, Evans Scholars Foundation; and Chairman of the Board, Denver Film Society | ||||
Rodney F. Dammeyer — 1940 Trustee | 2010 | Chairman of CAC, LLC, (private company offering capital investment and management advisory services)
Formerly: Prior to 2001, Managing Partner at Equity Group Corporate Investments; Prior to 1995, Chief Executive Officer of Itel Corporation (formerly Anixter International); Prior to 1985, experience includes Senior Vice President and Chief Financial Officer of Household International, Inc., Executive Vice President and Chief Financial Officer of Northwest Industries, Inc. and Partner of Arthur Andersen & Co.; From 1987 to 2010, Director/Trustee of investment companies in the Van Kampen Funds complex | 145 | Director of Quidel Corporation and Stericycle, Inc. | ||||
Albert R. Dowden — 1941 Trustee | 2003 | Director of a number of public and private business corporations, including the Boss Group, Ltd. (private investment and management); Nature’s Sunshine Products, Inc. and Reich & Tang Funds (5 portfolios) (registered investment company)
Formerly: Director, Homeowners of America Holding Corporation/Homeowners of America Insurance Company (property casualty company); Director, Continental Energy Services, LLC (oil and gas pipeline service); Director, CompuDyne Corporation (provider of product and services to the public security market) and Director, Annuity and Life Re (Holdings), Ltd. (reinsurance company); Director, President and Chief Executive Officer, Volvo Group North America, Inc.; Senior Vice President, AB Volvo; Director of various public and private corporations; Chairman, DHJ Media, Inc.; Director, Magellan Insurance Company; and Director, The Hertz Corporation, Genmar Corporation (boat manufacturer), National Media Corporation; Advisory Board of Rotary Power International (designer, manufacturer, and seller of rotary power engines); and Chairman, Cortland Trust, Inc. (registered investment company) | 145 | Director of: Nature’s Sunshine Products, Inc., Reich & Tang Funds, Homeowners of America Holding Corporation/ Homeowners of America Insurance Company, the Boss Group | ||||
Jack M. Fields — 1952 Trustee | 2003 | Chief Executive Officer, Twenty First Century Group, Inc. (government affairs company); Owner and Chief Executive Officer, Dos Angeles Ranch, L.P. (cattle, hunting, corporate entertainment); and Discovery Global Education Fund (non-profit)
Formerly: Chief Executive Officer, Texana Timber LP (sustainable forestry company); Director of Cross Timbers Quail Research Ranch (non-profit); and member of the U.S. House of Representatives | 145 | Insperity, Inc. (formerly known as Administaff) | ||||
Prema Mathai-Davis — 1950 Trustee | 2003 | Retired. Formerly: Chief Executive Officer, YWCA of the U.S.A. | 145 | None | ||||
Larry Soll — 1942 Trustee | 1997 | Retired. Formerly: Chairman, Chief Executive Officer and President, Synergen Corp. (a biotechnology company) | 145 | None | ||||
Hugo F. Sonnenschein — 1940 Trustee | 2010 | President Emeritus and Honorary Trustee of the University of Chicago and the Adam Smith Distinguished Service Professor in the Department of Economics at the University of Chicago. Prior to 2000, President of the University of Chicago | 145 | Trustee of the University of Rochester and a member of its investment committee; Member of the National Academy of Sciences and the American Philosophical Society; Fellow of the American Academy of Arts and Sciences | ||||
Raymond Stickel, Jr. — 1944 Trustee | 2005 | Retired. Formerly: Director, Mainstay VP Series Funds, Inc. (25 portfolios) and Partner, Deloitte & Touche | 145 | None |
T-2 Invesco Global Growth Fund
Trustees and Officers—(continued)
| Name, Year of Birth and Position(s) Held with the Trust | Trustee and/ or Officer Since | Principal Occupation(s) During Past 5 Years | Number of Funds in Fund Complex Overseen by Trustee | Other Directorship(s) Past 5 Years | ||||
| Independent Trustees—(continued) | ||||||||
Suzanne H. Woolsey — 1941 Trustee | 2014 | Chief Executive Officer of Woolsey Partners LLC | 145 | Emeritus Chair of the Board of Trustees of the Institute for Defense Analyses; Trustee of Colorado College; Trustee of California Institute of Technology; Prior to 2014, Director of Fluor Corp.; Prior to 2010, Trustee of the German Marshall Fund of the United States; Prior to 2010 Trustee of the Rocky Mountain Institute | ||||
| Other Officers | ||||||||
Russell C. Burk — 1958 Senior Vice President and Senior Officer | 2005 | Senior Vice President and Senior Officer, The Invesco Funds | N/A | N/A | ||||
John M. Zerr — 1962 Senior Vice President, Chief Legal Officer and Secretary | 2006 | Director, Senior Vice President, Secretary and General Counsel, Invesco Management Group, Inc. (formerly known as Invesco Aim Management Group, Inc.) and Van Kampen Exchange Corp.; Senior Vice President, Invesco Advisers, Inc. (formerly known as Invesco Institutional (N.A.), Inc.) (registered investment adviser); Senior Vice President and Secretary, Invesco Distributors, Inc. (formerly known as Invesco Aim Distributors, Inc.); Director, Vice President and Secretary, Invesco Investment Services, Inc. (formerly known as Invesco Aim Investment Services, Inc.) and IVZ Distributors, Inc. (formerly known as INVESCO Distributors, Inc.); Director and Vice President, INVESCO Funds Group, Inc.; Senior Vice President, Chief Legal Officer and Secretary, The Invesco Funds; Managing Director, Invesco PowerShares Capital Management LLC; Director, Secretary and General Counsel, Invesco Investment Advisers LLC (formerly known as Van Kampen Asset Management); Secretary and General Counsel, Invesco Capital Markets, Inc. (formerly known as Van Kampen Funds Inc.) and Chief Legal Officer, PowerShares Exchange-Traded Fund Trust, PowerShares Exchange-Traded Fund Trust II, PowerShares India Exchange-Traded Fund Trust, PowerShares Actively Managed Exchange-Traded Fund Trust, and PowerShares Actively Managed Exchange-Traded Commodity Fund Trust
Formerly: Director and Vice President, Van Kampen Advisors Inc.; Director, Vice President, Secretary and General Counsel, Van Kampen Investor Services Inc.; Director, Invesco Distributors, Inc. (formerly known as Invesco Aim Distributors, Inc.); Director, Senior Vice President, General Counsel and Secretary, Invesco Aim Advisers, Inc. and Van Kampen Investments Inc.; Director, Vice President and Secretary, Fund Management Company; Director, Senior Vice President, Secretary, General Counsel and Vice President, Invesco Aim Capital Management, Inc.; Chief Operating Officer and General Counsel, Liberty Ridge Capital, Inc. (an investment adviser); Vice President and Secretary, PBHG Funds (an investment company) and PBHG Insurance Series Fund (an investment company); Chief Operating Officer, General Counsel and Secretary, Old Mutual Investment Partners (a broker-dealer); General Counsel and Secretary, Old Mutual Fund Services (an administrator) and Old Mutual Shareholder Services (a shareholder servicing center); Executive Vice President, General Counsel and Secretary, Old Mutual Capital, Inc. (an investment adviser); and Vice President and Secretary, Old Mutual Advisors Funds (an investment company) | N/A | N/A | ||||
Sheri Morris — 1964 Vice President, Treasurer and Principal Financial Officer | 2003 | Vice President, Treasurer and Principal Financial Officer, The Invesco Funds; Vice President, Invesco Advisers, Inc. (formerly known as Invesco Institutional (N.A.), Inc.) (registered investment adviser); and Vice President, PowerShares Exchange-Traded Fund Trust, PowerShares Exchange-Traded Fund Trust II, PowerShares India Exchange-Traded Fund Trust, PowerShares Actively Managed Exchange-Traded Fund Trust, and PowerShares Actively Managed Exchange-Traded Commodity Fund Trust
Formerly: Vice President, Invesco Aim Advisers, Inc., Invesco Aim Capital Management, Inc. and Invesco Aim Private Asset Management, Inc.; Assistant Vice President and Assistant Treasurer, The Invesco Funds and Assistant Vice President, Invesco Advisers, Inc., Invesco Aim Capital Management, Inc. and Invesco Aim Private Asset Management, Inc.; and Treasurer, PowerShares Exchange-Traded Fund Trust, PowerShares Exchange-Traded Fund Trust II, PowerShares India Exchange-Traded Fund Trust and PowerShares Actively Managed Exchange-Traded Fund Trust | N/A | N/A | ||||
T-3 Invesco Global Growth Fund
Trustees and Officers—(continued)
| Name, Year of Birth and Position(s) Held with the Trust | Trustee and/ or Officer Since | Principal Occupation(s) During Past 5 Years | Number of Funds in Fund Complex Overseen by Trustee | Other Directorship(s) Past 5 Years | ||||
| Other Officers—(continued) | ||||||||
Karen Dunn Kelley — 1960 Vice President | 2003 | Senior Managing Director, Investments, Invesco Ltd.; Director, Co-President, Co-Chief Executive Officer, and Co-Chairman, Invesco Advisers, Inc. (formerly known as Invesco Institutional (N.A.), Inc.) (registered investment adviser); Chairman, Invesco Senior Secured Management, Inc.; Senior Vice President, Invesco Management Group, Inc. (formerly known as Invesco Aim Management Group, Inc.); Executive Vice President, Invesco Distributors, Inc. (formerly known as Invesco Aim Distributors, Inc.); Director, Invesco Mortgage Capital Inc. and Invesco Management Company Limited; Vice President, The Invesco Funds (other than AIM Treasurer’s Series Trust (Invesco Treasurer’s Series Trust), Short-Term Investments Trust and Invesco Management Trust); and President and Principal Executive Officer, The Invesco Funds (AIM Treasurer’s Series Trust (Invesco Treasurer’s Series Trust), Short-Term Investments Trust and Invesco Management Trust only)
Formerly: Director and President, INVESCO Asset Management (Bermuda) Ltd., Director, INVESCO Global Asset Management Limited and INVESCO Management S.A.; Senior Vice President, Van Kampen Investments Inc. and Invesco Advisers, Inc. (formerly known as Invesco Institutional (N.A.), Inc.) (registered investment adviser); Vice President, Invesco Advisers, Inc. (formerly known as Invesco Institutional (N.A.), Inc.); Director of Cash Management and Senior Vice President, Invesco Advisers, Inc. and Invesco Aim Capital Management, Inc.; Director and President, Fund Management Company; Chief Cash Management Officer, Director of Cash Management, Senior Vice President, and Managing Director, Invesco Aim Capital Management, Inc.; Director of Cash Management, Senior Vice President, and Vice President, Invesco Advisers, Inc. and The Invesco Funds (AIM Treasurer’s Series Trust (Invesco Treasurer’s Series Trust), and Short-Term Investments Trust only) | N/A | N/A | ||||
Crissie M. Wisdom — 1969 Anti-Money Laundering Compliance Officer | 2013 | Anti-Money Laundering Compliance Officer, Invesco Advisers, Inc. (formerly known as Invesco Institutional (N.A.), Inc.) (registered investment adviser), Invesco Capital Markets, Inc. (formerly known as Van Kampen Funds Inc.), Invesco Distributors, Inc., Invesco Investment Services, Inc., Invesco Management Group, Inc., Van Kampen Exchange Corp., The Invesco Funds, and PowerShares Exchange-Traded Fund Trust, PowerShares Exchange-Traded Fund Trust II, PowerShares India Exchange-Traded Fund Trust, PowerShares Actively Managed Exchange-Traded Fund Trust and PowerShares Actively Managed Exchange-Traded Commodity Fund Trust; Anti-Money Laundering Compliance Officer and Bank Secrecy Act Officer, INVESCO National Trust Company and Invesco Trust Company; and Fraud Prevention Manager and Controls and Risk Analysis Manager for Invesco Investment Services, Inc.. | N/A | N/A | ||||
Lisa O. Brinkley — 1959 Chief Compliance Officer | 2015 | Senior Vice President and Chief Compliance Officer, Invesco Advisers, Inc. (registered investment adviser) (formerly known as Invesco Institutional (N.A., Inc.); and Chief Compliance Officer, The Invesco Funds
Formerly: Global Assurance Officer, Invesco Ltd. and Vice President, The Invesco Funds; Chief Compliance Officer, Invesco Distributors, Inc. (formerly known as Invesco Aim Distributors, Inc.), Invesco Investment Services, Inc.(formerly known as Invesco Aim Investment Services, Inc.) and Van Kampen Investor Services Inc.; Senior Vice President, Invesco Management Group, Inc.; Senior Vice President and Chief Compliance Officer, Invesco Advisers, Inc. and The Invesco Funds; Vice President and Chief Compliance Officer, Invesco Aim Capital Management, Inc. and Invesco Distributors, Inc.; Vice President, Invesco Investment Services, Inc. and Fund Management Company. | N/A | N/A |
The Statement of Additional Information of the Trust includes additional information about the Fund’s Trustees and is available upon request, without charge, by calling 1.800.959.4246. Please refer to the Fund’s prospectus for information on the Fund’s sub-advisers.
Office of the Fund 11 Greenway Plaza, Suite 1000 Houston, TX 77046-1173 | Investment Adviser Invesco Advisers, Inc. 1555 Peachtree Street, N.E. Atlanta, GA 30309 | Distributor Invesco Distributors, Inc. 11 Greenway Plaza, Suite 1000 Houston, TX 77046-1173 | Auditors PricewaterhouseCoopers LLP 1000 Louisiana Street, Suite 5800 Houston, TX 77002-5678 | |||
Counsel to the Fund Stradley Ronon Stevens & Young, LLP 2005 Market Street, Suite 2600 Philadelphia, PA 19103-7018 | Counsel to the Independent Trustees Goodwin Procter LLP 901 New York Avenue, N.W. Washington, D.C. 20001 | Transfer Agent Invesco Investment Services, Inc. 11 Greenway Plaza, Suite 1000 Houston, TX 77046-1173 | Custodian State Street Bank and Trust Company 225 Franklin Street Boston, MA 02110-2801 | |||
T-4 Invesco Global Growth Fund

Invesco mailing information
Send general correspondence to Invesco Investment Services, Inc., P.O. Box 219078, Kansas City, MO 64121-9078.
Important notice regarding delivery of security holder documents
To reduce Fund expenses, only one copy of most shareholder documents may be mailed to shareholders with multiple accounts at the same address (Householding). Mailing of your shareholder documents may be householded indefinitely unless you instruct us otherwise. If you do not want the mailing of these documents to be combined with those for other members of your house-hold, please contact Invesco Investment Services, Inc. at 800 959 4246 or contact your financial institution. We will begin send-ing you individual copies for each account within 30 days after receiving your request.
Fund holdings and proxy voting information
The Fund provides a complete list of its holdings four times in each fiscal year, at the quarter ends. For the second and fourth quarters, the lists appear in the Fund’s semiannual and annual reports to shareholders. For the first and third quarters, the Fund files the lists with the Securities and Exchange Commission (SEC) on Form N-Q. The most recent list of portfolio holdings is available at invesco.com/completeqtrholdings. Shareholders can also look up the Fund’s Forms N-Q on the SEC website at sec.gov. Copies of the Fund’s Forms N-Q may be reviewed and copied at the SEC Public Reference Room in Washington, D.C. You can obtain information on the operation of the Public Reference Room, including information about duplicating fee charges, by calling 202 551 8090 or 800 732 0330, or by electronic request at the following email address: publicinfo@sec.gov. The SEC file numbers for the Fund are shown below.
A description of the policies and procedures that the Fund uses to determine how to vote proxies relating to portfolio securities is available without charge, upon request, from our Client Services department at 800 959 4246 or at invesco.com/proxyguidelines. The information is also available on the SEC website, sec.gov.
Information regarding how the Fund voted proxies related to its portfolio securities during the most recent 12-month period ended June 30 is available at invesco.com/proxysearch. The information is also available on the SEC website, sec.gov. Invesco Advisers, Inc. is an investment adviser; it provides investment advisory services to individual and institutional clients and does not sell securities. Invesco Distributors, Inc. is the US distributor for Invesco Ltd.’s retail mutual funds, exchange-traded funds and institutional money market funds. Both are wholly owned, indirect subsidiaries of Invesco Ltd. | |
SEC file numbers: 811-06463 and 033-44611 GLG-AR-1 Invesco Distributors, Inc.
| ||||
 | Annual Report to Shareholders
| October 31, 2015 | ||
| ||||
Invesco Global Opportunities Fund
| ||||
| Nasdaq: | ||||
| A: IAOPX n C: ICOPX n R: IROPX n Y: IYOPX n R5: IIOPX n R6: IFOPX | ||||

Letters to Shareholders
Philip Taylor | Dear Shareholders: This annual report includes information about your Fund, including performance data and a complete list of its investments as of the close of the reporting period. Inside is a discussion of how your Fund was managed and the factors that affected its performance during the reporting period. I hope you find this report of interest. The US economy expanded and unemployment declined throughout the reporting period. Continuing low energy prices benefited consumers, but a strong US dollar crimped corporate profits. The US Federal Reserve signaled that it was increasingly likely to raise interest rates, based on generally positive economic data, but uncertainty remained about when it might act. Overseas, the story was much different. Low energy prices hurt the economies of some oil-producing nations, such as Brazil and Russia. During the reporting period, the European Central Bank as well as central banks in China and Japan – among other countries – either instituted |

or maintained extraordinarily accommodative monetary policies in response to economic weakness.
Investor uncertainty, such as we saw for much of the reporting period – and market volatility, such as we saw at the end of the reporting period – are unfortunate facts of life when it comes to investing. Some investors use these things as excuses to delay saving and investing for their long-term financial goals. That’s why Invesco encourages investors to work with a professional financial adviser who can stress the importance of starting to save and invest early and the importance of adhering to a disciplined investment plan – when times are good and when they’re uncertain. A financial adviser who knows your unique financial situation, investment goals and risk tolerance can be an invaluable partner as you seek to achieve your financial goals. He or she can offer a long-term perspective when markets are volatile and time-tested advice and guidance when your financial situation or investment goals change.
Timely information when and where you want it
Invesco’s efforts to help investors achieve their financial objectives include providing individual investors and financial professionals with timely information about the markets, the economy and investing – whenever and wherever they want it.
Our website, invesco.com/us, offers a wide range of market insights and investment perspectives. On the website, you’ll find detailed information about our funds, including prices, performance, holdings and portfolio manager commentaries. You can access information about your account by completing a simple, secure online registration. Click on the “Need to register” link in the “Account Access” box on our homepage to get started.
Invesco’s mobile apps for iPhone® and iPad® (both available free from the App StoreSM) allow you to obtain the same detailed information, monitor your account and create customizable watch lists. Also, they allow you to access investment insights from our investment leaders, market strategists, economists and retirement experts. You can sign up to be alerted when new commentary is added, and you can watch portfolio manager videos and have instant access to Invesco news and updates wherever you may be.
In addition to the resources accessible on our website and through our mobile app, you can obtain timely updates to help you stay informed about the markets, the economy and investing by connecting with Invesco on Twitter, LinkedIn or Facebook. You can access our blog at blog.invesco.us.com. Our goal is to provide you the information you want, when and where you want it.
Have questions?
For questions about your account, feel free to contact an Invesco client services representative at 800 959 4246. For Invesco-related questions or comments, please email me directly at phil@invesco.com.
All of us at Invesco look forward to serving your investment management needs for many years to come. Thank you for investing with us.
Sincerely,

Philip Taylor
Senior Managing Director, Invesco Ltd.
iPhone and iPad are trademarks of Apple Inc., registered in the US and other countries. App Store is a service mark of Apple Inc. Invesco Distributors, Inc. is not affiliated with Apple Inc.
2 Invesco Global Opportunities Fund
Bruce Crockett | Dear Fellow Shareholders: Among the many important lessons I’ve learned in more than 40 years in a variety of business endeavors is the value of a trusted advocate. As independent chair of the Invesco Funds Board, I can assure you that the members of the Board are strong advocates for the interests of investors in Invesco’s mutual funds. We work hard to represent your interests through oversight of the quality of the investment management services your funds receive and other matters important to your investment, including but not limited to: n Ensuring that Invesco offers a diverse lineup of mutual funds that your financial adviser can use to strive to meet your financial needs as your investment goals change over time. n Monitoring how the portfolio management teams of the Invesco funds are performing in light of changing economic and market conditions. |

| n | Assessing each portfolio management team’s investment performance within the context of the investment strategy described in the fund’s prospectus. |
| n | Monitoring for potential conflicts of interests that may impact the nature of the services that your funds receive. |
We believe one of the most important services we provide our fund shareholders is the annual review of the funds’ advisory and sub-advisory contracts with Invesco Advisers and its affiliates. This review is required by the Investment Company Act of 1940 and focuses on the nature and quality of the services Invesco provides as the adviser to the Invesco funds and the reasonableness of the fees that it charges for those services. Each year, we spend months carefully reviewing information received from Invesco and a variety of independent sources, such as performance and fee data prepared by Lipper Inc., an independent, third-party firm widely recognized as a leader in its field. We also meet with our independent legal counsel and other independent advisers to review and help us assess the information that we have received. Our goal is to assure that you receive quality investment management services for a reasonable fee.
I trust the measures outlined above provide assurance that you have a worthy advocate when it comes to choosing the Invesco Funds.
As always, please contact me at bruce@brucecrockett.com with any questions or concerns you may have. On behalf of the Board, we look forward to continuing to represent your interests and serving your needs.
Sincerely,

Bruce L. Crockett
Independent Chair
Invesco Funds Board of Trustees
3 Invesco Global Opportunities Fund
Management’s Discussion of Fund Performance
Performance summary
For the fiscal year ended October 31, 2015, Class A shares of Invesco Global Opportunities Fund (the Fund), at net asset value (NAV), outperformed the MSCI All Country World Index, the Fund’s broad market/style-specific index.
Your Fund’s long-term performance appears later in this report.
Fund vs. Indexes
Total returns, 10/31/14 to 10/31/15, at net asset value (NAV). Performance shown does not include applicable contingent deferred sales charges (CDSC) or front-end sales charges, which would have reduced performance.
| Class A Shares | 1.76 | % | |||
| Class C Shares | 0.86 | ||||
| Class R Shares | 1.31 | ||||
| Class Y Shares | 1.90 | ||||
| Class R5 Shares | 1.97 | ||||
| Class R6 Shares | 1.97 | ||||
| MSCI All Country World Index▼ (Broad Market/Style-Specific Index) | -0.03 | ||||
| Lipper Global Large-Cap Core Funds Indexn (Peer Group Index) | -0.17 | ||||
Source(s): ▼FactSet Research Systems Inc.; nLipper Inc. |
Market conditions and your Fund
Global markets experienced increased volatility during the reporting period, driven largely by the continued slowdown in energy markets and the economic downturn in China. Developed markets were generally able to withstand these headwinds, even as more fragile emerging markets began to falter.
As the reporting period began in late 2014, international equity markets moved higher, although economic growth appeared to be somewhat stronger in the US than in the rest of the world. Equity markets globally were recovering from the initial crash of oil prices when OPEC added additional uncertainty by deciding to maintain high production despite low prices and slowing global growth. In this environment, commodity-based economies and most currencies underperformed those of the US.
Global markets were rattled again amid growing concerns that Greece and the eurozone would fail to reach an agreement on a financial bailout plan. However, those fears subsided
when a bailout was ultimately approved. The eurozone also benefited from generally positive economic data, which helped markets weather subsequent economic volatility.
In the summer of 2015, fears of a potential economic slowdown in China dominated headlines. The combination of a slowing Chinese economy, a sharp sell-off in domestic Chinese equities and the devaluation of China’s currency, the renminbi, contributed to a strong correction in global equity markets. Emerging markets, in particular, were hard hit by events in China and by continued weak commodity prices – as well as by the US Federal Reserve’s decision to delay raising interest rates, which increased investor uncertainty and market volatility.
From a sector perspective, stock selection in the information technology and materials sectors contributed to Fund performance relative to the broad market/style-specific benchmark, even though the materials sector struggled more broadly during the reporting period
due to falling commodity prices. The Fund’s holdings in the consumer discretionary sector were the most significant detractors from relative performance. Overweight exposure to and stock selection in the industrials sector also detracted from the Fund’s relative performance.
On a geographic basis, the Fund’s holdings in Europe outperformed those of the broad market/style-specific benchmark and were among the most significant contributors to the Fund’s relative performance. Underweight exposure to the US, which was one of the stronger equity markets globally during the reporting period, detracted from relative performance.
In reviewing which holdings contributed to or detracted from Fund performance, it’s important to reiterate that these are shaped by the stocks selected through our conviction-led and valuation-focused investment process. For example, Brazil-based homebuilder EZTEC Empreendimentos e Participacoes (EZTEC) was the Fund’s largest individual detractor for the reporting period, both as a result of the company’s declining share price and as a result of the weakening Brazilian real. In our view, the company’s shares have been heavily undervalued as the market remained fixated on the negative sentiment surrounding the Brazilian economy, giving little credit to the inherent qualities of the business. This meant that as a result of this exposure, Latin America was the largest detractor from Fund performance on a geographic basis, although the performance story really came down to this single stock. Importantly, we remain confident in the long-term outlook for EZTEC.
First Republic Bank was the Fund’s largest individual contributor over the reporting period. The San Francisco-headquartered bank performed well operationally,
| Portfolio Composition | |||||
By sector
|
| % of total net assets
|
| ||
| Financials | 34.2 | % | |||
| Industrials | 16.8 | ||||
| Consumer Discretionary | 11.8 | ||||
| Information Technology | 10.7 | ||||
| Energy | 10.1 | ||||
| Consumer Staples | 9.7 | ||||
| Materials | 3.2 | ||||
Money Market Funds Plus Other Assets Less Liabilities | 3.5 |
| Top 10 Equity Holdings* | |||||
% of total net assets
| |||||
| 1. Citigroup Inc. | 5.1 | % | |||
| 2. JPMorgan Chase & Co. | 5.1 | ||||
| 3. MasterCard, Inc.-Class A | 4.3 | ||||
| 4. American Express Co. | 4.2 | ||||
| 5. First Republic Bank | 4.1 | ||||
6. Royal Dutch Shell PLC- Class A | 3.9 | ||||
| 7. Statoil ASA | 3.9 | ||||
| 8. Airbus Group SE | 3.6 | ||||
| 9. United Technologies Corp. | 3.3 | ||||
| 10. Standard Chartered PLC | 3.2 |
| Total Net Assets | $20.3 million | ||||
| Total Number of Holdings* | 40 | ||||
The Fund’s holdings are subject to change, and there is no assurance that the Fund will continue to hold any particular security.
*Excluding money market fund holdings.
Data presented here are as of October 31, 2015.
4 Invesco Global Opportunities Fund
with strong third quarter financial results. Netease, one of China’s leading Internet technology and video game companies, also contributed to the Fund’s results. The company’s fundamentals remained strong, buoyed by higher projected earnings and revenues. Although shares fell in August as part of the sell-off in China’s equity markets, they declined by less than the broader market and later regained most of the losses.
Banking and financial services provider Standard Chartered was one of the largest detractors from Fund performance during the reporting period. Sliding commodity prices and heavy losses in Asian equity markets negatively impacted the stock during the third quarter of 2015. However, we believe that the market over-discounted the risks in the company’s loan portfolio, and we are optimistic about the potential changes that could be introduced by incoming chief executive officer Bill Winters.
In terms of portfolio positioning, early in the reporting period we sold out of Roche Holding and Novartis as we believed the health care sector as a whole had made impressive gains over the past five years, and that there were better risk-adjusted returns to be found elsewhere. We used some of the proceeds to establish new holdings in some underrated sectors and stocks. In the financials sector, for instance, we initiated positions in American Express and London Stock Exchange Group. Because we believe that extreme market movements, like those experienced during the reporting period, can create buying opportunities, as correlations rise and selling can be somewhat indiscriminate, we increased positions in some current holdings at what we believed were attractive prices.
Invesco Global Opportunities Fund seeks to invest in companies with sound fundamentals, good management, strong balance sheets and attractive valuations, regardless of their location. As bottom-up stock pickers, we seek out the most attractive and compelling investment opportunities from around the world, unconstrained by limitations on market capitalization, style or sector. We will continue to do so.
We thank you for your investment in Invesco Global Opportunities Fund.
The views and opinions expressed in management’s discussion of Fund performance are those of Invesco Advisers, Inc. These views and opinions are subject to change at any time based on factors such as market and economic conditions. These views and opinions may not be relied upon as investment advice or recommendations, or as an offer for a particular security. The information is not a complete analysis of every aspect of any market, country, industry, security or the Fund. Statements of fact are from sources considered reliable, but Invesco Advisers, Inc. makes no representation or warranty as to their completeness or accuracy. Although historical performance is no guarantee of future results, these insights may help you understand our investment management philosophy.
See important Fund and, if applicable, index disclosures later in this report.
Stephen Anness
Portfolio Manager, is lead manager of Invesco Global Opportunities Fund. He joined Invesco in 2002. Mr. Anness earned a BSc in economics from the University of Swansea, the Securities Institute Diploma and the Investment Management Certificate.
Andrew Hall
Portfolio Manager, is manager of Invesco Global Opportunities Fund. He joined Invesco in 2013. Mr. Hall earned a BSc degree in economics from Nottingham University.
5 Invesco Global Opportunities Fund
Your Fund’s Long-Term Performance
Results of a $10,000 Investment – Oldest Share Class(es) since Inception
Fund and index data from 8/3/12
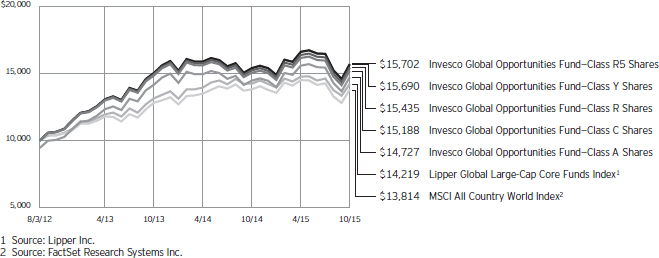
Past performance cannot guarantee comparable future results.
The data shown in the chart include reinvested distributions, applicable sales charges and Fund expenses including
management fees. Index results include reinvested dividends, but they do not reflect sales charges. Performance of the peer group, if applicable, reflects fund expenses and management fees;
performance of a market index does not. Performance shown in the chart and table(s) does not reflect deduction of taxes a shareholder would pay on Fund distributions or sale of Fund shares.
continued from page 8
Other information
| n | The returns shown in management’s discussion of Fund performance are based on net asset values (NAVs) calculated for shareholder transactions. Generally accepted accounting principles require adjustments to be made to the net assets of the Fund at period end for financial reporting purposes, and as such, the NAVs for shareholder transactions and the returns based on those NAVs may differ from the NAVs and returns reported in the Financial Highlights. |
| n | Industry classifications used in this report are generally according to the Global Industry Classification Standard, which was developed by and is the exclusive property and a service mark of MSCI Inc. and Standard & Poor’s. |
6 Invesco Global Opportunities Fund
| Average Annual Total Returns | |||||
As of 10/31/15, including maximum applicable sales charges
| |||||
| Class A Shares | |||||
| Inception (8/3/12) | 12.67 | % | |||
| 1 Year | -3.85 | ||||
| Class C Shares | |||||
| Inception (8/3/12) | 13.75 | % | |||
| 1 Year | -0.03 | ||||
| Class R Shares | |||||
| Inception (8/3/12) | 14.32 | % | |||
| 1 Year | 1.31 | ||||
| Class Y Shares | |||||
| Inception (8/3/12) | 14.90 | % | |||
| 1 Year | 1.90 | ||||
| Class R5 Shares | |||||
| Inception (8/3/12) | 14.92 | % | |||
| 1 Year | 1.97 | ||||
| Class R6 Shares | |||||
| Inception | 14.92 | % | |||
| 1 Year | 1.97 | ||||
Average Annual Total Returns | |||||
As of 9/30/15, the most recent calendar quarter end,including maximum applicable sales charges
| |||||
| Class A Shares | |||||
| Inception (8/3/12) | 10.41 | % | |||
| 1 Year | -8.69 | ||||
| Class C Shares | |||||
| Inception (8/3/12) | 11.57 | % | |||
| 1 Year | -4.89 | ||||
| Class R Shares | |||||
| Inception (8/3/12) | 12.10 | % | |||
| 1 Year | -3.66 | ||||
| Class Y Shares | |||||
| Inception (8/3/12) | 12.68 | % | |||
| 1 Year | -3.07 | ||||
| Class R5 Shares | |||||
| Inception (8/3/12) | 12.68 | % | |||
| 1 Year | -3.14 | ||||
| Class R6 Shares | |||||
| Inception | 12.68 | % | |||
| 1 Year | -3.07 | ||||
Class R6 shares incepted on September 24, 2012. Performance shown prior to that date is that of Class A shares and includes the 12b-1 fees applicable to Class A shares.
The performance data quoted represent past performance and cannot guarantee comparable future results; current performance may be lower or higher. Please visit invesco.com/performance for the most recent month-end performance. Performance figures reflect reinvested distributions, changes in net asset value and the effect of the maximum sales charge unless otherwise stated. Investment return and principal value will fluctuate so that you may have a gain or loss when you sell shares.
The net annual Fund operating expense ratio set forth in the most recent Fund prospectus as of the date of this report for Class A, Class C, Class R, Class Y, Class R5 and Class R6 shares was 1.36%, 2.11%, 1.61%, 1.11%, 1.11% and 1.11%, respectively.1 The total annual Fund operating expense ratio set forth in the most recent Fund prospectus as of the date of this report for Class A, Class C, Class R, Class Y, Class R5 and Class R6 shares was 2.39%, 3.14%, 2.64%, 2.14%, 1.99% and 1.99%, respectively.
The expense ratios presented above may vary from the expense ratios presented in other sections of this report that are based on expenses incurred during the period covered by this report.
Class A share performance reflects the maximum 5.50% sales charge, and Class C share performance reflects the applicable contingent deferred sales charge (CDSC) for the period involved. The CDSC on Class C shares is 1% for the first year after purchase. Class R, Class Y, Class R5 and Class R6 class shares do not have a front-end sales charge or a CDSC; therefore, performance is at net asset value.
The performance of the Fund’s share classes will differ primarily due to different sales charge structures and class expenses.
Fund performance reflects any applicable fee waivers and/or expense reimbursements. Had the adviser not waived fees and/or reimbursed expenses currently or in the past, returns would have been lower. See current prospectus for more information.
| 1 | Total annual Fund operating expenses after any contractual fee waivers and/or expense reimbursements by the adviser in effect through at least February 28, 2017. See current prospectus for more information. |
7 Invesco Global Opportunities Fund
Invesco Global Opportunities Fund’s investment objective is long-term growth of capital.
| n | Unless otherwise stated, information presented in this report is as of October 31, 2015, and is based on total net assets. |
| n | Unless otherwise noted, all data provided by Invesco. |
| n | To access your Fund’s reports/prospectus, visit invesco.com/fundreports. |
About share classes
| n | Class R shares are generally available only to employer sponsored retirement and benefit plans. Please see the prospectus for more information. |
| n | Class Y shares are available only to certain investors. Please see the prospectus for more information. |
| n | Class R5 shares and Class R6 shares are primarily intended for employer sponsored retirement and benefit plans that meet certain standards and for institutional investors. Please see the prospectus for more information. |
Principal risks of investing
in the Fund
| n | Convertible securities risk. The Fund may own convertible securities, the value of which may be affected by market interest rates, the risk that the issuer will default, the value of the underlying stock or the right of the issuer to buy back the convertible securities. |
| n | Depositary receipts risk. Depositary receipts involve many of the same risks as those associated with direct investment in foreign securities. In addition, the underlying issuers of certain depositary receipts, particularly unsponsored or unregistered depositary receipts, are under no obligation to distribute shareholder communications to the holders of such receipts or to pass through to them any voting rights with respect to the deposited securities. |
| n | Developing/emerging markets securities risk. The prices of securities issued by foreign companies and governments located in developing/emerging markets countries may be affected more negatively by inflation, devaluation of their currencies, higher transaction costs, delays in settlement, adverse political developments, the introduction of capital controls, withholding taxes, nationalization of private assets, expropriation, social unrest, war or lack of timely information than those in developed countries. |
| n | Foreign securities risk. The Fund’s foreign investments may be affected by changes in a foreign country’s exchange rates, political and social |
instability, changes in economic or taxation policies, difficulties when enforcing obligations, decreased liquidity, and increased volatility. Foreign companies may be subject to less regulation resulting in less publicly available information about the companies. |
| n | Geographic focus risk. From time to time the Fund may invest a substantial amount of its assets in securities of issuers located in a single country or a limited number of countries. If the Fund focuses its investments in this manner, it assumes the risk that economic, political and social conditions in those countries will have a significant impact on its investment performance. The Fund’s investment performance may also be more volatile if it focuses its investments in certain countries, especially emerging markets countries. |
| n | Management risk. The investment techniques and risk analysis used by the Fund’s portfolio managers may not produce the desired results. |
| n | Market risk. The prices of and the income generated by the Fund’s securities may decline in response to, among other things, investor sentiment, general economic and market conditions, regional or global instability, and currency and interest rate fluctuations. |
| n | Preferred securities risk. Preferred securities may include provisions that permit the issuer, in its discretion, to defer or omit distributions for a certain period of time. If the Fund owns a security that is deferring or omitting its distributions, the Fund may be required to report the distribution on its tax returns, even though it may not have received this income. Further, preferred securities may lose substantial value due to the omission or deferment of dividend payments. |
| n | Small- and mid-capitalization risks. Stocks of small- and mid-sized companies tend to be more vulnerable to adverse developments and may have little or no operating history or track record of success, |
and limited product lines, markets, management and financial resources. The securities of small- and mid-sized companies may be more volatile due to less market interest and less publicly available information about the issuer. They also may be illiquid or restricted as to resale, or may trade less frequently and in smaller volumes, all of which may cause difficulty when establishing or closing a position at a desirable price. |
| n | Warrants risk. Warrants may be significantly less valuable on their relevant expiration date resulting in a loss of money or they may expire worthless resulting in a total loss of the investment. Warrants may also be postponed or terminated early resulting in a partial or total loss of the investment. Warrants may also be subject to illiquidity. |
About indexes used in this report
| n | The MSCI All Country World Index is a free float-adjusted market capitalization index that is designed to measure equity market performance of developed and emerging markets. The index is computed using the net return, which withholds applicable taxes for nonresident investors. |
| n | The Lipper Global Large-Cap Core Funds Index is an unmanaged index considered representative of global large-cap core funds tracked by Lipper. |
| n | The Fund is not managed to track the performance of any particular index, including the index(es) described here, and consequently, the performance of the Fund may deviate significantly from the performance of the index(es). |
| n | A direct investment cannot be made in an index. Unless otherwise indicated, index results include reinvested dividends, and they do not reflect sales charges. Performance of the peer group, if applicable, reflects fund expenses; performance of a market index does not. |
continued on page 6
This report must be accompanied or preceded by a currently effective Fund prospectus, which contains more complete information, including sales charges and expenses. Investors should read it carefully before investing. |
NOT FDIC INSURED | MAY LOSE VALUE | NO BANK GUARANTEE |
8 Invesco Global Opportunities Fund
Schedule of Investments
October 31, 2015
| Shares | Value | |||||||
Common Stocks & Other Equity Interests–96.53% |
| |||||||
| Brazil–1.98% | ||||||||
EZ Tec Empreendimentos e Participacoes S.A. | 121,792 | $ | 401,276 | |||||
| China–2.33% | ||||||||
NetEase, Inc.–ADR | 3,279 | 473,914 | ||||||
| France–6.51% | ||||||||
Airbus Group SE | 10,612 | 737,398 | ||||||
Legrand S.A. | 10,638 | 583,179 | ||||||
| 1,320,577 | ||||||||
| Germany–2.65% | ||||||||
Beiersdorf AG | 3,515 | 334,090 | ||||||
Volkswagen AG–Preference Shares | 1,692 | 203,374 | ||||||
| 537,464 | ||||||||
| Hong Kong–5.56% | ||||||||
Cheung Kong Property Holdings Ltd. | 30,680 | 214,278 | ||||||
CK Hutchison Holdings Ltd. | 19,180 | 262,013 | ||||||
Standard Chartered PLC | 59,350 | 651,552 | ||||||
| 1,127,843 | ||||||||
| Indonesia–1.19% | ||||||||
PT Bank Rakyat Indonesia Persero Tbk | 316,800 | 242,011 | ||||||
| Norway–3.87% | ||||||||
Statoil ASA | 48,608 | 784,593 | ||||||
| South Korea–2.22% | ||||||||
Samsung Electronics Co., Ltd. | 297 | 355,623 | ||||||
Samsung Electronics Co., Ltd.–GDR | 160 | 95,760 | ||||||
| 451,383 | ||||||||
| Sweden–2.32% | ||||||||
Lundin Petroleum AB(a) | 32,599 | 471,304 | ||||||
| Switzerland–3.07% | ||||||||
Burckhardt Compression Holding AG | 1,082 | 377,709 | ||||||
LafargeHolcim Ltd. | 4,365 | 245,518 | ||||||
| 623,227 | ||||||||
| United Kingdom–24.09% | ||||||||
Booker Group PLC | 184,706 | 529,409 | ||||||
British American Tobacco PLC | 10,335 | 613,517 | ||||||
| Shares | Value | |||||||
| United Kingdom–(continued) | ||||||||
DS Smith PLC | 67,196 | $ | 400,244 | |||||
HSBC Holdings PLC | 26,022 | 203,278 | ||||||
HSBC Holdings PLC(b) | 22,000 | 172,456 | ||||||
London Stock Exchange Group PLC | 14,084 | 551,026 | ||||||
Rolls-Royce Holdings PLC | 49,331 | 521,962 | ||||||
Rolls-Royce Holdings PLC–Preference Shares(a) | 4,572,983 | 7,051 | ||||||
Royal Dutch Shell PLC–Class A | 30,479 | 797,079 | ||||||
Tesco PLC(a) | 174,178 | 490,802 | ||||||
Thomas Cook Group PLC(a) | 318,716 | 602,927 | ||||||
| 4,889,751 | ||||||||
| United States–40.74% | ||||||||
Alphabet Inc.–Class A(a) | 499 | 367,958 | ||||||
American Express Co. | 11,578 | 848,204 | ||||||
Citigroup Inc. | 19,554 | 1,039,686 | ||||||
Colfax Corp.(a) | 9,694 | 261,350 | ||||||
First Republic Bank | 12,850 | 839,234 | ||||||
J. C. Penney Co., Inc.(a) | 46,142 | 423,122 | ||||||
JPMorgan Chase & Co. | 16,085 | 1,033,461 | ||||||
Las Vegas Sands Corp. | 9,196 | 455,294 | ||||||
Markel Corp.(a) | 691 | 599,788 | ||||||
MasterCard, Inc.–Class A | 8,790 | 870,122 | ||||||
McGraw Hill Financial, Inc. | 5,971 | 553,153 | ||||||
Samsonite International S.A. | 107,700 | 317,013 | ||||||
United Technologies Corp. | 6,722 | 661,512 | ||||||
| 8,269,897 | ||||||||
Total Common Stocks & Other Equity Interests |
| 19,593,240 | ||||||
Money Market Funds–4.08% |
| |||||||
Liquid Assets Portfolio–Institutional Class, 0.16%(c) | 413,606 | 413,606 | ||||||
Premier Portfolio–Institutional Class, 0.12%(c) | 413,606 | 413,606 | ||||||
Total Money Market Funds |
| 827,212 | ||||||
TOTAL INVESTMENTS–100.61% |
| 20,420,452 | ||||||
OTHER ASSETS LESS LIABILITIES–(0.61)% |
| (123,815 | ) | |||||
NET ASSETS–100.00% |
| $ | 20,296,637 | |||||
Investment Abbreviations:
| ADR | – American Depositary Receipt | |
| GDR | – Global Depositary Receipt |
Notes to Schedule of Investments:
| (a) | Non-income producing security. |
| (b) | Security traded on the Stock Exchange of Hong Kong. |
| (c) | The money market fund and the Fund are affiliated by having the same investment adviser. The rate shown is the 7-day SEC standardized yield as of October 31, 2015. |
See accompanying Notes to Financial Statements which are an integral part of the financial statements.
9 Invesco Global Opportunities Fund
Statement of Assets and Liabilities
October 31, 2015
Assets: |
| |||
Investments, at value (Cost $19,451,863) | $ | 19,593,240 | ||
Investments in affiliated money market funds, at value and cost | 827,212 | |||
Total investments, at value (Cost $20,279,075) | 20,420,452 | |||
Foreign currencies, at value (Cost $31,623) | 31,574 | |||
Receivable for: | ||||
Fund shares sold | 45,535 | |||
Dividends | 43,508 | |||
Investment for trustee deferred compensation and retirement plans | 10,625 | |||
Other assets | 27,512 | |||
Total assets | 20,579,206 | |||
Liabilities: |
| |||
Payable for: | ||||
Investments purchased | 202,596 | |||
Fund shares reacquired | 21 | |||
Accrued fees to affiliates | 16,188 | |||
Accrued trustees’ and officers’ fees and benefits | 1,635 | |||
Accrued other operating expenses | 51,376 | |||
Trustee deferred compensation and retirement plans | 10,753 | |||
Total liabilities | 282,569 | |||
Net assets applicable to shares outstanding | $ | 20,296,637 | ||
Net assets consist of: |
| |||
Shares of beneficial interest | $ | 19,885,356 | ||
Undistributed net investment income | 20,047 | |||
Undistributed net realized gain | 252,698 | |||
Net unrealized appreciation | 138,536 | |||
| $ | 20,296,637 | |||
Net Assets: |
| |||
Class A | $ | 12,404,990 | ||
Class C | $ | 2,967,043 | ||
Class R | $ | 218,363 | ||
Class Y | $ | 4,680,805 | ||
Class R5 | $ | 13,192 | ||
Class R6 | $ | 12,244 | ||
Shares outstanding, $0.001 par value per share, |
| |||
Class A | 945,128 | |||
Class C | 229,396 | |||
Class R | 16,727 | |||
Class Y | 355,419 | |||
Class R5 | 1,001 | |||
Class R6 | 930 | |||
Class A: | ||||
Net asset value per share | $ | 13.13 | ||
Maximum offering price per share | ||||
(Net asset value of $13.13 ¸ 94.50%) | $ | 13.89 | ||
Class C: | ||||
Net asset value and offering price per share | $ | 12.93 | ||
Class R: | ||||
Net asset value and offering price per share | $ | 13.05 | ||
Class Y: | ||||
Net asset value and offering price per share | $ | 13.17 | ||
Class R5: | ||||
Net asset value and offering price per share | $ | 13.18 | ||
Class R6: | ||||
Net asset value and offering price per share | $ | 13.17 | ||
See accompanying Notes to Financial Statements which are an integral part of the financial statements.
10 Invesco Global Opportunities Fund
Statement of Operations
For the year ended October 31, 2015
Investment income: |
| |||
Dividends (net of foreign withholding taxes of $16,356) | $ | 286,365 | ||
Dividends from affiliated money market funds | 230 | |||
Total investment income | 286,595 | |||
Expenses: | ||||
Advisory fees | 128,423 | |||
Administrative services fees | 50,000 | |||
Custodian fees | 25,030 | |||
Distribution fees: | ||||
Class A | 29,169 | |||
Class C | 26,883 | |||
Class R | 925 | |||
Transfer agent fees — A, C, R and Y | 50,493 | |||
Transfer agent fees — R5 | 11 | |||
Transfer agent fees — R6 | 10 | |||
Trustees’ and officers’ fees and benefits | 19,101 | |||
Registration and filing fees | 73,898 | |||
Professional services fees | 51,219 | |||
Other | 32,781 | |||
Total expenses | 487,943 | |||
Less: Fees waived, expenses reimbursed and expense offset arrangement(s) | (253,458 | ) | ||
Net expenses | 234,485 | |||
Net investment income | 52,110 | |||
Realized and unrealized gain (loss) from: | ||||
Net realized gain (loss) from: | ||||
Investment securities | 565,430 | |||
Foreign currencies | (12,068 | ) | ||
| 553,362 | ||||
Change in net unrealized appreciation (depreciation) of: | ||||
Investment securities | (714,393 | ) | ||
Foreign currencies | 640 | |||
| (713,753 | ) | |||
Net realized and unrealized gain (loss) | (160,391 | ) | ||
Net increase (decrease) in net assets resulting from operations | $ | (108,281 | ) | |
See accompanying Notes to Financial Statements which are an integral part of the financial statements.
11 Invesco Global Opportunities Fund
Statement of Changes in Net Assets
For the years ended October 31, 2015 and 2014
| 2015 | 2014 | |||||||
Operations: |
| |||||||
Net investment income | $ | 52,110 | $ | 216,150 | ||||
Net realized gain | 553,362 | 1,457,858 | ||||||
Change in net unrealized appreciation (depreciation) | (713,753 | ) | (1,285,592 | ) | ||||
Net increase (decrease) in net assets resulting from operations | (108,281 | ) | 388,416 | |||||
Distributions to shareholders from net investment income: | ||||||||
Class A | (158,805 | ) | (52,017 | ) | ||||
Class C | (10,983 | ) | (7,371 | ) | ||||
Class R | (1,853 | ) | (331 | ) | ||||
Class Y | (53,196 | ) | (26,397 | ) | ||||
Class R5 | (261 | ) | (72 | ) | ||||
Class R6 | (243 | ) | (67 | ) | ||||
Total distributions from net investment income | (225,341 | ) | (86,255 | ) | ||||
Distributions to shareholders from net realized gains: | ||||||||
Class A | (1,159,655 | ) | (355,668 | ) | ||||
Class C | (244,473 | ) | (68,538 | ) | ||||
Class R | (17,319 | ) | (2,483 | ) | ||||
Class Y | (318,954 | ) | (148,828 | ) | ||||
Class R5 | (1,566 | ) | (409 | ) | ||||
Class R6 | (1,454 | ) | (379 | ) | ||||
Total distributions from net realized gains | (1,743,421 | ) | (576,305 | ) | ||||
Share transactions–net: | ||||||||
Class A | 3,066,764 | 315,968 | ||||||
Class C | 922,698 | 1,139,176 | ||||||
Class R | 79,273 | 121,483 | ||||||
Class Y | 1,735,517 | (2,420,079 | ) | |||||
Net increase (decrease) in net assets resulting from share transactions | 5,804,252 | (843,452 | ) | |||||
Net increase (decrease) in net assets | 3,727,209 | (1,117,596 | ) | |||||
Net assets: | ||||||||
Beginning of year | 16,569,428 | 17,687,024 | ||||||
End of year (includes undistributed net investment income of $20,047 and $211,244, respectively) | $ | 20,296,637 | $ | 16,569,428 | ||||
Notes to Financial Statements
October 31, 2015
NOTE 1—Significant Accounting Policies
Invesco Global Opportunities Fund (the “Fund”) is a series portfolio of AIM International Mutual Funds (Invesco International Mutual Funds) (the “Trust”). The Trust is a Delaware statutory trust registered under the Investment Company Act of 1940, as amended (the “1940 Act”), as an open-end series management investment company consisting of eight separate portfolios, each authorized to issue an unlimited number of shares of beneficial interest. The assets, liabilities and operations of each portfolio are accounted for separately. Information presented in these financial statements pertains only to the Fund. Matters affecting each portfolio or class will be voted on exclusively by the shareholders of such portfolio or class.
The Fund’s investment objective is long-term growth of capital.
The Fund currently consists of six different classes of shares: Class A, Class C, Class R, Class Y, Class R5 and Class R6. Class A shares are sold with a front-end sales charge unless certain waiver criteria are met and under certain circumstances load waived shares may be subject to contingent deferred sales charges (“CDSC”). Class C shares are sold with a CDSC. Class R, Class Y, Class R5 and Class R6 shares are sold at net asset value.
The following is a summary of the significant accounting policies followed by the Fund in the preparation of its financial statements.
| A. | Security Valuations — Securities, including restricted securities, are valued according to the following policy. |
A security listed or traded on an exchange (except convertible securities) is valued at its last sales price or official closing price as of the close of the customary trading session on the exchange where the security is principally traded, or lacking any sales or official closing price on a
12 Invesco Global Opportunities Fund
particular day, the security may be valued at the closing bid price on that day. Securities traded in the over-the-counter market are valued based on prices furnished by independent pricing services or market makers. When such securities are valued by an independent pricing service they may be considered fair valued. Futures contracts are valued at the final settlement price set by an exchange on which they are principally traded. Listed options are valued at the mean between the last bid and asked prices from the exchange on which they are principally traded. Options not listed on an exchange are valued by an independent source at the mean between the last bid and asked prices. For purposes of determining net asset value (“NAV”) per share, futures and option contracts generally are valued 15 minutes after the close of the customary trading session of the New York Stock Exchange (“NYSE”).
Investments in open-end and closed-end registered investment companies that do not trade on an exchange are valued at the end-of-day net asset value per share. Investments in open-end and closed-end registered investment companies that trade on an exchange are valued at the last sales price or official closing price as of the close of the customary trading session on the exchange where the security is principally traded.
Debt obligations (including convertible securities) and unlisted equities are fair valued using an evaluated quote provided by an independent pricing service. Evaluated quotes provided by the pricing service may be determined without exclusive reliance on quoted prices, and may reflect appropriate factors such as institution-size trading in similar groups of securities, developments related to specific securities, dividend rate (for unlisted equities), yield (for debt obligations), quality, type of issue, coupon rate (for debt obligations), maturity (for debt obligations), individual trading characteristics and other market data. Debt obligations are subject to interest rate and credit risks. In addition, all debt obligations involve some risk of default with respect to interest and/or principal payments.
Foreign securities’ (including foreign exchange contracts) prices are converted into U.S. dollar amounts using the applicable exchange rates as of the close of the NYSE. If market quotations are available and reliable for foreign exchange-traded equity securities, the securities will be valued at the market quotations. Because trading hours for certain foreign securities end before the close of the NYSE, closing market quotations may become unreliable. If between the time trading ends on a particular security and the close of the customary trading session on the NYSE, events occur that the Adviser determines are significant and make the closing price unreliable, the Fund may fair value the security. If the event is likely to have affected the closing price of the security, the security will be valued at fair value in good faith using procedures approved by the Board of Trustees. Adjustments to closing prices to reflect fair value may also be based on a screening process of an independent pricing service to indicate the degree of certainty, based on historical data, that the closing price in the principal market where a foreign security trades is not the current value as of the close of the NYSE. Foreign securities’ prices meeting the approved degree of certainty that the price is not reflective of current value will be priced at the indication of fair value from the independent pricing service. Multiple factors may be considered by the independent pricing service in determining adjustments to reflect fair value and may include information relating to sector indices, American Depositary Receipts and domestic and foreign index futures. Foreign securities may have additional risks including exchange rate changes, potential for sharply devalued currencies and high inflation, political and economic upheaval, the relative lack of issuer information, relatively low market liquidity and the potential lack of strict financial and accounting controls and standards.
Securities for which market prices are not provided by any of the above methods may be valued based upon quotes furnished by independent sources. The last bid price may be used to value equity securities. The mean between the last bid and asked prices is used to value debt obligations, including corporate loans.
Securities for which market quotations are not readily available or became unreliable are valued at fair value as determined in good faith by or under the supervision of the Trust’s officers following procedures approved by the Board of Trustees. Issuer specific events, market trends, bid/asked quotes of brokers and information providers and other market data may be reviewed in the course of making a good faith determination of a security’s fair value.
The Fund may invest in securities that are subject to interest rate risk, meaning the risk that the prices will generally fall as interest rates rise and, conversely, the prices will generally rise as interest rates fall. Specific securities differ in their sensitivity to changes in interest rates depending on their individual characteristics. Changes in interest rates may result in increased market volatility, which may affect the value and/or liquidity of certain Fund investments.
Valuations change in response to many factors including the historical and prospective earnings of the issuer, the value of the issuer’s assets, general economic conditions, interest rates, investor perceptions and market liquidity. Because of the inherent uncertainties of valuation, the values reflected in the financial statements may materially differ from the value received upon actual sale of those investments.
| B. | Securities Transactions and Investment Income — Securities transactions are accounted for on a trade date basis. Realized gains or losses on sales are computed on the basis of specific identification of the securities sold. Interest income (net of withholding tax, if any) is recorded on the accrual basis from settlement date. Dividend income (net of withholding tax, if any) is recorded on the ex-dividend date. |
The Fund may periodically participate in litigation related to Fund investments. As such, the Fund may receive proceeds from litigation settlements. Any proceeds received are included in the Statement of Operations as realized gain (loss) for investments no longer held and as unrealized gain (loss) for investments still held.
Brokerage commissions and mark ups are considered transaction costs and are recorded as an increase to the cost basis of securities purchased and/or a reduction of proceeds on a sale of securities. Such transaction costs are included in the determination of net realized and unrealized gain (loss) from investment securities reported in the Statement of Operations and the Statement of Changes in Net Assets and the net realized and unrealized gains (losses) on securities per share in the Financial Highlights. Transaction costs are included in the calculation of the Fund’s net asset value and, accordingly, they reduce the Fund’s total returns. These transaction costs are not considered operating expenses and are not reflected in net investment income reported in the Statement of Operations and the Statement of Changes in Net Assets, or the net investment income per share and the ratios of expenses and net investment income reported in the Financial Highlights, nor are they limited by any expense limitation arrangements between the Fund and the investment adviser.
The Fund allocates income and realized and unrealized capital gains and losses to a class based on the relative net assets of each class.
| C. | Country Determination — For the purposes of making investment selection decisions and presentation in the Schedule of Investments, the investment adviser may determine the country in which an issuer is located and/or credit risk exposure based on various factors. These factors include the laws of the country under which the issuer is organized, where the issuer maintains a principal office, the country in which the issuer derives 50% or more of its total revenues and the country that has the primary market for the issuer’s securities, as well as other criteria. Among the other criteria that may be evaluated for making this determination are the country in which the issuer maintains 50% or more of its assets, |
13 Invesco Global Opportunities Fund
| the type of security, financial guarantees and enhancements, the nature of the collateral and the sponsor organization. Country of issuer and/or credit risk exposure has been determined to be the United States of America, unless otherwise noted. |
| D. | Distributions — Distributions from net investment income and net realized capital gain, if any, are generally declared and paid annually and recorded on the ex-dividend date. The Fund may elect to treat a portion of the proceeds from redemptions as distributions for federal income tax purposes. |
| E. | Federal Income Taxes — The Fund intends to comply with the requirements of Subchapter M of the Internal Revenue Code of 1986, as amended (the “Internal Revenue Code”), necessary to qualify as a regulated investment company and to distribute substantially all of the Fund’s taxable earnings to shareholders. As such, the Fund will not be subject to federal income taxes on otherwise taxable income (including net realized capital gain) that is distributed to shareholders. Therefore, no provision for federal income taxes is recorded in the financial statements. |
The Fund recognizes the tax benefits of uncertain tax positions only when the position is more likely than not to be sustained. Management has analyzed the Fund’s uncertain tax positions and concluded that no liability for unrecognized tax benefits should be recorded related to uncertain tax positions. Management is not aware of any tax positions for which it is reasonably possible that the total amounts of unrecognized tax benefits will change materially in the next 12 months.
The Fund files tax returns in the U.S. Federal jurisdiction and certain other jurisdictions. Generally, the Fund is subject to examinations by such taxing authorities for up to three years after the filing of the return for the tax period.
| F. | Expenses — Fees provided for under the Rule 12b-1 plan of a particular class of the Fund are charged to the operations of such class. Transfer agency fees and expenses and other shareholder recordkeeping fees and expenses attributable to Class R5 and Class R6 are allocated to each share class based on relative net assets. Sub-accounting fees attributable to Class R5 are charged to the operations of the class. Transfer agency fees and expenses and other shareholder recordkeeping fees and expenses relating to all other classes are allocated among those classes based on relative net assets. All other expenses are allocated among the classes based on relative net assets. |
| G. | Accounting Estimates — The preparation of financial statements in conformity with accounting principles generally accepted in the United States of America (“GAAP”) requires management to make estimates and assumptions that affect the reported amounts of assets and liabilities at the date of the financial statements and the reported amounts of revenues and expenses during the reporting period including estimates and assumptions related to taxation. Actual results could differ from those estimates by a significant amount. In addition, the Fund monitors for material events or transactions that may occur or become known after the period-end date and before the date the financial statements are released to print. |
| H. | Indemnifications — Under the Trust’s organizational documents, each Trustee, officer, employee or other agent of the Trust is indemnified against certain liabilities that may arise out of the performance of their duties to the Fund. Additionally, in the normal course of business, the Fund enters into contracts, including the Fund’s servicing agreements, that contain a variety of indemnification clauses. The Fund’s maximum exposure under these arrangements is unknown as this would involve future claims that may be made against the Fund that have not yet occurred. The risk of material loss as a result of such indemnification claims is considered remote. |
| I. | Foreign Currency Translations — Foreign currency is valued at the close of the NYSE based on quotations posted by banks and major currency dealers. Portfolio securities and other assets and liabilities denominated in foreign currencies are translated into U.S. dollar amounts at date of valuation. Purchases and sales of portfolio securities (net of foreign taxes withheld on disposition) and income items denominated in foreign currencies are translated into U.S. dollar amounts on the respective dates of such transactions. The Fund does not separately account for the portion of the results of operations resulting from changes in foreign exchange rates on investments and the fluctuations arising from changes in market prices of securities held. The combined results of changes in foreign exchange rates and the fluctuation of market prices on investments (net of estimated foreign tax withholding) are included with the net realized and unrealized gain or loss from investments in the Statement of Operations. Reported net realized foreign currency gains or losses arise from (1) sales of foreign currencies, (2) currency gains or losses realized between the trade and settlement dates on securities transactions, and (3) the difference between the amounts of dividends, interest, and foreign withholding taxes recorded on the Fund’s books and the U.S. dollar equivalent of the amounts actually received or paid. Net unrealized foreign currency gains and losses arise from changes in the fair values of assets and liabilities, other than investments in securities at fiscal period end, resulting from changes in exchange rates. |
The Fund may invest in foreign securities, which may be subject to foreign taxes on income, gains on investments or currency repatriation, a portion of which may be recoverable. Foreign taxes, if any, are recorded based on the tax regulations and rates that exist in the foreign markets in which the Fund invests and are shown in the Statement of Operations.
| J. | Forward Foreign Currency Contracts — The Fund may engage in foreign currency transactions either on a spot (i.e. for prompt delivery and settlement) basis, or through forward foreign currency contracts, to manage or minimize currency or exchange rate risk. |
The Fund may also enter into forward foreign currency contracts for the purchase or sale of a security denominated in a foreign currency in order to “lock in” the U.S. dollar price of that security, or the Fund may also enter into forward foreign currency contracts that do not provide for physical settlement of the two currencies, but instead are settled by a single cash payment calculated as the difference between the agreed upon exchange rate and the spot rate at settlement based upon an agreed upon notional amount (non-deliverable forwards). The Fund will set aside liquid assets in an amount equal to daily mark-to-market obligation for forward foreign currency contracts.
A forward foreign currency contract is an obligation between two parties (“Counterparties”) to purchase or sell a specific currency for an agreed-upon price at a future date. The use of forward foreign currency contracts does not eliminate fluctuations in the price of the underlying securities the Fund owns or intends to acquire but establishes a rate of exchange in advance. Fluctuations in the value of these contracts are measured by the difference in the contract date and reporting date exchange rates and are recorded as unrealized appreciation (depreciation) until the contracts are closed. When the contracts are closed, realized gains (losses) are recorded. Realized and unrealized gains (losses) on the contracts are included in the Statement of Operations. The primary risks associated with forward foreign currency contracts include failure of the Counterparty to meet the terms of the contract and the value of the foreign currency changing unfavorably. These risks may be in excess of the amounts reflected in the Statement of Assets and Liabilities.
14 Invesco Global Opportunities Fund
NOTE 2—Advisory Fees and Other Fees Paid to Affiliates
The Trust has entered into a master investment advisory agreement with Invesco Advisers, Inc. (the “Adviser” or “Invesco”). Under the terms of the investment advisory agreement, the Fund pays an advisory fee to the Adviser based on the annual rate of the Fund’s average daily net assets as follows:
| Average Daily Net Assets | Rate | |||
First $250 million | 0.80% | |||
Next $250 million | 0.78% | |||
Next $500 million | 0.76% | |||
Next $1.5 billion | 0.74% | |||
Next $2.5 billion | 0.72% | |||
Next $2.5 billion | 0.70% | |||
Next $2.5 billion | 0.68% | |||
Over $10 billion | 0.66% | |||
For the year ended October 31, 2015, the effective advisory fees incurred by the fund was 0.80%.
Under the terms of a master sub-advisory agreement between the Adviser and each of Invesco Asset Management Deutschland GmbH, Invesco Asset Management Limited, Invesco Asset Management (Japan) Limited, Invesco Hong Kong Limited, Invesco Senior Secured Management, Inc., Invesco Canada Ltd. and Invesco PowerShares Capital Management LLC (collectively, the “Affiliated Sub-Advisers”) the Adviser, not the Fund, may pay 40% of the fees paid to the Adviser to any such Affiliated Sub-Adviser(s) that provide(s) discretionary investment management services to the Fund based on the percentage of assets allocated to such Sub-Adviser(s).
The Adviser has contractually agreed, through at least February 28, 2017, to waive advisory fees and/or reimburse expenses of all shares to the extent necessary to limit total annual fund operating expenses after fee waiver and/or expense reimbursement (excluding certain items discussed below) of Class A, Class C, Class R, Class Y, Class R5 and Class R6 shares to 1.36%, 2.11%, 1.61%, 1.11%, 1.11% and 1.11%, respectively, of average daily net assets. In determining the Adviser’s obligation to waive advisory fees and/or reimburse expenses, the following expenses are not taken into account, and could cause the total annual fund operating expenses after fee waiver and/or expense reimbursement to exceed the numbers reflected above: (1) interest; (2) taxes; (3) dividend expense on short sales; (4) extraordinary or non-routine items, litigation expenses; and (5) expenses that the Fund has incurred but did not actually pay because of an expense offset arrangement. Unless Invesco continues the fee waiver agreement, it will terminate on February 28, 2017. The fee waiver agreement cannot be terminated during its term.
Further, the Adviser has contractually agreed, through at least June 30, 2017, to waive the advisory fee payable by the Fund in an amount equal to 100% of the net advisory fees the Adviser receives from the affiliated money market funds on investments by the Fund of uninvested cash in such affiliated money market funds.
For the year ended October 31, 2015, the Adviser waived advisory fees and reimbursed fund level expenses of $202,943 and reimbursed class level expenses of $36,560, $8,424, $580, $4,656, $11 and $10 of Class A, Class C, Class R, Class Y, Class R5 and Class R6 shares, respectively.
The Trust has entered into a transfer agency and service agreement with Invesco Investment Services, Inc. (“IIS”) pursuant to which the Fund has agreed to pay IIS a fee for providing transfer agency and shareholder services to the Fund and reimburse IIS for certain expenses incurred by IIS in the course of providing such services. IIS may make payments to intermediaries that provide omnibus account services, sub-accounting services and/or networking services. All fees payable by IIS to intermediaries that provide omnibus account services or sub-accounting are charged back to the Fund, subject to certain limitations approved by the Trust’s Board of Trustees. For the year ended October 31, 2015, expenses incurred under the agreement are shown in the Statement of Operations as Transfer agent fees.
The Trust has entered into a master administrative services agreement with Invesco pursuant to which the Fund has agreed to pay Invesco for certain administrative costs incurred in providing accounting services to the Fund. For the year ended October 31, 2015, expenses incurred under the agreement are shown in the Statement of Operations as Administrative services fees.
The Trust has entered into master distribution agreements with Invesco Distributors, Inc. (“IDI”) to serve as the distributor for the Class A, Class C, Class R, Class Y, Class R5 and Class R6 shares of the Fund. The Trust has adopted plans pursuant to Rule 12b-1 under the 1940 Act with respect to the Fund’s Class A, Class C and Class R shares (collectively, the “Plans”). The Fund, pursuant to the Plans, pays IDI compensation at the annual rate of 0.25% of the Fund’s average daily net assets of Class A shares, 1.00% of the average daily net assets of Class C shares and 0.50% of the average daily net assets of Class R shares. Of the Plan payments, up to 0.25% of the average daily net assets of each class of shares may be paid to furnish continuing personal shareholder services to customers who purchase and own shares of such classes. Any amounts not paid as a service fee under the Plans would constitute an asset-based sales charge. Rules of the Financial Industry Regulatory Authority (“FINRA”) impose a cap on the total sales charges, including asset-based sales charges, that may be paid by any class of shares of the Fund. For the year ended October 31, 2015, expenses incurred under the Plans are shown in the Statement of Operations as Distribution fees.
Front-end sales commissions and CDSC (collectively, the “sales charges”) are not recorded as expenses of the Fund. Front-end sales commissions are deducted from proceeds from the sales of Fund shares prior to investment in Class A shares of the Fund. CDSC are deducted from redemption proceeds prior to remittance to the shareholder. During the year ended October 31, 2015, IDI advised the Fund that IDI retained $9,355 in front-end sales commissions from the sale of Class A shares and $4 and $319 from Class A and Class C shares, respectively, for CDSC imposed upon redemptions by shareholders.
Certain officers and trustees of the Trust are officers and directors of the Adviser, IIS and/or IDI.
15 Invesco Global Opportunities Fund
NOTE 3—Additional Valuation Information
GAAP defines fair value as the price that would be received to sell an asset or paid to transfer a liability in an orderly transaction between market participants at the measurement date, under current market conditions. GAAP establishes a hierarchy that prioritizes the inputs to valuation methods, giving the highest priority to readily available unadjusted quoted prices in an active market for identical assets (Level 1) and the lowest priority to significant unobservable inputs (Level 3), generally when market prices are not readily available or are unreliable. Based on the valuation inputs, the securities or other investments are tiered into one of three levels. Changes in valuation methods may result in transfers in or out of an investment’s assigned level:
| Level 1 — | Prices are determined using quoted prices in an active market for identical assets. |
| Level 2 — | Prices are determined using other significant observable inputs. Observable inputs are inputs that other market participants may use in pricing a security. These may include quoted prices for similar securities, interest rates, prepayment speeds, credit risk, yield curves, loss severities, default rates, discount rates, volatilities and others. |
| Level 3 — | Prices are determined using significant unobservable inputs. In situations where quoted prices or observable inputs are unavailable (for example, when there is little or no market activity for an investment at the end of the period), unobservable inputs may be used. Unobservable inputs reflect the Fund’s own assumptions about the factors market participants would use in determining fair value of the securities or instruments and would be based on the best available information. |
The following is a summary of the tiered valuation input levels, as of October 31, 2015. The level assigned to the securities valuations may not be an indication of the risk or liquidity associated with investing in those securities. Because of the inherent uncertainties of valuation, the values reflected in the financial statements may materially differ from the value received upon actual sale of those investments.
| Level 1 | Level 2 | Level 3 | Total | |||||||||||||
Brazil | $ | 401,276 | $ | — | $ | — | $ | 401,276 | ||||||||
China | 473,914 | — | — | 473,914 | ||||||||||||
France | — | 1,320,577 | — | 1,320,577 | ||||||||||||
Germany | 537,464 | — | — | 537,464 | ||||||||||||
Hong Kong | — | 1,127,843 | — | 1,127,843 | ||||||||||||
Indonesia | — | 242,011 | — | 242,011 | ||||||||||||
Norway | — | 784,593 | — | 784,593 | ||||||||||||
South Korea | 95,760 | 355,623 | — | 451,383 | ||||||||||||
Sweden | 471,304 | — | — | 471,304 | ||||||||||||
Switzerland | 377,709 | 245,518 | — | 623,227 | ||||||||||||
United Kingdom | 7,051 | 4,882,700 | — | 4,889,751 | ||||||||||||
United States | 8,780,096 | 317,013 | — | 9,097,109 | ||||||||||||
Total Investments | $ | 11,144,574 | $ | 9,275,878 | $ | — | $ | 20,420,452 | ||||||||
NOTE 4—Expense Offset Arrangement(s)
The expense offset arrangement is comprised of transfer agency credits which result from balances in demand deposit accounts used by the transfer agent for clearing shareholder transactions. For the year ended October 31, 2015, the Fund received credits from this arrangement, which resulted in the reduction of the Fund’s total expenses of $274.
NOTE 5—Trustees’ and Officers’ Fees and Benefits
Trustees’ and Officers’ Fees and Benefits include amounts accrued by the Fund to pay remuneration to certain Trustees and Officers of the Fund. Trustees have the option to defer compensation payable by the Fund, and Trustees’ and Officers’ Fees and Benefits also include amounts accrued by the Fund to fund such deferred compensation amounts. Those Trustees who defer compensation have the option to select various Invesco Funds in which their deferral accounts shall be deemed to be invested. Finally, certain current Trustees were eligible to participate in a retirement plan that provided for benefits to be paid upon retirement to Trustees over a period of time based on the number of years of service. The Fund may have certain former Trustees who also participate in a retirement plan and receive benefits under such plan. Trustees’ and Officers’ Fees and Benefits include amounts accrued by the Fund to fund such retirement benefits. Obligations under the deferred compensation and retirement plans represent unsecured claims against the general assets of the Fund.
NOTE 6—Cash Balances
The Fund is permitted to temporarily carry a negative or overdrawn balance in its account with State Street Bank and Trust Company, the custodian bank. Such balances, if any at period end, are shown in the Statement of Assets and Liabilities under the payable caption Amount due custodian. To compensate the custodian bank for such overdrafts, the overdrawn Fund may either (1) leave funds as a compensating balance in the account so the custodian bank can be compensated by earning the additional interest; or (2) compensate by paying the custodian bank at a rate agreed upon by the custodian bank and Invesco, not to exceed the contractually agreed upon rate.
16 Invesco Global Opportunities Fund
NOTE 7—Distributions to Shareholders and Tax Components of Net Assets
Tax Character of Distributions to Shareholders Paid During the Fiscal Years Ended October 31, 2015 and 2014:
| 2015 | 2014 | |||||||
Ordinary income | $ | 353,571 | $ | 554,408 | ||||
Long-term capital gain | 1,615,191 | 108,152 | ||||||
Total distributions | $ | 1,968,762 | $ | 662,560 | ||||
Tax Components of Net Assets at Period-End:
| 2015 | ||||
Undistributed ordinary income | $ | 30,095 | ||
Undistributed long-term gain | 562,052 | |||
Net unrealized appreciation (depreciation) — investments | (167,977 | ) | ||
Net unrealized appreciation (depreciation) — other investments | (2,841 | ) | ||
Temporary book/tax differences | (10,048 | ) | ||
Shares of beneficial interest | 19,885,356 | |||
Total net assets | $ | 20,296,637 | ||
The difference between book-basis and tax-basis unrealized appreciation (depreciation) is due to differences in the timing of recognition of gains and losses on investments for tax and book purposes. The Fund’s net unrealized appreciation (depreciation) difference is attributable primarily to wash sales.
The temporary book/tax differences are a result of timing differences between book and tax recognition of income and/or expenses. The Fund’s temporary book/tax differences are the result of the trustee deferral of compensation and retirement plan benefits.
Capital loss carryforward is calculated and reported as of a specific date. Results of transactions and other activity after that date may affect the amount of capital loss carryforward actually available for the Fund to utilize. Capital losses generated in years beginning after December 22, 2010 can be carried forward for an unlimited period, whereas previous losses expire in eight tax years. Capital losses with an expiration period may not be used to offset capital gains until all net capital losses without an expiration date have been utilized. Capital loss carryforwards with no expiration date will retain their character as either short-term or long-term capital losses instead of as short-term capital losses as under prior law. The ability to utilize capital loss carryforwards in the future may be limited under the Internal Revenue Code and related regulations based on the results of future transactions.
The Fund does not have a capital loss carryforward as of October 31, 2015.
NOTE 8—Investment Securities
The aggregate amount of investment securities (other than short-term securities, U.S. Treasury obligations and money market funds, if any) purchased and sold by the Fund during the year ended October 31, 2015 was $14,603,327 and $11,440,643, respectively. Cost of investments on a tax basis includes the adjustments for financial reporting purposes as of the most recently completed federal income tax reporting period-end.
| Unrealized Appreciation (Depreciation) of Investment Securities on a Tax Basis | ||||
Aggregate unrealized appreciation of investment securities | $ | 1,390,035 | ||
Aggregate unrealized (depreciation) of investment securities | (1,558,012 | ) | ||
Net unrealized appreciation (depreciation) of investment securities | $ | (167,977 | ) | |
Cost of investments for tax purposes is $20,588,429.
NOTE 9—Reclassification of Permanent Differences
Primarily as a result of differing book/tax treatment of foreign currency transactions and distributions, on October 31, 2015, undistributed net investment income was decreased by $17,966 and undistributed net realized gain was increased by $17,966. This reclassification had no effect on the net assets of the Fund.
17 Invesco Global Opportunities Fund
NOTE 10—Share Information
| Summary of Share Activity | ||||||||||||||||
| Years ended October 31, | ||||||||||||||||
| 2015(a) | 2014 | |||||||||||||||
| Shares | Amount | Shares | Amount | |||||||||||||
Sold: |
| |||||||||||||||
Class A | 745,064 | $ | 10,095,196 | 741,237 | $ | 11,169,969 | ||||||||||
Class C | 157,144 | 2,124,840 | 202,171 | 3,016,505 | ||||||||||||
Class R | 8,066 | 107,880 | 11,394 | 171,587 | ||||||||||||
Class Y | 399,612 | 4,922,074 | 222,189 | 3,411,391 | ||||||||||||
Issued as reinvestment of dividends: | ||||||||||||||||
Class A | 100,243 | 1,253,041 | 23,196 | 337,728 | ||||||||||||
Class C | 20,271 | 251,366 | 5,221 | 75,282 | ||||||||||||
Class R | 1,399 | 17,438 | 162 | 2,351 | ||||||||||||
Class Y | 6,729 | 84,246 | 7,113 | 103,855 | ||||||||||||
Reacquired: | ||||||||||||||||
Class A | (653,868 | ) | (8,281,473 | ) | (743,200 | ) | (11,191,729 | ) | ||||||||
Class C | (109,873 | ) | (1,453,508 | ) | (133,053 | ) | (1,952,611 | ) | ||||||||
Class R | (3,493 | ) | (46,045 | ) | (3,494 | ) | (52,455 | ) | ||||||||
Class Y | (248,246 | ) | (3,270,803 | ) | (394,270 | ) | (5,935,325 | ) | ||||||||
Net increase (decrease) in share activity | 423,048 | $ | 5,804,252 | (61,334 | ) | $ | (843,452 | ) | ||||||||
| (a) | There are entities that are record owners of more than 5% of the outstanding shares of the Fund and in the aggregate own 24% of the outstanding shares of the Fund. IDI has an agreement with these entities to sell Fund shares. The Fund, Invesco and/or Invesco affiliates may make payments to these entities, which are considered to be related to the Fund, for providing services to the Fund, Invesco and/or Invesco affiliates including but not limited to services such as securities brokerage, distribution, third party record keeping and account servicing. The Fund has no knowledge as to whether all or any portion of the shares owned of record by these entities are also owned beneficially. |
18 Invesco Global Opportunities Fund
NOTE 11—Financial Highlights
The following schedule presents financial highlights for a share of the Fund outstanding throughout the periods indicated.
| Net asset value, beginning of period | Net investment income (loss)(a) | Net gains (losses) on securities (both realized and unrealized) | Total from investment operations | Dividends from net investment income | Distributions from net realized gains | Total distributions | Net asset value, end of period | Total return(b) | Net assets, (000’s omitted) | Ratio of expenses to average net assets with fee waivers and/or expenses absorbed | Ratio of and/or expenses | Ratio of net investment income (loss) to average net assets | Portfolio turnover(c) | |||||||||||||||||||||||||||||||||||||||||||
Class A | ||||||||||||||||||||||||||||||||||||||||||||||||||||||||
Year ended 10/31/15 | $ | 14.74 | $ | 0.06 | $ | 0.11 | $ | 0.17 | $ | (0.22 | ) | $ | (1.56 | ) | $ | (1.78 | ) | $ | 13.13 | 1.76 | % | $ | 12,405 | 1.36 | %(d) | 2.94 | %(d) | 0.43 | %(d) | 71 | % | |||||||||||||||||||||||||
Year ended 10/31/14 | 14.90 | 0.14 | 0.17 | 0.31 | (0.06 | ) | (0.41 | ) | (0.47 | ) | 14.74 | 2.11 | 11,113 | 1.36 | 2.39 | 0.96 | 106 | |||||||||||||||||||||||||||||||||||||||
Year ended 10/31/13 | 10.64 | 0.13 | 4.20 | 4.33 | (0.07 | ) | — | (0.07 | ) | 14.90 | 40.94 | 10,912 | 1.36 | 4.80 | 0.97 | 76 | ||||||||||||||||||||||||||||||||||||||||
Year ended 10/31/12(e) | 10.00 | 0.02 | 0.62 | 0.64 | — | — | — | 10.64 | 6.40 | 1,658 | 1.35 | (f) | 11.20 | (f) | 0.80 | (f) | 9 | |||||||||||||||||||||||||||||||||||||||
Class C | ||||||||||||||||||||||||||||||||||||||||||||||||||||||||
Year ended 10/31/15 | 14.51 | (0.04 | ) | 0.10 | 0.06 | (0.08 | ) | (1.56 | ) | (1.64 | ) | 12.93 | 0.86 | 2,967 | 2.11 | (d) | 3.69 | (d) | (0.32 | )(d) | 71 | |||||||||||||||||||||||||||||||||||
Year ended 10/31/14 | 14.76 | 0.03 | 0.17 | 0.20 | (0.04 | ) | (0.41 | ) | (0.45 | ) | 14.51 | 1.39 | 2,348 | 2.11 | 3.14 | 0.21 | 106 | |||||||||||||||||||||||||||||||||||||||
Year ended 10/31/13 | 10.62 | 0.03 | 4.18 | 4.21 | (0.07 | ) | — | (0.07 | ) | 14.76 | 39.85 | 1,292 | 2.11 | 5.55 | 0.22 | 76 | ||||||||||||||||||||||||||||||||||||||||
Year ended 10/31/12(e) | 10.00 | 0.00 | 0.62 | 0.62 | — | — | — | 10.62 | 6.20 | 14 | 2.10 | (f) | 11.95 | (f) | 0.05 | (f) | 9 | |||||||||||||||||||||||||||||||||||||||
Class R | ||||||||||||||||||||||||||||||||||||||||||||||||||||||||
Year ended 10/31/15 | 14.67 | 0.02 | 0.09 | 0.11 | (0.17 | ) | (1.56 | ) | (1.73 | ) | 13.05 | 1.31 | 218 | 1.61 | (d) | 3.19 | (d) | 0.18 | (d) | 71 | ||||||||||||||||||||||||||||||||||||
Year ended 10/31/14 | 14.85 | 0.11 | 0.17 | 0.28 | (0.05 | ) | (0.41 | ) | (0.46 | ) | 14.67 | 1.94 | 158 | 1.61 | 2.64 | 0.71 | 106 | |||||||||||||||||||||||||||||||||||||||
Year ended 10/31/13 | 10.63 | 0.09 | 4.20 | 4.29 | (0.07 | ) | — | (0.07 | ) | 14.85 | 40.59 | 40 | 1.61 | 5.05 | 0.72 | 76 | ||||||||||||||||||||||||||||||||||||||||
Year ended 10/31/12(e) | 10.00 | 0.01 | 0.62 | 0.63 | — | — | — | 10.63 | 6.30 | 11 | 1.60 | (f) | 11.45 | (f) | 0.55 | (f) | 9 | |||||||||||||||||||||||||||||||||||||||
Class Y | ||||||||||||||||||||||||||||||||||||||||||||||||||||||||
Year ended 10/31/15 | 14.81 | 0.09 | 0.09 | 0.18 | (0.26 | ) | (1.56 | ) | (1.82 | ) | 13.17 | 1.90 | 4,681 | 1.11 | (d) | 2.69 | (d) | 0.68 | (d) | 71 | ||||||||||||||||||||||||||||||||||||
Year ended 10/31/14 | 14.94 | 0.18 | 0.17 | 0.35 | (0.07 | ) | (0.41 | ) | (0.48 | ) | 14.81 | 2.39 | 2,922 | 1.11 | 2.14 | 1.21 | 106 | |||||||||||||||||||||||||||||||||||||||
Year ended 10/31/13 | 10.65 | 0.16 | 4.20 | 4.36 | (0.07 | ) | — | (0.07 | ) | 14.94 | 41.21 | 5,414 | 1.11 | 4.55 | 1.22 | 76 | ||||||||||||||||||||||||||||||||||||||||
Year ended 10/31/12(e) | 10.00 | 0.03 | 0.62 | 0.65 | — | — | — | 10.65 | 6.50 | 1,581 | 1.10 | (f) | 10.95 | (f) | 1.05 | (f) | 9 | |||||||||||||||||||||||||||||||||||||||
Class R5 | ||||||||||||||||||||||||||||||||||||||||||||||||||||||||
Year ended 10/31/15 | 14.81 | 0.09 | 0.10 | 0.19 | (0.26 | ) | (1.56 | ) | (1.82 | ) | 13.18 | 1.97 | 13 | 1.11 | (d) | 2.45 | (d) | 0.68 | (d) | 71 | ||||||||||||||||||||||||||||||||||||
Year ended 10/31/14 | 14.94 | 0.18 | 0.17 | 0.35 | (0.07 | ) | (0.41 | ) | (0.48 | ) | 14.81 | 2.39 | 15 | 1.11 | 1.99 | 1.21 | 106 | |||||||||||||||||||||||||||||||||||||||
Year ended 10/31/13 | 10.64 | 0.16 | 4.21 | 4.37 | (0.07 | ) | — | (0.07 | ) | 14.94 | 41.34 | 15 | 1.11 | 4.53 | 1.22 | 76 | ||||||||||||||||||||||||||||||||||||||||
Year ended 10/31/12(e) | 10.00 | 0.03 | 0.61 | 0.64 | — | — | — | 10.64 | 6.40 | 11 | 1.10 | (f) | 11.00 | (f) | 1.05 | (f) | 9 | |||||||||||||||||||||||||||||||||||||||
Class R6 | ||||||||||||||||||||||||||||||||||||||||||||||||||||||||
Year ended 10/31/15 | 14.81 | 0.09 | 0.09 | 0.18 | (0.26 | ) | (1.56 | ) | (1.82 | ) | 13.17 | 1.89 | 12 | 1.11 | (d) | 2.45 | (d) | 0.68 | (d) | 71 | ||||||||||||||||||||||||||||||||||||
Year ended 10/31/14 | 14.94 | 0.18 | 0.17 | 0.35 | (0.07 | ) | (0.41 | ) | (0.48 | ) | 14.81 | 2.39 | 14 | 1.11 | 1.99 | 1.21 | 106 | |||||||||||||||||||||||||||||||||||||||
Year ended 10/31/13 | 10.64 | 0.16 | 4.21 | 4.37 | (0.07 | ) | — | (0.07 | ) | 14.94 | 41.34 | 14 | 1.11 | 4.53 | 1.22 | 76 | ||||||||||||||||||||||||||||||||||||||||
Year ended 10/31/12(e) | 10.76 | 0.01 | (0.13 | ) | (0.12 | ) | — | — | — | 10.64 | (1.12 | ) | 10 | 1.10 | (f) | 8.37 | (f) | 1.05 | (f) | 9 | ||||||||||||||||||||||||||||||||||||
| (a) | Calculated using average shares outstanding. |
| (b) | Includes adjustments in accordance with accounting principles generally accepted in the United States of America and as such, the net asset value for financial reporting purposes and the returns based upon those net asset values may differ from the net asset value and returns for shareholder transactions. Does not include sales charges and is not annualized for periods less than one year, if applicable. |
| (c) | Portfolio turnover is calculated at the fund level and is not annualized for periods less than one year, if applicable. |
| (d) | Ratios are based on average daily net assets (000’s omitted) of $11,668, $2,688, $185, $1,486, $14 and $13 for Class A, Class C, Class R, Class Y, Class R5 and Class R6 shares, respectively. |
| (e) | Commencement date of August 3, 2012 for Class A, Class C, Class R, Class Y and Class R5 shares and September 24, 2012 for Class R6 shares. |
| (f) | Annualized. |
19 Invesco Global Opportunities Fund
Report of Independent Registered Public Accounting Firm
To the Board of Trustees of AIM International Mutual Funds (Invesco International Mutual Funds)
and Shareholders of Invesco Global Opportunities Fund:
In our opinion, the accompanying statement of assets and liabilities, including the schedule of investments, and the related statements of operations and of changes in net assets and the financial highlights present fairly, in all material respects, the financial position of Invesco Global Opportunities Fund (one of the funds constituting AIM International Mutual Funds (Invesco International Mutual Funds), hereafter referred to as the “Fund”) at October 31, 2015, the results of its operations for the year then ended, the changes in its net assets for each of the two years in the period then ended and the financial highlights for each of the three years in the period then ended and for the period August 3, 2012 (commencement of operations) through October 31, 2012, in conformity with accounting principles generally accepted in the United States of America. These financial statements and financial highlights (hereafter referred to as “financial statements”) are the responsibility of the Fund’s management. Our responsibility is to express an opinion on these financial statements based on our audits. We conducted our audits of these financial statements in accordance with the standards of the Public Company Accounting Oversight Board (United States). Those standards require that we plan and perform the audit to obtain reasonable assurance about whether the financial statements are free of material misstatement. An audit includes examining, on a test basis, evidence supporting the amounts and disclosures in the financial statements, assessing the accounting principles used and significant estimates made by management, and evaluating the overall financial statement presentation. We believe that our audits, which included confirmation of securities at October 31, 2015 by correspondence with the custodian and brokers, and the application of alternative auditing procedures where confirmations of security purchases have not been received, provide a reasonable basis for our opinion.
PRICEWATERHOUSECOOPERS LLP
December 23, 2015
Houston, Texas
20 Invesco Global Opportunities Fund
Calculating your ongoing Fund expenses
Example
As a shareholder of the Fund, you incur two types of costs: (1) transaction costs, which may include sales charges (loads) on purchase payments or contingent deferred sales charges on redemptions, if any; and (2) ongoing costs, including management fees, distribution and/or service (12b-1) fees, and other Fund expenses. This example is intended to help you understand your ongoing costs (in dollars) of investing in the Fund and to compare these costs with ongoing costs of investing in other mutual funds. The example is based on an investment of $1,000 invested at the beginning of the period and held for the entire period May 1, 2015 through October 31, 2015.
Actual expenses
The table below provides information about actual account values and actual expenses. You may use the information in this table, together with the amount you invested, to estimate the expenses that you paid over the period. Simply divide your account value by $1,000 (for example, an $8,600 account value divided by $1,000 = 8.6), then multiply the result by the number in the table under the heading entitled “Actual Expenses Paid During Period” to estimate the expenses you paid on your account during this period.
Hypothetical example for comparison purposes
The table below also provides information about hypothetical account values and hypothetical expenses based on the Fund’s actual expense ratio and an assumed rate of return of 5% per year before expenses, which is not the Fund’s actual return.
The hypothetical account values and expenses may not be used to estimate the actual ending account balance or expenses you paid for the period. You may use this information to compare the ongoing costs of investing in the Fund and other funds. To do so, compare this 5% hypothetical example with the 5% hypothetical examples that appear in the shareholder reports of the other funds.
Please note that the expenses shown in the table are meant to highlight your ongoing costs only and do not reflect any transaction costs, such as sales charges (loads) on purchase payments or contingent deferred sales charges on redemptions, if any. Therefore, the hypothetical information is useful in comparing ongoing costs only, and will not help you determine the relative total costs of owning different funds. In addition, if these transaction costs were included, your costs would have been higher.
| Class | Beginning Account Value (05/01/15) | ACTUAL | HYPOTHETICAL (5% annual return before | Annualized Expense Ratio | ||||||||||||||||||||
| Ending Account Value (10/31/15)1 | Expenses Paid During Period2 | Ending Account Value (10/31/15) | Expenses Paid During Period2 | |||||||||||||||||||||
| A | $ | 1,000.00 | $ | 944.60 | $ | 6.67 | $ | 1,018.35 | $ | 6.92 | 1.36 | % | ||||||||||||
| C | 1,000.00 | 939.70 | 10.32 | 1,014.57 | 10.71 | 2.11 | ||||||||||||||||||
| R | 1,000.00 | 942.20 | 7.88 | 1,017.09 | 8.19 | 1.61 | ||||||||||||||||||
| Y | 1,000.00 | 944.80 | 5.44 | 1,019.61 | 5.65 | 1.11 | ||||||||||||||||||
| R5 | 1,000.00 | 944.80 | 5.44 | 1,019.61 | 5.65 | 1.11 | ||||||||||||||||||
| R6 | 1,000.00 | 945.50 | 5.44 | 1,019.61 | 5.65 | 1.11 | ||||||||||||||||||
| 1 | The actual ending account value is based on the actual total return of the Fund for the period May 1, 2015 through October 31, 2015, after actual expenses and will differ from the hypothetical ending account value which is based on the Fund’s expense ratio and a hypothetical annual return of 5% before expenses. |
| 2 | Expenses are equal to the Fund’s annualized expense ratio as indicated above multiplied by the average account value over the period, multiplied by 184/365 to reflect the most recent fiscal half year. |
21 Invesco Global Opportunities Fund
Approval of Investment Advisory and Sub-Advisory Contracts
The Board of Trustees (the Board) of AIM International Mutual Funds (Invesco International Mutual Funds) is required under the Investment Company Act of 1940, as amended, to approve annually the renewal of Invesco Global Opportunities Income Fund’s (the Fund) investment advisory agreements. During contract renewal meetings held on June 9-10, 2015, the Board as a whole, and the disinterested or “independent” Trustees, who comprise over 75% of the Board, voting separately, approved the continuance for the Fund of the Master Investment Advisory Agreement with Invesco Advisers, Inc. (Invesco Advisers and the investment advisory agreement) and the Master Intergroup Sub-Advisory Contract for Mutual Funds with Invesco Asset Management Deutschland GmbH, Invesco Asset Management Limited, Invesco Asset Management (Japan) Limited, Invesco Hong Kong Limited, Invesco Senior Secured Management, Inc., Invesco Canada Ltd. and Invesco PowerShares Capital Management LLC (collectively, the Affiliated Sub-Advisers and the sub-advisory contracts) for another year, effective July 1, 2015.
In evaluating the fairness and reasonableness of compensation under the Fund’s investment advisory agreement and sub-advisory contracts, the Board considered, among other things, the factors discussed below. The Board determined that continuation of the Fund’s investment advisory agreement and the sub-advisory contracts are in the best interest of the Fund and its shareholders and that the compensation payable to Invesco Advisers and the Affiliated Sub-Advisers under the agreements is fair and reasonable.
The Board’s Fund Evaluation Process
The Board’s Investments Committee has established three Sub-Committees, each of which is primarily responsible for overseeing the performance and investment management services provided by Invesco Advisers and the Affiliated Sub-Advisers to a number of the funds advised by Invesco Advisers (the Invesco Funds). The Sub-Committees meet throughout the year to review the performance of their assigned Invesco Funds, including reviewing materials prepared under the direction of the independent Senior Officer, an officer of the Invesco Funds who reports directly to the independent Trustees. Over the course of each year, the Sub-Committees meet with portfolio managers for their assigned Invesco Funds and other members of management to review the performance, investment objective(s), policies, strategies, limitations and investment risks of these funds. The Board had the benefit of reports form the Sub-Committees and Investments Committee throughout the year in considering approval of the continuance of each Invesco Fund’s investment advisory agreement and sub-advisory contracts for another year.
During the contract renewal process, the Board receives comparative performance and fee data regarding the Invesco Funds prepared by Invesco Advisers and Lipper Inc. (Lipper), an independent provider of investment company data. The Board also receives a report and this independent written evaluation from the Senior Officer. The Senior Officer’s evaluation is prepared as part of his responsibility to manage the process by which the Invesco Funds’ proposed management fees are negotiated during the annual contract renewal process to ensure they are negotiated in a manner that is at arms’ length and reasonable. In addition to meetings with Invesco Advisers and fund counsel, the independent Trustees also discuss the continuance of the investment advisory agreement and sub-advisory contracts in separate sessions with the Senior Officer and with independent legal counsel.
The Trustees recognized that the advisory fee rates for the Invesco Funds are, in many cases, the result of years of review and negotiation. The Trustees’ deliberations and conclusions in a particular year may be based in part on their deliberations and conclusions regarding these same arrangements throughout the year and in prior years. The Trustees’ review and conclusions are based on the comprehensive consideration of all information presented to them and are not the result of any single determinative factor. Moreover, one Trustee may have weighed a particular piece of information or factor differently than another Trustee.
The discussion below is a summary of the Senior Officer’s independent written evaluation with respect to the Fund’s investment advisory agreement as well as a discussion of the material factors and related conclusions that formed the basis for the Board’s approval of the Fund’s investment advisory agreement and sub-advisory contracts. Unless otherwise stated, this information is current as of June 10, 2015, and does not reflect consideration of factors that became known to the Board after that date.
Factors and Conclusions and Summary of Independent Written Fee Evaluation
| A. | Nature, Extent and Quality of Services Provided by Invesco Advisers and the Affiliated Sub-Advisers |
The Board reviewed the advisory services provided to the Fund by Invesco Advisers under the Fund’s investment advisory agreement, the performance of Invesco Advisers in providing these services, and the credentials and experience of the officers and employees of Invesco Advisers who provide these services, including the Fund’s portfolio manager or managers. The Board’s review of the qualifications of Invesco Advisers to provide advisory services included the Board’s
consideration of Invesco Advisers’ investment process oversight, independent credit analysis and investment risk management. The Board also considered non-advisory services that Invesco Advisers and its affiliates provide to the Invesco Funds such as various back office support functions, equity and fixed income trading operations, internal audit, distribution, valuation and legal and compliance.
In determining whether to continue the Fund’s investment advisory agreement, the Board considered the benefits of reapproving an existing relationship and the greater uncertainty that may be associated with entering into a new relationship. The Board concluded that the nature, extent and quality of the services provided to the Fund by Invesco Advisers are appropriate and satisfactory and consistent with the terms of the Fund’s investment advisory agreement.
The Board reviewed the services that may be provided by the Affiliated Sub-Advisers under the sub-advisory contracts and the credentials and experience of the officers and employees of the Affiliated Sub-Advisers who provide these services. The Board noted that the Affiliated Sub-Advisers have offices and personnel that are located in financial centers around the world. As a result, the Affiliated Sub-Advisers can provide research and investment analysis on the markets and economies of various countries in which the Fund may invest, make recommendations regarding securities and assist with security trades. The Board concluded that the sub-advisory contracts benefit the Fund and its shareholders by permitting Invesco Advisers to use the resources and talents of the Affiliated Sub-Advisers in managing the Fund. The Board concluded that the nature, extent and quality of the services that may be provided by the Affiliated Sub-Advisers are appropriate and satisfactory and consistent with the terms of the Fund’s sub-advisory contracts.
| B. | Fund Performance |
The Board considered Fund performance as a relevant factor in considering whether to approve the investment advisory agreement as well as the sub-advisory contracts for the Fund, as Invesco Asset Management Limited currently manages assets of the Fund.
The Board noted that the Fund recently began operations and that comparative performance data for only the past two calendar years was available. The Board compared the Fund’s performance during the past two calendar years to the performance of funds in the Lipper performance universe and against the Lipper Global Large-Cap Core Funds Index. The Board noted that performance of Class A shares of the Fund was in the fifth quintile of its performance universe for the one year period and the second quintile for the two year period (the first quintile being the best performing funds and the fifth quintile being the worst
22 Invesco Global Opportunities Fund
performing funds). The Board noted that the Fund’s performance was below the performance of the Index for the one year period and above the Index for the two year period. The Trustees also reviewed more recent Fund performance and this review did not change their conclusions.
| C. | Advisory and Sub-Advisory Fees |
The Board compared the Fund’s contractual management fee rate to the contractual management fee rates of funds in the Fund’s Lipper expense group at a common asset level. The Board noted that the contractual management fee rate for Class A shares of the Fund was below the median contractual management fee rate of funds in its expense group. The Board noted that the term “contractual management fee” may include both advisory and certain administrative services fees, but that Lipper does not provide information on a fund by fund basis as to what is included. The Board noted that Invesco Advisers does not charge the Invesco Funds for the administrative services included in the term as defined by Lipper. The Board also reviewed the methodology used by Lipper in providing expense group information, which includes using each fund’s contractual management fee schedule (including any applicable breakpoints) as reported in the most recent prospectus or statement of additional information for each fund in the expense group.
The Board noted that Invesco Advisers has contractually agreed to waive fees and/or limit expenses of the Fund through at least February 29, 2016 in an amount necessary to limit total annual operating expenses to a specified percentage of average daily net assets for each class of the Fund.
The Board also compared the Fund’s effective advisory fee rate (the advisory fee rate after advisory fee waivers and before other expense limitations/waivers) to the effective advisory fee rates of other funds advised by Invesco Advisers and its affiliates with investment strategies comparable to those of the Fund. The Board noted that the Fund’s rate was below the rate of an off-shore fund. The Board noted that Invesco Advisers and the Affiliated Sub-Advisers do not manage other client accounts with investment strategies comparable to those of the Fund.
The Board also considered the services provided by the Affiliated Sub-Advisers pursuant to the sub-advisory contracts, as well as the fees payable by Invesco Advisers to the Affiliated Sub-Advisers pursuant to the sub-advisory contracts. The Board noted that Invesco Advisers retains overall responsibility for, and provides services to, sub-advised Invesco Funds, including oversight of the Affiliated Sub-Advisers as well as the additional services described herein other than day-to-day portfolio management. The Board also noted that the sub-advisory fees are not paid directly by the Fund, but rather, are payable by Invesco Advisers to the Affiliated Sub-Advisers.
| D. | Economies of Scale and Breakpoints |
The Board considered the extent to which there are economies of scale in the provision of advisory services to the Fund. The Board also considered whether the Fund benefits from economies of scale through contractual breakpoints in the Fund’s advisory fee schedule. The Board also noted that the Fund shares directly in economies of scale through lower fees charged by third party service providers based on the combined size of the Invesco Funds and other clients advised by Invesco Advisers.
| E. | Profitability and Financial Resources |
The Board reviewed information from Invesco Advisers concerning the costs of the advisory and other services that Invesco Advisers and its affiliates provide to the Fund and the Invesco Funds and the profitability of Invesco Advisers and its affiliates in providing these services. The Board received information from Invesco Advisers about the methodology used to prepare the profitability information. The Board noted that Invesco Advisers continues to operate at a net profit from services Invesco Advisers and its affiliates provide to the Invesco Funds. The Board noted that Invesco Advisers and its affiliates did not make a profit from managing the Fund as a result of fee and expense waivers. The Board received and accepted information from Invesco Advisers demonstrating that Invesco Advisers and each Affiliated Sub-Adviser are financially sound and have the resources necessary to perform their obligations under the investment advisory agreement and sub-advisory contracts.
| F. | Collateral Benefits to Invesco Advisers and its Affiliates |
The Board considered various other benefits received by Invesco Advisers and its affiliates from the relationship with the Fund, including the fees received for providing transfer agency and distribution services to the Fund. The Board considered comparative information regarding fees charged for these services, including information provided by Lipper and other independent sources. The Board considered the performance of Invesco Advisers and its affiliates in providing these services and the organizational structure employed to provide these services. The Board also considered that these services are provided to the Fund pursuant to written contracts that are reviewed and approved on an annual basis by the Board; and that the services are required for the operation of the Fund.
The Board considered the benefits realized by Invesco Advisers and the Affiliated Sub-Advisers as a result of portfolio brokerage transactions executed through “soft dollar” arrangements. The Board noted that soft dollar arrangements shift the payment obligation for research services from Invesco Advisers and the Affiliated Sub-Advisers to the Invesco Funds and that the research received may be used with other clients of Invesco Advisers and may reduce Invesco Advisers’ and the Affiliated Sub-Advisers’ expenses. The Board also
considered that it receives periodic reports from the Chief Compliance Officer of the Invesco Funds demonstrating that these arrangements are consistent with regulatory requirements. The Board did not deem the soft dollar arrangements to be inappropriate.
The Board considered that the Fund’s uninvested cash and cash collateral from any securities lending arrangements may be invested in money market funds advised by Invesco Advisers pursuant to procedures approved by the Board. The Board noted that Invesco Advisers receives advisory fees from these affiliated money market funds attributable to such investments, although Invesco Advisers has contractually agreed to waive through varying periods the advisory fees payable by the Invesco Funds with respect to investments in the affiliated money market funds. The waiver is in an amount equal to 100% of the net advisory fee Invesco Advisers receives from the affiliated money market funds with respect to the Fund’s investment in the affiliated money market funds of uninvested cash, but not cash collateral. The Board concluded that the amount of advisory fees received by Invesco Advisors from the Fund’s investment of cash collateral from any securities lending arrangements in the affiliated money market funds is fair and reasonable.
The Board also considered the Fund may use an affiliated broker to execute certain trades for the Fund to among other things, control information leakage, and were advised that such trades would be executed in compliance with rules under the Investment Company Act of 1940, as amended, and consistent with best execution obligations.
23 Invesco Global Opportunities Fund
Tax Information
Form 1099-DIV, Form 1042-S and other year-end tax information provide shareholders with actual calendar year amounts that should be included in their tax returns. Shareholders should consult their tax advisors.
The following distribution information is being provided as required by the Internal Revenue Code or to meet a specific state’s requirement.
The Fund designates the following amounts or, if subsequently determined to be different, the maximum amount allowable for its fiscal year ended October 31, 2015:
Federal and State Income Tax | ||||
Long-Term Capital Gain Distributions | $ | 1,615,191 | ||
Qualified Dividend Income* | 100 | % | ||
Corporate Dividends Received Deduction* | 29.75 | % | ||
U.S. Treasury Obligations* | 0 | % | ||
| * | The above percentages are based on ordinary income dividends paid to shareholders during the Fund’s fiscal year. |
Non-Resident Alien Shareholders | ||||
Qualified Short-Term Gains | $ | 122,333 | ||
24 Invesco Global Opportunities Fund
Trustees and Officers
The address of each trustee and officer is AIM International Mutual Funds (Invesco International Mutual Funds) (the “Trust”), 11 Greenway Plaza, Suite 1000, Houston, Texas 77046-1173. The trustees serve for the life of the Trust, subject to their earlier death, incapacitation, resignation, retirement or removal as more specifically provided in the Trust’s organizational documents. Each officer serves for a one year term or until their successors are elected and qualified. Column two below includes length of time served with predecessor entities, if any.
| Name, Year of Birth and Position(s) Held with the Trust | Trustee and/ or Officer Since | Principal Occupation(s) During Past 5 Years | Number of Funds in Fund Complex Overseen by Trustee | Other Directorship(s) Past 5 Years | ||||
| Interested Persons | ||||||||
Martin L. Flanagan1 — 1960 Trustee | 2007 | Executive Director, Chief Executive Officer and President, Invesco Ltd. (ultimate parent of Invesco and a global investment management firm); Advisor to the Board, Invesco Advisers, Inc. (formerly known as Invesco Institutional (N.A.), Inc.); Trustee, The Invesco Funds; Vice Chair, Investment Company Institute; and Member of Executive Board, SMU Cox School of Business
Formerly: Chairman and Chief Executive Officer, Invesco Advisers, Inc. (registered investment adviser); Director, Chairman, Chief Executive Officer and President, IVZ Inc. (holding company), INVESCO Group Services, Inc. (service provider) and Invesco North American Holdings, Inc. (holding company); Director, Chief Executive Officer and President, Invesco Holding Company Limited (parent of Invesco and a global investment management firm); Director, Invesco Ltd.; Chairman, Investment Company Institute and President, Co-Chief Executive Officer, Co-President, Chief Operating Officer and Chief Financial Officer, Franklin Resources, Inc. (global investment management organization). | 145 | None | ||||
Philip A. Taylor2 — 1954 Trustee, President and Principal Executive Officer | 2006 | Head of North American Retail and Senior Managing Director, Invesco Ltd.; Director, Co-Chairman, Co-President and Co-Chief Executive Officer, Invesco Advisers, Inc. (formerly known as Invesco Institutional (N.A.), Inc.) (registered investment adviser); Director, Chairman, Chief Executive Officer and President, Invesco Management Group, Inc. (formerly known as Invesco Aim Management Group, Inc.) (financial services holding company); Director and President, INVESCO Funds Group, Inc. (registered investment adviser and registered transfer agent); Director and Chairman, Invesco Investment Services, Inc. (formerly known as Invesco Aim Investment Services, Inc.) (registered transfer agent) and IVZ Distributors, Inc. (formerly known as INVESCO Distributors, Inc.) (registered broker dealer); Chief Executive Officer, Invesco Corporate Class Inc. (corporate mutual fund company) Director, Chairman and Chief Executive Officer, Invesco Canada Ltd. (formerly known as Invesco Trimark Ltd./Invesco Trimark Ltèe) (registered investment adviser and registered transfer agent); Trustee, President and Principal Executive Officer, The Invesco Funds (other than AIM Treasurer’s Series Trust (Invesco Treasurer’s Series Trust), Short-Term Investments Trust and Invesco Management Trust); Trustee and Executive Vice President, The Invesco Funds (AIM Treasurer’s Series Trust (Invesco Treasurer’s Series Trust), Short-Term Investments Trust and Invesco Management Trust only); Director, Invesco Investment Advisers LLC (formerly known as Van Kampen Asset Management); Director, Chief Executive Officer and President, Van Kampen Exchange Corp.
Formerly: Director, President and Chairman, Invesco Inc. (holding company), Invesco Canada Holdings Inc. (holding company), Trimark Investments Ltd./Placements Trimark Ltèe and Invesco Financial Services Ltd/Services Financiers Invesco Ltèe; Chiief Executive Officer, Invesco Canada Fund Inc (corporate mutual fund company); Director and Chairman, Van Kampen Investor Services Inc.; Director, Chief Executive Officer and President, 1371 Preferred Inc. (holding company) and Van Kampen Investments Inc.; Director and President, AIM GP Canada Inc. (general partner for limited partnerships) and Van Kampen Advisors, Inc.; Director and Chief Executive Officer, Invesco Trimark Dealer Inc. (registered broker dealer); Director, Invesco Distributors, Inc. (formerly known as Invesco Aim Distributors, Inc.) (registered broker dealer); Manager, Invesco PowerShares Capital Management LLC; Director, Chief Executive Officer and President, Invesco Advisers, Inc.; Director, Chairman, Chief Executive Officer and President, Invesco Aim Capital Management, Inc.; President, Invesco Trimark Dealer Inc. and Invesco Trimark Ltd./Invesco Trimark Ltèe; Director and President, AIM Trimark Corporate Class Inc. and AIM Trimark Canada Fund Inc.; Senior Managing Director, Invesco Holding Company Limited; Director and Chairman, Fund Management Company (former registered broker dealer); President and Principal Executive Officer, The Invesco Funds (AIM Treasurer’s Series Trust (Invesco Treasurer’s Series Trust), and Short-Term Investments Trust only); President, AIM Trimark Global Fund Inc. and AIM Trimark Canada Fund Inc.. | 145 | None |
| 1 | Mr. Flanagan is considered an interested person (within the meaning of Section 2(a)(19) of the 1940 Act) of the Trust because he is an officer of the Adviser to the Trust, and an officer and a director of Invesco Ltd., ultimate parent of the Adviser. |
| 2 | Mr. Taylor is considered an interested person (within the meaning of Section 2(a)(19) of the 1940 Act) of the Trust because he is an officer and a director of the Adviser. |
T-1 �� Invesco Global Opportunities Fund
Trustees and Officers—(continued)
| Name, Year of Birth and Position(s) Held with the Trust | Trustee and/ or Officer Since | Principal Occupation(s) During Past 5 Years | Number of Funds in Fund Complex Overseen by Trustee | Other Directorship(s) Past 5 Years | ||||
| Independent Trustees | ||||||||
Bruce L. Crockett — 1944 Trustee and Chair | 2003 | Chairman, Crockett Technologies Associates (technology consulting company)
Formerly: Director, Captaris (unified messaging provider); Director, President and Chief Executive Officer, COMSAT Corporation; Chairman, Board of Governors of INTELSAT (international communications company); ACE Limited (insurance company); Independent Directors Council and Investment Company Institute | 145 | ALPS (Attorneys Liability Protection Society) (insurance company) and Globe Specialty Metals, Inc. (metallurgical company) | ||||
David C. Arch — 1945 Trustee | 2010 | Chairman of Blistex Inc., a consumer health care products manufacturer | 145 | Board member of the Illinois Manufacturers’ Association; Member of the Board of Visitors, Institute for the Humanities, University of Michigan; Member of the Audit Committee of the Edward-Elmhurst Hospital | ||||
James T. Bunch — 1942 Trustee | 2000 | Managing Member, Grumman Hill Group LLC (family office/private equity investments)
Formerly: Founder, Green Manning & Bunch Ltd. (investment banking firm) (1988-2010); Executive Committee, United States Golf Association; and Chairman, Board of Governors, Western Golf Association | 145 | Chairman of the Board of Trustees, Evans Scholars Foundation; and Chairman of the Board, Denver Film Society | ||||
Rodney F. Dammeyer — 1940 Trustee | 2010 | Chairman of CAC, LLC, (private company offering capital investment and management advisory services)
Formerly: Prior to 2001, Managing Partner at Equity Group Corporate Investments; Prior to 1995, Chief Executive Officer of Itel Corporation (formerly Anixter International); Prior to 1985, experience includes Senior Vice President and Chief Financial Officer of Household International, Inc., Executive Vice President and Chief Financial Officer of Northwest Industries, Inc. and Partner of Arthur Andersen & Co.; From 1987 to 2010, Director/Trustee of investment companies in the Van Kampen Funds complex | 145 | Director of Quidel Corporation and Stericycle, Inc. | ||||
Albert R. Dowden — 1941 Trustee | 2003 | Director of a number of public and private business corporations, including the Boss Group, Ltd. (private investment and management); Nature’s Sunshine Products, Inc. and Reich & Tang Funds (5 portfolios) (registered investment company)
Formerly: Director, Homeowners of America Holding Corporation/Homeowners of America Insurance Company (property casualty company); Director, Continental Energy Services, LLC (oil and gas pipeline service); Director, CompuDyne Corporation (provider of product and services to the public security market) and Director, Annuity and Life Re (Holdings), Ltd. (reinsurance company); Director, President and Chief Executive Officer, Volvo Group North America, Inc.; Senior Vice President, AB Volvo; Director of various public and private corporations; Chairman, DHJ Media, Inc.; Director, Magellan Insurance Company; and Director, The Hertz Corporation, Genmar Corporation (boat manufacturer), National Media Corporation; Advisory Board of Rotary Power International (designer, manufacturer, and seller of rotary power engines); and Chairman, Cortland Trust, Inc. (registered investment company) | 145 | Director of: Nature’s Sunshine Products, Inc., Reich & Tang Funds, Homeowners of America Holding Corporation/ Homeowners of America Insurance Company, the Boss Group | ||||
Jack M. Fields — 1952 Trustee | 2003 | Chief Executive Officer, Twenty First Century Group, Inc. (government affairs company); Owner and Chief Executive Officer, Dos Angeles Ranch, L.P. (cattle, hunting, corporate entertainment); and Discovery Global Education Fund (non-profit)
Formerly: Chief Executive Officer, Texana Timber LP (sustainable forestry company); Director of Cross Timbers Quail Research Ranch (non-profit); and member of the U.S. House of Representatives | 145 | Insperity, Inc. (formerly known as Administaff) | ||||
Prema Mathai-Davis — 1950 Trustee | 2003 | Retired. Formerly: Chief Executive Officer, YWCA of the U.S.A. | 145 | None | ||||
Larry Soll — 1942 Trustee | 1997 | Retired. Formerly: Chairman, Chief Executive Officer and President, Synergen Corp. (a biotechnology company) | 145 | None | ||||
Hugo F. Sonnenschein — 1940 Trustee | 2010 | President Emeritus and Honorary Trustee of the University of Chicago and the Adam Smith Distinguished Service Professor in the Department of Economics at the University of Chicago. Prior to 2000, President of the University of Chicago | 145 | Trustee of the University of Rochester and a member of its investment committee; Member of the National Academy of Sciences and the American Philosophical Society; Fellow of the American Academy of Arts and Sciences | ||||
Raymond Stickel, Jr. — 1944 Trustee | 2005 | Retired. Formerly: Director, Mainstay VP Series Funds, Inc. (25 portfolios) and Partner, Deloitte & Touche | 145 | None |
T-2 Invesco Global Opportunities Fund
Trustees and Officers—(continued)
| Name, Year of Birth and Position(s) Held with the Trust | Trustee and/ or Officer Since | Principal Occupation(s) During Past 5 Years | Number of Funds in Fund Complex Overseen by Trustee | Other Directorship(s) Past 5 Years | ||||
| Independent Trustees—(continued) | ||||||||
Suzanne H. Woolsey — 1941 Trustee | 2014 | Chief Executive Officer of Woolsey Partners LLC | 145 | Emeritus Chair of the Board of Trustees of the Institute for Defense Analyses; Trustee of Colorado College; Trustee of California Institute of Technology; Prior to 2014, Director of Fluor Corp.; Prior to 2010, Trustee of the German Marshall Fund of the United States; Prior to 2010 Trustee of the Rocky Mountain Institute | ||||
| Other Officers | ||||||||
Russell C. Burk — 1958 Senior Vice President and Senior Officer | 2005 | Senior Vice President and Senior Officer, The Invesco Funds | N/A | N/A | ||||
John M. Zerr — 1962 Senior Vice President, Chief Legal Officer and Secretary | 2006 | Director, Senior Vice President, Secretary and General Counsel, Invesco Management Group, Inc. (formerly known as Invesco Aim Management Group, Inc.) and Van Kampen Exchange Corp.; Senior Vice President, Invesco Advisers, Inc. (formerly known as Invesco Institutional (N.A.), Inc.) (registered investment adviser); Senior Vice President and Secretary, Invesco Distributors, Inc. (formerly known as Invesco Aim Distributors, Inc.); Director, Vice President and Secretary, Invesco Investment Services, Inc. (formerly known as Invesco Aim Investment Services, Inc.) and IVZ Distributors, Inc. (formerly known as INVESCO Distributors, Inc.); Director and Vice President, INVESCO Funds Group, Inc.; Senior Vice President, Chief Legal Officer and Secretary, The Invesco Funds; Managing Director, Invesco PowerShares Capital Management LLC; Director, Secretary and General Counsel, Invesco Investment Advisers LLC (formerly known as Van Kampen Asset Management); Secretary and General Counsel, Invesco Capital Markets, Inc. (formerly known as Van Kampen Funds Inc.) and Chief Legal Officer, PowerShares Exchange-Traded Fund Trust, PowerShares Exchange-Traded Fund Trust II, PowerShares India Exchange-Traded Fund Trust, PowerShares Actively Managed Exchange-Traded Fund Trust, and PowerShares Actively Managed Exchange-Traded Commodity Fund Trust
Formerly: Director and Vice President, Van Kampen Advisors Inc.; Director, Vice President, Secretary and General Counsel, Van Kampen Investor Services Inc.; Director, Invesco Distributors, Inc. (formerly known as Invesco Aim Distributors, Inc.); Director, Senior Vice President, General Counsel and Secretary, Invesco Aim Advisers, Inc. and Van Kampen Investments Inc.; Director, Vice President and Secretary, Fund Management Company; Director, Senior Vice President, Secretary, General Counsel and Vice President, Invesco Aim Capital Management, Inc.; Chief Operating Officer and General Counsel, Liberty Ridge Capital, Inc. (an investment adviser); Vice President and Secretary, PBHG Funds (an investment company) and PBHG Insurance Series Fund (an investment company); Chief Operating Officer, General Counsel and Secretary, Old Mutual Investment Partners (a broker-dealer); General Counsel and Secretary, Old Mutual Fund Services (an administrator) and Old Mutual Shareholder Services (a shareholder servicing center); Executive Vice President, General Counsel and Secretary, Old Mutual Capital, Inc. (an investment adviser); and Vice President and Secretary, Old Mutual Advisors Funds (an investment company) | N/A | N/A | ||||
Sheri Morris — 1964 Vice President, Treasurer and Principal Financial Officer | 2003 | Vice President, Treasurer and Principal Financial Officer, The Invesco Funds; Vice President, Invesco Advisers, Inc. (formerly known as Invesco Institutional (N.A.), Inc.) (registered investment adviser); and Vice President, PowerShares Exchange-Traded Fund Trust, PowerShares Exchange-Traded Fund Trust II, PowerShares India Exchange-Traded Fund Trust, PowerShares Actively Managed Exchange-Traded Fund Trust, and PowerShares Actively Managed Exchange-Traded Commodity Fund Trust
Formerly: Vice President, Invesco Aim Advisers, Inc., Invesco Aim Capital Management, Inc. and Invesco Aim Private Asset Management, Inc.; Assistant Vice President and Assistant Treasurer, The Invesco Funds and Assistant Vice President, Invesco Advisers, Inc., Invesco Aim Capital Management, Inc. and Invesco Aim Private Asset Management, Inc.; and Treasurer, PowerShares Exchange-Traded Fund Trust, PowerShares Exchange-Traded Fund Trust II, PowerShares India Exchange-Traded Fund Trust and PowerShares Actively Managed Exchange-Traded Fund Trust | N/A | N/A | ||||
T-3 Invesco Global Opportunities Fund
Trustees and Officers—(continued)
| Name, Year of Birth and Position(s) Held with the Trust | Trustee and/ or Officer Since | Principal Occupation(s) During Past 5 Years | Number of Funds in Fund Complex Overseen by Trustee | Other Directorship(s) Past 5 Years | ||||
| Other Officers—(continued) | ||||||||
Karen Dunn Kelley — 1960 Vice President | 2003 | Senior Managing Director, Investments, Invesco Ltd.; Director, Co-President, Co-Chief Executive Officer, and Co-Chairman, Invesco Advisers, Inc. (formerly known as Invesco Institutional (N.A.), Inc.) (registered investment adviser); Chairman, Invesco Senior Secured Management, Inc.; Senior Vice President, Invesco Management Group, Inc. (formerly known as Invesco Aim Management Group, Inc.); Executive Vice President, Invesco Distributors, Inc. (formerly known as Invesco Aim Distributors, Inc.); Director, Invesco Mortgage Capital Inc. and Invesco Management Company Limited; Vice President, The Invesco Funds (other than AIM Treasurer’s Series Trust (Invesco Treasurer’s Series Trust), Short-Term Investments Trust and Invesco Management Trust); and President and Principal Executive Officer, The Invesco Funds (AIM Treasurer’s Series Trust (Invesco Treasurer’s Series Trust), Short-Term Investments Trust and Invesco Management Trust only)
Formerly: Director and President, INVESCO Asset Management (Bermuda) Ltd., Director, INVESCO Global Asset Management Limited and INVESCO Management S.A.; Senior Vice President, Van Kampen Investments Inc. and Invesco Advisers, Inc. (formerly known as Invesco Institutional (N.A.), Inc.) (registered investment adviser); Vice President, Invesco Advisers, Inc. (formerly known as Invesco Institutional (N.A.), Inc.); Director of Cash Management and Senior Vice President, Invesco Advisers, Inc. and Invesco Aim Capital Management, Inc.; Director and President, Fund Management Company; Chief Cash Management Officer, Director of Cash Management, Senior Vice President, and Managing Director, Invesco Aim Capital Management, Inc.; Director of Cash Management, Senior Vice President, and Vice President, Invesco Advisers, Inc. and The Invesco Funds (AIM Treasurer’s Series Trust (Invesco Treasurer’s Series Trust), and Short-Term Investments Trust only) | N/A | N/A | ||||
Crissie M. Wisdom — 1969 Anti-Money Laundering Compliance Officer | 2013 | Anti-Money Laundering Compliance Officer, Invesco Advisers, Inc. (formerly known as Invesco Institutional (N.A.), Inc.) (registered investment adviser), Invesco Capital Markets, Inc. (formerly known as Van Kampen Funds Inc.), Invesco Distributors, Inc., Invesco Investment Services, Inc., Invesco Management Group, Inc., Van Kampen Exchange Corp., The Invesco Funds, and PowerShares Exchange-Traded Fund Trust, PowerShares Exchange-Traded Fund Trust II, PowerShares India Exchange-Traded Fund Trust, PowerShares Actively Managed Exchange-Traded Fund Trust and PowerShares Actively Managed Exchange-Traded Commodity Fund Trust; Anti-Money Laundering Compliance Officer and Bank Secrecy Act Officer, INVESCO National Trust Company and Invesco Trust Company; and Fraud Prevention Manager and Controls and Risk Analysis Manager for Invesco Investment Services, Inc.. | N/A | N/A | ||||
Lisa O. Brinkley — 1959 Chief Compliance Officer | 2015 | Senior Vice President and Chief Compliance Officer, Invesco Advisers, Inc. (registered investment adviser) (formerly known as Invesco Institutional (N.A., Inc.); and Chief Compliance Officer, The Invesco Funds
Formerly: Global Assurance Officer, Invesco Ltd. and Vice President, The Invesco Funds; Chief Compliance Officer, Invesco Distributors, Inc. (formerly known as Invesco Aim Distributors, Inc.), Invesco Investment Services, Inc.(formerly known as Invesco Aim Investment Services, Inc.) and Van Kampen Investor Services Inc.; Senior Vice President, Invesco Management Group, Inc.; Senior Vice President and Chief Compliance Officer, Invesco Advisers, Inc. and The Invesco Funds; Vice President and Chief Compliance Officer, Invesco Aim Capital Management, Inc. and Invesco Distributors, Inc.; Vice President, Invesco Investment Services, Inc. and Fund Management Company. | N/A | N/A |
The Statement of Additional Information of the Trust includes additional information about the Fund’s Trustees and is available upon request, without charge, by calling 1.800.959.4246. Please refer to the Fund’s prospectus for information on the Fund’s sub-advisers.
Office of the Fund 11 Greenway Plaza, Suite 1000 Houston, TX 77046-1173 | Investment Adviser Invesco Advisers, Inc. 1555 Peachtree Street, N.E. Atlanta, GA 30309 | Distributor Invesco Distributors, Inc. 11 Greenway Plaza, Suite 1000 Houston, TX 77046-1173 | Auditors PricewaterhouseCoopers LLP 1000 Louisiana Street, Suite 5800 Houston, TX 77002-5678 | |||
Counsel to the Fund Stradley Ronon Stevens & Young, LLP 2005 Market Street, Suite 2600 Philadelphia, PA 19103-7018 | Counsel to the Independent Trustees Goodwin Procter LLP 901 New York Avenue, N.W. Washington, D.C. 20001 | Transfer Agent Invesco Investment Services, Inc. 11 Greenway Plaza, Suite 1000 Houston, TX 77046-1173 | Custodian State Street Bank and Trust Company 225 Franklin Street Boston, MA 02110-2801 | |||
T-4 Invesco Global Opportunities Fund

Invesco mailing information
Send general correspondence to Invesco Investment Services, Inc., P.O. Box 219078, Kansas City, MO 64121-9078.
Important notice regarding delivery of security holder documents
To reduce Fund expenses, only one copy of most shareholder documents may be mailed to shareholders with multiple accounts at the same address (Householding). Mailing of your shareholder documents may be householded indefinitely unless you instruct us otherwise. If you do not want the mailing of these documents to be combined with those for other members of your household, please contact Invesco Investment Services, Inc. at 800 959 4246 or contact your financial institution. We will begin sending you individual copies for each account within 30 days after receiving your request.
Fund holdings and proxy voting information
The Fund provides a complete list of its holdings four times in each fiscal year, at the quarter ends. For the second and fourth quarters, the lists appear in the Fund’s semiannual and annual reports to shareholders. For the first and third quarters, the Fund files the lists with the Securities and Exchange Commission (SEC) on Form N-Q. The most recent list of portfolio holdings is available at invesco.com/completeqtrholdings. Shareholders can also look up the Fund’s Forms N-Q on the SEC website at sec.gov. Copies of the Fund’s Forms N-Q may be reviewed and copied at the SEC Public Reference Room in Washington, D.C. You can obtain information on the operation of the Public Reference Room, including information about duplicating fee charges, by calling 202 551 8090 or 800 732 0330, or by electronic request at the following email address: publicinfo@sec.gov. The SEC file numbers for the Fund are shown below.
A description of the policies and procedures that the Fund uses to determine how to vote proxies relating to portfolio securities is available without charge, upon request, from our Client Services department at 800 959 4246 or at invesco.com/proxyguidelines. The information is also available on the SEC website, sec.gov.
Information regarding how the Fund voted proxies related to its portfolio securities during the most recent 12-month period ended June 30 is available at invesco.com/proxysearch. The information is also available on the SEC website, sec.gov. Invesco Advisers, Inc. is an investment adviser; it provides investment advisory services to individual and institutional clients and does not sell securities. Invesco Distributors, Inc. is the US distributor for Invesco Ltd.’s retail mutual funds, exchange-traded funds and institutional money market funds. Both are wholly owned, indirect subsidiaries of Invesco Ltd. |
|
SEC file numbers: 811-06463 and 033-44611 | GLOPP-AR-1 | Invesco Distributors, Inc. |
| ||||
 | Annual Report to Shareholders
| October 31, 2015 | ||
| ||||
Invesco Global Small & Mid Cap Growth Fund
| ||||
| Nasdaq: | ||||
| A: AGAAX n B: AGABX n C: AGACX n Y: AGAYX n R5: GAIIX | ||||

Letters to Shareholders
Philip Taylor | Dear Shareholders: This annual report includes information about your Fund, including performance data and a complete list of its investments as of the close of the reporting period. Inside is a discussion of how your Fund was managed and the factors that affected its performance during the reporting period. I hope you find this report of interest. The US economy expanded and unemployment declined throughout the reporting period. Continuing low energy prices benefited consumers, but a strong US dollar crimped corporate profits. The US Federal Reserve signaled that it was increasingly likely to raise interest rates, based on generally positive economic data, but uncertainty remained about when it might act. Overseas, the story was much different. Low energy prices hurt the economies of some oil-producing nations, such as Brazil and Russia. During the reporting period, the European Central |

Bank as well as central banks in China and Japan – among other countries – either instituted or maintained extraordinarily accommodative monetary policies in response to economic weakness.
Investor uncertainty, such as we saw for much of the reporting period – and market volatility, such as we saw at the end of the reporting period – are unfortunate facts of life when it comes to investing. Some investors use these things as excuses to delay saving and investing for their long-term financial goals. That’s why Invesco encourages investors to work with a professional financial adviser who can stress the importance of starting to save and invest early and the importance of adhering to a disciplined investment plan – when times are good and when they’re uncertain. A financial adviser who knows your unique financial situation, investment goals and risk tolerance can be an invaluable partner as you seek to achieve your financial goals. He or she can offer a long-term perspective when markets are volatile and time-tested advice and guidance when your financial situation or investment goals change.
Timely information when and where you want it
Invesco’s efforts to help investors achieve their financial objectives include providing individual investors and financial professionals with timely information about the markets, the economy and investing – whenever and wherever they want it.
Our website, invesco.com/us, offers a wide range of market insights and investment perspectives. On the website, you’ll find detailed information about our funds, including prices, performance, holdings and portfolio manager commentaries. You can access information about your account by completing a simple, secure online registration. Click on the “Need to register” link in the “Account Access” box on our homepage to get started.
Invesco’s mobile apps for iPhone® and iPad® (both available free from the App StoreSM) allow you to obtain the same detailed information, monitor your account and create customizable watch lists. Also, they allow you to access investment insights from our investment leaders, market strategists, economists and retirement experts. You can sign up to be alerted when new commentary is added, and you can watch portfolio manager videos and have instant access to Invesco news and updates wherever you may be.
In addition to the resources accessible on our website and through our mobile app, you can obtain timely updates to help you stay informed about the markets, the economy and investing by connecting with Invesco on Twitter, LinkedIn or Facebook. You can access our blog at blog.invesco.us.com. Our goal is to provide you the information you want, when and where you want it.
Have questions?
For questions about your account, feel free to contact an Invesco client services representative at 800 959 4246. For Invesco-related questions or comments, please email me directly at phil@invesco.com.
All of us at Invesco look forward to serving your investment management needs for many years to come. Thank you for investing with us.
Sincerely,

Philip Taylor
Senior Managing Director, Invesco Ltd.
iPhone and iPad are trademarks of Apple Inc., registered in the US and other countries. App Store is a service mark of Apple Inc. Invesco Distributors, Inc. is not affiliated with Apple Inc.
2 Invesco Global Small & Mid Cap Growth Fund
Bruce Crockett | Dear Fellow Shareholders: Among the many important lessons I’ve learned in more than 40 years in a variety of business endeavors is the value of a trusted advocate. As independent chair of the Invesco Funds Board, I can assure you that the members of the Board are strong advocates for the interests of investors in Invesco’s mutual funds. We work hard to represent your interests through oversight of the quality of the investment management services your funds receive and other matters important to your investment, including but not limited to: | ||||||
n | Ensuring that Invesco offers a diverse lineup of mutual funds that your financial adviser can use to strive to meet your financial needs as your investment goals change over time. | ||||||
| n | Monitoring how the portfolio management teams of the Invesco funds are performing in light of changing economic and market conditions. | ||||||

| n | Assessing each portfolio management team’s investment performance within the context of the investment strategy described in the fund’s prospectus. |
| n | Monitoring for potential conflicts of interests that may impact the nature of the services that your funds receive. |
We believe one of the most important services we provide our fund shareholders is the annual review of the funds’ advisory and sub-advisory contracts with Invesco Advisers and its affiliates. This review is required by the Investment Company Act of 1940 and focuses on the nature and quality of the services Invesco provides as the adviser to the Invesco funds and the reasonableness of the fees that it charges for those services. Each year, we spend months carefully reviewing information received from Invesco and a variety of independent sources, such as performance and fee data prepared by Lipper Inc., an independent, third-party firm widely recognized as a leader in its field. We also meet with our independent legal counsel and other independent advisers to review and help us assess the information that we have received. Our goal is to assure that you receive quality investment management services for a reasonable fee.
I trust the measures outlined above provide assurance that you have a worthy advocate when it comes to choosing the Invesco Funds.
As always, please contact me at bruce@brucecrockett.com with any questions or concerns you may have. On behalf of the Board, we look forward to continuing to represent your interests and serving your needs.
Sincerely,

Bruce L. Crockett
Independent Chair
Invesco Funds Board of Trustees
3 Invesco Global Small & Mid Cap Growth Fund
Management’s Discussion of Fund Performance
Performance summary
For the fiscal year ended October 31, 2015, Class A shares of Invesco Global Small & Mid Cap Growth Fund (the Fund), at net asset value (NAV), underperformed the MSCI All Country World Small Mid Cap Growth Index, the Fund’s style-specific benchmark.
Your Fund’s long-term performance appears later in this report.
Fund vs. Indexes
Total returns, 10/31/14 to 10/31/15, at net asset value (NAV). Performance shown does not include applicable contingent deferred sales charges (CDSC) or front-end sales charges, which would have reduced performance.
| Class A Shares | -2.28 | % | |||
| Class B Shares | -2.96 | ||||
| Class C Shares | -3.01 | ||||
| Class Y Shares | -2.04 | ||||
| Class R5 Shares | -1.88 | ||||
| MSCI All Country World Small Mid Cap Index▼ (Broad Market Index)* | 1.30 | ||||
| MSCI World Index▼ (Former Broad Market Index)* | 1.77 | ||||
| MSCI All Country World Small Mid Cap Growth Index▼ (Style-Specific Index)* | 3.39 | ||||
| MSCI World Growth Index▼ (Former Style-Specific Index)* | 6.06 | ||||
| Lipper Global Small/Mid-Cap Funds Classification Averagen (Peer Group) | -0.85 |
Source(s): ▼FactSet Research Systems Inc.; nLipper Inc.
| * | The Fund has elected to use the MSCI All Country World Small Mid Cap Index and the MSCI All Country World Small Mid Cap Growth Index as its broad market and style-specific indexes, respectively, rather than the MSCI World Index and the MSCI World Growth Index, respectively, because the MSCI All Country World Small Mid Cap Index and the MSCI All Country World Small Mid Cap Growth Index more closely reflect the performance of the types of securities in which the Fund invests. |
Market conditions and your Fund
International markets experienced increased volatility during the fiscal year ended October 31, 2015, driven largely by the continued slowdown in energy markets and the economic downturn in China. Developed markets were generally able to withstand these headwinds, even as more fragile emerging markets began to falter.
As the reporting period began in late 2014, international equity markets moved higher, although economic growth appeared to be somewhat stronger in the US than in the rest of the world. Equity markets globally were recovering from the initial crash of oil
prices when OPEC added additional uncertainty by deciding to maintain high production despite low prices and slowing global growth. In this environment, commodity-based economies and most currencies underperformed those of the US.
Global markets were rattled again amid growing concerns that Greece and the eurozone would fail to reach an agreement on a financial bailout plan. However, those fears subsided when a bailout was ultimately approved. The eurozone also benefited from generally positive economic data, which helped markets weather subsequent economic volatility.
In the summer of 2015, fears of a potential economic slowdown in China dominated headlines. The combination of
a slowing Chinese economy, a sharp sell-off in domestic Chinese equities and the devaluation of China’s currency, the renminbi, contributed to a strong correction in global equity markets. Emerging markets, in particular, were hard hit by events in China and by continued weak commodity prices – as well as by the US Federal Reserve’s (the Fed) decision to delay raising interest rates, which increased investor uncertainty and market volatility.
As a reminder, the Fund’s country and sector exposures are shaped by the stocks we select based on their own investment merits, rather than by making top-down allocation decisions.
On a geographic basis, stock selection and overweight exposure in the United Kingdom, was the leading contributor to performance relative to the Fund’s style-specific benchmark during the reporting period. Stock selection in China and the United States also contributed to relative performance. Conversely, the Fund’s overweight exposure to emerging markets was a significant detractor from relative performance. Many emerging market holdings declined during the reporting period due to the Fed’s decision regarding interest rates, commodity weakness and the strengthening US dollar. Most notably, overweight exposure to the worst-performing market in the Fund’s style-specific index, Brazil, was the leading detractor from relative performance. The Fund’s holding in Thailand was a drag on relative results as well. Stock selection and underweight exposure in Japan and overweight exposure to Canada also detracted from relative performance.
At the sector level, stock selection in the industrials sector was the leading contributor to both absolute and relative performance during the fiscal year. DCC, an Ireland-based company, was the lead-
Portfolio Composition | |||||
| By sector | % of total net assets |
Financials |
|
24.0 |
% | ||
| Industrials | 15.0 | ||||
| Information Technology | 14.0 | ||||
| Consumer Discretionary | 12.9 | ||||
| Health Care | 7.4 | ||||
| Consumer Staples | 5.1 | ||||
| Energy | 4.7 | ||||
| Materials | 4.0 | ||||
| Utilities | 2.0 | ||||
| Telecommunication Services | 0.9 | ||||
| Money Market Funds Plus Other Assets Less Liabilities | 10.0 |
| Top 10 Equity Holdings* | |||
| % of total net assets | |||
1. |
DCC PLC |
|
4.4 |
% | |||
| 2. | Micro Focus International PLC | 2.9 | |||||
| 3. | IG Group Holdings PLC | 2.8 | |||||
| 4. | Hongkong Land Holdings Ltd. | 2.6 | |||||
| 5. | Deutsche Boerse AG | 2.5 | |||||
| 6. | WH Group Ltd. | 2.0 | |||||
| 7. | Onex Corp. | 1.9 | |||||
| 8. | Fairfax Financial Holdings Ltd. | 1.8 | |||||
| 9. | NetEase, Inc.-ADR | 1.8 | |||||
| 10. | MorphoSys AG | 1.7 |
| Total Net Assets | $569.6 million | ||||
Total Number of Holdings* |
|
98 |
|
The Fund’s holdings are subject to change, and there is no assurance that the Fund will continue to hold any particular security.
*Excluding money market fund holdings.
Data presented here are as of October 31, 2015.
4 Invesco Global Small & Mid Cap Growth Fund
ing contributor to Fund performance. The stock was boosted in the second quarter by a combination of a strong earnings report and an announcement of a large acquisition.
Despite being a detractor from absolute performance, stock selection in the slumping energy sector was supportive of relative results during the reporting period. While most of the Fund’s holdings in the energy sector experienced sharp declines, several holdings managed to return gains. Most notably, Irish-listed independent oil and gas company, Dragon Oil, was acquired by Emirates National Oil (not a Fund holding) at an attractive price during the fiscal year and we sold the Fund’s shares.
In contrast, stock selection in the financials sector was the leading detractor from relative performance versus the Fund’s style-specific benchmark. Within the sector, Fund holdings in emerging markets were the largest drag on relative performance. Specifically BR Malls Participacoes, a mall operator in Brazil, Siam Commercial Bank, one of the largest banks in Thailand, and Cetip, an organizer for over-the-counter market in Brazil, were the most significant detractors from Fund performance during the reporting period.
Stock selection and underweight exposure in the consumer staples sector, the best-performing sector within the Fund’s style-specific index, also detracted from relative performance. Within the sector, Swiss-based global food business, Aryzta, significantly detracted from relative performance. The company’s stock price fell in the third quarter when Aryzta downgraded its earnings guidance and outlook for the rest of this year and next year. China-based meat processing company, WH Group, was also a significant detractor from relative performance. The company’s share price dropped in the third quarter when it posted meat packaging sales that were lower than expected.
Stock selection within the health care, information technology (IT) and utilities sectors detracted from relative performance as well. Within the health care sector, German biotechnology company Morphosys was the leading
detractor from Fund performance. The company’s stock dropped significantly in the first quarter when it announced that its partnership with Celgene (not a Fund holding) for a multiple myeloma drug is ending. Brazilian credit and debit card operator, Cielo, was the largest detractor from Fund performance in the IT sector. Cielo’s stock price fell in the third quarter after the S&P downgrade of Brazil and the prospects for low GDP growth over the next couple of years. Within the utilities sector, Perusahaan Gas Negara, the largest natural gas transportation and distribution company in Indonesia, was the most significant detractor from Fund performance.
Over the reporting period, we continued to look for opportunities to improve the growth potential and quality of the Fund’s portfolio. As disconcerting as volatility may be, we believe it tends to create long-term opportunities for our shareholders. It’s rare to find a thriving business at a compelling valuation when everything is going right; those valuations typically occur when fear dominates the market. On a stock-by-stock basis, we saw the decline over the fiscal year as a buying opportunity.
We thank you for your continued investment in Invesco Global Small & Mid Cap Growth Fund.
The views and opinions expressed in management’s discussion of Fund performance are those of Invesco Advisers, Inc. These views and opinions are subject to change at any time based on factors such as market and economic conditions. These views and opinions may not be relied upon as investment advice or recommendations, or as an offer for a particular security. The information is not a complete analysis of every aspect of any market, country, industry, security or the Fund. Statements of fact are from sources considered reliable, but Invesco Advisers, Inc. makes no representation or warranty as to their completeness or accuracy. Although historical performance is no guarantee of future results, these insights may help you understand our investment management philosophy.
See important Fund and, if applicable, index disclosures later in this report.
 | Shuxin (Steve) Cao Chartered Financial Analyst, Portfolio Manager, is lead manager of Invesco Global Small & Mid | |
| Cap Growth Fund with respect to the Fund’s investments in Asia Pacific and Latin America. He joined Invesco in 1997. Mr. Cao earned a BA in English from the Tianjin Foreign Language Institute and an MBA from Texas A&M University. He is also a Certified Public Accountant. | ||
 | Jason Holzer Chartered Financial Analyst, Portfolio Manager, is lead manager of Invesco Global Small & Mid Cap | |
| Growth Fund with respect to the Fund’s investments in Europe and Canada. He joined Invesco in 1996. Mr. Holzer earned a BA in quantitative economics and an MS in engineering economic systems from Stanford University. | ||
 | Jim Leach Chartered Financial Analyst, Portfolio Manager, is lead manager of Invesco Global Small & Mid Cap | |
| Growth with respect to the domestic portion of the Fund’s portfolio. He joined Invesco in 2011. Mr. Leach earned a BS in mechanical engineering from the University of California and an MBA from New York University Stern School of Business. | ||
 | Borge Endresen Chartered Financial Analyst, Portfolio Manager, is manager of Invesco Global Small & Mid Cap Growth | |
| Fund. He joined Invesco in 1999. Mr. Endresen earned a BS in finance from the University of Oregon and an MBA from The University of Texas at Austin. | ||
5 Invesco Global Small & Mid Cap Growth Fund
Your Fund’s Long-Term Performance
Results of a $10,000 Investment – Oldest Share Class(es)
Fund and index data from 10/31/05
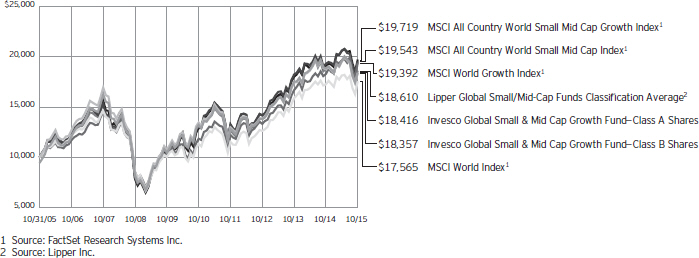
Past performance cannot guarantee comparable future results.
During the reporting period, the Fund has elected to use the MSCI All Country World Small Mid Cap Index and the MSCI All Country World Small Mid Cap Growth Index as its broad market and style-specific indexes, respectively, rather than the MSCI World Index and the MSCI World Growth Index, respectively, because the MSCI All Country World Small Mid Cap Index and the MSCI All Country World Small Mid Cap Growth Index more closely
reflects the performance of the types of securities in which the Fund invests. Because this is the first reporting period since we have adopted the new index, SEC guidelines require that we compare performance to both the old and new indexes.
The data shown in the chart include reinvested distributions, applicable sales charges and Fund expenses including management fees. Results for Class B shares are calculated as if a hypothetical shareholder had liquidated his entire
investment in the Fund at the close of the reporting period and paid the contingent deferred sales charges, if applicable. Index results include reinvested dividends, but they do not reflect sales charges. Performance of the peer group, if applicable, reflects fund expenses and management fees; performance of a market index does not. Performance shown in the chart and table(s) does not reflect deduction of taxes a shareholder would pay on Fund distributions or sale of Fund shares.
continued from page 8
mid-cap securities in developed and emerging markets. The index is computed using the net return, which withholds applicable taxes for non-resident investors.
| n | The MSCI World IndexSM is an unmanaged index considered representative of stocks of developed countries. The index is computed using the net return, which withholds applicable taxes for non-resident investors. |
| n | The MSCI All Country World Small Mid Cap Growth Index is a free float-adjusted market capitalization weighted index that is designed to measure small and mid-cap growth securities in developed and emerging markets. The index is computed using the net return, which withholds applicable taxes for non-resident investors. |
| n | The MSCI World Growth Index is an unmanaged index considered representative of growth stocks of developed countries. The index is computed using |
the net return, which withholds applicable taxes for non-resident investors.
| n | The Lipper Global Small/Mid-Cap Funds Classification Average represents an average of all funds in the Lipper Global Small/Mid-Cap Funds classification. |
| n | The Fund is not managed to track the performance of any particular index, including the index(es) described here, and consequently, the performance of the Fund may deviate significantly from the performance of the index(es). |
| n | A direct investment cannot be made in an index. Unless otherwise indicated, index results include reinvested dividends, and they do not reflect sales charges. Performance of the peer group, if applicable, reflects fund expenses; performance of a market index does not. |
Other information
| n | CPA® and Certified Public Accountant® are trademarks owned by the American Institute of Certified Public Accountants. |
| n | The returns shown in management’s discussion of Fund performance are based on net asset values (NAVs) calculated for shareholder transactions. Generally accepted accounting principles require adjustments to be made to the net assets of the Fund at period end for financial reporting purposes, and as such, the NAVs for shareholder transactions and the returns based on those NAVs may differ from the NAVs and returns reported in the Financial Highlights. |
| n | Industry classifications used in this report are generally according to the Global Industry Classification Standard, which was developed by and is the exclusive property and a service mark of MSCI Inc. and Standard & Poor’s. |
6 Invesco Global Small & Mid Cap Growth Fund
Average Annual Total Returns | |||||
| As of 10/31/15, including maximum applicable sales charges | |||||
Class A Shares | |||||
Inception (9/15/94) | 7.96 | % | |||
10 Years | 6.30 | ||||
5 Years | 5.66 | ||||
1 Year | -7.66 | ||||
Class B Shares | |||||
Inception (9/15/94) | 8.03 | % | |||
10 Years | 6.26 | ||||
5 Years | 5.77 | ||||
1 Year | -7.15 | ||||
Class C Shares | |||||
Inception (8/4/97) | 5.22 | % | |||
10 Years | 6.10 | ||||
5 Years | 6.06 | ||||
1 Year | -3.85 | ||||
Class Y Shares | |||||
10 Years | 7.09 | % | |||
5 Years | 7.12 | ||||
1 Year | -2.04 | ||||
Class R5 Shares | |||||
10 Years | 7.33 | % | |||
5 Years | 7.33 | ||||
1 Year | -1.88 | ||||
Class Y shares incepted on October 3, 2008. Performance shown prior to that date is that of Class A shares and includes the 12b-1 fees applicable to Class A shares.
Class R5 shares incepted on September 28, 2007. Performance shown prior to that date is that of Class A shares and includes the 12b-1 fees applicable to Class A shares.
The performance data quoted represent past performance and cannot guarantee comparable future results; current performance may be lower or higher. Please visit invesco.com/performance for the most recent month-end performance. Performance figures reflect reinvested distributions, changes in net asset value and the effect of the maximum sales charge unless otherwise stated. Investment return and principal value will fluctuate so that you may have a gain or loss when you sell shares.
The net annual Fund operating expense ratio set forth in the most recent Fund prospectus as of the date of this report for Class A, Class B, Class C, Class Y and Class R5 shares was 1.36%, 2.11%, 2.11%, 1.11% and
Average Annual Total Returns | |||||
| As of 9/30/15, the most recent calendar quarter end, including maximum applicable sales charges | |||||
Class A Shares | |||||
Inception (9/15/94) | 7.72 | % | |||
10 Years | 5.30 | ||||
5 Years | 5.17 | ||||
1 Year | -13.04 | ||||
Class B Shares | |||||
Inception (9/15/94) | 7.79 | % | |||
10 Years | 5.27 | ||||
5 Years | 5.28 | ||||
1 Year | -12.63 | ||||
Class C Shares | |||||
Inception (8/4/97) | 4.93 | % | |||
10 Years | 5.11 | ||||
5 Years | 5.58 | ||||
1 Year | -9.51 | ||||
Class Y Shares | |||||
10 Years | 6.09 | % | |||
5 Years | 6.64 | ||||
1 Year | -7.75 | ||||
Class R5 Shares | |||||
10 Years | 6.32 | % | |||
5 Years | 6.83 | ||||
1 Year | -7.69 | ||||
0.97%, respectively.1 The total annual Fund operating expense ratio set forth in the most recent Fund prospectus as of the date of this report for Class A, Class B, Class C, Class Y and Class R5 shares was 1.37%, 2.12%, 2.12%, 1.12% and 0.98%, respectively. The expense ratios presented above may vary from the expense ratios presented in other sections of this report that are based on expenses incurred during the period covered by this report.
Class A share performance reflects the maximum 5.50% sales charge, and Class B and Class C share performance reflects the applicable contingent deferred sales charge (CDSC) for the period involved. The CDSC on Class B shares declines from 5% beginning at the time of purchase to 0% at the beginning of the seventh year. The CDSC on Class C shares is 1% for the first year after purchase. Class Y and Class R5 shares do not have a front-end sales charge or a CDSC; therefore, performance is at net asset value.
The performance of the Fund’s share classes will differ primarily due to different sales charge structures and class expenses.
Fund performance reflects any applicable fee waivers and/or expense reimbursements. Had the adviser not waived fees and/or reimbursed expenses currently or in the past, returns would have been lower. See current prospectus for more information.
| 1 | Total annual Fund operating expenses after any contractual fee waivers and/or expense reimbursements by the adviser in effect through at least June 30, 2017. See current prospectus for more information. |
7 Invesco Global Small & Mid Cap Growth Fund
Invesco Global Small & Mid Cap Growth Fund’s investment objective is long-term growth of capital.
| n | Unless otherwise stated, information presented in this report is as of October 31, 2015, and is based on total net assets. |
| n | Unless otherwise noted, all data provided by Invesco. |
| n | To access your Fund’s reports/prospectus, visit invesco.com/fundreports. |
About share classes
| n | Class B shares may not be purchased for new or additional investments. Please see the prospectus for more information. |
| n | Class Y shares are available only to certain investors. Please see the prospectus for more information. |
| n | Class R5 shares are primarily intended for employer sponsored retirement and benefit plans that meet certain standards and for institutional investors. Please see the prospectus for more information. |
Principal risks of investing in the Fund
| n | Depositary receipts risk. Depositary receipts involve many of the same risks as those associated with direct investment in foreign securities. In addition, the underlying issuers of certain depositary receipts, particularly unsponsored or unregistered depositary receipts, are under no obligation to distribute shareholder communications to the holders of such receipts or to pass through to them any voting rights with respect to the deposited securities. |
| n | Derivatives risk. The value of a derivative instrument depends largely on (and is derived from) the value of an underlying security, currency, commodity, interest rate, index or other asset (each referred to as an underlying asset). In addition to risks relating to the underlying assets, the use of derivatives may include other, possibly greater, risks, including counterparty, leverage and liquidity risks. Counterparty risk is the risk that the counterparty to the derivative contract will default on its obligation to pay the Fund the amount owed or otherwise perform under the derivative contract. Derivatives create leverage risk because they do not require payment up front equal to the economic exposure created by owning the derivative. As a result, an adverse change in the value of the underlying asset could result in the Fund sustaining a loss that is substantially greater than the amount invested in the derivative, which may make the Fund’s returns more volatile and increase the risk of loss. Derivative instruments may also be less liquid than |
more traditional investments and the Fund may be unable to sell or close out its derivative positions at a desirable time or price. This risk may be more acute under adverse market conditions, during which the Fund may be most in need of liquidating its derivative positions. Derivatives may also be harder to value, less tax efficient and subject to changing government regulation that could impact the Fund’s ability to use certain derivatives or their cost. Also, derivatives used for hedging or to gain or limit exposure to a particular market segment may not provide the expected benefits, particularly during adverse market conditions. |
| n | Developing/emerging markets securities risk. The prices of securities issued by foreign companies and governments located in developing/emerging markets countries may be affected more negatively by inflation, devaluation of their currencies, higher transaction costs, delays in settlement, adverse political developments, the introduction of capital controls, withholding taxes, nationalization of private assets, expropriation, social unrest, war or lack of timely information than those in developed countries. |
| n | Foreign securities risk. The Fund’s foreign investments may be affected by changes in a foreign country’s exchange rates, political and social instability, changes in economic or taxation policies, difficulties when enforcing obligations, decreased liquidity, and increased volatility. Foreign companies may be subject to less regulation resulting in less publicly available information about the companies. |
| n | Geographic focus risk. From time to time the Fund may invest a substantial amount of its assets in securities of issuers located in a single country or a limited number of countries. If the Fund focuses its investments in this manner, it assumes the risk that economic, |
| political and social conditions in those countries will have a significant impact on its investment performance. The Fund’s investment performance may also be more volatile if it focuses its investments in certain countries, especially emerging markets countries. |
| n | Growth investing risk. Growth stocks tend to be more expensive relative to their earnings or assets compared with other types of stock. As a result they tend to be more sensitive to changes in their earnings and can be more volatile. |
| n | Management risk. The investment techniques and risk analysis used by the Fund’s portfolio managers may not produce the desired results. |
| n | Market risk. The prices of and the income generated by the Fund’s securities may decline in response to, among other things, investor sentiment, general economic and market conditions, regional or global instability, and currency and interest rate fluctuations. |
| n | Preferred securities risk. Preferred securities may include provisions that permit the issuer, in its discretion, to defer or omit distributions for a certain period of time. If the Fund owns a security that is deferring or omitting its distributions, the Fund may be required to report the distribution on its tax returns, even though it may not have received this income. Further, preferred securities may lose substantial value due to the omission or deferment of dividend payments. |
| n | Small- and mid-capitalization risks. Stocks of small- and mid-sized companies tend to be more vulnerable to adverse developments and may have little or no operating history or track record of success, and limited product lines, markets, management and financial resources. The securities of small- and mid-sized companies may be more volatile due to less market interest and less publicly available information about the issuer. They also may be illiquid or restricted as to resale, or may trade less frequently and in smaller volumes, all of which may cause difficulty when establishing or closing a position at a desirable price. |
About indexes used in this report
| n | The MSCI All Country World Small Mid Cap Index is a free float-adjusted market capitalization weighted index that is designed to measure small and |
continued on page 6
| This report must be accompanied or preceded by a currently effective Fund prospectus, which contains more complete information, including sales charges and expenses. Investors should read it carefully before investing. |
NOT FDIC INSURED | MAY LOSE VALUE | NO BANK GUARANTEE
8 Invesco Global Small & Mid Cap Growth Fund
Schedule of Investments
October 31, 2015
| Shares | Value | |||||||
Common Stocks & Other Equity Interests–89.99% |
| |||||||
| Australia–0.96% | ||||||||
Computershare Ltd. | 706,036 | $ | 5,442,557 | |||||
| Brazil–3.94% | ||||||||
BM&FBOVESPA S.A. | 565,000 | 1,670,991 | ||||||
BR Malls Participacoes S.A. | 960,400 | 2,790,557 | ||||||
CETIP S.A.–Mercados Organizados | 942,765 | 8,340,239 | ||||||
Cielo S.A. | 1,016,342 | 9,652,955 | ||||||
| 22,454,742 | ||||||||
| Canada–5.55% | ||||||||
Fairfax Financial Holdings Ltd. | 20,671 | 10,178,535 | ||||||
Onex Corp. | 182,223 | 11,047,365 | ||||||
Open Text Corp. | 90,310 | 4,185,738 | ||||||
Paramount Resources Ltd.–Class A(a) | 267,039 | 2,701,633 | ||||||
TransForce, Inc. | 180,000 | 3,520,991 | ||||||
| 31,634,262 | ||||||||
| China–3.31% | ||||||||
Lee & Man Paper Manufacturing Ltd. | 14,190,000 | 8,824,681 | ||||||
NetEase, Inc.–ADR | 69,458 | 10,038,765 | ||||||
| 18,863,446 | ||||||||
| France–0.95% | ||||||||
Bollore S.A. | 1,096,700 | 5,429,597 | ||||||
| Germany–4.80% | ||||||||
Deutsche Boerse AG | 151,855 | 13,985,827 | ||||||
MorphoSys AG(a) | 157,821 | 9,765,982 | ||||||
MTU Aero Engines AG | 39,000 | 3,609,908 | ||||||
| 27,361,717 | ||||||||
| Hong Kong–4.66% | ||||||||
Hongkong Land Holdings Ltd. | 1,992,100 | 14,914,233 | ||||||
WH Group Ltd.(a)(b) | 21,039,000 | 11,605,272 | ||||||
| 26,519,505 | ||||||||
| Indonesia–0.74% | ||||||||
PT Perusahaan Gas Negara Persero Tbk | 19,275,700 | 4,197,802 | ||||||
| Ireland–0.72% | ||||||||
Origin Enterprises PLC | 543,000 | 4,078,446 | ||||||
| Israel–1.90% | ||||||||
Israel Chemicals Ltd. | 934,724 | 5,171,574 | ||||||
Israel Discount Bank Ltd.–Class A(a) | 3,086,000 | 5,628,599 | ||||||
| 10,800,173 | ||||||||
| Japan–2.14% | ||||||||
EXEDY Corp. | 339,300 | 7,779,119 | ||||||
THK Co., Ltd. | 233,100 | 4,384,941 | ||||||
| 12,164,060 | ||||||||
| Shares | Value | |||||||
| Netherlands–0.49% | ||||||||
NXP Semiconductors N.V.(a) | 35,672 | $ | 2,794,901 | |||||
| Norway–0.73% | ||||||||
Prosafe S.E. | 1,504,155 | 4,177,198 | ||||||
| Philippines–1.26% | ||||||||
Energy Development Corp. | 50,672,100 | 7,148,875 | ||||||
| Switzerland–2.06% | ||||||||
Aryzta AG | 112,518 | 5,077,712 | ||||||
Tecan Group AG | 49,036 | 6,688,306 | ||||||
| 11,766,018 | ||||||||
| Thailand–0.72% | ||||||||
Siam Commercial Bank PCL (The) | 1,095,400 | 4,087,073 | ||||||
| Turkey–2.85% | ||||||||
Haci Omer Sabanci Holding A.S. | 2,098,392 | 6,653,576 | ||||||
Tupras-Turkiye Petrol Rafinerileri A.S.(a) | 363,635 | 9,603,476 | ||||||
| 16,257,052 | ||||||||
| United Kingdom–22.74% | ||||||||
Aberdeen Asset Management PLC | 815,542 | 4,351,690 | ||||||
Compass Group PLC | 340,574 | 5,867,492 | ||||||
DCC PLC | 308,961 | 24,763,861 | ||||||
HomeServe PLC | 1,099,489 | 6,846,881 | ||||||
IG Group Holdings PLC | 1,360,859 | 15,831,830 | ||||||
Informa PLC | 1,064,791 | 9,303,995 | ||||||
John Wood Group PLC | 680,000 | 6,240,708 | ||||||
Jupiter Fund Management PLC | 958,750 | 6,643,339 | ||||||
Lancashire Holdings Ltd. | 637,330 | 6,990,845 | ||||||
Micro Focus International PLC | 861,607 | 16,685,026 | ||||||
Savills PLC | 548,358 | 7,729,630 | ||||||
Smiths Group PLC | 303,956 | 4,508,311 | ||||||
UBM PLC | 374,848 | 2,951,972 | ||||||
Ultra Electronics Holdings PLC | 225,074 | 5,840,331 | ||||||
William Hill PLC | 1,019,541 | 4,984,585 | ||||||
| 129,540,496 | ||||||||
| United States–29.47% | ||||||||
Acuity Brands, Inc. | 4,756 | 1,039,662 | ||||||
Advance Auto Parts, Inc. | 23,275 | 4,618,458 | ||||||
Allegion PLC | 38,203 | 2,489,689 | ||||||
Allergan PLC(a) | 5,275 | 1,627,179 | ||||||
Alliance Data Systems Corp.(a) | 6,567 | 1,952,435 | ||||||
Amphenol Corp.–Class A | 72,333 | 3,921,895 | ||||||
Berry Plastics Group Inc.(a) | 126,978 | 4,253,763 | ||||||
Boston Scientific Corp.(a) | 226,436 | 4,139,250 | ||||||
Brunswick Corp. | 92,267 | 4,964,887 | ||||||
Burlington Stores, Inc.(a) | 72,897 | 3,504,888 | ||||||
Cadence Design Systems, Inc.(a) | 254,268 | 5,649,835 | ||||||
Carlisle Cos. Inc. | 53,875 | 4,687,125 | ||||||
See accompanying Notes to Financial Statements which are an integral part of the financial statements.
9 Invesco Global Small & Mid Cap Growth Fund
| Shares | Value | |||||||
| United States–(continued) | ||||||||
Cavium Inc.(a) | 73,190 | $ | 5,192,831 | |||||
Cinemark Holdings, Inc. | 108,002 | 3,827,591 | ||||||
Concho Resources Inc.(a) | 22,021 | 2,552,454 | ||||||
Constellation Brands, Inc.–Class A | 31,693 | 4,272,216 | ||||||
E*TRADE Financial Corp.(a) | 124,612 | 3,552,688 | ||||||
EQT Corp. | 26,133 | 1,726,607 | ||||||
Fidelity National Information Services, Inc. | 28,071 | 2,046,937 | ||||||
Harman International Industries, Inc. | 24,033 | 2,642,669 | ||||||
Hologic, Inc.(a) | 56,862 | 2,209,657 | ||||||
IHS Inc.–Class A(a) | 25,916 | 3,097,999 | ||||||
Illumina, Inc.(a) | 18,790 | 2,692,231 | ||||||
Intercontinental Exchange, Inc. | 15,657 | 3,951,827 | ||||||
KAR Auction Services Inc. | 97,824 | 3,756,442 | ||||||
L Brands, Inc. | 21,930 | 2,104,841 | ||||||
Lazard Ltd.–Class A | 55,833 | 2,586,185 | ||||||
Lennox International Inc. | 31,708 | 4,211,139 | ||||||
LinkedIn Corp.–Class A(a) | 15,358 | 3,699,281 | ||||||
McGraw Hill Financial, Inc. | 21,456 | 1,987,684 | ||||||
Medivation Inc.(a) | 52,808 | 2,221,104 | ||||||
MGIC Investment Corp.(a) | 415,778 | 3,908,313 | ||||||
Monster Beverage Corp.(a) | 11,557 | 1,575,450 | ||||||
Pacira Pharmaceuticals, Inc.(a) | 34,632 | 1,729,868 | ||||||
Palo Alto Networks, Inc.(a) | 17,943 | 2,888,823 | ||||||
PPG Industries, Inc. | 42,219 | 4,401,753 | ||||||
Qorvo, Inc.(a) | 44,372 | 1,949,262 | ||||||
Royal Caribbean Cruises Ltd. | 43,722 | 4,300,059 | ||||||
SBA Communications Corp.–Class A(a) | 41,592 | 4,950,280 | ||||||
| Shares | Value | |||||||
| United States–(continued) | ||||||||
Signet Jewelers Ltd. | 41,277 | $ | 6,230,350 | |||||
SolarWinds, Inc.(a) | 33,554 | 1,947,139 | ||||||
Stanley Black & Decker Inc. | 43,090 | 4,566,678 | ||||||
Tesla Motors, Inc.(a) | 9,332 | 1,931,071 | ||||||
Tractor Supply Co. | 44,497 | 4,111,078 | ||||||
Tyler Technologies, Inc.(a) | 9,278 | 1,580,600 | ||||||
Under Armour, Inc.–Class A(a) | 47,895 | 4,553,857 | ||||||
Universal Health Services, Inc.–Class B | 31,907 | 3,895,526 | ||||||
VCA, Inc.(a) | 35,847 | 1,963,340 | ||||||
VWR Corp.(a) | 180,858 | 4,975,404 | ||||||
WABCO Holdings Inc.(a) | 23,045 | 2,586,340 | ||||||
WhiteWave Foods Co. (The)(a) | 64,302 | 2,635,096 | ||||||
| 167,861,736 | ||||||||
Total Common Stocks & Other Equity Interests |
| 512,579,656 | ||||||
Money Market Funds–9.80% |
| |||||||
Liquid Assets Portfolio–Institutional Class, 0.16%(c) | 27,912,298 | 27,912,298 | ||||||
Premier Portfolio–Institutional Class, 0.12%(c) | 27,912,298 | 27,912,298 | ||||||
Total Money Market Funds |
| 55,824,596 | ||||||
TOTAL INVESTMENTS–99.79% |
| 568,404,252 | ||||||
OTHER ASSETS LESS LIABILITIES–0.21% |
| 1,182,887 | ||||||
NET ASSETS–100.00% |
| $ | 569,587,139 | |||||
Investment Abbreviations:
| ADR | – American Depositary Receipt |
Notes to Schedule of Investments:
| (a) | Non-income producing security. |
| (b) | Security purchased or received in a transaction exempt from registration under the Securities Act of 1933, as amended (the “1933 Act”). The security may be resold pursuant to an exemption from registration under the 1933 Act, typically to qualified institutional buyers. The value of this security at October 31, 2015 represented 2.04% of the Fund’s Net Assets. |
| (c) | The money market fund and the Fund are affiliated by having the same investment adviser. The rate shown is the 7-day SEC standardized yield as of October 31, 2015. |
See accompanying Notes to Financial Statements which are an integral part of the financial statements.
10 Invesco Global Small & Mid Cap Growth Fund
Statement of Assets and Liabilities
October 31, 2015
Assets: |
| |||
Investments, at value (Cost $391,054,262) | $ | 512,579,656 | ||
Investments in affiliated money market funds, at value and cost | 55,824,596 | |||
Total investments, at value (Cost $446,878,858) | 568,404,252 | |||
Foreign currencies, at value (Cost $813,086) | 819,009 | |||
Receivable for: | ||||
Investments sold | 1,157,570 | |||
Fund shares sold | 207,713 | |||
Dividends | 532,521 | |||
Investment for trustee deferred compensation and retirement plans | 199,593 | |||
Other assets | 25,295 | |||
Total assets | 571,345,953 | |||
Liabilities: |
| |||
Payable for: | ||||
Fund shares reacquired | 417,608 | |||
Accrued foreign taxes | 628,875 | |||
Accrued fees to affiliates | 370,362 | |||
Accrued trustees’ and officers’ fees and benefits | 2,017 | |||
Accrued other operating expenses | 114,764 | |||
Trustee deferred compensation and retirement plans | 225,188 | |||
Total liabilities | 1,758,814 | |||
Net assets applicable to shares outstanding | $ | 569,587,139 | ||
Net assets consist of: |
| |||
Shares of beneficial interest | $ | 413,488,175 | ||
Undistributed net investment income | 2,627,216 | |||
Undistributed net realized gain | 31,960,525 | |||
Net unrealized appreciation | 121,511,223 | |||
| $ | 569,587,139 | |||
Net Assets: |
| |||
Class A | $ | 504,019,874 | ||
Class B | $ | 7,353,235 | ||
Class C | $ | 27,879,641 | ||
Class Y | $ | 16,721,345 | ||
Class R5 | $ | 13,613,044 | ||
Shares outstanding, $0.001 par value per share, |
| |||
Class A | 27,169,717 | |||
Class B | 475,103 | |||
Class C | 1,799,729 | |||
Class Y | 898,346 | |||
Class R5 | 736,011 | |||
Class A: | ||||
Net asset value per share | $ | 18.55 | ||
Maximum offering price per share | ||||
(Net asset value of $18.55 ¸ 94.50%) | $ | 19.63 | ||
Class B: | ||||
Net asset value and offering price per share | $ | 15.48 | ||
Class C: | ||||
Net asset value and offering price per share | $ | 15.49 | ||
Class Y: | ||||
Net asset value and offering price per share | $ | 18.61 | ||
Class R5: | ||||
Net asset value and offering price per share | $ | 18.50 | ||
See accompanying Notes to Financial Statements which are an integral part of the financial statements.
11 Invesco Global Small & Mid Cap Growth Fund
Statement of Operations
For the year ended October 31, 2015
Investment income: |
| |||
Dividends (net of foreign withholding taxes of $418,330) | $ | 12,404,061 | ||
Dividends from affiliated money market funds | 39,017 | |||
Total investment income | 12,443,078 | |||
Expenses: | ||||
Advisory fees | 4,795,698 | |||
Administrative services fees | 160,594 | |||
Custodian fees | 189,089 | |||
Distribution fees: | ||||
Class A | 1,348,797 | |||
Class B | 95,982 | |||
Class C | 294,807 | |||
Transfer agent fees — A, B, C and Y | 1,326,321 | |||
Transfer agent fees — R5 | 13,961 | |||
Trustees’ and officers’ fees and benefits | 32,382 | |||
Other | 247,175 | |||
Total expenses | 8,504,806 | |||
Less: Fees waived and expense offset arrangement(s) | (78,373 | ) | ||
Net expenses | 8,426,433 | |||
Net investment income | 4,016,645 | |||
Realized and unrealized gain (loss) from: | ||||
Net realized gain (loss) from: | ||||
Investment securities (Net of foreign taxes of $657,601) | 32,259,377 | |||
Foreign currencies | (500,583 | ) | ||
| 31,758,794 | ||||
Change in net unrealized appreciation (depreciation) of: | ||||
Investment securities (net of foreign taxes on holdings of $985,887) | (49,230,895 | ) | ||
Foreign currencies | 28,752 | |||
| (49,202,143 | ) | |||
Net realized and unrealized gain (loss) | (17,443,349 | ) | ||
Net increase (decrease) in net assets resulting from operations | $ | (13,426,704 | ) | |
See accompanying Notes to Financial Statements which are an integral part of the financial statements.
12 Invesco Global Small & Mid Cap Growth Fund
Statement of Changes in Net Assets
For the years ended October 31, 2015 and 2014
| 2015 | 2014 | |||||||
Operations: |
| |||||||
Net investment income | $ | 4,016,645 | $ | 3,230,115 | ||||
Net realized gain | 31,758,794 | 70,732,456 | ||||||
Change in net unrealized appreciation (depreciation) | (49,202,143 | ) | (27,312,994 | ) | ||||
Net increase (decrease) in net assets resulting from operations | (13,426,704 | ) | 46,649,577 | |||||
Distributions to shareholders from net investment income: | ||||||||
Class A | (3,016,780 | ) | (4,339,742 | ) | ||||
Class B | — | (31,052 | ) | |||||
Class C | — | (59,279 | ) | |||||
Class Y | (145,818 | ) | (107,366 | ) | ||||
Class R5 | (123,663 | ) | (263,504 | ) | ||||
Total distributions from net investment income | (3,286,261 | ) | (4,800,943 | ) | ||||
Distributions to shareholders from net realized gains: | ||||||||
Class A | (61,809,369 | ) | (46,022,548 | ) | ||||
Class B | (1,473,690 | ) | (1,462,246 | ) | ||||
Class C | (3,866,332 | ) | (2,791,497 | ) | ||||
Class Y | (2,042,044 | ) | (882,116 | ) | ||||
Class R5 | (1,471,936 | ) | (1,885,173 | ) | ||||
Total distributions from net realized gains | (70,663,371 | ) | (53,043,580 | ) | ||||
Share transactions–net: | ||||||||
Class A | 23,233,411 | 15,791,123 | ||||||
Class B | (2,692,307 | ) | (3,174,863 | ) | ||||
Class C | 2,603,434 | 2,473,205 | ||||||
Class Y | 1,534,155 | 7,387,012 | ||||||
Class R5 | 2,462,340 | (9,025,593 | ) | |||||
Net increase in net assets resulting from share transactions | 27,141,033 | 13,450,884 | ||||||
Net increase (decrease) in net assets | (60,235,303 | ) | 2,255,938 | |||||
Net assets: | ||||||||
Beginning of year | 629,822,442 | 627,566,504 | ||||||
End of year (includes undistributed net investment income of $2,627,216 and $3,055,070, respectively) | $ | 569,587,139 | $ | 629,822,442 | ||||
Notes to Financial Statements
October 31, 2015
NOTE 1—Significant Accounting Policies
Invesco Global Small & Mid Cap Growth Fund (the “Fund”) is a series portfolio of AIM International Mutual Funds (Invesco International Mutual Funds) (the “Trust”). The Trust is a Delaware statutory trust registered under the Investment Company Act of 1940, as amended (the “1940 Act”), as an open-end series management investment company consisting of eight separate portfolios, each authorized to issue an unlimited number of shares of beneficial interest. The assets, liabilities and operations of each portfolio are accounted for separately. Information presented in these financial statements pertains only to the Fund. Matters affecting each portfolio or class will be voted on exclusively by the shareholders of such portfolio or class.
The Fund’s investment objective is long-term growth of capital.
The Fund currently consists of five different classes of shares: Class A, Class B, Class C, Class Y and Class R5. Class A shares are sold with a front-end sales charge unless certain waiver criteria are met and under certain circumstances load waived shares may be subject to contingent deferred sales charges (“CDSC”). Class C shares are sold with a CDSC. Class Y and Class R5 shares are sold at net asset value. Effective November 30, 2010, new or additional investments in Class B shares are no longer permitted. Existing shareholders of Class B shares may continue to reinvest dividends and capital gains distributions in Class B shares until they convert to Class A shares. Also, shareholders in Class B shares will be able to exchange those shares for Class B shares of other Invesco Funds offering such shares until they convert to Class A shares. Generally, Class B shares will automatically convert to Class A shares on or about the month-end, which is at least eight years after the date of purchase. Redemption of Class B shares prior to the conversion date will be subject to a CDSC.
13 Invesco Global Small & Mid Cap Growth Fund
The following is a summary of the significant accounting policies followed by the Fund in the preparation of its financial statements.
| A. | Security Valuations — Securities, including restricted securities, are valued according to the following policy. |
A security listed or traded on an exchange (except convertible securities) is valued at its last sales price or official closing price as of the close of the customary trading session on the exchange where the security is principally traded, or lacking any sales or official closing price on a particular day, the security may be valued at the closing bid price on that day. Securities traded in the over-the-counter market are valued based on prices furnished by independent pricing services or market makers. When such securities are valued by an independent pricing service they may be considered fair valued. Futures contracts are valued at the final settlement price set by an exchange on which they are principally traded. Listed options are valued at the mean between the last bid and asked prices from the exchange on which they are principally traded. Options not listed on an exchange are valued by an independent source at the mean between the last bid and asked prices. For purposes of determining net asset value (“NAV”) per share, futures and option contracts generally are valued 15 minutes after the close of the customary trading session of the New York Stock Exchange (“NYSE”).
Investments in open-end and closed-end registered investment companies that do not trade on an exchange are valued at the end-of-day net asset value per share. Investments in open-end and closed-end registered investment companies that trade on an exchange are valued at the last sales price or official closing price as of the close of the customary trading session on the exchange where the security is principally traded.
Debt obligations (including convertible securities) and unlisted equities are fair valued using an evaluated quote provided by an independent pricing service. Evaluated quotes provided by the pricing service may be determined without exclusive reliance on quoted prices, and may reflect appropriate factors such as institution-size trading in similar groups of securities, developments related to specific securities, dividend rate (for unlisted equities), yield (for debt obligations), quality, type of issue, coupon rate (for debt obligations), maturity (for debt obligations), individual trading characteristics and other market data. Debt obligations are subject to interest rate and credit risks. In addition, all debt obligations involve some risk of default with respect to interest and/or principal payments.
Foreign securities’ (including foreign exchange contracts) prices are converted into U.S. dollar amounts using the applicable exchange rates as of the close of the NYSE. If market quotations are available and reliable for foreign exchange-traded equity securities, the securities will be valued at the market quotations. Because trading hours for certain foreign securities end before the close of the NYSE, closing market quotations may become unreliable. If between the time trading ends on a particular security and the close of the customary trading session on the NYSE, events occur that the Adviser determines are significant and make the closing price unreliable, the Fund may fair value the security. If the event is likely to have affected the closing price of the security, the security will be valued at fair value in good faith using procedures approved by the Board of Trustees. Adjustments to closing prices to reflect fair value may also be based on a screening process of an independent pricing service to indicate the degree of certainty, based on historical data, that the closing price in the principal market where a foreign security trades is not the current value as of the close of the NYSE. Foreign securities’ prices meeting the approved degree of certainty that the price is not reflective of current value will be priced at the indication of fair value from the independent pricing service. Multiple factors may be considered by the independent pricing service in determining adjustments to reflect fair value and may include information relating to sector indices, American Depositary Receipts and domestic and foreign index futures. Foreign securities may have additional risks including exchange rate changes, potential for sharply devalued currencies and high inflation, political and economic upheaval, the relative lack of issuer information, relatively low market liquidity and the potential lack of strict financial and accounting controls and standards.
Securities for which market prices are not provided by any of the above methods may be valued based upon quotes furnished by independent sources. The last bid price may be used to value equity securities. The mean between the last bid and asked prices is used to value debt obligations, including corporate loans.
Securities for which market quotations are not readily available or became unreliable are valued at fair value as determined in good faith by or under the supervision of the Trust’s officers following procedures approved by the Board of Trustees. Issuer specific events, market trends, bid/asked quotes of brokers and information providers and other market data may be reviewed in the course of making a good faith determination of a security’s fair value.
The Fund may invest in securities that are subject to interest rate risk, meaning the risk that the prices will generally fall as interest rates rise and, conversely, the prices will generally rise as interest rates fall. Specific securities differ in their sensitivity to changes in interest rates depending on their individual characteristics. Changes in interest rates may result in increased market volatility, which may affect the value and/or liquidity of certain Fund investments.
Valuations change in response to many factors including the historical and prospective earnings of the issuer, the value of the issuer’s assets, general economic conditions, interest rates, investor perceptions and market liquidity. Because of the inherent uncertainties of valuation, the values reflected in the financial statements may materially differ from the value received upon actual sale of those investments.
| B. | Securities Transactions and Investment Income — Securities transactions are accounted for on a trade date basis. Realized gains or losses on sales are computed on the basis of specific identification of the securities sold. Interest income (net of withholding tax, if any) is recorded on the accrual basis from settlement date. Dividend income (net of withholding tax, if any) is recorded on the ex-dividend date. |
The Fund may periodically participate in litigation related to Fund investments. As such, the Fund may receive proceeds from litigation settlements. Any proceeds received are included in the Statement of Operations as realized gain (loss) for investments no longer held and as unrealized gain (loss) for investments still held.
Brokerage commissions and mark ups are considered transaction costs and are recorded as an increase to the cost basis of securities purchased and/or a reduction of proceeds on a sale of securities. Such transaction costs are included in the determination of net realized and unrealized gain (loss) from investment securities reported in the Statement of Operations and the Statement of Changes in Net Assets and the net realized and unrealized gains (losses) on securities per share in the Financial Highlights. Transaction costs are included in the calculation of the Fund’s net asset value and, accordingly, they reduce the Fund’s total returns. These transaction costs are not considered operating expenses and are not reflected in net investment income reported in the Statement of Operations and the Statement of Changes in Net Assets, or the net investment income per share and the ratios of expenses and net investment income reported in the Financial Highlights, nor are they limited by any expense limitation arrangements between the Fund and the investment adviser.
The Fund allocates income and realized and unrealized capital gains and losses to a class based on the relative net assets of each class.
14 Invesco Global Small & Mid Cap Growth Fund
| C. | Country Determination — For the purposes of making investment selection decisions and presentation in the Schedule of Investments, the investment adviser may determine the country in which an issuer is located and/or credit risk exposure based on various factors. These factors include the laws of the country under which the issuer is organized, where the issuer maintains a principal office, the country in which the issuer derives 50% or more of its total revenues and the country that has the primary market for the issuer’s securities, as well as other criteria. Among the other criteria that may be evaluated for making this determination are the country in which the issuer maintains 50% or more of its assets, the type of security, financial guarantees and enhancements, the nature of the collateral and the sponsor organization. Country of issuer and/or credit risk exposure has been determined to be the United States of America, unless otherwise noted. |
| D. | Distributions — Distributions from net investment income and net realized capital gain, if any, are generally declared and paid annually and recorded on the ex-dividend date. The Fund may elect to treat a portion of the proceeds from redemptions as distributions for federal income tax purposes. |
| E. | Federal Income Taxes — The Fund intends to comply with the requirements of Subchapter M of the Internal Revenue Code of 1986, as amended (the “Internal Revenue Code”), necessary to qualify as a regulated investment company and to distribute substantially all of the Fund’s taxable earnings to shareholders. As such, the Fund will not be subject to federal income taxes on otherwise taxable income (including net realized capital gain) that is distributed to shareholders. Therefore, no provision for federal income taxes is recorded in the financial statements. |
The Fund recognizes the tax benefits of uncertain tax positions only when the position is more likely than not to be sustained. Management has analyzed the Fund’s uncertain tax positions and concluded that no liability for unrecognized tax benefits should be recorded related to uncertain tax positions. Management is not aware of any tax positions for which it is reasonably possible that the total amounts of unrecognized tax benefits will change materially in the next 12 months.
The Fund files tax returns in the U.S. Federal jurisdiction and certain other jurisdictions. Generally, the Fund is subject to examinations by such taxing authorities for up to three years after the filing of the return for the tax period.
| F. | Expenses — Fees provided for under the Rule 12b-1 plan of a particular class of the Fund are charged to the operations of such class. Transfer agency fees and expenses and other shareholder recordkeeping fees and expenses attributable to Class R5 are charged to such class. Transfer agency fees and expenses and other shareholder recordkeeping fees and expenses relating to all other classes are allocated among those classes based on relative net assets. All other expenses are allocated among the classes based on relative net assets. |
| G. | Accounting Estimates — The preparation of financial statements in conformity with accounting principles generally accepted in the United States of America (“GAAP”) requires management to make estimates and assumptions that affect the reported amounts of assets and liabilities at the date of the financial statements and the reported amounts of revenues and expenses during the reporting period including estimates and assumptions related to taxation. Actual results could differ from those estimates by a significant amount. In addition, the Fund monitors for material events or transactions that may occur or become known after the period-end date and before the date the financial statements are released to print. |
| H. | Indemnifications — Under the Trust’s organizational documents, each Trustee, officer, employee or other agent of the Trust is indemnified against certain liabilities that may arise out of the performance of their duties to the Fund. Additionally, in the normal course of business, the Fund enters into contracts, including the Fund’s servicing agreements, that contain a variety of indemnification clauses. The Fund’s maximum exposure under these arrangements is unknown as this would involve future claims that may be made against the Fund that have not yet occurred. The risk of material loss as a result of such indemnification claims is considered remote. |
| I. | Foreign Currency Translations — Foreign currency is valued at the close of the NYSE based on quotations posted by banks and major currency dealers. Portfolio securities and other assets and liabilities denominated in foreign currencies are translated into U.S. dollar amounts at date of valuation. Purchases and sales of portfolio securities (net of foreign taxes withheld on disposition) and income items denominated in foreign currencies are translated into U.S. dollar amounts on the respective dates of such transactions. The Fund does not separately account for the portion of the results of operations resulting from changes in foreign exchange rates on investments and the fluctuations arising from changes in market prices of securities held. The combined results of changes in foreign exchange rates and the fluctuation of market prices on investments (net of estimated foreign tax withholding) are included with the net realized and unrealized gain or loss from investments in the Statement of Operations. Reported net realized foreign currency gains or losses arise from (1) sales of foreign currencies, (2) currency gains or losses realized between the trade and settlement dates on securities transactions, and (3) the difference between the amounts of dividends, interest, and foreign withholding taxes recorded on the Fund’s books and the U.S. dollar equivalent of the amounts actually received or paid. Net unrealized foreign currency gains and losses arise from changes in the fair values of assets and liabilities, other than investments in securities at fiscal period end, resulting from changes in exchange rates. |
The Fund may invest in foreign securities, which may be subject to foreign taxes on income, gains on investments or currency repatriation, a portion of which may be recoverable. Foreign taxes, if any, are recorded based on the tax regulations and rates that exist in the foreign markets in which the Fund invests and are shown in the Statement of Operations.
| J. | Forward Foreign Currency Contracts — The Fund may engage in foreign currency transactions either on a spot (i.e. for prompt delivery and settlement) basis, or through forward foreign currency contracts, to manage or minimize currency or exchange rate risk. |
The Fund may also enter into forward foreign currency contracts for the purchase or sale of a security denominated in a foreign currency in order to “lock in” the U.S. dollar price of that security, or the Fund may also enter into forward foreign currency contracts that do not provide for physical settlement of the two currencies, but instead are settled by a single cash payment calculated as the difference between the agreed upon exchange rate and the spot rate at settlement based upon an agreed upon notional amount (non-deliverable forwards). The Fund will set aside liquid assets in an amount equal to daily mark-to-market obligation for forward foreign currency contracts.
A forward foreign currency contract is an obligation between two parties (“Counterparties”) to purchase or sell a specific currency for an agreed-upon price at a future date. The use of forward foreign currency contracts does not eliminate fluctuations in the price of the underlying securities the Fund owns or intends to acquire but establishes a rate of exchange in advance. Fluctuations in the value of these contracts are measured by the difference in the contract date and reporting date exchange rates and are recorded as unrealized appreciation (depreciation) until the contracts are closed. When the contracts are closed, realized gains (losses) are recorded. Realized and unrealized gains (losses) on the contracts are included in the Statement of Operations. The primary risks associated with forward foreign currency contracts include failure of the
15 Invesco Global Small & Mid Cap Growth Fund
Counterparty to meet the terms of the contract and the value of the foreign currency changing unfavorably. These risks may be in excess of the amounts reflected in the Statement of Assets and Liabilities.
NOTE 2—Advisory Fees and Other Fees Paid to Affiliates
The Trust has entered into a master investment advisory agreement with Invesco Advisers, Inc. (the “Adviser” or “Invesco”). Under the terms of the investment advisory agreement, the Fund pays an advisory fee to the Adviser based on the annual rate of the Fund’s average daily net assets as follows:
| Average Daily Net Assets | Rate | |||
First $250 million | 0.80% | |||
Next $250 million | 0.78% | |||
Next $500 million | 0.76% | |||
Next $1.5 billion | 0.74% | |||
Next $2.5 billion | 0.72% | |||
Next $2.5 billion | 0.70% | |||
Next $2.5 billion | 0.68% | |||
Over $10 billion | 0.66% | |||
For the year ended October 31, 2015, the effective advisory fees incurred by the Fund was 0.78%.
Under the terms of a master sub-advisory agreement between the Adviser and each of Invesco Asset Management Deutschland GmbH, Invesco Asset Management Limited, Invesco Asset Management (Japan) Limited, Invesco Hong Kong Limited, Invesco Senior Secured Management, Inc. and Invesco Canada Ltd. (collectively, the “Affiliated Sub-Advisers”) the Adviser, not the Fund, may pay 40% of the fees paid to the Adviser to any such Affiliated Sub-Adviser(s) that provide(s) discretionary investment management services to the Fund based on the percentage of assets allocated to such Affiliated Sub-Adviser(s).
The Adviser has contractually agreed, through at least June 30, 2016, to waive advisory fees and/or reimburse expenses of all shares to the extent necessary to limit total annual fund operating expenses after fee waiver and/or expense reimbursement (excluding certain items discussed below) of Class A, Class B, Class C, Class Y and Class R5 shares to 2.25%, 3.00%, 3.00%, 2.00% and 2.00%, respectively, of average daily net assets. In determining the Adviser’s obligation to waive advisory fees and/or reimburse expenses, the following expenses are not taken into account, and could cause the total annual fund operating expenses after fee waiver and/or expense reimbursement to exceed the numbers reflected above: (1) interest; (2) taxes; (3) dividend expense on short sales; (4) extraordinary or non-routine items, including litigation expenses; and (5) expenses that the Fund has incurred but did not actually pay because of an expense offset arrangement. Unless Invesco continues the fee waiver agreement, it will terminate on June 30, 2016. The fee waiver agreement cannot be terminated during its term. The Adviser did not waive fees and/or reimburse expenses during the period under this expense limitation.
Further, the Adviser has contractually agreed, through at least June 30, 2017, to waive the advisory fee payable by the Fund in an amount equal to 100% of the net advisory fees the Adviser receives from the affiliated money market funds on investments by the Fund of uninvested cash in such affiliated money market funds.
For the year ended October 31, 2015, the Adviser waived advisory fees of $73,525.
The Trust has entered into a master administrative services agreement with Invesco pursuant to which the Fund has agreed to pay Invesco for certain administrative costs incurred in providing accounting services to the Fund. For the year ended October 31, 2015, expenses incurred under the agreement are shown in the Statement of Operations as Administrative services fees.
The Trust has entered into a transfer agency and service agreement with Invesco Investment Services, Inc. (“IIS”) pursuant to which the Fund has agreed to pay IIS a fee for providing transfer agency and shareholder services to the Fund and reimburse IIS for certain expenses incurred by IIS in the course of providing such services. IIS may make payments to intermediaries that provide omnibus account services, sub-accounting services and/or networking services. All fees payable by IIS to intermediaries that provide omnibus account services or sub-accounting are charged back to the Fund, subject to certain limitations approved by the Trust’s Board of Trustees. For the year ended October 31, 2015, expenses incurred under the agreement are shown in the Statement of Operations as Transfer agent fees.
The Trust has entered into master distribution agreements with Invesco Distributors, Inc. (“IDI”) to serve as the distributor for the Class A, Class B, Class C, Class Y and Class R5 shares of the Fund. The Trust has adopted plans pursuant to Rule 12b-1 under the 1940 Act with respect to the Fund’s Class A, Class B and Class C shares (collectively, the “Plans”). The Fund, pursuant to the Plans, pays IDI compensation at the annual rate of 0.25% of the Fund’s average daily net assets of Class A shares and 1.00% of the average daily net assets of Class B and Class C shares. Of the Plan payments, up to 0.25% of the average daily net assets of each class of shares may be paid to furnish continuing personal shareholder services to customers who purchase and own shares of such classes. Any amounts not paid as a service fee under the Plans would constitute an asset-based sales charge. Rules of the Financial Industry Regulatory Authority (“FINRA”) impose a cap on the total sales charges, including asset-based sales charges, that may be paid by any class of shares of the Fund. For the year ended October 31, 2015, expenses incurred under the Plans are shown in the Statement of Operations as Distribution fees.
Front-end sales commissions and CDSC (collectively, the “sales charges”) are not recorded as expenses of the Fund. Front-end sales commissions are deducted from proceeds from the sales of Fund shares prior to investment in Class A shares of the Fund. CDSC are deducted from redemption proceeds prior to remittance to the shareholder. During the year ended October 31, 2015, IDI advised the Fund that IDI retained $70,001 in front-end sales commissions from the sale of Class A shares and $1,554, $2,870 and $1,313 from Class A, Class B and Class C shares, respectively, for CDSC imposed on redemptions by shareholders.
For the year ended October 31, 2015, the Fund incurred $1,280 in brokerage commissions with Invesco Capital Markets, Inc., an affiliate of the Adviser and IDI, for portfolio transactions executed on behalf of the Fund.
Certain officers and trustees of the Trust are officers and directors of the Adviser, IIS and/or IDI.
16 Invesco Global Small & Mid Cap Growth Fund
NOTE 3—Additional Valuation Information
GAAP defines fair value as the price that would be received to sell an asset or paid to transfer a liability in an orderly transaction between market participants at the measurement date, under current market conditions. GAAP establishes a hierarchy that prioritizes the inputs to valuation methods, giving the highest priority to readily available unadjusted quoted prices in an active market for identical assets (Level 1) and the lowest priority to significant unobservable inputs (Level 3), generally when market prices are not readily available or are unreliable. Based on the valuation inputs, the securities or other investments are tiered into one of three levels. Changes in valuation methods may result in transfers in or out of an investment’s assigned level:
| Level 1 — | Prices are determined using quoted prices in an active market for identical assets. |
| Level 2 — | Prices are determined using other significant observable inputs. Observable inputs are inputs that other market participants may use in pricing a security. These may include quoted prices for similar securities, interest rates, prepayment speeds, credit risk, yield curves, loss severities, default rates, discount rates, volatilities and others. |
| Level 3 — | Prices are determined using significant unobservable inputs. In situations where quoted prices or observable inputs are unavailable (for example, when there is little or no market activity for an investment at the end of the period), unobservable inputs may be used. Unobservable inputs reflect the Fund’s own assumptions about the factors market participants would use in determining fair value of the securities or instruments and would be based on the best available information. |
The following is a summary of the tiered valuation input levels, as of October 31, 2015. The level assigned to the securities valuations may not be an indication of the risk or liquidity associated with investing in those securities. Because of the inherent uncertainties of valuation, the values reflected in the financial statements may materially differ from the value received upon actual sale of those investments.
During the year ended October 31, 2015, there were transfers from Level 1 to Level 2 of $62,328,950 and from Level 2 to Level 1 of $20,107,027, due to foreign fair value adjustments.
| Level 1 | Level 2 | Level 3 | Total | |||||||||||||
Australia | $ | 5,442,557 | $ | — | $ | — | $ | 5,442,557 | ||||||||
Brazil | 22,454,742 | — | — | 22,454,742 | ||||||||||||
Canada | 31,634,262 | — | — | 31,634,262 | ||||||||||||
China | 10,038,765 | 8,824,681 | — | 18,863,446 | ||||||||||||
France | 5,429,597 | — | — | 5,429,597 | ||||||||||||
Germany | 27,361,717 | — | — | 27,361,717 | ||||||||||||
Hong Kong | — | 26,519,505 | — | 26,519,505 | ||||||||||||
Indonesia | — | 4,197,802 | — | 4,197,802 | ||||||||||||
Ireland | 4,078,446 | — | — | 4,078,446 | ||||||||||||
Israel | 10,800,173 | — | — | 10,800,173 | ||||||||||||
Japan | — | 12,164,060 | — | 12,164,060 | ||||||||||||
Netherlands | 2,794,901 | — | — | 2,794,901 | ||||||||||||
Norway | — | 4,177,198 | — | 4,177,198 | ||||||||||||
Philippines | — | 7,148,875 | — | 7,148,875 | ||||||||||||
Switzerland | 11,766,018 | — | — | 11,766,018 | ||||||||||||
Thailand | — | 4,087,073 | — | 4,087,073 | ||||||||||||
Turkey | 9,603,476 | 6,653,576 | — | 16,257,052 | ||||||||||||
United Kingdom | 38,865,134 | 90,675,362 | — | 129,540,496 | ||||||||||||
United States | 223,686,332 | — | — | 223,686,332 | ||||||||||||
Total Investments | $ | 403,956,120 | $ | 164,448,132 | $ | — | $ | 568,404,252 | ||||||||
NOTE 4—Expense Offset Arrangement(s)
The expense offset arrangement is comprised of transfer agency credits which result from balances in demand deposit accounts used by the transfer agent for clearing shareholder transactions. For the year ended October 31, 2015, the Fund received credits from this arrangement, which resulted in the reduction of the Fund’s total expenses of $4,848.
NOTE 5—Trustees’ and Officers’ Fees and Benefits
Trustees’ and Officers’ Fees and Benefits include amounts accrued by the Fund to pay remuneration to certain Trustees and Officers of the Fund. Trustees have the option to defer compensation payable by the Fund, and Trustees’ and Officers’ Fees and Benefits also include amounts accrued by the Fund to fund such deferred compensation amounts. Those Trustees who defer compensation have the option to select various Invesco Funds in which their deferral accounts shall be deemed to be invested. Finally, certain current Trustees were eligible to participate in a retirement plan that provided for benefits to be paid upon retirement to Trustees over a period of time based on the number of years of service. The Fund may have certain former Trustees who also participate in a retirement plan and receive benefits under such plan. Trustees’ and Officers’ Fees and Benefits include amounts accrued by the Fund to fund such retirement benefits. Obligations under the deferred compensation and retirement plans represent unsecured claims against the general assets of the Fund.
17 Invesco Global Small & Mid Cap Growth Fund
NOTE 6—Cash Balances
The Fund is permitted to temporarily carry a negative or overdrawn balance in its account with State Street Bank and Trust Company, the custodian bank. Such balances, if any at period end, are shown in the Statement of Assets and Liabilities under the payable caption Amount due custodian. To compensate the custodian bank for such overdrafts, the overdrawn Fund may either (1) leave funds as a compensating balance in the account so the custodian bank can be compensated by earning the additional interest; or (2) compensate by paying the custodian bank at a rate agreed upon by the custodian bank and Invesco, not to exceed the contractually agreed upon rate.
NOTE 7—Distributions to Shareholders and Tax Components of Net Assets
Tax Character of Distributions to Shareholders Paid During the Fiscal Years Ended October 31, 2015 and 2014:
| 2015 | 2014 | |||||||
Ordinary income | $ | 3,286,261 | $ | 9,132,598 | ||||
Long-term capital gain | 70,663,371 | 48,711,925 | ||||||
Total distributions | $ | 73,949,632 | $ | 57,844,523 | ||||
Tax Components of Net Assets at Period-End:
| 2015 | ||||
Undistributed ordinary income | $ | 3,044,552 | ||
Undistributed long-term gain | 32,840,651 | |||
Net unrealized appreciation — investments | 120,452,520 | |||
Net unrealized appreciation (depreciation) — other investments | (14,171 | ) | ||
Temporary book/tax differences | (224,588 | ) | ||
Shares of beneficial interest | 413,488,175 | |||
Total net assets | $ | 569,587,139 | ||
The difference between book-basis and tax-basis unrealized appreciation (depreciation) is due to differences in the timing of recognition of gains and losses on investments for tax and book purposes. The Fund’s net unrealized appreciation difference is attributable primarily to wash sales.
The temporary book/tax differences are a result of timing differences between book and tax recognition of income and/or expenses. The Fund’s temporary book/tax differences are the result of the trustee deferral of compensation and retirement plan benefits.
Capital loss carryforward is calculated and reported as of a specific date. Results of transactions and other activity after that date may affect the amount of capital loss carryforward actually available for the Fund to utilize. Capital losses generated in years beginning after December 22, 2010 can be carried forward for an unlimited period, whereas previous losses expire in eight tax years. Capital losses with an expiration period may not be used to offset capital gains until all net capital losses without an expiration date have been utilized. Capital loss carryforwards with no expiration date will retain their character as either short-term or long-term capital losses instead of as short-term capital losses as under prior law. The ability to utilize capital loss carryforwards in the future may be limited under the Internal Revenue Code and related regulations based on the results of future transactions.
The Fund does not have a capital loss carryforward as of October 31, 2015.
NOTE 8—Investment Securities
The aggregate amount of investment securities (other than short-term securities, U.S. Treasury obligations and money market funds, if any) purchased and sold by the Fund during the year ended October 31, 2015 was $141,230,012 and $190,842,744, respectively. Cost of investments on a tax basis includes the adjustments for financial reporting purposes as of the most recently completed federal income tax reporting period-end.
| Unrealized Appreciation (Depreciation) of Investment Securities on a Tax Basis | ||||
Aggregate unrealized appreciation of investment securities | $ | 157,446,770 | ||
Aggregate unrealized (depreciation) of investment securities | (36,994,250 | ) | ||
Net unrealized appreciation of investment securities | $ | 120,452,520 | ||
Cost of investments for tax purposes is $447,951,732.
NOTE 9—Reclassification of Permanent Differences
Primarily as a result of differing book/tax treatment of foreign currency transactions and foreign capital gain taxes, on October 31, 2015, undistributed net investment income was decreased by $1,158,238 and undistributed net realized gain was increased by $1,158,238. This reclassification had no effect on the net assets of the Fund.
18 Invesco Global Small & Mid Cap Growth Fund
NOTE 10—Share Information
| Summary of Share Activity | ||||||||||||||||
| Years ended October 31, | ||||||||||||||||
| 2015(a) | 2014 | |||||||||||||||
| Shares | Amount | Shares | Amount | |||||||||||||
Sold: | ||||||||||||||||
Class A | 1,499,916 | $ | 29,138,450 | 1,900,337 | $ | 40,398,249 | ||||||||||
Class B | 11,718 | 192,903 | 19,526 | 357,338 | ||||||||||||
Class C | 299,129 | 4,892,671 | 326,870 | 6,000,317 | ||||||||||||
Class Y | 326,703 | 6,410,607 | 445,673 | 9,510,891 | ||||||||||||
Class R5 | 193,952 | 3,707,088 | 72,662 | 1,549,385 | ||||||||||||
Issued as reinvestment of dividends: | ||||||||||||||||
Class A | 3,351,989 | 61,710,118 | 2,329,616 | 46,126,396 | ||||||||||||
Class B | 93,226 | 1,441,267 | 84,985 | 1,447,288 | ||||||||||||
Class C | 242,184 | 3,746,582 | 158,302 | 2,697,463 | ||||||||||||
Class Y | 103,532 | 1,908,092 | 40,273 | 798,206 | ||||||||||||
Class R5 | 87,093 | 1,592,917 | 57,798 | 1,138,611 | ||||||||||||
Automatic conversion of Class B shares to Class A shares: | ||||||||||||||||
Class A | 146,258 | 2,850,440 | 158,109 | 3,358,448 | ||||||||||||
Class B | (174,430 | ) | (2,850,440 | ) | (184,290 | ) | (3,358,448 | ) | ||||||||
Reacquired: | ||||||||||||||||
Class A | (3,642,223 | ) | (70,465,597 | ) | (3,478,136 | ) | (74,091,970 | ) | ||||||||
Class B | (90,173 | ) | (1,476,037 | ) | (88,695 | ) | (1,621,041 | ) | ||||||||
Class C | (370,702 | ) | (6,035,819 | ) | (341,240 | ) | (6,224,575 | ) | ||||||||
Class Y | (354,991 | ) | (6,784,544 | ) | (138,395 | ) | (2,922,085 | ) | ||||||||
Class R5 | (147,380 | ) | (2,837,665 | ) | (550,912 | ) | (11,713,589 | ) | ||||||||
Net increase in share activity | 1,575,801 | $ | 27,141,033 | 812,483 | $ | 13,450,884 | ||||||||||
| (a) | There are entities that are record owners of more than 5% of the outstanding shares of the Fund and in the aggregate own 31% of the outstanding shares of the Fund. IDI has an agreement with these entities to sell Fund shares. The Fund, Invesco and/or Invesco affiliates may make payments to these entities, which are considered to be related to the Fund, for providing services to the Fund, Invesco and/or Invesco affiliates including but not limited to services such as securities brokerage, distribution, third party record keeping and account servicing. The Fund has no knowledge as to whether all or any portion of the shares owned of record by these entities are also owned beneficially. |
19 Invesco Global Small & Mid Cap Growth Fund
NOTE 11—Financial Highlights
The following schedule presents financial highlights for a share of the Fund outstanding throughout the periods indicated.
| Net asset value, beginning of period | Net investment income (loss)(a) | Net gains (both | Total from investment operations | Dividends income | Distributions from net | Total distributions | Net asset value, end of period(b) | Total return(c) | Net assets, end of period (000’s omitted) | Ratio of expenses to average net assets with fee waivers and/or expenses absorbed | Ratio of expenses to average net assets without fee waivers and/or expenses absorbed | Ratio of net investment income (loss) to average net assets | Portfolio turnover(d) | |||||||||||||||||||||||||||||||||||||||||||
Class A | ||||||||||||||||||||||||||||||||||||||||||||||||||||||||
Year ended 10/31/15 | $ | 21.59 | $ | 0.13 | $ | (0.64 | ) | $ | (0.51 | ) | $ | (0.12 | ) | $ | (2.41 | ) | $ | (2.53 | ) | $ | 18.55 | (2.28 | )% | $ | 504,020 | 1.35 | %(e) | 1.36 | %(e) | 0.69 | %(e) | 25 | % | |||||||||||||||||||||||
Year ended 10/31/14 | 22.11 | 0.12 | 1.40 | 1.52 | (0.18 | ) | (1.86 | ) | (2.04 | ) | 21.59 | 7.69 | 557,238 | 1.35 | 1.36 | 0.54 | 18 | |||||||||||||||||||||||||||||||||||||||
Year ended 10/31/13 | 17.87 | 0.17 | 4.48 | 4.65 | (0.16 | ) | (0.25 | ) | (0.41 | ) | 22.11 | 26.56 | 550,526 | 1.37 | 1.38 | 0.87 | 26 | |||||||||||||||||||||||||||||||||||||||
Year ended 10/31/12 | 17.93 | 0.17 | 1.10 | 1.27 | (0.24 | ) | (1.09 | ) | (1.33 | ) | 17.87 | 7.94 | 482,051 | 1.42 | 1.43 | 1.00 | 37 | |||||||||||||||||||||||||||||||||||||||
Year ended 10/31/11 | 18.57 | 0.18 | (0.74 | ) | (0.56 | ) | (0.08 | ) | — | (0.08 | ) | 17.93 | (3.05 | ) | 508,794 | 1.40 | 1.41 | 0.95 | 58 | |||||||||||||||||||||||||||||||||||||
Class B | ||||||||||||||||||||||||||||||||||||||||||||||||||||||||
Year ended 10/31/15 | 18.44 | (0.01 | ) | (0.54 | ) | (0.55 | ) | — | (2.41 | ) | (2.41 | ) | 15.48 | (2.96 | ) | 7,353 | 2.10 | (e) | 2.11 | (e) | (0.06 | )(e) | 25 | |||||||||||||||||||||||||||||||||
Year ended 10/31/14 | 19.18 | (0.04 | ) | 1.20 | 1.16 | (0.04 | ) | (1.86 | ) | (1.90 | ) | 18.44 | 6.87 | 11,707 | 2.10 | 2.11 | (0.21 | ) | 18 | |||||||||||||||||||||||||||||||||||||
Year ended 10/31/13 | 15.57 | 0.02 | 3.89 | 3.91 | (0.05 | ) | (0.25 | ) | (0.30 | ) | 19.18 | 25.58 | 15,405 | 2.12 | 2.13 | 0.12 | 26 | |||||||||||||||||||||||||||||||||||||||
Year ended 10/31/12 | 15.74 | 0.04 | 0.96 | 1.00 | (0.08 | ) | (1.09 | ) | (1.17 | ) | 15.57 | 7.12 | 17,529 | 2.17 | 2.18 | 0.25 | 37 | |||||||||||||||||||||||||||||||||||||||
Year ended 10/31/11 | 16.36 | 0.03 | (0.65 | ) | (0.62 | ) | — | — | — | 15.74 | (3.79 | ) | 23,124 | 2.15 | 2.16 | 0.20 | 58 | |||||||||||||||||||||||||||||||||||||||
Class C | ||||||||||||||||||||||||||||||||||||||||||||||||||||||||
Year ended 10/31/15 | 18.46 | (0.01 | ) | (0.55 | ) | (0.56 | ) | — | (2.41 | ) | (2.41 | ) | 15.49 | (3.01 | ) | 27,880 | 2.10 | (e) | 2.11 | (e) | (0.06 | )(e) | 25 | |||||||||||||||||||||||||||||||||
Year ended 10/31/14 | 19.19 | (0.04 | ) | 1.21 | 1.17 | (0.04 | ) | (1.86 | ) | (1.90 | ) | 18.46 | 6.92 | 30,069 | 2.10 | 2.11 | (0.21 | ) | 18 | |||||||||||||||||||||||||||||||||||||
Year ended 10/31/13 | 15.58 | 0.02 | 3.89 | 3.91 | (0.05 | ) | (0.25 | ) | (0.30 | ) | 19.19 | 25.56 | 28,505 | 2.12 | 2.13 | 0.12 | 26 | |||||||||||||||||||||||||||||||||||||||
Year ended 10/31/12 | 15.75 | 0.04 | 0.96 | 1.00 | (0.08 | ) | (1.09 | ) | (1.17 | ) | 15.58 | 7.11 | 22,401 | 2.17 | 2.18 | 0.25 | 37 | |||||||||||||||||||||||||||||||||||||||
Year ended 10/31/11 | 16.37 | 0.03 | (0.65 | ) | (0.62 | ) | — | — | — | 15.75 | (3.79 | ) | 23,368 | 2.15 | 2.16 | 0.20 | 58 | |||||||||||||||||||||||||||||||||||||||
Class Y | ||||||||||||||||||||||||||||||||||||||||||||||||||||||||
Year ended 10/31/15 | 21.66 | 0.18 | (0.65 | ) | (0.47 | ) | (0.17 | ) | (2.41 | ) | (2.58 | ) | 18.61 | (2.04 | ) | 16,721 | 1.10 | (e) | 1.11 | (e) | 0.94 | (e) | 25 | |||||||||||||||||||||||||||||||||
Year ended 10/31/14 | 22.18 | 0.17 | 1.40 | 1.57 | (0.23 | ) | (1.86 | ) | (2.09 | ) | 21.66 | 7.94 | 17,830 | 1.10 | 1.11 | 0.79 | 18 | |||||||||||||||||||||||||||||||||||||||
Year ended 10/31/13 | 17.92 | 0.22 | 4.49 | 4.71 | (0.20 | ) | (0.25 | ) | (0.45 | ) | 22.18 | 26.87 | 10,546 | 1.12 | 1.13 | 1.12 | 26 | |||||||||||||||||||||||||||||||||||||||
Year ended 10/31/12 | 18.00 | 0.22 | 1.09 | 1.31 | (0.30 | ) | (1.09 | ) | (1.39 | ) | 17.92 | 8.18 | 7,406 | 1.17 | 1.18 | 1.25 | 37 | |||||||||||||||||||||||||||||||||||||||
Year ended 10/31/11 | 18.64 | 0.23 | (0.75 | ) | (0.52 | ) | (0.12 | ) | — | (0.12 | ) | 18.00 | (2.81 | ) | 7,589 | 1.15 | 1.16 | 1.20 | 58 | |||||||||||||||||||||||||||||||||||||
Class R5 | ||||||||||||||||||||||||||||||||||||||||||||||||||||||||
Year ended 10/31/15 | 21.55 | 0.21 | (0.65 | ) | (0.44 | ) | (0.20 | ) | (2.41 | ) | (2.61 | ) | 18.50 | (1.88 | ) | 13,613 | 0.98 | (e) | 0.99 | (e) | 1.06 | (e) | 25 | |||||||||||||||||||||||||||||||||
Year ended 10/31/14 | 22.08 | 0.20 | 1.39 | 1.59 | (0.26 | ) | (1.86 | ) | (2.12 | ) | 21.55 | 8.10 | 12,980 | 0.96 | 0.97 | 0.93 | 18 | |||||||||||||||||||||||||||||||||||||||
Year ended 10/31/13 | 17.85 | 0.25 | 4.46 | 4.71 | (0.23 | ) | (0.25 | ) | (0.48 | ) | 22.08 | 27.05 | 22,585 | 0.95 | 0.96 | 1.29 | 26 | |||||||||||||||||||||||||||||||||||||||
Year ended 10/31/12 | 17.95 | 0.25 | 1.10 | 1.35 | (0.36 | ) | (1.09 | ) | (1.45 | ) | 17.85 | 8.46 | 20,481 | 0.94 | 0.95 | 1.48 | 37 | |||||||||||||||||||||||||||||||||||||||
Year ended 10/31/11 | 18.59 | 0.27 | (0.74 | ) | (0.47 | ) | (0.17 | ) | — | (0.17 | ) | 17.95 | (2.57 | ) | 22,918 | 0.91 | 0.92 | 1.44 | 58 | |||||||||||||||||||||||||||||||||||||
| (a) | Calculated using average shares outstanding. |
| (b) | Includes redemption fees added to shares of beneficial interest for Class A, Class B, Class C, Class Y and Class R5, which were less than $0.005 per share for the fiscal years ended October 31, 2012 and prior. |
| (c) | Includes adjustments in accordance with accounting principles generally accepted in the United States of America and as such, the net asset value for financial reporting purposes and the returns based upon those net asset values may differ from the net asset value and returns for shareholder transactions. Does not include sales charges and is not annualized for periods less than one year, if applicable. |
| (d) | Portfolio turnover is calculated at the fund level and is not annualized for periods less than one year, if applicable. |
| (e) | Ratios are based on average daily net assets (000’s omitted) of $539,519, $9,598, $29,481, $18,711 and $13,968 for Class A, Class B, Class C, Class Y and Class R5 shares, respectively. |
20 Invesco Global Small & Mid Cap Growth Fund
Report of Independent Registered Public Accounting Firm
To the Board of Trustees of AIM International Mutual Funds (Invesco International Mutual Funds)
and Shareholders of Invesco Global Small & Mid Cap Growth Fund:
In our opinion, the accompanying statement of assets and liabilities, including the schedule of investments, and the related statements of operations and of changes in net assets and the financial highlights present fairly, in all material respects, the financial position of Invesco Global Small & Mid Cap Growth Fund (one of the funds constituting AIM International Mutual Funds (Invesco International Mutual Funds), hereafter referred to as the “Fund”) at October 31, 2015, the results of its operations for the year then ended, the changes in its net assets for each of the two years in the period then ended and the financial highlights for each of the five years in the period then ended, in conformity with accounting principles generally accepted in the United States of America. These financial statements and financial highlights (hereafter referred to as “financial statements”) are the responsibility of the Fund’s management. Our responsibility is to express an opinion on these financial statements based on our audits. We conducted our audits of these financial statements in accordance with the standards of the Public Company Accounting Oversight Board (United States). Those standards require that we plan and perform the audit to obtain reasonable assurance about whether the financial statements are free of material misstatement. An audit includes examining, on a test basis, evidence supporting the amounts and disclosures in the financial statements, assessing the accounting principles used and significant estimates made by management, and evaluating the overall financial statement presentation. We believe that our audits, which included confirmation of securities at October 31, 2015 by correspondence with the custodian, provide a reasonable basis for our opinion.
PRICEWATERHOUSECOOPERS LLP
December 23, 2015
Houston, Texas
21 Invesco Global Small & Mid Cap Growth Fund
Calculating your ongoing Fund expenses
Example
As a shareholder of the Fund, you incur two types of costs: (1) transaction costs, which may include sales charges (loads) on purchase payments or contingent deferred sales charges on redemptions, if any; and (2) ongoing costs, including management fees, distribution and/or service (12b-1) fees, and other Fund expenses. This example is intended to help you understand your ongoing costs (in dollars) of investing in the Fund and to compare these costs with ongoing costs of investing in other mutual funds. The example is based on an investment of $1,000 invested at the beginning of the period and held for the entire period May 1, 2015 through October 31, 2015.
Actual expenses
The table below provides information about actual account values and actual expenses. You may use the information in this table, together with the amount you invested, to estimate the expenses that you paid over the period. Simply divide your account value by $1,000 (for example, an $8,600 account value divided by $1,000 = 8.6), then multiply the result by the number in the table under the heading entitled “Actual Expenses Paid During Period” to estimate the expenses you paid on your account during this period.
Hypothetical example for comparison purposes
The table below also provides information about hypothetical account values and hypothetical expenses based on the Fund’s actual expense ratio and an assumed rate of return of 5% per year before expenses, which is not the Fund’s actual return.
The hypothetical account values and expenses may not be used to estimate the actual ending account balance or expenses you paid for the period. You may use this information to compare the ongoing costs of investing in the Fund and other funds. To do so, compare this 5% hypothetical example with the 5% hypothetical examples that appear in the shareholder reports of the other funds.
Please note that the expenses shown in the table are meant to highlight your ongoing costs only and do not reflect any transaction costs, such as sales charges (loads) on purchase payments or contingent deferred sales charges on redemptions, if any. Therefore, the hypothetical information is useful in comparing ongoing costs only, and will not help you determine the relative total costs of owning different funds. In addition, if these transaction costs were included, your costs would have been higher.
| Class | Beginning Account Value (05/01/15) | ACTUAL | HYPOTHETICAL (5% annual return before expenses) | Annualized Expense Ratio | ||||||||||||||||||||
| Ending Account Value (10/31/15)1 | Expenses Paid During Period2 | Ending Account Value (10/31/15) | Expenses Paid During Period2 | |||||||||||||||||||||
A | $ | 1,000.00 | $ | 940.20 | $ | 6.60 | $ | 1,018.40 | $ | 6.87 | 1.35 | % | ||||||||||||
B | 1,000.00 | 937.10 | 10.25 | 1,014.62 | 10.66 | 2.10 | ||||||||||||||||||
C | 1,000.00 | 936.50 | 10.25 | 1,014.62 | 10.66 | 2.10 | ||||||||||||||||||
Y | 1,000.00 | 941.30 | 5.38 | 1,019.66 | 5.60 | 1.10 | ||||||||||||||||||
R5 | 1,000.00 | 942.40 | 4.80 | 1,020.27 | 4.99 | 0.98 | ||||||||||||||||||
| 1 | The actual ending account value is based on the actual total return of the Fund for the period May 1, 2015 through October 31, 2015, after actual expenses and will differ from the hypothetical ending account value which is based on the Fund’s expense ratio and a hypothetical annual return of 5% before expenses. |
| 2 | Expenses are equal to the Fund’s annualized expense ratio as indicated above multiplied by the average account value over the period, multiplied by 184/365 to reflect the most recent fiscal half year. |
22 Invesco Global Small & Mid Cap Growth Fund
Approval of Investment Advisory and Sub-Advisory Contracts
The Board of Trustees (the Board) of AIM International Mutual Funds (Invesco International Mutual Funds) is required under the Investment Company Act of 1940, as amended, to approve annually the renewal of Invesco Global Small & Mid Cap Growth Fund’s (the Fund) investment advisory agreements. During contract renewal meetings held on June 9-10, 2015, the Board as a whole, and the disinterested or “independent” Trustees, who comprise over 75% of the Board, voting separately, approved the continuance for the Fund of the Master Investment Advisory Agreement with Invesco Advisers, Inc. (Invesco Advisers and the investment advisory agreement) and the Master Intergroup Sub-Advisory Contract for Mutual Funds with Invesco Asset Management Deutschland GmbH, Invesco Asset Management Limited, Invesco Asset Management (Japan) Limited, Invesco Hong Kong Limited, Invesco Senior Secured Management, Inc. and Invesco Canada Ltd. (collectively, the Affiliated Sub-Advisers and the sub-advisory contracts) for another year, effective July 1, 2015.
In evaluating the fairness and reasonableness of compensation under the Fund’s investment advisory agreement and sub-advisory contracts, the Board considered, among other things, the factors discussed below. The Board determined that continuation of the Fund’s investment advisory agreement and the sub-advisory contracts is in the best interest of the Fund and its shareholders and that the compensation payable to Invesco Advisers and the Affiliated Sub-Advisers under the agreements is fair and reasonable.
The Board’s Fund Evaluation Process
The Board’s Investments Committee has established three Sub-Committees, each of which is primarily responsible for overseeing the performance and investment management services provided by Invesco Advisers and the Affiliated Sub-Advisers to a number of the funds advised by Invesco Advisers (the Invesco Funds). The Sub-Committees meet throughout the year to review the performance of their assigned Invesco Funds, including reviewing materials prepared under the direction of the independent Senior Officer, an officer of the Invesco Funds who reports directly to the independent Trustees. Over the course of each year, the Sub-Committees meet with portfolio managers for their assigned Invesco Funds and other members of management to review the performance, investment objective(s), policies, strategies, limitations and investment risks of these funds. The Board had the benefit of reports from the Sub-Committees and Investments Committee throughout the year in considering approval of the continuance of each Invesco Fund’s investment advisory agreement and sub-advisory contracts for another year.
During the contract renewal process, the Board receives comparative performance and fee data regarding the Invesco Funds prepared by Invesco Advisers and Lipper Inc. (Lipper), an independent provider of investment company data. The Board also receives a report and this independent written evaluation from the Senior Officer. The Senior Officer’s evaluation is prepared as part of his responsibility to manage the process by which the Invesco Funds’ proposed management fees are negotiated during the annual contract renewal process to ensure they are negotiated in a manner that is at arms’ length and reasonable. In addition to meetings with Invesco Advisers and fund counsel, the independent Trustees also discuss the continuance of the investment advisory agreement and sub-advisory contracts in separate sessions with the Senior Officer and with independent legal counsel.
The Trustees recognized that the advisory fee rates for the Invesco Funds are, in many cases, the result of years of review and negotiation. The Trustees’ deliberations and conclusions in a particular year may be based in part on their deliberations and conclusions regarding these arrangements throughout the year and in prior years. The Trustees’ review and conclusions are based on the comprehensive consideration of all information presented to them and are not the result of any single determinative factor. Moreover, one Trustee may have weighed a particular piece of information or factor differently than another Trustee.
The discussion below is a summary of the Senior Officer’s independent written evaluation with respect to the Fund’s investment advisory agreement as well as a discussion of the material factors and related conclusions that formed the basis for the Board’s approval of the Fund’s investment advisory agreement and sub-advisory contracts. Unless otherwise stated, this information is current as of June 10, 2015, and does not reflect consideration of factors that became known to the Board after that date.
Factors and Conclusions and Summary of Independent Written Fee Evaluation
| A. | Nature, Extent and Quality of Services Provided by Invesco Advisers and the Affiliated Sub-Advisers |
The Board reviewed the advisory services provided to the Fund by Invesco Advisers under the Fund’s investment advisory agreement, the performance of Invesco Advisers in providing these services, and the credentials and experience of the officers and employees of Invesco Advisers who provide these services, including the Fund’s portfolio manager or managers. The Board’s review of the qualifications of Invesco Advisers to provide advisory services included the Board’s consideration of Invesco Advisers’ investment
process oversight, independent credit analysis and investment risk management. The Board also considered non-advisory services that Invesco Advisers and its affiliates provide to the Invesco Funds such as various back office support functions, equity and fixed income trading operations, internal audit, distribution, valuation and legal and compliance.
In determining whether to continue the Fund’s investment advisory agreement, the Board considered the benefits of reapproving an existing relationship and the greater uncertainty that may be associated with entering into a new relationship. The Board concluded that the nature, extent and quality of the services provided to the Fund by Invesco Advisers are appropriate and satisfactory and consistent with the terms of the Fund’s investment advisory agreement.
The Board reviewed the services that may be provided by the Affiliated Sub-Advisers under the sub-advisory contracts and the credentials and experience of the officers and employees of the Affiliated Sub-Advisers who provide these services. The Board noted that the Affiliated Sub-Advisers have offices and personnel that are located in financial centers around the world. As a result, the Affiliated Sub-Advisers can provide research and investment analysis on the markets and economies of various countries in which the Fund may invest, make recommendations regarding securities and assist with security trades. The Board concluded that the sub-advisory contracts benefit the Fund and its shareholders by permitting Invesco Advisers to use the resources and talents of the Affiliated Sub-Advisers in managing the Fund. The Board concluded that the nature, extent and quality of the services that may be provided by the Affiliated Sub-Advisers are appropriate and satisfactory and consistent with the terms of the Fund’s sub-advisory contracts.
| B. | Fund Performance |
The Board considered Fund performance as a relevant factor in considering whether to approve the investment advisory agreement. The Board did not view Fund performance as a relevant factor in considering whether to approve the sub-advisory contracts for the Fund, as no Affiliated Sub-Adviser currently manages assets of the Fund.
The Board compared the Fund’s performance during the past one, three and five calendar years to the performance of funds in the Lipper performance universe and against the Lipper Global Small/Mid-Cap Funds Index. The Board noted that performance of Class A shares of the Fund was in the first quintile of its performance universe for the one year period and the third quintile for the three and five year periods (the first quintile being the best performing funds and the fifth quintile being the worst performing funds). The Board noted that performance of
23 Invesco Global Small & Mid Cap Growth Fund
the Class A shares of the Fund was above the performance of the Index for the one, three and five year periods. Invesco Advisers noted that two separate investment teams manage the Fund with an allocation to at least three countries, including the U.S. The allocation between U.S. and international sleeves is static, and an underweight to the U.S. may have affected performance. The Trustees also reviewed more recent Fund performance and this review did not change their conclusions.
| C. | Advisory and Sub-Advisory Fees |
The Board compared the Fund’s contractual management fee rate to the contractual management fee rates of funds in the Fund’s Lipper expense group at a common asset level. The Board noted that the contractual management fee rate for Class A shares of the Fund was below the median contractual management fee rate of funds in its expense group. The Board noted that the term “contractual management fee” may include both advisory and certain administrative services fees, but that Lipper does not provide information on a fund by fund basis as to what is included. The Board noted that Invesco Advisers does not charge the Invesco Funds for the administrative services included in the term as defined by Lipper. The Board also reviewed the methodology used by Lipper in providing expense group information, which includes using each fund’s contractual management fee schedule (including any applicable breakpoints) as reported in the most recent prospectus or statement of additional information for each fund in the expense group.
The Board noted that Invesco Advisers and the Affiliated Sub-Advisers do not manage other mutual funds or client accounts with investment strategies comparable to those of the Fund.
The Board also considered the services that may be provided by the Affiliated Sub-Advisers pursuant to the sub-advisory contracts, as well as the fees payable by Invesco Advisers to the Affiliated Sub-Advisers pursuant to the sub-advisory contracts. The Board also noted that the sub-advisory fees are not paid directly by the Fund, but rather, are payable by Invesco Advisers to the Affiliated Sub-Advisers.
| D. | Economies of Scale and Breakpoints |
The Board considered the extent to which there are economies of scale in the provision of advisory services to the Fund. The Board also considered whether the Fund benefits from economies of scale through contractual breakpoints in the Fund’s advisory fee schedule. The Board also noted that the Fund shares directly in economies of scale through lower fees charged by third party service providers based on the combined size of the Invesco Funds and other clients advised by Invesco Advisers.
| E. | Profitability and Financial Resources |
The Board reviewed information from Invesco Advisers concerning the costs of the advisory and other services that Invesco Advisers and its affiliates provide to the Fund and the Invesco Funds and the profitability of Invesco Advisers
and its affiliates in providing these services. The Board received information from Invesco Advisers about the methodology used to prepare the profitability information. The Board noted that Invesco Advisers continues to operate at a net profit from services Invesco Advisers and its affiliates provide to the Invesco Funds and the Fund. The Board did not deem the level of profits realized by Invesco Advisers and its affiliates from providing services to the Fund to be excessive given the nature, quality and extent of the services provided. The Board received and accepted information from Invesco Advisers demonstrating that Invesco Advisers and each Affiliated Sub-Adviser are financially sound and have the resources necessary to perform their obligations under the investment advisory agreement and sub-advisory contracts.
| F. | Collateral Benefits to Invesco Advisers and its Affiliates |
The Board considered various other benefits received by Invesco Advisers and its affiliates from the relationship with the Fund, including the fees received for providing transfer agency and distribution services to the Fund. The Board considered comparative information regarding fees charged for these services, including information provided by Lipper and other independent sources. The Board considered the performance of Invesco Advisers and its affiliates in providing these services and the organizational structure employed to provide these services. The Board also considered that these services are provided to the Fund pursuant to written contracts that are reviewed and approved on an annual basis by the Board; and that the services are required for the operation of the Fund.
The Board considered the benefits realized by Invesco Advisers and the Affiliated Sub-Advisers as a result of portfolio brokerage transactions executed through “soft dollar” arrangements. The Board noted that soft dollar arrangements shift the payment obligation for research services from Invesco Advisers and the Affiliated Sub-Advisers to the Invesco Funds and that the research received may be used with other clients of Invesco Advisers and may reduce Invesco Advisers’ and the Affiliated Sub-Advisers’ expenses. The Board also considered that it receives periodic reports from the Chief Compliance Officer of the Invesco Funds demonstrating that these arrangements are consistent with regulatory requirements. The Board did not deem the soft dollar arrangements to be inappropriate.
The Board considered that the Fund’s uninvested cash and cash collateral from any securities lending arrangements may be invested in money market funds advised by Invesco Advisers pursuant to procedures approved by the Board. The Board noted that Invesco Advisers receives advisory fees from these affiliated money market funds attributable to such investments, although Invesco Advisers has contractually agreed to waive through varying periods the advisory fees payable by the Invesco Funds with respect to
investments in the affiliated money market funds. The waiver is in an amount equal to 100% of the net advisory fee Invesco Advisers receives from the affiliated money market funds with respect to the Fund’s investment in the affiliated money market funds of uninvested cash, but not cash collateral. The Board concluded that the amount of advisory fees received by Invesco Advisors from the Fund’s investment of cash collateral from any securities lending arrangements in the affiliated money market funds is fair and reasonable.
The Board also considered the Fund use an affiliated broker to execute certain trades for the Fund to, among other things, control information leakage, and were advised that such trades would be executed in compliance with rules under the Investment Company Act of 1940, as amended, and consistent with best execution obligations.
24 Invesco Global Small & Mid Cap Growth Fund
Tax Information
Form 1099-DIV, Form 1042-S and other year–end tax information provide shareholders with actual calendar year amounts that should be included in their tax returns. Shareholders should consult their tax advisors.
The following distribution information is being provided as required by the Internal Revenue Code or to meet a specific state’s requirement.
The Fund designates the following amounts or, if subsequently determined to be different, the maximum amount allowable for its fiscal year ended October 31, 2015:
Federal and State Income Tax | ||||
Long-Term Capital Gain Distributions | $ | 70,663,371 | ||
Qualified Dividend Income* | 100.00 | % | ||
Corporate Dividends Received Deduction* | 40.19 | % | ||
U.S. Treasury Obligations* | 0.00 | % | ||
| * | The above percentages are based on ordinary income dividends paid to shareholders during the Fund’s fiscal year. |
25 Invesco Global Small & Mid Cap Growth Fund
Trustees and Officers
The address of each trustee and officer is AIM International Mutual Funds (Invesco International Mutual Funds) (the “Trust”), 11 Greenway Plaza, Suite 1000, Houston, Texas 77046-1173. The trustees serve for the life of the Trust, subject to their earlier death, incapacitation, resignation, retirement or removal as more specifically provided in the Trust’s organizational documents. Each officer serves for a one year term or until their successors are elected and qualified. Column two below includes length of time served with predecessor entities, if any.
| Name, Year of Birth and Position(s) Held with the Trust | Trustee and/ or Officer Since | Principal Occupation(s) During Past 5 Years | Number of Funds in Fund Complex Overseen by Trustee | Other Directorship(s) Past 5 Years | ||||
| Interested Persons | ||||||||
Martin L. Flanagan1 — 1960 Trustee | 2007 | Executive Director, Chief Executive Officer and President, Invesco Ltd. (ultimate parent of Invesco and a global investment management firm); Advisor to the Board, Invesco Advisers, Inc. (formerly known as Invesco Institutional (N.A.), Inc.); Trustee, The Invesco Funds; Vice Chair, Investment Company Institute; and Member of Executive Board, SMU Cox School of Business
Formerly: Chairman and Chief Executive Officer, Invesco Advisers, Inc. (registered investment adviser); Director, Chairman, Chief Executive Officer and President, IVZ Inc. (holding company), INVESCO Group Services, Inc. (service provider) and Invesco North American Holdings, Inc. (holding company); Director, Chief Executive Officer and President, Invesco Holding Company Limited (parent of Invesco and a global investment management firm); Director, Invesco Ltd.; Chairman, Investment Company Institute and President, Co-Chief Executive Officer, Co-President, Chief Operating Officer and Chief Financial Officer, Franklin Resources, Inc. (global investment management organization). | 145 | None | ||||
Philip A. Taylor2 — 1954 Trustee, President and Principal Executive Officer | 2006 | Head of North American Retail and Senior Managing Director, Invesco Ltd.; Director, Co-Chairman, Co-President and Co-Chief Executive Officer, Invesco Advisers, Inc. (formerly known as Invesco Institutional (N.A.), Inc.) (registered investment adviser); Director, Chairman, Chief Executive Officer and President, Invesco Management Group, Inc. (formerly known as Invesco Aim Management Group, Inc.) (financial services holding company); Director and President, INVESCO Funds Group, Inc. (registered investment adviser and registered transfer agent); Director and Chairman, Invesco Investment Services, Inc. (formerly known as Invesco Aim Investment Services, Inc.) (registered transfer agent) and IVZ Distributors, Inc. (formerly known as INVESCO Distributors, Inc.) (registered broker dealer); Chief Executive Officer, Invesco Corporate Class Inc. (corporate mutual fund company) Director, Chairman and Chief Executive Officer, Invesco Canada Ltd. (formerly known as Invesco Trimark Ltd./Invesco Trimark Ltèe) (registered investment adviser and registered transfer agent); Trustee, President and Principal Executive Officer, The Invesco Funds (other than AIM Treasurer’s Series Trust (Invesco Treasurer’s Series Trust), Short-Term Investments Trust and Invesco Management Trust); Trustee and Executive Vice President, The Invesco Funds (AIM Treasurer’s Series Trust (Invesco Treasurer’s Series Trust), Short-Term Investments Trust and Invesco Management Trust only); Director, Invesco Investment Advisers LLC (formerly known as Van Kampen Asset Management); Director, Chief Executive Officer and President, Van Kampen Exchange Corp.
Formerly: Director, President and Chairman, Invesco Inc. (holding company), Invesco Canada Holdings Inc. (holding company), Trimark Investments Ltd./Placements Trimark Ltèe and Invesco Financial Services Ltd/Services Financiers Invesco Ltèe; Chiief Executive Officer, Invesco Canada Fund Inc (corporate mutual fund company); Director and Chairman, Van Kampen Investor Services Inc.; Director, Chief Executive Officer and President, 1371 Preferred Inc. (holding company) and Van Kampen Investments Inc.; Director and President, AIM GP Canada Inc. (general partner for limited partnerships) and Van Kampen Advisors, Inc.; Director and Chief Executive Officer, Invesco Trimark Dealer Inc. (registered broker dealer); Director, Invesco Distributors, Inc. (formerly known as Invesco Aim Distributors, Inc.) (registered broker dealer); Manager, Invesco PowerShares Capital Management LLC; Director, Chief Executive Officer and President, Invesco Advisers, Inc.; Director, Chairman, Chief Executive Officer and President, Invesco Aim Capital Management, Inc.; President, Invesco Trimark Dealer Inc. and Invesco Trimark Ltd./Invesco Trimark Ltèe; Director and President, AIM Trimark Corporate Class Inc. and AIM Trimark Canada Fund Inc.; Senior Managing Director, Invesco Holding Company Limited; Director and Chairman, Fund Management Company (former registered broker dealer); President and Principal Executive Officer, The Invesco Funds (AIM Treasurer’s Series Trust (Invesco Treasurer’s Series Trust), and Short-Term Investments Trust only); President, AIM Trimark Global Fund Inc. and AIM Trimark Canada Fund Inc.. | 145 | None |
| 1 | Mr. Flanagan is considered an interested person (within the meaning of Section 2(a)(19) of the 1940 Act) of the Trust because he is an officer of the Adviser to the Trust, and an officer and a director of Invesco Ltd., ultimate parent of the Adviser. |
| 2 | Mr. Taylor is considered an interested person (within the meaning of Section 2(a)(19) of the 1940 Act) of the Trust because he is an officer and a director of the Adviser. |
T-1 Invesco Global Small & Mid Cap Growth Fund
Trustees and Officers—(continued)
| Name, Year of Birth and Position(s) Held with the Trust | Trustee and/ or Officer Since | Principal Occupation(s) During Past 5 Years | Number of Funds in Fund Complex Overseen by Trustee | Other Directorship(s) Past 5 Years | ||||
| Independent Trustees | ||||||||
Bruce L. Crockett — 1944 Trustee and Chair | 2003 | Chairman, Crockett Technologies Associates (technology consulting company)
Formerly: Director, Captaris (unified messaging provider); Director, President and Chief Executive Officer, COMSAT Corporation; Chairman, Board of Governors of INTELSAT (international communications company); ACE Limited (insurance company); Independent Directors Council and Investment Company Institute | 145 | ALPS (Attorneys Liability Protection Society) (insurance company) and Globe Specialty Metals, Inc. (metallurgical company) | ||||
David C. Arch — 1945 Trustee | 2010 | Chairman of Blistex Inc., a consumer health care products manufacturer | 145 | Board member of the Illinois Manufacturers’ Association; Member of the Board of Visitors, Institute for the Humanities, University of Michigan; Member of the Audit Committee of the Edward-Elmhurst Hospital | ||||
James T. Bunch — 1942 Trustee | 2000 | Managing Member, Grumman Hill Group LLC (family office/private equity investments)
Formerly: Founder, Green Manning & Bunch Ltd. (investment banking firm) (1988-2010); Executive Committee, United States Golf Association; and Chairman, Board of Governors, Western Golf Association | 145 | Chairman of the Board of Trustees, Evans Scholars Foundation; and Chairman of the Board, Denver Film Society | ||||
Rodney F. Dammeyer — 1940 Trustee | 2010 | Chairman of CAC, LLC, (private company offering capital investment and management advisory services)
Formerly: Prior to 2001, Managing Partner at Equity Group Corporate Investments; Prior to 1995, Chief Executive Officer of Itel Corporation (formerly Anixter International); Prior to 1985, experience includes Senior Vice President and Chief Financial Officer of Household International, Inc., Executive Vice President and Chief Financial Officer of Northwest Industries, Inc. and Partner of Arthur Andersen & Co.; From 1987 to 2010, Director/Trustee of investment companies in the Van Kampen Funds complex | 145 | Director of Quidel Corporation and Stericycle, Inc. | ||||
Albert R. Dowden — 1941 Trustee | 2003 | Director of a number of public and private business corporations, including the Boss Group, Ltd. (private investment and management); Nature’s Sunshine Products, Inc. and Reich & Tang Funds (5 portfolios) (registered investment company)
Formerly: Director, Homeowners of America Holding Corporation/Homeowners of America Insurance Company (property casualty company); Director, Continental Energy Services, LLC (oil and gas pipeline service); Director, CompuDyne Corporation (provider of product and services to the public security market) and Director, Annuity and Life Re (Holdings), Ltd. (reinsurance company); Director, President and Chief Executive Officer, Volvo Group North America, Inc.; Senior Vice President, AB Volvo; Director of various public and private corporations; Chairman, DHJ Media, Inc.; Director, Magellan Insurance Company; and Director, The Hertz Corporation, Genmar Corporation (boat manufacturer), National Media Corporation; Advisory Board of Rotary Power International (designer, manufacturer, and seller of rotary power engines); and Chairman, Cortland Trust, Inc. (registered investment company) | 145 | Director of: Nature’s Sunshine Products, Inc., Reich & Tang Funds, Homeowners of America Holding Corporation/ Homeowners of America Insurance Company, the Boss Group | ||||
Jack M. Fields — 1952 Trustee | 2003 | Chief Executive Officer, Twenty First Century Group, Inc. (government affairs company); Owner and Chief Executive Officer, Dos Angeles Ranch, L.P. (cattle, hunting, corporate entertainment); and Discovery Global Education Fund (non-profit)
Formerly: Chief Executive Officer, Texana Timber LP (sustainable forestry company); Director of Cross Timbers Quail Research Ranch (non-profit); and member of the U.S. House of Representatives | 145 | Insperity, Inc. (formerly known as Administaff) | ||||
Prema Mathai-Davis — 1950 Trustee | 2003 | Retired. Formerly: Chief Executive Officer, YWCA of the U.S.A. | 145 | None | ||||
Larry Soll — 1942 Trustee | 1997 | Retired. Formerly: Chairman, Chief Executive Officer and President, Synergen Corp. (a biotechnology company) | 145 | None | ||||
Hugo F. Sonnenschein — 1940 Trustee | 2010 | President Emeritus and Honorary Trustee of the University of Chicago and the Adam Smith Distinguished Service Professor in the Department of Economics at the University of Chicago. Prior to 2000, President of the University of Chicago | 145 | Trustee of the University of Rochester and a member of its investment committee; Member of the National Academy of Sciences and the American Philosophical Society; Fellow of the American Academy of Arts and Sciences | ||||
Raymond Stickel, Jr. — 1944 Trustee | 2005 | Retired. Formerly: Director, Mainstay VP Series Funds, Inc. (25 portfolios) and Partner, Deloitte & Touche | 145 | None |
T-2 Invesco Global Small & Mid Cap Growth Fund
Trustees and Officers—(continued)
| Name, Year of Birth and Position(s) Held with the Trust | Trustee and/ or Officer Since | Principal Occupation(s) During Past 5 Years | Number of Funds in Fund Complex Overseen by Trustee | Other Directorship(s) Past 5 Years | ||||
| Independent Trustees—(continued) | ||||||||
Suzanne H. Woolsey — 1941 Trustee | 2014 | Chief Executive Officer of Woolsey Partners LLC | 145 | Emeritus Chair of the Board of Trustees of the Institute for Defense Analyses; Trustee of Colorado College; Trustee of California Institute of Technology; Prior to 2014, Director of Fluor Corp.; Prior to 2010, Trustee of the German Marshall Fund of the United States; Prior to 2010 Trustee of the Rocky Mountain Institute | ||||
| Other Officers | ||||||||
Russell C. Burk — 1958 Senior Vice President and Senior Officer | 2005 | Senior Vice President and Senior Officer, The Invesco Funds | N/A | N/A | ||||
John M. Zerr — 1962 Senior Vice President, Chief Legal Officer and Secretary | 2006 | Director, Senior Vice President, Secretary and General Counsel, Invesco Management Group, Inc. (formerly known as Invesco Aim Management Group, Inc.) and Van Kampen Exchange Corp.; Senior Vice President, Invesco Advisers, Inc. (formerly known as Invesco Institutional (N.A.), Inc.) (registered investment adviser); Senior Vice President and Secretary, Invesco Distributors, Inc. (formerly known as Invesco Aim Distributors, Inc.); Director, Vice President and Secretary, Invesco Investment Services, Inc. (formerly known as Invesco Aim Investment Services, Inc.) and IVZ Distributors, Inc. (formerly known as INVESCO Distributors, Inc.); Director and Vice President, INVESCO Funds Group, Inc.; Senior Vice President, Chief Legal Officer and Secretary, The Invesco Funds; Managing Director, Invesco PowerShares Capital Management LLC; Director, Secretary and General Counsel, Invesco Investment Advisers LLC (formerly known as Van Kampen Asset Management); Secretary and General Counsel, Invesco Capital Markets, Inc. (formerly known as Van Kampen Funds Inc.) and Chief Legal Officer, PowerShares Exchange-Traded Fund Trust, PowerShares Exchange-Traded Fund Trust II, PowerShares India Exchange-Traded Fund Trust, PowerShares Actively Managed Exchange-Traded Fund Trust, and PowerShares Actively Managed Exchange-Traded Commodity Fund Trust
Formerly: Director and Vice President, Van Kampen Advisors Inc.; Director, Vice President, Secretary and General Counsel, Van Kampen Investor Services Inc.; Director, Invesco Distributors, Inc. (formerly known as Invesco Aim Distributors, Inc.); Director, Senior Vice President, General Counsel and Secretary, Invesco Aim Advisers, Inc. and Van Kampen Investments Inc.; Director, Vice President and Secretary, Fund Management Company; Director, Senior Vice President, Secretary, General Counsel and Vice President, Invesco Aim Capital Management, Inc.; Chief Operating Officer and General Counsel, Liberty Ridge Capital, Inc. (an investment adviser); Vice President and Secretary, PBHG Funds (an investment company) and PBHG Insurance Series Fund (an investment company); Chief Operating Officer, General Counsel and Secretary, Old Mutual Investment Partners (a broker-dealer); General Counsel and Secretary, Old Mutual Fund Services (an administrator) and Old Mutual Shareholder Services (a shareholder servicing center); Executive Vice President, General Counsel and Secretary, Old Mutual Capital, Inc. (an investment adviser); and Vice President and Secretary, Old Mutual Advisors Funds (an investment company) | N/A | N/A | ||||
Sheri Morris — 1964 Vice President, Treasurer and Principal Financial Officer | 2003 | Vice President, Treasurer and Principal Financial Officer, The Invesco Funds; Vice President, Invesco Advisers, Inc. (formerly known as Invesco Institutional (N.A.), Inc.) (registered investment adviser); and Vice President, PowerShares Exchange-Traded Fund Trust, PowerShares Exchange-Traded Fund Trust II, PowerShares India Exchange-Traded Fund Trust, PowerShares Actively Managed Exchange-Traded Fund Trust, and PowerShares Actively Managed Exchange-Traded Commodity Fund Trust
Formerly: Vice President, Invesco Aim Advisers, Inc., Invesco Aim Capital Management, Inc. and Invesco Aim Private Asset Management, Inc.; Assistant Vice President and Assistant Treasurer, The Invesco Funds and Assistant Vice President, Invesco Advisers, Inc., Invesco Aim Capital Management, Inc. and Invesco Aim Private Asset Management, Inc.; and Treasurer, PowerShares Exchange-Traded Fund Trust, PowerShares Exchange-Traded Fund Trust II, PowerShares India Exchange-Traded Fund Trust and PowerShares Actively Managed Exchange-Traded Fund Trust | N/A | N/A | ||||
T-3 Invesco Global Small & Mid Cap Growth Fund
Trustees and Officers—(continued)
| Name, Year of Birth and Position(s) Held with the Trust | Trustee and/ or Officer Since | Principal Occupation(s) During Past 5 Years | Number of Funds in Fund Complex Overseen by Trustee | Other Directorship(s) Past 5 Years | ||||
| Other Officers—(continued) | ||||||||
Karen Dunn Kelley — 1960 Vice President | 2003 | Senior Managing Director, Investments, Invesco Ltd.; Director, Co-President, Co-Chief Executive Officer, and Co-Chairman, Invesco Advisers, Inc. (formerly known as Invesco Institutional (N.A.), Inc.) (registered investment adviser); Chairman, Invesco Senior Secured Management, Inc.; Senior Vice President, Invesco Management Group, Inc. (formerly known as Invesco Aim Management Group, Inc.); Executive Vice President, Invesco Distributors, Inc. (formerly known as Invesco Aim Distributors, Inc.); Director, Invesco Mortgage Capital Inc. and Invesco Management Company Limited; Vice President, The Invesco Funds (other than AIM Treasurer’s Series Trust (Invesco Treasurer’s Series Trust), Short-Term Investments Trust and Invesco Management Trust); and President and Principal Executive Officer, The Invesco Funds (AIM Treasurer’s Series Trust (Invesco Treasurer’s Series Trust), Short-Term Investments Trust and Invesco Management Trust only)
Formerly: Director and President, INVESCO Asset Management (Bermuda) Ltd., Director, INVESCO Global Asset Management Limited and INVESCO Management S.A.; Senior Vice President, Van Kampen Investments Inc. and Invesco Advisers, Inc. (formerly known as Invesco Institutional (N.A.), Inc.) (registered investment adviser); Vice President, Invesco Advisers, Inc. (formerly known as Invesco Institutional (N.A.), Inc.); Director of Cash Management and Senior Vice President, Invesco Advisers, Inc. and Invesco Aim Capital Management, Inc.; Director and President, Fund Management Company; Chief Cash Management Officer, Director of Cash Management, Senior Vice President, and Managing Director, Invesco Aim Capital Management, Inc.; Director of Cash Management, Senior Vice President, and Vice President, Invesco Advisers, Inc. and The Invesco Funds (AIM Treasurer’s Series Trust (Invesco Treasurer’s Series Trust), and Short-Term Investments Trust only) | N/A | N/A | ||||
Crissie M. Wisdom — 1969 Anti-Money Laundering Compliance Officer | 2013 | Anti-Money Laundering Compliance Officer, Invesco Advisers, Inc. (formerly known as Invesco Institutional (N.A.), Inc.) (registered investment adviser), Invesco Capital Markets, Inc. (formerly known as Van Kampen Funds Inc.), Invesco Distributors, Inc., Invesco Investment Services, Inc., Invesco Management Group, Inc., Van Kampen Exchange Corp., The Invesco Funds, and PowerShares Exchange-Traded Fund Trust, PowerShares Exchange-Traded Fund Trust II, PowerShares India Exchange-Traded Fund Trust, PowerShares Actively Managed Exchange-Traded Fund Trust and PowerShares Actively Managed Exchange-Traded Commodity Fund Trust; Anti-Money Laundering Compliance Officer and Bank Secrecy Act Officer, INVESCO National Trust Company and Invesco Trust Company; and Fraud Prevention Manager and Controls and Risk Analysis Manager for Invesco Investment Services, Inc.. | N/A | N/A | ||||
Lisa O. Brinkley — 1959 Chief Compliance Officer | 2015 | Senior Vice President and Chief Compliance Officer, Invesco Advisers, Inc. (registered investment adviser) (formerly known as Invesco Institutional (N.A., Inc.); and Chief Compliance Officer, The Invesco Funds
Formerly: Global Assurance Officer, Invesco Ltd. and Vice President, The Invesco Funds; Chief Compliance Officer, Invesco Distributors, Inc. (formerly known as Invesco Aim Distributors, Inc.), Invesco Investment Services, Inc.(formerly known as Invesco Aim Investment Services, Inc.) and Van Kampen Investor Services Inc.; Senior Vice President, Invesco Management Group, Inc.; Senior Vice President and Chief Compliance Officer, Invesco Advisers, Inc. and The Invesco Funds; Vice President and Chief Compliance Officer, Invesco Aim Capital Management, Inc. and Invesco Distributors, Inc.; Vice President, Invesco Investment Services, Inc. and Fund Management Company. | N/A | N/A |
The Statement of Additional Information of the Trust includes additional information about the Fund’s Trustees and is available upon request, without charge, by calling 1.800.959.4246. Please refer to the Fund’s prospectus for information on the Fund’s sub-advisers.
Office of the Fund 11 Greenway Plaza, Suite 1000 Houston, TX 77046-1173 | Investment Adviser Invesco Advisers, Inc. 1555 Peachtree Street, N.E. Atlanta, GA 30309 | Distributor Invesco Distributors, Inc. 11 Greenway Plaza, Suite 1000 Houston, TX 77046-1173 | Auditors PricewaterhouseCoopers LLP 1000 Louisiana Street, Suite 5800 Houston, TX 77002-5678 | |||
Counsel to the Fund Stradley Ronon Stevens & Young, LLP 2005 Market Street, Suite 2600 Philadelphia, PA 19103-7018 | Counsel to the Independent Trustees Goodwin Procter LLP 901 New York Avenue, N.W. Washington, D.C. 20001 | Transfer Agent Invesco Investment Services, Inc. 11 Greenway Plaza, Suite 1000 Houston, TX 77046-1173 | Custodian State Street Bank and Trust Company 225 Franklin Street Boston, MA 02110-2801 | |||
T-4 Invesco Global Small & Mid Cap Growth Fund

Invesco mailing information
Send general correspondence to Invesco Investment Services, Inc., P.O. Box 219078, Kansas City, MO 64121-9078.
Important notice regarding delivery of security holder documents
To reduce Fund expenses, only one copy of most shareholder documents may be mailed to shareholders with multiple accounts at the same address (Householding). Mailing of your shareholder documents may be householded indefinitely unless you instruct us otherwise. If you do not want the mailing of these documents to be combined with those for other members of your household, please contact Invesco Investment Services, Inc. at 800 959 4246 or contact your financial institution. We will begin sending you individual copies for each account within 30 days after receiving your request.
Fund holdings and proxy voting information
The Fund provides a complete list of its holdings four times in each fiscal year, at the quarter ends. For the second and fourth quarters, the lists appear in the Fund’s semiannual and annual reports to shareholders. For the first and third quarters, the Fund files the lists with the Securities and Exchange Commission (SEC) on Form N-Q. The most recent list of portfolio holdings is available at invesco.com/completeqtrholdings. Shareholders can also look up the Fund’s Forms N-Q on the SEC website at sec.gov. Copies of the Fund’s Forms N-Q may be reviewed and copied at the SEC Public Reference Room in Washington, D.C. You can obtain information on the operation of the Public Reference Room, including information about duplicating fee charges, by calling 202 551 8090 or 800 732 0330, or by electronic request at the following email address: publicinfo@sec.gov. The SEC file numbers for the Fund are shown below.
A description of the policies and procedures that the Fund uses to determine how to vote proxies relating to portfolio securities is available without charge, upon request, from our Client Services department at 800 959 4246 or at invesco.com/proxyguidelines. The information is also available on the SEC website, sec.gov.
Information regarding how the Fund voted proxies related to its portfolio securities during the most recent 12-month period ended June 30 is available at invesco.com/proxysearch. The information is also available on the SEC website, sec.gov. Invesco Advisers, Inc. is an investment adviser; it provides investment advisory services to individual and institutional clients and does not sell securities. Invesco Distributors, Inc. is the US distributor for Invesco Ltd.’s retail mutual funds, exchange-traded funds and institutional money market funds. Both are wholly owned, indirect subsidiaries of Invesco Ltd. |  |
| SEC file numbers: 811-06463 and 033-44611 | GSMG-AR-1 | Invesco Distributors, Inc. |
| ||||
 | Annual Report to Shareholders
| October 31, 2015 | ||
| ||||
Invesco International Core Equity Fund
| ||||
| Nasdaq: | ||||
A: IBVAX n B: IBVBX n C: IBVCX n R: IIBRX n Y: IBVYX n Investor: IIBCX R5: IBVIX n R6: IBVFX | ||||

Letters to Shareholders
Philip Taylor | Dear Shareholders: This annual report includes information about your Fund, including performance data and a complete list of its investments as of the close of the reporting period. Inside is a discussion of how your Fund was managed and the factors that affected its performance during the reporting period. I hope you find this report of interest. The US economy expanded and unemployment declined throughout the reporting period. Continuing low energy prices benefited consumers, but a strong US dollar crimped corporate profits. The US Federal Reserve signaled that it was increasingly likely to raise interest rates, based on generally positive economic data, but uncertainty remained about when it might act. Overseas, the story was much different. Low energy prices hurt the economies of some oil-producing nations, such as Brazil and Russia. During the reporting period, the European Central |

Bank as well as central banks in China and Japan – among other countries – either instituted or maintained extraordinarily accommodative monetary policies in response to economic weakness.
Investor uncertainty, such as we saw for much of the reporting period – and market volatility, such as we saw at the end of the reporting period – are unfortunate facts of life when it comes to investing. Some investors use these things as excuses to delay saving and investing for their long-term financial goals. That’s why Invesco encourages investors to work with a professional financial adviser who can stress the importance of starting to save and invest early and the importance of adhering to a disciplined investment plan – when times are good and when they’re uncertain. A financial adviser who knows your unique financial situation, investment goals and risk tolerance can be an invaluable partner as you seek to achieve your financial goals. He or she can offer a long-term perspective when markets are volatile and time-tested advice and guidance when your financial situation or investment goals change.
Timely information when and where you want it
Invesco’s efforts to help investors achieve their financial objectives include providing individual investors and financial professionals with timely information about the markets, the economy and investing – whenever and wherever they want it.
Our website, invesco.com/us, offers a wide range of market insights and investment perspectives. On the website, you’ll find detailed information about our funds, including prices, performance, holdings and portfolio manager commentaries. You can access information about your account by completing a simple, secure online registration. Click on the “Need to register” link in the “Account Access” box on our homepage to get started.
Invesco’s mobile apps for iPhone® and iPad® (both available free from the App StoreSM) allow you to obtain the same detailed information, monitor your account and create customizable watch lists. Also, they allow you to access investment insights from our investment leaders, market strategists, economists and retirement experts. You can sign up to be alerted when new commentary is added, and you can watch portfolio manager videos and have instant access to Invesco news and updates wherever you may be.
In addition to the resources accessible on our website and through our mobile app, you can obtain timely updates to help you stay informed about the markets, the economy and investing by connecting with Invesco on Twitter, LinkedIn or Facebook. You can access our blog at blog.invesco.us.com. Our goal is to provide you the information you want, when and where you want it.
Have questions?
For questions about your account, feel free to contact an Invesco client services representative at 800 959 4246. For Invesco-related questions or comments, please email me directly at phil@invesco.com.
All of us at Invesco look forward to serving your investment management needs for many years to come. Thank you for investing with us.
Sincerely,

Philip Taylor
Senior Managing Director, Invesco Ltd.
iPhone and iPad are trademarks of Apple Inc., registered in the US and other countries. App Store is a service mark of Apple Inc. Invesco Distributors, Inc. is not affiliated with Apple Inc.
2 Invesco International Core Equity Fund
Bruce Crockett | Dear Fellow Shareholders: Among the many important lessons I’ve learned in more than 40 years in a variety of business endeavors is the value of a trusted advocate. As independent chair of the Invesco Funds Board, I can assure you that the members of the Board are strong advocates for the interests of investors in Invesco’s mutual funds. We work hard to represent your interests through oversight of the quality of the investment management services your funds receive and other matters important to your investment, including but not limited to: | ||||||
| n | Ensuring that Invesco offers a diverse lineup of mutual funds that your financial adviser can use to strive to meet your financial needs as your investment goals change over time. | ||||||
| n | Monitoring how the portfolio management teams of the Invesco funds are performing in light of changing economic and market conditions. | ||||||

| n | Assessing each portfolio management team’s investment performance within the context of the investment strategy described in the fund’s prospectus. |
| n | Monitoring for potential conflicts of interests that may impact the nature of the services that your funds receive. |
We believe one of the most important services we provide our fund shareholders is the annual review of the funds’ advisory and sub-advisory contracts with Invesco Advisers and its affiliates. This review is required by the Investment Company Act of 1940 and focuses on the nature and quality of the services Invesco provides as the adviser to the Invesco funds and the reasonableness of the fees that it charges for those services. Each year, we spend months carefully reviewing information received from Invesco and a variety of independent sources, such as performance and fee data prepared by Lipper Inc., an independent, third-party firm widely recognized as a leader in its field. We also meet with our independent legal counsel and other independent advisers to review and help us assess the information that we have received. Our goal is to assure that you receive quality investment management services for a reasonable fee.
I trust the measures outlined above provide assurance that you have a worthy advocate when it comes to choosing the Invesco Funds.
As always, please contact me at bruce@brucecrockett.com with any questions or concerns you may have. On behalf of the Board, we look forward to continuing to represent your interests and serving your needs.
Sincerely,

Bruce L. Crockett
Independent Chair
Invesco Funds Board of Trustees
3 Invesco International Core Equity Fund
Management’s Discussion of Fund Performance
Performance summary
For the fiscal year ended October 31, 2015, Class A shares of Invesco International Core Equity Fund (the Fund), at net asset value (NAV), underperformed the MSCI EAFE Index, the Fund’s broad market/style-specific benchmark.
Your Fund’s long-term performance appears later in this report.
Fund vs. Indexes
Total returns, 10/31/14 to 10/31/15, at net asset value (NAV). Performance shown does not include applicable contingent deferred sales charges (CDSC) or front-end sales charges, which would have reduced performance.
| Class A Shares | -0.19 | % | |||
| Class B Shares | -1.04 | ||||
| Class C Shares | -0.97 | ||||
| Class R Shares | -0.45 | ||||
| Class Y Shares | 0.05 | ||||
| Investor Class Shares | -0.19 | ||||
| Class R5 Shares | 0.37 | ||||
| Class R6 Shares | 0.38 | ||||
| MSCI EAFE Index▼ (Broad Market/Style-Specific Index) | -0.07 | ||||
| Lipper International Large-Cap Core Funds Index¡ (Peer Group Index) | -2.71 |
Source(s): ▼FactSet Research Systems Inc.; ¡Lipper Inc.
Market conditions and your Fund
International markets experienced increased volatility during the fiscal year ended October 31, 2015, driven largely by the continued slowdown in energy markets and the economic downturn in China. Developed markets were generally able to withstand these headwinds, even as more fragile emerging markets began to falter.
As the reporting period began in late 2014, international equity markets moved higher, although economic growth appeared to be somewhat stronger in the US than in the rest of the world. Equity markets globally were recovering from the initial crash of oil prices when OPEC added additional uncertainty by deciding to maintain high production despite low prices and slowing global growth. In this environment, commodity-
based economies and most currencies underperformed those of the US.
Global markets were rattled again amid growing concerns that Greece and the eurozone would fail to reach an agreement on a financial bailout plan. However, those fears subsided when a bailout was ultimately approved. The eurozone also benefited from generally positive economic data, which helped markets weather subsequent economic volatility.
In the summer of 2015, fears of a potential economic slowdown in China dominated headlines. The combination of a slowing Chinese economy, a sharp sell-off in domestic Chinese equities and the devaluation of China’s currency, the renminbi, contributed to a strong correction in global equity markets. Emerging markets, in particular, were hard hit by events in China and by continued weak
commodity prices – as well as by the US Federal Reserve’s decision to delay raising interest rates, which increased investor uncertainty and market volatility.
The Fund seeks long-term growth of capital by investing in foreign securities that have high or improving return on invested capital, quality management and a strong competitive position within their industries – and that are trading at compelling valuations. The Fund stayed true to its process and benefited from its quality orientation in stock selection. Stock selection in the financials, information technology (IT) and materials sectors contributed to Fund performance, while holdings in the consumer staples and industrials sectors detracted from Fund performance for the reporting period.
One of the largest contributors to Fund performance was Singapore-based Avago Technologies. Avago Technologies benefited from the momentum of smartphone sales globally, as the company is a major supplier to both Apple and Samsung (not Fund holdings) and a number of other IT companies.
Also aiding Fund performance was Randstad Holdings. Randstad Holdings, a Dutch staffing and human resources services company, benefited from Europe’s improving employment outlook. We eliminated the holding from the Fund before the close of the fiscal year. In the health care sector, Resmed was a strong performer. Resmed focuses on the development, manufacturing, distribution and marketing of medical products for the diagnosis, treatment and management of respiratory disorders. The company announced better-than-expected earnings due to new product cycles; that, in turn, generated optimism about future earnings prospects.
Portfolio Composition |
| ||||
By sector
|
| % of total net assets
|
| ||
| Financials | 26.8 | % | |||
| Consumer Discretionary | 16.5 | ||||
| Health Care | 11.4 | ||||
| Consumer Staples | 10.8 | ||||
| Industrials | 10.3 | ||||
| Information Technology | 8.6 | ||||
| Telecommunication Services | 5.7 | ||||
| Energy | 4.1 | ||||
| Materials | 3.3 | ||||
| Money Market Funds Plus Other Assets Less Liabilities | 2.5 |
Top 10 Equity Holdings* | |||||||||
% of total net assets
| |||||||||
| 1. | Danone | 2.8 | % | |||||||
| 2. | Vodafone Group PLC-ADR | 2.8 | ||||||||
| 3. | Diageo PLC | 2.6 | ||||||||
| 4. | Sampo Oyj-Class A | 2.5 | ||||||||
| 5. | UBS Group AG | 2.5 | ||||||||
| 6. | Roche Holding AG | 2.4 | ||||||||
| 7. | Taiwan Semiconductor Manufacturing Co. Ltd. | 2.4 | ||||||||
| 8. | ING Groep N.V. | 2.4 | ||||||||
| 9. | Muenchener Rueckversicherungs-Gesellschaft AG | 2.2 | ||||||||
| 10. | St. James’s Place PLC | 2.2 | ||||||||
Total Net Assets | $121.4 million | ||||
| Total Number of Holdings* | 74 | ||||
The Fund’s holdings are subject to change, and there is no assurance that the Fund will continue to hold any particular security.
*Excluding money market fund holdings.
Data presented here are as of October 31, 2015.
4 Invesco International Core Equity Fund
The Fund’s detractors during the reporting period included several industrial companies. Komatsu, for example, manufactures, develops, markets and sells construction machinery and vehicles; the company was hurt by weak global mining activity and its exposure to China.
In the energy sector, Vermilion Energy was a leading detractor. Vermilion Energy continued to be hurt by lower energy prices.
From a geographic perspective, the Fund’s exposure to Europe aided Fund performance during the fiscal year. Specifically, stock selection in Germany, the Netherlands and the UK helped Fund performance. Conversely, stock selection in Italy and Sweden detracted from the Fund’s performance relative to its broad market/style-specific benchmark. As a group, the Fund’s Japanese holdings were the most significant detractors from the Fund’s relative performance. At the close of the reporting period, and relative to its broad market/style-specific benchmark, the Fund maintained overweight positions in Canada, France, the Netherlands and Singapore, while holding underweight positions in Australia, Germany Hong Kong and Japan.
The Fund’s largest overweight positions (relative to its broad market/style-specific benchmark) were in the consumer discretionary, consumer staples, industrials, IT and telecommunication services sectors. Conversely, in the financials, materials and utilities sectors, the Fund maintained underweight positions.
As always, we are focused on companies that provide an attractive return on invested capital, are run by management teams with long-term perspectives and are trading at attractive valuations. In short, we seek to take advantage of the market’s volatile behavior and short-term focus. We believe our conservative approach may help position the Fund to navigate unpredictable and changing economic conditions going forward.
Thank you for your investment in Invesco International Core Equity Fund.
The views and opinions expressed in management’s discussion of Fund performance are those of Invesco Advisers, Inc. These views and opinions are subject to change at any time based on factors such as market and economic conditions. These views and opinions may not be relied upon as investment advice or recommendations, or as an offer for a particular security. The information is not a complete analysis of every aspect of any market, country, industry, security or the Fund. Statements of fact are from sources considered reliable, but Invesco Advisers, Inc. makes no representation or warranty as to their completeness or accuracy. Although historical performance is no guarantee of future results, these insights may help you understand our investment management philosophy.
See important Fund and, if applicable, index disclosures later in this report.
 | Erik Esselink Portfolio Manager, is manager of Invesco International Core Equity Fund. He joined Invesco in 2007. |
Mr. Esselink earned a Bachelor of Science degree from the Rotterdam School of Economics, where he studied commercial economics.
 | Brian Nelson Chartered Financial Analyst, Portfolio Manager, is manager of Invesco International Core Equity Fund. He |
joined Invesco in 2004. Mr. Nelson earned a BA from the University of California, Santa Barbara.
Assisted by Invesco’s Global Core Equity Team
5 Invesco International Core Equity Fund
Your Fund’s Long-Term Performance
Results of a $10,000 Investment – Oldest Share Class(es)
Fund and index data from 10/31/05
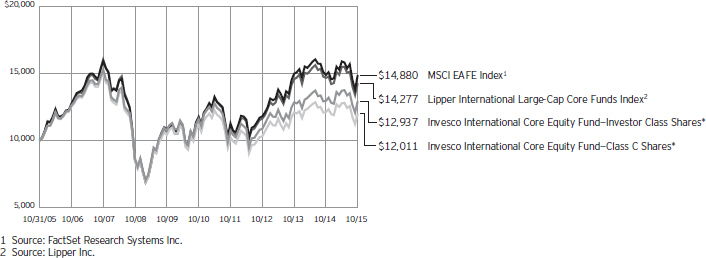
| * | The Fund’s oldest share class (Investor) does not have a sales charge; therefore, the second-oldest share class with a sales charge (Class C) is also included in the chart. |
Past performance cannot guarantee comparable future results.
The data shown in the chart include reinvested distributions, applicable sales charges and Fund expenses including
management fees. Index results include reinvested dividends, but they do not reflect sales charges. Performance of the peer group, if applicable, reflects fund expenses and management fees;
performance of a market index does not. Performance shown in the chart and table(s) does not reflect deduction of taxes a shareholder would pay on Fund distributions or sale of Fund shares.
continued from page 8
| n | Management risk. The investment techniques and risk analysis used by the Fund’s portfolio managers may not produce the desired results. |
| n | Market risk. The prices of and the income generated by the Fund’s securities may decline in response to, among other things, investor sentiment, general economic and market conditions, regional or global instability, and currency and interest rate fluctuations. |
| n | Preferred securities risk. Preferred securities may include provisions that permit the issuer, in its discretion, to defer or omit distributions for a certain period of time. If the Fund owns a security that is deferring or omitting its distributions, the Fund may be required to report the distribution on its tax returns, even though it may not have received this income. Further, preferred securities may lose substantial value due to the omission or deferment of dividend payments. |
About indexes used in this report
| n | The MSCI EAFE® Index is an unmanaged index considered representative of stocks of Europe, Australasia and the Far East. The index is computed using the net return, which withholds applicable taxes for non-resident investors. |
| n | The Lipper International Large-Cap Core Funds Index is an unmanaged index considered representative of international large-cap core funds tracked by Lipper. |
| n | The Fund is not managed to track the performance of any particular index, including the index(es) described here, and consequently, the performance of the Fund may deviate significantly from the performance of the index(es). |
| n | A direct investment cannot be made in an index. Unless otherwise indicated, index results include reinvested dividends, and they do not reflect sales charges. Performance of the peer group, if applicable, reflects fund expenses; performance of a market index does not. |
Other information
| n | The returns shown in management’s discussion of Fund performance are based on net asset values (NAVs) calculated for shareholder transactions. Generally accepted accounting principles require adjustments to be made to the net assets of the Fund at period end for financial reporting purposes, and as such, the NAVs for shareholder transactions and the returns based on those NAVs may differ from the NAVs and returns reported in the Financial Highlights. |
| n | Industry classifications used in this report are generally according to the Global Industry Classification Standard, which was developed by and is the exclusive property and a service mark of MSCI Inc. and Standard & Poor’s. |
6 Invesco International Core Equity Fund
| Average Annual Total Returns | |||||
As of 10/31/15, including maximum applicable sales charges
| |||||
| Class A Shares | |||||
| Inception (3/28/02) | 3.74 | % | |||
| 10 Years | 2.04 | ||||
| 5 Years | 1.10 | ||||
| 1 Year | -5.67 | ||||
| Class B Shares | |||||
| Inception (3/28/02) | 3.78 | % | |||
| 10 Years | 2.01 | ||||
| 5 Years | 1.10 | ||||
| 1 Year | -5.75 | ||||
| Class C Shares | |||||
| Inception (2/14/00) | 1.50 | % | |||
| 10 Years | 1.85 | ||||
| 5 Years | 1.49 | ||||
| 1 Year | -1.91 | ||||
| Class R Shares | |||||
| Inception (11/24/03) | 4.55 | % | |||
| 10 Years | 2.36 | ||||
| 5 Years | 2.00 | ||||
| 1 Year | -0.45 | ||||
| Class Y Shares | |||||
| 10 Years | 2.79 | % | |||
| 5 Years | 2.51 | ||||
| 1 Year | 0.05 | ||||
| Investor Class Shares | |||||
| Inception (10/28/98) | 3.45 | % | |||
| 10 Years | 2.61 | ||||
| 5 Years | 2.24 | ||||
| 1 Year | -0.19 | ||||
| Class R5 Shares | |||||
| Inception (4/30/04) | 4.71 | % | |||
| 10 Years | 3.22 | ||||
| 5 Years | 2.85 | ||||
| 1 Year | 0.37 | ||||
| Class R6 Shares | |||||
| 10 Years | 2.79 | % | |||
| 5 Years | 2.61 | ||||
| 1 Year | 0.38 | ||||
Class Y shares incepted on October 3, 2008. Performance shown prior to that date is that of Investor Class shares and includes the 12b-1 fees applicable to Investor Class shares.
Class R6 shares incepted on September 24, 2012. Performance shown prior to that date is that of Investor Class shares and includes the 12b-1 fees applicable to Investor Class shares.
The performance data quoted represent past performance and cannot guarantee comparable future results; current performance may be lower or higher. Please visit
| Average Annual Total Returns | |||||
As of 9/30/15, the most recent calendar quarter end, including maximum applicable sales charges
| |||||
| Class A Shares | |||||
| Inception (3/28/02) | 3.24 | % | |||
| 10 Years | 1.09 | ||||
| 5 Years | 0.42 | ||||
| 1 Year | -11.62 | ||||
| Class B Shares | |||||
| Inception (3/28/02) | 3.28 | % | |||
| 10 Years | 1.06 | ||||
| 5 Years | 0.45 | ||||
| 1 Year | -11.58 | ||||
| Class C Shares | |||||
| Inception (2/14/00) | 1.08 | % | |||
| 10 Years | 0.90 | ||||
| 5 Years | 0.83 | ||||
| 1 Year | -8.05 | ||||
| Class R Shares | |||||
| Inception (11/24/03) | 3.99 | % | |||
| 10 Years | 1.41 | ||||
| 5 Years | 1.33 | ||||
| 1 Year | -6.69 | ||||
| Class Y Shares | |||||
| 10 Years | 1.83 | % | |||
| 5 Years | 1.82 | ||||
| 1 Year | -6.30 | ||||
| Investor Class Shares | |||||
| Inception (10/28/98) | 3.05 | % | |||
| 10 Years | 1.65 | ||||
| 5 Years | 1.55 | ||||
| 1 Year | -6.54 | ||||
| Class R5 Shares | |||||
| Inception (4/30/04) | 4.12 | % | |||
| 10 Years | 2.25 | ||||
| 5 Years | 2.17 | ||||
| 1 Year | -6.03 | ||||
| Class R6 Shares | |||||
| 10 Years | 1.83 | % | |||
| 5 Years | 1.92 | ||||
| 1 Year | -6.03 | ||||
invesco.com/performance for the most recent month-end performance. Performance figures reflect reinvested distributions, changes in net asset value and the effect of the maximum sales charge unless otherwise stated. Investment return and principal value will fluctuate so that you may have a gain or loss when you sell shares.
The total annual Fund operating expense ratio set forth in the most recent Fund prospectus as of the date of this report for Class A, Class B, Class C, Class R, Class Y, Investor Class, Class R5 and Class R6 shares
was 1.59%, 2.34%, 2.34%, 1.84%, 1.34%, 1.59%, 1.01% and 1.00%, respectively. The expense ratios presented above may vary from the expense ratios presented in other sections of this report that are based on expenses incurred during the period covered by this report.
Class A share performance reflects the maximum 5.50% sales charge, and Class B and Class C share performance reflects the applicable contingent deferred sales charge (CDSC) for the period involved. The CDSC on Class B shares declines from 5% beginning at the time of purchase to 0% at the beginning of the seventh year. The CDSC on Class C shares is 1% for the first year after purchase. Class R, Class Y, Investor Class, Class R5 and Class R6 shares do not have a front-end sales charge or a CDSC; therefore, performance is at net asset value.
The performance of the Fund’s share classes will differ primarily due to different sales charge structures and class expenses.
Fund performance reflects any applicable fee waivers and/or expense reimbursements. Had the adviser not waived fees and/or reimbursed expenses currently or in the past, returns would have been lower. See current prospectus for more information.
7 Invesco International Core Equity Fund
Invesco International Core Equity Fund’s investment objective is long-term growth of capital.
| n | Unless otherwise stated, information presented in this report is as of October 31, 2015, and is based on total net assets. |
| n | Unless otherwise noted, all data provided by Invesco. |
| n | To access your Fund’s reports/prospectus, visit invesco.com/fundreports. |
About share classes
| n | Class B shares may not be purchased for new or additional investments. Please see the prospectus for more information. |
| n | Class R shares are generally available only to employer sponsored retirement and benefit plans. Please see the prospectus for more information. |
| n | Class Y shares are available only to certain investors. Please see the prospectus for more information. |
| n | Investor Class shares are closed to new investors. Contact your financial adviser about purchasing our other share classes. Please see the prospectus for more information. |
| n | Class R5 shares and Class R6 shares are primarily intended for employer sponsored retirement and benefit plans that meet certain standards and for institutional investors. Please see the prospectus for more information. |
Principal risks of investing in the Fund
| n | Depositary receipts risk. Depositary receipts involve many of the same risks as those associated with direct investment in foreign securities. In addition, the underlying issuers of certain depositary receipts, particularly unsponsored or unregistered depositary receipts, are under no obligation to distribute shareholder communications to the holders of such receipts or to pass through to them any voting rights with respect to the deposited securities. |
| n | Derivatives risk. The value of a derivative instrument depends largely on (and is derived from) the value of an underlying security, currency, commodity, interest rate, index or other asset (each referred to as an underlying asset). In addition to risks relating to the underlying assets, the use of derivatives may include other, possibly greater, risks, including counterparty, leverage and liquidity risks. Counterparty risk is the risk that the counterparty to the derivative contract will |
default on its obligation to pay the Fund the amount owed or otherwise perform under the derivative contract. Derivatives create leverage risk because they do not require payment up front equal to the economic exposure created by owning the derivative. As a result, an adverse change in the value of the underlying asset could result in the Fund sustaining a loss that is substantially greater than the amount invested in the derivative, which may make the Fund’s returns more volatile and increase the risk of loss. Derivative instruments may also be less liquid than more traditional investments and the Fund may be unable to sell or close out its derivative positions at a desirable time or price. This risk may be more acute under adverse market conditions, during which the Fund may be most in need of liquidating its derivative positions. Derivatives may also be harder to value, less tax efficient and subject to changing government regulation that could impact the Fund’s ability to use certain derivatives or their cost. Also, derivatives used for hedging or to gain or limit exposure to a particular market segment may not provide the expected benefits, particularly during adverse market conditions.
| n | Developing/emerging markets securities risk. The prices of securities issued by foreign companies and governments located in developing/emerging markets countries may be affected more negatively by inflation, devaluation of their currencies, higher transaction costs, delays in settlement, adverse political developments, the introduction of capital controls, withholding taxes, nationalization of private assets, expropriation, social unrest, war or lack of timely information than those in developed countries. |
| n | Foreign securities risk. The Fund’s foreign investments may be affected by changes in a foreign country’s exchange rates, political and social instability, changes in economic or taxation |
policies, difficulties when enforcing obligations, decreased liquidity, and increased volatility. Foreign companies may be subject to less regulation resulting in less publicly available information about the companies.
| n | Geographic focus risk. From time to time the Fund may invest a substantial amount of its assets in securities of issuers located in a single country or a limited number of countries. If the Fund focuses its investments in this manner, it assumes the risk that economic, political and social conditions in those countries will have a significant impact on its investment performance. The Fund’s investment performance may also be more volatile if it focuses its investments in certain countries, especially emerging markets countries. |
| n | Investing in the European Union risk. Many countries in the European Union are susceptible to high economic risks associated with high levels of debt, notably due to investments in sovereign debts of European countries such as Greece, Italy and Spain. One or more member states might exit the European Union, placing its currency and banking system in jeopardy. The European Union faces major issues involving its membership, structure, procedures and policies, including the adoption, abandonment or adjustment of the new constitutional treaty, the European Union’s enlargement to the south and east, and resolution of the European Union’s problematic fiscal and democratic accountability. Efforts of the member states to further unify their economic and monetary policies may increase the potential for the downward movement of one member state’s market to cause a similar effect on other member states’ markets. European countries that are part of the European Economic and Monetary Union may be significantly affected by the tight fiscal and monetary controls that the union seeks to impose on its members. |
continued on page 6
| This report must be accompanied or preceded by a currently effective Fund prospectus, which contains more complete information, including sales charges and expenses. Investors should read it carefully before investing. |
NOT FDIC INSURED | MAY LOSE VALUE | NO BANK GUARANTEE
8 Invesco International Core Equity Fund
Schedule of Investments
October 31, 2015
| Shares | Value | |||||||
Common Stocks & Other Equity Interests–97.46% |
| |||||||
| Australia–1.33% | ||||||||
Australia and New Zealand Banking Group Ltd. | 83,943 | $ | 1,615,052 | |||||
| Canada–6.77% | ||||||||
Hudson’s Bay Co. | 72,550 | 1,261,040 | ||||||
Intact Financial Corp. | 26,551 | 1,896,152 | ||||||
Peyto Exploration & Development Corp. | 30,053 | 620,502 | ||||||
Suncor Energy, Inc. | 60,860 | 1,810,861 | ||||||
Toronto-Dominion Bank (The) | 28,430 | 1,167,028 | ||||||
Vermilion Energy, Inc. | 41,433 | 1,457,775 | ||||||
| 8,213,358 | ||||||||
| China–1.22% | ||||||||
Baidu, Inc.–ADR(a) | 7,906 | 1,482,138 | ||||||
| Denmark–0.53% | ||||||||
Carlsberg AS–Class B | 7,915 | 647,623 | ||||||
| Finland–2.51% | ||||||||
Sampo Oyj–Class A | 62,555 | 3,051,995 | ||||||
| France–9.22% | ||||||||
Danone | 49,533 | 3,448,642 | ||||||
Europcar Groupe S.A.(a)(b) | 62,934 | 861,646 | ||||||
LVMH Moet Hennessy Louis Vuitton S.E. | 12,875 | 2,395,482 | ||||||
Publicis Groupe S.A. | 29,696 | 1,928,704 | ||||||
Rexel S.A. | 103,387 | 1,413,225 | ||||||
TOTAL S.A. | 23,496 | 1,138,655 | ||||||
| 11,186,354 | ||||||||
| Germany–5.64% | ||||||||
Bayer AG | 16,955 | 2,262,621 | ||||||
Bayerische Motoren Werke AG | 8,350 | 857,278 | ||||||
Muenchener Rueckversicherungs-Gesellschaft AG | 13,365 | 2,667,594 | ||||||
SAP S.E. | 13,464 | 1,064,281 | ||||||
| 6,851,774 | ||||||||
| Hong Kong–0.96% | ||||||||
AIA Group Ltd. | 133,600 | 780,131 | ||||||
AIA Group Ltd.–ADR | 16,225 | 381,859 | ||||||
| 1,161,990 | ||||||||
| Ireland–1.70% | ||||||||
Shire PLC–ADR | 9,099 | 2,065,928 | ||||||
| Israel–1.54% | ||||||||
Teva Pharmaceutical Industries Ltd.–ADR | 31,515 | 1,865,373 | ||||||
| Japan–17.16% | ||||||||
Asahi Group Holdings, Ltd. | 39,497 | 1,215,462 | ||||||
Asics Corp. | 53,800 | 1,481,500 | ||||||
FANUC Corp. | 5,800 | 1,020,672 | ||||||
| Shares | Value | |||||||
| Japan–(continued) | ||||||||
Hitachi, Ltd. | 210,000 | $ | 1,206,342 | |||||
Honda Motor Co., Ltd. | 51,800 | 1,719,752 | ||||||
KDDI Corp. | 96,200 | 2,323,791 | ||||||
Keyence Corp. | 2,000 | 1,038,042 | ||||||
Komatsu Ltd. | 78,000 | 1,287,703 | ||||||
Mitsubishi Estate Co. Ltd. | 56,000 | 1,197,246 | ||||||
Mitsubishi UFJ Financial Group, Inc. | 261,000 | 1,687,700 | ||||||
Nissan Chemical Industries, Ltd. | 30,500 | 753,900 | ||||||
NTT DOCOMO, Inc. | 60,900 | 1,195,416 | ||||||
ORIX Corp. | 61,100 | 893,285 | ||||||
Rakuten Inc. | 110,400 | 1,527,817 | ||||||
Toyota Motor Corp. | 37,200 | 2,277,777 | ||||||
| 20,826,405 | ||||||||
| Netherlands–9.41% | ||||||||
Arcadis N.V. | 49,273 | 1,241,517 | ||||||
GrandVision N.V.(b) | 62,071 | 1,716,385 | ||||||
Heineken N.V. | 12,723 | 1,160,120 | ||||||
ING Groep N.V. | 201,035 | 2,915,621 | ||||||
Koninklijke DSM N.V. | 44,551 | 2,372,219 | ||||||
Koninklijke Philips N.V. | 74,648 | 2,013,726 | ||||||
| 11,419,588 | ||||||||
| Singapore–2.15% | ||||||||
Avago Technologies Ltd. | 9,260 | 1,140,184 | ||||||
DBS Group Holdings Ltd. | 119,660 | 1,475,143 | ||||||
| 2,615,327 | ||||||||
| Sweden–3.06% | ||||||||
Sandvik AB | 119,265 | 1,115,552 | ||||||
Svenska Handelsbanken AB–Class A | 191,815 | 2,601,716 | ||||||
| 3,717,268 | ||||||||
| Switzerland–9.82% | ||||||||
ABB Ltd. | 119,988 | 2,260,306 | ||||||
Novartis AG–ADR | 26,021 | 2,353,079 | ||||||
Roche Holding AG | 10,944 | 2,964,764 | ||||||
TE Connectivity Ltd. | 20,335 | 1,310,387 | ||||||
UBS Group AG | 151,579 | 3,025,655 | ||||||
| 11,914,191 | ||||||||
| Taiwan–2.65% | ||||||||
Taiwan Semiconductor Manufacturing Co. Ltd. | 699,000 | 2,942,451 | ||||||
Taiwan Semiconductor Manufacturing Co. Ltd.–ADR | 12,719 | 279,309 | ||||||
| 3,221,760 | ||||||||
| United Kingdom–18.01% | ||||||||
British American Tobacco PLC | 18,882 | 1,120,892 | ||||||
Diageo PLC | 109,410 | 3,162,169 | ||||||
GlaxoSmithKline PLC–ADR | 23,642 | 1,018,025 | ||||||
See accompanying Notes to Financial Statements which are an integral part of the financial statements.
9 Invesco International Core Equity Fund
| Shares | Value | |||||||
| United Kingdom–(continued) | ||||||||
Imperial Tobacco Group PLC | 19,263 | $ | 1,037,775 | |||||
Kingfisher PLC | 325,518 | 1,769,371 | ||||||
Liberty Global PLC–Series A(a) | 30,201 | 1,344,548 | ||||||
Liberty Global PLC–Series C(a) | 34,158 | 1,456,497 | ||||||
Liberty Global PLC LiLAC–Series A(a) | 5,291 | 204,338 | ||||||
Liberty Global PLC LiLAC–Series C(a) | 1,041 | 40,245 | ||||||
Rio Tinto PLC | 25,451 | 923,125 | ||||||
SABMiller PLC | 21,788 | 1,342,030 | ||||||
Smiths Group PLC | 82,575 | 1,224,762 | ||||||
St. James’s Place PLC | 178,475 | 2,647,645 | ||||||
Standard Chartered PLC | 107,689 | 1,195,342 | ||||||
Vodafone Group PLC-ADR | 102,517 | 3,379,985 | ||||||
| 21,866,749 | ||||||||
| United States–3.78% | ||||||||
ACE Ltd. | 9,413 | 1,068,752 | ||||||
Aon PLC | 24,387 | 2,275,551 | ||||||
| Shares | Value | |||||||
| United States–(continued) | ||||||||
ResMed Inc. | 21,484 | $ | 1,237,694 | |||||
| 4,581,997 | ||||||||
Total Common Stocks & Other Equity Interests |
| 118,304,870 | ||||||
Money Market Funds–1.52% |
| |||||||
Liquid Assets Portfolio–Institutional Class, 0.16%(c) | 922,387 | 922,387 | ||||||
Premier Portfolio–Institutional Class, 0.12%(c) | 922,387 | 922,387 | ||||||
Total Money Market Funds |
| 1,844,774 | ||||||
TOTAL INVESTMENTS–98.98% | 120,149,644 | |||||||
OTHER ASSETS LESS LIABILITIES–1.02% |
| 1,233,735 | ||||||
NET ASSETS–100.00% | $ | 121,383,379 | ||||||
Investment Abbreviations:
| ADR | – American Depositary Receipt |
Notes to Schedule of Investments:
| (a) | Non-income producing security. |
| (b) | Security purchased or received in a transaction exempt from registration under the Securities Act of 1933, as amended (the “1933 Act”). The security may be resold pursuant to an exemption from registration under the 1933 Act, typically to qualified institutional buyers. The aggregate value of these securities at October 31, 2015 was $2,578,031, which represented 2.12% of the Fund’s Net Assets. |
| (c) | The money market fund and the Fund are affiliated by having the same investment adviser. The rate shown is the 7-day SEC standardized yield as of October 31, 2015. |
See accompanying Notes to Financial Statements which are an integral part of the financial statements.
10 Invesco International Core Equity Fund
Statement of Assets and Liabilities
October 31, 2015
Assets: |
| |||
Investments, at value (Cost $120,388,644) | $ | 118,304,870 | ||
Investments in affiliated money market funds, at value and cost | 1,844,774 | |||
Total investments, at value (Cost $122,233,418) | 120,149,644 | |||
Foreign currencies, at value (Cost $184,574) | 181,181 | |||
Receivable for: | ||||
Investments sold | 508,033 | |||
Fund shares sold | 170,229 | |||
Dividends | 653,598 | |||
Investment for trustee deferred compensation and retirement plans | 95,641 | |||
Other assets | 21,916 | |||
Total assets | 121,780,242 | |||
Liabilities: |
| |||
Payable for: | ||||
Fund shares reacquired | 159,041 | |||
Accrued fees to affiliates | 58,120 | |||
Accrued trustees’ and officers’ fees and benefits | 1,537 | |||
Accrued other operating expenses | 71,282 | |||
Trustee deferred compensation and retirement plans | 106,883 | |||
Total liabilities | 396,863 | |||
Net assets applicable to shares outstanding | $ | 121,383,379 | ||
Net assets consist of: |
| |||
Shares of beneficial interest | $ | 134,490,607 | ||
Undistributed net investment income | 1,342,564 | |||
Undistributed net realized gain (loss) | (12,379,286 | ) | ||
Net unrealized appreciation (depreciation) | (2,070,506 | ) | ||
| $ | 121,383,379 | |||
Net Assets: |
| |||
Class A | $ | 40,161,273 | ||
Class B | $ | 945,176 | ||
Class C | $ | 10,066,660 | ||
Class R | $ | 1,799,179 | ||
Class Y | $ | 3,017,297 | ||
Investor Class | $ | 11,707,334 | ||
Class R5 | $ | 2,829,760 | ||
Class R6 | $ | 50,856,700 | ||
Shares outstanding, $0.001 par value per share, |
| |||
Class A | 3,743,756 | |||
Class B | 88,057 | |||
Class C | 964,625 | |||
Class R | 167,563 | |||
Class Y | 276,366 | |||
Investor Class | 1,074,210 | |||
Class R5 | 264,193 | |||
Class R6 | 4,748,844 | |||
Class A: | ||||
Net asset value per share | $ | 10.73 | ||
Maximum offering price per share | ||||
(Net asset value of $10.73 ¸ 94.50%) | $ | 11.35 | ||
Class B: | ||||
Net asset value and offering price per share | $ | 10.73 | ||
Class C: | ||||
Net asset value and offering price per share | $ | 10.44 | ||
Class R: | ||||
Net asset value and offering price per share | $ | 10.74 | ||
Class Y: | ||||
Net asset value and offering price per share | $ | 10.92 | ||
Investor Class: | ||||
Net asset value and offering price per share | $ | 10.90 | ||
Class R5: | ||||
Net asset value and offering price per share | $ | 10.71 | ||
Class R6: | ||||
Net asset value and offering price per share | $ | 10.71 | ||
See accompanying Notes to Financial Statements which are an integral part of the financial statements.
11 Invesco International Core Equity Fund
Statement of Operations
For the year ended October 31, 2015
Investment income: |
| |||
Dividends (net of foreign withholding taxes of $360,425) | $ | 3,596,277 | ||
Dividends from affiliated money market funds (includes securities lending income of $4,290) | 5,540 | |||
Total investment income | 3,601,817 | |||
Expenses: | ||||
Advisory fees | 964,440 | |||
Administrative services fees | 50,000 | |||
Custodian fees | 60,627 | |||
Distribution fees: | ||||
Class A | 103,069 | |||
Class B | 12,787 | |||
Class C | 108,898 | |||
Class R | 9,074 | |||
Investor Class | 31,096 | |||
Transfer agent fees — A, B, C, R, Y and Investor | 242,214 | |||
Transfer agent fees — R5 | 270 | |||
Transfer agent fees — R6 | 1,104 | |||
Trustees’ and officers’ fees and benefits | 22,475 | |||
Other | 212,738 | |||
Total expenses | 1,818,792 | |||
Less: Fees waived and expense offset arrangement(s) | (4,007 | ) | ||
Net expenses | 1,814,785 | |||
Net investment income | 1,787,032 | |||
Realized and unrealized gain (loss) from: | ||||
Net realized gain (loss) from: | ||||
Investment securities (includes net gains from securities sold to affiliates of $35,494) | 739,228 | |||
Foreign currencies | (19,078 | ) | ||
| 720,150 | ||||
Change in net unrealized appreciation (depreciation) of: | ||||
Investment securities | (2,859,436 | ) | ||
Foreign currencies | (1,056 | ) | ||
| (2,860,492 | ) | |||
Net realized and unrealized gain (loss) | (2,140,342 | ) | ||
Net increase (decrease) in net assets resulting from operations | $ | (353,310 | ) | |
See accompanying Notes to Financial Statements which are an integral part of the financial statements.
12 Invesco International Core Equity Fund
Statement of Changes in Net Assets
For the years ended October 31, 2015 and 2014
| 2015 | 2014 | |||||||
Operations: |
| |||||||
Net investment income | $ | 1,787,032 | $ | 2,051,417 | ||||
Net realized gain | 720,150 | 9,734,770 | ||||||
Change in net unrealized appreciation (depreciation) | (2,860,492 | ) | (10,282,206 | ) | ||||
Net increase (decrease) in net assets resulting from operations | (353,310 | ) | 1,503,981 | |||||
Distributions to shareholders from net investment income: | ||||||||
Class A | (368,533 | ) | (699,534 | ) | ||||
Class B | (3,458 | ) | (22,302 | ) | ||||
Class C | (24,300 | ) | (119,183 | ) | ||||
Class R | (12,369 | ) | (29,524 | ) | ||||
Class Y | (14,995 | ) | (25,536 | ) | ||||
Investor Class | (115,445 | ) | (234,807 | ) | ||||
Class R5 | (45,523 | ) | (67,893 | ) | ||||
Class R6 | (817,524 | ) | (1,303,221 | ) | ||||
Total distributions from net investment income | (1,402,147 | ) | (2,502,000 | ) | ||||
Distributions to shareholders from net realized gains: | ||||||||
Class A | (1,729,823 | ) | — | |||||
Class B | (67,605 | ) | — | |||||
Class C | (475,093 | ) | — | |||||
Class R | (77,750 | ) | — | |||||
Class Y | (56,544 | ) | — | |||||
Investor Class | (541,871 | ) | — | |||||
Class R5 | (136,763 | ) | — | |||||
Class R6 | (2,441,264 | ) | — | |||||
Total distributions from net realized gains | (5,526,713 | ) | — | |||||
Share transactions–net: | ||||||||
Class A | 2,355,231 | (2,299,009 | ) | |||||
Class B | (613,854 | ) | (851,161 | ) | ||||
Class C | (34,457 | ) | (1,517,822 | ) | ||||
Class R | 44,465 | (147,808 | ) | |||||
Class Y | 1,579,806 | 279,681 | ||||||
Investor Class | (415,510 | ) | (1,799,147 | ) | ||||
Class R5 | (129,751 | ) | 125,732 | |||||
Class R6 | (2,860,031 | ) | (125,941 | ) | ||||
Net increase (decrease) in net assets resulting from share transactions | (74,101 | ) | (6,335,475 | ) | ||||
Net increase (decrease) in net assets | (7,356,271 | ) | (7,333,494 | ) | ||||
Net assets: | ||||||||
Beginning of year | 128,739,650 | 136,073,144 | ||||||
End of year (includes undistributed net investment income of $1,342,564 and $1,290,638, respectively) | $ | 121,383,379 | $ | 128,739,650 | ||||
See accompanying Notes to Financial Statements which are an integral part of the financial statements.
13 Invesco International Core Equity Fund
Notes to Financial Statements
October 31, 2015
NOTE 1—Significant Accounting Policies
Invesco International Core Equity Fund (the “Fund”) is a series portfolio of AIM International Mutual Funds (Invesco International Mutual Funds) (the “Trust”). The Trust is a Delaware statutory trust registered under the Investment Company Act of 1940, as amended (the “1940 Act”), as an open-end series management investment company consisting of eight separate portfolios, each authorized to issue an unlimited number of shares of beneficial interest. The assets, liabilities and operations of each portfolio are accounted for separately. Information presented in these financial statements pertains only to the Fund. Matters affecting each portfolio or class will be voted on exclusively by the shareholders of such portfolio or class.
The Fund’s investment objective is long-term growth of capital.
The Fund currently consists of eight different classes of shares: Class A, Class B, Class C, Class R, Class Y, Investor Class, Class R5 and Class R6. Investor Class shares of the Fund are offered only to certain grandfathered investors. Class A shares are sold with a front-end sales charge unless certain waiver criteria are met and under certain circumstances load waived shares may be subject to contingent deferred sales charges (“CDSC”). Class C shares are sold with a CDSC. Class R, Class Y, Investor Class, Class R5 and Class R6 shares are sold at net asset value. Effective November 30, 2010, new or additional investments in Class B shares are no longer permitted. Existing shareholders of Class B shares may continue to reinvest dividends and capital gains distributions in Class B shares until they convert to Class A shares. Also, shareholders in Class B shares will be able to exchange those shares for Class B shares of other Invesco Funds offering such shares until they convert to Class A shares. Generally, Class B shares will automatically convert to Class A shares on or about the month-end, which is at least eight years after the date of purchase. Redemption of Class B shares prior to the conversion date will be subject to a CDSC.
The following is a summary of the significant accounting policies followed by the Fund in the preparation of its financial statements.
| A. | Security Valuations — Securities, including restricted securities, are valued according to the following policy. |
A security listed or traded on an exchange (except convertible securities) is valued at its last sales price or official closing price as of the close of the customary trading session on the exchange where the security is principally traded, or lacking any sales or official closing price on a particular day, the security may be valued at the closing bid price on that day. Securities traded in the over-the-counter market are valued based on prices furnished by independent pricing services or market makers. When such securities are valued by an independent pricing service they may be considered fair valued. Futures contracts are valued at the final settlement price set by an exchange on which they are principally traded. Listed options are valued at the mean between the last bid and asked prices from the exchange on which they are principally traded. Options not listed on an exchange are valued by an independent source at the mean between the last bid and asked prices. For purposes of determining net asset value (“NAV”) per share, futures and option contracts generally are valued 15 minutes after the close of the customary trading session of the New York Stock Exchange (“NYSE”).
Investments in open-end and closed-end registered investment companies that do not trade on an exchange are valued at the end-of-day net asset value per share. Investments in open-end and closed-end registered investment companies that trade on an exchange are valued at the last sales price or official closing price as of the close of the customary trading session on the exchange where the security is principally traded.
Debt obligations (including convertible securities) and unlisted equities are fair valued using an evaluated quote provided by an independent pricing service. Evaluated quotes provided by the pricing service may be determined without exclusive reliance on quoted prices, and may reflect appropriate factors such as institution-size trading in similar groups of securities, developments related to specific securities, dividend rate (for unlisted equities), yield (for debt obligations), quality, type of issue, coupon rate (for debt obligations), maturity (for debt obligations), individual trading characteristics and other market data. Debt obligations are subject to interest rate and credit risks. In addition, all debt obligations involve some risk of default with respect to interest and/or principal payments.
Foreign securities’ (including foreign exchange contracts) prices are converted into U.S. dollar amounts using the applicable exchange rates as of the close of the NYSE. If market quotations are available and reliable for foreign exchange-traded equity securities, the securities will be valued at the market quotations. Because trading hours for certain foreign securities end before the close of the NYSE, closing market quotations may become unreliable. If between the time trading ends on a particular security and the close of the customary trading session on the NYSE, events occur that the Adviser determines are significant and make the closing price unreliable, the Fund may fair value the security. If the event is likely to have affected the closing price of the security, the security will be valued at fair value in good faith using procedures approved by the Board of Trustees. Adjustments to closing prices to reflect fair value may also be based on a screening process of an independent pricing service to indicate the degree of certainty, based on historical data, that the closing price in the principal market where a foreign security trades is not the current value as of the close of the NYSE. Foreign securities’ prices meeting the approved degree of certainty that the price is not reflective of current value will be priced at the indication of fair value from the independent pricing service. Multiple factors may be considered by the independent pricing service in determining adjustments to reflect fair value and may include information relating to sector indices, American Depositary Receipts and domestic and foreign index futures. Foreign securities may have additional risks including exchange rate changes, potential for sharply devalued currencies and high inflation, political and economic upheaval, the relative lack of issuer information, relatively low market liquidity and the potential lack of strict financial and accounting controls and standards.
Securities for which market prices are not provided by any of the above methods may be valued based upon quotes furnished by independent sources. The last bid price may be used to value equity securities. The mean between the last bid and asked prices is used to value debt obligations, including corporate loans.
Securities for which market quotations are not readily available or became unreliable are valued at fair value as determined in good faith by or under the supervision of the Trust’s officers following procedures approved by the Board of Trustees. Issuer specific events, market trends, bid/asked quotes of brokers and information providers and other market data may be reviewed in the course of making a good faith determination of a security’s fair value.
The Fund may invest in securities that are subject to interest rate risk, meaning the risk that the prices will generally fall as interest rates rise and, conversely, the prices will generally rise as interest rates fall. Specific securities differ in their sensitivity to changes in interest rates
14 Invesco International Core Equity Fund
depending on their individual characteristics. Changes in interest rates may result in increased market volatility, which may affect the value and/or liquidity of certain Fund investments.
Valuations change in response to many factors including the historical and prospective earnings of the issuer, the value of the issuer’s assets, general economic conditions, interest rates, investor perceptions and market liquidity. Because of the inherent uncertainties of valuation, the values reflected in the financial statements may materially differ from the value received upon actual sale of those investments.
| B. | Securities Transactions and Investment Income — Securities transactions are accounted for on a trade date basis. Realized gains or losses on sales are computed on the basis of specific identification of the securities sold. Interest income (net of withholding tax, if any) is recorded on the accrual basis from settlement date. Dividend income (net of withholding tax, if any) is recorded on the ex-dividend date. |
The Fund may periodically participate in litigation related to Fund investments. As such, the Fund may receive proceeds from litigation settlements. Any proceeds received are included in the Statement of Operations as realized gain (loss) for investments no longer held and as unrealized gain (loss) for investments still held.
Brokerage commissions and mark ups are considered transaction costs and are recorded as an increase to the cost basis of securities purchased and/or a reduction of proceeds on a sale of securities. Such transaction costs are included in the determination of net realized and unrealized gain (loss) from investment securities reported in the Statement of Operations and the Statement of Changes in Net Assets and the net realized and unrealized gains (losses) on securities per share in the Financial Highlights. Transaction costs are included in the calculation of the Fund’s net asset value and, accordingly, they reduce the Fund’s total returns. These transaction costs are not considered operating expenses and are not reflected in net investment income reported in the Statement of Operations and the Statement of Changes in Net Assets, or the net investment income per share and the ratios of expenses and net investment income reported in the Financial Highlights, nor are they limited by any expense limitation arrangements between the Fund and the investment adviser.
The Fund allocates income and realized and unrealized capital gains and losses to a class based on the relative net assets of each class.
| C. | Country Determination — For the purposes of making investment selection decisions and presentation in the Schedule of Investments, the investment adviser may determine the country in which an issuer is located and/or credit risk exposure based on various factors. These factors include the laws of the country under which the issuer is organized, where the issuer maintains a principal office, the country in which the issuer derives 50% or more of its total revenues and the country that has the primary market for the issuer’s securities, as well as other criteria. Among the other criteria that may be evaluated for making this determination are the country in which the issuer maintains 50% or more of its assets, the type of security, financial guarantees and enhancements, the nature of the collateral and the sponsor organization. Country of issuer and/or credit risk exposure has been determined to be the United States of America, unless otherwise noted. |
| D. | Distributions — Distributions from net investment income and net realized capital gain, if any, are generally declared and paid annually and recorded on the ex-dividend date. The Fund may elect to treat a portion of the proceeds from redemptions as distributions for federal income tax purposes. |
| E. | Federal Income Taxes — The Fund intends to comply with the requirements of Subchapter M of the Internal Revenue Code of 1986, as amended (the “Internal Revenue Code”), necessary to qualify as a regulated investment company and to distribute substantially all of the Fund’s taxable earnings to shareholders. As such, the Fund will not be subject to federal income taxes on otherwise taxable income (including net realized capital gain) that is distributed to shareholders. Therefore, no provision for federal income taxes is recorded in the financial statements. |
The Fund recognizes the tax benefits of uncertain tax positions only when the position is more likely than not to be sustained. Management has analyzed the Fund’s uncertain tax positions and concluded that no liability for unrecognized tax benefits should be recorded related to uncertain tax positions. Management is not aware of any tax positions for which it is reasonably possible that the total amounts of unrecognized tax benefits will change materially in the next 12 months.
The Fund files tax returns in the U.S. Federal jurisdiction and certain other jurisdictions. Generally, the Fund is subject to examinations by such taxing authorities for up to three years after the filing of the return for the tax period.
| F. | Expenses — Fees provided for under the Rule 12b-1 plan of a particular class of the Fund are charged to the operations of such class. Transfer agency fees and expenses and other shareholder recordkeeping fees and expenses attributable to Class R5 and Class R6 are allocated to each share class based on relative net assets. Sub-accounting fees attributable to Class R5 are charged to the operations of the class. Transfer agency fees and expenses and other shareholder recordkeeping fees and expenses relating to all other classes are allocated among those classes based on relative net assets. All other expenses are allocated among the classes based on relative net assets. |
| G. | Accounting Estimates — The preparation of financial statements in conformity with accounting principles generally accepted in the United States of America (“GAAP”) requires management to make estimates and assumptions that affect the reported amounts of assets and liabilities at the date of the financial statements and the reported amounts of revenues and expenses during the reporting period including estimates and assumptions related to taxation. Actual results could differ from those estimates by a significant amount. In addition, the Fund monitors for material events or transactions that may occur or become known after the period-end date and before the date the financial statements are released to print. |
| H. | Indemnifications — Under the Trust’s organizational documents, each Trustee, officer, employee or other agent of the Trust is indemnified against certain liabilities that may arise out of the performance of their duties to the Fund. Additionally, in the normal course of business, the Fund enters into contracts, including the Fund’s servicing agreements, that contain a variety of indemnification clauses. The Fund’s maximum exposure under these arrangements is unknown as this would involve future claims that may be made against the Fund that have not yet occurred. The risk of material loss as a result of such indemnification claims is considered remote. |
| I. | Securities Lending — The Fund may lend portfolio securities having a market value up to one-third of the Fund’s total assets. Such loans are secured by collateral equal to no less than the market value of the loaned securities determined daily by the securities lending provider. Such collateral will be cash or debt securities issued or guaranteed by the U.S. Government or any of its sponsored agencies. Cash collateral received in connection with these loans is invested in short-term money market instruments or affiliated money market funds and is shown as such on the Schedule of Investments. The Fund bears the risk of loss with respect to the investment of collateral. It is the Fund’s policy to obtain additional collateral from or return excess collateral to the borrower by the end of the next business day, following the valuation date of the securities loaned. Therefore, the value of the collateral held may be temporarily less than the value of the securities on loan. When loaning securities, the Fund retains certain benefits of owning the securities, including the economic equivalent of dividends or interest generated by the security. Lending securities entails a risk of loss to the Fund if, and to the extent that, the market value of the securities loaned were to increase and the |
15 Invesco International Core Equity Fund
| borrower did not increase the collateral accordingly, and the borrower failed to return the securities. The securities loaned are subject to termination at the option of the borrower or the Fund. Upon termination, the borrower will return to the Fund the securities loaned and the Fund will return the collateral. Upon the failure of the borrower to return the securities, collateral may be liquidated and the securities may be purchased on the open market to replace the loaned securities. The Fund could experience delays and costs in gaining access to the collateral and the securities may lose value during the delay which could result in potential losses to the Fund. Some of these losses may be indemnified by the lending agent. The Fund bears the risk of any deficiency in the amount of the collateral available for return to the borrower due to any loss on the collateral invested. Dividends received on cash collateral investments for securities lending transactions, which are net of compensation to counterparties, is included in Dividends from affiliated money market funds on the Statement of Operations. The aggregate value of securities out on loan, if any, is shown as a footnote on the Statement of Assets and Liabilities. |
| J. | Foreign Currency Translations — Foreign currency is valued at the close of the NYSE based on quotations posted by banks and major currency dealers. Portfolio securities and other assets and liabilities denominated in foreign currencies are translated into U.S. dollar amounts at date of valuation. Purchases and sales of portfolio securities (net of foreign taxes withheld on disposition) and income items denominated in foreign currencies are translated into U.S. dollar amounts on the respective dates of such transactions. The Fund does not separately account for the portion of the results of operations resulting from changes in foreign exchange rates on investments and the fluctuations arising from changes in market prices of securities held. The combined results of changes in foreign exchange rates and the fluctuation of market prices on investments (net of estimated foreign tax withholding) are included with the net realized and unrealized gain or loss from investments in the Statement of Operations. Reported net realized foreign currency gains or losses arise from (1) sales of foreign currencies, (2) currency gains or losses realized between the trade and settlement dates on securities transactions, and (3) the difference between the amounts of dividends, interest, and foreign withholding taxes recorded on the Fund’s books and the U.S. dollar equivalent of the amounts actually received or paid. Net unrealized foreign currency gains and losses arise from changes in the fair values of assets and liabilities, other than investments in securities at fiscal period end, resulting from changes in exchange rates. |
The Fund may invest in foreign securities, which may be subject to foreign taxes on income, gains on investments or currency repatriation, a portion of which may be recoverable. Foreign taxes, if any, are recorded based on the tax regulations and rates that exist in the foreign markets in which the Fund invests and are shown in the Statement of Operations.
| K. | Forward Foreign Currency Contracts — The Fund may engage in foreign currency transactions either on a spot (i.e. for prompt delivery and settlement) basis, or through forward foreign currency contracts, to manage or minimize currency or exchange rate risk. |
The Fund may also enter into forward foreign currency contracts for the purchase or sale of a security denominated in a foreign currency in order to “lock in” the U.S. dollar price of that security, or the Fund may also enter into forward foreign currency contracts that do not provide for physical settlement of the two currencies, but instead are settled by a single cash payment calculated as the difference between the agreed upon exchange rate and the spot rate at settlement based upon an agreed upon notional amount (non-deliverable forwards). The Fund will set aside liquid assets in an amount equal to daily mark-to-market obligation for forward foreign currency contracts.
A forward foreign currency contract is an obligation between two parties (“Counterparties”) to purchase or sell a specific currency for an agreed-upon price at a future date. The use of forward foreign currency contracts does not eliminate fluctuations in the price of the underlying securities the Fund owns or intends to acquire but establishes a rate of exchange in advance. Fluctuations in the value of these contracts are measured by the difference in the contract date and reporting date exchange rates and are recorded as unrealized appreciation (depreciation) until the contracts are closed. When the contracts are closed, realized gains (losses) are recorded. Realized and unrealized gains (losses) on the contracts are included in the Statement of Operations. The primary risks associated with forward foreign currency contracts include failure of the Counterparty to meet the terms of the contract and the value of the foreign currency changing unfavorably. These risks may be in excess of the amounts reflected in the Statement of Assets and Liabilities.
NOTE 2—Advisory Fees and Other Fees Paid to Affiliates
The Trust has entered into a master investment advisory agreement with Invesco Advisers, Inc. (the “Adviser” or “Invesco”). Under the terms of the investment advisory agreement, the Fund pays an advisory fee to the Adviser based on the annual rate of the Fund’s average daily net assets as follows:
| Average Daily Net Assets | Rate | |||||
First $500 million | 0 | .75% | ||||
Next $500 million | 0 | .65% | ||||
From $1 billion | 0 | .55% | ||||
From $2 billion | 0 | .45% | ||||
From $4 billion | 0 | .40% | ||||
From $6 billion | 0 | .375% | ||||
Over $8 billion | 0 | .35% | ||||
For the year ended October 31, 2015, the effective advisory fees incurred by the Fund was 0.75%.
Under the terms of a master sub-advisory agreement between the Adviser and each of Invesco Asset Management Deutschland GmbH, Invesco Asset Management Limited, Invesco Asset Management (Japan) Limited, Invesco Hong Kong Limited, Invesco Senior Secured Management, Inc. and Invesco Canada Ltd. (collectively, the “Affiliated Sub-Advisers”) the Adviser, not the Fund, may pay 40% of the fees paid to the Adviser to any such Affiliated Sub-Adviser(s) that provide(s) discretionary investment management services to the Fund based on the percentage of assets allocated to such Affiliated Sub-Adviser(s).
The Adviser has contractually agreed, through at least June 30, 2016, to waive advisory fees and/or reimburse expenses of all shares to the extent necessary to limit total annual fund operating expenses after fee waiver and/or expense reimbursement (excluding certain items discussed below) of Class A, Class B, Class C, Class R, Class Y, Investor Class, Class R5 and Class R6 shares to 2.25%, 3.00%, 3.00%, 2.50%, 2.00%,
16 Invesco International Core Equity Fund
2.25%, 2.00% and 2.00%, respectively, of average daily net assets. In determining the Adviser’s obligation to waive advisory fees and/or reimburse expenses, the following expenses are not taken into account, and could cause the total annual fund operating expenses after fee waiver and/or expense reimbursement to exceed the numbers reflected above: (1) interest; (2) taxes; (3) dividend expense on short sales; (4) extraordinary or non-routine items, including litigation expenses; and (5) expenses that the Fund has incurred but did not actually pay because of an expense offset arrangement. Unless Invesco continues the fee waiver agreement, it will terminate on June 30, 2016. The fee waiver agreement cannot be terminated during its term. The Adviser did not waive fees and/or reimburse expenses during the period under this expense limitation.
Further, the Adviser has contractually agreed, through at least June 30, 2017, to waive the advisory fee payable by the Fund in an amount equal to 100% of the net advisory fees the Adviser receives from the affiliated money market funds on investments by the Fund of uninvested cash (excluding investments of cash collateral from securities lending) in such affiliated money market funds.
For the year ended October 31, 2015, the Adviser waived advisory fees of $3,013.
The Trust has entered into a master administrative services agreement with Invesco pursuant to which the Fund has agreed to pay Invesco for certain administrative costs incurred in providing accounting services to the Fund. For the year ended October 31, 2015, expenses incurred under the agreement are shown in the Statement of Operations as Administrative services fees.
The Trust has entered into a transfer agency and service agreement with Invesco Investment Services, Inc. (“IIS”) pursuant to which the Fund has agreed to pay IIS a fee for providing transfer agency and shareholder services to the Fund and reimburse IIS for certain expenses incurred by IIS in the course of providing such services. IIS may make payments to intermediaries that provide omnibus account services, sub-accounting services and/or networking services. All fees payable by IIS to intermediaries that provide omnibus account services or sub-accounting are charged back to the Fund, subject to certain limitations approved by the Trust’s Board of Trustees. For the year ended October 31, 2015, expenses incurred under the agreement are shown in the Statement of Operations as Transfer agent fees.
The Trust has entered into master distribution agreements with Invesco Distributors, Inc. (“IDI”) to serve as the distributor for the Class A, Class B, Class C, Class R, Class Y, Investor Class, Class R5 and Class R6 shares of the Fund. The Trust has adopted plans pursuant to Rule 12b-1 under the 1940 Act with respect to the Fund’s Class A, Class B, Class C, Class R and Investor Class shares (collectively, the “Plans”). The Fund, pursuant to the Plans, pays IDI compensation at the annual rate of 0.25% of the Fund’s average daily net assets of Class A shares, 1.00% of the average daily net assets of Class B and Class C shares, 0.50% of the average daily net assets of Class R shares and 0.25% of the average daily net assets of Investor Class shares. Of the Plan payments, up to 0.25% of the average daily net assets of each class of shares may be paid to furnish continuing personal shareholder services to customers who purchase and own shares of such classes. Any amounts not paid as a service fee under the Plans would constitute an asset-based sales charge. Rules of the Financial Industry Regulatory Authority (“FINRA”) impose a cap on the total sales charges, including asset-based sales charges, that may be paid by any class of shares of the Fund. For the year ended October 31, 2015, expenses incurred under the Plans are shown in the Statement of Operations as Distribution fees.
Front-end sales commissions and CDSC (collectively, the “sales charges”) are not recorded as expenses of the Fund. Front-end sales commissions are deducted from proceeds from the sales of Fund shares prior to investment in Class A shares of the Fund. CDSC are deducted from redemption proceeds prior to remittance to the shareholder. During the year ended October 31, 2015, IDI advised the Fund that IDI retained $13,524 in front-end sales commissions from the sale of Class A shares and $134, $1,007 and $184 from Class A, Class B and Class C shares, respectively, for CDSC imposed on redemptions by shareholders.
Certain officers and trustees of the Trust are officers and directors of the Adviser, IIS and/or IDI.
NOTE 3—Additional Valuation Information
GAAP defines fair value as the price that would be received to sell an asset or paid to transfer a liability in an orderly transaction between market participants at the measurement date, under current market conditions. GAAP establishes a hierarchy that prioritizes the inputs to valuation methods, giving the highest priority to readily available unadjusted quoted prices in an active market for identical assets (Level 1) and the lowest priority to significant unobservable inputs (Level 3), generally when market prices are not readily available or are unreliable. Based on the valuation inputs, the securities or other investments are tiered into one of three levels. Changes in valuation methods may result in transfers in or out of an investment’s assigned level:
| Level 1 — | Prices are determined using quoted prices in an active market for identical assets. |
| Level 2 — | Prices are determined using other significant observable inputs. Observable inputs are inputs that other market participants may use in pricing a security. These may include quoted prices for similar securities, interest rates, prepayment speeds, credit risk, yield curves, loss severities, default rates, discount rates, volatilities and others. |
| Level 3 — | Prices are determined using significant unobservable inputs. In situations where quoted prices or observable inputs are unavailable (for example, when there is little or no market activity for an investment at the end of the period), unobservable inputs may be used. Unobservable inputs reflect the Fund’s own assumptions about the factors market participants would use in determining fair value of the securities or instruments and would be based on the best available information. |
The following is a summary of the tiered valuation input levels, as of October 31, 2015. The level assigned to the securities valuations may not be an indication of the risk or liquidity associated with investing in those securities. Because of the inherent uncertainties of valuation, the values reflected in the financial statements may materially differ from the value received upon actual sale of those investments.
17 Invesco International Core Equity Fund
During the year ended October 31, 2015, there were transfers from Level 1 to Level 2 of $4,608,762 and from Level 2 to Level 1 of $7,274,654, due to foreign fair value adjustments.
| Level 1 | Level 2 | Level 3 | Total | |||||||||||||
Australia | $ | — | $ | 1,615,052 | $ | — | $ | 1,615,052 | ||||||||
Canada | 8,213,358 | — | — | 8,213,358 | ||||||||||||
China | 1,482,138 | — | — | 1,482,138 | ||||||||||||
Denmark | — | 647,623 | — | 647,623 | ||||||||||||
Finland | — | 3,051,995 | — | 3,051,995 | ||||||||||||
France | 4,203,575 | 6,982,779 | — | 11,186,354 | ||||||||||||
Germany | 6,851,774 | — | — | 6,851,774 | ||||||||||||
Hong Kong | — | 1,161,990 | — | 1,161,990 | ||||||||||||
Ireland | 2,065,928 | — | — | 2,065,928 | ||||||||||||
Israel | 1,865,373 | — | — | 1,865,373 | ||||||||||||
Japan | — | 20,826,405 | — | 20,826,405 | ||||||||||||
Netherlands | 1,716,385 | 9,703,203 | — | 11,419,588 | ||||||||||||
Singapore | 2,615,327 | — | — | 2,615,327 | ||||||||||||
Sweden | 1,115,552 | 2,601,716 | — | 3,717,268 | ||||||||||||
Switzerland | 3,663,466 | 8,250,725 | — | 11,914,191 | ||||||||||||
Taiwan | 279,309 | 2,942,451 | — | 3,221,760 | ||||||||||||
United Kingdom | 10,010,430 | 11,856,319 | — | 21,866,749 | ||||||||||||
United States | 6,426,771 | — | — | 6,426,771 | ||||||||||||
Total Investments | $ | 50,509,386 | $ | 69,640,258 | $ | — | $ | 120,149,644 | ||||||||
NOTE 4—Security Transactions with Affiliated Funds
The Fund is permitted to purchase or sell securities from or to certain other Invesco Funds under specified conditions outlined in procedures adopted by the Board of Trustees of the Trust. The procedures have been designed to ensure that any purchase or sale of securities by the Fund from or to another fund or portfolio that is or could be considered an affiliate by virtue of having a common investment adviser (or affiliated investment advisers), common Trustees and/or common officers complies with Rule 17a-7 of the 1940 Act. Further, as defined under the procedures, each transaction is effected at the current market price. Pursuant to these procedures, for the year ended October 31, 2015, the Fund engaged in securities sales of $1,699,729, which resulted in net realized gains of $35,494.
NOTE 5—Expense Offset Arrangement(s)
The expense offset arrangement is comprised of transfer agency credits which result from balances in demand deposit accounts used by the transfer agent for clearing shareholder transactions. For the year ended October 31, 2015, the Fund received credits from this arrangement, which resulted in the reduction of the Fund’s total expenses of $994.
NOTE 6—Trustees’ and Officers’ Fees and Benefits
Trustees’ and Officers’ Fees and Benefits include amounts accrued by the Fund to pay remuneration to certain Trustees and Officers of the Fund. Trustees have the option to defer compensation payable by the Fund, and Trustees’ and Officers’ Fees and Benefits also include amounts accrued by the Fund to fund such deferred compensation amounts. Those Trustees who defer compensation have the option to select various Invesco Funds in which their deferral accounts shall be deemed to be invested. Finally, certain current Trustees were eligible to participate in a retirement plan that provided for benefits to be paid upon retirement to Trustees over a period of time based on the number of years of service. The Fund may have certain former Trustees who also participate in a retirement plan and receive benefits under such plan. Trustees’ and Officers’ Fees and Benefits include amounts accrued by the Fund to fund such retirement benefits. Obligations under the deferred compensation and retirement plans represent unsecured claims against the general assets of the Fund.
NOTE 7—Cash Balances
The Fund is permitted to temporarily carry a negative or overdrawn balance in its account with State Street Bank and Trust Company, the custodian bank. Such balances, if any at period end, are shown in the Statement of Assets and Liabilities under the payable caption Amount due custodian. To compensate the custodian bank for such overdrafts, the overdrawn Fund may either (1) leave funds as a compensating balance in the account so the custodian bank can be compensated by earning the additional interest; or (2) compensate by paying the custodian bank at a rate agreed upon by the custodian bank and Invesco, not to exceed the contractually agreed upon rate.
18 Invesco International Core Equity Fund
NOTE 8—Distributions to Shareholders and Tax Components of Net Assets
Tax Character of Distributions to Shareholders Paid During the Fiscal Years Ended October 31, 2015 and 2014:
| 2015 | 2014 | |||||||
Ordinary income | $ | 1,720,986 | $ | 2,502,000 | ||||
Long-term capital gain | 5,207,874 | — | ||||||
Total distributions | $ | 6,928,860 | $ | 2,502,000 | ||||
Tax Components of Net Assets at Period-End:
| 2015 | ||||
Undistributed ordinary income | $ | 1,466,250 | ||
Net unrealized appreciation (depreciation) — investments | (2,533,407 | ) | ||
Net unrealized appreciation — other investments | 13,268 | |||
Temporary book/tax differences | (105,158 | ) | ||
Capital loss carryforward | (11,948,181 | ) | ||
Shares of beneficial interest | 134,490,607 | |||
Total net assets | $ | 121,383,379 | ||
The difference between book-basis and tax-basis unrealized appreciation (depreciation) is due to differences in the timing of recognition of gains and losses on investments for tax and book purposes. The Fund’s net unrealized appreciation (depreciation) difference is attributable primarily to wash sales.
The temporary book/tax differences are a result of timing differences between book and tax recognition of income and/or expenses. The Fund’s temporary book/tax differences are the result of the trustee deferral of compensation and retirement plan benefits.
Capital loss carryforward is calculated and reported as of a specific date. Results of transactions and other activity after that date may affect the amount of capital loss carryforward actually available for the Fund to utilize. Capital losses generated in years beginning after December 22, 2010 can be carried forward for an unlimited period, whereas previous losses expire in eight tax years. Capital losses with an expiration period may not be used to offset capital gains until all net capital losses without an expiration date have been utilized. Capital loss carryforwards with no expiration date will retain their character as either short-term or long-term capital losses instead of as short-term capital losses as under prior law. The ability to utilize capital loss carryforwards in the future may be limited under the Internal Revenue Code and related regulations based on the results of future transactions.
The Fund has a capital loss carryforward as of October 31, 2015, which expires as follows:
| Capital Loss Carryforward* | ||||||||||||
| Expiration | Short-Term | Long-Term | Total | |||||||||
October 31, 2017 | $ | 11,001,492 | $ | — | $ | 11,001,492 | ||||||
Not subject to expiration | 938,051 | 8,638 | 946,689 | |||||||||
| $ | 11,939,543 | $ | 8,638 | $ | 11,948,181 | |||||||
| * | Capital loss carryforward as of the date listed above is reduced for limitations, if any, to the extent required by the Internal Revenue Code and may be further limited depending upon a variety of factors, including the realization of net unrealized gains or losses as of the date of any reorganization. |
NOTE 9—Investment Securities
The aggregate amount of investment securities (other than short-term securities, U.S. Treasury obligations and money market funds, if any) purchased and sold by the Fund during the year ended October 31, 2015 was $78,439,915 and $84,774,032, respectively. Cost of investments on a tax basis includes the adjustments for financial reporting purposes as of the most recently completed federal income tax reporting period-end.
| Unrealized Appreciation (Depreciation) of Investment Securities on a Tax Basis | ||||
Aggregate unrealized appreciation of investment securities | $ | 7,031,322 | ||
Aggregate unrealized (depreciation) of investment securities | (9,564,729 | ) | ||
Net unrealized appreciation (depreciation) of investment securities | $ | (2,533,407 | ) | |
Cost of investments for tax purposes is $122,683,051.
NOTE 10—Reclassification of Permanent Differences
Primarily as a result of differing book/tax treatment of foreign currency transactions and distributions, on October 31, 2015, undistributed net investment income was decreased by $332,959, undistributed net realized gain (loss) was increased by $337,917 and shares of beneficial interest was decreased by $4,958. This reclassification had no effect on the net assets of the Fund.
19 Invesco International Core Equity Fund
NOTE 11—Share Information
| Summary of Share Activity | ||||||||||||||||
| Years ended October 31, | ||||||||||||||||
| 2015(a) | 2014 | |||||||||||||||
| Shares | Amount | Shares | Amount | |||||||||||||
Sold: | ||||||||||||||||
Class A | 797,936 | $ | 8,883,676 | 497,949 | $ | 5,712,670 | ||||||||||
Class B | 7,506 | 85,315 | 8,611 | 97,374 | ||||||||||||
Class C | 294,709 | 3,216,682 | 105,522 | 1,179,598 | ||||||||||||
Class R | 48,193 | 528,121 | 64,374 | 731,130 | ||||||||||||
Class Y | 238,069 | 2,689,632 | 160,484 | 1,865,541 | ||||||||||||
Investor Class | 63,561 | 721,270 | 41,213 | 477,291 | ||||||||||||
Class R5 | 138 | 1,549 | 45,774 | 511,417 | ||||||||||||
Class R6 | 395,051 | 4,195,194 | 394,190 | 4,536,744 | ||||||||||||
Issued as reinvestment of dividends: | ||||||||||||||||
Class A | 191,804 | 2,006,264 | 61,809 | 668,156 | ||||||||||||
Class B | 6,563 | 69,103 | 2,006 | 21,844 | ||||||||||||
Class C | 44,636 | 457,077 | 10,054 | 106,576 | ||||||||||||
Class R | 8,591 | 90,119 | 2,721 | 29,524 | ||||||||||||
Class Y | 5,813 | 63,818 | 2,057 | 22,564 | ||||||||||||
Investor Class | 60,131 | 638,592 | 20,654 | 226,785 | ||||||||||||
Class R5 | 17,508 | 181,911 | 6,302 | 67,746 | ||||||||||||
Class R6 | 313,647 | 3,258,788 | 121,343 | 1,303,221 | ||||||||||||
Automatic conversion of Class B shares to Class A shares: | ||||||||||||||||
Class A | 52,540 | 582,328 | 46,434 | 532,069 | ||||||||||||
Class B | (52,328 | ) | (582,328 | ) | (46,217 | ) | (532,069 | ) | ||||||||
Reacquired: | ||||||||||||||||
Class A | (827,673 | ) | (9,117,037 | ) | (805,479 | ) | (9,211,904 | ) | ||||||||
Class B | (16,719 | ) | (185,944 | ) | (38,304 | ) | (438,310 | ) | ||||||||
Class C | (353,083 | ) | (3,708,216 | ) | (253,142 | ) | (2,803,996 | ) | ||||||||
Class R | (52,785 | ) | (573,775 | ) | (79,275 | ) | (908,462 | ) | ||||||||
Class Y | (103,676 | ) | (1,173,644 | ) | (136,622 | ) | (1,608,424 | ) | ||||||||
Investor Class | (160,126 | ) | (1,775,372 | ) | (217,046 | ) | (2,503,223 | ) | ||||||||
Class R5 | (28,852 | ) | (313,211 | ) | (39,647 | ) | (453,431 | ) | ||||||||
Class R6 | (959,668 | ) | (10,314,013 | ) | (527,417 | ) | (5,965,906 | ) | ||||||||
Net increase (decrease) in share activity | (8,514 | ) | $ | (74,101 | ) | (551,652 | ) | $ | (6,335,475 | ) | ||||||
| (a) | There is an entity that is a record owner of more than 5% of the outstanding shares of the Fund and owns 9% of the outstanding shares of the Fund. IDI has an agreement with this entity to sell Fund shares. The Fund, Invesco and/or Invesco affiliates may make payments to this entity, which are considered to be related to the Fund, for providing services to the Fund, Invesco and/or Invesco affiliates including but not limited to services such as securities brokerage, distribution, third party record keeping and account servicing. The Fund has no knowledge as to whether all or any portion of the shares owned of record by this entity are also owned beneficially. |
| 42% of the outstanding shares of the Fund are owned by affiliated mutual funds. Affiliated mutual funds are other mutual funds that are also advised by Invesco. |
20 Invesco International Core Equity Fund
NOTE 12—Financial Highlights
The following schedule presents financial highlights for a share of the Fund outstanding throughout the periods indicated.
| Net asset value, beginning of period | Net investment income(a) | Net gains (losses) on securities (both realized and unrealized) | Total from investment operations | Dividends from net investment income | Distributions from net realized gains | Total distributions | Net asset value, end of period(b) | Total return(c) | Net assets, end of period (000’s omitted) | Ratio of expenses to average net assets with fee waivers and/or expenses absorbed | Ratio of expenses to average net assets without fee waivers and/or expenses absorbed | Ratio of net investment income to average net assets | Portfolio turnover(d) | |||||||||||||||||||||||||||||||||||||||||||
Class A | ||||||||||||||||||||||||||||||||||||||||||||||||||||||||
Year ended 10/31/15 | $ | 11.37 | $ | 0.13 | $ | (0.17 | ) | $ | (0.04 | ) | $ | (0.10 | ) | $ | (0.50 | ) | $ | (0.60 | ) | $ | 10.73 | (0.19 | )% | $ | 40,161 | 1.61 | %(e) | 1.61 | %(e) | 1.19 | %(e) | 63 | % | |||||||||||||||||||||||
Year ended 10/31/14 | 11.45 | 0.15 | (0.04 | ) | 0.11 | (0.19 | ) | — | (0.19 | ) | 11.37 | 1.04 | 40,132 | 1.59 | 1.59 | 1.34 | 109 | |||||||||||||||||||||||||||||||||||||||
Year ended 10/31/13 | 9.87 | 0.13 | 1.63 | 1.76 | (0.18 | ) | — | (0.18 | ) | 11.45 | 18.11 | 42,703 | 1.65 | 1.65 | 1.20 | 25 | ||||||||||||||||||||||||||||||||||||||||
Year ended 10/31/12 | 10.02 | 0.18 | (0.05 | ) | 0.13 | (0.28 | ) | — | (0.28 | ) | 9.87 | 1.40 | 39,044 | 1.59 | 1.59 | 1.86 | 20 | |||||||||||||||||||||||||||||||||||||||
Year ended 10/31/11 | 10.96 | 0.30 | (1.11 | ) | (0.81 | ) | (0.13 | ) | — | (0.13 | ) | 10.02 | (7.46 | ) | 43,983 | 1.54 | 1.54 | 2.71 | 26 | |||||||||||||||||||||||||||||||||||||
Class B | ||||||||||||||||||||||||||||||||||||||||||||||||||||||||
Year ended 10/31/15 | 11.38 | 0.05 | (0.18 | ) | (0.13 | ) | (0.02 | ) | (0.50 | ) | (0.52 | ) | 10.73 | (1.04 | ) | 945 | 2.36 | (e) | 2.36 | (e) | 0.44 | (e) | 63 | |||||||||||||||||||||||||||||||||
Year ended 10/31/14 | 11.47 | 0.07 | (0.05 | ) | 0.02 | (0.11 | ) | — | (0.11 | ) | 11.38 | 0.19 | 1,627 | 2.34 | 2.34 | 0.59 | 109 | |||||||||||||||||||||||||||||||||||||||
Year ended 10/31/13 | 9.87 | 0.05 | 1.65 | 1.70 | (0.10 | ) | — | (0.10 | ) | 11.47 | 17.35 | 2,488 | 2.40 | 2.40 | 0.45 | 25 | ||||||||||||||||||||||||||||||||||||||||
Year ended 10/31/12 | 10.00 | 0.11 | (0.05 | ) | 0.06 | (0.19 | ) | — | (0.19 | ) | 9.87 | 0.67 | 3,085 | 2.34 | 2.34 | 1.11 | 20 | |||||||||||||||||||||||||||||||||||||||
Year ended 10/31/11 | 10.92 | 0.22 | (1.11 | ) | (0.89 | ) | (0.03 | ) | — | (0.03 | ) | 10.00 | (8.16 | ) | 4,654 | 2.29 | 2.29 | 1.96 | 26 | |||||||||||||||||||||||||||||||||||||
Class C | ||||||||||||||||||||||||||||||||||||||||||||||||||||||||
Year ended 10/31/15 | 11.08 | 0.05 | (0.17 | ) | (0.12 | ) | (0.02 | ) | (0.50 | ) | (0.52 | ) | 10.44 | (0.97 | ) | 10,067 | 2.36 | (e) | 2.36 | (e) | 0.44 | (e) | 63 | |||||||||||||||||||||||||||||||||
Year ended 10/31/14 | 11.16 | 0.07 | (0.04 | ) | 0.03 | (0.11 | ) | — | (0.11 | ) | 11.08 | 0.29 | 10,837 | 2.34 | 2.34 | 0.59 | 109 | |||||||||||||||||||||||||||||||||||||||
Year ended 10/31/13 | 9.61 | 0.05 | 1.60 | 1.65 | (0.10 | ) | — | (0.10 | ) | 11.16 | 17.30 | 12,458 | 2.40 | 2.40 | 0.45 | 25 | ||||||||||||||||||||||||||||||||||||||||
Year ended 10/31/12 | 9.74 | 0.11 | (0.05 | ) | 0.06 | (0.19 | ) | — | (0.19 | ) | 9.61 | 0.69 | 11,896 | 2.34 | 2.34 | 1.11 | 20 | |||||||||||||||||||||||||||||||||||||||
Year ended 10/31/11 | 10.65 | 0.21 | (1.09 | ) | (0.88 | ) | (0.03 | ) | — | (0.03 | ) | 9.74 | (8.28 | ) | 15,597 | 2.29 | 2.29 | 1.96 | 26 | |||||||||||||||||||||||||||||||||||||
Class R | ||||||||||||||||||||||||||||||||||||||||||||||||||||||||
Year ended 10/31/15 | 11.38 | 0.10 | (0.17 | ) | (0.07 | ) | (0.07 | ) | (0.50 | ) | (0.57 | ) | 10.74 | (0.45 | ) | 1,799 | 1.86 | (e) | 1.86 | (e) | 0.94 | (e) | 63 | |||||||||||||||||||||||||||||||||
Year ended 10/31/14 | 11.47 | 0.13 | (0.06 | ) | 0.07 | (0.16 | ) | — | (0.16 | ) | 11.38 | 0.70 | 1,862 | 1.84 | 1.84 | 1.09 | 109 | |||||||||||||||||||||||||||||||||||||||
Year ended 10/31/13 | 9.88 | 0.10 | 1.65 | 1.75 | (0.16 | ) | — | (0.16 | ) | 11.47 | 17.87 | 2,016 | 1.90 | 1.90 | 0.95 | 25 | ||||||||||||||||||||||||||||||||||||||||
Year ended 10/31/12 | 10.01 | 0.15 | (0.03 | ) | 0.12 | (0.25 | ) | — | (0.25 | ) | 9.88 | 1.29 | 2,016 | 1.84 | 1.84 | 1.61 | 20 | |||||||||||||||||||||||||||||||||||||||
Year ended 10/31/11 | 10.95 | 0.27 | (1.11 | ) | (0.84 | ) | (0.10 | ) | — | (0.10 | ) | 10.01 | (7.76 | ) | 2,885 | 1.79 | 1.79 | 2.46 | 26 | |||||||||||||||||||||||||||||||||||||
Class Y | ||||||||||||||||||||||||||||||||||||||||||||||||||||||||
Year ended 10/31/15 | 11.56 | 0.16 | (0.17 | ) | (0.01 | ) | (0.13 | ) | (0.50 | ) | (0.63 | ) | 10.92 | 0.05 | 3,017 | 1.36 | (e) | 1.36 | (e) | 1.44 | (e) | 63 | ||||||||||||||||||||||||||||||||||
Year ended 10/31/14 | 11.65 | 0.19 | (0.06 | ) | 0.13 | (0.22 | ) | — | (0.22 | ) | 11.56 | 1.20 | 1,574 | 1.34 | 1.34 | 1.59 | 109 | |||||||||||||||||||||||||||||||||||||||
Year ended 10/31/13 | 10.03 | 0.16 | 1.67 | 1.83 | (0.21 | ) | — | (0.21 | ) | 11.65 | 18.53 | 1,284 | 1.40 | 1.40 | 1.45 | 25 | ||||||||||||||||||||||||||||||||||||||||
Year ended 10/31/12 | 10.18 | 0.21 | (0.05 | ) | 0.16 | (0.31 | ) | — | (0.31 | ) | 10.03 | 1.67 | 1,411 | 1.34 | 1.34 | 2.11 | 20 | |||||||||||||||||||||||||||||||||||||||
Year ended 10/31/11 | 11.14 | 0.33 | (1.12 | ) | (0.79 | ) | (0.17 | ) | — | (0.17 | ) | 10.18 | (7.23 | ) | 1,354 | 1.29 | 1.29 | 2.96 | 26 | |||||||||||||||||||||||||||||||||||||
Investor Class | ||||||||||||||||||||||||||||||||||||||||||||||||||||||||
Year ended 10/31/15 | 11.54 | 0.13 | (0.17 | ) | (0.04 | ) | (0.10 | ) | (0.50 | ) | (0.60 | ) | 10.90 | (0.19 | ) | 11,707 | 1.61 | (e) | 1.61 | (e) | 1.19 | (e) | 63 | |||||||||||||||||||||||||||||||||
Year ended 10/31/14 | 11.63 | 0.16 | (0.06 | ) | 0.10 | (0.19 | ) | — | (0.19 | ) | 11.54 | 0.94 | 12,821 | 1.59 | 1.59 | 1.34 | 109 | |||||||||||||||||||||||||||||||||||||||
Year ended 10/31/13 | 10.02 | 0.13 | 1.66 | 1.79 | (0.18 | ) | — | (0.18 | ) | 11.63 | 18.14 | 14,726 | 1.65 | 1.65 | 1.20 | 25 | ||||||||||||||||||||||||||||||||||||||||
Year ended 10/31/12 | 10.16 | 0.18 | (0.04 | ) | 0.14 | (0.28 | ) | — | (0.28 | ) | 10.02 | 1.48 | 14,181 | 1.59 | 1.59 | 1.86 | 20 | |||||||||||||||||||||||||||||||||||||||
Year ended 10/31/11 | 11.12 | 0.30 | (1.13 | ) | (0.83 | ) | (0.13 | ) | — | (0.13 | ) | 10.16 | (7.53 | ) | 16,009 | 1.54 | 1.54 | 2.71 | 26 | |||||||||||||||||||||||||||||||||||||
Class R5 | ||||||||||||||||||||||||||||||||||||||||||||||||||||||||
Year ended 10/31/15 | 11.35 | 0.19 | (0.17 | ) | 0.02 | (0.16 | ) | (0.50 | ) | (0.66 | ) | 10.71 | 0.37 | 2,830 | 1.03 | (e) | 1.03 | (e) | 1.77 | (e) | 63 | |||||||||||||||||||||||||||||||||||
Year ended 10/31/14 | 11.45 | 0.22 | (0.06 | ) | 0.16 | (0.26 | ) | — | (0.26 | ) | 11.35 | 1.51 | 3,127 | 1.01 | 1.01 | 1.92 | 109 | |||||||||||||||||||||||||||||||||||||||
Year ended 10/31/13 | 9.89 | 0.19 | 1.63 | 1.82 | (0.26 | ) | — | (0.26 | ) | 11.45 | 18.71 | 3,010 | 1.04 | 1.04 | 1.81 | 25 | ||||||||||||||||||||||||||||||||||||||||
Year ended 10/31/12 | 10.04 | 0.24 | (0.04 | ) | 0.20 | (0.35 | ) | — | (0.35 | ) | 9.89 | 2.15 | 7,656 | 0.90 | 0.90 | 2.55 | 20 | |||||||||||||||||||||||||||||||||||||||
Year ended 10/31/11 | 10.99 | 0.37 | (1.11 | ) | (0.74 | ) | (0.21 | ) | — | (0.21 | ) | 10.04 | (6.85 | ) | 208,295 | 0.91 | 0.91 | 3.34 | 26 | |||||||||||||||||||||||||||||||||||||
Class R6 | ||||||||||||||||||||||||||||||||||||||||||||||||||||||||
Year ended 10/31/15 | 11.35 | 0.20 | (0.17 | ) | 0.03 | (0.17 | ) | (0.50 | ) | (0.67 | ) | 10.71 | 0.38 | 50,857 | 1.02 | (e) | 1.02 | (e) | 1.78 | (e) | 63 | |||||||||||||||||||||||||||||||||||
Year ended 10/31/14 | 11.45 | 0.22 | (0.06 | ) | 0.16 | (0.26 | ) | — | (0.26 | ) | 11.35 | 1.52 | 56,760 | 1.00 | 1.00 | 1.93 | 109 | |||||||||||||||||||||||||||||||||||||||
Year ended 10/31/13 | 9.88 | 0.19 | 1.64 | 1.83 | (0.26 | ) | — | (0.26 | ) | 11.45 | 18.84 | 57,388 | 1.03 | 1.03 | 1.82 | 25 | ||||||||||||||||||||||||||||||||||||||||
Year ended 10/31/12(f) | 10.05 | 0.03 | (0.20 | ) | (0.17 | ) | — | — | — | 9.88 | (1.69 | ) | 203,831 | 0.87 | (g) | 0.87 | (g) | 2.58 | (g) | 20 | ||||||||||||||||||||||||||||||||||||
| (a) | Calculated using average shares outstanding. |
| (b) | Includes redemption fees added to shares of beneficial interest for Class A, Class B, Class C, Class R, Class Y, Investor Class and Class R5 shares, which were less than $0.005 per share for the fiscal years ended October 31, 2012 and prior. |
| (c) | Includes adjustments in accordance with accounting principles generally accepted in the United States of America and as such, the net asset value for financial reporting purposes and the returns based upon those net asset values may differ from the net asset value and returns for shareholder transactions. Does not include sales charges and is not annualized for periods less than one year, if applicable. |
| (d) | Portfolio turnover is calculated at the fund level and is not annualized for periods less than one year, if applicable. |
| (e) | Ratios are based on average daily net assets (000’s omitted) of $41,228, $1,279, $10,890, $1,815, $2,576, $12,438, $3,000 and $55,367 for Class A, Class B, Class C, Class R, Class Y, Investor Class, Class R5 and Class R6 shares, respectively. |
| (f) | Commencement date of September 24, 2012 for Class R6 shares. |
| (g) | Annualized. |
21 Invesco International Core Equity Fund
Report of Independent Registered Public Accounting Firm
To the Board of Trustees of AIM International Mutual Funds (Invesco International Mutual Funds)
and Shareholders of Invesco International Core Equity Fund:
In our opinion, the accompanying statement of assets and liabilities, including the schedule of investments, and the related statements of operations and of changes in net assets and the financial highlights present fairly, in all material respects, the financial position of Invesco International Core Equity Fund (one of the funds constituting AIM International Mutual Funds (Invesco International Mutual Funds), hereafter referred to as the “Fund”) at October 31, 2015, the results of its operations for the year then ended, the changes in its net assets for each of the two years in the period then ended and the financial highlights for each of the five years in the period then ended, in conformity with accounting principles generally accepted in the United States of America. These financial statements and financial highlights (hereafter referred to as “financial statements”) are the responsibility of the Fund’s management. Our responsibility is to express an opinion on these financial statements based on our audits. We conducted our audits of these financial statements in accordance with the standards of the Public Company Accounting Oversight Board (United States). Those standards require that we plan and perform the audit to obtain reasonable assurance about whether the financial statements are free of material misstatement. An audit includes examining, on a test basis, evidence supporting the amounts and disclosures in the financial statements, assessing the accounting principles used and significant estimates made by management, and evaluating the overall financial statement presentation. We believe that our audits, which included confirmation of securities at October 31, 2015 by correspondence with the custodian, provide a reasonable basis for our opinion.
PRICEWATERHOUSECOOPERS LLP
December 23, 2015
Houston, Texas
22 Invesco International Core Equity Fund
Calculating your ongoing Fund expenses
Example
As a shareholder of the Fund, you incur two types of costs: (1) transaction costs, which may include sales charges (loads) on purchase payments or contingent deferred sales charges on redemptions, if any; and (2) ongoing costs, including management fees, distribution and/or service (12b-1) fees, and other Fund expenses. This example is intended to help you understand your ongoing costs (in dollars) of investing in the Fund and to compare these costs with ongoing costs of investing in other mutual funds. The example is based on an investment of $1,000 invested at the beginning of the period and held for the entire period May 1, 2015 through October 31, 2015.
Actual expenses
The table below provides information about actual account values and actual expenses. You may use the information in this table, together with the amount you invested, to estimate the expenses that you paid over the period. Simply divide your account value by $1,000 (for example, an $8,600 account value divided by $1,000 = 8.6), then multiply the result by the number in the table under the heading entitled “Actual Expenses Paid During Period” to estimate the expenses you paid on your account during this period.
Hypothetical example for comparison purposes
The table below also provides information about hypothetical account values and hypothetical expenses based on the Fund’s actual expense ratio and an assumed rate of return of 5% per year before expenses, which is not the Fund’s actual return.
The hypothetical account values and expenses may not be used to estimate the actual ending account balance or expenses you paid for the period. You may use this information to compare the ongoing costs of investing in the Fund and other funds. To do so, compare this 5% hypothetical example with the 5% hypothetical examples that appear in the shareholder reports of the other funds.
Please note that the expenses shown in the table are meant to highlight your ongoing costs only and do not reflect any transaction costs, such as sales charges (loads) on purchase payments or contingent deferred sales charges on redemptions, if any. Therefore, the hypothetical information is useful in comparing ongoing costs only, and will not help you determine the relative total costs of owning different funds. In addition, if these transaction costs were included, your costs would have been higher.
| Class | Beginning Account Value (05/01/15) | ACTUAL | HYPOTHETICAL (5% annual return before | Annualized Expense Ratio | ||||||||||||||||||||
| Ending Account Value (10/31/15)1 | Expenses Paid During Period2 | Ending Account Value (10/31/15) | Expenses Paid During Period2 | |||||||||||||||||||||
| A | $ | 1,000.00 | $ | 942.90 | $ | 7.84 | $ | 1,017.14 | $ | 8.13 | 1.60 | % | ||||||||||||
| B | 1,000.00 | 938.80 | 11.48 | 1,013.36 | 11.93 | 2.35 | ||||||||||||||||||
| C | 1,000.00 | 939.70 | 11.49 | 1,013.36 | 11.93 | 2.35 | ||||||||||||||||||
| R | 1,000.00 | 942.10 | 9.06 | 1,015.88 | 9.40 | 1.85 | ||||||||||||||||||
| Y | 1,000.00 | 943.80 | 6.61 | 1,018.40 | 6.87 | 1.35 | ||||||||||||||||||
| Investor | 1,000.00 | 942.90 | 7.84 | 1,017.14 | 8.13 | 1.60 | ||||||||||||||||||
| R5 | 1,000.00 | 945.30 | 5.05 | 1,020.01 | 5.24 | 1.03 | ||||||||||||||||||
| R6 | 1,000.00 | 945.30 | 5.00 | 1,020.06 | 5.19 | 1.02 | ||||||||||||||||||
| 1 | The actual ending account value is based on the actual total return of the Fund for the period May 1, 2015 through October 31, 2015, after actual expenses and will differ from the hypothetical ending account value which is based on the Fund’s expense ratio and a hypothetical annual return of 5% before expenses. |
| 2 | Expenses are equal to the Fund’s annualized expense ratio as indicated above multiplied by the average account value over the period, multiplied by 184/365 to reflect the most recent fiscal half year. |
23 Invesco International Core Equity Fund
Approval of Investment Advisory and Sub-Advisory Contracts
The Board of Trustees (the Board) of AIM International Mutual Funds (Invesco International Mutual Funds) is required under the Investment Company Act of 1940, as amended, to approve annually the renewal of Invesco International Core Equity Fund’s (the Fund) investment advisory agreements. During contract renewal meetings held on June 9-10, 2015, the Board as a whole, and the disinterested or “independent” Trustees, who comprise over 75% of the Board, voting separately, approved the continuance for the Fund of the Master Investment Advisory Agreement with Invesco Advisers, Inc. (Invesco Advisers and the investment advisory agreement) and the Master Intergroup Sub-Advisory Contract for Mutual Funds with Invesco Asset Management Deutschland GmbH, Invesco Asset Management Limited, Invesco Asset Management (Japan) Limited, Invesco Hong Kong Limited, Invesco Senior Secured Management, Inc. and Invesco Canada Ltd. (collectively, the Affiliated Sub-Advisers and the sub-advisory contracts) for another year, effective July 1, 2015.
In evaluating the fairness and reasonableness of compensation under the Fund’s investment advisory agreement and sub-advisory contracts, the Board considered, among other things, the factors discussed below. The Board determined that continuation of the Fund’s investment advisory agreement and the sub-advisory contracts are in the best interest of the Fund and its shareholders and that the compensation payable to Invesco Advisers and the Affiliated Sub-Advisers under the agreements is fair and reasonable.
The Board’s Fund Evaluation Process
The Board’s Investments Committee has established three Sub-Committees, each of which is primarily responsible for overseeing the performance and investment management services provided by Invesco Advisers and the Affiliated Sub-Advisers to a number of the funds advised by Invesco Advisers (the Invesco Funds). The Sub-Committees meet throughout the year to review the performance of their assigned Invesco Funds, including reviewing materials prepared under the direction of the independent Senior Officer, an officer of the Invesco Funds who reports directly to the independent Trustees. Over the course of each year, the Sub-Committees meet with portfolio managers for their assigned Invesco Funds and other members of management to review the performance, investment objective(s), policies, strategies, limitations and investment risks of these funds. The Board had the benefit of reports from the Sub-Committees and Investments Committee throughout the year in considering approval of the continuance of each Invesco Fund’s investment advisory agreement and sub-advisory contracts for another year.
During the contract renewal process, the Board receives comparative performance and fee data regarding the Invesco Funds prepared by Invesco Advisers and Lipper Inc. (Lipper), an independent provider of investment company data. The Board also receives a report and this independent written evaluation from the Senior Officer. The Senior Officer’s evaluation is prepared as part of his responsibility to manage the process by which the Invesco Funds’ proposed management fees are negotiated during the annual contract renewal process to ensure they are negotiated in a manner that is at arms’ length and reasonable. In addition to meetings with Invesco Advisers and fund counsel, the independent Trustees also discuss the continuance of the investment advisory agreement and sub-advisory contracts in separate sessions with the Senior Officer and with independent legal counsel.
The Trustees recognized that the advisory fee rates for the Invesco Funds are, in many cases, the result of years of review and negotiation. The Trustees’ deliberations and conclusions in a particular year may be based in part on their deliberations and conclusions regarding these same arrangements throughout the year and in prior years. The Trustees’ review and conclusions are based on the comprehensive consideration of all information presented to them and are not the result of any single determinative factor. Moreover, one Trustee may have weighed a particular piece of information or factor differently than another Trustee.
The discussion below is a summary of the Senior Officer’s independent written evaluation with respect to the Fund’s investment advisory agreement as well as a discussion of the material factors and related conclusions that formed the basis for the Board’s approval of the Fund’s investment advisory agreement and sub-advisory contracts. Unless otherwise stated, this information is current as of June 10, 2015, and does not reflect consideration of factors that became known to the Board after that date.
Factors and Conclusions and Summary of Independent Written Fee Evaluation
| A. | Nature, Extent and Quality of Services Provided by Invesco Advisers and the Affiliated Sub-Advisers |
The Board reviewed the advisory services provided to the Fund by Invesco Advisers under the Fund’s investment advisory agreement, the performance of Invesco Advisers in providing these services, and the credentials and experience of the officers and employees of Invesco Advisers who provide these services, including the Fund’s portfolio manager or managers. The Board’s review of the qualifications of Invesco Advisers to provide advisory services included the Board’s
consideration of Invesco Advisers’ investment process oversight, independent credit analysis and investment risk management. The Board also considered non-advisory services that Invesco Advisers and its affiliates provide to the Invesco Funds such as various back office support functions, equity and fixed income trading operations, internal audit, distribution, valuation and legal and compliance.
In determining whether to continue the Fund’s investment advisory agreement, the Board considered the benefits of reapproving an existing relationship and the greater uncertainty that may be associated with entering into a new relationship. The Board concluded that the nature, extent and quality of the services provided to the Fund by Invesco Advisers are appropriate and satisfactory and consistent with the terms of the Fund’s investment advisory agreement.
The Board reviewed the services that may be provided by the Affiliated Sub-Advisers under the sub-advisory contracts and the credentials and experience of the officers and employees of the Affiliated Sub-Advisers who provide these services. The Board noted that the Affiliated Sub-Advisers have offices and personnel that are located in financial centers around the world. As a result, the Affiliated Sub-Advisers can provide research and investment analysis on the markets and economies of various countries in which the Fund may invest, make recommendations regarding securities and assist with security trades. The Board concluded that the sub-advisory contracts benefit the Fund and its shareholders by permitting Invesco Advisers to use the resources and talents of the Affiliated Sub-Advisers in managing the Fund. The Board concluded that the nature, extent and quality of the services that may be provided by the Affiliated Sub-Advisers are appropriate and satisfactory and consistent with the terms of the Fund’s sub-advisory contracts.
| B. | Fund Performance |
The Board considered Fund performance as a relevant factor in considering whether to approve the investment advisory agreement. The Board did not view Fund performance as a relevant factor in considering whether to approve the sub-advisory contracts for the Fund, as no Affiliated Sub-Adviser currently manages assets of the Fund.
The Board compared the Fund’s performance during the past one, three and five calendar years to the performance of funds in the Lipper performance universe and against the Lipper International Multi-Cap Core Funds Index. The Board noted that performance of Investor Class shares of the Fund was in the first quintile of its performance universe for the one year period, and in the fifth quintile for the three and five year periods (the first quintile being the best performing funds and the fifth quintile being the worst performing funds). The Board noted that
24 Invesco International Core Equity Fund
performance of Investor Class shares of the Fund was above the performance of the Index for the one period and below the performance of the Index for the three and five year periods. Invesco Advisers noted that changes to the portfolio management team had been made in February 2014. The Trustees also reviewed more recent Fund performance and this review did not change their conclusions.
| C. | Advisory and Sub-Advisory Fees |
The Board compared the Fund’s contractual management fee rate to the contractual management fee rates of funds in the Fund’s Lipper expense group at a common asset level. The Board noted that the contractual management fee rate for Investor Class shares of the Fund was below the median contractual management fee rate of funds in its expense group. The Board noted that the term “contractual management fee” may include both advisory and certain administrative services fees, but that Lipper does not provide information on a fund by fund basis as to what is included. The Board noted that Invesco Advisers does not charge the Invesco Funds for the administrative services included in the term as defined by Lipper. The Board also reviewed the methodology used by Lipper in providing expense group information, which includes using each fund’s contractual management fee schedule (including any applicable breakpoints) as reported in the most recent prospectus or statement of additional information for each fund in the expense group.
The Board also compared the Fund’s effective advisory fee rate (the advisory fee rate after advisory fee waivers and before other expense limitations/waivers) to the effective advisory fee rates of other funds advised by Invesco Advisers and its affiliates with investment strategies comparable to those of the Fund. The Board noted that Invesco Advisers and the Affiliated Sub-Advisers do not manage other funds with investment strategies comparable to those of the Fund.
The Board also considered the fees charged by Invesco Advisers and the Affiliated Sub-Advisers to other client accounts with investment strategies comparable to those of the Fund. The Board noted that Invesco Advisers or the Affiliated Sub-Advisers may charge lower fees to large institutional clients. Invesco Advisers reviewed with the Board the significantly greater scope of services it provides to the Invesco Funds relative to certain other types of client accounts. These additional services include provision of administrative services, officers and office space, oversight of service providers, preparation of annual registration statement updates and financial information and regulatory compliance under the Investment Company Act of 1940, as amended.
Invesco Advisers also reviewed generally the higher frequency of shareholder purchases and redemptions in the Invesco Funds relative to the flow of assets for other client accounts. Invesco Advisers advised the Board that advance notice
of redemptions is often provided to Invesco Advisers by institutional clients. The Board did note that sub-advisory fee rates charged by the Affiliated Sub-Advisers to manage the Invesco Funds and to manage other client accounts tended to be more comparable, reflecting a similar scope of services. The information received by the Board demonstrated that the aggregate services provided to the Invesco Funds were sufficiently different from those provided to institutional clients to support the difference in fees.
The Board also considered the services that may be provided by the Affiliated Sub-Advisers pursuant to the sub-advisory contracts, as well as the fees payable by Invesco Advisers to the Affiliated Sub-Advisers pursuant to the sub-advisory contracts. The Board also noted that the sub-advisory fees are not paid directly by the Fund, but rather, are payable by Invesco Advisers to the Affiliated Sub-Advisers.
| D. | Economies of Scale and Breakpoints |
The Board considered the extent to which there are economies of scale in the provision of advisory services to the Fund. The Board also considered whether the Fund benefits from economies of scale through contractual breakpoints in the Fund’s advisory fee schedule. The Board also noted that the Fund shares directly in economies of scale through lower fees charged by third party service providers based on the combined size of the Invesco Funds and other clients advised by Invesco Advisers.
| E. | Profitability and Financial Resources |
The Board reviewed information from Invesco Advisers concerning the costs of the advisory and other services that Invesco Advisers and its affiliates provide to the Fund and the Invesco Funds and the profitability of Invesco Advisers and its affiliates in providing these services. The Board received information from Invesco Advisers about the methodology used to prepare the profitability information. The Board noted that Invesco Advisers continues to operate at a net profit from services Invesco Advisers and its affiliates provide to the Invesco Funds and the Fund. The Board did not deem the level of profits realized by Invesco Advisers and its affiliates from providing services to the Fund to be excessive given the nature, quality and extent of the services provided. The Board received and accepted information from Invesco Advisers demonstrating that Invesco Advisers and each Affiliated Sub-Adviser are financially sound and have the resources necessary to perform their obligations under the investment advisory agreement and sub-advisory contracts.
| F. | Collateral Benefits to Invesco Advisers and its Affiliates |
The Board considered various other benefits received by Invesco Advisers and its affiliates from the relationship with the Fund, including the fees received for providing transfer agency and distribution services to the Fund. The Board considered comparative information regarding fees charged for these services, including information provided by Lipper and other
independent sources. The Board considered the performance of Invesco Advisers and its affiliates in providing these services and the organizational structure employed to provide these services. The Board also considered that these services are provided to the Fund pursuant to written contracts that are reviewed and approved on an annual basis by the Board; and that the services are required for the operation of the Fund.
The Board considered the benefits realized by Invesco Advisers and the Affiliated Sub-Advisers as a result of portfolio brokerage transactions executed through “soft dollar” arrangements. The Board noted that soft dollar arrangements shift the payment obligation for research services from Invesco Advisers and the Affiliated Sub-Advisers to the Invesco Funds and that the research received may be used with other clients of Invesco Advisers and may reduce Invesco Advisers’ and the Affiliated Sub-Advisers’ expenses. The Board also considered that it receives periodic reports from the Chief Compliance Officer of the Invesco Funds demonstrating that these arrangements are consistent with regulatory requirements. The Board did not deem the soft dollar arrangements to be inappropriate.
The Board considered that the Fund’s uninvested cash and cash collateral from any securities lending arrangements may be invested in money market funds advised by Invesco Advisers pursuant to procedures approved by the Board. The Board noted that Invesco Advisers receives advisory fees from these affiliated money market funds attributable to such investments, although Invesco Advisers has contractually agreed to waive through varying periods the advisory fees payable by the Invesco Funds with respect to investments in the affiliated money market funds. The waiver is in an amount equal to 100% of the net advisory fee Invesco Advisers receives from the affiliated money market funds with respect to the Fund’s investment in the affiliated money market funds of uninvested cash, but not cash collateral. The Board concluded that the amount of advisory fees received by Invesco Advisors from the Fund’s investment of cash collateral from any securities lending arrangements in the affiliated money market funds is fair and reasonable.
The Board also considered the Fund may use an affiliated broker to execute certain trades for the Fund to among other things, control information leakage, and were advised that such trades would be executed in compliance with rules under the Investment Company Act of 1940, as amended, and consistent with best execution obligations.
25 Invesco International Core Equity Fund
Tax Information
Form 1099-DIV, Form 1042-S and other year–end tax information provide shareholders with actual calendar year amounts that should be included in their tax returns. Shareholders should consult their tax advisors.
The following distribution information is being provided as required by the Internal Revenue Code or to meet a specific state’s requirement.
The Fund designates the following amounts or, if subsequently determined to be different, the maximum amount allowable for its fiscal year ended October 31, 2015:
Federal and State Income Tax | ||||
Long-Term Capital Gain Distributions | $ | 5,207,874 | ||
Qualified Dividend Income* | 100 | % | ||
Corporate Dividends Received Deduction* | 0.38 | % | ||
U.S. Treasury Obligations* | 0 | % | ||
Foreign Taxes | $ | 0.0304 | per share | |
Foreign Source Income | $ | 0.3398 | per share | |
| * | The above percentages are based on ordinary income dividends paid to shareholders during the Fund’s fiscal year. |
26 Invesco International Core Equity Fund
Trustees and Officers
The address of each trustee and officer is AIM International Mutual Funds (Invesco International Mutual Funds) (the “Trust”), 11 Greenway Plaza, Suite 1000, Houston, Texas 77046-1173. The trustees serve for the life of the Trust, subject to their earlier death, incapacitation, resignation, retirement or removal as more specifically provided in the Trust’s organizational documents. Each officer serves for a one year term or until their successors are elected and qualified. Column two below includes length of time served with predecessor entities, if any.
| Name, Year of Birth and Position(s) Held with the Trust | Trustee and/ or Officer Since | Principal Occupation(s) During Past 5 Years | Number of Funds in Fund Complex Overseen by Trustee | Other Directorship(s) Past 5 Years | ||||
| Interested Persons | ||||||||
Martin L. Flanagan1 — 1960 Trustee | 2007 | Executive Director, Chief Executive Officer and President, Invesco Ltd. (ultimate parent of Invesco and a global investment management firm); Advisor to the Board, Invesco Advisers, Inc. (formerly known as Invesco Institutional (N.A.), Inc.); Trustee, The Invesco Funds; Vice Chair, Investment Company Institute; and Member of Executive Board, SMU Cox School of Business
Formerly: Chairman and Chief Executive Officer, Invesco Advisers, Inc. (registered investment adviser); Director, Chairman, Chief Executive Officer and President, IVZ Inc. (holding company), INVESCO Group Services, Inc. (service provider) and Invesco North American Holdings, Inc. (holding company); Director, Chief Executive Officer and President, Invesco Holding Company Limited (parent of Invesco and a global investment management firm); Director, Invesco Ltd.; Chairman, Investment Company Institute and President, Co-Chief Executive Officer, Co-President, Chief Operating Officer and Chief Financial Officer, Franklin Resources, Inc. (global investment management organization). | 145 | None | ||||
Philip A. Taylor2 — 1954 Trustee, President and Principal Executive Officer | 2006 | Head of North American Retail and Senior Managing Director, Invesco Ltd.; Director, Co-Chairman, Co-President and Co-Chief Executive Officer, Invesco Advisers, Inc. (formerly known as Invesco Institutional (N.A.), Inc.) (registered investment adviser); Director, Chairman, Chief Executive Officer and President, Invesco Management Group, Inc. (formerly known as Invesco Aim Management Group, Inc.) (financial services holding company); Director and President, INVESCO Funds Group, Inc. (registered investment adviser and registered transfer agent); Director and Chairman, Invesco Investment Services, Inc. (formerly known as Invesco Aim Investment Services, Inc.) (registered transfer agent) and IVZ Distributors, Inc. (formerly known as INVESCO Distributors, Inc.) (registered broker dealer); Chief Executive Officer, Invesco Corporate Class Inc. (corporate mutual fund company) Director, Chairman and Chief Executive Officer, Invesco Canada Ltd. (formerly known as Invesco Trimark Ltd./Invesco Trimark Ltèe) (registered investment adviser and registered transfer agent); Trustee, President and Principal Executive Officer, The Invesco Funds (other than AIM Treasurer’s Series Trust (Invesco Treasurer’s Series Trust), Short-Term Investments Trust and Invesco Management Trust); Trustee and Executive Vice President, The Invesco Funds (AIM Treasurer’s Series Trust (Invesco Treasurer’s Series Trust), Short-Term Investments Trust and Invesco Management Trust only); Director, Invesco Investment Advisers LLC (formerly known as Van Kampen Asset Management); Director, Chief Executive Officer and President, Van Kampen Exchange Corp.
Formerly: Director, President and Chairman, Invesco Inc. (holding company), Invesco Canada Holdings Inc. (holding company), Trimark Investments Ltd./Placements Trimark Ltèe and Invesco Financial Services Ltd/Services Financiers Invesco Ltèe; Chiief Executive Officer, Invesco Canada Fund Inc (corporate mutual fund company); Director and Chairman, Van Kampen Investor Services Inc.; Director, Chief Executive Officer and President, 1371 Preferred Inc. (holding company) and Van Kampen Investments Inc.; Director and President, AIM GP Canada Inc. (general partner for limited partnerships) and Van Kampen Advisors, Inc.; Director and Chief Executive Officer, Invesco Trimark Dealer Inc. (registered broker dealer); Director, Invesco Distributors, Inc. (formerly known as Invesco Aim Distributors, Inc.) (registered broker dealer); Manager, Invesco PowerShares Capital Management LLC; Director, Chief Executive Officer and President, Invesco Advisers, Inc.; Director, Chairman, Chief Executive Officer and President, Invesco Aim Capital Management, Inc.; President, Invesco Trimark Dealer Inc. and Invesco Trimark Ltd./Invesco Trimark Ltèe; Director and President, AIM Trimark Corporate Class Inc. and AIM Trimark Canada Fund Inc.; Senior Managing Director, Invesco Holding Company Limited; Director and Chairman, Fund Management Company (former registered broker dealer); President and Principal Executive Officer, The Invesco Funds (AIM Treasurer’s Series Trust (Invesco Treasurer’s Series Trust), and Short-Term Investments Trust only); President, AIM Trimark Global Fund Inc. and AIM Trimark Canada Fund Inc.. | 145 | None |
| 1 | Mr. Flanagan is considered an interested person (within the meaning of Section 2(a)(19) of the 1940 Act) of the Trust because he is an officer of the Adviser to the Trust, and an officer and a director of Invesco Ltd., ultimate parent of the Adviser. |
| 2 | Mr. Taylor is considered an interested person (within the meaning of Section 2(a)(19) of the 1940 Act) of the Trust because he is an officer and a director of the Adviser. |
T-1 Invesco International Core Equity Fund
Trustees and Officers—(continued)
| Name, Year of Birth and Position(s) Held with the Trust | Trustee and/ or Officer Since | Principal Occupation(s) During Past 5 Years | Number of Funds in Fund Complex Overseen by Trustee | Other Directorship(s) Past 5 Years | ||||
| Independent Trustees | ||||||||
Bruce L. Crockett — 1944 Trustee and Chair | 2003 | Chairman, Crockett Technologies Associates (technology consulting company)
Formerly: Director, Captaris (unified messaging provider); Director, President and Chief Executive Officer, COMSAT Corporation; Chairman, Board of Governors of INTELSAT (international communications company); ACE Limited (insurance company); Independent Directors Council and Investment Company Institute | 145 | ALPS (Attorneys Liability Protection Society) (insurance company) and Globe Specialty Metals, Inc. (metallurgical company) | ||||
David C. Arch — 1945 Trustee | 2010 | Chairman of Blistex Inc., a consumer health care products manufacturer | 145 | Board member of the Illinois Manufacturers’ Association; Member of the Board of Visitors, Institute for the Humanities, University of Michigan; Member of the Audit Committee of the Edward-Elmhurst Hospital | ||||
James T. Bunch — 1942 Trustee | 2000 | Managing Member, Grumman Hill Group LLC (family office/private equity investments)
Formerly: Founder, Green Manning & Bunch Ltd. (investment banking firm) (1988-2010); Executive Committee, United States Golf Association; and Chairman, Board of Governors, Western Golf Association | 145 | Chairman of the Board of Trustees, Evans Scholars Foundation; and Chairman of the Board, Denver Film Society | ||||
Rodney F. Dammeyer — 1940 Trustee | 2010 | Chairman of CAC, LLC, (private company offering capital investment and management advisory services)
Formerly: Prior to 2001, Managing Partner at Equity Group Corporate Investments; Prior to 1995, Chief Executive Officer of Itel Corporation (formerly Anixter International); Prior to 1985, experience includes Senior Vice President and Chief Financial Officer of Household International, Inc., Executive Vice President and Chief Financial Officer of Northwest Industries, Inc. and Partner of Arthur Andersen & Co.; From 1987 to 2010, Director/Trustee of investment companies in the Van Kampen Funds complex | 145 | Director of Quidel Corporation and Stericycle, Inc. | ||||
Albert R. Dowden — 1941 Trustee | 2003 | Director of a number of public and private business corporations, including the Boss Group, Ltd. (private investment and management); Nature’s Sunshine Products, Inc. and Reich & Tang Funds (5 portfolios) (registered investment company)
Formerly: Director, Homeowners of America Holding Corporation/Homeowners of America Insurance Company (property casualty company); Director, Continental Energy Services, LLC (oil and gas pipeline service); Director, CompuDyne Corporation (provider of product and services to the public security market) and Director, Annuity and Life Re (Holdings), Ltd. (reinsurance company); Director, President and Chief Executive Officer, Volvo Group North America, Inc.; Senior Vice President, AB Volvo; Director of various public and private corporations; Chairman, DHJ Media, Inc.; Director, Magellan Insurance Company; and Director, The Hertz Corporation, Genmar Corporation (boat manufacturer), National Media Corporation; Advisory Board of Rotary Power International (designer, manufacturer, and seller of rotary power engines); and Chairman, Cortland Trust, Inc. (registered investment company) | 145 | Director of: Nature’s Sunshine Products, Inc., Reich & Tang Funds, Homeowners of America Holding Corporation/ Homeowners of America Insurance Company, the Boss Group | ||||
Jack M. Fields — 1952 Trustee | 2003 | Chief Executive Officer, Twenty First Century Group, Inc. (government affairs company); Owner and Chief Executive Officer, Dos Angeles Ranch, L.P. (cattle, hunting, corporate entertainment); and Discovery Global Education Fund (non-profit)
Formerly: Chief Executive Officer, Texana Timber LP (sustainable forestry company); Director of Cross Timbers Quail Research Ranch (non-profit); and member of the U.S. House of Representatives | 145 | Insperity, Inc. (formerly known as Administaff) | ||||
Prema Mathai-Davis — 1950 Trustee | 2003 | Retired. Formerly: Chief Executive Officer, YWCA of the U.S.A. | 145 | None | ||||
Larry Soll — 1942 Trustee | 1997 | Retired. Formerly: Chairman, Chief Executive Officer and President, Synergen Corp. (a biotechnology company) | 145 | None | ||||
Hugo F. Sonnenschein — 1940 Trustee | 2010 | President Emeritus and Honorary Trustee of the University of Chicago and the Adam Smith Distinguished Service Professor in the Department of Economics at the University of Chicago. Prior to 2000, President of the University of Chicago | 145 | Trustee of the University of Rochester and a member of its investment committee; Member of the National Academy of Sciences and the American Philosophical Society; Fellow of the American Academy of Arts and Sciences | ||||
Raymond Stickel, Jr. — 1944 Trustee | 2005 | Retired. Formerly: Director, Mainstay VP Series Funds, Inc. (25 portfolios) and Partner, Deloitte & Touche | 145 | None |
T-2 Invesco International Core Equity Fund
Trustees and Officers—(continued)
| Name, Year of Birth and Position(s) Held with the Trust | Trustee and/ or Officer Since | Principal Occupation(s) During Past 5 Years | Number of Funds in Fund Complex Overseen by Trustee | Other Directorship(s) Past 5 Years | ||||
| Independent Trustees—(continued) | ||||||||
Suzanne H. Woolsey — 1941 Trustee | 2014 | Chief Executive Officer of Woolsey Partners LLC | 145 | Emeritus Chair of the Board of Trustees of the Institute for Defense Analyses; Trustee of Colorado College; Trustee of California Institute of Technology; Prior to 2014, Director of Fluor Corp.; Prior to 2010, Trustee of the German Marshall Fund of the United States; Prior to 2010 Trustee of the Rocky Mountain Institute | ||||
| Other Officers | ||||||||
Russell C. Burk — 1958 Senior Vice President and Senior Officer | 2005 | Senior Vice President and Senior Officer, The Invesco Funds | N/A | N/A | ||||
John M. Zerr — 1962 Senior Vice President, Chief Legal Officer and Secretary | 2006 | Director, Senior Vice President, Secretary and General Counsel, Invesco Management Group, Inc. (formerly known as Invesco Aim Management Group, Inc.) and Van Kampen Exchange Corp.; Senior Vice President, Invesco Advisers, Inc. (formerly known as Invesco Institutional (N.A.), Inc.) (registered investment adviser); Senior Vice President and Secretary, Invesco Distributors, Inc. (formerly known as Invesco Aim Distributors, Inc.); Director, Vice President and Secretary, Invesco Investment Services, Inc. (formerly known as Invesco Aim Investment Services, Inc.) and IVZ Distributors, Inc. (formerly known as INVESCO Distributors, Inc.); Director and Vice President, INVESCO Funds Group, Inc.; Senior Vice President, Chief Legal Officer and Secretary, The Invesco Funds; Managing Director, Invesco PowerShares Capital Management LLC; Director, Secretary and General Counsel, Invesco Investment Advisers LLC (formerly known as Van Kampen Asset Management); Secretary and General Counsel, Invesco Capital Markets, Inc. (formerly known as Van Kampen Funds Inc.) and Chief Legal Officer, PowerShares Exchange-Traded Fund Trust, PowerShares Exchange-Traded Fund Trust II, PowerShares India Exchange-Traded Fund Trust, PowerShares Actively Managed Exchange-Traded Fund Trust, and PowerShares Actively Managed Exchange-Traded Commodity Fund Trust
Formerly: Director and Vice President, Van Kampen Advisors Inc.; Director, Vice President, Secretary and General Counsel, Van Kampen Investor Services Inc.; Director, Invesco Distributors, Inc. (formerly known as Invesco Aim Distributors, Inc.); Director, Senior Vice President, General Counsel and Secretary, Invesco Aim Advisers, Inc. and Van Kampen Investments Inc.; Director, Vice President and Secretary, Fund Management Company; Director, Senior Vice President, Secretary, General Counsel and Vice President, Invesco Aim Capital Management, Inc.; Chief Operating Officer and General Counsel, Liberty Ridge Capital, Inc. (an investment adviser); Vice President and Secretary, PBHG Funds (an investment company) and PBHG Insurance Series Fund (an investment company); Chief Operating Officer, General Counsel and Secretary, Old Mutual Investment Partners (a broker-dealer); General Counsel and Secretary, Old Mutual Fund Services (an administrator) and Old Mutual Shareholder Services (a shareholder servicing center); Executive Vice President, General Counsel and Secretary, Old Mutual Capital, Inc. (an investment adviser); and Vice President and Secretary, Old Mutual Advisors Funds (an investment company) | N/A | N/A | ||||
Sheri Morris — 1964 Vice President, Treasurer and Principal Financial Officer | 2003 | Vice President, Treasurer and Principal Financial Officer, The Invesco Funds; Vice President, Invesco Advisers, Inc. (formerly known as Invesco Institutional (N.A.), Inc.) (registered investment adviser); and Vice President, PowerShares Exchange-Traded Fund Trust, PowerShares Exchange-Traded Fund Trust II, PowerShares India Exchange-Traded Fund Trust, PowerShares Actively Managed Exchange-Traded Fund Trust, and PowerShares Actively Managed Exchange-Traded Commodity Fund Trust
Formerly: Vice President, Invesco Aim Advisers, Inc., Invesco Aim Capital Management, Inc. and Invesco Aim Private Asset Management, Inc.; Assistant Vice President and Assistant Treasurer, The Invesco Funds and Assistant Vice President, Invesco Advisers, Inc., Invesco Aim Capital Management, Inc. and Invesco Aim Private Asset Management, Inc.; and Treasurer, PowerShares Exchange-Traded Fund Trust, PowerShares Exchange-Traded Fund Trust II, PowerShares India Exchange-Traded Fund Trust and PowerShares Actively Managed Exchange-Traded Fund Trust | N/A | N/A | ||||
T-3 Invesco International Core Equity Fund
Trustees and Officers—(continued)
| Name, Year of Birth and Position(s) Held with the Trust | Trustee and/ or Officer Since | Principal Occupation(s) During Past 5 Years | Number of Funds in Fund Complex Overseen by Trustee | Other Directorship(s) Past 5 Years | ||||
| Other Officers—(continued) | ||||||||
Karen Dunn Kelley — 1960 Vice President | 2003 | Senior Managing Director, Investments, Invesco Ltd.; Director, Co-President, Co-Chief Executive Officer, and Co-Chairman, Invesco Advisers, Inc. (formerly known as Invesco Institutional (N.A.), Inc.) (registered investment adviser); Chairman, Invesco Senior Secured Management, Inc.; Senior Vice President, Invesco Management Group, Inc. (formerly known as Invesco Aim Management Group, Inc.); Executive Vice President, Invesco Distributors, Inc. (formerly known as Invesco Aim Distributors, Inc.); Director, Invesco Mortgage Capital Inc. and Invesco Management Company Limited; Vice President, The Invesco Funds (other than AIM Treasurer’s Series Trust (Invesco Treasurer’s Series Trust), Short-Term Investments Trust and Invesco Management Trust); and President and Principal Executive Officer, The Invesco Funds (AIM Treasurer’s Series Trust (Invesco Treasurer’s Series Trust), Short-Term Investments Trust and Invesco Management Trust only)
Formerly: Director and President, INVESCO Asset Management (Bermuda) Ltd., Director, INVESCO Global Asset Management Limited and INVESCO Management S.A.; Senior Vice President, Van Kampen Investments Inc. and Invesco Advisers, Inc. (formerly known as Invesco Institutional (N.A.), Inc.) (registered investment adviser); Vice President, Invesco Advisers, Inc. (formerly known as Invesco Institutional (N.A.), Inc.); Director of Cash Management and Senior Vice President, Invesco Advisers, Inc. and Invesco Aim Capital Management, Inc.; Director and President, Fund Management Company; Chief Cash Management Officer, Director of Cash Management, Senior Vice President, and Managing Director, Invesco Aim Capital Management, Inc.; Director of Cash Management, Senior Vice President, and Vice President, Invesco Advisers, Inc. and The Invesco Funds (AIM Treasurer’s Series Trust (Invesco Treasurer’s Series Trust), and Short-Term Investments Trust only) | N/A | N/A | ||||
Crissie M. Wisdom — 1969 Anti-Money Laundering Compliance Officer | 2013 | Anti-Money Laundering Compliance Officer, Invesco Advisers, Inc. (formerly known as Invesco Institutional (N.A.), Inc.) (registered investment adviser), Invesco Capital Markets, Inc. (formerly known as Van Kampen Funds Inc.), Invesco Distributors, Inc., Invesco Investment Services, Inc., Invesco Management Group, Inc., Van Kampen Exchange Corp., The Invesco Funds, and PowerShares Exchange-Traded Fund Trust, PowerShares Exchange-Traded Fund Trust II, PowerShares India Exchange-Traded Fund Trust, PowerShares Actively Managed Exchange-Traded Fund Trust and PowerShares Actively Managed Exchange-Traded Commodity Fund Trust; Anti-Money Laundering Compliance Officer and Bank Secrecy Act Officer, INVESCO National Trust Company and Invesco Trust Company; and Fraud Prevention Manager and Controls and Risk Analysis Manager for Invesco Investment Services, Inc.. | N/A | N/A | ||||
Lisa O. Brinkley — 1959 Chief Compliance Officer | 2015 | Senior Vice President and Chief Compliance Officer, Invesco Advisers, Inc. (registered investment adviser) (formerly known as Invesco Institutional (N.A., Inc.); and Chief Compliance Officer, The Invesco Funds
Formerly: Global Assurance Officer, Invesco Ltd. and Vice President, The Invesco Funds; Chief Compliance Officer, Invesco Distributors, Inc. (formerly known as Invesco Aim Distributors, Inc.), Invesco Investment Services, Inc. (formerly known as Invesco Aim Investment Services, Inc.) and Van Kampen Investor Services Inc.; Senior Vice President, Invesco Management Group, Inc.; Senior Vice President and Chief Compliance Officer, Invesco Advisers, Inc. and The Invesco Funds; Vice President and Chief Compliance Officer, Invesco Aim Capital Management, Inc. and Invesco Distributors, Inc.; Vice President, Invesco Investment Services, Inc. and Fund Management Company. | N/A | N/A |
The Statement of Additional Information of the Trust includes additional information about the Fund’s Trustees and is available upon request, without charge, by calling 1.800.959.4246. Please refer to the Fund’s prospectus for information on the Fund’s sub-advisers.
Office of the Fund 11 Greenway Plaza, Suite 1000 Houston, TX 77046-1173 | Investment Adviser Invesco Advisers, Inc. 1555 Peachtree Street, N.E. Atlanta, GA 30309 | Distributor Invesco Distributors, Inc. 11 Greenway Plaza, Suite 1000 Houston, TX 77046-1173 | Auditors PricewaterhouseCoopers LLP 1000 Louisiana Street, Suite 5800 Houston, TX 77002-5678 | |||
Counsel to the Fund Stradley Ronon Stevens & Young, LLP 2005 Market Street, Suite 2600 Philadelphia, PA 19103-7018 | Counsel to the Independent Trustees Goodwin Procter LLP 901 New York Avenue, N.W. Washington, D.C. 20001 | Transfer Agent Invesco Investment Services, Inc. 11 Greenway Plaza, Suite 1000 Houston, TX 77046-1173 | Custodian State Street Bank and Trust Company 225 Franklin Street Boston, MA 02110-2801 | |||
T-4 Invesco International Core Equity Fund

Invesco mailing information
Send general correspondence to Invesco Investment Services, Inc., P.O. Box 219078, Kansas City, MO 64121-9078.
Important notice regarding delivery of security holder documents
To reduce Fund expenses, only one copy of most shareholder documents may be mailed to shareholders with multiple accounts at the same address (Householding). Mailing of your shareholder documents may be householded indefinitely unless you instruct us otherwise. If you do not want the mailing of these documents to be combined with those for other members of your household, please contact Invesco Investment Services, Inc. at 800 959 4246 or contact your financial institution. We will begin sending you individual copies for each account within 30 days after receiving your request.
Fund holdings and proxy voting information
The Fund provides a complete list of its holdings four times in each fiscal year, at the quarter ends. For the second and fourth quarters, the lists appear in the Fund’s semiannual and annual reports to shareholders. For the first and third quarters, the Fund files the lists with the Securities and Exchange Commission (SEC) on Form N-Q. The most recent list of portfolio holdings is available at invesco.com/completeqtrholdings. Shareholders can also look up the Fund’s Forms N-Q on the SEC website at sec.gov. Copies of the Fund’s Forms N-Q may be reviewed and copied at the SEC Public Reference Room in Washington, D.C. You can obtain information on the operation of the Public Reference Room, including information about duplicating fee charges, by calling 202 551 8090 or 800 732 0330, or by electronic request at the following email address: publicinfo@sec.gov. The SEC file numbers for the Fund are shown below.
A description of the policies and procedures that the Fund uses to determine how to vote proxies relating to portfolio securities is available without charge, upon request, from our Client Services department at 800 959 4246 or at invesco.com/proxyguidelines. The information is also available on the SEC website, sec.gov.
Information regarding how the Fund voted proxies related to its portfolio securities during the most recent 12-month period ended June 30 is available at invesco.com/proxysearch. The information is also available on the SEC website, sec.gov. Invesco Advisers, Inc. is an investment adviser; it provides investment advisory services to individual and institutional clients and does not sell securities. Invesco Distributors, Inc. is the US distributor for Invesco Ltd.’s retail mutual funds, exchange-traded funds and institutional money market funds. Both are wholly owned, indirect subsidiaries of Invesco Ltd. |  |
| SEC file numbers: 811-06463 and 033-44611 | I-ICE-AR-1 | Invesco Distributors, Inc. |
| ||||||
 | Annual Report to Shareholders
| October 31, 2015 | ||||
| ||||||
Invesco International Growth Fund
| ||||||
| Nasdaq: | ||||||
A: AIIEX n B: AIEBX n C: AIECX n R: AIERX n Y: AIIYX n R5: AIEVX n R6: IGFRX | ||||||

Letters to Shareholders
Philip Taylor | Dear Shareholders: This annual report includes information about your Fund, including performance data and a complete list of its investments as of the close of the reporting period. Inside is a discussion of how your Fund was managed and the factors that affected its performance during the reporting period. I hope you find this report of interest. The US economy expanded and unemployment declined throughout the reporting period. Continuing low energy prices benefited consumers, but a strong US dollar crimped corporate profits. The US Federal Reserve signaled that it was increasingly likely to raise interest rates, based on generally positive economic data, but uncertainty remained about when it might act. Overseas, the story was much different. Low energy prices hurt the economies of some oil-producing nations, such as Brazil and Russia. During the reporting period, the European Central | |
Bank as well as central banks in China and Japan – among other countries – either instituted or maintained extraordinarily accommodative monetary policies in response to economic weakness. Investor uncertainty, such as we saw for much of the reporting period – and market volatility, such as we saw at the end of the reporting period – are unfortunate facts of life when it comes to investing. Some investors use these things as excuses to delay saving and investing for their long-term financial goals. That’s why Invesco encourages investors to work with a professional financial adviser who can stress the importance of starting to save and invest early and the importance of adhering to a disciplined investment plan – when times are good and when they’re uncertain. A financial adviser who knows your unique financial situation, investment goals and risk tolerance can be an invaluable partner as you seek to achieve your financial goals. He or she can offer a long-term perspective when markets are volatile and time-tested advice and guidance when your financial situation or investment goals change. | ||

Timely information when and where you want it
Invesco’s efforts to help investors achieve their financial objectives include providing individual investors and financial professionals with timely information about the markets, the economy and investing – whenever and wherever they want it.
Our website, invesco.com/us, offers a wide range of market insights and investment perspectives. On the website, you’ll find detailed information about our funds, including prices, performance, holdings and portfolio manager commentaries. You can access information about your account by completing a simple, secure online registration. Click on the “Need to register” link in the “Account Access” box on our homepage to get started.
Invesco’s mobile apps for iPhone® and iPad® (both available free from the App StoreSM) allow you to obtain the same detailed information, monitor your account and create customizable watch lists. Also, they allow you to access investment insights from our investment leaders, market strategists, economists and retirement experts. You can sign up to be alerted when new commentary is added, and you can watch portfolio manager videos and have instant access to Invesco news and updates wherever you may be.
In addition to the resources accessible on our website and through our mobile app, you can obtain timely updates to help you stay informed about the markets, the economy and investing by connecting with Invesco on Twitter, LinkedIn or Facebook. You can access our blog at blog.invesco.us.com. Our goal is to provide you the information you want, when and where you want it.
Have questions?
For questions about your account, feel free to contact an Invesco client services representative at 800 959 4246. For Invesco-related questions or comments, please email me directly at phil@invesco.com.
All of us at Invesco look forward to serving your investment management needs for many years to come. Thank you for investing with us.
Sincerely,

Philip Taylor
Senior Managing Director, Invesco Ltd.
iPhone and iPad are trademarks of Apple Inc., registered in the US and other countries. App Store is a service mark of Apple Inc. Invesco Distributors, Inc. is not affiliated with Apple Inc.
2 Invesco International Growth Fund
Bruce Crockett | Dear Fellow Shareholders: Among the many important lessons I’ve learned in more than 40 years in a variety of business endeavors is the value of a trusted advocate. As independent chair of the Invesco Funds Board, I can assure you that the members of the Board are strong advocates for the interests of investors in Invesco’s mutual funds. We work hard to represent your interests through oversight of the quality of the investment management services your funds receive and other matters important to your investment, including but not limited to: n Ensuring that Invesco offers a diverse lineup of mutual funds that your financial adviser can use to strive to meet your financial needs as your investment goals change over time. n Monitoring how the portfolio management teams of the Invesco funds are performing in light of changing economic and market conditions. |

| n | Assessing each portfolio management team’s investment performance within the context of the investment strategy described in the fund’s prospectus. |
| n | Monitoring for potential conflicts of interests that may impact the nature of the services that your funds receive. |
We believe one of the most important services we provide our fund shareholders is the annual review of the funds’ advisory and sub-advisory contracts with Invesco Advisers and its affiliates. This review is required by the Investment Company Act of 1940 and focuses on the nature and quality of the services Invesco provides as the adviser to the Invesco funds and the reasonableness of the fees that it charges for those services. Each year, we spend months carefully reviewing information received from Invesco and a variety of independent sources, such as performance and fee data prepared by Lipper Inc., an independent, third-party firm widely recognized as a leader in its field. We also meet with our independent legal counsel and other independent advisers to review and help us assess the information that we have received. Our goal is to assure that you receive quality investment management services for a reasonable fee.
I trust the measures outlined above provide assurance that you have a worthy advocate when it comes to choosing the Invesco Funds.
As always, please contact me at bruce@brucecrockett.com with any questions or concerns you may have. On behalf of the Board, we look forward to continuing to represent your interests and serving your needs.
Sincerely,

Bruce L. Crockett
Independent Chair
Invesco Funds Board of Trustees
3 Invesco International Growth Fund
Management’s Discussion of Fund Performance
Performance summary
For the fiscal year ended October 31, 2015, Class A shares of Invesco International Growth Fund (the Fund), at net asset value (NAV), underperformed the Custom Invesco International Growth Index, the Fund’s style-specific benchmark.
Your Fund’s long-term performance appears later in this report.
Fund vs. Indexes
Total returns, 10/31/14 to 10/31/15, at net asset value (NAV). Performance shown does not include applicable contingent deferred sales charges (CDSC) or front-end sales charges, which would have reduced performance.
Class A Shares | -2.19 | % | |||
Class B Shares | -2.93 | ||||
Class C Shares | -2.89 | ||||
Class R Shares | -2.42 | ||||
Class Y Shares | -1.96 | ||||
Class R5 Shares | -1.86 | ||||
Class R6 Shares | -1.77 | ||||
MSCI All Country World ex-U.S. Index▼ (Broad Market Index)* | -4.68 | ||||
| MSCI EAFE Index▼ (Former Broad Market Index)* | -0.07 | ||||
| Custom Invesco International Growth Index¢ (Style-Specific Index) | -0.81 | ||||
| Lipper International Large-Cap Growth Funds¿ (Peer Group Index)* | -1.09 | ||||
| Lipper International Multi-Cap Growth Funds Index¿ (Former Peer Group Index)* | -1.34 |
Source(s): ▼FactSet Research Systems Inc.; ¢Invesco, FactSet Research Systems Inc.; ¿Lipper Inc. * The Fund has elected to use the MSCI All Country World ex-U.S. Index to represent its broad market benchmark rather than the MSCI EAFE Index and the Lipper International Large-Cap Growth Funds Index to represent its peer group benchmark rather than the Lipper International Multi-Cap Growth Funds Index because the MSCI All Country World ex-U.S. Index and the Lipper International Large-Cap Growth Funds Index more closely reflect the performance of the types of securities in which the Fund invests. | |||||
Market conditions and your Fund
International markets experienced increased volatility during the fiscal year ended October 31, 2015, driven largely by the continued slowdown in energy markets and the economic downturn in China. Developed markets were generally able to withstand these headwinds, even as more fragile emerging markets began to falter.
As the reporting period began in late 2014, international equity markets moved higher, although economic growth appeared to be somewhat stronger in the US than in the rest of the world. Equity markets globally were
recovering from the initial crash of oil prices when OPEC added additional uncertainty by deciding to maintain high production despite low prices and slowing global growth. In this environment, commodity-based economies and most currencies underperformed those of the US.
Global markets were rattled again amid growing concerns that Greece and the eurozone would fail to reach an agreement on a financial bailout plan. However, those fears subsided when a bailout was ultimately approved. The eurozone also benefited from generally positive economic data, which helped markets weather subsequent economic volatility.
In the summer of 2015, fears of a potential economic slowdown in China dominated headlines. The combination of a slowing Chinese economy, a sharp sell-off in domestic Chinese equities and the devaluation of China’s currency, the renminbi, contributed to a strong correction in global equity markets. Emerging markets, in particular, were hard hit by events in China and by continued weak commodity prices – as well as by the US Federal Reserve’s decision to delay raising interest rates, which increased investor uncertainty and market volatility.
Fund holdings in the information technology, materials and consumer discretionary sectors outperformed those of the style-specific benchmark and were among the strongest contributors to the Fund’s relative performance. An overweight allocation to the strong-performing consumer discretionary sector was supportive from a relative perspective. The Fund’s holdings in the energy, financials and industrials sectors, however, underperformed those of the style-specific benchmark and were the most significant detractors from the Fund’s relative performance.
On a geographic basis, the Fund’s holdings in Germany, Australia and Singapore outperformed those of the Custom Invesco International Growth Index and were among the most significant contributors to Fund performance. Overweight exposure to the positively-performing UK market was also supportive. The Fund’s holdings in France, Brazil and Japan, however, underperformed those of the style-specific benchmark over the reporting period and were among the most significant detractors from relative results. The Fund’s underweight exposure to Japan dragged on relative returns, as well.
From an individual securities perspective, Sky was one of the most significant
| Portfolio Composition | ||||||
By sector
| % of total net assets | |||||
Consumer Discretionary | 23.8 | % | ||
| Financials | 17.8 | |||
| Information Technology | 15.4 | |||
| Consumer Staples | 11.1 | |||
| Industrials | 9.2 | |||
| Health Care | 8.9 | |||
| Energy | 3.9 | |||
| Materials | 3.0 | |||
Money Market Funds Plus Other Assets Less Liabilities | 6.9 |
| Top 10 Equity Holdings* | ||||
% of total net assets
| ||||
1. | Sky PLC | 3.5 | % | |||
2. | RELX PLC | 2.6 | ||||
3. | British American Tobacco PLC | 2.4 | ||||
4. | Teva Pharmaceutical Industries Ltd. - ADR | 2.4 | ||||
5. | WPP PLC | 2.3 | ||||
6. | Deutsche Boerse AG | 2.2 | ||||
7. | CCK Hutchison Holdings Ltd. | 2.2 | ||||
8. | CGI Group Inc. - Class A | 2.0 | ||||
9. | Samsung Electronics Co., Ltd. | 1.9 | ||||
10. | SAP S.E. | 1.8 |
Total Net Assets | $9.0 billion | ||||
| Total Number of Holdings* | 70 | ||||
The Fund’s holdings are subject to change, and there is no assurance that the Fund will continue to hold any particular security.
*Excluding money market fund holdings.
Data presented here are as of October 31, 2015.
| 4 Invesco International Growth Fund |
contributors to Fund performance during the fiscal year. Sky, a British-based, pan-European broadcasting company, reported solid results over the reporting period with revenues and margins beating consensus expectations. The company’s strong management team executed the company’s business plan well and the company’s cost discipline was clearly evident in its latest results. We believe the stock remained attractively valued given potential for good growth over the next three to five years.
As noted previously, the Fund’s financials sector exposure was a key area of absolute and relative weakness. The portfolio’s emerging market bank stocks, including Brazil-based Banco Bradesco and Thailand-based Kasikornbank, showed particular weakness. Banco Bradesco is one of the largest banking and financial services companies in Brazil. The bank was hurt by deterioration in credit quality, impacting profitability. Further concerns over additional deterioration led us to sell out of the company in the latter part of the reporting period.
As bottom-up investors, our primary focus is on finding high-quality growth companies that are trading at attractive valuations through a process we call earnings, quality and valuation (EQV). Macro and political movements are not our primary concern and do not drive our stock selection decisions.
Over the reporting period, we continued to look for opportunities to improve the growth potential and quality of the Fund’s portfolio by adding companies based on our EQV outlook for each company. The volatility displayed by the markets during the past year has created long-term opportunities for our shareholders. It’s rare to find a thriving business at a compelling valuation when everything is going right; those valuations typically occur when fear dominates the market. On a stock-by-stock basis, we saw the decline over the past year in broad global equities as a buying opportunity.
For example, the pullback in China allowed us to add a China-based beverage manufacturer, Kweichow Moutai, to the portfolio. Moutai is the premier brand in Chinese spirits and is an integral part of Chinese culture. The business was started during the Qing dynasty hundreds of years ago, and today, the company has a significant share of the high-end spirits market in China. The company has net cash on its books, has operating margin of approximately 70%1 and was trading at a significant discount to its own
history and to global peers. The sell-off in China local shares provided us with an opportunity to initiate a new position in this company.
Additional companies we purchased for the portfolio over the fiscal year included (but not limited to) British retail and commercial bank Lloyds Bank, Switzerland-based global luxury consumer goods holding company Cie Financière Richemont, Germany-based global courier company Deutsche Post, Swiss watch manufacturer The Swatch Group and Australian rail freight company Aurizon Holdings. We trimmed or sold some of the Fund’s holdings with EQV characteristics that were no longer as compelling as when we first initiated Fund positions in them, including Total, Dufry, Banco Bradesco, Encana, Hyundai Mobis and Keppel Corporation.
As always, regardless of the macroeconomic environment, we remain focused on a bottom-up investment approach of identifying attractive companies that fit our EQV-focused investment process. We continue to look for high-quality growth companies that exhibit the following characteristics: strong organic revenue growth; high returns on capital; pricing power; strong balance sheets; cash generation and reasonable valuations. In addition, we continue to favor companies that are able to consistently generate cash during weak economic environments. We believe that this balanced EQV-focused approach may help deliver attractive returns over the long term.
We thank you for your continued investment in Invesco International Growth Fund.
1 Source: Merrill Lynch
The views and opinions expressed in management’s discussion of Fund performance are those of Invesco Advisers, Inc. These views and opinions are subject to change at any time based on factors such as market and economic conditions. These views and opinions may not be relied upon as investment advice or recommendations, or as an offer for a particular security. The information is not a complete analysis of every aspect of any market, country, industry, security or the Fund. Statements of fact are from sources considered reliable, but Invesco Advisers, Inc. makes no representation or warranty as to their completeness or accuracy. Although historical performance is no guarantee of future results, these insights may help you understand our investment management philosophy.
See important Fund and, if applicable, index disclosures later in this report.
 | Clas Olsson Portfolio Manager and Chief Investment Officer of Invesco’s international growth investments team, is lead manager of | |
| Invesco International Growth Fund. He joined Invesco in 1994. Mr. Olsson became a commissioned officer at the Royal Swedish Naval Academy in 1988. He also earned a BBA from The University of Texas at Austin. | ||
 | Brent Bates Chartered Financial Analyst, Portfolio Manager, is manager of Invesco International Growth Fund. He joined | |
| Invesco in 1996. Mr. Bates earned a BBA from Texas A&M University and is a Certified Public Accountant. | ||
 | Matthew Dennis Chartered Financial Analyst, Portfolio Manager, is manager of Invesco International Growth Fund. He joined | |
| Invesco in 2000. Mr. Dennis earned a BA in economics from The University of Texas at Austin and an MS in finance from Texas A&M University. | ||
 | Mark Jason Chartered Financial Analyst, Portfolio Manager, is manager of Invesco International Growth Fund. He joined | |
Invesco in 2001. Mr. Jason earned a BS in finance and a BS in real estate from California State University, Northridge.
| ||
 | Richard Nield Chartered Financial Analyst, Portfolio Manager, is manager of Invesco International Growth Fund. He joined | |
| Invesco in 2000. Mr. Nield earned a Bachelor of Commerce degree in finance and international business from McGill University in Montreal. | ||
| 5 Invesco International Growth Fund |
Your Fund’s Long-Term Performance
Results of a $10,000 Investment – Oldest Share Class(es)
Fund and index data from 10/31/05
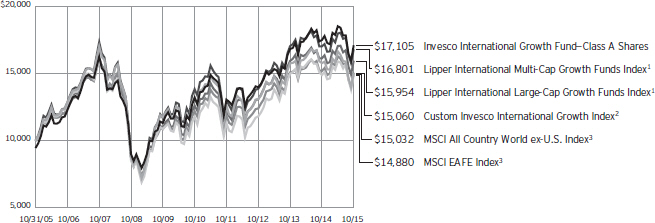
1 Source: Lipper Inc.
2 Source(s): Invesco, FactSet Research Systems Inc.
3 Source: FactSet Research Systems Inc.
Past performance cannot guarantee comparable future results.
During the reporting period, the Fund has elected to use the MSCI All Country World ex-U.S. Index to represent its broad market benchmark rather than the MSCI EAFE Index and the Lipper International Large-Cap Growth Funds Index to represent its peer group benchmark rather than the Lipper International Multi-Cap Growth Funds Index because the MSCI All Country World ex-U.S. Index and the Lipper International Large-Cap Growth Funds Index more closely reflect the performance of the types of securities in which the Fund invests. Because this is the first reporting period since we have
adopted the new indexes, SEC guidelines require that we compare performance to both the old and new indexes.
The data shown in the chart include reinvested distributions, applicable sales charges and Fund expenses including management fees. Index results include reinvested dividends, but they do not reflect sales charges. Performance of the peer group, if applicable, reflects fund expenses and management fees; performance of a market index does not. Performance shown in the chart and table(s) does not reflect deduction of taxes a shareholder would pay on Fund distributions or sale of Fund shares.
| 6 Invesco International Growth Fund |
Average Annual Total Returns As of 10/31/15, including maximum applicable | |||||
| Class A Shares | |||||
| Inception (4/7/92) | 7.37 | % | |||
| 10 Years | 5.51 | ||||
| 5 Years | 4.14 | ||||
| 1 Year | -7.56 | ||||
| Class B Shares | |||||
| Inception (9/15/94) | 6.05 | % | |||
| 10 Years | 5.48 | ||||
| 5 Years | 4.21 | ||||
| 1 Year | -7.57 | ||||
| Class C Shares | |||||
| Inception (8/4/97) | 4.35 | % | |||
| 10 Years | 5.33 | ||||
| 5 Years | 4.55 | ||||
| 1 Year | -3.82 | ||||
| Class R Shares | |||||
| Inception (6/3/02) | 7.00 | % | |||
| 10 Years | 5.85 | ||||
| 5 Years | 5.08 | ||||
| 1 Year | -2.42 | ||||
| Class Y Shares | |||||
| 10 Years | 6.31 | % | |||
| 5 Years | 5.59 | ||||
| 1 Year | -1.96 | ||||
| Class R5 Shares | |||||
| Inception (3/15/02) | 7.74 | % | |||
| 10 Years | 6.54 | ||||
| 5 Years | 5.72 | ||||
| 1 Year | -1.86 | ||||
| Class R6 Shares | |||||
| 10 Years | 6.25 | % | |||
| 5 Years | 5.61 | ||||
| 1 Year | -1.77 | ||||
Class Y shares incepted on October 3, 2008. Performance shown prior to that date is that of Class A shares and includes the 12b-1 fees applicable to Class A shares.
Class R6 shares incepted on September 24, 2012. Performance shown prior to that date is that of Class A shares and includes the 12b-1 fees applicable to Class A shares.
The performance data quoted represent past performance and cannot guarantee comparable future results; current performance may be lower or higher. Please visit invesco.com/performance for the most recent month-end performance. Performance figures reflect reinvested distributions, changes in net asset
| Average Annual Total Returns As of 9/30/15, the most recent calendar quarter | |||||
| Class A Shares | |||||
| Inception (4/7/92) | 7.09 | % | |||
| 10 Years | 4.46 | ||||
| 5 Years | 3.58 | ||||
| 1 Year | -13.14 | ||||
| Class B Shares | |||||
| Inception (9/15/94) | 5.73 | % | |||
| 10 Years | 4.42 | ||||
| 5 Years | 3.63 | ||||
| 1 Year | -13.14 | ||||
| Class C Shares | |||||
| Inception (8/4/97) | 3.98 | % | |||
| 10 Years | 4.26 | ||||
| 5 Years | 3.98 | ||||
| 1 Year | -9.65 | ||||
| Class R Shares | |||||
| Inception (6/3/02) | 6.50 | % | |||
| 10 Years | 4.79 | ||||
| 5 Years | 4.51 | ||||
| 1 Year | -8.31 | ||||
| Class Y Shares | |||||
| 10 Years | 5.24 | % | |||
| 5 Years | 5.03 | ||||
| 1 Year | -7.85 | ||||
| Class R5 Shares | |||||
| Inception (3/15/02) | 7.25 | % | |||
| 10 Years | 5.48 | ||||
| 5 Years | 5.14 | ||||
| 1 Year | -7.80 | ||||
| Class R6 Shares | |||||
| 10 Years | 5.18 | % | |||
| 5 Years | 5.03 | ||||
| 1 Year | -7.69 | ||||
value and the effect of the maximum sales charge unless otherwise stated. Investment return and principal value will fluctuate so that you may have a gain or loss when you sell shares.
The net annual Fund operating expense ratio set forth in the most recent Fund prospectus as of the date of this report for Class A, Class B, Class C, Class R, Class Y, Class R5 and Class R6 shares was 1.33%, 2.08%, 2.08%, 1.58%, 1.08%, 0.98% and 0.91%, respectively.1 The total annual Fund operating expense ratio set forth in the most recent Fund prospectus as of the date of this report for Class A, Class B, Class C, Class R, Class Y, Class R5 and Class R6 shares was 1.34%, 2.09%, 2.09%, 1.59%, 1.09%, 0.99% and 0.92%, respectively. The
expense ratios presented above may vary from the expense ratios presented in other sections of this report that are based on expenses incurred during the period covered by this report.
Class A share performance reflects the maximum 5.50% sales charge, and Class B and Class C share performance reflects the applicable contingent deferred sales charge (CDSC) for the period involved. The CDSC on Class B shares declines from 5% beginning at the time of purchase to 0% at the beginning of the seventh year. The CDSC on Class C shares is 1% for the first year after purchase. Class R, Class Y, Class R5 and Class R6 shares do not have a front-end sales charge or a CDSC; therefore, performance is at net asset value.
The performance of the Fund’s share classes will differ primarily due to different sales charge structures and class expenses.
Fund performance reflects any applicable fee waivers and/or expense reimbursements. Had the adviser not waived fees and/or reimbursed expenses currently or in the past, returns would have been lower. See current prospectus for more information.
| 1 | Total annual Fund operating expenses after any contractual fee waivers and/or expense reimbursements by the adviser in effect through at least June 30, 2017. See current prospectus for more information. |
| 7 Invesco International Growth Fund |
Invesco International Growth Fund’s investment objective is long-term growth of capital.
| n | Unless otherwise stated, information presented in this report is as of October 31, 2015, and is based on total net assets. |
| n | Unless otherwise noted, all data provided by Invesco. |
| n | To access your Fund’s reports/prospectus, visit invesco.com/fundreports. |
About share classes
| n | Class B shares may not be purchased for new or additional investments. Please see the prospectus for more information. |
| n | Class R shares are generally available only to employer sponsored retirement and benefit plans. Please see the prospectus for more information. |
| n | Class Y shares are available only to certain investors. Please see the prospectus for more information. |
| n | Class R5 shares and Class R6 shares are primarily intended for employer sponsored retirement and benefit plans that meet certain standards and for institutional investors. Please see the prospectus for more information. |
Principal risks of investing
in the Fund
| n | Depositary receipts risk. Depositary receipts involve many of the same risks as those associated with direct investment in foreign securities. In addition, the underlying issuers of certain depositary receipts, particularly unsponsored or unregistered depositary receipts, are under no obligation to distribute shareholder communications to the holders of such receipts or to pass through to them any voting rights with respect to the deposited securities. |
| n | Derivatives risk. The value of a derivative instrument depends largely on (and is derived from) the value of an underlying security, currency, commodity, interest rate, index or other asset (each referred to as an underlying asset). In addition to risks relating to the underlying assets, the use of derivatives may include other, possibly greater, risks, including counterparty, leverage and liquidity risks. Counterparty risk is the risk that the counterparty to the derivative contract will default on its obligation to pay the Fund the amount owed or otherwise perform under the derivative contract. Derivatives create leverage risk because they do not require payment up front equal |
to the economic exposure created by owning the derivative. As a result, an adverse change in the value of the underlying asset could result in the Fund sustaining a loss that is substantially greater than the amount invested in the derivative, which may make the Fund’s returns more volatile and increase the risk of loss. Derivative instruments may also be less liquid than more traditional investments and the Fund may be unable to sell or close out its derivative positions at a desirable time or price. This risk may be more acute under adverse market conditions, during which the Fund may be most in need of liquidating its derivative positions. Derivatives may also be harder to value, less tax efficient and subject to changing government regulation that could impact the Fund’s ability to use certain derivatives or their cost. Also, derivatives used for hedging or to gain or limit exposure to a particular market segment may not provide the expected benefits, particularly during adverse market conditions. |
| n | Developing/emerging markets securities risk. The prices of securities issued by foreign companies and governments located in developing/emerging markets countries may be affected more negatively by inflation, devaluation of their currencies, higher transaction costs, delays in settlement, adverse political developments, the introduction of capital controls, withholding taxes, nationalization of private assets, expropriation, social unrest, war or lack of timely information than those in developed countries. |
| n | Foreign securities risk. The Fund’s foreign investments may be affected by changes in a foreign country’s exchange rates, political and social instability, changes in economic or taxation policies, difficulties when enforcing obligations, decreased liquidity, and increased volatility. Foreign companies may be subject to less regulation resulting in less publicly available information about the companies. |
| n | Geographic focus risk. From time to time the Fund may invest a substantial amount of its assets in securities of issuers located in a single country or a limited number of countries. If the Fund focuses its investments in this manner, it assumes the risk that economic, political and social conditions in those countries will have a significant impact on its investment performance. The Fund’s investment performance may also be more volatile if it focuses its investments in certain countries, especially emerging markets countries. |
| n | Growth investing risk. Growth stocks tend to be more expensive relative to their earnings or assets compared with other types of stock. As a result they tend to be more sensitive to changes in their earnings and can be more volatile. |
| n | Investing in the European Union risk. Many countries in the European Union are susceptible to high economic risks associated with high levels of debt, notably due to investments in sovereign debts of European countries such as Greece, Italy and Spain. One or more member states might exit the European Union, placing its currency and banking system in jeopardy. The European Union faces major issues involving its membership, structure, procedures and policies, including the adoption, abandonment or adjustment of the new constitutional treaty, the European Union’s enlargement to the south and east, and resolution of the European Union’s problematic fiscal and democratic accountability. Efforts of the member states to further unify their economic and monetary policies may increase the potential for the downward movement of one member state’s market to cause a similar effect on other member states’ markets. European countries that are part of the European Economic and Monetary Union may be significantly affected by the tight fiscal and monetary controls that the union seeks to impose on its members. |
| n | Management risk. The investment techniques and risk analysis used by the Fund’s portfolio managers may not produce the desired results. |
This report must be accompanied or preceded by a currently effective Fund prospectus, which contains more complete information, including sales charges and expenses. Investors should read it carefully before investing.
|
|
| NOT FDIC INSURED | MAY LOSE VALUE | NO BANK GUARANTEE |
| 8 Invesco International Growth Fund |
| n | Market risk. The prices of and the income generated by the Fund’s securities may decline in response to, among other things, investor sentiment, general economic and market conditions, regional or global instability, and currency and interest rate fluctuations. |
| n | Mid-capitalization risk. Stocks of mid-sized companies tend to be more vulnerable to adverse developments and may have little or no operating history or track record of success, and limited product lines, markets, management and financial resources. The securities of mid-sized companies may be more volatile due to less market interest and less publicly available information about the issuer. They also may be illiquid or restricted as to resale, or may trade less frequently and in smaller volumes, all of which may cause difficulty when establishing or closing a position at a desirable price. |
| n | Preferred securities risk. Preferred securities may include provisions that permit the issuer, in its discretion, to defer or omit distributions for a certain period of time. If the Fund owns a security that is deferring or omitting its distributions, the Fund may be required to report the distribution on its tax returns, even though it may not have received this income. Further, preferred securities may lose substantial value due to the omission or deferment of dividend payments. |
About indexes used in this report
| n | The MSCI All Country World ex-U.S. Index is an index considered representative of developed and emerging stock markets, excluding the US. The index is computed using the net return, which withholds applicable taxes for non-resident investors. |
| n | The MSCI EAFE® Index is an unmanaged index considered representative of stocks of Europe, Australasia and the Far East. The index is computed using the net return, which withholds applicable taxes for non-resident investors. |
| n | The Custom Invesco International Growth Index is composed of the MSCI EAFE Growth Index through February 28, 2013, and the MSCI All Country World ex-U.S. Growth Index thereafter. Both MSCI indexes are computed using the net return, which withholds applicable taxes for non-resident investors. |
| n | The Lipper International Large-Cap Growth Funds Index is an unmanaged index considered representative of international large-cap growth funds tracked by Lipper. |
| n | The Lipper International Multi-Cap Growth Funds Index is an unmanaged index considered representative of international multi-cap growth funds tracked by Lipper. |
| n | The Fund is not managed to track the performance of any particular index, including the index(es) described here, and consequently, the performance of the Fund may deviate significantly from the performance of the index(es). |
| n | A direct investment cannot be made in an index. Unless otherwise indicated, index results include reinvested dividends, and they do not reflect sales charges. Performance of the peer group, if applicable, reflects fund expenses; performance of a market index does not. |
Other information
| n | CPA® and Certified Public Accountant® are trademarks owned by the American Institute of Certified Public Accountants. |
| n | The returns shown in management’s discussion of Fund performance are based on net asset values (NAVs) calculated for shareholder transactions. Generally accepted accounting principles require adjustments to be made to the net assets of the Fund at period end for financial reporting purposes, and as such, the NAVs for shareholder transactions and the returns based on those NAVs may differ from the NAVs and returns reported in the Financial Highlights. |
| n | Industry classifications used in this report are generally according to the Global Industry Classification Standard, which was developed by and is the exclusive property and a service mark of MSCI Inc. and Standard & Poor’s. |
9 Invesco International Growth Fund
Schedule of Investments
October 31, 2015
| Shares | Value | |||||||
Common Stocks & Other Equity Interests–93.10% |
| |||||||
| Australia–4.21% | ||||||||
Amcor Ltd. | 14,954,320 | $ | 144,692,411 | |||||
Aurizon Holdings Ltd. | 26,236,827 | 96,728,019 | ||||||
Brambles Ltd. | 8,927,625 | 66,082,084 | ||||||
CSL Ltd. | 1,076,753 | 71,512,279 | ||||||
| 379,014,793 | ||||||||
| Belgium–1.23% | ||||||||
Anheuser-Busch InBev SA/NV | 928,276 | 110,715,243 | ||||||
| Brazil–1.75% | ||||||||
BM&FBOVESPA S.A. | 35,632,602 | 105,383,610 | ||||||
BRF S.A. | 3,343,900 | 52,137,288 | ||||||
| 157,520,898 | ||||||||
| Canada–7.18% | ||||||||
Canadian National Railway Co. | 1,262,007 | 77,079,222 | ||||||
Cenovus Energy Inc. | 4,846,443 | 72,194,471 | ||||||
CGI Group Inc.–Class A(a) | 4,875,213 | 181,072,949 | ||||||
Fairfax Financial Holdings Ltd. | 196,057 | 96,539,744 | ||||||
Great-West Lifeco Inc. | 2,491,601 | 66,038,763 | ||||||
Suncor Energy, Inc. | 5,155,203 | 153,390,647 | ||||||
| 646,315,796 | ||||||||
| China–4.65% | ||||||||
Baidu, Inc.–ADR(a) | 671,673 | 125,918,537 | ||||||
Great Wall Motor Co. Ltd.–Class H | 69,298,500 | 84,009,150 | ||||||
Industrial & Commercial Bank of China Ltd.–Class H | 110,972,461 | 70,418,405 | ||||||
Kweichow Moutai Co., Ltd.–Class A | 4,098,001 | 138,314,588 | ||||||
| 418,660,680 | ||||||||
| Denmark–2.50% | ||||||||
Carlsberg AS–Class B | 1,659,602 | 135,792,448 | ||||||
Novo Nordisk A/S–Class B | 1,678,522 | 88,924,718 | ||||||
| 224,717,166 | ||||||||
| France–3.16% | ||||||||
Publicis Groupe S.A. | 2,474,051 | 160,685,362 | ||||||
Schneider Electric S.E. | 2,047,805 | 123,827,954 | ||||||
| 284,513,316 | ||||||||
| Germany–8.36% | ||||||||
adidas AG | 222,604 | 19,963,246 | ||||||
Allianz S.E. | 804,910 | 141,050,171 | ||||||
Deutsche Boerse AG | 2,167,261 | 199,604,467 | ||||||
Deutsche Post AG | 2,839,899 | 84,540,610 | ||||||
ProSiebenSat.1 Media SE | 2,659,305 | 143,853,091 | ||||||
SAP S.E. | 2,065,636 | 163,281,164 | ||||||
| 752,292,749 | ||||||||
| Hong Kong–3.26% | ||||||||
CK Hutchison Holdings Ltd. | 14,246,323 | 194,615,242 | ||||||
| Shares | Value | |||||||
| Hong Kong–(continued) | ||||||||
Galaxy Entertainment Group Ltd. | 29,034,090 | $ | 98,796,419 | |||||
| 293,411,661 | ||||||||
| Israel–2.41% | ||||||||
Teva Pharmaceutical Industries Ltd.–ADR | 3,659,564 | 216,609,593 | ||||||
| Japan–7.45% | ||||||||
Denso Corp. | 928,147 | 42,970,005 | ||||||
FANUC Corp. | 419,012 | 73,736,852 | ||||||
Japan Tobacco, Inc. | 4,691,300 | 162,070,764 | ||||||
Keyence Corp. | 113,127 | 58,715,268 | ||||||
Komatsu Ltd. | 4,168,728 | 68,821,569 | ||||||
Toyota Motor Corp. | 1,812,030 | 110,951,636 | ||||||
Yahoo Japan Corp. | 36,318,400 | 153,589,140 | ||||||
| 670,855,234 | ||||||||
| Mexico–2.03% | ||||||||
Fomento Economico Mexicano, S.A.B. de C.V.–ADR | 681,278 | 67,507,837 | ||||||
Grupo Televisa S.A.B.–ADR | 3,945,641 | 114,975,979 | ||||||
| 182,483,816 | ||||||||
| Singapore–3.21% | ||||||||
Avago Technologies Ltd. | 1,292,454 | 159,139,861 | ||||||
United Overseas Bank Ltd. | 8,914,466 | 129,367,616 | ||||||
| 288,507,477 | ||||||||
| South Korea–1.87% | ||||||||
Samsung Electronics Co., Ltd. | 140,429 | 168,147,239 | ||||||
| Spain–1.14% | ||||||||
Amadeus IT Holding S.A.–Class A | 2,405,694 | 102,371,593 | ||||||
| Sweden–4.20% | ||||||||
Getinge AB–Class B | 3,259,043 | 81,361,408 | ||||||
Investor AB–Class B | 3,800,211 | 140,703,598 | ||||||
Sandvik AB | 4,503,530 | 42,124,048 | ||||||
Telefonaktiebolaget LM Ericsson–Class B | 11,700,345 | 113,787,750 | ||||||
| 377,976,804 | ||||||||
| Switzerland–8.47% | ||||||||
Cie Financiere Richemont S.A. | 872,812 | 74,664,584 | ||||||
Julius Baer Group Ltd. | 2,500,954 | 123,942,078 | ||||||
Novartis AG | 701,720 | 63,631,808 | ||||||
Roche Holding AG | 582,341 | 157,758,032 | ||||||
Swatch Group AG (The) | 163,512 | 63,844,403 | ||||||
Syngenta AG | 375,579 | 126,191,650 | ||||||
UBS Group AG | 7,616,404 | 152,030,340 | ||||||
| 762,062,895 | ||||||||
See accompanying Notes to Financial Statements which are an integral part of the financial statements.
10 Invesco International Growth Fund
| Shares | Value | |||||||
| Taiwan–1.77% | ||||||||
Taiwan Semiconductor Manufacturing Co. Ltd. | 37,816,887 | $ | 159,190,725 | |||||
| Thailand–1.27% | ||||||||
Kasikornbank PCL–NVDR | 23,602,600 | 113,944,018 | ||||||
| Turkey–0.88% | ||||||||
Akbank T.A.S. | 30,754,354 | 79,006,075 | ||||||
| United Kingdom–22.10% | ||||||||
Aberdeen Asset Management PLC | 15,525,003 | 82,840,617 | ||||||
British American Tobacco PLC | 3,690,883 | 219,101,949 | ||||||
Compass Group PLC | 8,803,204 | 151,663,739 | ||||||
Informa PLC | 9,216,889 | 80,535,885 | ||||||
Kingfisher PLC | 25,056,242 | 136,194,557 | ||||||
Lloyds Banking Group PLC | 89,816,660 | 101,925,704 | ||||||
Next PLC | 796,017 | 97,983,527 | ||||||
RELX PLC | 13,138,441 | 234,881,325 | ||||||
Royal Dutch Shell PLC–Class B | 4,778,798 | 124,838,689 | ||||||
Sky PLC | 18,835,314 | 317,644,029 | ||||||
| Shares | Value | |||||||
| United Kingdom–(continued) | ||||||||
Smith & Nephew PLC | 7,169,592 | $ | 122,378,043 | |||||
Unilever N.V. | 2,466,601 | 111,186,406 | ||||||
WPP PLC | 9,233,804 | 206,981,486 | ||||||
| 1,988,155,956 | ||||||||
Total Common Stocks & Other Equity Interests |
| 8,376,473,727 | ||||||
Money Market Funds–6.34% |
| |||||||
Liquid Assets Portfolio–Institutional Class, 0.16%(b) | 285,164,967 | 285,164,967 | ||||||
Premier Portfolio–Institutional Class, 0.12%(b) | 285,164,968 | 285,164,968 | ||||||
Total Money Market Funds |
| 570,329,935 | ||||||
TOTAL INVESTMENTS–99.44% |
| 8,946,803,662 | ||||||
OTHER ASSETS LESS LIABILITIES–0.56% |
| 50,898,749 | ||||||
NET ASSETS–100.00% |
| $ | 8,997,702,411 | |||||
Investment Abbreviations:
| ADR | – American Depositary Receipt | |
| NVDR | – Non-Voting Depositary Receipt |
Notes to Schedule of Investments:
| (a) | Non-income producing security. |
| (b) | The money market fund and the Fund are affiliated by having the same investment adviser. The rate shown is the 7-day SEC standardized yield as of October 31, 2015. |
See accompanying Notes to Financial Statements which are an integral part of the financial statements.
11 Invesco International Growth Fund
Statement of Assets and Liabilities
October 31, 2015
Assets: |
| |||
Investments, at value (Cost $6,868,466,240) | $ | 8,376,473,727 | ||
Investments in affiliated money market funds, at value and cost | 570,329,935 | |||
Total investments, at value (Cost $7,438,796,175) | 8,946,803,662 | |||
Foreign currencies, at value (Cost $1,695,829) | 1,688,598 | |||
Receivable for: | ||||
Investments sold | 37,019,513 | |||
Fund shares sold | 12,201,890 | |||
Dividends | 23,560,974 | |||
Investment for trustee deferred compensation and retirement plans | 729,989 | |||
Other assets | 102,995 | |||
Total assets | 9,022,107,621 | |||
Liabilities: |
| |||
Payable for: | ||||
Investments purchased | 10,131,015 | |||
Fund shares reacquired | 9,223,636 | |||
Accrued foreign taxes | 80,137 | |||
Accrued fees to affiliates | 3,370,845 | |||
Accrued trustees’ and officers’ fees and benefits | 9,820 | |||
Accrued other operating expenses | 745,498 | |||
Trustee deferred compensation and retirement plans | 844,259 | |||
Total liabilities | 24,405,210 | |||
Net assets applicable to shares outstanding | $ | 8,997,702,411 | ||
Net assets consist of: |
| |||
Shares of beneficial interest | $ | 7,519,396,131 | ||
Undistributed net investment income | 76,519,765 | |||
Undistributed net realized gain (loss) | (105,751,817 | ) | ||
Net unrealized appreciation | 1,507,538,332 | |||
| $ | 8,997,702,411 | |||
Net Assets: |
| |||
Class A | $ | 2,725,648,518 | ||
Class B | $ | 16,818,323 | ||
Class C | $ | 198,691,518 | ||
Class R | $ | 116,738,217 | ||
Class Y | $ | 3,449,499,237 | ||
Class R5 | $ | 1,721,004,170 | ||
Class R6 | $ | 769,302,428 | ||
Shares outstanding, $0.001 par value per share, with an unlimited number of shares authorized: |
| |||
Class A | 85,409,643 | |||
Class B | 575,541 | |||
Class C | 6,791,946 | |||
Class R | 3,706,564 | |||
Class Y | 107,649,710 | |||
Class R5 | 53,004,920 | |||
Class R6 | 23,688,340 | |||
Class A: | ||||
Net asset value per share | $ | 31.91 | ||
Maximum offering price per share | ||||
(Net asset value of $31.91 ¸ 94.50%) | $ | 33.77 | ||
Class B: | ||||
Net asset value and offering price per share | $ | 29.22 | ||
Class C: | ||||
Net asset value and offering price per share | $ | 29.25 | ||
Class R: | ||||
Net asset value and offering price per share | $ | 31.49 | ||
Class Y: | ||||
Net asset value and offering price per share | $ | 32.04 | ||
Class R5: | ||||
Net asset value and offering price per share | $ | 32.47 | ||
Class R6: | ||||
Net asset value and offering price per share | $ | 32.48 | ||
See accompanying Notes to Financial Statements which are an integral part of the financial statements.
12 Invesco International Growth Fund
Statement of Operations
For the year ended October 31, 2015
Investment income: |
| |||
Dividends (net of foreign withholding taxes of $17,031,327) | $ | 217,284,327 | ||
Dividends from affiliated money market funds | 456,882 | |||
Total investment income | 217,741,209 | |||
Expenses: | ||||
Advisory fees | 74,988,543 | |||
Administrative services fees | 750,577 | |||
Custodian fees | 3,140,723 | |||
Distribution fees: | ||||
Class A | 6,935,421 | |||
Class B | 226,469 | |||
Class C | 1,964,316 | |||
Class R | 575,723 | |||
Transfer agent fees — A, B, C, R and Y | 11,163,789 | |||
Transfer agent fees — R5 | 1,648,174 | |||
Transfer agent fees — R6 | 25,434 | |||
Trustees’ and officers’ fees and benefits | 152,437 | |||
Other | 1,352,034 | |||
Total expenses | 102,923,640 | |||
Less: Fees waived and expense offset arrangement(s) | (987,828 | ) | ||
Net expenses | 101,935,812 | |||
Net investment income | 115,805,397 | |||
Realized and unrealized gain (loss) from: | ||||
Net realized gain from: | ||||
Investment securities | 12,321,146 | |||
Foreign currencies | 3,231,065 | |||
| 15,552,211 | ||||
Change in net unrealized appreciation (depreciation) of: | ||||
Investment securities (net of foreign taxes on holdings of $3,999,838) | (336,882,144 | ) | ||
Foreign currencies | 712,571 | |||
| (336,169,573 | ) | |||
Net realized and unrealized gain (loss) | (320,617,362 | ) | ||
Net increase (decrease) in net assets resulting from operations | $ | (204,811,965 | ) | |
See accompanying Notes to Financial Statements which are an integral part of the financial statements.
13 Invesco International Growth Fund
Statement of Changes in Net Assets
For the years ended October 31, 2015 and 2014
| 2015 | 2014 | |||||||
Operations: |
| |||||||
Net investment income | $ | 115,805,397 | $ | 116,369,966 | ||||
Net realized gain | 15,552,211 | 334,795,058 | ||||||
Change in net unrealized appreciation (depreciation) | (336,169,573 | ) | (149,840,959 | ) | ||||
Net increase (decrease) in net assets resulting from operations | (204,811,965 | ) | 301,324,065 | |||||
Distributions to shareholders from net investment income: | ||||||||
Class A | (36,276,805 | ) | (28,925,253 | ) | ||||
Class B | (224,850 | ) | (183,328 | ) | ||||
Class C | (1,528,747 | ) | (759,542 | ) | ||||
Class R | (1,246,313 | ) | (917,629 | ) | ||||
Class Y | (51,260,156 | ) | (29,609,780 | ) | ||||
Class R5 | (31,180,473 | ) | (25,890,985 | ) | ||||
Class R6 | (6,351,523 | ) | (4,443,470 | ) | ||||
Total distributions from net investment income | (128,068,867 | ) | (90,729,987 | ) | ||||
Distributions to shareholders from net realized gains: | ||||||||
Class A | (87,321,576 | ) | — | |||||
Class B | (939,746 | ) | — | |||||
Class C | (6,389,654 | ) | — | |||||
Class R | (3,501,862 | ) | — | |||||
Class Y | (106,776,710 | ) | — | |||||
Class R5 | (62,164,277 | ) | — | |||||
Class R6 | (12,220,329 | ) | — | |||||
Total distributions from net realized gains | (279,314,154 | ) | — | |||||
Share transactions–net: | ||||||||
Class A | 117,082,040 | 64,799,488 | ||||||
Class B | (9,435,673 | ) | (12,079,618 | ) | ||||
Class C | 32,127,058 | 23,298,435 | ||||||
Class R | 22,482,397 | (5,603,811 | ) | |||||
Class Y | 558,668,076 | 870,882,591 | ||||||
Class R5 | (111,649,974 | ) | 1,071,720 | |||||
Class R6 | 431,163,343 | 67,677,716 | ||||||
Net increase in net assets resulting from share transactions | 1,040,437,267 | 1,010,046,521 | ||||||
Net increase in net assets | 428,242,281 | 1,220,640,599 | ||||||
Net assets: | ||||||||
Beginning of year | 8,569,460,130 | 7,348,819,531 | ||||||
End of year (includes undistributed net investment income of $76,519,765 and $85,515,588, respectively) | $ | 8,997,702,411 | $ | 8,569,460,130 | ||||
Notes to Financial Statements
October 31, 2015
NOTE 1—Significant Accounting Policies
Invesco International Growth Fund (the “Fund”) is a series portfolio of AIM International Mutual Funds (Invesco International Mutual Funds) (the “Trust”). The Trust is a Delaware statutory trust registered under the Investment Company Act of 1940, as amended (the “1940 Act”), as an open-end series management investment company consisting of eight separate portfolios, each authorized to issue an unlimited number of shares of beneficial interest. The assets, liabilities and operations of each portfolio are accounted for separately. Information presented in these financial statements pertains only to the Fund. Matters affecting each portfolio or class will be voted on exclusively by the shareholders of such portfolio or class.
The Fund’s investment objective is long-term growth of capital.
14 Invesco International Growth Fund
The Fund currently consists of seven different classes of shares: Class A, Class B, Class C, Class R, Class Y, Class R5 and Class R6. Class A shares are sold with a front-end sales charge unless certain waiver criteria are met and under certain circumstances load waived shares may be subject to contingent deferred sales charges (“CDSC”). Class C shares are sold with a CDSC. Class R, Class Y, Class R5 and Class R6 shares are sold at net asset value. Effective November 30, 2010, new or additional investments in Class B shares are no longer permitted. Existing shareholders of Class B shares may continue to reinvest dividends and capital gains distributions in Class B shares until they convert to Class A shares. Also, shareholders in Class B shares will be able to exchange those shares for Class B shares of other Invesco Funds offering such shares until they convert to Class A shares. Generally, Class B shares will automatically convert to Class A shares on or about the month-end, which is at least eight years after the date of purchase. Redemption of Class B shares prior to the conversion date will be subject to a CDSC.
As of the open of business on October 1, 2015, the Fund will limit public sales of its shares to certain investors.
The following is a summary of the significant accounting policies followed by the Fund in the preparation of its financial statements.
| A. | Security Valuations — Securities, including restricted securities, are valued according to the following policy. |
A security listed or traded on an exchange (except convertible securities) is valued at its last sales price or official closing price as of the close of the customary trading session on the exchange where the security is principally traded, or lacking any sales or official closing price on a particular day, the security may be valued at the closing bid price on that day. Securities traded in the over-the-counter market are valued based on prices furnished by independent pricing services or market makers. When such securities are valued by an independent pricing service they may be considered fair valued. Futures contracts are valued at the final settlement price set by an exchange on which they are principally traded. Listed options are valued at the mean between the last bid and asked prices from the exchange on which they are principally traded. Options not listed on an exchange are valued by an independent source at the mean between the last bid and asked prices. For purposes of determining net asset value (“NAV”) per share, futures and option contracts generally are valued 15 minutes after the close of the customary trading session of the New York Stock Exchange (“NYSE”).
Investments in open-end and closed-end registered investment companies that do not trade on an exchange are valued at the end-of-day net asset value per share. Investments in open-end and closed-end registered investment companies that trade on an exchange are valued at the last sales price or official closing price as of the close of the customary trading session on the exchange where the security is principally traded.
Debt obligations (including convertible securities) and unlisted equities are fair valued using an evaluated quote provided by an independent pricing service. Evaluated quotes provided by the pricing service may be determined without exclusive reliance on quoted prices, and may reflect appropriate factors such as institution-size trading in similar groups of securities, developments related to specific securities, dividend rate (for unlisted equities), yield (for debt obligations), quality, type of issue, coupon rate (for debt obligations), maturity (for debt obligations), individual trading characteristics and other market data. Debt obligations are subject to interest rate and credit risks. In addition, all debt obligations involve some risk of default with respect to interest and/or principal payments.
Foreign securities’ (including foreign exchange contracts) prices are converted into U.S. dollar amounts using the applicable exchange rates as of the close of the NYSE. If market quotations are available and reliable for foreign exchange-traded equity securities, the securities will be valued at the market quotations. Because trading hours for certain foreign securities end before the close of the NYSE, closing market quotations may become unreliable. If between the time trading ends on a particular security and the close of the customary trading session on the NYSE, events occur that the Adviser determines are significant and make the closing price unreliable, the Fund may fair value the security. If the event is likely to have affected the closing price of the security, the security will be valued at fair value in good faith using procedures approved by the Board of Trustees. Adjustments to closing prices to reflect fair value may also be based on a screening process of an independent pricing service to indicate the degree of certainty, based on historical data, that the closing price in the principal market where a foreign security trades is not the current value as of the close of the NYSE. Foreign securities’ prices meeting the approved degree of certainty that the price is not reflective of current value will be priced at the indication of fair value from the independent pricing service. Multiple factors may be considered by the independent pricing service in determining adjustments to reflect fair value and may include information relating to sector indices, American Depositary Receipts and domestic and foreign index futures. Foreign securities may have additional risks including exchange rate changes, potential for sharply devalued currencies and high inflation, political and economic upheaval, the relative lack of issuer information, relatively low market liquidity and the potential lack of strict financial and accounting controls and standards.
Securities for which market prices are not provided by any of the above methods may be valued based upon quotes furnished by independent sources. The last bid price may be used to value equity securities. The mean between the last bid and asked prices is used to value debt obligations, including corporate loans.
Securities for which market quotations are not readily available or became unreliable are valued at fair value as determined in good faith by or under the supervision of the Trust’s officers following procedures approved by the Board of Trustees. Issuer specific events, market trends, bid/asked quotes of brokers and information providers and other market data may be reviewed in the course of making a good faith determination of a security’s fair value.
The Fund may invest in securities that are subject to interest rate risk, meaning the risk that the prices will generally fall as interest rates rise and, conversely, the prices will generally rise as interest rates fall. Specific securities differ in their sensitivity to changes in interest rates depending on their individual characteristics. Changes in interest rates may result in increased market volatility, which may affect the value and/or liquidity of certain Fund investments.
Valuations change in response to many factors including the historical and prospective earnings of the issuer, the value of the issuer’s assets, general economic conditions, interest rates, investor perceptions and market liquidity. Because of the inherent uncertainties of valuation, the values reflected in the financial statements may materially differ from the value received upon actual sale of those investments.
| B. | Securities Transactions and Investment Income — Securities transactions are accounted for on a trade date basis. Realized gains or losses on sales are computed on the basis of specific identification of the securities sold. Interest income (net of withholding tax, if any) is recorded on the accrual basis from settlement date. Dividend income (net of withholding tax, if any) is recorded on the ex-dividend date. |
The Fund may periodically participate in litigation related to Fund investments. As such, the Fund may receive proceeds from litigation settlements. Any proceeds received are included in the Statement of Operations as realized gain (loss) for investments no longer held and as unrealized gain (loss) for investments still held.
15 Invesco International Growth Fund
Brokerage commissions and mark ups are considered transaction costs and are recorded as an increase to the cost basis of securities purchased and/or a reduction of proceeds on a sale of securities. Such transaction costs are included in the determination of net realized and unrealized gain (loss) from investment securities reported in the Statement of Operations and the Statement of Changes in Net Assets and the net realized and unrealized gains (losses) on securities per share in the Financial Highlights. Transaction costs are included in the calculation of the Fund’s net asset value and, accordingly, they reduce the Fund’s total returns. These transaction costs are not considered operating expenses and are not reflected in net investment income reported in the Statement of Operations and the Statement of Changes in Net Assets, or the net investment income per share and the ratios of expenses and net investment income reported in the Financial Highlights, nor are they limited by any expense limitation arrangements between the Fund and the investment adviser.
The Fund allocates income and realized and unrealized capital gains and losses to a class based on the relative net assets of each class.
| C. | Country Determination — For the purposes of making investment selection decisions and presentation in the Schedule of Investments, the investment adviser may determine the country in which an issuer is located and/or credit risk exposure based on various factors. These factors include the laws of the country under which the issuer is organized, where the issuer maintains a principal office, the country in which the issuer derives 50% or more of its total revenues and the country that has the primary market for the issuer’s securities, as well as other criteria. Among the other criteria that may be evaluated for making this determination are the country in which the issuer maintains 50% or more of its assets, the type of security, financial guarantees and enhancements, the nature of the collateral and the sponsor organization. Country of issuer and/or credit risk exposure has been determined to be the United States of America, unless otherwise noted. |
| D. | Distributions — Distributions from net investment income and net realized capital gain, if any, are generally declared and paid annually and recorded on the ex-dividend date. The Fund may elect to treat a portion of the proceeds from redemptions as distributions for federal income tax purposes. |
| E. | Federal Income Taxes — The Fund intends to comply with the requirements of Subchapter M of the Internal Revenue Code of 1986, as amended (the “Internal Revenue Code”), necessary to qualify as a regulated investment company and to distribute substantially all of the Fund’s taxable earnings to shareholders. As such, the Fund will not be subject to federal income taxes on otherwise taxable income (including net realized capital gain) that is distributed to shareholders. Therefore, no provision for federal income taxes is recorded in the financial statements. |
The Fund recognizes the tax benefits of uncertain tax positions only when the position is more likely than not to be sustained. Management has analyzed the Fund’s uncertain tax positions and concluded that no liability for unrecognized tax benefits should be recorded related to uncertain tax positions. Management is not aware of any tax positions for which it is reasonably possible that the total amounts of unrecognized tax benefits will change materially in the next 12 months.
The Fund files tax returns in the U.S. Federal jurisdiction and certain other jurisdictions. Generally, the Fund is subject to examinations by such taxing authorities for up to three years after the filing of the return for the tax period.
| F. | Expenses — Fees provided for under the Rule 12b-1 plan of a particular class of the Fund are charged to the operations of such class. Transfer agency fees and expenses and other shareholder recordkeeping fees and expenses attributable to Class R5 and Class R6 are allocated to each share class based on relative net assets. Sub-accounting fees attributable to Class R5 are charged to the operations of the class. Transfer agency fees and expenses and other shareholder recordkeeping fees and expenses relating to all other classes are allocated among those classes based on relative net assets. All other expenses are allocated among the classes based on relative net assets. |
| G. | Accounting Estimates — The preparation of financial statements in conformity with accounting principles generally accepted in the United States of America (“GAAP”) requires management to make estimates and assumptions that affect the reported amounts of assets and liabilities at the date of the financial statements and the reported amounts of revenues and expenses during the reporting period including estimates and assumptions related to taxation. Actual results could differ from those estimates by a significant amount. In addition, the Fund monitors for material events or transactions that may occur or become known after the period-end date and before the date the financial statements are released to print. |
| H. | Indemnifications — Under the Trust’s organizational documents, each Trustee, officer, employee or other agent of the Trust is indemnified against certain liabilities that may arise out of the performance of their duties to the Fund. Additionally, in the normal course of business, the Fund enters into contracts, including the Fund’s servicing agreements, that contain a variety of indemnification clauses. The Fund’s maximum exposure under these arrangements is unknown as this would involve future claims that may be made against the Fund that have not yet occurred. The risk of material loss as a result of such indemnification claims is considered remote. |
| I. | Foreign Currency Translations — Foreign currency is valued at the close of the NYSE based on quotations posted by banks and major currency dealers. Portfolio securities and other assets and liabilities denominated in foreign currencies are translated into U.S. dollar amounts at date of valuation. Purchases and sales of portfolio securities (net of foreign taxes withheld on disposition) and income items denominated in foreign currencies are translated into U.S. dollar amounts on the respective dates of such transactions. The Fund does not separately account for the portion of the results of operations resulting from changes in foreign exchange rates on investments and the fluctuations arising from changes in market prices of securities held. The combined results of changes in foreign exchange rates and the fluctuation of market prices on investments (net of estimated foreign tax withholding) are included with the net realized and unrealized gain or loss from investments in the Statement of Operations. Reported net realized foreign currency gains or losses arise from (1) sales of foreign currencies, (2) currency gains or losses realized between the trade and settlement dates on securities transactions, and (3) the difference between the amounts of dividends, interest, and foreign withholding taxes recorded on the Fund’s books and the U.S. dollar equivalent of the amounts actually received or paid. Net unrealized foreign currency gains and losses arise from changes in the fair values of assets and liabilities, other than investments in securities at fiscal period end, resulting from changes in exchange rates. |
The Fund may invest in foreign securities, which may be subject to foreign taxes on income, gains on investments or currency repatriation, a portion of which may be recoverable. Foreign taxes, if any, are recorded based on the tax regulations and rates that exist in the foreign markets in which the Fund invests and are shown in the Statement of Operations.
| J. | Forward Foreign Currency Contracts — The Fund may engage in foreign currency transactions either on a spot (i.e. for prompt delivery and settlement) basis, or through forward foreign currency contracts, to manage or minimize currency or exchange rate risk. |
The Fund may also enter into forward foreign currency contracts for the purchase or sale of a security denominated in a foreign currency in order to “lock in” the U.S. dollar price of that security, or the Fund may also enter into forward foreign currency contracts that do not provide for
16 Invesco International Growth Fund
physical settlement of the two currencies, but instead are settled by a single cash payment calculated as the difference between the agreed upon exchange rate and the spot rate at settlement based upon an agreed upon notional amount (non-deliverable forwards). The Fund will set aside liquid assets in an amount equal to daily mark-to-market obligation for forward foreign currency contracts.
A forward foreign currency contract is an obligation between two parties (“Counterparties”) to purchase or sell a specific currency for an agreed-upon price at a future date. The use of forward foreign currency contracts does not eliminate fluctuations in the price of the underlying securities the Fund owns or intends to acquire but establishes a rate of exchange in advance. Fluctuations in the value of these contracts are measured by the difference in the contract date and reporting date exchange rates and are recorded as unrealized appreciation (depreciation) until the contracts are closed. When the contracts are closed, realized gains (losses) are recorded. Realized and unrealized gains (losses) on the contracts are included in the Statement of Operations. The primary risks associated with forward foreign currency contracts include failure of the Counterparty to meet the terms of the contract and the value of the foreign currency changing unfavorably. These risks may be in excess of the amounts reflected in the Statement of Assets and Liabilities.
NOTE 2—Advisory Fees and Other Fees Paid to Affiliates
The Trust has entered into a master investment advisory agreement with Invesco Advisers, Inc. (the “Adviser” or “Invesco”). Under the terms of the investment advisory agreement, the Fund pays an advisory fee to the Adviser based on the annual rate of the Fund’s average daily net assets as follows:
| Average Daily Net Assets | Rate | |||||
First $250 million | 0 | .935% | ||||
Next $250 million | 0 | .91% | ||||
Next $500 million | 0 | .885% | ||||
Next $1.5 billion | 0 | .86% | ||||
Next $2.5 billion | 0 | .835% | ||||
Next $2.5 billion | 0 | .81% | ||||
Next $2.5 billion | 0 | .785% | ||||
Over $10 billion | 0 | .76% | ||||
For the year ended October 31, 2015, the effective advisory fees incurred by the Fund was 0.83%.
Under the terms of a master sub-advisory agreement between the Adviser and each of Invesco Asset Management Deutschland GmbH, Invesco Asset Management Limited, Invesco Asset Management (Japan) Limited, Invesco Hong Kong Limited, Invesco Senior Secured Management, Inc. and Invesco Canada Ltd. (collectively, the “Affiliated Sub-Advisers”) the Adviser, not the Fund, may pay 40% of the fees paid to the Adviser to any such Affiliated Sub-Adviser(s) that provide(s) discretionary investment management services to the Fund based on the percentage of assets allocated to such Affiliated Sub-Adviser(s).
The Adviser has contractually agreed, through at least June 30, 2016, to waive advisory fees and/or reimburse expenses of all shares to the extent necessary to limit total annual fund operating expenses after fee waiver and/or expense reimbursement (excluding certain items discussed below) of Class A, Class B, Class C, Class R, Class Y, Class R5 and Class R6 shares to 2.25%, 3.00%, 3.00%, 2.50%, 2.00%, 2.00% and 2.00%, respectively, of average daily net assets. In determining the Adviser’s obligation to waive advisory fees and/or reimburse expenses, the following expenses are not taken into account, and could cause the total annual fund operating expenses after fee waiver and/or expense reimbursement to exceed the numbers reflected above: (1) interest; (2) taxes; (3) dividend expense on short sales; (4) extraordinary or non-routine items, including litigation expenses; and (5) expenses that the Fund has incurred but did not actually pay because of an expense offset arrangement. Unless Invesco continues the fee waiver agreement, it will terminate on June 30, 2016. The fee waiver agreement cannot be terminated during its term. The Adviser did not waive fees and/or reimburse expenses during the period under this expense limitation.
Further, the Adviser has contractually agreed, through at least June 30, 2017, to waive the advisory fee payable by the Fund in an amount equal to 100% of the net advisory fees the Adviser receives from the affiliated money market funds on investments by the Fund of uninvested cash in such affiliated money market funds.
For the year ended October 31, 2015, the Adviser waived advisory fees of $978,572.
The Trust has entered into a master administrative services agreement with Invesco pursuant to which the Fund has agreed to pay Invesco for certain administrative costs incurred in providing accounting services to the Fund. For the year ended October 31, 2015, expenses incurred under the agreement are shown in the Statement of Operations as Administrative services fees.
The Trust has entered into a transfer agency and service agreement with Invesco Investment Services, Inc. (“IIS”) pursuant to which the Fund has agreed to pay IIS a fee for providing transfer agency and shareholder services to the Fund and reimburse IIS for certain expenses incurred by IIS in the course of providing such services. IIS may make payments to intermediaries that provide omnibus account services, sub-accounting services and/or networking services. All fees payable by IIS to intermediaries that provide omnibus account services or sub-accounting are charged back to the Fund, subject to certain limitations approved by the Trust’s Board of Trustees. For the year ended October 31, 2015, expenses incurred under the agreement are shown in the Statement of Operations as Transfer agent fees.
The Trust has entered into master distribution agreements with Invesco Distributors, Inc. (“IDI”) to serve as the distributor for the Class A, Class B, Class C, Class R, Class Y, Class R5 and Class R6 shares of the Fund. The Trust has adopted plans pursuant to Rule 12b-1 under the 1940 Act with respect to the Fund’s Class A, Class B, Class C and Class R shares (collectively, the “Plans”). The Fund, pursuant to the Plans, pays IDI compensation at the annual rate of 0.25% of the Fund’s average daily net assets of Class A shares, 1.00% of the average daily net assets of Class B and Class C shares and 0.50% of the average daily net assets of Class R shares. Of the Plan payments, up to 0.25% of the average daily net assets of each class of shares may be paid to furnish continuing personal shareholder services to customers who purchase and own shares of such classes. Any amounts not paid as a service fee under the Plans would constitute an asset-based sales charge. Rules of the Financial Industry Regulatory Authority (“FINRA”) impose a cap on the total sales charges, including asset-based sales charges, that may be paid by any class of shares of the Fund. For the year ended October 31, 2015, expenses incurred under the Plans are shown in the Statement of Operations as Distribution fees.
17 Invesco International Growth Fund
Front-end sales commissions and CDSC (collectively, the “sales charges”) are not recorded as expenses of the Fund. Front-end sales commissions are deducted from proceeds from the sales of Fund shares prior to investment in Class A shares of the Fund. CDSC are deducted from redemption proceeds prior to remittance to the shareholder. During the year ended October 31, 2015, IDI advised the Fund that IDI retained $1,181,579 in front-end sales commissions from the sale of Class A shares and $30,474, $5,911 and $49,325 from Class A, Class B and Class C shares, respectively, for CDSC imposed on redemptions by shareholders.
Certain officers and trustees of the Trust are officers and directors of the Adviser, IIS and/or IDI.
NOTE 3—Additional Valuation Information
GAAP defines fair value as the price that would be received to sell an asset or paid to transfer a liability in an orderly transaction between market participants at the measurement date, under current market conditions. GAAP establishes a hierarchy that prioritizes the inputs to valuation methods, giving the highest priority to readily available unadjusted quoted prices in an active market for identical assets (Level 1) and the lowest priority to significant unobservable inputs (Level 3), generally when market prices are not readily available or are unreliable. Based on the valuation inputs, the securities or other investments are tiered into one of three levels. Changes in valuation methods may result in transfers in or out of an investment’s assigned level:
| Level 1 — | Prices are determined using quoted prices in an active market for identical assets. |
| Level 2 — | Prices are determined using other significant observable inputs. Observable inputs are inputs that other market participants may use in pricing a security. These may include quoted prices for similar securities, interest rates, prepayment speeds, credit risk, yield curves, loss severities, default rates, discount rates, volatilities and others. |
| Level 3 — | Prices are determined using significant unobservable inputs. In situations where quoted prices or observable inputs are unavailable (for example, when there is little or no market activity for an investment at the end of the period), unobservable inputs may be used. Unobservable inputs reflect the Fund’s own assumptions about the factors market participants would use in determining fair value of the securities or instruments and would be based on the best available information. |
The following is a summary of the tiered valuation input levels, as of October 31, 2015. The level assigned to the securities valuations may not be an indication of the risk or liquidity associated with investing in those securities. Because of the inherent uncertainties of valuation, the values reflected in the financial statements may materially differ from the value received upon actual sale of those investments.
During the year ended October 31, 2015, there were transfers from Level 1 to Level 2 of $847,364,049 and from Level 2 to Level 1 of $499,988,153, due to foreign fair value adjustments.
| Level 1 | Level 2 | Level 3 | Total | |||||||||||||
Australia | $ | 162,810,103 | $ | 216,204,690 | $ | — | $ | 379,014,793 | ||||||||
Belgium | — | 110,715,243 | — | 110,715,243 | ||||||||||||
Brazil | 157,520,898 | — | — | 157,520,898 | ||||||||||||
Canada | 646,315,796 | — | — | 646,315,796 | ||||||||||||
China | 125,918,537 | 292,742,143 | — | 418,660,680 | ||||||||||||
Denmark | — | 224,717,166 | — | 224,717,166 | ||||||||||||
France | 160,685,362 | 123,827,954 | — | 284,513,316 | ||||||||||||
Germany | 752,292,749 | — | — | 752,292,749 | ||||||||||||
Hong Kong | — | 293,411,661 | — | 293,411,661 | ||||||||||||
Israel | 216,609,593 | — | — | 216,609,593 | ||||||||||||
Japan | — | 670,855,234 | — | 670,855,234 | ||||||||||||
Mexico | 182,483,816 | — | — | 182,483,816 | ||||||||||||
Singapore | 288,507,477 | — | — | 288,507,477 | ||||||||||||
South Korea | — | 168,147,239 | — | 168,147,239 | ||||||||||||
Spain | — | 102,371,593 | — | 102,371,593 | ||||||||||||
Sweden | 42,124,048 | 335,852,756 | — | 377,976,804 | ||||||||||||
Switzerland | — | 762,062,895 | — | 762,062,895 | ||||||||||||
Taiwan | — | 159,190,725 | — | 159,190,725 | ||||||||||||
Thailand | — | 113,944,018 | — | 113,944,018 | ||||||||||||
Turkey | 79,006,075 | — | — | 79,006,075 | ||||||||||||
United Kingdom | — | 1,988,155,956 | — | 1,988,155,956 | ||||||||||||
United States | 570,329,935 | — | — | 570,329,935 | ||||||||||||
Total Investments | $ | 3,384,604,389 | $ | 5,562,199,273 | $ | — | $ | 8,946,803,662 | ||||||||
NOTE 4—Expense Offset Arrangement(s)
The expense offset arrangement is comprised of transfer agency credits which result from balances in demand deposit accounts used by the transfer agent for clearing shareholder transactions. For the year ended October 31, 2015, the Fund received credits from this arrangement, which resulted in the reduction of the Fund’s total expenses of $9,256.
18 Invesco International Growth Fund
NOTE 5—Trustees’ and Officers’ Fees and Benefits
Trustees’ and Officers’ Fees and Benefits include amounts accrued by the Fund to pay remuneration to certain Trustees and Officers of the Fund. Trustees have the option to defer compensation payable by the Fund, and Trustees’ and Officers’ Fees and Benefits also include amounts accrued by the Fund to fund such deferred compensation amounts. Those Trustees who defer compensation have the option to select various Invesco Funds in which their deferral accounts shall be deemed to be invested. Finally, certain current Trustees were eligible to participate in a retirement plan that provided for benefits to be paid upon retirement to Trustees over a period of time based on the number of years of service. The Fund may have certain former Trustees who also participate in a retirement plan and receive benefits under such plan. Trustees’ and Officers’ Fees and Benefits include amounts accrued by the Fund to fund such retirement benefits. Obligations under the deferred compensation and retirement plans represent unsecured claims against the general assets of the Fund.
NOTE 6—Cash Balances
The Fund is permitted to temporarily carry a negative or overdrawn balance in its account with State Street Bank and Trust Company, the custodian bank. Such balances, if any at period end, are shown in the Statement of Assets and Liabilities under the payable caption Amount due custodian. To compensate the custodian bank for such overdrafts, the overdrawn Fund may either (1) leave funds as a compensating balance in the account so the custodian bank can be compensated by earning the additional interest; or (2) compensate by paying the custodian bank at a rate agreed upon by the custodian bank and Invesco, not to exceed the contractually agreed upon rate.
NOTE 7—Distributions to Shareholders and Tax Components of Net Assets
Tax Character of Distributions to Shareholders Paid During the Fiscal Years Ended October 31, 2015 and 2014:
| 2015 | 2014 | |||||||
Ordinary income | $ | 128,102,965 | $ | 90,729,987 | ||||
Long-term capital gain | 279,280,056 | — | ||||||
Total distributions | $ | 407,383,021 | $ | 90,729,987 | ||||
Tax Components of Net Assets at Period-End:
| 2015 | ||||
Undistributed ordinary income | $ | 123,338,000 | ||
Net unrealized appreciation — investments | 1,449,897,619 | |||
Net unrealized appreciation (depreciation) — other investments | (469,157 | ) | ||
Temporary book/tax differences | (852,272 | ) | ||
Capital loss carryforward | (93,607,910 | ) | ||
Shares of beneficial interest | 7,519,396,131 | |||
Total net assets | $ | 8,997,702,411 | ||
The difference between book-basis and tax-basis unrealized appreciation (depreciation) is due to differences in the timing of recognition of gains and losses on investments for tax and book purposes. The Fund’s net unrealized appreciation difference is attributable primarily to wash sales and passive foreign investment companies.
The temporary book/tax differences are a result of timing differences between book and tax recognition of income and/or expenses. The Fund’s temporary book/tax differences are the result of the trustee deferral of compensation and retirement plan benefits.
Capital loss carryforward is calculated and reported as of a specific date. Results of transactions and other activity after that date may affect the amount of capital loss carryforward actually available for the Fund to utilize. Capital losses generated in years beginning after December 22, 2010 can be carried forward for an unlimited period, whereas previous losses expire in eight tax years. Capital losses with an expiration period may not be used to offset capital gains until all net capital losses without an expiration date have been utilized. Capital loss carryforwards with no expiration date will retain their character as either short-term or long-term capital losses instead of as short-term capital losses as under prior law. The ability to utilize capital loss carryforwards in the future may be limited under the Internal Revenue Code and related regulations based on the results of future transactions.
The Fund has a capital loss carryforward as of October 31, 2015, which expires as follows:
| Capital Loss Carryforward* | ||||||||||||
| Expiration | Short-Term | Long-Term | Total | |||||||||
October 31, 2017 | $ | 93,607,910 | $ | — | $ | 93,607,910 | ||||||
| * | Capital loss carryforward as of the date listed above is reduced for limitations, if any, to the extent required by the Internal Revenue Code and may be further limited depending upon a variety of factors, including the realization of net unrealized gains or losses as of the date of any reorganization. |
19 Invesco International Growth Fund
NOTE 8—Investment Securities
The aggregate amount of investment securities (other than short-term securities, U.S. Treasury obligations and money market funds, if any) purchased and sold by the Fund during the year ended October 31, 2015 was $2,410,327,826 and $1,681,864,395, respectively. Cost of investments on a tax basis includes the adjustments for financial reporting purposes as of the most recently completed federal income tax reporting period-end.
| Unrealized Appreciation (Depreciation) of Investment Securities on a Tax Basis | ||||
Aggregate unrealized appreciation of investment securities | $ | 1,822,641,254 | ||
Aggregate unrealized (depreciation) of investment securities | (372,743,635 | ) | ||
Net unrealized appreciation of investment securities | $ | 1,449,897,619 | ||
Cost of investments for tax purposes is $7,496,906,043.
NOTE 9—Reclassification of Permanent Differences
Primarily as a result of differing book/tax treatment of foreign currency transactions and Fair fund adjustments, on October 31, 2015, undistributed net investment income was increased by $3,267,647 and undistributed net realized gain (loss) was decreased by $3,267,647. This reclassification had no effect on the net assets of the Fund.
NOTE 10—Share Information
| Summary of Share Activity | ||||||||||||||||
| Years ended October 31, | ||||||||||||||||
| 2015(a) | 2014 | |||||||||||||||
| Shares | Amount | Shares | Amount | |||||||||||||
Sold: | ||||||||||||||||
Class A | 26,697,786 | $ | 885,874,850 | 21,118,637 | $ | 715,917,487 | ||||||||||
Class B | 33,284 | 1,019,092 | 42,381 | 1,324,067 | ||||||||||||
Class C | 2,098,788 | 64,436,962 | 1,693,544 | 53,355,080 | ||||||||||||
Class R | 1,532,311 | 49,911,996 | 925,708 | 31,167,250 | ||||||||||||
Class Y | 40,455,822 | 1,340,721,479 | 35,298,165 | 1,216,254,016 | ||||||||||||
Class R5 | 17,155,685 | 569,589,969 | 14,241,254 | 494,487,034 | ||||||||||||
Class R6 | 14,445,590 | 483,268,395 | 2,543,360 | 89,182,543 | ||||||||||||
Issued as reinvestment of dividends: | ||||||||||||||||
Class A | 3,536,773 | 111,762,038 | 783,877 | 25,272,200 | ||||||||||||
Class B | 37,950 | 1,105,107 | 5,818 | 173,790 | ||||||||||||
Class C | 246,494 | 7,187,756 | 23,015 | 688,159 | ||||||||||||
Class R | 150,113 | 4,691,039 | 28,368 | 905,491 | ||||||||||||
Class Y | 3,862,468 | 122,285,726 | 739,626 | 23,870,700 | ||||||||||||
Class R5 | 2,407,626 | 77,164,395 | 650,436 | 21,261,697 | ||||||||||||
Class R6 | 579,646 | 18,571,852 | 136,136 | 4,443,470 | ||||||||||||
Automatic conversion of Class B shares to Class A shares: | ||||||||||||||||
Class A | 246,099 | 8,178,590 | 243,713 | 8,352,444 | ||||||||||||
Class B | (267,820 | ) | (8,178,590 | ) | (263,944 | ) | (8,352,444 | ) | ||||||||
Reacquired: | ||||||||||||||||
Class A | (27,150,407 | ) | (888,733,438 | ) | (20,030,040 | ) | (684,742,643 | ) | ||||||||
Class B | (111,739 | ) | (3,381,282 | ) | (166,496 | ) | (5,225,031 | ) | ||||||||
Class C | (1,312,209 | ) | (39,497,660 | ) | (980,619 | ) | (30,744,804 | ) | ||||||||
Class R | (994,923 | ) | (32,120,638 | ) | (1,116,632 | ) | (37,676,552 | ) | ||||||||
Class Y | (27,405,343 | ) | (904,339,129 | ) | (10,793,562 | ) | (369,242,125 | ) | ||||||||
Class R5 | (22,699,710 | ) | (758,404,338 | ) | (14,870,829 | ) | (514,677,011 | ) | ||||||||
Class R6 | (2,126,176 | ) | (70,676,904 | ) | (752,292 | ) | (25,948,297 | ) | ||||||||
Net increase in share activity | 31,418,108 | $ | 1,040,437,267 | 29,499,624 | $ | 1,010,046,521 | ||||||||||
| (a) | There are entities that are record owners of more than 5% of the outstanding shares of the Fund and in the aggregate own 45% of the outstanding shares of the Fund. IDI has an agreement with these entities to sell Fund shares. The Fund, Invesco and/or Invesco affiliates may make payments to these entities, which are considered to be related to the Fund, for providing services to the Fund, Invesco and/or Invesco affiliates including but not limited to services such as securities brokerage, distribution, third party record keeping and account servicing. The Fund has no knowledge as to whether all or any portion of the shares owned of record by these entities are also owned beneficially. |
20 Invesco International Growth Fund
NOTE 11—Financial Highlights
The following schedule presents financial highlights for a share of the Fund outstanding throughout the periods indicated.
| Net asset value, beginning of period | Net investment income(a) | Net gains (losses) on securities (both realized and unrealized) | Total from investment operations | Dividends from net investment income | Distributions from net realized gains | Total distributions | Net asset value, end of period(b) | Total return(c) | Net assets, end of period (000’s omitted) | Ratio of expenses to average net assets with fee waivers and/or expenses absorbed | Ratio of expenses to average net assets without fee waivers and/or expenses absorbed | Ratio of net investment income to average net assets | Portfolio turnover(d) | |||||||||||||||||||||||||||||||||||||||||||
Class A | ||||||||||||||||||||||||||||||||||||||||||||||||||||||||
Year ended 10/31/15 | $ | 34.24 | $ | 0.37 | $ | (1.13 | ) | $ | (0.76 | ) | $ | (0.46 | ) | $ | (1.11 | ) | $ | (1.57 | ) | $ | 31.91 | (2.19 | )% | $ | 2,725,649 | 1.30 | %(e) | 1.31 | %(e) | 1.11 | %(e) | 20 | % | |||||||||||||||||||||||
Year ended 10/31/14 | 33.30 | 0.45 | 0.85 | 1.30 | (0.36 | ) | — | (0.36 | ) | 34.24 | 3.98 | 2,810,473 | 1.32 | 1.33 | 1.32 | 18 | ||||||||||||||||||||||||||||||||||||||||
Year ended 10/31/13 | 27.96 | 0.26 | 5.37 | 5.63 | (0.29 | ) | — | (0.29 | ) | 33.30 | 20.31 | 2,662,962 | 1.33 | 1.34 | 0.87 | 21 | ||||||||||||||||||||||||||||||||||||||||
Year ended 10/31/12 | 26.43 | 0.26 | 1.59 | 1.85 | (0.32 | ) | — | (0.32 | ) | 27.96 | 7.13 | 2,132,503 | 1.37 | 1.38 | 0.99 | 21 | ||||||||||||||||||||||||||||||||||||||||
Year ended 10/31/11 | 26.99 | 0.36 | (0.65 | ) | (0.29 | ) | (0.27 | ) | — | (0.27 | ) | 26.43 | (1.10 | ) | 2,056,979 | 1.38 | 1.39 | 1.29 | 25 | |||||||||||||||||||||||||||||||||||||
Class B | ||||||||||||||||||||||||||||||||||||||||||||||||||||||||
Year ended 10/31/15 | 31.51 | 0.11 | (1.03 | ) | (0.92 | ) | (0.26 | ) | (1.11 | ) | (1.37 | ) | 29.22 | (2.90 | ) | 16,818 | 2.05 | (e) | 2.06 | (e) | 0.36 | (e) | 20 | |||||||||||||||||||||||||||||||||
Year ended 10/31/14 | 30.69 | 0.17 | 0.80 | 0.97 | (0.15 | ) | — | (0.15 | ) | 31.51 | 3.18 | 27,855 | 2.07 | 2.08 | 0.57 | 18 | ||||||||||||||||||||||||||||||||||||||||
Year ended 10/31/13 | 25.81 | 0.03 | 4.96 | 4.99 | (0.11 | ) | — | (0.11 | ) | 30.69 | 19.41 | 38,858 | 2.08 | 2.09 | 0.12 | 21 | ||||||||||||||||||||||||||||||||||||||||
Year ended 10/31/12 | 24.41 | 0.06 | 1.47 | 1.53 | (0.13 | ) | — | (0.13 | ) | 25.81 | 6.31 | 44,873 | 2.12 | 2.13 | 0.24 | 21 | ||||||||||||||||||||||||||||||||||||||||
Year ended 10/31/11 | 24.95 | 0.14 | (0.60 | ) | (0.46 | ) | (0.08 | ) | — | (0.08 | ) | 24.41 | (1.85 | ) | 57,683 | 2.13 | 2.14 | 0.54 | 25 | |||||||||||||||||||||||||||||||||||||
Class C | ||||||||||||||||||||||||||||||||||||||||||||||||||||||||
Year ended 10/31/15 | 31.55 | 0.11 | (1.04 | ) | (0.93 | ) | (0.26 | ) | (1.11 | ) | (1.37 | ) | 29.25 | (2.93 | ) | 198,692 | 2.05 | (e) | 2.06 | (e) | 0.36 | (e) | 20 | |||||||||||||||||||||||||||||||||
Year ended 10/31/14 | 30.72 | 0.18 | 0.80 | 0.98 | (0.15 | ) | — | (0.15 | ) | 31.55 | 3.21 | 181,679 | 2.07 | 2.08 | 0.57 | 18 | ||||||||||||||||||||||||||||||||||||||||
Year ended 10/31/13 | 25.83 | 0.03 | 4.97 | 5.00 | (0.11 | ) | — | (0.11 | ) | 30.72 | 19.44 | 154,313 | 2.08 | 2.09 | 0.12 | 21 | ||||||||||||||||||||||||||||||||||||||||
Year ended 10/31/12 | 24.43 | 0.06 | 1.47 | 1.53 | (0.13 | ) | — | (0.13 | ) | 25.83 | 6.31 | 133,529 | 2.12 | 2.13 | 0.24 | 21 | ||||||||||||||||||||||||||||||||||||||||
Year ended 10/31/11 | 24.97 | 0.14 | (0.60 | ) | (0.46 | ) | (0.08 | ) | — | (0.08 | ) | 24.43 | (1.85 | ) | 145,944 | 2.13 | 2.14 | 0.54 | 25 | |||||||||||||||||||||||||||||||||||||
Class R | ||||||||||||||||||||||||||||||||||||||||||||||||||||||||
Year ended 10/31/15 | 33.83 | 0.28 | (1.11 | ) | (0.83 | ) | (0.40 | ) | (1.11 | ) | (1.51 | ) | 31.49 | (2.45 | ) | 116,738 | 1.55 | (e) | 1.56 | (e) | 0.86 | (e) | 20 | |||||||||||||||||||||||||||||||||
Year ended 10/31/14 | 32.91 | 0.36 | 0.85 | 1.21 | (0.29 | ) | — | (0.29 | ) | 33.83 | 3.73 | 102,126 | 1.57 | 1.58 | 1.07 | 18 | ||||||||||||||||||||||||||||||||||||||||
Year ended 10/31/13 | 27.64 | 0.19 | 5.31 | 5.50 | (0.23 | ) | — | (0.23 | ) | 32.91 | 20.03 | 104,712 | 1.58 | 1.59 | 0.62 | 21 | ||||||||||||||||||||||||||||||||||||||||
Year ended 10/31/12 | 26.13 | 0.20 | 1.57 | 1.77 | (0.26 | ) | — | (0.26 | ) | 27.64 | 6.85 | 88,726 | 1.62 | 1.63 | 0.74 | 21 | ||||||||||||||||||||||||||||||||||||||||
Year ended 10/31/11 | 26.70 | 0.28 | (0.64 | ) | (0.36 | ) | (0.21 | ) | — | (0.21 | ) | 26.13 | (1.38 | ) | 112,091 | 1.63 | 1.64 | 1.04 | 25 | |||||||||||||||||||||||||||||||||||||
Class Y | ||||||||||||||||||||||||||||||||||||||||||||||||||||||||
Year ended 10/31/15 | 34.37 | 0.45 | (1.14 | ) | (0.69 | ) | (0.53 | ) | (1.11 | ) | (1.64 | ) | 32.04 | (1.96 | ) | 3,449,499 | 1.05 | (e) | 1.06 | (e) | 1.36 | (e) | 20 | |||||||||||||||||||||||||||||||||
Year ended 10/31/14 | 33.42 | 0.54 | 0.85 | 1.39 | (0.44 | ) | — | (0.44 | ) | 34.37 | 4.25 | 3,118,319 | 1.07 | 1.08 | 1.57 | 18 | ||||||||||||||||||||||||||||||||||||||||
Year ended 10/31/13 | 28.05 | 0.34 | 5.37 | 5.71 | (0.34 | ) | — | (0.34 | ) | 33.42 | 20.59 | 2,188,960 | 1.08 | 1.09 | 1.12 | 21 | ||||||||||||||||||||||||||||||||||||||||
Year ended 10/31/12 | 26.53 | 0.33 | 1.59 | 1.92 | (0.40 | ) | — | (0.40 | ) | 28.05 | 7.39 | 1,464,295 | 1.12 | 1.13 | 1.24 | 21 | ||||||||||||||||||||||||||||||||||||||||
Year ended 10/31/11 | 27.08 | 0.42 | (0.64 | ) | (0.22 | ) | (0.33 | ) | — | (0.33 | ) | 26.53 | (0.83 | ) | 741,428 | 1.13 | 1.14 | 1.54 | 25 | |||||||||||||||||||||||||||||||||||||
Class R5 | ||||||||||||||||||||||||||||||||||||||||||||||||||||||||
Year ended 10/31/15 | 34.80 | 0.48 | (1.15 | ) | (0.67 | ) | (0.55 | ) | (1.11 | ) | (1.66 | ) | 32.47 | (1.86 | ) | 1,721,004 | 0.97 | (e) | 0.98 | (e) | 1.44 | (e) | 20 | |||||||||||||||||||||||||||||||||
Year ended 10/31/14 | 33.84 | 0.58 | 0.86 | 1.44 | (0.48 | ) | — | (0.48 | ) | 34.80 | 4.34 | 1,953,559 | 0.97 | 0.98 | 1.67 | 18 | ||||||||||||||||||||||||||||||||||||||||
Year ended 10/31/13 | 28.39 | 0.38 | 5.44 | 5.82 | (0.37 | ) | — | (0.37 | ) | 33.84 | 20.74 | 1,899,117 | 0.97 | 0.98 | 1.23 | 21 | ||||||||||||||||||||||||||||||||||||||||
Year ended 10/31/12 | 26.86 | 0.37 | 1.61 | 1.98 | (0.45 | ) | — | (0.45 | ) | 28.39 | 7.52 | 1,285,743 | 0.99 | 1.00 | 1.37 | 21 | ||||||||||||||||||||||||||||||||||||||||
Year ended 10/31/11 | 27.41 | 0.48 | (0.66 | ) | (0.18 | ) | (0.37 | ) | — | (0.37 | ) | 26.86 | (0.68 | ) | 1,457,494 | 0.97 | 0.98 | 1.70 | 25 | |||||||||||||||||||||||||||||||||||||
Class R6 | ||||||||||||||||||||||||||||||||||||||||||||||||||||||||
Year ended 10/31/15 | 34.80 | 0.51 | (1.14 | ) | (0.63 | ) | (0.58 | ) | (1.11 | ) | (1.69 | ) | 32.48 | (1.77 | ) | 769,302 | 0.89 | (e) | 0.90 | (e) | 1.52 | (e) | 20 | |||||||||||||||||||||||||||||||||
Year ended 10/31/14 | 33.84 | 0.60 | 0.86 | 1.46 | (0.50 | ) | — | (0.50 | ) | 34.80 | 4.42 | 375,449 | 0.90 | 0.91 | 1.74 | 18 | ||||||||||||||||||||||||||||||||||||||||
Year ended 10/31/13 | 28.38 | 0.40 | 5.45 | 5.85 | (0.39 | ) | — | (0.39 | ) | 33.84 | 20.85 | 299,898 | 0.90 | 0.91 | 1.30 | 21 | ||||||||||||||||||||||||||||||||||||||||
Year ended 10/31/12(f) | 28.83 | 0.04 | (0.49 | ) | (0.45 | ) | — | — | — | 28.38 | (1.56 | ) | 226,291 | 0.92 | (g) | 0.93 | (g) | 1.44 | (g) | 21 | ||||||||||||||||||||||||||||||||||||
| (a) | Calculated using average shares outstanding. |
| (b) | Includes redemption fees added to shares of beneficial interest for Class A, Class B, Class C, Class R, Class Y and Class R5 shares, which were less than $0.005 per share for the years ended October 31, 2012 and prior. |
| (c) | Includes adjustments in accordance with accounting principles generally accepted in the United States of America and as such, the net asset value for financial reporting purposes and the returns based upon those net asset values may differ from the net asset value and returns for shareholder transactions. Does not include sales charges and is not annualized for periods less than one year, if applicable. |
| (d) | Portfolio turnover is calculated at the fund level and is not annualized for periods less than one year, if applicable. For the period ended October 31, 2011, the portfolio turnover calculation excludes the value of securities purchased of $60,712,747 and sold of $131,009,072 in the effort to realign the Fund’s portfolio holdings after the reorganization of Invesco Van Kampen International Growth Advantage Fund and Invesco Van Kampen International Growth Fund into the Fund. |
| (e) | Ratios are based on average daily net assets (000’s omitted) of $2,774,168, $22,647, $196,432, $115,145, $3,443,628, $1,899,513 and $567,709 for Class A, Class B, Class C, Class R, Class Y, Class R5 and Class R6 shares, respectively. |
| (f) | Commencement date of September 24, 2012 for Class R6 shares. |
| (g) | Annualized. |
21 Invesco International Growth Fund
Report of Independent Registered Public Accounting Firm
To the Board of Trustees of AIM International Mutual Funds (Invesco International Mutual Funds)
and Shareholders of Invesco International Growth Fund:
In our opinion, the accompanying statement of assets and liabilities, including the schedule of investments, and the related statements of operations and of changes in net assets and the financial highlights present fairly, in all material respects, the financial position of Invesco International Growth Fund (one of the funds constituting AIM International Mutual Funds (Invesco International Mutual Funds), hereafter referred to as the “Fund”) at October 31, 2015, the results of its operations for the year then ended, the changes in its net assets for each of the two years in the period then ended and the financial highlights for each of the five years in the period then ended, in conformity with accounting principles generally accepted in the United States of America. These financial statements and financial highlights (hereafter referred to as “financial statements”) are the responsibility of the Fund’s management. Our responsibility is to express an opinion on these financial statements based on our audits. We conducted our audits of these financial statements in accordance with the standards of the Public Company Accounting Oversight Board (United States). Those standards require that we plan and perform the audit to obtain reasonable assurance about whether the financial statements are free of material misstatement. An audit includes examining, on a test basis, evidence supporting the amounts and disclosures in the financial statements, assessing the accounting principles used and significant estimates made by management, and evaluating the overall financial statement presentation. We believe that our audits, which included confirmation of securities at October 31, 2015 by correspondence with the custodian and brokers, and the application of alternative auditing procedures where confirmations of security purchases have not been received, provide a reasonable basis for our opinion.
PRICEWATERHOUSECOOPERS LLP
December 23, 2015
Houston, Texas
22 Invesco International Growth Fund
Calculating your ongoing Fund expenses
Example
As a shareholder of the Fund, you incur two types of costs: (1) transaction costs, which may include sales charges (loads) on purchase payments or contingent deferred sales charges on redemptions, if any; and (2) ongoing costs, including management fees, distribution and/or service (12b-1) fees, and other Fund expenses. This example is intended to help you understand your ongoing costs (in dollars) of investing in the Fund and to compare these costs with ongoing costs of investing in other mutual funds. The example is based on an investment of $1,000 invested at the beginning of the period and held for the entire period May 1, 2015 through October 31, 2015.
Actual expenses
The table below provides information about actual account values and actual expenses. You may use the information in this table, together with the amount you invested, to estimate the expenses that you paid over the period. Simply divide your account value by $1,000 (for example, an $8,600 account value divided by $1,000 = 8.6), then multiply the result by the number in the table under the heading entitled “Actual Expenses Paid During Period” to estimate the expenses you paid on your account during this period.
Hypothetical example for comparison purposes
The table below also provides information about hypothetical account values and hypothetical expenses based on the Fund’s actual expense ratio and an assumed rate of return of 5% per year before expenses, which is not the Fund’s actual return.
The hypothetical account values and expenses may not be used to estimate the actual ending account balance or expenses you paid for the period. You may use this information to compare the ongoing costs of investing in the Fund and other funds. To do so, compare this 5% hypothetical example with the 5% hypothetical examples that appear in the shareholder reports of the other funds.
Please note that the expenses shown in the table are meant to highlight your ongoing costs only and do not reflect any transaction costs, such as sales charges (loads) on purchase payments or contingent deferred sales charges on redemptions, if any. Therefore, the hypothetical information is useful in comparing ongoing costs only, and will not help you determine the relative total costs of owning different funds. In addition, if these transaction costs were included, your costs would have been higher.
| Class | Beginning Account Value (05/01/15) | ACTUAL | HYPOTHETICAL (5% annual return before expenses) | Annualized Expense Ratio | ||||||||||||||||||||
| Ending Account Value (10/31/15)1 | Expenses Paid During Period2 | Ending Account Value (10/31/15) | Expenses Paid During Period2 | |||||||||||||||||||||
A | $ | 1,000.00 | $ | 923.90 | $ | 6.26 | $ | 1,018.70 | $ | 6.56 | 1.29 | % | ||||||||||||
B | 1,000.00 | 920.30 | 9.87 | 1,014.92 | 10.36 | 2.04 | ||||||||||||||||||
C | 1,000.00 | 920.40 | 9.87 | 1,014.92 | 10.36 | 2.04 | ||||||||||||||||||
R | 1,000.00 | 922.70 | 7.46 | 1,017.44 | 7.83 | 1.54 | ||||||||||||||||||
Y | 1,000.00 | 924.90 | 5.05 | 1,019.96 | 5.30 | 1.04 | ||||||||||||||||||
R5 | 1,000.00 | 925.30 | 4.61 | 1,020.42 | 4.84 | 0.95 | ||||||||||||||||||
| R6 | 1,000.00 | 925.90 | 4.22 | 1,020.82 | 4.43 | 0.87 | ||||||||||||||||||
| 1 | The actual ending account value is based on the actual total return of the Fund for the period May 1, 2015 through October 31, 2015, after actual expenses and will differ from the hypothetical ending account value which is based on the Fund’s expense ratio and a hypothetical annual return of 5% before expenses. |
| 2 | Expenses are equal to the Fund’s annualized expense ratio as indicated above multiplied by the average account value over the period, multiplied by 184/365 to reflect the most recent fiscal half year. |
23 Invesco International Growth Fund
Approval of Investment Advisory and Sub-Advisory Contracts
The Board of Trustees (the Board) of AIM International Mutual Funds (Invesco International Mutual Funds) is required under the Investment Company Act of 1940, as amended, to approve annually the renewal of Invesco International Growth Fund’s (the Fund) investment advisory agreements. During contract renewal meetings held on June 9-10, 2015, the Board as a whole, and the disinterested or “independent” Trustees, who comprise over 75% of the Board, voting separately, approved the continuance for the Fund of the Master Investment Advisory Agreement with Invesco Advisers, Inc. (Invesco Advisers and the investment advisory agreement) and the Master Intergroup Sub-Advisory Contract for Mutual Funds with Invesco Asset Management Deutschland GmbH, Invesco Asset Management Limited, Invesco Asset Management (Japan) Limited, Invesco Hong Kong Limited, Invesco Senior Secured Management, Inc. and Invesco Canada Ltd. (collectively, the Affiliated Sub-Advisers and the sub-advisory contracts) for another year, effective July 1, 2015.
In evaluating the fairness and reasonableness of compensation under the Fund’s investment advisory agreement and sub-advisory contracts, the Board considered, among other things, the factors discussed below. The Board determined that continuation of the Fund’s investment advisory agreement and the sub-advisory contracts is in the best interest of the Fund and its shareholders and that the compensation payable to Invesco Advisers and the Affiliated Sub-Advisers under the agreements is fair and reasonable.
The Board’s Fund Evaluation Process
The Board’s Investments Committee has established three Sub-Committees, each of which is primarily responsible for overseeing the performance and investment management services provided by Invesco Advisers and the Affiliated Sub-Advisers to a number of the funds advised by Invesco Advisers (the Invesco Funds). The Sub-Committees meet throughout the year to review the performance of their assigned Invesco Funds, including reviewing materials prepared under the direction of the independent Senior Officer, an officer of the Invesco Funds who reports directly to the independent Trustees. Over the course of each year, the Sub-Committees meet with portfolio managers for their assigned Invesco Funds and other members of management to review the performance, investment objective(s), policies, strategies, limitations and investment risks of these funds. The Board had the benefit of reports from the Sub-Committees and Investments Committee throughout the year in considering approval of the continuance of each Invesco Fund’s investment advisory agreement and sub-advisory contracts for another year.
During the contract renewal process, the Board receives comparative performance and fee data regarding the Invesco Funds prepared by Invesco Advisers and Lipper Inc. (Lipper), an independent provider of investment company data. The Board also receives a report and this independent written evaluation from the Senior Officer. The Senior Officer’s evaluation is prepared as part of his responsibility to manage the process by which the Invesco Funds’ proposed management fees are negotiated during the annual contract renewal process to ensure they are negotiated in a manner that is at arms’ length and reasonable. In addition to meetings with Invesco Advisers and fund counsel, the independent Trustees also discuss the continuance of the investment advisory agreement and sub-advisory contracts in separate sessions with the Senior Officer and with independent legal counsel.
The Trustees recognized that the advisory fee rates for the Invesco Funds are, in many cases, the result of years of review and negotiation. The Trustees’ deliberations and conclusions in a particular year may be based in part on their deliberations and conclusions regarding these arrangements throughout the year and in prior years. The Trustees’ review and conclusions are based on the comprehensive consideration of all information presented to them and are not the result of any single determinative factor. Moreover, one Trustee may have weighed a particular piece of information or factor differently than another Trustee.
The discussion below is a summary of the Senior Officer’s independent written evaluation with respect to the Fund’s investment advisory agreement as well as a discussion of the material factors and related conclusions that formed the basis for the Board’s approval of the Fund’s investment advisory agreement and sub-advisory contracts. Unless otherwise stated, this information is current as of June 10, 2015, and does not reflect consideration of factors that became known to the Board after that date.
Factors and Conclusions and Summary of Independent Written Fee Evaluation
| A. | Nature, Extent and Quality of Services Provided by Invesco Advisers and the Affiliated Sub-Advisers |
The Board reviewed the advisory services provided to the Fund by Invesco Advisers under the Fund’s investment advisory agreement, the performance of Invesco Advisers in providing these services, and the credentials and experience of the officers and employees of Invesco Advisers who provide these services, including the Fund’s portfolio manager or managers. The Board’s review of the qualifications of Invesco Advisers to provide advisory services included the Board’s consideration of Invesco Advisers’ investment
process oversight, independent credit analysis and investment risk management. The Board also considered non-advisory services that Invesco Advisers and its affiliates provide to the Invesco Funds such as various back office support functions, equity and fixed income trading operations, internal audit, distribution, valuation and legal and compliance.
In determining whether to continue the Fund’s investment advisory agreement, the Board considered the benefits of reapproving an existing relationship and the greater uncertainty that may be associated with entering into a new relationship. The Board concluded that the nature, extent and quality of the services provided to the Fund by Invesco Advisers are appropriate and satisfactory and consistent with the terms of the Fund’s investment advisory agreement.
The Board reviewed the services that may be provided by the Affiliated Sub-Advisers under the sub-advisory contracts and the credentials and experience of the officers and employees of the Affiliated Sub-Advisers who provide these services. The Board noted that the Affiliated Sub-Advisers have offices and personnel that are located in financial centers around the world. As a result, the Affiliated Sub-Advisers can provide research and investment analysis on the markets and economies of various countries in which the Fund may invest, make recommendations regarding securities and assist with security trades. The Board concluded that the sub-advisory contracts benefit the Fund and its shareholders by permitting Invesco Advisers to use the resources and talents of the Affiliated Sub-Advisers in managing the Fund. The Board concluded that the nature, extent and quality of the services that may be provided by the Affiliated Sub-Advisers are appropriate and satisfactory and consistent with the terms of the Fund’s sub-advisory contracts.
| B. | Fund Performance |
The Board considered Fund performance as a relevant factor in considering whether to approve the investment advisory agreement. The Board did not view Fund performance as a relevant factor in considering whether to approve the sub-advisory contracts for the Fund, as no Affiliated Sub-Adviser currently manages assets of the Fund.
The Board compared the Fund’s performance during the past one, three and five calendar years to the performance of funds in the Lipper performance universe and against the Lipper International Large-Cap Growth Funds Index. The Board noted that performance of Class A shares of the Fund was in the first quintile of its performance universe for the one and five year periods and the third quintile for the three year period (the first quintile being the best performing funds and the fifth quintile being the worst performing funds). The Board noted that performance of Class A shares of the Fund was
24 Invesco International Growth Fund
above the performance of the Index for the one and five year periods and below the performance of the Index for the three year period. The Trustees also reviewed more recent Fund performance and this review did not change their conclusions.
| C. | Advisory and Sub-Advisory Fees |
The Board compared the Fund’s contractual management fee rate to the contractual management fee rates of funds in the Fund’s Lipper expense group at a common asset level. The Board noted that the contractual management fee rate for Class A shares of the Fund was below the median contractual management fee rate of funds in its expense group. The Board noted that the term “contractual management fee” may include both advisory and certain administrative services fees, but that Lipper does not provide information on a fund by fund basis as to what is included. The Board noted that Invesco Advisers does not charge the Invesco Funds for the administrative services included in the term as defined by Lipper. The Board also reviewed the methodology used by Lipper in providing expense group information, which includes using each fund’s contractual management fee schedule (including any applicable breakpoints) as reported in the most recent prospectus or statement of additional information for each fund in the expense group.
The Board also compared the Fund’s effective advisory fee rate (the advisory fee rate after advisory fee waivers and before other expense limitations/waivers) to the effective advisory fee rates of other funds advised by Invesco Advisers and its affiliates with investment strategies comparable to those of the Fund. The Board noted that the Fund’s rate was above the rate of one such mutual fund. The Board also noted how the Fund’s rate compared to the effective sub-adviser fee rate of other mutual funds sub-advised by Invesco Advisers.
The Board also considered the fees charged by Invesco Advisers and the Affiliated Sub-Advisers to other client accounts with investment strategies comparable to those of the Fund. The Board noted that Invesco Advisers or the Affiliated Sub-Advisers may charge lower fees to large institutional clients. Invesco Advisers reviewed with the Board the significantly greater scope of services it provides to the Invesco Funds relative to certain other types of client accounts. These additional services include provision of administrative services, officers and office space, oversight of service providers, preparation of annual registration statement updates and financial information and regulatory compliance under the Investment Company Act of 1940, as amended.
Invesco Advisers also reviewed generally the higher frequency of shareholder purchases and redemptions in the Invesco Funds relative to the flow of assets for other client accounts. Invesco Advisers advised the Board that advance notice of redemptions is often provided to Invesco Advisers by institutional clients. The Board did
note that sub-advisory fee rates charged by the Affiliated Sub-Advisers to manage the Invesco Funds and to manage other client accounts tended to be more comparable, reflecting a similar scope of services. The information received by the Board demonstrated that the aggregate services provided to the Invesco Funds were sufficiently different from those provided to institutional clients to support the difference in fees.
The Board also considered the services that may be provided by the Affiliated Sub-Advisers pursuant to the sub-advisory contracts, as well as the fees payable by Invesco Advisers to the Affiliated Sub-Advisers pursuant to the sub-advisory contracts. The Board also noted that the sub-advisory fees are not paid directly by the Fund, but rather, are payable by Invesco Advisers to the Affiliated Sub-Advisers.
| D. | Economies of Scale and Breakpoints |
The Board considered the extent to which there are economies of scale in the provision of advisory services to the Fund. The Board also considered whether the Fund benefits from economies of scale through contractual breakpoints in the Fund’s advisory fee schedule. The Board also noted that the Fund shares directly in economies of scale through lower fees charged by third party service providers based on the combined size of the Invesco Funds and other clients advised by Invesco Advisers.
| E. | Profitability and Financial Resources |
The Board reviewed information from Invesco Advisers concerning the costs of the advisory and other services that Invesco Advisers and its affiliates provide to the Fund and the Invesco Funds and the profitability of Invesco Advisers and its affiliates in providing these services. The Board received information from Invesco Advisers about the methodology used to prepare the profitability information. The Board noted that Invesco Advisers continues to operate at a net profit from services Invesco Advisers and its affiliates provide to the Invesco Funds and the Fund. The Board did not deem the level of profits realized by Invesco Advisers and its affiliates from providing services to the Fund to be excessive given the nature, quality and extent of the services provided. The Board received and accepted information from Invesco Advisers demonstrating that Invesco Advisers and each Affiliated Sub-Adviser are financially
sound and have the resources necessary to perform their obligations under the investment advisory agreement and sub-advisory contracts.
| F. | Collateral Benefits to Invesco Advisers and its Affiliates |
The Board considered various other benefits received by Invesco Advisers and its affiliates from the relationship with the Fund, including the fees received for providing transfer agency and distribution services to the Fund. The Board considered comparative information regarding fees charged for these services, including information provided by Lipper and other independent sources. The Board considered the performance of Invesco Advisers and its
affiliates in providing these services and the organizational structure employed to provide these services. The Board also considered that these services are provided to the Fund pursuant to written contracts that are reviewed and approved on an annual basis by the Board; and that the services are required for the operation of the Fund.
The Board considered the benefits realized by Invesco Advisers and the Affiliated Sub-Advisers as a result of portfolio brokerage transactions executed through “soft dollar” arrangements. The Board noted that soft dollar arrangements shift the payment obligation for research services from Invesco Advisers and the Affiliated Sub-Advisers to the Invesco Funds and that the research received may be used with other clients of Invesco Advisers and may reduce Invesco Advisers’ and the Affiliated Sub-Advisers’ expenses. The Board also considered that it receives periodic reports from the Chief Compliance Officer of the Invesco Funds demonstrating that these arrangements are consistent with regulatory requirements. The Board did not deem the soft dollar arrangements to be inappropriate.
The Board considered that the Fund’s uninvested cash and cash collateral from any securities lending arrangements may be invested in money market funds advised by Invesco Advisers pursuant to procedures approved by the Board. The Board noted that Invesco Advisers receives advisory fees from these affiliated money market funds attributable to such investments, although Invesco Advisers has contractually agreed to waive through varying periods the advisory fees payable by the Invesco Funds with respect to investments in the affiliated money market funds. The waiver is in an amount equal to 100% of the net advisory fee Invesco Advisers receives from the affiliated money market funds with respect to the Fund’s investment in the affiliated money market funds of uninvested cash, but not cash collateral. The Board concluded that the amount of advisory fees received by Invesco Advisors from the Fund’s investment of cash collateral from any securities lending arrangements in the affiliated money market funds is fair and reasonable.
The Board also considered the Fund may use an affiliated broker to execute certain trades for the Fund to, among other things, control information leakage, and were advised that such trades would be executed in compliance with rules under the Investment Company Act of 1940, as amended, and consistent with best execution obligations.
25 Invesco International Growth Fund
Tax Information
Form 1099-DIV, Form 1042-S and other year-end tax information provide shareholders with actual calendar year amounts that should be included in their tax returns. Shareholders should consult their tax advisors.
The following distribution information is being provided as required by the Internal Revenue Code or to meet a specific state’s requirement.
The Fund designates the following amounts or, if subsequently determined to be different, the maximum amount allowable for its fiscal year ended October 31, 2015:
Federal and State Income Tax | ||||
Long-Term Capital Gain Distributions | $ | 279,280,056 | ||
Qualified Dividend Income* | 100 | % | ||
Corporate Dividends Received Deduction* | 0 | % | ||
U.S. Treasury Obligations* | 0 | % | ||
Foreign Tax Credit | $ | 0.0604 | ||
Foreign Source Income | $ | 0.8374 | ||
| * | The above percentages are based on ordinary income dividends paid to shareholders during the Fund’s fiscal year. |
26 Invesco International Growth Fund
Trustees and Officers
The address of each trustee and officer is AIM International Mutual Funds (Invesco International Mutual Funds) (the “Trust”), 11 Greenway Plaza, Suite 1000, Houston, Texas 77046-1173. The trustees serve for the life of the Trust, subject to their earlier death, incapacitation, resignation, retirement or removal as more specifically provided in the Trust’s organizational documents. Each officer serves for a one year term or until their successors are elected and qualified. Column two below includes length of time served with predecessor entities, if any.
| Name, Year of Birth and Position(s) Held with the Trust | Trustee and/ or Officer Since | Principal Occupation(s) During Past 5 Years | Number of Funds in Fund Complex Overseen by Trustee | Other Directorship(s) Past 5 Years | ||||
| Interested Persons | ||||||||
Martin L. Flanagan1 — 1960 Trustee | 2007 | Executive Director, Chief Executive Officer and President, Invesco Ltd. (ultimate parent of Invesco and a global investment management firm); Advisor to the Board, Invesco Advisers, Inc. (formerly known as Invesco Institutional (N.A.), Inc.); Trustee, The Invesco Funds; Vice Chair, Investment Company Institute; and Member of Executive Board, SMU Cox School of Business
Formerly: Chairman and Chief Executive Officer, Invesco Advisers, Inc. (registered investment adviser); Director, Chairman, Chief Executive Officer and President, IVZ Inc. (holding company), INVESCO Group Services, Inc. (service provider) and Invesco North American Holdings, Inc. (holding company); Director, Chief Executive Officer and President, Invesco Holding Company Limited (parent of Invesco and a global investment management firm); Director, Invesco Ltd.; Chairman, Investment Company Institute and President, Co-Chief Executive Officer, Co-President, Chief Operating Officer and Chief Financial Officer, Franklin Resources, Inc. (global investment management organization). | 145 | None | ||||
Philip A. Taylor2 — 1954 Trustee, President and Principal Executive Officer | 2006 | Head of North American Retail and Senior Managing Director, Invesco Ltd.; Director, Co-Chairman, Co-President and Co-Chief Executive Officer, Invesco Advisers, Inc. (formerly known as Invesco Institutional (N.A.), Inc.) (registered investment adviser); Director, Chairman, Chief Executive Officer and President, Invesco Management Group, Inc. (formerly known as Invesco Aim Management Group, Inc.) (financial services holding company); Director and President, INVESCO Funds Group, Inc. (registered investment adviser and registered transfer agent); Director and Chairman, Invesco Investment Services, Inc. (formerly known as Invesco Aim Investment Services, Inc.) (registered transfer agent) and IVZ Distributors, Inc. (formerly known as INVESCO Distributors, Inc.) (registered broker dealer); Chief Executive Officer, Invesco Corporate Class Inc. (corporate mutual fund company) Director, Chairman and Chief Executive Officer, Invesco Canada Ltd. (formerly known as Invesco Trimark Ltd./Invesco Trimark Ltèe) (registered investment adviser and registered transfer agent); Trustee, President and Principal Executive Officer, The Invesco Funds (other than AIM Treasurer’s Series Trust (Invesco Treasurer’s Series Trust), Short-Term Investments Trust and Invesco Management Trust); Trustee and Executive Vice President, The Invesco Funds (AIM Treasurer’s Series Trust (Invesco Treasurer’s Series Trust), Short-Term Investments Trust and Invesco Management Trust only); Director, Invesco Investment Advisers LLC (formerly known as Van Kampen Asset Management); Director, Chief Executive Officer and President, Van Kampen Exchange Corp.
Formerly: Director, President and Chairman, Invesco Inc. (holding company), Invesco Canada Holdings Inc. (holding company), Trimark Investments Ltd./Placements Trimark Ltèe and Invesco Financial Services Ltd/Services Financiers Invesco Ltèe; Chiief Executive Officer, Invesco Canada Fund Inc (corporate mutual fund company); Director and Chairman, Van Kampen Investor Services Inc.; Director, Chief Executive Officer and President, 1371 Preferred Inc. (holding company) and Van Kampen Investments Inc.; Director and President, AIM GP Canada Inc. (general partner for limited partnerships) and Van Kampen Advisors, Inc.; Director and Chief Executive Officer, Invesco Trimark Dealer Inc. (registered broker dealer); Director, Invesco Distributors, Inc. (formerly known as Invesco Aim Distributors, Inc.) (registered broker dealer); Manager, Invesco PowerShares Capital Management LLC; Director, Chief Executive Officer and President, Invesco Advisers, Inc.; Director, Chairman, Chief Executive Officer and President, Invesco Aim Capital Management, Inc.; President, Invesco Trimark Dealer Inc. and Invesco Trimark Ltd./Invesco Trimark Ltèe; Director and President, AIM Trimark Corporate Class Inc. and AIM Trimark Canada Fund Inc.; Senior Managing Director, Invesco Holding Company Limited; Director and Chairman, Fund Management Company (former registered broker dealer); President and Principal Executive Officer, The Invesco Funds (AIM Treasurer’s Series Trust (Invesco Treasurer’s Series Trust), and Short-Term Investments Trust only); President, AIM Trimark Global Fund Inc. and AIM Trimark Canada Fund Inc.. | 145 | None |
| 1 | Mr. Flanagan is considered an interested person (within the meaning of Section 2(a)(19) of the 1940 Act) of the Trust because he is an officer of the Adviser to the Trust, and an officer and a director of Invesco Ltd., ultimate parent of the Adviser. |
| 2 | Mr. Taylor is considered an interested person (within the meaning of Section 2(a)(19) of the 1940 Act) of the Trust because he is an officer and a director of the Adviser. |
T-1 Invesco International Growth Fund
Trustees and Officers—(continued)
| Name, Year of Birth and Position(s) Held with the Trust | Trustee and/ or Officer Since | Principal Occupation(s) During Past 5 Years | Number of Funds in Fund Complex Overseen by Trustee | Other Directorship(s) Past 5 Years | ||||
| Independent Trustees | ||||||||
Bruce L. Crockett — 1944 Trustee and Chair | 2003 | Chairman, Crockett Technologies Associates (technology consulting company)
Formerly: Director, Captaris (unified messaging provider); Director, President and Chief Executive Officer, COMSAT Corporation; Chairman, Board of Governors of INTELSAT (international communications company); ACE Limited (insurance company); Independent Directors Council and Investment Company Institute | 145 | ALPS (Attorneys Liability Protection Society) (insurance company) and Globe Specialty Metals, Inc. (metallurgical company) | ||||
David C. Arch — 1945 Trustee | 2010 | Chairman of Blistex Inc., a consumer health care products manufacturer | 145 | Board member of the Illinois Manufacturers’ Association; Member of the Board of Visitors, Institute for the Humanities, University of Michigan; Member of the Audit Committee of the Edward-Elmhurst Hospital | ||||
James T. Bunch — 1942 Trustee | 2000 | Managing Member, Grumman Hill Group LLC (family office/private equity investments)
Formerly: Founder, Green Manning & Bunch Ltd. (investment banking firm) (1988-2010); Executive Committee, United States Golf Association; and Chairman, Board of Governors, Western Golf Association | 145 | Chairman of the Board of Trustees, Evans Scholars Foundation; and Chairman of the Board, Denver Film Society | ||||
Rodney F. Dammeyer — 1940 Trustee | 2010 | Chairman of CAC, LLC, (private company offering capital investment and management advisory services)
Formerly: Prior to 2001, Managing Partner at Equity Group Corporate Investments; Prior to 1995, Chief Executive Officer of Itel Corporation (formerly Anixter International); Prior to 1985, experience includes Senior Vice President and Chief Financial Officer of Household International, Inc., Executive Vice President and Chief Financial Officer of Northwest Industries, Inc. and Partner of Arthur Andersen & Co.; From 1987 to 2010, Director/Trustee of investment companies in the Van Kampen Funds complex | 145 | Director of Quidel Corporation and Stericycle, Inc. | ||||
Albert R. Dowden — 1941 Trustee | 2003 | Director of a number of public and private business corporations, including the Boss Group, Ltd. (private investment and management); Nature’s Sunshine Products, Inc. and Reich & Tang Funds (5 portfolios) (registered investment company)
Formerly: Director, Homeowners of America Holding Corporation/Homeowners of America Insurance Company (property casualty company); Director, Continental Energy Services, LLC (oil and gas pipeline service); Director, CompuDyne Corporation (provider of product and services to the public security market) and Director, Annuity and Life Re (Holdings), Ltd. (reinsurance company); Director, President and Chief Executive Officer, Volvo Group North America, Inc.; Senior Vice President, AB Volvo; Director of various public and private corporations; Chairman, DHJ Media, Inc.; Director, Magellan Insurance Company; and Director, The Hertz Corporation, Genmar Corporation (boat manufacturer), National Media Corporation; Advisory Board of Rotary Power International (designer, manufacturer, and seller of rotary power engines); and Chairman, Cortland Trust, Inc. (registered investment company) | 145 | Director of: Nature’s Sunshine Products, Inc., Reich & Tang Funds, Homeowners of America Holding Corporation/ Homeowners of America Insurance Company, the Boss Group | ||||
Jack M. Fields — 1952 Trustee | 2003 | Chief Executive Officer, Twenty First Century Group, Inc. (government affairs company); Owner and Chief Executive Officer, Dos Angeles Ranch, L.P. (cattle, hunting, corporate entertainment); and Discovery Global Education Fund (non-profit)
Formerly: Chief Executive Officer, Texana Timber LP (sustainable forestry company); Director of Cross Timbers Quail Research Ranch (non-profit); and member of the U.S. House of Representatives | 145 | Insperity, Inc. (formerly known as Administaff) | ||||
Prema Mathai-Davis — 1950 Trustee | 2003 | Retired. Formerly: Chief Executive Officer, YWCA of the U.S.A. | 145 | None | ||||
Larry Soll — 1942 Trustee | 1997 | Retired. Formerly: Chairman, Chief Executive Officer and President, Synergen Corp. (a biotechnology company) | 145 | None | ||||
Hugo F. Sonnenschein — 1940 Trustee | 2010 | President Emeritus and Honorary Trustee of the University of Chicago and the Adam Smith Distinguished Service Professor in the Department of Economics at the University of Chicago. Prior to 2000, President of the University of Chicago | 145 | Trustee of the University of Rochester and a member of its investment committee; Member of the National Academy of Sciences and the American Philosophical Society; Fellow of the American Academy of Arts and Sciences | ||||
Raymond Stickel, Jr. — 1944 Trustee | 2005 | Retired. Formerly: Director, Mainstay VP Series Funds, Inc. (25 portfolios) and Partner, Deloitte & Touche | 145 | None |
T-2 Invesco International Growth Fund
Trustees and Officers—(continued)
| Name, Year of Birth and Position(s) Held with the Trust | Trustee and/ or Officer Since | Principal Occupation(s) During Past 5 Years | Number of Funds in Fund Complex Overseen by Trustee | Other Directorship(s) Past 5 Years | ||||
| Independent Trustees—(continued) | ||||||||
Suzanne H. Woolsey — 1941 Trustee | 2014 | Chief Executive Officer of Woolsey Partners LLC | 145 | Emeritus Chair of the Board of Trustees of the Institute for Defense Analyses; Trustee of Colorado College; Trustee of California Institute of Technology; Prior to 2014, Director of Fluor Corp.; Prior to 2010, Trustee of the German Marshall Fund of the United States; Prior to 2010 Trustee of the Rocky Mountain Institute | ||||
| Other Officers | ||||||||
Russell C. Burk — 1958 Senior Vice President and Senior Officer | 2005 | Senior Vice President and Senior Officer, The Invesco Funds | N/A | N/A | ||||
John M. Zerr — 1962 Senior Vice President, Chief Legal Officer and Secretary | 2006 | Director, Senior Vice President, Secretary and General Counsel, Invesco Management Group, Inc. (formerly known as Invesco Aim Management Group, Inc.) and Van Kampen Exchange Corp.; Senior Vice President, Invesco Advisers, Inc. (formerly known as Invesco Institutional (N.A.), Inc.) (registered investment adviser); Senior Vice President and Secretary, Invesco Distributors, Inc. (formerly known as Invesco Aim Distributors, Inc.); Director, Vice President and Secretary, Invesco Investment Services, Inc. (formerly known as Invesco Aim Investment Services, Inc.) and IVZ Distributors, Inc. (formerly known as INVESCO Distributors, Inc.); Director and Vice President, INVESCO Funds Group, Inc.; Senior Vice President, Chief Legal Officer and Secretary, The Invesco Funds; Managing Director, Invesco PowerShares Capital Management LLC; Director, Secretary and General Counsel, Invesco Investment Advisers LLC (formerly known as Van Kampen Asset Management); Secretary and General Counsel, Invesco Capital Markets, Inc. (formerly known as Van Kampen Funds Inc.) and Chief Legal Officer, PowerShares Exchange-Traded Fund Trust, PowerShares Exchange-Traded Fund Trust II, PowerShares India Exchange-Traded Fund Trust, PowerShares Actively Managed Exchange-Traded Fund Trust, and PowerShares Actively Managed Exchange-Traded Commodity Fund Trust
Formerly: Director and Vice President, Van Kampen Advisors Inc.; Director, Vice President, Secretary and General Counsel, Van Kampen Investor Services Inc.; Director, Invesco Distributors, Inc. (formerly known as Invesco Aim Distributors, Inc.); Director, Senior Vice President, General Counsel and Secretary, Invesco Aim Advisers, Inc. and Van Kampen Investments Inc.; Director, Vice President and Secretary, Fund Management Company; Director, Senior Vice President, Secretary, General Counsel and Vice President, Invesco Aim Capital Management, Inc.; Chief Operating Officer and General Counsel, Liberty Ridge Capital, Inc. (an investment adviser); Vice President and Secretary, PBHG Funds (an investment company) and PBHG Insurance Series Fund (an investment company); Chief Operating Officer, General Counsel and Secretary, Old Mutual Investment Partners (a broker-dealer); General Counsel and Secretary, Old Mutual Fund Services (an administrator) and Old Mutual Shareholder Services (a shareholder servicing center); Executive Vice President, General Counsel and Secretary, Old Mutual Capital, Inc. (an investment adviser); and Vice President and Secretary, Old Mutual Advisors Funds (an investment company) | N/A | N/A | ||||
Sheri Morris — 1964 Vice President, Treasurer and Principal Financial Officer | 2003 | Vice President, Treasurer and Principal Financial Officer, The Invesco Funds; Vice President, Invesco Advisers, Inc. (formerly known as Invesco Institutional (N.A.), Inc.) (registered investment adviser); and Vice President, PowerShares Exchange-Traded Fund Trust, PowerShares Exchange-Traded Fund Trust II, PowerShares India Exchange-Traded Fund Trust, PowerShares Actively Managed Exchange-Traded Fund Trust, and PowerShares Actively Managed Exchange-Traded Commodity Fund Trust
Formerly: Vice President, Invesco Aim Advisers, Inc., Invesco Aim Capital Management, Inc. and Invesco Aim Private Asset Management, Inc.; Assistant Vice President and Assistant Treasurer, The Invesco Funds and Assistant Vice President, Invesco Advisers, Inc., Invesco Aim Capital Management, Inc. and Invesco Aim Private Asset Management, Inc.; and Treasurer, PowerShares Exchange-Traded Fund Trust, PowerShares Exchange-Traded Fund Trust II, PowerShares India Exchange-Traded Fund Trust and PowerShares Actively Managed Exchange-Traded Fund Trust | N/A | N/A | ||||
T-3 Invesco International Growth Fund
Trustees and Officers—(continued)
| Name, Year of Birth and Position(s) Held with the Trust | Trustee and/ or Officer Since | Principal Occupation(s) During Past 5 Years | Number of Funds in Fund Complex Overseen by Trustee | Other Directorship(s) Past 5 Years | ||||
| Other Officers—(continued) | ||||||||
Karen Dunn Kelley — 1960 Vice President | 2003 | Senior Managing Director, Investments, Invesco Ltd.; Director, Co-President, Co-Chief Executive Officer, and Co-Chairman, Invesco Advisers, Inc. (formerly known as Invesco Institutional (N.A.), Inc.) (registered investment adviser); Chairman, Invesco Senior Secured Management, Inc.; Senior Vice President, Invesco Management Group, Inc. (formerly known as Invesco Aim Management Group, Inc.); Executive Vice President, Invesco Distributors, Inc. (formerly known as Invesco Aim Distributors, Inc.); Director, Invesco Mortgage Capital Inc. and Invesco Management Company Limited; Vice President, The Invesco Funds (other than AIM Treasurer’s Series Trust (Invesco Treasurer’s Series Trust), Short-Term Investments Trust and Invesco Management Trust); and President and Principal Executive Officer, The Invesco Funds (AIM Treasurer’s Series Trust (Invesco Treasurer’s Series Trust), Short-Term Investments Trust and Invesco Management Trust only)
Formerly: Director and President, INVESCO Asset Management (Bermuda) Ltd., Director, INVESCO Global Asset Management Limited and INVESCO Management S.A.; Senior Vice President, Van Kampen Investments Inc. and Invesco Advisers, Inc. (formerly known as Invesco Institutional (N.A.), Inc.) (registered investment adviser); Vice President, Invesco Advisers, Inc. (formerly known as Invesco Institutional (N.A.), Inc.); Director of Cash Management and Senior Vice President, Invesco Advisers, Inc. and Invesco Aim Capital Management, Inc.; Director and President, Fund Management Company; Chief Cash Management Officer, Director of Cash Management, Senior Vice President, and Managing Director, Invesco Aim Capital Management, Inc.; Director of Cash Management, Senior Vice President, and Vice President, Invesco Advisers, Inc. and The Invesco Funds (AIM Treasurer’s Series Trust (Invesco Treasurer’s Series Trust), and Short-Term Investments Trust only) | N/A | N/A | ||||
Crissie M. Wisdom — 1969 Anti-Money Laundering Compliance Officer | 2013 | Anti-Money Laundering Compliance Officer, Invesco Advisers, Inc. (formerly known as Invesco Institutional (N.A.), Inc.) (registered investment adviser), Invesco Capital Markets, Inc. (formerly known as Van Kampen Funds Inc.), Invesco Distributors, Inc., Invesco Investment Services, Inc., Invesco Management Group, Inc., Van Kampen Exchange Corp., The Invesco Funds, and PowerShares Exchange-Traded Fund Trust, PowerShares Exchange-Traded Fund Trust II, PowerShares India Exchange-Traded Fund Trust, PowerShares Actively Managed Exchange-Traded Fund Trust and PowerShares Actively Managed Exchange-Traded Commodity Fund Trust; Anti-Money Laundering Compliance Officer and Bank Secrecy Act Officer, INVESCO National Trust Company and Invesco Trust Company; and Fraud Prevention Manager and Controls and Risk Analysis Manager for Invesco Investment Services, Inc.. | N/A | N/A | ||||
Lisa O. Brinkley — 1959 Chief Compliance Officer | 2015 | Senior Vice President and Chief Compliance Officer, Invesco Advisers, Inc. (registered investment adviser) (formerly known as Invesco Institutional (N.A., Inc.); and Chief Compliance Officer, The Invesco Funds
Formerly: Global Assurance Officer, Invesco Ltd. and Vice President, The Invesco Funds; Chief Compliance Officer, Invesco Distributors, Inc. (formerly known as Invesco Aim Distributors, Inc.), Invesco Investment Services, Inc.(formerly known as Invesco Aim Investment Services, Inc.) and Van Kampen Investor Services Inc.; Senior Vice President, Invesco Management Group, Inc.; Senior Vice President and Chief Compliance Officer, Invesco Advisers, Inc. and The Invesco Funds; Vice President and Chief Compliance Officer, Invesco Aim Capital Management, Inc. and Invesco Distributors, Inc.; Vice President, Invesco Investment Services, Inc. and Fund Management Company. | N/A | N/A |
The Statement of Additional Information of the Trust includes additional information about the Fund’s Trustees and is available upon request, without charge, by calling 1.800.959.4246. Please refer to the Fund’s prospectus for information on the Fund’s sub-advisers.
Office of the Fund 11 Greenway Plaza, Suite 1000 Houston, TX 77046-1173 | Investment Adviser Invesco Advisers, Inc. 1555 Peachtree Street, N.E. Atlanta, GA 30309 | Distributor Invesco Distributors, Inc. 11 Greenway Plaza, Suite 1000 Houston, TX 77046-1173 | Auditors PricewaterhouseCoopers LLP 1000 Louisiana Street, Suite 5800 Houston, TX 77002-5678 | |||
Counsel to the Fund Stradley Ronon Stevens & Young, LLP 2005 Market Street, Suite 2600 Philadelphia, PA 19103-7018 | Counsel to the Independent Trustees Goodwin Procter LLP 901 New York Avenue, N.W. Washington, D.C. 20001 | Transfer Agent Invesco Investment Services, Inc. 11 Greenway Plaza, Suite 1000 Houston, TX 77046-1173 | Custodian State Street Bank and Trust Company 225 Franklin Street Boston, MA 02110-2801 | |||
T-4 Invesco International Growth Fund

Invesco mailing information
Send general correspondence to Invesco Investment Services, Inc., P.O. Box 219078, Kansas City, MO 64121-9078.
Important notice regarding delivery of security holder documents
To reduce Fund expenses, only one copy of most shareholder documents may be mailed to shareholders with multiple accounts at the same address (Householding). Mailing of your shareholder documents may be householded indefinitely unless you instruct us otherwise. If you do not want the mailing of these documents to be combined with those for other members of your household, please contact Invesco Investment Services, Inc. at 800 959 4246 or contact your financial institution. We will begin sending you individual copies for each account within 30 days after receiving your request.
Fund holdings and proxy voting information
The Fund provides a complete list of its holdings four times in each fiscal year, at the quarter ends. For the second and fourth quarters, the lists appear in the Fund’s semiannual and annual reports to shareholders. For the first and third quarters, the Fund files the lists with the Securities and Exchange Commission (SEC) on Form N-Q. The most recent list of portfolio holdings is available at invesco.com/completeqtrholdings. Shareholders can also look up the Fund’s Forms N-Q on the SEC website at sec.gov. Copies of the Fund’s Forms N-Q may be reviewed and copied at the SEC Public Reference Room in Washington, D.C. You can obtain information on the operation of the Public Reference Room, including information about duplicating fee charges, by calling 202 551 8090 or 800 732 0330, or by electronic request at the following email address: publicinfo@sec.gov. The SEC file numbers for the Fund are shown below.
A description of the policies and procedures that the Fund uses to determine how to vote proxies relating to portfolio securities is available without charge, upon request, from our Client Services department at 800 959 4246 or at invesco.com/proxyguidelines. The information is also available on the SEC website, sec.gov.
Information regarding how the Fund voted proxies related to its portfolio securities during the most recent 12-month period ended June 30 is available at invesco.com/proxysearch. The information is also available on the SEC website, sec.gov. Invesco Advisers, Inc. is an investment adviser; it provides investment advisory services to individual and institutional clients and does not sell securities. Invesco Distributors, Inc. is the US distributor for Invesco Ltd.’s retail mutual funds, exchange-traded funds and institutional money market funds. Both are wholly owned, indirect subsidiaries of Invesco Ltd. |  |
SEC file numbers: 811-06463 and 033-44611 IGR-AR-1 Invesco Distributors, Inc.
| ||||
 | Annual Report to Shareholders
| October 31, 2015 | ||
| ||||
Invesco Select Opportunities Fund
| ||||
| Nasdaq: | ||||
| A: IZSAX n C: IZSCX n R: IZSRX n Y: IZSYX n R5: IZSIX n R6: IZFSX | ||||

Letters to Shareholders
Philip Taylor | Dear Shareholders: This annual report includes information about your Fund, including performance data and a complete list of its investments as of the close of the reporting period. Inside is a discussion of how your Fund was managed and the factors that affected its performance during the reporting period. I hope you find this report of interest. The US economy expanded and unemployment declined throughout the reporting period. Continuing low energy prices benefited consumers, but a strong US dollar crimped corporate profits. The US Federal Reserve signaled that it was increasingly likely to raise interest rates, based on generally positive economic data, but uncertainty remained about when it might act. Overseas, the story was much different. Low energy prices hurt the economies of some oil-producing nations, such as Brazil and Russia. During the reporting period, the European Central | |
Bank as well as central banks in China and Japan – among other countries – either instituted or maintained extraordinarily accommodative monetary policies in response to economic weakness. Investor uncertainty, such as we saw for much of the reporting period – and market volatility, such as we saw at the end of the reporting period – are unfortunate facts of life when it comes to investing. Some investors use these things as excuses to delay saving and investing for their long-term financial goals. That’s why Invesco encourages investors to work with a professional financial adviser who can stress the importance of starting to save and invest early and the importance of adhering to a disciplined investment plan – when times are good and when they’re uncertain. A financial adviser who knows your unique financial situation, investment goals and risk tolerance can be an invaluable partner as you seek to achieve your financial goals. He or she can offer a long-term perspective when markets are volatile and time-tested advice and guidance when your financial situation or investment goals change. | ||

Timely information when and where you want it
Invesco’s efforts to help investors achieve their financial objectives include providing individual investors and financial professionals with timely information about the markets, the economy and investing – whenever and wherever they want it.
Our website, invesco.com/us, offers a wide range of market insights and investment perspectives. On the website, you’ll find detailed information about our funds, including prices, performance, holdings and portfolio manager commentaries. You can access information about your account by completing a simple, secure online registration. Click on the “Need to register” link in the “Account Access” box on our homepage to get started.
Invesco’s mobile apps for iPhone® and iPad® (both available free from the App StoreSM) allow you to obtain the same detailed information, monitor your account and create customizable watch lists. Also, they allow you to access investment insights from our investment leaders, market strategists, economists and retirement experts. You can sign up to be alerted when new commentary is added, and you can watch portfolio manager videos and have instant access to Invesco news and updates wherever you may be.
In addition to the resources accessible on our website and through our mobile app, you can obtain timely updates to help you stay informed about the markets, the economy and investing by connecting with Invesco on Twitter, LinkedIn or Facebook. You can access our blog at blog.invesco.us.com. Our goal is to provide you the information you want, when and where you want it.
Have questions?
For questions about your account, feel free to contact an Invesco client services representative at 800 959 4246. For Invesco-related questions or comments, please email me directly at phil@invesco.com.
All of us at Invesco look forward to serving your investment management needs for many years to come. Thank you for investing with us.
Sincerely,

Philip Taylor
Senior Managing Director, Invesco Ltd.
iPhone and iPad are trademarks of Apple Inc., registered in the US and other countries. App Store is a service mark of Apple Inc. Invesco Distributors, Inc. is not affiliated with Apple Inc.
| 2 Invesco Select Opportunities Fund |
Bruce Crockett | Dear Fellow Shareholders: Among the many important lessons I’ve learned in more than 40 years in a variety of business endeavors is the value of a trusted advocate. As independent chair of the Invesco Funds Board, I can assure you that the members of the Board are strong advocates for the interests of investors in Invesco’s mutual funds. We work hard to represent your interests through oversight of the quality of the investment management services your funds receive and other matters important to your investment, including but not limited to: n Ensuring that Invesco offers a diverse lineup of mutual funds that your financial adviser can use to strive to meet your financial needs as your investment goals change over time. n Monitoring how the portfolio management teams of the Invesco funds are performing in light of changing economic and market conditions. |

| n | Assessing each portfolio management team’s investment performance within the context of the investment strategy described in the fund’s prospectus. |
| n | Monitoring for potential conflicts of interests that may impact the nature of the services that your funds receive. |
We believe one of the most important services we provide our fund shareholders is the annual review of the funds’ advisory and sub-advisory contracts with Invesco Advisers and its affiliates. This review is required by the Investment Company Act of 1940 and focuses on the nature and quality of the services Invesco provides as the adviser to the Invesco funds and the reasonableness of the fees that it charges for those services. Each year, we spend months carefully reviewing information received from Invesco and a variety of independent sources, such as performance and fee data prepared by Lipper Inc., an independent, third-party firm widely recognized as a leader in its field. We also meet with our independent legal counsel and other independent advisers to review and help us assess the information that we have received. Our goal is to assure that you receive quality investment management services for a reasonable fee.
I trust the measures outlined above provide assurance that you have a worthy advocate when it comes to choosing the Invesco Funds.
As always, please contact me at bruce@brucecrockett.com with any questions or concerns you may have. On behalf of the Board, we look forward to continuing to represent your interests and serving your needs.
Sincerely,

Bruce L. Crockett
Independent Chair
Invesco Funds Board of Trustees
| 3 Invesco Select Opportunities Fund |
Management’s Discussion of Fund Performance
Performance summary
For the fiscal year ended October 31, 2015, Class A shares of Invesco Select Opportunities Fund (the Fund), at net asset value (NAV), underperformed the Fund’s broad market, style-specific and peer group benchmarks, the MSCI World Index, the MSCI World Small Cap Index and the Lipper Global Small/Mid-Cap Funds Classification Average, respectively.
Your Fund’s long-term performance appears later in this report.
Fund vs. Indexes
Total returns, 10/31/14 to 10/31/15, at net asset value (NAV). Performance shown does not include applicable contingent deferred sales charges (CDSC) or front-end sales charges, which would have reduced performance.
Class A Shares | -9.07 | % | |||
Class C Shares | -9.70 | ||||
Class R Shares | -9.32 | ||||
Class Y Shares | -8.82 | ||||
Class R5 Shares | -8.89 | ||||
Class R6 Shares | -8.82 | ||||
| MSCI World Index▼ (Broad Market Index) | 1.77 | ||||
| MSCI World Small Cap Index▼ (Style-Specific Index) | 2.15 | ||||
| Lipper Global Small/Mid-Cap Funds Classification Average¢ (Peer Group) | -0.85 | ||||
| Source(s): ▼FactSet Research Systems Inc.; ¢Lipper Inc. | |||||
Market conditions and your Fund
Global markets experienced increased volatility during the fiscal year ended October 31, 2015, driven largely by the continued slowdown in energy markets and the economic downturn in China. Developed markets were generally able to withstand these headwinds, even as more fragile emerging markets began to falter.
As the reporting period began in late 2014, international equity markets moved higher, although economic growth appeared to be somewhat stronger in the US than in the rest of the world. Equity markets globally were recovering from the initial crash of oil prices when OPEC added additional uncertainty by deciding to maintain high production despite low prices and slowing global growth. In this environment, commodity-based economies and most currencies underperformed those of the US.
Global markets were rattled again amid
growing concerns that Greece and the eurozone would fail to reach an agreement on a financial bailout plan. However, those fears subsided when a bailout was ultimately approved. The eurozone also benefited from generally positive economic data, which helped markets weather subsequent economic volatility.
In the summer of 2015, fears of a potential economic slowdown in China dominated headlines. The combination of a slowing Chinese economy, a sharp sell-off in domestic Chinese equities and the devaluation of China’s currency, the renminbi, contributed to a strong correction in global equity markets. Emerging markets, in particular, were hard hit by events in China and by continued weak commodity prices – as well as by the US Federal Reserve’s decision to delay raising interest rates, which increased investor uncertainty and market volatility.
We view ourselves as business people buying businesses, and we consider the
purchase of a stock as an ownership interest in a business. We strive to develop a proprietary view of a business through in-depth, fundamental research that includes careful financial statement analysis and meetings with company management. We then seek to purchase businesses whose stock prices are below what we have calculated to be the true value of the company based on its future free cash flows.
Our investment approach focuses on individual businesses rather than market sectors. Therefore, your Fund shares little in common with sector and regional weightings of various market indexes. However, if we were to broadly categorize businesses with which we had the most success during the reporting period, our investments in select health care, materials and industrials stocks were the largest contributors to Fund performance. Select holdings in the energy, industrials and information technology (IT) sectors were the largest detractors from results. From a regional perspective, we had the most success in European investments and the least success in the North American region.
UDG Healthcare was one of the largest contributors to Fund performance during the reporting period. The company provides services to health care manufacturers and pharmaceutical retailers with operations in over 20 countries. UDG Healthcare sold its drug distribution and wholesaling businesses and is now focused on outsourced sales management and contract packaging for the pharmaceutical industry. The business was sold to McKesson (not a Fund holding) for full value. This completes UDG Healthcare’s transition away from an Irish-centric drug distributor to an international pharmaceutical outsourcer.
Materials sector holding Alent was also among the Fund’s best performers. Alent is a global supplier of specialty chemicals and engineered materials used primarily
| Portfolio Composition | ||||||
By sector
| % of total net assets | |||||
Information Technology | 22.4 | % | ||
Energy | 14.7 | |||
Industrials | 10.9 | |||
Financials | 10.0 | |||
Consumer Discretionary | 7.4 | |||
Health Care | 7.4 | |||
Materials | 5.5 | |||
| Money Market Funds Plus Other Assets Less Liabilities | 21.7 |
| Top 10 Equity Holdings* | ||||
% of total net assets
| ||||
1. | Encore Capital Group, Inc. | 6.4 | % | |||
2. | Booz Allen Hamilton Holding Corp. | 4.4 | ||||
3. | GasLog Ltd. | 4.2 | ||||
4. | SBM Offshore N.V. | 4.1 | ||||
5. | Alere, Inc. | 3.9 | ||||
6. | Aalberts Industries N.V. | 3.9 | ||||
7. | Microsemi Corp. | 3.8 | ||||
8. | Mitel Networks Corp. | 3.7 | ||||
9. | UDG Healthcare PLC | 3.5 | ||||
10. | Hollysys Automation Technologies Ltd. | 3.3 |
Total Net Assets | $59.9 million | ||||
| Total Number of Holdings* | 26 | ||||
The Fund’s holdings are subject to change, and there is no assurance that the Fund will continue to hold any particular security.
*Excluding money market fund holdings.
Data presented here are as of October 31, 2015.
| 4 Invesco Select Opportunities Fund |
in the electronics, automotive and industrial end-market segments. Alent’s share price rose after the announcement that it would be acquired by Platform (not a Fund holding) and we sold out of our position by the end of the reporting period.
Industrials company DCC strongly contributed to Fund performance for the reporting period. DCC is the largest distributor of heating oil in the UK. Shares of the company rose on the announcement of the acquisition of a large French gas distributor that further diversifies DCC’s energy distribution business outside the UK; this is expected to be accretive to earnings. DCC has a strong balance sheet and operates in highly fragmented industries, and thus should have the opportunity to continue to make more value-creating acquisitions.
Energy sector company Ultra Petroleum, industrials sector company Performant Financial and IT sector company Rovi were the largest detractors from Fund performance during the reporting period.
Ultra Petroleum is a low-cost US natural gas producer with some exposure to oil assets. The company’s share price declined in sympathy with oil prices. Though Ultra Petroleum focuses mainly on natural gas, there is a link with oil prices because they are substitutable commodities. We have confidence in the company’s long-term fundamentals because it has over 25 years of reserves from its existing land base, giving it the flexibility to wait out low energy prices for an extended period. We added to the Fund’s position in Ultra Petroleum on price weakness.
Performant Financial provides technology-enabled recovery and related analytical services to identify and recover delinquent or defaulted assets and improper payments for government and private clients. The company’s share price declined for several reasons, the first being management’s proposal to acquire a private firm that offers prepayment auditing for commercial health plans. While there is some merit to the business combination, we objected to the deal because it was predominately equity-financed, at a time when the company’s stock was grossly undervalued, which would have negatively impacted current shareholders. While the deal was subsequently rejected, the company’s share price has not fully recovered. Performant Financial was also hurt by a delay in awarding the new Department of Education contract on student lending rehabilitation, which the company has been expecting for a
number of months. We believe the market is being short-sighted and ignoring the long-term earnings capacity of the business.
Rovi is focused on delivering solutions that enable consumers to intuitively connect to new entertainment from many sources and locations. Shares of the company declined after it released updates about ongoing litigation against Netflix (not a Fund holding) for five patents. These five patents are only a handful of Rovi’s 5,000+ patents, and not necessarily the most critical ones. We believe markets overreacted to the news, and added to our position in Rovi.
During the fiscal year, we made some new investments and added to some of our existing holdings. We also sold several holdings based on valuations and other factors. The Fund’s large cash position was a result of existing holdings being acquired by other companies not held by the Fund over the past few years and therefore removed or sold from the portfolio as well as a lack of opportunities as markets continued to rise. We believe the cash may act as a shock absorber in the next market correction, while providing us with the ability to invest in attractive opportunities as they present themselves.
We continued to focus on finding quality businesses trading at attractive values relative to what we believe are their long-term prospects. In contrast, the market is often driven by short-term events or outlooks in both good times and bad. Market volatility allows us to take advantage of investment opportunities we believe will benefit your Fund in the long term.
While we can never predict future Fund performance, we pledge to you that we will adhere to our discipline of being business people who buy businesses; we will continually strive to upgrade the quality of your Fund’s portfolio.
Thank you for your investment in Invesco Select Opportunities Fund and for sharing our long-term investment perspective.
The views and opinions expressed in management’s discussion of Fund performance are those of Invesco Advisers, Inc. These views and opinions are subject to change at any time based on factors such as market and economic conditions. These views and opinions may not be relied upon as investment advice or recommendations, or as an offer for a particular security. The information is not a complete analysis of every aspect of any market, country, industry, security or the Fund. Statements of fact are from sources considered reliable, but Invesco Advisers, Inc. makes no representation or warranty as to their completeness or accuracy. Although historical performance is no guarantee of future results, these insights may help you understand our investment management philosophy.
See important Fund and, if applicable, index disclosures later in this report.
 | Virginia Au Chartered Financial Analyst, Portfolio Manager, is lead manager of Invesco Select Opportunities | |
| Fund. She joined Invesco in 2006. Ms. Au earned a Bachelor of Commerce degree in finance from The University of British Columbia. | ||
 | Robert Mikalachki Chartered Financial Analyst, Portfolio Manager, is manager of Invesco Select Opportunities Fund. He | |
| joined Invesco in 1999. Mr. Mikalachki earned a business degree from Wilfrid Laurier University. | ||
 | Jason Whiting Chartered Financial Analyst, Portfolio Manager, is manager of Invesco Select Opportunities Fund. | |
| He joined Invesco in 2003. Mr. Whiting earned a BBA from Wilfrid Laurier University. | ||
| 5 Invesco Select Opportunities Fund |
Your Fund’s Long-Term Performance
Results of a $10,000 Investment – Oldest Share Class(es) since Inception
Fund and index data from 8/3/12
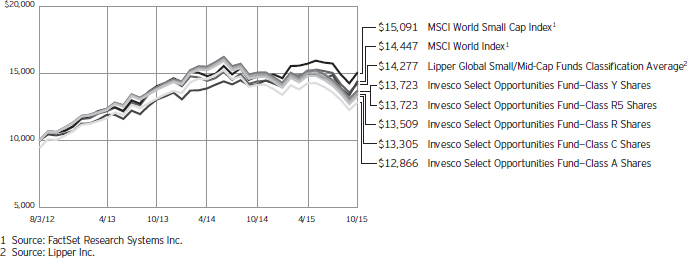
Past performance cannot guarantee comparable future results.
The data shown in the chart include reinvested distributions, applicable sales charges and Fund expenses including
management fees. Index results include reinvested dividends, but they do not reflect sales charges. Performance of the peer group, if applicable, reflects fund expenses and management fees;
performance of a market index does not. Performance shown in the chart and table(s) does not reflect deduction of taxes a shareholder would pay on Fund distributions or sale of Fund shares.
continued from page 8
| ¢ | The Lipper Global Small/Mid-Cap Funds Classification Average represents an average of all the funds in the Lipper Global Small/Mid-Cap Funds classification. |
| ¢ | The Fund is not managed to track the performance of any particular index, including the index(es) described here, and consequently, the performance of the Fund may deviate significantly from the performance of the index(es). |
| ¢ | A direct investment cannot be made in an index. Unless otherwise indicated, index results include reinvested dividends, and they do not reflect sales charges. Performance of the peer group, if applicable, reflects fund expenses; performance of a market index does not. |
Other information
| ¢ | The returns shown in management’s discussion of Fund performance are based on net asset values (NAVs) calculated for shareholder transactions. Generally accepted accounting principles require adjustments to be made to the net assets of the Fund at period end for financial reporting purposes, and as such, the NAVs for shareholder transactions and the returns based on those NAVs may differ from the NAVs and returns reported in the Financial Highlights. |
| ¢ | Industry classifications used in this report are generally according to the Global Industry Classification Standard, which was developed by and is the exclusive property and a service mark of MSCI Inc. and Standard & Poor’s. |
6 Invesco Select Opportunities Fund |
Average Annual Total Returns As of 10/31/15, including maximum applicable | |||||
| Class A Shares | |||||
| Inception (8/3/12) | 8.08 | % | |||
| 1 Year | -14.09 | ||||
| Class C Shares | |||||
| Inception (8/3/12) | 9.20 | % | |||
| 1 Year | -10.58 | ||||
| Class R Shares | |||||
| Inception (8/3/12) | 9.72 | % | |||
| 1 Year | -9.32 | ||||
| Class Y Shares | |||||
| Inception (8/3/12) | 10.25 | % | |||
| 1 Year | -8.82 | ||||
| Class R5 Shares | |||||
| Inception (8/3/12) | 10.25 | % | |||
| 1 Year | -8.89 | ||||
| Class R6 Shares | |||||
| Inception | 10.25 | % | |||
| 1 Year | -8.82 | ||||
Class R6 shares incepted on September 24, 2012. Performance shown prior to that date is that of Class A shares and includes the 12b-1 fees applicable to Class A shares.
The performance data quoted represent past performance and cannot guarantee comparable future results; current performance may be lower or higher. Please visit invesco.com/performance for the most recent month-end performance. Performance figures reflect reinvested distributions, changes in net asset value and the effect of the maximum sales charge unless otherwise stated. Investment return and principal value will fluctuate so that you may have a gain or loss when you sell shares.
The net annual Fund operating expense ratio set forth in the most recent Fund prospectus as of the date of this report for Class A, Class C, Class R, Class Y, Class R5 and Class R6 shares was 1.51%, 2.26%, 1.76%, 1.26%, 1.26%, and 1.26%, respectively.1,2 The total annual Fund operating expense ratio set forth in the most recent Fund prospectus as of the date of this report for Class A, Class C, Class R, Class Y, Class R5 and Class R6 shares was 2.28%, 3.03%, 2.53%, 2.03%, 1.91% and 1.87%, respectively. The expense ratios presented above may vary from the expense ratios presented in other sections of
| Average Annual Total Returns As of 9/30/15, the most recent calendar quarter | |||||
| Class A Shares | |||||
| Inception (8/3/12) | 6.75 | % | |||
| 1 Year | -17.13 | ||||
| Class C Shares | |||||
| Inception (8/3/12) | 7.91 | % | |||
| 1 Year | -13.81 | ||||
| Class R Shares | |||||
| Inception (8/3/12) | 8.42 | % | |||
| 1 Year | -12.55 | ||||
| Class Y Shares | |||||
| Inception (8/3/12) | 8.96 | % | |||
| 1 Year | -12.03 | ||||
| Class R5 Shares | |||||
| Inception (8/3/12) | 8.96 | % | |||
| 1 Year | -12.09 | ||||
| Class R6 Shares | |||||
| Inception | 8.96 | % | |||
| 1 Year | -12.03 | ||||
this report that are based on expenses incurred during the period covered by this report.
Class A share performance reflects the maximum 5.50% sales charge, and Class C share performance reflects the applicable contingent deferred sales charge (CDSC) for the period involved. The CDSC on Class C shares is 1% for the first year after purchase. Class R, Class Y, Class R5 and Class R6 shares do not have a front-end sales charge or a CDSC; therefore, performance is at net asset value.
The performance of the Fund’s share classes will differ primarily due to different sales charge structures and class expenses.
Fund performance reflects any applicable fee waivers and/or expense reimbursements. Had the adviser not waived fees and/or reimbursed expenses currently or in the past, returns would have been lower. See current prospectus for more information.
| 1 | Total annual Fund operating expenses after any contractual fee waivers and/or expense reimbursements by the adviser in effect through at least February 28, 2017. See current prospectus for more information. |
| 2 | Total annual Fund operating expenses after any contractual fee waivers and/or expense reimbursements by the adviser in effect through at least June 30, 2017. See current prospectus for more information. |
| 7 Invesco Select Opportunities Fund |
Invesco Select Opportunities Fund’s investment objective is long-term growth of capital.
| n | Unless otherwise stated, information presented in this report is as of October 31, 2015, and is based on total net assets. |
| n | Unless otherwise noted, all data provided by Invesco. |
| n | To access your Fund’s reports/prospectus, visit invesco.com/fundreports. |
About share classes
| n | Class R shares are generally available only to employer sponsored retirement and benefit plans. Please see the prospectus for more information. |
| n | Class Y shares are available only to certain investors. Please see the prospectus for more information. |
| n | Class R5 shares and Class R6 shares are primarily intended for employer sponsored retirement and benefit plans that meet certain standards and for institutional investors. Please see the prospectus for more information. |
Principal risks of investing in the Fund
| n | Cash/cash equivalents risk. Holding cash or cash equivalents may negatively affect performance. |
| n | Convertible securities risk. The Fund may own convertible securities, the value of which may be affected by market interest rates, the risk that the issuer will default, the value of the underlying stock or the right of the issuer to buy back the convertible securities. |
| n | Debt securities risk. The Fund may invest in debt securities that are affected by changing interest rates and changes in their effective maturities and credit quality. |
| n | Depositary receipts risk. Depositary receipts involve many of the same risks as those associated with direct investment in foreign securities. In addition, the underlying issuers of certain depositary receipts, particularly unsponsored or unregistered depositary receipts, are under no obligation to distribute shareholder communications to the holders of such receipts or to pass through to them any voting rights with respect to the deposited securities. |
| n | Developing/emerging markets securities risk. The prices of securities issued by foreign companies and governments located in developing/emerging markets countries may be affected more negatively by inflation, devaluation of their currencies, higher transaction costs, delays in settlement, adverse political developments, the introduction of capital controls, withholding taxes, nationalization of |
| private assets, expropriation, social unrest, war or lack of timely information than those in developed countries. |
| n | Foreign securities risk. The Fund’s foreign investments may be affected by changes in a foreign country’s exchange rates, political and social instability, changes in economic or taxation policies, difficulties when enforcing obligations, decreased liquidity, and increased volatility. Foreign companies may be subject to less regulation resulting in less publicly available information about the companies. |
| n | Management risk. The investment techniques and risk analysis used by the Fund’s portfolio managers may not produce the desired results. |
| n | Market risk. The prices of and the income generated by the Fund’s securities may decline in response to, among other things, investor sentiment, general economic and market conditions, regional or global instability, and currency and interest rate fluctuations. |
| n | Non-diversification risk. The Fund is non-diversified and can invest a greater portion of its assets in a small number of issuers or a single issuer. A change in the value of the issuer could affect the value of the Fund more than if it was a diversified fund. |
| n | Preferred securities risk. Preferred securities may include provisions that permit the issuer, in its discretion, to defer or omit distributions for a certain period of time. If the Fund owns a security that is deferring or omitting its distributions, the Fund may be required to report the distribution on its tax returns, even though it may not have received this income. Further, preferred securities may lose substantial value due to the omission or deferment of dividend payments. |
| n | Small- and mid-sized capitalization risks. Stocks of small- and mid-sized companies tend to be more vulnerable to adverse developments and may have little or no operating history or track record of success, and limited product lines, markets, management and financial resources. The securities of small- and mid-sized companies may be more volatile due to less market interest and less publicly available information about the issuer. They also may be illiquid or restricted as |
| to resale, or may trade less frequently and in smaller volumes, all of which may cause difficulty when establishing or closing a position at a desirable price. |
| n | US government obligations risk. The Fund may invest in obligations issued by US government agencies and instrumentalities that may receive varying levels of support from the government, which could affect the Fund’s ability to recover should they default. |
| n | Value investing style risk. The Fund emphasizes a value style of investing, which focuses on undervalued companies with characteristics for improved valuations. This style of investing is subject to the risk that the valuations never improve or that the returns on value equity securities are less than returns on other styles of investing or the overall stock market. Value stocks also may decline in price, even though in theory they are already underpriced. |
| n | Warrants risk. Warrants may be significantly less valuable on their relevant expiration date resulting in a loss of money or they may expire worthless resulting in a total loss of the investment. Warrants may also be postponed or terminated early resulting in a partial or total loss of the investment. Warrants may also be subject to illiquidity. |
About indexes used in this report
| n | The MSCI World IndexSM is an unmanaged index considered representative of stocks of developed countries. The index is computed using the net return, which withholds applicable taxes for non-resident investors. |
| n | The MSCI World Small Cap Index is an unmanaged index considered representative of small-cap stocks of global developed markets. The index is computed using the net return, which withholds applicable taxes for non-resident investors. |
continued on page 6
This report must be accompanied or preceded by a currently effective Fund prospectus, which contains more complete information, including sales charges and expenses. Investors should read it carefully before investing.
| ||
NOT FDIC INSURED | MAY LOSE VALUE | NO BANK GUARANTEE |
| 8 Invesco Select Opportunities Fund |
Schedule of Investments
October 31, 2015
| Shares | Value | |||||||
Common Stocks–78.32% |
| |||||||
| Brazil–5.48% | ||||||||
Arcos Dorados Holdings, Inc.–Class A | 438,029 | $ | 1,349,129 | |||||
CETIP S.A.–Mercados Organizados | 218,716 | 1,934,887 | ||||||
| 3,284,016 | ||||||||
| China–3.34% | ||||||||
Hollysys Automation Technologies Ltd. | 93,476 | 1,999,452 | ||||||
| France–6.23% | ||||||||
Ipsos | 96,150 | 1,953,475 | ||||||
Vicat S.A. | 27,755 | 1,779,443 | ||||||
| 3,732,918 | ||||||||
| Hong Kong–1.86% | ||||||||
Luk Fook Holdings (International) Ltd. | 431,000 | 1,111,598 | ||||||
| Ireland–3.48% | ||||||||
UDG Healthcare PLC | 284,614 | 2,085,263 | ||||||
| Monaco–4.16% | ||||||||
GasLog Ltd. | 215,481 | 2,493,115 | ||||||
| Netherlands–10.47% | ||||||||
Aalberts Industries N.V. | 71,432 | 2,316,288 | ||||||
Kendrion N.V. | 63,535 | 1,530,141 | ||||||
SBM Offshore N.V.(a) | 176,877 | 2,424,587 | ||||||
| 6,271,016 | ||||||||
| Norway–3.16% | ||||||||
Prosafe S.E. | 682,759 | 1,896,094 | ||||||
| United Kingdom–3.60% | ||||||||
Charles Taylor PLC | 56,952 | 238,839 | ||||||
DCC PLC | 23,948 | 1,919,482 | ||||||
| 2,158,321 | ||||||||
| Shares | Value | |||||||
| United States–36.54% | ||||||||
Alere, Inc.(a) | 51,111 | $ | 2,357,239 | |||||
Alliance Data Systems Corp.(a) | 2,721 | 808,980 | ||||||
Booz Allen Hamilton Holding Corp. | 88,894 | 2,618,817 | ||||||
Cubic Corp. | 34,601 | 1,551,855 | ||||||
Encore Capital Group, Inc.(a) | 94,136 | 3,831,335 | ||||||
Global Payments Inc. | 12,472 | 1,701,306 | ||||||
ION Geophysical Corp.(a) | 82,113 | 30,382 | ||||||
Microsemi Corp.(a) | 62,989 | 2,268,234 | ||||||
Mitel Networks Corp.(a) | 280,653 | 2,195,519 | ||||||
Performant Financial Corp.(a) | 320,598 | 740,581 | ||||||
Rovi Corp.(a) | 200,541 | 1,834,950 | ||||||
Ultra Petroleum Corp.(a) | 356,622 | 1,954,289 | ||||||
| 21,893,487 | ||||||||
Total Common Stocks |
| 46,925,280 | ||||||
Money Market Funds–20.68% |
| |||||||
Liquid Assets Portfolio–Institutional Class, 0.16%(b) | 6,193,457 | 6,193,457 | ||||||
Premier Portfolio–Institutional Class, 0.12%(b) | 6,193,458 | 6,193,458 | ||||||
Total Money Market Funds |
| 12,386,915 | ||||||
TOTAL INVESTMENTS–99.00% |
| 59,312,195 | ||||||
OTHER ASSETS LESS LIABILITIES–1.00% |
| 600,234 | ||||||
NET ASSETS–100.00% |
| $ | 59,912,429 | |||||
Notes to Schedule of Investments:
| (a) | Non-income producing security. |
| (b) | The money market fund and the Fund are affiliated by having the same investment adviser. The rate shown is the 7-day SEC standardized yield as of October 31, 2015. |
See accompanying Notes to Financial Statements which are an integral part of the financial statements.
9 Invesco Select Opportunities Fund
Statement of Assets and Liabilities
October 31, 2015
Assets: |
| |||
Investments, at value (Cost $52,970,050) | $ | 46,925,280 | ||
Investments in affiliated money market funds, at value and cost | 12,386,915 | |||
Total investments, at value (Cost $65,356,965) | 59,312,195 | |||
Foreign currencies, at value (Cost $717,850) | 710,509 | |||
Receivable for: | ||||
Fund shares sold | 191,072 | |||
Dividends | 9,488 | |||
Fund expenses absorbed | 45,600 | |||
Investment for trustee deferred compensation and retirement plans | 10,647 | |||
Other assets | 29,109 | |||
Total assets | 60,308,620 | |||
Liabilities: |
| |||
Payable for: | ||||
Investments purchased | 223,549 | |||
Fund shares reacquired | 40,519 | |||
Accrued fees to affiliates | 64,622 | |||
Accrued trustees’ and officers’ fees and benefits | 1,695 | |||
Accrued other operating expenses | 55,159 | |||
Trustee deferred compensation and retirement plans | 10,647 | |||
Total liabilities | 396,191 | |||
Net assets applicable to shares outstanding | $ | 59,912,429 | ||
Net assets consist of: |
| |||
Shares of beneficial interest | $ | 64,817,972 | ||
Undistributed net investment income (loss) | (9,941 | ) | ||
Undistributed net realized gain | 1,156,347 | |||
Net unrealized appreciation (depreciation) | (6,051,949 | ) | ||
| $ | 59,912,429 | |||
Net Assets: |
| |||
Class A | $ | 19,718,924 | ||
Class C | $ | 14,226,391 | ||
Class R | $ | 279,020 | ||
Class Y | $ | 25,662,946 | ||
Class R5 | $ | 13,068 | ||
Class R6 | $ | 12,080 | ||
Shares outstanding, $0.001 par value per share, |
| |||
Class A | 1,521,810 | |||
Class C | 1,121,674 | |||
Class R | 21,678 | |||
Class Y | 1,966,793 | |||
Class R5 | 1,001 | |||
Class R6 | 926 | |||
Class A: | ||||
Net asset value per share | $ | 12.96 | ||
Maximum offering price per share | ||||
(Net asset value of $12.96 ¸ 94.50%) | $ | 13.71 | ||
Class C: | ||||
Net asset value and offering price per share | $ | 12.68 | ||
Class R: | ||||
Net asset value and offering price per share | $ | 12.87 | ||
Class Y: | ||||
Net asset value and offering price per share | $ | 13.05 | ||
Class R5: | ||||
Net asset value and offering price per share | $ | 13.05 | ||
Class R6: | ||||
Net asset value and offering price per share | $ | 13.05 | ||
See accompanying Notes to Financial Statements which are an integral part of the financial statements.
10 Invesco Select Opportunities Fund
Statement of Operations
For the year ended October 31, 2015
Investment income: |
| |||
Dividends (net of foreign withholding taxes of $29,785) | $ | 606,146 | ||
Dividends from affiliated money market funds | 9,529 | |||
Total investment income | 615,675 | |||
Expenses: | ||||
Advisory fees | 455,748 | |||
Administrative services fees | 50,000 | |||
Custodian fees | 18,758 | |||
Distribution fees: | ||||
Class A | 51,908 | |||
Class C | 95,647 | |||
Class R | 968 | |||
Transfer agent fees — A, C, R and Y | 123,444 | |||
Transfer agent fees — R5 | 11 | |||
Transfer agent fees — R6 | 10 | |||
Trustees’ and officers’ fees and benefits | 19,708 | |||
Registration and filing fees | 77,887 | |||
Other | 85,525 | |||
Total expenses | 979,614 | |||
Less: Fees waived, expenses reimbursed and expense offset arrangement(s) | (133,596 | ) | ||
Net expenses | 846,018 | |||
Net investment income (loss) | (230,343 | ) | ||
Realized and unrealized gain (loss) from: | ||||
Net realized gain (loss) from: | ||||
Investment securities | 1,484,106 | |||
Foreign currencies | (74,571 | ) | ||
| 1,409,535 | ||||
Change in net unrealized appreciation (depreciation) of: | ||||
Investment securities | (7,036,160 | ) | ||
Foreign currencies | (10,605 | ) | ||
| (7,046,765 | ) | |||
Net realized and unrealized gain (loss) | (5,637,230 | ) | ||
Net increase (decrease) in net assets resulting from operations | $ | (5,867,573 | ) | |
See accompanying Notes to Financial Statements which are an integral part of the financial statements.
11 Invesco Select Opportunities Fund
Statement of Changes in Net Assets
For the years ended October 31, 2015 and 2014
| 2015 | 2014 | |||||||
Operations: |
| |||||||
Net investment income (loss) | $ | (230,343 | ) | $ | 19,490 | |||
Net realized gain | 1,409,535 | 971,307 | ||||||
Change in net unrealized appreciation (depreciation) | (7,046,765 | ) | (311,484 | ) | ||||
Net increase (decrease) in net assets resulting from operations | (5,867,573 | ) | 679,313 | |||||
Distributions to shareholders from net investment income: | ||||||||
Class A | — | (27,341 | ) | |||||
Class C | — | (2,287 | ) | |||||
Class R | — | (332 | ) | |||||
Class Y | — | (23,626 | ) | |||||
Class R5 | — | (283 | ) | |||||
Class R6 | — | (77 | ) | |||||
Total distributions from net investment income | — | (53,946 | ) | |||||
Distributions to shareholders from net realized gains: | ||||||||
Class A | (436,779 | ) | (46,698 | ) | ||||
Class C | (85,578 | ) | (6,231 | ) | ||||
Class R | (2,562 | ) | (652 | ) | ||||
Class Y | (490,590 | ) | (32,687 | ) | ||||
Class R5 | (284 | ) | (391 | ) | ||||
Class R6 | (263 | ) | (107 | ) | ||||
Total distributions from net realized gains | (1,016,056 | ) | (86,766 | ) | ||||
Share transactions–net: | ||||||||
Class A | 551,676 | 16,685,377 | ||||||
Class C | 11,345,138 | 3,922,532 | ||||||
Class R | 178,265 | 50,865 | ||||||
Class Y | 5,717,135 | 18,560,282 | ||||||
Class R5 | — | (37,228 | ) | |||||
Net increase in net assets resulting from share transactions | 17,792,214 | 39,181,828 | ||||||
Net increase in net assets | 10,908,585 | 39,720,429 | ||||||
Net assets: | ||||||||
Beginning of year | 49,003,844 | 9,283,415 | ||||||
End of year (includes undistributed net investment income (loss) of $(9,941) and $(7,290), respectively) | $ | 59,912,429 | $ | 49,003,844 | ||||
Notes to Financial Statements
October 31, 2015
NOTE 1—Significant Accounting Policies
Invesco Select Opportunities Fund (the “Fund”) is a series portfolio of AIM International Mutual Funds (Invesco International Mutual Funds) (the “Trust”). The Trust is a Delaware statutory trust registered under the Investment Company Act of 1940, as amended (the “1940 Act”), as an open-end series management investment company consisting of eight separate portfolios, each authorized to issue an unlimited number of shares of beneficial interest. The assets, liabilities and operations of each portfolio are accounted for separately. Information presented in these financial statements pertains only to the Fund. Matters affecting each portfolio or class will be voted on exclusively by the shareholders of such portfolio or class.
The Fund’s investment objective is long-term growth of capital.
The Fund currently consists of six different classes of shares: Class A, Class C, Class R, Class Y, Class R5 and Class R6. Class A shares are sold with a front-end sales charge unless certain waiver criteria are met and under certain circumstances load waived shares may be subject to contingent deferred sales charges (“CDSC”). Class C shares are sold with a CDSC. Class R, Class Y, Class R5 and Class R6 shares are sold at net asset value.
12 Invesco Select Opportunities Fund
The following is a summary of the significant accounting policies followed by the Fund in the preparation of its financial statements.
| A. | Security Valuations — Securities, including restricted securities, are valued according to the following policy. |
A security listed or traded on an exchange (except convertible securities) is valued at its last sales price or official closing price as of the close of the customary trading session on the exchange where the security is principally traded, or lacking any sales or official closing price on a particular day, the security may be valued at the closing bid price on that day. Securities traded in the over-the-counter market are valued based on prices furnished by independent pricing services or market makers. When such securities are valued by an independent pricing service they may be considered fair valued. Futures contracts are valued at the final settlement price set by an exchange on which they are principally traded. Listed options are valued at the mean between the last bid and asked prices from the exchange on which they are principally traded. Options not listed on an exchange are valued by an independent source at the mean between the last bid and asked prices. For purposes of determining net asset value (“NAV”) per share, futures and option contracts generally are valued 15 minutes after the close of the customary trading session of the New York Stock Exchange (“NYSE”).
Investments in open-end and closed-end registered investment companies that do not trade on an exchange are valued at the end-of-day net asset value per share. Investments in open-end and closed-end registered investment companies that trade on an exchange are valued at the last sales price or official closing price as of the close of the customary trading session on the exchange where the security is principally traded.
Debt obligations (including convertible securities) and unlisted equities are fair valued using an evaluated quote provided by an independent pricing service. Evaluated quotes provided by the pricing service may be determined without exclusive reliance on quoted prices, and may reflect appropriate factors such as institution-size trading in similar groups of securities, developments related to specific securities, dividend rate (for unlisted equities), yield (for debt obligations), quality, type of issue, coupon rate (for debt obligations), maturity (for debt obligations), individual trading characteristics and other market data. Debt obligations are subject to interest rate and credit risks. In addition, all debt obligations involve some risk of default with respect to interest and/or principal payments.
Foreign securities’ (including foreign exchange contracts) prices are converted into U.S. dollar amounts using the applicable exchange rates as of the close of the NYSE. If market quotations are available and reliable for foreign exchange-traded equity securities, the securities will be valued at the market quotations. Because trading hours for certain foreign securities end before the close of the NYSE, closing market quotations may become unreliable. If between the time trading ends on a particular security and the close of the customary trading session on the NYSE, events occur that the Adviser determines are significant and make the closing price unreliable, the Fund may fair value the security. If the event is likely to have affected the closing price of the security, the security will be valued at fair value in good faith using procedures approved by the Board of Trustees. Adjustments to closing prices to reflect fair value may also be based on a screening process of an independent pricing service to indicate the degree of certainty, based on historical data, that the closing price in the principal market where a foreign security trades is not the current value as of the close of the NYSE. Foreign securities’ prices meeting the approved degree of certainty that the price is not reflective of current value will be priced at the indication of fair value from the independent pricing service. Multiple factors may be considered by the independent pricing service in determining adjustments to reflect fair value and may include information relating to sector indices, American Depositary Receipts and domestic and foreign index futures. Foreign securities may have additional risks including exchange rate changes, potential for sharply devalued currencies and high inflation, political and economic upheaval, the relative lack of issuer information, relatively low market liquidity and the potential lack of strict financial and accounting controls and standards.
Securities for which market prices are not provided by any of the above methods may be valued based upon quotes furnished by independent sources. The last bid price may be used to value equity securities. The mean between the last bid and asked prices is used to value debt obligations, including corporate loans.
Securities for which market quotations are not readily available or became unreliable are valued at fair value as determined in good faith by or under the supervision of the Trust’s officers following procedures approved by the Board of Trustees. Issuer specific events, market trends, bid/asked quotes of brokers and information providers and other market data may be reviewed in the course of making a good faith determination of a security’s fair value.
The Fund may invest in securities that are subject to interest rate risk, meaning the risk that the prices will generally fall as interest rates rise and, conversely, the prices will generally rise as interest rates fall. Specific securities differ in their sensitivity to changes in interest rates depending on their individual characteristics. Changes in interest rates may result in increased market volatility, which may affect the value and/or liquidity of certain Fund investments.
Valuations change in response to many factors including the historical and prospective earnings of the issuer, the value of the issuer’s assets, general economic conditions, interest rates, investor perceptions and market liquidity. Because of the inherent uncertainties of valuation, the values reflected in the financial statements may materially differ from the value received upon actual sale of those investments.
| B. | Securities Transactions and Investment Income — Securities transactions are accounted for on a trade date basis. Realized gains or losses on sales are computed on the basis of specific identification of the securities sold. Interest income (net of withholding tax, if any) is recorded on the accrual basis from settlement date. Dividend income (net of withholding tax, if any) is recorded on the ex-dividend date. |
The Fund may periodically participate in litigation related to Fund investments. As such, the Fund may receive proceeds from litigation settlements. Any proceeds received are included in the Statement of Operations as realized gain (loss) for investments no longer held and as unrealized gain (loss) for investments still held.
Brokerage commissions and mark ups are considered transaction costs and are recorded as an increase to the cost basis of securities purchased and/or a reduction of proceeds on a sale of securities. Such transaction costs are included in the determination of net realized and unrealized gain (loss) from investment securities reported in the Statement of Operations and the Statement of Changes in Net Assets and the net realized and unrealized gains (losses) on securities per share in the Financial Highlights. Transaction costs are included in the calculation of the Fund’s net asset value and, accordingly, they reduce the Fund’s total returns. These transaction costs are not considered operating expenses and are not reflected in net investment income reported in the Statement of Operations and the Statement of Changes in Net Assets, or the net investment income per share and the ratios of expenses and net investment income reported in the Financial Highlights, nor are they limited by any expense limitation arrangements between the Fund and the investment adviser.
The Fund allocates income and realized and unrealized capital gains and losses to a class based on the relative net assets of each class.
13 Invesco Select Opportunities Fund
| C. | Country Determination — For the purposes of making investment selection decisions and presentation in the Schedule of Investments, the investment adviser may determine the country in which an issuer is located and/or credit risk exposure based on various factors. These factors include the laws of the country under which the issuer is organized, where the issuer maintains a principal office, the country in which the issuer derives 50% or more of its total revenues and the country that has the primary market for the issuer’s securities, as well as other criteria. Among the other criteria that may be evaluated for making this determination are the country in which the issuer maintains 50% or more of its assets, the type of security, financial guarantees and enhancements, the nature of the collateral and the sponsor organization. Country of issuer and/or credit risk exposure has been determined to be the United States of America, unless otherwise noted. |
| D. | Distributions — Distributions from net investment income and net realized capital gain, if any, are generally declared and paid annually and recorded on the ex-dividend date. The Fund may elect to treat a portion of the proceeds from redemptions as distributions for federal income tax purposes. |
| E. | Federal Income Taxes — The Fund intends to comply with the requirements of Subchapter M of the Internal Revenue Code of 1986, as amended (the “Internal Revenue Code”), necessary to qualify as a regulated investment company and to distribute substantially all of the Fund’s taxable earnings to shareholders. As such, the Fund will not be subject to federal income taxes on otherwise taxable income (including net realized capital gain) that is distributed to shareholders. Therefore, no provision for federal income taxes is recorded in the financial statements. |
The Fund recognizes the tax benefits of uncertain tax positions only when the position is more likely than not to be sustained. Management has analyzed the Fund’s uncertain tax positions and concluded that no liability for unrecognized tax benefits should be recorded related to uncertain tax positions. Management is not aware of any tax positions for which it is reasonably possible that the total amounts of unrecognized tax benefits will change materially in the next 12 months.
The Fund files tax returns in the U.S. Federal jurisdiction and certain other jurisdictions. Generally, the Fund is subject to examinations by such taxing authorities for up to three years after the filing of the return for the tax period.
| F. | Expenses — Fees provided for under the Rule 12b-1 plan of a particular class of the Fund are charged to the operations of such class. Transfer agency fees and expenses and other shareholder recordkeeping fees and expenses attributable to Class R5 and Class R6 are allocated to each share class based on relative net assets. Sub-accounting fees attributable to Class R5 are charged to the operations of the class. Transfer agency fees and expenses and other shareholder recordkeeping fees and expenses relating to all other classes are allocated among those classes based on relative net assets. All other expenses are allocated among the classes based on relative net assets. |
| G. | Accounting Estimates — The preparation of financial statements in conformity with accounting principles generally accepted in the United States of America (“GAAP”) requires management to make estimates and assumptions that affect the reported amounts of assets and liabilities at the date of the financial statements and the reported amounts of revenues and expenses during the reporting period including estimates and assumptions related to taxation. Actual results could differ from those estimates by a significant amount. In addition, the Fund monitors for material events or transactions that may occur or become known after the period-end date and before the date the financial statements are released to print. |
| H. | Indemnifications — Under the Trust’s organizational documents, each Trustee, officer, employee or other agent of the Trust is indemnified against certain liabilities that may arise out of the performance of their duties to the Fund. Additionally, in the normal course of business, the Fund enters into contracts, including the Fund’s servicing agreements, that contain a variety of indemnification clauses. The Fund’s maximum exposure under these arrangements is unknown as this would involve future claims that may be made against the Fund that have not yet occurred. The risk of material loss as a result of such indemnification claims is considered remote. |
| I. | Foreign Currency Translations — Foreign currency is valued at the close of the NYSE based on quotations posted by banks and major currency dealers. Portfolio securities and other assets and liabilities denominated in foreign currencies are translated into U.S. dollar amounts at date of valuation. Purchases and sales of portfolio securities (net of foreign taxes withheld on disposition) and income items denominated in foreign currencies are translated into U.S. dollar amounts on the respective dates of such transactions. The Fund does not separately account for the portion of the results of operations resulting from changes in foreign exchange rates on investments and the fluctuations arising from changes in market prices of securities held. The combined results of changes in foreign exchange rates and the fluctuation of market prices on investments (net of estimated foreign tax withholding) are included with the net realized and unrealized gain or loss from investments in the Statement of Operations. Reported net realized foreign currency gains or losses arise from (1) sales of foreign currencies, (2) currency gains or losses realized between the trade and settlement dates on securities transactions, and (3) the difference between the amounts of dividends, interest, and foreign withholding taxes recorded on the Fund’s books and the U.S. dollar equivalent of the amounts actually received or paid. Net unrealized foreign currency gains and losses arise from changes in the fair values of assets and liabilities, other than investments in securities at fiscal period end, resulting from changes in exchange rates. |
The Fund may invest in foreign securities, which may be subject to foreign taxes on income, gains on investments or currency repatriation, a portion of which may be recoverable. Foreign taxes, if any, are recorded based on the tax regulations and rates that exist in the foreign markets in which the Fund invests and are shown in the Statement of Operations.
| J. | Forward Foreign Currency Contracts — The Fund may engage in foreign currency transactions either on a spot (i.e. for prompt delivery and settlement) basis, or through forward foreign currency contracts, to manage or minimize currency or exchange rate risk. |
The Fund may also enter into forward foreign currency contracts for the purchase or sale of a security denominated in a foreign currency in order to “lock in” the U.S. dollar price of that security, or the Fund may also enter into forward foreign currency contracts that do not provide for physical settlement of the two currencies, but instead are settled by a single cash payment calculated as the difference between the agreed upon exchange rate and the spot rate at settlement based upon an agreed upon notional amount (non-deliverable forwards). The Fund will set aside liquid assets in an amount equal to daily mark-to-market obligation for forward foreign currency contracts.
A forward foreign currency contract is an obligation between two parties (“Counterparties”) to purchase or sell a specific currency for an agreed-upon price at a future date. The use of forward foreign currency contracts does not eliminate fluctuations in the price of the underlying securities the Fund owns or intends to acquire but establishes a rate of exchange in advance. Fluctuations in the value of these contracts are measured by the difference in the contract date and reporting date exchange rates and are recorded as unrealized appreciation (depreciation) until the contracts are closed. When the contracts are closed, realized gains (losses) are recorded. Realized and unrealized gains (losses) on the contracts are included in the Statement of Operations. The primary risks associated with forward foreign currency contracts include failure of the
14 Invesco Select Opportunities Fund
Counterparty to meet the terms of the contract and the value of the foreign currency changing unfavorably. These risks may be in excess of the amounts reflected in the Statement of Assets and Liabilities.
NOTE 2—Advisory Fees and Other Fees Paid to Affiliates
The Trust has entered into a master investment advisory agreement with Invesco Advisers, Inc. (the “Adviser” or “Invesco”). Under the terms of the investment advisory agreement, the Fund pays an advisory fee to the Adviser based on the annual rate of the Fund’s average daily net assets as follows:
| Average Daily Net Assets | Rate | |||
First $250 million | 0.80% | |||
Next $250 million | 0.78% | |||
Next $500 million | 0.76% | |||
Next $1.5 billion | 0.74% | |||
Next $2.5 billion | 0.72% | |||
Next $2.5 billion | 0.70% | |||
Next $2.5 billion | 0.68% | |||
Over $10 billion | 0.66% | |||
For the year ended October 31, 2015, the effective advisory fees incurred by the Fund was 0.80%.
Under the terms of a master sub-advisory agreement between the Adviser and each of Invesco Asset Management Deutschland GmbH, Invesco Asset Management Limited, Invesco Asset Management (Japan) Limited, Invesco Hong Kong Limited, Invesco Senior Secured Management, Inc., Invesco Canada Ltd. and Invesco PowerShares Capital Management LLC (collectively, the “Affiliated Sub-Advisers”) the Adviser, not the Fund, may pay 40% of the fees paid to the Adviser to any such Affiliated Sub-Adviser(s) that provide(s) discretionary investment management services to the Fund based on the percentage of assets allocated to such Affiliated Sub-Adviser(s).
The Adviser has contractually agreed, through at least February 28, 2017, to waive advisory fees and/or reimburse expenses of all shares to the extent necessary to limit total annual fund operating expenses after fee waiver and/or expense reimbursement (excluding certain items discussed below) of Class A, Class C, Class R, Class Y, Class R5 and Class R6 shares to 1.51%, 2.26%, 1.76%, 1.26%, 1.26% and 1.26%, respectively, of average daily net assets. In determining the Adviser’s obligation to waive advisory fees and/or reimburse expenses, the following expenses are not taken into account, and could cause the total annual fund operating expenses after fee waiver and/or expense reimbursement to exceed the numbers reflected above: (1) interest; (2) taxes; (3) dividend expense on short sales; (4) extraordinary or non-routine items, litigation expenses; and (5) expenses that the Fund has incurred but did not actually pay because of an expense offset arrangement. Unless Invesco continues the fee waiver agreement, it will terminate on February 28, 2017. The fee waiver agreement cannot be terminated during its term.
Further, the Adviser has contractually agreed, through at least June 30, 2017, to waive the advisory fee payable by the Fund in an amount equal to 100% of the net advisory fees the Adviser receives from the affiliated money market funds on investments by the Fund of uninvested cash in such affiliated money market funds.
For the year ended October 31, 2015, the Adviser waived advisory fees of $18,447 and reimbursed class level expenses of $41,887, $19,296, $391, $53,300, $9 and $8 of Class A, Class C, Class R, Class Y, Class R5 and Class R6 shares, respectively.
The Trust has entered into a transfer agency and service agreement with Invesco Investment Services, Inc. (“IIS”) pursuant to which the Fund has agreed to pay IIS a fee for providing transfer agency and shareholder services to the Fund and reimburse IIS for certain expenses incurred by IIS in the course of providing such services. IIS may make payments to intermediaries that provide omnibus account services, sub-accounting services and/or networking services. All fees payable by IIS to intermediaries that provide omnibus account services or sub-accounting are charged back to the Fund, subject to certain limitations approved by the Trust’s Board of Trustees. For the year ended October 31, 2015, expenses incurred under the agreement are shown in the Statement of Operations as Transfer agent fees.
The Trust has entered into a master administrative services agreement with Invesco pursuant to which the Fund has agreed to pay Invesco for certain administrative costs incurred in providing accounting services to the Fund. For the year ended October 31, 2015, expenses incurred under the agreement are shown in the Statement of Operations as Administrative services fees.
The Trust has entered into master distribution agreements with Invesco Distributors, Inc. (“IDI”) to serve as the distributor for the Class A, Class C, Class R, Class Y, Class R5 and Class R6 shares of the Fund. The Trust has adopted plans pursuant to Rule 12b-1 under the 1940 Act with respect to the Fund’s Class A, Class C and Class R shares (collectively, the “Plans”). The Fund, pursuant to the Plans, pays IDI compensation at the annual rate of 0.25% of the Fund’s average daily net assets of Class A shares, 1.00% of the average daily net assets of Class C shares and 0.50% of the average daily net assets of Class R shares. Of the Plan payments, up to 0.25% of the average daily net assets of each class of shares may be paid to furnish continuing personal shareholder services to customers who purchase and own shares of such classes. Any amounts not paid as a service fee under the Plans would constitute an asset-based sales charge. Rules of the Financial Industry Regulatory Authority (“FINRA”) impose a cap on the total sales charges, including asset-based sales charges, that may be paid by any class of shares of the Fund. For the year ended October 31, 2015, expenses incurred under the Plans are shown in the Statement of Operations as Distribution fees.
Front-end sales commissions and CDSC (collectively, the “sales charges”) are not recorded as expenses of the Fund. Front-end sales commissions are deducted from proceeds from the sales of Fund shares prior to investment in Class A shares of the Fund. CDSC are deducted from redemption proceeds prior to remittance to the shareholder. During the year ended October 31, 2015, IDI advised the Fund that IDI retained $7,649 in front-end sales commissions from the sale of Class A shares and $1 and $1,095 from Class A and Class C shares, respectively, for CDSC imposed upon redemptions by shareholders.
Certain officers and trustees of the Trust are officers and directors of the Adviser, IIS and/or IDI.
15 Invesco Select Opportunities Fund
NOTE 3—Additional Valuation Information
GAAP defines fair value as the price that would be received to sell an asset or paid to transfer a liability in an orderly transaction between market participants at the measurement date, under current market conditions. GAAP establishes a hierarchy that prioritizes the inputs to valuation methods, giving the highest priority to readily available unadjusted quoted prices in an active market for identical assets (Level 1) and the lowest priority to significant unobservable inputs (Level 3), generally when market prices are not readily available or are unreliable. Based on the valuation inputs, the securities or other investments are tiered into one of three levels. Changes in valuation methods may result in transfers in or out of an investment’s assigned level:
| Level 1 — | Prices are determined using quoted prices in an active market for identical assets. |
| Level 2 — | Prices are determined using other significant observable inputs. Observable inputs are inputs that other market participants may use in pricing a security. These may include quoted prices for similar securities, interest rates, prepayment speeds, credit risk, yield curves, loss severities, default rates, discount rates, volatilities and others. |
| Level 3 — | Prices are determined using significant unobservable inputs. In situations where quoted prices or observable inputs are unavailable (for example, when there is little or no market activity for an investment at the end of the period), unobservable inputs may be used. Unobservable inputs reflect the Fund’s own assumptions about the factors market participants would use in determining fair value of the securities or instruments and would be based on the best available information. |
The following is a summary of the tiered valuation input levels, as of October 31, 2015. The level assigned to the securities valuations may not be an indication of the risk or liquidity associated with investing in those securities. Because of the inherent uncertainties of valuation, the values reflected in the financial statements may materially differ from the value received upon actual sale of those investments.
During the year ended October 31, 2015, there were transfers from Level 1 to Level 2 of $1,896,094 and from Level 2 to Level 1 of $3,954,728, due to foreign fair value adjustments.
| Level 1 | Level 2 | Level 3 | Total | |||||||||||||
Brazil | $ | 3,284,016 | $ | — | $ | — | $ | 3,284,016 | ||||||||
China | 1,999,452 | — | — | 1,999,452 | ||||||||||||
France | 3,732,918 | — | — | 3,732,918 | ||||||||||||
Hong Kong | — | 1,111,598 | — | 1,111,598 | ||||||||||||
Ireland | 2,085,263 | — | — | 2,085,263 | ||||||||||||
Monaco | 2,493,115 | — | — | 2,493,115 | ||||||||||||
Netherlands | 3,954,728 | 2,316,288 | — | 6,271,016 | ||||||||||||
Norway | — | 1,896,094 | — | 1,896,094 | ||||||||||||
United Kingdom | 238,839 | 1,919,482 | — | 2,158,321 | ||||||||||||
United States | 34,280,402 | — | — | 34,280,402 | ||||||||||||
Total Investments | $ | 52,068,733 | $ | 7,243,462 | $ | — | $ | 59,312,195 | ||||||||
NOTE 4—Expense Offset Arrangement(s)
The expense offset arrangement is comprised of transfer agency credits which result from balances in demand deposit accounts used by the transfer agent for clearing shareholder transactions. For the year ended October 31, 2015, the Fund received credits from this arrangement, which resulted in the reduction of the Fund’s total expenses of $258.
NOTE 5—Trustees’ and Officers’ Fees and Benefits
Trustees’ and Officers’ Fees and Benefits include amounts accrued by the Fund to pay remuneration to certain Trustees and Officers of the Fund. Trustees have the option to defer compensation payable by the Fund, and Trustees’ and Officers’ Fees and Benefits also include amounts accrued by the Fund to fund such deferred compensation amounts. Those Trustees who defer compensation have the option to select various Invesco Funds in which their deferral accounts shall be deemed to be invested. Finally, certain current Trustees were eligible to participate in a retirement plan that provided for benefits to be paid upon retirement to Trustees over a period of time based on the number of years of service. The Fund may have certain former Trustees who also participate in a retirement plan and receive benefits under such plan. Trustees’ and Officers’ Fees and Benefits include amounts accrued by the Fund to fund such retirement benefits. Obligations under the deferred compensation and retirement plans represent unsecured claims against the general assets of the Fund.
NOTE 6—Cash Balances
The Fund is permitted to temporarily carry a negative or overdrawn balance in its account with State Street Bank and Trust Company, the custodian bank. Such balances, if any at period end, are shown in the Statement of Assets and Liabilities under the payable caption Amount due custodian. To compensate the custodian bank for such overdrafts, the overdrawn Fund may either (1) leave funds as a compensating balance in the account so the custodian bank can be compensated by earning the additional interest; or (2) compensate by paying the custodian bank at a rate agreed upon by the custodian bank and Invesco, not to exceed the contractually agreed upon rate.
16 Invesco Select Opportunities Fund
NOTE 7—Distributions to Shareholders and Tax Components of Net Assets
Tax Character of Distributions to Shareholders Paid During the Fiscal Years Ended October 31, 2015 and 2014:
| 2015 | 2014 | |||||||
Ordinary income | $ | 365,533 | $ | 140,712 | ||||
Long-term capital gain | 650,523 | — | ||||||
Total distributions | $ | 1,016,056 | $ | 140,712 | ||||
Tax Components of Net Assets at Period-End:
| 2015 | ||||
Undistributed ordinary income | $ | 141,641 | ||
Undistributed long-term gain | 1,014,706 | |||
Net unrealized appreciation (depreciation) — investments | (6,044,770 | ) | ||
Net unrealized appreciation (depreciation) — other investments | (7,179 | ) | ||
Temporary book/tax differences | (9,941 | ) | ||
Shares of beneficial interest | 64,817,972 | |||
Total net assets | $ | 59,912,429 | ||
The temporary book/tax differences are a result of timing differences between book and tax recognition of income and/or expenses. The Fund’s temporary book/tax differences are the result of the trustee deferral of compensation and retirement plan benefits.
Capital loss carryforward is calculated and reported as of a specific date. Results of transactions and other activity after that date may affect the amount of capital loss carryforward actually available for the Fund to utilize. Capital losses generated in years beginning after December 22, 2010 can be carried forward for an unlimited period, whereas previous losses expire in eight tax years. Capital losses with an expiration period may not be used to offset capital gains until all net capital losses without an expiration date have been utilized. Capital loss carryforwards with no expiration date will retain their character as either short-term or long-term capital losses instead of as short-term capital losses as under prior law. The ability to utilize capital loss carryforwards in the future may be limited under the Internal Revenue Code and related regulations based on the results of future transactions.
The Fund does not have a capital loss carryforward as of October 31, 2015.
NOTE 8—Investment Securities
The aggregate amount of investment securities (other than short-term securities, U.S. Treasury obligations and money market funds, if any) purchased and sold by the Fund during the year ended October 31, 2015 was $25,485,768 and $7,816,453, respectively. Cost of investments on a tax basis includes the adjustments for financial reporting purposes as of the most recently completed federal income tax reporting period-end.
| Unrealized Appreciation (Depreciation) of Investment Securities on a Tax Basis | ||||
Aggregate unrealized appreciation of investment securities | $ | 4,779,729 | ||
Aggregate unrealized (depreciation) of investment securities | (10,824,499 | ) | ||
Net unrealized appreciation (depreciation) of investment securities | $ | (6,044,770 | ) | |
Cost of investments is the same for tax and financial reporting purposes.
NOTE 9—Reclassification of Permanent Differences
Primarily as a result of differing book/tax treatment of foreign currency transactions, on October 31, 2015, undistributed net investment income (loss) was increased by $227,692 and undistributed net realized gain was decreased by $227,692. This reclassification had no effect on the net assets of the Fund.
17 Invesco Select Opportunities Fund
NOTE 10—Share Information
| Summary of Share Activity | ||||||||||||||||
| Years ended October 31, | ||||||||||||||||
| 2015(a) | 2014 | |||||||||||||||
| Shares | Amount | Shares | Amount | |||||||||||||
Sold: | ||||||||||||||||
Class A | 833,011 | $ | 11,620,829 | 2,278,339 | $ | 33,917,373 | ||||||||||
Class C | 942,583 | 13,000,944 | 393,488 | 5,821,391 | ||||||||||||
Class R | 15,641 | 211,798 | 6,700 | 97,143 | ||||||||||||
Class Y | 632,505 | 8,888,535 | 1,422,323 | 20,348,671 | ||||||||||||
Issued as reinvestment of dividends: | ||||||||||||||||
Class A | 29,246 | 398,039 | 3,856 | 52,562 | ||||||||||||
Class C | 6,054 | 81,183 | 496 | 6,719 | ||||||||||||
Class R | 168 | 2,278 | 60 | 809 | ||||||||||||
Class Y | 30,024 | 410,419 | 707 | 9,666 | ||||||||||||
Class R5 | — | — | 35 | 474 | ||||||||||||
Reacquired: | ||||||||||||||||
Class A | (828,964 | ) | (11,467,192 | ) | (1,160,142 | ) | (17,284,558 | ) | ||||||||
Class C | (128,772 | ) | (1,736,989 | ) | (130,981 | ) | (1,905,578 | ) | ||||||||
Class R | (2,669 | ) | (35,811 | ) | (3,175 | ) | (47,087 | ) | ||||||||
Class Y | (261,111 | ) | (3,581,819 | ) | (120,481 | ) | (1,798,055 | ) | ||||||||
Class R5 | — | — | (2,409 | ) | (37,702 | ) | ||||||||||
Net increase in share activity | 1,267,716 | $ | 17,792,214 | 2,688,816 | $ | 39,181,828 | ||||||||||
| (a) | There are entities that are record owners of more than 5% of the outstanding shares of the Fund and in the aggregate own 67% of the outstanding shares of the Fund. IDI has an agreement with these entities to sell Fund shares. The Fund, Invesco and/or Invesco affiliates may make payments to these entities, which are considered to be related to the Fund, for providing services to the Fund, Invesco and/or Invesco affiliates including but not limited to services such as securities brokerage, distribution, third party record keeping and account servicing. The Fund has no knowledge as to whether all or any portion of the shares owned of record by these entities are also owned beneficially. |
18 Invesco Select Opportunities Fund
NOTE 11—Financial Highlights
The following schedule presents financial highlights for a share of the Fund outstanding throughout the periods indicated.
| Net asset value, beginning of period | Net investment income (loss)(a) | Net gains (losses) on securities (both realized and unrealized) | Total from investment operations | Dividends from net investment income | Distributions from net realized gains | Total distributions | Net asset value, end of period | Total return(b) | Net assets, end of period (000’s omitted) | Ratio of expenses to average net assets with fee waivers and/or expenses absorbed | Ratio of expenses to average net assets without fee waivers and/or expenses absorbed | Ratio of net investment income (loss) to average net assets | Portfolio turnover(c) | |||||||||||||||||||||||||||||||||||||||||||
Class A |
| |||||||||||||||||||||||||||||||||||||||||||||||||||||||
Year ended 10/31/15 | $ | 14.55 | $ | (0.06 | ) | $ | (1.25 | ) | $ | (1.31 | ) | $ | — | $ | (0.28 | ) | $ | (0.28 | ) | $ | 12.96 | (9.07 | )% | $ | 19,719 | 1.48 | %(e) | 1.71 | %(e) | (0.40 | )%(e) | 18 | % | |||||||||||||||||||||||
Year ended 10/31/14 | 13.70 | 0.02 | 1.02 | 1.04 | (0.07 | ) | (0.12 | ) | (0.19 | ) | 14.55 | 7.64 | 21,652 | 1.47 | 2.24 | 0.11 | 13 | |||||||||||||||||||||||||||||||||||||||
Year ended 10/31/13 | 10.63 | 0.11 | (d) | 3.13 | 3.24 | (0.08 | ) | (0.09 | ) | (0.17 | ) | 13.70 | 30.84 | 5,019 | 1.47 | 6.17 | 0.84 | (d) | 10 | |||||||||||||||||||||||||||||||||||||
Year ended 10/31/12(f) | 10.00 | (0.00 | ) | 0.63 | 0.63 | — | — | — | 10.63 | 6.30 | 1,186 | 1.48 | (g) | 15.54 | (g) | (0.07 | )(g) | 7 | ||||||||||||||||||||||||||||||||||||||
Class C | ||||||||||||||||||||||||||||||||||||||||||||||||||||||||
Year ended 10/31/15 | 14.35 | (0.16 | ) | (1.23 | ) | (1.39 | ) | — | (0.28 | ) | (0.28 | ) | 12.68 | (9.77 | ) | 14,226 | 2.23 | (e) | 2.46 | (e) | (1.15 | )(e) | 18 | |||||||||||||||||||||||||||||||||
Year ended 10/31/14 | 13.59 | (0.10 | ) | 1.02 | 0.92 | (0.04 | ) | (0.12 | ) | (0.16 | ) | 14.35 | 6.83 | 4,331 | 2.22 | 2.99 | (0.64 | ) | 13 | |||||||||||||||||||||||||||||||||||||
Year ended 10/31/13 | 10.62 | 0.01 | (d) | 3.12 | 3.13 | (0.07 | ) | (0.09 | ) | (0.16 | ) | 13.59 | 29.87 | 527 | 2.22 | 6.92 | 0.09 | (d) | 10 | |||||||||||||||||||||||||||||||||||||
Year ended 10/31/12(f) | 10.00 | (0.02 | ) | 0.64 | 0.62 | — | — | — | 10.62 | 6.20 | 90 | 2.23 | (g) | 16.29 | (g) | (0.82 | )(g) | 7 | ||||||||||||||||||||||||||||||||||||||
Class R | ||||||||||||||||||||||||||||||||||||||||||||||||||||||||
Year ended 10/31/15 | 14.49 | (0.09 | ) | (1.25 | ) | (1.34 | ) | — | (0.28 | ) | (0.28 | ) | 12.87 | (9.32 | ) | 279 | 1.73 | (e) | 1.96 | (e) | (0.65 | )(e) | 18 | |||||||||||||||||||||||||||||||||
Year ended 10/31/14 | 13.66 | (0.02 | ) | 1.02 | 1.00 | (0.05 | ) | (0.12 | ) | (0.17 | ) | 14.49 | 7.44 | 124 | 1.72 | 2.49 | (0.14 | ) | 13 | |||||||||||||||||||||||||||||||||||||
Year ended 10/31/13 | 10.63 | 0.07 | (d) | 3.12 | 3.19 | (0.07 | ) | (0.09 | ) | (0.16 | ) | 13.66 | 30.44 | 68 | 1.72 | 6.42 | 0.59 | (d) | 10 | |||||||||||||||||||||||||||||||||||||
Year ended 10/31/12(f) | 10.00 | (0.01 | ) | 0.64 | 0.63 | — | — | — | 10.63 | 6.30 | 11 | 1.73 | (g) | 15.79 | (g) | (0.32 | )(g) | 7 | ||||||||||||||||||||||||||||||||||||||
Class Y | ||||||||||||||||||||||||||||||||||||||||||||||||||||||||
Year ended 10/31/15 | 14.61 | (0.02 | ) | (1.26 | ) | (1.28 | ) | — | (0.28 | ) | (0.28 | ) | 13.05 | (8.82 | ) | 25,663 | 1.23 | (e) | 1.46 | (e) | (0.15 | )(e) | 18 | |||||||||||||||||||||||||||||||||
Year ended 10/31/14 | 13.74 | 0.05 | 1.02 | 1.07 | (0.08 | ) | (0.12 | ) | (0.20 | ) | 14.61 | 7.88 | 22,869 | 1.22 | 1.99 | 0.36 | 13 | |||||||||||||||||||||||||||||||||||||||
Year ended 10/31/13 | 10.64 | 0.14 | (d) | 3.13 | 3.27 | (0.08 | ) | (0.09 | ) | (0.17 | ) | 13.74 | 31.11 | 3,610 | 1.22 | 5.92 | 1.09 | (d) | 10 | |||||||||||||||||||||||||||||||||||||
Year ended 10/31/12(f) | 10.00 | 0.00 | 0.64 | 0.64 | — | — | — | 10.64 | 6.40 | 1,049 | 1.23 | (g) | 15.29 | (g) | 0.18 | (g) | 7 | |||||||||||||||||||||||||||||||||||||||
Class R5 | ||||||||||||||||||||||||||||||||||||||||||||||||||||||||
Year ended 10/31/15 | 14.62 | (0.02 | ) | (1.27 | ) | (1.29 | ) | — | (0.28 | ) | (0.28 | ) | 13.05 | (8.89 | ) | 13 | 1.23 | (e) | 1.32 | (e) | (0.15 | )(e) | 18 | |||||||||||||||||||||||||||||||||
Year ended 10/31/14 | 13.74 | 0.05 | 1.03 | 1.08 | (0.08 | ) | (0.12 | ) | (0.20 | ) | 14.62 | 7.96 | 15 | 1.22 | 1.87 | 0.36 | 13 | |||||||||||||||||||||||||||||||||||||||
Year ended 10/31/13 | 10.64 | 0.14 | (d) | 3.13 | 3.27 | (0.08 | ) | (0.09 | ) | (0.17 | ) | 13.74 | 31.12 | 46 | 1.22 | 5.90 | 1.09 | (d) | 10 | |||||||||||||||||||||||||||||||||||||
Year ended 10/31/12(f) | 10.00 | 0.00 | 0.64 | 0.64 | — | — | — | 10.64 | 6.40 | 11 | 1.23 | (g) | 15.35 | (g) | 0.18 | (g) | 7 | |||||||||||||||||||||||||||||||||||||||
Class R6 | ||||||||||||||||||||||||||||||||||||||||||||||||||||||||
Year ended 10/31/15 | 14.61 | (0.02 | ) | (1.26 | ) | (1.28 | ) | — | (0.28 | ) | (0.28 | ) | 13.05 | (8.82 | ) | 12 | 1.23 | (e) | 1.32 | (e) | (0.15 | )(e) | 18 | |||||||||||||||||||||||||||||||||
Year ended 10/31/14 | 13.73 | 0.05 | 1.03 | 1.08 | (0.08 | ) | (0.12 | ) | (0.20 | ) | 14.61 | 7.96 | 14 | 1.22 | 1.83 | 0.36 | 13 | |||||||||||||||||||||||||||||||||||||||
Year ended 10/31/13 | 10.64 | 0.13 | (d) | 3.13 | 3.26 | (0.08 | ) | (0.09 | ) | (0.17 | ) | 13.73 | 31.02 | 13 | 1.22 | 5.89 | 1.09 | (d) | 10 | |||||||||||||||||||||||||||||||||||||
Year ended 10/31/12(f) | 10.80 | 0.00 | (0.16 | ) | (0.16 | ) | — | — | — | 10.64 | (1.48 | ) | 10 | 1.23 | (g) | 11.37 | (g) | 0.18 | (g) | 7 | ||||||||||||||||||||||||||||||||||||
| (a) | Calculated using average shares outstanding. |
| (b) | Includes adjustments in accordance with accounting principles generally accepted in the United States of America and as such, the net asset value for financial reporting purposes and the returns based upon those net asset values may differ from the net asset value and returns for shareholder transactions. Does not include sales charges and is not annualized for periods less than one year, if applicable. |
| (c) | Portfolio turnover is calculated at the fund level and is not annualized for periods less than one year, if applicable. |
| (d) | Net investment income (loss) per share and the ratio of net investment income (loss) to average net assets includes significant dividends received during the period. Net investment income (loss) per share and the ratio of net investment income (loss) to average net assets excluding the significant dividends are $(0.04) and (0.37)%, $(0.14) and (1.12)%, $(0.08) and (0.62)%, $(0.01) and (0.12)%, $(0.01) and (0.12)% and $(0.02) and (0.12)%, for Class A, Class C, Class R, Class Y, Class R5 and Class R6 shares, respectively. |
| (e) | Ratios are based on average daily net assets (000’s omitted) of $20,763, $9,565, $194, $26,420, $14 and $13 for Class A, Class C, Class R, Class Y, Class R5 and Class R6 shares, respectively. |
| (f) | Commencement date of August 3, 2012 for Class A, Class C, Class R, Class Y and Class R5 shares and September 24, 2012 for Class R6 shares, respectively. |
| (g) | Annualized. |
19 Invesco Select Opportunities Fund
Report of Independent Registered Public Accounting Firm
To the Board of Trustees of AIM International Mutual Funds (Invesco International Mutual Funds)
and Shareholders of Invesco Select Opportunities Fund:
In our opinion, the accompanying statement of assets and liabilities, including the schedule of investments, and the related statements of operations and of changes in net assets and the financial highlights present fairly, in all material respects, the financial position of Invesco Select Opportunities Fund (one of the funds constituting AIM International Mutual Funds (Invesco International Mutual Funds), hereafter referred to as the “Fund”) at October 31, 2015, the results of its operations for the year then ended, the changes in its net assets for each of the two years in the period then ended and the financial highlights for each of the three years in the period then ended and for the period August 3, 2012 (commencement of operations) through October 31, 2012, in conformity with accounting principles generally accepted in the United States of America. These financial statements and financial highlights (hereafter referred to as “financial statements”) are the responsibility of the Fund’s management. Our responsibility is to express an opinion on these financial statements based on our audits. We conducted our audits of these financial statements in accordance with the standards of the Public Company Accounting Oversight Board (United States). Those standards require that we plan and perform the audit to obtain reasonable assurance about whether the financial statements are free of material misstatement. An audit includes examining, on a test basis, evidence supporting the amounts and disclosures in the financial statements, assessing the accounting principles used and significant estimates made by management, and evaluating the overall financial statement presentation. We believe that our audits, which included confirmation of securities at October 31, 2015 by correspondence with the custodian and brokers, and the application of alternative auditing procedures where confirmations of security purchases have not been received, provide a reasonable basis for our opinion.
PRICEWATERHOUSECOOPERS LLP
December 23, 2015
Houston, Texas
20 Invesco Select Opportunities Fund
Calculating your ongoing Fund expenses
Example
As a shareholder of the Fund, you incur two types of costs: (1) transaction costs, which may include sales charges (loads) on purchase payments or contingent deferred sales charges on redemptions, if any; and (2) ongoing costs, including management fees, distribution and/or service (12b-1) fees, and other Fund expenses. This example is intended to help you understand your ongoing costs (in dollars) of investing in the Fund and to compare these costs with ongoing costs of investing in other mutual funds. The example is based on an investment of $1,000 invested at the beginning of the period and held for the entire period May 1, 2015 through October 31, 2015.
Actual expenses
The table below provides information about actual account values and actual expenses. You may use the information in this table, together with the amount you invested, to estimate the expenses that you paid over the period. Simply divide your account value by $1,000 (for example, an $8,600 account value divided by $1,000 = 8.6), then multiply the result by the number in the table under the heading entitled “Actual Expenses Paid During Period” to estimate the expenses you paid on your account during this period.
Hypothetical example for comparison purposes
The table below also provides information about hypothetical account values and hypothetical expenses based on the Fund’s actual expense ratio and an assumed rate of return of 5% per year before expenses, which is not the Fund’s actual return.
The hypothetical account values and expenses may not be used to estimate the actual ending account balance or expenses you paid for the period. You may use this information to compare the ongoing costs of investing in the Fund and other funds. To do so, compare this 5% hypothetical example with the 5% hypothetical examples that appear in the shareholder reports of the other funds.
Please note that the expenses shown in the table are meant to highlight your ongoing costs only and do not reflect any transaction costs, such as sales charges (loads) on purchase payments or contingent deferred sales charges on redemptions, if any. Therefore, the hypothetical information is useful in comparing ongoing costs only, and will not help you determine the relative total costs of owning different funds. In addition, if these transaction costs were included, your costs would have been higher.
| Class | Beginning Account Value (05/01/15) | ACTUAL | HYPOTHETICAL (5% annual return before | Annualized Expense Ratio | ||||||||||||||||||||
| Ending Account Value (10/31/15)1 | Expenses Paid During Period2 | Ending Account Value (10/31/15) | Expenses Paid During Period2 | |||||||||||||||||||||
| A | $ | 1,000.00 | $ | 901.30 | $ | 7.04 | $ | 1,017.80 | $ | 7.48 | 1.47 | % | ||||||||||||
| C | 1,000.00 | 898.10 | 10.62 | 1,014.01 | 11.27 | 2.22 | ||||||||||||||||||
| R | 1,000.00 | 900.00 | 8.24 | 1,016.53 | 8.74 | 1.72 | ||||||||||||||||||
| Y | 1,000.00 | 902.50 | 5.85 | 1,019.06 | 6.21 | 1.22 | ||||||||||||||||||
| R5 | 1,000.00 | 901.90 | 5.85 | 1,019.06 | 6.21 | 1.22 | ||||||||||||||||||
| R6 | 1,000.00 | 902.50 | 5.85 | 1,019.06 | 6.21 | 1.22 | ||||||||||||||||||
| 1 | The actual ending account value is based on the actual total return of the Fund for the period May 1, 2015 through October 31, 2015, after actual expenses and will differ from the hypothetical ending account value which is based on the Fund’s expense ratio and a hypothetical annual return of 5% before expenses. |
| 2 | Expenses are equal to the Fund’s annualized expense ratio as indicated above multiplied by the average account value over the period, multiplied by 184/365 to reflect the most recent fiscal half year. |
21 Invesco Select Opportunities Fund
Approval of Investment Advisory and Sub-Advisory Contracts
The Board of Trustees (the Board) of AIM International Mutual Funds (Invesco International Mutual Funds) is required under the Investment Company Act of 1940, as amended, to approve annually the renewal of Invesco Select Opportunities Fund’s (the Fund) investment advisory agreements. During contract renewal meetings held on June 9-10, 2015, the Board as a whole, and the disinterested or “independent” Trustees, who comprise over 75% of the Board, voting separately, approved the continuance for the Fund of the Master Investment Advisory Agreement with Invesco Advisers, Inc. (Invesco Advisers and the investment advisory agreement) and the Master Intergroup Sub-Advisory Contract for Mutual Funds with Invesco Asset Management Deutschland GmbH, Invesco Asset Management Limited, Invesco Asset Management (Japan) Limited, Invesco Hong Kong Limited, Invesco Senior Secured Management, Inc., Invesco Canada Ltd. and Invesco PowerShares Capital Management LLC (collectively, the Affiliated Sub-Advisers and the sub-advisory contracts) for another year, effective July 1, 2015.
In evaluating the fairness and reasonableness of compensation under the Fund’s investment advisory agreement and sub-advisory contracts, the Board considered, among other things, the factors discussed below. The Board determined that continuation of the Fund’s investment advisory agreement and the sub-advisory contracts are in the best interest of the Fund and its shareholders and that the compensation payable to Invesco Advisers and the Affiliated Sub-Advisers under the agreements is fair and reasonable.
The Board’s Fund Evaluation Process
The Board’s Investments Committee has established three Sub-Committees, each of which is primarily responsible for overseeing the performance and investment management services provided by Invesco Advisers and the Affiliated Sub-Advisers to a number of the funds advised by Invesco Advisers (the Invesco Funds). The Sub-Committees meet throughout the year to review the performance of their assigned Invesco Funds, including reviewing materials prepared under the direction of the independent Senior Officer, an officer of the Invesco Funds who reports directly to the independent Trustees. Over the course of each year, the Sub-Committees meet with portfolio managers for their assigned Invesco Funds and other members of management to review the performance, investment objective(s), policies, strategies, limitations and investment risks of these funds. The Board had the benefit of reports form the Sub-Committees and Investments Committee throughout the year in considering approval of the continuance of each
Invesco Fund’s investment advisory agreement and sub-advisory contracts for another year.
During the contract renewal process, the Board receives comparative performance and fee data regarding the Invesco Funds prepared by Invesco Advisers and Lipper Inc. (Lipper), an independent provider of investment company data. The Board also receives a report and this independent written evaluation from the Senior Officer. The Senior Officer’s evaluation is prepared as part of his responsibility to manage the process by which the Invesco Funds’ proposed management fees are negotiated during the annual contract renewal process to ensure they are negotiated in a manner that is at arms’ length and reasonable. In addition to meetings with Invesco Advisers and fund counsel, the independent Trustees also discuss the continuance of the investment advisory agreement and sub-advisory contracts in separate sessions with the Senior Officer and with independent legal counsel.
The Trustees recognized that the advisory fee rates for the Invesco Funds are, in many cases, the result of years of review and negotiation. The Trustees’ deliberations and conclusions in a particular year may be based in part on their deliberations and conclusions regarding these same arrangements throughout the year and in prior years. The Trustees’ review and conclusions are based on the comprehensive consideration of all information presented to them and are not the result of any single determinative factor. Moreover, one Trustee may have weighed a particular piece of information or factor differently than another Trustee.
The discussion below is a summary of the Senior Officer’s independent written evaluation with respect to the Fund’s investment advisory agreement as well as a discussion of the material factors and related conclusions that formed the basis for the Board’s approval of the Fund’s investment advisory agreement and sub-advisory contracts. Unless otherwise stated, this information is current as of June 10, 2015, and does not reflect consideration of factors that became known to the Board after that date.
Factors and Conclusions and Summary of Independent Written Fee Evaluation
| A. | Nature, Extent and Quality of Services Provided by Invesco Advisers and the Affiliated Sub-Advisers |
The Board reviewed the advisory services provided to the Fund by Invesco Advisers under the Fund’s investment advisory agreement, the performance of Invesco Advisers in providing these services, and the credentials and experience of the officers and employees of Invesco Advisers who provide these services, including the Fund’s portfolio manager or managers. The Board’s review of the
qualifications of Invesco Advisers to provide advisory services included the Board’s consideration of Invesco Advisers’ investment process oversight, independent credit analysis and investment risk management. The Board also considered non-advisory services that Invesco Advisers and its affiliates provide to the Invesco Funds such as various back office support functions, equity and fixed income trading operations, internal audit, distribution, valuation and legal and compliance.
In determining whether to continue the Fund’s investment advisory agreement, the Board considered the benefits of reapproving an existing relationship and the greater uncertainty that may be associated with entering into a new relationship. The Board concluded that the nature, extent and quality of the services provided to the Fund by Invesco Advisers are appropriate and satisfactory and consistent with the terms of the Fund’s investment advisory agreement.
The Board reviewed the services that may be provided by the Affiliated Sub-Advisers under the sub-advisory contracts and the credentials and experience of the officers and employees of the Affiliated Sub-Advisers who provide these services. The Board noted that the Affiliated Sub-Advisers have offices and personnel that are located in financial centers around the world. As a result, the Affiliated Sub-Advisers can provide research and investment analysis on the markets and economies of various countries in which the Fund may invest, make recommendations regarding securities and assist with security trades. The Board concluded that the sub-advisory contracts benefit the Fund and its shareholders by permitting Invesco Advisers to use the resources and talents of the Affiliated Sub-Advisers in managing the Fund. The Board concluded that the nature, extent and quality of the services that may be provided by the Affiliated Sub-Advisers are appropriate and satisfactory and consistent with the terms of the Fund’s sub-advisory contracts.
| B. | Fund Performance |
The Board considered Fund performance as a relevant factor in considering whether to approve the investment advisory agreement as well as the sub-advisory contracts for the Fund, as Invesco Canada Ltd. currently manages assets of the Fund.
The Board noted that the Fund recently began operations and that comparative performance data for only the past two calendar years was available. The Board compared the Fund’s performance during the past two calendar years to the performance of funds in the Lipper performance universe and against the Lipper Global Small/Mid-Cap Funds Index. The Board noted that performance of Class A shares of the Fund was in the second quintile of its performance universe for the one year period and in the third quintile for the two year
22 Invesco Select Opportunities Fund
period (the first quintile being the best performing funds and the fifth quintile being the worst performing funds). The Board noted that the Fund’s performance was above the performance of the Index for the one and two year periods. The Trustees also reviewed more recent Fund performance and this review did not change their conclusions.
| C. | Advisory and Sub-Advisory Fees |
The Board compared the Fund’s contractual management fee rate to the contractual management fee rates of funds in the Fund’s Lipper expense group at a common asset level. The Board noted that the contractual management fee rate for Class A shares of the Fund was below the median contractual management fee rate of funds in its expense group. The Board noted that the term “contractual management fee” may include both advisory and certain administrative services fees, but that Lipper does not provide information on a fund by fund basis as to what is included. The Board noted that Invesco Advisers does not charge the Invesco Funds for the administrative services included in the term as defined by Lipper. The Board also reviewed the methodology used by Lipper in providing expense group information, which includes using each fund’s contractual management fee schedule (including any applicable breakpoints) as reported in the most recent prospectus or statement of additional information for each fund in the expense group.
The Board noted that Invesco Advisers has contractually agreed to waive fees and/or limit expenses of the Fund through at least February 29, 2016 in an amount necessary to limit total annual operating expenses to a specified percentage of average daily net assets for each class of the Fund.
The Board also compared the Fund’s effective advisory fee rate (the advisory fee rate after advisory fee waivers and before other expense limitations/waivers) to the effective advisory fee rates of other mutual funds advised by Invesco Advisers and its affiliates with investment strategies comparable to those of the Fund. The Board noted that Invesco Advisers and the Affiliated Sub-Advisers do not manage other funds or client accounts with investment strategies comparable to those of the Fund.
The Board also considered the services that may be provided by the Affiliated Sub-Advisers pursuant to the sub-advisory contracts, as well as the fees payable by Invesco Advisers to the Affiliated Sub-Advisers pursuant to the sub-advisory contracts. The Board noted that Invesco Advisers retains overall responsibility for, and provides services to, sub-advised Invesco Funds, including oversight of the Affiliated Sub-Advisers as well as the additional services described herein other than day-to-day portfolio management other than day-to-day portfolio management. The Board also noted that the sub-advisory fees are not paid directly by the Fund, but rather, are payable by Invesco Advisers to the Affiliated Sub-Advisers.
| D. | Economies of Scale and Breakpoints |
The Board considered the extent to which there are economies of scale in the provision of advisory services to the Fund. The Board also considered whether the Fund benefits from economies of scale through contractual breakpoints in the Fund’s advisory fee schedule. The Board also noted that the Fund shares directly in economies of scale through lower fees charged by third party service providers based on the combined size of the Invesco Funds and other clients advised by Invesco Advisers.
| E. | Profitability and Financial Resources |
The Board reviewed information from Invesco Advisers concerning the costs of the advisory and other services that Invesco Advisers and its affiliates provide to the Fund and the Invesco Funds and the profitability of Invesco Advisers and its affiliates in providing these services. The Board received information from Invesco Advisers about the methodology used to prepare the profitability information. The Board noted that Invesco Advisers continues to operate at a net profit from services Invesco Advisers and its affiliates provide to the Invesco Funds. The Board noted that Invesco Advisers and its affiliates did not make a profit from managing the Fund as a result of fee and expense waivers. The Board received and accepted information from Invesco Advisers demonstrating that Invesco Advisers and each Affiliated Sub-Adviser are financially sound and have the resources necessary to perform their obligations under the investment advisory agreement and sub-advisory contracts.
| F. | Collateral Benefits to Invesco Advisers and its Affiliates |
The Board considered various other benefits received by Invesco Advisers and its affiliates from the relationship with the Fund, including the fees received for providing transfer agency and distribution services to the Fund. The Board considered comparative information regarding fees charged for these services, including information provided by Lipper and other independent sources. The Board considered the performance of Invesco Advisers and its affiliates in providing these services and the organizational structure employed to provide these services. The Board also considered that these services are provided to the Fund pursuant to written contracts that are reviewed and approved on an annual basis by the Board; and that the services are required for the operation of the Fund.
The Board considered the benefits realized by Invesco Advisers and the Affiliated Sub-Advisers as a result of portfolio brokerage transactions executed through “soft dollar” arrangements. The Board noted that soft dollar arrangements shift the payment obligation for research services from Invesco Advisers and the Affiliated Sub-Advisers to the Invesco Funds and that the research received may be used with other clients of Invesco Advisers and may reduce Invesco Advisers’ and the Affiliated Sub-Advisers’ expenses. The Board also
considered that it receives periodic reports from the Chief Compliance Officer of the Invesco Funds demonstrating that these arrangements are consistent with regulatory requirements. The Board did not deem the soft dollar arrangements to be inappropriate.
The Board considered that the Fund’s uninvested cash and cash collateral from any securities lending arrangements may be invested in money market funds advised by Invesco Advisers pursuant to procedures approved by the Board. The Board noted that Invesco Advisers receives advisory fees from these affiliated money market funds attributable to such investments, although Invesco Advisers has contractually agreed to waive through varying periods the advisory fees payable by the Invesco Funds with respect to investments in the affiliated money market funds. The waiver is in an amount equal to 100% of the net advisory fee Invesco Advisers receives from the affiliated money market funds with respect to the Fund’s investment in the affiliated money market funds of uninvested cash, but not cash collateral. The Board concluded that the amount of advisory fees received by Invesco Advisors from the Fund’s investment of collateral from any securities lending arrangements in the affiliated money market funds is fair and reasonable.
The Board also considered the Fund may use an affiliated broker to execute certain trades for the Fund to among other things, control information leakage, and were advised that such trades would be executed in compliance with rules under the Investment Company Act of 1940, as amended, and consistent with best execution obligations.
23 Invesco Select Opportunities Fund
Tax Information
Form 1099-DIV, Form 1042-S and other year-end tax information provide shareholders with actual calendar year amounts that should be included in their tax returns. Shareholders should consult their tax advisors.
The following distribution information is being provided as required by the Internal Revenue Code or to meet a specific state’s requirement.
The Fund designates the following amounts or, if subsequently determined to be different, the maximum amount allowable for its fiscal year ended October 31, 2015:
Federal and State Income Tax | ||||
Long-Term Capital Gain Distributions | $ | 650,523 | ||
Qualified Dividend Income* | 100.00 | % | ||
Corporate Dividends Received Deduction* | 22.38 | % | ||
U.S. Treasury Obligations* | 0.00 | % | ||
| * | The above percentages are based on ordinary income dividends paid to shareholders during the Fund’s fiscal year. |
Non-Resident Alien Shareholders | ||||
Qualified Short-Term Gains | $ | 365,533 | ||
24 Invesco Select Opportunities Fund
Trustees and Officers
The address of each trustee and officer is AIM International Mutual Funds (Invesco International Mutual Funds) (the “Trust”), 11 Greenway Plaza, Suite 1000, Houston, Texas 77046-1173. The trustees serve for the life of the Trust, subject to their earlier death, incapacitation, resignation, retirement or removal as more specifically provided in the Trust’s organizational documents. Each officer serves for a one year term or until their successors are elected and qualified. Column two below includes length of time served with predecessor entities, if any.
| Name, Year of Birth and Position(s) Held with the Trust | Trustee and/ or Officer Since | Principal Occupation(s) During Past 5 Years | Number of Funds in Fund Complex Overseen by Trustee | Other Directorship(s) Past 5 Years | ||||
| Interested Persons | ||||||||
Martin L. Flanagan1 — 1960 Trustee | 2007 | Executive Director, Chief Executive Officer and President, Invesco Ltd. (ultimate parent of Invesco and a global investment management firm); Advisor to the Board, Invesco Advisers, Inc. (formerly known as Invesco Institutional (N.A.), Inc.); Trustee, The Invesco Funds; Vice Chair, Investment Company Institute; and Member of Executive Board, SMU Cox School of Business
Formerly: Chairman and Chief Executive Officer, Invesco Advisers, Inc. (registered investment adviser); Director, Chairman, Chief Executive Officer and President, IVZ Inc. (holding company), INVESCO Group Services, Inc. (service provider) and Invesco North American Holdings, Inc. (holding company); Director, Chief Executive Officer and President, Invesco Holding Company Limited (parent of Invesco and a global investment management firm); Director, Invesco Ltd.; Chairman, Investment Company Institute and President, Co-Chief Executive Officer, Co-President, Chief Operating Officer and Chief Financial Officer, Franklin Resources, Inc. (global investment management organization). | 145 | None | ||||
Philip A. Taylor2 — 1954 Trustee, President and Principal Executive Officer | 2006 | Head of North American Retail and Senior Managing Director, Invesco Ltd.; Director, Co-Chairman, Co-President and Co-Chief Executive Officer, Invesco Advisers, Inc. (formerly known as Invesco Institutional (N.A.), Inc.) (registered investment adviser); Director, Chairman, Chief Executive Officer and President, Invesco Management Group, Inc. (formerly known as Invesco Aim Management Group, Inc.) (financial services holding company); Director and President, INVESCO Funds Group, Inc. (registered investment adviser and registered transfer agent); Director and Chairman, Invesco Investment Services, Inc. (formerly known as Invesco Aim Investment Services, Inc.) (registered transfer agent) and IVZ Distributors, Inc. (formerly known as INVESCO Distributors, Inc.) (registered broker dealer); Chief Executive Officer, Invesco Corporate Class Inc. (corporate mutual fund company) Director, Chairman and Chief Executive Officer, Invesco Canada Ltd. (formerly known as Invesco Trimark Ltd./Invesco Trimark Ltèe) (registered investment adviser and registered transfer agent); Trustee, President and Principal Executive Officer, The Invesco Funds (other than AIM Treasurer’s Series Trust (Invesco Treasurer’s Series Trust), Short-Term Investments Trust and Invesco Management Trust); Trustee and Executive Vice President, The Invesco Funds (AIM Treasurer’s Series Trust (Invesco Treasurer’s Series Trust), Short-Term Investments Trust and Invesco Management Trust only); Director, Invesco Investment Advisers LLC (formerly known as Van Kampen Asset Management); Director, Chief Executive Officer and President, Van Kampen Exchange Corp.
Formerly: Director, President and Chairman, Invesco Inc. (holding company), Invesco Canada Holdings Inc. (holding company), Trimark Investments Ltd./Placements Trimark Ltèe and Invesco Financial Services Ltd/Services Financiers Invesco Ltèe; Chiief Executive Officer, Invesco Canada Fund Inc (corporate mutual fund company); Director and Chairman, Van Kampen Investor Services Inc.; Director, Chief Executive Officer and President, 1371 Preferred Inc. (holding company) and Van Kampen Investments Inc.; Director and President, AIM GP Canada Inc. (general partner for limited partnerships) and Van Kampen Advisors, Inc.; Director and Chief Executive Officer, Invesco Trimark Dealer Inc. (registered broker dealer); Director, Invesco Distributors, Inc. (formerly known as Invesco Aim Distributors, Inc.) (registered broker dealer); Manager, Invesco PowerShares Capital Management LLC; Director, Chief Executive Officer and President, Invesco Advisers, Inc.; Director, Chairman, Chief Executive Officer and President, Invesco Aim Capital Management, Inc.; President, Invesco Trimark Dealer Inc. and Invesco Trimark Ltd./Invesco Trimark Ltèe; Director and President, AIM Trimark Corporate Class Inc. and AIM Trimark Canada Fund Inc.; Senior Managing Director, Invesco Holding Company Limited; Director and Chairman, Fund Management Company (former registered broker dealer); President and Principal Executive Officer, The Invesco Funds (AIM Treasurer’s Series Trust (Invesco Treasurer’s Series Trust), and Short-Term Investments Trust only); President, AIM Trimark Global Fund Inc. and AIM Trimark Canada Fund Inc.. | 145 | None |
| 1 | Mr. Flanagan is considered an interested person (within the meaning of Section 2(a)(19) of the 1940 Act) of the Trust because he is an officer of the Adviser to the Trust, and an officer and a director of Invesco Ltd., ultimate parent of the Adviser. |
| 2 | Mr. Taylor is considered an interested person (within the meaning of Section 2(a)(19) of the 1940 Act) of the Trust because he is an officer and a director of the Adviser. |
T-1 Invesco Select Opportunities Fund
Trustees and Officers—(continued)
| Name, Year of Birth and Position(s) Held with the Trust | Trustee and/ or Officer Since | Principal Occupation(s) During Past 5 Years | Number of Funds in Fund Complex Overseen by Trustee | Other Directorship(s) Past 5 Years | ||||
| Independent Trustees | ||||||||
Bruce L. Crockett — 1944 Trustee and Chair | 2003 | Chairman, Crockett Technologies Associates (technology consulting company)
Formerly: Director, Captaris (unified messaging provider); Director, President and Chief Executive Officer, COMSAT Corporation; Chairman, Board of Governors of INTELSAT (international communications company); ACE Limited (insurance company); Independent Directors Council and Investment Company Institute | 145 | ALPS (Attorneys Liability Protection Society) (insurance company) and Globe Specialty Metals, Inc. (metallurgical company) | ||||
David C. Arch — 1945 Trustee | 2010 | Chairman of Blistex Inc., a consumer health care products manufacturer | 145 | Board member of the Illinois Manufacturers’ Association; Member of the Board of Visitors, Institute for the Humanities, University of Michigan; Member of the Audit Committee of the Edward-Elmhurst Hospital | ||||
James T. Bunch — 1942 Trustee | 2000 | Managing Member, Grumman Hill Group LLC (family office/private equity investments)
Formerly: Founder, Green Manning & Bunch Ltd. (investment banking firm) (1988-2010); Executive Committee, United States Golf Association; and Chairman, Board of Governors, Western Golf Association | 145 | Chairman of the Board of Trustees, Evans Scholars Foundation; and Chairman of the Board, Denver Film Society | ||||
Rodney F. Dammeyer — 1940 Trustee | 2010 | Chairman of CAC, LLC, (private company offering capital investment and management advisory services)
Formerly: Prior to 2001, Managing Partner at Equity Group Corporate Investments; Prior to 1995, Chief Executive Officer of Itel Corporation (formerly Anixter International); Prior to 1985, experience includes Senior Vice President and Chief Financial Officer of Household International, Inc., Executive Vice President and Chief Financial Officer of Northwest Industries, Inc. and Partner of Arthur Andersen & Co.; From 1987 to 2010, Director/Trustee of investment companies in the Van Kampen Funds complex | 145 | Director of Quidel Corporation and Stericycle, Inc. | ||||
Albert R. Dowden — 1941 Trustee | 2003 | Director of a number of public and private business corporations, including the Boss Group, Ltd. (private investment and management); Nature’s Sunshine Products, Inc. and Reich & Tang Funds (5 portfolios) (registered investment company)
Formerly: Director, Homeowners of America Holding Corporation/Homeowners of America Insurance Company (property casualty company); Director, Continental Energy Services, LLC (oil and gas pipeline service); Director, CompuDyne Corporation (provider of product and services to the public security market) and Director, Annuity and Life Re (Holdings), Ltd. (reinsurance company); Director, President and Chief Executive Officer, Volvo Group North America, Inc.; Senior Vice President, AB Volvo; Director of various public and private corporations; Chairman, DHJ Media, Inc.; Director, Magellan Insurance Company; and Director, The Hertz Corporation, Genmar Corporation (boat manufacturer), National Media Corporation; Advisory Board of Rotary Power International (designer, manufacturer, and seller of rotary power engines); and Chairman, Cortland Trust, Inc. (registered investment company) | 145 | Director of: Nature’s Sunshine Products, Inc., Reich & Tang Funds, Homeowners of America Holding Corporation/ Homeowners of America Insurance Company, the Boss Group | ||||
Jack M. Fields — 1952 Trustee | 2003 | Chief Executive Officer, Twenty First Century Group, Inc. (government affairs company); Owner and Chief Executive Officer, Dos Angeles Ranch, L.P. (cattle, hunting, corporate entertainment); and Discovery Global Education Fund (non-profit)
Formerly: Chief Executive Officer, Texana Timber LP (sustainable forestry company); Director of Cross Timbers Quail Research Ranch (non-profit); and member of the U.S. House of Representatives | 145 | Insperity, Inc. (formerly known as Administaff) | ||||
Prema Mathai-Davis — 1950 Trustee | 2003 | Retired. Formerly: Chief Executive Officer, YWCA of the U.S.A. | 145 | None | ||||
Larry Soll — 1942 Trustee | 1997 | Retired. Formerly: Chairman, Chief Executive Officer and President, Synergen Corp. (a biotechnology company) | 145 | None | ||||
Hugo F. Sonnenschein — 1940 Trustee | 2010 | President Emeritus and Honorary Trustee of the University of Chicago and the Adam Smith Distinguished Service Professor in the Department of Economics at the University of Chicago. Prior to 2000, President of the University of Chicago | 145 | Trustee of the University of Rochester and a member of its investment committee; Member of the National Academy of Sciences and the American Philosophical Society; Fellow of the American Academy of Arts and Sciences | ||||
Raymond Stickel, Jr. — 1944 Trustee | 2005 | Retired. Formerly: Director, Mainstay VP Series Funds, Inc. (25 portfolios) and Partner, Deloitte & Touche | 145 | None |
T-2 Invesco Select Opportunities Fund
Trustees and Officers—(continued)
| Name, Year of Birth and Position(s) Held with the Trust | Trustee and/ or Officer Since | Principal Occupation(s) During Past 5 Years | Number of Funds in Fund Complex Overseen by Trustee | Other Directorship(s) Past 5 Years | ||||
| Independent Trustees—(continued) | ||||||||
Suzanne H. Woolsey — 1941 Trustee | 2014 | Chief Executive Officer of Woolsey Partners LLC | 145 | Emeritus Chair of the Board of Trustees of the Institute for Defense Analyses; Trustee of Colorado College; Trustee of California Institute of Technology; Prior to 2014, Director of Fluor Corp.; Prior to 2010, Trustee of the German Marshall Fund of the United States; Prior to 2010 Trustee of the Rocky Mountain Institute | ||||
| Other Officers | ||||||||
Russell C. Burk — 1958 Senior Vice President and Senior Officer | 2005 | Senior Vice President and Senior Officer, The Invesco Funds | N/A | N/A | ||||
John M. Zerr — 1962 Senior Vice President, Chief Legal Officer and Secretary | 2006 | Director, Senior Vice President, Secretary and General Counsel, Invesco Management Group, Inc. (formerly known as Invesco Aim Management Group, Inc.) and Van Kampen Exchange Corp.; Senior Vice President, Invesco Advisers, Inc. (formerly known as Invesco Institutional (N.A.), Inc.) (registered investment adviser); Senior Vice President and Secretary, Invesco Distributors, Inc. (formerly known as Invesco Aim Distributors, Inc.); Director, Vice President and Secretary, Invesco Investment Services, Inc. (formerly known as Invesco Aim Investment Services, Inc.) and IVZ Distributors, Inc. (formerly known as INVESCO Distributors, Inc.); Director and Vice President, INVESCO Funds Group, Inc.; Senior Vice President, Chief Legal Officer and Secretary, The Invesco Funds; Managing Director, Invesco PowerShares Capital Management LLC; Director, Secretary and General Counsel, Invesco Investment Advisers LLC (formerly known as Van Kampen Asset Management); Secretary and General Counsel, Invesco Capital Markets, Inc. (formerly known as Van Kampen Funds Inc.) and Chief Legal Officer, PowerShares Exchange-Traded Fund Trust, PowerShares Exchange-Traded Fund Trust II, PowerShares India Exchange-Traded Fund Trust, PowerShares Actively Managed Exchange-Traded Fund Trust, and PowerShares Actively Managed Exchange-Traded Commodity Fund Trust
Formerly: Director and Vice President, Van Kampen Advisors Inc.; Director, Vice President, Secretary and General Counsel, Van Kampen Investor Services Inc.; Director, Invesco Distributors, Inc. (formerly known as Invesco Aim Distributors, Inc.); Director, Senior Vice President, General Counsel and Secretary, Invesco Aim Advisers, Inc. and Van Kampen Investments Inc.; Director, Vice President and Secretary, Fund Management Company; Director, Senior Vice President, Secretary, General Counsel and Vice President, Invesco Aim Capital Management, Inc.; Chief Operating Officer and General Counsel, Liberty Ridge Capital, Inc. (an investment adviser); Vice President and Secretary, PBHG Funds (an investment company) and PBHG Insurance Series Fund (an investment company); Chief Operating Officer, General Counsel and Secretary, Old Mutual Investment Partners (a broker-dealer); General Counsel and Secretary, Old Mutual Fund Services (an administrator) and Old Mutual Shareholder Services (a shareholder servicing center); Executive Vice President, General Counsel and Secretary, Old Mutual Capital, Inc. (an investment adviser); and Vice President and Secretary, Old Mutual Advisors Funds (an investment company) | N/A | N/A | ||||
Sheri Morris — 1964 Vice President, Treasurer and Principal Financial Officer | 2003 | Vice President, Treasurer and Principal Financial Officer, The Invesco Funds; Vice President, Invesco Advisers, Inc. (formerly known as Invesco Institutional (N.A.), Inc.) (registered investment adviser); and Vice President, PowerShares Exchange-Traded Fund Trust, PowerShares Exchange-Traded Fund Trust II, PowerShares India Exchange-Traded Fund Trust, PowerShares Actively Managed Exchange-Traded Fund Trust, and PowerShares Actively Managed Exchange-Traded Commodity Fund Trust
Formerly: Vice President, Invesco Aim Advisers, Inc., Invesco Aim Capital Management, Inc. and Invesco Aim Private Asset Management, Inc.; Assistant Vice President and Assistant Treasurer, The Invesco Funds and Assistant Vice President, Invesco Advisers, Inc., Invesco Aim Capital Management, Inc. and Invesco Aim Private Asset Management, Inc.; and Treasurer, PowerShares Exchange-Traded Fund Trust, PowerShares Exchange-Traded Fund Trust II, PowerShares India Exchange-Traded Fund Trust and PowerShares Actively Managed Exchange-Traded Fund Trust | N/A | N/A | ||||
T-3 Invesco Select Opportunities Fund
Trustees and Officers—(continued)
| Name, Year of Birth and Position(s) Held with the Trust | Trustee and/ or Officer Since | Principal Occupation(s) During Past 5 Years | Number of Funds in Fund Complex Overseen by Trustee | Other Directorship(s) Past 5 Years | ||||
| Other Officers—(continued) | ||||||||
Karen Dunn Kelley — 1960 Vice President | 2003 | Senior Managing Director, Investments, Invesco Ltd.; Director, Co-President, Co-Chief Executive Officer, and Co-Chairman, Invesco Advisers, Inc. (formerly known as Invesco Institutional (N.A.), Inc.) (registered investment adviser); Chairman, Invesco Senior Secured Management, Inc.; Senior Vice President, Invesco Management Group, Inc. (formerly known as Invesco Aim Management Group, Inc.); Executive Vice President, Invesco Distributors, Inc. (formerly known as Invesco Aim Distributors, Inc.); Director, Invesco Mortgage Capital Inc. and Invesco Management Company Limited; Vice President, The Invesco Funds (other than AIM Treasurer’s Series Trust (Invesco Treasurer’s Series Trust), Short-Term Investments Trust and Invesco Management Trust); and President and Principal Executive Officer, The Invesco Funds (AIM Treasurer’s Series Trust (Invesco Treasurer’s Series Trust), Short-Term Investments Trust and Invesco Management Trust only)
Formerly: Director and President, INVESCO Asset Management (Bermuda) Ltd., Director, INVESCO Global Asset Management Limited and INVESCO Management S.A.; Senior Vice President, Van Kampen Investments Inc. and Invesco Advisers, Inc. (formerly known as Invesco Institutional (N.A.), Inc.) (registered investment adviser); Vice President, Invesco Advisers, Inc. (formerly known as Invesco Institutional (N.A.), Inc.); Director of Cash Management and Senior Vice President, Invesco Advisers, Inc. and Invesco Aim Capital Management, Inc.; Director and President, Fund Management Company; Chief Cash Management Officer, Director of Cash Management, Senior Vice President, and Managing Director, Invesco Aim Capital Management, Inc.; Director of Cash Management, Senior Vice President, and Vice President, Invesco Advisers, Inc. and The Invesco Funds (AIM Treasurer’s Series Trust (Invesco Treasurer’s Series Trust), and Short-Term Investments Trust only) | N/A | N/A | ||||
Crissie M. Wisdom — 1969 Anti-Money Laundering Compliance Officer | 2013 | Anti-Money Laundering Compliance Officer, Invesco Advisers, Inc. (formerly known as Invesco Institutional (N.A.), Inc.) (registered investment adviser), Invesco Capital Markets, Inc. (formerly known as Van Kampen Funds Inc.), Invesco Distributors, Inc., Invesco Investment Services, Inc., Invesco Management Group, Inc., Van Kampen Exchange Corp., The Invesco Funds, and PowerShares Exchange-Traded Fund Trust, PowerShares Exchange-Traded Fund Trust II, PowerShares India Exchange-Traded Fund Trust, PowerShares Actively Managed Exchange-Traded Fund Trust and PowerShares Actively Managed Exchange-Traded Commodity Fund Trust; Anti-Money Laundering Compliance Officer and Bank Secrecy Act Officer, INVESCO National Trust Company and Invesco Trust Company; and Fraud Prevention Manager and Controls and Risk Analysis Manager for Invesco Investment Services, Inc.. | N/A | N/A | ||||
Lisa O. Brinkley — 1959 Chief Compliance Officer | 2015 | Senior Vice President and Chief Compliance Officer, Invesco Advisers, Inc. (registered investment adviser) (formerly known as Invesco Institutional (N.A., Inc.); and Chief Compliance Officer, The Invesco Funds
Formerly: Global Assurance Officer, Invesco Ltd. and Vice President, The Invesco Funds; Chief Compliance Officer, Invesco Distributors, Inc. (formerly known as Invesco Aim Distributors, Inc.), Invesco Investment Services, Inc.(formerly known as Invesco Aim Investment Services, Inc.) and Van Kampen Investor Services Inc.; Senior Vice President, Invesco Management Group, Inc.; Senior Vice President and Chief Compliance Officer, Invesco Advisers, Inc. and The Invesco Funds; Vice President and Chief Compliance Officer, Invesco Aim Capital Management, Inc. and Invesco Distributors, Inc.; Vice President, Invesco Investment Services, Inc. and Fund Management Company. | N/A | N/A |
The Statement of Additional Information of the Trust includes additional information about the Fund’s Trustees and is available upon request, without charge, by calling 1.800.959.4246. Please refer to the Fund’s prospectus for information on the Fund’s sub-advisers.
Office of the Fund 11 Greenway Plaza, Suite 1000 Houston, TX 77046-1173 | Investment Adviser Invesco Advisers, Inc. 1555 Peachtree Street, N.E. Atlanta, GA 30309 | Distributor Invesco Distributors, Inc. 11 Greenway Plaza, Suite 1000 Houston, TX 77046-1173 | Auditors PricewaterhouseCoopers LLP 1000 Louisiana Street, Suite 5800 Houston, TX 77002-5678 | |||
Counsel to the Fund Stradley Ronon Stevens & Young, LLP 2005 Market Street, Suite 2600 Philadelphia, PA 19103-7018 | Counsel to the Independent Trustees Goodwin Procter LLP 901 New York Avenue, N.W. Washington, D.C. 20001 | Transfer Agent Invesco Investment Services, Inc. 11 Greenway Plaza, Suite 1000 Houston, TX 77046-1173 | Custodian State Street Bank and Trust Company 225 Franklin Street Boston, MA 02110-2801 | |||
T-4 Invesco Select Opportunities Fund

Invesco mailing information
Send general correspondence to Invesco Investment Services, Inc., P.O. Box 219078, Kansas City, MO 64121-9078.
Important notice regarding delivery of security holder documents
To reduce Fund expenses, only one copy of most shareholder documents may be mailed to shareholders with multiple accounts at the same address (Householding). Mailing of your shareholder documents may be householded indefinitely unless you instruct us otherwise. If you do not want the mailing of these documents to be combined with those for other members of your household, please contact Invesco Investment Services, Inc. at 800 959 4246 or contact your financial institution. We will begin sending you individual copies for each account within 30 days after receiving your request.
Fund holdings and proxy voting information
The Fund provides a complete list of its holdings four times in each fiscal year, at the quarter ends. For the second and fourth quarters, the lists appear in the Fund’s semiannual and annual reports to shareholders. For the first and third quarters, the Fund files the lists with the Securities and Exchange Commission (SEC) on Form N-Q. The most recent list of portfolio holdings is available at invesco.com/completeqtrholdings. Shareholders can also look up the Fund’s Forms N-Q on the SEC website at sec.gov. Copies of the Fund’s Forms N-Q may be reviewed and copied at the SEC Public Reference Room in Washington, D.C. You can obtain information on the operation of the Public Reference Room, including information about duplicating fee charges, by calling 202 551 8090 or 800 732 0330, or by electronic request at the following email address: publicinfo@sec.gov. The SEC file numbers for the Fund are shown below.
A description of the policies and procedures that the Fund uses to determine how to vote proxies relating to portfolio securities is available without charge, upon request, from our Client Services department at 800 959 4246 or at invesco.com/proxyguidelines. The information is also available on the SEC website, sec.gov.
Information regarding how the Fund voted proxies related to its portfolio securities during the most recent 12-month period ended June 30 is available at invesco.com/proxysearch. The information is also available on the SEC website, sec.gov. Invesco Advisers, Inc. is an investment adviser; it provides investment advisory services to individual and institutional clients and does not sell securities. Invesco Distributors, Inc. is the US distributor for Invesco Ltd.’s retail mutual funds, exchange-traded funds and institutional money market funds. Both are wholly owned, indirect subsidiaries of Invesco Ltd. |  |
SEC file numbers: 811-06463 and 033-44611 SOPP-AR-1 Invesco Distributors, Inc.
| ITEM 2. | CODE OF ETHICS. |
There were no amendments to the Code of Ethics (the “Code”) that applies to the Registrant’s Principal Executive Officer (“PEO”) and Principal Financial Officer (“PFO”) during the period covered by the report. The Registrant did not grant any waivers, including implicit waivers, from any provisions of the Code to the PEO or PFO during the period covered by this report.
| ITEM 3. | AUDIT COMMITTEE FINANCIAL EXPERT. |
The Board of Trustees has determined that the Registrant has at least one audit committee financial expert serving on its Audit Committee. The Audit Committee financial expert is Raymond Stickel, Jr. Mr. Stickel is “independent” within the meaning of that term as used in Form N-CSR.
| ITEM 4. | PRINCIPAL ACCOUNTANT FEES AND SERVICES. |
(a) to (d)
Fees Billed by PWC Related to the Registrant
PWC billed the Registrant aggregate fees for services rendered to the Registrant for the last two fiscal years as follows:
| Fees Billed for Services Rendered to the Registrant for fiscal year end 2015 | (e)(2) Percentage of Fees | Fees Billed for Services Rendered to the Registrant for fiscal year end 2014 | (e)(2) Percentage of Fees | |||||
Audit Fees | $259,490 | N/A | $251,900 | N/A | ||||
Audit-Related Fees | $ 0 | 0% | $ 0 | 0% | ||||
Tax Fees(2) | $136,912 | 0% | $176,346 | 0% | ||||
All Other Fees | $ 0 | 0% | $ 0 | 0% | ||||
Total Fees | $396,402 | 0% | $428,246 | 0% | ||||
(g) PWC billed the Registrant aggregate non-audit fees of $136,912 for the fiscal year ended 2015, and $176,346 for the fiscal year ended 2014, for non-audit services rendered to the Registrant.
| (1) | With respect to the provision of non-audit services, the pre-approval requirement is waived pursuant to a de minimis exception if (i) such services were not recognized as non-audit services by the Registrant at the time of engagement, (ii) the aggregate amount of all such services provided is no more than 5% of the aggregate audit and non-audit fees paid by the Registrant to PWC during a fiscal year; and (iii) such services are promptly brought to the attention of the Registrant’s Audit Committee and approved by the Registrant’s Audit Committee prior to the completion of the audit. |
| (2) | Tax fees for the fiscal year end 2015 include fees billed for reviewing tax returns. Tax fees for the fiscal year end 2014 includes fees billed for reviewing tax returns. |
Fees Billed by PWC Related to Invesco and Invesco Affiliates
PWC billed Invesco Advisers, Inc. (“Invesco”), the Registrant’s adviser, and any entity controlling, controlled by or under common control with Invesco that provides ongoing services to the Registrant (“Invesco Affiliates”) aggregate fees for pre-approved non-audit services rendered to Invesco and Invesco Affiliates for the last two fiscal years as follows:
Fees Billed for Non- to be Pre-Approved by the Registrant’s Audit Committee | (e)(2) Percentage of Fees | Fees Billed for Non- to be Pre-Approved by the Registrant’s Audit Committee | (e)(2) Percentage of Fees | |||||
Audit-Related Fees | $ 574,000 | 0% | $574,000 | 0% | ||||
Tax Fees | $ 0 | 0% | $ 0 | 0% | ||||
All Other Fees | $3,750,000 | 0% | $ 0 | 0% | ||||
Total Fees(2) | $4,324,000 | 0% | $574,000 | 0% | ||||
| (1) | With respect to the provision of non-audit services, the pre-approval requirement is waived pursuant to a de minimis exception if (i) such services were not recognized as non-audit services by the Registrant at the time of engagement, (ii) the aggregate amount of all such services provided is no more than 5% of the aggregate audit and non-audit fees paid by the Registrant, Invesco and Invesco Affiliates to PWC during a fiscal year; and (iii) such services are promptly brought to the attention of the Registrant’s Audit Committee and approved by the Registrant’s Audit Committee prior to the completion of the audit. |
| (2) | Audit-Related fees for the year end 2015 include fees billed related to reviewing controls at a service organization. Audit-Related fees for the year end 2014 include fees billed related to reviewing controls at a service organization. |
(g) Including the fees for services not required to be pre-approved by the registrant’s audit committee, PWC billed Invesco and Invesco Affiliates aggregate non-audit fees of $9,083,022 for the fiscal year ended 2015, and $2,939,346 for the fiscal year ended 2014, for non-audit services rendered to Invesco and Invesco Affiliates.
(h) The Audit Committee also has considered whether the provision of non-audit services that were rendered to Invesco and Invesco Affiliates that were not required to be pre-approved pursuant to SEC regulations, if any, is compatible with maintaining PWC’s independence. To the extent that such services were provided, the Audit Committee determined that the provision of such services is compatible with PWC maintaining independence with respect to the Registrant.
(f) Not applicable.
(e)(1)
PRE-APPROVAL OF AUDIT AND NON-AUDIT SERVICES
POLICIES AND PROCEDURES
As adopted by the Audit Committees of
the Invesco Funds (the “Funds”)
Last Amended May 4, 2010
Statement of Principles
Under the Sarbanes-Oxley Act of 2002 and rules adopted by the Securities and Exchange Commission (“SEC”) (“Rules”), the Audit Committees of the Funds’ (the “Audit Committees”) Board of Trustees (the “Board”) are responsible for the appointment, compensation and oversight of the work of independent accountants (an “Auditor”). As part of this responsibility and to assure that the Auditor’s independence is not impaired, the Audit Committees pre-approve the audit and non-audit services provided to the Funds by each Auditor, as well as all non-audit services provided by the Auditor to the Funds’ investment adviser and to affiliates of the adviser that provide ongoing services to the Funds (“Service Affiliates”) if the services directly impact the Funds’ operations or financial reporting. The SEC Rules also specify the types of services that an Auditor may not provide to its audit client. The following policies and procedures comply with the requirements for pre-approval and provide a mechanism by which management of the Funds may request and secure pre-approval of audit and non-audit services in an orderly manner with minimal disruption to normal business operations.
Proposed services either may be pre-approved without consideration of specific case-by-case services by the Audit Committees (“general pre-approval”) or require the specific pre-approval of the Audit Committees (“specific pre-approval”). As set forth in these policies and procedures, unless a type of service has received general pre-approval, it will require specific pre-approval by the Audit Committees. Additionally, any fees exceeding 110% of estimated pre-approved fee levels provided at the time the service was pre-approved will also require specific approval by the Audit Committees before payment is made. The Audit Committees will also consider the impact of additional fees on the Auditor’s independence when determining whether to approve any additional fees for previously pre-approved services.
The Audit Committees will annually review and generally pre-approve the services that may be provided by each Auditor without obtaining specific pre-approval from the Audit Committee generally on an annual basis. The term of any general pre-approval runs from the date of such pre-approval through September 30th of the following year, unless the Audit Committees consider a different period and state otherwise. The Audit Committees will add to or subtract from the list of general pre-approved services from time to time, based on subsequent determinations.
The purpose of these policies and procedures is to set forth the guidelines to assist the Audit Committees in fulfilling their responsibilities.
Delegation
The Audit Committees may from time to time delegate pre-approval authority to one or more of its members who are Independent Trustees. All decisions to pre-approve a service by a delegated member shall be reported to the Audit Committees at the next quarterly meeting.
Audit Services
The annual audit services engagement terms will be subject to specific pre-approval of the Audit Committees. Audit services include the annual financial statement audit and other procedures such as tax provision work that is required to be performed by the independent auditor to be able to form an opinion on the Funds’ financial statements. The Audit Committees will obtain, review and consider sufficient information concerning the proposed Auditor to make a reasonable evaluation of the Auditor’s qualifications and independence.
In addition to the annual Audit services engagement, the Audit Committees may grant either general or specific pre-approval of other audit services, which are those services that only the independent auditor
reasonably can provide. Other Audit services may include services such as issuing consents for the inclusion of audited financial statements with SEC registration statements, periodic reports and other documents filed with the SEC or other documents issued in connection with securities offerings.
Non-Audit Services
The Audit Committees may provide either general or specific pre-approval of any non-audit services to the Funds and its Service Affiliates if the Audit Committees believe that the provision of the service will not impair the independence of the Auditor, is consistent with the SEC’s Rules on auditor independence, and otherwise conforms to the Audit Committees’ general principles and policies as set forth herein.
Audit-Related Services
“Audit-related services” are assurance and related services that are reasonably related to the performance of the audit or review of the Fund’s financial statements or that are traditionally performed by the independent auditor. Audit-related services include, among others, accounting consultations related to accounting, financial reporting or disclosure matters not classified as “Audit services”; assistance with understanding and implementing new accounting and financial reporting guidance from rulemaking authorities; and agreed-upon procedures related to mergers, compliance with ratings agency requirements and interfund lending activities.
Tax Services
“Tax services” include, but are not limited to, the review and signing of the Funds’ federal tax returns, the review of required distributions by the Funds and consultations regarding tax matters such as the tax treatment of new investments or the impact of new regulations. The Audit Committees will scrutinize carefully the retention of the Auditor in connection with a transaction initially recommended by the Auditor, the major business purpose of which may be tax avoidance or the tax treatment of which may not be supported in the Internal Revenue Code and related regulations. The Audit Committees will consult with the Funds’ Treasurer (or his or her designee) and may consult with outside counsel or advisors as necessary to ensure the consistency of Tax services rendered by the Auditor with the foregoing policy.
No Auditor shall represent any Fund or any Service Affiliate before a tax court, district court or federal court of claims.
Under rules adopted by the Public Company Accounting Oversight Board and approved by the SEC, in connection with seeking Audit Committees’ pre-approval of permissible Tax services, the Auditor shall:
| 1. | Describe in writing to the Audit Committees, which writing may be in the form of the proposed engagement letter: |
| a. | The scope of the service, the fee structure for the engagement, and any side letter or amendment to the engagement letter, or any other agreement between the Auditor and the Fund, relating to the service; and |
| b. | Any compensation arrangement or other agreement, such as a referral agreement, a referral fee or fee-sharing arrangement, between the Auditor and any person (other than the Fund) with respect to the promoting, marketing, or recommending of a transaction covered by the service; |
| 2. | Discuss with the Audit Committees the potential effects of the services on the independence of the Auditor; and |
| 3. | Document the substance of its discussion with the Audit Committees. |
All Other Auditor Services
The Audit Committees may pre-approve non-audit services classified as “All other services” that are not categorically prohibited by the SEC, as listed in Exhibit 1 to this policy.
Pre-Approval Fee Levels or Established Amounts
Pre-approval of estimated fees or established amounts for services to be provided by the Auditor under general or specific pre-approval policies will be set periodically by the Audit Committees. Any proposed fees exceeding 110% of the maximum estimated pre-approved fees or established amounts for pre-approved audit and non-audit services will be reported to the Audit Committees at the quarterly Audit Committees meeting and will require specific approval by the Audit Committees before payment is made. The Audit Committees will always factor in the overall relationship of fees for audit and non-audit services in determining whether to pre-approve any such services and in determining whether to approve any additional fees exceeding 110% of the maximum pre-approved fees or established amounts for previously pre-approved services.
Procedures
Generally on an annual basis, Invesco Advisers, Inc. (“Invesco”) will submit to the Audit Committees for general pre-approval, a list of non-audit services that the Funds or Service Affiliates of the Funds may request from the Auditor. The list will describe the non-audit services in reasonable detail and will include an estimated range of fees and such other information as the Audit Committee may request.
Each request for services to be provided by the Auditor under the general pre-approval of the Audit Committees will be submitted to the Funds’ Treasurer (or his or her designee) and must include a detailed description of the services to be rendered. The Treasurer or his or her designee will ensure that such services are included within the list of services that have received the general pre-approval of the Audit Committees. The Audit Committees will be informed at the next quarterly scheduled Audit Committees meeting of any such services for which the Auditor rendered an invoice and whether such services and fees had been pre-approved and if so, by what means.
Each request to provide services that require specific approval by the Audit Committees shall be submitted to the Audit Committees jointly by the Fund’s Treasurer or his or her designee and the Auditor, and must include a joint statement that, in their view, such request is consistent with the policies and procedures and the SEC Rules.
Each request to provide tax services under either the general or specific pre-approval of the Audit Committees will describe in writing: (i) the scope of the service, the fee structure for the engagement, and any side letter or amendment to the engagement letter, or any other agreement between the Auditor and the audit client, relating to the service; and (ii) any compensation arrangement or other agreement between the Auditor and any person (other than the audit client) with respect to the promoting, marketing, or recommending of a transaction covered by the service. The Auditor will discuss with the Audit Committees the potential effects of the services on the Auditor’s independence and will document the substance of the discussion.
Non-audit services pursuant to the de minimis exception provided by the SEC Rules will be promptly brought to the attention of the Audit Committees for approval, including documentation that each of the conditions for this exception, as set forth in the SEC Rules, has been satisfied.
On at least an annual basis, the Auditor will prepare a summary of all the services provided to any entity in the investment company complex as defined in section 2-01(f)(14) of Regulation S-X in sufficient detail as to the nature of the engagement and the fees associated with those services.
The Audit Committees have designated the Funds’ Treasurer to monitor the performance of all services provided by the Auditor and to ensure such services are in compliance with these policies and procedures. The Funds’ Treasurer will report to the Audit Committees on a periodic basis as to the results of such monitoring. Both the Funds’ Treasurer and management of Invesco will immediately report to the chairman of the Audit Committees any breach of these policies and procedures that comes to the attention of the Funds’ Treasurer or senior management of Invesco.
Exhibit 1 to Pre-Approval of Audit and Non-Audit Services Policies and Procedures
Conditionally Prohibited Non-Audit Services (not prohibited if the Fund can reasonably conclude that the results of the service would not be subject to audit procedures in connection with the audit of the Fund’s financial statements)
| • | Bookkeeping or other services related to the accounting records or financial statements of the audit client |
| • | Financial information systems design and implementation |
| • | Appraisal or valuation services, fairness opinions, or contribution-in-kind reports |
| • | Actuarial services |
| • | Internal audit outsourcing services |
Categorically Prohibited Non-Audit Services
| • | Management functions |
| • | Human resources |
| • | Broker-dealer, investment adviser, or investment banking services |
| • | Legal services |
| • | Expert services unrelated to the audit |
| • | Any service or product provided for a contingent fee or a commission |
| • | Services related to marketing, planning, or opining in favor of the tax treatment of confidential transactions or aggressive tax position transactions, a significant purpose of which is tax avoidance |
| • | Tax services for persons in financial reporting oversight roles at the Fund |
| • | Any other service that the Public Company Oversight Board determines by regulation is impermissible. |
| ITEM 5. | AUDIT COMMITTEE OF LISTED REGISTRANTS. |
Not applicable.
| ITEM 6. | SCHEDULE OF INVESTMENTS. |
Investments in securities of unaffiliated issuers is included as part of the reports to stockholders filed under Item 1 of this Form.
| ITEM 7. | DISCLOSURE OF PROXY VOTING POLICIES AND PROCEDURES FOR CLOSED-END MANAGEMENT INVESTMENT COMPANIES. |
Not applicable.
| ITEM 8. | PORTFOLIO MANAGERS OF CLOSED-END MANAGEMENT COMPANIES. |
Not applicable.
| ITEM 9. | PURCHASES OF EQUITY SECURITIES BY CLOSED-END MANAGEMENT INVESTMENT COMPANY AND AFFILIATED PURCHASERS. |
Not applicable.
| ITEM 10. | SUBMISSION OF MATTERS TO A VOTE OF SECURITY HOLDERS. |
None
| ITEM 11. | CONTROLS AND PROCEDURES. |
| (a) | As of November 20, 2015, an evaluation was performed under the supervision and with the participation of the officers of the Registrant, including the PEO and PFO, to assess the effectiveness of the Registrant’s disclosure controls and procedures, as that term is defined in Rule 30a-3(c) under the Investment Company Act of 1940 (the “Act”), as amended. Based on that evaluation, the Registrant’s officers, including the PEO and PFO, concluded that, as of November 20, 2015, the Registrant’s disclosure controls and procedures were reasonably designed to ensure: (1) that information required to be disclosed by the Registrant on Form N-CSR is recorded, processed, summarized and reported within the time periods specified by the rules and forms of the Securities and Exchange Commission; and (2) that material information relating to the Registrant is made known to the PEO and PFO as appropriate to allow timely decisions regarding required disclosure. |
| (b) | There have been no changes in the Registrant’s internal control over financial reporting (as defined in Rule 30a-3(d) under the Act) that occurred during the second fiscal quarter of the period covered by this report that have materially affected, or are reasonably likely to materially affect, the Registrant’s internal control over financial reporting. |
| ITEM 12. | EXHIBITS. |
| 12(a) (1) | Code of Ethics. | |
| 12(a) (2) | Certifications of principal executive officer and principal financial officer as required by Rule 30a-2(a) under the Investment Company Act of 1940. | |
| 12(a) (3) | Not applicable. | |
| 12(b) | Certifications of principal executive officer and principal financial officer as required by Rule 30a-2(b) under the Investment Company Act of 1940. | |
SIGNATURES
Pursuant to the requirements of the Securities Exchange Act of 1934 and the Investment Company Act of 1940, the Registrant has duly caused this report to be signed on its behalf by the undersigned, thereunto duly authorized.
Registrant: AIM International Mutual Funds (Invesco International Mutual Funds)
| By: | /s/ Philip A. Taylor | |
| Philip A. Taylor | ||
| Principal Executive Officer | ||
| Date: | January 8, 2016 | |
Pursuant to the requirements of the Securities and Exchange Act of 1934 and the Investment Company Act of 1940, this report has been signed below by the following persons on behalf of the Registrant and in the capacities and on the dates indicated.
| By: | /s/ Philip A. Taylor | |
| Philip A. Taylor | ||
| Principal Executive Officer | ||
| Date: | January 8, 2016 | |
| By: | /s/ Sheri Morris | |
| Sheri Morris | ||
| Principal Financial Officer | ||
| Date: | January 8, 2016 | |
EXHIBIT INDEX
| 12(a) (1) | Code of Ethics. | |
| 12(a) (2) | Certifications of principal executive officer and principal financial officer as required by Rule 30a-2(a) under the Investment Company Act of 1940. | |
| 12(a) (3) | Not applicable. | |
| 12(b) | Certifications of principal executive officer and principal financial officer as required by Rule 30a-2(b) under the Investment Company Act of 1940. | |