OMB APPROVAL | ||||
| OMB Number: 3235-0570 | ||||
| Expires: January 31, 2014 | ||||
| Estimated average burden | ||||
| hours per response: 20.6 | ||||
UNITED STATES
SECURITIES AND EXCHANGE COMMISSION
Washington, D.C. 20549
FORM N-CSR
CERTIFIED SHAREHOLDER REPORT OF REGISTERED MANAGEMENT
INVESTMENT COMPANIES
Investment Company Act file number 811-06463
AIM International Mutual Funds (Invesco International Mutual Funds)
(Exact name of registrant as specified in charter)
11 Greenway Plaza, Suite 1000
Houston, Texas 77046
(Address of principal executive offices) (Zip code)
Philip A. Taylor
11 Greenway Plaza, Suite 1000
Houston, Texas 77046
(Name and address of agent for service)
Registrant’s telephone number, including area code: (713) 626-1919
Date of fiscal year end: 10/31
Date of reporting period: 10/31/12
| Item 1. | Reports to Stockholders. |
Letters to Shareholders
Philip Taylor | Dear Shareholders: This report contains information about your Fund, including a discussion from your portfolio managers about how they managed your Fund – and why it performed as it did – during the reporting period. This report also includes your Fund’s long-term performance and a complete list of your Fund’s investments as of the close of the reporting period. I hope you find this information helpful. For much of the reporting period, investors’ attention was focused on Europe, where eurozone governments struggled to reduce debt levels, strengthen their banks and stimulate their economies. European leaders disagreed whether the wiser path to restoring the Continent’s economic well-being was more stimulus or greater austerity. In the US, economic data were mixed. Economic growth, while positive, was relatively modest. Corporate earnings, which grew strongly in recent years, showed signs of slowing. And job creation was | |
| less robust than hoped. Later in this report, your Fund’s portfolio managers discuss how economic conditions and market trends affected your Fund’s performance. | ||

Economic conditions are always subject to sudden and unexpected change. That’s why you may find it helpful to work with a trusted, experienced financial adviser who understands your unique financial goals, needs and risk tolerances. Financial advisers can provide valuable insight and information, particularly when markets are uncertain, and they can recommend investments appropriate for specific investment goals, such as a child’s college education or your retirement. On a regular basis, a financial adviser also can determine whether your existing investments are still appropriate, given your changing needs, goals and circumstances.
Timely insight and information from many of Invesco’s investment professionals is available at our website, invesco.com/us. We offer in-depth articles, video clips and audio commentaries from many of our portfolio managers and other investment professionals on a wide range of topics of interest to investors: recent economic and market developments; retirement planning; legislative updates from Washington, DC; and general investor education. At invesco.com/us, you also can access information about your Invesco account at any time.
What we mean by Intentional Investing
Intentional InvestingSM is the science and art of investing with purpose, prudence and diligence – and it’s how Invesco’s investment professionals manage your money every day.
This highly disciplined process begins when specialized teams of investment professionals clearly define an investment objective and then establish specific investment strategies to try to achieve that objective. While our investment teams closely monitor economic and market conditions – and issues specific to individual holdings that could affect their value – they maintain a long-term investment perspective. Intentional Investing is also:
| n | How we manage and mitigate risk – by embedding risk controls and processes into every aspect of our business; |
| n | How we create products – by offering a diverse combination of investment strategies and vehicles designed to meet your needs; and |
| n | How we connect with you, our investors–by communicating clearly, by delivering expert in sights from our portfolio managers and other investment professionals, and by providing a website full of tools and articles to help you stay informed. |
As a company, Invesco believes in putting investors first, and that’s why investment management is all we do. Our sole focus on managing your money allows your financial adviser to build a truly diversified investment portfolio of Invesco funds, whatever your investment needs and goals may be – and allows him or her to find appropriate Invesco funds when your circumstances change. Of course, neither Intentional Investing nor diversification can guarantee a profit or protect against loss.
Have a question?
If you have questions about your account, please contact an Invesco client services representative at 800 959 4246. If you have an Invesco-related question or comment, feel free to email me directly at phil@invesco.com.
All of us at Invesco look forward to serving your investment management needs for many years to come. Thank you for investing with us.
Sincerely,

Philip Taylor
Senior Managing Director, Invesco Ltd.
2 Invesco Asia Pacific Growth Fund
Bruce Crockett | Dear Fellow Shareholders: One of our most important responsibilities as independent Trustees of the Invesco Funds is our annual review of the funds’ advisory and sub-advisory contracts with Invesco. This annual review is required by the Investment Company Act of 1940 and focuses on the nature and quality of the services Invesco has provided as adviser to the Invesco Funds and the reasonableness of the fees that it charges for those services. In our roles as Trustees, we spend months reviewing thousands of pages of detailed information that we request from Invesco in connection with our annual review. We focus on the quality and costs of the services to be provided by Invesco and its affiliates. Some of the most important things we look at are fund performance, expenses and fees. All of the Trustees have substantial personal investments in the Invesco Funds complex. We’re fund shareholders just like you. |

We also use information from many independent sources during the review process, including materials provided by the independent Senior Officer of the Invesco Funds, who reports directly to the independent Trustees. We also meet in private sessions with independent legal counsel and review performance and fee data on the Invesco Funds prepared by Lipper Inc., an independent, third-party firm widely recognized as a leader in its field.
I’m pleased to report that the Invesco Funds Board determined in June that renewing the investment advisory agreement and the sub-advisory contracts with Invesco would serve the best interests of each fund and its shareholders. For more detailed information about our assessment and conclusions with respect to each of the Invesco Funds, visit invesco.com/us, click on the “About Us” section and go to “Legal Information.” Information on the recent investment advisory renewal process can be found by clicking the last item under “Corporate Governance.”
In much the same way we review your fund’s advisory contract each year, it’s a good idea for you to review your own investment plan with your financial adviser on a regular basis. Perhaps you need to reassess your original asset allocation because different investments may grow at varying paces, or perhaps you’re going through a significant life change. Regardless of your situation, a financial adviser can provide guidance and experience to help you reach your financial goals.
As always, please contact me at bruce@brucecrockett.com with any questions or concerns you may have. On behalf of the Board, we look forward to continuing to represent your interests and serving your needs.
Sincerely,

Bruce L. Crockett
Independent Chair
Invesco Funds Board of Trustees
3 Invesco Asia Pacific Growth Fund
Management’s Discussion of Fund Performance
Performance summary
For the fiscal year ended October 31, 2012, Invesco Asia Pacific Growth Fund, at net asset value (NAV), delivered double-digit returns and outperformed the Fund’s style-specific benchmark, the MSCI All Country Asia Pacific ex-Japan Index. The Fund’s holdings in certain Southeast Asian markets, as well as strong stock selection in China, were the leading contributors to this outperformance. Exposure to Hong Kong and South Korea, combined with a high single-digit cash position, detracted from performance.
Your Fund’s long-term performance appears later in this report
Fund vs. Indexes
Total returns, 10/31/11 to 10/31/12, at net asset value (NAV). Performance shown does not include applicable contingent deferred sales charges (CDSC) or front-end sales charges, which would have reduced performance.
Class A Shares | 17.81 | % | ||
Class B Shares | 16.89 | |||
Class C Shares | 16.95 | |||
Class Y Shares | 18.07 | |||
MSCI EAFE Indexq (Broad Market Index) | 4.61 | |||
MSCI All Country Asia Pacific ex-Japan Indexn (Style-Specific Index) | 6.84 | |||
Lipper Pacific Region ex-Japan Funds Indexn (Peer Group Index) | 7.72 | |||
Source(s): qInvesco, MSCI via FactSet Research Systems Inc.; nLipper Inc. |
How we invest
Under normal circumstances, the Fund invests the bulk of its assets, plus any borrowings for investment purposes, in securities issued by foreign companies and governments in the Asia Pacific region, excluding Japanese issuers. We invest primarily in equity securities. When selecting stocks for your Fund, we use a disciplined investment strategy that emphasizes fundamental research, supported by quantitative analysis, portfolio construction and risk management techniques. Our EQV (earnings, quality, valuation) strategy focuses primarily on identifying quality companies that have experienced, or exhibit the potential for, accelerated or above-average earnings growth, but whose stock prices do not fully reflect these attributes.
While research responsibilities within the portfolio management team are focused by geographic region, we
select investments for the Fund using a bottom-up investment approach, which means we construct the Fund primarily on a stock-by-stock basis. We focus on the strengths of individual companies rather than sectors, countries or market-cap trends.
We believe disciplined sell decisions are key to successful investing. We consider selling a stock for one of the following reasons:
| n | A company’s fundamentals deteriorate, or it posts disappointing earnings. |
| n | A stock appears overvalued. |
| n | A more attractive investment opportunity becomes available. |
Market conditions and your Fund
During the reporting period, global equity markets remained volatile. At the beginning of the reporting period, macro events – ranging from continuing political instability in the Middle East, lingering
economic effects of the earthquake and tsunami in Japan, the ongoing eurozone sovereign debt crisis, aftereffects of Standard & Poor’s August 2011 first-ever downgrade of US debt, a slowing Chinese property market and generally higher inflation across the developing world – weighed on global economic growth and equity markets. While the markets rebounded modestly in December, macroeconomic concerns continued, stemming largely from the unstable economic conditions of Greece and Spain.
Toward the end of the reporting period, global central banks announced a series of stimulative policies. The European Central Bank (ECB) announced new measures to support eurozone economies through potentially unlimited purchases of sovereign debt, with ECB President Mario Draghi pledging to “do whatever it takes” to save the euro (although key details of the plan remain unresolved). The US Federal Reserve announced a third round of quantitative easing by promising to remain accommodative until the labor market outlook improves materially. Also, the Bank of Japan took steps to increase its asset purchase program. These easing measures were well received by investors and helped drive international equity markets higher in the final months of the reporting period, despite signs of a continued slowdown in global economic growth.
In Asia (excluding Japan), there continued to be a clear distinction between countries with robust domestic demand and those that are more export-dependent. The economies of North Asian countries – Taiwan and South Korea – were weighed down by weak export markets, causing their stock markets to lag over the reporting period. Southeast Asia was a different story with robust domestic demand making these economies
Portfolio Composition
By sector
Financials | 22.8 | % | ||
Consumer Discretionary | 15.6 | |||
Information Technology | 9.4 | |||
Utilities | 7.9 | |||
Telecommunication Services | 7.8 | |||
Industrials | 7.5 | |||
Health Care | 4.6 | |||
Materials | 4.5 | |||
Energy | 4.3 | |||
Consumer Staples | 3.0 | |||
Money Market Funds | ||||
Plus Other Assets Less Liabilities | 12.6 |
Top 10 Equity Holdings*
1. Industrial & Commercial Bank of China Ltd.-Class H | 3.8 | % | ||
2. Kasikornbank PCL | 3.5 | |||
3. First Gen Corp. | 3.4 | |||
4. PT Telekomunikasi Indonesia Persero Tbk | 3.1 | |||
5. Stella International Holdings Ltd. | 2.8 | |||
6. CNOOC Ltd.-ADR | 2.7 | |||
7. Public Bank Berhad | 2.7 | |||
8. Philippine Long Distance Telephone Co. | 2.7 | |||
9. Kossan Rubber Industries Berhad | 2.5 | |||
10. Siam Commercial Bank PCL | 2.5 |
Top Five Countries*
1. China | 21.7 | % | ||
2. Philippines | 13.4 | |||
3. Australia | 11.1 | |||
4. Indonesia | 9.1 | |||
5. Thailand | 8.3 |
Total Net Assets | $ | 623.9 million | ||
Total Number of Holdings* | 51 | |||
The Fund’s holdings are subject to change, and there is no assurance that the Fund will continue to hold any particular security.
*Excluding money market fund holdings.
4 Invesco Asia Pacific Growth Fund
more resilient. Thailand benefited from flood reconstruction and rising rural incomes. The Philippines experienced strong growth in business process out-sourcing, and Indonesia benefited from strong investment, particularly in residential construction.
In this environment, the Fund, at NAV, delivered strong double-digit returns for the fiscal year, outperforming the Fund’s style-specific benchmark. The Fund’s biggest successes came from China, as well as smaller Southeast Asian markets like Thailand, Indonesia and the Philippines. Despite delivering double-digit returns in Hong Kong, the Fund’s underweight position in this strong market detracted from relative results. Stock selection in South Korea was a drag as well.
The Fund outperformed its
style-specific benchmark in nine of 10 sectors, led by the financials, materials, utilities and industrials sectors. Stock selection was once again the key driver of relative results. An underweight position in the materials sector was beneficial as well. In contrast, an underweight position in the information technology sector detracted from relative results.
The Fund’s approximate 9% cash position throughout the fiscal year detracted from performance as markets rebounded at the end of the reporting period. It is important to note that we do not use cash for “top-down” tactical asset allocation purposes. When the portfolio’s cash position has been higher than average, it has reflected a lack of good EQV investment opportunities in the marketplace, rather than an overall negative opinion on markets. However, concerns about further downside risk led us to be cautious investors.
In terms of stocks, top performers included Australian global specialty biopharmaceutical company CSL Ltd. and SM Investments, a Philippines-based company with dominant franchises in retail and shopping mall operations. The largest detractors included MegaStudy, a South Korea-based online education service provider and Malaysia-based department store operator Parkson Holdings. We sold our holdings in MegaStudy before the close of the reporting period.
The Fund’s positioning is driven by our stock selection process, as opposed to any top-down or macro-based allocation criteria. As noted earlier, Southeast Asian markets saw strong gains over the reporting period. This led investors to shift money to these more resilient regional economies. However, with the strong performance, valuations became
less compelling. These less compelling valuations prompted us to trim some of our outperformers in Southeast Asia and redeploy funds into Chinese companies with more attractive valuations. Many of these companies have been on our “wish list” for some time. They are businesses we’ve wanted to own for years, but they’ve been much too expensive until recently, when their valuations reached levels at which it made sense for us to buy.
Over the reporting period, the Fund experienced strong double-digit returns at NAV. While we are pleased to provide shareholders with this performance, it would be imprudent for us to suggest that such a level of return is sustainable over the long term. With market volatility likely to continue for some time, our focus remains on ensuring that our portfolio is comprised of high-quality, reasonably valued companies capable of sustained earnings growth. We believe that this balanced, EQV-focused approach may help deliver attractive returns over the long term.
We thank you for your continued investment in Invesco Asia Pacific Growth Fund.
The views and opinions expressed in management’s discussion of Fund performance are those of Invesco Advisers, Inc. These views and opinions are subject to change at any time based on factors such as market and economic conditions. These views and opinions may not be relied upon as investment advice or recommendations, or as an offer for a particular security. The information is not a complete analysis of every aspect of any market, country, industry, security or the Fund. Statements of fact are from sources considered reliable, but Invesco Advisers, Inc. makes no representation or warranty as to their completeness or accuracy. Although historical performance is no guarantee of future results, these insights may help you understand our investment management philosophy.
See important Fund and, if applicable, index disclosures later in this report.
 | Steve Cao Chartered Financial Analyst, portfolio manager, is lead manager of Invesco Asia Pacific Growth Fund. He joined | |
| Invesco in 1997. Mr. Cao earned a BA in English from the Tianjin Foreign Language Institute and an MBA from Texas A&M University. He is also a Certified Public Accountant. | ||
 | Brent Bates Chartered Financial Analyst, portfolio manager, is manager of Invesco Asia Pacific Growth Fund. He | |
| joined Invesco in 1996. Mr. Bates earned a BBA from Texas A&M University and is a Certified Public Accountant. | ||
 | Mark Jason Chartered Financial Analyst, portfolio manager, is manager of Invesco Asia Pacific Growth Fund. He | |
| joined Invesco in 2001. Mr. Jason earned a BS in finance and a BS in real estate from California State University, Northridge. | ||
5 Invesco Asia Pacific Growth Fund
Your Fund’s Long-Term Performance
Results of a $10,000 Investment – Oldest Share Class(es)
Fund and index data from 10/31/02*
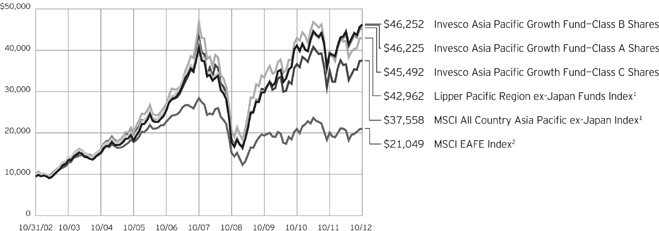
1 Source: Lipper Inc.
2 Source(s): Invesco, MSCI via FactSet Research Systems Inc.
| * | During the reporting period, Invesco changed its policy regarding growth of $10,000 charts. For funds older than 10 years, we previously showed performance since inception. Going forward, we will show performance for the most recent 10 years, since this more accurately reflects the experience of the typical shareholder. As a result, charts now may include benchmarks that did not appear previously, because the funds’ inception predated the benchmarks’ inception. Also, all charts will now be presented using a linear format. |
Past performance cannot guarantee comparable future results.
The data shown in the chart include reinvested distributions, applicable sales charges and Fund expenses including management fees. Results for Class B shares are calculated as if a hypothetical
shareholder had liquidated his entire investment in the Fund at the close of the reporting period and paid the contingent deferred sales charges, if applicable. Index results include reinvested dividends, but they do not reflect sales charges. Performance of the peer group,
if applicable, reflects fund expenses and management fees; performance of a market index does not. Performance shown in the chart and table(s) does not reflect deduction of taxes a shareholder would pay on Fund distributions or sale of Fund shares.
6 Invesco Asia Pacific Growth Fund
Average Annual Total Returns
As of 10/31/12, including maximum applicable sales charges
Class A Shares | ||||
Inception (11/3/97) | 9.65 | % | ||
10 Years | 16.54 | |||
5 Years | 1.42 | |||
1 Year | 11.35 | |||
Class B Shares | ||||
Inception (11/3/97) | 9.66 | % | ||
10 Years | 16.55 | |||
5 Years | 1.49 | |||
1 Year | 11.89 | |||
Class C Shares | ||||
Inception (11/3/97) | 9.26 | % | ||
10 Years | 16.36 | |||
5 Years | 1.81 | |||
1 Year | 15.95 | |||
Class Y Shares | ||||
10 Years | 17.32 | % | ||
5 Years | 2.78 | |||
1 Year | 18.07 | |||
Class Y shares incepted on October 3, 2008. Performance shown prior to that date is that of Class A shares and includes the 12b-1 fees applicable to Class A shares. Class A share performance reflects any applicable fee waivers or expense reimbursements.
The performance data quoted represent past performance and cannot guarantee comparable future results; current performance may be lower or higher. Please visit invesco.com/performance for the most recent month-end performance. Performance figures reflect reinvested distributions, changes in net asset value and the effect of the maximum sales charge unless otherwise stated. Investment return and principal value will fluctuate so that you may have a gain or loss when you sell shares.
The total annual Fund operating expense ratio set forth in the most recent Fund prospectus as of the date of this report for Class A, Class B, Class C and Class Y shares was 1.55%, 2.30%, 2.30% and 1.30%, respectively.
Average Annual Total Returns
As of 9/30/12, the most recent calendar quarter- end, including maximum applicable sales charges
Class A Shares | ||||
Inception (11/3/97) | 9.61 | % | ||
10 Years | 16.52 | |||
5 Years | 2.72 | |||
1 Year | 20.47 | |||
Class B Shares | ||||
Inception (11/3/97) | 9.63 | % | ||
10 Years | 16.52 | |||
5 Years | 2.79 | |||
1 Year | 21.55 | |||
Class C Shares | ||||
Inception (11/3/97) | 9.22 | % | ||
10 Years | 16.33 | |||
5 Years | 3.11 | |||
1 Year | 25.60 | |||
Class Y Shares | ||||
10 Years | 17.29 | % | ||
5 Years | 4.09 | |||
1 Year | 27.83 | |||
The expense ratios presented above may vary from the expense ratios presented in other sections of this report that are based on expenses incurred during the period covered by this report.
Class A share performance reflects the maximum 5.50% sales charge, and Class B and Class C share performance reflects the applicable contingent deferred sales charge (CDSC) for the period involved. The CDSC on Class B shares declines from 5% beginning at the time of purchase to 0% at the beginning of the seventh year. The CDSC on Class C shares is 1% for the first year after purchase. Class Y shares do not have a front-end sales charge or a CDSC; therefore, performance is at net asset value.
The performance of the Fund’s share classes will differ primarily due to different sales charge structures and class expenses.
Had the adviser not waived fees and/ or reimbursed expenses in the past, performance would have been lower.
7 Invesco Asia Pacific Growth Fund
Invesco Asia Pacific Growth Fund’s investment objective is long-term growth of capital.
| n | Unless otherwise stated, information presented in this report is as of October 31, 2012, and is based on total net assets. |
| n | Unless otherwise noted, all data provided by Invesco. |
| n | To access your Fund’s reports/prospectus, visit invesco.com/fundreports. |
About share classes
| n | Class B shares may not be purchased for new or additional investments. Please see the prospectus for more information. |
| n | Class Y shares are available to only certain investors. Please see the prospectus for more information. |
Principal risks of investing in the Fund
| n | Derivatives risk. The performance of derivative instruments is tied to the performance of an underlying currency, security, index or other instrument. In addition to risks relating to their underlying instruments, the use of derivatives may include other, possibly greater, risks. Derivatives involve costs, may be volatile, and may involve a small initial investment relative to the risk assumed. Risks associated with the use of derivatives include counterparty, leverage, correlation, liquidity, tax, market, interest rate and management risks. Derivatives may also be more difficult to purchase, sell or value than other investments. The Fund may lose more than the cash amount invested on investments in derivatives. |
Investors should bear in mind that, while the Fund intends to use derivative strategies, it is not obligated to actively engage in these transactions, generally or in any particular kind of derivative, if the investment manager elects not to do so due to availability, cost, market conditions or other factors.
| n | Developing/emerging markets securities risk. Securities issued by foreign companies and governments located in developing/emerging countries may be affected more negatively by inflation, devaluation of their currencies, higher transaction costs, delays in settlement, adverse political developments, the introduction of capital controls, withholding taxes, nationalization of private assets, expropriation, social unrest, war or lack of timely information than those in developed countries. |
| n | Foreign securities risk. The Fund’s foreign investments may be affected by changes in a foreign country’s exchange rates; political and social instability; changes in economic or taxation policies; difficulties when enforcing obligations; decreased liquidity; and increased volatility. Foreign companies may be subject to less regulation resulting in less publicly available information about the companies. |
| n | Geographic focus risk. From time to time the Fund may invest a substantial amount of its assets in securities of issuers located in a single country or a limited number of countries. If the Fund focuses its investments in this manner, it assumes the risk that economic, political and social conditions in those countries will have a significant impact on its investment performance. The Fund’s investment performance may also be more volatile if it focuses its investments in certain countries, especially emerging market countries. |
| n | Growth investing risk. Growth stocks tend to be more expensive relative to their earnings or assets compared with other types of stock. As a result they tend to be more sensitive to changes in their earnings and can be more volatile. |
| n | Management risk. The investment techniques and risk analysis used by the Fund’s portfolio managers may not produce the desired results. |
| n | Market risk. The prices of and the income generated by the Fund’s securities may decline in response to, among other things, investor sentiment, general economic and market conditions, regional or global instability, and currency and interest rate fluctuations. |
| n | Synthetic securities risk. Fluctuations in the values of synthetic securities may not correlate perfectly with the instruments they are designed to replicate. Synthetic securities may be subject to interest rate changes, market price fluctuations, counterparty risk and liquidity risk. |
About indexes used in this report
| n | The MSCI EAFE® Index is an unmanaged index considered representative of stocks of Europe, Australasia and the Far East. |
| n | The MSCI All Country Asia Pacific ex-Japan Index is an unmanaged index considered representative of Pacific region stock markets, excluding Japan. |
| n | The Lipper Pacific Region ex-Japan Funds Index is an unmanaged index considered representative of Pacific region ex-Japan funds tracked by Lipper. |
| n | The Fund is not managed to track the performance of any particular index, including the index(es) defined here, and consequently, the performance of the Fund may deviate significantly from the performance of the index(es). |
| n | A direct investment cannot be made in an index. Unless otherwise indicated, index results include reinvested dividends, and they do not reflect sales charges. Performance of the peer group, if applicable, reflects fund expenses; performance of a market index does not. |
Other information
| n | CPA® and Certified Public Accountant® are trademarks owned by the American Institute of certified Public Accountants. |
| n | The returns shown in management’s discussion of Fund performance are based on net asset values calculated for shareholder transactions. Generally accepted accounting principles require adjustments to be made to the net assets of the Fund at period end for financial reporting purposes, and as such, the net asset values for shareholder transactions and the returns based on those net asset values may differ from the net asset values and returns reported in the Financial Highlights. |
| n | Industry classifications used in this report are generally according to the Global Industry Classification Standard, which was developed by and is the exclusive property and a service mark of MSCI Inc. and Standard & Poor’s. |
This report must be accompanied or preceded by a currently effective Fund prospectus, which contains more complete information, including sales charges and expenses. Investors should read it carefully before investing.
| NOT FDIC INSURED | MAY LOSE VALUE | NO BANK GUARANTEE |
Fund Nasdaq Symbols
Class A Shares | ASIAX | |
Class B Shares | ASIBX | |
Class C Shares | ASICX | |
Class Y Shares | ASIYX |
8 Invesco Asia Pacific Growth Fund
Schedule of Investments
October 31, 2012
| Shares | Value | |||||||
Common Stocks & Other Equity Interests–87.44% |
| |||||||
Australia–11.08% |
| |||||||
BHP Billiton Ltd. | 363,260 | $ | 12,809,779 | |||||
Brambles Ltd. | 1,648,571 | 12,394,936 | ||||||
Coca-Cola Amatil Ltd. | 523,734 | 7,296,417 | ||||||
Computershare Ltd. | 1,059,860 | 9,535,441 | ||||||
CSL Ltd. | 264,797 | 13,008,460 | ||||||
QBE Insurance Group Ltd. | 331,894 | 4,538,402 | ||||||
WorleyParsons Ltd. | 373,219 | 9,521,130 | ||||||
| 69,104,565 | ||||||||
China–21.66% |
| |||||||
Baidu, Inc.–ADR(a) | 97,445 | 10,389,586 | ||||||
Belle International Holdings Ltd. | 3,762,000 | 7,009,456 | ||||||
China Mobile Ltd. | 1,128,000 | 12,509,884 | ||||||
CNOOC Ltd.–ADR | 83,164 | 17,094,360 | ||||||
Franshion Properties China Ltd. | 19,812,000 | 6,058,637 | ||||||
Golden Eagle Retail Group Ltd. | 1,526,000 | 3,347,355 | ||||||
Industrial & Commercial Bank of China Ltd.–Class H | 36,319,000 | 23,904,764 | ||||||
Lee & Man Paper Manufacturing Ltd. | 19,457,000 | 10,218,063 | ||||||
Minth Group Ltd. | 7,884,000 | 7,965,383 | ||||||
NetEase, Inc.–ADR(a) | 100,075 | 5,404,050 | ||||||
Stella International Holdings Ltd. | 6,747,000 | 17,738,391 | ||||||
Vinda International Holdings Ltd. | 3,592,000 | 4,998,081 | ||||||
Want Want China Holdings Ltd. | 4,678,000 | 6,372,633 | ||||||
Zhongsheng Group Holdings Ltd. | 1,655,000 | 2,139,755 | ||||||
| 135,150,398 | ||||||||
Hong Kong–5.22% |
| |||||||
Cheung Kong (Holdings) Ltd. | 785,000 | 11,597,742 | ||||||
Galaxy Entertainment Group Ltd.(a) | 1,583,000 | 5,410,283 | ||||||
Hongkong Land Holdings Ltd. | 673,000 | 4,259,875 | ||||||
Hutchison Whampoa Ltd. | 1,150,000 | 11,300,407 | ||||||
| 32,568,307 | ||||||||
Indonesia–9.07% |
| |||||||
PT Bank Central Asia Tbk | 7,908,500 | 6,738,331 | ||||||
PT Indocement Tunggal Prakarsa Tbk | 2,266,500 | 5,028,115 | ||||||
PT Perusahaan Gas Negara Persero Tbk | 25,604,000 | 12,371,010 | ||||||
PT Summarecon Agung Tbk | 71,202,000 | 12,947,163 | ||||||
PT Telekomunikasi Indonesia Persero Tbk | 19,158,000 | 19,468,950 | ||||||
| 56,553,569 | ||||||||
Malaysia–6.88% |
| |||||||
Kossan Rubber Industries Berhad | 15,635,100 | 15,647,413 | ||||||
Parkson Holdings Berhad | 6,602,177 | 10,506,811 | ||||||
Public Bank Berhad | 3,220,000 | 16,778,317 | ||||||
| 42,932,541 | ||||||||
| Shares | Value | |||||||
Philippines–13.44% |
| |||||||
Ayala Corp. | 902,340 | $ | 9,710,594 | |||||
Energy Development Corp. | 58,032,300 | 9,403,023 | ||||||
Energy Development Corp.(b) | 2,918,750 | 472,928 | ||||||
First Gen Corp.(a) | 39,161,489 | 21,262,220 | ||||||
First Gen Corp.(a)(b) | 1,919,100 | 1,041,950 | ||||||
GMA Holdings, Inc.–PDR | 46,635,500 | 9,516,293 | ||||||
GMA Holdings, Inc.–PDR(b) | 1,468,000 | 299,555 | ||||||
Manila Water Co. | 6,963,900 | 4,905,942 | ||||||
Philippine Long Distance Telephone Co. | 260,085 | 16,742,992 | ||||||
SM Investments Corp. | 538,355 | 10,501,617 | ||||||
| 83,857,114 | ||||||||
Singapore–3.41% |
| |||||||
Keppel Corp. Ltd. | 1,480,200 | 12,868,693 | ||||||
United Overseas Bank Ltd. | 564,000 | 8,409,612 | ||||||
| 21,278,305 | ||||||||
South Korea–5.24% |
| |||||||
Hyundai Department Store Co., Ltd. | 73,016 | 9,052,040 | ||||||
Hyundai Mobis | 38,932 | 9,862,096 | ||||||
NHN Corp. | 59,612 | 13,800,339 | ||||||
| 32,714,475 | ||||||||
Taiwan–2.50% |
| |||||||
Taiwan Semiconductor Manufacturing Co. Ltd. | 5,139,464 | 15,605,054 | ||||||
Thailand–8.27% |
| |||||||
Kasikornbank PCL | 3,722,100 | 21,718,966 | ||||||
Major Cineplex Group PCL | 11,608,600 | 7,451,594 | ||||||
Siam Commercial Bank PCL | 2,975,600 | 15,610,023 | ||||||
Thai Stanley Electric PCL | 960,700 | 6,824,132 | ||||||
| 51,604,715 | ||||||||
United States–0.67% |
| |||||||
Avago Technologies Ltd. | 125,739 | 4,153,159 | ||||||
Total Common Stocks & Other Equity Interests |
| 545,522,202 | ||||||
Money Market Funds–10.47% |
| |||||||
Liquid Assets Portfolio–Institutional Class(c) | 32,673,349 | 32,673,349 | ||||||
Premier Portfolio–Institutional Class(c) | 32,673,349 | 32,673,349 | ||||||
Total Money Market Funds |
| 65,346,698 | ||||||
TOTAL INVESTMENTS–97.91% |
| 610,868,900 | ||||||
OTHER ASSETS LESS LIABILITIES–2.09% |
| 13,008,178 | ||||||
NET ASSETS–100.00% |
| $ | 623,877,078 | |||||
Investment Abbreviations:
| ADR | – American Depositary Receipts | |
| PDR | – Philippine Depositary Receipts |
Notes to Schedule of Investments:
| (a) | Non-income producing security. |
| (b) | Security purchased or received in a transaction exempt from registration under the Securities Act of 1933, as amended. The security may be resold pursuant to an exemption from registration under the Securities Act of 1933, as amended, typically to qualified institutional buyers. The aggregate value of these securities at October 31, 2012 was $1,814,433, which represented less than 1% of the Fund’s Net Assets. |
| (c) | The money market fund and the Fund are affiliated by having the same investment adviser. |
See accompanying Notes to Financial Statements which are an integral part of the financial statements.
9 Invesco Asia Pacific Growth Fund
Statement of Assets and Liabilities
October 31, 2012
Assets: |
| |||
Investments, at value (Cost $367,424,961) | $ | 545,522,202 | ||
Investments in affiliated money market funds, at value and cost | 65,346,698 | |||
Total investments, at value (Cost $432,771,659) | 610,868,900 | |||
Foreign currencies, at value (Cost $9,053,200) | 9,263,353 | |||
Receivable for: | ||||
Investments sold | 284,394 | |||
Fund shares sold | 9,756,433 | |||
Dividends | 49,932 | |||
Investment for trustee deferred compensation and retirement plans | 45,998 | |||
Other assets | 29,526 | |||
Total assets | 630,298,536 | |||
Liabilities: |
| |||
Payable for: | ||||
Investments purchased | 521,168 | |||
Fund shares reacquired | 1,009,957 | |||
Accrued fees to affiliates | 443,971 | |||
Accrued foreign taxes | 4,160,142 | |||
Accrued other operating expenses | 176,363 | |||
Trustee deferred compensation and retirement plans | 109,857 | |||
Total liabilities | 6,421,458 | |||
Net assets applicable to shares outstanding | $ | 623,877,078 | ||
Net assets consist of: |
| |||
Shares of beneficial interest | $ | 429,634,767 | ||
Undistributed net investment income | 3,043,821 | |||
Undistributed net realized gain | 12,890,543 | |||
Unrealized appreciation | 178,307,947 | |||
| $ | 623,877,078 | |||
Net Assets: |
| |||
Class A | $ | 457,963,704 | ||
Class B | $ | 27,111,655 | ||
Class C | $ | 79,958,500 | ||
Class Y | $ | 58,843,219 | ||
Shares outstanding, $0.001 par value per share, |
| |||
Class A | 14,940,285 | |||
Class B | 943,409 | |||
Class C | 2,797,590 | |||
Class Y | 1,913,783 | |||
Class A: | ||||
Net asset value per share | $ | 30.65 | ||
Maximum offering price per share | ||||
(Net asset value of $30.65 ¸ 94.50%) | $ | 32.43 | ||
Class B: | ||||
Net asset value and offering price per share | $ | 28.74 | ||
Class C: | ||||
Net asset value and offering price per share | $ | 28.58 | ||
Class Y: | ||||
Net asset value and offering price per share | $ | 30.75 | ||
See accompanying Notes to Financial Statements which are an integral part of the financial statements.
10 Invesco Asia Pacific Growth Fund
Statement of Operations
For the year ended October 31, 2012
Investment income: |
| |||
Dividends (net of foreign withholding taxes of $1,351,263) | $ | 13,363,757 | ||
Dividends from affiliated money market funds | 70,786 | |||
Total investment income | 13,434,543 | |||
Expenses: | ||||
Advisory fees | 5,076,296 | |||
Administrative services fees | 152,013 | |||
Custodian fees | 455,722 | |||
Distribution fees: | ||||
Class A | 1,013,240 | |||
Class B | 282,964 | |||
Class C | 764,228 | |||
Transfer agent fees | 1,206,663 | |||
Trustees’ and officers’ fees and benefits | 51,434 | |||
Other | 241,931 | |||
Total expenses | 9,244,491 | |||
Less: Fees waived and expense offset arrangement(s) | (72,981 | ) | ||
Net expenses | 9,171,510 | |||
Net investment income | 4,263,033 | |||
Realized and unrealized gain from: | ||||
Net realized gain from: | ||||
Investment securities (net of foreign taxes of $1,113,610) | 12,595,426 | |||
Foreign currencies | 27,055 | |||
| 12,622,481 | ||||
Change in net unrealized appreciation of: | ||||
Investment securities (net of foreign taxes on holdings of $(1,797,176)) | 71,815,097 | |||
Foreign currencies | 119,627 | |||
| 71,934,724 | ||||
Net realized and unrealized gain | 84,557,205 | |||
Net increase in net assets resulting from operations | $ | 88,820,238 | ||
See accompanying Notes to Financial Statements which are an integral part of the financial statements.
11 Invesco Asia Pacific Growth Fund
Statement of Changes in Net Assets
For the years ended October 31, 2012 and 2011
| 2012 | 2011 | |||||||
Operations: |
| |||||||
Net investment income | $ | 4,263,033 | $ | 4,572,504 | ||||
Net realized gain | 12,622,481 | 37,836,026 | ||||||
Change in net unrealized appreciation (depreciation) | 71,934,724 | (72,105,630 | ) | |||||
Net increase (decrease) in net assets resulting from operations | 88,820,238 | (29,697,100 | ) | |||||
Distributions to shareholders from net investment income: | ||||||||
Class A | (3,532,360 | ) | (3,296,075 | ) | ||||
Class B | (26,763 | ) | (92,167 | ) | ||||
Class C | (67,611 | ) | (205,092 | ) | ||||
Class Y | (406,659 | ) | (325,228 | ) | ||||
Total distributions from net investment income | (4,033,393 | ) | (3,918,562 | ) | ||||
Distributions to shareholders from net realized gains: | ||||||||
Class A | (27,939,694 | ) | (3,602,407 | ) | ||||
Class B | (2,323,311 | ) | (361,815 | ) | ||||
Class C | (5,869,287 | ) | (805,153 | ) | ||||
Class Y | (2,471,959 | ) | (283,195 | ) | ||||
Total distributions from net realized gains | (38,604,251 | ) | (5,052,570 | ) | ||||
Share transactions–net: | ||||||||
Class A | 37,767,909 | (15,948,252 | ) | |||||
Class B | (5,357,121 | ) | (7,542,507 | ) | ||||
Class C | (2,874,407 | ) | (2,772,610 | ) | ||||
Class Y | 19,111,110 | 5,729,512 | ||||||
Net increase (decrease) in net assets resulting from share transactions | 48,647,491 | (20,533,857 | ) | |||||
Net increase (decrease) in net assets | 94,830,085 | (59,202,089 | ) | |||||
Net assets: | ||||||||
Beginning of year | 529,046,993 | 588,249,082 | ||||||
End of year (includes undistributed net investment income of $3,043,821 and $3,834,127, respectively) | $ | 623,877,078 | $ | 529,046,993 | ||||
Notes to Financial Statements
October 31, 2012
NOTE 1—Significant Accounting Policies
Invesco Asia Pacific Growth Fund (the “Fund”) is a series portfolio of AIM International Mutual Funds (Invesco International Mutual Funds) (the “Trust”). The Trust is a Delaware statutory trust registered under the Investment Company Act of 1940, as amended (the “1940 Act”), as an open-end series management investment company consisting of eight separate portfolios, each authorized to issue an unlimited number of shares of beneficial interest. The assets, liabilities and operations of each portfolio are accounted for separately. Information presented in these financial statements pertains only to the Fund. Matters affecting each portfolio or class will be voted on exclusively by the shareholders of such portfolio or class.
The Fund’s investment objective is long-term growth of capital.
The Fund currently consists of four different classes of shares: Class A, Class B, Class C and Class Y. Class A shares are sold with a front-end sales charge unless certain waiver criteria are met and under certain circumstances load waived shares may be subject to contingent deferred sales charges (“CDSC”). Class C shares are sold with a CDSC. Class Y shares are sold at net asset value. Effective November 30, 2010, new or additional investments in Class B shares are no longer permitted. Existing shareholders of Class B shares may continue to reinvest dividends and capital gains distributions in Class B shares until they convert to Class A shares. Also, shareholders in Class B shares will be able to exchange those shares for Class B shares of other Invesco Funds offering such shares until they convert to Class A shares. Generally, Class B shares will automatically convert to Class A shares on or about the month-end, which is at least eight years after the date of purchase. Redemption of Class B shares prior to the conversion date will be subject to a CDSC.
The following is a summary of the significant accounting policies followed by the Fund in the preparation of its financial statements.
| A. | Security Valuations — Securities, including restricted securities, are valued according to the following policy. |
A security listed or traded on an exchange (except convertible bonds) is valued at its last sales price or official closing price as of the close of the customary trading session on the exchange where the security is principally traded, or lacking any sales or official closing price on a particular day, the security may be valued at the closing bid price on that day. Securities traded in the over-the-counter market are valued based on prices
12 Invesco Asia Pacific Growth Fund
furnished by independent pricing services or market makers. When such securities are valued by an independent pricing service they may be considered fair valued. Futures contracts are valued at the final settlement price set by an exchange on which they are principally traded. Listed options are valued at the mean between the last bid and ask prices from the exchange on which they are principally traded. Options not listed on an exchange are valued by an independent source at the mean between the last bid and ask prices. For purposes of determining net asset value per share, futures and option contracts generally are valued 15 minutes after the close of the customary trading session of the New York Stock Exchange (“NYSE”).
Investments in open-end and closed-end registered investment companies that do not trade on an exchange are valued at the end of day net asset value per share. Investments in open-end and closed-end registered investment companies that trade on an exchange are valued at the last sales price or official closing price as of the close of the customary trading session on the exchange where the security is principally traded.
Debt obligations (including convertible bonds) and unlisted equities are fair valued using an evaluated quote provided by an independent pricing service. Evaluated quotes provided by the pricing service may be determined without exclusive reliance on quoted prices, and may reflect appropriate factors such as institution-size trading in similar groups of securities, developments related to specific securities, dividend rate, yield, quality, type of issue, coupon rate, maturity, individual trading characteristics and other market data. Debt securities are subject to interest rate and credit risks. In addition, all debt securities involve some risk of default with respect to interest and/or principal payments.
Foreign securities (including foreign exchange contracts) are converted into U.S. dollar amounts using the applicable exchange rates as of the close of the NYSE. If market quotations are available and reliable for foreign exchange traded equity securities, the securities will be valued at the market quotations. Because trading hours for certain foreign securities end before the close of the NYSE, closing market quotations may become unreliable. If between the time trading ends on a particular security and the close of the customary trading session on the NYSE, events occur that are significant and make the closing price unreliable, the Fund may fair value the security. If the event is likely to have affected the closing price of the security, the security will be valued at fair value in good faith using procedures approved by the Board of Trustees. Adjustments to closing prices to reflect fair value may also be based on a screening process of an independent pricing service to indicate the degree of certainty, based on historical data, that the closing price in the principal market where a foreign security trade is not the current value as of the close of the NYSE. Foreign securities meeting the approved degree of certainty that the price is not reflective of current value will be priced at the indication of fair value from the independent pricing service. Multiple factors may be considered by the independent pricing service in determining adjustments to reflect fair value and may include information relating to sector indices, American Depositary Receipts and domestic and foreign index futures. Foreign securities may have additional risks including exchange rate changes, potential for sharply devalued currencies and high inflation, political and economic upheaval, the relative lack of issuer information, relatively low market liquidity and the potential lack of strict financial and accounting controls and standards.
Securities for which market prices are not provided by any of the above methods may be valued based upon quotes furnished by independent sources. The last bid price may be used to value equity securities. The mean between the last bid and asked prices is used to value debt obligations, including corporate loans.
Securities for which market quotations are not readily available or are unreliable are valued at fair value as determined in good faith by or under the supervision of the Trust’s officers following procedures approved by the Board of Trustees. Issuer specific events, market trends, bid/ask quotes of brokers and information providers and other market data may be reviewed in the course of making a good faith determination of a security’s fair value.
Valuations change in response to many factors including the historical and prospective earnings of the issuer, the value of the issuer’s assets, general economic conditions, interest rates, investor perceptions and market liquidity. Because of the inherent uncertainties of valuation, the values reflected in the financial statements may materially differ from the value received upon actual sale of those investments.
| B. | Securities Transactions and Investment Income — Securities transactions are accounted for on a trade date basis. Realized gains or losses on sales are computed on the basis of specific identification of the securities sold. Interest income is recorded on the accrual basis from settlement date. Dividend income (net of withholding tax, if any) is recorded on the ex-dividend date. |
The Fund may periodically participate in litigation related to Fund investments. As such, the Fund may receive proceeds from litigation settlements. Any proceeds received are included in the Statement of Operations as realized gain (loss) for investments no longer held and as unrealized gain (loss) for investments still held.
Brokerage commissions and mark ups are considered transaction costs and are recorded as an increase to the cost basis of securities purchased and/or a reduction of proceeds on a sale of securities. Such transaction costs are included in the determination of net realized and unrealized gain (loss) from investment securities reported in the Statement of Operations and the Statement of Changes in Net Assets and the net realized and unrealized gains (losses) on securities per share in the Financial Highlights. Transaction costs are included in the calculation of the Fund’s net asset value and, accordingly, they reduce the Fund’s total returns. These transaction costs are not considered operating expenses and are not reflected in net investment income reported in the Statement of Operations and Statement of Changes in Net Assets, or the net investment income per share and ratios of expenses and net investment income reported in the Financial Highlights, nor are they limited by any expense limitation arrangements between the Fund and the investment adviser.
The Fund allocates income and realized and unrealized capital gains and losses to a class based on the relative net assets of each class.
| C. | Country Determination — For the purposes of making investment selection decisions and presentation in the Schedule of Investments, the investment adviser may determine the country in which an issuer is located and/or credit risk exposure based on various factors. These factors include the laws of the country under which the issuer is organized, where the issuer maintains a principal office, the country in which the issuer derives 50% or more of its total revenues and the country that has the primary market for the issuer’s securities, as well as other criteria. Among the other criteria that may be evaluated for making this determination are the country in which the issuer maintains 50% or more of its assets, the type of security, financial guarantees and enhancements, the nature of the collateral and the sponsor organization. Country of issuer and/or credit risk exposure has been determined to be the United States of America, unless otherwise noted. |
| D. | Distributions — Distributions from income and net realized capital gain, if any, are generally declared and paid annually and recorded on the ex-dividend date. The Fund may elect to treat a portion of the proceeds from redemptions as distributions for federal income tax purposes. |
| E. | Federal Income Taxes — The Fund intends to comply with the requirements of Subchapter M of the Internal Revenue Code necessary to qualify as a regulated investment company and to distribute substantially all of the Fund’s taxable earnings to shareholders. As such, the Fund |
13 Invesco Asia Pacific Growth Fund
| will not be subject to federal income taxes on otherwise taxable income (including net realized capital gain) that is distributed to shareholders. Therefore, no provision for federal income taxes is recorded in the financial statements. |
The Fund files tax returns in the U.S. Federal jurisdiction and certain other jurisdictions. Generally, the Fund is subject to examinations by such taxing authorities for up to three years after the filing of the return for the tax period.
| F. | Expenses — Fees provided for under the Rule 12b-1 plan of a particular class of the Fund and which are directly attributable to that class are charged to the operations of such class. All other expenses are allocated among the classes based on relative net assets. |
| G. | Accounting Estimates — The preparation of financial statements in conformity with accounting principles generally accepted in the United States of America (“GAAP”) requires management to make estimates and assumptions that affect the reported amounts of assets and liabilities at the date of the financial statements and the reported amounts of revenues and expenses during the reporting period including estimates and assumptions related to taxation. Actual results could differ from those estimates by a significant amount. In addition, the Fund monitors for material events or transactions that may occur or become known after the period-end date and before the date the financial statements are released to print. |
| H. | Indemnifications — Under the Trust’s organizational documents, each Trustee, officer, employee or other agent of the Trust is indemnified against certain liabilities that may arise out of the performance of their duties to the Fund. Additionally, in the normal course of business, the Fund enters into contracts, including the Fund’s servicing agreements, that contain a variety of indemnification clauses. The Fund’s maximum exposure under these arrangements is unknown as this would involve future claims that may be made against the Fund that have not yet occurred. The risk of material loss as a result of such indemnification claims is considered remote. |
| I. | Redemption Fees — The Fund had a 2% redemption fee that was retained by the Fund to offset transaction costs and other expenses associated with short-term redemptions and exchanges. The fee, subject to certain exceptions, was imposed on certain redemptions or exchanges of shares within 31 days of purchase. The redemption fee was recorded as an increase in shareholder capital and was allocated among the share classes based on the relative net assets of each class. Effective January 1, 2012, the Fund eliminated the 2% redemption fee assessed on shares of the Fund redeemed or exchanged within 31 days of purchase. |
| J. | Foreign Currency Translations — Foreign currency is valued at the close of the NYSE based on quotations posted by banks and major currency dealers. Portfolio securities and other assets and liabilities denominated in foreign currencies are translated into U.S. dollar amounts at date of valuation. Purchases and sales of portfolio securities (net of foreign taxes withheld on disposition) and income items denominated in foreign currencies are translated into U.S. dollar amounts on the respective dates of such transactions. The Fund does not separately account for the portion of the results of operations resulting from changes in foreign exchange rates on investments and the fluctuations arising from changes in market prices of securities held. The combined results of changes in foreign exchange rates and the fluctuation of market prices on investments (net of estimated foreign tax withholding) are included with the net realized and unrealized gain or loss from investments in the Statement of Operations. Reported net realized foreign currency gains or losses arise from (1) sales of foreign currencies, (2) currency gains or losses realized between the trade and settlement dates on securities transactions, and (3) the difference between the amounts of dividends, interest, and foreign withholding taxes recorded on the Fund’s books and the U.S. dollar equivalent of the amounts actually received or paid. Net unrealized foreign currency gains and losses arise from changes in the fair values of assets and liabilities, other than investments in securities at fiscal period end, resulting from changes in exchange rates. |
The Fund may invest in foreign securities which may be subject to foreign taxes on income, gains on investments or currency repatriation, a portion of which may be recoverable.
| K. | Foreign Currency Contracts — The Fund may enter into foreign currency contracts to manage or minimize currency or exchange rate risk. The Fund may also enter into foreign currency contracts for the purchase or sale of a security denominated in a foreign currency in order to “lock in” the U.S. dollar price of that security. A foreign currency contract is an obligation to purchase or sell a specific currency for an agreed-upon price at a future date. The use of foreign currency contracts does not eliminate fluctuations in the price of the underlying securities the Fund owns or intends to acquire but establishes a rate of exchange in advance. Fluctuations in the value of these contracts are measured by the difference in the contract date and reporting date exchange rates and are recorded as unrealized appreciation (depreciation) until the contracts are closed. When the contracts are closed, realized gains (losses) are recorded. Realized and unrealized gains (losses) on the contracts are included in the Statement of Operations. The primary risks associated with foreign currency contracts include failure of the counterparty to meet the terms of the contract and the value of the foreign currency changing unfavorably. These risks may be in excess of the amounts reflected in the Statement of Assets and Liabilities. |
NOTE 2—Advisory Fees and Other Fees Paid to Affiliates
The Trust has entered into a master investment advisory agreement with Invesco Advisers, Inc. (the “Adviser” or “Invesco”). Under the terms of the investment advisory agreement, the Fund pays an advisory fee to the Adviser based on the annual rate of the Fund’s average daily net assets as follows:
| Average Daily Net Assets | Rate | |
First $250 million | 0.935% | |
Next $250 million | 0.91% | |
Next $500 million | 0.885% | |
Next $1.5 billion | 0.86% | |
Next $2.5 billion | 0.835% | |
Next $2.5 billion | 0.81% | |
Next $2.5 billion | 0.785% | |
Over $10 billion | 0.76% |
14 Invesco Asia Pacific Growth Fund
Under the terms of a master sub-advisory agreement between the Adviser and each of Invesco Asset Management Deutschland GmbH, Invesco Asset Management Limited, Invesco Asset Management (Japan) Limited, Invesco Australia Limited, Invesco Hong Kong Limited, Invesco Senior Secured Management, Inc. and Invesco Canada Ltd. (collectively, the “Affiliated Sub-Advisers”) the Adviser, not the Fund, may pay 40% of the fees paid to the Adviser to any such Affiliated Sub-Adviser(s) that provide discretionary investment management services to the Fund based on the percentage of assets allocated to such Sub-Adviser(s).
The Adviser has contractually agreed, through at least June 30, 2013, to waive advisory fees and/or reimburse expenses of all shares to the extent necessary to limit total annual fund operating expenses after fee waivers and/or expense reimbursements (excluding certain items discussed below) of Class A, Class B, Class C and Class Y shares to 2.25%, 3.00%, 3.00% and 2.00%, respectively, of average daily net assets. In determining the Adviser’s obligation to waive advisory fees and/or reimburse expenses, the following expenses are not taken into account, and could cause the total annual fund operating expenses after fee waiver and/or expense reimbursement to exceed the numbers reflected above: (1) interest; (2) taxes; (3) dividend expense on short sales; (4) extraordinary or non-routine items; and (5) expenses that the Fund has incurred but did not actually pay because of an expense offset arrangement. Unless the Board of Trustees and Invesco mutually agree to amend or continue the fee waiver agreement, it will terminate on June 30, 2013. The Adviser did not waive fees and/or reimburse expenses during the period under this expense limitation.
Further, the Adviser has contractually agreed, through at least June 30, 2013, to waive the advisory fee payable by the Fund in an amount equal to 100% of the net advisory fees the Adviser receives from the affiliated money market funds on investments by the Fund of uninvested cash in such affiliated money market funds.
For the year ended October 31, 2012, the Adviser waived advisory fees of $70,217.
The Trust has entered into a master administrative services agreement with Invesco pursuant to which the Fund has agreed to pay Invesco for certain administrative costs incurred in providing accounting services to the Fund. For the year ended October 31, 2012, expenses incurred under the agreement are shown in the Statement of Operations as Administrative services fees.
The Trust has entered into a transfer agency and service agreement with Invesco Investment Services, Inc. (“IIS”) pursuant to which the Fund has agreed to pay IIS a fee for providing transfer agency and shareholder services to the Fund and reimburse IIS for certain expenses incurred by IIS in the course of providing such services. IIS may make payments to intermediaries that provide omnibus account services, sub-accounting services and/or networking services. All fees payable by IIS to intermediaries that provide omnibus account services or sub-accounting are charged back to the Fund, subject to certain limitations approved by the Trust’s Board of Trustees. For the year ended October 31, 2012, the expenses incurred under the agreement are shown in the Statement of Operations as Transfer agent fees.
The Trust has entered into master distribution agreements with Invesco Distributors, Inc. (“IDI”) to serve as the distributor for the Class A, Class B, Class C and Class Y shares of the Fund. The Trust has adopted plans pursuant to Rule 12b-1 under the 1940 Act with respect to the Fund’s Class A, Class B and Class C shares (collectively, the “Plans”). The Fund, pursuant to the Plans, pays IDI compensation at the annual rate of 0.25% of the Fund’s average daily net assets of Class A shares and 1.00% of the average daily net assets of each class of Class B and Class C shares. Of the Plan payments, up to 0.25% of the average daily net assets of each class of shares may be paid to furnish continuing personal shareholder services to customers who purchase and own shares of such classes. Any amounts not paid as a service fee under the Plans would constitute an asset-based sales charge. Rules of the Financial Industry Regulatory Authority (“FINRA”) impose a cap on the total sales charges, including asset-based sales charges, that may be paid by any class of shares of the Fund. For the year ended October 31, 2012, expenses incurred under the Plans are shown in the Statement of Operations as Distribution fees.
Front-end sales commissions and CDSC (collectively, the “sales charges”) are not recorded as expenses of the Fund. Front-end sales commissions are deducted from proceeds from the sales of Fund shares prior to investment in Class A shares of the Fund. CDSC are deducted from redemption proceeds prior to remittance to the shareholder. During the year ended October 31, 2012, IDI advised the Fund that IDI retained $123,055 in front-end sales commissions from the sale of Class A shares and $1,499, $31,234 and $5,910 from Class A, Class B and Class C shares, respectively, for CDSC imposed on redemptions by shareholders.
Certain officers and trustees of the Trust are officers and directors of the Adviser, IIS and/or IDI.
NOTE 3—Additional Valuation Information
GAAP defines fair value as the price that would be received to sell an asset or paid to transfer a liability in an orderly transaction between market participants at the measurement date, under current market conditions. GAAP establishes a hierarchy that prioritizes the inputs to valuation methods giving the highest priority to readily available unadjusted quoted prices in an active market for identical assets (Level 1) and the lowest priority to significant unobservable inputs (Level 3) generally when market prices are not readily available or are unreliable. Based on the valuation inputs, the securities or other investments are tiered into one of three levels. Changes in valuation methods may result in transfers in or out of an investment’s assigned level:
| Level 1 — | Prices are determined using quoted prices in an active market for identical assets. |
| Level 2 — | Prices are determined using other significant observable inputs. Observable inputs are inputs that other market participants may use in pricing a security. These may include quoted prices for similar securities, interest rates, prepayment speeds, credit risk, yield curves, loss severities, default rates, discount rates, volatilities and others. |
| Level 3 — | Prices are determined using significant unobservable inputs. In situations where quoted prices or observable inputs are unavailable (for example, when there is little or no market activity for an investment at the end of the period), unobservable inputs may be used. Unobservable inputs reflect the Fund’s own assumptions about the factors market participants would use in determining fair value of the securities or instruments and would be based on the best available information. |
15 Invesco Asia Pacific Growth Fund
The following is a summary of the tiered valuation input levels, as of October 31, 2012. The level assigned to the securities valuations may not be an indication of the risk or liquidity associated with investing in those securities. Because of the inherent uncertainties of valuation, the values reflected in the financial statements may materially differ from the value received upon actual sale of those investments.
During year ended October 31, 2012, there were transfers from Level 2 to Level 1 of $231,323,817, due to foreign fair value adjustments.
| Level 1 | Level 2 | Level 3 | Total | |||||||||||||
Australia | $ | 4,538,402 | $ | 64,566,163 | $ | — | $ | 69,104,565 | ||||||||
China | 82,136,529 | 53,013,869 | — | 135,150,398 | ||||||||||||
Hong Kong | 11,597,742 | 20,970,565 | — | 32,568,307 | ||||||||||||
Indonesia | 32,056,505 | 24,497,064 | — | 56,553,569 | ||||||||||||
Malaysia | 42,932,541 | — | — | 42,932,541 | ||||||||||||
Philippines | 83,857,114 | — | — | 83,857,114 | ||||||||||||
Singapore | — | 21,278,305 | — | 21,278,305 | ||||||||||||
South Korea | 13,800,339 | 18,914,136 | — | 32,714,475 | ||||||||||||
Taiwan | 15,605,054 | — | — | 15,605,054 | ||||||||||||
Thailand | — | 51,604,715 | — | 51,604,715 | ||||||||||||
United States | 69,499,857 | — | — | 69,499,857 | ||||||||||||
Total Investments | $ | 356,024,083 | $ | 254,844,817 | $ | — | $ | 610,868,900 | ||||||||
NOTE 4—Expense Offset Arrangement(s)
The expense offset arrangement is comprised of transfer agency credits which result from balances in Demand Deposit Accounts (DDA) used by the transfer agent for clearing shareholder transactions. For the year ended October 31, 2012, the Fund received credits from this arrangement, which resulted in the reduction of the Fund’s total expenses of $2,764.
NOTE 5—Trustees’ and Officers’ Fees and Benefits
“Trustees’ and Officers’ Fees and Benefits” include amounts accrued by the Fund to pay remuneration to certain Trustees and Officers of the Fund. Trustees have the option to defer compensation payable by the Fund, and “Trustees’ and Officers’ Fees and Benefits” also include amounts accrued by the Fund to fund such deferred compensation amounts. Those Trustees who defer compensation have the option to select various Invesco Funds in which their deferral accounts shall be deemed to be invested. Finally, certain current Trustees are eligible to participate in a retirement plan that provides for benefits to be paid upon retirement to Trustees over a period of time based on the number of years of service. The Fund may have certain former Trustees who also participate in a retirement plan and receive benefits under such plan. “Trustees’ and Officers’ Fees and Benefits” include amounts accrued by the Fund to fund such retirement benefits. Obligations under the deferred compensation and retirement plans represent unsecured claims against the general assets of the Fund.
NOTE 6—Cash Balances
The Fund is permitted to temporarily carry a negative or overdrawn balance in its account with State Street Bank and Trust Company, the custodian bank. Such balances, if any at period end, are shown in the Statement of Assets and Liabilities under the payable caption Amount due custodian. To compensate the custodian bank for such overdrafts, the overdrawn Fund may either (1) leave funds as a compensating balance in the account so the custodian bank can be compensated by earning the additional interest; or (2) compensate by paying the custodian bank at a rate agreed upon by the custodian bank and Invesco, not to exceed the contractually agreed upon rate.
NOTE 7—Distributions to Shareholders and Tax Components of Net Assets
Tax Character of Distributions to Shareholders Paid During the Years Ended October 31, 2012 and 2011:
| 2012 | 2011 | |||||||
Ordinary income | $ | 4,033,393 | $ | 3,918,683 | ||||
Long-term capital gain | 38,604,251 | 5,052,449 | ||||||
Total distributions | $ | 42,637,644 | $ | 8,971,132 | ||||
Tax Components of Net Assets at Period-End:
| 2012 | ||||
Undistributed ordinary income | $ | 3,529,120 | ||
Undistributed long-term gain | 13,458,008 | |||
Net unrealized appreciation — investments | 177,149,038 | |||
Net unrealized appreciation — other investments | 210,706 | |||
Temporary book/tax differences | (104,561 | ) | ||
Shares of beneficial interest | 429,634,767 | |||
Total net assets | $ | 623,877,078 | ||
16 Invesco Asia Pacific Growth Fund
The difference between book-basis and tax-basis unrealized appreciation is due to differences in the timing of recognition of gains and losses on investments for tax and book purposes. The Fund’s net unrealized appreciation difference is attributable primarily to the treatment of wash sales and passive foreign investment companies.
The temporary book/tax differences are a result of timing differences between book and tax recognition of income and/or expenses. The Fund’s temporary book/tax differences are the result of the trustee deferral of compensation and retirement plan benefits.
Capital loss carryforward is calculated and reported as of a specific date. Results of transactions and other activity after that date may affect the amount of capital loss carryforward actually available for the Fund to utilize. The Regulated Investment Company Modernization Act of 2010 (the “Act”) eliminated the eight-year carryover period for capital losses that arise in taxable years beginning after its enactment date of December 22, 2010. Consequently, these capital losses can be carried forward for an unlimited period. However, capital losses with an expiration period may not be used to offset capital gains until all net capital losses without an expiration date have been utilized. Additionally, post-enactment capital loss carryovers will retain their character as either short-term or long-term capital losses instead of as short-term capital losses as under prior law. The ability to utilize capital loss carryforward in the future may be limited under the Internal Revenue Code and related regulations based on the results of future transactions.
The Fund does not have a capital loss carryforward at period-end.
NOTE 8—Investment Securities
The aggregate amount of investment securities (other than short-term securities, U.S. Treasury obligations and money market funds, if any) purchased and sold by the Fund during the year ended October 31, 2012 was $81,386,097 and $111,604,101, respectively. Cost of investments on a tax basis includes the adjustments for financial reporting purposes as of the most recently completed federal income tax reporting period-end.
| Unrealized Appreciation (Depreciation) of Investment Securities on a Tax Basis | ||||
Aggregate unrealized appreciation of investment securities | $ | 180,823,560 | ||
Aggregate unrealized (depreciation) of investment securities | (3,674,522 | ) | ||
Net unrealized appreciation of investment securities | $ | 177,149,038 | ||
Cost of investments for tax purposes is $433,719,862.
NOTE 9—Reclassification of Permanent Differences
Primarily as a result of differing book/tax treatment of foreign capital gain taxes, on October 31, 2012, undistributed net investment income was decreased by $1,019,946, undistributed net realized gain was increased by $1,020,069 and shares of beneficial interest was decreased by $123. This reclassification had no effect on the net assets of the Fund.
17 Invesco Asia Pacific Growth Fund
NOTE 10—Share Information
| Summary of Share Activity | ||||||||||||||||
| Years ended October 31, | ||||||||||||||||
| 2012(a) | 2011 | |||||||||||||||
| Shares | Amount | Shares | Amount | |||||||||||||
Sold: | ||||||||||||||||
Class A | 3,650,438 | $ | 104,623,607 | 4,394,289 | $ | 132,259,271 | ||||||||||
Class B | 57,168 | 1,528,521 | 183,714 | 5,229,772 | ||||||||||||
Class C | 410,766 | 10,941,363 | 971,523 | 27,533,484 | ||||||||||||
Class Y | 1,522,078 | 43,739,490 | 926,353 | 27,890,937 | ||||||||||||
Issued as reinvestment of dividends: | ||||||||||||||||
Class A | 1,123,514 | 28,885,539 | 202,721 | 6,022,831 | ||||||||||||
Class B | 90,171 | 2,185,470 | 14,079 | 396,192 | ||||||||||||
Class C | 228,199 | 5,506,442 | 26,920 | 753,756 | ||||||||||||
Class Y | 100,103 | 2,575,648 | 12,441 | 370,115 | ||||||||||||
Automatic conversion of Class B shares to Class A shares: | ||||||||||||||||
Class A | 141,257 | 3,996,044 | 132,714 | 3,941,506 | ||||||||||||
Class B | (150,093 | ) | (3,996,044 | ) | (140,624 | ) | (3,941,506 | ) | ||||||||
Reacquired:(b) | ||||||||||||||||
Class A | (3,551,899 | ) | (99,737,281 | ) | (5,329,504 | ) | (158,171,860 | ) | ||||||||
Class B | (190,731 | ) | (5,075,068 | ) | (330,303 | ) | (9,226,965 | ) | ||||||||
Class C | (734,750 | ) | (19,322,212 | ) | (1,126,481 | ) | (31,059,850 | ) | ||||||||
Class Y | (966,018 | ) | (27,204,028 | ) | (748,469 | ) | (22,531,540 | ) | ||||||||
Net increase (decrease) in share activity | 1,730,203 | $ | 48,647,491 | (810,627 | ) | $ | (20,533,857 | ) | ||||||||
| (a) | There are entities that are record owners of more than 5% of the outstanding shares of the Fund and in the aggregate own 27% of the outstanding shares of the Fund. IDI has an agreement with these entities to sell Fund shares. The Fund, Invesco and/or Invesco affiliates may make payments to these entities, which are considered to be related to the Fund, for providing services to the Fund, Invesco and/or Invesco affiliates including but not limited to services such as securities brokerage, distribution, third party record keeping and account servicing. The Fund has no knowledge as to whether all or any portion of the shares owned of record by these entities are also owned beneficially. |
| (b) | Net of redemption fees of $10,831 and $59,864 allocated among the classes based on relative net assets of each class for the years ended October 31, 2012 and 2011, respectively. |
18 Invesco Asia Pacific Growth Fund
NOTE 11—Financial Highlights
The following schedule presents financial highlights for a share of the Fund outstanding throughout the periods indicated.
| Net asset value, beginning of period | Net investment income(a) | Net gains (losses) on securities (both realized and unrealized) | Total from investment operations | Dividends from net investment income | Distributions from net realized gains | Total distributions | Net asset value, end of period(b) | Total return(c) | Net assets, end of period (000s omitted) | Ratio of expenses to average net assets with fee waivers and/or expenses absorbed | Ratio of expenses to average net assets without fee waivers and/or expenses absorbed | Ratio of net investment income to average net assets | Portfolio turnover(d) | |||||||||||||||||||||||||||||||||||||||||||
Class A |
| |||||||||||||||||||||||||||||||||||||||||||||||||||||||
Year ended 10/31/12 | $ | 28.42 | $ | 0.26 | $ | 4.34 | $ | 4.60 | $ | (0.27 | ) | $ | (2.10 | ) | $ | (2.37 | ) | $ | 30.65 | 17.77 | % | $ | 457,964 | 1.54 | %(e) | 1.55 | %(e) | 0.89 | %(e) | 16 | % | |||||||||||||||||||||||||
Year ended 10/31/11 | 30.30 | 0.28 | (1.68 | ) | (1.40 | ) | (0.23 | ) | (0.25 | ) | (0.48 | ) | 28.42 | (4.67 | ) | 385,828 | 1.53 | 1.55 | 0.93 | 27 | ||||||||||||||||||||||||||||||||||||
Year ended 10/31/10 | 22.23 | 0.23 | 8.12 | 8.35 | (0.28 | ) | — | (0.28 | ) | 30.30 | 37.97 | 429,596 | 1.60 | 1.61 | 0.91 | 25 | ||||||||||||||||||||||||||||||||||||||||
Year ended 10/31/09 | 13.52 | 0.24 | 8.82 | 9.06 | (0.35 | ) | — | (0.35 | ) | 22.23 | 68.89 | 298,982 | 1.78 | 1.79 | 1.43 | 28 | ||||||||||||||||||||||||||||||||||||||||
Year ended 10/31/08 | 35.16 | 0.34 | (18.36 | ) | (18.02 | ) | (0.21 | ) | (3.41 | ) | (3.62 | ) | 13.52 | (56.58 | ) | 189,403 | 1.67 | 1.68 | 1.34 | 25 | ||||||||||||||||||||||||||||||||||||
Class B | ||||||||||||||||||||||||||||||||||||||||||||||||||||||||
Year ended 10/31/12 | 26.73 | 0.04 | 4.10 | 4.14 | (0.03 | ) | (2.10 | ) | (2.13 | ) | 28.74 | 16.94 | 27,112 | 2.29 | (e) | 2.30 | (e) | 0.14 | (e) | 16 | ||||||||||||||||||||||||||||||||||||
Year ended 10/31/11 | 28.58 | 0.05 | (1.59 | ) | (1.54 | ) | (0.06 | ) | (0.25 | ) | (0.31 | ) | 26.73 | (5.41 | ) | 30,394 | 2.28 | 2.30 | 0.18 | 27 | ||||||||||||||||||||||||||||||||||||
Year ended 10/31/10 | 21.02 | 0.04 | 7.69 | 7.73 | (0.17 | ) | — | (0.17 | ) | 28.58 | 36.98 | 40,299 | 2.35 | 2.36 | 0.16 | 25 | ||||||||||||||||||||||||||||||||||||||||
Year ended 10/31/09 | 12.65 | 0.11 | 8.37 | 8.48 | (0.11 | ) | — | (0.11 | ) | 21.02 | 67.63 | 35,178 | 2.53 | 2.54 | 0.68 | 28 | ||||||||||||||||||||||||||||||||||||||||
Year ended 10/31/08 | 33.19 | 0.14 | (17.23 | ) | (17.09 | ) | (0.04 | ) | (3.41 | ) | (3.45 | ) | 12.65 | (56.91 | ) | 26,678 | 2.42 | 2.43 | 0.59 | 25 | ||||||||||||||||||||||||||||||||||||
Class C | ||||||||||||||||||||||||||||||||||||||||||||||||||||||||
Year ended 10/31/12 | 26.60 | 0.04 | 4.07 | 4.11 | (0.03 | ) | (2.10 | ) | (2.13 | ) | 28.58 | 16.91 | 79,959 | 2.29 | (e) | 2.30 | (e) | 0.14 | (e) | 16 | ||||||||||||||||||||||||||||||||||||
Year ended 10/31/11 | 28.44 | 0.05 | (1.58 | ) | (1.53 | ) | (0.06 | ) | (0.25 | ) | (0.31 | ) | 26.60 | (5.41 | ) | 76,962 | 2.28 | 2.30 | 0.18 | 27 | ||||||||||||||||||||||||||||||||||||
Year ended 10/31/10 | 20.92 | 0.04 | 7.65 | 7.69 | (0.17 | ) | — | (0.17 | ) | 28.44 | 36.97 | 85,918 | 2.35 | 2.36 | 0.16 | 25 | ||||||||||||||||||||||||||||||||||||||||
Year ended 10/31/09 | 12.59 | 0.11 | 8.33 | 8.44 | (0.11 | ) | — | (0.11 | ) | 20.92 | 67.64 | 55,810 | 2.53 | 2.54 | 0.68 | 28 | ||||||||||||||||||||||||||||||||||||||||
Year ended 10/31/08 | 33.06 | 0.14 | (17.16 | ) | (17.02 | ) | (0.04 | ) | (3.41 | ) | (3.45 | ) | 12.59 | (56.92 | ) | 37,630 | 2.42 | 2.43 | 0.59 | 25 | ||||||||||||||||||||||||||||||||||||
Class Y | ||||||||||||||||||||||||||||||||||||||||||||||||||||||||
Year ended 10/31/12 | 28.52 | 0.33 | 4.35 | 4.68 | (0.35 | ) | (2.10 | ) | (2.45 | ) | 30.75 | 18.07 | 58,843 | 1.29 | (e) | 1.30 | (e) | 1.14 | (e) | 16 | ||||||||||||||||||||||||||||||||||||
Year ended 10/31/11 | 30.39 | 0.35 | (1.68 | ) | (1.33 | ) | (0.29 | ) | (0.25 | ) | (0.54 | ) | 28.52 | (4.43 | ) | 35,862 | 1.28 | 1.30 | 1.18 | 27 | ||||||||||||||||||||||||||||||||||||
Year ended 10/31/10 | 22.28 | 0.30 | 8.14 | 8.44 | (0.33 | ) | — | (0.33 | ) | 30.39 | 38.31 | 32,436 | 1.35 | 1.36 | 1.16 | 25 | ||||||||||||||||||||||||||||||||||||||||
Year ended 10/31/09 | 13.52 | 0.29 | 8.82 | 9.11 | (0.35 | ) | — | (0.35 | ) | 22.28 | 69.31 | 11,785 | 1.53 | 1.54 | 1.68 | 28 | ||||||||||||||||||||||||||||||||||||||||
Year ended 10/31/08(f) | 17.47 | 0.02 | (3.97 | ) | (3.95 | ) | — | — | — | 13.52 | (22.61 | ) | 4,351 | 1.52 | (g) | 1.52 | (g) | 1.49 | (g) | 25 | ||||||||||||||||||||||||||||||||||||
| (a) | Calculated using average shares outstanding. |
| (b) | Includes redemption fees added to shares of beneficial interest which were less than $0.005 per share. |
| (c) | Includes adjustments in accordance with accounting principles generally accepted in the United States of America and as such, the net asset value for financial reporting purposes and the returns based upon those net asset values may differ from the net asset value and returns for shareholder transactions. Does not include sales charges and is not annualized for periods less than one year, if applicable. |
| (d) | Portfolio turnover is calculated at the fund level and is not annualized for periods less than one year, if applicable. |
| (e) | Ratios are based on average daily net assets (000’s) of $405,296, $28,296, $76,423 and $42,391 for Class A, Class B, Class C and Class Y shares, respectively. |
| (f) | Commencement date of October 3, 2008. |
| (g) | Annualized. |
19 Invesco Asia Pacific Growth Fund
Report of Independent Registered Public Accounting Firm
To the Board of Trustees of AIM International Mutual Funds (Invesco International Mutual Funds)
and Shareholders of Invesco Asia Pacific Growth Fund:
In our opinion, the accompanying statement of assets and liabilities, including the schedule of investments, and the related statements of operations and of changes in net assets and the financial highlights present fairly, in all material respects, the financial position of Invesco Asia Pacific Growth Fund (one of the funds constituting AIM International Mutual Funds (Invesco International Mutual Funds), hereafter referred to as the “Fund”) at October 31, 2012, the results of its operations for the year then ended, the changes in its net assets for each of the two years in the period then ended and the financial highlights for each of the five years in the period then ended, in conformity with accounting principles generally accepted in the United States of America. These financial statements and financial highlights (hereafter referred to as “financial statements”) are the responsibility of the Fund’s management; our responsibility is to express an opinion on these financial statements based on our audits. We conducted our audits of these financial statements in accordance with the standards of the Public Company Accounting Oversight Board (United States). Those standards require that we plan and perform the audit to obtain reasonable assurance about whether the financial statements are free of material misstatement. An audit includes examining, on a test basis, evidence supporting the amounts and disclosures in the financial statements, assessing the accounting principles used and significant estimates made by management, and evaluating the overall financial statement presentation. We believe that our audits, which included confirmation of securities at October 31, 2012 by correspondence with the custodian and brokers, provide a reasonable basis for our opinion.
PRICEWATERHOUSECOOPERS LLP
December 21, 2012
Houston, Texas
20 Invesco Asia Pacific Growth Fund
Calculating your ongoing Fund expenses
Example
As a shareholder of the Fund, you incur two types of costs: (1) transaction costs, which may include sales charges (loads) on purchase payments or contingent deferred sales charges on redemptions, and redemption fees, if any; and (2) ongoing costs, including management fees, distribution and/or service (12b-1) fees, and other Fund expenses. This example is intended to help you understand your ongoing costs (in dollars) of investing in the Fund and to compare these costs with ongoing costs of investing in other mutual funds. The example is based on an investment of $1,000 invested at the beginning of the period and held for the entire period May 1, 2012 through October 31, 2012.
Actual expenses
The table below provides information about actual account values and actual expenses. You may use the information in this table, together with the amount you invested, to estimate the expenses that you paid over the period. Simply divide your account value by $1,000 (for example, an $8,600 account value divided by $1,000 = 8.6), then multiply the result by the number in the table under the heading entitled “Actual Expenses Paid During Period” to estimate the expenses you paid on your account during this period.
Hypothetical example for comparison purposes
The table below also provides information about hypothetical account values and hypothetical expenses based on the Fund’s actual expense ratio and an assumed rate of return of 5% per year before expenses, which is not the Fund’s actual return.
The hypothetical account values and expenses may not be used to estimate the actual ending account balance or expenses you paid for the period. You may use this information to compare the ongoing costs of investing in the Fund and other funds. To do so, compare this 5% hypothetical example with the 5% hypothetical examples that appear in the shareholder reports of the other funds.
Please note that the expenses shown in the table are meant to highlight your ongoing costs only and do not reflect any transaction costs, such as sales charges (loads) on purchase payments, contingent deferred sales charges on redemptions, and redemption fees, if any. Therefore, the hypothetical information is useful in comparing ongoing costs only, and will not help you determine the relative total costs of owning different funds. In addition, if these transaction costs were included, your costs would have been higher.
| Class | ACTUAL | HYPOTHETICAL expenses) | ||||||||||||||||||||||
| Beginning Account Value (05/01/12) | Ending Account Value | Expenses Period2 | Ending Account Value | Expenses Period2 | Annualized Ratio | |||||||||||||||||||
| A | $ | 1,000.00 | $ | 1,037.20 | $ | 7.78 | $ | 1,017.50 | $ | 7.71 | 1.52 | % | ||||||||||||
| B | 1,000.00 | 1,033.10 | 11.60 | 1,013.72 | 11.49 | 2.27 | ||||||||||||||||||
| C | 1,000.00 | 1,033.20 | 11.60 | 1,013.72 | 11.49 | 2.27 | ||||||||||||||||||
| Y | 1,000.00 | 1,038.20 | 6.51 | 1,018.75 | 6.44 | 1.27 | ||||||||||||||||||
| 1 | The actual ending account value is based on the actual total return of the Fund for the period May 1, 2012 through October 31, 2012, after actual expenses and will differ from the hypothetical ending account value which is based on the Fund’s expense ratio and a hypothetical annual return of 5% before expenses. |
| 2 | Expenses are equal to the Fund’s annualized expense ratio as indicated above multiplied by the average account value over the period, multiplied by 184/366 to reflect the most recent fiscal half year. |
21 Invesco Asia Pacific Growth Fund
Approval of Investment Advisory and Sub-Advisory Contracts
The Board of Trustees (the Board) of AIM International Mutual Funds (Invesco International Mutual Funds) is required under the Investment Company Act of 1940, as amended, to approve annually the renewal of the Invesco Asia Pacific Growth Fund (the Fund) investment advisory agreement with Invesco Advisers, Inc. (Invesco Advisers) and the Master Intergroup Sub-Advisory Contract for Mutual Funds (the sub-advisory contracts) with Invesco Asset Management Deutschland GmbH, Invesco Asset Management Limited, Invesco Asset Management (Japan) Limited, Invesco Australia Limited, Invesco Hong Kong Limited, Invesco Senior Secured Management, Inc. and Invesco Canada Ltd. (collectively, the Affiliated Sub-Advisers). During contract renewal meetings held on June 19-20, 2012, the Board as a whole, and the disinterested or “independent” Trustees, who comprise 80% of the Board, voting separately, approved the continuance of the Fund’s investment advisory agreement and the sub-advisory contracts for another year, effective July 1, 2012. In doing so, the Board considered the process that it follows in reviewing and approving the Fund’s investment advisory agreement and sub-advisory contracts and the information that it is provided. The Board determined that the Fund’s investment advisory agreement and the sub-advisory contracts are in the best interests of the Fund and its shareholders and the compensation to Invesco Advisers and the Affiliated Sub-Advisers under the agreements is fair and reasonable.
The Board’s Fund Evaluation Process
The Board’s Investments Committee has established three Sub-Committees, each of which is primarily responsible for overseeing the management of a number of the series portfolios of the funds advised by Invesco Advisers (the Invesco Funds). The Sub-Committees meet throughout the year to review the performance of their assigned funds, including reviewing materials prepared under the direction of the independent Senior Officer, an officer of the Invesco Funds who reports directly to the independent Trustees. Over the course of each year, the Sub-Committees meet with portfolio managers for their assigned Invesco Funds and other members of management to review the performance, investment objective(s), policies, strategies, limitations and investment risks of these funds. The Sub-Committees meet regularly and at designated contract renewal meetings each year to conduct a review of the performance, fees, expenses and other matters related to their assigned Invesco Funds. Each Sub-Committee recommends to the Investments Committee, which in turn recommends to the full Board, whether and on what terms to approve the continuance of each Invesco Fund’s
investment advisory agreement and sub-advisory contracts for another year.
During the contract renewal process, the Trustees receive comparative performance and fee data regarding the Invesco Funds prepared by Invesco Advisers and an independent company, Lipper Inc. (Lipper). The Trustees also receive an independent written evaluation from the Senior Officer. The Senior Officer’s evaluation is prepared as part of his responsibility to manage the process by which the Invesco Funds’ proposed management fees are negotiated during the annual contract renewal process to ensure they are negotiated in a manner that is at arms’ length and reasonable. The independent Trustees are assisted in their annual evaluation of the Fund’s investment advisory agreement by the Senior Officer and by independent legal counsel. In addition to meetings with Invesco Advisers and fund counsel, the independent Trustees also discuss the continuance of the investment advisory agreement and sub-advisory contracts in private sessions with the Senior Officer and independent legal counsel.
In evaluating the fairness and reasonableness of the Fund’s investment advisory agreement and sub-advisory contracts, the Board considered, among other things, the factors discussed below. The Trustees recognized that the advisory fees for the Invesco Funds include advisory fees that are the result of years of review and negotiation between the Trustees and Invesco Advisers as well as advisory fees previously approved by a different board that, at the time, was responsible for overseeing Morgan Stanley and Van Kampen funds, which have become Invesco Funds following the acquisition of the retail mutual fund business of Morgan Stanley. The Trustees’ deliberations and conclusions in a particular year may be based in part on their deliberations and conclusions regarding these same arrangements throughout the year and in prior years. One Trustee may have weighed a particular piece of information or factor differently than another Trustee.
The discussion below serves as the Senior Officer’s independent written evaluation with respect to the Fund’s investment advisory agreement as well as a discussion of the material factors and related conclusions that formed the basis for the Board’s approval of the Fund’s investment advisory agreement and sub-advisory contracts. Unless otherwise stated, this information is current as of June 20, 2012, and may not reflect consideration of factors that became known to the Board after that date, including, for example, changes to the Fund’s performance, advisory fees, expense limitations and/or fee waivers.
Factors and Conclusions and Summary of Independent Written Fee Evaluation
| A. | Nature, Extent and Quality of Services Provided by Invesco Advisers and the Affiliated Sub-Advisers |
The Board reviewed the advisory services provided to the Fund by Invesco Advisers under the Fund’s investment advisory agreement, the performance of Invesco Advisers in providing these services, and the credentials and experience of the officers and employees of Invesco Advisers who provide these services, including the Fund’s portfolio manager or managers, with whom the Sub-Committees met during the year. The Board’s review of the qualifications of Invesco Advisers to provide advisory services included the Board’s consideration of Invesco Advisers’ performance and investment process oversight, independent credit analysis and investment risk management.
In determining whether to continue the Fund’s investment advisory agreement, the Board considered the prior relationship between Invesco Advisers and the Fund, as well as the Board’s knowledge of Invesco Advisers’ operations, and concluded that it is beneficial to maintain the current relationship, in part because of such prior relationship and knowledge. The Board also considered services that Invesco Advisers and its affiliates provide to the Invesco Funds such as various back office support functions, equity and fixed income trading operations, internal audit, distribution and legal and compliance. The Board concluded that the nature, extent and quality of the services provided to the Fund by Invesco Advisers are appropriate and satisfactory and consistent with the terms of the Fund’s investment advisory agreement.
The Board reviewed the services provided by the Affiliated Sub-Advisers under the sub-advisory contracts and the credentials and experience of the officers and employees of the Affiliated Sub-Advisers who provide these services. The Board noted that the Affiliated Sub-Advisers have offices and personnel that are located in financial centers around the world. As a result, the Affiliated Sub-Advisers can provide research and investment analysis on the markets and economies of various countries in which the Fund invests and make recommendations on securities of companies located in such countries. The Board concluded that the sub-advisory contracts benefit the Fund and its shareholders by permitting Invesco Advisers to use the resources and talents of the Affiliated Sub-Advisers in managing the Fund. The Board concluded that the nature, extent and quality of the services provided by the Affiliated Sub-Advisers are appropriate and satisfactory and consistent with the terms of the Fund’s sub-advisory contracts.
22 Invesco Asia Pacific Growth Fund
| B. | Fund Performance |
The Board considered Fund performance as a relevant factor in considering whether to approve the investment advisory agreement. The Board did not view Fund performance as a relevant factor in considering whether to approve the sub-advisory contracts for the Fund, as no Affiliated Sub-Adviser currently manages assets of the Fund.
The Board compared the Fund’s performance during the past one, three and five calendar years to the performance of funds in the Lipper performance universe and against the Lipper Pacific Region Ex-Japan Funds Index. The Board noted that performance of Class A shares of the Fund was in the first quintile of the performance universe for the one, three and five year periods (the first quintile being the best performing funds and the fifth quintile being the worst performing funds). The Board noted that performance of Class A shares of the Fund was above the performance of the Index for the one, three and five year periods. The Trustees also reviewed more recent Fund performance and this review did not change their conclusions.
| C. | Advisory and Sub-Advisory Fees and Fee Waivers |
The Board compared the Fund’s contractual advisory fee rate to the contractual advisory fee rates of funds in the Fund’s Lipper expense group at a common asset level. The Board noted that the contractual advisory fee rate for Class A shares of the Fund was below the median contractual advisory fee rate of funds in the expense group. The Board also reviewed the methodology used by Lipper in providing expense group information, which includes using audited financial data from the most recent annual report of each fund in the expense group that was publicly available as of the end of the past calendar year and including only one fund per investment adviser. The Board noted that comparative data is as of varying dates, which may affect the comparability of data during times of market volatility.
The Board noted that Invesco Advisers and the Affiliated Sub-Advisers do not manage other funds or client accounts in a manner substantially similar to the management of the Fund.
The Board also considered the services provided by the Affiliated Sub-Advisers pursuant to the sub-advisory contracts, as well as the allocation of fees between Invesco Advisers and the Affiliated Sub-Advisers pursuant to the sub-advisory contracts. The Board noted that Invesco Advisers provides services to sub-advised Invesco Funds, including oversight of the Affiliated Sub-Advisers as well as the additional services described above other than day-to-day portfolio management. The Board also noted that the sub-advisory fees have no direct effect on the Fund or its shareholders, as they are paid by Invesco Advisers to the Affiliated Sub-Advisers.
Based upon the information and considerations described above, the Board concluded that the Fund’s advisory and sub-advisory fees are fair and reasonable.
| D. | Economies of Scale and Breakpoints |
The Board considered the extent to which there are economies of scale in the provision of advisory services to the Fund. The Board also considered whether the Fund benefits from economies of scale through contractual breakpoints in the Fund’s advisory fee schedule and were assisted in their review by a report from the Senior Officer. The Board also noted that the Fund shares directly in economies of scale through lower fees charged by third party service providers based on the combined size of the Invesco Funds and other clients advised by Invesco Advisers. The Board noted that Invesco Advisers proposes sharing economies of scale in administration expenses by lowering per class administrative fees.
| E. | Profitability and Financial Resources |
The Board reviewed information from Invesco Advisers concerning the costs of the advisory and other services that Invesco Advisers and its affiliates provide to the Fund and the profitability of Invesco Advisers and its affiliates in providing these services for the year ended December 31, 2011. The Board reviewed with Invesco Advisers the methodology used to prepare the profitability information. The Board considered the profitability of Invesco Advisers in connection with managing the Fund and the Invesco Funds. The Board noted that Invesco Advisers continues to operate at a net profit from services Invesco Advisers and its subsidiaries provide to the Invesco Funds and the Fund. The Board did not deem the level of profits realized by Invesco Advisers and its affiliates from providing services to the Fund to be excessive given the nature, quality and extent of the services provided to the Invesco Funds. The Board received and accepted information from Invesco Advisers demonstrating that Invesco Advisers and each Affiliated Sub-Adviser are financially sound and have the resources necessary to perform their obligations under the investment advisory agreement and sub-advisory contracts.
| F. | Collateral Benefits to Invesco Advisers and its Affiliates |
The Board considered various other benefits received by Invesco Advisers and its affiliates from the relationship with the Fund, including the fees received for their provision of administrative, transfer agency and distribution services to the Fund. The Board considered the performance of Invesco Advisers and its affiliates in providing these services and the organizational structure employed to provide these services. The Board also considered that these services are provided to the Fund pursuant to written contracts that are reviewed and approved on an annual basis by the Board; that the services are required for the operation of the Fund; that Invesco Advisers and its affiliates can provide services, the nature and quality of which are at least equal to those
provided by others offering the same or similar services; and that the fees for such services are fair and reasonable in light of the usual and customary charges by others for services of the same nature and quality.
The Board considered the benefits realized by Invesco Advisers and the Affiliated Sub-Advisers as a result of portfolio brokerage transactions executed through “soft dollar” arrangements. The Board noted that soft dollar arrangements shift the payment obligation for research services from Invesco Advisers and the Affiliated Sub-Advisers to the Invesco Funds and therefore may reduce Invesco Advisers’ and the Affiliated Sub-Advisers’ expenses. The Board also considered periodic reports from the Chief Compliance Officer of the Invesco Funds demonstrating that these arrangements are consistent with regulatory requirements. The Board did not deem the soft dollar arrangements to be inappropriate.
The Board considered that the Fund’s uninvested cash and cash collateral from any securities lending arrangements may be invested in money market funds advised by Invesco Advisers pursuant to procedures approved by the Board. The Board noted that Invesco Advisers receives advisory fees from these affiliated money market funds attributable to such investments, although Invesco Advisers has contractually agreed to waive through varying periods the advisory fees payable by the Invesco Funds. The waiver is in an amount equal to 100% of the net advisory fee Invesco Advisers receives from the affiliated money market funds with respect to the Fund’s investment in the affiliated money market funds of uninvested cash, but not cash collateral. The Board concluded that the Fund’s investment of uninvested cash and cash collateral from any securities lending arrangements in the affiliated money market funds is in the best interests of the Fund and its shareholders.
The Board also considered use of an affiliated broker to execute certain trades for the Fund and that such trades are executed in compliance with rules under the Investment Company Act of 1940, as amended.
23 Invesco Asia Pacific Growth Fund
Tax Information
Form 1099-DIV, Form 1042-S and other year–end tax information provide shareholders with actual calendar year amounts that should be included in their tax returns. Shareholders should consult their tax advisors.
The following distribution information is being provided as required by the Internal Revenue Code or to meet a specific state’s requirement.
The Fund designates the following amounts or, if subsequently determined to be different, the maximum amount allowable for its fiscal year ended October 31, 2012:
Federal and State Income Tax | ||||
Long-Term Capital Gain Dividends | $ | 38,604,251 | ||
Qualified Dividend Income* | 100 | % | ||
Corporate Dividends Received Deduction* | 0.00 | % | ||
| * | The above percentages are based on ordinary income dividends paid to shareholders during the Fund’s fiscal year. |
24 Invesco Asia Pacific Growth Fund
Trustees and Officers
The address of each trustee and officer is AIM International Mutual Funds (Invesco International Mutual Funds) (the “Trust”), 11 Greenway Plaza, Suite 1000, Houston, Texas 77046-1173. The trustees serve for the life of the Trust, subject to their earlier death, incapacitation, resignation, retirement or removal as more specifically provided in the Trust’s organizational documents. Each officer serves for a one year term or until their successors are elected and qualified. Column two below includes length of time served with predecessor entities, if any.
| Name, Year of Birth and Position(s) Held with the Trust | Trustee and/ or Officer Since | Principal Occupation(s) During Past 5 Years | Number of Complex Overseen by Trustee | Other Directorship(s) Held by Trustee During Past 5 Years | ||||
| Interested Persons | ||||||||
| Martin L. Flanagan1 — 1960 Trustee | 2007 | Executive Director, Chief Executive Officer and President, Invesco Ltd. (ultimate parent of Invesco and a global investment management firm); Advisor to the Board, Invesco Advisers, Inc. (formerly known as Invesco Institutional (N.A.), Inc.); Trustee, The Invesco Funds; Vice Chair, Investment Company Institute; and Member of Executive Board, SMU Cox School of Business
Formerly: Chairman, Invesco Advisers, Inc. (registered investment adviser); Director, Chairman, Chief Executive Officer and President, IVZ Inc. (holding company), INVESCO Group Services, Inc. (service provider) and Invesco North American Holdings, Inc. (holding company); Director, Chief Executive Officer and President, Invesco Holding Company Limited (parent of Invesco and a global investment management firm); Director, Invesco Ltd.; Chairman, Investment Company Institute and President, Co-Chief Executive Officer, Co-President, Chief Operating Officer and Chief Financial Officer, Franklin Resources, Inc. (global investment management organization) | 123 | None | ||||
Philip A. Taylor2 — 1954 Trustee, President and Principal Executive Officer | 2006 | Head of North American Retail and Senior Managing Director, Invesco Ltd.; Director, Co-Chairman, Co-President and Co-Chief Executive Officer, Invesco Advisers, Inc. (formerly known as Invesco Institutional (N.A.), Inc.) (registered investment adviser); Director, Chairman, Chief Executive Officer and President, Invesco Management Group, Inc. (formerly known as Invesco Aim Management Group, Inc.) (financial services holding company); Director and President, INVESCO Funds Group, Inc. (registered investment adviser and registered transfer agent); Director and Chairman, Invesco Investment Services, Inc. (formerly known as Invesco Aim Investment Services, Inc.) (registered transfer agent) and IVZ Distributors, Inc. (formerly known as INVESCO Distributors, Inc.) (registered broker dealer); Director, President and Chairman, Invesco Inc. (holding company) and Invesco Canada Holdings Inc. (holding company); Chief Executive Officer, Invesco Corporate Class Inc. (corporate mutual fund company) and Invesco Canada Fund Inc. (corporate mutual fund company); Director, Chairman and Chief Executive Officer, Invesco Canada Ltd. (formerly known as Invesco Trimark Ltd./Invesco Trimark Ltèe) (registered investment adviser and registered transfer agent); Trustee, President and Principal Executive Officer, The Invesco Funds (other than AIM Treasurer’s Series Trust (Invesco Treasurer’s Series Trust) and Short-Term Investments Trust); Trustee and Executive Vice President, The Invesco Funds (AIM Treasurer’s Series Trust (Invesco Treasurer’s Series Trust) and Short-Term Investments Trust only); Director, Invesco Investment Advisers LLC (formerly known as Van Kampen Asset Management); Director, Chief Executive Officer and President, Van Kampen Exchange Corp.
Formerly: Director and Chairman, Van Kampen Investor Services Inc.; Director, Chief Executive Officer and President, 1371 Preferred Inc. (holding company); and Van Kampen Investments Inc.; Director and President, AIM GP Canada Inc. (general partner for limited partnerships); and Van Kampen Advisors, Inc.; Director and Chief Executive Officer, Invesco Trimark Dealer Inc. (registered broker dealer); Director, Invesco Distributors, Inc. (formerly known as Invesco Aim Distributors, Inc.) (registered broker dealer); Manager, Invesco PowerShares Capital Management LLC; Director, Chief Executive Officer and President, Invesco Advisers, Inc.; Director, Chairman, Chief Executive Officer and President, Invesco Aim Capital Management, Inc.; President, Invesco Trimark Dealer Inc. and Invesco Trimark Ltd./Invesco Trimark Ltèe; Director and President, AIM Trimark Corporate Class Inc. and AIM Trimark Canada Fund Inc.; Senior Managing Director, Invesco Holding Company Limited; Trustee and Executive Vice President, Tax-Free Investments Trust; Director and Chairman, Fund Management Company (former registered broker dealer); President and Principal Executive Officer, The Invesco Funds (AIM Treasurer’s Series Trust (Invesco Treasurer’s Series Trust), Short-Term Investments Trust and Tax-Free Investments Trust only); President, AIM Trimark Global Fund Inc. and AIM Trimark Canada Fund Inc. | 123 | None | ||||
Wayne W. Whalen3 — 1939 Trustee | 2010 | Of Counsel, and prior to 2010, partner in the law firm of Skadden, Arps, Slate, Meagher & Flom LLP, legal counsel to certain funds in the Fund Complex
| 136 | Director of the Mutual Fund Directors Forum, a nonprofit membership organization for investment directors; Chairman and Director of the Abraham Lincoln Presidential Library Foundation; and Director of the Stevenson Center for Democracy |
| 1 | Mr. Flanagan is considered an interested person of the Trust because he is an officer of the adviser to the Trust, and an officer and a director of Invesco Ltd., ultimate parent of the adviser to the Trust. |
| 2 | Mr. Taylor is considered an interested person of the Trust because he is an officer and a director of the adviser to, and a director of the principal underwriter of, the Trust. |
| 3 | Mr. Whalen is considered an “interested person” (within the meaning of Section 2(a)(19) of the 1940 Act) of certain Funds in the Invesco Fund Complex by reason of he and his firm currently providing legal services as legal counsel to such Funds in the Invesco Fund Complex. |
T-1 Invesco Asia Pacific Growth Fund
Trustees and Officers—(continued)
| Name, Year of Birth and Position(s) Held with the Trust | Trustee and/ or Officer Since | Principal Occupation(s) During Past 5 Years | Number of Funds in Fund Complex Overseen by Trustee | Other Directorship(s) Held by Trustee During Past 5 Years | ||||
| Independent Trustees | ||||||||
Bruce L. Crockett — 1944 Trustee and Chair | 1992 | Chairman, Crockett Technologies Associates (technology consulting company)
Formerly: Director, Captaris (unified messaging provider); Director, President and Chief Executive Officer COMSAT Corporation; and Chairman, Board of Governors of INTELSAT (international communications company) | 123 | ACE Limited (insurance company); and Investment Company Institute | ||||
David C. Arch — 1945 Trustee | 2010 | Retired.
Formerly: Chairman and Chief Executive Officer of Blistex Inc., (consumer health care products manufacturer) | 136 | Member of the Heartland Alliance Advisory Board, a nonprofit organization serving human needs based in Chicago. Board member of the Illinois Manufacturers’ Association. Member of the Board of Visitors, Institute for the Humanities, University of Michigan | ||||
Frank S. Bayley — 1939 Trustee | 2001 | Retired
Formerly: Director, Badgley Funds, Inc. (registered investment company) (2 portfolios) and Partner, law firm of Baker & McKenzie | 123 | Director and Chairman, C.D. Stimson Company (a real estate investment company) | ||||
James T. Bunch — 1942 Trustee | 2003 | Managing Member, Grumman Hill Group LLC (family office private equity management)
Formerly: Founder, Green, Manning & Bunch Ltd. (investment banking firm)(1988-2010); Executive Committee, United States Golf Association; and Director, Policy Studies, Inc. and Van Gilder Insurance Corporation | 123 | Chairman, Board of Governors, Western Golf Association, Chairman-elect, Evans Scholars Foundation and Director, Denver Film Society | ||||
Rodney F. Dammeyer — 1940 Trustee | 2010 | Chairman of CAC, LLC, (private company offering capital investment and management advisory services)
Formerly: Prior to January 2004, Director of TeleTech Holdings Inc.; Prior to 2002, Director of Arris Group, Inc.; Prior to 2001, Managing Partner at Equity Group Corporate Investments. Prior to 1995, Vice Chairman of Anixter International. Prior to 1985, experience includes Senior Vice President and Chief Financial Officer of Household International, Inc., Executive Vice President and Chief Financial Officer of Northwest Industries, Inc. and Partner of Arthur Andersen & Co. | 136 | Director of Quidel Corporation and Stericycle, Inc. Prior to May 2008, Trustee of The Scripps Research Institute. Prior to February 2008, Director of Ventana Medical Systems, Inc. Prior to April 2007, Director of GATX Corporation. Prior to April 2004, Director of TheraSense, Inc. | ||||
Albert R. Dowden — 1941 Trustee | 2000 | Director of a number of public and private business corporations, including the Boss Group, Ltd. (private investment and management); Reich & Tang Funds (5 portfolios) (registered investment company); and Homeowners of America Holding Corporation/ Homeowners of America Insurance Company (property casualty company)
Formerly: Director, Continental Energy Services, LLC (oil and gas pipeline service); Director, CompuDyne Corporation (provider of product and services to the public security market) and Director, Annuity and Life Re (Holdings), Ltd. (reinsurance company); Director, President and Chief Executive Officer, Volvo Group North America, Inc.; Senior Vice President, AB Volvo; Director of various public and private corporations; Chairman, DHJ Media, Inc.; Director Magellan Insurance Company; and Director, The Hertz Corporation, Genmar Corporation (boat manufacturer), National Media Corporation; Advisory Board of Rotary Power International (designer, manufacturer, and seller of rotary power engines); and Chairman, Cortland Trust, Inc. (registered investment company) | 123 | Director of Nature’s Sunshine Products, Inc. | ||||
Jack M. Fields — 1952 Trustee | 1997 | Chief Executive Officer, Twenty First Century Group, Inc. (government affairs company); and Owner and Chief Executive Officer, Dos Angelos Ranch, L.P. (cattle, hunting, corporate entertainment), Discovery Global Education Fund (non-profit) and Cross Timbers Quail Research Ranch (non-profit)
Formerly: Chief Executive Officer, Texana Timber LP (sustainable forestry company) and member of the U.S. House of Representatives | 123 | Insperity (formerly known as Administaff) | ||||
Carl Frischling — 1937 Trustee | 1991 | Partner, law firm of Kramer Levin Naftalis and Frankel LLP | 123 | Director, Reich & Tang Funds (6 portfolios) | ||||
Prema Mathai-Davis — 1950 Trustee | 1998 | Retired
Formerly: Chief Executive Officer, YWCA of the U.S.A. | 123 | None | ||||
Larry Soll — 1942 Trustee | 2003 | Retired
Formerly: Chairman, Chief Executive Officer and President, Synergen Corp. (a biotechnology company) | 123 | None |
T-2 Invesco Asia Pacific Growth Fund
Trustees and Officers—(continued)
| Name, Year of Birth and Position(s) Held with the Trust | Trustee and/ or Officer Since | Principal Occupation(s) During Past 5 Years | Number of Funds in Fund Complex Overseen by Trustee | Other Directorship(s) Held by Trustee During Past 5 Years | ||||
| Independent Trustees—(continued) | ||||||||
Hugo F. Sonnenschein — 1940 Trustee | 2010 | Distinguished Service Professor and President Emeritus of the University of Chicago and the Adam Smith Distinguished Service Professor in the Department of Economics at the University of Chicago.
Formerly: President of the University of Chicago | 136 | Trustee of the University of Rochester and a member of its investment committee. Member of the National Academy of Sciences, the American Philosophical Society and a fellow of the American Academy of Arts and Sciences | ||||
Raymond Stickel, Jr. — 1944 Trustee | 2005 | Retired
Formerly: Director, Mainstay VP Series Funds, Inc. (25 portfolios) and Partner, Deloitte & Touche | 123 | None | ||||
| Other Officers | ||||||||
Russell C. Burk — 1958 Senior Vice President and Senior Officer | 2005 | Senior Vice President and Senior Officer, The Invesco Funds | N/A | N/A | ||||
John M. Zerr — 1962 Senior Vice President, Chief Legal Officer and Secretary | 2006 | Director, Senior Vice President, Secretary and General Counsel, Invesco Management Group, Inc. (formerly known as Invesco Aim Management Group, Inc.) and Van Kampen Exchange Corp.; Senior Vice President, Invesco Advisers, Inc. (formerly known as Invesco Institutional (N.A.), Inc.) (registered investment adviser); Senior Vice President and Secretary, Invesco Distributors, Inc. (formerly known as Invesco Aim Distributors, Inc.); Director, Vice President and Secretary, Invesco Investment Services, Inc. (formerly known as Invesco Aim Investment Services, Inc.) and IVZ Distributors, Inc. (formerly known as INVESCO Distributors, Inc.); Director and Vice President, INVESCO Funds Group, Inc.; Senior Vice President, Chief Legal Officer and Secretary, The Invesco Funds; Manager, Invesco PowerShares Capital Management LLC; Director, Secretary and General Counsel, Invesco Investment Advisers LLC (formerly known as Van Kampen Asset Management); Secretary and General Counsel, Invesco Capital Markets, Inc. (formerly known as Van Kampen Funds Inc.) and Chief Legal Officer, PowerShares Exchange-Traded Fund Trust, PowerShares Exchange-Traded Fund Trust II, PowerShares India Exchange-Traded Fund Trust and PowerShares Actively Managed Exchange-Traded Fund Trust
Formerly: Director and Secretary, Van Kampen Advisors Inc.; Director Vice President, Secretary and General Counsel Van Kampen Investor Services Inc.; Director, Invesco Distributors, Inc. (formerly known as Invesco Aim Distributors, Inc.); Director, Senior Vice President, General Counsel and Secretary, Invesco Advisers, Inc.; and Van Kampen Investments Inc.; Director, Vice President and Secretary, Fund Management Company; Director, Senior Vice President, Secretary, General Counsel and Vice President, Invesco Aim Capital Management, Inc.; Chief Operating Officer and General Counsel, Liberty Ridge Capital, Inc. (an investment adviser); Vice President and Secretary, PBHG Funds (an investment company) and PBHG Insurance Series Fund (an investment company); Chief Operating Officer, General Counsel and Secretary, Old Mutual Investment Partners (a broker-dealer); General Counsel and Secretary, Old Mutual Fund Services (an administrator) and Old Mutual Shareholder Services (a shareholder servicing center); Executive Vice President, General Counsel and Secretary, Old Mutual Capital, Inc. (an investment adviser); and Vice President and Secretary, Old Mutual Advisors Funds (an investment company) | N/A | N/A | ||||
Lisa O. Brinkley — 1959 Vice President | 2004 | Global Assurance Officer, Invesco Ltd. and Vice President, The Invesco Funds
Formerly: Chief Compliance Officer, Invesco Distributors, Inc. (formerly known as Invesco Aim Distributors, Inc.), Invesco Investment Services, Inc.(formerly known as Invesco Aim Investment Services, Inc.) and Van Kampen Investor Services Inc.; Senior Vice President, Invesco Management Group, Inc.; Senior Vice President and Chief Compliance Officer, Invesco Advisers, Inc. and The Invesco Funds; Vice President and Chief Compliance Officer, Invesco Aim Capital Management, Inc. and Invesco Distributors, Inc.; Vice President, Invesco Investment Services, Inc. and Fund Management Company | N/A | N/A | ||||
T-3 Invesco Asia Pacific Growth Fund
Trustees and Officers—(continued)
| Name, Year of Birth and Position(s) Held with the Trust | Trustee and/ or Officer Since | Principal Occupation(s) During Past 5 Years | Number of Funds in Fund Complex Overseen by Trustee | Other Directorship(s) Held by Trustee During Past 5 Years | ||||
| Other Officers—(continued) | ||||||||
Karen Dunn Kelley — 1960 Vice President | 2004 | Head of Invesco’s World Wide Fixed Income and Cash Management Group; Senior Vice President, Invesco Management Group, Inc. (formerly known as Invesco Aim Management Group, Inc.) and Invesco Advisers, Inc. (formerly known as Invesco Institutional (N.A.), Inc.) (registered investment adviser); Executive Vice President, Invesco Distributors, Inc. (formerly known as Invesco Aim Distributors, Inc.); Director, Invesco Mortgage Capital Inc., INVESCO Global Asset Management Limited, Invesco Management Company Limited and INVESCO Management S.A.; Vice President, The Invesco Funds (other than AIM Treasurer’s Series Trust (Invesco Treasurer’s Series Trust) and Short-Term Investments Trust); and President and Principal Executive Officer, The Invesco Funds (AIM Treasurer’s Series Trust (Invesco Treasurer’s Series Trust) and Short-Term Investments Trust only)
Formerly: Senior Vice President, Van Kampen Investments Inc.; Vice President, Invesco Advisers, Inc. (formerly known as Invesco Institutional (N.A.), Inc.); Director of Cash Management and Senior Vice President, Invesco Advisers, Inc. and Invesco Aim Capital Management, Inc.; President and Principal Executive Officer, Tax-Free Investments Trust; Director and President, Fund Management Company; Chief Cash Management Officer, Director of Cash Management, Senior Vice President, and Managing Director, Invesco Aim Capital Management, Inc.; Director of Cash Management, Senior Vice President, and Vice President, Invesco Advisers, Inc. and The Invesco Funds (AIM Treasurer’s Series Trust (Invesco Treasurer’s Series Trust), Short-Term Investments Trust and Tax-Free Investments Trust only) | N/A | N/A | ||||
Sheri Morris — 1964 Vice President, Treasurer and Principal Financial Officer | 1999 | Vice President, Treasurer and Principal Financial Officer, The Invesco Funds; Vice President, Invesco Advisers, Inc. (formerly known as Invesco Institutional (N.A.), Inc.) (registered investment adviser); and Treasurer, PowerShares Exchange-Traded Fund Trust, PowerShares Exchange-Traded Fund Trust II, PowerShares India Exchange-Traded Fund Trust and PowerShares Actively Managed Exchange-Traded Fund Trust
Formerly: Vice President, Invesco Advisers, Inc., Invesco Aim Capital Management, Inc. and Invesco Aim Private Asset Management, Inc.; Assistant Vice President and Assistant Treasurer, The Invesco Funds and Assistant Vice President, Invesco Advisers, Inc., Invesco Aim Capital Management, Inc. and Invesco Aim Private Asset Management, Inc. | N/A | N/A | ||||
Yinka Akinsola — 1977 Anti-Money Laundering Compliance Officer | 2011 | Anti-Money Laundering Compliance Officer, Invesco Advisers, Inc. (formerly known as Invesco Institutional (N.A.), Inc.) (registered investment adviser); Invesco Distributors, Inc. (formerly known as Invesco Aim Distributors, Inc.), Invesco Investment Services, Inc. (formerly known as Invesco Aim Investment Services, Inc.), Invesco Management Group, Inc., The Invesco Funds, Invesco Van Kampen Closed-End Funds, Van Kampen Exchange Corp., Invesco Capital Markets, Inc. (formerly known as Van Kampen Funds Inc.), PowerShares Exchange-Traded Fund Trust, PowerShares Exchange-Traded Fund Trust II, PowerShares India Exchange-Traded Fund Trust, and PowerShares Actively Managed Exchange-Traded Fund Trust
Formerly: Regulatory Analyst III, Financial Industry Regulatory Authority (FINRA). | N/A | N/A | ||||
Todd L. Spillane — 1958 Chief Compliance Officer | 2006 | Senior Vice President, Invesco Management Group, Inc. (formerly known as Invesco Aim Management Group, Inc.) and Van Kampen Exchange Corp.; Senior Vice President and Chief Compliance Officer, Invesco Advisers, Inc. (registered investment adviser) (formerly known as Invesco Institutional (N.A.), Inc.); Chief Compliance Officer, The Invesco Funds; Vice President, Invesco Distributors, Inc. (formerly known as Invesco Aim Distributors, Inc.) and Invesco Investment Services, Inc. (formerly known as Invesco Aim Investment Services, Inc.)
Formerly: Chief Compliance Officer, Invesco Van Kampen Closed-End Funds; Senior Vice President, Van Kampen Investments Inc.; Senior Vice President and Chief Compliance Officer, Invesco Advisers, Inc. and Invesco Aim Capital Management, Inc.; Chief Compliance Officer, INVESCO Private Capital Investments, Inc. (holding company), Invesco Private Capital, Inc. (registered investment adviser), Invesco Global Asset Management (N.A.), Inc., Invesco Senior Secured Management, Inc. (registered investment adviser) and Van Kampen Investor Services Inc., PowerShares Exchange-Traded Fund Trust, PowerShares Exchange-Traded Fund Trust II, PowerShares India Exchange-Traded Fund Trust and PowerShares Actively Managed Exchange-Traded Fund Trust; Vice President, Invesco Aim Capital Management, Inc. and Fund Management Company | N/A | N/A | ||||
The Statement of Additional Information of the Trust includes additional information about the Fund’s Trustees and is available upon request, without charge, by calling 1.800.959.4246. Please refer to the Fund’s prospectus for information on the Fund’s sub-advisers.
Office of the Fund 11 Greenway Plaza, Suite 1000 Houston, TX 77046-1173 | Investment Adviser Invesco Advisers, Inc. 1555 Peachtree Street, N.E. Atlanta, GA 30309 | Distributor Invesco Distributors, Inc. 11 Greenway Plaza, Suite 1000 Houston, TX 77046-1173 | Auditors PricewaterhouseCoopers LLP 1201 Louisiana Street, Suite 2900 Houston, TX 77002-5678 | |||
Counsel to the Fund Stradley Ronon Stevens & Young, LLP 2005 Market Street, Suite 2600 Philadelphia, PA 19103-7018 | Counsel to the Independent Trustees Kramer Levin Naftalis & Frankel LLP 1177 Avenue of the Americas New York, NY 10036-2714 | Transfer Agent Invesco Investment Services, Inc. 11 Greenway Plaza, Suite 1000 Houston, TX 77046-1173 | Custodian State Street Bank and Trust Company 225 Franklin Street Boston, MA 02110-2801 | |||
T-4 Invesco Asia Pacific Growth Fund

Invesco mailing information
Send general correspondence to Invesco Investment Services, Inc., P.O. Box 219078, Kansas City, MO 64121-9078.
Invesco privacy policy
You share personal and financial information with us that is necessary for your transactions and your account records. We take very seriously the obligation to keep that information confidential and private.
Invesco collects nonpublic personal information about you from account applications or other forms you complete and from your transactions with us or our affiliates. We do not disclose information about you or our former customers to service providers or other third parties except to the extent necessary to service your account and in other limited circumstances as permitted by law. For example, we use this information to facilitate the delivery of transaction confirmations, financial reports, prospectuses and tax forms.
Even within Invesco, only people involved in the servicing of your accounts and compliance monitoring have access to your information. To ensure the highest level of confidentiality and security, Invesco maintains physical, electronic and procedural safeguards that meet or exceed federal standards. Special measures, such as data encryption and authentication, apply to your communications with us on our website. More detail is available to you at invesco.com/privacy.
Important notice regarding delivery of security holder documents
To reduce Fund expenses, only one copy of most shareholder documents may be mailed to shareholders with multiple accounts at the same address (Householding). Mailing of your shareholder documents may be householded indefinitely unless you instruct us otherwise. If you do not want the mailing of these documents to be combined with those for other members of your household, please contact Invesco Investment Services, Inc. at 800 959 4246 or contact your financial institution. We will begin sending you individual copies for each account within 30 days after receiving your request.
Fund holdings and proxy voting information
The Fund provides a complete list of its holdings four times in each fiscal year, at the quarter-ends. For the second and fourth quarters, the lists appear in the Fund’s semiannual and annual reports to shareholders. For the first and third quarters, the Fund files the lists with the Securities and Exchange Commission (SEC) on Form N-Q. The most recent list of portfolio holdings is available at invesco.com/completeqtrholdings. Shareholders can also look up the Fund’s Forms N-Q on the SEC website at sec.gov. Copies of the Fund’s Forms N-Q may be reviewed and copied at the SEC Public Reference Room in Washington, D.C. You can obtain information on the operation of the Public Reference Room, including information about duplicating fee charges, by calling 202 551 8090 or 800 732 0330, or by electronic request at the following email address: publicinfo@sec.gov. The SEC file numbers for the Fund are shown below.
A description of the policies and procedures that the Fund uses to determine how to vote proxies relating to portfolio securities is available without charge, upon request, from our Client Services department at 800 959 4246 or at invesco.com/proxyguidelines. The information is also available on the SEC website, sec.gov.
Information regarding how the Fund voted proxies related to its portfolio securities during the 12 months ended June 30, 2012, is available at invesco.com/proxysearch. The information is also available on the SEC website, sec.gov. Invesco Advisers, Inc. is an investment adviser; it provides investment advisory services to individual and institutional clients and does not sell securities. Invesco Distributors, Inc. is the US distributor for Invesco Ltd.’s retail mutual funds, exchange-traded funds and institutional money market funds. Both are wholly owned, indirect subsidiaries of Invesco Ltd. |  |
| SEC file numbers: 811-06463 and 033-44611 | APG-AR-1 | Invesco Distributors, Inc. |

Letters to Shareholders
Philip Taylor | Dear Shareholders: This report contains information about your Fund, including a discussion from your portfolio managers about how they managed your Fund – and why it performed as it did – during the reporting period. This report also includes your Fund’s long-term performance and a complete list of your Fund’s investments as of the close of the reporting period. I hope you find this information helpful. For much of the reporting period, investors’ attention was focused on Europe, where eurozone governments struggled to reduce debt levels, strengthen their banks and stimulate their economies. European leaders disagreed whether the wiser path to restoring the Continent’s economic well-being was more stimulus or greater austerity. In the US, economic data were mixed. Economic growth, while positive, was relatively modest. Corporate earnings, which grew strongly in recent years, showed signs of slowing. And job | |
| creation was less robust than hoped. Later in this report, your Fund’s portfolio managers discuss how economic conditions and market trends affected your Fund’s performance. | ||

Economic conditions are always subject to sudden and unexpected change. That’s why you may find it helpful to work with a trusted, experienced financial adviser who understands your unique financial goals, needs and risk tolerances. Financial advisers can provide valuable insight and information, particularly when markets are uncertain, and they can recommend investments appropriate for specific investment goals, such as a child’s college education or your retirement. On a regular basis, a financial adviser also can determine whether your existing investments are still appropriate, given your changing needs, goals and circumstances.
Timely insight and information from many of Invesco’s investment professionals is available at our website, invesco.com/us. We offer in-depth articles, video clips and audio commentaries from many of our portfolio managers and other investment professionals on a wide range of topics of interest to investors: recent economic and market developments; retirement planning; legislative updates from Washington, DC; and general investor education. At invesco.com/us, you also can access information about your Invesco account at any time.
What we mean by Intentional Investing
Intentional InvestingSM is the science and art of investing with purpose, prudence and diligence – and it’s how Invesco’s investment professionals manage your money every day.
This highly disciplined process begins when specialized teams of investment professionals clearly define an investment objective and then establish specific investment strategies to try to achieve that objective. While our investment teams closely monitor economic and market conditions – and issues specific to individual holdings that could affect their value – they maintain a long-term investment perspective. Intentional Investing is also:
| n | How we manage and mitigate risk – by embedding risk controls and processes into every aspect of our business; |
| n | How we create products – by offering a diverse combination of investment strategies and vehicles designed to meet your needs; and |
| n | How we connect with you, our investors – by communicating clearly, by delivering expert insights from our portfolio managers and other investment professionals, and by providing a website full of tools and articles to help you stay informed. |
As a company, Invesco believes in putting investors first, and that’s why investment management is all we do. Our sole focus on managing your money allows your financial adviser to build a truly diversified investment portfolio of Invesco funds, whatever your investment needs and goals may be – and allows him or her to find appropriate Invesco funds when your circumstances change. Of course, neither Intentional Investing nor diversification can guarantee a profit or protect against loss.
Have a question?
If you have questions about your account, please contact an Invesco client services representative at 800 959 4246. If you have an Invesco-related question or comment, feel free to email me directly at phil@invesco.com.
All of us at Invesco look forward to serving your investment management needs for many years to come. Thank you for investing with us.
Sincerely,

Philip Taylor
Senior Managing Director, Invesco Ltd.
2 Invesco European Growth Fund
Bruce Crockett | Dear Fellow Shareholders: One of our most important responsibilities as independent Trustees of the Invesco Funds is our annual review of the funds’ advisory and sub-advisory contracts with Invesco. This annual review is required by the Investment Company Act of 1940 and focuses on the nature and quality of the services Invesco has provided as adviser to the Invesco Funds and the reasonableness of the fees that it charges for those services. In our roles as Trustees, we spend months reviewing thousands of pages of detailed information that we request from Invesco in connection with our annual review. We focus on the quality and costs of the services to be provided by Invesco and its affiliates. Some of the most important things we look at are fund performance, expenses and fees. All of the Trustees have substantial personal investments in the Invesco Funds complex. We’re fund shareholders just like you. |

We also use information from many independent sources during the review process, including materials provided by the independent Senior Officer of the Invesco Funds, who reports directly to the independent Trustees. We also meet in private sessions with independent legal counsel and review performance and fee data on the Invesco Funds prepared by Lipper Inc., an independent, third-party firm widely recognized as a leader in its field.
I’m pleased to report that the Invesco Funds Board determined in June that renewing the investment advisory agreement and the sub-advisory contracts with Invesco would serve the best interests of each fund and its shareholders. For more detailed information about our assessment and conclusions with respect to each of the Invesco Funds, visit invesco.com/us, click on the “About Us” section and go to “Legal Information.” Information on the recent investment advisory renewal process can be found by clicking the last item under “Corporate Governance.”
In much the same way we review your fund’s advisory contract each year, it’s a good idea for you to review your own investment plan with your financial adviser on a regular basis. Perhaps you need to reassess your original asset allocation because different investments may grow at varying paces, or perhaps you’re going through a significant life change. Regardless of your situation, a financial adviser can provide guidance and experience to help you reach your financial goals.
As always, please contact me at bruce@brucecrockett.com with any questions or concerns you may have. On behalf of the Board, we look forward to continuing to represent your interests and serving your needs.
Sincerely,

Bruce L. Crockett
Independent Chair
Invesco Funds Board of Trustees
3 Invesco European Growth Fund
Management’s Discussion of Fund Performance
Performance summary
For the fiscal year ended October 31, 2012, Invesco European Growth Fund, at net asset value (NAV), delivered double-digit returns, outperforming the Fund’s style-specific benchmark, the MSCI Europe Growth Index. Strong stock selection, particularly in the consumer discretionary, financials, materials and energy sectors, provided the largest positive contributions to the Fund’s outperformance.
Your Fund’s long-term performance appears later in this report.
Fund vs. Indexes
Total returns, 10/31/11 to 10/31/12, at net asset value (NAV). Performance shown does not include applicable contingent deferred sales charges (CDSC) or front-end sales charges, which would have reduced performance.
Class A Shares* | 12.64 | % | ||
Class B Shares* | 11.84 | |||
Class C Shares* | 11.79 | |||
Class R Shares* | 12.36 | |||
Class Y Shares* | 12.96 | |||
Investor Class Shares* | 12.72 | |||
MSCI EAFE Indexq (Broad Market Index) | 4.61 | |||
MSCI Europe Growth Indexn (Style-Specific Index) | 7.64 | |||
Lipper European Funds Indexn (Peer Group Index) | 10.09 |
Source(s): qInvesco, MSCI via FactSet Research Systems Inc.; nLipper Inc.
| * | Performance includes litigation proceeds. Had these proceeds not been received, total returns would have been lower. |
How we invest
When selecting stocks for your Fund, we use a disciplined investment strategy that emphasizes fundamental research, supported by both quantitative analysis and portfolio construction techniques. Our EQV (earnings, quality, valuation) strategy focuses primarily on identifying quality companies that have experienced, or exhibit the potential for, accelerated or above-average earnings growth, but whose stock prices do not fully reflect these attributes.
While research responsibilities within the portfolio management team are focused by market capitalization, we select investments for the Fund using a bottom-up investment approach, which means we construct the Fund primarily on a stock-by-stock basis. We focus on the strengths of individual companies rather than on sectors, countries or market-cap trends.
We believe disciplined sell decisions are key to successful investing. We consider selling a stock for one of the following reasons:
| n | A company’s fundamentals deteriorate, or it posts disappointing earnings. |
| n | A stock appears overvalued. |
| n | A more attractive investment opportunity becomes available. |
Market conditions and your Fund
During the reporting period, global equity markets remained volatile. At the beginning of the reporting period, macro events – ranging from continuing political instability in the Middle East, lingering economic effects of the earthquake and tsunami in Japan, the ongoing eurozone sovereign debt crisis, aftereffects of Standard & Poor’s August 2011 first-ever downgrade of US debt, a slowing Chinese property market and generally higher inflation across the developing world –
weighed on global economic growth and equity markets. While the markets rebounded modestly in December, macroeconomic concerns continued, stemming largely from the unstable economic conditions of Greece and Spain.
Toward the end of the reporting period, global central banks announced a series of stimulative policies. The European Central Bank (ECB) announced new measures to support eurozone economies through potentially unlimited purchases of sovereign debt, with ECB President Mario Draghi pledging to “do whatever it takes” to save the euro (although key details of the plan remain unresolved). The US Federal Reserve announced a third round of quantitative easing by promising to remain accommodative until the labor market outlook improves materially. Also, the Bank of Japan took steps to increase its asset purchase program. These easing measures were well received by investors and helped drive international equity markets higher in the final months of the reporting period, despite signs of a continued slowdown in global economic growth.
Despite this somewhat challenging environment, the Fund, at NAV, delivered double-digit gains for the fiscal year, outperforming the Fund’s style-specific benchmark. The Fund delivered double-digit returns across nine of the 10 invested sectors, with the industrials sector being the only exception. The Fund’s outperformance relative to the style-specific benchmark was driven by strong stock selection in the consumer discretionary, financials, energy and materials sectors. An underweight position in the materials sector also was beneficial.
In contrast, despite delivering double-digit absolute gains, the Fund’s exposure to the consumer staples sector proved to be a drag on relative performance. This was due to a combination of our stock selection and the Fund’s continued sig-
Portfolio Composition
By sectors
Consumer Discretionary | 20.6 | % | ||
Industrials | 16.6 | |||
Financials | 12.6 | |||
Consumer Staples | 11.8 | |||
Energy | 10.7 | |||
Health Care | 5.8 | |||
Information Technology | 5.5 | |||
Materials | 3.5 | |||
Utilities | 1.0 | |||
Money Market Funds | ||||
Plus Other Assets Less | 11.9 |
Top 10 Equity Holdings*
1. Anheuser-Busch InBev N.V. | 2.7 | % | ||
2. Aryzta AG | 2.6 | |||
3. Compass Group PLC | 2.4 | |||
4. Haci Omer Sabanci Holdings A.S. | 2.3 | |||
5. TGS Nopec Geophysical Co. A.S.A. | 2.2 | |||
6. Prosafe S.E. | 2.2 | |||
7. SAP AG | 2.2 | |||
8. Reed Elsevier PLC | 2.0 | |||
9. Dufry AG | 2.0 | |||
10. Informa PLC | 1.9 |
Top Five Countries*
1. United Kingdom | 32.5 | % | ||
2. Switzerland | 12.1 | |||
3. Germany | 8.0 | |||
4. Sweden | 5.9 | |||
5. France | 4.5 |
Total Net Assets | $ | 860.3 million | ||
Total Number of Holdings* | 71 | |||
The Fund’s holdings are subject to change, and there is no assurance that the Fund will continue to hold any particular security.
*Excluding money market fund holdings.
4 Invesco European Growth Fund
nificant underweight exposure to this strongly performing sector. Elsewhere, stock selection in the industrials sector detracted from relative performance, as did the Fund’s high single-digit cash exposure for most of the reporting period.
In broad geographic terms, the Fund benefited most significantly from strong outperformance in the UK, the largest country allocation in the portfolio. Within the UK, the largest contributors to Fund performance included Amlin, a British insurance and reinsurance company, and Compass Group, a global leader in food-service management and support services. Among the smaller markets in the region, the Fund’s exposure to Turkey was another area of strong outperformance, with Tupras-Turkiye Petrol Rafinerileri, the country’s dominant oil refiner, being a leading contributor.
Global brewing company Anheuser-Busch InBev was the largest individual contributor to Fund performance over the reporting period. The company performed well and, during the latter part of the reporting period, agreed to buy the remaining 50% stake of Mexican brewer Grupo Modelo that it did not already own. This transaction consolidates the company’s position in the Americas, provides opportunities for the company to execute its best-in-class cost management program, and adds Corona to its portfolio of global brands.
In contrast, relative gains were modestly offset by the negative impact of stock selection in France, Sweden and Russia. Key detractors included Chemring, a British defense company, and HomeServe, a UK-based emergency home repair provider. Chemring fell sharply toward the end of the reporting period in response to an aborted take-over bid and fear about further defense spending cuts in both the UK and the US. HomeServe faced increased regulatory risk regarding its selling practices in the UK. Although discussions between the company and the British Financial Services Authority (FSA) have been constructive, the FSA’s aggressive approach in similar situations has increased uncertainty about marketing-based business models in the UK.
As mentioned above, stock selection in the portfolio is driven by the underlying fundamentals of each individual company, not by any top-down macroeconomic views. This focus on bottom-up, stock selection is the key driver of the portfolio’s overall profile. The Fund ended the reporting period with over-
weight exposure (relative to the Fund’s style-specific benchmark) in the consumer discretionary, financials, energy, industrials, information technology and utilities sectors. The Fund had underweight exposure in the consumer staples, materials, health care and telecommunication services sectors.
Over the reporting period, the Fund provided double-digit returns at NAV. While we are pleased to provide shareholders with this performance, it would be imprudent for us to suggest that such a level of return is sustainable over the long term. With market volatility likely to continue for some time, our focus remains on ensuring that our portfolio is comprised of high-quality, reasonably valued companies capable of sustained earnings growth. We believe that this balanced EQV-focused approach may help deliver attractive returns over the long term.
We thank you for your continued investment in Invesco European Growth Fund.
The views and opinions expressed in management’s discussion of Fund performance are those of Invesco Advisers, Inc. These views and opinions are subject to change at any time based on factors such as market and economic conditions. These views and opinions may not be relied upon as investment advice or recommendations, or as an offer for a particular security. The information is not a complete analysis of every aspect of any market, country, industry, security or the Fund. Statements of fact are from sources considered reliable, but Invesco Advisers, Inc. makes no representation or warranty as to their completeness or accuracy. Although historical performance is no guarantee of future results, these insights may help you understand our investment management philosophy.
See important Fund and, if applicable, index disclosures later in this report.
 | Jason Holzer Chartered Financial Analyst, portfolio manager, is lead manager of Invesco European Growth | |
| Fund with respect to the Fund’s small and mid-cap investments. He joined Invesco in 1996. Mr. Holzer earned a BA in quantitative economics and an MS in engineering economic systems from Stanford University. | ||
 | Clas Olsson Portfolio manager and chief investment officer of Invesco’s international growth investments team, is | |
| lead manager of Invesco European Growth Fund with respect to the Fund’s large-cap investments. He joined Invesco in 1994. Mr. Olsson became a commissioned officer at the Royal Swedish Naval Academy in 1988. He also earned a BBA from The University of Texas at Austin. | ||
 | Matthew Dennis Chartered Financial Analyst, portfolio manager, is manager of Invesco European Growth Fund. He | |
| joined Invesco in 2000. Mr. Dennis earned a BA in economics from The University of Texas at Austin and an MS in finance from Texas A&M University. | ||
 | Borge Endresen Chartered Financial Analyst, portfolio manager, is manager of Invesco European Growth Fund. He | |
| joined Invesco in 1999. Mr. Endresen earned a BS in finance from the University of Oregon and an MBA from The University of Texas at Austin. | ||
 | Richard Nield Chartered Financial Analyst, portfolio manager, is manager of Invesco European Growth Fund. He | |
| joined Invesco in 2000. Mr. Nield earned a Bachelor of Commerce degree in finance and international business from McGill University in Montreal. | ||
5 Invesco European Growth Fund
Your Fund’s Long-Term Performance
Results of a $10,000 Investment – Oldest Share Class(es)
Fund and index data from 10/31/02*
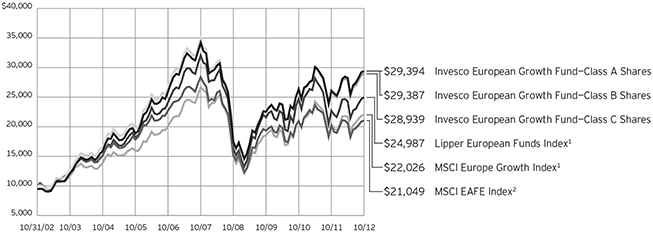
1 Source: Lipper Inc.
2 Source(s): Invesco, MSCI via FactSet Research Systems Inc.
| * | During the reporting period, Invesco changed its policy regarding growth of $10,000 charts. For funds older than 10 years, we previously showed performance since inception. Going forward, we will show performance for the most recent 10 years, since this more accurately reflects the experience of the typical shareholder. As a result, charts now may include benchmarks that did not appear previously, because the funds’ inception predated the benchmarks’ inception. Also, all charts will now be presented using a linear format. |
Past performance cannot guarantee comparable future results.
The data shown in the chart include reinvested distributions, applicable sales charges and Fund expenses including management fees. Results for Class B shares are calculated as if a hypothetical
shareholder had liquidated his entire investment in the Fund at the close of the reporting period and paid the contingent deferred sales charges, if applicable. Index results include reinvested dividends, but they do not reflect sales charges. Performance of the peer group,
if applicable, reflects fund expenses and management fees; performance of a market index does not. Performance shown in the chart and table(s) does not reflect deduction of taxes a shareholder would pay on Fund distributions or sale of Fund shares.
continued from page 8
| n | Synthetic securities risk. Fluctuations in the values of synthetic securities may not correlate perfectly with the instruments they are designed to replicate. Synthetic securities may be subject to interest rate changes, market price fluctuations, counterparty risk and liquidity risk. |
About indexes used in this report
| n | The MSCI EAFE® Index is an unmanaged index considered representative of stocks of Europe, Australasia and the Far East. |
| n | The MSCI Europe Growth Index is an unmanaged index considered representative of European growth stocks. |
| n | The Lipper European Funds Index is an unmanaged index considered representative of European funds tracked by Lipper. |
| n | The Fund is not managed to track the performance of any particular index, including the index(es) defined here, and consequently, the performance of the Fund may deviate significantly from the performance of the index(es). |
| n | A direct investment cannot be made in an index. Unless otherwise indicated, index results include reinvested dividends, and they do not reflect sales charges. Performance of the peer group, if applicable, reflects fund expenses; performance of a market index does not. |
Other information
| n | The returns shown in management’s discussion of Fund performance are based on net asset values calculated for shareholder transactions. Generally accepted accounting principles require adjustments to be made to the net |
assets of the Fund at period end for financial reporting purposes, and as such, the net asset values for shareholder transactions and the returns based on those net asset values may differ from the net asset values and returns reported in the Financial Highlights.
| n | Industry classifications used in this report are generally according to the Global Industry Classification Standard, which was developed by and is the exclusive property and a service mark of MSCI Inc. and Standard & Poor’s. |
6 Invesco European Growth Fund
Average Annual Total Returns
As of 10/31/12, including maximum applicable sales charges
Class A Shares | ||||
Inception (11/3/97) | 10.70 | % | ||
10 Years | 11.38 | |||
5 Years | -4.07 | |||
1 Year | 6.45 | |||
Class B Shares | ||||
Inception (11/3/97) | 10.71 | % | ||
10 Years | 11.38 | |||
5 Years | -4.01 | |||
1 Year | 6.84 | |||
Class C Shares | ||||
Inception (11/3/97) | 10.33 | % | ||
10 Years | 11.21 | |||
5 Years | -3.70 | |||
1 Year | 10.79 | |||
Class R Shares | ||||
Inception (6/3/02) | 9.55 | % | ||
10 Years | 11.77 | |||
5 Years | -3.21 | |||
1 Year | 12.36 | |||
Class Y Shares | ||||
10 Years | 12.14 | % | ||
5 Years | -2.77 | |||
1 Year | 12.96 | |||
Investor Class Shares | ||||
10 Years | 12.06 | % | ||
5 Years | -2.94 | |||
1 Year | 12.72 | |||
Performance includes litigation proceeds. Had these proceeds not been received, total returns would have been lower. |
| |||
Class Y shares incepted on October 3, 2008. Performance shown prior to that date is that of Class A shares and includes the 12b-1 fees applicable to Class A shares. Class A share performance reflects any applicable fee waivers or expense reimbursements.
Investor Class shares incepted on September 30, 2003. Performance shown prior to that date is that of Class A shares and includes the 12b-1 fees applicable to Class A shares. Class A share performance reflects any applicable fee waivers or expense reimbursements.
The performance data quoted represent past performance and cannot guarantee comparable future results; current performance may be lower or higher. Please visit invesco.com/performance for the most recent month-end performance.
Average Annual Total Returns
As of 9/30/12, the most recent calendar quarter-end, including maximum applicable sales charges
Class A Shares | ||||
Inception (11/3/97) | 10.71 | % | ||
10 Years | 11.90 | |||
5 Years | -3.32 | |||
1 Year | 15.53 | |||
Class B Shares | ||||
Inception (11/3/97) | 10.72 | % | ||
10 Years | 11.89 | |||
5 Years | -3.26 | |||
1 Year | 16.37 | |||
Class C Shares | ||||
Inception (11/3/97) | 10.35 | % | ||
10 Years | 11.72 | |||
5 Years | -2.95 | |||
1 Year | 20.30 | |||
Class R Shares | ||||
Inception (6/3/02) | 9.56 | % | ||
10 Years | 12.28 | |||
5 Years | -2.46 | |||
1 Year | 21.97 | |||
Class Y Shares | ||||
10 Years | 12.64 | % | ||
5 Years | -2.03 | |||
1 Year | 22.52 | |||
Investor Class Shares | ||||
10 Years | 12.57 | % | ||
5 Years | -2.19 | |||
1 Year | 22.30 | |||
Performance includes litigation proceeds. Had these proceeds not been received, total returns would have been lower. |
| |||
Performance figures reflect reinvested distributions, changes in net asset value and the effect of the maximum sales charge unless otherwise stated. Investment return and principal value will fluctuate so that you may have a gain or loss when you sell shares.
The total annual Fund operating expense ratio set forth in the most recent Fund prospectus as of the date of this report for Class A, Class B, Class C, Class R, Class Y and Investor Class shares was 1.45%, 2.20%, 2.20%, 1.70%, 1.20% and 1.39%, respectively. The expense ratios presented above may vary from the expense ratios presented in other sections of this report that are based on expenses incurred during the period covered by this report.
Class A share performance reflects the maximum 5.50% sales charge, and Class B and Class C share performance reflects the applicable contingent deferred sales charge (CDSC) for the period involved. The CDSC on Class B shares declines from 5% beginning at the time of purchase to 0% at the beginning of the seventh year. The CDSC on Class C shares is 1% for the first year after purchase. Class R shares, Class Y shares and Investor Class shares do not have a front-end sales charge or a CDSC; therefore, performance is at net asset value.
The performance of the Fund’s share classes will differ primarily due to different sales charge structures and class expenses.
7 Invesco European Growth Fund
Invesco European Growth Fund’s investment objective is long-term growth of capital.
| n | Unless otherwise stated, information presented in this report is as of October 31, 2012, and is based on total net assets. |
| n | Unless otherwise noted, all data provided by Invesco. |
| n | To access your Fund’s reports/prospectus, visit invesco.com/fundreports. |
About share classes
| n | Class B shares may not be purchased for new or additional investments. Please see the prospectus for more information. |
| n | Class R shares are generally available only to employee benefit plans. Please see the prospectus for more information. |
| n | Class Y shares are available only to certain investors. Please see the prospectus for more information. |
| n | Investor Class shares are closed to new investors. Contact your financial adviser about purchasing our other share classes. Please see the prospectus for more information. |
Principal risks of investing in the Fund
| n | Derivatives risk. The performance of derivative instruments is tied to the performance of an underlying currency, security, index or other instrument. In addition to risks relating to their underlying instruments, the use of derivatives may include other, possibly greater, risks. Derivatives involve costs, may be volatile, and may involve a small initial investment relative to the risk assumed. Risks associated with the use of derivatives include counterparty, leverage, correlation, liquidity, tax, market, interest rate and management risks. Derivatives may also be more difficult to purchase, sell or value than other investments. The Fund may lose more than the cash amount invested on investments in derivatives. |
Investors should bear in mind that, while the Fund intends to use derivative strategies, it is not obligated to actively engage in these transactions, generally or in any particular kind of derivative, if the investment manager elects not to do so due to availability, cost, market conditions or other factors.
| n | Developing/emerging markets securities risk. Securities issued by foreign companies and governments located in developing/emerging countries may be |
affected more negatively by inflation, devaluation of their currencies, higher transaction costs, delays in settlement, adverse political developments, the introduction of capital controls, withholding taxes, nationalization of private assets, expropriation, social unrest, war or lack of timely information than those in developed countries.
| n | Foreign securities risk. The Fund’s foreign investments may be affected by changes in a foreign country’s exchange rates; political and social instability; changes in economic or taxation policies; difficulties when enforcing obligations; decreased liquidity; and increased volatility. Foreign companies may be subject to less regulation resulting in less publicly available information about the companies. |
| n | Geographic focus risk. From time to time the Fund may invest a substantial amount of its assets in securities of issuers located in a single country or a limited number of countries. If the Fund focuses its investments in this manner, it assumes the risk that economic, political and social conditions in those countries will have a significant impact on its investment performance. The Fund’s investment performance may also be more volatile if it focuses its investments in certain countries, especially emerging market countries. |
| n | Growth investing risk. Growth stocks tend to be more expensive relative to their earnings or assets compared with other types of stock. As a result they tend to be more sensitive to changes in their earnings and can be more volatile. |
| n | Investing in the European Union risk. Many countries in the European Union are susceptible to high economic risks associated with high levels of debt, notably due to investments in sovereign debts of European countries such as Greece, Italy and Spain. One or more member states might exit the European Union, placing its currency and banking system in jeopardy. The European Union faces major issues involving its |
membership, structure, procedures and policies, including the adoption, abandonment or adjustment of the new constitutional treaty, the European Union’s enlargement to the south and east, and resolution of the European Union’s problematic fiscal and democratic accountability. Efforts of the member states to further unify their economic and monetary policies may increase the potential for the downward movement of one member state’s market to cause a similar effect on other member states’ markets. European countries that are part of the European Economic and Monetary Union may be significantly affected by the tight fiscal and monetary controls that the union seeks to impose on its members.
| n | Management risk. The investment techniques and risk analysis used by the Fund’s portfolio managers may not produce the desired results. |
| n | Market risk. The prices of and the income generated by the Fund’s securities may decline in response to, among other things, investor sentiment, general economic and market conditions, regional or global instability, and currency and interest rate fluctuations. |
| n | Small and mid-capitalization risk. Stocks of small and mid-sized companies tend to be more vulnerable to adverse developments in the above factors and may have little or no operating history or track record of success, and limited product lines, markets, management and financial resources. The securities of small and mid-sized companies may be more volatile due to less market interest and less publicly available information about the issuer. They also may be illiquid or restricted as to resale, or may trade less frequently and in smaller volumes, all of which may cause difficulty when establishing or closing a position at a desirable price. |
continued on page 6
This report must be accompanied or preceded by a currently effective Fund prospectus, which contains more complete information, including sales charges and expenses. Investors should read it carefully before investing.
| NOT FDIC INSURED | MAY LOSE VALUE | NO BANK GUARANTEE |
Fund Nasdaq Symbols | ||
Class A Shares | AEDAX | |
Class B Shares | AEDBX | |
Class C Shares | AEDCX | |
Class R Shares | AEDRX | |
Class Y Shares | AEDYX | |
Investor Class Shares | EGINX | |
8 Invesco European Growth Fund
Schedule of Investments
October 31, 2012
| Shares | Value | |||||||
Common Stocks & Other Equity Interests–88.05% |
| |||||||
Austria–0.98% |
| |||||||
Andritz AG | 139,582 | $ | 8,417,899 | |||||
Belgium–3.76% |
| |||||||
Anheuser-Busch InBev N.V. | 275,221 | 23,032,270 | ||||||
S.A. D’Ieteren N.V. | 193,095 | 9,334,898 | ||||||
| 32,367,168 | ||||||||
Denmark–0.95% |
| |||||||
Novo Nordisk A.S.–Class B | 50,768 | 8,150,252 | ||||||
France–4.46% |
| |||||||
Cap Gemini S.A. | 155,465 | 6,552,375 | ||||||
Faurecia | 292,393 | 4,414,467 | ||||||
Publicis Groupe S.A. | 167,071 | 9,014,065 | ||||||
SA des Ciments Vicat (Vicat) | 175,394 | 9,446,301 | ||||||
Schneider Electric S.A. | 142,965 | 8,955,176 | ||||||
| 38,382,384 | ||||||||
Germany–8.01% |
| |||||||
Brenntag AG | 40,878 | 5,151,172 | ||||||
Deutsche Boerse AG | 183,489 | 9,929,835 | ||||||
Fresenius Medical Care AG & Co. KGaA | 141,770 | 9,955,773 | ||||||
MorphoSys AG(a) | 167,944 | 5,702,132 | ||||||
SAP AG | 262,859 | 19,143,911 | ||||||
Volkswagen AG–Preference Shares | 67,453 | 13,951,010 | ||||||
Wirecard AG | 220,670 | 5,041,585 | ||||||
| 68,875,418 | ||||||||
Greece–0.55% |
| |||||||
Jumbo S.A.(a) | 716,646 | 4,736,378 | ||||||
Ireland–4.41% | ||||||||
DCC PLC | 494,412 | 14,097,201 | ||||||
Paddy Power PLC | 140,482 | 10,387,690 | ||||||
Shire PLC | 129,071 | 3,630,353 | ||||||
WPP PLC | 760,802 | 9,845,262 | ||||||
| 37,960,506 | ||||||||
Israel–0.91% |
| |||||||
Israel Chemicals Ltd. | 630,319 | 7,865,689 | ||||||
Italy–0.34% |
| |||||||
Ansaldo STS S.p.A. | 364,856 | 2,969,528 | ||||||
Netherlands–1.68% |
| |||||||
Aalberts Industries N.V. | 208,593 | 3,791,462 | ||||||
Unilever N.V. | 289,429 | 10,625,763 | ||||||
| 14,417,225 | ||||||||
| Shares | Value | |||||||
Norway–4.46% |
| |||||||
Prosafe S.E. | 2,304,988 | $ | 19,149,583 | |||||
TGS Nopec Geophysical Co. A.S.A. | 565,823 | 19,251,418 | ||||||
| 38,401,001 | ||||||||
Russia–0.63% |
| |||||||
Gazprom OAO–ADR | 595,285 | 5,462,154 | ||||||
Spain–1.45% |
| |||||||
Construcciones y Auxiliar de Ferrocarriles S.A. | 15,033 | 7,149,624 | ||||||
Prosegur Compania de Seguridad S.A. | 985,600 | 5,364,404 | ||||||
| 12,514,028 | ||||||||
Sweden–5.90% |
| |||||||
Intrum Justitia AB | 810,101 | 11,734,519 | ||||||
Investment AB Kinnevik–Class B | 444,861 | 8,516,113 | ||||||
Investor AB–Class B | 385,306 | 8,514,308 | ||||||
Swedbank AB–Class A | 485,173 | 8,993,080 | ||||||
Telefonaktiebolaget LM Ericsson–Class B | 651,005 | 5,755,158 | ||||||
Volvo AB–Class B | 538,379 | 7,259,011 | ||||||
| 50,772,189 | ||||||||
Switzerland–12.12% |
| |||||||
ABB Ltd.(a) | 450,012 | 8,130,621 | ||||||
Aryzta AG(a) | 449,957 | 22,495,134 | ||||||
Dufry AG(a) | 132,312 | 16,821,668 | ||||||
Julius Baer Group Ltd.(a) | 231,977 | 8,060,601 | ||||||
Nestle S.A. | 204,581 | 12,979,857 | ||||||
Novartis AG | 148,122 | 8,927,477 | ||||||
Roche Holding AG | 72,024 | 13,863,589 | ||||||
Syngenta AG | 33,130 | 12,964,623 | ||||||
| 104,243,570 | ||||||||
Turkey–3.56% |
| |||||||
Haci Omer Sabanci Holding A.S. | 3,826,299 | 20,193,466 | ||||||
Tupras-Turkiye Petrol Rafinerileri A.S. | 427,216 | 10,439,085 | ||||||
| 30,632,551 | ||||||||
United Arab Emirates–1.40% |
| |||||||
Dragon Oil PLC | 1,341,058 | 12,010,562 | ||||||
United Kingdom–32.48% | ||||||||
Amlin PLC | 2,260,983 | 13,649,157 | ||||||
Balfour Beatty PLC | 2,383,493 | 12,136,195 | ||||||
BG Group PLC | 710,158 | 13,175,628 | ||||||
British American Tobacco PLC | 321,997 | 15,976,166 | ||||||
British Sky Broadcasting Group PLC | 531,643 | 6,090,737 | ||||||
Bunzl PLC | 614,939 | 10,184,392 | ||||||
Catlin Group Ltd. | 832,634 | 6,341,673 | ||||||
Centrica PLC | 1,627,987 | 8,523,468 | ||||||
Chemring Group PLC | 1,447,825 | 7,329,146 | ||||||
Compass Group PLC | 1,911,736 | 21,006,608 | ||||||
See accompanying Notes to Financial Statements which are an integral part of the financial statements.
9 Invesco European Growth Fund
| Shares | Value | |||||||
United Kingdom–(continued) | ||||||||
Homeserve PLC | 2,134,883 | $ | 7,616,418 | |||||
IG Group Holdings PLC | 2,002,117 | 14,070,205 | ||||||
Imperial Tobacco Group PLC | 435,860 | 16,479,903 | ||||||
Informa PLC | 2,591,598 | 16,765,080 | ||||||
Kingfisher PLC | 2,008,908 | 9,402,272 | ||||||
Lancashire Holdings Ltd. | 697,863 | 9,733,024 | ||||||
Micro Focus International PLC | 1,169,442 | 10,846,826 | ||||||
Next PLC | 233,536 | 13,464,619 | ||||||
Reed Elsevier PLC | 1,741,689 | 17,063,473 | ||||||
Royal Dutch Shell PLC–Class B | 360,177 | 12,715,709 | ||||||
Smiths Group PLC | 491,182 | 8,385,397 | ||||||
UBM PLC | 603,966 | 6,817,466 | ||||||
| Shares | Value | |||||||
United Kingdom–(continued) | ||||||||
Ultra Electronics Holdings PLC | 504,333 | 13,778,348 | ||||||
William Hill PLC | 1,439,895 | 7,864,914 | ||||||
| 279,416,824 | ||||||||
Total Common Stocks & Other Equity Interests |
| 757,595,326 | ||||||
Money Market Funds–11.79% | ||||||||
Liquid Assets Portfolio–Institutional Class(b) | 50,699,478 | 50,699,478 | ||||||
Premier Portfolio–Institutional | 50,699,478 | 50,699,478 | ||||||
Total Money Market Funds |
| 101,398,956 | ||||||
TOTAL INVESTMENTS–99.84% |
| 858,994,282 | ||||||
OTHER ASSETS LESS LIABILITIES–0.16% |
| 1,346,423 | ||||||
NET ASSETS–100.00% |
| $ | 860,340,705 | |||||
Investment Abbreviation:
| ADR | – American Depositary Receipt |
Notes to Schedule of Investments:
| (a) | Non-income producing security. |
| (b) | The money market fund and the Fund are affiliated by having the same investment adviser. |
See accompanying Notes to Financial Statements which are an integral part of the financial statements.
10 Invesco European Growth Fund
Statement of Assets and Liabilities
October 31, 2012
Assets: | ||||
Investments, at value (Cost $575,060,549) | $ | 757,595,326 | ||
Investments in affiliated money market funds, at value and cost | 101,398,956 | |||
Total investments, at value (Cost $676,459,505) | 858,994,282 | |||
Foreign currencies, at value (Cost $115,183) | 116,094 | |||
Receivable for: | ||||
Investments sold | 730,547 | |||
Fund shares sold | 1,177,155 | |||
Dividends | 2,984,263 | |||
Investment for trustee deferred compensation and retirement plans | 63,421 | |||
Other assets | 39,586 | |||
Total assets | 864,105,348 | |||
Liabilities: | ||||
Payable for: | ||||
Investments purchased | 1,040,641 | |||
Fund shares reacquired | 1,718,515 | |||
Accrued fees to affiliates | 610,221 | |||
Accrued other operating expenses | 197,676 | |||
Trustee deferred compensation and retirement plans | 197,590 | |||
Total liabilities | 3,764,643 | |||
Net assets applicable to shares outstanding | $ | 860,340,705 | ||
Net assets consist of: | ||||
Shares of beneficial interest | $ | 647,238,426 | ||
Undistributed net investment income | 14,866,400 | |||
Undistributed net realized gain | 15,709,862 | |||
Unrealized appreciation | 182,526,017 | |||
| $ | 860,340,705 | |||
Net Assets: | ||||
Class A | $ | 377,331,016 | ||
Class B | $ | 15,089,185 | ||
Class C | $ | 38,281,888 | ||
Class R | $ | 13,203,791 | ||
Class Y | $ | 260,859,916 | ||
Investor Class | $ | 155,574,909 | ||
Shares outstanding, $0.001 par value per share, |
| |||
Class A | 11,489,168 | |||
Class B | 488,731 | |||
Class C | 1,238,750 | |||
Class R | 403,404 | |||
Class Y | 7,925,236 | |||
Investor Class | 4,746,383 | |||
Class A: | ||||
Net asset value per share | $ | 32.84 | ||
Maximum offering price per share | ||||
(Net asset value of $32.84 ¸ 94.50%) | $ | 34.75 | ||
Class B: | ||||
Net asset value and offering price per share | $ | 30.87 | ||
Class C: | ||||
Net asset value and offering price per share | $ | 30.90 | ||
Class R: | ||||
Net asset value and offering price per share | $ | 32.73 | ||
Class Y: | ||||
Net asset value and offering price per share | $ | 32.92 | ||
Investor Class: | ||||
Net asset value and offering price per share | $ | 32.78 | ||
See accompanying Notes to Financial Statements which are an integral part of the financial statements.
11 Invesco European Growth Fund
Statement of Operations
For the year ended October 31, 2012
Investment income: | ||||
Dividends (net of foreign withholding taxes of $1,616,233) | $ | 27,065,335 | ||
Dividends from affiliated money market funds | 92,291 | |||
Total investment income | 27,157,626 | |||
Expenses: | ||||
Advisory fees | 7,236,202 | |||
Administrative services fees | 224,785 | |||
Custodian fees | 268,360 | |||
Distribution fees: | ||||
Class A | 883,365 | |||
Class B | 175,672 | |||
Class C | 377,390 | |||
Class R | 67,499 | |||
Investor Class | 289,348 | |||
Transfer agent fees | 1,700,291 | |||
Trustees’ and officers’ fees and benefits | 67,467 | |||
Other | 286,993 | |||
Total expenses | 11,577,372 | |||
Less: Fees waived and expense offset arrangement(s) | (90,263 | ) | ||
Net expenses | 11,487,109 | |||
Net investment income | 15,670,517 | |||
Realized and unrealized gain (loss) from: | ||||
Net realized gain (loss) from: | ||||
Investment securities | 43,395,911 | |||
Foreign currencies | (338,382 | ) | ||
| 43,057,529 | ||||
Change in net unrealized appreciation (depreciation) of: | ||||
Investment securities | 34,698,701 | |||
Foreign currencies | (97,371 | ) | ||
| 34,601,330 | ||||
Net realized and unrealized gain | 77,658,859 | |||
Net increase in net assets resulting from operations | $ | 93,329,376 | ||
See accompanying Notes to Financial Statements which are an integral part of the financial statements.
12 Invesco European Growth Fund
Statement of Changes in Net Assets
For the years ended October 31, 2012 and 2011
| 2012 | 2011 | |||||||
Operations: | ||||||||
Net investment income | $ | 15,670,517 | $ | 16,759,973 | ||||
Net realized gain | 43,057,529 | 25,787,812 | ||||||
Change in net unrealized appreciation (depreciation) | 34,601,330 | (52,114,552 | ) | |||||
Net increase (decrease) in net assets resulting from operations | 93,329,376 | (9,566,767 | ) | |||||
Distributions to shareholders from net investment income: | ||||||||
Class A | (11,239,209 | ) | (5,034,945 | ) | ||||
Class B | (459,400 | ) | (144,732 | ) | ||||
Class C | (883,408 | ) | (253,785 | ) | ||||
Class R | (411,620 | ) | (166,534 | ) | ||||
Class Y | (7,626,755 | ) | (2,800,684 | ) | ||||
Investor Class | (4,892,756 | ) | (2,105,390 | ) | ||||
Total distributions from net investment income | (25,513,148 | ) | (10,506,070 | ) | ||||
Share transactions–net: | ||||||||
Class A | (15,931,363 | ) | (61,449,648 | ) | ||||
Class B | (7,474,488 | ) | (10,292,445 | ) | ||||
Class C | (6,007,219 | ) | (14,798,478 | ) | ||||
Class R | (2,777,150 | ) | (2,323,285 | ) | ||||
Class Y | 26,320,670 | 31,068,314 | ||||||
Investor Class | (11,292,427 | ) | (17,836,532 | ) | ||||
Net increase (decrease) in net assets resulting from share transactions | (17,161,977 | ) | (75,632,074 | ) | ||||
Net increase (decrease) in net assets | 50,654,251 | (95,704,911 | ) | |||||
Net assets: | ||||||||
Beginning of year | 809,686,454 | 905,391,365 | ||||||
End of year (includes undistributed net investment income of $14,866,400 and $22,275,648, respectively) | $ | 860,340,705 | $ | 809,686,454 | ||||
Notes to Financial Statements
October 31, 2012
NOTE 1—Significant Accounting Policies
Invesco European Growth Fund (the “Fund”) is a series portfolio of AIM International Mutual Funds (Invesco International Mutual Funds) (the “Trust”). The Trust is a Delaware statutory trust registered under the Investment Company Act of 1940, as amended (the “1940 Act”), as an open-end series management investment company consisting of eight separate portfolios, each authorized to issue an unlimited number of shares of beneficial interest. The assets, liabilities and operations of each portfolio are accounted for separately. Information presented in these financial statements pertains only to the Fund. Matters affecting each portfolio or class will be voted on exclusively by the shareholders of such portfolio or class.
The Fund’s investment objective is long-term growth of capital.
The Fund currently consists of six different classes of shares: Class A, Class B, Class C, Class R, Class Y and Investor Class. Investor Class shares of the Fund are offered only to certain grandfathered investors. Class A shares are sold with a front-end sales charge unless certain waiver criteria are met and under certain circumstances load waived shares may be subject to contingent deferred sales charges (“CDSC”). Class C shares are sold with a CDSC. Class R, Class Y and Investor Class shares are sold at net asset value. Effective November 30, 2010, new or additional investments in Class B shares are no longer permitted. Existing shareholders of Class B shares may continue to reinvest dividends and capital gains distributions in Class B shares until they convert to Class A shares. Also, shareholders in Class B shares will be able to exchange those shares for Class B shares of other Invesco Funds offering such shares until they convert to Class A shares. Generally, Class B shares will automatically convert to Class A shares on or about the month-end, which is at least eight years after the date of purchase. Redemption of Class B shares prior to the conversion date will be subject to a CDSC.
The following is a summary of the significant accounting policies followed by the Fund in the preparation of its financial statements.
| A. | Security Valuations — Securities, including restricted securities, are valued according to the following policy. |
A security listed or traded on an exchange (except convertible bonds) is valued at its last sales price or official closing price as of the close of the customary trading session on the exchange where the security is principally traded, or lacking any sales or official closing price on a particular day, the security may be valued at the closing bid price on that day. Securities traded in the over-the-counter market are valued based on prices furnished by independent pricing services or market makers. When such securities are valued by an independent pricing service they may be considered fair valued. Futures contracts are valued at the final settlement price set by an exchange on which they are principally traded. Listed
13 Invesco European Growth Fund
options are valued at the mean between the last bid and ask prices from the exchange on which they are principally traded. Options not listed on an exchange are valued by an independent source at the mean between the last bid and ask prices. For purposes of determining net asset value per share, futures and option contracts generally are valued 15 minutes after the close of the customary trading session of the New York Stock Exchange (“NYSE”).
Investments in open-end and closed-end registered investment companies that do not trade on an exchange are valued at the end of day net asset value per share. Investments in open-end and closed-end registered investment companies that trade on an exchange are valued at the last sales price or official closing price as of the close of the customary trading session on the exchange where the security is principally traded.
Debt obligations (including convertible bonds) and unlisted equities are fair valued using an evaluated quote provided by an independent pricing service. Evaluated quotes provided by the pricing service may be determined without exclusive reliance on quoted prices, and may reflect appropriate factors such as institution-size trading in similar groups of securities, developments related to specific securities, dividend rate, yield, quality, type of issue, coupon rate, maturity, individual trading characteristics and other market data. Debt securities are subject to interest rate and credit risks. In addition, all debt securities involve some risk of default with respect to interest and/or principal payments.
Foreign securities (including foreign exchange contracts) are converted into U.S. dollar amounts using the applicable exchange rates as of the close of the NYSE. If market quotations are available and reliable for foreign exchange traded equity securities, the securities will be valued at the market quotations. Because trading hours for certain foreign securities end before the close of the NYSE, closing market quotations may become unreliable. If between the time trading ends on a particular security and the close of the customary trading session on the NYSE, events occur that are significant and make the closing price unreliable, the Fund may fair value the security. If the event is likely to have affected the closing price of the security, the security will be valued at fair value in good faith using procedures approved by the Board of Trustees. Adjustments to closing prices to reflect fair value may also be based on a screening process of an independent pricing service to indicate the degree of certainty, based on historical data, that the closing price in the principal market where a foreign security trade is not the current value as of the close of the NYSE. Foreign securities meeting the approved degree of certainty that the price is not reflective of current value will be priced at the indication of fair value from the independent pricing service. Multiple factors may be considered by the independent pricing service in determining adjustments to reflect fair value and may include information relating to sector indices, American Depositary Receipts and domestic and foreign index futures. Foreign securities may have additional risks including exchange rate changes, potential for sharply devalued currencies and high inflation, political and economic upheaval, the relative lack of issuer information, relatively low market liquidity and the potential lack of strict financial and accounting controls and standards.
Securities for which market prices are not provided by any of the above methods may be valued based upon quotes furnished by independent sources. The last bid price may be used to value equity securities. The mean between the last bid and asked prices is used to value debt obligations, including corporate loans.
Securities for which market quotations are not readily available or are unreliable are valued at fair value as determined in good faith by or under the supervision of the Trust’s officers following procedures approved by the Board of Trustees. Issuer specific events, market trends, bid/ask quotes of brokers and information providers and other market data may be reviewed in the course of making a good faith determination of a security’s fair value.
Valuations change in response to many factors including the historical and prospective earnings of the issuer, the value of the issuer’s assets, general economic conditions, interest rates, investor perceptions and market liquidity. Because of the inherent uncertainties of valuation, the values reflected in the financial statements may materially differ from the value received upon actual sale of those investments.
| B. | Securities Transactions and Investment Income — Securities transactions are accounted for on a trade date basis. Realized gains or losses on sales are computed on the basis of specific identification of the securities sold. Interest income is recorded on the accrual basis from settlement date. Dividend income (net of withholding tax, if any) is recorded on the ex-dividend date. |
The Fund may periodically participate in litigation related to Fund investments. As such, the Fund may receive proceeds from litigation settlements. Any proceeds received are included in the Statement of Operations as realized gain (loss) for investments no longer held and as unrealized gain (loss) for investments still held.
Brokerage commissions and mark ups are considered transaction costs and are recorded as an increase to the cost basis of securities purchased and/or a reduction of proceeds on a sale of securities. Such transaction costs are included in the determination of net realized and unrealized gain (loss) from investment securities reported in the Statement of Operations and the Statement of Changes in Net Assets and the net realized and unrealized gains (losses) on securities per share in the Financial Highlights. Transaction costs are included in the calculation of the Fund’s net asset value and, accordingly, they reduce the Fund’s total returns. These transaction costs are not considered operating expenses and are not reflected in net investment income reported in the Statement of Operations and Statement of Changes in Net Assets, or the net investment income per share and ratios of expenses and net investment income reported in the Financial Highlights, nor are they limited by any expense limitation arrangements between the Fund and the investment adviser.
The Fund allocates income and realized and unrealized capital gains and losses to a class based on the relative net assets of each class.
| C. | Country Determination — For the purposes of making investment selection decisions and presentation in the Schedule of Investments, the investment adviser may determine the country in which an issuer is located and/or credit risk exposure based on various factors. These factors include the laws of the country under which the issuer is organized, where the issuer maintains a principal office, the country in which the issuer derives 50% or more of its total revenues and the country that has the primary market for the issuer’s securities, as well as other criteria. Among the other criteria that may be evaluated for making this determination are the country in which the issuer maintains 50% or more of its assets, the type of security, financial guarantees and enhancements, the nature of the collateral and the sponsor organization. Country of issuer and/or credit risk exposure has been determined to be the United States of America, unless otherwise noted. |
| D. | Distributions — Distributions from income and net realized capital gain, if any, are generally declared and paid annually and recorded on the ex-dividend date. The Fund may elect to treat a portion of the proceeds from redemptions as distributions for federal income tax purposes. |
| E. | Federal Income Taxes — The Fund intends to comply with the requirements of Subchapter M of the Internal Revenue Code necessary to qualify as a regulated investment company and to distribute substantially all of the Fund’s taxable earnings to shareholders. As such, the Fund will not be subject to federal income taxes on otherwise taxable income (including net realized capital gain) that is distributed to shareholders. Therefore, no provision for federal income taxes is recorded in the financial statements. |
14 Invesco European Growth Fund
The Fund files tax returns in the U.S. Federal jurisdiction and certain other jurisdictions. Generally, the Fund is subject to examinations by such taxing authorities for up to three years after the filing of the return for the tax period.
| F. | Expenses — Fees provided for under the Rule 12b-1 plan of a particular class of the Fund and which are directly attributable to that class are charged to the operations of such class. All other expenses are allocated among the classes based on relative net assets. |
| G. | Accounting Estimates — The preparation of financial statements in conformity with accounting principles generally accepted in the United States of America (“GAAP”) requires management to make estimates and assumptions that affect the reported amounts of assets and liabilities at the date of the financial statements and the reported amounts of revenues and expenses during the reporting period including estimates and assumptions related to taxation. Actual results could differ from those estimates by a significant amount. In addition, the Fund monitors for material events or transactions that may occur or become known after the period-end date and before the date the financial statements are released to print. |
| H. | Indemnifications — Under the Trust’s organizational documents, each Trustee, officer, employee or other agent of the Trust is indemnified against certain liabilities that may arise out of the performance of their duties to the Fund. Additionally, in the normal course of business, the Fund enters into contracts, including the Fund’s servicing agreements, that contain a variety of indemnification clauses. The Fund’s maximum exposure under these arrangements is unknown as this would involve future claims that may be made against the Fund that have not yet occurred. The risk of material loss as a result of such indemnification claims is considered remote. |
| I. | Redemption Fees — The Fund had a 2% redemption fee that was retained by the Fund to offset transaction costs and other expenses associated with short-term redemptions and exchanges. The fee, subject to certain exceptions, was imposed on certain redemptions or exchanges of shares within 31 days of purchase. The redemption fee was recorded as an increase in shareholder capital and was allocated among the share classes based on the relative net assets of each class. Effective January 1, 2012, the Fund eliminated the 2% redemption fee assessed on shares of the Fund redeemed or exchanged within 31 days of purchase. |
| J. | Foreign Currency Translations — Foreign currency is valued at the close of the NYSE based on quotations posted by banks and major currency dealers. Portfolio securities and other assets and liabilities denominated in foreign currencies are translated into U.S. dollar amounts at date of valuation. Purchases and sales of portfolio securities (net of foreign taxes withheld on disposition) and income items denominated in foreign currencies are translated into U.S. dollar amounts on the respective dates of such transactions. The Fund does not separately account for the portion of the results of operations resulting from changes in foreign exchange rates on investments and the fluctuations arising from changes in market prices of securities held. The combined results of changes in foreign exchange rates and the fluctuation of market prices on investments (net of estimated foreign tax withholding) are included with the net realized and unrealized gain or loss from investments in the Statement of Operations. Reported net realized foreign currency gains or losses arise from (1) sales of foreign currencies, (2) currency gains or losses realized between the trade and settlement dates on securities transactions, and (3) the difference between the amounts of dividends, interest, and foreign withholding taxes recorded on the Fund’s books and the U.S. dollar equivalent of the amounts actually received or paid. Net unrealized foreign currency gains and losses arise from changes in the fair values of assets and liabilities, other than investments in securities at fiscal period end, resulting from changes in exchange rates. |
The Fund may invest in foreign securities which may be subject to foreign taxes on income, gains on investments or currency repatriation, a portion of which may be recoverable.
| K. | Foreign Currency Contracts — The Fund may enter into foreign currency contracts to manage or minimize currency or exchange rate risk. The Fund may also enter into foreign currency contracts for the purchase or sale of a security denominated in a foreign currency in order to “lock in” the U.S. dollar price of that security. A foreign currency contract is an obligation to purchase or sell a specific currency for an agreed-upon price at a future date. The use of foreign currency contracts does not eliminate fluctuations in the price of the underlying securities the Fund owns or intends to acquire but establishes a rate of exchange in advance. Fluctuations in the value of these contracts are measured by the difference in the contract date and reporting date exchange rates and are recorded as unrealized appreciation (depreciation) until the contracts are closed. When the contracts are closed, realized gains (losses) are recorded. Realized and unrealized gains (losses) on the contracts are included in the Statement of Operations. The primary risks associated with foreign currency contracts include failure of the counterparty to meet the terms of the contract and the value of the foreign currency changing unfavorably. These risks may be in excess of the amounts reflected in the Statement of Assets and Liabilities. |
NOTE 2—Advisory Fees and Other Fees Paid to Affiliates
The Trust has entered into a master investment advisory agreement with Invesco Advisers, Inc. (the “Adviser” or “Invesco”). Under the terms of the investment advisory agreement, the Fund pays an advisory fee to the Adviser based on the annual rate of the Fund’s average daily net assets as follows:
| Average Daily Net Assets | Rate | |||||
First $250 million | 0 | .935% | ||||
Next $250 million | 0 | .91% | ||||
Next $500 million | 0 | .885% | ||||
Next $1.5 billion | 0 | .86% | ||||
Next $2.5 billion | 0 | .835% | ||||
Next $2.5 billion | 0 | .81% | ||||
Next $2.5 billion | 0 | .785% | ||||
Over $10 billion | 0 | .76% | ||||
15 Invesco European Growth Fund
Under the terms of a master sub-advisory agreement between the Adviser and each of Invesco Asset Management Deutschland GmbH, Invesco Asset Management Limited, Invesco Asset Management (Japan) Limited, Invesco Australia Limited, Invesco Hong Kong Limited, Invesco Senior Secured Management, Inc. and Invesco Canada Ltd. (collectively, the “Affiliated Sub-Advisers”) the Adviser, not the Fund, may pay 40% of the fees paid to the Adviser to any such Affiliated Sub-Adviser(s) that provide discretionary investment management services to the Fund based on the percentage of assets allocated to such Sub-Adviser(s).
The Adviser has contractually agreed, through at least June 30, 2013, to waive advisory fees and/or reimburse expenses of all shares to the extent necessary to limit total annual fund operating expenses after fee waiver and/or expense reimbursement (excluding certain items discussed below) of Class A, Class B, Class C, Class R, Class Y and Investor Class shares to 2.25%, 3.00%, 3.00%, 2.50%, 2.00% and 2.25%, respectively, of average daily net assets. In determining the Adviser’s obligation to waive advisory fees and/or reimburse expenses, the following expenses are not taken into account, and could cause the total annual fund operating expenses after fee waiver and/or expense reimbursement to exceed the numbers reflected above: (1) interest; (2) taxes; (3) dividend expense on short sales; (4) extraordinary or non-routine items, including litigation expenses; and (5) expenses that the Fund has incurred but did not actually pay because of an expense offset arrangement. Unless the Board of Trustees and Invesco mutually agree to amend or continue the fee waiver agreement, it will terminate on June 30, 2013. The Adviser did not waive fees and/or reimburse expenses during the period under this expense limitation.
The Adviser has contractually agreed, through at least June 30, 2013, to waive the advisory fee payable by the Fund in an amount equal to 100% of the net advisory fees the Adviser receives from the affiliated money market funds on investments by the Fund of uninvested cash in such affiliated money market funds.
For the year ended October 31, 2012, the Adviser waived advisory fees of $86,368.
The Trust has entered into a master administrative services agreement with Invesco pursuant to which the Fund has agreed to pay Invesco for certain administrative costs incurred in providing accounting services to the Fund. For the year ended October 31, 2012, expenses incurred under the agreement are shown in the Statement of Operations as Administrative services fees.
The Trust has entered into a transfer agency and service agreement with Invesco Investment Services, Inc. (“IIS”) pursuant to which the Fund has agreed to pay IIS a fee for providing transfer agency and shareholder services to the Fund and reimburse IIS for certain expenses incurred by IIS in the course of providing such services. IIS may make payments to intermediaries that provide omnibus account services, sub-accounting services and/or networking services. All fees payable by IIS to intermediaries that provide omnibus account services or sub-accounting are charged back to the Fund, subject to certain limitations approved by the Trust’s Board of Trustees. For the year ended October 31, 2012, expenses incurred under the agreement are shown in the Statement of Operations as Transfer agent fees.
The Trust has entered into master distribution agreements with Invesco Distributors, Inc. (“IDI”) to serve as the distributor for the Class A, Class B, Class C, Class R, Class Y and Investor Class shares of the Fund. The Trust has adopted plans pursuant to Rule 12b-1 under the 1940 Act with respect to the Fund’s Class A, Class B, Class C, Class R and Investor Class shares (collectively, the “Plans”). The Fund, pursuant to the Plans, pays IDI compensation at the annual rate of 0.25% of the Fund’s average daily net assets of Class A shares, 1.00% of the average daily net assets of Class B and Class C shares and 0.50% of the average daily net assets of Class R shares. The Fund, pursuant to the Investor Class Plan, reimburses IDI for its allocated share of expenses incurred pursuant to the Investor Class Plan for the period, up to a maximum annual rate of 0.25% of the average daily net assets of Investor Class shares. Of the Plan payments, up to 0.25% of the average daily net assets of each class of shares may be paid to furnish continuing personal shareholder services to customers who purchase and own shares of such classes. Any amounts not paid as a service fee under the Plans would constitute an asset-based sales charge. Rules of the Financial Industry Regulatory Authority (“FINRA”) impose a cap on the total sales charges, including asset-based sales charges, that may be paid by any class of shares of the Fund. For the year ended October 31, 2012, expenses incurred under the Plans are shown in the Statement of Operations as Distribution fees.
Front-end sales commissions and CDSC (collectively, the “sales charges”) are not recorded as expenses of the Fund. Front-end sales commissions are deducted from proceeds from the sales of Fund shares prior to investment in Class A shares of the Fund. CDSC are deducted from redemption proceeds prior to remittance to the shareholder. During the year ended October 31, 2012, IDI advised the Fund that IDI retained $25,635 in front-end sales commissions from the sale of Class A shares and $7, $30,400 and $1,110 from Class A, Class B and Class C shares, respectively, for CDSC imposed on redemptions by shareholders.
Certain officers and trustees of the Trust are officers and directors of the Adviser, IIS and/or IDI.
NOTE 3—Additional Valuation Information
GAAP defines fair value as the price that would be received to sell an asset or paid to transfer a liability in an orderly transaction between market participants at the measurement date, under current market conditions. GAAP establishes a hierarchy that prioritizes the inputs to valuation methods giving the highest priority to readily available unadjusted quoted prices in an active market for identical assets (Level 1) and the lowest priority to significant unobservable inputs (Level 3) generally when market prices are not readily available or are unreliable. Based on the valuation inputs, the securities or other investments are tiered into one of three levels. Changes in valuation methods may result in transfers in or out of an investment’s assigned level:
| Level 1 — | Prices are determined using quoted prices in an active market for identical assets. |
| Level 2 — | Prices are determined using other significant observable inputs. Observable inputs are inputs that other market participants may use in pricing a security. These may include quoted prices for similar securities, interest rates, prepayment speeds, credit risk, yield curves, loss severities, default rates, discount rates, volatilities and others. |
| Level 3 — | Prices are determined using significant unobservable inputs. In situations where quoted prices or observable inputs are unavailable (for example, when there is little or no market activity for an investment at the end of the period), unobservable inputs may be used. Unobservable inputs reflect the Fund’s own assumptions about the factors market participants would use in determining fair value of the securities or instruments and would be based on the best available information. |
The following is a summary of the tiered valuation input levels, as of October 31, 2012. The level assigned to the securities valuations may not be an indication of the risk or liquidity associated with investing in those securities. Because of the inherent uncertainties of valuation, the values reflected in the financial statements may materially differ from the value received upon actual sale of those investments.
16 Invesco European Growth Fund
During the year ended October 31, 2012, there were transfers from Level 1 to Level 2 of $34,607,809 and from Level 2 to Level 1 of $191,351,312, due to foreign fair value adjustments.
| Level 1 | Level 2 | Level 3 | Total | |||||||||||||
Austria | $ | — | $ | 8,417,899 | $ | — | $ | 8,417,899 | ||||||||
Belgium | 9,334,898 | 23,032,270 | — | 32,367,168 | ||||||||||||
Denmark | — | 8,150,252 | — | 8,150,252 | ||||||||||||
France | 9,446,301 | 28,936,083 | — | 38,382,384 | ||||||||||||
Germany | 68,875,418 | — | — | 68,875,418 | ||||||||||||
Greece | 4,736,378 | — | — | 4,736,378 | ||||||||||||
Ireland | 3,630,353 | 34,330,153 | — | 37,960,506 | ||||||||||||
Israel | — | 7,865,689 | — | 7,865,689 | ||||||||||||
Italy | — | 2,969,528 | — | 2,969,528 | ||||||||||||
Netherlands | 10,625,763 | 3,791,462 | — | 14,417,225 | ||||||||||||
Norway | 19,251,418 | 19,149,583 | — | 38,401,001 | ||||||||||||
Russia | — | 5,462,154 | — | 5,462,154 | ||||||||||||
Spain | 12,514,028 | — | — | 12,514,028 | ||||||||||||
Sweden | 8,993,080 | 41,779,109 | — | 50,772,189 | ||||||||||||
Switzerland | 12,979,857 | 91,263,713 | — | 104,243,570 | ||||||||||||
Turkey | 30,632,551 | — | — | 30,632,551 | ||||||||||||
United Arab Emirates | 12,010,562 | — | — | 12,010,562 | ||||||||||||
United Kingdom | 41,995,165 | 237,421,659 | — | 279,416,824 | ||||||||||||
United States | 101,398,956 | — | — | 101,398,956 | ||||||||||||
| $ | 346,424,728 | $ | 512,569,554 | $ | — | $ | 858,994,282 | |||||||||
NOTE 4—Expense Offset Arrangement(s)
The expense offset arrangement is comprised of transfer agency credits which result from balances in Demand Deposit Accounts (DDA) used by the transfer agent for clearing shareholder transactions. For the year ended October 31, 2012, the Fund received credits from this arrangement, which resulted in the reduction of the Fund’s total expenses of $3,895.
NOTE 5—Trustees’ and Officers’ Fees and Benefits
“Trustees’ and Officers’ Fees and Benefits” include amounts accrued by the Fund to pay remuneration to certain Trustees and Officers of the Fund. Trustees have the option to defer compensation payable by the Fund, and “Trustees’ and Officers’ Fees and Benefits” also include amounts accrued by the Fund to fund such deferred compensation amounts. Those Trustees who defer compensation have the option to select various Invesco Funds in which their deferral accounts shall be deemed to be invested. Finally, certain current Trustees are eligible to participate in a retirement plan that provides for benefits to be paid upon retirement to Trustees over a period of time based on the number of years of service. The Fund may have certain former Trustees who also participate in a retirement plan and receive benefits under such plan. “Trustees’ and Officers’ Fees and Benefits” include amounts accrued by the Fund to fund such retirement benefits. Obligations under the deferred compensation and retirement plans represent unsecured claims against the general assets of the Fund.
NOTE 6—Cash Balances
The Fund is permitted to temporarily carry a negative or overdrawn balance in its account with State Street Bank and Trust Company, the custodian bank. Such balances, if any at period end, are shown in the Statement of Assets and Liabilities under the payable caption Amount due custodian. To compensate the custodian bank for such overdrafts, the overdrawn Fund may either (1) leave funds as a compensating balance in the account so the custodian bank can be compensated by earning the additional interest; or (2) compensate by paying the custodian bank at a rate agreed upon by the custodian bank and Invesco, not to exceed the contractually agreed upon rate.
17 Invesco European Growth Fund
NOTE 7—Distributions to Shareholders and Tax Components of Net Assets
Tax Character of Distributions to Shareholders Paid During the Years Ended October 31, 2012 and 2011:
| 2012 | 2011 | |||||||
Ordinary income | $ | 25,513,148 | $ | 10,506,070 | ||||
Tax Components of Net Assets at Period-End:
| 2012 | ||||
Undistributed ordinary income | $ | 15,703,646 | ||
Undistributed long-term gain | 15,907,316 | |||
Net unrealized appreciation — investments | 181,690,112 | |||
Net unrealized appreciation (depreciation) — other investments | (8,760 | ) | ||
Temporary book/tax differences | (190,035 | ) | ||
Shares of beneficial interest | 647,238,426 | |||
Total net assets | $ | 860,340,705 | ||
The difference between book-basis and tax-basis unrealized appreciation (depreciation) is due to differences in the timing of recognition of gains and losses on investments for tax and book purposes. The Fund’s net unrealized appreciation (depreciation) difference is attributable primarily to passive foreign investment companies and wash sales.
The temporary book/tax differences are a result of timing differences between book and tax recognition of income and/or expenses. The Fund’s temporary book/tax differences are the result of the trustee deferral of compensation and retirement plan benefits.
Capital loss carryforward is calculated and reported as of a specific date. Results of transactions and other activity after that date may affect the amount of capital loss carryforward actually available for the Fund to utilize. The Regulated Investment Company Modernization Act of 2010 (the “Act”) eliminated the eight-year carryover period for capital losses that arise in taxable years beginning after its enactment date of December 22, 2010. Consequently, these capital losses can be carried forward for an unlimited period. However, capital losses with an expiration period may not be used to offset capital gains until all net capital losses without an expiration date have been utilized. Additionally, post-enactment capital loss carryovers will retain their character as either short-term or long-term capital losses instead of as short-term capital losses as under prior law. The ability to utilize capital loss carryforward in the future may be limited under the Internal Revenue Code and related regulations based on the results of future transactions.
The Fund utilized $24,716,831 of capital loss carryforward in the current period to offset net realized capital gain for federal income tax purposes. The Fund does not have a capital loss carryforward as of October 31, 2012.
NOTE 8—Investment Securities
The aggregate amount of investment securities (other than short-term securities, U.S. Treasury obligations and money market funds, if any) purchased and sold by the Fund during the year ended October 31, 2012 was $105,668,128 and $192,533,979, respectively. Cost of investments on a tax basis includes the adjustments for financial reporting purposes as of the most recently completed federal income tax reporting period-end.
| Unrealized Appreciation (Depreciation) of Investment Securities on a Tax Basis | ||||
Aggregate unrealized appreciation of investment securities | $ | 217,744,648 | ||
Aggregate unrealized (depreciation) of investment securities | (36,054,536 | ) | ||
Net unrealized appreciation of investment securities | $ | 181,690,112 | ||
Cost of investments for tax purposes is $677,304,170.
NOTE 9—Reclassification of Permanent Differences
Primarily as a result of differing book/tax treatment of fair fund settlements and foreign currency transactions, on October 31, 2012, undistributed net investment income was increased by $2,433,383 and undistributed net realized gain was decreased by $2,433,383. This reclassification had no effect on the net assets of the Fund.
18 Invesco European Growth Fund
NOTE 10—Share Information
| Summary of Share Activity | ||||||||||||||||
| Years ended October 31, | ||||||||||||||||
| 2012(a) | 2011 | |||||||||||||||
| Shares | Amount | Shares | Amount | |||||||||||||
Sold: | ||||||||||||||||
Class A | 1,667,254 | $ | 52,045,582 | 883,072 | $ | 27,902,997 | ||||||||||
Class B | 8,002 | 226,660 | 27,790 | 832,775 | ||||||||||||
Class C | 131,641 | 3,886,628 | 106,525 | 3,115,796 | ||||||||||||
Class R | 121,098 | 3,709,154 | 135,473 | 4,262,417 | ||||||||||||
Class Y | 2,643,233 | 80,565,699 | 3,120,034 | 98,847,706 | ||||||||||||
Investor Class | 288,800 | 8,904,572 | 191,023 | 5,976,110 | ||||||||||||
Issued as reinvestment of dividends: | ||||||||||||||||
Class A | 357,870 | 10,163,502 | 159,206 | 4,809,610 | ||||||||||||
Class B | 16,360 | 439,761 | 4,949 | 141,239 | ||||||||||||
Class C | 28,397 | 764,153 | 8,294 | 236,949 | ||||||||||||
Class R | 14,430 | 409,395 | 5,495 | 165,684 | ||||||||||||
Class Y | 260,086 | 7,386,427 | 90,823 | 2,746,476 | ||||||||||||
Investor Class | 165,958 | 4,701,609 | 68,022 | 2,050,194 | ||||||||||||
Automatic conversion of Class B shares to Class A shares: | ||||||||||||||||
Class A | 112,206 | 3,417,979 | 155,232 | 4,903,561 | ||||||||||||
Class B | (118,999 | ) | (3,417,979 | ) | (164,909 | ) | (4,903,561 | ) | ||||||||
Reacquired:(b) | ||||||||||||||||
Class A | (2,694,743 | ) | (81,558,426 | ) | (3,213,924 | ) | (99,065,816 | ) | ||||||||
Class B | (165,750 | ) | (4,722,930 | ) | (217,027 | ) | (6,362,898 | ) | ||||||||
Class C | (373,019 | ) | (10,658,000 | ) | (619,520 | ) | (18,151,223 | ) | ||||||||
Class R | (229,222 | ) | (6,895,699 | ) | (216,755 | ) | (6,751,386 | ) | ||||||||
Class Y | (2,116,547 | ) | (61,631,456 | ) | (2,251,650 | ) | (70,525,868 | ) | ||||||||
Investor Class | (825,387 | ) | (24,898,608 | ) | (834,210 | ) | (25,862,836 | ) | ||||||||
Net increase (decrease) in share activity | (708,332 | ) | $ | (17,161,977 | ) | (2,562,057 | ) | $ | (75,632,074 | ) | ||||||
| (a) | There are entities that are record owners of more than 5% of the outstanding shares of the Fund and in the aggregate own 32% of the outstanding shares of the Fund. IDI has an agreement with these entities to sell Fund shares. The Fund, Invesco and/or Invesco affiliates may make payments to these entities, which are considered to be related to the Fund, for providing services to the Fund, Invesco and/or Invesco affiliates including but not limited to services such as securities brokerage, distribution, third party record keeping and account servicing. The Fund has no knowledge as to whether all or any portion of the shares owned of record by these entities are also owned beneficially. |
| (b) | Net of redemption fees of $618 and $9,871 allocated among the classes based on relative net assets of each class for the years ended October 31, 2012 and 2011, respectively. |
19 Invesco European Growth Fund
NOTE 11—Financial Highlights
The following schedule presents financial highlights for a share of the Fund outstanding throughout the periods indicated.
| Net asset value, beginning of period | Net investment income(a) | Net gains (losses) on securities (both realized and unrealized) | Total from investment operations | Dividends from net investment income | Distributions from net realized gains | Total distributions | Net asset value, end of period(b) | Total return(c) | Net assets, end of period (000’s omitted) | Ratio of expenses to average net assets with fee waivers and/or expenses absorbed | Ratio of expenses to average net assets without fee waivers and/or expenses absorbed | Ratio of net investment income to average net assets | Portfolio turnover(d) | |||||||||||||||||||||||||||||||||||||||||||
Class A | ||||||||||||||||||||||||||||||||||||||||||||||||||||||||
Year ended 10/31/12 | $ | 30.13 | $ | 0.59 | $ | 3.07 | (e) | $ | 3.66 | $ | (0.95 | ) | $ | — | $ | (0.95 | ) | $ | 32.84 | 12.64 | %(e) | $ | 377,331 | 1.47 | %(f) | 1.48 | %(f) | 1.94 | %(f) | 14 | % | |||||||||||||||||||||||||
Year ended 10/31/11 | 30.81 | 0.58 | (0.89 | )(e) | (0.31 | ) | (0.37 | ) | — | (0.37 | ) | 30.13 | (1.02 | )(e) | 362,913 | 1.44 | 1.45 | 1.84 | 21 | |||||||||||||||||||||||||||||||||||||
Year ended 10/31/10 | 26.66 | 0.29 | 4.23 | 4.52 | (0.37 | ) | — | (0.37 | ) | 30.81 | 17.12 | 433,347 | 1.50 | 1.51 | 1.07 | 25 | ||||||||||||||||||||||||||||||||||||||||
Year ended 10/31/09 | 22.86 | 0.32 | 5.64 | 5.96 | (0.78 | ) | (1.38 | ) | (2.16 | ) | 26.66 | 29.54 | 443,525 | 1.64 | 1.65 | 1.48 | 21 | |||||||||||||||||||||||||||||||||||||||
Year ended 10/31/08 | 49.22 | 0.63 | (23.02 | ) | (22.39 | ) | (0.58 | ) | (3.39 | ) | (3.97 | ) | 22.86 | (49.17 | ) | 426,609 | 1.49 | 1.50 | 1.66 | 18 | ||||||||||||||||||||||||||||||||||||
Class B | ||||||||||||||||||||||||||||||||||||||||||||||||||||||||
Year ended 10/31/12 | 28.27 | 0.34 | 2.90 | (e) | 3.24 | (0.64 | ) | — | (0.64 | ) | 30.87 | 11.80 | (e) | 15,089 | 2.22 | (f) | 2.23 | (f) | 1.19 | (f) | 14 | |||||||||||||||||||||||||||||||||||
Year ended 10/31/11 | 28.92 | 0.32 | (0.84 | )(e) | (0.52 | ) | (0.13 | ) | — | (0.13 | ) | 28.27 | (1.78 | )(e) | 21,177 | 2.19 | 2.20 | 1.09 | 21 | |||||||||||||||||||||||||||||||||||||
Year ended 10/31/10 | 25.06 | 0.08 | 3.97 | 4.05 | (0.19 | ) | — | (0.19 | ) | 28.92 | 16.24 | 31,767 | 2.25 | 2.26 | 0.32 | 25 | ||||||||||||||||||||||||||||||||||||||||
Year ended 10/31/09 | 21.37 | 0.15 | 5.33 | 5.48 | (0.41 | ) | (1.38 | ) | (1.79 | ) | 25.06 | 28.60 | 39,459 | 2.39 | 2.40 | 0.73 | 21 | |||||||||||||||||||||||||||||||||||||||
Year ended 10/31/08 | 46.29 | 0.33 | (21.59 | ) | (21.26 | ) | (0.27 | ) | (3.39 | ) | (3.66 | ) | 21.37 | (49.56 | ) | 48,021 | 2.24 | 2.25 | 0.91 | 18 | ||||||||||||||||||||||||||||||||||||
Class C | ||||||||||||||||||||||||||||||||||||||||||||||||||||||||
Year ended 10/31/12 | 28.30 | 0.34 | 2.90 | (e) | 3.24 | (0.64 | ) | — | (0.64 | ) | 30.90 | 11.79 | (e) | 38,282 | 2.22 | (f) | 2.23 | (f) | 1.19 | (f) | 14 | |||||||||||||||||||||||||||||||||||
Year ended 10/31/11 | 28.95 | 0.32 | (0.84 | )(e) | (0.52 | ) | (0.13 | ) | — | (0.13 | ) | 28.30 | (1.78 | )(e) | 41,078 | 2.19 | 2.20 | 1.09 | 21 | |||||||||||||||||||||||||||||||||||||
Year ended 10/31/10 | 25.08 | 0.08 | 3.98 | 4.06 | (0.19 | ) | — | (0.19 | ) | 28.95 | 16.27 | 56,637 | 2.25 | 2.26 | 0.32 | 25 | ||||||||||||||||||||||||||||||||||||||||
Year ended 10/31/09 | 21.39 | 0.15 | 5.33 | 5.48 | (0.41 | ) | (1.38 | ) | (1.79 | ) | 25.08 | 28.57 | 59,971 | 2.39 | 2.40 | 0.73 | 21 | |||||||||||||||||||||||||||||||||||||||
Year ended 10/31/08 | 46.31 | 0.33 | (21.59 | ) | (21.26 | ) | (0.27 | ) | (3.39 | ) | (3.66 | ) | 21.39 | (49.53 | ) | 65,252 | 2.24 | 2.25 | 0.91 | 18 | ||||||||||||||||||||||||||||||||||||
Class R | ||||||||||||||||||||||||||||||||||||||||||||||||||||||||
Year ended 10/31/12 | 30.00 | 0.51 | 3.07 | (e) | 3.58 | (0.85 | ) | — | (0.85 | ) | 32.73 | 12.36 | (e) | 13,204 | 1.72 | (f) | 1.73 | (f) | 1.69 | (f) | 14 | |||||||||||||||||||||||||||||||||||
Year ended 10/31/11 | 30.68 | 0.50 | (0.89 | )(e) | (0.39 | ) | (0.29 | ) | — | (0.29 | ) | 30.00 | (1.28 | )(e) | 14,911 | 1.69 | 1.70 | 1.59 | 21 | |||||||||||||||||||||||||||||||||||||
Year ended 10/31/10 | 26.56 | 0.22 | 4.21 | 4.43 | (0.31 | ) | — | (0.31 | ) | 30.68 | 16.82 | 17,578 | 1.75 | 1.76 | 0.82 | 25 | ||||||||||||||||||||||||||||||||||||||||
Year ended 10/31/09 | 22.70 | 0.27 | 5.63 | 5.90 | (0.66 | ) | (1.38 | ) | (2.04 | ) | 26.56 | 29.24 | 16,933 | 1.89 | 1.90 | 1.23 | 21 | |||||||||||||||||||||||||||||||||||||||
Year ended 10/31/08 | 48.90 | 0.53 | (22.86 | ) | (22.33 | ) | (0.48 | ) | (3.39 | ) | (3.87 | ) | 22.70 | (49.28 | ) | 14,030 | 1.74 | 1.75 | 1.41 | 18 | ||||||||||||||||||||||||||||||||||||
Class Y | ||||||||||||||||||||||||||||||||||||||||||||||||||||||||
Year ended 10/31/12 | 30.22 | 0.67 | 3.08 | (e) | 3.75 | (1.05 | ) | — | (1.05 | ) | 32.92 | 12.96 | (e) | 260,860 | 1.22 | (f) | 1.23 | (f) | 2.19 | (f) | 14 | |||||||||||||||||||||||||||||||||||
Year ended 10/31/11 | 30.91 | 0.66 | (0.91 | )(e) | (0.25 | ) | (0.44 | ) | — | (0.44 | ) | 30.22 | (0.80 | )(e) | 215,716 | 1.19 | 1.20 | 2.09 | 21 | |||||||||||||||||||||||||||||||||||||
Year ended 10/31/10 | 26.73 | 0.36 | 4.25 | 4.61 | (0.43 | ) | — | (0.43 | ) | 30.91 | 17.44 | 190,994 | 1.25 | 1.26 | 1.32 | 25 | ||||||||||||||||||||||||||||||||||||||||
Year ended 10/31/09 | 22.87 | 0.42 | 5.61 | 6.03 | (0.79 | ) | (1.38 | ) | (2.17 | ) | 26.73 | 29.84 | 84,793 | 1.39 | 1.40 | 1.73 | 21 | |||||||||||||||||||||||||||||||||||||||
Year ended 10/31/08(g) | 28.09 | 0.03 | (5.25 | ) | (5.22 | ) | — | — | — | 22.87 | (18.58 | ) | 5,177 | 1.34 | (h) | 1.35 | (h) | 1.81 | (h) | 18 | ||||||||||||||||||||||||||||||||||||
Investor Class | ||||||||||||||||||||||||||||||||||||||||||||||||||||||||
Year ended 10/31/12 | 30.07 | 0.61 | 3.07 | (e) | 3.68 | (0.97 | ) | — | (0.97 | ) | 32.78 | 12.75 | (e) | 155,575 | 1.41 | (f) | 1.42 | (f) | 2.00 | (f) | 14 | |||||||||||||||||||||||||||||||||||
Year ended 10/31/11 | 30.76 | 0.60 | (0.92 | )(e) | (0.32 | ) | (0.37 | ) | — | (0.37 | ) | 30.07 | (1.03 | )(e) | 153,892 | 1.38 | 1.39 | 1.90 | 21 | |||||||||||||||||||||||||||||||||||||
Year ended 10/31/10 | 26.61 | 0.30 | 4.22 | 4.52 | (0.37 | ) | — | (0.37 | ) | 30.76 | 17.16 | 175,069 | 1.47 | 1.48 | 1.10 | 25 | ||||||||||||||||||||||||||||||||||||||||
Year ended 10/31/09 | 22.83 | 0.32 | 5.64 | 5.96 | (0.80 | ) | (1.38 | ) | (2.18 | ) | 26.61 | 29.58 | 178,106 | 1.64 | 1.65 | 1.48 | 21 | |||||||||||||||||||||||||||||||||||||||
Year ended 10/31/08 | 49.14 | 0.64 | (22.98 | ) | (22.34 | ) | (0.58 | ) | (3.39 | ) | (3.97 | ) | 22.83 | (49.14 | ) | 155,205 | 1.47 | 1.48 | 1.69 | 18 | ||||||||||||||||||||||||||||||||||||
| (a) | Calculated using average shares outstanding. |
| (b) | Includes redemption fees added to shares of beneficial interest which were less than $0.005 per share. |
| (c) | Includes adjustments in accordance with accounting principles generally accepted in the United States of America and as such, the net asset value for financial reporting purposes and the returns based upon those net asset values may differ from the net asset value and returns for shareholder transactions. Does not include sales charges and is not annualized for periods less than one year, if applicable. |
| (d) | Portfolio turnover is calculated at the fund level and is not annualized for periods less than one year, if applicable. |
| (e) | Includes litigation proceeds received during the period. Had the litigation proceeds not been received, Net gains (losses) on securities (both realized and unrealized) per share, for the year ended October 31, 2012, would have been $2.96, $2.79, $2.79, $2.95, $2.97 and $2.96 for Class A, Class B, Class C, Class R, Class Y and Investor Class shares, respectively and total return would have been lower. Net gains (losses) on securities (both realized and unrealized) per share, for the year ended October 31, 2011, would have been $(1.11), $(1.06), $(1.06), $(1.11), $(1.13) and $(1.14) for Class A, Class B, Class C, Class R, Class Y and Investor Class shares, respectively, and total returns would have been lower. |
| (f) | Ratios are based on average daily net assets (000’s omitted) of $353,346, $17,567, $37,739, $13,500, $224,339 and $149,972 for Class A, Class B, Class C, Class R, Class Y and Investor Class shares, respectively. |
| (g) | Commencement date of October 03, 2008. |
| (h) | Annualized. |
20 Invesco European Growth Fund
Report of Independent Registered Public Accounting Firm
To the Board of Trustees of AIM International Mutual Funds (Invesco International Mutual Funds)
and Shareholders of Invesco European Growth Fund:
In our opinion, the accompanying statement of assets and liabilities, including the schedule of investments, and the related statements of operations and of changes in net assets and the financial highlights present fairly, in all material respects, the financial position of Invesco European Growth Fund (one of the funds constituting AIM International Mutual Funds (Invesco International Mutual Funds), hereafter referred to as the “Fund”) at October 31, 2012, the results of its operations for the year then ended, the changes in its net assets for each of the two years in the period then ended and the financial highlights for each of the five years in the period then ended, in conformity with accounting principles generally accepted in the United States of America. These financial statements and financial highlights (hereafter referred to as “financial statements”) are the responsibility of the Fund’s management; our responsibility is to express an opinion on these financial statements based on our audits. We conducted our audits of these financial statements in accordance with the standards of the Public Company Accounting Oversight Board (United States). Those standards require that we plan and perform the audit to obtain reasonable assurance about whether the financial statements are free of material misstatement. An audit includes examining, on a test basis, evidence supporting the amounts and disclosures in the financial statements, assessing the accounting principles used and significant estimates made by management, and evaluating the overall financial statement presentation. We believe that our audits, which included confirmation of securities at October 31, 2012 by correspondence with the custodian and brokers, provide a reasonable basis for our opinion.
PRICEWATERHOUSECOOPERS LLP
December 21, 2012
Houston, Texas
21 Invesco European Growth Fund
Calculating your ongoing Fund expenses
Example
As a shareholder of the Fund, you incur two types of costs: (1) transaction costs, which may include sales charges (loads) on purchase payments or contingent deferred sales charges on redemptions, and redemption fees, if any; and (2) ongoing costs, including management fees, distribution and/or service (12b-1) fees, and other Fund expenses. This example is intended to help you understand your ongoing costs (in dollars) of investing in the Fund and to compare these costs with ongoing costs of investing in other mutual funds. The example is based on an investment of $1,000 invested at the beginning of the period and held for the entire period May 1, 2012 through October 31, 2012.
Actual expenses
The table below provides information about actual account values and actual expenses. You may use the information in this table, together with the amount you invested, to estimate the expenses that you paid over the period. Simply divide your account value by $1,000 (for example, an $8,600 account value divided by $1,000 = 8.6), then multiply the result by the number in the table under the heading entitled “Actual Expenses Paid During Period” to estimate the expenses you paid on your account during this period.
Hypothetical example for comparison purposes
The table below also provides information about hypothetical account values and hypothetical expenses based on the Fund’s actual expense ratio and an assumed rate of return of 5% per year before expenses, which is not the Fund’s actual return.
The hypothetical account values and expenses may not be used to estimate the actual ending account balance or expenses you paid for the period. You may use this information to compare the ongoing costs of investing in the Fund and other funds. To do so, compare this 5% hypothetical example with the 5% hypothetical examples that appear in the shareholder reports of the other funds.
Please note that the expenses shown in the table are meant to highlight your ongoing costs only and do not reflect any transaction costs, such as sales charges (loads) on purchase payments, contingent deferred sales charges on redemptions, and redemption fees, if any. Therefore, the hypothetical information is useful in comparing ongoing costs only, and will not help you determine the relative total costs of owning different funds. In addition, if these transaction costs were included, your costs would have been higher.
| Class | Beginning Account Value (05/01/12) | ACTUAL | HYPOTHETICAL (5% annual return before | Annualized Expense Ratio | ||||||||||||||||||||
| Ending Account Value (10/31/12)1 | Expenses Paid During Period2 | Ending Account Value (10/31/12) | Expenses Paid During Period2 | |||||||||||||||||||||
| A | $ | 1,000.00 | $ | 1,041.20 | $ | 7.59 | $ | 1,017.70 | $ | 7.51 | 1.48 | % | ||||||||||||
| B | 1,000.00 | 1,037.60 | 11.42 | 1,013.93 | 11.29 | 2.23 | ||||||||||||||||||
| C | 1,000.00 | 1,037.30 | 11.42 | 1,013.93 | 11.29 | 2.23 | ||||||||||||||||||
| R | 1,000.00 | 1,040.00 | 8.87 | 1,016.44 | 8.77 | 1.73 | ||||||||||||||||||
| Y | 1,000.00 | 1,042.80 | 6.32 | 1,018.95 | 6.24 | 1.23 | ||||||||||||||||||
| Investor | 1,000.00 | 1,041.90 | 7.03 | 1,018.25 | 6.95 | 1.37 | ||||||||||||||||||
| 1 | The actual ending account value is based on the actual total return of the Fund for the period May 1, 2012 through October 31, 2012, after actual expenses and will differ from the hypothetical ending account value which is based on the Fund’s expense ratio and a hypothetical annual return of 5% before expenses. |
| 2 | Expenses are equal to the Fund’s annualized expense ratio as indicated above multiplied by the average account value over the period, multiplied by 184/366 to reflect the most recent fiscal half year. |
22 Invesco European Growth Fund
Approval of Investment Advisory and Sub-Advisory Contracts
The Board of Trustees (the Board) of AIM International Mutual Funds (Invesco International Mutual Funds) is required under the Investment Company Act of 1940, as amended, to approve annually the renewal of the Invesco European Growth Fund (the Fund) investment advisory agreement with Invesco Advisers, Inc. (Invesco Advisers) and the Master Intergroup Sub-Advisory Contract for Mutual Funds (the sub-advisory contracts) with Invesco Asset Management Deutschland GmbH, Invesco Asset Management Limited, Invesco Asset Management (Japan) Limited, Invesco Australia Limited, Invesco Hong Kong Limited, Invesco Senior Secured Management, Inc. and Invesco Canada Ltd. (collectively, the Affiliated Sub-Advisers). During contract renewal meetings held on June 19-20, 2012, the Board as a whole, and the disinterested or “independent” Trustees, who comprise 80% of the Board, voting separately, approved the continuance of the Fund’s investment advisory agreement and the sub-advisory contracts for another year, effective July 1, 2012. In doing so, the Board considered the process that it follows in reviewing and approving the Fund’s investment advisory agreement and sub-advisory contracts and the information that it is provided. The Board determined that the Fund’s investment advisory agreement and the sub-advisory contracts are in the best interests of the Fund and its shareholders and the compensation to Invesco Advisers and the Affiliated Sub-Advisers under the agreements is fair and reasonable.
The Board’s Fund Evaluation Process
The Board’s Investments Committee has established three Sub-Committees, each of which is primarily responsible for overseeing the management of a number of the series portfolios of the funds advised by Invesco Advisers (the Invesco Funds). The Sub-Committees meet throughout the year to review the performance of their assigned funds, including reviewing materials prepared under the direction of the independent Senior Officer, an officer of the Invesco Funds who reports directly to the independent Trustees. Over the course of each year, the Sub-Committees meet with portfolio managers for their assigned Invesco Funds and other members of management to review the performance, investment objective(s), policies, strategies, limitations and investment risks of these funds. The Sub-Committees meet regularly and at designated contract renewal meetings each year to conduct a review of the performance, fees, expenses and other matters related to their assigned Invesco Funds. Each Sub-Committee recommends to the Investments Committee, which in turn recommends to the full Board, whether and on what terms to
approve the continuance of each Invesco Fund’s investment advisory agreement and sub-advisory contracts for another year.
During the contract renewal process, the Trustees receive comparative performance and fee data regarding the Invesco Funds prepared by Invesco Advisers and an independent company, Lipper Inc. (Lipper). The Trustees also receive an independent written evaluation from the Senior Officer. The Senior Officer’s evaluation is prepared as part of his responsibility to manage the process by which the Invesco Funds’ proposed management fees are negotiated during the annual contract renewal process to ensure they are negotiated in a manner that is at arms’ length and reasonable. The independent Trustees are assisted in their annual evaluation of the Fund’s investment advisory agreement by the Senior Officer and by independent legal counsel. In addition to meetings with Invesco Advisers and fund counsel, the independent Trustees also discuss the continuance of the investment advisory agreement and sub-advisory contracts in private sessions with the Senior Officer and independent legal counsel.
In evaluating the fairness and reasonableness of the Fund’s investment advisory agreement and sub-advisory contracts, the Board considered, among other things, the factors discussed below. The Trustees recognized that the advisory fees for the Invesco Funds include advisory fees that are the result of years of review and negotiation between the Trustees and Invesco Advisers as well as advisory fees previously approved by a different board that, at the time, was responsible for overseeing Morgan Stanley and Van Kampen funds, which have become Invesco Funds following the acquisition of the retail mutual fund business of Morgan Stanley. The Trustees’ deliberations and conclusions in a particular year may be based in part on their deliberations and conclusions regarding these same arrangements throughout the year and in prior years. One Trustee may have weighed a particular piece of information or factor differently than another Trustee.
The discussion below serves as the Senior Officer’s independent written evaluation with respect to the Fund’s investment advisory agreement as well as a discussion of the material factors and related conclusions that formed the basis for the Board’s approval of the Fund’s investment advisory agreement and sub-advisory contracts. Unless otherwise stated, this information is current as of June 20, 2012, and may not reflect consideration of factors that became known to the Board after that date, including, for example, changes to the Fund’s performance, advisory fees, expense limitations and/or fee waivers.
Factors and Conclusions and Summary of Independent Written Fee Evaluation
| A. | Nature, Extent and Quality of Services Provided by Invesco Advisers and the Affiliated Sub-Advisers |
The Board reviewed the advisory services provided to the Fund by Invesco Advisers under the Fund’s investment advisory agreement, the performance of Invesco Advisers in providing these services, and the credentials and experience of the officers and employees of Invesco Advisers who provide these services, including the Fund’s portfolio manager or managers, with whom the Sub-Committees met during the year. The Board’s review of the qualifications of Invesco Advisers to provide advisory services included the Board’s consideration of Invesco Advisers’ performance and investment process oversight, independent credit analysis and investment risk management.
In determining whether to continue the Fund’s investment advisory agreement, the Board considered the prior relationship between Invesco Advisers and the Fund, as well as the Board’s knowledge of Invesco Advisers’ operations, and concluded that it is beneficial to maintain the current relationship, in part because of such prior relationship and knowledge. The Board also considered services that Invesco Advisers and its affiliates provide to the Invesco Funds such as various back office support functions, equity and fixed income trading operations, internal audit, distribution and legal and compliance. The Board concluded that the nature, extent and quality of the services provided to the Fund by Invesco Advisers are appropriate and satisfactory and consistent with the terms of the Fund’s investment advisory agreement.
The Board reviewed the services provided by the Affiliated Sub-Advisers under the sub-advisory contracts and the credentials and experience of the officers and employees of the Affiliated Sub-Advisers who provide these services. The Board noted that the Affiliated Sub-Advisers have offices and personnel that are located in financial centers around the world. As a result, the Affiliated Sub-Advisers can provide research and investment analysis on the markets and economies of various countries in which the Fund invests and make recommendations on securities of companies located in such countries. The Board concluded that the sub-advisory contracts benefit the Fund and its shareholders by permitting Invesco Advisers to use the resources and talents of the Affiliated Sub-Advisers in managing the Fund. The Board concluded that the nature, extent and quality of the services provided by the Affiliated Sub-Advisers are appropriate and satisfactory and consistent with the terms of the Fund’s sub-advisory contracts.
23 Invesco European Growth Fund
| B. | Fund Performance |
The Board considered Fund performance as a relevant factor in considering whether to approve the investment advisory agreement. The Board did not view Fund performance as a relevant factor in considering whether to approve the sub-advisory contracts for the Fund, as no Affiliated Sub-Adviser currently manages assets of the Fund.
The Board compared the Fund’s performance during the past one, three and five calendar years to the performance of funds in the Lipper performance universe and against the Lipper European Funds Index. The Board noted that performance of Class A shares of the Fund was in the first quintile of the performance universe for the one, three and five year periods (the first quintile being the best performing funds and the fifth quintile being the worst performing funds). The Board noted that performance of Class A shares of the Fund was above the performance of the Index for the one, three and five year periods. The Trustees also reviewed more recent Fund performance and this review did not change their conclusions.
| C. | Advisory and Sub-Advisory Fees and Fee Waivers |
The Board compared the Fund’s contractual advisory fee rate to the contractual advisory fee rates of funds in the Fund’s Lipper expense group at a common asset level. The Board noted that the contractual advisory fee rate for Class A shares of the Fund was above the median contractual advisory fee rate of funds in the expense group. The Board also reviewed the methodology used by Lipper in providing expense group information, which includes using audited financial data from the most recent annual report of each fund in the expense group that was publicly available as of the end of the past calendar year and including only one fund per investment adviser. The Board noted that comparative data is as of varying dates, which may affect the comparability of data during times of market volatility.
The Board also compared the Fund’s effective fee rate (the advisory fee after advisory fee waivers and before expense limitations/waivers) to the advisory fee rates of other funds advised by Invesco Advisers and its affiliates with investment strategies comparable to those of the Fund. The Board noted that Invesco Advisers sub-advises one off-shore fund with investment strategies comparable to the Fund, which had an effective fee rate higher than the Fund’s.
The Board also considered the services provided by the Affiliated Sub-Advisers pursuant to the sub-advisory contracts, as well as the allocation of fees between Invesco Advisers and the Affiliated Sub-Advisers pursuant to the sub-advisory contracts. The Board noted that Invesco Advisers provides services to sub-advised Invesco Funds, including oversight of the Affiliated Sub-Advisers as well as the additional services described above other than day-to-day portfolio management. The Board also noted that the sub-advisory fees have no
direct effect on the Fund or its shareholders, as they are paid by Invesco Advisers to the Affiliated Sub-Advisers.
Based upon the information and considerations described above, the Board concluded that the Fund’s advisory and sub-advisory fees are fair and reasonable.
| D. | Economies of Scale and Breakpoints |
The Board considered the extent to which there are economies of scale in the provision of advisory services to the Fund. The Board also considered whether the Fund benefits from economies of scale through contractual breakpoints in the Fund’s advisory fee schedule and were assisted in their review by a report from the Senior Officer. The Board also noted that the Fund shares directly in economies of scale through lower fees charged by third party service providers based on the combined size of the Invesco Funds and other clients advised by Invesco Advisers. The Board noted that Invesco Advisers proposes sharing economies of scale in administration expenses by lowering per class administrative fees.
| E. | Profitability and Financial Resources |
The Board reviewed information from Invesco Advisers concerning the costs of the advisory and other services that Invesco Advisers and its affiliates provide to the Fund and the profitability of Invesco Advisers and its affiliates in providing these services for the year ended December 31, 2011. The Board reviewed with Invesco Advisers the methodology used to prepare the profitability information. The Board considered the profitability of Invesco Advisers in connection with managing the Fund and the Invesco Funds. The Board noted that Invesco Advisers continues to operate at a net profit from services Invesco Advisers and its subsidiaries provide to the Invesco Funds and the Fund. The Board did not deem the level of profits realized by Invesco Advisers and its affiliates from providing services to the Fund to be excessive given the nature, quality and extent of the services provided to the Invesco Funds. The Board received and accepted information from Invesco Advisers demonstrating that Invesco Advisers and each Affiliated Sub-Adviser are financially sound and have the resources necessary to perform their obligations under the investment advisory agreement and sub-advisory contracts.
| F. | Collateral Benefits to Invesco Advisers and its Affiliates |
The Board considered various other benefits received by Invesco Advisers and its affiliates from the relationship with the Fund, including the fees received for their provision of administrative, transfer agency and distribution services to the Fund. The Board considered the performance of Invesco Advisers and its affiliates in providing these services and the organizational structure employed to provide these services. The Board also considered that these services are provided to the Fund pursuant to written contracts that are reviewed and approved on an annual basis by the Board; that the services are required for the operation
of the Fund; that Invesco Advisers and its affiliates can provide services, the nature and quality of which are at least equal to those provided by others offering the same or similar services; and that the fees for such services are fair and reasonable in light of the usual and customary charges by others for services of the same nature and quality.
The Board considered the benefits realized by Invesco Advisers and the Affiliated Sub-Advisers as a result of portfolio brokerage transactions executed through “soft dollar” arrangements. The Board noted that soft dollar arrangements shift the payment obligation for research services from Invesco Advisers and the Affiliated Sub-Advisers to the Invesco Funds and therefore may reduce Invesco Advisers’ and the Affiliated Sub-Advisers’ expenses. The Board also considered periodic reports from the Chief Compliance Officer of the Invesco Funds demonstrating that these arrangements are consistent with regulatory requirements. The Board did not deem the soft dollar arrangements to be inappropriate.
The Board considered that the Fund’s uninvested cash and cash collateral from any securities lending arrangements may be invested in money market funds advised by Invesco Advisers pursuant to procedures approved by the Board. The Board noted that Invesco Advisers receives advisory fees from these affiliated money market funds attributable to such investments, although Invesco Advisers has contractually agreed to waive through varying periods the advisory fees payable by the Invesco Funds. The waiver is in an amount equal to 100% of the net advisory fee Invesco Advisers receives from the affiliated money market funds with respect to the Fund’s investment in the affiliated money market funds of uninvested cash, but not cash collateral. The Board concluded that the Fund’s investment of uninvested cash and cash collateral from any securities lending arrangements in the affiliated money market funds is in the best interests of the Fund and its shareholders.
The Board also considered use of an affiliated broker to execute certain trades for the Fund and that such trades are executed in compliance with rules under the Investment Company Act of 1940, as amended.
24 Invesco European Growth Fund
Tax Information
Form 1099-DIV, Form 1042-S and other year–end tax information provide shareholders with actual calendar year amounts that should be included in their tax returns. Shareholders should consult their tax advisors.
The following distribution information is being provided as required by the Internal Revenue Code or to meet a specific state’s requirement.
The Fund designates the following amounts or, if subsequently determined to be different, the maximum amount allowable for its fiscal year ended October 31, 2012:
Federal and State Income Tax | ||||
Qualified Dividend Income* | 100 | % | ||
Corporate Dividends Received Deduction* | 0.32 | % | ||
Foreign Taxes | $ | 0.0615 per share | ||
Foreign Source Income | $ | 1.0922 per share | ||
| * | The above percentages are based on ordinary income dividends paid to shareholders during the Fund’s fiscal year. |
25 Invesco European Growth Fund
Trustees and Officers
The address of each trustee and officer is AIM International Mutual Funds (Invesco International Mutual Funds) (the “Trust”), 11 Greenway Plaza, Suite 1000, Houston, Texas 77046-1173. The trustees serve for the life of the Trust, subject to their earlier death, incapacitation, resignation, retirement or removal as more specifically provided in the Trust’s organizational documents. Each officer serves for a one year term or until their successors are elected and qualified. Column two below includes length of time served with predecessor entities, if any.
| Name, Year of Birth and Position(s) Held with the Trust | Trustee and/ or Officer Since | Principal Occupation(s) During Past 5 Years | Number of Complex Overseen by Trustee | Other Directorship(s) Held by Trustee During Past 5 Years | ||||
| Interested Persons | ||||||||
| Martin L. Flanagan1 — 1960 Trustee | 2007 | Executive Director, Chief Executive Officer and President, Invesco Ltd. (ultimate parent of Invesco and a global investment management firm); Advisor to the Board, Invesco Advisers, Inc. (formerly known as Invesco Institutional (N.A.), Inc.); Trustee, The Invesco Funds; Vice Chair, Investment Company Institute; and Member of Executive Board, SMU Cox School of Business
Formerly: Chairman, Invesco Advisers, Inc. (registered investment adviser); Director, Chairman, Chief Executive Officer and President, IVZ Inc. (holding company), INVESCO Group Services, Inc. (service provider) and Invesco North American Holdings, Inc. (holding company); Director, Chief Executive Officer and President, Invesco Holding Company Limited (parent of Invesco and a global investment management firm); Director, Invesco Ltd.; Chairman, Investment Company Institute and President, Co-Chief Executive Officer, Co-President, Chief Operating Officer and Chief Financial Officer, Franklin Resources, Inc. (global investment management organization) | 123 | None | ||||
Philip A. Taylor2 — 1954 Trustee, President and Principal Executive Officer | 2006 | Head of North American Retail and Senior Managing Director, Invesco Ltd.; Director, Co-Chairman, Co-President and Co-Chief Executive Officer, Invesco Advisers, Inc. (formerly known as Invesco Institutional (N.A.), Inc.) (registered investment adviser); Director, Chairman, Chief Executive Officer and President, Invesco Management Group, Inc. (formerly known as Invesco Aim Management Group, Inc.) (financial services holding company); Director and President, INVESCO Funds Group, Inc. (registered investment adviser and registered transfer agent); Director and Chairman, Invesco Investment Services, Inc. (formerly known as Invesco Aim Investment Services, Inc.) (registered transfer agent) and IVZ Distributors, Inc. (formerly known as INVESCO Distributors, Inc.) (registered broker dealer); Director, President and Chairman, Invesco Inc. (holding company) and Invesco Canada Holdings Inc. (holding company); Chief Executive Officer, Invesco Corporate Class Inc. (corporate mutual fund company) and Invesco Canada Fund Inc. (corporate mutual fund company); Director, Chairman and Chief Executive Officer, Invesco Canada Ltd. (formerly known as Invesco Trimark Ltd./Invesco Trimark Ltèe) (registered investment adviser and registered transfer agent); Trustee, President and Principal Executive Officer, The Invesco Funds (other than AIM Treasurer’s Series Trust (Invesco Treasurer’s Series Trust) and Short-Term Investments Trust); Trustee and Executive Vice President, The Invesco Funds (AIM Treasurer’s Series Trust (Invesco Treasurer’s Series Trust) and Short-Term Investments Trust only); Director, Invesco Investment Advisers LLC (formerly known as Van Kampen Asset Management); Director, Chief Executive Officer and President, Van Kampen Exchange Corp.
Formerly: Director and Chairman, Van Kampen Investor Services Inc.; Director, Chief Executive Officer and President, 1371 Preferred Inc. (holding company); and Van Kampen Investments Inc.; Director and President, AIM GP Canada Inc. (general partner for limited partnerships); and Van Kampen Advisors, Inc.; Director and Chief Executive Officer, Invesco Trimark Dealer Inc. (registered broker dealer); Director, Invesco Distributors, Inc. (formerly known as Invesco Aim Distributors, Inc.) (registered broker dealer); Manager, Invesco PowerShares Capital Management LLC; Director, Chief Executive Officer and President, Invesco Advisers, Inc.; Director, Chairman, Chief Executive Officer and President, Invesco Aim Capital Management, Inc.; President, Invesco Trimark Dealer Inc. and Invesco Trimark Ltd./Invesco Trimark Ltèe; Director and President, AIM Trimark Corporate Class Inc. and AIM Trimark Canada Fund Inc.; Senior Managing Director, Invesco Holding Company Limited; Trustee and Executive Vice President, Tax-Free Investments Trust; Director and Chairman, Fund Management Company (former registered broker dealer); President and Principal Executive Officer, The Invesco Funds (AIM Treasurer’s Series Trust (Invesco Treasurer’s Series Trust), Short-Term Investments Trust and Tax-Free Investments Trust only); President, AIM Trimark Global Fund Inc. and AIM Trimark Canada Fund Inc. | 123 | None | ||||
Wayne W. Whalen3 — 1939 Trustee | 2010 | Of Counsel, and prior to 2010, partner in the law firm of Skadden, Arps, Slate, Meagher & Flom LLP, legal counsel to certain funds in the Fund Complex
| 136 | Director of the Mutual Fund Directors Forum, a nonprofit membership organization for investment directors; Chairman and Director of the Abraham Lincoln Presidential Library Foundation; and Director of the Stevenson Center for Democracy |
| 1 | Mr. Flanagan is considered an interested person of the Trust because he is an officer of the adviser to the Trust, and an officer and a director of Invesco Ltd., ultimate parent of the adviser to the Trust. |
| 2 | Mr. Taylor is considered an interested person of the Trust because he is an officer and a director of the adviser to, and a director of the principal underwriter of, the Trust. |
| 3 | Mr. Whalen is considered an “interested person” (within the meaning of Section 2(a)(19) of the 1940 Act) of certain Funds in the Invesco Fund Complex by reason of he and his firm currently providing legal services as legal counsel to such Funds in the Invesco Fund Complex. |
T-1 Invesco European Growth Fund
Trustees and Officers—(continued)
| Name, Year of Birth and Position(s) Held with the Trust | Trustee and/ or Officer Since | Principal Occupation(s) During Past 5 Years | Number of Funds in Fund Complex Overseen by Trustee | Other Directorship(s) Held by Trustee During Past 5 Years | ||||
| Independent Trustees | ||||||||
Bruce L. Crockett — 1944 Trustee and Chair | 1992 | Chairman, Crockett Technologies Associates (technology consulting company)
Formerly: Director, Captaris (unified messaging provider); Director, President and Chief Executive Officer COMSAT Corporation; and Chairman, Board of Governors of INTELSAT (international communications company) | 123 | ACE Limited (insurance company); and Investment Company Institute | ||||
David C. Arch — 1945 Trustee | 2010 | Retired.
Formerly: Chairman and Chief Executive Officer of Blistex Inc., (consumer health care products manufacturer) | 136 | Member of the Heartland Alliance Advisory Board, a nonprofit organization serving human needs based in Chicago. Board member of the Illinois Manufacturers’ Association. Member of the Board of Visitors, Institute for the Humanities, University of Michigan | ||||
Frank S. Bayley — 1939 Trustee | 2001 | Retired
Formerly: Director, Badgley Funds, Inc. (registered investment company) (2 portfolios) and Partner, law firm of Baker & McKenzie | 123 | Director and Chairman, C.D. Stimson Company (a real estate investment company) | ||||
James T. Bunch — 1942 Trustee | 2003 | Managing Member, Grumman Hill Group LLC (family office private equity management)
Formerly: Founder, Green, Manning & Bunch Ltd. (investment banking firm)(1988-2010); Executive Committee, United States Golf Association; and Director, Policy Studies, Inc. and Van Gilder Insurance Corporation | 123 | Chairman, Board of Governors, Western Golf Association, Chairman-elect, Evans Scholars Foundation and Director, Denver Film Society | ||||
Rodney F. Dammeyer — 1940 Trustee | 2010 | Chairman of CAC, LLC, (private company offering capital investment and management advisory services)
Formerly: Prior to January 2004, Director of TeleTech Holdings Inc.; Prior to 2002, Director of Arris Group, Inc.; Prior to 2001, Managing Partner at Equity Group Corporate Investments. Prior to 1995, Vice Chairman of Anixter International. Prior to 1985, experience includes Senior Vice President and Chief Financial Officer of Household International, Inc., Executive Vice President and Chief Financial Officer of Northwest Industries, Inc. and Partner of Arthur Andersen & Co. | 136 | Director of Quidel Corporation and Stericycle, Inc. Prior to May 2008, Trustee of The Scripps Research Institute. Prior to February 2008, Director of Ventana Medical Systems, Inc. Prior to April 2007, Director of GATX Corporation. Prior to April 2004, Director of TheraSense, Inc. | ||||
Albert R. Dowden — 1941 Trustee | 2000 | Director of a number of public and private business corporations, including the Boss Group, Ltd. (private investment and management); Reich & Tang Funds (5 portfolios) (registered investment company); and Homeowners of America Holding Corporation/ Homeowners of America Insurance Company (property casualty company)
Formerly: Director, Continental Energy Services, LLC (oil and gas pipeline service); Director, CompuDyne Corporation (provider of product and services to the public security market) and Director, Annuity and Life Re (Holdings), Ltd. (reinsurance company); Director, President and Chief Executive Officer, Volvo Group North America, Inc.; Senior Vice President, AB Volvo; Director of various public and private corporations; Chairman, DHJ Media, Inc.; Director Magellan Insurance Company; and Director, The Hertz Corporation, Genmar Corporation (boat manufacturer), National Media Corporation; Advisory Board of Rotary Power International (designer, manufacturer, and seller of rotary power engines); and Chairman, Cortland Trust, Inc. (registered investment company) | 123 | Director of Nature’s Sunshine Products, Inc. | ||||
Jack M. Fields — 1952 Trustee | 1997 | Chief Executive Officer, Twenty First Century Group, Inc. (government affairs company); and Owner and Chief Executive Officer, Dos Angelos Ranch, L.P. (cattle, hunting, corporate entertainment), Discovery Global Education Fund (non-profit) and Cross Timbers Quail Research Ranch (non-profit)
Formerly: Chief Executive Officer, Texana Timber LP (sustainable forestry company) and member of the U.S. House of Representatives | 123 | Insperity (formerly known as Administaff) | ||||
Carl Frischling — 1937 Trustee | 1991 | Partner, law firm of Kramer Levin Naftalis and Frankel LLP | 123 | Director, Reich & Tang Funds (6 portfolios) | ||||
Prema Mathai-Davis — 1950 Trustee | 1998 | Retired
Formerly: Chief Executive Officer, YWCA of the U.S.A. | 123 | None | ||||
Larry Soll — 1942 Trustee | 2003 | Retired
Formerly: Chairman, Chief Executive Officer and President, Synergen Corp. (a biotechnology company) | 123 | None |
T-2 Invesco European Growth Fund
Trustees and Officers—(continued)
| Name, Year of Birth and Position(s) Held with the Trust | Trustee and/ or Officer Since | Principal Occupation(s) During Past 5 Years | Number of Funds in Fund Complex Overseen by Trustee | Other Directorship(s) Held by Trustee During Past 5 Years | ||||
| Independent Trustees—(continued) | ||||||||
Hugo F. Sonnenschein — 1940 Trustee | 2010 | Distinguished Service Professor and President Emeritus of the University of Chicago and the Adam Smith Distinguished Service Professor in the Department of Economics at the University of Chicago.
Formerly: President of the University of Chicago | 136 | Trustee of the University of Rochester and a member of its investment committee. Member of the National Academy of Sciences, the American Philosophical Society and a fellow of the American Academy of Arts and Sciences | ||||
Raymond Stickel, Jr. — 1944 Trustee | 2005 | Retired
Formerly: Director, Mainstay VP Series Funds, Inc. (25 portfolios) and Partner, Deloitte & Touche | 123 | None | ||||
| Other Officers | ||||||||
Russell C. Burk — 1958 Senior Vice President and Senior Officer | 2005 | Senior Vice President and Senior Officer, The Invesco Funds | N/A | N/A | ||||
John M. Zerr — 1962 Senior Vice President, Chief Legal Officer and Secretary | 2006 | Director, Senior Vice President, Secretary and General Counsel, Invesco Management Group, Inc. (formerly known as Invesco Aim Management Group, Inc.) and Van Kampen Exchange Corp.; Senior Vice President, Invesco Advisers, Inc. (formerly known as Invesco Institutional (N.A.), Inc.) (registered investment adviser); Senior Vice President and Secretary, Invesco Distributors, Inc. (formerly known as Invesco Aim Distributors, Inc.); Director, Vice President and Secretary, Invesco Investment Services, Inc. (formerly known as Invesco Aim Investment Services, Inc.) and IVZ Distributors, Inc. (formerly known as INVESCO Distributors, Inc.); Director and Vice President, INVESCO Funds Group, Inc.; Senior Vice President, Chief Legal Officer and Secretary, The Invesco Funds; Manager, Invesco PowerShares Capital Management LLC; Director, Secretary and General Counsel, Invesco Investment Advisers LLC (formerly known as Van Kampen Asset Management); Secretary and General Counsel, Invesco Capital Markets, Inc. (formerly known as Van Kampen Funds Inc.) and Chief Legal Officer, PowerShares Exchange-Traded Fund Trust, PowerShares Exchange-Traded Fund Trust II, PowerShares India Exchange-Traded Fund Trust and PowerShares Actively Managed Exchange-Traded Fund Trust
Formerly: Director and Secretary, Van Kampen Advisors Inc.; Director Vice President, Secretary and General Counsel Van Kampen Investor Services Inc.; Director, Invesco Distributors, Inc. (formerly known as Invesco Aim Distributors, Inc.); Director, Senior Vice President, General Counsel and Secretary, Invesco Advisers, Inc.; and Van Kampen Investments Inc.; Director, Vice President and Secretary, Fund Management Company; Director, Senior Vice President, Secretary, General Counsel and Vice President, Invesco Aim Capital Management, Inc.; Chief Operating Officer and General Counsel, Liberty Ridge Capital, Inc. (an investment adviser); Vice President and Secretary, PBHG Funds (an investment company) and PBHG Insurance Series Fund (an investment company); Chief Operating Officer, General Counsel and Secretary, Old Mutual Investment Partners (a broker-dealer); General Counsel and Secretary, Old Mutual Fund Services (an administrator) and Old Mutual Shareholder Services (a shareholder servicing center); Executive Vice President, General Counsel and Secretary, Old Mutual Capital, Inc. (an investment adviser); and Vice President and Secretary, Old Mutual Advisors Funds (an investment company) | N/A | N/A | ||||
Lisa O. Brinkley — 1959 Vice President | 2004 | Global Assurance Officer, Invesco Ltd. and Vice President, The Invesco Funds
Formerly: Chief Compliance Officer, Invesco Distributors, Inc. (formerly known as Invesco Aim Distributors, Inc.), Invesco Investment Services, Inc.(formerly known as Invesco Aim Investment Services, Inc.) and Van Kampen Investor Services Inc.; Senior Vice President, Invesco Management Group, Inc.; Senior Vice President and Chief Compliance Officer, Invesco Advisers, Inc. and The Invesco Funds; Vice President and Chief Compliance Officer, Invesco Aim Capital Management, Inc. and Invesco Distributors, Inc.; Vice President, Invesco Investment Services, Inc. and Fund Management Company | N/A | N/A | ||||
T-3 Invesco European Growth Fund
Trustees and Officers—(continued)
| Name, Year of Birth and Position(s) Held with the Trust | Trustee and/ or Officer Since | Principal Occupation(s) During Past 5 Years | Number of Funds in Fund Complex Overseen by Trustee | Other Directorship(s) Held by Trustee During Past 5 Years | ||||
| Other Officers—(continued) | ||||||||
Karen Dunn Kelley — 1960 Vice President | 2004 | Head of Invesco’s World Wide Fixed Income and Cash Management Group; Senior Vice President, Invesco Management Group, Inc. (formerly known as Invesco Aim Management Group, Inc.) and Invesco Advisers, Inc. (formerly known as Invesco Institutional (N.A.), Inc.) (registered investment adviser); Executive Vice President, Invesco Distributors, Inc. (formerly known as Invesco Aim Distributors, Inc.); Director, Invesco Mortgage Capital Inc., INVESCO Global Asset Management Limited, Invesco Management Company Limited and INVESCO Management S.A.; Vice President, The Invesco Funds (other than AIM Treasurer’s Series Trust (Invesco Treasurer’s Series Trust) and Short-Term Investments Trust); and President and Principal Executive Officer, The Invesco Funds (AIM Treasurer’s Series Trust (Invesco Treasurer’s Series Trust) and Short-Term Investments Trust only)
Formerly: Senior Vice President, Van Kampen Investments Inc.; Vice President, Invesco Advisers, Inc. (formerly known as Invesco Institutional (N.A.), Inc.); Director of Cash Management and Senior Vice President, Invesco Advisers, Inc. and Invesco Aim Capital Management, Inc.; President and Principal Executive Officer, Tax-Free Investments Trust; Director and President, Fund Management Company; Chief Cash Management Officer, Director of Cash Management, Senior Vice President, and Managing Director, Invesco Aim Capital Management, Inc.; Director of Cash Management, Senior Vice President, and Vice President, Invesco Advisers, Inc. and The Invesco Funds (AIM Treasurer’s Series Trust (Invesco Treasurer’s Series Trust), Short-Term Investments Trust and Tax-Free Investments Trust only) | N/A | N/A | ||||
Sheri Morris — 1964 Vice President, Treasurer and Principal Financial Officer | 1999 | Vice President, Treasurer and Principal Financial Officer, The Invesco Funds; Vice President, Invesco Advisers, Inc. (formerly known as Invesco Institutional (N.A.), Inc.) (registered investment adviser); and Treasurer, PowerShares Exchange-Traded Fund Trust, PowerShares Exchange-Traded Fund Trust II, PowerShares India Exchange-Traded Fund Trust and PowerShares Actively Managed Exchange-Traded Fund Trust
Formerly: Vice President, Invesco Advisers, Inc., Invesco Aim Capital Management, Inc. and Invesco Aim Private Asset Management, Inc.; Assistant Vice President and Assistant Treasurer, The Invesco Funds and Assistant Vice President, Invesco Advisers, Inc., Invesco Aim Capital Management, Inc. and Invesco Aim Private Asset Management, Inc. | N/A | N/A | ||||
Yinka Akinsola — 1977 Anti-Money Laundering Compliance Officer | 2011 | Anti-Money Laundering Compliance Officer, Invesco Advisers, Inc. (formerly known as Invesco Institutional (N.A.), Inc.) (registered investment adviser); Invesco Distributors, Inc. (formerly known as Invesco Aim Distributors, Inc.), Invesco Investment Services, Inc. (formerly known as Invesco Aim Investment Services, Inc.), Invesco Management Group, Inc., The Invesco Funds, Invesco Van Kampen Closed-End Funds, Van Kampen Exchange Corp., Invesco Capital Markets, Inc. (formerly known as Van Kampen Funds Inc.), PowerShares Exchange-Traded Fund Trust, PowerShares Exchange-Traded Fund Trust II, PowerShares India Exchange-Traded Fund Trust, and PowerShares Actively Managed Exchange-Traded Fund Trust
Formerly: Regulatory Analyst III, Financial Industry Regulatory Authority (FINRA). | N/A | N/A | ||||
Todd L. Spillane — 1958 Chief Compliance Officer | 2006 | Senior Vice President, Invesco Management Group, Inc. (formerly known as Invesco Aim Management Group, Inc.) and Van Kampen Exchange Corp.; Senior Vice President and Chief Compliance Officer, Invesco Advisers, Inc. (registered investment adviser) (formerly known as Invesco Institutional (N.A.), Inc.); Chief Compliance Officer, The Invesco Funds; Vice President, Invesco Distributors, Inc. (formerly known as Invesco Aim Distributors, Inc.) and Invesco Investment Services, Inc. (formerly known as Invesco Aim Investment Services, Inc.)
Formerly: Chief Compliance Officer, Invesco Van Kampen Closed-End Funds; Senior Vice President, Van Kampen Investments Inc.; Senior Vice President and Chief Compliance Officer, Invesco Advisers, Inc. and Invesco Aim Capital Management, Inc.; Chief Compliance Officer, INVESCO Private Capital Investments, Inc. (holding company), Invesco Private Capital, Inc. (registered investment adviser), Invesco Global Asset Management (N.A.), Inc., Invesco Senior Secured Management, Inc. (registered investment adviser) and Van Kampen Investor Services Inc., PowerShares Exchange-Traded Fund Trust, PowerShares Exchange-Traded Fund Trust II, PowerShares India Exchange-Traded Fund Trust and PowerShares Actively Managed Exchange-Traded Fund Trust; Vice President, Invesco Aim Capital Management, Inc. and Fund Management Company | N/A | N/A | ||||
The Statement of Additional Information of the Trust includes additional information about the Fund’s Trustees and is available upon request, without charge, by calling 1.800.959.4246. Please refer to the Fund’s prospectus for information on the Fund’s sub-advisers.
Office of the Fund 11 Greenway Plaza, Suite 1000 Houston, TX 77046-1173 | Investment Adviser Invesco Advisers, Inc. 1555 Peachtree Street, N.E. Atlanta, GA 30309 | Distributor Invesco Distributors, Inc. 11 Greenway Plaza, Suite 1000 Houston, TX 77046-1173 | Auditors PricewaterhouseCoopers LLP 1201 Louisiana Street, Suite 2900 Houston, TX 77002-5678 | |||
Counsel to the Fund Stradley Ronon Stevens & Young, LLP 2005 Market Street, Suite 2600 Philadelphia, PA 19103-7018 | Counsel to the Independent Trustees Kramer Levin Naftalis & Frankel LLP 1177 Avenue of the Americas New York, NY 10036-2714 | Transfer Agent Invesco Investment Services, Inc. 11 Greenway Plaza, Suite 1000 Houston, TX 77046-1173 | Custodian State Street Bank and Trust Company 225 Franklin Street Boston, MA 02110-2801 | |||
T-4 Invesco European Growth Fund

Invesco mailing information
Send general correspondence to Invesco Investment Services, Inc., P.O. Box 219078, Kansas City, MO 64121-9078.
Invesco privacy policy
You share personal and financial information with us that is necessary for your transactions and your account records. We take very seriously the obligation to keep that information confidential and private.
Invesco collects nonpublic personal information about you from account applications or other forms you complete and from your transactions with us or our affiliates. We do not disclose information about you or our former customers to service providers or other third parties except to the extent necessary to service your account and in other limited circumstances as permitted by law. For example, we use this information to facilitate the delivery of transaction confirmations, financial reports, prospectuses and tax forms.
Even within Invesco, only people involved in the servicing of your accounts and compliance monitoring have access to your information. To ensure the highest level of confidentiality and security, Invesco maintains physical, electronic and procedural safeguards that meet or exceed federal standards. Special measures, such as data encryption and authentication, apply to your communications with us on our website. More detail is available to you at invesco.com/privacy.
Important notice regarding delivery of security holder documents
To reduce Fund expenses, only one copy of most shareholder documents may be mailed to shareholders with multiple accounts at the same address (Householding). Mailing of your shareholder documents may be householded indefinitely unless you instruct us otherwise. If you do not want the mailing of these documents to be combined with those for other members of your house-hold, please contact Invesco Investment Services, Inc. at 800 959 4246 or contact your financial institution. We will begin sending you individual copies for each account within 30 days after receiving your request.
Fund holdings and proxy voting information
The Fund provides a complete list of its holdings four times in each fiscal year, at the quarter-ends. For the second and fourth quarters, the lists appear in the Fund’s semiannual and annual reports to shareholders. For the first and third quarters, the Fund files the lists with the Securities and Exchange Commission (SEC) on Form N-Q. The most recent list of portfolio holdings is available at invesco.com/completeqtrholdings. Shareholders can also look up the Fund’s Forms N-Q on the SEC website at sec.gov. Copies of the Fund’s Forms N-Q may be reviewed and copied at the SEC Public Reference Room in Washington, D.C. You can obtain information on the operation of the Public Reference Room, including information about duplicating fee charges, by calling 202 551 8090 or 800 732 0330, or by electronic request at the following email address: publicinfo@sec.gov. The SEC file numbers for the Fund are shown below.
A description of the policies and procedures that the Fund uses to determine how to vote proxies relating to portfolio securities is available without charge, upon request, from our Client Services department at 800 959 4246 or at invesco.com/proxyguidelines. The information is also available on the SEC website, sec.gov.
Information regarding how the Fund voted proxies related to its portfolio securities during the 12 months ended June 30, 2012, is available at invesco.com/proxysearch. The information is also available on the SEC website, sec.gov. Invesco Advisers, Inc. is an investment adviser; it provides investment advisory services to individual and institutional clients and does not sell securities. Invesco Distributors, Inc. is the US distributor for Invesco Ltd.’s retail mutual funds, exchange-traded funds and institutional money market funds. Both are wholly owned, indirect subsidiaries of Invesco Ltd. |  |
| SEC file numbers: 811-06463 and 033-44611 | EGR-AR-1 | Invesco Distributors, Inc. |

Letters to Shareholders
Philip Taylor | Dear Shareholders: This report contains information about your Fund, including a discussion from your portfolio managers about how they managed your Fund – and why it performed as it did – during the reporting period. This report also includes your Fund’s long-term performance and a complete list of your Fund’s investments as of the close of the reporting period. I hope you find this information helpful. For much of the reporting period, investors’ attention was focused on Europe, where eurozone governments struggled to reduce debt levels, strengthen their banks and stimulate their economies. European leaders disagreed whether the wiser path to restoring the Continent’s economic well-being was more stimulus or greater austerity. In the US, economic data were mixed. Economic growth, while positive, was relatively modest. Corporate earnings, which grew strongly in recent years, showed signs of slowing. And job creation was less robust than hoped. Later in this report, your Fund’s portfolio managers discuss how economic | |
| conditions and market trends affected your Fund’s performance. | ||

Economic conditions are always subject to sudden and unexpected change. That’s why you may find it helpful to work with a trusted, experienced financial adviser who understands your unique financial goals, needs and risk tolerances. Financial advisers can provide valuable insight and information, particularly when markets are uncertain, and they can recommend investments appropriate for specific investment goals, such as a child’s college education or your retirement. On a regular basis, a financial adviser also can determine whether your existing investments are still appropriate, given your changing needs, goals and circumstances.
Timely insight and information from many of Invesco’s investment professionals is available at our website, invesco.com/us. We offer in-depth articles, video clips and audio commentaries from many of our portfolio managers and other investment professionals on a wide range of topics of interest to investors: recent economic and market developments; retirement planning; legislative updates from Washington, DC; and general investor education. At invesco.com/us, you also can access information about your Invesco account at any time.
What we mean by Intentional Investing
Intentional InvestingSM is the science and art of investing with purpose, prudence and diligence – and it’s how Invesco’s investment professionals manage your money every day.
This highly disciplined process begins when specialized teams of investment professionals clearly define an investment objective and then establish specific investment strategies to try to achieve that objective. While our investment teams closely monitor economic and market conditions – and issues specific to individual holdings that could affect their value – they maintain a long-term investment perspective. Intentional Investing is also:
| n | How we manage and mitigate risk – by embedding risk controls and processes into every aspect of our business; |
| n | How we create products – by offering a diverse combination of investment strategies and vehicles designed to meet your needs; and |
| n | How we connect with you, our investors – by communicating clearly, by delivering expert insights from our portfolio managers and other investment professionals, and by providing a website full of tools and articles to help you stay informed. |
As a company, Invesco believes in putting investors first, and that’s why investment management is all we do. Our sole focus on managing your money allows your financial adviser to build a truly diversified investment portfolio of Invesco funds, whatever your investment needs and goals may be – and allows him or her to find appropriate Invesco funds when your circumstances change. Of course, neither Intentional Investing nor diversification can guarantee a profit or protect against loss.
Have a question?
If you have questions about your account, please contact an Invesco client services representative at 800 959 4246. If you have an Invesco-related question or comment, feel free to email me directly at phil@invesco.com.
All of us at Invesco look forward to serving your investment management needs for many years to come. Thank you for investing with us.
Sincerely,

Philip Taylor
Senior Managing Director, Invesco Ltd.
2 Invesco Global Growth Fund
Bruce Crockett | Dear Fellow Shareholders: One of our most important responsibilities as independent Trustees of the Invesco Funds is our annual review of the funds’ advisory and sub-advisory contracts with Invesco. This annual review is required by the Investment Company Act of 1940 and focuses on the nature and quality of the services Invesco has provided as adviser to the Invesco Funds and the reasonableness of the fees that it charges for those services. In our roles as Trustees, we spend months reviewing thousands of pages of detailed information that we request from Invesco in connection with our annual review. We focus on the quality and costs of the services to be provided by Invesco and its affiliates. Some of the most important things we look at are fund performance, expenses and fees. All of the Trustees have substantial personal investments in the Invesco Funds complex. We’re fund shareholders just like you. |

We also use information from many independent sources during the review process, including materials provided by the independent Senior Officer of the Invesco Funds, who reports directly to the independent Trustees. We also meet in private sessions with independent legal counsel and review performance and fee data on the Invesco Funds prepared by Lipper Inc., an independent, third-party firm widely recognized as a leader in its field.
I’m pleased to report that the Invesco Funds Board determined in June that renewing the investment advisory agreement and the sub-advisory contracts with Invesco would serve the best interests of each fund and its shareholders. For more detailed information about our assessment and conclusions with respect to each of the Invesco Funds, visit invesco.com/us, click on the “About Us” section and go to “Legal Information.” Information on the recent investment advisory renewal process can be found by clicking the last item under “Corporate Governance.”
In much the same way we review your fund’s advisory contract each year, it’s a good idea for you to review your own investment plan with your financial adviser on a regular basis. Perhaps you need to reassess your original asset allocation because different investments may grow at varying paces, or perhaps you’re going through a significant life change. Regardless of your situation, a financial adviser can provide guidance and experience to help you reach your financial goals.
As always, please contact me at bruce@brucecrockett.com with any questions or concerns you may have. On behalf of the Board, we look forward to continuing to represent your interests and serving your needs.
Sincerely,

Bruce L. Crockett
Independent Chair
Invesco Funds Board of Trustees
3 Invesco Global Growth Fund
Management’s Discussion of Fund Performance
Performance summary
For the fiscal year ended October 31, 2012, Invesco Global Growth Fund, at net asset value (NAV), delivered positive returns and performed in line with its style-specific benchmark, the MSCI World Growth Index. The Fund’s investments in Europe provided the largest positive contribution to Fund performance, with the Fund’s exposure to the UK leading the gains. The Fund’s performance in North America, led by outperformance in Canada, was supportive as well.
Your Fund’s long-term performance appears later in this report.
Fund vs. Indexes
Total returns, 10/31/11 to 10/31/12, at net asset value (NAV). Performance shown does not include applicable contingent deferred sales charges (CDSC) or front-end sales charges, which would have reduced performance.
Class A Shares | 9.55 | % | ||
Class B Shares | 8.74 | |||
Class C Shares | 8.74 | |||
Class Y Shares | 9.83 | |||
Class R5 Shares* | 10.00 | |||
Class R6 Shares** | 9.58 | |||
MSCI World Indexq (Broad Market Index) | 9.45 | |||
MSCI World Growth Indexn (Style-Specific Index) | 9.01 | |||
Lipper Global Large-Cap Growth Funds Indexn (Peer Group Index) | 9.48 |
Source(s): qInvesco, MSCI via FactSet Research Systems Inc.; ¢Lipper Inc.
| * | Effective September 24, 2012, Institutional Class shares were renamed Class R5 shares. |
| ** | Share class incepted during the reporting period. See page 7 for a detailed explanation of Fund performance. |
How we invest
When selecting stocks for your Fund, we use a disciplined investment strategy that emphasizes fundamental research, supported by both quantitative analysis and portfolio construction techniques. Our EQV (earnings, quality, valuation) strategy focuses primarily on identifying quality companies that have experienced, or exhibit the potential for, accelerated or above-average earnings growth, but whose stock prices do not fully reflect these attributes.
While research responsibilities within the portfolio management team are focused by geographic region, we select investments for the Fund using a bottom-up investment approach, which means we
construct the Fund primarily on a stock-by-stock basis. We focus on the strengths of individual companies rather than sectors, countries or market-cap trends.
We believe disciplined sell decisions are key to successful investing. We consider selling a stock for one of the following reasons:
| n | A company’s fundamentals deteriorate, or it posts disappointing earnings. |
| n | A stock appears overvalued. |
| n | A more attractive investment opportunity becomes available. |
Market conditions and your Fund
During the reporting period, global equity markets remained volatile. At the beginning of the reporting period, macro events – ranging from continuing political
instability in the Middle East, lingering economic effects of the earthquake and tsunami in Japan, the ongoing eurozone sovereign debt crisis, aftereffects of Standard & Poor’s August 2011 first-ever downgrade of US debt, a slowing Chinese property market and generally higher inflation across the developing world – weighed on global economic growth and equity markets. While the markets rebounded modestly in December, macroeconomic concerns continued, stemming largely from the unstable economic conditions of Greece and Spain.
Toward the end of the reporting period, global central banks announced a series of stimulative policies. The European Central Bank (ECB) announced new measures to support eurozone economies through potentially unlimited purchases of sovereign debt, with ECB President Mario Draghi pledging to “do whatever it takes” to save the euro (although key details of the plan remain unresolved). The US Federal Reserve announced a third round of quantitative easing by promising to remain accommodative until the labor market outlook improves materially. Also, the Bank of Japan took steps to increase its asset purchase program. These easing measures were well received by investors and helped drive international equity markets higher in the final months of the reporting period, despite signs of a continued slowdown in global economic growth.
Given this environment, we continued to construct the Fund’s portfolio on a bottom-up basis, selecting stocks on an individual basis. From a sector perspective, the Fund fared better than its benchmark in six of 10 sectors. Significant outperformance came from the materials, industrials and information technology (IT) sectors; in each of these three sectors, strong stock selection was a key driver of results.
Portfolio Composition
By sector
Information Technology | 25.1 | % | ||
Consumer Discretionary | 21.8 | |||
Health Care | 11.1 | |||
Energy | 8.9 | |||
Industrials | 8.5 | |||
Consumer Staples | 7.9 | |||
Financials | 7.8 | |||
Materials | 3.9 | |||
Telecommunication Services | 1.8 | |||
Utilities | 0.7 | |||
Money Market Funds Plus Other Assets Less Liabilities | 2.5 |
Top 10 Equity Holdings*
1. Apple Inc. | 3.1 | % | ||
2. Anheuser-Busch InBev N.V. | 2.2 | |||
3. SAP AG | 2.0 | |||
4. Teva Pharmaceutical Industries Ltd.-ADR | 2.0 | |||
5. Imperial Tobacco Group PLC | 1.9 | |||
6. Reed Elsevier PLC | 1.8 | |||
7. Adidas AG | 1.8 | |||
8. Microsoft Corp. | 1.7 | |||
9. Google Inc.-Class A | 1.6 | |||
10. Compass Group PLC | 1.6 |
Total Net Assets | $311.2 million | |||
Total Number of Holdings* | 93 | |||
The Fund’s holdings are subject to change, and there is no assurance that the Fund will continue to hold any particular security.
* Excluding money market fund holdings.
4 Invesco Global Growth Fund
Fund holdings in the materials sector delivered positive performance, while index holdings in the sector produced a negative return for the reporting period. Underweight exposure to the sector, relative to the index, also helped relative results. The Fund’s underweight exposure to materials was driven by limited exposure to large metals and mining companies – companies that saw double-digit declines over the reporting period. In the IT sector, Fund results were helped by double-digit gains in the IT services and software industries.
In contrast, the Fund’s underweight exposure to the strong consumer staples sector detracted from relative returns. Stock selection in the financials sector was a drag as well; the Fund’s lack of exposure to several strong-performing stocks included in the index in the insurance and real estate investment and management industries was negative for relative performance. A modest cash position throughout the fiscal year detracted from performance, as markets rebounded at the end of the reporting period.
In broad geographic terms, the Fund benefited most significantly from strong outperformance in the UK, the second-largest country allocation in the portfolio. Among our UK holdings, significant contributors to Fund performance included Compass Group, a global leader in food-service management and support services and retailer Next PLC. Relative results also were supported by the Fund’s Canadian holdings. Strong stock selection, predominantly in the energy sector, enabled the Fund to deliver positive results in Canada for the reporting period, even as the index delivered negative results for the country.
In contrast, relative gains for the Fund were modestly offset by the negative impact of stock selection in Japan. While underweight exposure to the US was a drag on relative results, strong stock selection in the US enabled the Fund to outperform the index in this market, despite our underweight exposure.
Top stock-level contributors to Fund performance included US-based Apple and Gilead. Apple shares rose over the reporting period as the company launched the iPhone 5, which pre-sold five million units in its first weekend.1 This was 25% higher than last year’s release of the iPhone 4S.1 Gilead is an American biotechnology company and a leader in HIV combination therapy. The company received approval from the U.S. Food and
Drug Administration for its four-in-one HIV treatment pill Stribild. Earlier this year, Gilead acquired Pharmasset and its promising pipeline, including an all-oral treatment for hepatitis C. We believed that the addition of Pharmasset’s hepatitis C pipeline improved Gilead’s growth outlook.
The Fund’s positioning is driven by our stock selection process as opposed to top-down allocation decisions. In terms of sector positioning, at fiscal year-end, the Fund’s largest absolute and overweight positions were in the consumer discretionary, health care, telecommunication services, IT and energy sectors. The Fund ended the reporting period underweight in the consumer staples, industrials and materials sectors. From a geographic perspective, the Fund ended the fiscal year with overweight exposure to Europe and Asia relative to the index. Our allocation to the US remained underweight despite the addition of several new US holdings to the portfolio during the reporting period.
With market volatility likely to continue for some time, our focus remains on ensuring that our portfolio is comprised of high-quality, reasonably valued companies capable of sustained earnings growth. We believe that this balanced EQV-focused approach may help deliver attractive returns over the long term.
We thank you for your continued investment in Invesco Global Growth Fund.
| 1 | Source: Forbes |
The views and opinions expressed in management’s discussion of Fund performance are those of Invesco Advisers, Inc. These views and opinions are subject to change at any time based on factors such as market and economic conditions. These views and opinions may not be relied upon as investment advice or recommendations, or as an offer for a particular security. The information is not a complete analysis of every aspect of any market, country, industry, security or the Fund. Statements of fact are from sources considered reliable, but Invesco Advisers, Inc. makes no representation or warranty as to their completeness or accuracy. Although historical performance is no guarantee of future results, these insights may help you understand our investment management philosophy.
See important Fund and, if applicable, index disclosures later in this report.
 | Matthew Dennis Chartered Financial Analyst, portfolio manager, is lead manager of Invesco Global Growth Fund. | |
| He joined Invesco in 2000. Mr. Dennis earned a BA in economics from The University of Texas at Austin and an MS in finance from Texas A&M University. | ||
 | Ryan Amerman Chartered Financial Analyst, portfolio manager, is manager of Invesco Global Growth Fund. | |
| He joined Invesco in 1996. Mr. Amerman earned a BBA from Stephen F. Austin State University and an MBA from the University of St. Thomas. | ||
 | Mark Jason Chartered Financial Analyst, portfolio manager, is manager of Invesco Global Growth Fund. | |
| He joined Invesco in 2001. Mr. Jason earned a BS in finance and a BS in real estate from California State University, Northridge. | ||
5 Invesco Global Growth Fund
Your Fund’s Long-Term Performance
Results of a $10,000 Investment – Oldest Share Class(es)
Fund and index data from 10/31/02*
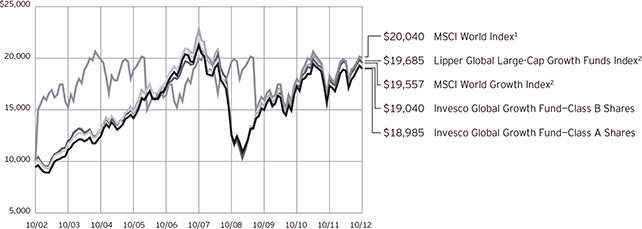
1 Source(s): Invesco, MSCI via FactSet Research Systems Inc.
2 Source: Lipper Inc.
| * | During the reporting period, Invesco changed its policy regarding growth of $10,000 charts. For funds older than 10 years, we previously showed performance since inception. Going forward, we will show performance for the most recent 10 years, since this more accurately reflects the experience of the typical shareholder. As a result, charts now may include benchmarks that did not appear previously, because the funds’ inception predated the benchmarks’ inception. Also, all charts will now be presented using a linear format. |
Past performance cannot guarantee comparable future results.
The data shown in the chart include reinvested distributions, applicable sales charges and Fund expenses including management fees. Results for Class B shares are calculated as if a hypothetical shareholder had liquidated his entire investment in the Fund at the close of the reporting period and paid the contingent deferred sales charges, if applicable.
Index results include reinvested dividends, but they do not reflect sales charges. Performance of the peer group, if applicable, reflects fund expenses and management fees; performance of a market index does not. Performance shown in the chart and table(s) does not reflect deduction of taxes a shareholder would pay on Fund distributions or sale of Fund shares.
6 Invesco Global Growth Fund
Average Annual Total Returns
As of 10/31/12, including maximum applicable sales charges
Class A Shares | ||||
Inception (9/15/94) | 5.68 | % | ||
10 Years | 6.62 | |||
5 Years | –3.33 | |||
1 Year | 3.54 | |||
Class B Shares | ||||
Inception (9/15/94) | 5.76 | % | ||
10 Years | 6.65 | |||
5 Years | –3.35 | |||
1 Year | 3.74 | |||
Class C Shares | ||||
Inception (8/4/97) | 2.49 | % | ||
10 Years | 6.49 | |||
5 Years | –2.96 | |||
1 Year | 7.74 | |||
Class Y Shares | ||||
10 Years | 7.34 | % | ||
5 Years | –2.03 | |||
1 Year | 9.83 | |||
Class R5 Shares | ||||
10 Years | 7.54 | % | ||
5 Years | –1.69 | |||
1 Year | 10.00 | |||
Class R6 Shares | ||||
10 Years | 7.23 | % | ||
5 Years | –2.23 | |||
1 Year | 9.58 | |||
Class Y shares incepted on October 3, 2008. Performance shown prior to that date is that of Class A shares and includes the 12b-1 fees applicable to Class A shares. Class A share performance reflects any applicable fee waivers or expense reimbursements.
Class R5 shares incepted on September 28, 2007. Performance shown prior to that date is that of Class A shares and includes the 12b-1 fees applicable to Class A shares. Class A share performance reflects any applicable fee waivers or expense reimbursements.
Class R6 shares incepted on September 24, 2012. Performance shown prior to that date is that of Class A shares and includes the 12b-1 fees applicable to Class A shares. Class A share performance reflects any applicable fee waivers or expense reimbursements.
The performance data quoted represent past performance and cannot guarantee comparable future
Average Annual Total Returns
As of 9/30/12, the most recent calendar quarter-end, including maximum applicable sales charges
Class A Shares | ||||
Inception (9/15/94) | 5.79 | % | ||
10 Years | 7.38 | |||
5 Years | –2.32 | |||
1 Year | 16.30 | |||
Class B Shares | ||||
Inception (9/15/94) | 5.87 | % | ||
10 Years | 7.42 | |||
5 Years | –2.34 | |||
1 Year | 17.16 | |||
Class C Shares | ||||
Inception (8/4/97) | 2.61 | % | ||
10 Years | 7.25 | |||
5 Years | –1.94 | |||
1 Year | 21.21 | |||
Class Y Shares | ||||
10 Years | 8.10 | % | ||
5 Years | –1.01 | |||
1 Year | 23.34 | |||
Class R5 Shares | ||||
10 Years | 8.30 | % | ||
5 Years | –0.64 | |||
1 Year | 23.55 | |||
Class R6 Shares | ||||
10 Years | 7.99 | % | ||
5 Years | –1.20 | |||
1 Year | 23.11 | |||
results; current performance may be lower or higher. Please visit invesco.com/performance for the most recent month-end performance. Performance figures reflect reinvested distributions, changes in net asset value and the effect of the maximum sales charge unless otherwise stated. Investment return and principal value will fluctuate so that you may have a gain or loss when you sell shares.
The total annual Fund operating expense ratio set forth in the most recent Fund prospectus as of the date of this report for Class A, Class B, Class C, Class Y, Class R5 and Class R6 shares was 1.56%, 2.31%, 2.31%, 1.31%, 1.07% and 1.07%, respectively. The expense ratios presented above may vary from the expense ratios presented in other sections of this report that are based on expenses incurred during the period covered by this report.
Class A share performance reflects the maximum 5.50% sales charge, and Class B and Class C share performance reflects the applicable contingent deferred sales charge (CDSC) for the period involved. The CDSC on Class B shares declines from 5% beginning at the time of purchase to 0% at the beginning of the seventh year. The CDSC on Class C shares is 1% for the first year after purchase. Class Y, Class R5 and Class R6 shares do not have a front-end sales charge or a CDSC; therefore, performance is at net asset value.
The performance of the Fund’s share classes will differ primarily due to different sales charge structures and class expenses.
7 Invesco Global Growth Fund
Invesco Global Growth Fund’s investment objective is long-term growth of capital.
| n | Unless otherwise stated, information presented in this report is as of October 31, 2012, and is based on total net assets. |
| n | Unless otherwise noted, all data provided by Invesco. |
| n | To access your Fund’s reports/prospectus, visit invesco.com/fundreports. |
About share classes
| n | Class B shares may not be purchased for new or additional investments. Please see the prospectus for more information. |
| n | Class Y shares are available only to certain investors. Please see the prospectus for more information. |
| n | Class R5 shares and Class R6 shares are primarily intended for retirement plans that meet certain standards and for institutional investors. On September 24, 2012, Institutional Class shares were renamed Class R5 shares. Please see the prospectus for more information. |
Principal risks of investing in the Fund
| n | Derivatives risk. The performance of derivative instruments is tied to the performance of an underlying currency, security, index or other instrument. In addition to risks relating to their underlying instruments, the use of derivatives may include other, possibly greater, risks. Derivatives involve costs, may be volatile, and may involve a small initial investment relative to the risk assumed. Risks associated with the use of derivatives include counterparty, leverage, correlation, liquidity, tax, market, interest rate and management risks. Derivatives may also be more difficult to purchase, sell or value than other investments. The Fund may lose more than the cash amount invested on investments in derivatives. |
Investors should bear in mind that, while the Fund intends to use derivative strategies, it is not obligated to actively engage in these transactions, generally or in any particular kind of derivative, if the investment manager elects not to do so due to availability, cost, market conditions or other factors.
| n | Developing/emerging markets securities risk. Securities issued by foreign companies and governments located in developing/emerging countries may be affected more negatively by inflation, devaluation of their currencies, higher transaction costs, delays in settlement, adverse political developments, the introduction of capital controls, withholding taxes, nationalization of private assets, expropriation, social unrest, war or lack of timely information than those in developed countries. |
| n | Foreign securities risk. The Fund’s foreign investments may be affected by changes in a foreign country’s exchange rates; political and social instability; changes in economic or taxation policies; difficulties when enforcing obligations; decreased liquidity; and increased volatility. Foreign companies may be subject to less regulation resulting in less publicly available information about the companies. |
| n | Growth investing risk. Growth stocks tend to be more expensive relative to their earnings or assets compared with other types of stock. As a result they tend to be more sensitive to changes in their earnings and can be more volatile. |
| n | Large capitalization company risk. Larger, more established companies may be unable to respond quickly to new competitive challenges such as changes in consumer tastes or innovative smaller competitors. Returns on investments in large capitalization companies could trail the returns on investments in smaller companies. |
| n | Management risk. The investment techniques and risk analysis used by the Fund’s portfolio managers may not produce the desired results. |
| n | Market risk. The prices of and the income generated by the Fund’s securities may decline in response to, among other things, investor sentiment, general economic and market conditions, regional or global instability, and currency and interest rate fluctuations. |
About indexes used in this report
| n | The MSCI World IndexSM is an unmanaged index considered representative of stocks of developed countries. |
| n | The MSCI World Growth Index is an unmanaged index considered representative of growth stocks of developed countries. |
| n | The Lipper Global Large-Cap Growth Funds Index is an unmanaged index considered representative of global large-cap growth funds tracked by Lipper. |
| n | The Fund is not managed to track the performance of any particular index, including the index(es) defined here, and consequently, the performance of the Fund may deviate significantly from the performance of the index(es). |
| n | A direct investment cannot be made in an index. Unless otherwise indicated, index results include reinvested dividends, and they do not reflect sales charges. Performance of the peer group, if applicable, reflects fund expenses; performance of a market index does not. |
Other information
| n | The returns shown in management’s discussion of Fund performance are based on net asset values calculated for shareholder transactions. Generally accepted accounting principles require adjustments to be made to the net assets of the Fund at period end for financial reporting purposes, and as such, the net asset values for shareholder transactions and the returns based on those net asset values may differ from the net asset values and returns reported in the Financial Highlights. |
| n | Industry classifications used in this report are generally according to the Global Industry Classification Standard, which was developed by and is the exclusive property and a service mark of MSCI Inc. and Standard & Poor’s. |
This report must be accompanied or preceded by a currently effective Fund prospectus, which contains more complete information, including sales charges and expenses. Investors should read it carefully before investing.
| NOT FDIC INSURED | MAY LOSE VALUE | NO BANK GUARANTEE |
Fund Nasdaq Symbols | ||
Class A Shares | AGGAX | |
Class B Shares | AGGBX | |
Class C Shares | AGGCX | |
Class Y Shares | AGGYX | |
Class R5 Shares | GGAIX | |
Class R6 Shares | AGGFX | |
8 Invesco Global Growth Fund
Schedule of Investments
October 31, 2012
| Shares | Value | |||||||
Common Stocks & Other Equity Interests–97.48% |
| |||||||
Australia–3.66% |
| |||||||
BHP Billiton Ltd. | 90,040 | $ | 3,175,115 | |||||
Brambles Ltd. | 517,484 | 3,890,752 | ||||||
CSL Ltd. | 20,869 | 1,025,214 | ||||||
WorleyParsons Ltd. | 128,625 | 3,281,332 | ||||||
| 11,372,413 | ||||||||
Belgium–2.24% |
| |||||||
Anheuser-Busch InBev N.V. | 83,325 | 6,973,174 | ||||||
Brazil–2.00% |
| |||||||
Banco Bradesco S.A.–ADR | 276,341 | 4,327,500 | ||||||
Cielo S.A. | 76,560 | 1,894,396 | ||||||
| 6,221,896 | ||||||||
Canada–3.19% |
| |||||||
CGI Group Inc.–Class A(a) | 106,923 | 2,796,694 | ||||||
Potash Corp. of Saskatchewan Inc. | 71,101 | 2,857,563 | ||||||
Suncor Energy, Inc. | 127,319 | 4,272,005 | ||||||
| 9,926,262 | ||||||||
China–4.08% |
| |||||||
Baidu, Inc.–ADR(a) | 37,013 | 3,946,326 | ||||||
China Mobile Ltd. | 235,000 | 2,606,226 | ||||||
CNOOC Ltd. | 1,115,000 | 2,299,087 | ||||||
Industrial & Commercial Bank of China Ltd.–Class H | 5,840,000 | 3,843,823 | ||||||
| 12,695,462 | ||||||||
Denmark–0.77% |
| |||||||
Novo Nordisk A.S.–Class B | 14,952 | 2,400,381 | ||||||
France–3.31% |
| |||||||
Cap Gemini S.A. | 61,040 | 2,572,650 | ||||||
L’Oreal S.A. | 16,632 | 2,122,334 | ||||||
Publicis Groupe S.A. | 39,622 | 2,137,745 | ||||||
Schneider Electric S.A. | 55,579 | 3,481,410 | ||||||
| 10,314,139 | ||||||||
Germany–6.02% |
| |||||||
Adidas AG | 64,538 | 5,497,315 | ||||||
Fresenius Medical Care AG & Co. KGaA | 36,172 | 2,540,172 | ||||||
SAP AG | 87,265 | 6,355,473 | ||||||
Volkswagen AG -Preference Shares | 21,022 | 4,347,889 | ||||||
| 18,740,849 | ||||||||
Hong Kong–1.66% |
| |||||||
Galaxy Entertainment Group Ltd.(a) | 877,000 | 2,997,358 | ||||||
Hutchison Whampoa Ltd. | 222,000 | 2,181,470 | ||||||
| 5,178,828 | ||||||||
| Shares | Value | |||||||
Ireland–1.35% |
| |||||||
WPP PLC | 324,397 | $ | 4,197,904 | |||||
Israel–2.95% |
| |||||||
Check Point Software Technologies Ltd.(a) | 64,922 | 2,890,977 | ||||||
Teva Pharmaceutical Industries Ltd.–ADR | 155,241 | 6,274,841 | ||||||
| 9,165,818 | ||||||||
Japan–4.83% |
| |||||||
Canon Inc. | 45,500 | 1,462,926 | ||||||
Fanuc Corp. | 14,900 | 2,389,324 | ||||||
Keyence Corp. | 15,600 | 4,133,531 | ||||||
Komatsu Ltd. | 69,300 | 1,451,454 | ||||||
Nidec Corp. | 21,800 | 1,540,660 | ||||||
Toyota Motor Corp. | 45,800 | 1,770,697 | ||||||
Yamada Denki Co., Ltd. | 52,450 | 2,273,293 | ||||||
| 15,021,885 | ||||||||
Mexico–2.45% |
| |||||||
America Movil S.A.B. de C.V.–ADR | 123,126 | 3,113,856 | ||||||
Grupo Televisa S.A.B.–ADR | 199,008 | 4,497,581 | ||||||
| 7,611,437 | ||||||||
Netherlands–1.48% |
| |||||||
Unilever N.V. | 125,785 | 4,617,925 | ||||||
Russia–0.52% |
| |||||||
Gazprom OAO–ADR | 177,640 | 1,629,971 | ||||||
Singapore–0.65% |
| |||||||
United Overseas Bank Ltd. | 136,000 | 2,027,850 | ||||||
South Korea–2.05% |
| |||||||
Hyundai Mobis | 16,394 | 4,152,861 | ||||||
NHN Corp. | 9,614 | 2,225,667 | ||||||
| 6,378,528 | ||||||||
Spain–1.49% |
| |||||||
Amadeus IT Holding S.A.–Class A | 187,452 | 4,648,606 | ||||||
Sweden–3.36% |
| |||||||
Investment AB Kinnevik–Class B | 117,866 | 2,256,346 | ||||||
Swedbank AB–Class A | 149,771 | 2,776,128 | ||||||
Telefonaktiebolaget LM Ericsson–Class B | 307,159 | 2,715,415 | ||||||
Volvo AB–Class B | 201,800 | 2,720,887 | ||||||
| 10,468,776 | ||||||||
Switzerland–6.52% |
| |||||||
ABB Ltd.(a) | 177,654 | 3,209,775 | ||||||
Julius Baer Group Ltd.(a) | 76,121 | 2,645,008 | ||||||
Nestle S.A. | 37,710 | 2,392,551 | ||||||
Novartis AG | 53,446 | 3,221,250 | ||||||
See accompanying Notes to Financial Statements which are an integral part of the financial statements.
9 Invesco Global Growth Fund
| Shares | Value | |||||||
Switzerland–(continued) |
| |||||||
Roche Holding AG | 22,517 | $ | 4,334,200 | |||||
Syngenta AG | 11,471 | 4,488,898 | ||||||
| 20,291,682 | ||||||||
Taiwan–0.79% |
| |||||||
Taiwan Semiconductor Manufacturing Co. Ltd. | 805,428 | 2,445,537 | ||||||
United Kingdom–13.41% |
| |||||||
BG Group PLC | 240,099 | 4,454,579 | ||||||
British American Tobacco PLC | 53,249 | 2,641,996 | ||||||
British Sky Broadcasting Group PLC | 140,655 | 1,611,406 | ||||||
Centrica PLC | 411,347 | 2,153,643 | ||||||
Compass Group PLC | 442,825 | 4,865,866 | ||||||
Imperial Tobacco Group PLC | 156,585 | 5,920,492 | ||||||
Kingfisher PLC | 748,824 | 3,504,714 | ||||||
Next PLC | 76,863 | 4,431,570 | ||||||
Reed Elsevier PLC | 579,919 | 5,681,515 | ||||||
Royal Dutch Shell PLC–Class B | 113,361 | 4,002,103 | ||||||
Smith & Nephew PLC | 233,840 | 2,473,411 | ||||||
| 41,741,295 | ||||||||
United States–28.70% |
| |||||||
Accenture PLC–Class A | 67,613 | 4,557,792 | ||||||
Amphenol Corp.–Class A | 30,715 | 1,846,893 | ||||||
Apple Inc. | 16,036 | 9,543,024 | ||||||
Avago Technologies Ltd. | 67,035 | 2,214,166 | ||||||
Broadcom Corp.–Class A(a) | 41,695 | 1,314,852 | ||||||
Cameron International Corp.(a) | 60,142 | 3,045,591 | ||||||
Cardinal Health, Inc. | 80,829 | 3,324,497 | ||||||
Celgene Corp.(a) | 35,959 | 2,636,514 | ||||||
Chubb Corp. (The) | 24,686 | 1,900,328 | ||||||
Cisco Systems, Inc. | 216,407 | 3,709,216 | ||||||
| Shares | Value | |||||||
United States–(continued) |
| |||||||
Comcast Corp.-Class A | 98,533 | $ | 3,695,973 | |||||
DIRECTV(a) | 76,800 | 3,925,248 | ||||||
EMC Corp.(a) | 144,306 | 3,523,953 | ||||||
Express Scripts Holding Co.(a) | 38,219 | 2,351,997 | ||||||
Exxon Mobil Corp. | 17,404 | 1,586,723 | ||||||
First Republic Bank | 78,187 | 2,685,723 | ||||||
Gilead Sciences, Inc.(a) | 58,320 | 3,916,771 | ||||||
Google Inc.–Class A(a) | 7,471 | 5,080,280 | ||||||
Home Depot, Inc. (The) | 39,339 | 2,414,628 | ||||||
Ingersoll-Rand PLC | 72,007 | 3,386,489 | ||||||
Joy Global Inc. | 34,055 | 2,126,735 | ||||||
JPMorgan Chase & Co. | 44,444 | 1,852,426 | ||||||
Macy’s, Inc. | 70,867 | 2,697,907 | ||||||
Microsoft Corp. | 182,314 | 5,202,330 | ||||||
Mosaic Co. (The) | 29,373 | 1,537,383 | ||||||
Occidental Petroleum Corp. | 38,349 | 3,028,037 | ||||||
QUALCOMM, Inc. | 51,691 | 3,027,800 | ||||||
Scripps Networks Interactive–Class A | 52,821 | 3,207,291 | ||||||
| 89,340,567 | ||||||||
Total Common Stocks & Other Equity Interests |
| 303,411,185 | ||||||
Money Market Funds–2.65% |
| |||||||
Liquid Assets Portfolio–Institutional | 4,117,604 | 4,117,604 | ||||||
Premier Portfolio–Institutional Class(b) | 4,117,603 | 4,117,603 | ||||||
Total Money Market Funds (Cost $8,235,207) | 8,235,207 | |||||||
TOTAL INVESTMENTS—100.13% (Cost $267,864,842) |
| 311,646,392 | ||||||
OTHER ASSETS LESS LIABILITIES—(0.13)% |
| (402,226 | ) | |||||
NET ASSETS—100.00% |
| $ | 311,244,166 | |||||
Investment Abbreviations:
| ADR | – American Depositary Receipt |
Notes to Schedule of Investments:
| (a) | Non-income producing security. |
| (b) | The money market fund and the Fund are affiliated by having the same investment adviser. |
See accompanying Notes to Financial Statements which are an integral part of the financial statements.
10 Invesco Global Growth Fund
Statement of Assets and Liabilities
October 31, 2012
Assets: |
| |||
Investments, at value (Cost $259,629,635) | $ | 303,411,185 | ||
Investments in affiliated money market funds, at value and cost | 8,235,207 | |||
Total investments, at value (Cost $267,864,842) | 311,646,392 | |||
Foreign currencies, at value (Cost $181,200) | 185,126 | |||
Receivable for: | ||||
Investments sold | 899,042 | |||
Fund shares sold | 58,382 | |||
Dividends | 556,684 | |||
Fund expenses absorbed | 19,748 | |||
Deposits with sub-custodian (Cost $352,001) | 360,158 | |||
Investment for trustee deferred compensation and retirement plans | 65,281 | |||
Other assets | 36,251 | |||
Total assets | 313,827,064 | |||
Liabilities: |
| |||
Payable for: | ||||
Investments purchased | 1,384,128 | |||
Fund shares reacquired | 504,628 | |||
Accrued fees to affiliates | 454,237 | |||
Accrued other operating expenses | 107,471 | |||
Trustee deferred compensation and retirement plans | 132,434 | |||
Total liabilities | 2,582,898 | |||
Net assets applicable to shares outstanding | $ | 311,244,166 | ||
Net assets consist of: |
| |||
Shares of beneficial interest | $ | 269,887,337 | ||
Undistributed net investment income | 2,318,624 | |||
Undistributed net realized gain (loss) | (4,739,876 | ) | ||
Unrealized appreciation | 43,778,081 | |||
| $ | 311,244,166 | |||
Net Assets: |
| |||
Class A | $ | 277,312,748 | ||
Class B | $ | 9,367,553 | ||
Class C | $ | 21,803,243 | ||
Class Y | $ | 2,372,016 | ||
Class R5 | $ | 378,874 | ||
Class R6 | $ | 9,732 | ||
Shares outstanding, $0.001 par value per share, |
| |||
Class A | 11,448,930 | |||
Class B | 413,793 | |||
Class C | 962,841 | |||
Class Y | 97,635 | |||
Class R5 | 15,670 | |||
Class R6 | 402.6 | |||
Class A: | ||||
Net asset value per share | $ | 24.22 | ||
Maximum offering price per share | ||||
(Net asset value of $24.22 ¸ 94.50%) | $ | 25.63 | ||
Class B: | ||||
Net asset value and offering price per share | $ | 22.64 | ||
Class C: | ||||
Net asset value and offering price per share | $ | 22.64 | ||
Class Y: | ||||
Net asset value and offering price per share | $ | 24.29 | ||
Class R5: | ||||
Net asset value and offering price per share | $ | 24.18 | ||
Class R6: | ||||
Net asset value and offering price per share | $ | 24.17 | ||
See accompanying Notes to Financial Statements which are an integral part of the financial statements.
11 Invesco Global Growth Fund
Statement of Operations
For the year ended October 31, 2012
Investment income: |
| |||
Dividends (net of foreign withholding taxes of $480,907) | $ | 6,564,471 | ||
Dividends from affiliated money market funds | 14,888 | |||
Total investment income | 6,579,359 | |||
Expenses: | ||||
Advisory fees | 2,395,209 | |||
Administrative services fees | 102,951 | |||
Custodian fees | 93,632 | |||
Distribution fees: | ||||
Class A | 666,928 | |||
Class B | 108,622 | |||
Class C | 205,279 | |||
Transfer agent fees — A, B, C and Y | 1,030,625 | |||
Transfer agent fees — R5 | 54 | |||
Trustees’ and officers’ fees and benefits | 34,819 | |||
Other | 297,013 | |||
Total expenses | 4,935,132 | |||
Less: Fees waived, expenses reimbursed and expense offset arrangement(s) | (668,921 | ) | ||
Net expenses | 4,266,211 | |||
Net investment income | 2,313,148 | |||
Realized and unrealized gain (loss) from: | ||||
Net realized gain (loss) from: | ||||
Investment securities (includes net gains (losses) from securities sold to affiliates of $(336,211)) | 18,454,167 | |||
Foreign currencies (net of foreign taxes of $3,486) | (176,243 | ) | ||
| 18,277,924 | ||||
Change in net unrealized appreciation (depreciation) of: | ||||
Investment securities | 14,495,772 | |||
Foreign currencies | (89,929 | ) | ||
| 14,405,843 | ||||
Net realized and unrealized gain | 32,683,767 | |||
Net increase in net assets resulting from operations | $ | 34,996,915 | ||
See accompanying Notes to Financial Statements which are an integral part of the financial statements.
12 Invesco Global Growth Fund
Statement of Changes in Net Assets
October 31, 2012
| 2012 | 2011 | |||||||
Operations: | ||||||||
Net investment income | $ | 2,313,148 | $ | 960,388 | ||||
Net realized gain | 18,277,924 | 14,294,101 | ||||||
Change in net unrealized appreciation (depreciation) | 14,405,843 | (13,359,246 | ) | |||||
Net increase in net assets resulting from operations | 34,996,915 | 1,895,243 | ||||||
Distributions to shareholders from net investment income: | ||||||||
Class A | (1,135,136 | ) | (1,239,504 | ) | ||||
Class Y | (13,183 | ) | (11,973 | ) | ||||
Class R5 | (4,589 | ) | (99 | ) | ||||
Total distributions from net investment income | (1,152,908 | ) | (1,251,576 | ) | ||||
Share transactions–net: | ||||||||
Class A | 61,731,699 | (23,374,415 | ) | |||||
Class B | (2,448,098 | ) | (5,105,489 | ) | ||||
Class C | 8,505,195 | (2,089,321 | ) | |||||
Class Y | 754,792 | 279,528 | ||||||
Class R5 | 42,272 | 277,310 | ||||||
Class R6 | 10,000 | — | ||||||
Net increase (decrease) in net assets resulting from share transactions | 68,595,860 | (30,012,387 | ) | |||||
Net increase (decrease) in net assets | 102,439,867 | (29,368,720 | ) | |||||
Net assets: | ||||||||
Beginning of year | 208,804,299 | 238,173,019 | ||||||
End of year (includes undistributed net investment income of $2,318,624 and $1,025,140, respectively) | $ | 311,244,166 | $ | 208,804,299 | ||||
Notes to Financial Statements
October 31, 2012
NOTE 1—Significant Accounting Policies
Invesco Global Growth Fund (the “Fund”) is a series portfolio of AIM International Mutual Funds (Invesco International Mutual Funds) (the “Trust”). The Trust is a Delaware statutory trust registered under the Investment Company Act of 1940, as amended (the “1940 Act”), as an open-end series management investment company consisting of eight separate portfolios, each authorized to issue an unlimited number of shares of beneficial interest. The assets, liabilities and operations of each portfolio are accounted for separately. Information presented in these financial statements pertains only to the Fund. Matters affecting each portfolio or class will be voted on exclusively by the shareholders of such portfolio or class.
The Fund’s investment objective is long-term growth of capital.
The Fund currently consists of six different classes of shares: Class A, Class B, Class C, Class Y, Class R5 and Class R6. On September 24, 2012, Institutional Class shares were renamed Class R5 shares and the Fund began offering Class R6 shares. Class A shares are sold with a front-end sales charge unless certain waiver criteria are met and under certain circumstances load waived shares may be subject to contingent deferred sales charges (“CDSC”). Class C shares are sold with a CDSC. Class Y, Class R5 and Class R6 shares are sold at net asset value. Effective November 30, 2010, new or additional investments in Class B shares are no longer permitted. Existing shareholders of Class B shares may continue to reinvest dividends and capital gains distributions in Class B shares until they convert to Class A shares. Also, shareholders in Class B shares will be able to exchange those shares for Class B shares of other Invesco Funds offering such shares until they convert to Class A shares. Generally, Class B shares will automatically convert to Class A shares on or about the month-end, which is at least eight years after the date of purchase. Redemption of Class B shares prior to the conversion date will be subject to a CDSC.
The following is a summary of the significant accounting policies followed by the Fund in the preparation of its financial statements.
| A. | Security Valuations — Securities, including restricted securities, are valued according to the following policy. |
A security listed or traded on an exchange (except convertible bonds) is valued at its last sales price or official closing price as of the close of the customary trading session on the exchange where the security is principally traded, or lacking any sales or official closing price on a particular day, the security may be valued at the closing bid price on that day. Securities traded in the over-the-counter market are valued based on prices furnished by independent pricing services or market makers. When such securities are valued by an independent pricing service they may be considered fair valued. Futures contracts are valued at the final settlement price set by an exchange on which they are principally traded. Listed options are valued at the mean between the last bid and ask prices from the exchange on which they are principally traded. Options not listed on an exchange are valued by an independent source at the mean between the last bid and ask prices. For purposes of determining net asset value per share, futures and option contracts generally are valued 15 minutes after the close of the customary trading session of the New York Stock Exchange (“NYSE”).
13 Invesco Global Growth Fund
Investments in open-end and closed-end registered investment companies that do not trade on an exchange are valued at the end of day net asset value per share. Investments in open-end and closed-end registered investment companies that trade on an exchange are valued at the last sales price or official closing price as of the close of the customary trading session on the exchange where the security is principally traded.
Debt obligations (including convertible bonds) and unlisted equities are fair valued using an evaluated quote provided by an independent pricing service. Evaluated quotes provided by the pricing service may be determined without exclusive reliance on quoted prices, and may reflect appropriate factors such as institution-size trading in similar groups of securities, developments related to specific securities, dividend rate, yield, quality, type of issue, coupon rate, maturity, individual trading characteristics and other market data. Debt securities are subject to interest rate and credit risks. In addition, all debt securities involve some risk of default with respect to interest and/or principal payments.
Foreign securities (including foreign exchange contracts) are converted into U.S. dollar amounts using the applicable exchange rates as of the close of the NYSE. If market quotations are available and reliable for foreign exchange traded equity securities, the securities will be valued at the market quotations. Because trading hours for certain foreign securities end before the close of the NYSE, closing market quotations may become unreliable. If between the time trading ends on a particular security and the close of the customary trading session on the NYSE, events occur that are significant and make the closing price unreliable, the Fund may fair value the security. If the event is likely to have affected the closing price of the security, the security will be valued at fair value in good faith using procedures approved by the Board of Trustees. Adjustments to closing prices to reflect fair value may also be based on a screening process of an independent pricing service to indicate the degree of certainty, based on historical data, that the closing price in the principal market where a foreign security trade is not the current value as of the close of the NYSE. Foreign securities meeting the approved degree of certainty that the price is not reflective of current value will be priced at the indication of fair value from the independent pricing service. Multiple factors may be considered by the independent pricing service in determining adjustments to reflect fair value and may include information relating to sector indices, American Depositary Receipts and domestic and foreign index futures. Foreign securities may have additional risks including exchange rate changes, potential for sharply devalued currencies and high inflation, political and economic upheaval, the relative lack of issuer information, relatively low market liquidity and the potential lack of strict financial and accounting controls and standards.
Securities for which market prices are not provided by any of the above methods may be valued based upon quotes furnished by independent sources. The last bid price may be used to value equity securities. The mean between the last bid and asked prices is used to value debt obligations, including corporate loans.
Securities for which market quotations are not readily available or are unreliable are valued at fair value as determined in good faith by or under the supervision of the Trust’s officers following procedures approved by the Board of Trustees. Issuer specific events, market trends, bid/ask quotes of brokers and information providers and other market data may be reviewed in the course of making a good faith determination of a security’s fair value.
Valuations change in response to many factors including the historical and prospective earnings of the issuer, the value of the issuer’s assets, general economic conditions, interest rates, investor perceptions and market liquidity. Because of the inherent uncertainties of valuation, the values reflected in the financial statements may materially differ from the value received upon actual sale of those investments.
| B. | Securities Transactions and Investment Income — Securities transactions are accounted for on a trade date basis. Realized gains or losses on sales are computed on the basis of specific identification of the securities sold. Interest income is recorded on the accrual basis from settlement date. Dividend income (net of withholding tax, if any) is recorded on the ex-dividend date. |
The Fund may periodically participate in litigation related to Fund investments. As such, the Fund may receive proceeds from litigation settlements. Any proceeds received are included in the Statement of Operations as realized gain (loss) for investments no longer held and as unrealized gain (loss) for investments still held.
Brokerage commissions and mark ups are considered transaction costs and are recorded as an increase to the cost basis of securities purchased and/or a reduction of proceeds on a sale of securities. Such transaction costs are included in the determination of net realized and unrealized gain (loss) from investment securities reported in the Statement of Operations and the Statement of Changes in Net Assets and the net realized and unrealized gains (losses) on securities per share in the Financial Highlights. Transaction costs are included in the calculation of the Fund’s net asset value and, accordingly, they reduce the Fund’s total returns. These transaction costs are not considered operating expenses and are not reflected in net investment income reported in the Statement of Operations and Statement of Changes in Net Assets, or the net investment income per share and ratios of expenses and net investment income reported in the Financial Highlights, nor are they limited by any expense limitation arrangements between the Fund and the investment adviser.
The Fund allocates income and realized and unrealized capital gains and losses to a class based on the relative net assets of each class.
| C. | Country Determination — For the purposes of making investment selection decisions and presentation in the Schedule of Investments, the investment adviser may determine the country in which an issuer is located and/or credit risk exposure based on various factors. These factors include the laws of the country under which the issuer is organized, where the issuer maintains a principal office, the country in which the issuer derives 50% or more of its total revenues and the country that has the primary market for the issuer’s securities, as well as other criteria. Among the other criteria that may be evaluated for making this determination are the country in which the issuer maintains 50% or more of its assets, the type of security, financial guarantees and enhancements, the nature of the collateral and the sponsor organization. Country of issuer and/or credit risk exposure has been determined to be the United States of America, unless otherwise noted. |
| D. | Distributions — Distributions from income and net realized capital gain, if any, are generally declared and paid annually and recorded on the ex-dividend date. The Fund may elect to treat a portion of the proceeds from redemptions as distributions for federal income tax purposes. |
| E. | Federal Income Taxes — The Fund intends to comply with the requirements of Subchapter M of the Internal Revenue Code necessary to qualify as a regulated investment company and to distribute substantially all of the Fund’s taxable earnings to shareholders. As such, the Fund will not be subject to federal income taxes on otherwise taxable income (including net realized capital gain) that is distributed to shareholders. Therefore, no provision for federal income taxes is recorded in the financial statements. |
The Fund files tax returns in the U.S. Federal jurisdiction and certain other jurisdictions. Generally, the Fund is subject to examinations by such taxing authorities for up to three years after the filing of the return for the tax period.
14 Invesco Global Growth Fund
| F. | Expenses — Fees provided for under the Rule 12b-1 plan of a particular class of the Fund are charged to the operations of such class. Transfer agency fees and expenses and other shareholder recordkeeping fees and expenses attributable to Class R5 and Class R6 are allocated to each share class based on relative net assets. Sub-accounting fees attributable to Class R5 are charged to the operations of the class. Transfer agency fees and expenses and other shareholder recordkeeping fees and expenses relating to all other classes are allocated among those classes based on relative net assets. All other expenses are allocated among the classes based on relative net assets. |
| G. | Accounting Estimates — The preparation of financial statements in conformity with accounting principles generally accepted in the United States of America (“GAAP”) requires management to make estimates and assumptions that affect the reported amounts of assets and liabilities at the date of the financial statements and the reported amounts of revenues and expenses during the reporting period including estimates and assumptions related to taxation. Actual results could differ from those estimates by a significant amount. In addition, the Fund monitors for material events or transactions that may occur or become known after the period-end date and before the date the financial statements are released to print. |
| H. | Indemnifications — Under the Trust’s organizational documents, each Trustee, officer, employee or other agent of the Trust is indemnified against certain liabilities that may arise out of the performance of their duties to the Fund. Additionally, in the normal course of business, the Fund enters into contracts, including the Fund’s servicing agreements, that contain a variety of indemnification clauses. The Fund’s maximum exposure under these arrangements is unknown as this would involve future claims that may be made against the Fund that have not yet occurred. The risk of material loss as a result of such indemnification claims is considered remote. |
| I. | Redemption Fees — The Fund had a 2% redemption fee that was retained by the Fund to offset transaction costs and other expenses associated with short-term redemptions and exchanges. The fee, subject to certain exceptions, was imposed on certain redemptions or exchanges of shares within 31 days of purchase. The redemption fee was recorded as an increase in shareholder capital and was allocated among the share classes based on the relative net assets of each class. Effective January 1, 2012, the Fund eliminated the 2% redemption fee assessed on shares of the Fund redeemed or exchanged within 31 days of purchase. |
| J. | Foreign Currency Translations — Foreign currency is valued at the close of the NYSE based on quotations posted by banks and major currency dealers. Portfolio securities and other assets and liabilities denominated in foreign currencies are translated into U.S. dollar amounts at date of valuation. Purchases and sales of portfolio securities (net of foreign taxes withheld on disposition) and income items denominated in foreign currencies are translated into U.S. dollar amounts on the respective dates of such transactions. The Fund does not separately account for the portion of the results of operations resulting from changes in foreign exchange rates on investments and the fluctuations arising from changes in market prices of securities held. The combined results of changes in foreign exchange rates and the fluctuation of market prices on investments (net of estimated foreign tax withholding) are included with the net realized and unrealized gain or loss from investments in the Statement of Operations. Reported net realized foreign currency gains or losses arise from (1) sales of foreign currencies, (2) currency gains or losses realized between the trade and settlement dates on securities transactions, and (3) the difference between the amounts of dividends, interest, and foreign withholding taxes recorded on the Fund’s books and the U.S. dollar equivalent of the amounts actually received or paid. Net unrealized foreign currency gains and losses arise from changes in the fair values of assets and liabilities, other than investments in securities at fiscal period end, resulting from changes in exchange rates. |
The Fund may invest in foreign securities which may be subject to foreign taxes on income, gains on investments or currency repatriation, a portion of which may be recoverable.
| K. | Foreign Currency Contracts — The Fund may enter into foreign currency contracts to manage or minimize currency or exchange rate risk. The Fund may also enter into foreign currency contracts for the purchase or sale of a security denominated in a foreign currency in order to “lock in” the U.S. dollar price of that security. A foreign currency contract is an obligation to purchase or sell a specific currency for an agreed-upon price at a future date. The use of foreign currency contracts does not eliminate fluctuations in the price of the underlying securities the Fund owns or intends to acquire but establishes a rate of exchange in advance. Fluctuations in the value of these contracts are measured by the difference in the contract date and reporting date exchange rates and are recorded as unrealized appreciation (depreciation) until the contracts are closed. When the contracts are closed, realized gains (losses) are recorded. Realized and unrealized gains (losses) on the contracts are included in the Statement of Operations. The primary risks associated with foreign currency contracts include failure of the counterparty to meet the terms of the contract and the value of the foreign currency changing unfavorably. These risks may be in excess of the amounts reflected in the Statement of Assets and Liabilities. |
NOTE 2—Advisory Fees and Other Fees Paid to Affiliates
The Trust has entered into a master investment advisory agreement with Invesco Advisers, Inc. (the “Adviser” or “Invesco”). Under the terms of the investment advisory agreement, the Fund pays an advisory fee to the Adviser based on the annual rate of the Fund’s average daily net assets as follows:
| Average Daily Net Assets | Rate | |||
First $250 million | 0.80% | |||
Next $250 million | 0.78% | |||
Next $500 million | 0.76% | |||
Next $1.5 billion | 0.74% | |||
Next $2.5 billion | 0.72% | |||
Next $2.5 billion | 0.70% | |||
Next $2.5 billion | 0.68% | |||
Over $10 billion | 0.66% | |||
15 Invesco Global Growth Fund
Under the terms of a master sub-advisory agreement between the Adviser and each of Invesco Asset Management Deutschland GmbH, Invesco Asset Management Limited, Invesco Asset Management (Japan) Limited, Invesco Australia Limited, Invesco Hong Kong Limited, Invesco Senior Secured Management, Inc., Invesco Canada Ltd. and Invesco PowerShares Capital Management LLC (collectively, the “Affiliated Sub-Advisers”) the Adviser, not the Fund, may pay 40% of the fees paid to the Adviser to any such Affiliated Sub-Adviser(s) that provide discretionary investment management services to the Fund based on the percentage of assets allocated to such Sub-Adviser(s).
Effective December 19, 2011, the Adviser has contractually agreed, through at least December 31, 2012, to waive advisory fees and/or reimburse expenses of all shares to the extent necessary to limit total annual fund operating expenses after fee waiver and/or expense reimbursement (excluding certain items discussed below) of Class A, Class B, Class C, Class Y, Class R5 and Class R6 shares to 1.32%, 2.07%, 2.07%, 1.07%, 1.07% and 1.07%, respectively, of average daily net assets. Prior to December 19, 2011, the Adviser had contractually agreed to waive advisory fees and/or reimburse expenses of all shares to the extent necessary to limit total annual fund operating expenses after fee waiver and/or expense reimbursement (excluding certain items discussed below) of Class A, Class B, Class C, Class Y and Class R5 shares to 2.25%, 3.00%, 3.00%, 2.00% and 2.00%, respectively, of average daily net assets. In determining the Adviser’s obligation to waive advisory fees and/or reimburse expenses, the following expenses are not taken into account, and could cause the total annual fund operating expenses after fee waiver and/or expense reimbursement to exceed the numbers reflected above: (1) interest; (2) taxes; (3) dividend expense on short sales; (4) extraordinary or non-routine items, litigation expenses; and (5) expenses that the Fund has incurred but did not actually pay because of an expense offset arrangement. Unless the Board of Trustees and Invesco mutually agree to amend or continue the fee waiver agreement, it will terminate on December 31, 2012.
The Adviser has contractually agreed, through at least June 30, 2013, to waive the advisory fee payable by the Fund in an amount equal to 100% of the net advisory fees the Adviser receives from the affiliated money market funds on investments by the Fund of uninvested cash in such affiliated money market funds.
For the year ended October 31, 2012, the Adviser waived advisory fees of $15,005 and reimbursed class level expenses of $578,782, $23,566, $44,537 and $4,671 for Class A, Class B, Class C and Class Y shares, respectively.
The Trust has entered into a transfer agency and service agreement with Invesco Investment Services, Inc. (“IIS”) pursuant to which the Fund has agreed to pay IIS a fee for providing transfer agency and shareholder services to the Fund and reimburse IIS for certain expenses incurred by IIS in the course of providing such services. IIS may make payments to intermediaries that provide omnibus account services, sub-accounting services and/or networking services. All fees payable by IIS to intermediaries that provide omnibus account services or sub-accounting are charged back to the Fund, subject to certain limitations approved by the Trust’s Board of Trustees. For the year ended October 31, 2012, expenses incurred under the agreement are shown in the Statement of Operations as Transfer agent fees.
The Trust has entered into a master administrative services agreement with Invesco pursuant to which the Fund has agreed to pay Invesco for certain administrative costs incurred in providing accounting services to the Fund. For the year ended October 31, 2012, expenses incurred under the agreement are shown in the Statement of Operations as Administrative services fees.
The Trust has entered into master distribution agreements with Invesco Distributors, Inc. (“IDI”) to serve as the distributor for the Class A, Class B, Class C, Class Y, Class R5 and Class R6 shares of the Fund. The Trust has adopted plans pursuant to Rule 12b-1 under the 1940 Act with respect to the Fund’s Class A, Class B and Class C shares (collectively, the “Plans”). The Fund, pursuant to the Plans, pays IDI compensation at the annual rate of 0.25% of the Fund’s average daily net assets of Class A shares and 1.00% of the average daily net assets of Class B and Class C shares. Of the Plan payments, up to 0.25% of the average daily net assets of each class of shares may be paid to furnish continuing personal shareholder services to customers who purchase and own shares of such classes. Any amounts not paid as a service fee under the Plans would constitute an asset-based sales charge. Rules of the Financial Industry Regulatory Authority (“FINRA”) impose a cap on the total sales charges, including asset-based sales charges, that may be paid by any class of shares of the Fund. For the year ended October 31, 2012, expenses incurred under the Plans are shown in the Statement of Operations as Distribution fees.
Front-end sales commissions and CDSC (collectively, the “sales charges”) are not recorded as expenses of the Fund. Front-end sales commissions are deducted from proceeds from the sales of Fund shares prior to investment in Class A shares of the Fund. CDSC are deducted from redemption proceeds prior to remittance to the shareholder. During the year ended October 31, 2012, IDI advised the Fund that IDI retained $11,968 in front-end sales commissions from the sale of Class A shares and $4, $10,908 and $1,156 from Class A, Class B and Class C shares, respectively, for CDSC imposed on redemptions by shareholders.
Certain officers and trustees of the Trust are officers and directors of the Adviser, IIS and/or IDI.
NOTE 3—Additional Valuation Information
GAAP defines fair value as the price that would be received to sell an asset or paid to transfer a liability in an orderly transaction between market participants at the measurement date, under current market conditions. GAAP establishes a hierarchy that prioritizes the inputs to valuation methods giving the highest priority to readily available unadjusted quoted prices in an active market for identical assets (Level 1) and the lowest priority to significant unobservable inputs (Level 3) generally when market prices are not readily available or are unreliable. Based on the valuation inputs, the securities or other investments are tiered into one of three levels. Changes in valuation methods may result in transfers in or out of an investment’s assigned level:
| Level 1 — | Prices are determined using quoted prices in an active market for identical assets. |
| Level 2 — | Prices are determined using other significant observable inputs. Observable inputs are inputs that other market participants may use in pricing a security. These may include quoted prices for similar securities, interest rates, prepayment speeds, credit risk, yield curves, loss severities, default rates, discount rates, volatilities and others. |
| Level 3 — | Prices are determined using significant unobservable inputs. In situations where quoted prices or observable inputs are unavailable (for example, when there is little or no market activity for an investment at the end of the period), unobservable inputs may be used. Unobservable inputs reflect the Fund’s own assumptions about the factors market participants would use in determining fair value of the securities or instruments and would be based on the best available information. |
16 Invesco Global Growth Fund
The following is a summary of the tiered valuation input levels, as of October 31, 2012. The level assigned to the securities valuations may not be an indication of the risk or liquidity associated with investing in those securities. Because of the inherent uncertainties of valuation, the values reflected in the financial statements may materially differ from the value received upon actual sale of those investments.
During the year ended October 31, 2012, there were transfers from Level 1 to Level 2 of $11,712,251 and from Level 2 to Level 1 of $39,529,631, due to foreign fair value adjustments.
| Level 1 | Level 2 | Level 3 | Total | |||||||||||||
Australia | $ | — | $ | 11,372,413 | $ | — | $ | 11,372,413 | ||||||||
Belgium | — | 6,973,174 | — | 6,973,174 | ||||||||||||
Brazil | 6,221,896 | — | — | 6,221,896 | ||||||||||||
Canada | 9,926,262 | — | 9,926,262 | |||||||||||||
China | 6,552,552 | 6,142,910 | — | 12,695,462 | ||||||||||||
Denmark | — | 2,400,381 | — | 2,400,381 | ||||||||||||
France | — | 10,314,139 | — | 10,314,139 | ||||||||||||
Germany | 18,740,849 | — | — | 18,740,849 | ||||||||||||
Hong Kong | — | 5,178,828 | — | 5,178,828 | ||||||||||||
Ireland | — | 4,197,904 | — | 4,197,904 | ||||||||||||
Israel | 9,165,818 | — | — | 9,165,818 | ||||||||||||
Japan | 3,724,748 | 11,297,137 | — | 15,021,885 | ||||||||||||
Mexico | 7,611,437 | — | — | 7,611,437 | ||||||||||||
Netherlands | 4,617,925 | — | — | 4,617,925 | ||||||||||||
Russia | — | 1,629,971 | — | 1,629,971 | ||||||||||||
Singapore | — | 2,027,850 | — | 2,027,850 | ||||||||||||
South Korea | 2,225,667 | 4,152,861 | — | 6,378,528 | ||||||||||||
Spain | — | 4,648,606 | — | 4,648,606 | ||||||||||||
Sweden | 2,776,128 | 7,692,648 | — | 10,468,776 | ||||||||||||
Switzerland | 2,392,551 | 17,899,131 | — | 20,291,682 | ||||||||||||
Taiwan | 2,445,537 | — | — | 2,445,537 | ||||||||||||
United Kingdom | — | 41,741,295 | — | 41,741,295 | ||||||||||||
United States | 97,575,774 | — | — | 97,575,774 | ||||||||||||
Total Investments | $ | 173,977,144 | $ | 137,669,248 | $ | — | $ | 311,646,392 | ||||||||
NOTE 4—Security Transactions with Affiliated Funds
The Fund is permitted to purchase or sell securities from or to certain other Invesco Funds under specified conditions outlined in procedures adopted by the Board of Trustees of the Trust. The procedures have been designed to ensure that any purchase or sale of securities by the Fund from or to another fund or portfolio that is or could be considered an affiliate by virtue of having a common investment adviser (or affiliated investment advisers), common Trustees and/or common officers complies with Rule 17a-7 of the 1940 Act. Further, as defined under the procedures, each transaction is effected at the current market price. Pursuant to these procedures, for the year ended October 31, 2012, the Fund engaged in securities sales of $2,014,278, which resulted in net realized gains (losses) of $(336,211).
NOTE 5—Expense Offset Arrangement(s)
The expense offset arrangement is comprised of transfer agency credits which result from balances in Demand Deposit Accounts (DDA) used by the transfer agent for clearing shareholder transactions. For the year ended October 31, 2012, the Fund received credits from this arrangement, which resulted in the reduction of the Fund’s total expenses of $2,360.
NOTE 6—Trustees’ and Officers’ Fees and Benefits
“Trustees’ and Officers’ Fees and Benefits” include amounts accrued by the Fund to pay remuneration to certain Trustees and Officers of the Fund. Trustees have the option to defer compensation payable by the Fund, and “Trustees’ and Officers’ Fees and Benefits” also include amounts accrued by the Fund to fund such deferred compensation amounts. Those Trustees who defer compensation have the option to select various Invesco Funds in which their deferral accounts shall be deemed to be invested. Finally, certain current Trustees are eligible to participate in a retirement plan that provides for benefits to be paid upon retirement to Trustees over a period of time based on the number of years of service. The Fund may have certain former Trustees who also participate in a retirement plan and receive benefits under such plan. “Trustees’ and Officers’ Fees and Benefits” include amounts accrued by the Fund to fund such retirement benefits. Obligations under the deferred compensation and retirement plans represent unsecured claims against the general assets of the Fund.
17 Invesco Global Growth Fund
NOTE 7—Cash Balances
The Fund is permitted to temporarily carry a negative or overdrawn balance in its account with State Street Bank and Trust Company, the custodian bank. Such balances, if any at period end, are shown in the Statement of Assets and Liabilities under the payable caption Amount due custodian. To compensate the custodian bank for such overdrafts, the overdrawn Fund may either (1) leave funds as a compensating balance in the account so the custodian bank can be compensated by earning the additional interest; or (2) compensate by paying the custodian bank at a rate agreed upon by the custodian bank and Invesco, not to exceed the contractually agreed upon rate.
NOTE 8—Distributions to Shareholders and Tax Components of Net Assets
Tax Character of Distributions to Shareholders Paid During the Years Ended October 31, 2012 and 2011:
| 2012 | 2011 | |||||||
Ordinary income | $ | 1,152,908 | $ | 1,251,576 | ||||
Tax Components of Net Assets at Period-End:
| 2012 | ||||
Undistributed ordinary income | $ | 2,443,542 | ||
Net unrealized appreciation — investments | 43,740,224 | |||
Net unrealized appreciation (depreciation) — other investments | (3,469 | ) | ||
Temporary book/tax differences | (124,918 | ) | ||
Capital loss carryforward | (4,698,550 | ) | ||
Shares of beneficial interest | 269,887,337 | |||
Total net assets | $ | 311,244,166 | ||
The difference between book-basis and tax-basis unrealized appreciation (depreciation) is due to differences in the timing of recognition of gains and losses on investments for tax and book purposes. The Fund’s net unrealized appreciation difference is attributable primarily to wash sales.
The temporary book/tax differences are a result of timing differences between book and tax recognition of income and/or expenses. The Fund’s temporary book/tax differences are the result of the trustee deferral of compensation and retirement plan benefits.
Capital loss carryforward is calculated and reported as of a specific date. Results of transactions and other activity after that date may affect the amount of capital loss carryforward actually available for the Fund to utilize. The Regulated Investment Company Modernization Act of 2010 (the “Act”) eliminated the eight-year carryover period for capital losses that arise in taxable years beginning after its enactment date of December 22, 2010. Consequently, these capital losses can be carried forward for an unlimited period. However, capital losses with an expiration period may not be used to offset capital gains until all net capital losses without an expiration date have been utilized. Additionally, post-enactment capital loss carryovers will retain their character as either short-term or long-term capital losses instead of as short-term capital losses as under prior law. The ability to utilize capital loss carryforward in the future may be limited under the Internal Revenue Code and related regulations based on the results of future transactions.
The Fund utilized $18,115,603 of capital loss carryforward in the current period to offset net realized capital gain for federal income tax purposes. The Fund has a capital loss carryforward as of October 31, 2012, which expires as follows:
| Capital Loss Carryforward* | ||||||||||||
| Expiration | Short-Term | Long-Term | Total | |||||||||
October 31, 2017 | $ | 4,698,550 | $ | — | $ | 4,698,550 | ||||||
| * | Capital loss carryforward as of the date listed above is reduced for limitations, if any, to the extent required by the Internal Revenue Code. To the extent that unrealized gains as of December 19, 2011, the date of reorganization of Invesco Global Advantage Fund into the Fund and realized on securities held in each fund at such date of reorganization, the capital loss carryforward may be further limited for up to five years from the date of the reorganization. |
NOTE 9—Investment Securities
The aggregate amount of investment securities (other than short-term securities, U.S. Treasury obligations and money market funds, if any) purchased and sold by the Fund during the year ended October 31, 2012 was $76,305,019 and $70,182,616, respectively. Cost of investments on a tax basis includes the adjustments for financial reporting purposes as of the most recently completed federal income tax reporting period-end.
| Unrealized Appreciation (Depreciation) of Investment Securities on a Tax Basis | ||||
Aggregate unrealized appreciation of investment securities | $ | 54,572,618 | ||
Aggregate unrealized (depreciation) of investment securities | (10,832,394 | ) | ||
Net unrealized appreciation of investment securities | $ | 43,740,224 | ||
Cost of investments for tax purposes is $267,906,168.
18 Invesco Global Growth Fund
NOTE 10—Reclassification of Permanent Differences
Primarily as a result of differing book/tax treatment of foreign currency transactions, swap agreement income and proxy costs, on October 31, 2011, undistributed net investment income was increased by $141,241, undistributed net realized gain (loss) was decreased by $149,986 and shares of beneficial interest increased by $8,745.
Further, as a result of tax deferrals acquired in the reorganization of Invesco Global Advantage Fund into the Fund, on December 19, 2011, undistributed net investment income was decreased by $7,997, undistributed net realized gain (loss) was decreased by $6,393,497 and shares of beneficial interest increased by $6,401,494. These reclassifications had no effect on the net assets of the Fund.
NOTE 11—Share Information
| Summary of Share Activity | ||||||||||||||||
| Years ended October 31, | ||||||||||||||||
| 2012(a) | 2011 | |||||||||||||||
| Shares | Amount | Shares | Amount | |||||||||||||
Sold: | ||||||||||||||||
Class A | 424,833 | $ | 9,696,259 | 342,583 | $ | 7,944,364 | ||||||||||
Class B | 4,614 | 119,211 | 29,878 | 643,525 | ||||||||||||
Class C | 42,154 | 1,009,559 | 60,024 | 1,291,118 | ||||||||||||
Class Y | 47,573 | 1,087,732 | 32,379 | 743,804 | ||||||||||||
Class R5 | 3,216 | 71,604 | 14,129 | 293,317 | ||||||||||||
Class R6(b) | 403 | 10,000 | — | — | ||||||||||||
Issued as reinvestment of dividends: | ||||||||||||||||
Class A | 41,209 | 894,871 | 49,848 | 1,132,552 | ||||||||||||
Class Y | 542 | 11,768 | 476 | 10,826 | ||||||||||||
Class R5 | 173 | 3,741 | — | — | ||||||||||||
Issued in connection with acquisitions:(c) | ||||||||||||||||
Class A | 4,430,742 | 92,331,215 | — | — | ||||||||||||
Class B | 117,982 | 2,312,153 | — | — | ||||||||||||
Class C | 569,039 | 11,161,203 | — | — | ||||||||||||
Class Y | 17,363 | 362,039 | — | — | ||||||||||||
Automatic conversion of Class B shares to Class A shares: | ||||||||||||||||
Class A | 134,939 | 3,098,956 | 145,218 | 3,355,437 | ||||||||||||
Class B | (145,256 | ) | (3,098,956 | ) | (154,699 | ) | (3,355,437 | ) | ||||||||
Reacquired:(d) | ||||||||||||||||
Class A | (1,916,101 | ) | (44,289,602 | ) | (1,551,991 | ) | (35,806,768 | ) | ||||||||
Class B | (80,980 | ) | (1,780,506 | ) | (109,720 | ) | (2,393,577 | ) | ||||||||
Class C | (168,757 | ) | (3,665,567 | ) | (156,604 | ) | (3,380,439 | ) | ||||||||
Class Y | (30,523 | ) | (706,747 | ) | (20,377 | ) | (475,102 | ) | ||||||||
Class R5 | (1,415 | ) | (33,073 | ) | (818 | ) | (16,007 | ) | ||||||||
Net increase (decrease) in share activity | 3,491,750 | $ | 68,595,860 | (1,319,674 | ) | $ | (30,012,387 | ) | ||||||||
| (a) | There are entities that are record owners of more than 5% of the outstanding shares of the Fund and in the aggregate own 44% of the outstanding shares of the Fund. IDI has an agreement with these entities to sell Fund shares. The Fund, Invesco and/or Invesco affiliates may make payments to these entities, which are considered to be related to the Fund, for providing services to the Fund, Invesco and/or Invesco affiliates including but not limited to services such as securities brokerage, distribution, third party record keeping and account servicing. The Fund has no knowledge as to whether all or any portion of the shares owned of record by these entities are also owned beneficially. |
| (b) | Commencement date of September 24, 2012. |
| (c) | As of the opening of business on December 19, 2011, the Fund acquired all the net assets of Invesco Global Advantage Fund (the “Target Fund”) pursuant to a plan of reorganization approved by the Trustees of the Fund on November 10, 2010 and by the shareholders of the Target Fund on November 28, 2011. The acquisition was accomplished by a tax-free exchange of 5,135,126 shares of the Fund for 10,335,183 shares outstanding of the Target Fund as of the close of business on December 16, 2011. Each class of the Target Fund was exchanged for the like class of shares of the Fund based on the relative net asset value of the Target Fund to the net asset value of the Fund at the close of business on December 16, 2011. The Target Fund’s net assets at that date of $106,166,610, including $5,789,863 of unrealized appreciation, were combined with those of the Fund. The net assets of the Fund immediately before the acquisition were $193,640,137 and $299,806,747 immediately after the acquisition. |
| The pro forma results of operations for the year ended October 31, 2012 assuming the reorganization had been completed on November 1, 2011, the beginning of the annual reporting period are as follows: |
Net investment income | $ | 2,329,861 | |||
Net realized/unrealized gains | 26,252,977 | ||||
Change in net assets resulting from operations | $ | 28,582,838 |
| The combined investment portfolios have been managed as a single integrated portfolio since the acquisition was completed, it is not practicable to separate the amounts of revenue and earnings of the Target Fund that has been included in the Fund’s Statement of Operations since December 19, 2011. |
| (d) | Net of redemption fees of $496 and $1,643 allocated among the classes based on relative net assets of each class for the years ended October 31, 2012 and 2011, respectively. |
19 Invesco Global Growth Fund
NOTE 12—Financial Highlights
The following schedule presents financial highlights for a share of the Fund outstanding throughout the periods indicated.
| Net asset value, beginning of period | Net investment income (loss)(a) | Net gains (losses) on securities (both realized and unrealized) | Total from investment operations | Dividends from net investment income | Net asset value, end of period(b) | Total return(c) | Net assets, end of period (000s omitted) | Ratio of net assets | Ratio of expenses to average net assets without fee waivers and/or expenses absorbed | Ratio of net investment income (loss) to average net assets | Portfolio turnover(d) | |||||||||||||||||||||||||||||||||||||
Class A |
| |||||||||||||||||||||||||||||||||||||||||||||||
Year ended 10/31/12 | $ | 22.26 | $ | 0.20 | $ | 1.90 | $ | 2.10 | $ | (0.14 | ) | $ | 24.22 | 9.50 | % | $ | 277,313 | 1.34 | %(e) | 1.56 | %(e) | 0.85 | %(e) | 33 | % | |||||||||||||||||||||||
Year ended 10/31/11 | 22.30 | 0.12 | (0.02 | ) | 0.10 | (0.14 | ) | 22.26 | 0.41 | 185,484 | 1.62 | 1.63 | 0.50 | 28 | ||||||||||||||||||||||||||||||||||
Year ended 10/31/10 | 19.51 | 0.09 | 2.88 | 2.97 | (0.18 | ) | 22.30 | 15.33 | 208,436 | 1.62 | 1.63 | 0.44 | 41 | |||||||||||||||||||||||||||||||||||
Year ended 10/31/09 | 16.56 | 0.14 | 3.05 | (f) | 3.19 | (0.24 | ) | 19.51 | 19.62 | (f) | 204,605 | 1.79 | 1.80 | 0.83 | 40 | |||||||||||||||||||||||||||||||||
Year ended 10/31/08 | 28.18 | 0.24 | (11.80 | ) | (11.56 | ) | (0.06 | ) | 16.56 | (41.11 | ) | 190,275 | 1.59 | 1.60 | 1.00 | 48 | ||||||||||||||||||||||||||||||||
Class B |
| |||||||||||||||||||||||||||||||||||||||||||||||
Year ended 10/31/12 | 20.83 | 0.02 | 1.79 | 1.81 | — | 22.64 | 8.69 | 9,368 | 2.09 | (e) | 2.31 | (e) | 0.10 | (e) | 33 | |||||||||||||||||||||||||||||||||
Year ended 10/31/11 | 20.90 | (0.05 | ) | (0.02 | ) | (0.07 | ) | — | 20.83 | (0.33 | ) | 10,776 | 2.37 | 2.38 | (0.25 | ) | 28 | |||||||||||||||||||||||||||||||
Year ended 10/31/10 | 18.29 | (0.06 | ) | 2.71 | 2.65 | (0.04 | ) | 20.90 | 14.53 | 15,713 | 2.37 | 2.38 | (0.31 | ) | 41 | |||||||||||||||||||||||||||||||||
Year ended 10/31/09 | 15.42 | 0.01 | 2.86 | (f) | 2.87 | 0.00 | 18.29 | 18.64 | (f) | 19,325 | 2.54 | 2.55 | 0.08 | 40 | ||||||||||||||||||||||||||||||||||
Year ended 10/31/08 | 26.37 | 0.06 | (11.01 | ) | (10.95 | ) | — | 15.42 | (41.52 | ) | 25,426 | 2.34 | 2.35 | 0.25 | 48 | |||||||||||||||||||||||||||||||||
Class C |
| |||||||||||||||||||||||||||||||||||||||||||||||
Year ended 10/31/12 | 20.83 | 0.02 | 1.79 | 1.81 | — | 22.64 | 8.69 | 21,803 | 2.09 | (e) | 2.31 | (e) | 0.10 | (e) | 33 | |||||||||||||||||||||||||||||||||
Year ended 10/31/11 | 20.90 | (0.05 | ) | (0.02 | ) | (0.07 | ) | — | 20.83 | (0.33 | ) | 10,838 | 2.37 | 2.38 | (0.25 | ) | 28 | |||||||||||||||||||||||||||||||
Year ended 10/31/10 | 18.30 | (0.06 | ) | 2.70 | 2.64 | (0.04 | ) | 20.90 | 14.47 | 12,893 | 2.37 | 2.38 | (0.31 | ) | 41 | |||||||||||||||||||||||||||||||||
Year ended 10/31/09 | 15.42 | 0.01 | 2.87 | (f) | 2.88 | 0.00 | 18.30 | 18.71 | (f) | 13,192 | 2.54 | 2.55 | 0.08 | 40 | ||||||||||||||||||||||||||||||||||
Year ended 10/31/08 | 26.38 | 0.06 | (11.02 | ) | (10.96 | ) | — | 15.42 | (41.55 | ) | 12,719 | 2.34 | 2.35 | 0.25 | 48 | |||||||||||||||||||||||||||||||||
Class Y |
| |||||||||||||||||||||||||||||||||||||||||||||||
Year ended 10/31/12 | 22.33 | 0.25 | 1.91 | 2.16 | (0.20 | ) | 24.29 | 9.78 | 2,372 | 1.09 | (e) | 1.31 | (e) | 1.10 | (e) | 33 | ||||||||||||||||||||||||||||||||
Year ended 10/31/11 | 22.37 | 0.17 | (0.02 | ) | 0.15 | (0.19 | ) | 22.33 | 0.66 | 1,400 | 1.37 | 1.38 | 0.75 | 28 | ||||||||||||||||||||||||||||||||||
Year ended 10/31/10 | 19.57 | 0.14 | 2.89 | 3.03 | (0.23 | ) | 22.37 | 15.58 | 1,123 | 1.37 | 1.38 | 0.69 | 41 | |||||||||||||||||||||||||||||||||||
Year ended 10/31/09 | 16.57 | 0.19 | 3.05 | (f) | 3.24 | (0.24 | ) | 19.57 | 19.93 | (f) | 1,395 | 1.54 | 1.55 | 1.08 | 40 | |||||||||||||||||||||||||||||||||
Year ended 10/31/08(g) | 19.00 | 0.01 | (2.44 | ) | (2.43 | ) | — | 16.57 | (12.79 | ) | 821 | 1.45 | (h) | 1.46 | (h) | 1.14 | (h) | 48 | ||||||||||||||||||||||||||||||
Class R5 |
| |||||||||||||||||||||||||||||||||||||||||||||||
Year ended 10/31/12 | 22.33 | 0.28 | 1.90 | 2.18 | (0.33 | ) | 24.18 | 9.95 | 379 | 0.99 | (e) | 0.99 | (e) | 1.20 | (e) | 33 | ||||||||||||||||||||||||||||||||
Year ended 10/31/11 | 22.37 | 0.28 | (0.06 | ) | 0.22 | (0.26 | ) | 22.33 | 0.95 | 306 | 0.82 | 0.83 | 1.30 | 28 | ||||||||||||||||||||||||||||||||||
Year ended 10/31/10 | 19.59 | 0.20 | 2.89 | 3.09 | (0.31 | ) | 22.37 | 15.93 | 9 | 1.07 | 1.08 | 0.99 | 41 | |||||||||||||||||||||||||||||||||||
Year ended 10/31/09 | 16.65 | 0.26 | 3.05 | (f) | 3.31 | (0.37 | ) | 19.59 | 20.49 | (f) | 1,013 | 1.07 | 1.08 | 1.55 | 40 | |||||||||||||||||||||||||||||||||
Year ended 10/31/08 | 28.19 | 0.30 | (11.77 | ) | (11.47 | ) | (0.07 | ) | 16.65 | (40.79 | ) | 1,010 | 1.08 | 1.09 | 1.51 | 48 | ||||||||||||||||||||||||||||||||
Class R6 |
| |||||||||||||||||||||||||||||||||||||||||||||||
Year ended 10/31/12(g) | 24.84 | 0.03 | (0.70 | ) | (0.67 | ) | — | 24.17 | (2.70 | ) | 10 | 0.95 | (e)(h) | 0.96 | (e)(h) | 1.24 | (e)(h) | 33 | ||||||||||||||||||||||||||||||
| (a) | Calculated using average shares outstanding. |
| (b) | Includes redemption fees added to shares of beneficial interest which were less than $0.005 per share. |
| (c) | Includes adjustments in accordance with accounting principles generally accepted in the United States of America and as such, the net asset value for financial reporting purposes and the returns based upon those net asset values may differ from the net asset value and returns for shareholder transactions. Does not include sales charges and is not annualized for periods less than one year, if applicable. |
| (d) | Portfolio turnover is calculated at the fund level and is not annualized for periods less than one year, if applicable. For the period ended October 31, 2012, the portfolio turnover calculation excludes the value of securities purchased of $92,850,953 and sold of $35,562,826 in effect to realign the Fund’s portfolio after the reorganization of Invesco Global Advantage Fund into the Fund. |
| (e) | Ratios are based on average daily net assets (000’s) of $266,771, $10,862, $20,528, $2,153, $352 and $10 for Class A, Class B, Class C, Class Y, Class R5 and Class R6 shares, respectively. |
| (f) | Includes litigation proceeds received during the period. Had the litigation proceeds not been received, net gains (losses) on securities (both realized and unrealized) per share would have been $2.93, $2.74, $2.75, $2.93 and $2.93 for Class A, Class B, Class C, Class Y and Class R5 shares, respectively and total returns would have been lower. |
| (g) | Commencement date of October 3, 2008 and September 24, 2012 for Class Y and Class R6 shares, respectively. |
| (h) | Annualized. |
20 Invesco Global Growth Fund
Report of Independent Registered Public Accounting Firm
To the Board of Trustees of AIM International Mutual Funds (Invesco International Mutual Funds)
and Shareholders of Invesco Global Growth Fund:
In our opinion, the accompanying statement of assets and liabilities, including the schedule of investments, and the related statements of operations and of changes in net assets and the financial highlights present fairly, in all material respects, the financial position of Invesco Global Growth Fund (one of the funds constituting AIM International Mutual Funds (Invesco International Mutual Funds), hereafter referred to as the “Fund”) at October 31, 2012, the results of its operations for the year then ended, the changes in its net assets for each of the two years in the period then ended and the financial highlights for each of the five years in the period then ended, in conformity with accounting principles generally accepted in the United States of America. These financial statements and financial highlights (hereafter referred to as “financial statements”) are the responsibility of the Fund’s management; our responsibility is to express an opinion on these financial statements based on our audits. We conducted our audits of these financial statements in accordance with the standards of the Public Company Accounting Oversight Board (United States). Those standards require that we plan and perform the audit to obtain reasonable assurance about whether the financial statements are free of material misstatement. An audit includes examining, on a test basis, evidence supporting the amounts and disclosures in the financial statements, assessing the accounting principles used and significant estimates made by management, and evaluating the overall financial statement presentation. We believe that our audits, which included confirmation of securities at October 31, 2012 by correspondence with the custodian and brokers, provide a reasonable basis for our opinion.
PRICEWATERHOUSECOOPERS LLP
December 21, 2012
Houston, Texas
21 Invesco Global Growth Fund
Calculating your ongoing Fund expenses
Example
As a shareholder of the Fund, you incur two types of costs: (1) transaction costs, which may include sales charges (loads) on purchase payments or contingent deferred sales charges on redemptions, and redemption fees, if any; and (2) ongoing costs, including management fees, distribution and/or service (12b-1) fees, and other Fund expenses. This example is intended to help you understand your ongoing costs (in dollars) of investing in the Fund and to compare these costs with ongoing costs of investing in other mutual funds. With the exception of the actual ending account value and expenses of the Class R6 shares, the example is based on an investment of $1,000 invested at the beginning of the period and held for the entire period May 1, 2012, through October 31, 2012. The actual ending account value and expenses of the Class R6 shares in the example below are based on an investment of $1,000 invested as of close of business September 24, 2012 (commencement date) and held through October 31, 2012.
Actual expenses
The table below provides information about actual account values and actual expenses. You may use the information in this table, together with the amount you invested, to estimate the expenses that you paid over the period. Simply divide your account value by $1,000 (for example, an $8,600 account value divided by $1,000 = 8.6), then multiply the result by the number in the table under the heading entitled “Actual Expenses Paid During Period” to estimate the expenses you paid on your account during this period (as of close of business September 24, 2012 through October 31, 2012 for the Class R6 shares). Because the actual ending account value and expense information in the example is not based upon a six month period for the Class R6 shares, the ending account value and expense information may not provide a meaningful comparison to mutual funds that provide such information for a full six month period.
Hypothetical example for comparison purposes
The table below also provides information about hypothetical account values and hypothetical expenses based on the Fund’s actual expense ratio and an assumed rate of return of 5% per year before expenses, which is not the Fund’s actual return.
The hypothetical account values and expenses may not be used to estimate the actual ending account balance or expenses you paid for the period. You may use this information to compare the ongoing costs of investing in the Fund and other funds. To do so, compare this 5% hypothetical example with the 5% hypothetical examples that appear in the shareholder reports of the other funds.
Please note that the expenses shown in the table are meant to highlight your ongoing costs only and do not reflect any transaction costs, such as sales charges (loads) on purchase payments, contingent deferred sales charges on redemptions, and redemption fees, if any. Therefore, the hypothetical information is useful in comparing ongoing costs only, and will not help you determine the relative total costs of owning different funds. In addition, if these transaction costs were included, your costs would have been higher.
| Class | Beginning Account Value (05/01/12) | ACTUAL | HYPOTHETICAL (5% annual return before expenses) | Annualized Expense Ratio | ||||||||||||||||||||
| Ending Account Value (10/31/12)1 | Expenses Paid During Period2 | Ending Account Value (10/31/12) | Expenses Paid During Period3 | |||||||||||||||||||||
| A | $ | 1,000.00 | $ | 1,010.40 | $ | 6.62 | $ | 1,018.55 | $ | 6.65 | 1.31 | % | ||||||||||||
| B | 1,000.00 | 1,006.70 | 10.39 | 1,014.78 | 10.43 | 2.06 | ||||||||||||||||||
| C | 1,000.00 | 1,006.20 | 10.39 | 1,014.78 | 10.43 | 2.06 | ||||||||||||||||||
| Y | 1,000.00 | 1,011.20 | 5.36 | 1,019.81 | 5.38 | 1.06 | ||||||||||||||||||
| R5 | 1,000.00 | 1,012.20 | 5.01 | 1,020.16 | 5.03 | 0.99 | ||||||||||||||||||
| R6 | 1,000.00 | 973.00 | 0.97 | 1,020.36 | 4.82 | 0.95 | ||||||||||||||||||
| 1 | The actual ending account value is based on the actual total return of the Fund for the period May 1, 2012, through October 31, 2012 (as of close of business September 24, 2012 (commencement date), through October 31, 2012 for the Class R6 shares), after actual expenses and will differ from the hypothetical ending account value which is based on the Fund’s expense ratio and a hypothetical annual return of 5% before expenses. |
| 2 | Actual expenses are equal to the Fund’s annualized expense ratio as indicated above multiplied by the average account value over the period, multiplied by 184/366 to reflect the most recent fiscal half year. For the Class R6 shares actual expenses are equal to the annualized expense ratio indicated above multiplied by the average account value over the period, multiplied by 38 (as of close of business September 24, 2012 (commencement date), through October 31, 2012)/366. Because the Class R6 shares have not been in existence for a full six month period, the actual ending account value and expense information shown may not provide a meaningful comparison to fund expense information of classes that show such data for a full six month period and, because the actual ending account value and expense information in the expense example covers a short time period, return and expense data may not be indicative of return and expense data for longer time periods. |
| 3 | Hypothetical expenses are equal to the annualized expense ratio indicated above multiplied by the average account value over the period, multiplied by 184/366 to reflect a one-half year period. The hypothetical ending account value and expenses may be used to compare ongoing costs of investing in Class R6 shares of the Fund and other funds because such data is based on a full six month period. |
22 Invesco Global Growth Fund
Approval of Investment Advisory and Sub-Advisory Contracts
The Board of Trustees (the Board) of AIM International Mutual Funds (Invesco International Mutual Funds) is required under the Investment Company Act of 1940, as amended, to approve annually the renewal of the Invesco Global Growth Fund (the Fund) investment advisory agreement with Invesco Advisers, Inc. (Invesco Advisers) and the Master Intergroup Sub-Advisory Contract for Mutual Funds (the sub-advisory contracts) with Invesco Asset Management Deutschland GmbH, Invesco Asset Management Limited, Invesco Asset Management (Japan) Limited, Invesco Australia Limited, Invesco Hong Kong Limited, Invesco Senior Secured Management, Inc. and Invesco Canada Ltd. (collectively, the Affiliated Sub-Advisers). During contract renewal meetings held on June 19-20, 2012, the Board as a whole, and the disinterested or “independent” Trustees, who comprise 80% of the Board, voting separately, approved the continuance of the Fund’s investment advisory agreement and the sub-advisory contracts for another year, effective July 1, 2012. In doing so, the Board considered the process that it follows in reviewing and approving the Fund’s investment advisory agreement and sub-advisory contracts and the information that it is provided. The Board determined that the Fund’s investment advisory agreement and the sub-advisory contracts are in the best interests of the Fund and its shareholders and the compensation to Invesco Advisers and the Affiliated Sub-Advisers under the agreements is fair and reasonable.
The Board’s Fund Evaluation Process
The Board’s Investments Committee has established three Sub-Committees, each of which is primarily responsible for overseeing the management of a number of the series portfolios of the funds advised by Invesco Advisers (the Invesco Funds). The Sub-Committees meet throughout the year to review the performance of their assigned funds, including reviewing materials prepared under the direction of the independent Senior Officer, an officer of the Invesco Funds who reports directly to the independent Trustees. Over the course of each year, the Sub-Committees meet with portfolio managers for their assigned Invesco Funds and other members of management to review the performance, investment objective(s), policies, strategies, limitations and investment risks of these funds. The Sub-Committees meet regularly and at designated contract renewal meetings each year to conduct a review of the performance, fees, expenses and other matters related to their assigned Invesco Funds. Each Sub-Committee recommends to the Investments Committee, which in turn recommends to the full Board, whether and on what terms to approve the continuance of each Invesco Fund’s
investment advisory agreement and sub-advisory contracts for another year.
During the contract renewal process, the Trustees receive comparative performance and fee data regarding the Invesco Funds prepared by Invesco Advisers and an independent company, Lipper Inc. (Lipper). The Trustees also receive an independent written evaluation from the Senior Officer. The Senior Officer’s evaluation is prepared as part of his responsibility to manage the process by which the Invesco Funds’ proposed management fees are negotiated during the annual contract renewal process to ensure they are negotiated in a manner that is at arms’ length and reasonable. The independent Trustees are assisted in their annual evaluation of the Fund’s investment advisory agreement by the Senior Officer and by independent legal counsel. In addition to meetings with Invesco Advisers and fund counsel, the independent Trustees also discuss the continuance of the investment advisory agreement and sub-advisory contracts in private sessions with the Senior Officer and independent legal counsel.
In evaluating the fairness and reasonableness of the Fund’s investment advisory agreement and sub-advisory contracts, the Board considered, among other things, the factors discussed below. The Trustees recognized that the advisory fees for the Invesco Funds include advisory fees that are the result of years of review and negotiation between the Trustees and Invesco Advisers as well as advisory fees previously approved by a different board that, at the time, was responsible for overseeing Morgan Stanley and Van Kampen funds, which have become Invesco Funds following the acquisition of the retail mutual fund business of Morgan Stanley. The Trustees’ deliberations and conclusions in a particular year may be based in part on their deliberations and conclusions regarding these same arrangements throughout the year and in prior years. One Trustee may have weighed a particular piece of information or factor differently than another Trustee.
The discussion below serves as the Senior Officer’s independent written evaluation with respect to the Fund’s investment advisory agreement as well as a discussion of the material factors and related conclusions that formed the basis for the Board’s approval of the Fund’s investment advisory agreement and sub-advisory contracts. Unless otherwise stated, this information is current as of June 20, 2012, and may not reflect consideration of factors that became known to the Board after that date, including, for example, changes to the Fund’s performance, advisory fees, expense limitations and/or fee waivers.
Factors and Conclusions and Summary of Independent Written Fee Evaluation
| A. | Nature, Extent and Quality of Services Provided by Invesco Advisers and the Affiliated Sub-Advisers |
The Board reviewed the advisory services provided to the Fund by Invesco Advisers under the Fund’s investment advisory agreement, the performance of Invesco Advisers in providing these services, and the credentials and experience of the officers and employees of Invesco Advisers who provide these services, including the Fund’s portfolio manager or managers, with whom the Sub-Committees met during the year. The Board’s review of the qualifications of Invesco Advisers to provide advisory services included the Board’s consideration of Invesco Advisers’ performance and investment process oversight, independent credit analysis and investment risk management.
In determining whether to continue the Fund’s investment advisory agreement, the Board considered the prior relationship between Invesco Advisers and the Fund, as well as the Board’s knowledge of Invesco Advisers’ operations, and concluded that it is beneficial to maintain the current relationship, in part because of such prior relationship and knowledge. The Board also considered services that Invesco Advisers and its affiliates provide to the Invesco Funds such as various back office support functions, equity and fixed income trading operations, internal audit, distribution and legal and compliance. The Board concluded that the nature, extent and quality of the services provided to the Fund by Invesco Advisers are appropriate and satisfactory and consistent with the terms of the Fund’s investment advisory agreement.
The Board reviewed the services provided by the Affiliated Sub-Advisers under the sub-advisory contracts and the credentials and experience of the officers and employees of the Affiliated Sub-Advisers who provide these services. The Board noted that the Affiliated Sub-Advisers have offices and personnel that are located in financial centers around the world. As a result, the Affiliated Sub-Advisers can provide research and investment analysis on the markets and economies of various countries in which the Fund invests and make recommendations on securities of companies located in such countries. The Board concluded that the sub-advisory contracts benefit the Fund and its shareholders by permitting Invesco Advisers to use the resources and talents of the Affiliated Sub-Advisers in managing the Fund. The Board concluded that the nature, extent and quality of the services provided by the Affiliated Sub-Advisers are appropriate and satisfactory and consistent with the terms of the Fund’s sub-advisory contracts.
23 Invesco Global Growth Fund
| B. | Fund Performance |
The Board considered Fund performance as a relevant factor in considering whether to approve the investment advisory agreement. The Board did not view Fund performance as a relevant factor in considering whether to approve the sub-advisory contracts for the Fund, as no Affiliated Sub-Adviser currently manages assets of the Fund.
The Board compared the Fund’s performance during the past one, three and five calendar years to the performance of funds in the Lipper performance universe and against the Lipper Global Large-Cap Growth Funds Index. The Board noted that performance of Class A shares of the Fund was in the second quintile of the performance universe for the one year period and the fourth quintile for the three and five year periods (the first quintile being the best performing funds and the fifth quintile being the worst performing funds). The Board noted that performance of Class A shares of the Fund was above the performance of the Index for the one year period and below the performance of the Index for the three and five year periods. The Trustees also reviewed more recent Fund performance and this review did not change their conclusions.
| C. | Advisory and Sub-Advisory Fees and Fee Waivers |
The Board compared the Fund’s contractual advisory fee rate to the contractual advisory fee rates of funds in the Fund’s Lipper expense group at a common asset level. The Board noted that the contractual advisory fee rate for Class A shares of the Fund was below the median contractual advisory fee rate of funds in the expense group. The Board also reviewed the methodology used by Lipper in providing expense group information, which includes using audited financial data from the most recent annual report of each fund in the expense group that was publicly available as of the end of the past calendar year and including only one fund per investment adviser. The Board noted that comparative data is as of varying dates, which may affect the comparability of data during times of market volatility.
The Board also compared the Fund’s effective fee rate (the advisory fee after advisory fee waivers and before expense limitations/waivers) to the advisory fee rates of other funds advised by Invesco Advisers and its affiliates with investment strategies comparable to those of the Fund. The Board noted that Invesco Advisers advises one off-shore fund with comparable investment strategies, which had an effective fee rate higher than the Fund’s.
The Board noted that Invesco Advisers has contractually agreed to waive fees and/or limit expenses of the Fund through at least December 31,2012 in an amount necessary to limit total annual operating expenses to a specified percentage of average daily net assets for each class of the Fund.
The Board also considered the services provided by the Affiliated Sub-Advisers pursuant
to the sub-advisory contracts, as well as the allocation of fees between Invesco Advisers and the Affiliated Sub-Advisers pursuant to the sub-advisory contracts. The Board noted that Invesco Advisers provides services to sub-advised Invesco Funds, including oversight of the Affiliated Sub-Advisers as well as the additional services described above other than day-to-day portfolio management. The Board also noted that the sub-advisory fees have no direct effect on the Fund or its shareholders, as they are paid by Invesco Advisers to the Affiliated Sub-Advisers.
Based upon the information and considerations described above, the Board concluded that the Fund’s advisory and sub-advisory fees are fair and reasonable.
| D. | Economies of Scale and Breakpoints |
The Board considered the extent to which there are economies of scale in the provision of advisory services to the Fund. The Board also considered whether the Fund benefits from economies of scale through contractual breakpoints in the Fund’s advisory fee schedule and were assisted in their review by a report from the Senior Officer. The Board also noted that the Fund shares directly in economies of scale through lower fees charged by third party service providers based on the combined size of the Invesco Funds and other clients advised by Invesco Advisers. The Board noted that Invesco Advisers proposes sharing economies of scale in administration expenses by lowering per class administrative fees.
| E. | Profitability and Financial Resources |
The Board reviewed information from Invesco Advisers concerning the costs of the advisory and other services that Invesco Advisers and its affiliates provide to the Fund and the profitability of Invesco Advisers and its affiliates in providing these services for the year ended December 31, 2011. The Board reviewed with Invesco Advisers the methodology used to prepare the profitability information. The Board considered the profitability of Invesco Advisers in connection with managing the Fund and the Invesco Funds. The Board noted that Invesco Advisers continues to operate at a net profit from services Invesco Advisers and its subsidiaries provide to the Invesco Funds and the Fund. The Board did not deem the level of profits realized by Invesco Advisers and its affiliates from providing services to the Fund to be excessive given the nature, quality and extent of the services provided to the Invesco Funds. The Board received and accepted information from Invesco Advisers demonstrating that Invesco Advisers and each Affiliated Sub-Adviser are financially sound and have the resources necessary to perform their obligations under the investment advisory agreement and sub-advisory contracts.
| F. | Collateral Benefits to Invesco Advisers and its Affiliates |
The Board considered various other benefits received by Invesco Advisers and its affiliates from the relationship with the Fund, including the fees received for their provision of
administrative, transfer agency and distribution services to the Fund. The Board considered the performance of Invesco Advisers and its affiliates in providing these services and the organizational structure employed to provide these services. The Board also considered that these services are provided to the Fund pursuant to written contracts that are reviewed and approved on an annual basis by the Board; that the services are required for the operation of the Fund; that Invesco Advisers and its affiliates can provide services, the nature and quality of which are at least equal to those provided by others offering the same or similar services; and that the fees for such services are fair and reasonable in light of the usual and customary charges by others for services of the same nature and quality.
The Board considered the benefits realized by Invesco Advisers and the Affiliated Sub-Advisers as a result of portfolio brokerage transactions executed through “soft dollar” arrangements. The Board noted that soft dollar arrangements shift the payment obligation for research services from Invesco Advisers and the Affiliated Sub-Advisers to the Invesco Funds and therefore may reduce Invesco Advisers’ and the Affiliated Sub-Advisers’ expenses. The Board also considered periodic reports from the Chief Compliance Officer of the Invesco Funds demonstrating that these arrangements are consistent with regulatory requirements. The Board did not deem the soft dollar arrangements to be inappropriate.
The Board considered that the Fund’s uninvested cash and cash collateral from any securities lending arrangements may be invested in money market funds advised by Invesco Advisers pursuant to procedures approved by the Board. The Board noted that Invesco Advisers receives advisory fees from these affiliated money market funds attributable to such investments, although Invesco Advisers has contractually agreed to waive through varying periods the advisory fees payable by the Invesco Funds. The waiver is in an amount equal to 100% of the net advisory fee Invesco Advisers receives from the affiliated money market funds with respect to the Fund’s investment in the affiliated money market funds of uninvested cash, but not cash collateral. The Board concluded that the Fund’s investment of uninvested cash and cash collateral from any securities lending arrangements in the affiliated money market funds is in the best interests of the Fund and its shareholders.
The Board also considered use of an affiliated broker to execute certain trades for the Fund and that such trades are executed in compliance with rules under the Investment Company Act of 1940, as amended.
24 Invesco Global Growth Fund
Tax Information
Form 1099-DIV, Form 1042-S and other year—end tax information provide shareholders with actual calendar year amounts that should be included in their tax returns. Shareholders should consult their tax advisors.
The following distribution information is being provided as required by the Internal Revenue Code or to meet a specific state’s requirement.
The Fund designates the following amounts or, if subsequently determined to be different, the maximum amount allowable for its fiscal year ended October 31, 2012:
Federal and State Income Tax | ||||
Qualified Dividend Income* | 100.00 | % | ||
Corporate Dividends Received Deduction* | 58.51 | % | ||
| * | The above percentages are based on ordinary income dividends paid to shareholders during the Fund’s fiscal year. |
25 Invesco Global Growth Fund
Trustees and Officers
The address of each trustee and officer is AIM International Mutual Funds (Invesco International Mutual Funds) (the “Trust”), 11 Greenway Plaza, Suite 1000, Houston, Texas 77046-1173. The trustees serve for the life of the Trust, subject to their earlier death, incapacitation, resignation, retirement or removal as more specifically provided in the Trust’s organizational documents. Each officer serves for a one year term or until their successors are elected and qualified. Column two below includes length of time served with predecessor entities, if any.
| Name, Year of Birth and Position(s) Held with the Trust | Trustee and/ or Officer Since | Principal Occupation(s) During Past 5 Years | Number of Complex Overseen by Trustee | Other Directorship(s) Held by Trustee During Past 5 Years | ||||
| Interested Persons | ||||||||
| Martin L. Flanagan1 — 1960 Trustee | 2007 | Executive Director, Chief Executive Officer and President, Invesco Ltd. (ultimate parent of Invesco and a global investment management firm); Advisor to the Board, Invesco Advisers, Inc. (formerly known as Invesco Institutional (N.A.), Inc.); Trustee, The Invesco Funds; Vice Chair, Investment Company Institute; and Member of Executive Board, SMU Cox School of Business
Formerly: Chairman, Invesco Advisers, Inc. (registered investment adviser); Director, Chairman, Chief Executive Officer and President, IVZ Inc. (holding company), INVESCO Group Services, Inc. (service provider) and Invesco North American Holdings, Inc. (holding company); Director, Chief Executive Officer and President, Invesco Holding Company Limited (parent of Invesco and a global investment management firm); Director, Invesco Ltd.; Chairman, Investment Company Institute and President, Co-Chief Executive Officer, Co-President, Chief Operating Officer and Chief Financial Officer, Franklin Resources, Inc. (global investment management organization) | 123 | None | ||||
Philip A. Taylor2 — 1954 Trustee, President and Principal Executive Officer | 2006 | Head of North American Retail and Senior Managing Director, Invesco Ltd.; Director, Co-Chairman, Co-President and Co-Chief Executive Officer, Invesco Advisers, Inc. (formerly known as Invesco Institutional (N.A.), Inc.) (registered investment adviser); Director, Chairman, Chief Executive Officer and President, Invesco Management Group, Inc. (formerly known as Invesco Aim Management Group, Inc.) (financial services holding company); Director and President, INVESCO Funds Group, Inc. (registered investment adviser and registered transfer agent); Director and Chairman, Invesco Investment Services, Inc. (formerly known as Invesco Aim Investment Services, Inc.) (registered transfer agent) and IVZ Distributors, Inc. (formerly known as INVESCO Distributors, Inc.) (registered broker dealer); Director, President and Chairman, Invesco Inc. (holding company) and Invesco Canada Holdings Inc. (holding company); Chief Executive Officer, Invesco Corporate Class Inc. (corporate mutual fund company) and Invesco Canada Fund Inc. (corporate mutual fund company); Director, Chairman and Chief Executive Officer, Invesco Canada Ltd. (formerly known as Invesco Trimark Ltd./Invesco Trimark Ltèe) (registered investment adviser and registered transfer agent); Trustee, President and Principal Executive Officer, The Invesco Funds (other than AIM Treasurer’s Series Trust (Invesco Treasurer’s Series Trust) and Short-Term Investments Trust); Trustee and Executive Vice President, The Invesco Funds (AIM Treasurer’s Series Trust (Invesco Treasurer’s Series Trust) and Short-Term Investments Trust only); Director, Invesco Investment Advisers LLC (formerly known as Van Kampen Asset Management); Director, Chief Executive Officer and President, Van Kampen Exchange Corp.
Formerly: Director and Chairman, Van Kampen Investor Services Inc.; Director, Chief Executive Officer and President, 1371 Preferred Inc. (holding company); and Van Kampen Investments Inc.; Director and President, AIM GP Canada Inc. (general partner for limited partnerships); and Van Kampen Advisors, Inc.; Director and Chief Executive Officer, Invesco Trimark Dealer Inc. (registered broker dealer); Director, Invesco Distributors, Inc. (formerly known as Invesco Aim Distributors, Inc.) (registered broker dealer); Manager, Invesco PowerShares Capital Management LLC; Director, Chief Executive Officer and President, Invesco Advisers, Inc.; Director, Chairman, Chief Executive Officer and President, Invesco Aim Capital Management, Inc.; President, Invesco Trimark Dealer Inc. and Invesco Trimark Ltd./Invesco Trimark Ltèe; Director and President, AIM Trimark Corporate Class Inc. and AIM Trimark Canada Fund Inc.; Senior Managing Director, Invesco Holding Company Limited; Trustee and Executive Vice President, Tax-Free Investments Trust; Director and Chairman, Fund Management Company (former registered broker dealer); President and Principal Executive Officer, The Invesco Funds (AIM Treasurer’s Series Trust (Invesco Treasurer’s Series Trust), Short-Term Investments Trust and Tax-Free Investments Trust only); President, AIM Trimark Global Fund Inc. and AIM Trimark Canada Fund Inc. | 123 | None | ||||
Wayne W. Whalen3 — 1939 Trustee | 2010 | Of Counsel, and prior to 2010, partner in the law firm of Skadden, Arps, Slate, Meagher & Flom LLP, legal counsel to certain funds in the Fund Complex
| 136 | Director of the Mutual Fund Directors Forum, a nonprofit membership organization for investment directors; Chairman and Director of the Abraham Lincoln Presidential Library Foundation; and Director of the Stevenson Center for Democracy |
| 1 | Mr. Flanagan is considered an interested person of the Trust because he is an officer of the adviser to the Trust, and an officer and a director of Invesco Ltd., ultimate parent of the adviser to the Trust. |
| 2 | Mr. Taylor is considered an interested person of the Trust because he is an officer and a director of the adviser to, and a director of the principal underwriter of, the Trust. |
| 3 | Mr. Whalen is considered an “interested person” (within the meaning of Section 2(a)(19) of the 1940 Act) of certain Funds in the Invesco Fund Complex by reason of he and his firm currently providing legal services as legal counsel to such Funds in the Invesco Fund Complex. |
T-1 Invesco Global Growth Fund
Trustees and Officers—(continued)
| Name, Year of Birth and Position(s) Held with the Trust | Trustee and/ or Officer Since | Principal Occupation(s) During Past 5 Years | Number of Funds in Fund Complex Overseen by Trustee | Other Directorship(s) Held by Trustee During Past 5 Years | ||||
| Independent Trustees | ||||||||
Bruce L. Crockett — 1944 Trustee and Chair | 1992 | Chairman, Crockett Technologies Associates (technology consulting company)
Formerly: Director, Captaris (unified messaging provider); Director, President and Chief Executive Officer COMSAT Corporation; and Chairman, Board of Governors of INTELSAT (international communications company) | 123 | ACE Limited (insurance company); and Investment Company Institute | ||||
David C. Arch — 1945 Trustee | 2010 | Retired.
Formerly: Chairman and Chief Executive Officer of Blistex Inc., (consumer health care products manufacturer) | 136 | Member of the Heartland Alliance Advisory Board, a nonprofit organization serving human needs based in Chicago. Board member of the Illinois Manufacturers’ Association. Member of the Board of Visitors, Institute for the Humanities, University of Michigan | ||||
Frank S. Bayley — 1939 Trustee | 2001 | Retired
Formerly: Director, Badgley Funds, Inc. (registered investment company) (2 portfolios) and Partner, law firm of Baker & McKenzie | 123 | Director and Chairman, C.D. Stimson Company (a real estate investment company) | ||||
James T. Bunch — 1942 Trustee | 2003 | Managing Member, Grumman Hill Group LLC (family office private equity management)
Formerly: Founder, Green, Manning & Bunch Ltd. (investment banking firm)(1988-2010); Executive Committee, United States Golf Association; and Director, Policy Studies, Inc. and Van Gilder Insurance Corporation | 123 | Chairman, Board of Governors, Western Golf Association, Chairman-elect, Evans Scholars Foundation and Director, Denver Film Society | ||||
Rodney F. Dammeyer — 1940 Trustee | 2010 | Chairman of CAC, LLC, (private company offering capital investment and management advisory services)
Formerly: Prior to January 2004, Director of TeleTech Holdings Inc.; Prior to 2002, Director of Arris Group, Inc.; Prior to 2001, Managing Partner at Equity Group Corporate Investments. Prior to 1995, Vice Chairman of Anixter International. Prior to 1985, experience includes Senior Vice President and Chief Financial Officer of Household International, Inc., Executive Vice President and Chief Financial Officer of Northwest Industries, Inc. and Partner of Arthur Andersen & Co. | 136 | Director of Quidel Corporation and Stericycle, Inc. Prior to May 2008, Trustee of The Scripps Research Institute. Prior to February 2008, Director of Ventana Medical Systems, Inc. Prior to April 2007, Director of GATX Corporation. Prior to April 2004, Director of TheraSense, Inc. | ||||
Albert R. Dowden — 1941 Trustee | 2000 | Director of a number of public and private business corporations, including the Boss Group, Ltd. (private investment and management); Reich & Tang Funds (5 portfolios) (registered investment company); and Homeowners of America Holding Corporation/ Homeowners of America Insurance Company (property casualty company)
Formerly: Director, Continental Energy Services, LLC (oil and gas pipeline service); Director, CompuDyne Corporation (provider of product and services to the public security market) and Director, Annuity and Life Re (Holdings), Ltd. (reinsurance company); Director, President and Chief Executive Officer, Volvo Group North America, Inc.; Senior Vice President, AB Volvo; Director of various public and private corporations; Chairman, DHJ Media, Inc.; Director Magellan Insurance Company; and Director, The Hertz Corporation, Genmar Corporation (boat manufacturer), National Media Corporation; Advisory Board of Rotary Power International (designer, manufacturer, and seller of rotary power engines); and Chairman, Cortland Trust, Inc. (registered investment company) | 123 | Director of Nature’s Sunshine Products, Inc. | ||||
Jack M. Fields — 1952 Trustee | 1997 | Chief Executive Officer, Twenty First Century Group, Inc. (government affairs company); and Owner and Chief Executive Officer, Dos Angelos Ranch, L.P. (cattle, hunting, corporate entertainment), Discovery Global Education Fund (non-profit) and Cross Timbers Quail Research Ranch (non-profit)
Formerly: Chief Executive Officer, Texana Timber LP (sustainable forestry company) and member of the U.S. House of Representatives | 123 | Insperity (formerly known as Administaff) | ||||
Carl Frischling — 1937 Trustee | 1991 | Partner, law firm of Kramer Levin Naftalis and Frankel LLP | 123 | Director, Reich & Tang Funds (6 portfolios) | ||||
Prema Mathai-Davis — 1950 Trustee | 1998 | Retired
Formerly: Chief Executive Officer, YWCA of the U.S.A. | 123 | None | ||||
Larry Soll — 1942 Trustee | 2003 | Retired
Formerly: Chairman, Chief Executive Officer and President, Synergen Corp. (a biotechnology company) | 123 | None |
T-2 Invesco Global Growth Fund
Trustees and Officers—(continued)
| Name, Year of Birth and Position(s) Held with the Trust | Trustee and/ or Officer Since | Principal Occupation(s) During Past 5 Years | Number of Funds in Fund Complex Overseen by Trustee | Other Directorship(s) Held by Trustee During Past 5 Years | ||||
| Independent Trustees—(continued) | ||||||||
Hugo F. Sonnenschein — 1940 Trustee | 2010 | Distinguished Service Professor and President Emeritus of the University of Chicago and the Adam Smith Distinguished Service Professor in the Department of Economics at the University of Chicago.
Formerly: President of the University of Chicago | 136 | Trustee of the University of Rochester and a member of its investment committee. Member of the National Academy of Sciences, the American Philosophical Society and a fellow of the American Academy of Arts and Sciences | ||||
Raymond Stickel, Jr. — 1944 Trustee | 2005 | Retired
Formerly: Director, Mainstay VP Series Funds, Inc. (25 portfolios) and Partner, Deloitte & Touche | 123 | None | ||||
| Other Officers | ||||||||
Russell C. Burk — 1958 Senior Vice President and Senior Officer | 2005 | Senior Vice President and Senior Officer, The Invesco Funds | N/A | N/A | ||||
John M. Zerr — 1962 Senior Vice President, Chief Legal Officer and Secretary | 2006 | Director, Senior Vice President, Secretary and General Counsel, Invesco Management Group, Inc. (formerly known as Invesco Aim Management Group, Inc.) and Van Kampen Exchange Corp.; Senior Vice President, Invesco Advisers, Inc. (formerly known as Invesco Institutional (N.A.), Inc.) (registered investment adviser); Senior Vice President and Secretary, Invesco Distributors, Inc. (formerly known as Invesco Aim Distributors, Inc.); Director, Vice President and Secretary, Invesco Investment Services, Inc. (formerly known as Invesco Aim Investment Services, Inc.) and IVZ Distributors, Inc. (formerly known as INVESCO Distributors, Inc.); Director and Vice President, INVESCO Funds Group, Inc.; Senior Vice President, Chief Legal Officer and Secretary, The Invesco Funds; Manager, Invesco PowerShares Capital Management LLC; Director, Secretary and General Counsel, Invesco Investment Advisers LLC (formerly known as Van Kampen Asset Management); Secretary and General Counsel, Invesco Capital Markets, Inc. (formerly known as Van Kampen Funds Inc.) and Chief Legal Officer, PowerShares Exchange-Traded Fund Trust, PowerShares Exchange-Traded Fund Trust II, PowerShares India Exchange-Traded Fund Trust and PowerShares Actively Managed Exchange-Traded Fund Trust
Formerly: Director and Secretary, Van Kampen Advisors Inc.; Director Vice President, Secretary and General Counsel Van Kampen Investor Services Inc.; Director, Invesco Distributors, Inc. (formerly known as Invesco Aim Distributors, Inc.); Director, Senior Vice President, General Counsel and Secretary, Invesco Advisers, Inc.; and Van Kampen Investments Inc.; Director, Vice President and Secretary, Fund Management Company; Director, Senior Vice President, Secretary, General Counsel and Vice President, Invesco Aim Capital Management, Inc.; Chief Operating Officer and General Counsel, Liberty Ridge Capital, Inc. (an investment adviser); Vice President and Secretary, PBHG Funds (an investment company) and PBHG Insurance Series Fund (an investment company); Chief Operating Officer, General Counsel and Secretary, Old Mutual Investment Partners (a broker-dealer); General Counsel and Secretary, Old Mutual Fund Services (an administrator) and Old Mutual Shareholder Services (a shareholder servicing center); Executive Vice President, General Counsel and Secretary, Old Mutual Capital, Inc. (an investment adviser); and Vice President and Secretary, Old Mutual Advisors Funds (an investment company) | N/A | N/A | ||||
Lisa O. Brinkley — 1959 Vice President | 2004 | Global Assurance Officer, Invesco Ltd. and Vice President, The Invesco Funds
Formerly: Chief Compliance Officer, Invesco Distributors, Inc. (formerly known as Invesco Aim Distributors, Inc.), Invesco Investment Services, Inc.(formerly known as Invesco Aim Investment Services, Inc.) and Van Kampen Investor Services Inc.; Senior Vice President, Invesco Management Group, Inc.; Senior Vice President and Chief Compliance Officer, Invesco Advisers, Inc. and The Invesco Funds; Vice President and Chief Compliance Officer, Invesco Aim Capital Management, Inc. and Invesco Distributors, Inc.; Vice President, Invesco Investment Services, Inc. and Fund Management Company | N/A | N/A | ||||
T-3 Invesco Global Growth Fund
Trustees and Officers—(continued)
| Name, Year of Birth and Position(s) Held with the Trust | Trustee and/ or Officer Since | Principal Occupation(s) During Past 5 Years | Number of Funds in Fund Complex Overseen by Trustee | Other Directorship(s) Held by Trustee During Past 5 Years | ||||
| Other Officers—(continued) | ||||||||
Karen Dunn Kelley — 1960 Vice President | 2004 | Head of Invesco’s World Wide Fixed Income and Cash Management Group; Senior Vice President, Invesco Management Group, Inc. (formerly known as Invesco Aim Management Group, Inc.) and Invesco Advisers, Inc. (formerly known as Invesco Institutional (N.A.), Inc.) (registered investment adviser); Executive Vice President, Invesco Distributors, Inc. (formerly known as Invesco Aim Distributors, Inc.); Director, Invesco Mortgage Capital Inc., INVESCO Global Asset Management Limited, Invesco Management Company Limited and INVESCO Management S.A.; Vice President, The Invesco Funds (other than AIM Treasurer’s Series Trust (Invesco Treasurer’s Series Trust) and Short-Term Investments Trust); and President and Principal Executive Officer, The Invesco Funds (AIM Treasurer’s Series Trust (Invesco Treasurer’s Series Trust) and Short-Term Investments Trust only)
Formerly: Senior Vice President, Van Kampen Investments Inc.; Vice President, Invesco Advisers, Inc. (formerly known as Invesco Institutional (N.A.), Inc.); Director of Cash Management and Senior Vice President, Invesco Advisers, Inc. and Invesco Aim Capital Management, Inc.; President and Principal Executive Officer, Tax-Free Investments Trust; Director and President, Fund Management Company; Chief Cash Management Officer, Director of Cash Management, Senior Vice President, and Managing Director, Invesco Aim Capital Management, Inc.; Director of Cash Management, Senior Vice President, and Vice President, Invesco Advisers, Inc. and The Invesco Funds (AIM Treasurer’s Series Trust (Invesco Treasurer’s Series Trust), Short-Term Investments Trust and Tax-Free Investments Trust only) | N/A | N/A | ||||
Sheri Morris — 1964 Vice President, Treasurer and Principal Financial Officer | 1999 | Vice President, Treasurer and Principal Financial Officer, The Invesco Funds; Vice President, Invesco Advisers, Inc. (formerly known as Invesco Institutional (N.A.), Inc.) (registered investment adviser); and Treasurer, PowerShares Exchange-Traded Fund Trust, PowerShares Exchange-Traded Fund Trust II, PowerShares India Exchange-Traded Fund Trust and PowerShares Actively Managed Exchange-Traded Fund Trust
Formerly: Vice President, Invesco Advisers, Inc., Invesco Aim Capital Management, Inc. and Invesco Aim Private Asset Management, Inc.; Assistant Vice President and Assistant Treasurer, The Invesco Funds and Assistant Vice President, Invesco Advisers, Inc., Invesco Aim Capital Management, Inc. and Invesco Aim Private Asset Management, Inc. | N/A | N/A | ||||
Yinka Akinsola — 1977 Anti-Money Laundering Compliance Officer | 2011 | Anti-Money Laundering Compliance Officer, Invesco Advisers, Inc. (formerly known as Invesco Institutional (N.A.), Inc.) (registered investment adviser); Invesco Distributors, Inc. (formerly known as Invesco Aim Distributors, Inc.), Invesco Investment Services, Inc. (formerly known as Invesco Aim Investment Services, Inc.), Invesco Management Group, Inc., The Invesco Funds, Invesco Van Kampen Closed-End Funds, Van Kampen Exchange Corp., Invesco Capital Markets, Inc. (formerly known as Van Kampen Funds Inc.), PowerShares Exchange-Traded Fund Trust, PowerShares Exchange-Traded Fund Trust II, PowerShares India Exchange-Traded Fund Trust, and PowerShares Actively Managed Exchange-Traded Fund Trust
Formerly: Regulatory Analyst III, Financial Industry Regulatory Authority (FINRA). | N/A | N/A | ||||
Todd L. Spillane — 1958 Chief Compliance Officer | 2006 | Senior Vice President, Invesco Management Group, Inc. (formerly known as Invesco Aim Management Group, Inc.) and Van Kampen Exchange Corp.; Senior Vice President and Chief Compliance Officer, Invesco Advisers, Inc. (registered investment adviser) (formerly known as Invesco Institutional (N.A.), Inc.); Chief Compliance Officer, The Invesco Funds; Vice President, Invesco Distributors, Inc. (formerly known as Invesco Aim Distributors, Inc.) and Invesco Investment Services, Inc. (formerly known as Invesco Aim Investment Services, Inc.)
Formerly: Chief Compliance Officer, Invesco Van Kampen Closed-End Funds; Senior Vice President, Van Kampen Investments Inc.; Senior Vice President and Chief Compliance Officer, Invesco Advisers, Inc. and Invesco Aim Capital Management, Inc.; Chief Compliance Officer, INVESCO Private Capital Investments, Inc. (holding company), Invesco Private Capital, Inc. (registered investment adviser), Invesco Global Asset Management (N.A.), Inc., Invesco Senior Secured Management, Inc. (registered investment adviser) and Van Kampen Investor Services Inc., PowerShares Exchange-Traded Fund Trust, PowerShares Exchange-Traded Fund Trust II, PowerShares India Exchange-Traded Fund Trust and PowerShares Actively Managed Exchange-Traded Fund Trust; Vice President, Invesco Aim Capital Management, Inc. and Fund Management Company | N/A | N/A | ||||
The Statement of Additional Information of the Trust includes additional information about the Fund’s Trustees and is available upon request, without charge, by calling 1.800.959.4246. Please refer to the Fund’s prospectus for information on the Fund’s sub-advisers.
Office of the Fund 11 Greenway Plaza, Suite 1000 Houston, TX 77046-1173 | Investment Adviser Invesco Advisers, Inc. 1555 Peachtree Street, N.E. Atlanta, GA 30309 | Distributor Invesco Distributors, Inc. 11 Greenway Plaza, Suite 1000 Houston, TX 77046-1173 | Auditors PricewaterhouseCoopers LLP 1201 Louisiana Street, Suite 2900 Houston, TX 77002-5678 | |||
Counsel to the Fund Stradley Ronon Stevens & Young, LLP 2005 Market Street, Suite 2600 Philadelphia, PA 19103-7018 | Counsel to the Independent Trustees Kramer Levin Naftalis & Frankel LLP 1177 Avenue of the Americas New York, NY 10036-2714 | Transfer Agent Invesco Investment Services, Inc. 11 Greenway Plaza, Suite 1000 Houston, TX 77046-1173 | Custodian State Street Bank and Trust Company 225 Franklin Street Boston, MA 02110-2801 | |||
T-4 Invesco Global Growth Fund

Invesco mailing information
Send general correspondence to Invesco Investment Services, Inc., P.O. Box 219078, Kansas City, MO 64121-9078.
Invesco privacy policy
You share personal and financial information with us that is necessary for your transactions and your account records. We take very seriously the obligation to keep that information confidential and private.
Invesco collects nonpublic personal information about you from account applications or other forms you complete and from your transactions with us or our affiliates. We do not disclose information about you or our former customers to service providers or other third parties except to the extent necessary to service your account and in other limited circumstances as permitted by law. For example, we use this information to facilitate the delivery of transaction confirmations, financial reports, prospectuses and tax forms.
Even within Invesco, only people involved in the servicing of your accounts and compliance monitoring have access to your information. To ensure the highest level of confidentiality and security, Invesco maintains physical, electronic and procedural safeguards that meet or exceed federal standards. Special measures, such as data encryption and authentication, apply to your communications with us on our website. More detail is available to you at invesco.com/privacy.
Important notice regarding delivery of security holder documents
To reduce Fund expenses, only one copy of most shareholder documents may be mailed to shareholders with multiple accounts at the same address (Householding). Mailing of your shareholder documents may be householded indefinitely unless you instruct us otherwise. If you do not want the mailing of these documents to be combined with those for other members of your household, please contact Invesco Investment Services, Inc. at 800 959 4246 or contact your financial institution. We will begin sending you individual copies for each account within 30 days after receiving your request.
Fund holdings and proxy voting information
The Fund provides a complete list of its holdings four times in each fiscal year, at the quarter-ends. For the second and fourth quarters, the lists appear in the Fund’s semiannual and annual reports to shareholders. For the first and third quarters, the Fund files the lists with the Securities and Exchange Commission (SEC) on Form N-Q. The most recent list of portfolio holdings is available at invesco.com/completeqtrholdings. Shareholders can also look up the Fund’s Forms N-Q on the SEC website at sec.gov. Copies of the Fund’s Forms N-Q may be reviewed and copied at the SEC Public Reference Room in Washington, D.C. You can obtain information on the operation of the Public Reference Room, including information about duplicating fee charges, by calling 202 551 8090 or 800 732 0330, or by electronic request at the following email address: publicinfo@sec.gov. The SEC file numbers for the Fund are shown below.
A description of the policies and procedures that the Fund uses to determine how to vote proxies relating to portfolio securities is available without charge, upon request, from our Client Services department at 800 959 4246 or at invesco.com/proxyguidelines. The information is also available on the SEC website, sec.gov.
Information regarding how the Fund voted proxies related to its portfolio securities during the 12 months ended June 30, 2012, is available at invesco.com/proxysearch. The information is also available on the SEC website, sec.gov. Invesco Advisers, Inc. is an investment adviser; it provides investment advisory services to individual and institutional clients and does not sell securities. Invesco Distributors, Inc. is the US distributor for Invesco Ltd.’s retail mutual funds, exchange-traded funds and institutional money market funds. Both are wholly owned, indirect subsidiaries of Invesco Ltd. |  |
| SEC file numbers: 811-06463 and 033-44611 | GLG-AR-1 | Invesco Distributors, Inc. |

Letters to Shareholders
Philip Taylor | Dear Shareholders: This report contains information about your Fund, including a discussion from your portfolio managers about how they managed your Fund – and why it performed as it did – during the reporting period. This report also includes your Fund’s long-term performance and a complete list of your Fund’s investments as of the close of the reporting period. I hope you find this information helpful. For much of the reporting period, investors’ attention was focused on Europe, where eurozone governments struggled to reduce debt levels, strengthen their banks and stimulate their economies. European leaders disagreed whether the wiser path to restoring the Continent’s economic well-being was more stimulus or greater austerity. In the US, economic data were mixed. Economic growth, while positive, was relatively modest. Corporate earnings, which grew strongly in recent years, showed signs of slowing. And job creation was less robust than hoped. | |
| Later in this report, your Fund’s portfolio managers discuss how economic conditions and market trends affected your Fund’s performance. | ||

Economic conditions are always subject to sudden and unexpected change. That’s why you may find it helpful to work with a trusted, experienced financial adviser who understands your unique financial goals, needs and risk tolerances. Financial advisers can provide valuable insight and information, particularly when markets are uncertain, and they can recommend investments appropriate for specific investment goals, such as a child’s college education or your retirement. On a regular basis, a financial adviser also can determine whether your existing investments are still appropriate, given your changing needs, goals and circumstances.
Timely insight and information from many of Invesco’s investment professionals is available at our website, invesco.com/us. We offer in-depth articles, video clips and audio commentaries from many of our portfolio managers and other investment professionals on a wide range of topics of interest to investors: recent economic and market developments; retirement planning; legislative updates from Washington, DC; and general investor education. At invesco.com/us, you also can access information about your Invesco account at any time.
What we mean by Intentional Investing
Intentional InvestingSM is the science and art of investing with purpose, prudence and diligence – and it’s how Invesco’s investment professionals manage your money every day.
This highly disciplined process begins when specialized teams of investment professionals clearly define an investment objective and then establish specific investment strategies to try to achieve that objective. While our investment teams closely monitor economic and market conditions – and issues specific to individual holdings that could affect their value – they maintain a long-term investment perspective. Intentional Investing is also:
| n | How we manage and mitigate risk – by embedding risk controls and processes into every aspect of our business; |
| n | How we create products – by offering a diverse combination of investment strategies and vehicles designed to meet your needs; and |
| n | How we connect with you, our investors – by communicating clearly, by delivering expert insights from our portfolio managers and other investment professionals, and by providing a website full of tools and articles to help you stay informed. |
As a company, Invesco believes in putting investors first, and that’s why investment management is all we do. Our sole focus on managing your money allows your financial adviser to build a truly diversified investment portfolio of Invesco funds, whatever your investment needs and goals may be – and allows him or her to find appropriate Invesco funds when your circumstances change. Of course, neither Intentional Investing nor diversification can guarantee a profit or protect against loss.
Have a question?
If you have questions about your account, please contact an Invesco client services representative at 800 959 4246. If you have an Invesco-related question or comment, feel free to email me directly at phil@invesco.com.
All of us at Invesco look forward to serving your investment management needs for many years to come. Thank you for investing with us.
Sincerely,

Philip Taylor
Senior Managing Director, Invesco Ltd.
2 Invesco Global Opportunities Fund
Bruce Crockett | Dear Fellow Shareholders: One of our most important responsibilities as independent Trustees of the Invesco Funds is our annual review of the funds’ advisory and sub-advisory contracts with Invesco. This annual review is required by the Investment Company Act of 1940 and focuses on the nature and quality of the services Invesco has provided as adviser to the Invesco Funds and the reasonableness of the fees that it charges for those services. In our roles as Trustees, we spend months reviewing thousands of pages of detailed information that we request from Invesco in connection with our annual review. We focus on the quality and costs of the services to be provided by Invesco and its affiliates. Some of the most important things we look at are fund performance, expenses and fees. All of the Trustees have substantial personal investments in the Invesco Funds complex. We’re fund shareholders just like you. |

We also use information from many independent sources during the review process, including materials provided by the independent Senior Officer of the Invesco Funds, who reports directly to the independent Trustees. We also meet in private sessions with independent legal counsel and review performance and fee data on the Invesco Funds prepared by Lipper Inc., an independent, third-party firm widely recognized as a leader in its field.
I’m pleased to report that the Invesco Funds Board determined in June that renewing the investment advisory agreement and the sub-advisory contracts with Invesco would serve the best interests of each fund and its shareholders. For more detailed information about our assessment and conclusions with respect to each of the Invesco Funds, visit invesco.com/us, click on the “About Us” section and go to “Legal Information.” Information on the recent investment advisory renewal process can be found by clicking the last item under “Corporate Governance.”
In much the same way we review your fund’s advisory contract each year, it’s a good idea for you to review your own investment plan with your financial adviser on a regular basis. Perhaps you need to reassess your original asset allocation because different investments may grow at varying paces, or perhaps you’re going through a significant life change. Regardless of your situation, a financial adviser can provide guidance and experience to help you reach your financial goals.
As always, please contact me at bruce@brucecrockett.com with any questions or concerns you may have. On behalf of the Board, we look forward to continuing to represent your interests and serving your needs.
Sincerely,

Bruce L. Crockett
Independent Chair
Invesco Funds Board of Trustees
3 Invesco Global Opportunities Fund
Management’s Discussion of Fund Performance
Performance summary
Invesco Global Opportunities Fund incepted on August 3, 2012. For the reporting period ended October 31, 2012, the Fund, at net asset value (NAV), outperformed the MSCI All Country World Index and the Lipper Global Large-Cap Core Funds Index, the Fund’s broad market/style-specific and peer group indexes, respectively.
Drivers of Fund performance were largely stock specific. Stock selection in Europe, particularly in the industrials and financials sectors, was strong. At the sector level, the bulk of relative underperformance was due to our low exposure to commodities, which recovered from their second-quarter underperformance relative to the style-specific benchmark.
Additional Fund performance appears later in this report.
Fund vs. Indexes
Cumulative total returns, 8/3/12 to 10/31/12, at net asset value (NAV). Performance shown does not include applicable contingent deferred sales charges (CDSC) or front-end sales charges, which would have reduced performance.
Class A Shares | 6.40 | % | ||
Class C Shares | 6.20 | |||
Class R Shares | 6.30 | |||
Class Y Shares | 6.50 | |||
Class R5 Shares* | 6.50 | |||
Class R6 Shares** | 6.40 | |||
MSCI All County World Indexq (Broad Market/Style-Specific | 4.69 | |||
Lipper Global Large-Cap Core Funds Indexq (Peer Group | 5.18 |
Source(s): qLipper Inc.
| * | Effective September 24, 2012, Institutional Class shares were renamed Class R5 shares. |
| ** | Share class incepted during the reporting period. See page 6 for a detailed explanation of Fund performance. |
| *** | Returns for the Fund’s indexes are from 7/31/12, the month-end closest to the date of the Fund’s inception. |
How we invest
In managing the Fund, our primary focus is to seek out the best investment ideas from around the world. The Fund has core holdings that we believe are companies with the potential for sustained growth and cash generation. We favor companies with strong aftermarket or service elements because of their ability to support earnings stability; many such companies are found in the industrials sector. The Fund also tends to hold a number of turnaround and special-situation investments that we believe the market is not pricing accurately. Exposure to
commodity-related stocks, such as those found in the materials sector, is generally modest in the Fund.
Your Fund is managed by the Global Equity Group (GEG) – eight portfolio managers who are experienced regional specialists who carry out independent research supported by regional investment teams. The GEG seeks compelling long-term investment opportunities that are vetted through a rigorous investment process. Invesco Perpetual’s† chief investment officer, Nick Mustoe, is the chairman of the GEG and the final arbiter of the Fund’s portfolio construction.
Before we meet to formally consider new investment ideas, the potential investment has been thoroughly researched and the case for purchasing it has been rigorously tested. While the entire team manages the Fund’s overall portfolio, each individual stock is managed by one team member responsible for monitoring developments related to the holding, keeping the team informed of those developments and, if warranted, recommending changes to the position. Our team includes eight lead regional specialists who cover all global markets; the wider investment team provides the research platform within which regional stock selection is undertaken. The chairman of the GEG and the strategy team provide leadership for the overall team. Decision-making is a team responsibility, although the chairman is ultimately responsible for ensuring the validity of all investment decisions. Continuous investment oversight is a critical component of the investment process.
The portfolio manager typically considers whether to sell a security in any of four circumstances:
| n | A more attractive investment opportunity is identified. |
| n | The full value of the investment is deemed to have been realized. |
| n | There has been a fundamental negative change in the management strategy of the issuer. |
| n | There has been a fundamental negative change in the competitive environment. |
Market conditions and your Fund
During the reporting period, global central banks announced a series of monetary stimulus policies that bolstered international equity markets. The European Central Bank announced new measures to support eurozone economies
Portfolio Composition
By sector
Industrials | 21.6 | % | ||
Financials | 16.4 | |||
Health Care | 16.0 | |||
Consumer Discretionary | 14.5 | |||
Information Technology | 13.5 | |||
Energy | 7.5 | |||
Consumer Staples | 4.9 | |||
Materials | 1.6 | |||
Telecommunication Services | 0.5 | |||
Money Market Funds Plus Other Assets Less Liabilities | 3.5 |
Top 10 Equity Holdings*
1. Novartis AG | 5.0 | % | ||
2. Roche Holding AG | 4.2 | |||
3. Microsoft Corp. | 3.5 | |||
4. Jardine Matheson Holdings Ltd. | 3.0 | |||
5. Johnson and Johnson | 2.9 | |||
6. Samsung Electronics Co., Ltd. | 2.8 | |||
7. Hutchison Whampoa Ltd. | 2.7 | |||
8. Rentokil Initial PLC | 2.7 | |||
9. HSBC Holdings PLC | 2.6 | |||
10. BAE Systems PLC | 2.6 |
Top Five Countries*
1. United States | 27.2 | % | ||
2. United Kingdom | 16.3 | |||
3. Switzerland | 11.4 | |||
4. Japan | 8.8 | |||
5. Hong Kong | 5.7 |
Total Net Assets | $ | 3.3 million | ||
Total Number of Holdings* | 50 | |||
The Fund’s holdings are subject to change, and there is no assurance that the Fund will continue to hold any particular security.
| * | Excluding money market fund holdings. |
4 Invesco Global Opportunities Fund
through potentially unlimited purchases of sovereign debt, also known as Outright Monetary Transactions (OMT). The US Federal Reserve announced a third round of quantitative easing by promising to remain accommodative until the labor market outlook improves materially. Also, the Bank of Japan took steps to increase its asset purchase program. These easing measures were well received by investors and helped drive international equity markets higher during the reporting period, despite signs of a continued slowdown in global economic growth. While emerging markets outperformed their developed market counterparts, Chinese equities performed relatively poorly given continued fears of potential economic weakness.
The Fund benefited from its relatively high exposure to Europe, with stock selection in the Netherlands, Spain and Switzerland contributing to relative performance. Financial stocks, in particular, were buoyed by the OMT, which helped shore up confidence in the financial system. Key contributors to relative performance included ING Groep, which represents a strong financial restructuring story. After a bailout by the Dutch government in 2007-2008, the company has reduced its global footprint. The restructuring is proving very successful, and with the state aid soon to be fully repaid, the company will be able to focus on achieving a sustainable return. Similarly, Swiss banking giant UBS has focused on rebuilding its damaged balance sheet and franchise following the global credit crisis. We see significant value in the private banking division of UBS as management has moved aggressively to de-emphasize the investment bank.
From a sector perspective, industrials was the biggest contributor to Fund performance with positive returns coming from a variety of sources, including defense (BAE) and Asian conglomerates (Jardine Matheson and Hutchison Whampoa). Obrascon Huarte Lain, a Spanish construction and engineering firm, was another strong contributor to relative performance in the sector. While there may be some inherent weakness in the Spanish construction business, we see substantial value in the company’s toll road concessions and construction business in Latin America. Corporate activity surrounding the company’s concessions unit, recent order wins and a stable backlog are improving visibility in the construction business.
Consumer staples, our second-largest sector underweight position, was the biggest detractor from performance. Consumer staples stocks have benefited from strong performance over the past few years, leaving many of them fully valued. Our consumer staples exposure was limited largely to tobacco stocks, with Reynolds American representing the largest detractor from relative performance in this space. Reynolds American’s recent underperformance likely stems from concerns about changes to US tax policy regarding dividends, a key attraction of Reynolds. Tobacco stocks also have traded lower on concerns about increased government regulation and increased efforts to eliminate tobacco use. We sold our holdings in Reynolds American before the close of the reporting period.
Vodafone, a UK-based mobile communications company, also detracted from the Fund’s relative performance. Vodafone’s core business is experiencing challenges in Europe, and the company faces headwinds from competition, technological shifts and weak economics.
Since the Fund’s inception on August 3, 2012, we have focused on seeking out companies with sound fundamentals, good management, strong balance sheets and attractive valuations, regardless of their location. As bottom-up stock-pickers, we seek out the most attractive and compelling investment opportunities from around the world, unconstrained by limitations on market capitalization, style or sector. We will continue to do so going forward.
We thank you for your investment in Invesco Global Opportunities Fund.
| † | Invesco Perpetual is a business name of Invesco Asset Management Limited (IAML), an investment adviser. Invesco Distributors, Inc., Invesco Advisers, Inc. and IAML are each wholly owned, indirect subsidiaries of Invesco Ltd. |
The views and opinions expressed in management’s discussion of Fund performance are those of Invesco Advisers, Inc. These views and opinions are subject to change at any time based on factors such as market and economic conditions. These views and opinions may not be relied upon as investment advice or recommendations, or as an offer for a particular security. The information is not a complete analysis of every aspect of any market, country, industry, security or the Fund. Statements of fact are from sources considered reliable, but Invesco Advisers, Inc. makes no representation or warranty as to their completeness or accuracy. Although historical performance is no guarantee of future results, these insights may help you understand our investment management philosophy.
See important Fund and, if applicable, index disclosures later in this report.
 | Nick Mustoe Portfolio manager and chief investment officer of Invesco Perpetual, is manager of Invesco Global Opportunities Fund. He joined | |
| Invesco in 2010. Mr. Mustoe earned a degree in business studies from Bradford University. | ||
Assisted by the Global Equity Group
5 Invesco Global Opportunities Fund
Your Fund’s Performance
Cumulative Total Returns
As of 10/31/12, including maximum applicable sales charges
Class A Shares | ||||
Inception (8/3/12) | 0.57 | % | ||
Class C Shares | ||||
Inception (8/3/12) | 5.20 | % | ||
Class R Shares | ||||
Inception (8/3/12) | 6.30 | % | ||
Class Y Shares | ||||
Inception (8/3/12) | 6.50 | % | ||
Class R5 Shares | ||||
Inception (8/3/12) | 6.50 | % | ||
Class R6 Shares | ||||
Inception | 6.40 | % | ||
Class R6 shares incepted on September 24, 2012. Performance shown prior to that date is that of Class A shares and includes the 12b-1 fees applicable to Class A shares. Class A share performance reflects any applicable fee waivers or expense reimbursements.
The performance data quoted represent past performance and cannot guarantee comparable future results; current performance may be lower or higher. Please visit invesco.com/performance for the most recent month-end performance. Performance figures reflect reinvested distributions, changes in net asset value and the effect of the maximum sales charge unless otherwise stated. Investment return and principal value will fluctuate so that you may have a gain or loss when you sell shares.
The net annual Fund operating expense ratio set forth in the most recent Fund prospectus as of the date of this report for Class A, Class C, Class R, Class Y, Class R5 and Class R6 shares was 1.36%, 2.11%, 1.61%, 1.11%, 1.11% and 1.11%, respectively.1 The total annual Fund operating expense ratio set forth in the most recent Fund prospectus as of the date of this report for Class A, Class C, Class R, Class Y, Class R5 and Class R6 shares was 3.49%, 4.24%, 3.74%, 3.24%, 3.11% and 3.07%, respectively. The expense ratios presented above may vary from the expense ratios presented in other sections of this report that are based on expenses incurred during the period covered by this report.
Cumulative Total Returns
As of 9/30/12, the most recent calendar quarter-end, including maximum applicable sales charges
Class A Shares | ||||
Inception (8/3/12) | -0.09 | % | ||
Class C Shares | ||||
Inception (8/3/12) | 4.60 | % | ||
Class R Shares | ||||
Inception (8/3/12) | 5.70 | % | ||
Class Y Shares | ||||
Inception (8/3/12) | 5.80 | % | ||
Class R5 Shares | ||||
Inception (8/3/12) | 5.80 | % | ||
Class R6 Shares | ||||
Inception | 5.70 | % | ||
Class A share performance reflects the maximum 5.50% sales charge, and Class C share performance reflects the applicable contingent deferred sales charge (CDSC) for the period involved. The CDSC on Class C shares is 1% for the first year after purchase. Class R, Class Y, Class R5 and Class R6 shares do not have a front-end sales charge or a CDSC; therefore, performance is at net asset value.
The performance of the Fund’s share classes will differ primarily due to different sales charge structures and class expenses.
Had the adviser not waived fees and/or reimbursed expenses, performance would have been lower.
| 1 | Total annual Fund operating expenses after any contractual fee waivers and/or expense reimbursements by the adviser in effect through at least July 31, 2013. See current prospectus for more information. |
6 Invesco Global Opportunities Fund
Invesco Global Opportunities Fund’s investment objective is long-term growth of capital.
| n | Unless otherwise stated, information presented in this report is as of October 31,2012, and is based on total net assets. |
| n | Unless otherwise noted, all data provided by Invesco. |
| n | To access your Fund’s reports/prospectus, visit invesco.com/fundreports. |
About share classes
| n | Class R shares are generally available only to employee benefit plans. Please see the prospectus for more information. |
| n | Class Y shares are available only to certain investors. Please see the prospectus for more information. |
| n | Class R5 shares and Class R6 shares are primarily intended for retirement plans that meet certain standards and for institutional investors. On September 24, 2012, Institutional Class shares were renamed Class R5 shares. Please see the prospectus for more information. |
��
Principal risks of investing in the Fund
| n | Currency/exchange rate risk. The dollar value of the Fund’s foreign investments will be affected by changes in the exchange rates between the dollar and the currencies in which those investments are traded. |
| n | Developing/emerging markets securities risk. Securities issued by foreign companies and governments located in developing/emerging countries may be affected more negatively by inflation, devaluation of their currencies, higher transaction costs, delays in settlement, adverse political developments, the introduction of capital controls, withholding taxes, nationalization of private assets, expropriation, social unrest, war or lack of timely information than those in developed countries. |
| n | Foreign securities risk. The Fund’s foreign investments may be affected by changes in a foreign country’s exchange rates; political and social instability; changes in economic or taxation policies; difficulties when enforcing obligations; decreased liquidity; and increased volatility. Foreign companies may be subject to less regulation resulting in less publicly available information about the companies. |
| n | Management risk. The investment techniques and risk analysis used by the Fund’s portfolio managers may not produce the desired results. |
| n | Market risk. The prices of and the income generated by the Fund’s securities may decline in response to, among other things, investor sentiment; general economic and market conditions; regional or global instability; and currency and interest rate fluctuations. |
| n | Small and mid-capitalization risk. Stocks of small and mid-sized companies tend to be more vulnerable to adverse developments in the above factors and may have little or no operating history or track record of success, and limited product lines, markets, management and financial resources. The securities of small and mid-sized companies may be more volatile due to less market interest and less publicly available information about the issuer. They also may be illiquid or restricted as to resale, or may trade less frequently and in smaller volumes, all of which may cause difficulty when establishing or closing a position at a desirable price. |
About indexes used in this report
| n | The MSCI All Country World IndexSM is an index considered representative of stock markets of developed and emerging markets. |
| n | The Lipper Global Large-Cap Core Funds Index is an unmanaged index considered representative of global large-cap core funds tracked by Lipper. |
| n | The Fund is not managed to track the performance of any particular index, including the index(es) defined here, and consequently, the performance of the Fund may deviate significantly from the performance of the index(es). |
| n | A direct investment cannot be made in an index. Unless otherwise indicated, index results include reinvested dividends, and they do not reflect sales charges. Performance of the peer group, if applicable, reflects fund expenses; performance of a market index does not. |
Other information
| n | The returns shown in management’s discussion of Fund performance are based on net asset values calculated for shareholder transactions. Generally accepted accounting principles require adjustments to be made to the net assets of the Fund at period end for financial reporting purposes, and as such, the net asset values for shareholder transactions and the returns based on those net asset values may differ from the net asset values and returns reported in the Financial Highlights. |
| n | Industry classifications used in this report are generally according to the Global Industry Classification Standard, which was developed by and is the exclusive property and a service mark of MSCI Inc. and Standard & Poor’s. |
This report must be accompanied or preceded by a currently effective Fund prospectus, which contains more complete information, including sales charges and expenses. Investors should read it carefully before investing.
| NOT FDIC INSURED | MAY LOSE VALUE | NO BANK GUARANTEE |
Fund Nasdaq Symbols | ||
Class A Shares | IAOPX | |
Class C Shares | ICOPX | |
Class R Shares | IROPX | |
Class Y Shares | IYOPX | |
Class R5 Shares | IIOPX | |
Class R6 Shares | IFOPX | |
7 Invesco Global Opportunities Fund
Schedule of Investments
October 31, 2012
| Shares | Value | |||||||
Common Stocks & Other Equity Interests–96.15% |
| |||||||
China–5.50% |
| |||||||
Baidu, Inc.–ADR(a) | 302 | $ | 32,199 | |||||
China Taiping Insurance Holdings Co. Ltd.(a) | 29,600 | 50,721 | ||||||
Daphne International Holdings Ltd. | 50,000 | 60,323 | ||||||
Wumart Stores, Inc.–Class H | 21,000 | 37,285 | ||||||
| 180,528 | ||||||||
Finland–1.64% |
| |||||||
UPM-Kymmene Oyj | 5,036 | 53,906 | ||||||
France–2.37% |
| |||||||
Cap Gemini S.A. | 185 | 7,797 | ||||||
Safran S.A. | 1,755 | 69,894 | ||||||
| 77,691 | ||||||||
Germany–2.05% |
| |||||||
Daimler AG | 1,446 | 67,506 | ||||||
Hong Kong–5.69% |
| |||||||
Hutchison Whampoa Ltd. | 9,000 | 88,438 | ||||||
Jardine Matheson Holdings Ltd. | 1,600 | 98,560 | ||||||
| 186,998 | ||||||||
Ireland–1.77% |
| |||||||
WPP PLC | 4,484 | 58,026 | ||||||
Japan–8.83% |
| |||||||
Mitsubishi Estate Co. Ltd. | 3,000 | 59,630 | ||||||
Nomura Holdings, Inc. | 8,600 | 31,026 | ||||||
Sumitomo Mitsui Financial Group, Inc. | 2,300 | 70,260 | ||||||
Tokyo Electron Ltd. | 1,500 | 67,362 | ||||||
Toyota Motor Corp. | 1,600 | 61,858 | ||||||
| 290,136 | ||||||||
Netherlands–2.39% |
| |||||||
ING Groep N.V.(a) | 8,818 | 78,472 | ||||||
Russia–2.06% |
| |||||||
LUKOIL–ADR | 1,114 | 67,535 | ||||||
South Korea–4.35% |
| |||||||
Samsung Electronics Co., Ltd. | 77 | 92,482 | ||||||
Shinhan Financial Group Co., Ltd. | 1,480 | 50,478 | ||||||
| 142,960 | ||||||||
Spain–3.02% |
| |||||||
Banco Bilbao Vizcaya Argentaria, S.A. | 4,075 | 33,992 | ||||||
Obrascon Huarte Lain, S.A. | 2,496 | 65,290 | ||||||
| 99,282 | ||||||||
| Shares | Value | |||||||
Switzerland–11.40% |
| |||||||
Novartis AG | 2,703 | $ | 162,913 | |||||
Roche Holding AG | 716 | 137,820 | ||||||
UBS AG(a) | 4,895 | 73,719 | ||||||
| 374,452 | ||||||||
Taiwan–1.83% |
| |||||||
Hon Hai Precision Industry Co., Ltd., REGS –GDR(b) | 9,888 | 60,170 | ||||||
United Kingdom–16.34% |
| |||||||
BAE Systems PLC | 16,673 | 84,154 | ||||||
BG Group PLC | 3,746 | 69,500 | ||||||
G4S PLC(a) | 15,996 | 67,108 | ||||||
GlaxoSmithKline PLC | 2,314 | 51,810 | ||||||
HSBC Holdings PLC | 8,800 | 86,233 | ||||||
Imperial Tobacco Group PLC | 1,607 | 60,761 | ||||||
Rentokil Initial PLC | 62,137 | 88,188 | ||||||
Resolution Ltd. | 1,192 | 4,211 | ||||||
Thomas Cook Group PLC(a) | 20,253 | 6,700 | ||||||
Vodafone Group PLC | 6,598 | 17,914 | ||||||
| 536,579 | ||||||||
United States–26.91% |
| |||||||
Apache Corp. | 578 | 47,829 | ||||||
Chevron Corp. | 543 | 59,844 | ||||||
Emerson Electric Co. | 1,219 | 59,036 | ||||||
Google Inc.–Class A(a) | 100 | 68,000 | ||||||
Johnson & Johnson | 1,367 | 96,811 | ||||||
Laboratory Corp. of America Holdings(a) | 886 | 75,071 | ||||||
Microsoft Corp. | 3,666 | 104,610 | ||||||
Philip Morris International Inc. | 692 | 61,283 | ||||||
Priceline.com Inc.(a) | 59 | 33,852 | ||||||
Stanley Black & Decker Inc. | 925 | 64,102 | ||||||
Time Warner Inc. | 1,340 | 58,223 | ||||||
Tyco International Ltd. | 575 | 15,450 | ||||||
United Technologies Corp. | 948 | 74,096 | ||||||
Viacom Inc.–Class B | 1,279 | 65,574 | ||||||
| 883,781 | ||||||||
Total Common Stocks & Other Equity Interests |
| 3,158,022 | ||||||
See accompanying Notes to Financial Statements which are an integral part of the financial statements.
8 Invesco Global Opportunities Fund
| Shares | Value | |||||||
Money Market Funds–2.08% | ||||||||
Liquid Assets Portfolio–Institutional Class(c) | 34,103 | $ | 34,103 | |||||
Premier Portfolio–Institutional Class(c) | 34,103 | 34,103 | ||||||
Total Money Market Funds |
| 68,206 | ||||||
TOTAL INVESTMENTS–98.23% |
| 3,226,228 | ||||||
OTHER ASSETS LESS LIABILITIES–1.77% |
| 58,225 | ||||||
NET ASSETS–100.00% |
| $ | 3,284,453 | |||||
Investment Abbreviations:
| ADR | – American Depositary Receipt | |
| GDR | – Global Depositary Receipt | |
| REGS | – Regulation S |
Notes to Schedule of Investments:
| (a) | Non-income producing security. |
| (b) | Security purchased or received in a transaction exempt from registration under the Securities Act of 1933, as amended. The security may be resold pursuant to an exemption from registration under the 1933 Act, typically to qualified institutional buyers. The value of this security at October 31, 2012 represented 1.83% of the Fund’s Net Assets. |
| (c) | The money market fund and the Fund are affiliated by having the same investment adviser. |
See accompanying Notes to Financial Statements which are an integral part of the financial statements.
9 Invesco Global Opportunities Fund
Statement of Assets and Liabilities
October 31, 2012
Assets: |
| |||
Investments, at value (Cost $2,956,367) | $ | 3,158,022 | ||
Investments in affiliated money market funds, at value and cost | 68,206 | |||
Total investments, at value (Cost $3,024,573) | 3,226,228 | |||
Foreign currencies, at value (Cost $28,497) | 28,227 | |||
Receivable for: | ||||
Investments sold | 92,498 | |||
Fund shares sold | 3,712 | |||
Dividends | 6,315 | |||
Investment for trustee deferred compensation and retirement plans | 1,085 | |||
Other assets | 72,457 | |||
Total assets | 3,430,522 | |||
Liabilities: |
| |||
Payable for: | ||||
Investments purchased | 47,893 | |||
Fund shares reacquired | 15,000 | |||
Accrued fees to affiliates | 44,545 | |||
Accrued other operating expenses | 37,546 | |||
Trustee deferred compensation and retirement plans | 1,085 | |||
Total liabilities | 146,069 | |||
Net assets applicable to shares outstanding | $ | 3,284,453 | ||
Net assets consist of: |
| |||
Shares of beneficial interest | $ | 3,067,190 | ||
Undistributed net investment income | 18,231 | |||
Undistributed net realized gain (loss) | (2,315 | ) | ||
Unrealized appreciation | 201,347 | |||
| $ | 3,284,453 | |||
Net Assets: |
| |||
Class A | $ | 1,657,990 | ||
Class C | $ | 14,480 | ||
Class R | $ | 10,642 | ||
Class Y | $ | 1,580,795 | ||
Class R5 | $ | 10,655 | ||
Class R6 | $ | 9,891 | ||
Shares outstanding, $0.001 par value per share, |
| |||
Class A | 155,850 | |||
Class C | 1,364 | |||
Class R | 1,001 | |||
Class Y | 148,501 | |||
Class R5 | 1,001 | |||
Class R6 | 930 | |||
Class A: | ||||
Net asset value per share | $ | 10.64 | ||
Maximum offering price per share | ||||
(Net asset value of $10.64 ¸ 94.50%) | $ | 11.26 | ||
Class C: | ||||
Net asset value and offering price per share | $ | 10.62 | ||
Class R: | ||||
Net asset value and offering price per share | $ | 10.63 | ||
Class Y: | ||||
Net asset value and offering price per share | $ | 10.65 | ||
Class R5: | ||||
Net asset value and offering price per share | $ | 10.64 | ||
Class R6: | ||||
Net asset value and offering price per share | $ | 10.64 | ||
See accompanying Notes to Financial Statements which are an integral part of the financial statements.
10 Invesco Global Opportunities Fund
Statement of Operations
For the period August 3, 2012 (commencement date) through October 31, 2012
Investment income: |
| |||
Dividends (net of foreign withholding taxes of $391) | $ | 16,861 | ||
Dividends from affiliated money market funds | 88 | |||
Total investment income | 16,949 | |||
Expenses: | ||||
Advisory fees | 6,305 | |||
Administrative services fees | 12,295 | |||
Custodian fees | 2,590 | |||
Distribution fees: | ||||
Class A | 987 | |||
Class C | 26 | |||
Class R | 13 | |||
Filing fees | 21,945 | |||
Professional fees | 30,891 | |||
Transfer agent fees — A, C, R and Y | 358 | |||
Transfer agent fees — R5 | 3 | |||
Transfer agent fees — R6 | 1 | |||
Trustees’ and officers’ fees and benefits | 5,874 | |||
Other | 6,012 | |||
Total expenses | 87,300 | |||
Less: Fees waived and expenses reimbursed | (77,601 | ) | ||
Net expenses | 9,699 | |||
Net investment income | 7,250 | |||
Realized and unrealized gain (loss) from: | ||||
Net realized gain (loss) from: | ||||
Investment securities | (2,315 | ) | ||
Foreign currencies | (13,676 | ) | ||
| (15,991 | ) | |||
Change in net unrealized appreciation (depreciation) of: | ||||
Investment securities | 201,655 | |||
Foreign currencies | (308 | ) | ||
| 201,347 | ||||
Net realized and unrealized gain | 185,356 | |||
Net increase in net assets resulting from operations | $ | 192,606 | ||
See accompanying Notes to Financial Statements which are an integral part of the financial statements.
11 Invesco Global Opportunities Fund
Statement of Changes in Net Assets
For the period August 3, 2012 (commencement date) through October 31, 2012
Operations: |
| |||
Net investment income | $ | 7,250 | ||
Net realized gain (loss) | (15,991 | ) | ||
Change in net unrealized appreciation | 201,347 | |||
Net increase in net assets resulting from operations | 192,606 | |||
Share transactions–net: | ||||
Class A | 1,562,957 | |||
Class C | 13,860 | |||
Class R | 10,010 | |||
Class Y | 1,485,010 | |||
Class R5 | 10,010 | |||
Class R6 | 10,000 | |||
Net increase in net assets resulting from share transactions | 3,091,847 | |||
Net increase in net assets | 3,284,453 | |||
Net assets: | ||||
Beginning of period | — | |||
End of period (includes undistributed net investment income of $18,231) | $ | 3,284,453 | ||
Notes to Financial Statements
October 31, 2012
NOTE 1—Significant Accounting Policies
Invesco Global Opportunities Fund (the “Fund”) is a series portfolio of AIM International Mutual Funds (Invesco International Mutual Funds) (the “Trust”). The Trust is a Delaware statutory trust registered under the Investment Company Act of 1940, as amended (the “1940 Act”), as an open-end series management investment company consisting of eight separate portfolios, each authorized to issue an unlimited number of shares of beneficial interest. The assets, liabilities and operations of each portfolio are accounted for separately. Information presented in these financial statements pertains only to the Fund. Matters affecting each portfolio or class will be voted on exclusively by the shareholders of such portfolio or class.
The Fund currently consists of six different classes of shares: Class A, Class C, Class R, Class Y, Class R5 and Class R6. On September 24, 2012, Institutional Class shares were renamed Class R5 shares and the Fund began offering Class R6 shares. Class A shares are sold with a front-end sales charge unless certain waiver criteria are met and under certain circumstances load waiver shares may be subject to contingent deferred sales charges (“CDSC”). Class C, Class R, Class Y, Class R5 and Class R6 shares are sold at net asset value.
The Fund’s investment objective is long-term growth of capital.
The following is a summary of the significant accounting policies followed by the Fund in the preparation of its financial statements.
| A. | Security Valuations — Securities, including restricted securities, are valued according to the following policy. |
A security listed or traded on an exchange (except convertible bonds) is valued at its last sales price or official closing price as of the close of the customary trading session on the exchange where the security is principally traded, or lacking any sales or official closing price on a particular day, the security may be valued at the closing bid price on that day. Securities traded in the over-the-counter market are valued based on prices furnished by independent pricing services or market makers. When such securities are valued by an independent pricing service they may be considered fair valued. Futures contracts are valued at the final settlement price set by an exchange on which they are principally traded. Listed options are valued at the mean between the last bid and ask prices from the exchange on which they are principally traded. Options not listed on an exchange are valued by an independent source at the mean between the last bid and ask prices. For purposes of determining net asset value per share, futures and option contracts generally are valued 15 minutes after the close of the customary trading session of the New York Stock Exchange (“NYSE”).
Investments in open-end and closed-end registered investment companies that do not trade on an exchange are valued at the end of day net asset value per share. Investments in open-end and closed-end registered investment companies that trade on an exchange are valued at the last sales price or official closing price as of the close of the customary trading session on the exchange where the security is principally traded.
Debt obligations (including convertible bonds) and unlisted equities are fair valued using an evaluated quote provided by an independent pricing service. Evaluated quotes provided by the pricing service may be determined without exclusive reliance on quoted prices, and may reflect appropriate factors such as institution-size trading in similar groups of securities, developments related to specific securities, dividend rate, yield, quality, type of issue, coupon rate, maturity, individual trading characteristics and other market data. Debt securities are subject to interest rate and credit risks. In addition, all debt securities involve some risk of default with respect to interest and/or principal payments.
Foreign securities (including foreign exchange contracts) are converted into U.S. dollar amounts using the applicable exchange rates as of the close of the NYSE. If market quotations are available and reliable for foreign exchange traded equity securities, the securities will be valued at the
12 Invesco Global Opportunities Fund
market quotations. Because trading hours for certain foreign securities end before the close of the NYSE, closing market quotations may become unreliable. If between the time trading ends on a particular security and the close of the customary trading session on the NYSE, events occur that are significant and make the closing price unreliable, the Fund may fair value the security. If the event is likely to have affected the closing price of the security, the security will be valued at fair value in good faith using procedures approved by the Board of Trustees. Adjustments to closing prices to reflect fair value may also be based on a screening process of an independent pricing service to indicate the degree of certainty, based on historical data, that the closing price in the principal market where a foreign security trade is not the current value as of the close of the NYSE. Foreign securities meeting the approved degree of certainty that the price is not reflective of current value will be priced at the indication of fair value from the independent pricing service. Multiple factors may be considered by the independent pricing service in determining adjustments to reflect fair value and may include information relating to sector indices, American Depositary Receipts and domestic and foreign index futures. Foreign securities may have additional risks including exchange rate changes, potential for sharply devalued currencies and high inflation, political and economic upheaval, the relative lack of issuer information, relatively low market liquidity and the potential lack of strict financial and accounting controls and standards.
Securities for which market prices are not provided by any of the above methods may be valued based upon quotes furnished by independent sources. The last bid price may be used to value equity securities. The mean between the last bid and asked prices is used to value debt obligations, including corporate loans.
Securities for which market quotations are not readily available or are unreliable are valued at fair value as determined in good faith by or under the supervision of the Trust’s officers following procedures approved by the Board of Trustees. Issuer specific events, market trends, bid/ask quotes of brokers and information providers and other market data may be reviewed in the course of making a good faith determination of a security’s fair value.
Valuations change in response to many factors including the historical and prospective earnings of the issuer, the value of the issuer’s assets, general economic conditions, interest rates, investor perceptions and market liquidity. Because of the inherent uncertainties of valuation, the values reflected in the financial statements may materially differ from the value received upon actual sale of those investments.
| B. | Securities Transactions and Investment Income — Securities transactions are accounted for on a trade date basis. Realized gains or losses on sales are computed on the basis of specific identification of the securities sold. Interest income is recorded on the accrual basis from settlement date. Dividend income (net of withholding tax, if any) is recorded on the ex-dividend date. |
The Fund may periodically participate in litigation related to Fund investments. As such, the Fund may receive proceeds from litigation settlements. Any proceeds received are included in the Statement of Operations as realized gain (loss) for investments no longer held and as unrealized gain (loss) for investments still held.
Brokerage commissions and mark ups are considered transaction costs and are recorded as an increase to the cost basis of securities purchased and/or a reduction of proceeds on a sale of securities. Such transaction costs are included in the determination of net realized and unrealized gain (loss) from investment securities reported in the Statement of Operations and the Statement of Changes in Net Assets and the net realized and unrealized gains (losses) on securities per share in the Financial Highlights. Transaction costs are included in the calculation of the Fund’s net asset value and, accordingly, they reduce the Fund’s total returns. These transaction costs are not considered operating expenses and are not reflected in net investment income reported in the Statement of Operations and Statement of Changes in Net Assets, or the net investment income per share and ratios of expenses and net investment income reported in the Financial Highlights, nor are they limited by any expense limitation arrangements between the Fund and the investment adviser.
The Fund allocates income and realized and unrealized capital gains and losses to a class based on the relative net assets of each class.
| C. | Country Determination — For the purposes of making investment selection decisions and presentation in the Schedule of Investments, the investment adviser may determine the country in which an issuer is located and/or credit risk exposure based on various factors. These factors include the laws of the country under which the issuer is organized, where the issuer maintains a principal office, the country in which the issuer derives 50% or more of its total revenues and the country that has the primary market for the issuer’s securities, as well as other criteria. Among the other criteria that may be evaluated for making this determination are the country in which the issuer maintains 50% or more of its assets, the type of security, financial guarantees and enhancements, the nature of the collateral and the sponsor organization. Country of issuer and/or credit risk exposure has been determined to be the United States of America, unless otherwise noted. |
| D. | Distributions — Distributions from income and net realized capital gain, if any, are generally declared and paid annually and recorded on the ex-dividend date. The Fund may elect to treat a portion of the proceeds from redemptions as distributions for federal income tax purposes. |
| E. | Federal Income Taxes — The Fund intends to comply with the requirements of Subchapter M of the Internal Revenue Code necessary to qualify as a regulated investment company and to distribute substantially all of the Fund’s taxable earnings to shareholders. As such, the Fund will not be subject to federal income taxes on otherwise taxable income (including net realized capital gain) that is distributed to shareholders. Therefore, no provision for federal income taxes is recorded in the financial statements. |
The Fund files tax returns in the U.S. Federal jurisdiction and certain other jurisdictions. Generally, the Fund is subject to examinations by such taxing authorities for up to three years after the filing of the return for the tax period.
| F. | Expenses — Fees provided for under the Rule 12b-1 plan of a particular class of the Fund are charged to the operations of such class. Transfer agency fees and expenses and other shareholder recordkeeping fees and expenses attributable to Class R5 and Class R6 are allocated to each share class based on relative net assets. Sub-accounting fees attributable to Class R5 are charged to the operations of the class. Transfer agency fees and expenses and other shareholder recordkeeping fees and expenses relating to all other classes are allocated among those classes based on relative net assets. All other expenses are allocated among the classes based on relative net assets. |
| G. | Accounting Estimates — The preparation of financial statements in conformity with accounting principles generally accepted in the United States of America (“GAAP”) requires management to make estimates and assumptions that affect the reported amounts of assets and liabilities at the date of the financial statements and the reported amounts of revenues and expenses during the reporting period including estimates and assumptions related to taxation. Actual results could differ from those estimates by a significant amount. In addition, the Fund monitors for material events or transactions that may occur or become known after the period-end date and before the date the financial statements are released to print. |
| H. | Indemnifications — Under the Trust’s organizational documents, each Trustee, officer, employee or other agent of the Trust is indemnified against certain liabilities that may arise out of the performance of their duties to the Fund. Additionally, in the normal course of business, the |
13 Invesco Global Opportunities Fund
| Fund enters into contracts, including the Fund’s servicing agreements, that contain a variety of indemnification clauses. The Fund’s maximum exposure under these arrangements is unknown as this would involve future claims that may be made against the Fund that have not yet occurred. The risk of material loss as a result of such indemnification claims is considered remote. |
| I. | Foreign Currency Translations — Foreign currency is valued at the close of the NYSE based on quotations posted by banks and major currency dealers. Portfolio securities and other assets and liabilities denominated in foreign currencies are translated into U.S. dollar amounts at date of valuation. Purchases and sales of portfolio securities (net of foreign taxes withheld on disposition) and income items denominated in foreign currencies are translated into U.S. dollar amounts on the respective dates of such transactions. The Fund does not separately account for the portion of the results of operations resulting from changes in foreign exchange rates on investments and the fluctuations arising from changes in market prices of securities held. The combined results of changes in foreign exchange rates and the fluctuation of market prices on investments (net of estimated foreign tax withholding) are included with the net realized and unrealized gain or loss from investments in the Statement of Operations. Reported net realized foreign currency gains or losses arise from (1) sales of foreign currencies, (2) currency gains or losses realized between the trade and settlement dates on securities transactions, and (3) the difference between the amounts of dividends, interest, and foreign withholding taxes recorded on the Fund’s books and the U.S. dollar equivalent of the amounts actually received or paid. Net unrealized foreign currency gains and losses arise from changes in the fair values of assets and liabilities, other than investments in securities at fiscal period end, resulting from changes in exchange rates. |
The Fund may invest in foreign securities which may be subject to foreign taxes on income, gains on investments or currency repatriation, a portion of which may be recoverable.
| J. | Foreign Currency Contracts — The Fund may enter into foreign currency contracts to manage or minimize currency or exchange rate risk. The Fund may also enter into foreign currency contracts for the purchase or sale of a security denominated in a foreign currency in order to “lock in” the U.S. dollar price of that security. A foreign currency contract is an obligation to purchase or sell a specific currency for an agreed-upon price at a future date. The use of foreign currency contracts does not eliminate fluctuations in the price of the underlying securities the Fund owns or intends to acquire but establishes a rate of exchange in advance. Fluctuations in the value of these contracts are measured by the difference in the contract date and reporting date exchange rates and are recorded as unrealized appreciation (depreciation) until the contracts are closed. When the contracts are closed, realized gains (losses) are recorded. Realized and unrealized gains (losses) on the contracts are included in the Statement of Operations. The primary risks associated with foreign currency contracts include failure of the counterparty to meet the terms of the contract and the value of the foreign currency changing unfavorably. These risks may be in excess of the amounts reflected in the Statement of Assets and Liabilities. |
NOTE 2—Advisory Fees and Other Fees Paid to Affiliates
The Trust has entered into a master investment advisory agreement with Invesco Advisers, Inc. (the “Adviser” or “Invesco”). Under the terms of the investment advisory agreement, the Fund pays an advisory fee to the Adviser based on the annual rate of the Fund’s average daily net assets as follows:
| Average Daily Net Assets | Rate | |||
First $250 million | 0.80% | |||
Next $250 million | 0.78% | |||
Next $500 million | 0.76% | |||
Next $1.5 billion | 0.74% | |||
Next $2.5 billion | 0.72% | |||
Next $2.5 billion | 0.70% | |||
Next $2.5 billion | 0.68% | |||
Over $10 billion | 0.66% | |||
Under the terms of a master sub-advisory agreement between the Adviser and each of Invesco Asset Management Deutschland GmbH, Invesco Asset Management Limited, Invesco Asset Management (Japan) Limited, Invesco Australia Limited, Invesco Hong Kong Limited, Invesco Senior Secured Management, Inc., Invesco Canada Ltd. and Invesco PowerShares Capital Management LLC (collectively, the “Affiliated Sub-Advisers”) the Adviser, not the Fund, may pay 40% of the fees paid to the Adviser to any such Affiliated Sub-Adviser(s) that provide discretionary investment management services to the Fund based on the percentage of assets allocated to such Sub-Adviser(s).
The Adviser has contractually agreed, through at least February 28, 2014, to waive advisory fees and/or reimburse expenses of all shares to the extent necessary to limit total annual fund operating expenses after fee waiver and/or expense reimbursement (excluding certain items discussed below) of Class A, Class C, Class R, Class Y, Class R5 and Class R6 shares to 1.36%, 2.11%, 1.61%, 1.11%, 1.11% and 1.11%, respectively, of average daily net assets. In determining the Adviser’s obligation to waive advisory fees and/or reimburse expenses, the following expenses are not taken into account, and could cause the total annual fund operating expenses after fee waiver and/or expense reimbursement to exceed the numbers reflected above: (1) interest; (2) taxes; (3) dividend expense on short sales; (4) extraordinary or non-routine items, litigation expenses; and (5) expenses that the Fund has incurred but did not actually pay because of an expense offset arrangement. Unless the Board of Trustees and Invesco mutually agree to amend or continue the fee waiver agreement, it will terminate on February 28, 2014.
The Adviser has contractually agreed, through at least June 30, 2013, to waive the advisory fee payable by the Fund in an amount equal to 100% of the net advisory fees the Adviser receives from the affiliated money market funds on investments by the Fund of uninvested cash in such affiliated money market funds.
For the period August 3, 2012 (commencement date) to October 31, 2012, the Adviser waived advisory fees and reimbursed fund level expenses of $77,239 and reimbursed class level expenses of $180, $1, $1, $176, $3 and $1 of Class A, Class C, Class R, Class Y, Class R5 and Class R6, respectively.
The Trust has entered into a transfer agency and service agreement with Invesco Investment Services, Inc. (“IIS”) pursuant to which the Fund has agreed to pay IIS a fee for providing transfer agency and shareholder services to the Fund and reimburse IIS for certain expenses incurred by IIS in the
14 Invesco Global Opportunities Fund
course of providing such services. IIS may make payments to intermediaries that provide omnibus account services, sub-accounting services and/or networking services. All fees payable by IIS to intermediaries that provide omnibus account services or sub-accounting are charged back to the Fund, subject to certain limitations approved by the Trust’s Board of Trustees. For the period August 3, 2012 (commencement date) to October 31, 2012, expenses incurred under the agreement are shown in the Statement of Operations as Transfer agent fees.
The Trust has entered into a master administrative services agreement with Invesco pursuant to which the Fund has agreed to pay Invesco for certain administrative costs incurred in providing accounting services to the Fund. For the period August 3, 2012 (commencement date) to October 31, 2012, expenses incurred under the agreement are shown in the Statement of Operations as Administrative services fees.
The Trust has entered into master distribution agreements with Invesco Distributors, Inc. (“IDI”) to serve as the distributor for the Class A, Class C, Class R, Class Y, Class R5 and Class R6 shares of the Fund. The Trust has adopted plans pursuant to Rule 12b-1 under the 1940 Act with respect to the Fund’s Class A, Class C and Class R shares (collectively, the “Plans”). The Fund, pursuant to the Plans, pays IDI compensation at the annual rate of 0.25% of the Fund’s average daily net assets of Class A shares, 1.00% of the average daily net assets of Class C shares and 0.50% of the average daily net assets of Class R shares. Of the Plan payments, up to 0.25% of the average daily net assets of each class of shares may be paid to furnish continuing personal shareholder services to customers who purchase and own shares of such classes. Any amounts not paid as a service fee under the Plans would constitute an asset-based sales charge. Rules of the Financial Industry Regulatory Authority (“FINRA”) impose a cap on the total sales charges, including asset-based sales charges, that may be paid by any class of shares of the Fund. For the period August 3, 2012 (commencement date) to October 31, 2012, expenses incurred under the Plans are shown in the Statement of Operations as Distribution fees.
Front-end sales commissions and CDSC (collectively, the “sales charges”) are not recorded as expenses of the Fund. Front-end sales commissions are deducted from proceeds from the sales of Fund shares prior to investment in Class A shares of the Fund. CDSC are deducted from redemption proceeds prior to remittance to the shareholder. During the period August 3, 2012 (commencement date) to October 31, 2012, IDI advised the Fund that IDI retained $34 in front-end sales commissions from the sale of Class A shares.
Certain officers and trustees of the Trust are officers and directors of the Adviser, IIS and/or IDI.
NOTE 3—Additional Valuation Information
GAAP defines fair value as the price that would be received to sell an asset or paid to transfer a liability in an orderly transaction between market participants at the measurement date, under current market conditions. GAAP establishes a hierarchy that prioritizes the inputs to valuation methods giving the highest priority to readily available unadjusted quoted prices in an active market for identical assets (Level 1) and the lowest priority to significant unobservable inputs (Level 3) generally when market prices are not readily available or are unreliable. Based on the valuation inputs, the securities or other investments are tiered into one of three levels. Changes in valuation methods may result in transfers in or out of an investment’s assigned level:
| Level 1 — | Prices are determined using quoted prices in an active market for identical assets. |
| Level 2 – | Prices are determined using other significant observable inputs. Observable inputs are inputs that other market participants may use in pricing a security. These may include quoted prices for similar securities, interest rates, prepayment speeds, credit risk, yield curves, loss severities, default rates, discount rates, volatilities and others. |
| Level 3 – | Prices are determined using significant unobservable inputs. In situations where quoted prices or observable inputs are unavailable (for example, when there is little or no market activity for an investment at the end of the period), unobservable inputs may be used. Unobservable inputs reflect the Fund’s own assumptions about the factors market participants would use in determining fair value of the securities or instruments and would be based on the best available information. |
The following is a summary of the tiered valuation input levels, as of October 31, 2012. The level assigned to the securities valuations may not be an indication of the risk or liquidity associated with investing in those securities. Because of the inherent uncertainties of valuation, the values reflected in the financial statements may materially differ from the value received upon actual sale of those investments.
| Level 1 | Level 2 | Level 3 | Total | |||||||||||||
China | $ | 180,528 | $ | — | $ | — | $ | 180,528 | ||||||||
Finland | 53,906 | — | — | 53,906 | ||||||||||||
France | — | 77,691 | — | 77,691 | ||||||||||||
Germany | 67,506 | — | — | 67,506 | ||||||||||||
Hong Kong | 98,560 | 88,438 | — | 186,998 | ||||||||||||
Ireland | — | 58,026 | — | 58,026 | ||||||||||||
Japan | 98,388 | 191,748 | — | 290,136 | ||||||||||||
Netherlands | — | 78,472 | — | 78,472 | ||||||||||||
Russia | — | 67,535 | — | 67,535 | ||||||||||||
South Korea | 92,482 | 50,478 | — | 142,960 | ||||||||||||
Spain | 99,282 | — | — | 99,282 | ||||||||||||
Switzerland | — | 374,452 | — | 374,452 | ||||||||||||
Taiwan | — | 60,170 | — | 60,170 | ||||||||||||
United Kingdom | 179,910 | 356,669 | — | 536,579 | ||||||||||||
United States | 951,987 | — | — | 951,987 | ||||||||||||
Total Investments | $ | 1,822,549 | $ | 1,403,679 | $ | — | $ | 3,226,228 | ||||||||
15 Invesco Global Opportunities Fund
NOTE 4—Trustees’ and Officers’ Fees and Benefits
“Trustees’ and Officers’ Fees and Benefits” include amounts accrued by the Fund to pay remuneration to certain Trustees and Officers of the Fund. Trustees have the option to defer compensation payable by the Fund, and “Trustees’ and Officers’ Fees and Benefits” also include amounts accrued by the Fund to fund such deferred compensation amounts. Those Trustees who defer compensation have the option to select various Invesco Funds in which their deferral accounts shall be deemed to be invested. Finally, certain current Trustees are eligible to participate in a retirement plan that provides for benefits to be paid upon retirement to Trustees over a period of time based on the number of years of service. The Fund may have certain former Trustees who also participate in a retirement plan and receive benefits under such plan. “Trustees’ and Officers’ Fees and Benefits” include amounts accrued by the Fund to fund such retirement benefits. Obligations under the deferred compensation and retirement plans represent unsecured claims against the general assets of the Fund.
NOTE 5—Cash Balances
The Fund is permitted to temporarily carry a negative or overdrawn balance in its account with State Street Bank and Trust Company, the custodian bank. Such balances, if any at period end, are shown in the Statement of Assets and Liabilities under the payable caption Amount due custodian. To compensate the custodian bank for such overdrafts, the overdrawn Fund may either (1) leave funds as a compensating balance in the account so the custodian bank can be compensated by earning the additional interest; or (2) compensate by paying the custodian bank at a rate agreed upon by the custodian bank and Invesco, not to exceed the contractually agreed upon rate.
NOTE 6—Distributions to Shareholders and Tax Components of Net Assets
There were no ordinary income or long-term capital gain distributions during the period August 3, 2012 (commencement date) to October 31, 2012.
Tax Components of Net Assets at Period-End:
| 2012 | ||||
Undistributed ordinary income | $ | 19,191 | ||
Net unrealized appreciation — investments | 201,655 | |||
Net unrealized appreciation (depreciation) — other investments | (308 | ) | ||
Temporary book/tax differences | (960 | ) | ||
Capital loss carryforward | (2,315 | ) | ||
Shares of beneficial interest | 3,067,190 | |||
Total net assets | $ | 3,284,453 | ||
The temporary book/tax differences are a result of timing differences between book and tax recognition of income and/or expenses. The Fund’s temporary book/tax differences are the result of the trustee deferral of compensation and retirement plan benefits.
Capital loss carryforward is calculated and reported as of a specific date. Results of transactions and other activity after that date may affect the amount of capital loss carryforward actually available for the Fund to utilize. The Regulated Investment Company Modernization Act of 2010 (the “Act”) eliminated the eight-year carryover period for capital losses that arise in taxable years beginning after its enactment date of December 22, 2010. Consequently, these capital losses can be carried forward for an unlimited period. However, capital losses with an expiration period may not be used to offset capital gains until all net capital losses without an expiration date have been utilized. Additionally, post-enactment capital loss carryovers will retain their character as either short-term or long-term capital losses instead of as short-term capital losses as under prior law. The ability to utilize capital loss carryforward in the future may be limited under the Internal Revenue Code and related regulations based on the results of future transactions.
The Fund has a capital loss carryforward as of October 31, 2012, which expires as follows:
| Capital Loss Carryforward* | ||||||||||||
| Expiration | Short-Term | Long-Term | Total | |||||||||
Not subject to expiration | $ | 2,315 | $ | — | $ | 2,315 | ||||||
| * | Capital loss carryforward as of the date listed above is reduced for limitations, if any, to the extent required by the Internal Revenue Code. |
NOTE 7—Investment Securities
The aggregate amount of investment securities (other than short-term securities, U.S. Treasury obligations and money market funds, if any) purchased and sold by the Fund during the period August 3, 2012 (commencement date) to October 31, 2012 was $3,248,033 and $289,352, respectively. Cost of investments on a tax basis includes the adjustments for financial reporting purposes as of the most recently completed federal income tax reporting period-end.
| Unrealized Appreciation (Depreciation) of Investment Securities on a Tax Basis | ||||
Aggregate unrealized appreciation of investment securities | $ | 243,465 | ||
Aggregate unrealized (depreciation) of investment securities | (41,810 | ) | ||
Net unrealized appreciation of investment securities | $ | 201,655 | ||
Cost of investments is the same for tax and financial reporting purposes.
16 Invesco Global Opportunities Fund
NOTE 8—Reclassification of Permanent Differences
Primarily as a result of differing book/tax treatment of foreign currency transactions and non-deductible stock issuance costs, on October 31, 2012, undistributed net investment income was increased by $10,981, undistributed net realized gain (loss) was increased by $13,676 and shares of beneficial interest was decreased by $24,657. This reclassification had no effect on the net assets of the Fund.
NOTE 9—Share Information
| Summary of Share Activity | ||||||||
| August 3, 2012 (commencement date) to October 31, 2012(a) | ||||||||
| Shares | Amount | |||||||
Sold: | ||||||||
Class A | 157,740 | $ | 1,583,061 | |||||
Class C | 1,364 | 13,860 | ||||||
Class R | 1,001 | 10,010 | ||||||
Class Y | 148,501 | 1,485,010 | ||||||
Class R5 | 1,001 | 10,010 | ||||||
Class R6(b) | 930 | 10,000 | ||||||
Reacquired: | ||||||||
Class A | (1,890 | ) | (20,104 | ) | ||||
Net increase in share activity | 308,647 | $ | 3,091,847 | |||||
| (a) | 98% of the outstanding shares of the Fund are owned by the Adviser. |
| (b) | Commencement date of September 24, 2012. |
NOTE 10—Financial Highlights
The following schedule presents financial highlights for a share of the Fund outstanding throughout the periods indicated.
| Net asset value, beginning of period | Net investment income(a) | Net gains (losses) on securities (both realized and unrealized) | Total from investment operations | Net asset value, end of period | Total return(b) | Net assets, end of period (000s omitted) | Ratio of expenses to average net assets with fee waivers and/or expenses absorbed | Ratio of expenses to average net assets without fee waivers and/or expenses absorbed | Ratio of net investment income to average net assets | Portfolio turnover(c) | ||||||||||||||||||||||||||||||||||
Class A |
| |||||||||||||||||||||||||||||||||||||||||||
Period ended 10/31/12(d) | $ | 10.00 | $ | 0.02 | $ | 0.62 | $ | 0.64 | $ | 10.64 | 6.40 | % | $ | 1,658 | 1.35 | %(e) | 11.20 | %(e) | 0.80 | %(e) | 9 | % | ||||||||||||||||||||||
Class C |
| |||||||||||||||||||||||||||||||||||||||||||
Period ended 10/31/12(d) | 10.00 | 0.00 | 0.62 | 0.62 | 10.62 | 6.20 | 14 | 2.10 | (e) | 11.95 | (e) | 0.05 | (e) | 9 | ||||||||||||||||||||||||||||||
Class R |
| |||||||||||||||||||||||||||||||||||||||||||
Period ended 10/31/12(d) | 10.00 | 0.01 | 0.62 | 0.63 | 10.63 | 6.30 | 11 | 1.60 | (e) | 11.45 | (e) | 0.55 | (e) | 9 | ||||||||||||||||||||||||||||||
Class Y |
| |||||||||||||||||||||||||||||||||||||||||||
Period ended 10/31/12(d) | 10.00 | 0.03 | 0.62 | 0.65 | 10.65 | 6.50 | 1,581 | 1.10 | (e) | 10.95 | (e) | 1.05 | (e) | 9 | ||||||||||||||||||||||||||||||
Class R5 |
| |||||||||||||||||||||||||||||||||||||||||||
Period ended 10/31/12(d) | 10.00 | 0.03 | 0.61 | 0.64 | 10.64 | 6.40 | 11 | 1.10 | (e) | 11.00 | (e) | 1.05 | (e) | 9 | ||||||||||||||||||||||||||||||
Class R6 |
| |||||||||||||||||||||||||||||||||||||||||||
Period ended 10/31/12(d) | 10.76 | 0.01 | (0.13 | ) | (0.12 | ) | 10.64 | (1.12 | ) | 10 | 1.10 | (e) | 8.37 | (e) | 1.05 | (e) | 9 | |||||||||||||||||||||||||||
| (a) | Calculated using average shares outstanding. |
| (b) | Includes adjustments in accordance with accounting principles generally accepted in the United States of America and as such, the net asset value for financial reporting purposes and the returns based upon those net asset values may differ from the net asset value and returns for shareholder transactions. Does not include sales charges and is not annualized for periods less than one year, if applicable. |
| (c) | Portfolio turnover is calculated at the fund level and is not annualized for periods less than one year, if applicable. |
| (d) | Commencement date of August 3, 2012 for Class A, Class C, Class R, Class Y and Class R5 shares and September 24, 2012 for Class R6 shares. |
| (e) | Ratios are annualized and based on average daily net assets (000’s omitted) of $1,606, $11, $11, $1,564, $11 and $10 for Class A, Class C, Class R, Class Y, Class R5 and Class R6 shares, respectively. |
17 Invesco Global Opportunities Fund
Report of Independent Registered Public Accounting Firm
To the Board of Trustees of AIM International Mutual Funds (Invesco International Mutual Funds)
and Shareholders of Invesco Global Opportunities Fund:
In our opinion, the accompanying statement of assets and liabilities, including the schedule of investments, and the related statements of operations and of changes in net assets and the financial highlights present fairly, in all material respects, the financial position of Invesco Global Opportunities Fund (one of the funds constituting AIM International Mutual Funds (Invesco International Mutual Funds), hereafter referred to as the “Fund”) at October 31, 2012, the results of its operations, the changes in its net assets and the financial highlights for the period August 3, 2012 (commencement date) through October 31, 2012, in conformity with accounting principles generally accepted in the United States of America. These financial statements and financial highlights (hereafter referred to as “financial statements”) are the responsibility of the Fund’s management; our responsibility is to express an opinion on these financial statements based on our audit. We conducted our audit of these financial statements in accordance with the standards of the Public Company Accounting Oversight Board (United States). Those standards require that we plan and perform the audit to obtain reasonable assurance about whether the financial statements are free of material misstatement. An audit includes examining, on a test basis, evidence supporting the amounts and disclosures in the financial statements, assessing the accounting principles used and significant estimates made by management, and evaluating the overall financial statement presentation. We believe that our audit, which included confirmation of securities at October 31, 2012 by correspondence with the custodian and brokers, provides a reasonable basis for our opinion.
PRICEWATERHOUSECOOPERS LLP
December 21, 2012
Houston, Texas
18 Invesco Global Opportunities Fund
Calculating your ongoing Fund expenses
Example
As a shareholder of the Fund, you incur two types of costs: (1) transaction costs, which may include sales charges (loads) on purchase payments or contingent deferred sales charges on redemptions, and redemption fees, if any; and (2) ongoing costs, including management fees, distribution and/or service (12b-1) fees, and other Fund expenses. This example is intended to help you understand your ongoing costs (in dollars) of investing in the Fund and to compare these costs with ongoing costs of investing in other mutual funds. With the exception of the actual ending account value and expenses of the Class R6 shares, the example is based on an investment of $1,000 invested at the beginning of the period and held for the entire period August 3, 2012 (commencement date) through October 31, 2012. The actual ending account value and expenses of the Class R6 shares in the example below are based on an investment of $1,000 invested as of close of business September 24, 2012 (commencement date) and held through October 31, 2012.
Actual expenses
The table below provides information about actual account values and actual expenses. You may use the information in this table, together with the amount you invested, to estimate the expenses that you paid over the period. Simply divide your account value by $1,000 (for example, an $8,600 account value divided by $1,000 = 8.6), then multiply the result by the number in the table under the heading entitled “Actual Expenses Paid During Period” to estimate the expenses you paid on your account during this period (as of close of business August 3, 2012 through October 31, 2012 for the Class A, Class C, Class R, Class Y and Class R5 shares and September 24, 2012 through October 31, 2012 for the Class R6 shares).
Hypothetical example for comparison purposes
The table below also provides information about hypothetical account values and hypothetical expenses based on the Fund’s actual expense ratio and an assumed rate of return of 5% per year before expenses, which is not the Fund’s actual return.
The hypothetical account values and expenses may not be used to estimate the actual ending account balance or expenses you paid for the period. You may use this information to compare the ongoing costs of investing in the Fund and other funds. To do so, compare this 5% hypothetical example with the 5% hypothetical examples that appear in the shareholder reports of the other funds.
Please note that the expenses shown in the table are meant to highlight your ongoing costs only and do not reflect any transaction costs, such as sales charges (loads) on purchase payments, contingent deferred sales charges on redemptions, and redemption fees, if any. Therefore, the hypothetical information is useful in comparing ongoing costs only, and will not help you determine the relative total costs of owning different funds. In addition, if these transaction costs were included, your costs would have been higher.
| Class | Beginning Account Value (05/01/12) | ACTUAL | HYPOTHETICAL (5% annual return before | Annualized Expense Ratio | ||||||||||||||||||||
| Ending Account Value (10/31/12)1 | Expenses Paid During Period2 | Ending Account Value (10/31/12) | Expenses Paid During Period3 | |||||||||||||||||||||
| A | $ | 1,000.00 | $ | 1,064.00 | $ | 3.43 | $ | 1,018.35 | $ | 6.85 | 1.35 | % | ||||||||||||
| C | 1,000.00 | 1,062.00 | 5.32 | 1,014.58 | 10.63 | 2.10 | ||||||||||||||||||
| R | 1,000.00 | 1,063.00 | 4.06 | 1,017.09 | 8.11 | 1.60 | ||||||||||||||||||
| Y | 1,000.00 | 1,065.00 | 2.79 | 1,019.61 | 5.58 | 1.10 | ||||||||||||||||||
| R5 | 1,000.00 | 1,065.00 | 2.79 | 1,019.61 | 5.58 | 1.10 | ||||||||||||||||||
| R6 | 1,000.00 | 988.85 | 1.14 | 1,019.61 | 5.58 | 1.10 | ||||||||||||||||||
| 1 | The actual ending account value is based on the actual total return of the Fund for the period August 3, 2012 (commencement date) through October 31, 2012 and (as of close of business September 24, 2012 (commencement date) through October 31, 2012 for the Class R6 shares), after actual expenses and will differ from the hypothetical ending account value which is based on the Fund’s expense ratio and a hypothetical annual return of 5% before expenses. |
| 2 | Actual expenses are equal to the annualized expense ratio as indicated above multiplied by the average account value over the period, multiplied by 90 (as of close of business August 3, 2012 (commencement date) through October 31, 2012)/366. For the Class R6 shares, actual expenses are equal to the annualized expense ratio as indicated above multiplied by the average account value over the period, multiplied by 38 (as of close of business September 24, 2012 (commencement date) through October 31, 2012)/366. Because Class A, Class C, Class R, Class Y, Class R5 and Class R6 shares have not been in existence for a full six month period, the actual ending account value and expense information shown may not provide a meaningful comparison to fund expense information of classes that show such data for a full six month period and, because the actual ending account value and expense information in the expense example covers a short time period, return and expense data may not be indicative of return and expense data for longer time periods. |
| 3 | Hypothetical expenses are equal to the annualized expense ratio indicated above multiplied by the average account value over the period, multiplied by 184/366 to reflect a one-half year period. The hypothetical ending account value and expenses may be used to compare ongoing costs of investing in Class A, Class C, Class R, Class Y, Class R5 and Class R6 shares of the Fund and other funds because such data is based on a full six month period. |
19 Invesco Global Opportunities Fund
Approval of Investment Advisory and Sub-Advisory Contracts
The Board of Trustees (the Board) of AIM International Mutual Funds (Invesco International Mutual Funds) (the Company) is required under the Investment Company Act of 1940 to approve the Invesco Global Opportunities Fund (the Fund) investment advisory agreements. During meetings held on June 19-20, 2012, the Board as a whole and the disinterested or “independent” Trustees, voting separately approved (i) an amendment to the Company’s investment advisory agreement with Invesco Advisers, Inc. (Invesco Advisers) to add the Fund, and (ii) (a) an amendment to the Master Intergroup Sub-Advisory Contract for Mutual Funds (the sub-advisory contracts) with Invesco Asset Management Deutschland GmbH, Invesco Asset Management Limited, Invesco Asset Management (Japan) Limited, Invesco Australia Limited, Invesco Hong Kong Limited, Invesco Senior Secured Management, Inc. and Invesco Canada Ltd. to add the Fund, and (b) an amendment to the Sub-Advisory Contract with Invesco PowerShares Capital Management LLC to add the Fund (the sub-advisers, the Affiliated Sub-Advisers and the contracts, the sub-advisory contracts). In doing so, the Board considered the process that it follows in reviewing and approving investment advisory agreements and sub-advisory contracts for the series portfolios of funds advised by Invesco Advisers (the Invesco Funds) and the information that it is provided. The Board determined that the investment advisory agreement and the sub-advisory contracts are in the best interests of the Fund and its shareholders and that the compensation to Invesco Advisers and the Affiliated Sub-Advisers under the agreements is fair and reasonable.
The Board’s Fund Evaluation Process
The Board’s Investments Committee has established three Sub-Committees, each of which is primarily responsible for overseeing the management of a number of the Invesco Funds. The Fund will be assigned to one of the Sub-Committees. The Sub-Committees meet throughout the year to review the performance of their assigned funds. Over the course of each year, the Sub-Committees meet with portfolio managers for their assigned funds and other members of management to review the performance, investment objective(s), policies, strategies, limitations and investment risk of these funds.
In evaluating the fairness and reasonableness of the Fund’s investment advisory agreement and sub-advisory contracts, the Board considered, among other things, the factors discussed below. The discussion below serves as a summary of the material factors and related conclusions that formed the basis for the Board’s approval of the Fund’s investment advisory agreement and sub-advisory contracts. The Board considered the information provided
to it and did not identify any particular factor that was controlling. One Trustee may have weighed a particular piece of information or factor differently than another Trustee.
Factors and Conclusions and Summary of Evaluation of Investment Advisory and Sub-Advisory Agreements
| A. | Nature, Extent and Quality of Services Provided by Invesco Advisers and the Affiliated Sub-Advisers |
The Board reviewed the advisory services to be provided to the Fund by Invesco Advisers under the Fund’s investment advisory agreement and the credentials and experience of the officers and employees of Invesco Advisers who provide these services. The Board’s review of the qualifications of Invesco Advisers to provide these services included the Board’s consideration of Invesco Advisers’ performance and investment process oversight, independent credit analysis and investment risk management.
In determining whether to approve the Fund’s investment advisory agreement, the Board considered the prior relationship between Invesco Advisers and the Invesco Funds, as well as the Board’s knowledge of Invesco Advisers’ operations. The Board also considered services that Invesco Advisers and its affiliates provide to the Invesco Funds such as various back office support functions, equity and fixed income trading operations, internal audit, distribution and legal and compliance. The Board concluded that the nature, extent and quality of the services to be provided to the Fund by Invesco Advisers are appropriate and satisfactory and consistent with the terms of the Fund’s investment advisory agreement.
The Board reviewed the services to be provided by the Affiliated Sub-Advisers under the sub-advisory contracts and the credentials and experience of the officers and employees of the Affiliated Sub-Advisers who provide these services. The Board noted that the Affiliated Sub-Advisers have offices and personnel that are located in financial centers around the world. As a result, the Affiliated Sub-Advisers can provide research and investment analysis on the markets and economies of various countries in which the Fund invests and make recommendations on securities of companies located in such countries. The Board concluded that the sub-advisory contracts will benefit the Fund and its shareholders by permitting Invesco Advisers to use the resources and talents of the Affiliated Sub-Advisers in managing the Fund. The Board concluded that the nature, extent and quality of the services to be provided by the Affiliated Sub-Advisers are appropriate and satisfactory and consistent with the terms of the Fund’s sub-advisory contracts.
| B. | Fund Performance |
The Board did not consider the performance of the Fund because the Fund is new and has no performance history.
| C. | Advisory and Sub-Advisory Fees and Fee Waivers |
The Board considered the contractual advisory fee rate of the Fund and the proposed fee limitations that will be in place for the Fund through July 31, 2013. The Board also considered the services to be provided by the Affiliated Sub-Advisers pursuant to the sub-advisory contracts and the services to be provided by Invesco Advisers pursuant to the Fund’s investment advisory agreement, as well as the allocation of fees between Invesco Advisers and the Affiliated Sub-Advisers pursuant to the sub-advisory contracts. The Board noted that the sub-advisory fees have no direct effect on the Fund or its shareholders, as they are paid by Invesco Advisers to the Affiliated Sub-Advisers.
The Board also considered comparative advisory fee data provided by Invesco Advisers with respect to funds managed by third-party advisers and other accounts managed by Invesco Advisers.
Based upon the information provided and considerations described above, the Board concluded that the Fund’s advisory and sub-advisory fees are fair and reasonable.
| D. | Economies of Scale and Breakpoints |
The Board considered the extent to which there are economies of scale in the provision of advisory services to the Fund. The Board also considered whether the Fund benefits from such economies of scale through contractual breakpoints in the Fund’s advisory fee schedule. The Board also noted that the Fund shares directly in economies of scale through lower fees charged by third party service providers based on the combined size of all of the Invesco Funds and other clients advised by Invesco Advisers.
| E. | Profitability and Financial Resources |
The Board reviewed information from Invesco Advisers concerning the costs of the advisory and other services that Invesco Advisers and its affiliates provide to the Invesco Funds and the profitability of Invesco Advisers and its affiliates in providing these services. The Board received and accepted information from Invesco Advisers demonstrating that Invesco Advisers and each Affiliated Sub-Adviser are financially sound and have the resources necessary to perform their obligations under the investment advisory agreement and sub-advisory contracts.
| F. | Collateral Benefits to Invesco Advisers and its Affiliates |
The Board considered various other benefits received by Invesco Advisers and its affiliates resulting from Invesco Advisers’ relationship with the Fund, including the fees received by Invesco Advisers and its affiliates for their
20 Invesco Global Opportunities Fund
provision of administrative, transfer agency and distribution services to the Fund. The Board considered the performance of Invesco Advisers and its affiliates in providing these services to other Invesco Funds and the organizational structure employed to provide these services. The Board also considered that these services will be provided to the Fund pursuant to written contracts that are reviewed and approved on an annual basis by the Board; that the services are required for the operation of the Fund; that Invesco Advisers and its affiliates can provide services, the nature and quality of which are at least equal to those provided by others offering the same or similar services; and that the fees for such services are fair and reasonable in light of the usual and customary charges by others for services of the same nature and quality.
The Board considered the benefits realized by Invesco Advisers and the Affiliated Sub-Advisers as a result of portfolio brokerage transactions executed through “soft dollar” arrangements. The Board noted that soft dollar arrangements shift the payment obligation for research and execution services from Invesco Advisers and the Affiliated Sub-Advisers to the Invesco Funds and therefore may reduce Invesco Advisers’ and the Affiliated Sub-Advisers’ expenses. The Board also considered periodic reports from the Chief Compliance Officer of the Invesco Funds demonstrating that these arrangements are consistent with regulatory requirements. The Board did not deem the soft dollar arrangements to be inappropriate.
The Board considered that the Fund’s uninvested cash and cash collateral from any securities lending arrangements may be invested in money market funds advised by Invesco Advisers pursuant to procedures approved by the Board. The Board noted that Invesco Advisers receives advisory fees from these affiliated money market funds attributable to such investments, although Invesco Advisers has contractually agreed to waive through varying periods the advisory fees payable by the Invesco Funds. The waiver is in an amount equal to 100% of the net advisory fee Invesco Advisers receives from the affiliated money market funds with respect to the Fund’s investment in the affiliated money market funds of uninvested cash, but not cash collateral. The Board concluded that the Fund’s investment of uninvested cash and cash collateral from any securities lending arrangements in the affiliated money market funds is in the best interests of the Fund and its shareholders.
The Board also considered the Fund may use an affiliated broker to execute certain trades and that such trades will be executed in compliance with rules under the Investment Company Act of 1940, as amended.
21 Invesco Global Opportunities Fund
Trustees and Officers
The address of each trustee and officer is AIM International Mutual Funds (Invesco International Mutual Funds) (the “Trust”), 11 Greenway Plaza, Suite 1000, Houston, Texas 77046-1173. The trustees serve for the life of the Trust, subject to their earlier death, incapacitation, resignation, retirement or removal as more specifically provided in the Trust’s organizational documents. Each officer serves for a one year term or until their successors are elected and qualified. Column two below includes length of time served with predecessor entities, if any.
| Name, Year of Birth and Position(s) Held with the Trust | Trustee and/ or Officer Since | Principal Occupation(s) During Past 5 Years | Number of Complex Overseen by Trustee | Other Directorship(s) Held by Trustee During Past 5 Years | ||||
| Interested Persons | ||||||||
| Martin L. Flanagan1 — 1960 Trustee | 2007 | Executive Director, Chief Executive Officer and President, Invesco Ltd. (ultimate parent of Invesco and a global investment management firm); Advisor to the Board, Invesco Advisers, Inc. (formerly known as Invesco Institutional (N.A.), Inc.); Trustee, The Invesco Funds; Vice Chair, Investment Company Institute; and Member of Executive Board, SMU Cox School of Business
Formerly: Chairman, Invesco Advisers, Inc. (registered investment adviser); Director, Chairman, Chief Executive Officer and President, IVZ Inc. (holding company), INVESCO Group Services, Inc. (service provider) and Invesco North American Holdings, Inc. (holding company); Director, Chief Executive Officer and President, Invesco Holding Company Limited (parent of Invesco and a global investment management firm); Director, Invesco Ltd.; Chairman, Investment Company Institute and President, Co-Chief Executive Officer, Co-President, Chief Operating Officer and Chief Financial Officer, Franklin Resources, Inc. (global investment management organization) | 123 | None | ||||
Philip A. Taylor2 — 1954 Trustee, President and Principal Executive Officer | 2006 | Head of North American Retail and Senior Managing Director, Invesco Ltd.; Director, Co-Chairman, Co-President and Co-Chief Executive Officer, Invesco Advisers, Inc. (formerly known as Invesco Institutional (N.A.), Inc.) (registered investment adviser); Director, Chairman, Chief Executive Officer and President, Invesco Management Group, Inc. (formerly known as Invesco Aim Management Group, Inc.) (financial services holding company); Director and President, INVESCO Funds Group, Inc. (registered investment adviser and registered transfer agent); Director and Chairman, Invesco Investment Services, Inc. (formerly known as Invesco Aim Investment Services, Inc.) (registered transfer agent) and IVZ Distributors, Inc. (formerly known as INVESCO Distributors, Inc.) (registered broker dealer); Director, President and Chairman, Invesco Inc. (holding company) and Invesco Canada Holdings Inc. (holding company); Chief Executive Officer, Invesco Corporate Class Inc. (corporate mutual fund company) and Invesco Canada Fund Inc. (corporate mutual fund company); Director, Chairman and Chief Executive Officer, Invesco Canada Ltd. (formerly known as Invesco Trimark Ltd./Invesco Trimark Ltèe) (registered investment adviser and registered transfer agent); Trustee, President and Principal Executive Officer, The Invesco Funds (other than AIM Treasurer’s Series Trust (Invesco Treasurer’s Series Trust) and Short-Term Investments Trust); Trustee and Executive Vice President, The Invesco Funds (AIM Treasurer’s Series Trust (Invesco Treasurer’s Series Trust) and Short-Term Investments Trust only); Director, Invesco Investment Advisers LLC (formerly known as Van Kampen Asset Management); Director, Chief Executive Officer and President, Van Kampen Exchange Corp.
Formerly: Director and Chairman, Van Kampen Investor Services Inc.; Director, Chief Executive Officer and President, 1371 Preferred Inc. (holding company); and Van Kampen Investments Inc.; Director and President, AIM GP Canada Inc. (general partner for limited partnerships); and Van Kampen Advisors, Inc.; Director and Chief Executive Officer, Invesco Trimark Dealer Inc. (registered broker dealer); Director, Invesco Distributors, Inc. (formerly known as Invesco Aim Distributors, Inc.) (registered broker dealer); Manager, Invesco PowerShares Capital Management LLC; Director, Chief Executive Officer and President, Invesco Advisers, Inc.; Director, Chairman, Chief Executive Officer and President, Invesco Aim Capital Management, Inc.; President, Invesco Trimark Dealer Inc. and Invesco Trimark Ltd./Invesco Trimark Ltèe; Director and President, AIM Trimark Corporate Class Inc. and AIM Trimark Canada Fund Inc.; Senior Managing Director, Invesco Holding Company Limited; Trustee and Executive Vice President, Tax-Free Investments Trust; Director and Chairman, Fund Management Company (former registered broker dealer); President and Principal Executive Officer, The Invesco Funds (AIM Treasurer’s Series Trust (Invesco Treasurer’s Series Trust), Short-Term Investments Trust and Tax-Free Investments Trust only); President, AIM Trimark Global Fund Inc. and AIM Trimark Canada Fund Inc. | 123 | None | ||||
Wayne W. Whalen3 — 1939 Trustee | 2010 | Of Counsel, and prior to 2010, partner in the law firm of Skadden, Arps, Slate, Meagher & Flom LLP, legal counsel to certain funds in the Fund Complex
| 136 | Director of the Mutual Fund Directors Forum, a nonprofit membership organization for investment directors; Chairman and Director of the Abraham Lincoln Presidential Library Foundation; and Director of the Stevenson Center for Democracy |
| 1 | Mr. Flanagan is considered an interested person of the Trust because he is an officer of the adviser to the Trust, and an officer and a director of Invesco Ltd., ultimate parent of the adviser to the Trust. |
| 2 | Mr. Taylor is considered an interested person of the Trust because he is an officer and a director of the adviser to, and a director of the principal underwriter of, the Trust. |
| 3 | Mr. Whalen is considered an “interested person” (within the meaning of Section 2(a)(19) of the 1940 Act) of certain Funds in the Invesco Fund Complex by reason of he and his firm currently providing legal services as legal counsel to such Funds in the Invesco Fund Complex. |
T-1 Invesco Global Opportunities Fund
Trustees and Officers—(continued)
| Name, Year of Birth and Position(s) Held with the Trust | Trustee and/ or Officer Since | Principal Occupation(s) During Past 5 Years | Number of Funds in Fund Complex Overseen by Trustee | Other Directorship(s) Held by Trustee During Past 5 Years | ||||
| Independent Trustees | ||||||||
Bruce L. Crockett — 1944 Trustee and Chair | 1992 | Chairman, Crockett Technologies Associates (technology consulting company)
Formerly: Director, Captaris (unified messaging provider); Director, President and Chief Executive Officer COMSAT Corporation; and Chairman, Board of Governors of INTELSAT (international communications company) | 123 | ACE Limited (insurance company); and Investment Company Institute | ||||
David C. Arch — 1945 Trustee | 2010 | Retired.
Formerly: Chairman and Chief Executive Officer of Blistex Inc., (consumer health care products manufacturer) | 136 | Member of the Heartland Alliance Advisory Board, a nonprofit organization serving human needs based in Chicago. Board member of the Illinois Manufacturers’ Association. Member of the Board of Visitors, Institute for the Humanities, University of Michigan | ||||
Frank S. Bayley — 1939 Trustee | 2001 | Retired
Formerly: Director, Badgley Funds, Inc. (registered investment company) (2 portfolios) and Partner, law firm of Baker & McKenzie | 123 | Director and Chairman, C.D. Stimson Company (a real estate investment company) | ||||
James T. Bunch — 1942 Trustee | 2003 | Managing Member, Grumman Hill Group LLC (family office private equity management)
Formerly: Founder, Green, Manning & Bunch Ltd. (investment banking firm)(1988-2010); Executive Committee, United States Golf Association; and Director, Policy Studies, Inc. and Van Gilder Insurance Corporation | 123 | Chairman, Board of Governors, Western Golf Association, Chairman-elect, Evans Scholars Foundation and Director, Denver Film Society | ||||
Rodney F. Dammeyer — 1940 Trustee | 2010 | Chairman of CAC, LLC, (private company offering capital investment and management advisory services)
Formerly: Prior to January 2004, Director of TeleTech Holdings Inc.; Prior to 2002, Director of Arris Group, Inc.; Prior to 2001, Managing Partner at Equity Group Corporate Investments. Prior to 1995, Vice Chairman of Anixter International. Prior to 1985, experience includes Senior Vice President and Chief Financial Officer of Household International, Inc., Executive Vice President and Chief Financial Officer of Northwest Industries, Inc. and Partner of Arthur Andersen & Co. | 136 | Director of Quidel Corporation and Stericycle, Inc. Prior to May 2008, Trustee of The Scripps Research Institute. Prior to February 2008, Director of Ventana Medical Systems, Inc. Prior to April 2007, Director of GATX Corporation. Prior to April 2004, Director of TheraSense, Inc. | ||||
Albert R. Dowden — 1941 Trustee | 2000 | Director of a number of public and private business corporations, including the Boss Group, Ltd. (private investment and management); Reich & Tang Funds (5 portfolios) (registered investment company); and Homeowners of America Holding Corporation/ Homeowners of America Insurance Company (property casualty company)
Formerly: Director, Continental Energy Services, LLC (oil and gas pipeline service); Director, CompuDyne Corporation (provider of product and services to the public security market) and Director, Annuity and Life Re (Holdings), Ltd. (reinsurance company); Director, President and Chief Executive Officer, Volvo Group North America, Inc.; Senior Vice President, AB Volvo; Director of various public and private corporations; Chairman, DHJ Media, Inc.; Director Magellan Insurance Company; and Director, The Hertz Corporation, Genmar Corporation (boat manufacturer), National Media Corporation; Advisory Board of Rotary Power International (designer, manufacturer, and seller of rotary power engines); and Chairman, Cortland Trust, Inc. (registered investment company) | 123 | Director of Nature’s Sunshine Products, Inc. | ||||
Jack M. Fields — 1952 Trustee | 1997 | Chief Executive Officer, Twenty First Century Group, Inc. (government affairs company); and Owner and Chief Executive Officer, Dos Angelos Ranch, L.P. (cattle, hunting, corporate entertainment), Discovery Global Education Fund (non-profit) and Cross Timbers Quail Research Ranch (non-profit)
Formerly: Chief Executive Officer, Texana Timber LP (sustainable forestry company) and member of the U.S. House of Representatives | 123 | Insperity (formerly known as Administaff) | ||||
Carl Frischling — 1937 Trustee | 1991 | Partner, law firm of Kramer Levin Naftalis and Frankel LLP | 123 | Director, Reich & Tang Funds (6 portfolios) | ||||
Prema Mathai-Davis — 1950 Trustee | 1998 | Retired
Formerly: Chief Executive Officer, YWCA of the U.S.A. | 123 | None | ||||
Larry Soll — 1942 Trustee | 2003 | Retired
Formerly: Chairman, Chief Executive Officer and President, Synergen Corp. (a biotechnology company) | 123 | None |
T-2 Invesco Global Opportunities Fund
Trustees and Officers—(continued)
| Name, Year of Birth and Position(s) Held with the Trust | Trustee and/ or Officer Since | Principal Occupation(s) During Past 5 Years | Number of Funds in Fund Complex Overseen by Trustee | Other Directorship(s) Held by Trustee During Past 5 Years | ||||
| Independent Trustees—(continued) | ||||||||
Hugo F. Sonnenschein — 1940 Trustee | 2010 | Distinguished Service Professor and President Emeritus of the University of Chicago and the Adam Smith Distinguished Service Professor in the Department of Economics at the University of Chicago.
Formerly: President of the University of Chicago | 136 | Trustee of the University of Rochester and a member of its investment committee. Member of the National Academy of Sciences, the American Philosophical Society and a fellow of the American Academy of Arts and Sciences | ||||
Raymond Stickel, Jr. — 1944 Trustee | 2005 | Retired
Formerly: Director, Mainstay VP Series Funds, Inc. (25 portfolios) and Partner, Deloitte & Touche | 123 | None | ||||
| Other Officers | ||||||||
Russell C. Burk — 1958 Senior Vice President and Senior Officer | 2005 | Senior Vice President and Senior Officer, The Invesco Funds | N/A | N/A | ||||
John M. Zerr — 1962 Senior Vice President, Chief Legal Officer and Secretary | 2006 | Director, Senior Vice President, Secretary and General Counsel, Invesco Management Group, Inc. (formerly known as Invesco Aim Management Group, Inc.) and Van Kampen Exchange Corp.; Senior Vice President, Invesco Advisers, Inc. (formerly known as Invesco Institutional (N.A.), Inc.) (registered investment adviser); Senior Vice President and Secretary, Invesco Distributors, Inc. (formerly known as Invesco Aim Distributors, Inc.); Director, Vice President and Secretary, Invesco Investment Services, Inc. (formerly known as Invesco Aim Investment Services, Inc.) and IVZ Distributors, Inc. (formerly known as INVESCO Distributors, Inc.); Director and Vice President, INVESCO Funds Group, Inc.; Senior Vice President, Chief Legal Officer and Secretary, The Invesco Funds; Manager, Invesco PowerShares Capital Management LLC; Director, Secretary and General Counsel, Invesco Investment Advisers LLC (formerly known as Van Kampen Asset Management); Secretary and General Counsel, Invesco Capital Markets, Inc. (formerly known as Van Kampen Funds Inc.) and Chief Legal Officer, PowerShares Exchange-Traded Fund Trust, PowerShares Exchange-Traded Fund Trust II, PowerShares India Exchange-Traded Fund Trust and PowerShares Actively Managed Exchange-Traded Fund Trust
Formerly: Director and Secretary, Van Kampen Advisors Inc.; Director Vice President, Secretary and General Counsel Van Kampen Investor Services Inc.; Director, Invesco Distributors, Inc. (formerly known as Invesco Aim Distributors, Inc.); Director, Senior Vice President, General Counsel and Secretary, Invesco Advisers, Inc.; and Van Kampen Investments Inc.; Director, Vice President and Secretary, Fund Management Company; Director, Senior Vice President, Secretary, General Counsel and Vice President, Invesco Aim Capital Management, Inc.; Chief Operating Officer and General Counsel, Liberty Ridge Capital, Inc. (an investment adviser); Vice President and Secretary, PBHG Funds (an investment company) and PBHG Insurance Series Fund (an investment company); Chief Operating Officer, General Counsel and Secretary, Old Mutual Investment Partners (a broker-dealer); General Counsel and Secretary, Old Mutual Fund Services (an administrator) and Old Mutual Shareholder Services (a shareholder servicing center); Executive Vice President, General Counsel and Secretary, Old Mutual Capital, Inc. (an investment adviser); and Vice President and Secretary, Old Mutual Advisors Funds (an investment company) | N/A | N/A | ||||
Lisa O. Brinkley — 1959 Vice President | 2004 | Global Assurance Officer, Invesco Ltd. and Vice President, The Invesco Funds
Formerly: Chief Compliance Officer, Invesco Distributors, Inc. (formerly known as Invesco Aim Distributors, Inc.), Invesco Investment Services, Inc.(formerly known as Invesco Aim Investment Services, Inc.) and Van Kampen Investor Services Inc.; Senior Vice President, Invesco Management Group, Inc.; Senior Vice President and Chief Compliance Officer, Invesco Advisers, Inc. and The Invesco Funds; Vice President and Chief Compliance Officer, Invesco Aim Capital Management, Inc. and Invesco Distributors, Inc.; Vice President, Invesco Investment Services, Inc. and Fund Management Company | N/A | N/A | ||||
T-3 Invesco Global Opportunities Fund
Trustees and Officers—(continued)
| Name, Year of Birth and Position(s) Held with the Trust | Trustee and/ or Officer Since | Principal Occupation(s) During Past 5 Years | Number of Funds in Fund Complex Overseen by Trustee | Other Directorship(s) Held by Trustee During Past 5 Years | ||||
| Other Officers—(continued) | ||||||||
Karen Dunn Kelley — 1960 Vice President | 2004 | Head of Invesco’s World Wide Fixed Income and Cash Management Group; Senior Vice President, Invesco Management Group, Inc. (formerly known as Invesco Aim Management Group, Inc.) and Invesco Advisers, Inc. (formerly known as Invesco Institutional (N.A.), Inc.) (registered investment adviser); Executive Vice President, Invesco Distributors, Inc. (formerly known as Invesco Aim Distributors, Inc.); Director, Invesco Mortgage Capital Inc., INVESCO Global Asset Management Limited, Invesco Management Company Limited and INVESCO Management S.A.; Vice President, The Invesco Funds (other than AIM Treasurer’s Series Trust (Invesco Treasurer’s Series Trust) and Short-Term Investments Trust); and President and Principal Executive Officer, The Invesco Funds (AIM Treasurer’s Series Trust (Invesco Treasurer’s Series Trust) and Short-Term Investments Trust only)
Formerly: Senior Vice President, Van Kampen Investments Inc.; Vice President, Invesco Advisers, Inc. (formerly known as Invesco Institutional (N.A.), Inc.); Director of Cash Management and Senior Vice President, Invesco Advisers, Inc. and Invesco Aim Capital Management, Inc.; President and Principal Executive Officer, Tax-Free Investments Trust; Director and President, Fund Management Company; Chief Cash Management Officer, Director of Cash Management, Senior Vice President, and Managing Director, Invesco Aim Capital Management, Inc.; Director of Cash Management, Senior Vice President, and Vice President, Invesco Advisers, Inc. and The Invesco Funds (AIM Treasurer’s Series Trust (Invesco Treasurer’s Series Trust), Short-Term Investments Trust and Tax-Free Investments Trust only) | N/A | N/A | ||||
Sheri Morris — 1964 Vice President, Treasurer and Principal Financial Officer | 1999 | Vice President, Treasurer and Principal Financial Officer, The Invesco Funds; Vice President, Invesco Advisers, Inc. (formerly known as Invesco Institutional (N.A.), Inc.) (registered investment adviser); and Treasurer, PowerShares Exchange-Traded Fund Trust, PowerShares Exchange-Traded Fund Trust II, PowerShares India Exchange-Traded Fund Trust and PowerShares Actively Managed Exchange-Traded Fund Trust
Formerly: Vice President, Invesco Advisers, Inc., Invesco Aim Capital Management, Inc. and Invesco Aim Private Asset Management, Inc.; Assistant Vice President and Assistant Treasurer, The Invesco Funds and Assistant Vice President, Invesco Advisers, Inc., Invesco Aim Capital Management, Inc. and Invesco Aim Private Asset Management, Inc. | N/A | N/A | ||||
Yinka Akinsola — 1977 Anti-Money Laundering Compliance Officer | 2011 | Anti-Money Laundering Compliance Officer, Invesco Advisers, Inc. (formerly known as Invesco Institutional (N.A.), Inc.) (registered investment adviser); Invesco Distributors, Inc. (formerly known as Invesco Aim Distributors, Inc.), Invesco Investment Services, Inc. (formerly known as Invesco Aim Investment Services, Inc.), Invesco Management Group, Inc., The Invesco Funds, Invesco Van Kampen Closed-End Funds, Van Kampen Exchange Corp., Invesco Capital Markets, Inc. (formerly known as Van Kampen Funds Inc.), PowerShares Exchange-Traded Fund Trust, PowerShares Exchange-Traded Fund Trust II, PowerShares India Exchange-Traded Fund Trust, and PowerShares Actively Managed Exchange-Traded Fund Trust
Formerly: Regulatory Analyst III, Financial Industry Regulatory Authority (FINRA). | N/A | N/A | ||||
Todd L. Spillane — 1958 Chief Compliance Officer | 2006 | Senior Vice President, Invesco Management Group, Inc. (formerly known as Invesco Aim Management Group, Inc.) and Van Kampen Exchange Corp.; Senior Vice President and Chief Compliance Officer, Invesco Advisers, Inc. (registered investment adviser) (formerly known as Invesco Institutional (N.A.), Inc.); Chief Compliance Officer, The Invesco Funds; Vice President, Invesco Distributors, Inc. (formerly known as Invesco Aim Distributors, Inc.) and Invesco Investment Services, Inc. (formerly known as Invesco Aim Investment Services, Inc.)
Formerly: Chief Compliance Officer, Invesco Van Kampen Closed-End Funds; Senior Vice President, Van Kampen Investments Inc.; Senior Vice President and Chief Compliance Officer, Invesco Advisers, Inc. and Invesco Aim Capital Management, Inc.; Chief Compliance Officer, INVESCO Private Capital Investments, Inc. (holding company), Invesco Private Capital, Inc. (registered investment adviser), Invesco Global Asset Management (N.A.), Inc., Invesco Senior Secured Management, Inc. (registered investment adviser) and Van Kampen Investor Services Inc., PowerShares Exchange-Traded Fund Trust, PowerShares Exchange-Traded Fund Trust II, PowerShares India Exchange-Traded Fund Trust and PowerShares Actively Managed Exchange-Traded Fund Trust; Vice President, Invesco Aim Capital Management, Inc. and Fund Management Company | N/A | N/A | ||||
The Statement of Additional Information of the Trust includes additional information about the Fund’s Trustees and is available upon request, without charge, by calling 1.800.959.4246. Please refer to the Fund’s prospectus for information on the Fund’s sub-advisers.
Office of the Fund 11 Greenway Plaza, Suite 1000 Houston, TX 77046-1173 | Investment Adviser Invesco Advisers, Inc. 1555 Peachtree Street, N.E. Atlanta, GA 30309 | Distributor Invesco Distributors, Inc. 11 Greenway Plaza, Suite 1000 Houston, TX 77046-1173 | Auditors PricewaterhouseCoopers LLP 1201 Louisiana Street, Suite 2900 Houston, TX 77002-5678 | |||
Counsel to the Fund Stradley Ronon Stevens & Young, LLP 2005 Market Street, Suite 2600 Philadelphia, PA 19103-7018 | Counsel to the Independent Trustees Kramer Levin Naftalis & Frankel LLP 1177 Avenue of the Americas New York, NY 10036-2714 | Transfer Agent Invesco Investment Services, Inc. 11 Greenway Plaza, Suite 1000 Houston, TX 77046-1173 | Custodian State Street Bank and Trust Company 225 Franklin Street Boston, MA 02110-2801 | |||
T-4 Invesco Global Opportunities Fund

Invesco mailing information
Send general correspondence to Invesco Investment Services, Inc., P.O. Box 219078, Kansas City, MO 64121-9078.
Invesco privacy policy
You share personal and financial information with us that is necessary for your transactions and your account records. We take very seriously the obligation to keep that information confidential and private.
Invesco collects nonpublic personal information about you from account applications or other forms you complete and from your transactions with us or our affiliates. We do not disclose information about you or our former customers to service providers or other third parties except to the extent necessary to service your account and in other limited circumstances as permitted by law. For example, we use this information to facilitate the delivery of transaction confirmations, financial reports, prospectuses and tax forms.
Even within Invesco, only people involved in the servicing of your accounts and compliance monitoring have access to your information. To ensure the highest level of confidentiality and security, Invesco maintains physical, electronic and procedural safeguards that meet or exceed federal standards. Special measures, such as data encryption and authentication, apply to your communications with us on our website. More detail is available to you at invesco.com/privacy.
Important notice regarding delivery of security holder documents
To reduce Fund expenses, only one copy of most shareholder documents may be mailed to shareholders with multiple accounts at the same address (Householding). Mailing of your shareholder documents may be householded indefinitely unless you instruct us otherwise. If you do not want the mailing of these documents to be combined with those for other members of your household, please contact Invesco Investment Services, Inc. at 800 959 4246 or contact your financial institution. We will begin sending you individual copies for each account within 30 days after receiving your request.
Fund holdings and proxy voting information
The Fund provides a complete list of its holdings four times in each fiscal year, at the quarter-ends. For the second and fourth quarters, the lists appear in the Fund’s semiannual and annual reports to shareholders. For the first and third quarters, the Fund files the lists with the Securities and Exchange Commission (SEC) on Form N-Q. The most recent list of portfolio holdings is available at invesco.com/completeqtrholdings. Shareholders can also look up the Fund’s Forms N-Q on the SEC website at sec.gov. Copies of the Fund’s Forms N-Q may be reviewed and copied at the SEC Public Reference Room in Washington, D.C. You can obtain information on the operation of the Public Reference Room, including information about duplicating fee charges, by calling 202 551 8090 or 800 732 0330, or by electronic request at the following email address: publicinfo@sec.gov. The SEC file numbers for the Fund are shown below.
A description of the policies and procedures that the Fund uses to determine how to vote proxies relating to portfolio securities is available without charge, upon request, from our Client Services department at 800 959 4246 or at invesco.com/proxyguidelines. The information is also available on the SEC website, sec.gov.
Information regarding how the Fund voted proxies related to its portfolio securities during the 12 months ended June 30, 2012, is available at invesco.com/proxysearch. The information is also available on the SEC website, sec.gov. Invesco Advisers, Inc. is an investment adviser; it provides investment advisory services to individual and institutional clients and does not sell securities. Invesco Distributors, Inc. is the US distributor for Invesco Ltd.’s retail mutual funds, exchange-traded funds and institutional money market funds. Both are wholly owned, indirect subsidiaries of Invesco Ltd. |  |
| SEC file numbers: 811-06463 and 033-44611 | GLOPP-AR-1 | Invesco Distributors, Inc. |

Letters to Shareholders
Philip Taylor | Dear Shareholders: This report contains information about your Fund, including a discussion from your portfolio managers about how they managed your Fund – and why it performed as it did – during the reporting period. This report also includes your Fund’s long-term performance and a complete list of your Fund’s investments as of the close of the reporting period. I hope you find this information helpful. For much of the reporting period, investors’ attention was focused on Europe, where eurozone governments struggled to reduce debt levels, strengthen their banks and stimulate their economies. European leaders disagreed whether the wiser path to restoring the Continent’s economic well-being was more stimulus or greater austerity. In the US, economic data were mixed. Economic growth, while positive, was relatively modest. Corporate earnings, which grew strongly in recent years, showed signs of slowing. And job | |
| creation was less robust than hoped. Later in this report, your Fund’s portfolio managers discuss how economic conditions and market trends affected your Fund’s performance. | ||

Economic conditions are always subject to sudden and unexpected change. That’s why you may find it helpful to work with a trusted, experienced financial adviser who understands your unique financial goals, needs and risk tolerances. Financial advisers can provide valuable insight and information, particularly when markets are uncertain, and they can recommend investments appropriate for specific investment goals, such as a child’s college education or your retirement. On a regular basis, a financial adviser also can determine whether your existing investments are still appropriate, given your changing needs, goals and circumstances.
Timely insight and information from many of Invesco’s investment professionals is available at our website, invesco.com/us. We offer in-depth articles, video clips and audio commentaries from many of our portfolio managers and other investment professionals on a wide range of topics of interest to investors: recent economic and market developments; retirement planning; legislative updates from Washington, DC; and general investor education. At invesco.com/us, you also can access information about your Invesco account at any time.
What we mean by Intentional Investing
Intentional InvestingSM is the science and art of investing with purpose, prudence and diligence – and it’s how Invesco’s investment professionals manage your money every day.
This highly disciplined process begins when specialized teams of investment professionals clearly define an investment objective and then establish specific investment strategies to try to achieve that objective. While our investment teams closely monitor economic and market conditions – and issues specific to individual holdings that could affect their value – they maintain a long-term investment perspective. Intentional Investing is also:
| n | How we manage and mitigate risk – by embedding risk controls and processes into every aspect of our business; |
| n | How we create products – by offering a diverse combination of investment strategies and vehicles designed to meet your needs; and |
| n | How we connect with you, our investors – by communicating clearly, by delivering expert insights from our portfolio managers and other investment professionals, and by providing a website full of tools and articles to help you stay informed. |
As a company, Invesco believes in putting investors first, and that’s why investment management is all we do. Our sole focus on managing your money allows your financial adviser to build a truly diversified investment portfolio of Invesco funds, whatever your investment needs and goals may be – and allows him or her to find appropriate Invesco funds when your circumstances change. Of course, neither Intentional Investing nor diversification can guarantee a profit or protect against loss.
Have a question?
If you have questions about your account, please contact an Invesco client services representative at 800 959 4246. If you have an Invesco-related question or comment, feel free to email me directly at phil@invesco.com.
All of us at Invesco look forward to serving your investment management needs for many years to come. Thank you for investing with us.
Sincerely,

Philip Taylor
Senior Managing Director, Invesco Ltd.
2 Invesco Global Small & Mid Cap Growth Fund
Bruce Crockett | Dear Fellow Shareholders: One of our most important responsibilities as independent Trustees of the Invesco Funds is our annual review of the funds’ advisory and sub-advisory contracts with Invesco. This annual review is required by the Investment Company Act of 1940 and focuses on the nature and quality of the services Invesco has provided as adviser to the Invesco Funds and the reasonableness of the fees that it charges for those services. In our roles as Trustees, we spend months reviewing thousands of pages of detailed information that we request from Invesco in connection with our annual review. We focus on the quality and costs of the services to be provided by Invesco and its affiliates. Some of the most important things we look at are fund performance, expenses and fees. All of the Trustees have substantial personal investments in the Invesco Funds complex. We’re fund shareholders just like you. |

We also use information from many independent sources during the review process, including materials provided by the independent Senior Officer of the Invesco Funds, who reports directly to the independent Trustees. We also meet in private sessions with independent legal counsel and review performance and fee data on the Invesco Funds prepared by Lipper Inc., an independent, third-party firm widely recognized as a leader in its field.
I’m pleased to report that the Invesco Funds Board determined in June that renewing the investment advisory agreement and the sub-advisory contracts with Invesco would serve the best interests of each fund and its shareholders. For more detailed information about our assessment and conclusions with respect to each of the Invesco Funds, visit invesco.com/us, click on the “About Us” section and go to “Legal Information.” Information on the recent investment advisory renewal process can be found by clicking the last item under “Corporate Governance.”
In much the same way we review your fund’s advisory contract each year, it’s a good idea for you to review your own investment plan with your financial adviser on a regular basis. Perhaps you need to reassess your original asset allocation because different investments may grow at varying paces, or perhaps you’re going through a significant life change. Regardless of your situation, a financial adviser can provide guidance and experience to help you reach your financial goals.
As always, please contact me at bruce@brucecrockett.com with any questions or concerns you may have. On behalf of the Board, we look forward to continuing to represent your interests and serving your needs.
Sincerely,

Bruce L. Crockett
Independent Chair
Invesco Funds Board of Trustees
3 Invesco Global Small & Mid Cap Growth Fund
Management’s Discussion of Fund Performance
Performance summary
Invesco Global Small & Mid Cap Growth Fund, at net asset value (NAV), delivered positive returns for the fiscal year ended October 31, 2012. Despite this, the Fund trailed its style-specific benchmark, the MSCI World Growth Index. The Fund’s modest cash position and significant underweight exposure to the US were the key detractors from performance for the fiscal year.
Your Fund’s long-term performance appears later in this report.
Fund vs. Indexes
Total returns, 10/31/11 to 10/31/12, at net asset value (NAV). Performance shown does not include applicable contingent deferred sales charges (CDSC) or front-end sales charges, which would have reduced performance.
Class A Shares | 7.94 | % | ||
Class B Shares | 7.12 | |||
Class C Shares | 7.11 | |||
Class Y Shares | 8.18 | |||
Class R5 Shares* | 8.46 | |||
MSCI World Indexq (Broad Market Index) | 9.45 | |||
MSCI World Growth Indexn (Style-Specific Index) | 9.01 | |||
Lipper Global Small/Mid-Cap Funds Classification Averagen (Peer Group) | 7.30 |
Source(s): qInvesco, MSCI via FactSet Research Systems Inc.; nLipper Inc.
*Effective September 24, 2012, Institutional Class shares were renamed Class R5 shares.
How we invest
When selecting stocks for your Fund, we use a disciplined investment strategy that emphasizes fundamental research, supported by both quantitative analysis and portfolio construction techniques. Our EQV (earnings, quality, valuation) strategy focuses primarily on identifying quality companies that have experienced, or exhibit the potential for, accelerated or above-average earnings growth, but whose stock prices do not fully reflect these attributes.
While research responsibilities within the portfolio management team are focused by region, we select investments for the Fund using a bottom-up investment approach, which means we construct the Fund primarily on a stock-by-stock basis. We focus on the strengths of individual companies rather than sectors, countries or market-cap trends.
We believe disciplined sell decisions are key to successful investing. We consider selling a stock for one of the following reasons:
| n | A company’s fundamentals deteriorate, or it posts disappointing earnings. |
| n | A stock appears overvalued. |
| n | A more attractive investment opportunity becomes available. |
Market conditions and your Fund
During the reporting period, global equity markets remained volatile. At the beginning of the reporting period, macro events – ranging from continuing political instability in the Middle East, lingering economic effects of the earthquake and tsunami in Japan, the ongoing eurozone sovereign debt crisis, aftereffects of Standard & Poor’s August 2011 first-ever downgrade of US debt, a slowing Chinese property market and generally higher inflation across the developing world –
weighed on global economic growth and equity markets. While the markets rebounded modestly in December, macroeconomic concerns continued, stemming largely from the unstable economic conditions of Greece and Spain.
Toward the end of the reporting period, global central banks announced a series of stimulative policies. The European Central Bank (ECB) announced new measures to support eurozone economies through potentially unlimited purchases of sovereign debt, with ECB President Mario Draghi pledging to “do whatever it takes” to save the euro (although key details of the plan remain unresolved). The US Federal Reserve announced a third round of quantitative easing by promising to remain accommodative until the labor market outlook improves materially. Also, the Bank of Japan took steps to increase its asset purchase program. These easing measures were well received by investors and helped drive international equity markets higher in the final months of the reporting period, despite signs of a continued slowdown in global economic growth.
In this environment, we continued to construct the Fund’s portfolio with a long-term view and a bottom-up approach (i.e., selecting stocks on an individual basis). From a sector perspective, favorable stock selection in the financials sector was the largest contributor to both relative and absolute results. Fund holdings in the diversified financial services industry were particularly strong. Philip-pines-based Ayala, a holding company with interests in real estate development, financial services and insurance, was the Fund’s top contributor.
The materials sector was the second-leading contributor to the Fund’s outperformance for the reporting period. An underweight position and strong stock
Portfolio Composition
By sector
Financials | 19.9 | % | ||
Consumer Discretionary | 18.6 | |||
Industrials | 14.4 | |||
Information Technology | 14.1 | |||
Energy | 8.8 | |||
Materials | 7.0 | |||
Health Care | 4.7 | |||
Consumer Staples | 3.2 | |||
Utilities | 2.7 | |||
Telecommunication Services | 1.0 | |||
Money Market Funds | ||||
Plus Other Assets Less Liabilities | 5.6 |
Top 10 Equity Holdings*
1. Ayala Corp. | 3.6 | % | ||
2. Naspers Ltd.-Class N | 2.6 | |||
3. Onex Corp. | 2.2 | |||
4. Siam Commercial Bank PCL | 2.2 | |||
5. IG Group Holdings PLC | 2.1 | |||
6. Aryzta AG | 2.0 | |||
7. Informa PLC | 2.0 | |||
8. DCC PLC | 1.9 | |||
9. Duratex S.A. | 1.9 | |||
10. Paramount Resources Ltd.-Class A | | 1.8 | |
Total Net Assets | $ | 549.9 million | ||
Total Number of Holdings* | 101 | |||
The Fund’s holdings are subject to change, and there is no assurance that the Fund will continue to hold any particular security.
* Excluding money market fund holdings.
4 Invesco Global Small & Mid Cap Growth Fund
selection, most notably in the paper and forest products industry, were the key drivers to relative results in the sector. One Fund holding that the style-specific benchmark did not own, Duratex, a Brazilian wood furniture manufacturer, was a top contributor for the reporting period. In the utilities sector, Fund holdings in the gas utilities industry produced double-digit returns.
As mentioned earlier, however, the Fund underperformed the MSCI World Growth Index for the reporting period. Underperformance was driven predominately by Fund holdings in the consumer staples, industrials and health care sectors. Holdings in the UK industrials sector, particularly HomeServe, a company that offers emergency home repairs, detracted from relative results. Japanese automotive parts manufacturer EXEDY was among the Fund’s most significant detractors for the fiscal year. A modest cash position also detracted from relative performance.
Our exposure to the US was the largest single detractor from relative results. Although the Fund’s US holdings delivered positive returns, a significant underweight position versus our style-specific index negatively affected results. Japan was another of the largest country-level detractors from the Fund’s absolute performance.
During the reporting period, developed markets outperformed emerging markets. However, the Fund’s emerging market bias contributed to the Fund’s relative performance as the MSCI World Growth Index did not have exposure to this segment of the market. Emerging market holdings in Indonesia, the Philippines and Thailand were the Fund’s largest contributors to absolute performance. The Fund’s bias toward small- and mid-cap stocks, holdings that did not perform as well as large-cap stocks due to many investors chasing dividends, detracted from relative results.
With market volatility likely to continue for some time, our focus remains on ensuring that our portfolio is comprised of high-quality, reasonably valued companies capable of sustained earnings growth. We believe that this balanced EQV-focused approach may help deliver attractive returns over the long term.
We thank you for your continued investment in Invesco Global Small & Mid Cap Growth Fund.
The views and opinions expressed in management’s discussion of Fund performance are those of Invesco Advisers, Inc. These views and opinions are subject to change at any time based on factors such as market and economic conditions. These views and opinions may not be relied upon as investment advice or recommendations, or as an offer for a particular security. The information is not a complete analysis of every aspect of any market, country, industry, security or the Fund. Statements of fact are from sources considered reliable, but Invesco Advisers, Inc. makes no representation or warranty as to their completeness or accuracy. Although historical performance is no guarantee of future results, these insights may help you understand our investment management philosophy.
See important Fund and, if applicable, index disclosures later in this report.
 | Steve Cao Chartered Financial Analyst, portfolio manager, is lead manager of Invesco Global Small & Mid | |
| Cap Growth Fund with respect to the Fund’s investments in the Asia Pacific region and Latin America. He joined Invesco in 1997. Mr. Cao earned a BA in English from the Tianjin Foreign Language Institute and an MBA from Texas A&M University. He is also a Certified Public Accountant. | ||
 | Jason Holzer Chartered Financial Analyst, portfolio manager, is lead manager of Invesco Global Small & Mid | |
| Cap Growth Fund with respect to the Fund’s investments in Europe and Canada. He joined Invesco in 1996. Mr. Holzer earned a BA in quantitative economics and an MS in engineering economic systems from Stanford University. | ||
 | James Leach Chartered Financial Analyst, portfolio manager, is lead manager of Invesco Global Small & Mid | |
| Cap Growth Fund with respect to the Fund’s investments in the US. He joined Invesco in 2011. Mr. Leach earned a BS in mechanical engineering from the University of California and an MBA from New York University Stern School of Business. | ||
 | Borge Endresen Chartered Financial Analyst, portfolio manager, is manager of Invesco Global Small & Mid Cap | |
| Growth Fund. He joined Invesco in 1999. Mr. Endresen earned a BS in finance from the University of Oregon and an MBA from The University of Texas at Austin. | ||
5 Invesco Global Small & Mid Cap Growth Fund
Your Fund’s Long-Term Performance
Results of a $10,000 Investment – Oldest Share Class(es)
Fund and index data from 10/31/02*
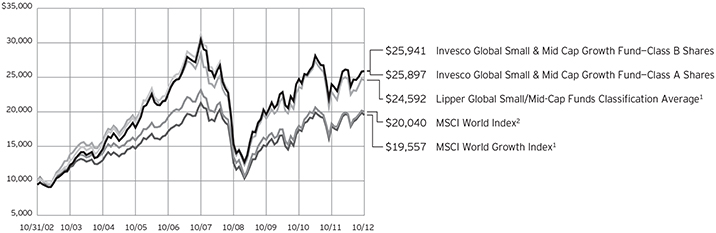
1 Source: Lipper Inc.
2 Source(s): Invesco, MSCI via FactSet Research Systems Inc.
| * | During the reporting period, Invesco changed its policy regarding growth of $10,000 charts. For funds older than 10 years, we previously showed performance since inception. Going forward, we will show performance for the most recent 10 years, since this more accurately reflects the experience of the typical shareholder. As a result, charts now may include benchmarks that did not appear previously, because the funds’ inception predated the benchmarks’ inception. Also, all charts will now be presented using a linear format. |
Past performance cannot guarantee comparable future results.
The data shown in the chart include reinvested distributions, applicable sales charges and Fund expenses including management fees. Results for Class B shares are calculated as if a hypothetical shareholder had liquidated his entire investment in the Fund at the close of the reporting period and paid the contingent deferred sales charges, if applicable.
Index results include reinvested dividends, but they do not reflect sales charges. Performance of the peer group, if applicable, reflects fund expenses and management fees; performance of a market index does not. Performance shown in the chart and table(s) does not reflect deduction of taxes a shareholder would pay on Fund distributions or sale of Fund shares.
continued from page 8
Other information
| n | CPA® and Certified Public Accountant® are trademarks owned by the American Institute of Certified Public Accountants. |
| n | The returns shown in management’s discussion of Fund performance are based on net asset values calculated for shareholder transactions. Generally accepted accounting principles require |
adjustments to be made to the net assets of the Fund at period end for financial reporting purposes, and as such, the net asset values for shareholder transactions and the returns based on those net asset values may differ from the net asset values and returns reported in the Financial Highlights.
| n | Industry classifications used in this report are generally according to the Global Industry Classification Standard, which was developed by and is the exclusive property and a service mark of MSCI Inc. and Standard & Poor’s. |
6 Invesco Global Small & Mid Cap Growth Fund
Average Annual Total Returns
As of 10/31/12, including maximum applicable sales charges
Class A Shares | ||||
Inception (9/15/94) | 7.63 | % | ||
10 Years | 9.98 | |||
5 Years | -4.26 | |||
1 Year | 2.03 | |||
Class B Shares | ||||
Inception (9/15/94) | 7.70 | % | ||
10 Years | 10.00 | |||
5 Years | -4.16 | |||
1 Year | 2.17 | |||
Class C Shares | ||||
Inception (8/4/97) | 4.45 | % | ||
10 Years | 9.85 | |||
5 Years | -3.89 | |||
1 Year | 6.12 | |||
Class Y Shares | ||||
10 Years | 10.72 | % | ||
5 Years | -2.97 | |||
1 Year | 8.18 | |||
Class R5 Shares | ||||
10 Years | 10.92 | % | ||
5 Years | -2.65 | |||
1 Year | 8.46 | |||
Class Y shares incepted on October 3, 2008. Performance shown prior to that date is that of Class A shares and includes the 12b-1 fees applicable to Class A shares. Class A share performance reflects any applicable fee waivers or expense reimbursements.
Class R5 shares incepted on September 28, 2007. Performance
shown prior to that date is that of Class A shares and includes the 12b-1 fees applicable to Class A shares. Class A share performance reflects any applicable fee waivers or expense reimbursements.
The performance data quoted represent past performance and cannot guarantee comparable future results; current performance may be lower or higher. Please visit invesco.com/performance for the most recent month-end performance. Performance figures reflect reinvested distributions, changes in net asset value and the effect of the maximum sales charge unless otherwise stated. Investment return and principal value will fluctuate so that you may have a gain or loss when you sell shares.
Average Annual Total Returns
As of 9/30/12, the most recent calendar quarter-end,including maximum applicable sales charges
Class A Shares | ||||
Inception (9/15/94) | 7.65 | % | ||
10 Years | 10.21 | |||
5 Years | -3.19 | |||
1 Year | 11.24 | |||
Class B Shares | ||||
Inception (9/15/94) | 7.73 | % | ||
10 Years | 10.25 | |||
5 Years | -3.11 | |||
1 Year | 11.79 | |||
Class C Shares | ||||
Inception (8/4/97) | 4.46 | % | ||
10 Years | 10.07 | |||
5 Years | -2.83 | |||
1 Year | 15.77 | |||
Class Y Shares | ||||
10 Years | 10.95 | % | ||
5 Years | -1.89 | |||
1 Year | 17.97 | |||
Class R5 Shares | ||||
10 Years | 11.15 | % | ||
5 Years | -1.55 | |||
1 Year | 18.24 | |||
The total annual Fund operating expense ratio set forth in the most recent Fund prospectus as of the date of this report for Class A, Class B, Class C, Class Y and Class R5 shares was 1.41%, 2.16%, 2.16%, 1.16% and 0.92%, respectively. The expense ratios presented above may vary from the expense ratios presented in other sections of this report that are based on expenses incurred during the period covered by this report.
Class A share performance reflects the maximum 5.50% sales charge, and Class B and Class C share performance reflects the applicable contingent deferred sales charge (CDSC) for the period involved. The CDSC on Class B shares declines from 5% beginning at the time of purchase to 0% at the beginning of the seventh year. The CDSC on Class C shares is 1% for the first year after purchase. Class Y and Class R5 shares do not have a front-end sales charge or a CDSC; therefore, performance is at net asset value.
The performance of the Fund’s share classes will differ primarily due to different sales charge structures and class expenses.
7 Invesco Global Small & Mid Cap Growth Fund
Invesco Global Small & Mid Cap Growth Fund’s investment objective is long-term growth of capital.
| n | Unless otherwise stated, information presented in this report is as of October 31, 2012, and is based on total net assets. |
| n | Unless otherwise noted, all data provided by Invesco. |
| n | To access your Fund’s reports/prospectus, visit invesco.com/fundreports. |
About share classes
| n | Class B shares may not be purchased for new or additional investments. Please see the prospectus for more information. |
| n | Class Y shares are available only to certain investors. Please see the prospectus for more information. |
| n | Class R5 shares are primarily intended for retirement plans that meet certain standards and for institutional investors. On September 24, 2012, Institutional Class shares were renamed Class R5 shares. Please see the prospectus for more information. |
Principal risks of investing in the Fund
| n | Derivatives risk. The performance of derivative instruments is tied to the performance of an underlying currency, security, index or other instrument. In addition to risks relating to their underlying instruments, the use of derivatives may include other, possibly greater, risks. Derivatives involve costs, may be volatile, and may involve a small initial investment relative to the risk assumed. Risks associated with the use of derivatives include counterparty, leverage, correlation, liquidity, tax, market, interest rate and management risks. Derivatives may also be more difficult to purchase, sell or value than other investments. The Fund may lose more than the cash amount invested on investments in derivatives. |
Investors should bear in mind that, while the Fund intends to use derivative strategies, it is not obligated to actively engage in these transactions, generally or in any particular kind of derivative, if the investment manager elects not to do so due to availability, cost, market conditions or other factors.
| n | Developing/emerging markets securities risk. Securities issued by foreign companies and governments located in developing/emerging countries may be affected more negatively by inflation, devaluation of their currencies, higher transaction costs, delays in settlement, adverse political developments, the introduction of capital controls, withholding taxes, nationalization of private assets, expropriation, social unrest, war or lack of timely information than those in developed countries. |
| n | Foreign securities risk. The Fund’s foreign investments may be affected by changes in a foreign country’s exchange rates, political and social instability, changes in economic or taxation policies, difficulties when enforcing obligations, decreased liquidity, and increased volatility. Foreign companies may be subject to less regulation resulting in less publicly available information about the companies. |
| n | Growth investing risk. Growth stocks tend to be more expensive relative to their earnings or assets compared with other types of stock. As a result they tend to be more sensitive to changes in their earnings and can be more volatile. |
| n | Management risk. The investment techniques and risk analysis used by the Fund’s portfolio managers may not produce the desired results. |
| n | Market risk. The prices of and the income generated by the Fund’s securities may decline in response to, among other things, investor sentiment, general economic and market conditions, regional or global instability, and currency and interest rate fluctuations. |
| n | Small and mid-capitalization risk. Stocks of small and mid-sized companies tend to be more vulnerable to adverse developments in the above factors and may have little or no operating history or track record of success, |
and limited product lines, markets, management and financial resources. The securities of small and mid-sized companies may be more volatile due to less market interest and less publicly available information about the issuer. They also may be illiquid or restricted as to resale, or may trade less frequently and in smaller volumes, all of which may cause difficulty when establishing or closing a position at a desirable price. |
| n | Synthetic securities risk. Fluctuations in the values of synthetic securities may not correlate perfectly with the instruments they are designed to replicate. Synthetic securities may be subject to interest rate changes, market price fluctuations, counterparty risk and liquidity risk. |
About indexes used in this report
| n | The MSCI World IndexSM is an unmanaged index considered representative of stocks of developed countries. |
| n | The MSCI World Growth Index is an unmanaged index considered representative of growth stocks of developed countries. |
| n | The Lipper Global Small/Mid-Cap Funds Classification Average represents an average of all funds in the Lipper Global Small/Mid-Cap Funds classification. |
| n | The Fund is not managed to track the performance of any particular index, including the index(es) defined here, and consequently, the performance of the Fund may deviate significantly from the performance of the index(es). |
| n | A direct investment cannot be made in an index. Unless otherwise indicated, index results include reinvested dividends, and they do not reflect sales charges. Performance of the peer group, if applicable, reflects fund expenses; performance of a market index does not. |
continued on page 6
This report must be accompanied or preceded by a currently effective Fund prospectus, which contains more complete information, including sales charges and expenses. Investors should read it carefully before investing.
NOT FDIC INSURED | MAY LOSE VALUE | NO BANK GUARANTEE
Fund Nasdaq Symbols
Class A Shares | AGAAX | |
Class B Shares | AGABX | |
Class C Shares | AGACX | |
Class Y Shares | AGAYX | |
Class R5 Shares | GAIIX | |
8 Invesco Global Small & Mid Cap Growth Fund
Schedule of Investments
October 31, 2012
| Shares | Value | |||||||
| Common Stocks & Other Equity Interests–94.45% | ||||||||
Australia–1.27% |
| |||||||
Computershare Ltd. | 779,807 | $ | 7,015,836 | |||||
Belgium–0.76% |
| |||||||
S.A. D’Ieteren N.V. | 86,244 | 4,169,341 | ||||||
Brazil–4.28% |
| |||||||
CETIP S.A.–Mercados Organizados | 298,000 | 3,433,721 | ||||||
Cielo S.A. | 394,355 | 9,757,898 | ||||||
Duratex S.A. | 1,484,540 | 10,329,205 | ||||||
| 23,520,824 | ||||||||
Canada–9.78% |
| |||||||
Celtic Exploration Ltd.(a) | 299,763 | 7,825,644 | ||||||
Fairfax Financial Holdings Ltd. | 20,671 | 7,666,479 | ||||||
MacDonald, Dettwiler and Associates Ltd. | 77,012 | 4,316,989 | ||||||
Onex Corp. | 302,723 | 12,181,646 | ||||||
Open Text Corp.(a) | 102,645 | 5,515,499 | ||||||
Paramount Resources Ltd.–Class A(a) | 296,410 | 10,028,687 | ||||||
Precision Drilling Corp.(a) | 870,962 | 6,233,612 | ||||||
| 53,768,556 | ||||||||
China–2.09% |
| |||||||
Lee & Man Paper Manufacturing Ltd. | 12,159,000 | 6,385,436 | ||||||
NetEase, Inc.–ADR(a) | 94,877 | 5,123,358 | ||||||
| 11,508,794 | ||||||||
France–0.59% |
| |||||||
Faurecia | 213,682 | 3,226,110 | ||||||
Germany–2.64% |
| |||||||
Brenntag AG | 29,717 | 3,744,738 | ||||||
Deutsche Boerse AG | 131,408 | 7,111,378 | ||||||
MorphoSys AG(a) | 107,972 | 3,665,928 | ||||||
| 14,522,044 | ||||||||
Hong Kong–0.57% |
| |||||||
Hongkong Land Holdings Ltd. | 497,000 | 3,145,851 | ||||||
Indonesia–1.17% |
| |||||||
PT Perusahaan Gas Negara Persero Tbk | 13,276,500 | 6,414,768 | ||||||
Ireland–2.53% |
| |||||||
DCC PLC | 366,961 | 10,463,183 | ||||||
Shire PLC | 123,205 | 3,465,361 | ||||||
| 13,928,544 | ||||||||
Israel–1.01% |
| |||||||
Israel Chemicals Ltd. | 446,257 | 5,568,797 | ||||||
| Shares | Value | |||||||
Japan–2.19% |
| |||||||
EXEDY Corp. | 339,300 | $ | 6,579,436 | |||||
THK Co., Ltd. | 328,400 | 5,441,942 | ||||||
| 12,021,378 | ||||||||
Mexico–1.04% |
| |||||||
America Movil S.A.B. de C.V.–ADR | 225,506 | 5,703,047 | ||||||
Philippines–5.06% |
| |||||||
Ayala Corp. | 1,824,079 | 19,629,953 | ||||||
Energy Development Corp.(b) | 6,577,500 | 1,065,758 | ||||||
Energy Development Corp. | 44,094,600 | 7,144,685 | ||||||
| 27,840,396 | ||||||||
South Africa–3.16% |
| |||||||
AngloGold Ashanti Ltd.–ADR | 87,789 | 2,983,070 | ||||||
Naspers Ltd.–Class N | 221,481 | 14,388,380 | ||||||
| 17,371,450 | ||||||||
South Korea–1.60% |
| |||||||
NHN Corp. | 38,058 | 8,810,530 | ||||||
Spain–0.76% |
| |||||||
Prosegur Compania de Seguridad S.A. | 768,032 | 4,180,229 | ||||||
Sweden–1.03% |
| |||||||
Investment AB Kinnevik–Class B | 294,904 | 5,645,439 | ||||||
Switzerland–1.98% |
| |||||||
Aryzta AG(a) | 217,713 | 10,884,336 | ||||||
Tanzania–1.05% |
| |||||||
African Barrick Gold Ltd. | 845,685 | 5,786,251 | ||||||
Thailand–2.20% |
| |||||||
Siam Commercial Bank PCL | 2,302,100 | 12,076,836 | ||||||
Turkey–3.32% |
| |||||||
Haci Omer Sabanci Holding A.S. | 1,770,697 | 9,344,934 | ||||||
Tupras-Turkiye Petrol Rafinerileri A.S. | 363,635 | 8,885,474 | ||||||
| 18,230,408 | ||||||||
United Arab Emirates–1.38% |
| |||||||
Dragon Oil PLC | 847,085 | 7,586,523 | ||||||
United Kingdom–16.14% |
| |||||||
Bunzl PLC | 355,093 | 5,880,919 | ||||||
Chemring Group PLC | 955,565 | 4,837,239 | ||||||
Compass Group PLC | 611,853 | 6,723,186 | ||||||
Homeserve PLC | 1,650,642 | 5,888,838 | ||||||
IG Group Holdings PLC | 1,623,859 | 11,411,935 | ||||||
Informa PLC | 1,662,227 | 10,752,967 | ||||||
Lancashire Holdings Ltd. | 637,330 | 8,888,776 | ||||||
Micro Focus International PLC | 1,005,286 | 9,324,249 | ||||||
See accompanying Notes to Financial Statements which are an integral part of the financial statements.
9 Invesco Global Small & Mid Cap Growth Fund
| Shares | Value | |||||||
United Kingdom–(continued) |
| |||||||
Smiths Group PLC | 396,534 | $ | 6,769,578 | |||||
UBM PLC | 424,848 | 4,795,613 | ||||||
Ultra Electronics Holdings PLC | 266,074 | 7,269,126 | ||||||
William Hill PLC | 1,137,590 | 6,213,680 | ||||||
| 88,756,106 | ||||||||
United States–26.85% |
| |||||||
Affiliated Managers Group, Inc.(a) | 36,572 | 4,626,358 | ||||||
Albemarle Corp. | 29,670 | 1,635,114 | ||||||
Allegheny Technologies, Inc. | 55,850 | 1,471,647 | ||||||
Alliance Data Systems Corp.(a) | 12,619 | 1,805,148 | ||||||
American Eagle Outfitters, Inc. | 216,858 | 4,525,826 | ||||||
AMETEK, Inc. | 106,170 | 3,774,344 | ||||||
Amphenol Corp.–Class A | 61,518 | 3,699,077 | ||||||
Autodesk, Inc.(a) | 69,222 | 2,204,028 | ||||||
Avago Technologies Ltd. | 73,891 | 2,440,620 | ||||||
Avnet, Inc.(a) | 103,725 | 2,971,721 | ||||||
B/E Aerospace, Inc.(a) | 66,986 | 3,020,399 | ||||||
BioMarin Pharmaceutical Inc.(a) | 70,697 | 2,618,617 | ||||||
Cameron International Corp.(a) | 41,095 | 2,081,051 | ||||||
Church & Dwight Co., Inc. | 53,856 | 2,733,731 | ||||||
Cinemark Holdings, Inc. | 168,530 | 4,161,006 | ||||||
Citrix Systems, Inc.(a) | 60,993 | 3,769,977 | ||||||
Cognizant Technology Solutions | 33,200 | 2,212,780 | ||||||
DaVita HealthCare Partners Inc.(a) | 36,224 | 4,075,924 | ||||||
Dick’s Sporting Goods, Inc. | 88,627 | 4,431,350 | ||||||
Discover Financial Services | 105,335 | 4,318,735 | ||||||
Endo Health Solutions Inc.(a) | 15,345 | 439,788 | ||||||
EQT Corp. | 33,267 | 2,016,978 | ||||||
Express Scripts Holding Co.(a) | 36,008 | 2,215,932 | ||||||
F5 Networks, Inc.(a) | 25,393 | 2,094,415 | ||||||
GNC Holdings, Inc.–Class A | 86,081 | 3,328,752 | ||||||
HMS Holdings Corp.(a) | 68,690 | 1,586,052 | ||||||
Joy Global Inc. | 44,167 | 2,758,229 | ||||||
Kansas City Southern | 39,289 | 3,161,193 | ||||||
| Shares | Value | |||||||
United States–(continued) |
| |||||||
Lennox International Inc. | 55,557 | $ | 2,780,628 | |||||
LyondellBasell Industries N.V.–Class A | 26,795 | 1,430,585 | ||||||
MasTec Inc.(a) | 106,141 | 2,394,541 | ||||||
Medivation Inc.(a) | 64,666 | 3,305,726 | ||||||
Michael Kors Holdings Ltd.(a) | 75,801 | 4,145,557 | ||||||
O’Reilly Automotive, Inc.(a) | 26,564 | 2,276,004 | ||||||
Pioneer Natural Resources Co. | 34,168 | 3,609,849 | ||||||
PPG Industries, Inc. | 25,982 | 3,041,973 | ||||||
Ralph Lauren Corp. | 18,658 | 2,867,548 | ||||||
Red Hat, Inc.(a) | 65,143 | 3,203,081 | ||||||
Salesforce.com, Inc.(a) | 9,297 | 1,357,176 | ||||||
Starwood Hotels & Resorts Worldwide, Inc. | 25,538 | 1,324,145 | ||||||
Teradata Corp.(a) | 28,306 | 1,933,583 | ||||||
Tesla Motors, Inc.(a) | 130,907 | 3,682,414 | ||||||
Tractor Supply Co. | 16,982 | 1,634,348 | ||||||
Triumph Group, Inc. | 60,903 | 3,984,274 | ||||||
Ulta Salon, Cosmetics & Fragrance, Inc. | 59,387 | 5,476,669 | ||||||
Under Armour, Inc.–Class A(a) | 83,972 | 4,388,377 | ||||||
Universal Health Services, Inc.–Class B | 112,496 | 4,656,209 | ||||||
Waste Connections, Inc. | 94,585 | 3,105,226 | ||||||
Whole Foods Market, Inc. | 41,670 | 3,947,399 | ||||||
Wynn Resorts Ltd. | 24,303 | 2,942,121 | ||||||
| 147,666,225 | ||||||||
Total Common Stocks & Other Equity Interests (Cost $400,191,234) |
| 519,348,619 | ||||||
Money Market Funds–5.88% |
| |||||||
Liquid Assets Portfolio–Institutional Class(c) | 16,180,742 | 16,180,742 | ||||||
Premier Portfolio–Institutional Class(c) | 16,180,742 | 16,180,742 | ||||||
Total Money Market Funds |
| 32,361,484 | ||||||
TOTAL INVESTMENTS–100.33% |
| 551,710,103 | ||||||
OTHER ASSETS LESS LIABILITIES–(0.33)% |
| (1,841,377 | ) | |||||
NET ASSETS–100.00% |
| $ | 549,868,726 | |||||
Investment Abbreviations:
| ADR | – American Depositary Receipt |
Notes to Schedule of Investments:
| (a) | Non-income producing security. |
| (b) | Security purchased or received in a transaction exempt from registration under the Securities Act of 1933, as amended. The security may be resold pursuant to an exemption from registration under the 1933 Act, typically to qualified institutional buyers. The value of this security at October 31, 2012 represented 0.19% of the Fund’s Net Assets. |
| (c) | The money market fund and the Fund are affiliated by having the same investment adviser. |
See accompanying Notes to Financial Statements which are an integral part of the financial statements.
10 Invesco Global Small & Mid Cap Growth Fund
Statement of Assets and Liabilities
October 31, 2012
Assets: |
| |||
Investments, at value (Cost $400,191,234) | $ | 519,348,619 | ||
Investments in affiliated money market funds, at value and cost | 32,361,484 | |||
Total investments, at value (Cost $432,552,718) | 551,710,103 | |||
Foreign currencies, at value (Cost $27,205) | 27,225 | |||
Receivable for: | ||||
Investments sold | 2,170,496 | |||
Fund shares sold | 435,929 | |||
Dividends | 1,412,047 | |||
Investment for trustee deferred compensation and retirement plans | 77,180 | |||
Other assets | 27,452 | |||
Total assets | 555,860,432 | |||
Liabilities: |
| |||
Payable for: | ||||
Investments purchased | 2,477,916 | |||
Fund shares reacquired | 1,401,171 | |||
Accrued fees to affiliates | 411,085 | |||
Accrued foreign taxes | 1,332,551 | |||
Accrued other operating expenses | 151,249 | |||
Trustee deferred compensation and retirement plans | 217,734 | |||
Total liabilities | 5,991,706 | |||
Net assets applicable to shares outstanding | $ | 549,868,726 | ||
Net assets consist of: |
| |||
Shares of beneficial interest | $ | 419,500,852 | ||
Undistributed net investment income | 4,440,486 | |||
Undistributed net realized gain | 6,772,751 | |||
Unrealized appreciation | 119,154,637 | |||
| $ | 549,868,726 | |||
Net Assets: |
| |||
Class A | $ | 482,051,320 | ||
Class B | $ | 17,529,161 | ||
Class C | $ | 22,401,460 | ||
Class Y | $ | 7,405,807 | ||
Class R5 | $ | 20,480,978 | ||
Shares outstanding, $0.001 par value per share, with an unlimited number of shares authorized: |
| |||
Class A | 26,974,805 | |||
Class B | 1,126,030 | |||
Class C | 1,437,927 | |||
Class Y | 413,265 | |||
Class R5 | 1,147,420 | |||
Class A: | ||||
Net asset value per share | $ | 17.87 | ||
Maximum offering price per share | ||||
(Net asset value of $17.87 ¸ 94.50%) | $ | 18.91 | ||
Class B: | ||||
Net asset value and offering price per share | $ | 15.57 | ||
Class C: | ||||
Net asset value and offering price per share | $ | 15.58 | ||
Class Y: | ||||
Net asset value and offering price per share | $ | 17.92 | ||
Class R5: | ||||
Net asset value and offering price per share | $ | 17.85 | ||
See accompanying Notes to Financial Statements which are an integral part of the financial statements.
11 Invesco Global Small & Mid Cap Growth Fund
Statement of Operations
For the year ended October 31, 2012
Investment income: |
| |||
Dividends (net of foreign withholding taxes of $717,022) | $ | 13,624,402 | ||
Dividends from affiliated money market funds | 50,840 | |||
Total investment income | 13,675,242 | |||
Expenses: | ||||
Advisory fees | 4,452,731 | |||
Administrative services fees | 163,493 | |||
Custodian fees | 261,587 | |||
Distribution fees: | ||||
Class A | 1,234,870 | |||
Class B | 200,652 | |||
Class C | 224,816 | |||
Transfer agent fees — A, B, C and Y | 1,449,483 | |||
Transfer agent fees — R5 | 8,827 | |||
Trustees’ and officers’ fees and benefits | 52,103 | |||
Other | 233,753 | |||
Total expenses | 8,282,315 | |||
Less: Fees waived and expense offset arrangement(s) | (57,519 | ) | ||
Net expenses | 8,224,796 | |||
Net investment income | 5,450,446 | |||
Realized and unrealized gain (loss) from: | ||||
Net realized gain (loss) from: | ||||
Investment securities (net of foreign taxes of $288,609) | 8,577,102 | |||
Foreign currencies | (241,562 | ) | ||
| 8,335,540 | ||||
Change in net unrealized appreciation of: | ||||
Investment securities (net of foreign taxes on holdings of $(358,019)) | 28,757,096 | |||
Foreign currencies | 64,007 | |||
| 28,821,103 | ||||
Net realized and unrealized gain | 37,156,643 | |||
Net increase in net assets resulting from operations | $ | 42,607,089 | ||
See accompanying Notes to Financial Statements which are an integral part of the financial statements.
12 Invesco Global Small & Mid Cap Growth Fund
Statement of Changes in Net Assets
For the years ended October 31, 2012 and 2011
| 2012 | 2011 | |||||||
Operations: |
| |||||||
Net investment income | $ | 5,450,446 | $ | 6,054,030 | ||||
Net realized gain | 8,335,540 | 46,841,004 | ||||||
Change in net unrealized appreciation (depreciation) | 28,821,103 | (69,656,358 | ) | |||||
Net increase (decrease) in net assets resulting from operations | 42,607,089 | (16,761,324 | ) | |||||
Distributions to shareholders from net investment income: | ||||||||
Class A | (6,820,626 | ) | (2,433,351 | ) | ||||
Class B | (108,863 | ) | — | |||||
Class C | (111,931 | ) | — | |||||
Class Y | (127,196 | ) | (52,803 | ) | ||||
Class R5 | (454,708 | ) | (261,973 | ) | ||||
Total distributions from net investment income | (7,623,324 | ) | (2,748,127 | ) | ||||
Distributions to shareholders from net realized gains: | ||||||||
Class A | (30,688,616 | ) | — | |||||
Class B | (1,557,807 | ) | — | |||||
Class C | (1,601,713 | ) | — | |||||
Class Y | (461,675 | ) | — | |||||
Class R5 | (1,386,928 | ) | — | |||||
Total distributions from net realized gains | (35,696,739 | ) | — | |||||
Share transactions–net: | ||||||||
Class A | (26,615,988 | ) | (63,952,043 | ) | ||||
Class B | (5,249,848 | ) | (10,746,044 | ) | ||||
Class C | (811,631 | ) | (1,830,344 | ) | ||||
Class Y | (148,594 | ) | (169,160 | ) | ||||
Class R5 | (2,384,743 | ) | (4,147,809 | ) | ||||
Net increase (decrease) in net assets resulting from share transactions | (35,210,804 | ) | (80,845,400 | ) | ||||
Net increase (decrease) in net assets | (35,923,778 | ) | (100,354,851 | ) | ||||
Net assets: | ||||||||
Beginning of year | 585,792,504 | 686,147,355 | ||||||
End of year (includes undistributed net investment income of $4,440,486 and $5,921,642, respectively) | $ | 549,868,726 | $ | 585,792,504 | ||||
Notes to Financial Statements
October 31, 2012
NOTE 1—Significant Accounting Policies
Invesco Global Small & Mid Cap Growth Fund (the “Fund”) is a series portfolio of AIM International Mutual Funds (Invesco International Mutual Funds) (the “Trust”). The Trust is a Delaware statutory trust registered under the Investment Company Act of 1940, as amended (the “1940 Act”), as an open-end series management investment company consisting of eight separate portfolios, each authorized to issue an unlimited number of shares of beneficial interest. The assets, liabilities and operations of each portfolio are accounted for separately. Information presented in these financial statements pertains only to the Fund. Matters affecting each portfolio or class will be voted on exclusively by the shareholders of such portfolio or class.
The Fund’s investment objective is long-term growth of capital.
The Fund currently consists of five different classes of shares: Class A, Class B, Class C, Class Y and Class R5. On September 24, 2012, Institutional Class shares were renamed Class R5 shares. Class A shares are sold with a front-end sales charge unless certain waiver criteria are met and under certain circumstances load waived shares may be subject to contingent deferred sales charges (“CDSC”). Class C shares are sold with a CDSC. Class Y and Class R5 shares are sold at net asset value. Effective November 30, 2010, new or additional investments in Class B shares are no longer permitted. Existing shareholders of Class B shares may continue to reinvest dividends and capital gains distributions in Class B shares until they convert to Class A shares. Also, shareholders in Class B shares will be able to exchange those shares for Class B shares of other Invesco Funds offering
13 Invesco Global Small & Mid Cap Growth Fund
such shares until they convert to Class A shares. Generally, Class B shares will automatically convert to Class A shares on or about the month-end, which is at least eight years after the date of purchase. Redemption of Class B shares prior to the conversion date will be subject to a CDSC.
The following is a summary of the significant accounting policies followed by the Fund in the preparation of its financial statements.
| A. | Security Valuations — Securities, including restricted securities, are valued according to the following policy. |
A security listed or traded on an exchange (except convertible bonds) is valued at its last sales price or official closing price as of the close of the customary trading session on the exchange where the security is principally traded, or lacking any sales or official closing price on a particular day, the security may be valued at the closing bid price on that day. Securities traded in the over-the-counter market are valued based on prices furnished by independent pricing services or market makers. When such securities are valued by an independent pricing service they may be considered fair valued. Futures contracts are valued at the final settlement price set by an exchange on which they are principally traded. Listed options are valued at the mean between the last bid and ask prices from the exchange on which they are principally traded. Options not listed on an exchange are valued by an independent source at the mean between the last bid and ask prices. For purposes of determining net asset value per share, futures and option contracts generally are valued 15 minutes after the close of the customary trading session of the New York Stock Exchange (“NYSE”).
Investments in open-end and closed-end registered investment companies that do not trade on an exchange are valued at the end of day net asset value per share. Investments in open-end and closed-end registered investment companies that trade on an exchange are valued at the last sales price or official closing price as of the close of the customary trading session on the exchange where the security is principally traded.
Debt obligations (including convertible bonds) and unlisted equities are fair valued using an evaluated quote provided by an independent pricing service. Evaluated quotes provided by the pricing service may be determined without exclusive reliance on quoted prices, and may reflect appropriate factors such as institution-size trading in similar groups of securities, developments related to specific securities, dividend rate, yield, quality, type of issue, coupon rate, maturity, individual trading characteristics and other market data. Debt securities are subject to interest rate and credit risks. In addition, all debt securities involve some risk of default with respect to interest and/or principal payments.
Foreign securities (including foreign exchange contracts) are converted into U.S. dollar amounts using the applicable exchange rates as of the close of the NYSE. If market quotations are available and reliable for foreign exchange traded equity securities, the securities will be valued at the market quotations. Because trading hours for certain foreign securities end before the close of the NYSE, closing market quotations may become unreliable. If between the time trading ends on a particular security and the close of the customary trading session on the NYSE, events occur that are significant and make the closing price unreliable, the Fund may fair value the security. If the event is likely to have affected the closing price of the security, the security will be valued at fair value in good faith using procedures approved by the Board of Trustees. Adjustments to closing prices to reflect fair value may also be based on a screening process of an independent pricing service to indicate the degree of certainty, based on historical data, that the closing price in the principal market where a foreign security trade is not the current value as of the close of the NYSE. Foreign securities meeting the approved degree of certainty that the price is not reflective of current value will be priced at the indication of fair value from the independent pricing service. Multiple factors may be considered by the independent pricing service in determining adjustments to reflect fair value and may include information relating to sector indices, American Depositary Receipts and domestic and foreign index futures. Foreign securities may have additional risks including exchange rate changes, potential for sharply devalued currencies and high inflation, political and economic upheaval, the relative lack of issuer information, relatively low market liquidity and the potential lack of strict financial and accounting controls and standards.
Securities for which market prices are not provided by any of the above methods may be valued based upon quotes furnished by independent sources. The last bid price may be used to value equity securities. The mean between the last bid and asked prices is used to value debt obligations, including corporate loans.
Securities for which market quotations are not readily available or are unreliable are valued at fair value as determined in good faith by or under the supervision of the Trust’s officers following procedures approved by the Board of Trustees. Issuer specific events, market trends, bid/ask quotes of brokers and information providers and other market data may be reviewed in the course of making a good faith determination of a security’s fair value.
Valuations change in response to many factors including the historical and prospective earnings of the issuer, the value of the issuer’s assets, general economic conditions, interest rates, investor perceptions and market liquidity. Because of the inherent uncertainties of valuation, the values reflected in the financial statements may materially differ from the value received upon actual sale of those investments.
| B. | Securities Transactions and Investment Income — Securities transactions are accounted for on a trade date basis. Realized gains or losses on sales are computed on the basis of specific identification of the securities sold. Interest income is recorded on the accrual basis from settlement date. Dividend income (net of withholding tax, if any) is recorded on the ex-dividend date. |
The Fund may periodically participate in litigation related to Fund investments. As such, the Fund may receive proceeds from litigation settlements. Any proceeds received are included in the Statement of Operations as realized gain (loss) for investments no longer held and as unrealized gain (loss) for investments still held.
Brokerage commissions and mark ups are considered transaction costs and are recorded as an increase to the cost basis of securities purchased and/or a reduction of proceeds on a sale of securities. Such transaction costs are included in the determination of net realized and unrealized gain (loss) from investment securities reported in the Statement of Operations and the Statement of Changes in Net Assets and the net realized and unrealized gains (losses) on securities per share in the Financial Highlights. Transaction costs are included in the calculation of the Fund’s net asset value and, accordingly, they reduce the Fund’s total returns. These transaction costs are not considered operating expenses and are not reflected in net investment income reported in the Statement of Operations and Statement of Changes in Net Assets, or the net investment income per share and ratios of expenses and net investment income reported in the Financial Highlights, nor are they limited by any expense limitation arrangements between the Fund and the investment adviser.
The Fund allocates income and realized and unrealized capital gains and losses to a class based on the relative net assets of each class.
| C. | Country Determination — For the purposes of making investment selection decisions and presentation in the Schedule of Investments, the investment adviser may determine the country in which an issuer is located and/or credit risk exposure based on various factors. These factors include the laws of the country under which the issuer is organized, where the issuer maintains a principal office, the country in which the issuer derives 50% or more of its total revenues and the country that has the primary market for the issuer’s securities, as well as other criteria. Among |
14 Invesco Global Small & Mid Cap Growth Fund
| the other criteria that may be evaluated for making this determination are the country in which the issuer maintains 50% or more of its assets, the type of security, financial guarantees and enhancements, the nature of the collateral and the sponsor organization. Country of issuer and/or credit risk exposure has been determined to be the United States of America, unless otherwise noted. |
| D. | Distributions — Distributions from income and net realized capital gain, if any, are generally declared and paid annually and recorded on the ex-dividend date. The Fund may elect to treat a portion of the proceeds from redemptions as distributions for federal income tax purposes. |
| E. | Federal Income Taxes — The Fund intends to comply with the requirements of Subchapter M of the Internal Revenue Code necessary to qualify as a regulated investment company and to distribute substantially all of the Fund’s taxable earnings to shareholders. As such, the Fund will not be subject to federal income taxes on otherwise taxable income (including net realized capital gain) that is distributed to shareholders. Therefore, no provision for federal income taxes is recorded in the financial statements. |
The Fund files tax returns in the U.S. Federal jurisdiction and certain other jurisdictions. Generally, the Fund is subject to examinations by such taxing authorities for up to three years after the filing of the return for the tax period.
| F. | Expenses — Fees provided for under the Rule 12b-1 plan of a particular class of the Fund are charged to the operations of such class. Transfer agency fees and expenses and other shareholder recordkeeping fees and expenses attributable to Class R5 are charged to such class. Transfer agency fees and expenses and other shareholder recordkeeping fees and expenses relating to all other classes are allocated among those classes based on relative net assets. All other expenses are allocated among the classes based on relative net assets. |
| G. | Accounting Estimates — The preparation of financial statements in conformity with accounting principles generally accepted in the United States of America (“GAAP”) requires management to make estimates and assumptions that affect the reported amounts of assets and liabilities at the date of the financial statements and the reported amounts of revenues and expenses during the reporting period including estimates and assumptions related to taxation. Actual results could differ from those estimates by a significant amount. In addition, the Fund monitors for material events or transactions that may occur or become known after the period-end date and before the date the financial statements are released to print. |
| H. | Indemnifications — Under the Trust’s organizational documents, each Trustee, officer, employee or other agent of the Trust is indemnified against certain liabilities that may arise out of the performance of their duties to the Fund. Additionally, in the normal course of business, the Fund enters into contracts, including the Fund’s servicing agreements, that contain a variety of indemnification clauses. The Fund’s maximum exposure under these arrangements is unknown as this would involve future claims that may be made against the Fund that have not yet occurred. The risk of material loss as a result of such indemnification claims is considered remote. |
| I. | Redemption Fees — The Fund had a 2% redemption fee that was retained by the Fund to offset transaction costs and other expenses associated with short-term redemptions and exchanges. The fee, subject to certain exceptions, was imposed on certain redemptions or exchanges of shares within 31 days of purchase. The redemption fee was recorded as an increase in shareholder capital and was allocated among the share classes based on the relative net assets of each class. Effective January 1, 2012, the Fund eliminated the 2% redemption fee assessed on shares of the Fund redeemed or exchanged within 31 days of purchase. |
| J. | Foreign Currency Translations — Foreign currency is valued at the close of the NYSE based on quotations posted by banks and major currency dealers. Portfolio securities and other assets and liabilities denominated in foreign currencies are translated into U.S. dollar amounts at date of valuation. Purchases and sales of portfolio securities (net of foreign taxes withheld on disposition) and income items denominated in foreign currencies are translated into U.S. dollar amounts on the respective dates of such transactions. The Fund does not separately account for the portion of the results of operations resulting from changes in foreign exchange rates on investments and the fluctuations arising from changes in market prices of securities held. The combined results of changes in foreign exchange rates and the fluctuation of market prices on investments (net of estimated foreign tax withholding) are included with the net realized and unrealized gain or loss from investments in the Statement of Operations. Reported net realized foreign currency gains or losses arise from (1) sales of foreign currencies, (2) currency gains or losses realized between the trade and settlement dates on securities transactions, and (3) the difference between the amounts of dividends, interest, and foreign withholding taxes recorded on the Fund’s books and the U.S. dollar equivalent of the amounts actually received or paid. Net unrealized foreign currency gains and losses arise from changes in the fair values of assets and liabilities, other than investments in securities at fiscal period end, resulting from changes in exchange rates. |
The Fund may invest in foreign securities which may be subject to foreign taxes on income, gains on investments or currency repatriation, a portion of which may be recoverable.
| K. | Foreign Currency Contracts — The Fund may enter into foreign currency contracts to manage or minimize currency or exchange rate risk. The Fund may also enter into foreign currency contracts for the purchase or sale of a security denominated in a foreign currency in order to “lock in” the U.S. dollar price of that security. A foreign currency contract is an obligation to purchase or sell a specific currency for an agreed-upon price at a future date. The use of foreign currency contracts does not eliminate fluctuations in the price of the underlying securities the Fund owns or intends to acquire but establishes a rate of exchange in advance. Fluctuations in the value of these contracts are measured by the difference in the contract date and reporting date exchange rates and are recorded as unrealized appreciation (depreciation) until the contracts are closed. When the contracts are closed, realized gains (losses) are recorded. Realized and unrealized gains (losses) on the contracts are included in the Statement of Operations. The primary risks associated with foreign currency contracts include failure of the counterparty to meet the terms of the contract and the value of the foreign currency changing unfavorably. These risks may be in excess of the amounts reflected in the Statement of Assets and Liabilities. |
15 Invesco Global Small & Mid Cap Growth Fund
NOTE 2—Advisory Fees and Other Fees Paid to Affiliates
The Trust has entered into a master investment advisory agreement with Invesco Advisers, Inc. (the “Adviser” or “Invesco”). Under the terms of the investment advisory agreement, the Fund pays an advisory fee to the Adviser based on the annual rate of the Fund’s average daily net assets as follows:
| Average Daily Net Assets | Rate | |||
First $250 million | 0.80% | |||
Next $250 million | 0.78% | |||
Next $500 million | 0.76% | |||
Next $1.5 billion | 0.74% | |||
Next $2.5 billion | 0.72% | |||
Next $2.5 billion | 0.70% | |||
Next $2.5 billion | 0.68% | |||
Over $10 billion | 0.66% | |||
Under the terms of a master sub-advisory agreement between the Adviser and each of Invesco Asset Management Deutschland GmbH, Invesco Asset Management Limited, Invesco Asset Management (Japan) Limited, Invesco Australia Limited, Invesco Hong Kong Limited, Invesco Senior Secured Management, Inc. and Invesco Canada Ltd. (collectively, the “Affiliated Sub-Advisers”) the Adviser, not the Fund, may pay 40% of the fees paid to the Adviser to any such Affiliated Sub-Adviser(s) that provide discretionary investment management services to the Fund based on the percentage of assets allocated to such Sub-Adviser(s).
The Adviser has contractually agreed, through at least June 30, 2013, to waive advisory fees and/or reimburse expenses of all shares to the extent necessary to limit total annual fund operating expenses after fee waiver and/or expense reimbursement (excluding certain items discussed below) of Class A, Class B, Class C, Class Y and Class R5 shares to 2.25%, 3.00%, 3.00%, 2.00% and 2.00%, respectively, of average daily net assets. In determining the Adviser’s obligation to waive advisory fees and/or reimburse expenses, the following expenses are not taken into account, and could cause the total annual fund operating expenses after fee waiver and/or expense reimbursement to exceed the numbers reflected above: (1) interest; (2) taxes; (3) dividend expense on short sales; (4) extraordinary items or non-routine items, including litigation expenses; and (5) expenses that the Fund has incurred but did not actually pay because of an expense offset arrangement. Unless the Board of Trustees and Invesco mutually agree to amend or continue the fee waiver agreement, it will terminate on June 30, 2013. The Adviser did not waive fees and/or reimburse expenses during the period under this expense limitation.
Further, the Adviser has contractually agreed, through at least June 30, 2013, to waive the advisory fee payable by the Fund in an amount equal to 100% of the net advisory fees the Adviser receives from the affiliated money market funds on investments by the Fund of uninvested cash in such affiliated money market funds.
For the year ended October 31, 2012, the Adviser waived advisory fees of $53,470.
The Trust has entered into a master administrative services agreement with Invesco pursuant to which the Fund has agreed to pay Invesco for certain administrative costs incurred in providing accounting services to the Fund. For the year ended October 31, 2012, expenses incurred under the agreement are shown in the Statement of Operations as Administrative services fees.
The Trust has entered into a transfer agency and service agreement with Invesco Investment Services, Inc. (“IIS”) pursuant to which the Fund has agreed to pay IIS a fee for providing transfer agency and shareholder services to the Fund and reimburse IIS for certain expenses incurred by IIS in the course of providing such services. IIS may make payments to intermediaries that provide omnibus account services, sub-accounting services and/or networking services. All fees payable by IIS to intermediaries that provide omnibus account services or sub-accounting are charged back to the Fund, subject to certain limitations approved by the Trust’s Board of Trustees. For the year ended October 31, 2012, expenses incurred under the agreement are shown in the Statement of Operations as Transfer agent fees.
The Trust has entered into master distribution agreements with Invesco Distributors, Inc. (“IDI”) to serve as the distributor for the Class A, Class B, Class C, Class Y and Class R5 shares of the Fund. The Trust has adopted plans pursuant to Rule 12b-1 under the 1940 Act with respect to the Fund’s Class A, Class B and Class C shares (collectively, the “Plans”). The Fund, pursuant to the Plans, pays IDI compensation at the annual rate of 0.25% of the Fund’s average daily net assets of Class A shares and 1.00% of the average daily net assets of Class B and Class C shares. Of the Plan payments, up to 0.25% of the average daily net assets of each class of shares may be paid to furnish continuing personal shareholder services to customers who purchase and own shares of such classes. Any amounts not paid as a service fee under the Plans would constitute an asset-based sales charge. Rules of the Financial Industry Regulatory Authority (“FINRA”) impose a cap on the total sales charges, including asset-based sales charges, that may be paid by any class of shares of the Fund. For the year ended October 31, 2012, expenses incurred under the Plans are shown in the Statement of Operations as Distribution fees.
Front-end sales commissions and CDSC (collectively, the “sales charges”) are not recorded as expenses of the Fund. Front-end sales commissions are deducted from proceeds from the sales of Fund shares prior to investment in Class A shares of the Fund. CDSC are deducted from redemption proceeds prior to remittance to the shareholder. During the year ended October 31, 2012, IDI advised the Fund that IDI retained $38,916 in front-end sales commissions from the sale of Class A shares and $19, $19,470 and $1,332 from Class A, Class B and Class C shares, respectively, for CDSC imposed on redemptions by shareholders.
For the year ended October 31, 2012, the Fund incurred $1,928 in brokerage commissions with Invesco Capital Markets, Inc., an affiliate of the Adviser and IDI, for portfolio transactions executed on behalf of the Fund.
Certain officers and trustees of the Trust are officers and directors of the Adviser, IIS and/or IDI.
NOTE 3—Additional Valuation Information
GAAP defines fair value as the price that would be received to sell an asset or paid to transfer a liability in an orderly transaction between market participants at the measurement date, under current market conditions. GAAP establishes a hierarchy that prioritizes the inputs to valuation methods giving the highest priority to readily available unadjusted quoted prices in an active market for identical assets (Level 1) and the lowest priority to significant unobservable inputs (Level 3) generally when market prices are not readily available or are unreliable. Based on the valuation inputs, the
16 Invesco Global Small & Mid Cap Growth Fund
securities or other investments are tiered into one of three levels. Changes in valuation methods may result in transfers in or out of an investment’s assigned level:
| Level 1 — | Prices are determined using quoted prices in an active market for identical assets. |
| Level 2 — | Prices are determined using other significant observable inputs. Observable inputs are inputs that other market participants may use in pricing a security. These may include quoted prices for similar securities, interest rates, prepayment speeds, credit risk, yield curves, loss severities, default rates, discount rates, volatilities and others. |
| Level 3 — | Prices are determined using significant unobservable inputs. In situations where quoted prices or observable inputs are unavailable (for example, when there is little or no market activity for an investment at the end of the period), unobservable inputs may be used. Unobservable inputs reflect the Fund’s own assumptions about the factors market participants would use in determining fair value of the securities or instruments and would be based on the best available information. |
The following is a summary of the tiered valuation input levels, as of October 31, 2012. The level assigned to the securities valuations may not be an indication of the risk or liquidity associated with investing in those securities. Because of the inherent uncertainties of valuation, the values reflected in the financial statements may materially differ from the value received upon actual sale of those investments.
During the year ended October 31, 2012, there were transfers from Level 2 to Level 1 of $122,749,517, due to foreign fair value adjustments.
| Level 1 | Level 2 | Level 3 | Total | |||||||||||||
Australia | $ | — | $ | 7,015,836 | $ | — | $ | 7,015,836 | ||||||||
Belgium | 4,169,341 | — | — | 4,169,341 | ||||||||||||
Brazil | 23,520,824 | — | — | 23,520,824 | ||||||||||||
Canada | 53,768,556 | — | — | 53,768,556 | ||||||||||||
China | 11,508,794 | — | — | 11,508,794 | ||||||||||||
France | — | 3,226,110 | — | 3,226,110 | ||||||||||||
Germany | 14,522,044 | — | — | 14,522,044 | ||||||||||||
Hong Kong | — | 3,145,851 | — | 3,145,851 | ||||||||||||
Indonesia | 6,414,768 | — | — | 6,414,768 | ||||||||||||
Ireland | 3,465,361 | 10,463,183 | — | 13,928,544 | ||||||||||||
Israel | — | 5,568,797 | — | 5,568,797 | ||||||||||||
Japan | 6,579,436 | 5,441,942 | — | 12,021,378 | ||||||||||||
Mexico | 5,703,047 | — | — | 5,703,047 | ||||||||||||
Philippines | 27,840,396 | — | — | 27,840,396 | ||||||||||||
South Africa | 17,371,450 | — | — | 17,371,450 | ||||||||||||
South Korea | 8,810,530 | — | — | 8,810,530 | ||||||||||||
Spain | 4,180,229 | — | — | 4,180,229 | ||||||||||||
Sweden | — | 5,645,439 | — | 5,645,439 | ||||||||||||
Switzerland | — | 10,884,336 | — | 10,884,336 | ||||||||||||
Tanzania | 5,786,251 | — | — | 5,786,251 | ||||||||||||
Thailand | — | 12,076,836 | — | 12,076,836 | ||||||||||||
Turkey | 18,230,408 | — | — | 18,230,408 | ||||||||||||
United Arab Emirates | 7,586,523 | — | — | 7,586,523 | ||||||||||||
United Kingdom | 28,313,913 | 60,442,193 | — | 88,756,106 | ||||||||||||
United States | 180,027,709 | — | — | 180,027,709 | ||||||||||||
Total Investments | $ | 427,799,580 | $ | 123,910,523 | $ | — | $ | 551,710,103 | ||||||||
NOTE 4—Expense Offset Arrangement(s)
The expense offset arrangement is comprised of transfer agency credits which result from balances in Demand Deposit Accounts (DDA) used by the transfer agent for clearing shareholder transactions. For the year ended October 31, 2012, the Fund received credits from this arrangement, which resulted in the reduction of the Fund’s total expenses of $4,049.
NOTE 5—Trustees’ and Officers’ Fees and Benefits
“Trustees’ and Officers’ Fees and Benefits” include amounts accrued by the Fund to pay remuneration to certain Trustees and Officers of the Fund. Trustees have the option to defer compensation payable by the Fund, and “Trustees’ and Officers’ Fees and Benefits” also include amounts accrued by the Fund to fund such deferred compensation amounts. Those Trustees who defer compensation have the option to select various Invesco Funds in which their deferral accounts shall be deemed to be invested. Finally, certain current Trustees are eligible to participate in a retirement plan that provides for benefits to be paid upon retirement to Trustees over a period of time based on the number of years of service. The Fund may have certain former Trustees who also participate in a retirement plan and receive benefits under such plan. “Trustees’ and Officers’ Fees and Benefits” include amounts accrued by the Fund to fund such retirement benefits. Obligations under the deferred compensation and retirement plans represent unsecured claims against the general assets of the Fund.
17 Invesco Global Small & Mid Cap Growth Fund
NOTE 6—Cash Balances
The Fund is permitted to temporarily carry a negative or overdrawn balance in its account with State Street Bank and Trust Company, the custodian bank. Such balances, if any at period end, are shown in the Statement of Assets and Liabilities under the payable caption Amount due custodian. To compensate the custodian bank for such overdrafts, the overdrawn Fund may either (1) leave funds as a compensating balance in the account so the custodian bank can be compensated by earning the additional interest; or (2) compensate by paying the custodian bank at a rate agreed upon by the custodian bank and Invesco, not to exceed the contractually agreed upon rate.
NOTE 7—Distributions to Shareholders and Tax Components of Net Assets
Tax Character of Distributions to Shareholders Paid During the Years Ended October 31, 2012 and 2011:
| 2012 | 2011 | |||||||
Ordinary income | $ | 7,623,324 | $ | 2,748,127 | ||||
Long-term capital gain | 35,696,739 | — | ||||||
Total distributions | $ | 43,320,063 | $ | 2,748,127 | ||||
Tax Components of Net Assets at Period-End:
| 2012 | ||||
Undistributed ordinary income | $ | 4,649,335 | ||
Undistributed long — term gain | 7,616,911 | |||
Net unrealized appreciation — investments | 118,313,225 | |||
Net unrealized appreciation (depreciation) — other investments | (2,748 | ) | ||
Temporary book/tax differences | (208,849 | ) | ||
Shares of beneficial interest | 419,500,852 | |||
Total net assets | $ | 549,868,726 | ||
The difference between book-basis and tax-basis unrealized appreciation (depreciation) is due to differences in the timing of recognition of gains and losses on investments for tax and book purposes. The Fund’s net unrealized appreciation difference is attributable primarily to wash sales.
The temporary book/tax differences are a result of timing differences between book and tax recognition of income and/or expenses. The Fund’s temporary book/tax differences are the result of the trustee deferral of compensation and retirement plan benefits.
Capital loss carryforward is calculated and reported as of a specific date. Results of transactions and other activity after that date may affect the amount of capital loss carryforward actually available for the Trust to utilize. The Regulated Investment Company Modernization Act of 2010 (the “Act”) eliminated the eight-year carryover period for capital losses that arise in taxable years beginning after its enactment date of December 22, 2010. Consequently, these capital losses can be carried forward for an unlimited period. However, capital losses with an expiration period may not be used to offset capital gains until all net capital losses without an expiration date have been utilized. Additionally, post-enactment capital loss carryovers will retain their character as either short-term or long-term capital losses instead of as short-term capital losses as under prior law. The ability to utilize capital loss carryforward in the future may be limited under the Internal Revenue Code and related regulations based on the results of future transactions.
The Fund does not have a capital loss carryforward at period-end.
NOTE 8—Investment Securities
The aggregate amount of investment securities (other than short-term securities, U.S. Treasury obligations and money market funds, if any) purchased and sold by the Fund during the year ended October 31, 2012 was $195,865,367 and $257,275,173, respectively. Cost of investments on a tax basis includes the adjustments for financial reporting purposes as of the most recently completed federal income tax reporting period-end.
| Unrealized Appreciation (Depreciation) of Investment Securities on a Tax Basis | ||||
Aggregate unrealized appreciation of investment securities | $ | 139,383,224 | ||
Aggregate unrealized (depreciation) of investment securities | (21,069,999 | ) | ||
Net unrealized appreciation of investment securities | $ | 118,313,225 | ||
Cost of investments for tax purposes is $433,396,878. | ||||
NOTE 9—Reclassification of Permanent Differences
Primarily as a result of differing book/tax treatment of litigation settlements and foreign currency transactions on October 31, 2012, undistributed net investment income was increased by $691,722 and undistributed net realized gain was decreased by $691,722. This reclassification had no effect on the net assets of the Fund.
18 Invesco Global Small & Mid Cap Growth Fund
NOTE 10—Share Information
| Summary of Share Activity | ||||||||||||||||
| Years ended October 31, | ||||||||||||||||
| 2012(a) | 2011 | |||||||||||||||
| Shares | Amount | Shares | Amount | |||||||||||||
Sold: | ||||||||||||||||
Class A | 1,205,494 | $ | 20,836,098 | 1,679,095 | $ | 32,113,470 | ||||||||||
Class B | 39,260 | 595,951 | 102,712 | 1,727,710 | ||||||||||||
Class C | 231,133 | 3,457,433 | 326,553 | 5,556,756 | ||||||||||||
Class Y | 123,609 | 2,150,277 | 191,884 | 3,637,247 | ||||||||||||
Class R5 | 141,555 | 2,354,943 | 222,144 | 4,183,712 | ||||||||||||
Issued as reinvestment of dividends: | ||||||||||||||||
Class A | 2,215,027 | 35,684,100 | 124,919 | 2,353,483 | ||||||||||||
Class B | 114,873 | 1,623,294 | — | — | ||||||||||||
Class C | 114,861 | 1,624,132 | — | — | ||||||||||||
Class Y | 33,655 | 542,517 | 2,680 | 50,544 | ||||||||||||
Class R5 | 38,004 | 609,207 | 3,330 | 62,538 | ||||||||||||
Automatic conversion of Class B shares to Class A shares: | ||||||||||||||||
Class A | 267,381 | 4,592,844 | 348,022 | 6,697,374 | ||||||||||||
Class B | (323,642 | ) | (4,592,844 | ) | (395,239 | ) | (6,697,374 | ) | ||||||||
Reacquired:(b) | ||||||||||||||||
Class A | (5,084,143 | ) | (87,729,030 | ) | (5,529,361 | ) | (105,116,370 | ) | ||||||||
Class B | (173,772 | ) | (2,876,249 | ) | (343,739 | ) | (5,776,380 | ) | ||||||||
Class C | (391,865 | ) | (5,893,196 | ) | (453,901 | ) | (7,387,100 | ) | ||||||||
Class Y | (165,677 | ) | (2,841,388 | ) | (199,107 | ) | (3,856,951 | ) | ||||||||
Class R5 | (308,651 | ) | (5,348,893 | ) | (437,752 | ) | (8,394,059 | ) | ||||||||
Net increase (decrease) in share activity | (1,922,898 | ) | $ | (35,210,804 | ) | (4,357,760 | ) | $ | (80,845,400 | ) | ||||||
| (a) | There are entities that are record owners of more than 5% of the outstanding shares of the Fund and in the aggregate own 32% of the outstanding shares of the Fund. IDI has an agreement with these entities to sell Fund shares. The Fund, Invesco and/or Invesco affiliates may make payments to these entities, which are considered to be related to the Fund, for providing services to the Fund, Invesco and/or Invesco affiliates including but not limited to services such as securities brokerage, distribution, third party record keeping and account servicing. The Fund has no knowledge as to whether all or any portion of the shares owned of record by these entities are also owned beneficially. |
| (b) | Net of redemption fees of $1,482 and $17,417 allocated among the classes based on relative net assets of each class for the years ended October 31, 2012 and 2011, respectively. |
19 Invesco Global Small & Mid Cap Growth Fund
NOTE 11 — Financial Highlights
The following schedule presents financial highlights for a share of the Fund outstanding throughout the periods indicated.
| Net asset value, beginning of period | Net (loss) (a) | Net gains (losses) on securities (both realized and unrealized) | Total from investment operations | Dividends from net investment income | Distributions from net realized gains | Total distributions | Net asset value, end of period(b) | Total return(c) | Net assets, end of period (000s omitted) | Ratio of expenses to average net assets with fee waivers and/or expenses absorbed | Ratio of expenses to average net assets without fee waivers and/or expenses absorbed | Ratio of net investment income (loss) to average net assets | Portfolio turnover(d) | |||||||||||||||||||||||||||||||||||||||||||
Class A |
| |||||||||||||||||||||||||||||||||||||||||||||||||||||||
Year ended 10/31/12 | $ | 17.93 | $ | 0.17 | $ | 1.10 | $ | 1.27 | $ | (0.24 | ) | $ | (1.09 | ) | $ | (1.33 | ) | $ | 17.87 | 7.94 | % | $ | 482,051 | 1.42 | %(e) | 1.43 | %(e) | 1.00 | %(e) | 37 | % | |||||||||||||||||||||||||
Year ended 10/31/11 | 18.57 | 0.18 | (0.74 | ) | (0.56 | ) | (0.08 | ) | — | (0.08 | ) | 17.93 | (3.05 | ) | 508,794 | 1.40 | 1.41 | 0.95 | 58 | |||||||||||||||||||||||||||||||||||||
Year ended 10/31/10 | 14.79 | 0.06 | 3.78 | 3.84 | (0.06 | ) | — | (0.06 | ) | 18.57 | 26.07 | 589,712 | 1.45 | 1.46 | 0.37 | 39 | ||||||||||||||||||||||||||||||||||||||||
Year ended 10/31/09 | 12.87 | 0.05 | 3.07 | 3.12 | (0.15 | ) | (1.05 | ) | (1.20 | ) | 14.79 | 28.24 | 521,223 | 1.61 | 1.62 | 0.40 | 54 | |||||||||||||||||||||||||||||||||||||||
Year ended 10/31/08 | 29.51 | 0.15 | (13.09 | ) | (12.94 | ) | (0.10 | ) | (3.60 | ) | (3.70 | ) | 12.87 | (49.68 | ) | 464,060 | 1.45 | 1.46 | 0.70 | 74 | ||||||||||||||||||||||||||||||||||||
Class B |
| |||||||||||||||||||||||||||||||||||||||||||||||||||||||
Year ended 10/31/12 | 15.74 | 0.04 | 0.96 | 1.00 | (0.08 | ) | (1.09 | ) | (1.17 | ) | 15.57 | 7.12 | 17,529 | 2.17 | (e) | 2.18 | (e) | 0.25 | (e) | 37 | ||||||||||||||||||||||||||||||||||||
Year ended 10/31/11 | 16.36 | 0.03 | (0.65 | ) | (0.62 | ) | — | — | — | 15.74 | (3.79 | ) | 23,124 | 2.15 | 2.16 | 0.20 | 58 | |||||||||||||||||||||||||||||||||||||||
Year ended 10/31/10 | 13.07 | (0.05 | ) | 3.34 | 3.29 | — | — | — | 16.36 | 25.17 | 34,439 | 2.20 | 2.21 | (0.38 | ) | 39 | ||||||||||||||||||||||||||||||||||||||||
Year ended 10/31/09 | 11.43 | (0.04 | ) | 2.73 | 2.69 | — | (1.05 | ) | (1.05 | ) | 13.07 | 27.33 | 38,709 | 2.36 | 2.37 | (0.35 | ) | 54 | ||||||||||||||||||||||||||||||||||||||
Year ended 10/31/08 | 26.73 | (0.01 | ) | (11.69 | ) | (11.70 | ) | — | (3.60 | ) | (3.60 | ) | 11.43 | (50.07 | ) | 44,392 | 2.20 | 2.21 | (0.05 | ) | 74 | |||||||||||||||||||||||||||||||||||
Class C |
| |||||||||||||||||||||||||||||||||||||||||||||||||||||||
Year ended 10/31/12 | 15.75 | 0.04 | 0.96 | 1.00 | (0.08 | ) | (1.09 | ) | (1.17 | ) | 15.58 | 7.11 | 22,401 | 2.17 | (e) | 2.18 | (e) | 0.25 | (e) | 37 | ||||||||||||||||||||||||||||||||||||
Year ended 10/31/11 | 16.37 | 0.03 | (0.65 | ) | (0.62 | ) | — | — | — | 15.75 | (3.79 | ) | 23,368 | 2.15 | 2.16 | 0.20 | 58 | |||||||||||||||||||||||||||||||||||||||
Year ended 10/31/10 | 13.08 | (0.05 | ) | 3.34 | 3.29 | — | — | — | 16.37 | 25.15 | 26,369 | 2.20 | 2.21 | (0.38 | ) | 39 | ||||||||||||||||||||||||||||||||||||||||
Year ended 10/31/09 | 11.43 | (0.04 | ) | 2.74 | 2.70 | — | (1.05 | ) | (1.05 | ) | 13.08 | 27.41 | 20,802 | 2.36 | 2.37 | (0.35 | ) | 54 | ||||||||||||||||||||||||||||||||||||||
Year ended 10/31/08 | 26.74 | (0.01 | ) | (11.70 | ) | (11.71 | ) | — | (3.60 | ) | (3.60 | ) | 11.43 | (50.09 | ) | 19,690 | 2.20 | 2.21 | (0.05 | ) | 74 | |||||||||||||||||||||||||||||||||||
Class Y |
| |||||||||||||||||||||||||||||||||||||||||||||||||||||||
Year ended 10/31/12 | 18.00 | 0.22 | 1.09 | 1.31 | (0.30 | ) | (1.09 | ) | (1.39 | ) | 17.92 | 8.18 | 7,406 | 1.17 | (e) | 1.18 | (e) | 1.25 | (e) | 37 | ||||||||||||||||||||||||||||||||||||
Year ended 10/31/11 | 18.64 | 0.23 | (0.75 | ) | (0.52 | ) | (0.12 | ) | — | (0.12 | ) | 18.00 | (2.81 | ) | 7,589 | 1.15 | 1.16 | 1.20 | 58 | |||||||||||||||||||||||||||||||||||||
Year ended 10/31/10 | 14.84 | 0.10 | 3.80 | 3.90 | (0.10 | ) | — | (0.10 | ) | 18.64 | 26.38 | 7,944 | 1.20 | 1.21 | 0.62 | 39 | ||||||||||||||||||||||||||||||||||||||||
Year ended 10/31/09 | 12.87 | 0.09 | 3.09 | 3.18 | (0.16 | ) | (1.05 | ) | (1.21 | ) | 14.84 | 28.70 | 4,715 | 1.36 | 1.37 | 0.65 | 54 | |||||||||||||||||||||||||||||||||||||||
Year ended 10/31/08(f) | 15.38 | 0.01 | (2.52 | ) | (2.51 | ) | — | — | — | 12.87 | (16.32 | ) | 1,580 | 1.24 | (g) | 1.26 | (g) | 0.91 | (g) | 74 | ||||||||||||||||||||||||||||||||||||
Class R5 |
| |||||||||||||||||||||||||||||||||||||||||||||||||||||||
Year ended 10/31/12 | 17.95 | 0.25 | 1.10 | 1.35 | (0.36 | ) | (1.09 | ) | (1.45 | ) | 17.85 | 8.46 | 20,481 | 0.94 | (e) | 0.95 | (e) | 1.48 | (e) | 37 | ||||||||||||||||||||||||||||||||||||
Year ended 10/31/11 | 18.59 | 0.27 | (0.74 | ) | (0.47 | ) | (0.17 | ) | — | (0.17 | ) | 17.95 | (2.57 | ) | 22,918 | 0.91 | 0.92 | 1.44 | 58 | |||||||||||||||||||||||||||||||||||||
Year ended 10/31/10 | 14.81 | 0.15 | 3.78 | 3.93 | (0.15 | ) | — | (0.15 | ) | 18.59 | 26.72 | 27,683 | 0.92 | 0.93 | 0.90 | 39 | ||||||||||||||||||||||||||||||||||||||||
Year ended 10/31/09 | 12.93 | 0.13 | 3.07 | 3.20 | (0.27 | ) | (1.05 | ) | (1.32 | ) | 14.81 | 29.20 | 23,859 | 0.96 | 0.97 | 1.05 | 54 | |||||||||||||||||||||||||||||||||||||||
Year ended 10/31/08 | 29.53 | 0.23 | (13.12 | ) | (12.89 | ) | (0.11 | ) | (3.60 | ) | (3.71 | ) | 12.93 | (49.46 | ) | 17,593 | 0.93 | 0.94 | 1.22 | 74 | ||||||||||||||||||||||||||||||||||||
| (a) | Calculated using average shares outstanding. |
| (b) | Includes redemption fees added to shares of beneficial interest which were less than $0.005 per share. |
| (c) | Includes adjustments in accordance with accounting principles generally accepted in the United States of America and as such, the net asset value for financial reporting purposes and the returns based upon those net asset values may differ from the net asset value and returns for shareholder transactions. Does not include sales charges and is not annualized for periods less than one year, if applicable. |
| (d) | Portfolio turnover is calculated at the fund level and is not annualized for periods less than one year, if applicable. |
| (e) | Ratios are based on average daily net assets (000’s) of $493,948, $20,065, $22,482, $7,560 and $22,094 for Class A, Class B, Class C, Class Y and Class R5 shares, respectively. |
| (f) | Commencement date of October 3, 2008. |
| (g) | Annualized. |
20 Invesco Global Small & Mid Cap Growth Fund
Report of Independent Registered Public Accounting Firm
To the Board of Trustees of AIM International Mutual Funds (Invesco International Mutual Funds)
and Shareholders of Invesco Global Small & Mid Cap Growth Fund:
In our opinion, the accompanying statement of assets and liabilities, including the schedule of investments, and the related statements of operations and of changes in net assets and the financial highlights present fairly, in all material respects, the financial position of Invesco Global Small & Mid Cap Growth Fund (one of the funds constituting AIM International Mutual Funds (Invesco International Mutual Funds), hereafter referred to as the “Fund”) at October 31, 2012, the results of its operations for the year then ended, the changes in its net assets for each of the two years in the period then ended and the financial highlights for each of the five years in the period then ended, in conformity with accounting principles generally accepted in the United States of America. These financial statements and financial highlights (hereafter referred to as “financial statements”) are the responsibility of the Fund’s management; our responsibility is to express an opinion on these financial statements based on our audits. We conducted our audits of these financial statements in accordance with the standards of the Public Company Accounting Oversight Board (United States). Those standards require that we plan and perform the audit to obtain reasonable assurance about whether the financial statements are free of material misstatement. An audit includes examining, on a test basis, evidence supporting the amounts and disclosures in the financial statements, assessing the accounting principles used and significant estimates made by management, and evaluating the overall financial statement presentation. We believe that our audits, which included confirmation of securities at October 31, 2012 by correspondence with the custodian and brokers, provide a reasonable basis for our opinion.
PRICEWATERHOUSECOOPERS LLP
December 21, 2012
Houston, Texas
21 Invesco Global Small & Mid Cap Growth Fund
Calculating your ongoing Fund expenses
Example
As a shareholder of the Fund, you incur two types of costs: (1) transaction costs, which may include sales charges (loads) on purchase payments or contingent deferred sales charges on redemptions, and redemption fees, if any; and (2) ongoing costs, including management fees, distribution and/or service (12b-1) fees, and other Fund expenses. This example is intended to help you understand your ongoing costs (in dollars) of investing in the Fund and to compare these costs with ongoing costs of investing in other mutual funds. The example is based on an investment of $1,000 invested at the beginning of the period and held for the entire period May 1, 2012 through October 31, 2012.
Actual expenses
The table below provides information about actual account values and actual expenses. You may use the information in this table, together with the amount you invested, to estimate the expenses that you paid over the period. Simply divide your account value by $1,000 (for example, an $8,600 account value divided by $1,000 = 8.6), then multiply the result by the number in the table under the heading entitled “Actual Expenses Paid During Period” to estimate the expenses you paid on your account during this period.
Hypothetical example for comparison purposes
The table below also provides information about hypothetical account values and hypothetical expenses based on the Fund’s actual expense ratio and an assumed rate of return of 5% per year before expenses, which is not the Fund’s actual return.
The hypothetical account values and expenses may not be used to estimate the actual ending account balance or expenses you paid for the period. You may use this information to compare the ongoing costs of investing in the Fund and other funds. To do so, compare this 5% hypothetical example with the 5% hypothetical examples that appear in the shareholder reports of the other funds.
Please note that the expenses shown in the table are meant to highlight your ongoing costs only and do not reflect any transaction costs, such as sales charges (loads) on purchase payments, contingent deferred sales charges on redemptions, and redemption fees, if any. Therefore, the hypothetical information is useful in comparing ongoing costs only, and will not help you determine the relative total costs of owning different funds. In addition, if these transaction costs were included, your costs would have been higher.
| Class | Beginning Account Value (05/01/12) | ACTUAL | HYPOTHETICAL (5% annual return before expenses) | Annualized Expense Ratio | ||||||||||||||||||||
| Ending Account Value (10/31/12)1 | Expenses Paid During Period2 | Ending Account Value (10/31/12) | Expenses Paid During Period2 | |||||||||||||||||||||
A | $ | 1,000.00 | $ | 995.00 | $ | 6.97 | $ | 1,018.15 | $ | 7.05 | 1.39 | % | ||||||||||||
B | 1,000.00 | 991.10 | 10.71 | 1,014.38 | 10.84 | 2.14 | ||||||||||||||||||
C | 1,000.00 | 991.10 | 10.71 | 1,014.38 | 10.84 | 2.14 | ||||||||||||||||||
Y | 1,000.00 | 996.10 | 5.72 | 1,019.41 | 5.79 | 1.14 | ||||||||||||||||||
R5 | 1,000.00 | 997.20 | 4.67 | 1,020.46 | 4.72 | 0.93 | ||||||||||||||||||
| 1 | The actual ending account value is based on the actual total return of the Fund for the period May 1, 2012 through October 31, 2012, after actual expenses and will differ from the hypothetical ending account value which is based on the Fund’s expense ratio and a hypothetical annual return of 5% before expenses. |
| 2 | Expenses are equal to the Fund’s annualized expense ratio as indicated above multiplied by the average account value over the period, multiplied by 184/366 to reflect the most recent fiscal half year. |
22 Invesco Global Small & Mid Cap Growth Fund
Approval of Investment Advisory and Sub-Advisory Contracts
The Board of Trustees (the Board) of AIM International Mutual Funds (Invesco International Mutual Funds) is required under the Investment Company Act of 1940, as amended, to approve annually the renewal of the Invesco Global Small & Mid Cap Growth Fund (the Fund) investment advisory agreement with Invesco Advisers, Inc. (Invesco Advisers) and the Master Intergroup Sub-Advisory Contract for Mutual Funds (the sub-advisory contracts) with Invesco Asset Management Deutschland GmbH, Invesco Asset Management Limited, Invesco Asset Management (Japan) Limited, Invesco Australia Limited, Invesco Hong Kong Limited, Invesco Senior Secured Management, Inc. and Invesco Canada Ltd. (collectively, the Affiliated Sub-Advisers). During contract renewal meetings held on June 19-20, 2012, the Board as a whole, and the disinterested or “independent” Trustees, who comprise 80% of the Board, voting separately, approved the continuance of the Fund’s investment advisory agreement and the sub-advisory contracts for another year, effective July 1, 2012. In doing so, the Board considered the process that it follows in reviewing and approving the Fund’s investment advisory agreement and sub-advisory contracts and the information that it is provided. The Board determined that the Fund’s investment advisory agreement and the sub-advisory contracts are in the best interests of the Fund and its shareholders and the compensation to Invesco Advisers and the Affiliated Sub-Advisers under the agreements is fair and reasonable.
The Board’s Fund Evaluation Process
The Board’s Investments Committee has established three Sub-Committees, each of which is primarily responsible for overseeing the management of a number of the series portfolios of the funds advised by Invesco Advisers (the Invesco Funds). The Sub-Committees meet throughout the year to review the performance of their assigned funds, including reviewing materials prepared under the direction of the independent Senior Officer, an officer of the Invesco Funds who reports directly to the independent Trustees. Over the course of each year, the Sub-Committees meet with portfolio managers for their assigned Invesco Funds and other members of management to review the performance, investment objective(s), policies, strategies, limitations and investment risks of these funds. The Sub-Committees meet regularly and at designated contract renewal meetings each year to conduct a review of the performance, fees, expenses and other matters related to their assigned Invesco Funds. Each Sub-Committee recommends to the Investments Committee, which in turn recommends to the full Board, whether and on what terms to approve the continuance of each Invesco Fund’s
investment advisory agreement and sub-advisory contracts for another year.
During the contract renewal process, the Trustees receive comparative performance and fee data regarding the Invesco Funds prepared by Invesco Advisers and an independent company, Lipper Inc. (Lipper). The Trustees also receive an independent written evaluation from the Senior Officer. The Senior Officer’s evaluation is prepared as part of his responsibility to manage the process by which the Invesco Funds’ proposed management fees are negotiated during the annual contract renewal process to ensure they are negotiated in a manner that is at arms’ length and reasonable. The independent Trustees are assisted in their annual evaluation of the Fund’s investment advisory agreement by the Senior Officer and by independent legal counsel. In addition to meetings with Invesco Advisers and fund counsel, the independent Trustees also discuss the continuance of the investment advisory agreement and sub-advisory contracts in private sessions with the Senior Officer and independent legal counsel.
In evaluating the fairness and reasonableness of the Fund’s investment advisory agreement and sub-advisory contracts, the Board considered, among other things, the factors discussed below. The Trustees recognized that the advisory fees for the Invesco Funds include advisory fees that are the result of years of review and negotiation between the Trustees and Invesco Advisers as well as advisory fees previously approved by a different board that, at the time, was responsible for overseeing Morgan Stanley and Van Kampen funds, which have become Invesco Funds following the acquisition of the retail mutual fund business of Morgan Stanley. The Trustees’ deliberations and conclusions in a particular year may be based in part on their deliberations and conclusions regarding these same arrangements throughout the year and in prior years. One Trustee may have weighed a particular piece of information or factor differently than another Trustee.
The discussion below serves as the Senior Officer’s independent written evaluation with respect to the Fund’s investment advisory agreement as well as a discussion of the material factors and related conclusions that formed the basis for the Board’s approval of the Fund’s investment advisory agreement and sub-advisory contracts. Unless otherwise stated, this information is current as of June 20, 2012, and may not reflect consideration of factors that became known to the Board after that date, including, for example, changes to the Fund’s performance, advisory fees, expense limitations and/or fee waivers.
Factors and Conclusions and Summary of Independent Written Fee Evaluation
| A. | Nature, Extent and Quality of Services Provided by Invesco Advisers and the Affiliated Sub-Advisers |
The Board reviewed the advisory services provided to the Fund by Invesco Advisers under the Fund’s investment advisory agreement, the performance of Invesco Advisers in providing these services, and the credentials and experience of the officers and employees of Invesco Advisers who provide these services, including the Fund’s portfolio manager or managers, with whom the Sub-Committees met during the year. The Board’s review of the qualifications of Invesco Advisers to provide advisory services included the Board’s consideration of Invesco Advisers’ performance and investment process oversight, independent credit analysis and investment risk management.
In determining whether to continue the Fund’s investment advisory agreement, the Board considered the prior relationship between Invesco Advisers and the Fund, as well as the Board’s knowledge of Invesco Advisers’ operations, and concluded that it is beneficial to maintain the current relationship, in part because of such prior relationship and knowledge. The Board also considered services that Invesco Advisers and its affiliates provide to the Invesco Funds such as various back office support functions, equity and fixed income trading operations, internal audit, distribution and legal and compliance. The Board concluded that the nature, extent and quality of the services provided to the Fund by Invesco Advisers are appropriate and satisfactory and consistent with the terms of the Fund’s investment advisory agreement.
The Board reviewed the services provided by the Affiliated Sub-Advisers under the sub-advisory contracts and the credentials and experience of the officers and employees of the Affiliated Sub-Advisers who provide these services. The Board noted that the Affiliated Sub-Advisers have offices and personnel that are located in financial centers around the world. As a result, the Affiliated Sub-Advisers can provide research and investment analysis on the markets and economies of various countries in which the Fund invests and make recommendations on securities of companies located in such countries. The Board concluded that the sub-advisory contracts benefit the Fund and its shareholders by permitting Invesco Advisers to use the resources and talents of the Affiliated Sub-Advisers in managing the Fund. The Board concluded that the nature, extent and quality of the services provided by the Affiliated Sub-Advisers are appropriate and satisfactory and consistent with the terms of the Fund’s sub-advisory contracts.
23 Invesco Global Small & Mid Cap Growth Fund
| B. | Fund Performance |
The Board considered Fund performance as a relevant factor in considering whether to approve the investment advisory agreement. The Board did not view Fund performance as a relevant factor in considering whether to approve the sub-advisory contracts for the Fund, as no Affiliated Sub-Adviser currently manages assets of the Fund.
The Board compared the Fund’s performance during the past one, three and five calendar years to the performance of funds in the Lipper performance universe and against the Lipper Global Small/Mid-Cap Funds Index. The Board noted that performance of Class A shares of the Fund was in the first quintile of the performance universe for the one year period, the fourth quintile for the three year period and the third quintile for the five year period (the first quintile being the best performing funds and the fifth quintile being the worst performing funds). The Board noted that performance of the Class A shares of the Fund was above the performance of the Index for the one, three and five year periods. The Trustees also reviewed more recent Fund performance and this review did not change their conclusions.
| C. | Advisory and Sub-Advisory Fees and Fee Waivers |
The Board compared the Fund’s contractual advisory fee rate to the contractual advisory fee rates of funds in the Fund’s Lipper expense group at a common asset level. The Board noted that the contractual advisory fee rate for Class A shares of the Fund was below the median contractual advisory fee rate of funds in the expense group. The Board also reviewed the methodology used by Lipper in providing expense group information, which includes using audited financial data from the most recent annual report of each fund in the expense group that was publicly available as of the end of the past calendar year and including only one fund per investment adviser. The Board noted that comparative data is as of varying dates, which may affect the comparability of data during times of market volatility.
The Board also compared the Fund’s effective fee rate (the advisory fee after advisory fee waivers and before expense limitations/waivers) to the advisory fee rates of other funds advised by Invesco Advisers and its affiliates with investment strategies comparable to those of the Fund. The Board noted that Invesco Advisers sub-advises an off-shore fund with comparable investment strategies, which had an effective fee rate higher than the Fund’s.
The Board also considered the services provided by the Affiliated Sub-Advisers pursuant to the sub-advisory contracts, as well as the allocation of fees between Invesco Advisers and the Affiliated Sub-Advisers pursuant to the sub-advisory contracts. The Board noted that Invesco Advisers provides services to sub-advised Invesco Funds, including oversight of the Affiliated Sub-Advisers as well as the additional services described above other than
day-to-day portfolio management. The Board also noted that the sub-advisory fees have no direct effect on the Fund or its shareholders, as they are paid by Invesco Advisers to the Affiliated Sub-Advisers.
Based upon the information and considerations described above, the Board concluded that the Fund’s advisory and sub-advisory fees are fair and reasonable.
| D. | Economies of Scale and Breakpoints |
The Board considered the extent to which there are economies of scale in the provision of advisory services to the Fund. The Board also considered whether the Fund benefits from economies of scale through contractual breakpoints in the Fund’s advisory fee schedule and were assisted in their review by a report from the Senior Officer. The Board also noted that the Fund shares directly in economies of scale through lower fees charged by third party service providers based on the combined size of the Invesco Funds and other clients advised by Invesco Advisers. The Board noted that Invesco Advisers proposes sharing economies of scale in administration expenses by lowering per class administrative fees.
| E. | Profitability and Financial Resources |
The Board reviewed information from Invesco Advisers concerning the costs of the advisory and other services that Invesco Advisers and its affiliates provide to the Fund and the profitability of Invesco Advisers and its affiliates in providing these services for the year ended December 31, 2011. The Board reviewed with Invesco Advisers the methodology used to prepare the profitability information. The Board considered the profitability of Invesco Advisers in connection with managing the Fund and the Invesco Funds. The Board noted that Invesco Advisers continues to operate at a net profit from services Invesco Advisers and its subsidiaries provide to the Invesco Funds and the Fund. The Board did not deem the level of profits realized by Invesco Advisers and its affiliates from providing services to the Fund to be excessive given the nature, quality and extent of the services provided to the Invesco Funds. The Board received and accepted information from Invesco Advisers demonstrating that Invesco Advisers and each Affiliated Sub-Adviser are financially sound and have the resources necessary to perform their obligations under the investment advisory agreement and sub-advisory contracts.
| F. | Collateral Benefits to Invesco Advisers and its Affiliates |
The Board considered various other benefits received by Invesco Advisers and its affiliates from the relationship with the Fund, including the fees received for their provision of administrative, transfer agency and distribution services to the Fund. The Board considered the performance of Invesco Advisers and its affiliates in providing these services and the organizational structure employed to provide these services. The Board also considered that these services are provided to the Fund pursuant to written contracts that are reviewed
and approved on an annual basis by the Board; that the services are required for the operation of the Fund; that Invesco Advisers and its affiliates can provide services, the nature and quality of which are at least equal to those provided by others offering the same or similar services; and that the fees for such services are fair and reasonable in light of the usual and customary charges by others for services of the same nature and quality.
The Board considered the benefits realized by Invesco Advisers and the Affiliated Sub-Advisers as a result of portfolio brokerage transactions executed through “soft dollar” arrangements. The Board noted that soft dollar arrangements shift the payment obligation for research services from Invesco Advisers and the Affiliated Sub-Advisers to the Invesco Funds and therefore may reduce Invesco Advisers’ and the Affiliated Sub-Advisers’ expenses. The Board also considered periodic reports from the Chief Compliance Officer of the Invesco Funds demonstrating that these arrangements are consistent with regulatory requirements. The Board did not deem the soft dollar arrangements to be inappropriate.
The Board considered that the Fund’s uninvested cash and cash collateral from any securities lending arrangements may be invested in money market funds advised by Invesco Advisers pursuant to procedures approved by the Board. The Board noted that Invesco Advisers receives advisory fees from these affiliated money market funds attributable to such investments, although Invesco Advisers has contractually agreed to waive through varying periods the advisory fees payable by the Invesco Funds. The waiver is in an amount equal to 100% of the net advisory fee Invesco Advisers receives from the affiliated money market funds with respect to the Fund’s investment in the affiliated money market funds of uninvested cash, but not cash collateral. The Board concluded that the Fund’s investment of uninvested cash and cash collateral from any securities lending arrangements in the affiliated money market funds is in the best interests of the Fund and its shareholders.
The Board also considered use of an affiliated broker to execute certain trades for the Fund and that such trades are executed in compliance with rules under the Investment Company Act of 1940, as amended.
24 Invesco Global Small & Mid Cap Growth Fund
Tax Information
Form 1099-DIV, Form 1042-S and other year–end tax information provide shareholders with actual calendar year amounts that should be included in their tax returns. Shareholders should consult their tax advisors.
The following distribution information is being provided as required by the Internal Revenue Code or to meet a specific state’s requirement.
The Fund designates the following amounts or, if subsequently determined to be different, the maximum amount allowable for its fiscal year ended October 31, 2012:
Federal and State Income Tax | ||||
Long-Term Capital Gain Dividends | $ | 35,696,739 | ||
Qualified Dividend Income * | 100.00 | % | ||
Corporate Dividends Received Deduction * | 20.04 | % | ||
Foreign Tax Credit | $ | 0.0328 | ||
Foreign Source Income | $ | 0.4250 | ||
| * | The above percentages are based on ordinary income dividends paid to shareholders during the Fund’s fiscal year. |
25 Invesco Global Small & Mid Cap Growth Fund
Trustees and Officers
The address of each trustee and officer is AIM International Mutual Funds (Invesco International Mutual Funds) (the “Trust”), 11 Greenway Plaza, Suite 1000, Houston, Texas 77046-1173. The trustees serve for the life of the Trust, subject to their earlier death, incapacitation, resignation, retirement or removal as more specifically provided in the Trust’s organizational documents. Each officer serves for a one year term or until their successors are elected and qualified. Column two below includes length of time served with predecessor entities, if any.
| Name, Year of Birth and Position(s) Held with the Trust | Trustee and/ or Officer Since | Principal Occupation(s) During Past 5 Years | Number of Complex Overseen by Trustee | Other Directorship(s) Held by Trustee During Past 5 Years | ||||
| Interested Persons | ||||||||
| Martin L. Flanagan1 — 1960 Trustee | 2007 | Executive Director, Chief Executive Officer and President, Invesco Ltd. (ultimate parent of Invesco and a global investment management firm); Advisor to the Board, Invesco Advisers, Inc. (formerly known as Invesco Institutional (N.A.), Inc.); Trustee, The Invesco Funds; Vice Chair, Investment Company Institute; and Member of Executive Board, SMU Cox School of Business
Formerly: Chairman, Invesco Advisers, Inc. (registered investment adviser); Director, Chairman, Chief Executive Officer and President, IVZ Inc. (holding company), INVESCO Group Services, Inc. (service provider) and Invesco North American Holdings, Inc. (holding company); Director, Chief Executive Officer and President, Invesco Holding Company Limited (parent of Invesco and a global investment management firm); Director, Invesco Ltd.; Chairman, Investment Company Institute and President, Co-Chief Executive Officer, Co-President, Chief Operating Officer and Chief Financial Officer, Franklin Resources, Inc. (global investment management organization) | 123 | None | ||||
Philip A. Taylor2 — 1954 Trustee, President and Principal Executive Officer | 2006 | Head of North American Retail and Senior Managing Director, Invesco Ltd.; Director, Co-Chairman, Co-President and Co-Chief Executive Officer, Invesco Advisers, Inc. (formerly known as Invesco Institutional (N.A.), Inc.) (registered investment adviser); Director, Chairman, Chief Executive Officer and President, Invesco Management Group, Inc. (formerly known as Invesco Aim Management Group, Inc.) (financial services holding company); Director and President, INVESCO Funds Group, Inc. (registered investment adviser and registered transfer agent); Director and Chairman, Invesco Investment Services, Inc. (formerly known as Invesco Aim Investment Services, Inc.) (registered transfer agent) and IVZ Distributors, Inc. (formerly known as INVESCO Distributors, Inc.) (registered broker dealer); Director, President and Chairman, Invesco Inc. (holding company) and Invesco Canada Holdings Inc. (holding company); Chief Executive Officer, Invesco Corporate Class Inc. (corporate mutual fund company) and Invesco Canada Fund Inc. (corporate mutual fund company); Director, Chairman and Chief Executive Officer, Invesco Canada Ltd. (formerly known as Invesco Trimark Ltd./Invesco Trimark Ltèe) (registered investment adviser and registered transfer agent); Trustee, President and Principal Executive Officer, The Invesco Funds (other than AIM Treasurer’s Series Trust (Invesco Treasurer’s Series Trust) and Short-Term Investments Trust); Trustee and Executive Vice President, The Invesco Funds (AIM Treasurer’s Series Trust (Invesco Treasurer’s Series Trust) and Short-Term Investments Trust only); Director, Invesco Investment Advisers LLC (formerly known as Van Kampen Asset Management); Director, Chief Executive Officer and President, Van Kampen Exchange Corp.
Formerly: Director and Chairman, Van Kampen Investor Services Inc.; Director, Chief Executive Officer and President, 1371 Preferred Inc. (holding company); and Van Kampen Investments Inc.; Director and President, AIM GP Canada Inc. (general partner for limited partnerships); and Van Kampen Advisors, Inc.; Director and Chief Executive Officer, Invesco Trimark Dealer Inc. (registered broker dealer); Director, Invesco Distributors, Inc. (formerly known as Invesco Aim Distributors, Inc.) (registered broker dealer); Manager, Invesco PowerShares Capital Management LLC; Director, Chief Executive Officer and President, Invesco Advisers, Inc.; Director, Chairman, Chief Executive Officer and President, Invesco Aim Capital Management, Inc.; President, Invesco Trimark Dealer Inc. and Invesco Trimark Ltd./Invesco Trimark Ltèe; Director and President, AIM Trimark Corporate Class Inc. and AIM Trimark Canada Fund Inc.; Senior Managing Director, Invesco Holding Company Limited; Trustee and Executive Vice President, Tax-Free Investments Trust; Director and Chairman, Fund Management Company (former registered broker dealer); President and Principal Executive Officer, The Invesco Funds (AIM Treasurer’s Series Trust (Invesco Treasurer’s Series Trust), Short-Term Investments Trust and Tax-Free Investments Trust only); President, AIM Trimark Global Fund Inc. and AIM Trimark Canada Fund Inc. | 123 | None | ||||
Wayne W. Whalen3 — 1939 Trustee | 2010 | Of Counsel, and prior to 2010, partner in the law firm of Skadden, Arps, Slate, Meagher & Flom LLP, legal counsel to certain funds in the Fund Complex
| 136 | Director of the Mutual Fund Directors Forum, a nonprofit membership organization for investment directors; Chairman and Director of the Abraham Lincoln Presidential Library Foundation; and Director of the Stevenson Center for Democracy |
| 1 | Mr. Flanagan is considered an interested person of the Trust because he is an officer of the adviser to the Trust, and an officer and a director of Invesco Ltd., ultimate parent of the adviser to the Trust. |
| 2 | Mr. Taylor is considered an interested person of the Trust because he is an officer and a director of the adviser to, and a director of the principal underwriter of, the Trust. |
| 3 | Mr. Whalen is considered an “interested person” (within the meaning of Section 2(a)(19) of the 1940 Act) of certain Funds in the Invesco Fund Complex by reason of he and his firm currently providing legal services as legal counsel to such Funds in the Invesco Fund Complex. |
T-1 Invesco Global Small & Mid Cap Growth Fund
Trustees and Officers—(continued)
| Name, Year of Birth and Position(s) Held with the Trust | Trustee and/ or Officer Since | Principal Occupation(s) During Past 5 Years | Number of Funds in Fund Complex Overseen by Trustee | Other Directorship(s) Held by Trustee During Past 5 Years | ||||
| Independent Trustees | ||||||||
Bruce L. Crockett — 1944 Trustee and Chair | 1992 | Chairman, Crockett Technologies Associates (technology consulting company)
Formerly: Director, Captaris (unified messaging provider); Director, President and Chief Executive Officer COMSAT Corporation; and Chairman, Board of Governors of INTELSAT (international communications company) | 123 | ACE Limited (insurance company); and Investment Company Institute | ||||
David C. Arch — 1945 Trustee | 2010 | Retired.
Formerly: Chairman and Chief Executive Officer of Blistex Inc., (consumer health care products manufacturer) | 136 | Member of the Heartland Alliance Advisory Board, a nonprofit organization serving human needs based in Chicago. Board member of the Illinois Manufacturers’ Association. Member of the Board of Visitors, Institute for the Humanities, University of Michigan | ||||
Frank S. Bayley — 1939 Trustee | 2001 | Retired
Formerly: Director, Badgley Funds, Inc. (registered investment company) (2 portfolios) and Partner, law firm of Baker & McKenzie | 123 | Director and Chairman, C.D. Stimson Company (a real estate investment company) | ||||
James T. Bunch — 1942 Trustee | 2003 | Managing Member, Grumman Hill Group LLC (family office private equity management)
Formerly: Founder, Green, Manning & Bunch Ltd. (investment banking firm)(1988-2010); Executive Committee, United States Golf Association; and Director, Policy Studies, Inc. and Van Gilder Insurance Corporation | 123 | Chairman, Board of Governors, Western Golf Association, Chairman-elect, Evans Scholars Foundation and Director, Denver Film Society | ||||
Rodney F. Dammeyer — 1940 Trustee | 2010 | Chairman of CAC, LLC, (private company offering capital investment and management advisory services)
Formerly: Prior to January 2004, Director of TeleTech Holdings Inc.; Prior to 2002, Director of Arris Group, Inc.; Prior to 2001, Managing Partner at Equity Group Corporate Investments. Prior to 1995, Vice Chairman of Anixter International. Prior to 1985, experience includes Senior Vice President and Chief Financial Officer of Household International, Inc., Executive Vice President and Chief Financial Officer of Northwest Industries, Inc. and Partner of Arthur Andersen & Co. | 136 | Director of Quidel Corporation and Stericycle, Inc. Prior to May 2008, Trustee of The Scripps Research Institute. Prior to February 2008, Director of Ventana Medical Systems, Inc. Prior to April 2007, Director of GATX Corporation. Prior to April 2004, Director of TheraSense, Inc. | ||||
Albert R. Dowden — 1941 Trustee | 2000 | Director of a number of public and private business corporations, including the Boss Group, Ltd. (private investment and management); Reich & Tang Funds (5 portfolios) (registered investment company); and Homeowners of America Holding Corporation/ Homeowners of America Insurance Company (property casualty company)
Formerly: Director, Continental Energy Services, LLC (oil and gas pipeline service); Director, CompuDyne Corporation (provider of product and services to the public security market) and Director, Annuity and Life Re (Holdings), Ltd. (reinsurance company); Director, President and Chief Executive Officer, Volvo Group North America, Inc.; Senior Vice President, AB Volvo; Director of various public and private corporations; Chairman, DHJ Media, Inc.; Director Magellan Insurance Company; and Director, The Hertz Corporation, Genmar Corporation (boat manufacturer), National Media Corporation; Advisory Board of Rotary Power International (designer, manufacturer, and seller of rotary power engines); and Chairman, Cortland Trust, Inc. (registered investment company) | 123 | Director of Nature’s Sunshine Products, Inc. | ||||
Jack M. Fields — 1952 Trustee | 1997 | Chief Executive Officer, Twenty First Century Group, Inc. (government affairs company); and Owner and Chief Executive Officer, Dos Angelos Ranch, L.P. (cattle, hunting, corporate entertainment), Discovery Global Education Fund (non-profit) and Cross Timbers Quail Research Ranch (non-profit)
Formerly: Chief Executive Officer, Texana Timber LP (sustainable forestry company) and member of the U.S. House of Representatives | 123 | Insperity (formerly known as Administaff) | ||||
Carl Frischling — 1937 Trustee | 1991 | Partner, law firm of Kramer Levin Naftalis and Frankel LLP | 123 | Director, Reich & Tang Funds (6 portfolios) | ||||
Prema Mathai-Davis — 1950 Trustee | 1998 | Retired
Formerly: Chief Executive Officer, YWCA of the U.S.A. | 123 | None | ||||
Larry Soll — 1942 Trustee | 2003 | Retired
Formerly: Chairman, Chief Executive Officer and President, Synergen Corp. (a biotechnology company) | 123 | None |
T-2 Invesco Global Small & Mid Cap Growth Fund
Trustees and Officers—(continued)
| Name, Year of Birth and Position(s) Held with the Trust | Trustee and/ or Officer Since | Principal Occupation(s) During Past 5 Years | Number of Funds in Fund Complex Overseen by Trustee | Other Directorship(s) Held by Trustee During Past 5 Years | ||||
| Independent Trustees—(continued) | ||||||||
Hugo F. Sonnenschein — 1940 Trustee | 2010 | Distinguished Service Professor and President Emeritus of the University of Chicago and the Adam Smith Distinguished Service Professor in the Department of Economics at the University of Chicago.
Formerly: President of the University of Chicago | 136 | Trustee of the University of Rochester and a member of its investment committee. Member of the National Academy of Sciences, the American Philosophical Society and a fellow of the American Academy of Arts and Sciences | ||||
Raymond Stickel, Jr. — 1944 Trustee | 2005 | Retired
Formerly: Director, Mainstay VP Series Funds, Inc. (25 portfolios) and Partner, Deloitte & Touche | 123 | None | ||||
| Other Officers | ||||||||
Russell C. Burk — 1958 Senior Vice President and Senior Officer | 2005 | Senior Vice President and Senior Officer, The Invesco Funds | N/A | N/A | ||||
John M. Zerr — 1962 Senior Vice President, Chief Legal Officer and Secretary | 2006 | Director, Senior Vice President, Secretary and General Counsel, Invesco Management Group, Inc. (formerly known as Invesco Aim Management Group, Inc.) and Van Kampen Exchange Corp.; Senior Vice President, Invesco Advisers, Inc. (formerly known as Invesco Institutional (N.A.), Inc.) (registered investment adviser); Senior Vice President and Secretary, Invesco Distributors, Inc. (formerly known as Invesco Aim Distributors, Inc.); Director, Vice President and Secretary, Invesco Investment Services, Inc. (formerly known as Invesco Aim Investment Services, Inc.) and IVZ Distributors, Inc. (formerly known as INVESCO Distributors, Inc.); Director and Vice President, INVESCO Funds Group, Inc.; Senior Vice President, Chief Legal Officer and Secretary, The Invesco Funds; Manager, Invesco PowerShares Capital Management LLC; Director, Secretary and General Counsel, Invesco Investment Advisers LLC (formerly known as Van Kampen Asset Management); Secretary and General Counsel, Invesco Capital Markets, Inc. (formerly known as Van Kampen Funds Inc.) and Chief Legal Officer, PowerShares Exchange-Traded Fund Trust, PowerShares Exchange-Traded Fund Trust II, PowerShares India Exchange-Traded Fund Trust and PowerShares Actively Managed Exchange-Traded Fund Trust
Formerly: Director and Secretary, Van Kampen Advisors Inc.; Director Vice President, Secretary and General Counsel Van Kampen Investor Services Inc.; Director, Invesco Distributors, Inc. (formerly known as Invesco Aim Distributors, Inc.); Director, Senior Vice President, General Counsel and Secretary, Invesco Advisers, Inc.; and Van Kampen Investments Inc.; Director, Vice President and Secretary, Fund Management Company; Director, Senior Vice President, Secretary, General Counsel and Vice President, Invesco Aim Capital Management, Inc.; Chief Operating Officer and General Counsel, Liberty Ridge Capital, Inc. (an investment adviser); Vice President and Secretary, PBHG Funds (an investment company) and PBHG Insurance Series Fund (an investment company); Chief Operating Officer, General Counsel and Secretary, Old Mutual Investment Partners (a broker-dealer); General Counsel and Secretary, Old Mutual Fund Services (an administrator) and Old Mutual Shareholder Services (a shareholder servicing center); Executive Vice President, General Counsel and Secretary, Old Mutual Capital, Inc. (an investment adviser); and Vice President and Secretary, Old Mutual Advisors Funds (an investment company) | N/A | N/A | ||||
Lisa O. Brinkley — 1959 Vice President | 2004 | Global Assurance Officer, Invesco Ltd. and Vice President, The Invesco Funds
Formerly: Chief Compliance Officer, Invesco Distributors, Inc. (formerly known as Invesco Aim Distributors, Inc.), Invesco Investment Services, Inc.(formerly known as Invesco Aim Investment Services, Inc.) and Van Kampen Investor Services Inc.; Senior Vice President, Invesco Management Group, Inc.; Senior Vice President and Chief Compliance Officer, Invesco Advisers, Inc. and The Invesco Funds; Vice President and Chief Compliance Officer, Invesco Aim Capital Management, Inc. and Invesco Distributors, Inc.; Vice President, Invesco Investment Services, Inc. and Fund Management Company | N/A | N/A | ||||
T-3 Invesco Global Small & Mid Cap Growth Fund
Trustees and Officers—(continued)
| Name, Year of Birth and Position(s) Held with the Trust | Trustee and/ or Officer Since | Principal Occupation(s) During Past 5 Years | Number of Funds in Fund Complex Overseen by Trustee | Other Directorship(s) Held by Trustee During Past 5 Years | ||||
| Other Officers—(continued) | ||||||||
Karen Dunn Kelley — 1960 Vice President | 2004 | Head of Invesco’s World Wide Fixed Income and Cash Management Group; Senior Vice President, Invesco Management Group, Inc. (formerly known as Invesco Aim Management Group, Inc.) and Invesco Advisers, Inc. (formerly known as Invesco Institutional (N.A.), Inc.) (registered investment adviser); Executive Vice President, Invesco Distributors, Inc. (formerly known as Invesco Aim Distributors, Inc.); Director, Invesco Mortgage Capital Inc., INVESCO Global Asset Management Limited, Invesco Management Company Limited and INVESCO Management S.A.; Vice President, The Invesco Funds (other than AIM Treasurer’s Series Trust (Invesco Treasurer’s Series Trust) and Short-Term Investments Trust); and President and Principal Executive Officer, The Invesco Funds (AIM Treasurer’s Series Trust (Invesco Treasurer’s Series Trust) and Short-Term Investments Trust only)
Formerly: Senior Vice President, Van Kampen Investments Inc.; Vice President, Invesco Advisers, Inc. (formerly known as Invesco Institutional (N.A.), Inc.); Director of Cash Management and Senior Vice President, Invesco Advisers, Inc. and Invesco Aim Capital Management, Inc.; President and Principal Executive Officer, Tax-Free Investments Trust; Director and President, Fund Management Company; Chief Cash Management Officer, Director of Cash Management, Senior Vice President, and Managing Director, Invesco Aim Capital Management, Inc.; Director of Cash Management, Senior Vice President, and Vice President, Invesco Advisers, Inc. and The Invesco Funds (AIM Treasurer’s Series Trust (Invesco Treasurer’s Series Trust), Short-Term Investments Trust and Tax-Free Investments Trust only) | N/A | N/A | ||||
Sheri Morris — 1964 Vice President, Treasurer and Principal Financial Officer | 1999 | Vice President, Treasurer and Principal Financial Officer, The Invesco Funds; Vice President, Invesco Advisers, Inc. (formerly known as Invesco Institutional (N.A.), Inc.) (registered investment adviser); and Treasurer, PowerShares Exchange-Traded Fund Trust, PowerShares Exchange-Traded Fund Trust II, PowerShares India Exchange-Traded Fund Trust and PowerShares Actively Managed Exchange-Traded Fund Trust
Formerly: Vice President, Invesco Advisers, Inc., Invesco Aim Capital Management, Inc. and Invesco Aim Private Asset Management, Inc.; Assistant Vice President and Assistant Treasurer, The Invesco Funds and Assistant Vice President, Invesco Advisers, Inc., Invesco Aim Capital Management, Inc. and Invesco Aim Private Asset Management, Inc. | N/A | N/A | ||||
Yinka Akinsola — 1977 Anti-Money Laundering Compliance Officer | 2011 | Anti-Money Laundering Compliance Officer, Invesco Advisers, Inc. (formerly known as Invesco Institutional (N.A.), Inc.) (registered investment adviser); Invesco Distributors, Inc. (formerly known as Invesco Aim Distributors, Inc.), Invesco Investment Services, Inc. (formerly known as Invesco Aim Investment Services, Inc.), Invesco Management Group, Inc., The Invesco Funds, Invesco Van Kampen Closed-End Funds, Van Kampen Exchange Corp., Invesco Capital Markets, Inc. (formerly known as Van Kampen Funds Inc.), PowerShares Exchange-Traded Fund Trust, PowerShares Exchange-Traded Fund Trust II, PowerShares India Exchange-Traded Fund Trust, and PowerShares Actively Managed Exchange-Traded Fund Trust
Formerly: Regulatory Analyst III, Financial Industry Regulatory Authority (FINRA). | N/A | N/A | ||||
Todd L. Spillane — 1958 Chief Compliance Officer | 2006 | Senior Vice President, Invesco Management Group, Inc. (formerly known as Invesco Aim Management Group, Inc.) and Van Kampen Exchange Corp.; Senior Vice President and Chief Compliance Officer, Invesco Advisers, Inc. (registered investment adviser) (formerly known as Invesco Institutional (N.A.), Inc.); Chief Compliance Officer, The Invesco Funds; Vice President, Invesco Distributors, Inc. (formerly known as Invesco Aim Distributors, Inc.) and Invesco Investment Services, Inc. (formerly known as Invesco Aim Investment Services, Inc.)
Formerly: Chief Compliance Officer, Invesco Van Kampen Closed-End Funds; Senior Vice President, Van Kampen Investments Inc.; Senior Vice President and Chief Compliance Officer, Invesco Advisers, Inc. and Invesco Aim Capital Management, Inc.; Chief Compliance Officer, INVESCO Private Capital Investments, Inc. (holding company), Invesco Private Capital, Inc. (registered investment adviser), Invesco Global Asset Management (N.A.), Inc., Invesco Senior Secured Management, Inc. (registered investment adviser) and Van Kampen Investor Services Inc., PowerShares Exchange-Traded Fund Trust, PowerShares Exchange-Traded Fund Trust II, PowerShares India Exchange-Traded Fund Trust and PowerShares Actively Managed Exchange-Traded Fund Trust; Vice President, Invesco Aim Capital Management, Inc. and Fund Management Company | N/A | N/A | ||||
The Statement of Additional Information of the Trust includes additional information about the Fund’s Trustees and is available upon request, without charge, by calling 1.800.959.4246. Please refer to the Fund’s prospectus for information on the Fund’s sub-advisers.
Office of the Fund 11 Greenway Plaza, Suite 1000 Houston, TX 77046-1173 | Investment Adviser Invesco Advisers, Inc. 1555 Peachtree Street, N.E. Atlanta, GA 30309 | Distributor Invesco Distributors, Inc. 11 Greenway Plaza, Suite 1000 Houston, TX 77046-1173 | Auditors PricewaterhouseCoopers LLP 1201 Louisiana Street, Suite 2900 Houston, TX 77002-5678 | |||
Counsel to the Fund Stradley Ronon Stevens & Young, LLP 2005 Market Street, Suite 2600 Philadelphia, PA 19103-7018 | Counsel to the Independent Trustees Kramer Levin Naftalis & Frankel LLP 1177 Avenue of the Americas New York, NY 10036-2714 | Transfer Agent Invesco Investment Services, Inc. 11 Greenway Plaza, Suite 1000 Houston, TX 77046-1173 | Custodian State Street Bank and Trust Company 225 Franklin Street Boston, MA 02110-2801 | |||
T-4 Invesco Global Small & Mid Cap Growth Fund

Invesco mailing information
Send general correspondence to Invesco Investment Services, Inc., P.O. Box 219078, Kansas City, MO 64121-9078.
Invesco privacy policy
You share personal and financial information with us that is necessary for your transactions and your account records. We take very seriously the obligation to keep that information confidential and private.
Invesco collects nonpublic personal information about you from account applications or other forms you complete and from your transactions with us or our affiliates. We do not disclose information about you or our former customers to service providers or other third parties except to the extent necessary to service your account and in other limited circumstances as permitted by law. For example, we use this information to facilitate the delivery of transaction confirmations, financial reports, prospectuses and tax forms.
Even within Invesco, only people involved in the servicing of your accounts and compliance monitoring have access to your information. To ensure the highest level of confidentiality and security, Invesco maintains physical, electronic and procedural safeguards that meet or exceed federal standards. Special measures, such as data encryption and authentication, apply to your communications with us on our website. More detail is available to you at invesco.com/privacy.
Important notice regarding delivery of security holder documents
To reduce Fund expenses, only one copy of most shareholder documents may be mailed to shareholders with multiple accounts at the same address (Householding). Mailing of your shareholder documents may be householded indefinitely unless you instruct us otherwise. If you do not want the mailing of these documents to be combined with those for other members of your household, please contact Invesco Investment Services, Inc. at 800 959 4246 or contact your financial institution. We will begin sending you individual copies for each account within 30 days after receiving your request.
Fund holdings and proxy voting information
The Fund provides a complete list of its holdings four times in each fiscal year, at the quarter-ends. For the second and fourth quarters, the lists appear in the Fund’s semiannual and annual reports to shareholders. For the first and third quarters, the Fund files the lists with the Securities and Exchange Commission (SEC) on Form N-Q. The most recent list of portfolio holdings is available at invesco.com/completeqtrholdings. Shareholders can also look up the Fund’s Forms N-Q on the SEC website at sec.gov. Copies of the Fund’s Forms N-Q may be reviewed and copied at the SEC Public Reference Room in Washington, D.C. You can obtain information on the operation of the Public Reference Room, including information about duplicating fee charges, by calling 202 551 8090 or 800 732 0330, or by electronic request at the following email address: publicinfo@sec.gov. The SEC file numbers for the Fund are shown below.
A description of the policies and procedures that the Fund uses to determine how to vote proxies relating to portfolio securities is available without charge, upon request, from our Client Services department at 800 959 4246 or at invesco.com/proxyguidelines. The information is also available on the SEC website, sec.gov.
Information regarding how the Fund voted proxies related to its portfolio securities during the 12 months ended June 30, 2012, is available at invesco.com/proxysearch. The information is also available on the SEC website, sec.gov. Invesco Advisers, Inc. is an investment adviser; it provides investment advisory services to individual and institutional clients and does not sell securities. Invesco Distributors, Inc. is the US distributor for Invesco Ltd.’s retail mutual funds, exchange-traded funds and institutional money market funds. Both are wholly owned, indirect subsidiaries of Invesco Ltd. |  |
| SEC file numbers: 811-06463 and 033-44611 | GSMG-AR-1 | Invesco Distributors, Inc. |
Letters to Shareholders
Philip Taylor | Dear Shareholders: This report contains information about your Fund, including a discussion from your portfolio managers about how they managed your Fund – and why it performed as it did – during the reporting period. This report also includes your Fund’s long-term performance and a complete list of your Fund’s investments as of the close of the reporting period. I hope you find this information helpful. For much of the reporting period, investors’ attention was focused on Europe, where eurozone governments struggled to reduce debt levels, strengthen their banks and stimulate their economies. European leaders disagreed whether the wiser path to restoring the Continent’s economic well-being was more stimulus or greater austerity. In the US, economic data were mixed. Economic growth, while positive, was relatively modest. Corporate earnings, which grew strongly in recent years, showed signs of slowing. And job creation was less robust than hoped. Later in this report, your Fund’s portfolio managers discuss how | |
| economic conditions and market trends affected your Fund’s performance. | ||

Economic conditions are always subject to sudden and unexpected change. That’s why you may find it helpful to work with a trusted, experienced financial adviser who understands your unique financial goals, needs and risk tolerances. Financial advisers can provide valuable insight and information, particularly when markets are uncertain, and they can recommend investments appropriate for specific investment goals, such as a child’s college education or your retirement. On a regular basis, a financial adviser also can determine whether your existing investments are still appropriate, given your changing needs, goals and circumstances.
Timely insight and information from many of Invesco’s investment professionals is available at our website, invesco.com/us. We offer in-depth articles, video clips and audio commentaries from many of our portfolio managers and other investment professionals on a wide range of topics of interest to investors: recent economic and market developments; retirement planning; legislative updates from Washington, DC; and general investor education. At invesco.com/us, you also can access information about your Invesco account at any time.
What we mean by Intentional Investing
Intentional InvestingSM is the science and art of investing with purpose, prudence and diligence – and it’s how Invesco’s investment professionals manage your money every day.
This highly disciplined process begins when specialized teams of investment professionals clearly define an investment objective and then establish specific investment strategies to try to achieve that objective. While our investment teams closely monitor economic and market conditions – and issues specific to individual holdings that could affect their value – they maintain a long-term investment perspective. Intentional Investing is also:
| n | How we manage and mitigate risk – by embedding risk controls and processes into every aspect of our business; |
| n | How we create products – by offering a diverse combination of investment strategies and vehicles designed to meet your needs; and |
| n | How we connect with you, our investors – by communicating clearly, by delivering expert insights from our portfolio managers and other investment professionals, and by providing a website full of tools and articles to help you stay informed. |
As a company, Invesco believes in putting investors first, and that’s why investment management is all we do. Our sole focus on managing your money allows your financial adviser to build a truly diversified investment portfolio of Invesco funds, whatever your investment needs and goals may be – and allows him or her to find appropriate Invesco funds when your circumstances change. Of course, neither Intentional Investing nor diversification can guarantee a profit or protect against loss.
Have a question?
If you have questions about your account, please contact an Invesco client services representative at 800 959 4246. If you have an Invesco-related question or comment, feel free to email me directly at phil@invesco.com.
All of us at Invesco look forward to serving your investment management needs for many years to come. Thank you for investing with us.
Sincerely,

Philip Taylor
Senior Managing Director, Invesco Ltd.
2 Invesco International Core Equity Fund
Bruce Crockett | Dear Fellow Shareholders: One of our most important responsibilities as independent Trustees of the Invesco Funds is our annual review of the funds’ advisory and sub-advisory contracts with Invesco. This annual review is required by the Investment Company Act of 1940 and focuses on the nature and quality of the services Invesco has provided as adviser to the Invesco Funds and the reasonableness of the fees that it charges for those services. In our roles as Trustees, we spend months reviewing thousands of pages of detailed information that we request from Invesco in connection with our annual review. We focus on the quality and costs of the services to be provided by Invesco and its affiliates. Some of the most important things we look at are fund performance, expenses and fees. All of the Trustees have substantial personal investments in the Invesco Funds complex. We’re fund shareholders just like you. |

We also use information from many independent sources during the review process, including materials provided by the independent Senior Officer of the Invesco Funds, who reports directly to the independent Trustees. We also meet in private sessions with independent legal counsel and review performance and fee data on the Invesco Funds prepared by Lipper Inc., an independent, third-party firm widely recognized as a leader in its field.
I’m pleased to report that the Invesco Funds Board determined in June that renewing the investment advisory agreement and the sub-advisory contracts with Invesco would serve the best interests of each fund and its shareholders. For more detailed information about our assessment and conclusions with respect to each of the Invesco Funds, visit invesco.com/us, click on the “About Us” section and go to “Legal Information.” Information on the recent investment advisory renewal process can be found by clicking the last item under “Corporate Governance.”
In much the same way we review your fund’s advisory contract each year, it’s a good idea for you to review your own investment plan with your financial adviser on a regular basis. Perhaps you need to reassess your original asset allocation because different investments may grow at varying paces, or perhaps you’re going through a significant life change. Regardless of your situation, a financial adviser can provide guidance and experience to help you reach your financial goals.
As always, please contact me at bruce@brucecrockett.com with any questions or concerns you may have. On behalf of the Board, we look forward to continuing to represent your interests and serving your needs.
Sincerely,

Bruce L. Crockett
Independent Chair
Invesco Funds Board of Trustees
3 Invesco International Core Equity Fund
Management’s Discussion of Fund Performance
Performance summary
For the fiscal year ended October 31, 2012, Invesco International Core Equity Fund underperformed its benchmarks, the MSCI EAFE Index and the Lipper International Large-Cap Core Funds Index.
Stock selection in the energy, financials, telecommunication services and utilities sectors contributed positively to Fund performance, while holdings in the consumer discretionary, consumer staples, industrials and materials sectors detracted from performance for the reporting period.
Your Fund’s long-term performance appears later in this report.
Fund vs. Indexes
Total returns, 10/31/11 to 10/31/12, at net asset value (NAV). Performance shown does not include applicable contingent deferred sales charges (CDSC) or front-end sales charges, which would have reduced performance.
Class A Shares | 1.40 | % | ||
Class B Shares | 0.67 | |||
Class C Shares | 0.69 | |||
Class R Shares | 1.29 | |||
Class Y Shares | 1.67 | |||
Investor Class Shares | 1.48 | |||
Class R5 Shares* | 2.15 | |||
Class R6 Shares** | 1.56 | |||
MSCI EAFE Indexq (Broad Market/Style-Specific Index) | 4.61 | |||
Lipper International Large-Cap Core Funds Indexn (Peer Group Index) | 5.63 |
Source(s): qInvesco, MSCI via FactSet Research Systems Inc.; nLipper Inc.
| *Effective | September 24, 2012, Institutional Class shares were renamed Class R5 shares. |
| **Share | class incepted during the reporting period. See page 7 for a detailed explanation of Fund performance. |
How we invest
The Fund invests primarily in stocks of mid- and large-cap foreign companies with a record of stable earnings and strong balance sheets. Our investment process includes a valuation assessment, fundamental research and team-based portfolio decisions. We address risk at the security level by emphasizing balance sheet strength and earnings stability of individual holdings. At the portfolio level, we seek to achieve appropriate diversification relative to the MSCI EAFE Index. We are committed to a long-term investment horizon resulting in low rates of portfolio turnover. Risk management efforts also seek to ensure that the largest single component of active risk is security-specific, which is consistent with stock
selection being the sole targeted area of excess return.
We strive to maintain a consistent investment discipline through varying market conditions and an appropriate level of overall portfolio diversification. Individual holdings are selected based on their own merits, however, and not on projections of country or sector performance.
Our sell discipline replicates our security selection process in that we look to trim or liquidate positions in the portfolio based on valuation, fundamentals or portfolio design considerations.
Market conditions and your Fund
During the reporting period, global equity markets remained volatile. At
the beginning of the reporting period, macro events – ranging from continuing political instability in the Middle East, lingering economic effects of the earthquake and tsunami in Japan, the ongoing eurozone sovereign debt crisis, after effects of Standard & Poor’s August 2011 first-ever downgrade of US debt, a slowing Chinese property market and generally higher inflation across the developing world – weighed on global economic growth and equity markets. While the markets rebounded modestly in December, macroeconomic concerns continued, stemming largely from the unstable economic conditions of Greece and Spain.
Toward the end of the reporting period, global central banks announced a series of stimulative policies. The European Central Bank (ECB) announced new measures to support eurozone economies through potentially unlimited purchases of sovereign debt, with ECB President Mario Draghi pledging to “do whatever it takes” to save the euro (although key details of the plan remain unresolved). The US Federal Reserve announced a third round of quantitative easing by promising to remain accommodative until the labor market outlook improves materially. Also, the Bank of Japan took steps to increase its asset purchase program. These easing measures were well received by investors and helped drive international equity markets higher in the final months of the reporting period, despite signs of a continued slowdown in global economic growth.
The Fund stayed true to its process and benefited from its quality orientation in stock selection. Our stock selection within the energy, financials, telecommunication services and utilities sectors made the largest contribution to the Fund’s relative results. Within the financials sector, several banks, including
Portfolio Composition
By sector
Financials | 23.5 | % | ||
Materials | 12.0 | |||
Energy | 11.4 | |||
Consumer Discretionary | 10.0 | |||
Industrials | 9.9 | |||
Telecommunication Services | 9.3 | |||
Consumer Staples | 8.7 | |||
Health Care | 7.1 | |||
Information Technology | 3.7 | |||
Utilities | 3.1 | |||
Money Market Funds | ||||
Plus Other Assets Less Liabilities | 1.3 |
Top 10 Equity Holdings*
1. Imperial Tobacco Group PLC | 3.1 | % | ||
2. Swisscom AG | 2.9 | |||
3. Sanofi | 2.8 | |||
4. Royal Dutch Shell PLC-ADR | 2.8 | |||
5. Porsche Automobil Holding SE | 2.6 | |||
6. Zurich Insurance Group AG | 2.6 | |||
7. Yara International ASA | 2.4 | |||
8. BHP Billiton Ltd. | 2.4 | |||
9. DeNA Co., Ltd. | 2.4 | |||
10. Total SA | 2.3 |
Top Five Countries
1. Japan | 25.4 | % | ||
2. United Kingdom | 14.9 | |||
3. France | 11.4 | |||
4. Australia | 9.5 | |||
5. Switzerland | 7.4 |
Total Net Assets | $ | 283.1 million | ||
Total Number of Holdings* | 105 | |||
The Fund’s holdings are subject to change, and there is no assurance that the Fund will continue to hold any particular security.
*Excluding money market fund holdings.
4 Invesco International Core Equity Fund
Australia & New Zealand Bank Group and Zurich Insurance Group, were top contributors. In the telecommunication services sector, Australian-based Telstra was also a notable contributor to performance. In addition, Nexen, a global energy company that was sold before the end of the reporting period, rose significantly after receiving a buyout bid from state-owned Chinese energy company CNOOC at a substantial premium.
Detracting from the Fund’s relative performance was our stock selection in the consumer discretionary, consumer staples, industrials and materials sectors. Vallourec, a France-based company that specializes in the production of seamless steel tube products for industrial applications, announced that two key projects were delayed which hurt results. In addition, while Spanish telecommunications firm Telefonica has been out of favor largely due to macro events in Spain, a large percentage of its business is global in nature and the company benefits from other regions such as Latin America.
From a geographic perspective, the Fund’s exposure to the Asia Pacific region and Europe detracted from Fund performance during the fiscal year. Specifically, stock selection in France, Spain and the UK negatively affected Fund performance. Also hampering Fund performance was stock selection and a slight overweight to Japan. Conversely, our stock selection in Hong Kong and Switzerland helped Fund performance versus the Fund’s broad-based benchmark. Also adding to performance were our Fund’s holdings in Canada, which are not represented in the Fund’s broad-based benchmark, as well as contributions from the holdings in Australia.
The Fund maintains a slight overweight position in emerging markets and Canada, while being modestly underweight in German and UK securities, relative to the Fund’s broad-based benchmark. In addition, the Fund is slightly overweight in France and Japan. We select Fund holdings based on the merits of individual holdings and not on a country or sector basis.
From a positioning perspective, we increased the Fund’s allocation to the consumer staples, industrials and materials sectors during the fiscal year. We reduced the Fund’s weighting in the utilities and information technology sectors.
During the fiscal year, we initiated positions in numerous holdings including Rio Tinto, Standard Chartered, JSR Corporation and Suncor Energy. We also liquidated numerous holdings such as
Unilever, International Power and Sumitomo Chemical Company.
Many of the same issues plaguing markets over the past several years, such as weak economic growth prospects globally, high sovereign debt levels across developed markets and the uncertain outcome of the eurozone crisis, remain unresolved and could continue to weigh on markets. That said, easing measures from central banks around the world have been supportive of equity markets and we believe such measures may continue. Also, stock market valuations are relatively attractive from a historical context. We remain firmly committed to our investment approach of striving to build a diversified portfolio with above-average profitability characteristics and discounted valuations.
We welcome any new investors who have joined the Fund during the fiscal year, and to all of our shareholders we would like to say thank you for your continued investment in Invesco International Core Equity Fund.
The views and opinions expressed in management’s discussion of Fund performance are those of Invesco Advisers, Inc. These views and opinions are subject to change at any time based on factors such as market and economic conditions. These views and opinions may not be relied upon as investment advice or recommendations, or as an offer for a particular security. The information is not a complete analysis of every aspect of any market, country, industry, security or the Fund. Statements of fact are from sources considered reliable, but Invesco Advisers, Inc. makes no representation or warranty as to their completeness or accuracy. Although historical performance is no guarantee of future results, these insights may help you understand our investment management philosophy.
See important Fund and, if applicable, index disclosures later in this report.
 | Ingrid Baker Chartered Financial Analyst, portfolio manager, is manager of Invesco International Core | |
| Equity Fund. She joined Invesco in 1999. Ms. Baker earned a BA in international politics from Oberlin College and an MBA in finance from the University of Navarra. | ||
 | W. Lindsay Davidson Portfolio manager, is manager of Invesco International Core Equity Fund. | |
| He joined Invesco in 1984. Mr. Davidson earned an economics degree from Edinburgh University. | ||
 | E. Sargent McGowan Chartered Financial Analyst, portfolio manager, is manager of | |
| Invesco International Core Equity Fund. He joined Invesco in 2002. Mr. McGowan earned a BS in commerce from the University of Virginia and an MBA in investment management from the University of North Carolina. | ||
 | Anuja Singha Chartered Financial Analyst, portfolio manager, is manager of Invesco International Core | |
| Equity Fund. She joined Invesco in 1998. Ms. Singha earned a BA in economics from Mills College and a PhD in economics from Emory University. | ||
 | Stephen Thomas Chartered Financial Analyst, portfolio manager, is manager of Invesco International Core | |
| Equity Fund. He joined Invesco in 2000. Mr. Thomas earned a BBA in banking and finance and an MBA from the University of Mississippi. | ||
5 Invesco International Core Equity Fund
Your Fund’s Long-Term Performance
Results of a $10,000 Investment – Oldest Share Class(es)
Fund and index data from 10/31/02*
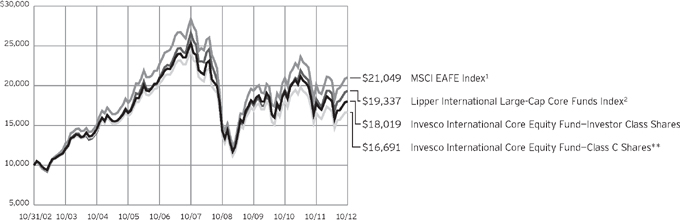
1 Source(s): Invesco, MSCI via FactSet Research Systems Inc.
2 Source: Lipper Inc.
| * | During the reporting period, Invesco changed its policy regarding growth of $10,000 charts. For funds older than 10 years, we previously showed performance since inception. Going forward, we will show performance for the most recent 10 years, since this more accurately reflects the experience of the typical shareholder. As a result, charts now may include benchmarks that did not appear previously, because the funds’ inception predated the benchmarks’ inception. Also, all charts will now be presented using a linear format. |
| ** | The Fund’s oldest share class (Investor) does not have a sales charge, therefore, the second oldest share class with a sales charge (Class C) is also included in the chart. |
Past performance cannot guarantee comparable future results.
The data shown in the chart include reinvested distributions, applicable sales charges and Fund expenses including
management fees. Index results include reinvested dividends, but they do not reflect sales charges. Performance of the peer group, if applicable, reflects fund expenses and management fees; performance
of a market index does not. Performance shown in the chart and table(s) does not reflect deduction of taxes a shareholder would pay on Fund distributions or sale of Fund shares.
6 Invesco International Core Equity Fund
Average Annual Total Returns
As of 10/31/12, including maximum applicable sales charges
Class A Shares | ||||
Inception (3/28/02) | 3.11 | % | ||
10 Years | 5.41 | |||
5 Years | -7.66 | |||
1 Year | -4.15 | |||
Class B Shares | ||||
Inception (3/28/02) | 3.16 | % | ||
10 Years | 5.44 | |||
5 Years | -7.62 | |||
1 Year | -4.26 | |||
Class C Shares | ||||
Inception (2/14/00) | 0.65 | % | ||
10 Years | 5.26 | |||
5 Years | -7.31 | |||
1 Year | -0.30 | |||
Class R Shares | ||||
Inception (11/24/03) | 4.15 | % | ||
5 Years | -6.84 | |||
1 Year | 1.29 | |||
Class Y Shares | ||||
10 Years | 6.17 | % | ||
5 Years | -6.43 | |||
1 Year | 1.67 | |||
Investor Class Shares | ||||
Inception (10/28/98) | 2.92 | % | ||
10 Years | 6.07 | |||
5 Years | -6.61 | |||
1 Year | 1.48 | |||
Class R5 Shares | ||||
Inception (4/30/04) | 4.07 | % | ||
5 Years | -6.00 | |||
1 Year | 2.15 | |||
Class R6 Shares | ||||
10 Years | 6.07 | % | ||
5 Years | -6.59 | |||
1 Year | 1.56 | |||
Class Y shares incepted on October 3, 2008. Performance shown prior to that date is that of Investor Class shares and includes the 12b-1 fees applicable to Investor Class shares. Investor Class share performance reflects any applicable fee waivers or expense reimbursements.
Average Annual Total Returns
As of 9/30/12, the most recent calendar quarter- end, including maximum applicable sales charges
Class A Shares | ||||
Inception (3/28/02) | 3.07 | % | ||
10 Years | 5.66 | |||
5 Years | -7.12 | |||
1 Year | 3.15 | |||
Class B Shares | ||||
Inception (3/28/02) | 3.13 | % | ||
10 Years | 5.68 | |||
5 Years | -7.09 | |||
1 Year | 3.40 | |||
Class C Shares | ||||
Inception (2/14/00) | 0.61 | % | ||
10 Years | 5.50 | |||
5 Years | -6.78 | |||
1 Year | 7.40 | |||
Class R Shares | ||||
Inception (11/24/03) | 4.12 | % | ||
5 Years | -6.30 | |||
1 Year | 8.94 | |||
Class Y Shares | ||||
10 Years | 6.42 | % | ||
5 Years | -5.89 | |||
1 Year | 9.56 | |||
Investor Class Shares | ||||
Inception (10/28/98) | 2.89 | % | ||
10 Years | 6.32 | |||
5 Years | -6.07 | |||
1 Year | 9.26 | |||
Class R5 Shares | ||||
Inception (4/30/04) | 4.02 | % | ||
5 Years | -5.47 | |||
1 Year | 9.97 | |||
Class R6 Shares | ||||
10 Years | 6.33 | % | ||
5 Years | -6.05 | |||
1 Year | 9.33 | |||
Class R6 shares incepted on September 24, 2012. Performance shown prior to that date is that of Investor Class shares and includes the 12b-1 fees applicable to Investor Class shares. Investor Class share performance reflects any applicable fee waivers or expense reimbursements.
The performance data quoted represent past performance and cannot guarantee comparable future results; current performance may be lower or higher. Please visit invesco.com/performance for the most recent month-end performance. Performance figures reflect reinvested distributions, changes in net asset value and the effect of the maximum sales charge unless otherwise stated. Investment return and principal value will fluctuate so that you may have a gain or loss when you sell shares.
The total annual Fund operating expense ratio set forth in the most recent Fund prospectus as of the date of this report for Class A, Class B, Class C, Class R, Class Y, Investor Class, Class R5 and Class R6 shares was 1.54%, 2.29%, 2.29%, 1.79%, 1.29%, 1.54%, 0.91% and 0.91%, respectively. The expense ratios presented above may vary from the expense ratios presented in other sections of this report that are based on expenses incurred during the period covered by this report.
Class A share performance reflects the maximum 5.50% sales charge, and Class B and Class C share performance reflects the applicable contingent deferred sales charge (CDSC) for the period involved. The CDSC on Class B shares declines from 5% beginning at the time of purchase to 0% at the beginning of the seventh year. The CDSC on Class C shares is 1% for the first year after purchase. Class R, Class Y, Investor Class, Class R5 and Class R6 shares do not have a front-end sales charge or a CDSC; therefore, performance is at net asset value.
The performance of the Fund’s share classes will differ primarily due to different sales charge structures and class expenses.
�� Had the adviser not waived fees and/ or reimbursed expenses in the past for Class C shares, performance would have been lower.
continued from page 8
returns reported in the Financial Highlights. n Industry classifications used in this report are generally according to the Global Industry Classification Standard, | which was developed by and is the exclusive property and a service mark of MSCI Inc. and Standard & Poor’s. |
7 Invesco International Core Equity Fund
Invesco International Core Equity Fund’s investment objective is long-term growth of capital.
| n | Unless otherwise stated, information presented in this report is as of October 31, 2012, and is based on total net assets. |
| n | Unless otherwise noted, all data provided by Invesco. |
| n | To access your Fund’s reports/prospectus, visit invesco.com/fundreports. |
About share classes
| n | Class B shares may not be purchased for new or additional investments. Please see the prospectus for more information. |
| n | Class R shares are generally available only to employee benefit plans. Please see the prospectus for more information. |
| n | Class Y shares are available only to certain investors. Please see the prospectus for more information. |
| n | Investor Class shares are closed to new investors. Contact your financial adviser about purchasing our other share classes. Please see the prospectus for more information. |
| n | Class R5 shares and Class R6 shares are primarily intended for retirement plans that meet certain standards and for institutional investors. On September 24, 2012, Institutional Class shares were renamed Class R5 shares. Please see the prospectus for more information. |
Principal risks of investing in the Fund
| n | Developing/emerging markets securities risk. Securities issued by foreign companies and governments located in developing/emerging countries may be affected more negatively by inflation, devaluation of their currencies, higher transaction costs, delays in settlement, adverse political developments, the introduction of capital controls, withholding taxes, nationalization of private assets, expropriation, social unrest, war or lack of timely information than those in developed countries. |
| n | Foreign securities risk. The Fund’s foreign investments may be affected by changes in a foreign country’s exchange rates, political and social instability, changes in economic or taxation policies, difficulties when enforcing obligations, decreased liquidity, and increased volatility. Foreign companies may be subject to less regulation resulting in less publicly available information about the companies. |
| n | Geographic concentration risk. Because an underlying fund emphasizes investment in issuers in the developed countries of Western Europe and the Pacific Basin, an underlying fund’s performance is expected to be closely tied to social, political and economic conditions within countries in those regions and to be more volatile than the performance of more geographically diversified funds. |
| n | Investing in the European Union risk. Many countries in the European Union are susceptible to high economic risks associated with high levels of debt, notably due to investments in sovereign debts of European countries such as Greece, Italy and Spain. One or more member states might exit the European Union, placing its currency and banking system in jeopardy. The European Union faces major issues involving its membership, structure, procedures and policies, including the adoption, abandonment or adjustment of the new constitutional treaty, the European Union’s enlargement to the south and east, and resolution of the European Union’s problematic fiscal and democratic accountability. Efforts of the member states to further unify their economic and monetary policies may increase the potential for the downward movement of one member state’s market to cause a similar effect on other member states’ markets. European countries that are part of the European Economic and Monetary Union may be significantly affected by the tight fiscal and monetary controls that the union seeks to impose on its members. |
| n | Management risk. The investment techniques and risk analysis used by the Fund’s portfolio managers may not produce the desired results. |
| n | Market risk. The prices of and the income generated by the Fund’s securities may decline in response to, among other things, investor sentiment, general economic and market conditions, regional or global instability, |
| and currency and interest rate fluctuations. |
| n | Synthetic securities risk. Fluctuations in the values of synthetic securities may not correlate perfectly with the instruments they are designed to replicate. Synthetic Securities may be subject to interest rate changes, market price fluctuations, counterparty risk and liquidity risk. |
About indexes used in this report
| n | The MSCI EAFE® Index is an unmanaged index considered representative of stocks of Europe, Australasia and the Far East. |
| n | The Lipper International Large-Cap Core Funds Index is an unmanaged index considered representative of international large-cap core funds tracked by Lipper. |
| n | The Fund is not managed to track the performance of any particular index, including the index(es) defined here, and consequently, the performance of the Fund may deviate significantly from the performance of the index(es). |
| n | A direct investment cannot be made in an index. Unless otherwise indicated, index results include reinvested dividends, and they do not reflect sales charges. Performance of the peer group, if applicable, reflects fund expenses; performance of a market index does not. |
Other information
| n | The returns shown in management’s discussion of Fund performance are based on net asset values calculated for shareholder transactions. Generally accepted accounting principles require adjustments to be made to the net assets of the Fund at period end for financial reporting purposes, and as such, the net asset values for shareholder transactions and the returns based on those net asset values may differ from the net asset values and |
continued on page 7
This report must be accompanied or preceded by a currently effective Fund prospectus, which contains more complete information, including sales charges and expenses. Investors should read it carefully before investing.
NOT FDIC INSURED | MAY LOSE VALUE | NO BANK GUARANTEE
Fund Nasdaq Symbols | ||
Class A Shares | IBVAX | |
Class B Shares | IBVBX | |
Class C Shares | IBVCX | |
Class R Shares | IIBRX | |
Class Y Shares | IBVYX | |
Investor Class Shares | IIBCX | |
Class R5 Shares | IBVIX | |
Class R6 Shares | IBVFX | |
8 Invesco International Core Equity Fund
Schedule of Investments
October 31, 2012
| Shares | Value | |||||||
Common Stocks & Other Equity Interests–98.67% |
| |||||||
Australia–9.45% |
| |||||||
Australia & New Zealand Banking Group Ltd. | 194,225 | $ | 5,118,092 | |||||
BHP Billiton Ltd. | 193,605 | 6,827,169 | ||||||
Macquarie Group Ltd. | 143,486 | 4,740,210 | ||||||
Suncorp Group Ltd. | 495,257 | 4,821,652 | ||||||
Telstra Corp. Ltd. | 1,222,069 | 5,249,092 | ||||||
| 26,756,215 | ||||||||
Brazil–0.80% |
| |||||||
Banco do Brasil S.A. | 27,500 | 293,443 | ||||||
Companhia Paranaense de Energia–Copel–Class B–Preference Shares(a) | 17,600 | 259,996 | ||||||
PDG Realty S.A. Empreendimentos e Participacoes | 103,500 | 174,301 | ||||||
Petroleo Brasileiro S.A.–ADR | 31,150 | 660,692 | ||||||
Telefonica Brasil S.A.–Preference Shares | 16,000 | 354,540 | ||||||
Vale S.A.–ADR | 28,450 | 521,204 | ||||||
| 2,264,176 | ||||||||
Canada–2.73% |
| |||||||
Suncor Energy, Inc. | 120,221 | 4,033,842 | ||||||
Toronto-Dominion Bank (The)(b) | 45,300 | 3,683,402 | ||||||
| 7,717,244 | ||||||||
China–1.25% |
| |||||||
China Agri-Industries Holdings Ltd. | 384,000 | 240,034 | ||||||
China Communications Construction Co. Ltd.–Class H | 452,000 | 424,005 | ||||||
China Construction Bank Corp.–Class H | 732,000 | 551,597 | ||||||
China Minsheng Banking Corp., Ltd.–Class H | 657,500 | 597,218 | ||||||
China Mobile Ltd. | 82,500 | 914,952 | ||||||
CNOOC Ltd. | 294,800 | 607,866 | ||||||
KWG Property Holding Ltd. | 363,000 | 215,002 | ||||||
| 3,550,674 | ||||||||
Denmark–1.21% |
| |||||||
Danske Bank AS(a) | 218,868 | 3,421,951 | ||||||
France–11.38% |
| |||||||
BNP Paribas S.A. | 76,347 | 3,862,281 | ||||||
Bouygues S.A. | 177,989 | 4,279,822 | ||||||
Cie Generale des Etablissements Michelin | 56,328 | 4,851,498 | ||||||
Sanofi | 89,975 | 7,923,975 | ||||||
Total S.A.–ADR | 130,898 | 6,597,259 | ||||||
Vallourec S.A. | 113,781 | 4,689,549 | ||||||
| 32,204,384 | ||||||||
Germany–5.42% |
| |||||||
Deutsche Lufthansa AG | 246,822 | 3,771,110 | ||||||
Muenchener Rueckversicherungs–Gesellschaft AG | 15,109 | 2,427,889 | ||||||
Porsche Automobil Holding SE–Preference Shares | 110,058 | 7,305,210 | ||||||
Salzgitter AG | 42,732 | 1,849,654 | ||||||
| 15,353,863 | ||||||||
| Shares | Value | |||||||
Hong Kong–4.90% |
| |||||||
Cheung Kong (Holdings) Ltd. | 256,000 | $ | 3,782,194 | |||||
First Pacific Co. Ltd. | 184,000 | 204,893 | ||||||
Henderson Land Development Co. Ltd. | 621,000 | 4,295,920 | ||||||
Standard Chartered PLC | 235,712 | 5,591,342 | ||||||
| 13,874,349 | ||||||||
India–0.52% |
| |||||||
Canara Bank Ltd. | 51,269 | 381,942 | ||||||
Grasim Industries Ltd. | 6,529 | 401,025 | ||||||
Oil and Natural Gas Corp. Ltd. | 69,094 | 343,508 | ||||||
Tata Motors Ltd. | 73,499 | 351,713 | ||||||
| 1,478,188 | ||||||||
Indonesia–0.12% |
| |||||||
PT Telekomunikasi Indonesia Persero Tbk | 331,000 | 336,372 | ||||||
Italy–1.83% |
| |||||||
Eni S.p.A–ADR(b) | 112,799 | 5,176,346 | ||||||
Japan–25.40% |
| |||||||
Asahi Group Holdings, Ltd. | 288,800 | 6,580,573 | ||||||
DeNA Co., Ltd.(b) | 217,400 | 6,783,708 | ||||||
East Japan Railway Co. | 46,100 | 3,164,575 | ||||||
FUJIFILM Holdings Corp. | 115,900 | 1,954,170 | ||||||
JSR Corp. | 147,800 | 2,529,730 | ||||||
Komatsu Ltd. | 127,000 | 2,659,952 | ||||||
Mitsubishi Corp. | 222,600 | 3,973,506 | ||||||
Mitsubishi UFJ Financial Group, Inc. | 1,222,900 | 5,530,088 | ||||||
Nippon Telegraph & Telephone Corp. | 68,500 | 3,127,016 | ||||||
Nippon Yusen Kabushiki Kaisha | 1,277,000 | 2,431,467 | ||||||
Nissan Motor Co., Ltd. | 643,400 | 5,383,831 | ||||||
Nitto Denko Corp. | 65,900 | 2,980,331 | ||||||
NSK Ltd. | 421,000 | 2,309,884 | ||||||
NTT DoCoMo, Inc. | 1,918 | 2,818,256 | ||||||
Seven & I Holdings Co., Ltd. | 138,700 | 4,277,582 | ||||||
Shin-Etsu Chemical Co., Ltd. | 56,000 | 3,156,708 | ||||||
Toyo Suisan Kaisha, Ltd. | 136,000 | 3,388,501 | ||||||
Toyota Motor Corp.(a) | 102,900 | 3,978,269 | ||||||
Yamada Denki Co., Ltd. | 112,840 | 4,890,723 | ||||||
| 71,918,870 | ||||||||
Mexico–0.20% |
| |||||||
America Movil S.A.B. de C.V.–Series L | 449,400 | 569,894 | ||||||
Norway–3.35% |
| |||||||
Statoil ASA | 106,219 | 2,624,784 | ||||||
Yara International ASA | 145,578 | 6,857,758 | ||||||
| 9,482,542 | ||||||||
Poland–0.19% |
| |||||||
KGHM Polska Miedz S.A. | 10,350 | 522,815 | ||||||
Russia–0.66% |
| |||||||
Gazprom OAO–ADR | 34,128 | 313,148 | ||||||
Magnitogorsk Iron & Steel Works–REGS–GDR(c) | 57,918 | 250,538 | ||||||
See accompanying Notes to Financial Statements which are an integral part of the financial statements.
9 Invesco International Core Equity Fund
| Shares | Value | |||||||
Russia–(continued) |
| |||||||
Rosneft Oil Co.–REGS–GDR(c) | 70,464 | $ | 523,528 | |||||
Sberbank of Russia–ADR | 35,591 | 420,443 | ||||||
Sistema JSFC–REGS–GDR(c) | 19,349 | 355,748 | ||||||
| 1,863,405 | ||||||||
South Africa–0.71% |
| |||||||
Sasol Ltd. | 11,541 | 492,350 | ||||||
Standard Bank Group Ltd. | 29,880 | 369,707 | ||||||
Steinhoff International Holdings Ltd. | 198,940 | 669,034 | ||||||
Tiger Brands Ltd. | 14,990 | 476,779 | ||||||
| 2,007,870 | ||||||||
South Korea–1.47% |
| |||||||
Dongbu Insurance Co., Ltd. | 10,686 | 484,479 | ||||||
Hyundai Mipo Dockyard Co., Ltd. | 3,292 | 348,495 | ||||||
Hyundai Mobis | 2,844 | 720,431 | ||||||
KT&G Corp. | 7,391 | 562,022 | ||||||
POSCO | 1,182 | 370,701 | ||||||
Samsung Electronics Co., Ltd. | 672 | 807,115 | ||||||
Shinhan Financial Group Co., Ltd. | 11,947 | 407,473 | ||||||
SK Telecom Co., Ltd. | 2,799 | 393,918 | ||||||
SK Telecom Co., Ltd.–ADR | 5,161 | 80,666 | ||||||
| 4,175,300 | ||||||||
Spain–3.93% |
| |||||||
Banco Santander S.A. | 257,438 | 1,940,924 | ||||||
Iberdrola S.A. | 612,152 | 3,165,218 | ||||||
Repsol S.A. | 114,792 | 2,300,667 | ||||||
Telefonica S.A.(a) | 281,629 | 3,720,947 | ||||||
| 11,127,756 | ||||||||
Switzerland–7.43% |
| |||||||
Actelion Ltd.(a) | 52,931 | 2,557,704 | ||||||
Holcim Ltd.(a) | 42,954 | 2,933,045 | ||||||
Swisscom AG | 19,937 | 8,290,901 | ||||||
Zurich Insurance Group AG(a) | 29,345 | 7,247,713 | ||||||
| 21,029,363 | ||||||||
Taiwan–0.29% |
| |||||||
Powertech Technology Inc. | 222,000 | 344,230 | ||||||
Unimicron Technology Corp. | 274,000 | 279,879 | ||||||
Wistron Corp. | 219,450 | 210,713 | ||||||
| 834,822 | ||||||||
| Shares | Value | |||||||
Thailand–0.30% |
| |||||||
Bangkok Bank PCL–NVDR | 84,000 | $ | 482,095 | |||||
PTT PCL | 34,700 | 359,550 | ||||||
| 841,645 | ||||||||
Turkey–0.10% |
| |||||||
Asya Katilim Bankasi AS(a) | 260,808 | 293,262 | ||||||
United Arab Emirates–0.16% |
| |||||||
Dragon Oil PLC | 50,018 | 447,963 | ||||||
United Kingdom–14.87% |
| |||||||
AstraZeneca PLC | 78,952 | 3,666,074 | ||||||
Barclays PLC | 1,526,716 | 5,639,233 | ||||||
Eurasian Natural Resources Corp. | 51,144 | 271,524 | ||||||
GlaxoSmithKline PLC | 265,738 | 5,949,783 | ||||||
Imperial Tobacco Group PLC | 234,094 | 8,851,114 | ||||||
National Grid PLC | 465,863 | 5,311,206 | ||||||
Rio Tinto PLC | 92,506 | 4,612,331 | ||||||
Royal Dutch Shell PLC–ADR | 113,986 | 7,805,761 | ||||||
| 42,107,026 | ||||||||
Total Common Stocks & Other Equity Interests |
| 279,356,295 | ||||||
Money Market Funds–0.49% |
| |||||||
Liquid Assets Portfolio–Institutional Class(d) | 692,985 | 692,985 | ||||||
Premier Portfolio–Institutional Class(d) | 692,984 | 692,984 | ||||||
Total Money Market Funds |
| 1,385,969 | ||||||
TOTAL INVESTMENTS (excluding investments purchased with cash collateral from securities on loan)–99.16% (Cost $268,402,421) |
| 280,742,264 | ||||||
Investments Purchased with Cash Collateral from Securities on Loan–3.73% |
| |||||||
Liquid Assets Portfolio—Institutional Class (Cost $10,548,700)(d)(e) | 10,548,700 | 10,548,700 | ||||||
TOTAL INVESTMENTS–102.89% |
| 291,290,964 | ||||||
OTHER ASSETS LESS LIABILITIES–(2.89)% |
| (8,169,598 | ) | |||||
NET ASSETS–100.00% |
| $ | 283,121,366 | |||||
Investment Abbreviations:
| ADR | – American Depositary Receipt | |
| GDR | – Global Depositary Receipt | |
| NVDR | – Non-Voting Depositary Receipt | |
| REGS | – Regulation S |
Notes to Schedule of Investments:
| (a) | Non-income producing security. |
| (b) | All or a portion of this security was out on loan at October 31, 2012. |
| (c) | Security purchased or received in a transaction exempt from registration under the Securities Act of 1933, as amended. The security may be resold pursuant to an exemption from registration under the 1933 Act, typically to qualified institutional buyers. The aggregate value of these securities at October 31, 2012 was $1,129,814, which represented less than 1% of the Fund’s Net Assets. |
| (d) | The money market fund and the Fund are affiliated by having the same investment adviser. |
| (e) | The security has been segregated to satisfy the commitment to return the cash collateral received in securities lending transactions upon the borrower’s return of the securities loaned. See Note 1J. |
See accompanying Notes to Financial Statements which are an integral part of the financial statements.
10 Invesco International Core Equity Fund
Statement of Assets and Liabilities
October 31, 2012
Assets: |
| |||
Investments, at value (Cost $267,016,452)* | $ | 279,356,295 | ||
Investments in affiliated money market funds, at value and cost | 11,934,669 | |||
Total investments, at value (Cost $278,951,121) | 291,290,964 | |||
Foreign currencies, at value (Cost $107,459) | 107,930 | |||
Receivable for: | ||||
Investments sold | 1,721,968 | |||
Fund shares sold | 88,518 | |||
Dividends | 1,325,600 | |||
Investment for trustee deferred compensation and retirement plans | 45,969 | |||
Other assets | 31,510 | |||
Total assets | 294,612,459 | |||
Liabilities: |
| |||
Payable for: | ||||
Investments purchased | 342,167 | |||
Fund shares reacquired | 301,213 | |||
Collateral upon return of securities loaned | 10,548,700 | |||
Accrued fees to affiliates | 85,474 | |||
Accrued other operating expenses | 114,058 | |||
Trustee deferred compensation and retirement plans | 99,481 | |||
Total liabilities | 11,491,093 | |||
Net assets applicable to shares outstanding | $ | 283,121,366 | ||
Net assets consist of: |
| |||
Shares of beneficial interest | $ | 349,023,262 | ||
Undistributed net investment income | 5,891,323 | |||
Undistributed net realized gain (loss) | (84,156,627 | ) | ||
Unrealized appreciation | 12,363,408 | |||
| $ | 283,121,366 | |||
Net Assets: |
| |||
Class A | $ | 39,044,329 | ||
Class B | $ | 3,085,134 | ||
Class C | $ | 11,896,201 | ||
Class R | $ | 2,016,265 | ||
Class Y | $ | 1,411,325 | ||
Investor Class | $ | 14,181,067 | ||
Class R5 | $ | 7,656,417 | ||
Class R6 | $ | 203,830,628 | ||
Shares outstanding, $0.001 par value per share, |
| |||
Class A | 3,956,349 | |||
Class B | 312,495 | |||
Class C | 1,237,373 | |||
Class R | 204,146 | |||
Class Y | 140,650 | |||
Investor Class | 1,415,170 | |||
Class R5 | 774,313 | |||
Class R6 | 20,621,583 | |||
Class A: | ||||
Net asset value per share | $ | 9.87 | ||
Maximum offering price per share | ||||
(Net asset value of $9.87 ¸ 94.50%) | $ | 10.44 | ||
Class B: | ||||
Net asset value and offering price per share | $ | 9.87 | ||
Class C: | ||||
Net asset value and offering price per share | $ | 9.61 | ||
Class R: | ||||
Net asset value and offering price per share | $ | 9.88 | ||
Class Y: | ||||
Net asset value and offering price per share | $ | 10.03 | ||
Investor Class: | ||||
Net asset value and offering price per share | $ | 10.02 | ||
Class R5: | ||||
Net asset value and offering price per share | $ | 9.89 | ||
Class R6: | ||||
Net asset value and offering price per share | $ | 9.88 | ||
| * | At October 31, 2012, securities with an aggregate value of $10,189,922 were on loan to brokers. |
See accompanying Notes to Financial Statements which are an integral part of the financial statements.
11 Invesco International Core Equity Fund
Statement of Operations
For the year ended October 31, 2012
Investment income: |
| |||
Dividends (net of foreign withholding taxes of $859,218) | $ | 9,446,733 | ||
Dividends from affiliated money market funds (includes securities lending income of $240,021) | 249,709 | |||
Interest | 14,938 | |||
Total investment income | 9,711,380 | |||
Expenses: | ||||
Advisory fees | 2,109,033 | |||
Administrative services fees | 115,114 | |||
Custodian fees | 77,717 | |||
Distribution fees: | ||||
Class A | 100,425 | |||
Class B | 37,176 | |||
Class C | 133,424 | |||
Class R | 12,147 | |||
Investor Class | 36,587 | |||
Transfer agent fees — A, B, C, R, Y and Investor | 338,062 | |||
Transfer agent fees — R5 | 2,851 | |||
Trustees’ and officers’ fees and benefits | 37,009 | |||
Other | 177,878 | |||
Total expenses | 3,177,423 | |||
Less: Fees waived and expense offset arrangement(s) | (12,327 | ) | ||
Net expenses | 3,165,096 | |||
Net investment income | 6,546,284 | |||
Realized and unrealized gain (loss) from: | ||||
Net realized gain (loss) from: | ||||
Investment securities (Net of foreign taxes of $40,017) | (9,599,801 | ) | ||
Foreign currencies | (30,323 | ) | ||
| (9,630,124 | ) | |||
Change in net unrealized appreciation (depreciation) of: | ||||
Investment securities (net of foreign taxes on holdings of $(8,599)) | 9,307,363 | |||
Foreign currencies | (54,203 | ) | ||
| 9,253,160 | ||||
Net realized and unrealized gain (loss) | (376,964 | ) | ||
Net increase in net assets resulting from operations | $ | 6,169,320 | ||
See accompanying Notes to Financial Statements which are an integral part of the financial statements.
12 Invesco International Core Equity Fund
Statement of Changes in Net Assets
For the years ended October 31, 2012 and 2011
| 2012 | 2011 | |||||||
Operations: | ||||||||
Net investment income | $ | 6,546,284 | $ | 9,810,961 | ||||
Net realized gain (loss) | (9,630,124 | ) | 4,508,395 | |||||
Change in net unrealized appreciation (depreciation) | 9,253,160 | (36,414,780 | ) | |||||
Net increase (decrease) in net assets resulting from operations | 6,169,320 | (22,095,424 | ) | |||||
Distributions to shareholders from net investment income: | ||||||||
Class A | (1,194,907 | ) | (492,615 | ) | ||||
Class B | (85,504 | ) | (19,825 | ) | ||||
Class C | (295,545 | ) | (58,152 | ) | ||||
Class R | (71,058 | ) | (27,144 | ) | ||||
Class Y | (38,444 | ) | (27,226 | ) | ||||
Investor Class | (428,804 | ) | (231,567 | ) | ||||
Class R5 | (7,206,076 | ) | (4,423,038 | ) | ||||
Total distributions from net investment income | (9,320,338 | ) | (5,279,567 | ) | ||||
Share transactions-net: | ||||||||
Class A | (4,194,169 | ) | 8,638,671 | |||||
Class B | (1,465,367 | ) | (1,765,326 | ) | ||||
Class C | (3,368,728 | ) | (3,064,318 | ) | ||||
Class R | (826,663 | ) | 84,794 | |||||
Class Y | 87,877 | (351,372 | ) | |||||
Investor Class | (1,507,656 | ) | (1,895,737 | ) | ||||
Class R5 | (202,598,493 | ) | (1,264,414 | ) | ||||
Class R6 | 207,367,842 | — | ||||||
Net increase (decrease) in net assets resulting from share transactions | (6,505,357 | ) | 382,298 | |||||
Net increase (decrease) in net assets | (9,656,375 | ) | (26,992,693 | ) | ||||
Net assets: | ||||||||
Beginning of year | 292,777,741 | 319,770,434 | ||||||
End of year (includes undistributed net investment income of $5,891,323 and $8,734,402, respectively) | $ | 283,121,366 | $ | 292,777,741 | ||||
Notes to Financial Statements
October 31, 2012
NOTE 1—Significant Accounting Policies
Invesco International Core Equity Fund (the “Fund”) is a series portfolio of AIM International Mutual Funds (Invesco International Mutual Funds) (the “Trust”). The Trust is a Delaware statutory trust registered under the Investment Company Act of 1940, as amended (the “1940 Act”), as an open-end series management investment company consisting of eight separate portfolios, each authorized to issue an unlimited number of shares of beneficial interest. The assets, liabilities and operations of each portfolio are accounted for separately. Information presented in these financial statements pertains only to the Fund. Matters affecting each portfolio or class will be voted on exclusively by the shareholders of such portfolio or class.
The Fund’s investment objective is long-term growth of capital.
The Fund currently consists of eight different classes of shares: Class A, Class B, Class C, Class R, Class Y, Investor Class, Class R5 and Class R6. On September 24, 2012, Institutional Class shares were renamed Class R5 shares and the Fund began offering Class R6 shares. Investor Class shares of the Fund are offered only to certain grandfathered investors. Class A shares are sold with a front-end sales charge unless certain waiver criteria are met and under certain circumstances load waived shares may be subject to contingent deferred sales charges (“CDSC”). Class C shares are sold with a CDSC. Class R, Class Y, Investor Class, Class R5 and Class R6 shares are sold at net asset value. Effective November 30, 2010, new or additional investments in Class B shares are no longer permitted. Existing shareholders of Class B shares may continue to reinvest dividends and capital gains distributions in Class B shares until they convert to Class A shares. Also, shareholders in Class B shares will be able to exchange those shares for Class B shares of other Invesco Funds offering such shares until they convert to Class A shares. Generally, Class B shares will automatically convert to Class A shares on or about the month-end, which is at least eight years after the date of purchase. Redemption of Class B shares prior to the conversion date will be subject to a CDSC.
13 Invesco International Core Equity Fund
The following is a summary of the significant accounting policies followed by the Fund in the preparation of its financial statements.
| A. | Security Valuations — Securities, including restricted securities, are valued according to the following policy. |
A security listed or traded on an exchange (except convertible bonds) is valued at its last sales price or official closing price as of the close of the customary trading session on the exchange where the security is principally traded, or lacking any sales or official closing price on a particular day, the security may be valued at the closing bid price on that day. Securities traded in the over-the-counter market are valued based on prices furnished by independent pricing services or market makers. When such securities are valued by an independent pricing service they may be considered fair valued. Futures contracts are valued at the final settlement price set by an exchange on which they are principally traded. Listed options are valued at the mean between the last bid and ask prices from the exchange on which they are principally traded. Options not listed on an exchange are valued by an independent source at the mean between the last bid and ask prices. For purposes of determining net asset value per share, futures and option contracts generally are valued 15 minutes after the close of the customary trading session of the New York Stock Exchange (“NYSE”).
Investments in open-end and closed-end registered investment companies that do not trade on an exchange are valued at the end of day net asset value per share. Investments in open-end and closed-end registered investment companies that trade on an exchange are valued at the last sales price or official closing price as of the close of the customary trading session on the exchange where the security is principally traded.
Debt obligations (including convertible bonds) and unlisted equities are fair valued using an evaluated quote provided by an independent pricing service. Evaluated quotes provided by the pricing service may be determined without exclusive reliance on quoted prices, and may reflect appropriate factors such as institution-size trading in similar groups of securities, developments related to specific securities, dividend rate, yield, quality, type of issue, coupon rate, maturity, individual trading characteristics and other market data. Debt securities are subject to interest rate and credit risks. In addition, all debt securities involve some risk of default with respect to interest and/or principal payments.
Foreign securities (including foreign exchange contracts) are converted into U.S. dollar amounts using the applicable exchange rates as of the close of the NYSE. If market quotations are available and reliable for foreign exchange traded equity securities, the securities will be valued at the market quotations. Because trading hours for certain foreign securities end before the close of the NYSE, closing market quotations may become unreliable. If between the time trading ends on a particular security and the close of the customary trading session on the NYSE, events occur that are significant and make the closing price unreliable, the Fund may fair value the security. If the event is likely to have affected the closing price of the security, the security will be valued at fair value in good faith using procedures approved by the Board of Trustees. Adjustments to closing prices to reflect fair value may also be based on a screening process of an independent pricing service to indicate the degree of certainty, based on historical data, that the closing price in the principal market where a foreign security trade is not the current value as of the close of the NYSE. Foreign securities meeting the approved degree of certainty that the price is not reflective of current value will be priced at the indication of fair value from the independent pricing service. Multiple factors may be considered by the independent pricing service in determining adjustments to reflect fair value and may include information relating to sector indices, American Depositary Receipts and domestic and foreign index futures. Foreign securities may have additional risks including exchange rate changes, potential for sharply devalued currencies and high inflation, political and economic upheaval, the relative lack of issuer information, relatively low market liquidity and the potential lack of strict financial and accounting controls and standards.
Securities for which market prices are not provided by any of the above methods may be valued based upon quotes furnished by independent sources. The last bid price may be used to value equity securities. The mean between the last bid and asked prices is used to value debt obligations, including corporate loans.
Securities for which market quotations are not readily available or are unreliable are valued at fair value as determined in good faith by or under the supervision of the Trust’s officers following procedures approved by the Board of Trustees. Issuer specific events, market trends, bid/ask quotes of brokers and information providers and other market data may be reviewed in the course of making a good faith determination of a security’s fair value.
Valuations change in response to many factors including the historical and prospective earnings of the issuer, the value of the issuer’s assets, general economic conditions, interest rates, investor perceptions and market liquidity. Because of the inherent uncertainties of valuation, the values reflected in the financial statements may materially differ from the value received upon actual sale of those investments.
| B. | Securities Transactions and Investment Income — Securities transactions are accounted for on a trade date basis. Realized gains or losses on sales are computed on the basis of specific identification of the securities sold. Interest income is recorded on the accrual basis from settlement date. Dividend income (net of withholding tax, if any) is recorded on the ex-dividend date. |
The Fund may periodically participate in litigation related to Fund investments. As such, the Fund may receive proceeds from litigation settlements. Any proceeds received are included in the Statement of Operations as realized gain (loss) for investments no longer held and as unrealized gain (loss) for investments still held.
Brokerage commissions and mark ups are considered transaction costs and are recorded as an increase to the cost basis of securities purchased and/or a reduction of proceeds on a sale of securities. Such transaction costs are included in the determination of net realized and unrealized gain (loss) from investment securities reported in the Statement of Operations and the Statement of Changes in Net Assets and the net realized and unrealized gains (losses) on securities per share in the Financial Highlights. Transaction costs are included in the calculation of the Fund’s net asset value and, accordingly, they reduce the Fund’s total returns. These transaction costs are not considered operating expenses and are not reflected in net investment income reported in the Statement of Operations and Statement of Changes in Net Assets, or the net investment income per share and ratios of expenses and net investment income reported in the Financial Highlights, nor are they limited by any expense limitation arrangements between the Fund and the investment adviser.
The Fund allocates income and realized and unrealized capital gains and losses to a class based on the relative net assets of each class.
| C. | Country Determination — For the purposes of making investment selection decisions and presentation in the Schedule of Investments, the investment adviser may determine the country in which an issuer is located and/or credit risk exposure based on various factors. These factors include the laws of the country under which the issuer is organized, where the issuer maintains a principal office, the country in which the issuer derives 50% or more of its total revenues and the country that has the primary market for the issuer’s securities, as well as other criteria. Among the other criteria that may be evaluated for making this determination are the country in which the issuer maintains 50% or more of its assets, |
14 Invesco International Core Equity Fund
| the type of security, financial guarantees and enhancements, the nature of the collateral and the sponsor organization. Country of issuer and/or credit risk exposure has been determined to be the United States of America, unless otherwise noted. |
| D. | Distributions — Distributions from income and net realized capital gain, if any, are generally declared and paid annually and recorded on the ex-dividend date. The Fund may elect to treat a portion of the proceeds from redemptions as distributions for federal income tax purposes. |
| E. | Federal Income Taxes — The Fund intends to comply with the requirements of Subchapter M of the Internal Revenue Code necessary to qualify as a regulated investment company and to distribute substantially all of the Fund’s taxable earnings to shareholders. As such, the Fund will not be subject to federal income taxes on otherwise taxable income (including net realized capital gain) that is distributed to shareholders. Therefore, no provision for federal income taxes is recorded in the financial statements. |
The Fund files tax returns in the U.S. Federal jurisdiction and certain other jurisdictions. Generally, the Fund is subject to examinations by such taxing authorities for up to three years after the filing of the return for the tax period.
| F. | Expenses — Fees provided for under the Rule 12b-1 plan of a particular class of the Fund are charged to the operations of such class. Transfer agency fees and expenses and other shareholder recordkeeping fees and expenses attributable to Class R5 and Class R6 are allocated to each share class based on relative net assets. Sub-accounting fees attributable to Class R5 are charged to the operations of the class. Transfer agency fees and expenses and other shareholder recordkeeping fees and expenses relating to all other classes are allocated among those classes based on relative net assets. All other expenses are allocated among the classes based on relative net assets. |
| G. | Accounting Estimates — The preparation of financial statements in conformity with accounting principles generally accepted in the United States of America (“GAAP”) requires management to make estimates and assumptions that affect the reported amounts of assets and liabilities at the date of the financial statements and the reported amounts of revenues and expenses during the reporting period including estimates and assumptions related to taxation. Actual results could differ from those estimates by a significant amount. In addition, the Fund monitors for material events or transactions that may occur or become known after the period-end date and before the date the financial statements are released to print. |
| H. | Indemnifications — Under the Trust’s organizational documents, each Trustee, officer, employee or other agent of the Trust is indemnified against certain liabilities that may arise out of the performance of their duties to the Fund. Additionally, in the normal course of business, the Fund enters into contracts, including the Fund’s servicing agreements, that contain a variety of indemnification clauses. The Fund’s maximum exposure under these arrangements is unknown as this would involve future claims that may be made against the Fund that have not yet occurred. The risk of material loss as a result of such indemnification claims is considered remote. |
| I. | Redemption Fees — The Fund had a 2% redemption fee that was retained by the Fund to offset transaction costs and other expenses associated with short-term redemptions and exchanges. The fee, subject to certain exceptions, was imposed on certain redemptions or exchanges of shares within 31 days of purchase. The redemption fee was recorded as an increase in shareholder capital and was allocated among the share classes based on the relative net assets of each class. Effective January 1, 2012, the Fund eliminated the 2% redemption fee assessed on shares of the Fund redeemed or exchanged within 31 days of purchase. |
| J. | Securities Lending — The Fund may lend portfolio securities having a market value up to one-third of the Fund’s total assets. Such loans are secured by collateral equal to no less than the market value of the loaned securities determined daily by the securities lending provider. Such collateral will be cash or debt securities issued or guaranteed by the U.S. Government or any of its sponsored agencies. Cash collateral received in connection with these loans is invested in short-term money market instruments or affiliated money market funds and is shown as such on the Schedule of Investments. It is the Fund’s policy to obtain additional collateral from or return excess collateral to the borrower by the end of the next business day, following the valuation date of the securities loaned. Therefore, the value of the collateral held may be temporarily less than the value of the securities on loan. Lending securities entails a risk of loss to the Fund if and to the extent that the market value of the securities loaned were to increase and the borrower did not increase the collateral accordingly, and the borrower fails to return the securities. Upon the failure of the borrower to return the securities, collateral may be liquidated and the securities may be purchased on the open market to replace the loaned securities. The Fund could experience delays and costs in gaining access to the collateral. The Fund bears the risk of any deficiency in the amount of the collateral available for return to the borrower due to any loss on the collateral invested. Dividends received on cash collateral investments for securities lending transactions, which are net of compensation to counterparties, is included in Dividends from affiliated money market funds on the Statement of Operations. The aggregate value of securities out on loan is shown as a footnote on the Statement of Assets and Liabilities, if any. |
| K. | Foreign Currency Translations — Foreign currency is valued at the close of the NYSE based on quotations posted by banks and major currency dealers. Portfolio securities and other assets and liabilities denominated in foreign currencies are translated into U.S. dollar amounts at date of valuation. Purchases and sales of portfolio securities (net of foreign taxes withheld on disposition) and income items denominated in foreign currencies are translated into U.S. dollar amounts on the respective dates of such transactions. The Fund does not separately account for the portion of the results of operations resulting from changes in foreign exchange rates on investments and the fluctuations arising from changes in market prices of securities held. The combined results of changes in foreign exchange rates and the fluctuation of market prices on investments (net of estimated foreign tax withholding) are included with the net realized and unrealized gain or loss from investments in the Statement of Operations. Reported net realized foreign currency gains or losses arise from (1) sales of foreign currencies, (2) currency gains or losses realized between the trade and settlement dates on securities transactions, and (3) the difference between the amounts of dividends, interest, and foreign withholding taxes recorded on the Fund’s books and the U.S. dollar equivalent of the amounts actually received or paid. Net unrealized foreign currency gains and losses arise from changes in the fair values of assets and liabilities, other than investments in securities at fiscal period end, resulting from changes in exchange rates. |
The Fund may invest in foreign securities which may be subject to foreign taxes on income, gains on investments or currency repatriation, a portion of which may be recoverable.
| L. | Foreign Currency Contracts — The Fund may enter into foreign currency contracts to manage or minimize currency or exchange rate risk. The Fund may also enter into foreign currency contracts for the purchase or sale of a security denominated in a foreign currency in order to “lock in” the U.S. dollar price of that security. A foreign currency contract is an obligation to purchase or sell a specific currency for an agreed-upon price at a future date. The use of foreign currency contracts does not eliminate fluctuations in the price of the underlying securities the Fund owns or intends to acquire but establishes a rate of exchange in advance. Fluctuations in the value of these contracts are measured by the |
15 Invesco International Core Equity Fund
| difference in the contract date and reporting date exchange rates and are recorded as unrealized appreciation (depreciation) until the contracts are closed. When the contracts are closed, realized gains (losses) are recorded. Realized and unrealized gains (losses) on the contracts are included in the Statement of Operations. The primary risks associated with foreign currency contracts include failure of the counterparty to meet the terms of the contract and the value of the foreign currency changing unfavorably. These risks may be in excess of the amounts reflected in the Statement of Assets and Liabilities. |
NOTE 2—Advisory Fees and Other Fees Paid to Affiliates
The Trust has entered into a master investment advisory agreement with Invesco Advisers, Inc. (the “Adviser” or “Invesco”). Under the terms of the investment advisory agreement, the Fund pays an advisory fee to the Adviser based on the annual rate of the Fund’s average daily net assets as follows:
| Average Daily Net Assets | Rate | |||||
First $500 million | 0 | .75% | ||||
Next $500 million | 0 | .65% | ||||
From $1 billion | 0 | .55% | ||||
From $2 billion | 0 | .45% | ||||
From $4 billion | 0 | .40% | ||||
From $6 billion | 0 | .375% | ||||
Over $8 billion | 0 | .35% | ||||
Under the terms of a master sub-advisory agreement between the Adviser and each of Invesco Asset Management Deutschland GmbH, Invesco Asset Management Limited, Invesco Asset Management (Japan) Limited, Invesco Australia Limited, Invesco Hong Kong Limited, Invesco Senior Secured Management, Inc. and Invesco Canada Ltd. (collectively, the “Affiliated Sub-Advisers”) the Adviser, not the Fund, may pay 40% of the fees paid to the Adviser to any such Affiliated Sub-Adviser(s) that provide discretionary investment management services to the Fund based on the percentage of assets allocated to such Sub-Adviser(s).
The Adviser has contractually agreed, through at least June 30, 2013, to waive advisory fees and/or reimburse expenses of all shares to the extent necessary to limit total annual fund operating expenses after fee waiver and/or expense reimbursement (excluding certain items discussed below) of Class A, Class B, Class C, Class R, Class Y, Investor Class, Class R5 and Class R6 shares to 2.25%, 3.00%, 3.00%, 2.50%, 2.00%, 2.25%, 2.00% and 2.00%, respectively, of average daily net assets. In determining the Adviser’s obligation to waive advisory fees and/or reimburse expenses, the following expenses are not taken into account, and could cause the total annual fund operating expenses after fee waiver and/or expense reimbursement to exceed the numbers reflected above: (1) interest; (2) taxes; (3) dividend expense on short sales; (4) extraordinary items or non-routine items,including litigation expenses; and (5) expenses that the Fund has incurred but did not actually pay because of an expense offset arrangement. Unless the Board of Trustees and Invesco mutually agree to amend or continue the fee waiver agreement, it will terminate on June 30, 2013. The Adviser did not waive fees and/or reimburse expenses during the period under this expense limitation.
Further, the Adviser has contractually agreed, through at least June 30, 2013, to waive the advisory fee payable by the Fund in an amount equal to 100% of the net advisory fees the Adviser receives from the affiliated money market funds on investments by the Fund of uninvested cash (excluding investments of cash collateral from securities lending) in such affiliated money market funds.
For the year ended October 31, 2012, the Adviser waived advisory fees of $11,249.
The Trust has entered into a master administrative services agreement with Invesco pursuant to which the Fund has agreed to pay Invesco for certain administrative costs incurred in providing accounting services to the Fund. For the year ended October 31, 2012, expenses incurred under the agreement are shown in the Statement of Operations as Administrative services fees.
The Trust has entered into a transfer agency and service agreement with Invesco Investment Services, Inc. (“IIS”) pursuant to which the Fund has agreed to pay IIS a fee for providing transfer agency and shareholder services to the Fund and reimburse IIS for certain expenses incurred by IIS in the course of providing such services. IIS may make payments to intermediaries that provide omnibus account services, sub-accounting services and/or networking services. All fees payable by IIS to intermediaries that provide omnibus account services or sub-accounting are charged back to the Fund, subject to certain limitations approved by the Trust’s Board of Trustees. For the year ended October 31, 2012, expenses incurred under the agreement are shown in the Statement of Operations as Transfer agent fees.
The Trust has entered into master distribution agreements with Invesco Distributors, Inc. (“IDI”) to serve as the distributor for the Class A, Class B, Class C, Class R, Class Y, Investor Class, Class R5 and Class R6 shares of the Fund. The Trust has adopted plans pursuant to Rule 12b-1 under the 1940 Act with respect to the Fund’s Class A, Class B, Class C, Class R and Investor Class shares (collectively, the “Plans”). The Fund, pursuant to the Plans, pays IDI compensation at the annual rate of 0.25% of the Fund’s average daily net assets of Class A shares, 1.00% of the average daily net assets of Class B and Class C shares, 0.50% of the average daily net assets of Class R shares and 0.25% of the average daily net assets of Investor Class shares. Of the Plan payments, up to 0.25% of the average daily net assets of each class of shares may be paid to furnish continuing personal shareholder services to customers who purchase and own shares of such classes. Any amounts not paid as a service fee under the Plans would constitute an asset-based sales charge. Rules of the Financial Industry Regulatory Authority (“FINRA”) impose a cap on the total sales charges, including asset-based sales charges, that may be paid by any class of shares of the Fund. For the year ended October 31, 2012, expenses incurred under the Plans are shown in the Statement of Operations as Distribution fees.
Front-end sales commissions and CDSC (collectively, the “sales charges”) are not recorded as expenses of the Fund. Front-end sales commissions are deducted from proceeds from the sales of Fund shares prior to investment in Class A shares of the Fund. CDSC are deducted from redemption proceeds prior to remittance to the shareholder. During the year ended October 31, 2012, IDI advised the Fund that IDI retained $5,328 in front-end sales commissions from the sale of Class A shares and $65, $4,091 and $261 from Class A, Class B and Class C shares, respectively, for CDSC imposed on redemptions by shareholders.
Certain officers and trustees of the Trust are officers and directors of the Adviser, IIS and/or IDI.
16 Invesco International Core Equity Fund
NOTE 3—Additional Valuation Information
GAAP defines fair value as the price that would be received to sell an asset or paid to transfer a liability in an orderly transaction between market participants at the measurement date, under current market conditions. GAAP establishes a hierarchy that prioritizes the inputs to valuation methods giving the highest priority to readily available unadjusted quoted prices in an active market for identical assets (Level 1) and the lowest priority to significant unobservable inputs (Level 3) generally when market prices are not readily available or are unreliable. Based on the valuation inputs, the securities or other investments are tiered into one of three levels. Changes in valuation methods may result in transfers in or out of an investment’s assigned level:
| Level 1 — | Prices are determined using quoted prices in an active market for identical assets. |
| Level 2 — | Prices are determined using other significant observable inputs. Observable inputs are inputs that other market participants may use in pricing a security. These may include quoted prices for similar securities, interest rates, prepayment speeds, credit risk, yield curves, loss severities, default rates, discount rates, volatilities and others. |
| Level 3 — | Prices are determined using significant unobservable inputs. In situations where quoted prices or observable inputs are unavailable (for example, when there is little or no market activity for an investment at the end of the period), unobservable inputs may be used. Unobservable inputs reflect the Fund’s own assumptions about the factors market participants would use in determining fair value of the securities or instruments and would be based on the best available information. |
The following is a summary of the tiered valuation input levels, as of October 31, 2012. The level assigned to the securities valuations may not be an indication of the risk or liquidity associated with investing in those securities. Because of the inherent uncertainties of valuation, the values reflected in the financial statements may materially differ from the value received upon actual sale of those investments.
During the year ended October 31, 2012, there were transfers from Level 1 to Level 2 of $2,995,296 and from Level 2 to Level 1 of $104,302,818, due to foreign fair value adjustments.
| Level 1 | Level 2 | Level 3 | Total | |||||||||||||
Australia | $ | 5,249,092 | $ | 21,507,123 | $ | — | $ | 26,756,215 | ||||||||
Brazil | 2,264,176 | — | — | 2,264,176 | ||||||||||||
Canada | 7,717,244 | — | — | 7,717,244 | ||||||||||||
China | 1,890,554 | 1,660,120 | — | 3,550,674 | ||||||||||||
Denmark | 3,421,951 | — | — | 3,421,951 | ||||||||||||
France | 10,877,081 | 21,327,303 | — | 32,204,384 | ||||||||||||
Germany | 13,504,209 | 1,849,654 | — | 15,353,863 | ||||||||||||
Hong Kong | 3,987,087 | 9,887,262 | — | 13,874,349 | ||||||||||||
India | 381,942 | 1,096,246 | — | 1,478,188 | ||||||||||||
Indonesia | — | 336,372 | — | 336,372 | ||||||||||||
Italy | 5,176,346 | — | — | 5,176,346 | ||||||||||||
Japan | 59,303,524 | 12,615,346 | — | 71,918,870 | ||||||||||||
Mexico | 569,894 | — | — | 569,894 | ||||||||||||
Norway | 9,482,542 | — | — | 9,482,542 | ||||||||||||
Poland | — | 522,815 | — | 522,815 | ||||||||||||
Russia | — | 1,863,405 | — | 1,863,405 | ||||||||||||
South Africa | 1,145,813 | 862,057 | — | 2,007,870 | ||||||||||||
South Korea | 1,766,178 | 2,409,122 | — | 4,175,300 | ||||||||||||
Spain | 3,165,218 | 7,962,538 | — | 11,127,756 | ||||||||||||
Switzerland | — | 21,029,363 | — | 21,029,363 | ||||||||||||
Taiwan | 210,713 | 624,109 | — | 834,822 | ||||||||||||
Thailand | — | 841,645 | — | 841,645 | ||||||||||||
Turkey | — | 293,262 | — | 293,262 | ||||||||||||
United Arab Emirates | 447,963 | — | — | 447,963 | ||||||||||||
United Kingdom | 16,783,041 | 25,323,985 | — | 42,107,026 | ||||||||||||
United States | 11,934,669 | — | — | 11,934,669 | ||||||||||||
Total Investments | $ | 159,279,237 | $ | 132,011,727 | $ | — | $ | 291,290,964 | ||||||||
NOTE 4—Expense Offset Arrangement(s)
The expense offset arrangement is comprised of transfer agency credits which result from balances in Demand Deposit Accounts (DDA) used by the transfer agent for clearing shareholder transactions. For the year ended October 31, 2012, the Fund received credits from this arrangement, which resulted in the reduction of the Fund’s total expenses of $1,078.
17 Invesco International Core Equity Fund
NOTE 5—Trustees’ and Officers’ Fees and Benefits
“Trustees’ and Officers’ Fees and Benefits” include amounts accrued by the Fund to pay remuneration to certain Trustees and Officers of the Fund. Trustees have the option to defer compensation payable by the Fund, and “Trustees’ and Officers’ Fees and Benefits” also include amounts accrued by the Fund to fund such deferred compensation amounts. Those Trustees who defer compensation have the option to select various Invesco Funds in which their deferral accounts shall be deemed to be invested. Finally, certain current Trustees are eligible to participate in a retirement plan that provides for benefits to be paid upon retirement to Trustees over a period of time based on the number of years of service. The Fund may have certain former Trustees who also participate in a retirement plan and receive benefits under such plan. “Trustees’ and Officers’ Fees and Benefits” include amounts accrued by the Fund to fund such retirement benefits. Obligations under the deferred compensation and retirement plans represent unsecured claims against the general assets of the Fund.
NOTE 6—Cash Balances
The Fund is permitted to temporarily carry a negative or overdrawn balance in its account with State Street Bank and Trust Company, the custodian bank. Such balances, if any at period end, are shown in the Statement of Assets and Liabilities under the payable caption Amount due custodian. To compensate the custodian bank for such overdrafts, the overdrawn Fund may either (1) leave funds as a compensating balance in the account so the custodian bank can be compensated by earning the additional interest; or (2) compensate by paying the custodian bank at a rate agreed upon by the custodian bank and Invesco, not to exceed the contractually agreed upon rate.
NOTE 7—Distributions to Shareholders and Tax Components of Net Assets
Tax Character of Distributions to Shareholders Paid During the Years Ended October 31, 2012 and 2011:
| 2012 | 2011 | |||||||
Ordinary income | $ | 9,320,338 | $ | 5,279,567 | ||||
Tax Components of Net Assets at Period-End:
| 2012 | ||||
Undistributed ordinary income | $ | 5,985,468 | ||
Net unrealized appreciation — investments | 9,480,413 | |||
Net unrealized appreciation — other investments | 23,565 | |||
Temporary book/tax differences | (94,144 | ) | ||
Capital loss carryforward | (81,297,198 | ) | ||
Shares of beneficial interest | 349,023,262 | |||
Total net assets | $ | 283,121,366 | ||
The difference between book-basis and tax-basis unrealized appreciation (depreciation) is due to differences in the timing of recognition of gains and losses on investments for tax and book purposes. The Fund’s net unrealized appreciation difference is attributable primarily to wash sales.
The temporary book/tax differences are a result of timing differences between book and tax recognition of income and/or expenses. The Fund’s temporary book/tax differences are the result of the trustee deferral of compensation and retirement plan benefits.
Capital loss carryforward is calculated and reported as of a specific date. Results of transactions and other activity after that date may affect the amount of capital loss carryforward actually available for the Fund to utilize. The Regulated Investment Company Modernization Act of 2010 (the “Act”) eliminated the eight-year carryover period for capital losses that arise in taxable years beginning after its enactment date of December 22, 2010. Consequently, these capital losses can be carried forward for an unlimited period. However, capital losses with an expiration period may not be used to offset capital gains until all net capital losses without an expiration date have been utilized. Additionally, post-enactment capital loss carryovers will retain their character as either short-term or long-term capital losses instead of as short-term capital losses as under prior law. The ability to utilize capital loss carryforward in the future may be limited under the Internal Revenue Code and related regulations based on the results of future transactions.
The Fund has a capital loss carryforward as of October 31, 2012, which expires as follows:
| Capital Loss Carryforward* | ||||||||||||
| Expiration | Short-Term | Long-Term | Total | |||||||||
October 31, 2016 | $ | 11,926,757 | $ | — | $ | 11,926,757 | ||||||
October 31, 2017 | 59,517,145 | — | 59,517,145 | |||||||||
Not subject to expiration | 4,399,528 | 5,453,768 | 9,853,296 | |||||||||
| $ | 75,843,430 | $ | 5,453,768 | $ | 81,297,198 | |||||||
| * | Capital loss carryforward as of the date listed above is reduced for limitations, if any, to the extent required by the Internal Revenue Code. |
18 Invesco International Core Equity Fund
NOTE 8—Investment Securities
The aggregate amount of investment securities (other than short-term securities, U.S. Treasury obligations and money market funds, if any) purchased and sold by the Fund during the year ended October 31, 2012 was $54,920,139 and $56,719,713, respectively. Cost of investments on a tax basis includes the adjustments for financial reporting purposes as of the most recently completed federal income tax reporting period-end.
| Unrealized Appreciation (Depreciation) of Investment Securities on a Tax Basis | ||||
Aggregate unrealized appreciation of investment securities | $ | 40,090,472 | ||
Aggregate unrealized (depreciation) of investment securities | (30,610,059 | ) | ||
Net unrealized appreciation of investment securities | $ | 9,480,413 | ||
Cost of investments for tax purposes is $281,810,551.
NOTE 9—Reclassification of Permanent Differences
Primarily as a result of differing book/tax treatment foreign currency transactions and foreign capital gain taxes, on October 31, 2012, undistributed net investment income was decreased by $69,025, undistributed net realized gain (loss) was increased by $70,341 and shares of beneficial interest was decreased by $1,316. This reclassification had no effect on the net assets of the Fund.
NOTE 10—Share Information
| Summary of Share Activity | ||||||||||||||||
| Years ended October 31, | ||||||||||||||||
| 2012(a) | 2011 | |||||||||||||||
| Shares | Amount | Shares | Amount | |||||||||||||
Sold: | ||||||||||||||||
Class A | 575,295 | $ | 5,527,199 | 1,656,894 | $ | 18,905,446 | ||||||||||
Class B | 28,628 | 282,638 | 118,128 | 1,348,732 | ||||||||||||
Class C | 105,635 | 996,063 | 123,695 | 1,321,952 | ||||||||||||
Class R | 70,699 | 677,226 | 98,816 | 1,059,284 | ||||||||||||
Class Y | 42,853 | 425,170 | 26,495 | 296,534 | ||||||||||||
Investor Class | 64,957 | 636,710 | 91,664 | 1,026,309 | ||||||||||||
Class R5 | 3,199,332 | 29,178,405 | 2,874,759 | 30,019,524 | ||||||||||||
Class R6(b) | 20,951,195 | 210,629,278 | — | — | ||||||||||||
Issued as reinvestment of dividends: | ||||||||||||||||
Class A | 124,973 | 1,180,999 | 41,920 | 459,022 | ||||||||||||
Class B | 8,828 | 83,953 | 1,718 | 18,918 | ||||||||||||
Class C | 29,526 | 273,705 | 4,747 | 50,933 | ||||||||||||
Class R | 7,496 | 71,058 | 2,474 | 27,144 | ||||||||||||
Class Y | 3,796 | 36,365 | 2,028 | 22,519 | ||||||||||||
Investor Class | 43,718 | 419,256 | 20,260 | 225,084 | ||||||||||||
Class R5 | 765,787 | 7,206,058 | 405,410 | 4,423,027 | ||||||||||||
Automatic conversion of Class B shares to Class A shares: | ||||||||||||||||
Class A | 106,817 | 1,021,343 | 157,225 | 1,708,417 | ||||||||||||
Class B | (106,504 | ) | (1,021,343 | ) | (157,076 | ) | (1,708,417 | ) | ||||||||
Reacquired:(c) | ||||||||||||||||
Class A | (1,241,662 | ) | (11,923,710 | ) | (1,153,714 | ) | (12,434,214 | ) | ||||||||
Class B | (83,859 | ) | (810,615 | ) | (129,629 | ) | (1,424,559 | ) | ||||||||
Class C | (498,561 | ) | (4,638,496 | ) | (416,726 | ) | (4,437,203 | ) | ||||||||
Class R | (162,168 | ) | (1,574,947 | ) | (89,623 | ) | (1,001,634 | ) | ||||||||
Class Y | (38,980 | ) | (373,658 | ) | (60,565 | ) | (670,425 | ) | ||||||||
Investor Class | (268,692 | ) | (2,563,622 | ) | (284,590 | ) | (3,147,130 | ) | ||||||||
Class R5 | (23,944,212 | ) | (238,982,956 | ) | (3,266,068 | ) | (35,706,965 | ) | ||||||||
Class R6(b) | (329,612 | ) | (3,261,436 | ) | — | — | ||||||||||
Net increase in share activity | (544,715 | ) | $ | (6,505,357 | ) | 68,242 | $ | 382,298 | ||||||||
| (a) | 71% of the outstanding shares of the Fund are owned by affiliated mutual funds. Affiliated mutual funds are other mutual funds that are also advised by Invesco. |
| (b) | Commencement date of September 24, 2012. |
| (c) | Net of redemption fees of $131 and $1,280 allocated among the classes based on relative net assets of each class for the years ended October 31, 2012 and 2011, respectively. |
19 Invesco International Core Equity Fund
NOTE 11—Financial Highlights
The following schedule presents financial highlights for a share of the Fund outstanding throughout the periods indicated.
| Net asset value, beginning of period | Net investment income(a) | Net gains (losses) on securities (both realized and unrealized) | Total from investment operations | Dividends from net investment income | Distributions from net realized gains | Total distributions | Net asset value, end of period(b) | Total return(c) | Net assets, end of period (000’s omitted) | Ratio of expenses to average net assets with fee waivers and/or expenses absorbed | Ratio of expenses to average net assets without fee waivers and/ or expenses absorbed | Ratio of net investment income to average net assets | Portfolio turnover(d) | |||||||||||||||||||||||||||||||||||||||||||
Class A |
| |||||||||||||||||||||||||||||||||||||||||||||||||||||||
Year ended 10/31/12 | $ | 10.02 | $ | 0.18 | $ | (0.05 | ) | $ | 0.13 | $ | (0.28 | ) | $ | — | $ | (0.28 | ) | $ | 9.87 | 1.40 | % | $ | 39,044 | 1.59 | %(e) | 1.59 | %(e) | 1.86 | %(e) | 20 | % | |||||||||||||||||||||||||
Year ended 10/31/11 | 10.96 | 0.30 | (1.11 | ) | (0.81 | ) | (0.13 | ) | — | (0.13 | ) | 10.02 | (7.46 | ) | 43,983 | 1.54 | 1.54 | 2.71 | 26 | |||||||||||||||||||||||||||||||||||||
Year ended 10/31/10 | 10.34 | 0.17 | 0.62 | 0.79 | (0.17 | ) | — | (0.17 | ) | 10.96 | 7.68 | 40,422 | 1.51 | 1.51 | 1.59 | 39 | ||||||||||||||||||||||||||||||||||||||||
Year ended 10/31/09 | 8.63 | 0.14 | 1.87 | 2.01 | (0.30 | ) | — | (0.30 | ) | 10.34 | 24.35 | 61,810 | 1.62 | 1.62 | 1.63 | 43 | ||||||||||||||||||||||||||||||||||||||||
Year ended 10/31/08 | 16.77 | 0.28 | (7.01 | ) | (6.73 | ) | (0.18 | ) | (1.23 | ) | (1.41 | ) | 8.63 | (43.45 | ) | 45,100 | 1.45 | 1.45 | 2.13 | 38 | ||||||||||||||||||||||||||||||||||||
Class B |
| |||||||||||||||||||||||||||||||||||||||||||||||||||||||
Year ended 10/31/12 | 10.00 | 0.11 | (0.05 | ) | 0.06 | (0.19 | ) | — | (0.19 | ) | 9.87 | 0.67 | 3,085 | 2.34 | (e) | 2.34 | (e) | 1.11 | (e) | 20 | ||||||||||||||||||||||||||||||||||||
Year ended 10/31/11 | 10.92 | 0.22 | (1.11 | ) | (0.89 | ) | (0.03 | ) | — | (0.03 | ) | 10.00 | (8.16 | ) | 4,654 | 2.29 | 2.29 | 1.96 | 26 | |||||||||||||||||||||||||||||||||||||
Year ended 10/31/10 | 10.30 | 0.09 | 0.62 | 0.71 | (0.09 | ) | — | (0.09 | ) | 10.92 | 6.88 | 6,906 | 2.26 | 2.26 | 0.84 | 39 | ||||||||||||||||||||||||||||||||||||||||
Year ended 10/31/09 | 8.54 | 0.08 | 1.86 | 1.94 | (0.18 | ) | — | (0.18 | ) | 10.30 | 23.26 | 9,864 | 2.37 | 2.37 | 0.88 | 43 | ||||||||||||||||||||||||||||||||||||||||
Year ended 10/31/08 | 16.58 | 0.18 | (6.93 | ) | (6.75 | ) | (0.06 | ) | (1.23 | ) | (1.29 | ) | 8.54 | (43.79 | ) | 10,873 | 2.20 | 2.20 | 1.38 | 38 | ||||||||||||||||||||||||||||||||||||
Class C |
| |||||||||||||||||||||||||||||||||||||||||||||||||||||||
Year ended 10/31/12 | 9.74 | 0.11 | (0.05 | ) | 0.06 | (0.19 | ) | — | (0.19 | ) | 9.61 | 0.69 | 11,896 | 2.34 | (e) | 2.34 | (e) | 1.11 | (e) | 20 | ||||||||||||||||||||||||||||||||||||
Year ended 10/31/11 | 10.65 | 0.21 | (1.09 | ) | (0.88 | ) | (0.03 | ) | — | (0.03 | ) | 9.74 | (8.28 | ) | 15,597 | 2.29 | 2.29 | 1.96 | 26 | |||||||||||||||||||||||||||||||||||||
Year ended 10/31/10 | 10.04 | 0.09 | 0.61 | 0.70 | (0.09 | ) | — | (0.09 | ) | 10.65 | 6.96 | 20,110 | 2.26 | 2.26 | 0.84 | 39 | ||||||||||||||||||||||||||||||||||||||||
Year ended 10/31/09 | 8.33 | 0.07 | 1.82 | 1.89 | (0.18 | ) | — | (0.18 | ) | 10.04 | 23.25 | 22,854 | 2.37 | 2.37 | 0.88 | 43 | ||||||||||||||||||||||||||||||||||||||||
Year ended 10/31/08 | 16.21 | 0.18 | (6.77 | ) | (6.59 | ) | (0.06 | ) | (1.23 | ) | (1.29 | ) | 8.33 | (43.80 | ) | 21,323 | 2.20 | 2.20 | 1.38 | 38 | ||||||||||||||||||||||||||||||||||||
Class R |
| |||||||||||||||||||||||||||||||||||||||||||||||||||||||
Year ended 10/31/12 | 10.01 | 0.15 | (0.03 | ) | 0.12 | (0.25 | ) | — | (0.25 | ) | 9.88 | 1.29 | 2,016 | 1.84 | (e) | 1.84 | (e) | 1.61 | (e) | 20 | ||||||||||||||||||||||||||||||||||||
Year ended 10/31/11 | 10.95 | 0.27 | (1.11 | ) | (0.84 | ) | (0.10 | ) | — | (0.10 | ) | 10.01 | (7.76 | ) | 2,885 | 1.79 | 1.79 | 2.46 | 26 | |||||||||||||||||||||||||||||||||||||
Year ended 10/31/10 | 10.33 | 0.14 | 0.62 | 0.76 | (0.14 | ) | — | (0.14 | ) | 10.95 | 7.41 | 3,028 | 1.76 | 1.76 | 1.34 | 39 | ||||||||||||||||||||||||||||||||||||||||
Year ended 10/31/09 | 8.61 | 0.12 | 1.86 | 1.98 | (0.26 | ) | — | (0.26 | ) | 10.33 | 23.88 | 2,697 | 1.87 | 1.87 | 1.38 | 43 | ||||||||||||||||||||||||||||||||||||||||
Year ended 10/31/08 | 16.72 | 0.24 | (6.98 | ) | (6.74 | ) | (0.14 | ) | (1.23 | ) | (1.37 | ) | 8.61 | (43.55 | ) | 2,077 | 1.70 | 1.70 | 1.88 | 38 | ||||||||||||||||||||||||||||||||||||
Class Y |
| |||||||||||||||||||||||||||||||||||||||||||||||||||||||
Year ended 10/31/12 | 10.18 | 0.21 | (0.05 | ) | 0.16 | (0.31 | ) | — | (0.31 | ) | 10.03 | 1.67 | 1,411 | 1.34 | (e) | 1.34 | (e) | 2.11 | (e) | 20 | ||||||||||||||||||||||||||||||||||||
Year ended 10/31/11 | 11.14 | 0.33 | (1.12 | ) | (0.79 | ) | (0.17 | ) | — | (0.17 | ) | 10.18 | (7.23 | ) | 1,354 | 1.29 | 1.29 | 2.96 | 26 | |||||||||||||||||||||||||||||||||||||
Year ended 10/31/10 | 10.51 | 0.19 | 0.64 | 0.83 | (0.20 | ) | — | (0.20 | ) | 11.14 | 7.91 | 1,839 | 1.26 | 1.26 | 1.84 | 39 | ||||||||||||||||||||||||||||||||||||||||
Year ended 10/31/09 | 8.75 | 0.18 | 1.88 | 2.06 | (0.30 | ) | — | (0.30 | ) | 10.51 | 24.61 | 1,983 | 1.37 | 1.37 | 1.88 | 43 | ||||||||||||||||||||||||||||||||||||||||
Year ended 10/31/08(f) | 10.45 | 0.01 | (1.71 | ) | (1.70 | ) | — | — | — | 8.75 | (16.27 | ) | 185 | 1.30 | (g) | 1.30 | (g) | 2.28 | (g) | 38 | ||||||||||||||||||||||||||||||||||||
Investor Class |
| |||||||||||||||||||||||||||||||||||||||||||||||||||||||
Year ended 10/31/12 | 10.16 | 0.18 | (0.04 | ) | 0.14 | (0.28 | ) | — | (0.28 | ) | 10.02 | 1.48 | 14,181 | 1.59 | (e) | 1.59 | (e) | 1.86 | (e) | 20 | ||||||||||||||||||||||||||||||||||||
Year ended 10/31/11 | 11.12 | 0.30 | (1.13 | ) | (0.83 | ) | (0.13 | ) | — | (0.13 | ) | 10.16 | (7.53 | ) | 16,009 | 1.54 | 1.54 | 2.71 | 26 | |||||||||||||||||||||||||||||||||||||
Year ended 10/31/10 | 10.49 | 0.17 | 0.63 | 0.80 | (0.17 | ) | — | (0.17 | ) | 11.12 | 7.67 | 19,438 | 1.51 | 1.51 | 1.59 | 39 | ||||||||||||||||||||||||||||||||||||||||
Year ended 10/31/09 | 8.75 | 0.14 | 1.90 | 2.04 | (0.30 | ) | — | (0.30 | ) | 10.49 | 24.35 | 21,500 | 1.62 | 1.62 | 1.63 | 43 | ||||||||||||||||||||||||||||||||||||||||
Year ended 10/31/08 | 16.98 | 0.28 | (7.10 | ) | (6.82 | ) | (0.18 | ) | (1.23 | ) | (1.41 | ) | 8.75 | (43.44 | ) | 19,710 | 1.45 | 1.45 | 2.13 | 38 | ||||||||||||||||||||||||||||||||||||
Class R5 |
| |||||||||||||||||||||||||||||||||||||||||||||||||||||||
Year ended 10/31/12 | 10.04 | 0.24 | (0.04 | ) | 0.20 | (0.35 | ) | — | (0.35 | ) | 9.89 | 2.15 | 7,656 | 0.90 | (e) | 0.90 | (e) | 2.55 | (e) | 20 | ||||||||||||||||||||||||||||||||||||
Year ended 10/31/11 | 10.99 | 0.37 | (1.11 | ) | (0.74 | ) | (0.21 | ) | — | (0.21 | ) | 10.04 | (6.85 | ) | 208,295 | 0.91 | 0.91 | 3.34 | 26 | |||||||||||||||||||||||||||||||||||||
Year ended 10/31/10 | 10.37 | 0.23 | 0.63 | 0.86 | (0.24 | ) | — | (0.24 | ) | 10.99 | 8.35 | 228,027 | 0.91 | 0.91 | 2.19 | 39 | ||||||||||||||||||||||||||||||||||||||||
Year ended 10/31/09 | 8.70 | 0.20 | 1.86 | 2.06 | (0.39 | ) | — | (0.39 | ) | 10.37 | 25.10 | 241,432 | 0.94 | 0.94 | 2.31 | 43 | ||||||||||||||||||||||||||||||||||||||||
Year ended 10/31/08 | 16.89 | 0.35 | (7.05 | ) | (6.70 | ) | (0.26 | ) | (1.23 | ) | (1.49 | ) | 8.70 | (43.08 | ) | 209,494 | 0.87 | 0.87 | 2.71 | 38 | ||||||||||||||||||||||||||||||||||||
Class R6 |
| |||||||||||||||||||||||||||||||||||||||||||||||||||||||
Year ended 10/31/12(f) | 10.05 | 0.03 | (0.20 | ) | (0.17 | ) | — | — | — | 9.88 | (1.69 | ) | 203,831 | 0.87 | (e)(g) | 0.87 | (e)(g) | 2.58 | (e)(g) | 20 | ||||||||||||||||||||||||||||||||||||
| (a) | Calculated using average shares outstanding. |
| (b) | Includes redemption fees added to shares of beneficial interest which were less than $0.005 per share. |
| (c) | Includes adjustments in accordance with accounting principles generally accepted in the United States of America and as such, the net asset value for financial reporting purposes and the returns based upon those net asset values may differ from the net asset value and returns for shareholder transactions. Does not include sales charges and is not annualized for periods less than one year, if applicable. |
| (d) | Portfolio turnover is calculated at the fund level and is not annualized for periods less than one year, if applicable. |
| (e) | Ratios are based on average daily net assets (000’s) of $40,170, $3,718, $13,342, $2,429, $1,380, $14,635, $184,754 and $200,109 for Class A, Class B, Class C, Class R, Class Y, Investor Class, Class R5 and Class R6 shares, respectively. |
| (f) | Commencement date of October 3, 2008 and September 24, 2012 for Class Y shares and Class R6 shares, respectively. |
| (g) | Annualized. |
20 Invesco International Core Equity Fund
Report of Independent Registered Public Accounting Firm
To the Board of Trustees of AIM International Mutual Funds (Invesco International Mutual Funds)
and Shareholders of Invesco International Core Equity Fund:
In our opinion, the accompanying statement of assets and liabilities, including the schedule of investments, and the related statements of operations and of changes in net assets and the financial highlights present fairly, in all material respects, the financial position of Invesco International Core Equity Fund (one of the funds constituting AIM International Mutual Funds (Invesco International Mutual Funds), hereafter referred to as the “Fund”) at October 31, 2012, the results of its operations for the year then ended, the changes in its net assets for each of the two years in the period then ended and the financial highlights for each of the five years in the period then ended, in conformity with accounting principles generally accepted in the United States of America. These financial statements and financial highlights (hereafter referred to as “financial statements”) are the responsibility of the Fund’s management; our responsibility is to express an opinion on these financial statements based on our audits. We conducted our audits of these financial statements in accordance with the standards of the Public Company Accounting Oversight Board (United States). Those standards require that we plan and perform the audit to obtain reasonable assurance about whether the financial statements are free of material misstatement. An audit includes examining, on a test basis, evidence supporting the amounts and disclosures in the financial statements, assessing the accounting principles used and significant estimates made by management, and evaluating the overall financial statement presentation. We believe that our audits, which included confirmation of securities at October 31, 2012 by correspondence with the custodian and brokers, provide a reasonable basis for our opinion.
PRICEWATERHOUSECOOPERS LLP
December 21, 2012
Houston, Texas
21 Invesco International Core Equity Fund
Calculating your ongoing Fund expenses
Example
As a shareholder of the Fund, you incur two types of costs: (1) transaction costs, which may include sales charges (loads) on purchase payments or contingent deferred sales charges on redemptions, and redemption fees, if any; and (2) ongoing costs, including management fees, distribution and/or service (12b-1) fees, and other Fund expenses. This example is intended to help you understand your ongoing costs (in dollars) of investing in the Fund and to compare these costs with ongoing costs of investing in other mutual funds. With the exception of the actual ending account value and expenses of the Class R6 shares, the example is based on an investment of $1,000 invested at the beginning of the period and held for the entire period May 1, 2012 through October 31, 2012. The actual ending account value and expenses of the Class R6 shares in the example below are based on an investment of $1,000 invested as of close of business September 24, 2012 (commencement date) and held through October 31, 2012.
Actual expenses
The table below provides information about actual account values and actual expenses. You may use the information in this table, together with the amount you invested, to estimate the expenses that you paid over the period. Simply divide your account value by $1,000 (for example, an $8,600 account value divided by $1,000 = 8.6), then multiply the result by the number in the table under the heading entitled “Actual Expenses Paid During Period” to estimate the expenses you paid on your account during this period (as of close of business September 24, 2012 through October 31, 2012 for the Class R6 shares). Because the actual ending account value and expense information in the example is not based upon a six month period for the Class R6 shares, the ending account value and expense information may not provide a meaningful comparison to mutual funds that provide such information for a full six month period.
Hypothetical example for comparison purposes
The table below also provides information about hypothetical account values and hypothetical expenses based on the Fund’s actual expense ratio and an assumed rate of return of 5% per year before expenses, which is not the Fund’s actual return.
The hypothetical account values and expenses may not be used to estimate the actual ending account balance or expenses you paid for the period. You may use this information to compare the ongoing costs of investing in the Fund and other funds. To do so, compare this 5% hypothetical example with the 5% hypothetical examples that appear in the shareholder reports of the other funds.
Please note that the expenses shown in the table are meant to highlight your ongoing costs only and do not reflect any transaction costs, such as sales charges (loads) on purchase payments, contingent deferred sales charges on redemptions, and redemption fees, if any. Therefore, the hypothetical information is useful in comparing ongoing costs only, and will not help you determine the relative total costs of owning different funds. In addition, if these transaction costs were included, your costs would have been higher.
| Class | Beginning Account Value (05/01/12) | ACTUAL | HYPOTHETICAL (5% annual return before expenses) | Annualized Expense Ratio | ||||||||||||||||||||
| Ending Account Value (10/31/12)1 | Expenses Paid During Period2 | Ending Account Value (10/31/12) | Expenses Paid During Period3 | |||||||||||||||||||||
A | $ | 1,000.00 | $ | 998.00 | $ | 7.99 | $ | 1,017.14 | $ | 8.06 | 1.59 | % | ||||||||||||
B | 1,000.00 | 995.00 | 11.73 | 1,013.37 | 11.84 | 2.34 | ||||||||||||||||||
C | 1,000.00 | 994.80 | 11.73 | 1,013.37 | 11.84 | 2.34 | ||||||||||||||||||
R | 1,000.00 | 998.00 | 9.24 | 1,015.89 | 9.32 | 1.84 | ||||||||||||||||||
Y | 1,000.00 | 999.00 | 6.73 | 1,018.40 | 6.80 | 1.34 | ||||||||||||||||||
Investor | 1,000.00 | 999.00 | 7.94 | 1,017.19 | 8.01 | 1.58 | ||||||||||||||||||
R5 | 1,000.00 | 1,002.00 | 4.38 | 1,020.76 | 4.42 | 0.87 | ||||||||||||||||||
R6 | 1,000.00 | 983.10 | 0.90 | 1,020.76 | 4.42 | 0.87 | ||||||||||||||||||
| 1 | The actual ending account value is based on the actual total return of the Funds for the period May 1, 2012, through October 31, 2012 (as of close of business September 24,2012 through October 31, 2012 for the Class R6 shares), after actual expenses and will differ from the hypothetical ending account value which is based on the Fund’s expense ratio and a hypothetical annual return of 5% before expenses. |
| 2 | Expenses are equal to each Fund’s annualized expense ratio as indicated above multiplied by the average account value over the period, multiplied by 184/366 to reflect the most recent fiscal half year. For the Class R6 shares actual expenses are equal to the annualized expense ratio indicated above multiplied by the average account value over the period, multiplied by 38 (as of close of business September 24, 2012 through October 31, 2012)/366. Because the Class R6 shares have not been in existence for a full six month period, the actual ending account value and expense information shown may not provide a meaningful comparison to fund expense information of classes that show such data for a full six month period and, because the actual ending account value and expense information in the expense example covers a short time period, return and expense data may not be indicative of return and expense data for longer time periods. |
| 3 | Hypothetical expenses are equal to the annualized expense ratio indicated above multiplied by the average account value over the period, multiplied by 184/366 to reflect a one-half year period. The hypothetical ending account value and expenses may be used to compare ongoing costs of investing in Class R6 shares of each Fund and other funds because such data is based on a full six month period. |
22 Invesco International Core Equity Fund
Approval of Investment Advisory and Sub-Advisory Contracts
The Board of Trustees (the Board) of AIM International Mutual Funds (Invesco International Mutual Funds) is required under the Investment Company Act of 1940, as amended, to approve annually the renewal of the Invesco International Core Equity Fund (the Fund) investment advisory agreement with Invesco Advisers, Inc. (Invesco Advisers) and the Master Intergroup Sub-Advisory Contract for Mutual Funds (the sub-advisory contracts) with Invesco Asset Management Deutschland GmbH, Invesco Asset Management Limited, Invesco Asset Management (Japan) Limited, Invesco Australia Limited, Invesco Hong Kong Limited, Invesco Senior Secured Management, Inc. and Invesco Canada Ltd. (collectively, the Affiliated Sub-Advisers). During contract renewal meetings held on June 19-20, 2012, the Board as a whole, and the disinterested or “independent” Trustees, who comprise 80% of the Board, voting separately, approved the continuance of the Fund’s investment advisory agreement and the sub-advisory contracts for another year, effective July 1, 2012. In doing so, the Board considered the process that it follows in reviewing and approving the Fund’s investment advisory agreement and sub-advisory contracts and the information that it is provided. The Board determined that the Fund’s investment advisory agreement and the sub-advisory contracts are in the best interests of the Fund and its shareholders and the compensation to Invesco Advisers and the Affiliated Sub-Advisers under the agreements is fair and reasonable.
The Board’s Fund Evaluation Process
The Board’s Investments Committee has established three Sub-Committees, each of which is primarily responsible for overseeing the management of a number of the series portfolios of the funds advised by Invesco Advisers (the Invesco Funds). The Sub-Committees meet throughout the year to review the performance of their assigned funds, including reviewing materials prepared under the direction of the independent Senior Officer, an officer of the Invesco Funds who reports directly to the independent Trustees. Over the course of each year, the Sub-Committees meet with portfolio managers for their assigned Invesco Funds and other members of management to review the performance, investment objective(s), policies, strategies, limitations and investment risks of these funds. The Sub-Committees meet regularly and at designated contract renewal meetings each year to conduct a review of the performance, fees, expenses and other matters related to their assigned Invesco Funds. Each Sub-Committee recommends to the Investments Committee, which in turn recommends to the full Board, whether and on what terms to approve the continuance of each Invesco Fund’s investment advisory agreement and sub-advisory contracts for another year.
During the contract renewal process, the Trustees receive comparative performance and fee
data regarding the Invesco Funds prepared by Invesco Advisers and an independent company, Lipper Inc. (Lipper). The Trustees also receive an independent written evaluation from the Senior Officer. The Senior Officer’s evaluation is prepared as part of his responsibility to manage the process by which the Invesco Funds’ proposed management fees are negotiated during the annual contract renewal process to ensure they are negotiated in a manner that is at arms’ length and reasonable. The independent Trustees are assisted in their annual evaluation of the Fund’s investment advisory agreement by the Senior Officer and by independent legal counsel. In addition to meetings with Invesco Advisers and fund counsel, the independent Trustees also discuss the continuance of the investment advisory agreement and sub-advisory contracts in private sessions with the Senior Officer and independent legal counsel.
In evaluating the fairness and reasonableness of the Fund’s investment advisory agreement and sub-advisory contracts, the Board considered, among other things, the factors discussed below. The Trustees recognized that the advisory fees for the Invesco Funds include advisory fees that are the result of years of review and negotiation between the Trustees and Invesco Advisers as well as advisory fees previously approved by a different board that, at the time, was responsible for overseeing Morgan Stanley and Van Kampen funds, which have become Invesco Funds following the acquisition of the retail mutual fund business of Morgan Stanley. The Trustees’ deliberations and conclusions in a particular year may be based in part on their deliberations and conclusions regarding these same arrangements throughout the year and in prior years. One Trustee may have weighed a particular piece of information or factor differently than another Trustee.
The discussion below serves as the Senior Officer’s independent written evaluation with respect to the Fund’s investment advisory agreement as well as a discussion of the material factors and related conclusions that formed the basis for the Board’s approval of the Fund’s investment advisory agreement and sub-advisory contracts. Unless otherwise stated, this information is current as of June 20, 2012, and may not reflect consideration of factors that became known to the Board after that date, including, for example, changes to the Fund’s performance, advisory fees, expense limitations and/or fee waivers.
Factors and Conclusions and Summary of Independent Written Fee Evaluation
| A. | Nature, Extent and Quality of Services Provided by Invesco Advisers and the Affiliated Sub-Advisers |
The Board reviewed the advisory services provided to the Fund by Invesco Advisers under the Fund’s investment advisory agreement, the performance of Invesco Advisers in providing these services,
and the credentials and experience of the officers and employees of Invesco Advisers who provide these services, including the Fund’s portfolio manager or managers, with whom the Sub-Committees met during the year. The Board’s review of the qualifications of Invesco Advisers to provide advisory services included the Board’s consideration of Invesco Advisers’ performance and investment process oversight, independent credit analysis and investment risk management.
In determining whether to continue the Fund’s investment advisory agreement, the Board considered the prior relationship between Invesco Advisers and the Fund, as well as the Board’s knowledge of Invesco Advisers’ operations, and concluded that it is beneficial to maintain the current relationship, in part because of such prior relationship and knowledge. The Board also considered services that Invesco Advisers and its affiliates provide to the Invesco Funds such as various back office support functions, equity and fixed income trading operations, internal audit, distribution and legal and compliance. The Board concluded that the nature, extent and quality of the services provided to the Fund by Invesco Advisers are appropriate and satisfactory and consistent with the terms of the Fund’s investment advisory agreement.
The Board reviewed the services provided by the Affiliated Sub-Advisers under the sub-advisory contracts and the credentials and experience of the officers and employees of the Affiliated Sub-Advisers who provide these services. The Board noted that the Affiliated Sub-Advisers have offices and personnel that are located in financial centers around the world. As a result, the Affiliated Sub-Advisers can provide research and investment analysis on the markets and economies of various countries in which the Fund invests and make recommendations on securities of companies located in such countries. The Board concluded that the sub-advisory contracts benefit the Fund and its shareholders by permitting Invesco Advisers to use the resources and talents of the Affiliated Sub-Advisers in managing the Fund. The Board concluded that the nature, extent and quality of the services provided by the Affiliated Sub-Advisers are appropriate and satisfactory and consistent with the terms of the Fund’s sub-advisory contracts.
| B. | Fund Performance |
The Board considered Fund performance as a relevant factor in considering whether to approve the investment advisory agreement. The Board did not view Fund performance as a relevant factor in considering whether to approve the sub-advisory contracts for the Fund, as no Affiliated Sub-Adviser currently manages assets of the Fund.
The Board compared the Fund’s performance during the past one, three and five calendar years to the performance of all funds in the Lipper performance universe and against the Lipper International Large-Cap Core Funds Index. The Board noted that performance of Investor Class
23 Invesco International Core Equity Fund
shares of the Fund was in the fourth quintile of the performance universe for the one and three year periods and the third quintile for the five year period (the first quintile being the best performing funds and the fifth quintile being the worst performing funds). The Board noted that performance of Investor Class shares of the Fund was below the performance of the Index for the one, three and five year periods. Invesco Advisers advised the Board that performance has been affected by the high-quality, large-cap bias of the Fund, as well as stock selection, and Invesco Advisers is monitoring the Fund. The Trustees also reviewed more recent Fund performance and this review did not change their conclusions.
| C. | Advisory and Sub-Advisory Fees and Fee Waivers |
The Board compared the Fund’s contractual advisory fee rate to the contractual advisory fee rates of funds in the Fund’s Lipper expense group at a common asset level. The Board noted that the contractual advisory fee rate for Investor Class shares of the Fund was at the median contractual advisory fee rate of funds in the expense group. The Board also reviewed the methodology used by Lipper in providing expense group information, which includes using audited financial data from the most recent annual report of each fund in the expense group that was publicly available as of the end of the past calendar year and including only one fund per investment adviser. The Board noted that comparative data is as of varying dates, which may affect the comparability of data during times of market volatility.
The Board noted that Invesco Advisers and the Affiliated Sub-Advisers sub-advise two other mutual funds with investment strategies comparable to those of the Fund.
The Board also considered the fees charged by Invesco Advisers and the Affiliated Sub-Advisers to other client accounts with investment strategies comparable to those of the Fund. The Board noted that Invesco Advisers or the Affiliated Sub-Advisers may charge lower fees to large institutional clients solely for investment management services. Invesco Advisers reviewed with the Board the significantly greater scope of services it provides to the Invesco Funds relative to other client accounts. These additional services include provision of administrative services, officers and office space, oversight of service providers, preparation of annual registration statement updates and financial information and regulatory compliance under the Investment Company Act of 1940, as amended. Invesco Advisers also reviewed generally the higher frequency of shareholder purchases and redemptions in the Invesco Funds relative to the flow of assets for other client accounts. Invesco Advisers advised the Board that advance notice of redemptions is often provided to Invesco Advisers by institutional clients. The Board did note that sub-advisory fees charged by the Affiliated Sub-Advisers to manage the Invesco Funds and to manage other client accounts tended to be more comparable, reflecting a more comparable scope of services. The Board concluded that the aggregate services provided to the Invesco Funds
were sufficiently different from those provided to institutional clients, and the Board did not place significant weight on these fee comparisons.
The Board also considered the services provided by the Affiliated Sub-Advisers pursuant to the sub-advisory contracts, as well as the allocation of fees between Invesco Advisers and the Affiliated Sub-Advisers pursuant to the sub-advisory contracts. The Board noted that Invesco Advisers provides services to sub-advised Invesco Funds, including oversight of the Affiliated Sub-Advisers as well as the additional services described above other than day-to-day portfolio management. The Board also noted that the sub-advisory fees have no direct effect on the Fund or its shareholders, as they are paid by Invesco Advisers to the Affiliated Sub-Advisers.
Based upon the information and considerations described above, the Board concluded that the Fund’s advisory and sub-advisory fees are fair and reasonable.
| D. | Economies of Scale and Breakpoints |
The Board considered the extent to which there are economies of scale in the provision of advisory services to the Fund. The Board also considered whether the Fund benefits from economies of scale through contractual breakpoints in the Fund’s advisory fee schedule and were assisted in their review by a report from the Senior Officer. The Board also noted that the Fund shares directly in economies of scale through lower fees charged by third party service providers based on the combined size of the Invesco Funds and other clients advised by Invesco Advisers. The Board noted that Invesco Advisers proposes sharing economies of scale in administration expenses by lowering per class administrative fees.
| E. | Profitability and Financial Resources |
The Board reviewed information from Invesco Advisers concerning the costs of the advisory and other services that Invesco Advisers and its affiliates provide to the Fund and the profitability of Invesco Advisers and its affiliates in providing these services for the year ended December 31, 2011. The Board reviewed with Invesco Advisers the methodology used to prepare the profitability information. The Board considered the profitability of Invesco Advisers in connection with managing the Fund and the Invesco Funds. The Board noted that Invesco Advisers continues to operate at a net profit from services Invesco Advisers and its subsidiaries provide to the Invesco Funds and the Fund. The Board did not deem the level of profits realized by Invesco Advisers and its affiliates from providing services to the Fund to be excessive given the nature, quality and extent of the services provided to the Invesco Funds. The Board received and accepted information from Invesco Advisers demonstrating that Invesco Advisers and each Affiliated Sub-Adviser are financially sound and have the resources necessary to perform their obligations under the investment advisory agreement and sub-advisory contracts.
| F. | Collateral Benefits to Invesco Advisers and its Affiliates |
The Board considered various other benefits received by Invesco Advisers and its affiliates from the relationship with the Fund, including the fees
received for their provision of administrative, transfer agency and distribution services to the Fund. The Board considered the performance of Invesco Advisers and its affiliates in providing these services and the organizational structure employed to provide these services. The Board also considered that these services are provided to the Fund pursuant to written contracts that are reviewed and approved on an annual basis by the Board; that the services are required for the operation of the Fund; that Invesco Advisers and its affiliates can provide services, the nature and quality of which are at least equal to those provided by others offering the same or similar services; and that the fees for such services are fair and reasonable in light of the usual and customary charges by others for services of the same nature and quality.
The Board considered the benefits realized by Invesco Advisers and the Affiliated Sub-Advisers as a result of portfolio brokerage transactions executed through “soft dollar” arrangements. The Board noted that soft dollar arrangements shift the payment obligation for research services from Invesco Advisers and the Affiliated Sub-Advisers to the Invesco Funds and therefore may reduce Invesco Advisers’ and the Affiliated Sub-Advisers’ expenses. The Board also considered periodic reports from the Chief Compliance Officer of the Invesco Funds demonstrating that these arrangements are consistent with regulatory requirements. The Board did not deem the soft dollar arrangements to be inappropriate.
The Board considered that the Fund’s uninvested cash and cash collateral from any securities lending arrangements may be invested in money market funds advised by Invesco Advisers pursuant to procedures approved by the Board. The Board noted that Invesco Advisers receives advisory fees from these affiliated money market funds attributable to such investments, although Invesco Advisers has contractually agreed to waive through varying periods the advisory fees payable by the Invesco Funds. The waiver is in an amount equal to 100% of the net advisory fee Invesco Advisers receives from the affiliated money market funds with respect to the Fund’s investment in the affiliated money market funds of uninvested cash, but not cash collateral. The Board concluded that the Fund’s investment of uninvested cash and cash collateral from any securities lending arrangements in the affiliated money market funds is in the best interests of the Fund and its shareholders.
The Board also considered use of an affiliated broker to execute certain trades for the Fund and that such trades are executed in compliance with rules under the Investment Company Act of 1940, as amended.
24 Invesco International Core Equity Fund
Tax Information
Form 1099-DIV, Form 1042-S and other year–end tax information provide shareholders with actual calendar year amounts that should be included in their tax returns. Shareholders should consult their tax advisors.
The following distribution information is being provided as required by the Internal Revenue Code or to meet a specific state’s requirement.
The Fund designates the following amounts or, if subsequently determined to be different, the maximum amount allowable for its fiscal year ended October 31, 2012:
Federal and State Income Tax | ||||
Qualified Dividend Income* | 100 | % | ||
Corporate Dividends Received Deduction* | 0.91 | % | ||
| * | The above percentages are based on ordinary income dividends paid to shareholders during the Fund’s fiscal year. |
25 Invesco International Core Equity Fund
Trustees and Officers
The address of each trustee and officer is AIM International Mutual Funds (Invesco International Mutual Funds) (the “Trust”), 11 Greenway Plaza, Suite 1000, Houston, Texas 77046-1173. The trustees serve for the life of the Trust, subject to their earlier death, incapacitation, resignation, retirement or removal as more specifically provided in the Trust’s organizational documents. Each officer serves for a one year term or until their successors are elected and qualified. Column two below includes length of time served with predecessor entities, if any.
| Name, Year of Birth and Position(s) Held with the Trust | Trustee and/ or Officer Since | Principal Occupation(s) During Past 5 Years | Number of Complex Overseen by Trustee | Other Directorship(s) Held by Trustee During Past 5 Years | ||||
| Interested Persons | ||||||||
| Martin L. Flanagan1 — 1960 Trustee | 2007 | Executive Director, Chief Executive Officer and President, Invesco Ltd. (ultimate parent of Invesco and a global investment management firm); Advisor to the Board, Invesco Advisers, Inc. (formerly known as Invesco Institutional (N.A.), Inc.); Trustee, The Invesco Funds; Vice Chair, Investment Company Institute; and Member of Executive Board, SMU Cox School of Business
Formerly: Chairman, Invesco Advisers, Inc. (registered investment adviser); Director, Chairman, Chief Executive Officer and President, IVZ Inc. (holding company), INVESCO Group Services, Inc. (service provider) and Invesco North American Holdings, Inc. (holding company); Director, Chief Executive Officer and President, Invesco Holding Company Limited (parent of Invesco and a global investment management firm); Director, Invesco Ltd.; Chairman, Investment Company Institute and President, Co-Chief Executive Officer, Co-President, Chief Operating Officer and Chief Financial Officer, Franklin Resources, Inc. (global investment management organization) | 123 | None | ||||
Philip A. Taylor2 — 1954 Trustee, President and Principal Executive Officer | 2006 | Head of North American Retail and Senior Managing Director, Invesco Ltd.; Director, Co-Chairman, Co-President and Co-Chief Executive Officer, Invesco Advisers, Inc. (formerly known as Invesco Institutional (N.A.), Inc.) (registered investment adviser); Director, Chairman, Chief Executive Officer and President, Invesco Management Group, Inc. (formerly known as Invesco Aim Management Group, Inc.) (financial services holding company); Director and President, INVESCO Funds Group, Inc. (registered investment adviser and registered transfer agent); Director and Chairman, Invesco Investment Services, Inc. (formerly known as Invesco Aim Investment Services, Inc.) (registered transfer agent) and IVZ Distributors, Inc. (formerly known as INVESCO Distributors, Inc.) (registered broker dealer); Director, President and Chairman, Invesco Inc. (holding company) and Invesco Canada Holdings Inc. (holding company); Chief Executive Officer, Invesco Corporate Class Inc. (corporate mutual fund company) and Invesco Canada Fund Inc. (corporate mutual fund company); Director, Chairman and Chief Executive Officer, Invesco Canada Ltd. (formerly known as Invesco Trimark Ltd./Invesco Trimark Ltèe) (registered investment adviser and registered transfer agent); Trustee, President and Principal Executive Officer, The Invesco Funds (other than AIM Treasurer’s Series Trust (Invesco Treasurer’s Series Trust) and Short-Term Investments Trust); Trustee and Executive Vice President, The Invesco Funds (AIM Treasurer’s Series Trust (Invesco Treasurer’s Series Trust) and Short-Term Investments Trust only); Director, Invesco Investment Advisers LLC (formerly known as Van Kampen Asset Management); Director, Chief Executive Officer and President, Van Kampen Exchange Corp.
Formerly: Director and Chairman, Van Kampen Investor Services Inc.; Director, Chief Executive Officer and President, 1371 Preferred Inc. (holding company); and Van Kampen Investments Inc.; Director and President, AIM GP Canada Inc. (general partner for limited partnerships); and Van Kampen Advisors, Inc.; Director and Chief Executive Officer, Invesco Trimark Dealer Inc. (registered broker dealer); Director, Invesco Distributors, Inc. (formerly known as Invesco Aim Distributors, Inc.) (registered broker dealer); Manager, Invesco PowerShares Capital Management LLC; Director, Chief Executive Officer and President, Invesco Advisers, Inc.; Director, Chairman, Chief Executive Officer and President, Invesco Aim Capital Management, Inc.; President, Invesco Trimark Dealer Inc. and Invesco Trimark Ltd./Invesco Trimark Ltèe; Director and President, AIM Trimark Corporate Class Inc. and AIM Trimark Canada Fund Inc.; Senior Managing Director, Invesco Holding Company Limited; Trustee and Executive Vice President, Tax-Free Investments Trust; Director and Chairman, Fund Management Company (former registered broker dealer); President and Principal Executive Officer, The Invesco Funds (AIM Treasurer’s Series Trust (Invesco Treasurer’s Series Trust), Short-Term Investments Trust and Tax-Free Investments Trust only); President, AIM Trimark Global Fund Inc. and AIM Trimark Canada Fund Inc. | 123 | None | ||||
Wayne W. Whalen3 — 1939 Trustee | 2010 | Of Counsel, and prior to 2010, partner in the law firm of Skadden, Arps, Slate, Meagher & Flom LLP, legal counsel to certain funds in the Fund Complex
| 136 | Director of the Mutual Fund Directors Forum, a nonprofit membership organization for investment directors; Chairman and Director of the Abraham Lincoln Presidential Library Foundation; and Director of the Stevenson Center for Democracy |
| 1 | Mr. Flanagan is considered an interested person of the Trust because he is an officer of the adviser to the Trust, and an officer and a director of Invesco Ltd., ultimate parent of the adviser to the Trust. |
| 2 | Mr. Taylor is considered an interested person of the Trust because he is an officer and a director of the adviser to, and a director of the principal underwriter of, the Trust. |
| 3 | Mr. Whalen is considered an “interested person” (within the meaning of Section 2(a)(19) of the 1940 Act) of certain Funds in the Invesco Fund Complex by reason of he and his firm currently providing legal services as legal counsel to such Funds in the Invesco Fund Complex. |
T-1 Invesco International Core Equity Fund
Trustees and Officers—(continued)
| Name, Year of Birth and Position(s) Held with the Trust | Trustee and/ or Officer Since | Principal Occupation(s) During Past 5 Years | Number of Funds in Fund Complex Overseen by Trustee | Other Directorship(s) Held by Trustee During Past 5 Years | ||||
| Independent Trustees | ||||||||
Bruce L. Crockett — 1944 Trustee and Chair | 1992 | Chairman, Crockett Technologies Associates (technology consulting company)
Formerly: Director, Captaris (unified messaging provider); Director, President and Chief Executive Officer COMSAT Corporation; and Chairman, Board of Governors of INTELSAT (international communications company) | 123 | ACE Limited (insurance company); and Investment Company Institute | ||||
David C. Arch — 1945 Trustee | 2010 | Retired.
Formerly: Chairman and Chief Executive Officer of Blistex Inc., (consumer health care products manufacturer) | 136 | Member of the Heartland Alliance Advisory Board, a nonprofit organization serving human needs based in Chicago. Board member of the Illinois Manufacturers’ Association. Member of the Board of Visitors, Institute for the Humanities, University of Michigan | ||||
Frank S. Bayley — 1939 Trustee | 2001 | Retired
Formerly: Director, Badgley Funds, Inc. (registered investment company) (2 portfolios) and Partner, law firm of Baker & McKenzie | 123 | Director and Chairman, C.D. Stimson Company (a real estate investment company) | ||||
James T. Bunch — 1942 Trustee | 2003 | Managing Member, Grumman Hill Group LLC (family office private equity management)
Formerly: Founder, Green, Manning & Bunch Ltd. (investment banking firm)(1988-2010); Executive Committee, United States Golf Association; and Director, Policy Studies, Inc. and Van Gilder Insurance Corporation | 123 | Chairman, Board of Governors, Western Golf Association, Chairman-elect, Evans Scholars Foundation and Director, Denver Film Society | ||||
Rodney F. Dammeyer — 1940 Trustee | 2010 | Chairman of CAC, LLC, (private company offering capital investment and management advisory services)
Formerly: Prior to January 2004, Director of TeleTech Holdings Inc.; Prior to 2002, Director of Arris Group, Inc.; Prior to 2001, Managing Partner at Equity Group Corporate Investments. Prior to 1995, Vice Chairman of Anixter International. Prior to 1985, experience includes Senior Vice President and Chief Financial Officer of Household International, Inc., Executive Vice President and Chief Financial Officer of Northwest Industries, Inc. and Partner of Arthur Andersen & Co. | 136 | Director of Quidel Corporation and Stericycle, Inc. Prior to May 2008, Trustee of The Scripps Research Institute. Prior to February 2008, Director of Ventana Medical Systems, Inc. Prior to April 2007, Director of GATX Corporation. Prior to April 2004, Director of TheraSense, Inc. | ||||
Albert R. Dowden — 1941 Trustee | 2000 | Director of a number of public and private business corporations, including the Boss Group, Ltd. (private investment and management); Reich & Tang Funds (5 portfolios) (registered investment company); and Homeowners of America Holding Corporation/ Homeowners of America Insurance Company (property casualty company)
Formerly: Director, Continental Energy Services, LLC (oil and gas pipeline service); Director, CompuDyne Corporation (provider of product and services to the public security market) and Director, Annuity and Life Re (Holdings), Ltd. (reinsurance company); Director, President and Chief Executive Officer, Volvo Group North America, Inc.; Senior Vice President, AB Volvo; Director of various public and private corporations; Chairman, DHJ Media, Inc.; Director Magellan Insurance Company; and Director, The Hertz Corporation, Genmar Corporation (boat manufacturer), National Media Corporation; Advisory Board of Rotary Power International (designer, manufacturer, and seller of rotary power engines); and Chairman, Cortland Trust, Inc. (registered investment company) | 123 | Director of Nature’s Sunshine Products, Inc. | ||||
Jack M. Fields — 1952 Trustee | 1997 | Chief Executive Officer, Twenty First Century Group, Inc. (government affairs company); and Owner and Chief Executive Officer, Dos Angelos Ranch, L.P. (cattle, hunting, corporate entertainment), Discovery Global Education Fund (non-profit) and Cross Timbers Quail Research Ranch (non-profit)
Formerly: Chief Executive Officer, Texana Timber LP (sustainable forestry company) and member of the U.S. House of Representatives | 123 | Insperity (formerly known as Administaff) | ||||
Carl Frischling — 1937 Trustee | 1991 | Partner, law firm of Kramer Levin Naftalis and Frankel LLP | 123 | Director, Reich & Tang Funds (6 portfolios) | ||||
Prema Mathai-Davis — 1950 Trustee | 1998 | Retired
Formerly: Chief Executive Officer, YWCA of the U.S.A. | 123 | None | ||||
Larry Soll — 1942 Trustee | 2003 | Retired
Formerly: Chairman, Chief Executive Officer and President, Synergen Corp. (a biotechnology company) | 123 | None |
T-2 Invesco International Core Equity Fund
Trustees and Officers—(continued)
| Name, Year of Birth and Position(s) Held with the Trust | Trustee and/ or Officer Since | Principal Occupation(s) During Past 5 Years | Number of Funds in Fund Complex Overseen by Trustee | Other Directorship(s) Held by Trustee During Past 5 Years | ||||
| Independent Trustees—(continued) | ||||||||
Hugo F. Sonnenschein — 1940 Trustee | 2010 | Distinguished Service Professor and President Emeritus of the University of Chicago and the Adam Smith Distinguished Service Professor in the Department of Economics at the University of Chicago.
Formerly: President of the University of Chicago | 136 | Trustee of the University of Rochester and a member of its investment committee. Member of the National Academy of Sciences, the American Philosophical Society and a fellow of the American Academy of Arts and Sciences | ||||
Raymond Stickel, Jr. — 1944 Trustee | 2005 | Retired
Formerly: Director, Mainstay VP Series Funds, Inc. (25 portfolios) and Partner, Deloitte & Touche | 123 | None | ||||
| Other Officers | ||||||||
Russell C. Burk — 1958 Senior Vice President and Senior Officer | 2005 | Senior Vice President and Senior Officer, The Invesco Funds | N/A | N/A | ||||
John M. Zerr — 1962 Senior Vice President, Chief Legal Officer and Secretary | 2006 | Director, Senior Vice President, Secretary and General Counsel, Invesco Management Group, Inc. (formerly known as Invesco Aim Management Group, Inc.) and Van Kampen Exchange Corp.; Senior Vice President, Invesco Advisers, Inc. (formerly known as Invesco Institutional (N.A.), Inc.) (registered investment adviser); Senior Vice President and Secretary, Invesco Distributors, Inc. (formerly known as Invesco Aim Distributors, Inc.); Director, Vice President and Secretary, Invesco Investment Services, Inc. (formerly known as Invesco Aim Investment Services, Inc.) and IVZ Distributors, Inc. (formerly known as INVESCO Distributors, Inc.); Director and Vice President, INVESCO Funds Group, Inc.; Senior Vice President, Chief Legal Officer and Secretary, The Invesco Funds; Manager, Invesco PowerShares Capital Management LLC; Director, Secretary and General Counsel, Invesco Investment Advisers LLC (formerly known as Van Kampen Asset Management); Secretary and General Counsel, Invesco Capital Markets, Inc. (formerly known as Van Kampen Funds Inc.) and Chief Legal Officer, PowerShares Exchange-Traded Fund Trust, PowerShares Exchange-Traded Fund Trust II, PowerShares India Exchange-Traded Fund Trust and PowerShares Actively Managed Exchange-Traded Fund Trust
Formerly: Director and Secretary, Van Kampen Advisors Inc.; Director Vice President, Secretary and General Counsel Van Kampen Investor Services Inc.; Director, Invesco Distributors, Inc. (formerly known as Invesco Aim Distributors, Inc.); Director, Senior Vice President, General Counsel and Secretary, Invesco Advisers, Inc.; and Van Kampen Investments Inc.; Director, Vice President and Secretary, Fund Management Company; Director, Senior Vice President, Secretary, General Counsel and Vice President, Invesco Aim Capital Management, Inc.; Chief Operating Officer and General Counsel, Liberty Ridge Capital, Inc. (an investment adviser); Vice President and Secretary, PBHG Funds (an investment company) and PBHG Insurance Series Fund (an investment company); Chief Operating Officer, General Counsel and Secretary, Old Mutual Investment Partners (a broker-dealer); General Counsel and Secretary, Old Mutual Fund Services (an administrator) and Old Mutual Shareholder Services (a shareholder servicing center); Executive Vice President, General Counsel and Secretary, Old Mutual Capital, Inc. (an investment adviser); and Vice President and Secretary, Old Mutual Advisors Funds (an investment company) | N/A | N/A | ||||
Lisa O. Brinkley — 1959 Vice President | 2004 | Global Assurance Officer, Invesco Ltd. and Vice President, The Invesco Funds
Formerly: Chief Compliance Officer, Invesco Distributors, Inc. (formerly known as Invesco Aim Distributors, Inc.), Invesco Investment Services, Inc.(formerly known as Invesco Aim Investment Services, Inc.) and Van Kampen Investor Services Inc.; Senior Vice President, Invesco Management Group, Inc.; Senior Vice President and Chief Compliance Officer, Invesco Advisers, Inc. and The Invesco Funds; Vice President and Chief Compliance Officer, Invesco Aim Capital Management, Inc. and Invesco Distributors, Inc.; Vice President, Invesco Investment Services, Inc. and Fund Management Company | N/A | N/A | ||||
T-3 Invesco International Core Equity Fund
Trustees and Officers—(continued)
| Name, Year of Birth and Position(s) Held with the Trust | Trustee and/ or Officer Since | Principal Occupation(s) During Past 5 Years | Number of Funds in Fund Complex Overseen by Trustee | Other Directorship(s) Held by Trustee During Past 5 Years | ||||
| Other Officers—(continued) | ||||||||
Karen Dunn Kelley — 1960 Vice President | 2004 | Head of Invesco’s World Wide Fixed Income and Cash Management Group; Senior Vice President, Invesco Management Group, Inc. (formerly known as Invesco Aim Management Group, Inc.) and Invesco Advisers, Inc. (formerly known as Invesco Institutional (N.A.), Inc.) (registered investment adviser); Executive Vice President, Invesco Distributors, Inc. (formerly known as Invesco Aim Distributors, Inc.); Director, Invesco Mortgage Capital Inc., INVESCO Global Asset Management Limited, Invesco Management Company Limited and INVESCO Management S.A.; Vice President, The Invesco Funds (other than AIM Treasurer’s Series Trust (Invesco Treasurer’s Series Trust) and Short-Term Investments Trust); and President and Principal Executive Officer, The Invesco Funds (AIM Treasurer’s Series Trust (Invesco Treasurer’s Series Trust) and Short-Term Investments Trust only)
Formerly: Senior Vice President, Van Kampen Investments Inc.; Vice President, Invesco Advisers, Inc. (formerly known as Invesco Institutional (N.A.), Inc.); Director of Cash Management and Senior Vice President, Invesco Advisers, Inc. and Invesco Aim Capital Management, Inc.; President and Principal Executive Officer, Tax-Free Investments Trust; Director and President, Fund Management Company; Chief Cash Management Officer, Director of Cash Management, Senior Vice President, and Managing Director, Invesco Aim Capital Management, Inc.; Director of Cash Management, Senior Vice President, and Vice President, Invesco Advisers, Inc. and The Invesco Funds (AIM Treasurer’s Series Trust (Invesco Treasurer’s Series Trust), Short-Term Investments Trust and Tax-Free Investments Trust only) | N/A | N/A | ||||
Sheri Morris — 1964 Vice President, Treasurer and Principal Financial Officer | 1999 | Vice President, Treasurer and Principal Financial Officer, The Invesco Funds; Vice President, Invesco Advisers, Inc. (formerly known as Invesco Institutional (N.A.), Inc.) (registered investment adviser); and Treasurer, PowerShares Exchange-Traded Fund Trust, PowerShares Exchange-Traded Fund Trust II, PowerShares India Exchange-Traded Fund Trust and PowerShares Actively Managed Exchange-Traded Fund Trust
Formerly: Vice President, Invesco Advisers, Inc., Invesco Aim Capital Management, Inc. and Invesco Aim Private Asset Management, Inc.; Assistant Vice President and Assistant Treasurer, The Invesco Funds and Assistant Vice President, Invesco Advisers, Inc., Invesco Aim Capital Management, Inc. and Invesco Aim Private Asset Management, Inc. | N/A | N/A | ||||
Yinka Akinsola — 1977 Anti-Money Laundering Compliance Officer | 2011 | Anti-Money Laundering Compliance Officer, Invesco Advisers, Inc. (formerly known as Invesco Institutional (N.A.), Inc.) (registered investment adviser); Invesco Distributors, Inc. (formerly known as Invesco Aim Distributors, Inc.), Invesco Investment Services, Inc. (formerly known as Invesco Aim Investment Services, Inc.), Invesco Management Group, Inc., The Invesco Funds, Invesco Van Kampen Closed-End Funds, Van Kampen Exchange Corp., Invesco Capital Markets, Inc. (formerly known as Van Kampen Funds Inc.), PowerShares Exchange-Traded Fund Trust, PowerShares Exchange-Traded Fund Trust II, PowerShares India Exchange-Traded Fund Trust, and PowerShares Actively Managed Exchange-Traded Fund Trust
Formerly: Regulatory Analyst III, Financial Industry Regulatory Authority (FINRA). | N/A | N/A | ||||
Todd L. Spillane — 1958 Chief Compliance Officer | 2006 | Senior Vice President, Invesco Management Group, Inc. (formerly known as Invesco Aim Management Group, Inc.) and Van Kampen Exchange Corp.; Senior Vice President and Chief Compliance Officer, Invesco Advisers, Inc. (registered investment adviser) (formerly known as Invesco Institutional (N.A.), Inc.); Chief Compliance Officer, The Invesco Funds; Vice President, Invesco Distributors, Inc. (formerly known as Invesco Aim Distributors, Inc.) and Invesco Investment Services, Inc. (formerly known as Invesco Aim Investment Services, Inc.)
Formerly: Chief Compliance Officer, Invesco Van Kampen Closed-End Funds; Senior Vice President, Van Kampen Investments Inc.; Senior Vice President and Chief Compliance Officer, Invesco Advisers, Inc. and Invesco Aim Capital Management, Inc.; Chief Compliance Officer, INVESCO Private Capital Investments, Inc. (holding company), Invesco Private Capital, Inc. (registered investment adviser), Invesco Global Asset Management (N.A.), Inc., Invesco Senior Secured Management, Inc. (registered investment adviser) and Van Kampen Investor Services Inc., PowerShares Exchange-Traded Fund Trust, PowerShares Exchange-Traded Fund Trust II, PowerShares India Exchange-Traded Fund Trust and PowerShares Actively Managed Exchange-Traded Fund Trust; Vice President, Invesco Aim Capital Management, Inc. and Fund Management Company | N/A | N/A | ||||
The Statement of Additional Information of the Trust includes additional information about the Fund’s Trustees and is available upon request, without charge, by calling 1.800.959.4246. Please refer to the Fund’s prospectus for information on the Fund’s sub-advisers.
Office of the Fund 11 Greenway Plaza, Suite 1000 Houston, TX 77046-1173 | Investment Adviser Invesco Advisers, Inc. 1555 Peachtree Street, N.E. Atlanta, GA 30309 | Distributor Invesco Distributors, Inc. 11 Greenway Plaza, Suite 1000 Houston, TX 77046-1173 | Auditors PricewaterhouseCoopers LLP 1201 Louisiana Street, Suite 2900 Houston, TX 77002-5678 | |||
Counsel to the Fund Stradley Ronon Stevens & Young, LLP 2005 Market Street, Suite 2600 Philadelphia, PA 19103-7018 | Counsel to the Independent Trustees Kramer Levin Naftalis & Frankel LLP 1177 Avenue of the Americas New York, NY 10036-2714 | Transfer Agent Invesco Investment Services, Inc. 11 Greenway Plaza, Suite 1000 Houston, TX 77046-1173 | Custodian State Street Bank and Trust Company 225 Franklin Street Boston, MA 02110-2801 | |||
T-4 Invesco International Core Equity Fund

Invesco mailing information
Send general correspondence to Invesco Investment Services, Inc., P.O. Box 219078, Kansas City, MO 64121-9078.
Invesco privacy policy
You share personal and financial information with us that is necessary for your transactions and your account records. We take very seriously the obligation to keep that information confidential and private.
Invesco collects nonpublic personal information about you from account applications or other forms you complete and from your transactions with us or our affiliates. We do not disclose information about you or our former customers to service providers or other third parties except to the extent necessary to service your account and in other limited circumstances as permitted by law. For example, we use this information to facilitate the delivery of transaction confirmations, financial reports, prospectuses and tax forms.
Even within Invesco, only people involved in the servicing of your accounts and compliance monitoring have access to your information. To ensure the highest level of confidentiality and security, Invesco maintains physical, electronic and procedural safeguards that meet or exceed federal standards. Special measures, such as data encryption and authentication, apply to your communications with us on our website. More detail is available to you at invesco.com/privacy.
Important notice regarding delivery of security holder documents
To reduce Fund expenses, only one copy of most shareholder documents may be mailed to shareholders with multiple accounts at the same address (Householding). Mailing of your shareholder documents may be householded indefinitely unless you instruct us otherwise. If you do not want the mailing of these documents to be combined with those for other members of your household, please contact Invesco Investment Services, Inc. at 800 959 4246 or contact your financial institution. We will begin sending you individual copies for each account within 30 days after receiving your request.
Fund holdings and proxy voting information
The Fund provides a complete list of its holdings four times in each fiscal year, at the quarter-ends. For the second and fourth quarters, the lists appear in the Fund’s semiannual and annual reports to shareholders. For the first and third quarters, the Fund files the lists with the Securities and Exchange Commission (SEC) on Form N-Q. The most recent list of portfolio holdings is available at invesco.com/completeqtrholdings. Shareholders can also look up the Fund’s Forms N-Q on the SEC website at sec.gov. Copies of the Fund’s Forms N-Q may be reviewed and copied at the SEC Public Reference Room in Washington, D.C. You can obtain information on the operation of the Public Reference Room, including information about duplicating fee charges, by calling 202 551 8090 or 800 732 0330, or by electronic request at the following email address: publicinfo@sec.gov. The SEC file numbers for the Fund are shown below.
A description of the policies and procedures that the Fund uses to determine how to vote proxies relating to portfolio securities is available without charge, upon request, from our Client Services department at 800 959 4246 or at invesco.com/proxyguidelines. The information is also available on the SEC website, sec.gov.
Information regarding how the Fund voted proxies related to its portfolio securities during the 12 months ended June 30, 2012, is available at invesco.com/proxysearch. The information is also available on the SEC website, sec.gov. Invesco Advisers, Inc. is an investment adviser; it provides investment advisory services to individual and institutional clients and does not sell securities. Invesco Distributors, Inc. is the US distributor for Invesco Ltd.’s retail mutual funds, exchange-traded funds and institutional money market funds. Both are wholly owned, indirect subsidiaries of Invesco Ltd. |  |
| SEC file numbers: 811-06463 and 033-44611 | I-ICE-AR-1 | Invesco Distributors, Inc. |

Letters to Shareholders
Philip Taylor | Dear Shareholders: This report contains information about your Fund, including a discussion from your portfolio managers about how they managed your Fund – and why it performed as it did – during the reporting period. This report also includes your Fund’s long-term performance and a complete list of your Fund’s investments as of the close of the reporting period. I hope you find this information helpful. For much of the reporting period, investors’ attention was focused on Europe, where eurozone governments struggled to reduce debt levels, strengthen their banks and stimulate their economies. European leaders disagreed whether the wiser path to restoring the Continent’s economic well-being was more stimulus or greater austerity. In the US, economic data were mixed. Economic growth, while positive, was relatively modest. Corporate earnings, which grew strongly in recent years, showed signs of slowing. And job creation was less robust than hoped. Later in this report, your Fund’s portfolio managers discuss how economic conditions and market | |
| trends affected your Fund’s performance. | ||

Economic conditions are always subject to sudden and unexpected change. That’s why you may find it helpful to work with a trusted, experienced financial adviser who understands your unique financial goals, needs and risk tolerances. Financial advisers can provide valuable insight and information, particularly when markets are uncertain, and they can recommend investments appropriate for specific investment goals, such as a child’s college education or your retirement. On a regular basis, a financial adviser also can determine whether your existing investments are still appropriate, given your changing needs, goals and circumstances.
Timely insight and information from many of Invesco’s investment professionals is available at our website, invesco.com/us. We offer in-depth articles, video clips and audio commentaries from many of our portfolio managers and other investment professionals on a wide range of topics of interest to investors: recent economic and market developments; retirement planning; legislative updates from Washington, DC; and general investor education. At invesco.com/us, you also can access information about your Invesco account at any time.
What we mean by Intentional Investing
Intentional InvestingSM is the science and art of investing with purpose, prudence and diligence – and it’s how Invesco’s investment professionals manage your money every day.
This highly disciplined process begins when specialized teams of investment professionals clearly define an investment objective and then establish specific investment strategies to try to achieve that objective. While our investment teams closely monitor economic and market conditions – and issues specific to individual holdings that could affect their value – they maintain a long-term investment perspective. Intentional Investing is also:
| n | How we manage and mitigate risk – by embedding risk controls and processes into every aspect of our business; |
| n | How we create products – by offering a diverse combination of investment strategies and vehicles designed to meet your needs; and |
| n | How we connect with you, our investors – by communicating clearly, by delivering expert insights from our portfolio managers and other investment professionals, and by providing a website full of tools and articles to help you stay informed. |
As a company, Invesco believes in putting investors first, and that’s why investment management is all we do. Our sole focus on managing your money allows your financial adviser to build a truly diversified investment portfolio of Invesco funds, whatever your investment needs and goals may be – and allows him or her to find appropriate Invesco funds when your circumstances change. Of course, neither Intentional Investing nor diversification can guarantee a profit or protect against loss.
Have a question?
If you have questions about your account, please contact an Invesco client services representative at 800 959 4246. If you have an Invesco-related question or comment, feel free to email me directly at phil@invesco.com.
All of us at Invesco look forward to serving your investment management needs for many years to come. Thank you for investing with us.
Sincerely,

Philip Taylor
Senior Managing Director, Invesco Ltd.
2 Invesco International Growth Fund
Bruce Crockett | Dear Fellow Shareholders: One of our most important responsibilities as independent Trustees of the Invesco Funds is our annual review of the funds’ advisory and sub-advisory contracts with Invesco. This annual review is required by the Investment Company Act of 1940 and focuses on the nature and quality of the services Invesco has provided as adviser to the Invesco Funds and the reasonableness of the fees that it charges for those services. In our roles as Trustees, we spend months reviewing thousands of pages of detailed information that we request from Invesco in connection with our annual review. We focus on the quality and costs of the services to be provided by Invesco and its affiliates. Some of the most important things we look at are fund performance, expenses and fees. All of the Trustees have substantial personal investments in the Invesco Funds complex. We’re fund shareholders just like you. |

We also use information from many independent sources during the review process, including materials provided by the independent Senior Officer of the Invesco Funds, who reports directly to the independent Trustees. We also meet in private sessions with independent legal counsel and review performance and fee data on the Invesco Funds prepared by Lipper Inc., an independent, third-party firm widely recognized as a leader in its field.
I’m pleased to report that the Invesco Funds Board determined in June that renewing the investment advisory agreement and the sub-advisory contracts with Invesco would serve the best interests of each fund and its shareholders. For more detailed information about our assessment and conclusions with respect to each of the Invesco Funds, visit invesco.com/us, click on the “About Us” section and go to “Legal Information.” Information on the recent investment advisory renewal process can be found by clicking the last item under “Corporate Governance.”
In much the same way we review your fund’s advisory contract each year, it’s a good idea for you to review your own investment plan with your financial adviser on a regular basis. Perhaps you need to reassess your original asset allocation because different investments may grow at varying paces, or perhaps you’re going through a significant life change. Regardless of your situation, a financial adviser can provide guidance and experience to help you reach your financial goals.
As always, please contact me at bruce@brucecrockett.com with any questions or concerns you may have. On behalf of the Board, we look forward to continuing to represent your interests and serving your needs.
Sincerely,

Bruce L. Crockett
Independent Chair
Invesco Funds Board of Trustees
3 Invesco International Growth Fund
Management’s Discussion of Fund Performance
Performance summary
For the fiscal year ended October 31, 2012, Invesco International Growth Fund, at net asset value (NAV), delivered positive returns and outperformed its style-specific benchmark, the MSCI EAFE Growth Index. The Fund’s European holdings provided the largest positive contribution to this outperformance, with the Fund’s exposure to the UK leading the gains. Relative results also benefited from the Fund’s underweight exposure to Japan, one of the weakest markets during the reporting period.
Your Fund’s long-term performance appears later in this report.
Fund vs. Indexes
Total returns, 10/31/11 to 10/31/12, at net asset value (NAV). Performance shown does not include applicable contingent deferred sales charges (CDSC) or front-end sales charges, which would have reduced performance.
Class A Shares | 7.13 | % | ||
Class B Shares | 6.31 | |||
Class C Shares | 6.31 | |||
Class R Shares | 6.85 | |||
Class Y Shares | 7.39 | |||
Class R5 Shares* | 7.52 | |||
Class R6 Shares** | 7.15 | |||
MSCI EAFE Indexq (Broad Market Index) | 4.61 | |||
MSCI EAFE Growth Indexq (Style-Specific Index) | 4.67 | |||
Lipper International Multi-Cap Growth Funds Indexn (Peer Group Index) | 6.94 |
Source(s): qInvesco, MSCI via FactSet Research Systems Inc.; nLipper Inc.
| *Effective | September 24, 2012, Institutional Class shares were renamed Class R5 shares. |
| **Share | class incepted during the reporting period. See page 7 for a detailed explanation of Fund performance. |
How we invest
When selecting stocks for your Fund, we use a disciplined investment strategy that emphasizes fundamental research, supported by both quantitative analysis and portfolio construction techniques. Our EQV (earnings, quality, valuation) strategy focuses primarily on identifying quality companies that have experienced, or exhibit the potential for, accelerated or above-average earnings growth, but whose stock prices do not fully reflect these attributes.
While research responsibilities within the portfolio management team are focused by geographic region, we select investments for the Fund using a bottom-up investment approach, which means we construct the Fund primarily on a
stock-by-stock basis. We focus on the strengths of individual companies rather than sectors, countries or market-cap trends.
We believe disciplined sell decisions are key to successful investing. We consider selling a stock for one of the following reasons:
| n | A company’s fundamentals deteriorate, or it posts disappointing earnings. |
| n | A stock appears overvalued. |
| n | A more attractive investment opportunity becomes available. |
Market conditions and your Fund
During the reporting period, global equity markets remained volatile. At the beginning of the reporting period, macro events – ranging from continuing political
instability in the Middle East, lingering economic effects of the earthquake and tsunami in Japan, the ongoing eurozone sovereign debt crisis, aftereffects of Standard & Poor’s August 2011 first-ever downgrade of US debt, a slowing Chinese property market and generally higher inflation across the developing world – weighed on global economic growth and equity markets. While the markets rebounded modestly in December, macroeconomic concerns continued, stemming largely from the unstable economic conditions of Greece and Spain.
Toward the end of the reporting period, global central banks announced a series of stimulative policies. The European Central Bank (ECB) announced new measures to support eurozone economies through potentially unlimited purchases of sovereign debt, with ECB President Mario Draghi pledging to “do whatever it takes” to save the euro (although key details of the plan remain unresolved). The US Federal Reserve announced a third round of quantitative easing by promising to remain accommodative until the labor market outlook improves materially. Also, the Bank of Japan took steps to increase its asset purchase program. These easing measures were well received by investors and helped drive international equity markets higher in the final months of the reporting period, despite signs of a continued slowdown in global economic growth.
In this environment, we continued to construct the Fund’s portfolio on a bottom-up basis, selecting stocks on an individual basis. The Fund fared better than its style-specific benchmark in nine of 10 sectors. Significant outperformance came from the materials, consumer discretionary and information technology (IT) sectors; in each of these sectors, strong stock selection was a key driver of relative results.
Portfolio Composition
By sector
Consumer Discretionary | 23.1 | % | ||
Information Technology | 12.2 | |||
Consumer Staples | 10.0 | |||
Industrials | 10.0 | |||
Health Care | 9.5 | |||
Energy | 9.2 | |||
Financials | 9.2 | |||
Materials | 4.8 | |||
Telecommunication Services | 2.5 | |||
Utilities | 0.9 | |||
Money Market Funds | ||||
Plus Other Assets Less Liabilities | 8.6 |
Top 10 Equity Holdings*
1. Reed Elsevier PLC | 2.4 | % | ||
2. SAP AG | 2.3 | |||
3. Compass Group PLC | 2.3 | |||
4. Anheuser-Busch InBev N.V. | 2.3 | |||
5. Suncor Energy, Inc. | 2.1 | |||
6. Imperial Tobacco Group PLC | 2.0 | |||
7. Teva Pharmaceutical Industries Ltd.- ADR | 2.0 | |||
8. Brambles Ltd. | 1.8 | |||
9. Roche Holding AG | 1.7 | |||
10. Volkswagen AG-Preference Shares | 1.7 |
Top Five Countries*
1. United Kingdom | 18.3 | % | ||
2. Canada | 8.7 | |||
3. Switzerland | 7.9 | |||
4. Japan | 7.0 | |||
5. Germany | 6.7 |
Total Net Assets | $ | 5.4 billion | ||
Total Number of Holdings* | 78 | |||
The Fund’s holdings are subject to change, and there is no assurance that the Fund will continue to hold any particular security.
*Excluding money market fund holdings.
4 Invesco International Growth Fund
In the materials sector, strong stock selection led to Fund holdings delivering a double-digit gain while index holdings in the sector provided a negative return. The Fund’s underweight exposure to this weak sector versus the index also supported relative results.
As a group, the Fund’s holdings in the consumer discretionary sector delivered a double-digit gain, outperforming the index’s holdings in the sector for the reporting period. The Fund’s holdings in the media, retail and hotels, restaurants and leisure industries were particularly strong. Top contributors in this sector included UK-based retailer Next PLC and UK-based professional information solutions publisher Reed Elsevier.
In contrast, the Fund’s underweight exposure to the strong-performing consumer staples sector detracted from relative returns. Strong stock selection in this sector, however, enabled the Fund to perform in line with the index in the sector.
The Fund’s high single-digit cash position throughout the fiscal year detracted from performance as markets rebounded at the end of the reporting period. It is important to note that we do not use cash for “top-down” tactical asset allocation purposes. Historically, when the portfolio’s cash position has been higher than average, it has reflected a lack of good EQV investment opportunities in the marketplace, rather than an overall negative opinion on markets. However, concerns about further downside risk led us to be cautious investors throughout the reporting period.
In broad geographic terms, the Fund benefited most significantly from strong outperformance in the UK, the largest country allocation in the portfolio. Within the UK, one of the largest contributors to Fund performance included Compass Group, a global leader in foodservice management and support services.
In the Asia Pacific region, outperformance was led by the Fund’s continued underweight exposure to Japan. The Japanese economy continues to face significant headwinds, including a weak export market – the result of a continued strong yen. This put significant pressure on export-oriented companies. Much of the growth in the Japanese stock market this year reflected a temporary benefit resulting from the resumption of production after the devastating 2011 earthquake and tsunami. In our opinion, this boost is unlikely to last beyond 2012.
In contrast, Fund holdings in select emerging markets (a segment of the market not represented in the index) declined
over the reporting period and detracted from both the Fund’s relative and absolute results.
As mentioned above, stock selection in the portfolio is driven by the underlying fundamentals of each individual company, not by any top-down macroeconomic views. This focus on bottom-up stock selection is the key driver of the portfolio’s overall profile. The Fund ended the reporting period with overweight exposure (relative to our style-specific benchmark) to the consumer discretionary, IT, energy, financials and telecommunication services sectors. The Fund had underweight exposure to the consumer staples, materials, industrials, health care and utilities sectors.
With market volatility likely to continue for some time, our focus remains on ensuring that our portfolio is comprised of high-quality, reasonably valued companies capable of sustained earnings growth. We believe that this balanced EQV-focused approach may help deliver attractive returns over the long term.
We thank you for your continued investment in Invesco International Growth Fund.
The views and opinions expressed in management’s discussion of Fund performance are those of Invesco Advisers, Inc. These views and opinions are subject to change at any time based on factors such as market and economic conditions. These views and opinions may not be relied upon as investment advice or recommendations, or as an offer for a particular security. The information is not a complete analysis of every aspect of any market, country, industry, security or the Fund. Statements of fact are from sources considered reliable, but Invesco Advisers, Inc. makes no representation or warranty as to their completeness or accuracy. Although historical performance is no guarantee of future results, these insights may help you understand our investment management philosophy.
See important Fund and, if applicable, index disclosures later in this report.
 | Clas Olsson Portfolio manager and chief investment officer of Invesco’s international growth investments team, is | |
| lead manager of Invesco | ||
| International Growth Fund. He joined Invesco in 1994. Mr. Olsson became a commissioned officer at the Royal Swedish Naval Academy in 1988. He also earned a BBA from The University of Texas at Austin. | ||
 | Steve Cao Chartered Financial Analyst, portfolio manager, is manager of Invesco International Growth | |
| Fund. He joined Invesco in 1997. | ||
| Mr. Cao earned a BA in English from the Tianjin Foreign Language Institute and an MBA from Texas A&M University. He is also a Certified Public Accountant. | ||
 | Matthew Dennis Chartered Financial Analyst, portfolio manager, is manager of Invesco International Growth | |
| Fund. He joined Invesco in 2000. | ||
| Mr. Dennis earned a BA in economics from The University of Texas at Austin and an MS in finance from Texas A&M University. | ||
 | Jason Holzer Chartered Financial Analyst, portfolio manager, is manager of Invesco International Growth | |
| Fund. He joined Invesco in 1996. | ||
| Mr. Holzer earned a BA in quantitative economics and an MS in engineering economic systems from Stanford University. | ||
 | Mark Jason Chartered Financial Analyst, portfolio manager, is manager of Invesco International Growth | |
| Fund. He joined Invesco in 2001. | ||
| Mr. Jason earned a BS in finance and a BS in real estate from California State University, Northridge. | ||
5 Invesco International Growth Fund
Your Fund’s Long-Term Performance
Results of a $10,000 Investment – Oldest Share Class(es)
Fund and index data from 10/31/02*
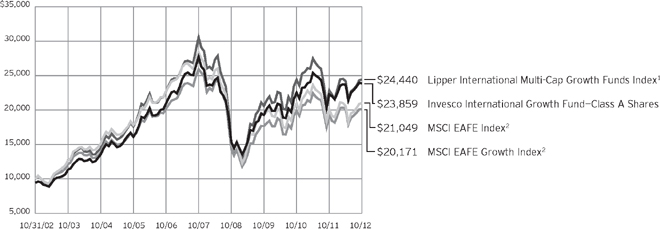
1 Source: Lipper Inc.
2 Source(s): Invesco, MSCI via FactSet Research Systems Inc.
| * | During the reporting period, Invesco changed its policy regarding growth of $10,000 charts. For funds older than 10 years, we previously showed performance since inception. Going forward, we will show performance for the most recent 10 years, since this more accurately reflects the experience of the typical shareholder. As a result, charts now may include benchmarks that did not appear previously, because the funds’ inception predated the benchmarks’ inception. Also, all charts will now be presented using a linear format. |
Past performance cannot guarantee comparable future results.
The data shown in the chart include reinvested distributions, applicable sales charges and Fund expenses including management fees. Index results include
reinvested dividends, but they do not reflect sales charges. Performance of the peer group, if applicable, reflects fund expenses and management fees; performance of a market index does not. Performance shown in the chart and table(s)
does not reflect deduction of taxes a shareholder would pay on Fund distributions or sale of Fund shares.
continued from page 8
| n | The Fund is not managed to track the performance of any particular index, including the index(es) defined here, and consequently, the performance of the Fund may deviate significantly from the performance of the index(es). |
| n | A direct investment cannot be made in an index. Unless otherwise indicated, index results include reinvested dividends, and they do not reflect sales charges. Performance of the peer group, if applicable, reflects fund expenses; performance of a market index does not. |
Other information
| n | CPA® and Certified Public Accountant® are trademarks owned by the American Institute of Certified Public Accountants. |
| n | The returns shown in management’s discussion of Fund performance are based on net asset values calculated for shareholder transactions. Generally accepted accounting principles require adjustments to be made to the net assets of the Fund at period end for financial reporting purposes, and as |
such, the net asset values for shareholder transactions and the returns based on those net asset values may differ from the net asset values and returns reported in the Financial Highlights.
| n | Industry classifications used in this report are generally according to the Global Industry Classification Standard, which was developed by and is the exclusive property and a service mark of MSCI Inc. and Standard & Poor’s. |
6 Invesco International Growth Fund
Average Annual Total Returns
As of 10/31/12, including maximum applicable sales charges
Class A Shares | ||||
Inception (4/7/92) | 7.43 | % | ||
10 Years | 9.08 | |||
5 Years | -4.06 | |||
1 Year | 1.23 | |||
Class B Shares | ||||
Inception (9/15/94) | 5.90 | % | ||
10 Years | 9.06 | |||
5 Years | -4.05 | |||
1 Year | 1.31 | |||
Class C Shares | ||||
Inception (8/4/97) | 3.99 | % | ||
10 Years | 8.90 | |||
5 Years | -3.70 | |||
1 Year | 5.31 | |||
Class R Shares | ||||
Inception (6/3/02) | 7.09 | % | ||
10 Years | 9.39 | |||
5 Years | -3.21 | |||
1 Year | 6.85 | |||
Class Y Shares | ||||
10 Years | 9.82 | % | ||
5 Years | -2.76 | |||
1 Year | 7.39 | |||
Class R5 Shares | ||||
Inception (3/15/02) | 7.86 | % | ||
10 Years | 10.22 | |||
5 Years | -2.56 | |||
1 Year | 7.52 | |||
Class R6 Shares | ||||
10 Years | 9.71 | % | ||
5 Years | -2.96 | |||
1 Year | 7.15 | |||
Class Y shares incepted on October 3, 2008. Performance shown prior to that date is that of Class A shares and includes the 12b-1 fees applicable to Class A shares. Class A share performance reflects any applicable fee waivers or expense reimbursements.
Class R6 shares incepted on September 24, 2012. Performance shown prior to that date is that of Class A shares and includes the 12b-1 fees applicable to Class A shares. Class A share performance reflects any applicable fee waivers or expense reimbursements.
The performance data quoted represent past performance and cannot guarantee comparable future results; current performance
Average Annual Total Returns
As of 9/30/12, the most recent calendar quarter-end, including maximum applicable sales charges
Class A Shares | ||||
Inception (4/7/92) | 7.49 | % | ||
10 Years | 9.67 | |||
5 Years | -3.02 | |||
1 Year | 11.81 | |||
Class B Shares | ||||
Inception (9/15/94) | 5.95 | % | ||
10 Years | 9.64 | |||
5 Years | -3.01 | |||
1 Year | 12.48 | |||
Class C Shares | ||||
Inception (8/4/97) | 4.05 | % | ||
10 Years | 9.48 | |||
5 Years | -2.65 | |||
1 Year | 16.41 | |||
Class R Shares | ||||
Inception (6/3/02) | 7.20 | % | ||
10 Years | 9.98 | |||
5 Years | -2.16 | |||
1 Year | 18.00 | |||
Class Y Shares | ||||
10 Years | 10.40 | % | ||
5 Years | -1.71 | |||
1 Year | 18.62 | |||
Class R5 Shares | ||||
Inception (3/15/02) | 7.97 | % | ||
10 Years | 10.81 | |||
5 Years | -1.50 | |||
1 Year | 18.77 | |||
Class R6 Shares | ||||
10 Years | 10.29 | % | ||
5 Years | -1.91 | |||
1 Year | 18.34 | |||
may be lower or higher. Please visit invesco.com/performance for the most recent month-end performance. Performance figures reflect reinvested distributions, changes in net asset value and the effect of the maximum sales charge unless otherwise stated. Investment return and principal value will fluctuate so that you may have a gain or loss when you sell shares.
The total annual Fund operating expense ratio set forth in the most recent Fund prospectus as of the date of this report for Class A, Class B, Class C, Class R, Class Y, Class R5 and Class R6 shares was 1.39%, 2.14%, 2.14%, 1.64%, 1.14%, 0.98% and 0.93%, respectively. The expense ratios presented above may vary from
the expense ratios presented in other sections of this report that are based on expenses incurred during the period covered by this report.
Class A share performance reflects the maximum 5.50% sales charge, and Class B and Class C share performance reflects the applicable contingent deferred sales charge (CDSC) for the period involved. The CDSC on Class B shares declines from 5% beginning at the time of purchase to 0% at the beginning of the seventh year. The CDSC on Class C shares is 1% for the first year after purchase. Class R, Class Y, Class R5 and Class R6 shares do not have a front-end sales charge or a CDSC; therefore, performance is at net asset value.
The performance of the Fund’s share classes will differ primarily due to different sales charge structures and class expenses.
7 Invesco International Growth Fund
Invesco International Growth Fund’s investment objective is long-term growth of capital.
| n | Unless otherwise stated, information presented in this report is as of October 31, 2012, and is based on total net assets. |
| n | Unless otherwise noted, all data provided by Invesco. |
| n | To access your Fund’s reports/prospectus, visit invesco.com/fundreports. |
About share classes
| n | Class A shares at NAV and Class Y shares are available only to certain investors. Please see the prospectus for more information. |
| n | Class B shares may not be purchased for new or additional investments. Please see the prospectus for more information. |
| n | Class R shares are generally available only to employee benefit plans. Please see the prospectus for more information. |
| n | Class R5 shares and Class R6 shares are primarily intended for retirement plans that meet certain standards and for institutional investors. On September 24, 2012, Institutional Class shares were renamed Class R5 shares. Please see the prospectus for more information. |
Principal risks of investing in the Fund
| n | Derivatives risk. The performance of derivative instruments is tied to the performance of an underlying currency, security, index or other instrument. In addition to risks relating to their underlying instruments, the use of derivatives may include other, possibly greater, risks. Derivatives involve costs, may be volatile, and may involve a small initial investment relative to the risk assumed. Risks associated with the use of derivatives include counterparty, leverage, correlation, liquidity, tax, market, interest rate and management risks. Derivatives may also be more difficult to purchase, sell or value than other investments. The Fund may lose more than the cash amount invested on investments in derivatives. |
Investors should bear in mind that, while the Fund intends to use derivative strategies, it is not obligated to actively engage in these transactions, generally or in any particular kind of derivative, if the investment manager elects not to do so due to availability, cost, market conditions or other factors.
| n | Developing/emerging markets securities risk. Securities issued by foreign companies and governments located in developing/emerging countries may be affected more negatively by inflation, devaluation of their currencies, higher transaction costs, delays in settlement, adverse political developments, the introduction of capital controls, withholding taxes, nationalization of private assets, expropriation, social unrest, war or lack of timely information than those in developed countries. |
| n | Foreign securities risk. The Fund’s foreign investments may be affected by changes in a foreign country’s exchange rates, political and social instability, changes in economic or taxation policies, difficulties when enforcing obligations, decreased liquidity, and increased volatility. Foreign companies may be subject to less regulation resulting in less publicly available information about the companies. |
| n | Geographic focus risk. From time to time the Fund may invest a substantial amount of its assets in securities of issuers located in a single country or a limited number of countries. If the Fund focuses its investments in this manner, it assumes the risk that economic, political and social conditions in those countries will have a significant impact on its investment performance. The Fund’s investment performance may also be more volatile if it focuses its investments in certain countries, especially emerging market countries. |
| n | Growth investing risk. Growth stocks tend to be more expensive relative to their earnings or assets compared with other types of stock. As a result they tend to be more sensitive to changes in their earnings and can be more volatile. |
| n | Investing in the European Union risk. Many countries in the European Union are susceptible to high economic risks associated with high levels of debt, notably due to investments in sovereign debts of European countries such as Greece, Italy and Spain. One or more member states might exit the European |
Union, placing its currency and banking system in jeopardy. The European Union faces major issues involving its membership, structure, procedures and policies, including the adoption, abandonment or adjustment of the new constitutional treaty, the European Union’s enlargement to the south and east, and resolution of the European Union’s problematic fiscal and democratic accountability. Efforts of the member states to further unify their economic and monetary policies may increase the potential for the downward movement of one member state’s market to cause a similar effect on other member states’ markets. European countries that are part of the European Economic and Monetary Union may be significantly affected by the tight fiscal and monetary controls that the union seeks to impose on its members.
| n | Management risk. The investment techniques and risk analysis used by the Fund’s portfolio managers may not produce the desired results. |
| n | Market risk. The prices of and the income generated by the Fund’s securities may decline in response to, among other things, investor sentiment, general economic and market conditions, regional or global instability, and currency and interest rate fluctuations. |
About indexes used in this report
| n | The MSCI EAFE® Index is an unmanaged index considered representative of stocks of Europe, Australasia and the Far East. |
| n | The MSCI EAFE® Growth Index is an unmanaged index considered representative of growth stocks of Europe, Australasia and the Far East. |
| n | The Lipper International Multi-Cap Growth Funds Index is an unmanaged index considered representative of international multi-cap growth funds tracked by Lipper. |
continued on page 6
This report must be accompanied or preceded by a currently effective Fund prospectus, which contains more complete information, including sales charges and expenses. Investors should read it carefully before investing.
| NOT FDIC INSURED | MAY LOSE VALUE | NO BANK GUARANTEE |
Fund Nasdaq Symbols
Class A Shares | AIIEX | |
Class B Shares | AIEBX | |
Class C Shares | AIECX | |
Class R Shares | AIERX | |
Class Y Shares | AIIYX | |
Class R5 Shares | AIEVX | |
Class R6 Shares | IGFRX |
8 Invesco International Growth Fund
Schedule of Investments
October 31, 2012
| Shares | Value | |||||||
Common Stocks & Other Equity Interests–91.42% |
| |||||||
Australia–5.10% |
| |||||||
BHP Billiton Ltd. | 1,527,724 | $ | 53,872,727 | |||||
Brambles Ltd. | 12,798,806 | 96,229,026 | ||||||
CSL Ltd. | 1,185,307 | 58,229,584 | ||||||
WorleyParsons Ltd. | 2,578,399 | 65,777,125 | ||||||
| 274,108,462 | ||||||||
Belgium–2.27% |
| |||||||
Anheuser-Busch InBev N.V. | 1,457,966 | 122,012,006 | ||||||
Brazil–1.63% |
| |||||||
Banco Bradesco S.A.–ADR | 5,585,226 | 87,464,639 | ||||||
Canada–8.68% |
| |||||||
Agrium Inc. | 531,622 | 55,971,974 | ||||||
Canadian National Railway Co. | 520,573 | 44,939,155 | ||||||
Canadian Natural Resources Ltd. | 1,341,137 | 40,408,632 | ||||||
Cenovus Energy Inc. | 1,487,315 | 52,450,558 | ||||||
CGI Group Inc.–Class A(a) | 2,003,861 | 52,413,301 | ||||||
Fairfax Financial Holdings Ltd. | 117,015 | 43,398,626 | ||||||
Potash Corp. of Saskatchewan Inc. | 1,583,718 | 63,649,928 | ||||||
Suncor Energy, Inc. | 3,381,942 | 113,476,172 | ||||||
| 466,708,346 | ||||||||
China–4.50% |
| |||||||
Baidu, Inc.–ADR(a) | 688,416 | 73,398,914 | ||||||
China Mobile Ltd. | 5,837,000 | 64,734,213 | ||||||
CNOOC Ltd. | 20,556,000 | 42,385,676 | ||||||
Industrial & Commercial Bank of China Ltd.–Class H | 93,254,000 | 61,378,750 | ||||||
| 241,897,553 | ||||||||
Denmark–1.00% |
| |||||||
Novo Nordisk A.S.–Class B | 335,636 | 53,882,721 | ||||||
France–4.41% |
| |||||||
Cap Gemini S.A. | 1,043,410 | 43,976,545 | ||||||
Eutelsat Communications S.A. | 1,100,985 | 35,280,919 | ||||||
L’Oreal S.A. | 281,443 | 35,913,664 | ||||||
Publicis Groupe S.A. | 1,202,745 | 64,892,300 | ||||||
Schneider Electric S.A. | 909,505 | 56,970,429 | ||||||
| 237,033,857 | ||||||||
Germany–6.68% |
| |||||||
Adidas AG | 1,015,116 | 86,467,080 | ||||||
Fresenius Medical Care AG & Co. KGaA | 808,243 | 56,758,720 | ||||||
SAP AG | 1,726,382 | 125,731,676 | ||||||
Volkswagen AG -Preference Shares | 435,347 | 90,040,922 | ||||||
| 358,998,398 | ||||||||
| Shares | Value | |||||||
Hong Kong–2.09% |
| |||||||
Galaxy Entertainment Group Ltd.(a) | 15,808,000 | $ | 54,027,641 | |||||
Hutchison Whampoa Ltd. | 5,953,000 | 58,496,802 | ||||||
| 112,524,443 | ||||||||
Ireland–1.60% |
| |||||||
Shire PLC | 1,028,893 | 28,939,458 | ||||||
WPP PLC | 4,414,517 | 57,126,658 | ||||||
| 86,066,116 | ||||||||
Israel–1.96% |
| |||||||
Teva Pharmaceutical Industries Ltd.–ADR | 2,603,814 | 105,246,162 | ||||||
Japan–6.98% |
| |||||||
Canon Inc. | 868,400 | 27,920,979 | ||||||
Denso Corp. | 1,722,600 | 53,924,307 | ||||||
Fanuc Corp. | 290,100 | 46,519,646 | ||||||
Keyence Corp. | 269,300 | 71,356,406 | ||||||
Komatsu Ltd. | 1,174,445 | 24,598,172 | ||||||
Nidec Corp. | 560,702 | 39,626,207 | ||||||
Toyota Motor Corp. | 1,479,300 | 57,191,960 | ||||||
Yamada Denki Co., Ltd. | 1,254,737 | 54,382,939 | ||||||
| 375,520,616 | ||||||||
Mexico–3.56% |
| |||||||
America Movil S.A.B. de C.V.–ADR | 2,755,297 | 69,681,461 | ||||||
Fomento Economico Mexicano, S.A.B. de C.V.–ADR | 474,086 | 42,956,932 | ||||||
Grupo Televisa S.A.B.–ADR | 3,486,576 | 78,796,618 | ||||||
| 191,435,011 | ||||||||
Netherlands–1.25% |
| |||||||
Unilever N.V. | 1,825,892 | 67,033,694 | ||||||
Russia–0.51% |
| |||||||
Gazprom OAO–ADR | 2,998,523 | 27,513,537 | ||||||
Singapore–2.27% |
| |||||||
Keppel Corp. Ltd. | 8,380,548 | 72,859,547 | ||||||
United Overseas Bank Ltd. | 3,296,000 | 49,145,531 | ||||||
| 122,005,078 | ||||||||
South Korea–2.60% |
| |||||||
Hyundai Mobis | 289,629 | 73,367,641 | ||||||
NHN Corp. | 287,898 | 66,649,166 | ||||||
| 140,016,807 | ||||||||
Spain–1.17% |
| |||||||
Amadeus IT Holding S.A.–Class A | 2,530,989 | 62,765,784 | ||||||
Sweden–4.15% |
| |||||||
Investment AB Kinnevik–Class B | 1,689,215 | 32,337,171 | ||||||
Investor AB–Class B | 2,509,861 | 55,461,708 | ||||||
Swedbank AB–Class A | 2,877,419 | 53,335,323 | ||||||
See accompanying Notes to Financial Statements which are an integral part of the financial statements.
9 Invesco International Growth Fund
| Shares | Value | |||||||
Sweden–(continued) | ||||||||
Telefonaktiebolaget LM Ericsson–Class B | 4,085,506 | $ | 36,117,594 | |||||
Volvo AB–Class B | 3,416,293 | 46,062,177 | ||||||
| 223,313,973 | ||||||||
Switzerland–7.92% |
| |||||||
ABB Ltd.(a) | 2,972,215 | 53,700,689 | ||||||
Julius Baer Group Ltd.(a) | 1,584,612 | 55,061,170 | ||||||
Nestle S.A. | 1,273,971 | 80,828,434 | ||||||
Novartis AG | 942,409 | 56,800,036 | ||||||
Roche Holding AG | 481,113 | 92,607,364 | ||||||
Syngenta AG | 222,113 | 86,918,542 | ||||||
| 425,916,235 | ||||||||
Taiwan–1.04% |
| |||||||
Taiwan Semiconductor Manufacturing Co. Ltd. | 18,472,887 | 56,089,586 | ||||||
Turkey–1.08% |
| |||||||
Akbank T.A.S. | 12,041,197 | 58,039,577 | ||||||
United Kingdom–18.26% |
| |||||||
BG Group PLC | 4,773,428 | 88,561,858 | ||||||
British American Tobacco PLC | 1,589,713 | 78,875,017 | ||||||
British Sky Broadcasting Group PLC | 4,703,567 | 53,886,139 | ||||||
Centrica PLC | 9,256,297 | 48,462,151 | ||||||
Compass Group PLC | 11,121,289 | 122,203,361 | ||||||
| Shares | Value | |||||||
United Kingdom–(continued) |
| |||||||
Imperial Tobacco Group PLC | 2,858,730 | $ | 108,088,822 | |||||
Informa PLC | 6,656,151 | 43,058,724 | ||||||
Kingfisher PLC | 13,814,528 | 64,655,998 | ||||||
Next PLC | 1,393,268 | 80,329,466 | ||||||
Pearson PLC | 2,099,931 | 42,238,457 | ||||||
Reed Elsevier PLC | 13,096,078 | 128,303,374 | ||||||
Royal Dutch Shell PLC-Class B | 1,858,172 | 65,601,006 | ||||||
Smith & Nephew PLC | 5,413,449 | 57,260,033 | ||||||
| 981,524,406 | ||||||||
United States–0.71% |
| |||||||
Avago Technologies Ltd. | 1,148,201 | 37,925,079 | ||||||
Total Common Stocks & Other Equity Interests |
| 4,915,042,086 | ||||||
Money Market Funds–8.68% |
| |||||||
Liquid Assets Portfolio– | 233,205,582 | 233,205,582 | ||||||
Premier Portfolio–Institutional Class(b) | 233,205,582 | 233,205,582 | ||||||
Total Money Market Funds |
| 466,411,164 | ||||||
TOTAL INVESTMENTS–100.10% (Cost $4,384,227,750) |
| 5,381,453,250 | ||||||
OTHER ASSETS LESS LIABILITIES–(0.10)% |
| (5,493,563 | ) | |||||
NET ASSETS–100.00% |
| $ | 5,375,959,687 | |||||
Investment Abbreviations:
| ADR | – American Depositary Receipt |
Notes to Schedule of Investments:
| (a) | Non-income producing security. |
| (b) | The money market fund and the Fund are affiliated by having the same investment adviser. |
See accompanying Notes to Financial Statements which are an integral part of the financial statements.
10 Invesco International Growth Fund
Statement of Assets and Liabilities
October 31, 2012
Assets: | ||||
Investments, at value (Cost $3,917,816,586) | $ | 4,915,042,086 | ||
Investments in affiliated money market funds, at value and cost | 466,411,164 | |||
Total investments, at value (Cost $4,384,227,750) | 5,381,453,250 | |||
Foreign currencies, at value (Cost $4,536,338) | 4,637,348 | |||
Receivable for: | ||||
Investments sold | 15,581,029 | |||
Fund shares sold | 12,626,310 | |||
Dividends | 8,785,751 | |||
Deposits with sub-custodian (Cost $408,300) | 418,259 | |||
Investment for trustee deferred compensation and retirement plans | 156,222 | |||
Other assets | 76,848 | |||
Total assets | 5,423,735,017 | |||
Liabilities: | ||||
Payable for: | ||||
Investments purchased | 27,222,524 | |||
Fund shares reacquired | 16,726,473 | |||
Accrued fees to affiliates | 2,432,153 | |||
Accrued other operating expenses | 739,407 | |||
Trustee deferred compensation and retirement plans | 654,773 | |||
Total liabilities | 47,775,330 | |||
Net assets applicable to shares outstanding | $ | 5,375,959,687 | ||
Net assets consist of: |
| |||
Shares of beneficial interest | $ | 4,622,616,805 | ||
Undistributed net investment income | 57,403,616 | |||
Undistributed net realized gain (loss) | (301,224,222 | ) | ||
Unrealized appreciation | 997,163,488 | |||
| $ | 5,375,959,687 | |||
Net Assets: | ||||
Class A | $ | 2,132,502,939 | ||
Class B | $ | 44,872,575 | ||
Class C | $ | 133,529,470 | ||
Class R | $ | 88,725,679 | ||
Class Y | $ | 1,464,294,898 | ||
Class R5 | $ | 1,285,742,634 | ||
Class R6 | $ | 226,291,492 | ||
Shares outstanding, $0.001 par value per share, |
| |||
Class A | 76,270,391 | |||
Class B | 1,738,705 | |||
Class C | 5,168,939 | |||
Class R | 3,209,580 | |||
Class Y | 52,209,726 | |||
Class R5 | 45,291,350 | |||
Class R6 | 7,972,628 | |||
Class A: | ||||
Net asset value per share | $ | 27.96 | ||
Maximum offering price per share | ||||
(Net asset value of $27.96 ¸ 94.50%) | $ | 29.59 | ||
Class B: | ||||
Net asset value and offering price per share | $ | 25.81 | ||
Class C: | ||||
Net asset value and offering price per share | $ | 25.83 | ||
Class R: | ||||
Net asset value and offering price per share | $ | 27.64 | ||
Class Y: | ||||
Net asset value and offering price per share | $ | 28.05 | ||
Class R5: | ||||
Net asset value and offering price per share | $ | 28.39 | ||
Class R6: | ||||
Net asset value and offering price per share | $ | 28.38 | ||
See accompanying Notes to Financial Statements which are an integral part of the financial statements.
11 Invesco International Growth Fund
Statement of Operations
For the year ended October 31, 2012
Investment income: |
| |||
Dividends (net of foreign withholding taxes of $9,782,634) | $ | 117,022,049 | ||
Dividends from affiliated money market funds | 658,344 | |||
Interest | 14,608 | |||
Total investment income | 117,695,001 | |||
Expenses: | ||||
Advisory fees | 42,771,123 | |||
Administrative services fees | 641,969 | |||
Custodian fees | 1,449,210 | |||
Distribution fees: | ||||
Class A | 5,139,173 | |||
Class B | 505,195 | |||
Class C | 1,378,869 | |||
Class R | 490,132 | |||
Transfer agent fees — A, B, C, R and Y | 7,014,129 | |||
Transfer agent fees — R5 | 1,152,201 | |||
Transfer agent fees — R6 | 248 | |||
Trustees’ and officers’ fees and benefits | 280,150 | |||
Other | 964,387 | |||
Total expenses | 61,786,786 | |||
Less: Fees waived and expense offset arrangement(s) | (674,266 | ) | ||
Net expenses | 61,112,520 | |||
Net investment income | 56,582,481 | |||
Realized and unrealized gain (loss) from: | ||||
Net realized gain (loss) from: | ||||
Investment securities | 66,407,718 | |||
Foreign currencies | (842,800 | ) | ||
| 65,564,918 | ||||
Change in net unrealized appreciation (depreciation) of: | ||||
Investment securities | 238,968,605 | |||
Foreign currencies | (1,234,801 | ) | ||
| 237,733,804 | ||||
Net realized and unrealized gain | 303,298,722 | |||
Net increase in net assets resulting from operations | $ | 359,881,203 | ||
See accompanying Notes to Financial Statements which are an integral part of the financial statements.
12 Invesco International Growth Fund
Statement of Changes in Net Assets
For the years ended October 31, 2012 and 2011
| 2012 | 2011 | |||||||
Operations: |
| |||||||
Net investment income | $ | 56,582,481 | $ | 58,922,257 | ||||
Net realized gain | 65,564,918 | 119,299,702 | ||||||
Change in net unrealized appreciation (depreciation) | 237,733,804 | (301,580,096 | ) | |||||
Net increase (decrease) in net assets resulting from operations | 359,881,203 | (123,358,137 | ) | |||||
Distributions to shareholders from net investment income: | ||||||||
Class A | (24,794,919 | ) | (19,146,777 | ) | ||||
Class B | (297,285 | ) | (160,999 | ) | ||||
Class C | (754,132 | ) | (454,272 | ) | ||||
Class R | (1,093,679 | ) | (897,387 | ) | ||||
Class Y | (11,922,825 | ) | (2,154,921 | ) | ||||
Class R5 | (24,768,329 | ) | (17,496,217 | ) | ||||
Total distributions from net investment income | (63,631,169 | ) | (40,310,573 | ) | ||||
Share transactions-net: | ||||||||
Class A | (42,994,301 | ) | 163,825,425 | |||||
Class B | (15,485,476 | ) | 8,745,916 | |||||
Class C | (19,800,385 | ) | 8,119,730 | |||||
Class R | (27,645,778 | ) | (909,172 | ) | ||||
Class Y | 629,419,616 | 615,879,817 | ||||||
Class R5 | (245,281,401 | ) | 268,371,175 | |||||
Class R6 | 229,878,780 | — | ||||||
Net increase in net assets resulting from share transactions | 508,091,055 | 1,064,032,891 | ||||||
Net increase in net assets | 804,341,089 | 900,364,181 | ||||||
Net assets: | ||||||||
Beginning of year | 4,571,618,598 | 3,671,254,417 | ||||||
End of year (includes undistributed net investment income of $57,403,616 and $61,773,335, respectively) | $ | 5,375,959,687 | $ | 4,571,618,598 | ||||
Notes to Financial Statements
October 31, 2012
NOTE 1—Significant Accounting Policies
Invesco International Growth Fund (the “Fund”) is a series portfolio of AIM International Mutual Funds (Invesco International Mutual Funds) (the “Trust”). The Trust is a Delaware statutory trust registered under the Investment Company Act of 1940, as amended (the “1940 Act”), as an open-end series management investment company consisting of eight separate portfolios, each authorized to issue an unlimited number of shares of beneficial interest. The assets, liabilities and operations of each portfolio are accounted for separately. Information presented in these financial statements pertains only to the Fund. Matters affecting each portfolio or class will be voted on exclusively by the shareholders of such portfolio or class.
The Fund’s investment objective is long-term growth of capital.
The Fund currently consists of seven different classes of shares: Class A, Class B, Class C, Class R, Class Y, Class R5 and Class R6. On September 24, 2012, Institutional Class shares were renamed Class R5 shares and the Fund began offering Class R6 shares. Class A shares are sold with a front-end sales charge unless certain waiver criteria are met and under certain circumstances load waived shares may be subject to contingent deferred sales charges (“CDSC”). Class C shares are sold with a CDSC. Class R, Class Y, Class R5 and Class R6 shares are sold at net asset value. Effective November 30, 2010, new or additional investments in Class B shares are no longer permitted. Existing shareholders of Class B shares may continue to reinvest dividends and capital gains distributions in Class B shares until they convert to Class A shares. Also, shareholders in Class B shares will be able to exchange those shares for Class B shares of other Invesco Funds offering such shares until they convert to Class A shares. Generally, Class B shares will automatically convert to Class A shares on or about the month-end, which is at least eight years after the date of purchase. Redemption of Class B shares prior to the conversion date will be subject to a CDSC.
The following is a summary of the significant accounting policies followed by the Fund in the preparation of its financial statements.
| A. | Security Valuations — Securities, including restricted securities, are valued according to the following policy. |
A security listed or traded on an exchange (except convertible bonds) is valued at its last sales price or official closing price as of the close of the customary trading session on the exchange where the security is principally traded, or lacking any sales or official closing price on a particular
13 Invesco International Growth Fund
day, the security may be valued at the closing bid price on that day. Securities traded in the over-the-counter market are valued based on prices furnished by independent pricing services or market makers. When such securities are valued by an independent pricing service they may be considered fair valued. Futures contracts are valued at the final settlement price set by an exchange on which they are principally traded. Listed options are valued at the mean between the last bid and ask prices from the exchange on which they are principally traded. Options not listed on an exchange are valued by an independent source at the mean between the last bid and ask prices. For purposes of determining net asset value per share, futures and option contracts generally are valued 15 minutes after the close of the customary trading session of the New York Stock Exchange (“NYSE”).
Investments in open-end and closed-end registered investment companies that do not trade on an exchange are valued at the end of day net asset value per share. Investments in open-end and closed-end registered investment companies that trade on an exchange are valued at the last sales price or official closing price as of the close of the customary trading session on the exchange where the security is principally traded.
Debt obligations (including convertible bonds) and unlisted equities are fair valued using an evaluated quote provided by an independent pricing service. Evaluated quotes provided by the pricing service may be determined without exclusive reliance on quoted prices, and may reflect appropriate factors such as institution-size trading in similar groups of securities, developments related to specific securities, dividend rate, yield, quality, type of issue, coupon rate, maturity, individual trading characteristics and other market data. Debt securities are subject to interest rate and credit risks. In addition, all debt securities involve some risk of default with respect to interest and/or principal payments.
Foreign securities (including foreign exchange contracts) are converted into U.S. dollar amounts using the applicable exchange rates as of the close of the NYSE. If market quotations are available and reliable for foreign exchange traded equity securities, the securities will be valued at the market quotations. Because trading hours for certain foreign securities end before the close of the NYSE, closing market quotations may become unreliable. If between the time trading ends on a particular security and the close of the customary trading session on the NYSE, events occur that are significant and make the closing price unreliable, the Fund may fair value the security. If the event is likely to have affected the closing price of the security, the security will be valued at fair value in good faith using procedures approved by the Board of Trustees. Adjustments to closing prices to reflect fair value may also be based on a screening process of an independent pricing service to indicate the degree of certainty, based on historical data, that the closing price in the principal market where a foreign security trade is not the current value as of the close of the NYSE. Foreign securities meeting the approved degree of certainty that the price is not reflective of current value will be priced at the indication of fair value from the independent pricing service. Multiple factors may be considered by the independent pricing service in determining adjustments to reflect fair value and may include information relating to sector indices, American Depositary Receipts and domestic and foreign index futures. Foreign securities may have additional risks including exchange rate changes, potential for sharply devalued currencies and high inflation, political and economic upheaval, the relative lack of issuer information, relatively low market liquidity and the potential lack of strict financial and accounting controls and standards.
Securities for which market prices are not provided by any of the above methods may be valued based upon quotes furnished by independent sources. The last bid price may be used to value equity securities. The mean between the last bid and asked prices is used to value debt obligations, including corporate loans.
Securities for which market quotations are not readily available or are unreliable are valued at fair value as determined in good faith by or under the supervision of the Trust’s officers following procedures approved by the Board of Trustees. Issuer specific events, market trends, bid/ask quotes of brokers and information providers and other market data may be reviewed in the course of making a good faith determination of a security’s fair value.
Valuations change in response to many factors including the historical and prospective earnings of the issuer, the value of the issuer’s assets, general economic conditions, interest rates, investor perceptions and market liquidity. Because of the inherent uncertainties of valuation, the values reflected in the financial statements may materially differ from the value received upon actual sale of those investments.
| B. | Securities Transactions and Investment Income — Securities transactions are accounted for on a trade date basis. Realized gains or losses on sales are computed on the basis of specific identification of the securities sold. Interest income is recorded on the accrual basis from settlement date. Dividend income (net of withholding tax, if any) is recorded on the ex-dividend date. |
The Fund may periodically participate in litigation related to Fund investments. As such, the Fund may receive proceeds from litigation settlements. Any proceeds received are included in the Statement of Operations as realized gain (loss) for investments no longer held and as unrealized gain (loss) for investments still held.
Brokerage commissions and mark ups are considered transaction costs and are recorded as an increase to the cost basis of securities purchased and/or a reduction of proceeds on a sale of securities. Such transaction costs are included in the determination of net realized and unrealized gain (loss) from investment securities reported in the Statement of Operations and the Statement of Changes in Net Assets and the net realized and unrealized gains (losses) on securities per share in the Financial Highlights. Transaction costs are included in the calculation of the Fund’s net asset value and, accordingly, they reduce the Fund’s total returns. These transaction costs are not considered operating expenses and are not reflected in net investment income reported in the Statement of Operations and Statement of Changes in Net Assets, or the net investment income per share and ratios of expenses and net investment income reported in the Financial Highlights, nor are they limited by any expense limitation arrangements between the Fund and the investment adviser.
The Fund allocates income and realized and unrealized capital gains and losses to a class based on the relative net assets of each class.
| C. | Country Determination — For the purposes of making investment selection decisions and presentation in the Schedule of Investments, the investment adviser may determine the country in which an issuer is located and/or credit risk exposure based on various factors. These factors include the laws of the country under which the issuer is organized, where the issuer maintains a principal office, the country in which the issuer derives 50% or more of its total revenues and the country that has the primary market for the issuer’s securities, as well as other criteria. Among the other criteria that may be evaluated for making this determination are the country in which the issuer maintains 50% or more of its assets, the type of security, financial guarantees and enhancements, the nature of the collateral and the sponsor organization. Country of issuer and/or credit risk exposure has been determined to be the United States of America, unless otherwise noted. |
| D. | Distributions — Distributions from income and net realized capital gain, if any, are generally declared and paid annually and recorded on the ex-dividend date. The Fund may elect to treat a portion of the proceeds from redemptions as distributions for federal income tax purposes. |
14 Invesco International Growth Fund
| E. | Federal Income Taxes — The Fund intends to comply with the requirements of Subchapter M of the Internal Revenue Code necessary to qualify as a regulated investment company and to distribute substantially all of the Fund’s taxable earnings to shareholders. As such, the Fund will not be subject to federal income taxes on otherwise taxable income (including net realized capital gain) that is distributed to shareholders. Therefore, no provision for federal income taxes is recorded in the financial statements. |
The Fund files tax returns in the U.S. Federal jurisdiction and certain other jurisdictions. Generally, the Fund is subject to examinations by such taxing authorities for up to three years after the filing of the return for the tax period.
| F. | Expenses — Fees provided for under the Rule 12b-1 plan of a particular class of the Fund are charged to the operations of such class. Transfer agency fees and expenses and other shareholder recordkeeping fees and expenses attributable to Class R5 and Class R6 are allocated to each share class based on relative net assets. Sub-accounting fees attributable to Class R5 are charged to the operations of the class. Transfer agency fees and expenses and other shareholder recordkeeping fees and expenses relating to all other classes are allocated among those classes based on relative net assets. All other expenses are allocated among the classes based on relative net assets. |
| G. | Accounting Estimates — The preparation of financial statements in conformity with accounting principles generally accepted in the United States of America (“GAAP”) requires management to make estimates and assumptions that affect the reported amounts of assets and liabilities at the date of the financial statements and the reported amounts of revenues and expenses during the reporting period including estimates and assumptions related to taxation. Actual results could differ from those estimates by a significant amount. In addition, the Fund monitors for material events or transactions that may occur or become known after the period-end date and before the date the financial statements are released to print. |
| H. | Indemnifications — Under the Trust’s organizational documents, each Trustee, officer, employee or other agent of the Trust is indemnified against certain liabilities that may arise out of the performance of their duties to the Fund. Additionally, in the normal course of business, the Fund enters into contracts, including the Fund’s servicing agreements, that contain a variety of indemnification clauses. The Fund’s maximum exposure under these arrangements is unknown as this would involve future claims that may be made against the Fund that have not yet occurred. The risk of material loss as a result of such indemnification claims is considered remote. |
| I. | Redemption Fees — The Fund had a 2% redemption fee that was retained by the Fund to offset transaction costs and other expenses associated with short-term redemptions and exchanges. The fee, subject to certain exceptions, was imposed on certain redemptions or exchanges of shares within 31 days of purchase. The redemption fee was recorded as an increase in shareholder capital and was allocated among the share classes based on the relative net assets of each class. Effective January 1, 2012, the Fund eliminated the 2% redemption fee assessed on shares of the Fund redeemed or exchanged within 31 days of purchase. |
| J. | Foreign Currency Translations — Foreign currency is valued at the close of the NYSE based on quotations posted by banks and major currency dealers. Portfolio securities and other assets and liabilities denominated in foreign currencies are translated into U.S. dollar amounts at date of valuation. Purchases and sales of portfolio securities (net of foreign taxes withheld on disposition) and income items denominated in foreign currencies are translated into U.S. dollar amounts on the respective dates of such transactions. The Fund does not separately account for the portion of the results of operations resulting from changes in foreign exchange rates on investments and the fluctuations arising from changes in market prices of securities held. The combined results of changes in foreign exchange rates and the fluctuation of market prices on investments (net of estimated foreign tax withholding) are included with the net realized and unrealized gain or loss from investments in the Statement of Operations. Reported net realized foreign currency gains or losses arise from (1) sales of foreign currencies, (2) currency gains or losses realized between the trade and settlement dates on securities transactions, and (3) the difference between the amounts of dividends, interest, and foreign withholding taxes recorded on the Fund’s books and the U.S. dollar equivalent of the amounts actually received or paid. Net unrealized foreign currency gains and losses arise from changes in the fair values of assets and liabilities, other than investments in securities at fiscal period end, resulting from changes in exchange rates. |
The Fund may invest in foreign securities which may be subject to foreign taxes on income, gains on investments or currency repatriation, a portion of which may be recoverable.
| K. | Foreign Currency Contracts — The Fund may enter into foreign currency contracts to manage or minimize currency or exchange rate risk. The Fund may also enter into foreign currency contracts for the purchase or sale of a security denominated in a foreign currency in order to “lock in” the U.S. dollar price of that security. A foreign currency contract is an obligation to purchase or sell a specific currency for an agreed-upon price at a future date. The use of foreign currency contracts does not eliminate fluctuations in the price of the underlying securities the Fund owns or intends to acquire but establishes a rate of exchange in advance. Fluctuations in the value of these contracts are measured by the difference in the contract date and reporting date exchange rates and are recorded as unrealized appreciation (depreciation) until the contracts are closed. When the contracts are closed, realized gains (losses) are recorded. Realized and unrealized gains (losses) on the contracts are included in the Statement of Operations. The primary risks associated with foreign currency contracts include failure of the counterparty to meet the terms of the contract and the value of the foreign currency changing unfavorably. These risks may be in excess of the amounts reflected in the Statement of Assets and Liabilities. |
15 Invesco International Growth Fund
NOTE 2—Advisory Fees and Other Fees Paid to Affiliates
The Trust has entered into a master investment advisory agreement with Invesco Advisers, Inc. (the “Adviser” or “Invesco”). Under the terms of the investment advisory agreement, the Fund pays an advisory fee to the Adviser based on the annual rate of the Fund’s average daily net assets as follows:
| Average Daily Net Assets | Rate | |||||
First $250 million | 0 | .935% | ||||
Next $250 million | 0 | .91% | ||||
Next $500 million | 0 | .885% | ||||
Next $1.5 billion | 0 | .86% | ||||
Next $2.5 billion | 0 | .835% | ||||
Next $2.5 billion | 0 | .81% | ||||
Next $2.5 billion | 0 | .785% | ||||
Over $10 billion | 0 | .76% | ||||
Under the terms of a master sub-advisory agreement between the Adviser and each of Invesco Asset Management Deutschland GmbH, Invesco Asset Management Limited, Invesco Asset Management (Japan) Limited, Invesco Australia Limited, Invesco Hong Kong Limited, Invesco Senior Secured Management, Inc. and Invesco Canada Ltd. (collectively, the “Affiliated Sub-Advisers”) the Adviser, not the Fund, may pay 40% of the fees paid to the Adviser to any such Affiliated Sub-Adviser(s) that provide discretionary investment management services to the Fund based on the percentage of assets allocated to such Sub-Adviser(s).
The Adviser has contractually agreed, through at least June 30, 2013, to waive advisory fees and/or reimburse expenses of all shares to the extent necessary to limit total annual fund operating expenses after fee waiver and/or expense reimbursement (excluding certain items discussed below) of Class A, Class B, Class C, Class R, Class Y, Class R5 and Class R6 shares to 1.40%, 2.15%, 2.15%, 1.65%, 1.15%, 1.15% and 1.15%, respectively, of average daily net assets. In determining the Adviser’s obligation to waive advisory fees and/or reimburse expenses, the following expenses are not taken into account, and could cause the total annual fund operating expenses after fee waiver and/or expense reimbursement to exceed the numbers reflected above: (1) interest; (2) taxes; (3) dividend expense on short sales; (4) extraordinary or non-routine items, including litigation expenses; and (5) expenses that the Fund has incurred but did not actually pay because of an expense offset arrangement. Unless the Board of Trustees and Invesco mutually agree to amend or continue the fee waiver agreement, it will terminate on June 30, 2013. The Adviser did not waive fees and/or reimburse expenses under this expense limitation.
Further, the Adviser has contractually agreed, through at least June 30, 2013, to waive the advisory fee payable by the Fund in an amount equal to 100% of the net advisory fees the Adviser receives from the affiliated money market funds on investments by the Fund of uninvested cash in such affiliated money market funds.
For the year ended October 31, 2012, the Adviser waived advisory fees of $666,189.
The Trust has entered into a master administrative services agreement with Invesco pursuant to which the Fund has agreed to pay Invesco for certain administrative costs incurred in providing accounting services to the Fund. For the year ended October 31, 2012, expenses incurred under the agreement are shown in the Statement of Operations as Administrative services fees.
The Trust has entered into a transfer agency and service agreement with Invesco Investment Services, Inc. (“IIS”) pursuant to which the Fund has agreed to pay IIS a fee for providing transfer agency and shareholder services to the Fund and reimburse IIS for certain expenses incurred by IIS in the course of providing such services. IIS may make payments to intermediaries that provide omnibus account services, sub-accounting services and/or networking services. All fees payable by IIS to intermediaries that provide omnibus account services or sub-accounting are charged back to the Fund, subject to certain limitations approved by the Trust’s Board of Trustees. For the year ended October 31, 2012, expenses incurred under the agreement are shown in the Statement of Operations as Transfer agent fees.
The Trust has entered into master distribution agreements with Invesco Distributors, Inc. (“IDI”) to serve as the distributor for the Class A, Class B, Class C, Class R, Class Y, Class R5 and Class R6 shares of the Fund. The Trust has adopted plans pursuant to Rule 12b-1 under the 1940 Act with respect to the Fund’s Class A, Class B, Class C and Class R shares (collectively, the “Plans”). The Fund, pursuant to the Plans, pays IDI compensation at the annual rate of 0.25% of the Fund’s average daily net assets of Class A shares, 1.00% of the average daily net assets of Class B and Class C shares and 0.50% of the average daily net assets of Class R shares. Of the Plan payments, up to 0.25% of the average daily net assets of each class of shares may be paid to furnish continuing personal shareholder services to customers who purchase and own shares of such classes. Any amounts not paid as a service fee under the Plans would constitute an asset-based sales charge. Rules of the Financial Industry Regulatory Authority (“FINRA”) impose a cap on the total sales charges, including asset-based sales charges, that may be paid by any class of shares of the Fund. For the year ended October 31, 2012, expenses incurred under the Plans are shown in the Statement of Operations as Distribution fees.
Front-end sales commissions and CDSC (collectively, the “sales charges”) are not recorded as expenses of the Fund. Front-end sales commissions are deducted from proceeds from the sales of Fund shares prior to investment in Class A shares of the Fund. CDSC are deducted from redemption proceeds prior to remittance to the shareholder. During the year ended October 31, 2012, IDI advised the Fund that IDI retained $313,822 in front-end sales commissions from the sale of Class A shares and $6,935, $67,655 and $7,220 from Class A, Class B and Class C shares, respectively, for CDSC imposed on redemptions by shareholders.
Certain officers and trustees of the Trust are officers and directors of the Adviser, IIS and/or IDI.
NOTE 3—Additional Valuation Information
GAAP defines fair value as the price that would be received to sell an asset or paid to transfer a liability in an orderly transaction between market participants at the measurement date, under current market conditions. GAAP establishes a hierarchy that prioritizes the inputs to valuation methods giving the highest priority to readily available unadjusted quoted prices in an active market for identical assets (Level 1) and the lowest priority to significant unobservable inputs (Level 3) generally when market prices are not readily available or are unreliable. Based on the valuation inputs, the
16 Invesco International Growth Fund
securities or other investments are tiered into one of three levels. Changes in valuation methods may result in transfers in or out of an investment’s assigned level:
| Level 1 — | Prices are determined using quoted prices in an active market for identical assets. |
| Level 2 — | Prices are determined using other significant observable inputs. Observable inputs are inputs that other market participants may use in pricing a security. These may include quoted prices for similar securities, interest rates, prepayment speeds, credit risk, yield curves, loss severities, default rates, discount rates, volatilities and others. |
| Level 3 — | Prices are determined using significant unobservable inputs. In situations where quoted prices or observable inputs are unavailable (for example, when there is little or no market activity for an investment at the end of the period), unobservable inputs may be used. Unobservable inputs reflect the Fund’s own assumptions about the factors market participants would use in determining fair value of the securities or instruments and would be based on the best available information. |
The following is a summary of the tiered valuation input levels, as of October 31, 2012. The level assigned to the securities valuations may not be an indication of the risk or liquidity associated with investing in those securities. Because of the inherent uncertainties of valuation, the values reflected in the financial statements may materially differ from the value received upon actual sale of those investments.
During the year ended October 31, 2012, there were transfers from Level 1 to Level 2 of $209,319,584 and from Level 2 to Level 1 of $938,613,809, due to foreign fair value adjustments.
| Level 1 | Level 2 | Level 3 | Total | |||||||||||||
Australia | $ | — | $ | 274,108,462 | $ | — | $ | 274,108,462 | ||||||||
Belgium | — | 122,012,006 | — | 122,012,006 | ||||||||||||
Brazil | 87,464,639 | — | — | 87,464,639 | ||||||||||||
Canada | 466,708,346 | — | — | 466,708,346 | ||||||||||||
China | 138,133,127 | 103,764,426 | — | 241,897,553 | ||||||||||||
Denmark | — | 53,882,721 | — | 53,882,721 | ||||||||||||
France | — | 237,033,857 | — | 237,033,857 | ||||||||||||
Germany | 358,998,398 | — | — | 358,998,398 | ||||||||||||
Hong Kong | 112,524,443 | — | 112,524,443 | |||||||||||||
Ireland | 28,939,458 | 57,126,658 | — | 86,066,116 | ||||||||||||
Israel | 105,246,162 | — | — | 105,246,162 | ||||||||||||
Japan | 132,905,418 | 242,615,198 | — | 375,520,616 | ||||||||||||
Mexico | 191,435,011 | — | — | 191,435,011 | ||||||||||||
Netherlands | 67,033,694 | — | — | 67,033,694 | ||||||||||||
Russia | — | 27,513,537 | — | 27,513,537 | ||||||||||||
Singapore | — | 122,005,078 | — | 122,005,078 | ||||||||||||
South Korea | 66,649,166 | 73,367,641 | — | 140,016,807 | ||||||||||||
Spain | — | 62,765,784 | — | 62,765,784 | ||||||||||||
Sweden | 53,335,323 | 169,978,650 | — | 223,313,973 | ||||||||||||
Switzerland | 80,828,434 | 345,087,801 | — | 425,916,235 | ||||||||||||
Taiwan | 56,089,586 | — | — | 56,089,586 | ||||||||||||
Turkey | 58,039,577 | — | — | 58,039,577 | ||||||||||||
United Kingdom | — | 981,524,406 | — | 981,524,406 | ||||||||||||
United States | 504,336,243 | — | — | 504,336,243 | ||||||||||||
Total Investments | $ | 2,396,142,582 | $ | 2,985,310,668 | $ | — | $ | 5,381,453,250 | ||||||||
NOTE 4—Expense Offset Arrangement(s)
The expense offset arrangement is comprised of transfer agency credits which result from balances in Demand Deposit Accounts (DDA) used by the transfer agent for clearing shareholder transactions. For the year ended October 31, 2012, the Fund received credits from this arrangement, which resulted in the reduction of the Fund’s total expenses of $8,077.
NOTE 5—Trustees’ and Officers’ Fees and Benefits
“Trustees’ and Officers’ Fees and Benefits” include amounts accrued by the Fund to pay remuneration to certain Trustees and Officers of the Fund. Trustees have the option to defer compensation payable by the Fund, and “Trustees’ and Officers’ Fees and Benefits” also include amounts accrued by the Fund to fund such deferred compensation amounts. Those Trustees who defer compensation have the option to select various Invesco Funds in which their deferral accounts shall be deemed to be invested. Finally, certain current Trustees are eligible to participate in a retirement plan that provides for benefits to be paid upon retirement to Trustees over a period of time based on the number of years of service. The Fund may have certain former Trustees who also participate in a retirement plan and receive benefits under such plan. “Trustees’ and Officers’ Fees and Benefits” include amounts accrued by the Fund to fund such retirement benefits. Obligations under the deferred compensation and retirement plans represent unsecured claims against the general assets of the Fund.
During the year ended October 31, 2012, the Fund paid legal fees of $329 for services rendered by Kramer, Levin, Naftalis & Frankel LLP as counsel to the Independent Trustees. A partner of that firm is a Trustee of the Trust.
17 Invesco International Growth Fund
NOTE 6—Cash Balances
The Fund is permitted to temporarily carry a negative or overdrawn balance in its account with State Street Bank and Trust Company, the custodian bank. Such balances, if any at period end, are shown in the Statement of Assets and Liabilities under the payable caption Amount due custodian. To compensate the custodian bank for such overdrafts, the overdrawn Fund may either (1) leave funds as a compensating balance in the account so the custodian bank can be compensated by earning the additional interest; or (2) compensate by paying the custodian bank at a rate agreed upon by the custodian bank and Invesco, not to exceed the contractually agreed upon rate.
NOTE 7—Distributions to Shareholders and Tax Components of Net Assets
Tax Character of Distributions to Shareholders Paid During the Years Ended October 31, 2012 and 2011:
| 2012 | 2011 | |||||||
Ordinary income | $ | 63,631,169 | $ | 40,310,572 | ||||
Tax Components of Net Assets at Period-End:
| 2012 | ||||
Undistributed ordinary income | $ | 62,277,734 | ||
Net unrealized appreciation — investments | 989,373,391 | |||
Net unrealized appreciation (depreciation) — other investments | (62,012 | ) | ||
Temporary book/tax differences | (636,785 | ) | ||
Capital loss carryforward | (297,609,446 | ) | ||
Shares of beneficial interest | 4,622,616,805 | |||
Total net assets | $ | 5,375,959,687 | ||
The difference between book-basis and tax-basis unrealized appreciation (depreciation) is due to differences in the timing of recognition of gains and losses on investments for tax and book purposes. The Fund’s net unrealized appreciation (depreciation) difference is attributable primarily to wash sales and recognition of unrealized gain on passive foreign investment company.
The temporary book/tax differences are a result of timing differences between book and tax recognition of income and/or expenses. The Fund’s temporary book/tax differences are the result of the trustee deferral of compensation and retirement plan benefits.
Capital loss carryforward is calculated and reported as of a specific date. Results of transactions and other activity after that date may affect the amount of capital loss carryforward actually available for the Fund to utilize. The Regulated Investment Company Modernization Act of 2010 (the “Act”) eliminated the eight-year carryover period for capital losses that arise in taxable years beginning after its enactment date of December 22, 2010. Consequently, these capital losses can be carried forward for an unlimited period. However, capital losses with an expiration period may not be used to offset capital gains until all net capital losses without an expiration date have been utilized. Additionally, post-enactment capital loss carryovers will retain their character as either short-term or long-term capital losses instead of as short-term capital losses as under prior law. The ability to utilize capital loss carryforward in the future may be limited under the Internal Revenue Code and related regulations based on the results of future transactions.
The Fund utilized $62,402,355 of capital loss carryforward in the current period to offset net realized capital gain for federal income tax purposes. The Fund has a capital loss carryforward as of October 31, 2012, which expires as follows:
| Capital Loss Carryforward* | ||||||||||||
| Expiration | Short-Term | Long-Term | Total | |||||||||
October 31, 2017 | $ | 297,609,446 | $ | — | $ | 297,609,446 | ||||||
| * | Capital loss carryforward as of the date listed above is reduced for limitations, if any, to the extent required by the Internal Revenue Code. To the extent that unrealized gains as of May 23, 2011, the date of reorganization of Invesco Van Kampen International Advantage Fund and Invesco Van Kampen International Growth Fund into the Fund and realized on securities held in each fund at such date of reorganization, the capital loss carryforward may be further limited for up to five years from the date of the reorganization. |
NOTE 8—Investment Securities
The aggregate amount of investment securities (other than short-term securities, U.S. Treasury obligations and money market funds, if any) purchased and sold by the Fund during the year ended October 31, 2012 was $1,355,122,118 and $925,593,567, respectively. Cost of investments on a tax basis includes the adjustments for financial reporting purposes as of the most recently completed federal income tax reporting period-end.
| Unrealized Appreciation (Depreciation) of Investment Securities on a Tax Basis | ||||
Aggregate unrealized appreciation of investment securities | $ | 1,086,216,787 | ||
Aggregate unrealized (depreciation) of investment securities | (96,843,396 | ) | ||
Net unrealized appreciation of investment securities | $ | 989,373,391 | ||
Cost of investments for tax purposes is $4,392,079,859.
NOTE 9—Reclassification of Permanent Differences
Primarily as a result of differing book/tax treatment of Fair Fund settlements and foreign currency transactions on October 31, 2012, undistributed net investment income was increased by $2,678,969 and undistributed net realized gain (loss) was decreased by $2,678,969. This reclassification had no effect on the net assets of the Fund.
18 Invesco International Growth Fund
NOTE 10—Share Information
| Summary of Share Activity | ||||||||||||||||
| Years ended October 31, | ||||||||||||||||
| 2012(a) | 2011 | |||||||||||||||
| Shares | Amount | Shares | Amount | |||||||||||||
Sold: | ||||||||||||||||
Class A | 16,612,668 | $ | 444,317,637 | 14,037,487 | $ | 387,500,963 | ||||||||||
Class B | 71,411 | 1,773,811 | 174,784 | 4,753,921 | ||||||||||||
Class C | 565,753 | 14,000,364 | 747,741 | 19,387,187 | ||||||||||||
Class R | 1,103,953 | 29,258,707 | 1,333,470 | 36,383,554 | ||||||||||||
Class Y | 35,037,135 | 918,964,925 | 10,051,297 | 272,811,514 | ||||||||||||
Class R5 | 22,915,486 | 616,373,073 | 19,343,414 | 533,838,311 | ||||||||||||
Class R6(b) | 8,072,691 | 232,732,447 | — | — | ||||||||||||
Issued as reinvestment of dividends: | ||||||||||||||||
Class A | 884,535 | 22,608,705 | 546,284 | 14,760,585 | ||||||||||||
Class B | 11,852 | 281,496 | 5,633 | 141,502 | ||||||||||||
Class C | 28,863 | 686,093 | 11,641 | 292,664 | ||||||||||||
Class R | 42,777 | 1,083,548 | 30,701 | 822,161 | ||||||||||||
Class Y | 347,894 | 8,899,120 | 25,598 | 692,428 | ||||||||||||
Class R5 | 844,709 | 21,844,184 | 520,471 | 14,234,881 | ||||||||||||
Issued in connection with acquisitions:(c) | ||||||||||||||||
Class A | — | — | 11,381,064 | 331,260,802 | ||||||||||||
Class B | — | — | 952,100 | 25,671,741 | ||||||||||||
Class C | — | — | 814,037 | 21,970,347 | ||||||||||||
Class R | — | — | 102,409 | 2,950,523 | ||||||||||||
Class Y | — | — | 15,897,443 | 463,869,410 | ||||||||||||
Class R5 | — | — | 3,490,727 | 103,037,338 | ||||||||||||
Automatic conversion of Class B shares to Class A shares: | ||||||||||||||||
Class A | 291,534 | 7,771,380 | 360,370 | 9,945,690 | ||||||||||||
Class B | (314,740 | ) | (7,771,380 | ) | (389,081 | ) | (9,945,690 | ) | ||||||||
Reacquired:(d) | ||||||||||||||||
Class A | (19,338,411 | ) | (517,692,023 | ) | (21,085,258 | ) | (579,642,615 | ) | ||||||||
Class B | (393,138 | ) | (9,769,403 | ) | (462,709 | ) | (11,875,558 | ) | ||||||||
Class C | (1,399,533 | ) | (34,486,842 | ) | (1,322,979 | ) | (33,530,468 | ) | ||||||||
Class R | (2,226,283 | ) | (57,988,033 | ) | (1,494,180 | ) | (41,065,410 | ) | ||||||||
Class Y | (11,123,652 | ) | (298,444,429 | ) | (4,426,443 | ) | (121,493,535 | ) | ||||||||
Class R5 | (32,738,845 | ) | (883,498,658 | ) | (13,918,449 | ) | (382,739,355 | ) | ||||||||
Class R6(b) | (100,063 | ) | (2,853,667 | ) | — | — | ||||||||||
Net increase in share activity | 19,196,596 | $ | 508,091,055 | 36,727,572 | $ | 1,064,032,891 | ||||||||||
| (a) | There are entities that are record owners of more than 5% of the outstanding shares of the Fund and in the aggregate own 38% of the outstanding shares of the Fund. IDI has an agreement with these entities to sell Fund shares. The Fund, Invesco and/or Invesco affiliates may make payments to these entities, which are considered to be related to the Fund, for providing services to the Fund, Invesco and/or Invesco affiliates including but not limited to services such as securities brokerage, distribution, third party record keeping and account servicing. The Fund has no knowledge as to whether all or any portion of the shares owned of record by these entities are also owned beneficially. |
| (b) | Commencement date of September 24, 2012. |
| (c) | As of the open of business on May 23, 2011, the Fund acquired all the net assets of Invesco Van Kampen International Advantage Fund and Invesco Van Kampen International Growth Fund pursuant to a plan of reorganization approved by the Trustees of the Fund on November 10, 2010 and by the shareholders of Invesco Van Kampen International Advantage Fund and Invesco Van Kampen International Growth Fund, respectively on April 14, 2011. The acquisition was accomplished by a tax-free exchange of 32,637,780 shares of the Fund for 5,574,029 shares outstanding of Invesco Van Kampen International Advantage Fund and 49,348,979 shares outstanding of Invesco Van Kampen International Growth Fund as of the close of business on May 20, 2011. Each class of shares of Invesco Van Kampen International Advantage Fund and Invesco Van Kampen International Growth Fund was exchanged for the like class of shares of the Fund based on the relative net asset value of Invesco Van Kampen International Advantage Fund and Invesco Van Kampen International Growth Fund to the net asset value of the Fund on the close of business, May 20, 2011. Invesco Van Kampen International Advantage Fund’s net assets as of the close of business on May 20, 2011 of $77,649,931 including $13,427,590 of unrealized appreciation and Invesco Van Kampen International Growth Fund’s net assets as of the close of business on May 20, 2011 of $871,110,230 including $153,130,351 of unrealized appreciation, were combined with the net assets of the Fund immediately before the acquisition of $3,996,943,417. The combined aggregate net assets of the Fund subsequent to the reorganization were $4,945,703,578. |
| (d) | Net of redemption fees of $21,765 and $112,143 allocated among the classes based on relative net assets of each class for the years ended October 31, 2012 and 2011, respectively. |
19 Invesco International Growth Fund
NOTE 11—Financial Highlights
The following schedule presents financial highlights for a share of the Fund outstanding throughout the periods indicated.
| Net asset value, beginning of period | Net investment income(a) | Net gains (losses) on securities (both realized and unrealized) | Total from investment operations | Dividends from net investment income | Distributions from net realized gains | Total distributions | Net asset value, end of period(b) | Total return(c) | Net assets, end of period (000s omitted) | Ratio of expenses to average net assets with fee waivers and/or expenses absorbed | Ratio of expenses to average net assets without fee waivers and/or expenses absorbed | Ratio of net investment income to average net assets | Portfolio turnover(d) | |||||||||||||||||||||||||||||||||||||||||||
Class A | ||||||||||||||||||||||||||||||||||||||||||||||||||||||||
Year ended 10/31/12 | $ | 26.43 | $ | 0.26 | $ | 1.59 | $ | 1.85 | $ | (0.32 | ) | $ | — | $ | (0.32 | ) | $ | 27.96 | 7.13 | % | $ | 2,132,503 | 1.37 | %(e) | 1.38 | %(e) | 0.99 | %(e) | 21 | % | ||||||||||||||||||||||||||
Year ended 10/31/11 | 26.99 | 0.36 | (0.65 | ) | (0.29 | ) | (0.27 | ) | — | (0.27 | ) | 26.43 | (1.10 | ) | 2,056,979 | 1.38 | 1.39 | 1.29 | 25 | |||||||||||||||||||||||||||||||||||||
Year ended 10/31/10 | 23.41 | 0.21 | 3.66 | 3.87 | (0.29 | ) | — | (0.29 | ) | 26.99 | 16.68 | 1,958,940 | 1.43 | 1.44 | 0.85 | 25 | ||||||||||||||||||||||||||||||||||||||||
Year ended 10/31/09 | 19.04 | 0.24 | 4.52 | 4.76 | (0.39 | ) | — | (0.39 | ) | 23.41 | 25.65 | 1,734,895 | 1.49 | 1.51 | 1.24 | 26 | ||||||||||||||||||||||||||||||||||||||||
Year ended 10/31/08 | 36.57 | 0.40 | (15.91 | ) | (15.51 | ) | (0.18 | ) | (1.84 | ) | (2.02 | ) | 19.04 | (47.34 | ) | 1,452,469 | 1.44 | 1.45 | 1.38 | 38 | ||||||||||||||||||||||||||||||||||||
Class B | ||||||||||||||||||||||||||||||||||||||||||||||||||||||||
Year ended 10/31/12 | 24.41 | 0.06 | 1.47 | 1.53 | (0.13 | ) | — | (0.13 | ) | 25.81 | 6.31 | 44,873 | 2.12 | (e) | 2.13 | (e) | 0.24 | (e) | 21 | |||||||||||||||||||||||||||||||||||||
Year ended 10/31/11 | 24.95 | 0.14 | (0.60 | ) | (0.46 | ) | (0.08 | ) | — | (0.08 | ) | 24.41 | (1.85 | ) | 57,683 | 2.13 | 2.14 | 0.54 | 25 | |||||||||||||||||||||||||||||||||||||
Year ended 10/31/10 | 21.68 | 0.02 | 3.40 | 3.42 | (0.15 | ) | — | (0.15 | ) | 24.95 | 15.83 | 51,950 | 2.18 | 2.19 | 0.10 | 25 | ||||||||||||||||||||||||||||||||||||||||
Year ended 10/31/09 | 17.52 | 0.09 | 4.20 | 4.29 | (0.13 | ) | — | (0.13 | ) | 21.68 | 24.72 | 61,649 | 2.24 | 2.26 | 0.49 | 26 | ||||||||||||||||||||||||||||||||||||||||
Year ended 10/31/08 | 33.88 | 0.17 | (14.69 | ) | (14.52 | ) | — | (1.84 | ) | (1.84 | ) | 17.52 | (45.03 | ) | 77,465 | 2.19 | 2.20 | 0.63 | 38 | |||||||||||||||||||||||||||||||||||||
Class C | ||||||||||||||||||||||||||||||||||||||||||||||||||||||||
Year ended 10/31/12 | 24.43 | 0.06 | 1.47 | 1.53 | (0.13 | ) | — | (0.13 | ) | 25.83 | 6.31 | 133,529 | 2.12 | (e) | 2.13 | (e) | 0.24 | (e) | 21 | |||||||||||||||||||||||||||||||||||||
Year ended 10/31/11 | 24.97 | 0.14 | (0.60 | ) | (0.46 | ) | (0.08 | ) | — | (0.08 | ) | 24.43 | (1.85 | ) | 145,944 | 2.13 | 2.14 | 0.54 | 25 | |||||||||||||||||||||||||||||||||||||
Year ended 10/31/10 | 21.70 | 0.02 | 3.40 | 3.42 | (0.15 | ) | — | (0.15 | ) | 24.97 | 15.81 | 142,898 | 2.18 | 2.19 | 0.10 | 25 | ||||||||||||||||||||||||||||||||||||||||
Year ended 10/31/09 | 17.53 | 0.09 | 4.21 | 4.30 | (0.13 | ) | — | (0.13 | ) | 21.70 | 24.76 | 139,000 | 2.24 | 2.26 | 0.49 | 26 | ||||||||||||||||||||||||||||||||||||||||
Year ended 10/31/08 | 33.91 | 0.17 | (14.71 | ) | (14.54 | ) | — | (1.84 | ) | (1.84 | ) | 17.53 | (45.05 | ) | 125,172 | 2.19 | 2.20 | 0.63 | 38 | |||||||||||||||||||||||||||||||||||||
Class R | ||||||||||||||||||||||||||||||||||||||||||||||||||||||||
Year ended 10/31/12 | 26.13 | 0.20 | 1.57 | 1.77 | (0.26 | ) | — | (0.26 | ) | 27.64 | 6.85 | 88,726 | 1.62 | (e) | 1.63 | (e) | 0.74 | (e) | 21 | |||||||||||||||||||||||||||||||||||||
Year ended 10/31/11 | 26.70 | 0.28 | (0.64 | ) | (0.36 | ) | (0.21 | ) | — | (0.21 | ) | 26.13 | (1.38 | ) | 112,091 | 1.63 | 1.64 | 1.04 | 25 | |||||||||||||||||||||||||||||||||||||
Year ended 10/31/10 | 23.18 | 0.15 | 3.62 | 3.77 | (0.25 | ) | — | (0.25 | ) | 26.70 | 16.36 | 115,237 | 1.68 | 1.69 | 0.60 | 25 | ||||||||||||||||||||||||||||||||||||||||
Year ended 10/31/09 | 18.80 | 0.20 | 4.49 | 4.69 | (0.31 | ) | — | (0.31 | ) | 23.18 | 25.44 | 63,544 | 1.74 | 1.76 | 0.99 | 26 | ||||||||||||||||||||||||||||||||||||||||
Year ended 10/31/08 | 36.18 | 0.32 | (15.74 | ) | (15.42 | ) | (0.12 | ) | (1.84 | ) | (1.96 | ) | 18.80 | (44.78 | ) | 34,821 | 1.69 | 1.70 | 1.13 | 38 | ||||||||||||||||||||||||||||||||||||
Class Y | ||||||||||||||||||||||||||||||||||||||||||||||||||||||||
Year ended 10/31/12 | 26.53 | 0.33 | 1.59 | 1.92 | (0.40 | ) | — | (0.40 | ) | 28.05 | 7.39 | 1,464,295 | 1.12 | (e) | 1.13 | (e) | 1.24 | (e) | 21 | |||||||||||||||||||||||||||||||||||||
Year ended 10/31/11 | 27.08 | 0.42 | (0.64 | ) | (0.22 | ) | (0.33 | ) | — | (0.33 | ) | 26.53 | (0.83 | ) | 741,428 | 1.13 | 1.14 | 1.54 | 25 | |||||||||||||||||||||||||||||||||||||
Year ended 10/31/10 | 23.48 | 0.27 | 3.67 | 3.94 | (0.34 | ) | — | (0.34 | ) | 27.08 | 16.94 | 173,313 | 1.18 | 1.19 | 1.10 | 25 | ||||||||||||||||||||||||||||||||||||||||
Year ended 10/31/09 | 19.04 | 0.32 | 4.52 | 4.84 | (0.40 | ) | — | (0.40 | ) | 23.48 | 26.05 | 62,343 | 1.24 | 1.26 | 1.49 | 26 | ||||||||||||||||||||||||||||||||||||||||
Year ended 10/31/08(f) | 22.36 | 0.02 | (3.34 | ) | (3.32 | ) | — | — | — | 19.04 | (14.85 | ) | 2,537 | 1.25 | (g) | 1.27 | (g) | 1.57 | (g) | 38 | ||||||||||||||||||||||||||||||||||||
Class R5 | ||||||||||||||||||||||||||||||||||||||||||||||||||||||||
Year ended 10/31/12 | 26.86 | 0.37 | 1.61 | 1.98 | (0.45 | ) | — | (0.45 | ) | 28.39 | 7.52 | 1,285,743 | 0.99 | (e) | 1.00 | (e) | 1.37 | (e) | 21 | |||||||||||||||||||||||||||||||||||||
Year ended 10/31/11 | 27.41 | 0.48 | (0.66 | ) | (0.18 | ) | (0.37 | ) | — | (0.37 | ) | 26.86 | (0.68 | ) | 1,457,494 | 0.97 | 0.98 | 1.70 | 25 | |||||||||||||||||||||||||||||||||||||
Year ended 10/31/10 | 23.77 | 0.31 | 3.72 | 4.03 | (0.39 | ) | — | (0.39 | ) | 27.41 | 17.12 | 1,228,916 | 1.02 | 1.03 | 1.26 | 25 | ||||||||||||||||||||||||||||||||||||||||
Year ended 10/31/09 | 19.36 | 0.35 | 4.58 | 4.93 | (0.52 | ) | — | (0.52 | ) | 23.77 | 26.32 | 917,297 | 1.01 | 1.03 | 1.72 | 26 | ||||||||||||||||||||||||||||||||||||||||
Year ended 10/31/08 | 37.14 | 0.52 | (16.17 | ) | (15.65 | ) | (0.29 | ) | (1.84 | ) | (2.13 | ) | 19.36 | (44.38 | ) | 526,647 | 1.03 | 1.04 | 1.79 | 38 | ||||||||||||||||||||||||||||||||||||
Class R6 | ||||||||||||||||||||||||||||||||||||||||||||||||||||||||
Year ended | 28.83 | 0.04 | (0.49 | ) | (0.45 | ) | — | — | — | 28.38 | (1.56 | ) | 226,291 | 0.92 | (e)(g) | 0.93 | (e)(g) | 1.44 | (e)(g) | 21 | ||||||||||||||||||||||||||||||||||||
| (a) | Calculated using average shares outstanding. |
| (b) | Includes redemption fees added to shares of beneficial interest which were less than $0.005 per share. |
| (c) | Includes adjustments in accordance with accounting principles generally accepted in the United States of America and as such, the net asset value for financial reporting purposes and the returns based upon those net asset values may differ from the net asset value and returns for shareholder transactions. Does not include sales charges and is not annualized for periods less than one year, if applicable. |
| (d) | Portfolio turnover is calculated at the fund level and is not annualized for periods less than one year, if applicable. For the period ending October 31, 2011, the portfolio turnover calculation excludes the value of securities purchased of $690,712,747 and sold of $131,009,072 in the effort to realign the Fund’s portfolio holdings after the reorganization of Invesco Van Kampen International Growth Advantage fund and Invesco Van Kampen International Growth Fund into the Fund. |
| (e) | Ratios are based on average daily net assets (000’s) of $2,055,669, $50,519, $137,887, $98,026, $1,097,269, $1,532,548 and $222,739 for Class A, Class B, Class C, Class R, Class Y, Class R5 and Class R6 shares, respectively. |
| (f) | Commencement date of October 3, 2008 and September 24, 2012 for Class Y shares and Class R6 shares, respectively. |
| (g) | Annualized. |
20 Invesco International Growth Fund
Report of Independent Registered Public Accounting Firm
To the Board of Trustees of AIM International Mutual Funds (Invesco International Mutual Funds)
and Shareholders of Invesco International Growth Fund:
In our opinion, the accompanying statement of assets and liabilities, including the schedule of investments, and the related statements of operations and of changes in net assets and the financial highlights present fairly, in all material respects, the financial position of Invesco International Growth Fund (one of the funds constituting AIM International Mutual Funds (Invesco International Mutual Funds), hereafter referred to as the “Fund”) at October 31, 2012, the results of its operations for the year then ended, the changes in its net assets for each of the two years in the period then ended and the financial highlights for each of the five years in the period then ended, in conformity with accounting principles generally accepted in the United States of America. These financial statements and financial highlights (hereafter referred to as “financial statements”) are the responsibility of the Fund’s management; our responsibility is to express an opinion on these financial statements based on our audits. We conducted our audits of these financial statements in accordance with the standards of the Public Company Accounting Oversight Board (United States). Those standards require that we plan and perform the audit to obtain reasonable assurance about whether the financial statements are free of material misstatement. An audit includes examining, on a test basis, evidence supporting the amounts and disclosures in the financial statements, assessing the accounting principles used and significant estimates made by management, and evaluating the overall financial statement presentation. We believe that our audits, which included confirmation of securities at October 31, 2012 by correspondence with the custodian and brokers, provide a reasonable basis for our opinion.
PRICEWATERHOUSECOOPERS LLP
December 21, 2012
Houston, Texas
21 Invesco International Growth Fund
Calculating your ongoing Fund expenses
Example
As a shareholder of the Fund, you incur two types of costs: (1) transaction costs, which may include sales charges (loads) on purchase payments or contingent deferred sales charges on redemptions, and redemption fees, if any; and (2) ongoing costs, including management fees, distribution and/or service (12b-1) fees, and other Fund expenses. This example is intended to help you understand your ongoing costs (in dollars) of investing in the Fund and to compare these costs with ongoing costs of investing in other mutual funds. With the exception of the actual ending account value and expenses of the Class R6 shares, the example is based on an investment of $1,000 invested at the beginning of the period and held for the entire period May 1, 2012, through October 31, 2012. The actual ending account value and expenses of the Class R6 shares in the example below are based on an investment of $1,000 invested as of close of business September 24, 2012 (commencement date) and held through October 31, 2012.
Actual expenses
The table below provides information about actual account values and actual expenses. You may use the information in this table, together with the amount you invested, to estimate the expenses that you paid over the period. Simply divide your account value by $1,000 (for example, an $8,600 account value divided by $1,000 = 8.6), then multiply the result by the number in the table under the heading entitled “Actual Expenses Paid During Period” to estimate the expenses you paid on your account during this period (as of close of business September 24, 2012 through October 31, 2012 for the Class R6 shares). Because the actual ending account value and expense information in the example is not based upon a six month period for the Class R6 shares, the ending account value and expense information may not provide a meaningful comparison to mutual funds that provide such information for a full six month period.
Hypothetical example for comparison purposes
The table below also provides information about hypothetical account values and hypothetical expenses based on the Fund’s actual expense ratio and an assumed rate of return of 5% per year before expenses, which is not the Fund’s actual return.
The hypothetical account values and expenses may not be used to estimate the actual ending account balance or expenses you paid for the period. You may use this information to compare the ongoing costs of investing in the Fund and other funds. To do so, compare this 5% hypothetical example with the 5% hypothetical examples that appear in the shareholder reports of the other funds.
Please note that the expenses shown in the table are meant to highlight your ongoing costs only and do not reflect any transaction costs, such as sales charges (loads) on purchase payments, contingent deferred sales charges on redemptions, and redemption fees, if any. Therefore, the hypothetical information is useful in comparing ongoing costs only, and will not help you determine the relative total costs of owning different funds. In addition, if these transaction costs were included, your costs would have been higher.
| Class | Beginning Account Value (05/01/12) | ACTUAL | HYPOTHETICAL (5% annual return before expenses) | Annualized Expense Ratio | ||||||||||||||||||||
| Ending Account Value (10/31/12)1 | Expenses Paid During Period2 | Ending Account Value (10/31/12) | Expenses Paid During Period3 | |||||||||||||||||||||
| A | $ | 1,000.00 | $ | 1,007.60 | $ | 6.81 | $ | 1,018.35 | $ | 6.85 | 1.35 | % | ||||||||||||
| B | 1,000.00 | 1,003.50 | 10.58 | 1,014.58 | 10.63 | 2.10 | ||||||||||||||||||
| C | 1,000.00 | 1,003.50 | 10.58 | 1,014.58 | 10.63 | 2.10 | ||||||||||||||||||
| R | 1,000.00 | 1,005.80 | 8.07 | 1,017.09 | 8.11 | 1.60 | ||||||||||||||||||
| Y | 1,000.00 | 1,008.60 | 5.55 | 1,019.61 | 5.58 | 1.10 | ||||||||||||||||||
| R5 | 1,000.00 | 1,009.20 | 5.05 | 1,020.11 | 5.08 | 1.00 | ||||||||||||||||||
| R6 | 1,000.00 | 984.40 | 0.95 | 1,020.51 | 4.67 | 0.92 | ||||||||||||||||||
| 1 | The actual ending account value is based on the actual total return of the Fund for the period May 1, 2012, through October 31, 2012 (as of close of business September 24, 2012 through October 31, 2012 for the Class R6 shares), after actual expenses and will differ from the hypothetical ending account value which is based on the Fund’s expense ratio and a hypothetical annual return of 5% before expenses. |
| 2 | Actual expenses are equal to the annualized expense ratio as indicated above multiplied by the average account value over the period, multiplied by 184/366 to reflect the most recent fiscal half year. For the Class R6 shares actual expenses are equal to the annualized expense ratio indicated above multiplied by the average account value over the period, multiplied by 38 (as of close of business September 24, 2012, through October 31, 2012)/366. Because the Class R6 shares have not been in existence for a full six month period, the actual ending account value and expense information shown may not provide a meaningful comparison to fund expense information of classes that show such data for a full six month period and, because the actual ending account value and expense information in the expense example covers a short time period, return and expense data may not be indicative of return and expense data for longer time periods. |
| 3 | Hypothetical expenses are equal to the annualized expense ratio indicated above multiplied by the average account value over the period, multiplied by 184/366 to reflect a one-half year. The hypothetical ending account value and expenses may be used to compare ongoing costs of investing in Class R6 shares of the Fund and other funds because such data is based on a full six month period. |
22 Invesco International Growth Fund
Approval of Investment Advisory and Sub-Advisory Contracts
The Board of Trustees (the Board) of AIM International Mutual Funds (Invesco International Mutual Funds) is required under the Investment Company Act of 1940, as amended, to approve annually the renewal of the Invesco International Growth Fund (the Fund) investment advisory agreement with Invesco Advisers, Inc. (Invesco Advisers) and the Master Intergroup Sub-Advisory Contract for Mutual Funds (the sub-advisory contracts) with Invesco Asset Management Deutschland GmbH, Invesco Asset Management Limited, Invesco Asset Management (Japan) Limited, Invesco Australia Limited, Invesco Hong Kong Limited, Invesco Senior Secured Management, Inc. and Invesco Canada Ltd. (collectively, the Affiliated Sub-Advisers). During contract renewal meetings held on June 19-20, 2012, the Board as a whole, and the disinterested or “independent” Trustees, who comprise 80% of the Board, voting separately, approved the continuance of the Fund’s investment advisory agreement and the sub-advisory contracts for another year, effective July 1, 2012. In doing so, the Board considered the process that it follows in reviewing and approving the Fund’s investment advisory agreement and sub-advisory contracts and the information that it is provided. The Board determined that the Fund’s investment advisory agreement and the sub-advisory contracts are in the best interests of the Fund and its shareholders and the compensation to Invesco Advisers and the Affiliated Sub-Advisers under the agreements is fair and reasonable.
The Board’s Fund Evaluation Process
The Board’s Investments Committee has established three Sub-Committees, each of which is primarily responsible for overseeing the management of a number of the series portfolios of the funds advised by Invesco Advisers (the Invesco Funds). The Sub-Committees meet throughout the year to review the performance of their assigned funds, including reviewing materials prepared under the direction of the independent Senior Officer, an officer of the Invesco Funds who reports directly to the independent Trustees. Over the course of each year, the Sub-Committees meet with portfolio managers for their assigned Invesco Funds and other members of management to review the performance, investment objective(s), policies, strategies, limitations and investment risks of these funds. The Sub-Committees meet regularly and at designated contract renewal meetings each year to conduct a review of the performance, fees, expenses and other matters related to their assigned Invesco Funds. Each Sub-Committee recommends to the Investments Committee, which in turn recommends to the full Board, whether and on what terms to approve the continuance of each Invesco Fund’s investment advisory agreement and sub-advisory contracts for another year.
During the contract renewal process, the Trustees receive comparative performance and fee data regarding the Invesco Funds prepared by Invesco Advisers and an independent company, Lipper Inc.
(Lipper). The Trustees also receive an independent written evaluation from the Senior Officer. The Senior Officer’s evaluation is prepared as part of his responsibility to manage the process by which the Invesco Funds’ proposed management fees are negotiated during the annual contract renewal process to ensure they are negotiated in a manner that is at arms’ length and reasonable. The independent Trustees are assisted in their annual evaluation of the Fund’s investment advisory agreement by the Senior Officer and by independent legal counsel. In addition to meetings with Invesco Advisers and fund counsel, the independent Trustees also discuss the continuance of the investment advisory agreement and sub-advisory contracts in private sessions with the Senior Officer and independent legal counsel.
In evaluating the fairness and reasonableness of the Fund’s investment advisory agreement and sub-advisory contracts, the Board considered, among other things, the factors discussed below. The Trustees recognized that the advisory fees for the Invesco Funds include advisory fees that are the result of years of review and negotiation between the Trustees and Invesco Advisers as well as advisory fees previously approved by a different board that, at the time, was responsible for overseeing Morgan Stanley and Van Kampen funds, which have become Invesco Funds following the acquisition of the retail mutual fund business of Morgan Stanley. The Trustees’ deliberations and conclusions in a particular year may be based in part on their deliberations and conclusions regarding these same arrangements throughout the year and in prior years. One Trustee may have weighed a particular piece of information or factor differently than another Trustee.
The discussion below serves as the Senior Officer’s independent written evaluation with respect to the Fund’s investment advisory agreement as well as a discussion of the material factors and related conclusions that formed the basis for the Board’s approval of the Fund’s investment advisory agreement and sub-advisory contracts. Unless otherwise stated, this information is current as of June 20, 2012, and may not reflect consideration of factors that became known to the Board after that date, including, for example, changes to the Fund’s performance, advisory fees, expense limitations and/or fee waivers.
Factors and Conclusions and Summary of Independent Written Fee Evaluation
| A. | Nature, Extent and Quality of Services Provided by Invesco Advisers and the Affiliated Sub-Advisers |
The Board reviewed the advisory services provided to the Fund by Invesco Advisers under the Fund’s investment advisory agreement, the performance of Invesco Advisers in providing these services, and the credentials and experience of the officers and employees of Invesco Advisers who provide these services, including the Fund’s portfolio manager or managers, with whom the Sub-Committees met during the year. The Board’s review of the
qualifications of Invesco Advisers to provide advisory services included the Board’s consideration of Invesco Advisers’ performance and investment process oversight, independent credit analysis and investment risk management.
In determining whether to continue the Fund’s investment advisory agreement, the Board considered the prior relationship between Invesco Advisers and the Fund, as well as the Board’s knowledge of Invesco Advisers’ operations, and concluded that it is beneficial to maintain the current relationship, in part because of such prior relationship and knowledge. The Board also considered services that Invesco Advisers and its affiliates provide to the Invesco Funds such as various back office support functions, equity and fixed income trading operations, internal audit, distribution and legal and compliance. The Board concluded that the nature, extent and quality of the services provided to the Fund by Invesco Advisers are appropriate and satisfactory and consistent with the terms of the Fund’s investment advisory agreement.
The Board reviewed the services provided by the Affiliated Sub-Advisers under the sub-advisory contracts and the credentials and experience of the officers and employees of the Affiliated Sub-Advisers who provide these services. The Board noted that the Affiliated Sub-Advisers have offices and personnel that are located in financial centers around the world. As a result, the Affiliated Sub-Advisers can provide research and investment analysis on the markets and economies of various countries in which the Fund invests and make recommendations on securities of companies located in such countries. The Board concluded that the sub-advisory contracts benefit the Fund and its shareholders by permitting Invesco Advisers to use the resources and talents of the Affiliated Sub-Advisers in managing the Fund. The Board concluded that the nature, extent and quality of the services provided by the Affiliated Sub-Advisers are appropriate and satisfactory and consistent with the terms of the Fund’s sub-advisory contracts.
| B. | Fund Performance |
The Board considered Fund performance as a relevant factor in considering whether to approve the investment advisory agreement. The Board did not view Fund performance as a relevant factor in considering whether to approve the sub-advisory contracts for the Fund, as no Affiliated Sub-Adviser currently manages assets of the Fund.
The Board compared the Fund’s performance during the past one, three and five calendar years to the performance of funds in the Lipper performance universe and against the Lipper International Large-Cap Growth Funds Index and the Lipper International Multi-Cap Growth Funds Index. The Board noted that performance of Class A shares of the Fund was in the first quintile of the performance universe for the one and five year periods and the second quintile for the three year period (the first quintile being the best performing funds and the fifth quintile being the worst performing funds). The Board noted that performance of Class A shares of the Fund
23 Invesco International Growth Fund
was above the performance of the Lipper International Large-Cap Growth Funds Index for the one, three and five year periods. The Board also noted that performance of Class A shares of the Fund was above the performance of the Lipper International Multi-Cap Growth Funds Index for the one and five year periods and below the performance of the Index for the three year period. The Trustees also reviewed more recent Fund performance and this review did not change their conclusions.
| C. | Advisory and Sub-Advisory Fees and Fee Waivers |
The Board compared the Fund’s contractual advisory fee rate to the contractual advisory fee rates of funds in the Fund’s Lipper expense group at a common asset level. The Board noted that the contractual advisory fee rate for Class A shares of the Fund was above the median contractual advisory fee rate of funds in the expense group. The Board also reviewed the methodology used by Lipper in providing expense group information, which includes using audited financial data from the most recent annual report of each fund in the expense group that was publicly available as of the end of the past calendar year and including only one fund per investment adviser. The Board noted that comparative data is as of varying dates, which may affect the comparability of data during times of market volatility.
The Board also compared the Fund’s effective fee rate (the advisory fee after advisory fee waivers and before expense limitations/waivers) to the advisory fee rates of other mutual funds advised by Invesco Advisers and its affiliates with investment strategies comparable to those of the Fund. The Board noted that Invesco Advisers sub-advises other mutual funds with investment strategies similar to the Fund and that the sub-advisory fees are below the advisory fee of the Fund, although the total account fee is higher in some instances and lower in others.
The Board also considered the fees charged by Invesco Advisers and the Affiliated Sub-Advisers to other client accounts with investment strategies comparable to those of the Fund. The Board noted that Invesco Advisers or the Affiliated Sub-Advisers may charge lower fees to large institutional clients solely for investment management services. Invesco Advisers reviewed with the Board the significantly greater scope of services it provides to the Invesco Funds relative to other client accounts. These additional services include provision of administrative services, officers and office space, oversight of service providers, preparation of annual registration statement updates and financial information and regulatory compliance under the Investment Company Act of 1940, as amended. Invesco Advisers also reviewed generally the higher frequency of shareholder purchases and redemptions in the Invesco Funds relative to the flow of assets for other client accounts. Invesco Advisers advised the Board that advance notice of redemptions is often provided to Invesco Advisers by institutional clients. The Board did note that sub-advisory fees charged by the Affiliated Sub-Advisers to manage the Invesco Funds and to manage other client accounts tended to be more comparable, reflecting a more comparable scope of services. The Board concluded that the aggregate services provided to the Invesco Funds were sufficiently different from those provided to
institutional clients, and the Board did not place significant weight on these fee comparisons.
The Board noted that Invesco Advisers has contractually agreed to waive fees and/or limit expenses of the Fund through at least June 30, 2013 in an amount necessary to limit total annual operating expenses to a specified percentage of average daily net assets for each class of the Fund.
The Board also considered the services provided by the Affiliated Sub-Advisers pursuant to the sub-advisory contracts, as well as the allocation of fees between Invesco Advisers and the Affiliated Sub-Advisers pursuant to the sub-advisory contracts. The Board noted that Invesco Advisers provides services to sub-advised Invesco Funds, including oversight of the Affiliated Sub-Advisers as well as the additional services described above other than day-to-day portfolio management. The Board also noted that the sub-advisory fees have no direct effect on the Fund or its shareholders, as they are paid by Invesco Advisers to the Affiliated Sub-Advisers.
Based upon the information and considerations described above, the Board concluded that the Fund’s advisory and sub-advisory fees are fair and reasonable.
| D. | Economies of Scale and Breakpoints |
The Board considered the extent to which there are economies of scale in the provision of advisory services to the Fund. The Board also considered whether the Fund benefits from economies of scale through contractual breakpoints in the Fund’s advisory fee schedule and were assisted in their review by a report from the Senior Officer. The Board also noted that the Fund shares directly in economies of scale through lower fees charged by third party service providers based on the combined size of the Invesco Funds and other clients advised by Invesco Advisers. The Board noted that Invesco Advisers proposes sharing economies of scale in administration expenses by lowering per class administrative fees.
| E. | Profitability and Financial Resources |
The Board reviewed information from Invesco Advisers concerning the costs of the advisory and other services that Invesco Advisers and its affiliates provide to the Fund and the profitability of Invesco Advisers and its affiliates in providing these services for the year ended December 31, 2011. The Board reviewed with Invesco Advisers the methodology used to prepare the profitability information. The Board considered the profitability of Invesco Advisers in connection with managing the Fund and the Invesco Funds. The Board noted that Invesco Advisers continues to operate at a net profit from services Invesco Advisers and its subsidiaries provide to the Invesco Funds and the Fund. The Board did not deem the level of profits realized by Invesco Advisers and its affiliates from providing services to the Fund to be excessive given the nature, quality and extent of the services provided to the Invesco Funds. The Board received and accepted information from Invesco Advisers demonstrating that Invesco Advisers and each Affiliated Sub-Adviser are financially sound and have the resources necessary to perform their obligations under the investment advisory agreement and sub-advisory contracts.
| F. | Collateral Benefits to Invesco Advisers and its Affiliates |
The Board considered various other benefits received by Invesco Advisers and its affiliates from the relationship with the Fund, including the fees received for their provision of administrative, transfer agency and distribution services to the Fund. The Board considered the performance of Invesco Advisers and its affiliates in providing these services and the organizational structure employed to provide these services. The Board also considered that these services are provided to the Fund pursuant to written contracts that are reviewed and approved on an annual basis by the Board; that the services are required for the operation of the Fund; that Invesco Advisers and its affiliates can provide services, the nature and quality of which are at least equal to those provided by others offering the same or similar services; and that the fees for such services are fair and reasonable in light of the usual and customary charges by others for services of the same nature and quality.
The Board considered the benefits realized by Invesco Advisers and the Affiliated Sub-Advisers as a result of portfolio brokerage transactions executed through “soft dollar” arrangements. The Board noted that soft dollar arrangements shift the payment obligation for research services from Invesco Advisers and the Affiliated Sub-Advisers to the Invesco Funds and therefore may reduce Invesco Advisers’ and the Affiliated Sub-Advisers’ expenses. The Board also considered periodic reports from the Chief Compliance Officer of the Invesco Funds demonstrating that these arrangements are consistent with regulatory requirements. The Board did not deem the soft dollar arrangements to be inappropriate.
The Board considered that the Fund’s uninvested cash and cash collateral from any securities lending arrangements may be invested in money market funds advised by Invesco Advisers pursuant to procedures approved by the Board. The Board noted that Invesco Advisers receives advisory fees from these affiliated money market funds attributable to such investments, although Invesco Advisers has contractually agreed to waive through varying periods the advisory fees payable by the Invesco Funds. The waiver is in an amount equal to 100% of the net advisory fee Invesco Advisers receives from the affiliated money market funds with respect to the Fund’s investment in the affiliated money market funds of uninvested cash, but not cash collateral. The Board concluded that the Fund’s investment of uninvested cash and cash collateral from any securities lending arrangements in the affiliated money market funds is in the best interests of the Fund and its shareholders.
The Board also considered use of an affiliated broker to execute certain trades for the Fund and that such trades are executed in compliance with rules under the Investment Company Act of 1940, as amended.
24 Invesco International Growth Fund
Tax Information
Form 1099-DIV, Form 1042-S and other year–end tax information provide shareholders with actual calendar year amounts that should be included in their tax returns. Shareholders should consult their tax advisors.
The following distribution information is being provided as required by the Internal Revenue Code or to meet a specific state’s requirement.
The Fund designates the following amounts or, if subsequently determined to be different, the maximum amount allowable for its fiscal year ended October 31, 2012:
Federal and State Income Tax | ||||
Qualified Dividend Income* | 100 | % | ||
Corporate Dividends Received Deduction* | 0 | % | ||
Foreign Tax Credit | $ | 0.0503 | per share | |
Foreign Source Income | $ | 0.6526 | per share | |
| * | The above percentages are based on ordinary income dividends paid to shareholders during the Fund’s fiscal year. |
25 Invesco International Growth Fund
Trustees and Officers
The address of each trustee and officer is AIM International Mutual Funds (Invesco International Mutual Funds) (the “Trust”), 11 Greenway Plaza, Suite 1000, Houston, Texas 77046-1173. The trustees serve for the life of the Trust, subject to their earlier death, incapacitation, resignation, retirement or removal as more specifically provided in the Trust’s organizational documents. Each officer serves for a one year term or until their successors are elected and qualified. Column two below includes length of time served with predecessor entities, if any.
| Name, Year of Birth and Position(s) Held with the Trust | Trustee and/ or Officer Since | Principal Occupation(s) During Past 5 Years | Number of Complex Overseen by Trustee | Other Directorship(s) Held by Trustee During Past 5 Years | ||||
| Interested Persons | ||||||||
| Martin L. Flanagan1 — 1960 Trustee | 2007 | Executive Director, Chief Executive Officer and President, Invesco Ltd. (ultimate parent of Invesco and a global investment management firm); Advisor to the Board, Invesco Advisers, Inc. (formerly known as Invesco Institutional (N.A.), Inc.); Trustee, The Invesco Funds; Vice Chair, Investment Company Institute; and Member of Executive Board, SMU Cox School of Business
Formerly: Chairman, Invesco Advisers, Inc. (registered investment adviser); Director, Chairman, Chief Executive Officer and President, IVZ Inc. (holding company), INVESCO Group Services, Inc. (service provider) and Invesco North American Holdings, Inc. (holding company); Director, Chief Executive Officer and President, Invesco Holding Company Limited (parent of Invesco and a global investment management firm); Director, Invesco Ltd.; Chairman, Investment Company Institute and President, Co-Chief Executive Officer, Co-President, Chief Operating Officer and Chief Financial Officer, Franklin Resources, Inc. (global investment management organization) | 123 | None | ||||
Philip A. Taylor2 — 1954 Trustee, President and Principal Executive Officer | 2006 | Head of North American Retail and Senior Managing Director, Invesco Ltd.; Director, Co-Chairman, Co-President and Co-Chief Executive Officer, Invesco Advisers, Inc. (formerly known as Invesco Institutional (N.A.), Inc.) (registered investment adviser); Director, Chairman, Chief Executive Officer and President, Invesco Management Group, Inc. (formerly known as Invesco Aim Management Group, Inc.) (financial services holding company); Director and President, INVESCO Funds Group, Inc. (registered investment adviser and registered transfer agent); Director and Chairman, Invesco Investment Services, Inc. (formerly known as Invesco Aim Investment Services, Inc.) (registered transfer agent) and IVZ Distributors, Inc. (formerly known as INVESCO Distributors, Inc.) (registered broker dealer); Director, President and Chairman, Invesco Inc. (holding company) and Invesco Canada Holdings Inc. (holding company); Chief Executive Officer, Invesco Corporate Class Inc. (corporate mutual fund company) and Invesco Canada Fund Inc. (corporate mutual fund company); Director, Chairman and Chief Executive Officer, Invesco Canada Ltd. (formerly known as Invesco Trimark Ltd./Invesco Trimark Ltèe) (registered investment adviser and registered transfer agent); Trustee, President and Principal Executive Officer, The Invesco Funds (other than AIM Treasurer’s Series Trust (Invesco Treasurer’s Series Trust) and Short-Term Investments Trust); Trustee and Executive Vice President, The Invesco Funds (AIM Treasurer’s Series Trust (Invesco Treasurer’s Series Trust) and Short-Term Investments Trust only); Director, Invesco Investment Advisers LLC (formerly known as Van Kampen Asset Management); Director, Chief Executive Officer and President, Van Kampen Exchange Corp.
Formerly: Director and Chairman, Van Kampen Investor Services Inc.; Director, Chief Executive Officer and President, 1371 Preferred Inc. (holding company); and Van Kampen Investments Inc.; Director and President, AIM GP Canada Inc. (general partner for limited partnerships); and Van Kampen Advisors, Inc.; Director and Chief Executive Officer, Invesco Trimark Dealer Inc. (registered broker dealer); Director, Invesco Distributors, Inc. (formerly known as Invesco Aim Distributors, Inc.) (registered broker dealer); Manager, Invesco PowerShares Capital Management LLC; Director, Chief Executive Officer and President, Invesco Advisers, Inc.; Director, Chairman, Chief Executive Officer and President, Invesco Aim Capital Management, Inc.; President, Invesco Trimark Dealer Inc. and Invesco Trimark Ltd./Invesco Trimark Ltèe; Director and President, AIM Trimark Corporate Class Inc. and AIM Trimark Canada Fund Inc.; Senior Managing Director, Invesco Holding Company Limited; Trustee and Executive Vice President, Tax-Free Investments Trust; Director and Chairman, Fund Management Company (former registered broker dealer); President and Principal Executive Officer, The Invesco Funds (AIM Treasurer’s Series Trust (Invesco Treasurer’s Series Trust), Short-Term Investments Trust and Tax-Free Investments Trust only); President, AIM Trimark Global Fund Inc. and AIM Trimark Canada Fund Inc. | 123 | None | ||||
Wayne W. Whalen3 — 1939 Trustee | 2010 | Of Counsel, and prior to 2010, partner in the law firm of Skadden, Arps, Slate, Meagher & Flom LLP, legal counsel to certain funds in the Fund Complex
| 136 | Director of the Mutual Fund Directors Forum, a nonprofit membership organization for investment directors; Chairman and Director of the Abraham Lincoln Presidential Library Foundation; and Director of the Stevenson Center for Democracy |
| 1 | Mr. Flanagan is considered an interested person of the Trust because he is an officer of the adviser to the Trust, and an officer and a director of Invesco Ltd., ultimate parent of the adviser to the Trust. |
| 2 | Mr. Taylor is considered an interested person of the Trust because he is an officer and a director of the adviser to, and a director of the principal underwriter of, the Trust. |
| 3 | Mr. Whalen is considered an “interested person” (within the meaning of Section 2(a)(19) of the 1940 Act) of certain Funds in the Invesco Fund Complex by reason of he and his firm currently providing legal services as legal counsel to such Funds in the Invesco Fund Complex. |
T-1 Invesco International Growth Fund
Trustees and Officers—(continued)
| Name, Year of Birth and Position(s) Held with the Trust | Trustee and/ or Officer Since | Principal Occupation(s) During Past 5 Years | Number of Funds in Fund Complex Overseen by Trustee | Other Directorship(s) Held by Trustee During Past 5 Years | ||||
| Independent Trustees | ||||||||
Bruce L. Crockett — 1944 Trustee and Chair | 1992 | Chairman, Crockett Technologies Associates (technology consulting company)
Formerly: Director, Captaris (unified messaging provider); Director, President and Chief Executive Officer COMSAT Corporation; and Chairman, Board of Governors of INTELSAT (international communications company) | 123 | ACE Limited (insurance company); and Investment Company Institute | ||||
David C. Arch — 1945 Trustee | 2010 | Retired.
Formerly: Chairman and Chief Executive Officer of Blistex Inc., (consumer health care products manufacturer) | 136 | Member of the Heartland Alliance Advisory Board, a nonprofit organization serving human needs based in Chicago. Board member of the Illinois Manufacturers��� Association. Member of the Board of Visitors, Institute for the Humanities, University of Michigan | ||||
Frank S. Bayley — 1939 Trustee | 2001 | Retired
Formerly: Director, Badgley Funds, Inc. (registered investment company) (2 portfolios) and Partner, law firm of Baker & McKenzie | 123 | Director and Chairman, C.D. Stimson Company (a real estate investment company) | ||||
James T. Bunch — 1942 Trustee | 2003 | Managing Member, Grumman Hill Group LLC (family office private equity management)
Formerly: Founder, Green, Manning & Bunch Ltd. (investment banking firm)(1988-2010); Executive Committee, United States Golf Association; and Director, Policy Studies, Inc. and Van Gilder Insurance Corporation | 123 | Chairman, Board of Governors, Western Golf Association, Chairman-elect, Evans Scholars Foundation and Director, Denver Film Society | ||||
Rodney F. Dammeyer — 1940 Trustee | 2010 | Chairman of CAC, LLC, (private company offering capital investment and management advisory services)
Formerly: Prior to January 2004, Director of TeleTech Holdings Inc.; Prior to 2002, Director of Arris Group, Inc.; Prior to 2001, Managing Partner at Equity Group Corporate Investments. Prior to 1995, Vice Chairman of Anixter International. Prior to 1985, experience includes Senior Vice President and Chief Financial Officer of Household International, Inc., Executive Vice President and Chief Financial Officer of Northwest Industries, Inc. and Partner of Arthur Andersen & Co. | 136 | Director of Quidel Corporation and Stericycle, Inc. Prior to May 2008, Trustee of The Scripps Research Institute. Prior to February 2008, Director of Ventana Medical Systems, Inc. Prior to April 2007, Director of GATX Corporation. Prior to April 2004, Director of TheraSense, Inc. | ||||
Albert R. Dowden — 1941 Trustee | 2000 | Director of a number of public and private business corporations, including the Boss Group, Ltd. (private investment and management); Reich & Tang Funds (5 portfolios) (registered investment company); and Homeowners of America Holding Corporation/ Homeowners of America Insurance Company (property casualty company)
Formerly: Director, Continental Energy Services, LLC (oil and gas pipeline service); Director, CompuDyne Corporation (provider of product and services to the public security market) and Director, Annuity and Life Re (Holdings), Ltd. (reinsurance company); Director, President and Chief Executive Officer, Volvo Group North America, Inc.; Senior Vice President, AB Volvo; Director of various public and private corporations; Chairman, DHJ Media, Inc.; Director Magellan Insurance Company; and Director, The Hertz Corporation, Genmar Corporation (boat manufacturer), National Media Corporation; Advisory Board of Rotary Power International (designer, manufacturer, and seller of rotary power engines); and Chairman, Cortland Trust, Inc. (registered investment company) | 123 | Director of Nature’s Sunshine Products, Inc. | ||||
Jack M. Fields — 1952 Trustee | 1997 | Chief Executive Officer, Twenty First Century Group, Inc. (government affairs company); and Owner and Chief Executive Officer, Dos Angelos Ranch, L.P. (cattle, hunting, corporate entertainment), Discovery Global Education Fund (non-profit) and Cross Timbers Quail Research Ranch (non-profit)
Formerly: Chief Executive Officer, Texana Timber LP (sustainable forestry company) and member of the U.S. House of Representatives | 123 | Insperity (formerly known as Administaff) | ||||
Carl Frischling — 1937 Trustee | 1991 | Partner, law firm of Kramer Levin Naftalis and Frankel LLP | 123 | Director, Reich & Tang Funds (6 portfolios) | ||||
Prema Mathai-Davis — 1950 Trustee | 1998 | Retired
Formerly: Chief Executive Officer, YWCA of the U.S.A. | 123 | None | ||||
Larry Soll — 1942 Trustee | 2003 | Retired
Formerly: Chairman, Chief Executive Officer and President, Synergen Corp. (a biotechnology company) | 123 | None |
T-2 Invesco International Growth Fund
Trustees and Officers—(continued)
| Name, Year of Birth and Position(s) Held with the Trust | Trustee and/ or Officer Since | Principal Occupation(s) During Past 5 Years | Number of Funds in Fund Complex Overseen by Trustee | Other Directorship(s) Held by Trustee During Past 5 Years | ||||
| Independent Trustees—(continued) | ||||||||
Hugo F. Sonnenschein — 1940 Trustee | 2010 | Distinguished Service Professor and President Emeritus of the University of Chicago and the Adam Smith Distinguished Service Professor in the Department of Economics at the University of Chicago.
Formerly: President of the University of Chicago | 136 | Trustee of the University of Rochester and a member of its investment committee. Member of the National Academy of Sciences, the American Philosophical Society and a fellow of the American Academy of Arts and Sciences | ||||
Raymond Stickel, Jr. — 1944 Trustee | 2005 | Retired
Formerly: Director, Mainstay VP Series Funds, Inc. (25 portfolios) and Partner, Deloitte & Touche | 123 | None | ||||
| Other Officers | ||||||||
Russell C. Burk — 1958 Senior Vice President and Senior Officer | 2005 | Senior Vice President and Senior Officer, The Invesco Funds | N/A | N/A | ||||
John M. Zerr — 1962 Senior Vice President, Chief Legal Officer and Secretary | 2006 | Director, Senior Vice President, Secretary and General Counsel, Invesco Management Group, Inc. (formerly known as Invesco Aim Management Group, Inc.) and Van Kampen Exchange Corp.; Senior Vice President, Invesco Advisers, Inc. (formerly known as Invesco Institutional (N.A.), Inc.) (registered investment adviser); Senior Vice President and Secretary, Invesco Distributors, Inc. (formerly known as Invesco Aim Distributors, Inc.); Director, Vice President and Secretary, Invesco Investment Services, Inc. (formerly known as Invesco Aim Investment Services, Inc.) and IVZ Distributors, Inc. (formerly known as INVESCO Distributors, Inc.); Director and Vice President, INVESCO Funds Group, Inc.; Senior Vice President, Chief Legal Officer and Secretary, The Invesco Funds; Manager, Invesco PowerShares Capital Management LLC; Director, Secretary and General Counsel, Invesco Investment Advisers LLC (formerly known as Van Kampen Asset Management); Secretary and General Counsel, Invesco Capital Markets, Inc. (formerly known as Van Kampen Funds Inc.) and Chief Legal Officer, PowerShares Exchange-Traded Fund Trust, PowerShares Exchange-Traded Fund Trust II, PowerShares India Exchange-Traded Fund Trust and PowerShares Actively Managed Exchange-Traded Fund Trust
Formerly: Director and Secretary, Van Kampen Advisors Inc.; Director Vice President, Secretary and General Counsel Van Kampen Investor Services Inc.; Director, Invesco Distributors, Inc. (formerly known as Invesco Aim Distributors, Inc.); Director, Senior Vice President, General Counsel and Secretary, Invesco Advisers, Inc.; and Van Kampen Investments Inc.; Director, Vice President and Secretary, Fund Management Company; Director, Senior Vice President, Secretary, General Counsel and Vice President, Invesco Aim Capital Management, Inc.; Chief Operating Officer and General Counsel, Liberty Ridge Capital, Inc. (an investment adviser); Vice President and Secretary, PBHG Funds (an investment company) and PBHG Insurance Series Fund (an investment company); Chief Operating Officer, General Counsel and Secretary, Old Mutual Investment Partners (a broker-dealer); General Counsel and Secretary, Old Mutual Fund Services (an administrator) and Old Mutual Shareholder Services (a shareholder servicing center); Executive Vice President, General Counsel and Secretary, Old Mutual Capital, Inc. (an investment adviser); and Vice President and Secretary, Old Mutual Advisors Funds (an investment company) | N/A | N/A | ||||
Lisa O. Brinkley — 1959 Vice President | 2004 | Global Assurance Officer, Invesco Ltd. and Vice President, The Invesco Funds
Formerly: Chief Compliance Officer, Invesco Distributors, Inc. (formerly known as Invesco Aim Distributors, Inc.), Invesco Investment Services, Inc.(formerly known as Invesco Aim Investment Services, Inc.) and Van Kampen Investor Services Inc.; Senior Vice President, Invesco Management Group, Inc.; Senior Vice President and Chief Compliance Officer, Invesco Advisers, Inc. and The Invesco Funds; Vice President and Chief Compliance Officer, Invesco Aim Capital Management, Inc. and Invesco Distributors, Inc.; Vice President, Invesco Investment Services, Inc. and Fund Management Company | N/A | N/A | ||||
T-3 Invesco International Growth Fund
Trustees and Officers—(continued)
| Name, Year of Birth and Position(s) Held with the Trust | Trustee and/ or Officer Since | Principal Occupation(s) During Past 5 Years | Number of Funds in Fund Complex Overseen by Trustee | Other Directorship(s) Held by Trustee During Past 5 Years | ||||
| Other Officers—(continued) | ||||||||
Karen Dunn Kelley — 1960 Vice President | 2004 | Head of Invesco’s World Wide Fixed Income and Cash Management Group; Senior Vice President, Invesco Management Group, Inc. (formerly known as Invesco Aim Management Group, Inc.) and Invesco Advisers, Inc. (formerly known as Invesco Institutional (N.A.), Inc.) (registered investment adviser); Executive Vice President, Invesco Distributors, Inc. (formerly known as Invesco Aim Distributors, Inc.); Director, Invesco Mortgage Capital Inc., INVESCO Global Asset Management Limited, Invesco Management Company Limited and INVESCO Management S.A.; Vice President, The Invesco Funds (other than AIM Treasurer’s Series Trust (Invesco Treasurer’s Series Trust) and Short-Term Investments Trust); and President and Principal Executive Officer, The Invesco Funds (AIM Treasurer’s Series Trust (Invesco Treasurer’s Series Trust) and Short-Term Investments Trust only)
Formerly: Senior Vice President, Van Kampen Investments Inc.; Vice President, Invesco Advisers, Inc. (formerly known as Invesco Institutional (N.A.), Inc.); Director of Cash Management and Senior Vice President, Invesco Advisers, Inc. and Invesco Aim Capital Management, Inc.; President and Principal Executive Officer, Tax-Free Investments Trust; Director and President, Fund Management Company; Chief Cash Management Officer, Director of Cash Management, Senior Vice President, and Managing Director, Invesco Aim Capital Management, Inc.; Director of Cash Management, Senior Vice President, and Vice President, Invesco Advisers, Inc. and The Invesco Funds (AIM Treasurer’s Series Trust (Invesco Treasurer’s Series Trust), Short-Term Investments Trust and Tax-Free Investments Trust only) | N/A | N/A | ||||
Sheri Morris — 1964 Vice President, Treasurer and Principal Financial Officer | 1999 | Vice President, Treasurer and Principal Financial Officer, The Invesco Funds; Vice President, Invesco Advisers, Inc. (formerly known as Invesco Institutional (N.A.), Inc.) (registered investment adviser); and Treasurer, PowerShares Exchange-Traded Fund Trust, PowerShares Exchange-Traded Fund Trust II, PowerShares India Exchange-Traded Fund Trust and PowerShares Actively Managed Exchange-Traded Fund Trust
Formerly: Vice President, Invesco Advisers, Inc., Invesco Aim Capital Management, Inc. and Invesco Aim Private Asset Management, Inc.; Assistant Vice President and Assistant Treasurer, The Invesco Funds and Assistant Vice President, Invesco Advisers, Inc., Invesco Aim Capital Management, Inc. and Invesco Aim Private Asset Management, Inc. | N/A | N/A | ||||
Yinka Akinsola — 1977 Anti-Money Laundering Compliance Officer | 2011 | Anti-Money Laundering Compliance Officer, Invesco Advisers, Inc. (formerly known as Invesco Institutional (N.A.), Inc.) (registered investment adviser); Invesco Distributors, Inc. (formerly known as Invesco Aim Distributors, Inc.), Invesco Investment Services, Inc. (formerly known as Invesco Aim Investment Services, Inc.), Invesco Management Group, Inc., The Invesco Funds, Invesco Van Kampen Closed-End Funds, Van Kampen Exchange Corp., Invesco Capital Markets, Inc. (formerly known as Van Kampen Funds Inc.), PowerShares Exchange-Traded Fund Trust, PowerShares Exchange-Traded Fund Trust II, PowerShares India Exchange-Traded Fund Trust, and PowerShares Actively Managed Exchange-Traded Fund Trust
Formerly: Regulatory Analyst III, Financial Industry Regulatory Authority (FINRA). | N/A | N/A | ||||
Todd L. Spillane — 1958 Chief Compliance Officer | 2006 | Senior Vice President, Invesco Management Group, Inc. (formerly known as Invesco Aim Management Group, Inc.) and Van Kampen Exchange Corp.; Senior Vice President and Chief Compliance Officer, Invesco Advisers, Inc. (registered investment adviser) (formerly known as Invesco Institutional (N.A.), Inc.); Chief Compliance Officer, The Invesco Funds; Vice President, Invesco Distributors, Inc. (formerly known as Invesco Aim Distributors, Inc.) and Invesco Investment Services, Inc. (formerly known as Invesco Aim Investment Services, Inc.)
Formerly: Chief Compliance Officer, Invesco Van Kampen Closed-End Funds; Senior Vice President, Van Kampen Investments Inc.; Senior Vice President and Chief Compliance Officer, Invesco Advisers, Inc. and Invesco Aim Capital Management, Inc.; Chief Compliance Officer, INVESCO Private Capital Investments, Inc. (holding company), Invesco Private Capital, Inc. (registered investment adviser), Invesco Global Asset Management (N.A.), Inc., Invesco Senior Secured Management, Inc. (registered investment adviser) and Van Kampen Investor Services Inc., PowerShares Exchange-Traded Fund Trust, PowerShares Exchange-Traded Fund Trust II, PowerShares India Exchange-Traded Fund Trust and PowerShares Actively Managed Exchange-Traded Fund Trust; Vice President, Invesco Aim Capital Management, Inc. and Fund Management Company | N/A | N/A | ||||
The Statement of Additional Information of the Trust includes additional information about the Fund’s Trustees and is available upon request, without charge, by calling 1.800.959.4246. Please refer to the Fund’s prospectus for information on the Fund’s sub-advisers.
Office of the Fund 11 Greenway Plaza, Suite 1000 Houston, TX 77046-1173 | Investment Adviser Invesco Advisers, Inc. 1555 Peachtree Street, N.E. Atlanta, GA 30309 | Distributor Invesco Distributors, Inc. 11 Greenway Plaza, Suite 1000 Houston, TX 77046-1173 | Auditors PricewaterhouseCoopers LLP 1201 Louisiana Street, Suite 2900 Houston, TX 77002-5678 | |||
Counsel to the Fund Stradley Ronon Stevens & Young, LLP 2005 Market Street, Suite 2600 Philadelphia, PA 19103-7018 | Counsel to the Independent Trustees Kramer Levin Naftalis & Frankel LLP 1177 Avenue of the Americas New York, NY 10036-2714 | Transfer Agent Invesco Investment Services, Inc. 11 Greenway Plaza, Suite 1000 Houston, TX 77046-1173 | Custodian State Street Bank and Trust Company 225 Franklin Street Boston, MA 02110-2801 | |||
T-4 Invesco International Growth Fund

Invesco mailing information
Send general correspondence to Invesco Investment Services, Inc., P.O. Box 219078, Kansas City, MO 64121-9078.
Invesco privacy policy
You share personal and financial information with us that is necessary for your transactions and your account records. We take very seriously the obligation to keep that information confidential and private.
Invesco collects nonpublic personal information about you from account applications or other forms you complete and from your transactions with us or our affiliates. We do not disclose information about you or our former customers to service providers or other third parties except to the extent necessary to service your account and in other limited circumstances as permitted by law. For example, we use this information to facilitate the delivery of transaction confirmations, financial reports, prospectuses and tax forms.
Even within Invesco, only people involved in the servicing of your accounts and compliance monitoring have access to your information. To ensure the highest level of confidentiality and security, Invesco maintains physical, electronic and procedural safeguards that meet or exceed federal standards. Special measures, such as data encryption and authentication, apply to your communications with us on our website. More detail is available to you at invesco.com/privacy.
Important notice regarding delivery of security holder documents
To reduce Fund expenses, only one copy of most shareholder documents may be mailed to shareholders with multiple accounts at the same address (Householding). Mailing of your shareholder documents may be householded indefinitely unless you instruct us otherwise. If you do not want the mailing of these documents to be combined with those for other members of your household, please contact Invesco Investment Services, Inc. at 800 959 4246 or contact your financial institution. We will begin sending you individual copies for each account within 30 days after receiving your request.
Fund holdings and proxy voting information
The Fund provides a complete list of its holdings four times in each fiscal year, at the quarter-ends. For the second and fourth quarters, the lists appear in the Fund’s semiannual and annual reports to shareholders. For the first and third quarters, the Fund files the lists with the Securities and Exchange Commission (SEC) on Form N-Q. The most recent list of portfolio holdings is available at invesco.com/completeqtrholdings. Shareholders can also look up the Fund’s Forms N-Q on the SEC website at sec.gov. Copies of the Fund’s Forms N-Q may be reviewed and copied at the SEC Public Reference Room in Washington, D.C. You can obtain information on the operation of the Public Reference Room, including information about duplicating fee charges, by calling 202 551 8090 or 800 732 0330, or by electronic request at the following email address: publicinfo@sec.gov. The SEC file numbers for the Fund are shown below.
A description of the policies and procedures that the Fund uses to determine how to vote proxies relating to portfolio securities is available without charge, upon request, from our Client Services department at 800 959 4246 or at invesco.com/proxyguidelines. The information is also available on the SEC website, sec.gov.
Information regarding how the Fund voted proxies related to its portfolio securities during the 12 months ended June 30, 2012, is available at invesco.com/proxysearch. The information is also available on the SEC website, sec.gov. Invesco Advisers, Inc. is an investment adviser; it provides investment advisory services to individual and institutional clients and does not sell securities. Invesco Distributors, Inc. is the US distributor for Invesco Ltd.’s retail mutual funds, exchange-traded funds and institutional money market funds. Both are wholly owned, indirect subsidiaries of Invesco Ltd. |  |
| SEC file numbers: 811-06463 and 033-44611 | IGR-AR-1 | Invesco Distributors, Inc. |

Letters to Shareholders
Philip Taylor | Dear Shareholders: This report contains information about your Fund, including a discussion from your portfolio managers about how they managed your Fund – and why it performed as it did – during the reporting period. This report also includes your Fund’s long-term performance and a complete list of your Fund’s investments as of the close of the reporting period. I hope you find this information helpful. For much of the reporting period, investors’ attention was focused on Europe, where eurozone governments struggled to reduce debt levels, strengthen their banks and stimulate their economies. European leaders disagreed whether the wiser path to restoring the Continent’s economic well-being was more stimulus or greater austerity. In the US, economic data were mixed. Economic growth, while positive, was relatively modest. Corporate earnings, which grew strongly in recent years, showed signs of slowing. And job creation was less robust than hoped. |

Later in this report, your Fund’s portfolio managers discuss how economic conditions and market trends affected your Fund’s performance.
Economic conditions are always subject to sudden and unexpected change. That’s why you may find it helpful to work with a trusted, experienced financial adviser who understands your unique financial goals, needs and risk tolerances. Financial advisers can provide valuable insight and information, particularly when markets are uncertain, and they can recommend investments appropriate for specific investment goals, such as a child’s college education or your retirement. On a regular basis, a financial adviser also can determine whether your existing investments are still appropriate, given your changing needs, goals and circumstances.
Timely insight and information from many of Invesco’s investment professionals is available at our website, invesco.com/us. We offer in-depth articles, video clips and audio commentaries from many of our portfolio managers and other investment professionals on a wide range of topics of interest to investors: recent economic and market developments; retirement planning; legislative updates from Washington, DC; and general investor education. At invesco.com/us, you also can access information about your Invesco account at any time.
What we mean by Intentional Investing
Intentional InvestingSM is the science and art of investing with purpose, prudence and diligence – and it’s how Invesco’s investment professionals manage your money every day.
This highly disciplined process begins when specialized teams of investment professionals clearly define an investment objective and then establish specific investment strategies to try to achieve that objective. While our investment teams closely monitor economic and market conditions – and issues specific to individual holdings that could affect their value – they maintain a long-term investment perspective. Intentional Investing is also:
| n | How we manage and mitigate risk – by embedding risk controls and processes into every aspect of our business; |
| n | How we create products – by offering a diverse combination of investment strategies and vehicles designed to meet your needs; and |
| n | How we connect with you, our investors – by communicating clearly, by delivering expert insights from our portfolio managers and other investment professionals, and by providing a website full of tools and articles to help you stay informed. |
As a company, Invesco believes in putting investors first, and that’s why investment management is all we do. Our sole focus on managing your money allows your financial adviser to build a truly diversified investment portfolio of Invesco funds, whatever your investment needs and goals may be – and allows him or her to find appropriate Invesco funds when your circumstances change. Of course, neither Intentional Investing nor diversification can guarantee a profit or protect against loss.
Have a question?
If you have questions about your account, please contact an Invesco client services representative at 800 959 4246. If you have an Invesco-related question or comment, feel free to email me directly at phil@invesco.com.
All of us at Invesco look forward to serving your investment management needs for many years to come. Thank you for investing with us.
Sincerely,

Philip Taylor
Senior Managing Director, Invesco Ltd.
2 Invesco Select Opportunities Fund
Bruce Crockett | Dear Fellow Shareholders: One of our most important responsibilities as independent Trustees of the Invesco Funds is our annual review of the funds’ advisory and sub-advisory contracts with Invesco. This annual review is required by the Investment Company Act of 1940 and focuses on the nature and quality of the services Invesco has provided as adviser to the Invesco Funds and the reasonableness of the fees that it charges for those services. In our roles as Trustees, we spend months reviewing thousands of pages of detailed information that we request from Invesco in connection with our annual review. We focus on the quality and costs of the services to be provided by Invesco and its affiliates. Some of the most important things we look at are fund performance, expenses and fees. All of the Trustees have substantial personal investments in the Invesco Funds complex. We’re fund shareholders just like you. |

We also use information from many independent sources during the review process, including materials provided by the independent Senior Officer of the Invesco Funds, who reports directly to the independent Trustees. We also meet in private sessions with independent legal counsel and review performance and fee data on the Invesco Funds prepared by Lipper Inc., an independent, third-party firm widely recognized as a leader in its field.
I’m pleased to report that the Invesco Funds Board determined in June that renewing the investment advisory agreement and the sub-advisory contracts with Invesco would serve the best interests of each fund and its shareholders. For more detailed information about our assessment and conclusions with respect to each of the Invesco Funds, visit invesco.com/us, click on the “About Us” section and go to “Legal Information.” Information on the recent investment advisory renewal process can be found by clicking the last item under “Corporate Governance.”
In much the same way we review your fund’s advisory contract each year, it’s a good idea for you to review your own investment plan with your financial adviser on a regular basis. Perhaps you need to reassess your original asset allocation because different investments may grow at varying paces, or perhaps you’re going through a significant life change. Regardless of your situation, a financial adviser can provide guidance and experience to help you reach your financial goals.
As always, please contact me at bruce@brucecrockett.com with any questions or concerns you may have. On behalf of the Board, we look forward to continuing to represent your interests and serving your needs.
Sincerely,

Bruce L. Crockett
Independent Chair
Invesco Funds Board of Trustees
3 Invesco Select Opportunities Fund
Management’s Discussion of Fund Performance
Performance summary
Invesco Select Opportunities Fund incepted on August 3, 2012. For the reporting period ended October 31, 2012, Invesco Select Opportunities Fund, at net asset value (NAV), performed better than the Fund’s broad market index, the MSCI World Index.
Drivers of performance were largely stock specific and due mainly to above-market returns from select investments in the health care, consumer staples and information technology (IT) sectors. Alternatively, select holdings in the IT sector were the largest detractors from performance during the reporting period.
Additional Fund performance appears later in this report.
Fund vs. Indexes
Cumulative total returns, 8/3/12 to 10/31/12, at net asset value (NAV). Performance shown does not include applicable contingent deferred sales charges (CDSC) or front-end sales charges, which would have reduced performance.
Class A Shares | 6.30 | % | ||
Class C Shares | 6.20 | |||
Class R Shares | 6.30 | |||
Class Y Shares | 6.40 | |||
Class R5 Shares* | 6.40 | |||
Class R6 Shares** | 6.40 | |||
MSCI World Indexq (Broad Market Index)*** | 4.64 | |||
MSCI World Small Cap Indexn (Style-Specific Index)*** | 6.28 | |||
Lipper Global Small/Mid-Cap Funds Classification Averagen (Peer Group)*** | 6.76 |
Source(s): qInvesco, MSCI via FactSet Research Systems Inc.; nLipper Inc.
| * | Effective September 24, 2012, Institutional Class shares were renamed Class R5 shares. |
| ** | Share class incepted during the reporting period. See page 6 for a detailed explanation of Fund performance. |
| *** | Returns for the Fund’s indexes are from 7/31/12, the month-end closest to the date of the Fund’s inception. |
How we invest
We view ourselves as business people buying businesses, and we consider the purchase of a stock as an ownership interest in a business. We strive to develop a proprietary view of a business through in-depth, fundamental research that includes careful financial statement analysis and meetings with company management teams. We then seek to purchase businesses whose stock prices are below what we have calculated to be the true value based on future cash flows, management performance and business fundamentals.
In conducting a comprehensive analysis of a company, we strive to identify
primarily global stocks which have:
| n | Sustainable competitive advantages. |
| n | Strong growth prospects. |
| n | High barriers to entry. |
| n | Honest and capable management teams. |
Central to our discipline is our adherence to an investment horizon of three to five years. We use this long-term approach because we believe good business strategies usually take that amount of time to implement and produce strong earnings growth. We also use a concentrated portfolio approach, constructing a portfolio of about 20 to 40 stocks. We believe this allows each investment opportunity to materially impact the Fund’s performance.
While deliberate efforts are made to reduce risk through industry diversification, our primary method of attempting to reduce risk is to purchase businesses that are trading below their estimated intrinsic value.
Holdings are considered for sale if:
| n | A more attractive investment opportunity exists. |
| n | Full value of the investment is deemed to have been realized. |
Holdings are also considered for sale if the original thesis for buying the company changes due to a fundamental negative change in management strategy or a fundamental negative change in the competitive environment.
Market conditions and your Fund
As noted earlier, Invesco Select Opportunities Fund incepted on August 3, 2012, and the reporting period spanned approximately three months. During this time, equity markets were somewhat volatile. At the end of the reporting period, fears about the fate of the eurozone began to subside after the European Central Bank announced new measures to support eurozone economies through potentially unlimited purchases of sovereign debt, among other measures. At the same time, continued risk aversion among investors and corporations, along with tepid employment growth, prompted the US Federal Reserve (the Fed) to initiate a third round of quantitative easing by promising to remain accommodative until the labor market outlook improves materially. The Fed’s action initially bolstered equity markets, but the potential impact on employment and economic conditions remained uncertain. At the close of the reporting period, market volatility increased as many investors remained concerned about the uncertainty surrounding the presidential election and the so-called “fiscal cliff” – a variety of tax increases and spending
Portfolio Composition
By country
United States | 28.3 | % | ||
Ireland | 11.4 | |||
France | 7.6 | |||
Netherlands | 6.1 | |||
Canada | 5.3 | |||
Hong Kong | 3.1 | |||
United Kingdom | 2.9 | |||
Sweden | 2.6 | |||
Norway | 2.5 | |||
Money Market Funds | ||||
Plus Other Assets Less Liabilities | 30.2 |
Top 10 Equity Holdings*
1. Alliance Data Systems Corp. | 7.3 | % | ||
2. United Drug PLC | 5.7 | |||
3. International Rectifier Corp. | 5.0 | |||
4. Ipsos | 4.9 | |||
5. DCC PLC | 4.0 | |||
6. Aastra Technologies Ltd. | 3.9 | |||
7 . Aalberts Industries N.V. | 3.6 | |||
8. Rovi Corp. | 3.3 | |||
9. Lender Processing Services, | 3.3 | |||
10. Fairwood Holdings Ltd. | 3.1 |
Total Net Assets | $ | 2.4 million | ||
Total Number of Holdings* | 22 | |||
The Fund’s holdings are subject to change, and there is no assurance that the Fund will continue to hold any particular security.
*Excluding money market fund holdings.
4 Invesco Select Opportunities Fund
cuts scheduled to take effect in January 2013, unless an agreement is reached between the White House and Congress.
Our investment approach focuses on individual businesses rather than market sectors. Therefore, your Fund shares little in common with sector and regional weightings of various market indexes. However, if we were to broadly categorize businesses with which we had the most success during the reporting period, our investments in select health care and consumer staples stocks were the largest contributors to performance. Select holdings in IT were among the largest detractors. From a regional perspective, we had the most success in European investments and the least success in North America. Our cash position hurt the Fund’s performance relative to its benchmarks in a rising market environment.
United Drug and Alliance Data
Systems (ADS) were among the largest contributors to Fund performance during the reporting period. United Drug is a provider of outsourced services to pharmaceutical companies including distribution, contract sales and packaging. Initially, we believed United Drug had a leading competitive position, was a dominant player in the Irish drug distribution market, was well managed and had promising growth opportunities. The concern at the time was the company’s valuation. We purchased the business as we realized that it was still a leader in its sector and had capitalized on some of those growth opportunities (with more still to explore). We were able to purchase the company at an attractive valuation. The company’s valuation had been weighed down by negative investor sentiment toward Ire-land and by health care reform from reduced drug reimbursements as a result of budgetary pressures. We focused on the long-term prospects of the business. Shares of the company rose during the reporting period as investors recognized the inherent value in this business. The company made a number of acquisitions at attractive prices that are aligned with its strategic vision. Investor sentiment became more positive on the company’s wholesale business which isn’t deteriorating as fast as previously expected.
ADS operates three business segments: Private Label Services and Credit, LoyaltyOne and Epsilon. ADS is the market leader in the private label services and credit segment, catering to specialty retailers like Victoria’s Secret. ADS is the credit issuer, processor and service provider and creates a single point of high-quality service where three or four
providers would otherwise need to be stitched together. The LoyaltyOne segment allows consumers to earn Air Miles reward miles and Epsilon provides integrated direct marketing solutions. All three of the company’s business segments have been performing strongly.
Among the largest detractors from Fund performance during the reporting period were International Rectifier and Synaptics. International Rectifier has a 40-year history of leadership in making chips that reduce power consumption. The company specializes in semiconductors used in computers as well as in energy-efficient appliances and automobiles. These semiconductors help reduce power consumption and improve both performance and efficiency. Shares of the company declined as revenues and margins were negatively affected by weaker sales in China, which currently has an oversupply of inventory. We are still comfortable with our position and believe the company’s efforts to consolidate manufacturing will remove costs, which could increase profitability even at the same level of revenues.
Synaptics is a leader in developing touch interface for portable devices. It has a rich history of developing innovative products such as TouchPadTM and iPod’s Clickwheel. With its strong technical expertise in capacitive touch, it is well positioned to benefit from the massive transition to touch screen in handsets, digital still cameras, handheld gaming devices and other portable devices. In the short term, the company is being negatively affected by slowing PC sales. We believe they have the opportunity to benefit from the launch of Windows 8 and their Windows 8 notebook systems, which have a bigger screen and thus a larger touch footprint. The larger screen increases the amount that Synaptics can earn relative to the smaller screens on tablets and smartphones.
During the almost three-month reporting period since the Fund’s inception, we focused on finding quality businesses trading at attractive values relative to what we believe are their long-term prospects. In contrast, the market is often driven by short-term events or outlooks in both good times and bad. Market volatility allows us to take advantage of investment opportunities we believe may benefit your Fund in the long term.
While we can never predict future Fund performance, we pledge to you that we will adhere to our discipline of being business people who buy businesses. We will continually strive to upgrade the quality
of your Fund’s portfolio. Thank you for your investment in Invesco Select Opportunities Fund.
The views and opinions expressed in management’s discussion of Fund performance are those of Invesco Advisers, Inc. These views and opinions are subject to change at any time based on factors such as market and economic conditions. These views and opinions may not be relied upon as investment advice or recommendations, or as an offer for a particular security. The information is not a complete analysis of every aspect of any market, country, industry, security or the Fund. Statements of fact are from sources considered reliable, but Invesco Advisers, Inc. makes no representation or warranty as to their completeness or accuracy. Although historical performance is no guarantee of future results, these insights may help you understand our investment management philosophy.
See important Fund and, if applicable, index disclosures later in this report.
 | Robert Mikalachki Chartered Financial Analyst, portfolio manager, is lead manager of Invesco Select Opportunities | |
| Fund. He joined Invesco in 1999. Mr. Mikalachki earned a business degree from Wilfrid Laurier University. | ||
 | Virginia Au Chartered Financial Analyst, portfolio manager, is manager of Invesco Select Opportunities Fund. | |
| She joined Invesco in 2006. Ms. Au earned a Bachelor of Commerce degree in finance from The University of British Columbia. | ||
 | Jason Whiting Chartered Financial Analyst, portfolio manager, is manager of Invesco Select Opportunities Fund. | |
| He joined Invesco in 2003. Mr. Whiting earned a B.B.A. from Wilfrid Laurier University. | ||
5 Invesco Select Opportunities Fund
Cumulative Total Returns
As of 10/31/12, including maximum applicable sales charges
Class A Shares | ||||
Inception (8/3/12) | 0.47 | % | ||
Class C Shares | ||||
Inception (8/3/12) | 5.20 | % | ||
Class R Shares | ||||
Inception (8/3/12) | 6.30 | % | ||
Class Y Shares | ||||
Inception (8/3/12) | 6.40 | % | ||
Class R5 Shares | ||||
Inception (8/3/12) | 6.40 | % | ||
Class R6 Shares | ||||
Inception | 6.40 | % | ||
Class R6 shares incepted on September 24, 2012. Performance shown prior to that date is that of Class A shares and includes the 12b-1 fees applicable to Class A shares. Class A share performance reflects any applicable fee waivers or expense reimbursements.
The performance data quoted represent past performance and cannot guarantee comparable future results; current performance may be lower or higher. Please visit invesco.com/performance for the most recent month-end performance. Performance figures reflect reinvested distributions, changes in net asset value and the effect of the maximum sales charge unless otherwise stated. Investment return and principal value will fluctuate so that you may have a gain or loss when you sell shares.
The net annual Fund operating expense ratio set forth in the most recent Fund prospectus as of the date of this report for Class A, Class C, Class R, Class Y, Class R5 and Class R6 shares was 1.51%, 2.26%, 1.76%, 1.26%, 1.26% and 1.26%, respectively.1 The total annual Fund operating expense ratio set forth in the most recent Fund prospectus as of the date of this report for Class A, Class C, Class R, Class Y, Class R5 and Class R6 shares was 2.76%, 3.51%, 3.01%, 2.51%, 2.39% and 2.35%, respectively. The expense ratios presented above may vary from the expense ratios presented in other sections of this report that are based on expenses incurred during the period covered by this report.
Cumulative Total Returns
As of 9/30/12, the most recent calendar quarter-end, including maximum applicable sales charges
Class A Shares | ||||
Inception (8/3/12) | 1.04 | % | ||
Class C Shares | ||||
Inception (8/3/12) | 5.70 | % | ||
Class R Shares | ||||
Inception (8/3/12) | 6.80 | % | ||
Class Y Shares | ||||
Inception (8/3/12) | 6.90 | % | ||
Class R5 Shares | ||||
Inception (8/3/12) | 6.90 | % | ||
Class R6 Shares | ||||
Inception | 6.90 | % | ||
Class A share performance reflects the maximum 5.50% sales charge, and Class C share performance reflects the applicable contingent deferred sales charge (CDSC) for the period involved. The CDSC on Class C shares is 1% for the first year after purchase. Class R, Class Y, Class R5 and Class R6 shares do not have a front-end sales charge or a CDSC; therefore, performance is at net asset value.
The performance of the Fund’s share classes will differ primarily due to different sales charge structures and class expenses.
Had the adviser not waived fees and/ or reimbursed expenses, performance would have been lower.
| 1 | Total annual Fund operating expenses after any contractual fee waivers and/or expense reimbursements by the adviser in effect through at least February 28, 2014. See current prospectus for more information. |
6 Invesco Select Opportunities Fund
Invesco Select Opportunities Fund’s investment objective is long-term growth of capital.
| n | Unless otherwise stated, information presented in this report is as of October 31, 2012, and is based on total net assets. |
| n | Unless otherwise noted, all data provided by Invesco. |
| n | To access your Fund’s reports/prospectus, visit invesco.com/fundreports. |
About share classes
| n | Class R shares are generally available only to employee benefit plans. Please see the prospectus for more information. |
| n | Class Y shares are available only to certain investors. Please see the prospectus for more information. |
| n | Class R5 shares and Class R6 shares are primarily intended for retirement plans that meet certain standards and for institutional investors. On September 24, 2012, Institutional Class shares were renamed Class R5. |
Principal risks of investing in the Fund
| n | Currency/exchange rate risk. The dollar value of the Fund’s foreign investments will be affected by changes in the exchange rates between the dollar and the currencies in which those investments are traded. |
| n | Debt securities risk. The Fund may invest in debt securities that are affected by changing interest rates and changes in their effective maturities and credit quality. |
| n | Developing/emerging markets securities risk. Securities issued by foreign companies and governments located in developing/emerging countries may be affected more negatively by inflation, devaluation of their currencies, higher transaction costs, delays in settlement, adverse political developments, the introduction of capital controls, withholding taxes, nationalization of private assets, expropriation, social unrest, war or lack of timely information than those in developed countries. |
| n | Foreign securities risk. The Fund’s foreign investments may be affected by changes in a foreign country’s exchange rates, political and social instability, changes in economic or taxation policies, difficulties when enforcing obligations, decreased liquidity and increased volatility. |
Foreign companies may be subject to less regulation resulting in less publicly available information about the companies.
| n | Management risk. The investment techniques and risk analysis used by the Fund’s portfolio managers may not produce the desired results. |
| n | Market risk. The prices of and the income generated by the Fund’s securities may decline in response to, among other things, investor sentiment, general economic and market conditions, regional or global instability, and currency and interest rate fluctuations. |
| n | Non-diversification risk. The Fund is non-diversified and can invest a greater portion of its assets in a single issuer. A change in the value of the issuer could affect the value of the Fund more than if it was a diversified fund. |
| n | Small- and mid-capitalization risks. Stocks of small and mid-sized companies tend to be more vulnerable to adverse developments in the above factors and may have little or no operating history or track record of success, and limited product lines, markets, management and financial resources. The securities of small and mid-sized companies may be more volatile due to less market interest and less publicly available information about the issuer. They also may be illiquid or restricted as to resale, or may trade less frequently and in smaller volumes, all of which may cause difficulty when establishing or closing a position at a desirable price. |
| n | US government obligations risk. The Fund may invest in obligations issued by US government agencies and instrumentalities that may receive varying levels of support from the government, which could affect the Fund’s ability to recover should they default. |
About indexes used in this report
| n | The MSCI World IndexSM is an unmanaged index considered representative of stocks of developed countries. |
| n | The MSCI World Small Cap Index is an unmanaged index considered representative of small-cap stocks of global developed markets. |
| n | The Lipper Global Small/Mid-Cap Funds Classification Average represents an average of all funds in the Lipper Global Small/Mid-Cap Funds classification. |
| n | The Fund is not managed to track the performance of any particular index, including the index(es) defined here, and consequently, the performance of the Fund may deviate significantly from the performance of the index(es). |
| n | A direct investment cannot be made in an index. Unless otherwise indicated, index results include reinvested dividends, and they do not reflect sales charges. Performance of the peer group, if applicable, reflects fund expenses; performance of a market index does not. |
Other information
| n | The returns shown in management’s discussion of Fund performance are based on net asset values calculated for shareholder transactions. Generally accepted accounting principles require adjustments to be made to the net assets of the Fund at period end for financial reporting purposes, and as such, the net asset values for shareholder transactions and the returns based on those net asset values may differ from the net asset values and returns reported in the Financial Highlights. |
| n | Industry classifications used in this report are generally according to the Global Industry Classification Standard, which was developed by and is the exclusive property and a service mark of MSCI Inc. and Standard & Poor’s. |
This report must be accompanied or preceded by a currently effective Fund prospectus, which contains more complete information, including sales charges and expenses. Investors should read it carefully before investing.
| NOT FDIC INSURED | MAY LOSE VALUE | NO BANK GUARANTEE |
Fund Nasdaq Symbols
Class A Shares | IZSAX | |
Class C Shares | IZSCX | |
Class R Shares | IZSRX | |
Class Y Shares | IZSYX | |
Class R5 Shares | IZSIX | |
Class R6 Shares | IZFSX |
7 Invesco Select Opportunities Fund
Schedule of Investments(a)
October 31, 2012
| Shares | Value | |||||||
Common Stocks & Other Equity Interests–69.75% |
| |||||||
Advertising–4.92% |
| |||||||
Ipsos (France) | 3,300 | $ | 115,935 | |||||
Aerospace & Defense–0.02% |
| |||||||
Cubic Corp. | 11 | 537 | ||||||
Commodity Chemicals–2.57% |
| |||||||
Kendrion N.V. (Netherlands) | 3,000 | 60,571 | ||||||
Communications Equipment–3.88% |
| |||||||
Aastra Technologies Ltd. (Canada) | 5,566 | 91,374 | ||||||
Computer Storage & Peripherals–2.36% |
| |||||||
Synaptics Inc.(b) | 2,400 | 55,584 | ||||||
Data Processing & Outsourced Services–10.56% |
| |||||||
Alliance Data Systems Corp.(b) | 1,200 | 171,660 | ||||||
Lender Processing Services, Inc. | 3,200 | 77,153 | ||||||
| 248,813 | ||||||||
Electric Utilities–2.08% |
| |||||||
Generac Holdings, Inc. | 1,442 | 49,028 | ||||||
Health Care Distributors–5.73% |
| |||||||
United Drug PLC (Ireland) | 37,000 | 134,937 | ||||||
Health Care Supplies–2.61% |
| |||||||
Alere, Inc.(b) | 3,200 | 61,440 | ||||||
Industrial Conglomerates–3.99% |
| |||||||
DCC PLC (Ireland) | 3,300 | 94,093 | ||||||
Industrial Machinery–3.55% |
| |||||||
Aalberts Industries N.V. (Netherlands) | 4,600 | 83,611 | ||||||
Insurance Brokers–2.88% |
| |||||||
Charles Taylor PLC (United Kingdom) | 23,400 | 67,969 | ||||||
Leisure Products–1.40% |
| |||||||
MEGA Brands Inc. (Canada)(b) | 3,388 | 32,998 | ||||||
Life Sciences Tools & Services–2.65% |
| |||||||
Biotage AB (Sweden) | 51,800 | 62,449 | ||||||
Oil & Gas Equipment & Services–4.88% |
| |||||||
ION Geophysical Corp.(b) | 8,800 | 56,848 | ||||||
Prosafe S.E. (Norway) | 7,000 | 58,155 | ||||||
| 115,003 | ||||||||
| Shares | Value | |||||||
Property & Casualty Insurance–2.63% |
| |||||||
Euler Hermes S.A. (France) | 900 | $ | 62,107 | |||||
Restaurants–3.12% |
| |||||||
Fairwood Holdings Ltd. (Hong Kong) | 35,000 | 73,432 | ||||||
Semiconductors–5.00% |
| |||||||
International Rectifier Corp.(b) | 7,600 | 117,724 | ||||||
Systems Software–3.29% |
| |||||||
Rovi Corp.(b) | 5,731 | 77,540 | ||||||
Trading Companies & Distributors–1.63% |
| |||||||
Grafton Group PLC (Ireland)(c) | 8,800 | 38,454 | ||||||
Total Common Stocks & Other Equity Interests |
| 1,643,599 | ||||||
Money Market Funds–29.21% |
| |||||||
Liquid Assets Portfolio–Institutional | 344,144 | 344,144 | ||||||
Premier Portfolio–Institutional Class(d) | 344,144 | 344,144 | ||||||
Total Money Market Funds |
| 688,288 | ||||||
TOTAL INVESTMENTS–98.96% (Cost $2,217,622) |
| 2,331,887 | ||||||
OTHER ASSETS LESS LIABILITIES–1.04% |
| 24,571 | ||||||
NET ASSETS–100.00% |
| $ | 2,356,458 | |||||
Notes to Schedule of Investments:
| (a) | Industry and/or sector classifications used in this report are generally according to the Global Industry Classification Standard, which was developed by and is the exclusive property and a service mark of MSCI Inc. and Standard & Poor’s. |
| (b) | Non-income producing security. |
| (c) | Each unit represents one ordinary share, seventeen Class A shares and one Class C share. |
| (d) | The money market fund and the Fund are affiliated by having the same investment adviser. |
See accompanying Notes to Financial Statements which are an integral part of the financial statements.
8 Invesco Select Opportunities Fund
Statement of Assets and Liabilities
October 31, 2012
Assets: |
| |||
Investments, at value (Cost $1,529,334) | $ | 1,643,599 | ||
Investments in affiliated money market funds, at value and cost | 688,288 | |||
Total investments, at value (Cost $2,217,622) | 2,331,887 | |||
Foreign currencies, at value (Cost $10,504) | 10,520 | |||
Receivable for: | ||||
Investments sold | 5,300 | |||
Fund shares sold | 20,249 | |||
Dividends | 2,258 | |||
Investment for trustee deferred compensation and retirement plans | 1,085 | |||
Other assets | 72,397 | |||
Total assets | 2,443,696 | |||
Liabilities: |
| |||
Payable for: | ||||
Investments purchased | 6,437 | |||
Accrued fees to affiliates | 42,774 | |||
Accrued other operating expenses | 36,942 | |||
Trustee deferred compensation and retirement plans | 1,085 | |||
Total liabilities | 87,238 | |||
Net assets applicable to shares outstanding | $ | 2,356,458 | ||
Net assets consist of: |
| |||
Shares of beneficial interest | $ | 2,207,746 | ||
Undistributed net investment income | 14,204 | |||
Undistributed net realized gain | 20,197 | |||
Unrealized appreciation | 114,311 | |||
| $ | 2,356,458 | |||
Net Assets: |
| |||
Class A | $ | 1,186,093 | ||
Class C | $ | 89,830 | ||
Class R | $ | 10,636 | ||
Class Y | $ | 1,049,401 | ||
Class R5 | $ | 10,648 | ||
Class R6 | $ | 9,850 | ||
Shares outstanding, $0.001 par value per share, |
| |||
Class A | 111,554 | |||
Class C | 8,462 | |||
Class R | 1,001 | |||
Class Y | 98,638 | |||
Class R5 | 1,001 | |||
Class R6 | 926 | |||
Class A: | ||||
Net asset value per share | $ | 10.63 | ||
Maximum offering price per share | ||||
(Net asset value of $10.63 ¸ 94.50%) | $ | 11.25 | ||
Class C: | ||||
Net asset value and offering price per share | $ | 10.62 | ||
Class R: | ||||
Net asset value and offering price per share | $ | 10.63 | ||
Class Y: | ||||
Net asset value and offering price per share | $ | 10.64 | ||
Class R5: | ||||
Net asset value and offering price per share | $ | 10.64 | ||
Class R6: | ||||
Net asset value and offering price per share | $ | 10.64 | ||
See accompanying Notes to Financial Statements which are an integral part of the financial statements.
9 Invesco Select Opportunities Fund
Statement of Operations
For the period August 3, 2012 (commencement date) through October 31, 2012
Investment income: |
| |||
Dividends (net of foreign withholding taxes of $166) | $ | 7,277 | ||
Dividends from affiliated money market funds | 242 | |||
Total investment income | 7,519 | |||
Expenses: | ||||
Advisory fees | 4,266 | |||
Administrative services fees | 12,295 | |||
Custodian fees | 1,741 | |||
Distribution fees: | ||||
Class A | 659 | |||
Class C | 78 | |||
Class R | 13 | |||
Transfer agent fees — A, C, R and Y | 197 | |||
Transfer agent fees — R5 | 3 | |||
Transfer agent fees — R6 | 1 | |||
Trustees’ and officers’ fees and benefits | 5,962 | |||
Registration and filing fees | 21,945 | |||
Professional services fees | 30,763 | |||
Other | 4,312 | |||
Total expenses | 82,235 | |||
Less: Fees waived and expenses reimbursed | (74,919 | ) | ||
Net expenses | 7,316 | |||
Net investment income | 203 | |||
Realized and unrealized gain from: | ||||
Net realized gain (loss) from: | ||||
Investment securities | 20,197 | |||
Foreign currencies | (10,220 | ) | ||
| 9,977 | ||||
Change in net unrealized appreciation of: | ||||
Investment securities | 114,265 | |||
Foreign currencies | 46 | |||
| 114,311 | ||||
Net realized and unrealized gain | 124,288 | |||
Net increase in net assets resulting from operations | $ | 124,491 | ||
See accompanying Notes to Financial Statements which are an integral part of the financial statements.
10 Invesco Select Opportunities Fund
Statement of Changes in Net Assets
For the period August 3, 2012 (commencement date) through October 31, 2012
| 2012 | ||||
Operations: |
| |||
Net investment income | $ | 203 | ||
Net realized gain | 9,977 | |||
Change in net unrealized appreciation | 114,311 | |||
Net increase in net assets resulting from operations | 124,491 | |||
Share transactions–net: | ||||
Class A | 1,124,851 | |||
Class C | 90,586 | |||
Class R | 10,010 | |||
Class Y | 986,510 | |||
Class R5 | 10,010 | |||
Class R6 | 10,000 | |||
Net increase in net assets resulting from share transactions | 2,231,967 | |||
Net increase in net assets | 2,356,458 | |||
Net assets: | ||||
Beginning of period | — | |||
End of period (includes undistributed net investment income of $14,204) | $ | 2,356,458 | ||
Notes to Financial Statements
October 31, 2012
NOTE 1—Significant Accounting Policies
Invesco Select Opportunities Fund (the “Fund”) is a series portfolio of AIM International Mutual Funds (Invesco International Mutual Funds) (the “Trust”). The Trust is a Delaware statutory trust registered under the Investment Company Act of 1940, as amended (the “1940 Act”), as an open-end series management investment company consisting of eight separate portfolios, each authorized to issue an unlimited number of shares of beneficial interest. The assets, liabilities and operations of each portfolio are accounted for separately. Information presented in these financial statements pertains only to the Fund. Matters affecting each portfolio or class will be voted on exclusively by the shareholders of such portfolio or class.
The Fund currently consists of six different classes of shares: Class A, Class C, Class R, Class Y, Class R5 and Class R6. On September 24, 2012, Institutional Class shares were renamed Class R5 shares and the Fund began offering Class R6 shares. Class A shares are sold with a front-end sales charge unless certain waiver criteria are met and under certain circumstances load waiver shares may be subject to contingent deferred sales charges (“CDSC”). Class C, Class R, Class Y, Class R5 and Class R6 shares are sold at net asset value.
The Fund’s investment objective is long-term growth of capital.
The following is a summary of the significant accounting policies followed by the Fund in the preparation of its financial statements.
| A. | Security Valuations — Securities, including restricted securities, are valued according to the following policy. |
A security listed or traded on an exchange (except convertible bonds) is valued at its last sales price or official closing price as of the close of the customary trading session on the exchange where the security is principally traded, or lacking any sales or official closing price on a particular day, the security may be valued at the closing bid price on that day. Securities traded in the over-the-counter market are valued based on prices furnished by independent pricing services or market makers. When such securities are valued by an independent pricing service they may be considered fair valued. Futures contracts are valued at the final settlement price set by an exchange on which they are principally traded. Listed options are valued at the mean between the last bid and ask prices from the exchange on which they are principally traded. Options not listed on an exchange are valued by an independent source at the mean between the last bid and ask prices. For purposes of determining net asset value per share, futures and option contracts generally are valued 15 minutes after the close of the customary trading session of the New York Stock Exchange (“NYSE”).
Investments in open-end and closed-end registered investment companies that do not trade on an exchange are valued at the end of day net asset value per share. Investments in open-end and closed-end registered investment companies that trade on an exchange are valued at the last sales price or official closing price as of the close of the customary trading session on the exchange where the security is principally traded.
Debt obligations (including convertible bonds) and unlisted equities are fair valued using an evaluated quote provided by an independent pricing service. Evaluated quotes provided by the pricing service may be determined without exclusive reliance on quoted prices, and may reflect appropriate factors such as institution-size trading in similar groups of securities, developments related to specific securities, dividend rate, yield, quality, type of issue, coupon rate, maturity, individual trading characteristics and other market data. Debt securities are subject to interest rate and credit risks. In addition, all debt securities involve some risk of default with respect to interest and/or principal payments.
11 Invesco Select Opportunities Fund
Foreign securities (including foreign exchange contracts) are converted into U.S. dollar amounts using the applicable exchange rates as of the close of the NYSE. If market quotations are available and reliable for foreign exchange traded equity securities, the securities will be valued at the market quotations. Because trading hours for certain foreign securities end before the close of the NYSE, closing market quotations may become unreliable. If between the time trading ends on a particular security and the close of the customary trading session on the NYSE, events occur that are significant and make the closing price unreliable, the Fund may fair value the security. If the event is likely to have affected the closing price of the security, the security will be valued at fair value in good faith using procedures approved by the Board of Trustees. Adjustments to closing prices to reflect fair value may also be based on a screening process of an independent pricing service to indicate the degree of certainty, based on historical data, that the closing price in the principal market where a foreign security trade is not the current value as of the close of the NYSE. Foreign securities meeting the approved degree of certainty that the price is not reflective of current value will be priced at the indication of fair value from the independent pricing service. Multiple factors may be considered by the independent pricing service in determining adjustments to reflect fair value and may include information relating to sector indices, American Depositary Receipts and domestic and foreign index futures. Foreign securities may have additional risks including exchange rate changes, potential for sharply devalued currencies and high inflation, political and economic upheaval, the relative lack of issuer information, relatively low market liquidity and the potential lack of strict financial and accounting controls and standards.
Securities for which market prices are not provided by any of the above methods may be valued based upon quotes furnished by independent sources. The last bid price may be used to value equity securities. The mean between the last bid and asked prices is used to value debt obligations, including corporate loans.
Securities for which market quotations are not readily available or are unreliable are valued at fair value as determined in good faith by or under the supervision of the Trust’s officers following procedures approved by the Board of Trustees. Issuer specific events, market trends, bid/ask quotes of brokers and information providers and other market data may be reviewed in the course of making a good faith determination of a security’s fair value.
Valuations change in response to many factors including the historical and prospective earnings of the issuer, the value of the issuer’s assets, general economic conditions, interest rates, investor perceptions and market liquidity. Because of the inherent uncertainties of valuation, the values reflected in the financial statements may materially differ from the value received upon actual sale of those investments.
| B. | Securities Transactions and Investment Income — Securities transactions are accounted for on a trade date basis. Realized gains or losses on sales are computed on the basis of specific identification of the securities sold. Interest income is recorded on the accrual basis from settlement date. Dividend income (net of withholding tax, if any) is recorded on the ex-dividend date. |
The Fund may periodically participate in litigation related to Fund investments. As such, the Fund may receive proceeds from litigation settlements. Any proceeds received are included in the Statement of Operations as realized gain (loss) for investments no longer held and as unrealized gain (loss) for investments still held.
Brokerage commissions and mark ups are considered transaction costs and are recorded as an increase to the cost basis of securities purchased and/or a reduction of proceeds on a sale of securities. Such transaction costs are included in the determination of net realized and unrealized gain (loss) from investment securities reported in the Statement of Operations and the Statement of Changes in Net Assets and the net realized and unrealized gains (losses) on securities per share in the Financial Highlights. Transaction costs are included in the calculation of the Fund’s net asset value and, accordingly, they reduce the Fund’s total returns. These transaction costs are not considered operating expenses and are not reflected in net investment income reported in the Statement of Operations and Statement of Changes in Net Assets, or the net investment income per share and ratios of expenses and net investment income reported in the Financial Highlights, nor are they limited by any expense limitation arrangements between the Fund and the investment adviser.
The Fund allocates income and realized and unrealized capital gains and losses to a class based on the relative net assets of each class.
| C. | Country Determination — For the purposes of making investment selection decisions and presentation in the Schedule of Investments, the investment adviser may determine the country in which an issuer is located and/or credit risk exposure based on various factors. These factors include the laws of the country under which the issuer is organized, where the issuer maintains a principal office, the country in which the issuer derives 50% or more of its total revenues and the country that has the primary market for the issuer’s securities, as well as other criteria. Among the other criteria that may be evaluated for making this determination are the country in which the issuer maintains 50% or more of its assets, the type of security, financial guarantees and enhancements, the nature of the collateral and the sponsor organization. Country of issuer and/or credit risk exposure has been determined to be the United States of America, unless otherwise noted. |
| D. | Distributions — Distributions from income and net realized capital gain, if any, are generally declared and paid annually and recorded on the ex-dividend date. The Fund may elect to treat a portion of the proceeds from redemptions as distributions for federal income tax purposes. |
| E. | Federal Income Taxes — The Fund intends to comply with the requirements of Subchapter M of the Internal Revenue Code necessary to qualify as a regulated investment company and to distribute substantially all of the Fund’s taxable earnings to shareholders. As such, the Fund will not be subject to federal income taxes on otherwise taxable income (including net realized capital gain) that is distributed to shareholders. Therefore, no provision for federal income taxes is recorded in the financial statements. |
The Fund files tax returns in the U.S. Federal jurisdiction and certain other jurisdictions. Generally, the Fund is subject to examinations by such taxing authorities for up to three years after the filing of the return for the tax period.
| F. | Expenses — Fees provided for under the Rule 12b-1 plan of a particular class of the Fund are charged to the operations of such class. Transfer agency fees and expenses and other shareholder recordkeeping fees and expenses attributable to Class R5 and Class R6 are allocated to each share class based on relative net assets. Sub-accounting fees attributable to Class R5 are charged to the operations of the class. Transfer agency fees and expenses and other shareholder recordkeeping fees and expenses relating to all other classes are allocated among those classes based on relative net assets. All other expenses are allocated among the classes based on relative net assets. |
| G. | Accounting Estimates — The preparation of financial statements in conformity with accounting principles generally accepted in the United States of America (“GAAP”) requires management to make estimates and assumptions that affect the reported amounts of assets and liabilities at the date of the financial statements and the reported amounts of revenues and expenses during the reporting period including estimates and assumptions related to taxation. Actual results could differ from those estimates by a significant amount. In addition, the Fund monitors for material events or transactions that may occur or become known after the period-end date and before the date the financial statements are released to print. |
12 Invesco Select Opportunities Fund
| H. | Indemnifications — Under the Trust’s organizational documents, each Trustee, officer, employee or other agent of the Trust is indemnified against certain liabilities that may arise out of the performance of their duties to the Fund. Additionally, in the normal course of business, the Fund enters into contracts, including the Fund’s servicing agreements, that contain a variety of indemnification clauses. The Fund’s maximum exposure under these arrangements is unknown as this would involve future claims that may be made against the Fund that have not yet occurred. The risk of material loss as a result of such indemnification claims is considered remote. |
| I. | Foreign Currency Translations — Foreign currency is valued at the close of the NYSE based on quotations posted by banks and major currency dealers. Portfolio securities and other assets and liabilities denominated in foreign currencies are translated into U.S. dollar amounts at date of valuation. Purchases and sales of portfolio securities (net of foreign taxes withheld on disposition) and income items denominated in foreign currencies are translated into U.S. dollar amounts on the respective dates of such transactions. The Fund does not separately account for the portion of the results of operations resulting from changes in foreign exchange rates on investments and the fluctuations arising from changes in market prices of securities held. The combined results of changes in foreign exchange rates and the fluctuation of market prices on investments (net of estimated foreign tax withholding) are included with the net realized and unrealized gain or loss from investments in the Statement of Operations. Reported net realized foreign currency gains or losses arise from (1) sales of foreign currencies, (2) currency gains or losses realized between the trade and settlement dates on securities transactions, and (3) the difference between the amounts of dividends, interest, and foreign withholding taxes recorded on the Fund’s books and the U.S. dollar equivalent of the amounts actually received or paid. Net unrealized foreign currency gains and losses arise from changes in the fair values of assets and liabilities, other than investments in securities at fiscal period end, resulting from changes in exchange rates. |
The Fund may invest in foreign securities which may be subject to foreign taxes on income, gains on investments or currency repatriation, a portion of which may be recoverable.
| J. | Foreign Currency Contracts — The Fund may enter into foreign currency contracts to manage or minimize currency or exchange rate risk. The Fund may also enter into foreign currency contracts for the purchase or sale of a security denominated in a foreign currency in order to “lock in” the U.S. dollar price of that security. A foreign currency contract is an obligation to purchase or sell a specific currency for an agreed-upon price at a future date. The use of foreign currency contracts does not eliminate fluctuations in the price of the underlying securities the Fund owns or intends to acquire but establishes a rate of exchange in advance. Fluctuations in the value of these contracts are measured by the difference in the contract date and reporting date exchange rates and are recorded as unrealized appreciation (depreciation) until the contracts are closed. When the contracts are closed, realized gains (losses) are recorded. Realized and unrealized gains (losses) on the contracts are included in the Statement of Operations. The primary risks associated with foreign currency contracts include failure of the counterparty to meet the terms of the contract and the value of the foreign currency changing unfavorably. These risks may be in excess of the amounts reflected in the Statement of Assets and Liabilities. |
NOTE 2—Advisory Fees and Other Fees Paid to Affiliates
The Trust has entered into a master investment advisory agreement with Invesco Advisers, Inc. (the “Adviser” or “Invesco”). Under the terms of the investment advisory agreement, the Fund pays an advisory fee to the Adviser based on the annual rate of the Fund’s average daily net assets as follows:
| Average Daily Net Assets | Rate | |||
First $250 million | 0.80% | |||
Next $250 million | 0.78% | |||
Next $500 million | 0.76% | |||
Next $1.5 billion | 0.74% | |||
Next $2.5 billion | 0.72% | |||
Next $2.5 billion | 0.70% | |||
Next $2.5 billion | 0.68% | |||
Over $10 billion | 0.66% | |||
Under the terms of a master sub-advisory agreement between the Adviser and each of Invesco Asset Management Deutschland GmbH, Invesco Asset Management Limited, Invesco Asset Management (Japan) Limited, Invesco Australia Limited, Invesco Hong Kong Limited, Invesco Senior Secured Management, Inc., Invesco Canada Ltd. and Invesco PowerShares Capital Management LLC (collectively, the “Affiliated Sub-Advisers”) the Adviser, not the Fund, may pay 40% of the fees paid to the Adviser to any such Affiliated Sub-Adviser(s) that provide discretionary investment management services to the Fund based on the percentage of assets allocated to such Sub-Adviser(s).
The Adviser has contractually agreed, through at least February 28, 2014, to waive advisory fees and/or reimburse expenses of all shares to the extent necessary to limit total annual fund operating expenses after fee waiver and/or expense reimbursement (excluding certain items discussed below) of Class A, Class C, Class R, Class Y, Class R5 and Class R6 shares to 1.51%, 2.26%, 1.76%, 1.26%, 1.26% and 1.26%, respectively, of average daily net assets. In determining the Adviser’s obligation to waive advisory fees and/or reimburse expenses, the following expenses are not taken into account, and could cause the total annual fund operating expenses after fee waiver and/or expense reimbursement to exceed the numbers reflected above: (1) interest; (2) taxes; (3) dividend expense on short sales; (4) extraordinary or non-routine items, litigation expenses; and (5) expenses that the Fund has incurred but did not actually pay because of an expense offset arrangement. Unless the Board of Trustees and Invesco mutually agree to amend or continue the fee waiver agreement, it will terminate on February 28, 2014.
Further, the Adviser has contractually agreed, through at least June 30, 2013, to waive the advisory fee payable by the Fund in an amount equal to 100% of the net advisory fees the Adviser receives from the affiliated money market funds on investments by the Fund of uninvested cash in such affiliated money market funds.
For the period August 3, 2012 (commencement date) to October 31, 2012, the Adviser waived advisory fees and reimbursed fund level expenses of $74,718 and reimbursed class level expenses of $98, $3, $1, $95, $3 and $1 of Class A, Class C, Class R, Class Y, Class R5 and Class R6, respectively.
13 Invesco Select Opportunities Fund
The Trust has entered into a transfer agency and service agreement with Invesco Investment Services, Inc. (“IIS”) pursuant to which the Fund has agreed to pay IIS a fee for providing transfer agency and shareholder services to the Fund and reimburse IIS for certain expenses incurred by IIS in the course of providing such services. IIS may make payments to intermediaries that provide omnibus account services, sub-accounting services and/or networking services. All fees payable by IIS to intermediaries that provide omnibus account services or sub-accounting are charged back to the Fund, subject to certain limitations approved by the Trust’s Board of Trustees. For the period August 3, 2012 (commencement date) to October 31, 2012, expenses incurred under the agreement are shown in the Statement of Operations as Transfer agent fees.
The Trust has entered into a master administrative services agreement with Invesco pursuant to which the Fund has agreed to pay Invesco for certain administrative costs incurred in providing accounting services to the Fund. For the period August 3, 2012 (commencement date) to October 31, 2012, expenses incurred under the agreement are shown in the Statement of Operations as Administrative services fees.
The Trust has entered into master distribution agreements with Invesco Distributors, Inc. (“IDI”) to serve as the distributor for the Class A, Class C, Class R, Class Y, Class R5 and Class R6 shares of the Fund. The Trust has adopted plans pursuant to Rule 12b-1 under the 1940 Act with respect to the Fund’s Class A, Class C and Class R shares (collectively, the “Plans”). The Fund, pursuant to the Plans, pays IDI compensation at the annual rate of 0.25% of the Fund’s average daily net assets of Class A shares, 1.00% of the average daily net assets of Class C shares and 0.50% of the average daily net assets of Class R shares. Of the Plan payments, up to 0.25% of the average daily net assets of each class of shares may be paid to furnish continuing personal shareholder services to customers who purchase and own shares of such classes. Any amounts not paid as a service fee under the Plans would constitute an asset-based sales charge. Rules of the Financial Industry Regulatory Authority (“FINRA”) impose a cap on the total sales charges, including asset-based sales charges, that may be paid by any class of shares of the Fund. For the period August 3, 2012 (commencement date) to October 31, 2012, expenses incurred under the Plans are shown in the Statement of Operations as Distribution fees.
Front-end sales commissions and CDSC (collectively, the “sales charges”) are not recorded as expenses of the Fund. Front-end sales commissions are deducted from proceeds from the sales of Fund shares prior to investment in Class A shares of the Fund. CDSC are deducted from redemption proceeds prior to remittance to the shareholder. During the period August 3, 2012 (commencement date) to October 31, 2012, IDI advised the Fund that IDI retained $193 in front-end sales commissions from the sale of Class A shares.
Certain officers and trustees of the Trust are officers and directors of the Adviser, IIS and/or IDI.
NOTE 3—Additional Valuation Information
GAAP defines fair value as the price that would be received to sell an asset or paid to transfer a liability in an orderly transaction between market participants at the measurement date, under current market conditions. GAAP establishes a hierarchy that prioritizes the inputs to valuation methods giving the highest priority to readily available unadjusted quoted prices in an active market for identical assets (Level 1) and the lowest priority to significant unobservable inputs (Level 3) generally when market prices are not readily available or are unreliable. Based on the valuation inputs, the securities or other investments are tiered into one of three levels. Changes in valuation methods may result in transfers in or out of an investment’s assigned level:
| Level 1 — | Prices are determined using quoted prices in an active market for identical assets. |
| Level 2 — | Prices are determined using other significant observable inputs. Observable inputs are inputs that other market participants may use in pricing a security. These may include quoted prices for similar securities, interest rates, prepayment speeds, credit risk, yield curves, loss severities, default rates, discount rates, volatilities and others. |
| Level 3 — | Prices are determined using significant unobservable inputs. In situations where quoted prices or observable inputs are unavailable (for example, when there is little or no market activity for an investment at the end of the period), unobservable inputs may be used. Unobservable inputs reflect the Fund’s own assumptions about the factors market participants would use in determining fair value of the securities or instruments and would be based on the best available information. |
The following is a summary of the tiered valuation input levels, as of October 31, 2012. The level assigned to the securities valuations may not be an indication of the risk or liquidity associated with investing in those securities. Because of the inherent uncertainties of valuation, the values reflected in the financial statements may materially differ from the value received upon actual sale of those investments.
| Level 1 | Level 2 | Level 3 | Total | |||||||||||||
Canada | $ | 124,372 | $ | — | $ | — | $ | 124,372 | ||||||||
France | 115,935 | 62,107 | — | 178,042 | ||||||||||||
Hong Kong | 73,432 | — | — | 73,432 | ||||||||||||
Ireland | 173,392 | 94,093 | — | 267,485 | ||||||||||||
Netherlands | 60,571 | 83,611 | — | 144,182 | ||||||||||||
Norway | — | 58,155 | — | 58,155 | ||||||||||||
Sweden | 62,449 | — | — | 62,449 | ||||||||||||
United Kingdom | 67,969 | — | — | 67,969 | ||||||||||||
United States | 1,355,801 | — | — | 1,355,801 | ||||||||||||
| $ | 2,033,921 | $ | 297,966 | $ | — | $ | 2,331,887 | |||||||||
14 Invesco Select Opportunities Fund
NOTE 4—Trustees’ and Officers’ Fees and Benefits
“Trustees’ and Officers’ Fees and Benefits” include amounts accrued by the Fund to pay remuneration to certain Trustees and Officers of the Fund. Trustees have the option to defer compensation payable by the Fund, and “Trustees’ and Officers’ Fees and Benefits” also include amounts accrued by the Fund to fund such deferred compensation amounts. Those Trustees who defer compensation have the option to select various Invesco Funds in which their deferral accounts shall be deemed to be invested. Finally, certain current Trustees are eligible to participate in a retirement plan that provides for benefits to be paid upon retirement to Trustees over a period of time based on the number of years of service. The Fund may have certain former Trustees who also participate in a retirement plan and receive benefits under such plan. “Trustees’ and Officers’ Fees and Benefits” include amounts accrued by the Fund to fund such retirement benefits. Obligations under the deferred compensation and retirement plans represent unsecured claims against the general assets of the Fund.
NOTE 5—Cash Balances
The Fund is permitted to temporarily carry a negative or overdrawn balance in its account with State Street Bank and Trust Company, the custodian bank. Such balances, if any at period end, are shown in the Statement of Assets and Liabilities under the payable caption Amount due custodian. To compensate the custodian bank for such overdrafts, the overdrawn Fund may either (1) leave funds as a compensating balance in the account so the custodian bank can be compensated by earning the additional interest; or (2) compensate by paying the custodian bank at a rate agreed upon by the custodian bank and Invesco, not to exceed the contractually agreed upon rate.
NOTE 6—Distributions to Shareholders and Tax Components of Net Assets
There were no ordinary income or long-term capital gain distributions during the period August 3, 2012 (commencement date) to October 31, 2012.
Tax Components of Net Assets at Period-End:
| 2012 | ||||
Undistributed ordinary income | $ | 35,361 | ||
Net unrealized appreciation — investments | 114,265 | |||
Net unrealized appreciation — other investments | 46 | |||
Temporary book/tax differences | (960 | ) | ||
Shares of beneficial interest | 2,207,746 | |||
Total net assets | $ | 2,356,458 | ||
The temporary book/tax differences are a result of timing differences between book and tax recognition of income and/or expenses. The Fund’s temporary book/tax differences are the result of the trustee deferral of compensation and retirement plan benefits.
Capital loss carryforward is calculated and reported as of a specific date. Results of transactions and other activity after that date may affect the amount of capital loss carryforward actually available for the Fund to utilize. The Regulated Investment Company Modernization Act of 2010 (the “Act”) eliminated the eight-year carryover period for capital losses that arise in taxable years beginning after its enactment date of December 22, 2010. Consequently, these capital losses can be carried forward for an unlimited period. However, capital losses with an expiration period may not be used to offset capital gains until all net capital losses without an expiration date have been utilized. Additionally, post-enactment capital loss carryovers will retain their character as either short-term or long-term capital losses instead of as short-term capital losses as under prior law. The ability to utilize capital loss carryforward in the future may be limited under the Internal Revenue Code and related regulations based on the results of future transactions.
The Fund does not have a capital loss carryforward as of October 31, 2012.
NOTE 7—Investment Securities
The aggregate amount of investment securities (other than short-term securities, U.S. Treasury obligations and money market funds, if any) purchased and sold by the Fund during the period August 3, 2012 (commencement date) to October 31, 2012 was $1,629,816 and $120,679, respectively. Cost of investments on a tax basis includes the adjustments for financial reporting purposes as of the most recently completed federal income tax reporting period-end.
| Unrealized Appreciation (Depreciation) of Investment Securities on a Tax Basis | ||||
Aggregate unrealized appreciation of investment securities | $ | 157,941 | ||
Aggregate unrealized (depreciation) of investment securities | (43,676 | ) | ||
Net unrealized appreciation of investment securities | $ | 114,265 | ||
Investments have the same cost for tax and financial statement purposes.
NOTE 8—Reclassification of Permanent Differences
Primarily as a result of differing book/tax treatment of foreign currency transactions and stock issuance costs, on October 31, 2012, undistributed net investment income was increased by $14,001, undistributed net realized gain was increased by $10,220 and shares of beneficial interest was decreased by $24,221. This reclassification had no effect on the net assets of the Fund.
15 Invesco Select Opportunities Fund
NOTE 9—Share Information
| Summary of Share Activity | ||||||||
| August 3, 2012 (commencement date) to October 31, 2012(a) | ||||||||
| Shares | Amount | |||||||
Sold: |
| |||||||
Class A | 111,561 | $ | 1,124,935 | |||||
Class C | 8,462 | 90,586 | ||||||
Class R | 1,001 | 10,010 | ||||||
Class Y | 98,638 | 986,510 | ||||||
Class R5 | 1,001 | 10,010 | ||||||
Class R6(b) | 926 | 10,000 | ||||||
Reacquired: | ||||||||
Class A | (7 | ) | (84 | ) | ||||
Net increase in share activity | 221,582 | $ | 2,231,967 | |||||
| (a) | 91% of the outstanding shares of the Fund are owned by the Adviser. |
| (b) | Commencement date of September 24, 2012. |
NOTE 10—Financial Highlights
The following schedule presents financial highlights for a share of the Fund outstanding throughout the periods indicated.
| Net asset value, beginning of period | Net investment income (loss)(a) | Net gains (losses) on securities (both realized and unrealized) | Total from investment operations | Net asset value, end of period | Total return(b) | Net assets, end of period (000s omitted) | Ratio of expenses to average net assets with fee waivers and/or expenses absorbed | Ratio of expenses to average net assets without fee waivers and/or expenses absorbed | Ratio of net investment income (loss) to average net assets | Portfolio turnover(c) | ||||||||||||||||||||||||||||||||||
Class A | ||||||||||||||||||||||||||||||||||||||||||||
Period ended 10/31/12(d) | $ | 10.00 | $ | (0.00 | ) | $ | 0.63 | $ | 0.63 | $ | 10.63 | 6.30 | % | $ | 1,186 | 1.48 | %(e) | 15.54 | %(e) | (0.07 | )%(e) | 7 | % | |||||||||||||||||||||
Class C | ||||||||||||||||||||||||||||||||||||||||||||
Period ended 10/31/12(d) | 10.00 | (0.02 | ) | 0.64 | 0.62 | 10.62 | 6.20 | 90 | 2.23 | (e) | 16.29 | (e) | (0.82 | )(e) | 7 | |||||||||||||||||||||||||||||
Class R | ||||||||||||||||||||||||||||||||||||||||||||
Period ended 10/31/12(d) | 10.00 | (0.01 | ) | 0.64 | 0.63 | 10.63 | 6.30 | 11 | 1.73 | (e) | 15.79 | (e) | (0.32 | )(e) | 7 | |||||||||||||||||||||||||||||
Class Y | ||||||||||||||||||||||||||||||||||||||||||||
Period ended 10/31/12(d) | 10.00 | 0.00 | 0.64 | 0.64 | 10.64 | 6.40 | 1,049 | 1.23 | (e) | 15.29 | (e) | 0.18 | (e) | 7 | ||||||||||||||||||||||||||||||
Class R5 | ||||||||||||||||||||||||||||||||||||||||||||
Period ended 10/31/12(d) | 10.00 | 0.00 | 0.64 | 0.64 | 10.64 | 6.40 | 11 | 1.23 | (e) | 15.35 | (e) | 0.18 | (e) | 7 | ||||||||||||||||||||||||||||||
Class R6 | ||||||||||||||||||||||||||||||||||||||||||||
Period ended 10/31/12(d) | 10.80 | 0.00 | (0.16 | ) | (0.16 | ) | 10.64 | (1.48 | ) | 10 | 1.23 | (e) | 11.37 | (e) | 0.18 | (e) | 7 | |||||||||||||||||||||||||||
| (a) | Calculated using average shares outstanding. |
| (b) | Includes adjustments in accordance with accounting principles generally accepted in the United States of America and as such, the net asset value for financial reporting purposes and the returns based upon those net asset values may differ from the net asset value and returns for shareholder transactions. Does not include sales charges and is not annualized for periods less than one year, if applicable. |
| (c) | Portfolio turnover is calculated at the fund level and is not annualized for periods less than one year, if applicable. |
| (d) | Commencement date of August 3, 2012 for Class A, Class C, Class R, Class Y, Class R5 shares and September 24, 2012 for Class R6 shares. |
| (e) | Ratios are annualized and based on average daily net assets (000’s omitted) of $1,072, $32, $11, $1,040, $11 and $10 for Class A, Class C, Class R, Class Y, Class R5 and Class R6 shares, respectively. |
16 Invesco Select Opportunities Fund
Report of Independent Registered Public Accounting Firm
To the Board of Trustees of AIM International Mutual Funds (Invesco International Mutual Funds)
and Shareholders of Invesco Select Opportunities Fund:
In our opinion, the accompanying statement of assets and liabilities, including the schedule of investments, and the related statements of operations and of changes in net assets and the financial highlights present fairly, in all material respects, the financial position of Invesco Select Opportunities Fund (one of the funds constituting AIM International Mutual Funds (Invesco International Mutual Funds), hereafter referred to as the “Fund”) at October 31, 2012, the results of its operations, the changes in its net assets and the financial highlights for the period August 3, 2012 (commencement date) through October 31, 2012, in conformity with accounting principles generally accepted in the United States of America. These financial statements and financial highlights (hereafter referred to as “financial statements”) are the responsibility of the Fund’s management; our responsibility is to express an opinion on these financial statements based on our audit. We conducted our audit of these financial statements in accordance with the standards of the Public Company Accounting Oversight Board (United States). Those standards require that we plan and perform the audit to obtain reasonable assurance about whether the financial statements are free of material misstatement. An audit includes examining, on a test basis, evidence supporting the amounts and disclosures in the financial statements, assessing the accounting principles used and significant estimates made by management, and evaluating the overall financial statement presentation. We believe that our audit, which included confirmation of securities at October 31, 2012 by correspondence with the custodian and brokers, provides a reasonable basis for our opinion.
PRICEWATERHOUSECOOPERS LLP
December 21, 2012
Houston, Texas
17 Invesco Select Opportunities Fund
Calculating your ongoing Fund expenses
Example
As a shareholder of the Fund, you incur two types of costs: (1) transaction costs, which may include sales charges (loads) on purchase payments or contingent deferred sales charges on redemptions, and redemption fees, if any; and (2) ongoing costs, including management fees, distribution and/or service (12b-1) fees, and other Fund expenses. This example is intended to help you understand your ongoing costs (in dollars) of investing in the Fund and to compare these costs with ongoing costs of investing in other mutual funds. With the exception of the actual ending account value and expenses of the Class R6 shares, the example is based on an investment of $1,000 invested at the beginning of the period and held for the entire period August 3, 2012 (commencement date) through October 31, 2012. The actual ending account value and expenses of the Class R6 shares in the example below are based on an investment of $1,000 invested as of close of business September 24, 2012 (Class R6 commencement date) and held through October 31, 2012.
Actual expenses
The table below provides information about actual account values and actual expenses. You may use the information in this table, together with the amount you invested, to estimate the expenses that you paid over the period. Simply divide your account value by $1,000 (for example, an $8,600 account value divided by $1,000 = 8.6), then multiply the result by the number in the table under the heading entitled “Actual Expenses Paid During Period” to estimate the expenses you paid on your account during this period (as of close of business August 3, 2012 through October 31, 2012 for the Class A, Class C, Class Y and Class R5 shares and September 24, 2012 through October 31, 2012 for the Class R6 shares).
Hypothetical example for comparison purposes
The table below also provides information about hypothetical account values and hypothetical expenses based on the Fund’s actual expense ratio and an assumed rate of return of 5% per year before expenses, which is not the Fund’s actual return.
The hypothetical account values and expenses may not be used to estimate the actual ending account balance or expenses you paid for the period. You may use this information to compare the ongoing costs of investing in the Fund and other funds. To do so, compare this 5% hypothetical example with the 5% hypothetical examples that appear in the shareholder reports of the other funds.
Please note that the expenses shown in the table are meant to highlight your ongoing costs only and do not reflect any transaction costs, such as sales charges (loads) on purchase payments, contingent deferred sales charges on redemptions, and redemption fees, if any. Therefore, the hypothetical information is useful in comparing ongoing costs only, and will not help you determine the relative total costs of owning different funds. In addition, if these transaction costs were included, your costs would have been higher.
| Class | Beginning Account Value (05/01/12) | ACTUAL | HYPOTHETICAL (5% annual return before | Annualized Expense Ratio | ||||||||||||||||||||
| Ending Account Value (10/31/12)1 | Expenses Paid During Period 2 | Ending Account Value (10/31/12) | Expenses Paid During Period 3 | |||||||||||||||||||||
| A | $ | 1,000.00 | $ | 1,063.00 | $ | 3.75 | $ | 1,017.70 | $ | 7.51 | 1.48 | % | ||||||||||||
| C | 1,000.00 | 1,062.00 | 5.65 | 1,013.93 | 11.29 | 2.23 | ||||||||||||||||||
| R | 1,000.00 | 1,063.00 | 4.39 | 1,016.44 | 8.77 | 1.73 | ||||||||||||||||||
| Y | 1,000.00 | 1,064.00 | 3.12 | 1,018.95 | 6.24 | 1.23 | ||||||||||||||||||
| R5 | 1,000.00 | 1,064.00 | 3.12 | 1,018.95 | 6.24 | 1.23 | ||||||||||||||||||
| R6 | 1,000.00 | 985.20 | 1.27 | 1,018.95 | 6.24 | 1.23 | ||||||||||||||||||
| 1 | The actual ending account value is based on the actual total return of the Fund for the period August 3, 2012 (commencement date) through October 31, 2012 and (as of close of business September 24, 2012 (commencement date) through October 31, 2012 for the Class R6 shares), after actual expenses and will differ from the hypothetical ending account value which is based on the Fund’s expense ratio and a hypothetical annual return of 5% before expenses. |
| 2 | Actual expenses are equal to the annualized expense ratio as indicated above multiplied by the average account value over the period, multiplied by 90 (as of close of business August 3, 2012 (commencement date) through October 31, 2012)/365. For the Class R6 shares, actual expenses are equal to the annualized expense ratio as indicated above multiplied by the average account value over the period, multiplied by 38 (as of close of business September 24, 2012 (commencement date) through October 31, 2012)/365. Because Class A, Class C, Class R, Class Y, Class R5 and Class R6 shares have not been in existence for a full six month period, the actual ending account value and expense information shown may not provide a meaningful comparison to fund expense information of classes that show such data for a full six month period and, because the actual ending account value and expense information in the expense example covers a short time period, return and expense data may not be indicative of return and expense data for longer time periods. |
| 3 | Hypothetical expenses are equal to the annualized expense ratio indicated above multiplied by the average account value over the period, multiplied by 184/365 to reflect a one-half year period. The hypothetical ending account value and expenses may be used to compare ongoing costs of investing in Class A, Class C, Class R, Class Y, Class R5 and Class R6 shares of the Fund and other funds because such data is based on a full six month period. |
18 Invesco Select Opportunities Fund
Approval of Investment Advisory and Sub-Advisory Contracts
The Board of Trustees (the Board) of AIM International Mutual Funds (Invesco International Mutual Funds) (the Company) is required under the Investment Company Act of 1940 to approve the Invesco Select Opportunities Fund (the Fund) investment advisory agreements. During meetings held on June 19-20, 2012, the Board as a whole and the disinterested or “independent” Trustees, voting separately approved (i) an amendment to the Company’s investment advisory agreement with Invesco Advisers, Inc. (Invesco Advisers) to add the Fund, and (ii) (a) an amendment to the Master Intergroup Sub-Advisory Contract for Mutual Funds (the sub-advisory contracts) with Invesco Asset Management Deutschland GmbH, Invesco Asset Management Limited, Invesco Asset Management (Japan) Limited, Invesco Australia Limited, Invesco Hong Kong Limited, Invesco Senior Secured Management, Inc. and Invesco Canada Ltd. to add the Fund, and (b) an amendment to the Sub-Advisory Contract with Invesco PowerShares Capital Management LLC to add the Fund (the sub-advisers, the Affiliated Sub-Advisers and the contracts, the sub-advisory contracts). In doing so, the Board considered the process that it follows in reviewing and approving investment advisory agreements and sub-advisory contracts for the series portfolios of funds advised by Invesco Advisers (the Invesco Funds) and the information that it is provided. The Board determined that the investment advisory agreement and the sub-advisory contracts are in the best interests of the Fund and its shareholders and that the compensation to Invesco Advisers and the Affiliated Sub-Advisers under the agreements is fair and reasonable.
The Board’s Fund Evaluation Process
The Board’s Investments Committee has established three Sub-Committees, each of which is primarily responsible for overseeing the management of a number of the Invesco Funds. The Fund will be assigned to one of the Sub-Committees. The Sub-Committees meet throughout the year to review the performance of their assigned funds. Over the course of each year, the Sub-Committees meet with portfolio managers for their assigned funds and other members of management to review the performance, investment objective(s), policies, strategies, limitations and investment risk of these funds.
In evaluating the fairness and reasonableness of the Fund’s investment advisory agreement and sub-advisory contracts, the Board considered, among other things, the factors discussed below. The discussion below serves as a summary of the material factors and related conclusions that formed the basis for the Board’s approval of the Fund’s investment advisory agreement and sub-advisory contracts. The Board considered the information provided
to it and did not identify any particular factor that was controlling. One Trustee may have weighed a particular piece of information or factor differently than another Trustee.
Factors and Conclusions and Summary of Evaluation of Investment Advisory and Sub-Advisory Agreements
| A. | Nature, Extent and Quality of Services Provided by Invesco Advisers and the Affiliated Sub-Advisers |
The Board reviewed the advisory services to be provided to the Fund by Invesco Advisers under the Fund’s investment advisory agreement and the credentials and experience of the officers and employees of Invesco Advisers who provide these services. The Board’s review of the qualifications of Invesco Advisers to provide these services included the Board’s consideration of Invesco Advisers’ performance and investment process oversight, independent credit analysis and investment risk management.
In determining whether to approve the Fund’s investment advisory agreement, the Board considered the prior relationship between Invesco Advisers and the Invesco Funds, as well as the Board’s knowledge of Invesco Advisers’ operations. The Board also considered services that Invesco Advisers and its affiliates provide to the Invesco Funds such as various back office support functions, equity and fixed income trading operations, internal audit, distribution and legal and compliance. The Board concluded that the nature, extent and quality of the services to be provided to the Fund by Invesco Advisers are appropriate and satisfactory and consistent with the terms of the Fund’s investment advisory agreement.
The Board reviewed the services to be provided by the Affiliated Sub-Advisers under the sub-advisory contracts and the credentials and experience of the officers and employees of the Affiliated Sub-Advisers who provide these services. The Board noted that the Affiliated Sub-Advisers have offices and personnel that are located in financial centers around the world. As a result, the Affiliated Sub-Advisers can provide research and investment analysis on the markets and economies of various countries in which the Fund invests and make recommendations on securities of companies located in such countries. The Board concluded that the sub-advisory contracts will benefit the Fund and its shareholders by permitting Invesco Advisers to use the resources and talents of the Affiliated Sub-Advisers in managing the Fund. The Board concluded that the nature, extent and quality of the services to be provided by the Affiliated Sub-Advisers are appropriate and satisfactory and consistent with the terms of the Fund’s sub-advisory contracts.
| B. | Fund Performance |
The Board did not consider the performance of the Fund because the Fund is new and has no performance history.
| C. | Advisory and Sub-Advisory Fees and Fee Waivers |
The Board considered the contractual advisory fee rate of the Fund and the proposed fee limitations that will be in place for the Fund through July 31, 2013. The Board also considered the services to be provided by the Affiliated Sub-Advisers pursuant to the sub-advisory contracts and the services to be provided by Invesco Advisers pursuant to the Fund’s investment advisory agreement, as well as the allocation of fees between Invesco Advisers and the Affiliated Sub-Advisers pursuant to the sub-advisory contracts. The Board noted that the sub-advisory fees have no direct effect on the Fund or its shareholders, as they are paid by Invesco Advisers to the Affiliated Sub-Advisers.
The Board also considered comparative advisory fee data provided by Invesco Advisers with respect to funds managed by third-party advisers and other accounts managed by Invesco Advisers.
Based upon the information provided and considerations described above, the Board concluded that the Fund’s advisory and sub-advisory fees are fair and reasonable.
| D. | Economies of Scale and Breakpoints |
The Board considered the extent to which there are economies of scale in the provision of advisory services to the Fund. The Board also considered whether the Fund benefits from such economies of scale through contractual breakpoints in the Fund’s advisory fee schedule. The Board also noted that the Fund shares directly in economies of scale through lower fees charged by third party service providers based on the combined size of all of the Invesco Funds and other clients advised by Invesco Advisers.
| E. | Profitability and Financial Resources |
The Board reviewed information from Invesco Advisers concerning the costs of the advisory and other services that Invesco Advisers and its affiliates provide to the Invesco Funds and the profitability of Invesco Advisers and its affiliates in providing these services. The Board received and accepted information from Invesco Advisers demonstrating that Invesco Advisers and each Affiliated Sub-Adviser are financially sound and have the resources necessary to perform their obligations under the investment advisory agreement and sub-advisory contracts.
| F. | Collateral Benefits to Invesco Advisers and its Affiliates |
The Board considered various other benefits received by Invesco Advisers and its affiliates resulting from Invesco Advisers’ relationship with the Fund, including the fees received by Invesco Advisers and its affiliates for their
19 Invesco Select Opportunities Fund
provision of administrative, transfer agency and distribution services to the Fund. The Board considered the performance of Invesco Advisers and its affiliates in providing these services to other Invesco Funds and the organizational structure employed to provide these services. The Board also considered that these services will be provided to the Fund pursuant to written contracts that are reviewed and approved on an annual basis by the Board; that the services are required for the operation of the Fund; that Invesco Advisers and its affiliates can provide services, the nature and quality of which are at least equal to those provided by others offering the same or similar services; and that the fees for such services are fair and reasonable in light of the usual and customary charges by others for services of the same nature and quality.
The Board considered the benefits realized by Invesco Advisers and the Affiliated Sub-Advisers as a result of portfolio brokerage transactions executed through “soft dollar” arrangements. The Board noted that soft dollar arrangements shift the payment obligation for research and execution services from Invesco Advisers and the Affiliated Sub-Advisers to the Invesco Funds and therefore may reduce Invesco Advisers’ and the Affiliated Sub-Advisers’ expenses. The Board also considered periodic reports from the Chief Compliance Officer of the Invesco Funds demonstrating that these arrangements are consistent with regulatory requirements. The Board did not deem the soft dollar arrangements to be inappropriate.
The Board considered that the Fund’s uninvested cash and cash collateral from any securities lending arrangements may be invested in money market funds advised by Invesco Advisers pursuant to procedures approved by the Board. The Board noted that Invesco Advisers receives advisory fees from these affiliated money market funds attributable to such investments, although Invesco Advisers has contractually agreed to waive through varying periods the advisory fees payable by the Invesco Funds. The waiver is in an amount equal to 100% of the net advisory fee Invesco Advisers receives from the affiliated money market funds with respect to the Fund’s investment in the affiliated money market funds of uninvested cash, but not cash collateral. The Board concluded that the Fund’s investment of uninvested cash and cash collateral from any securities lending arrangements in the affiliated money market funds is in the best interests of the Fund and its shareholders.
The Board also considered the Fund may use an affiliated broker to execute certain trades and that such trades will be executed in compliance with rules under the Investment Company Act of 1940, as amended.
20 Invesco Select Opportunities Fund
Trustees and Officers
The address of each trustee and officer is AIM International Mutual Funds (Invesco International Mutual Funds) (the “Trust”), 11 Greenway Plaza, Suite 1000, Houston, Texas 77046-1173. The trustees serve for the life of the Trust, subject to their earlier death, incapacitation, resignation, retirement or removal as more specifically provided in the Trust’s organizational documents. Each officer serves for a one year term or until their successors are elected and qualified. Column two below includes length of time served with predecessor entities, if any.
| Name, Year of Birth and Position(s) Held with the Trust | Trustee and/ or Officer Since | Principal Occupation(s) During Past 5 Years | Number of Complex Overseen by Trustee | Other Directorship(s) Held by Trustee During Past 5 Years | ||||
| Interested Persons | ||||||||
| Martin L. Flanagan1 — 1960 Trustee | 2007 | Executive Director, Chief Executive Officer and President, Invesco Ltd. (ultimate parent of Invesco and a global investment management firm); Advisor to the Board, Invesco Advisers, Inc. (formerly known as Invesco Institutional (N.A.), Inc.); Trustee, The Invesco Funds; Vice Chair, Investment Company Institute; and Member of Executive Board, SMU Cox School of Business
Formerly: Chairman, Invesco Advisers, Inc. (registered investment adviser); Director, Chairman, Chief Executive Officer and President, IVZ Inc. (holding company), INVESCO Group Services, Inc. (service provider) and Invesco North American Holdings, Inc. (holding company); Director, Chief Executive Officer and President, Invesco Holding Company Limited (parent of Invesco and a global investment management firm); Director, Invesco Ltd.; Chairman, Investment Company Institute and President, Co-Chief Executive Officer, Co-President, Chief Operating Officer and Chief Financial Officer, Franklin Resources, Inc. (global investment management organization) | 123 | None | ||||
Philip A. Taylor2 — 1954 Trustee, President and Principal Executive Officer | 2006 | Head of North American Retail and Senior Managing Director, Invesco Ltd.; Director, Co-Chairman, Co-President and Co-Chief Executive Officer, Invesco Advisers, Inc. (formerly known as Invesco Institutional (N.A.), Inc.) (registered investment adviser); Director, Chairman, Chief Executive Officer and President, Invesco Management Group, Inc. (formerly known as Invesco Aim Management Group, Inc.) (financial services holding company); Director and President, INVESCO Funds Group, Inc. (registered investment adviser and registered transfer agent); Director and Chairman, Invesco Investment Services, Inc. (formerly known as Invesco Aim Investment Services, Inc.) (registered transfer agent) and IVZ Distributors, Inc. (formerly known as INVESCO Distributors, Inc.) (registered broker dealer); Director, President and Chairman, Invesco Inc. (holding company) and Invesco Canada Holdings Inc. (holding company); Chief Executive Officer, Invesco Corporate Class Inc. (corporate mutual fund company) and Invesco Canada Fund Inc. (corporate mutual fund company); Director, Chairman and Chief Executive Officer, Invesco Canada Ltd. (formerly known as Invesco Trimark Ltd./Invesco Trimark Ltèe) (registered investment adviser and registered transfer agent); Trustee, President and Principal Executive Officer, The Invesco Funds (other than AIM Treasurer’s Series Trust (Invesco Treasurer’s Series Trust) and Short-Term Investments Trust); Trustee and Executive Vice President, The Invesco Funds (AIM Treasurer’s Series Trust (Invesco Treasurer’s Series Trust) and Short-Term Investments Trust only); Director, Invesco Investment Advisers LLC (formerly known as Van Kampen Asset Management); Director, Chief Executive Officer and President, Van Kampen Exchange Corp.
Formerly: Director and Chairman, Van Kampen Investor Services Inc.; Director, Chief Executive Officer and President, 1371 Preferred Inc. (holding company); and Van Kampen Investments Inc.; Director and President, AIM GP Canada Inc. (general partner for limited partnerships); and Van Kampen Advisors, Inc.; Director and Chief Executive Officer, Invesco Trimark Dealer Inc. (registered broker dealer); Director, Invesco Distributors, Inc. (formerly known as Invesco Aim Distributors, Inc.) (registered broker dealer); Manager, Invesco PowerShares Capital Management LLC; Director, Chief Executive Officer and President, Invesco Advisers, Inc.; Director, Chairman, Chief Executive Officer and President, Invesco Aim Capital Management, Inc.; President, Invesco Trimark Dealer Inc. and Invesco Trimark Ltd./Invesco Trimark Ltèe; Director and President, AIM Trimark Corporate Class Inc. and AIM Trimark Canada Fund Inc.; Senior Managing Director, Invesco Holding Company Limited; Trustee and Executive Vice President, Tax-Free Investments Trust; Director and Chairman, Fund Management Company (former registered broker dealer); President and Principal Executive Officer, The Invesco Funds (AIM Treasurer’s Series Trust (Invesco Treasurer’s Series Trust), Short-Term Investments Trust and Tax-Free Investments Trust only); President, AIM Trimark Global Fund Inc. and AIM Trimark Canada Fund Inc. | 123 | None | ||||
Wayne W. Whalen3 — 1939 Trustee | 2010 | Of Counsel, and prior to 2010, partner in the law firm of Skadden, Arps, Slate, Meagher & Flom LLP, legal counsel to certain funds in the Fund Complex
| 136 | Director of the Mutual Fund Directors Forum, a nonprofit membership organization for investment directors; Chairman and Director of the Abraham Lincoln Presidential Library Foundation; and Director of the Stevenson Center for Democracy |
| 1 | Mr. Flanagan is considered an interested person of the Trust because he is an officer of the adviser to the Trust, and an officer and a director of Invesco Ltd., ultimate parent of the adviser to the Trust. |
| 2 | Mr. Taylor is considered an interested person of the Trust because he is an officer and a director of the adviser to, and a director of the principal underwriter of, the Trust. |
| 3 | Mr. Whalen is considered an “interested person” (within the meaning of Section 2(a)(19) of the 1940 Act) of certain Funds in the Invesco Fund Complex by reason of he and his firm currently providing legal services as legal counsel to such Funds in the Invesco Fund Complex. |
T-1 Invesco Select Opportunities Fund
Trustees and Officers—(continued)
| Name, Year of Birth and Position(s) Held with the Trust | Trustee and/ or Officer Since | Principal Occupation(s) During Past 5 Years | Number of Funds in Fund Complex Overseen by Trustee | Other Directorship(s) Held by Trustee During Past 5 Years | ||||
| Independent Trustees | ||||||||
Bruce L. Crockett — 1944 Trustee and Chair | 1992 | Chairman, Crockett Technologies Associates (technology consulting company)
Formerly: Director, Captaris (unified messaging provider); Director, President and Chief Executive Officer COMSAT Corporation; and Chairman, Board of Governors of INTELSAT (international communications company) | 123 | ACE Limited (insurance company); and Investment Company Institute | ||||
David C. Arch — 1945 Trustee | 2010 | Retired.
Formerly: Chairman and Chief Executive Officer of Blistex Inc., (consumer health care products manufacturer) | 136 | Member of the Heartland Alliance Advisory Board, a nonprofit organization serving human needs based in Chicago. Board member of the Illinois Manufacturers’ Association. Member of the Board of Visitors, Institute for the Humanities, University of Michigan | ||||
Frank S. Bayley — 1939 Trustee | 2001 | Retired
Formerly: Director, Badgley Funds, Inc. (registered investment company) (2 portfolios) and Partner, law firm of Baker & McKenzie | 123 | Director and Chairman, C.D. Stimson Company (a real estate investment company) | ||||
James T. Bunch — 1942 Trustee | 2003 | Managing Member, Grumman Hill Group LLC (family office private equity management)
Formerly: Founder, Green, Manning & Bunch Ltd. (investment banking firm)(1988-2010); Executive Committee, United States Golf Association; and Director, Policy Studies, Inc. and Van Gilder Insurance Corporation | 123 | Chairman, Board of Governors, Western Golf Association, Chairman-elect, Evans Scholars Foundation and Director, Denver Film Society | ||||
Rodney F. Dammeyer — 1940 Trustee | 2010 | Chairman of CAC, LLC, (private company offering capital investment and management advisory services)
Formerly: Prior to January 2004, Director of TeleTech Holdings Inc.; Prior to 2002, Director of Arris Group, Inc.; Prior to 2001, Managing Partner at Equity Group Corporate Investments. Prior to 1995, Vice Chairman of Anixter International. Prior to 1985, experience includes Senior Vice President and Chief Financial Officer of Household International, Inc., Executive Vice President and Chief Financial Officer of Northwest Industries, Inc. and Partner of Arthur Andersen & Co. | 136 | Director of Quidel Corporation and Stericycle, Inc. Prior to May 2008, Trustee of The Scripps Research Institute. Prior to February 2008, Director of Ventana Medical Systems, Inc. Prior to April 2007, Director of GATX Corporation. Prior to April 2004, Director of TheraSense, Inc. | ||||
Albert R. Dowden — 1941 Trustee | 2000 | Director of a number of public and private business corporations, including the Boss Group, Ltd. (private investment and management); Reich & Tang Funds (5 portfolios) (registered investment company); and Homeowners of America Holding Corporation/ Homeowners of America Insurance Company (property casualty company)
Formerly: Director, Continental Energy Services, LLC (oil and gas pipeline service); Director, CompuDyne Corporation (provider of product and services to the public security market) and Director, Annuity and Life Re (Holdings), Ltd. (reinsurance company); Director, President and Chief Executive Officer, Volvo Group North America, Inc.; Senior Vice President, AB Volvo; Director of various public and private corporations; Chairman, DHJ Media, Inc.; Director Magellan Insurance Company; and Director, The Hertz Corporation, Genmar Corporation (boat manufacturer), National Media Corporation; Advisory Board of Rotary Power International (designer, manufacturer, and seller of rotary power engines); and Chairman, Cortland Trust, Inc. (registered investment company) | 123 | Director of Nature’s Sunshine Products, Inc. | ||||
Jack M. Fields — 1952 Trustee | 1997 | Chief Executive Officer, Twenty First Century Group, Inc. (government affairs company); and Owner and Chief Executive Officer, Dos Angelos Ranch, L.P. (cattle, hunting, corporate entertainment), Discovery Global Education Fund (non-profit) and Cross Timbers Quail Research Ranch (non-profit)
Formerly: Chief Executive Officer, Texana Timber LP (sustainable forestry company) and member of the U.S. House of Representatives | 123 | Insperity (formerly known as Administaff) | ||||
Carl Frischling — 1937 Trustee | 1991 | Partner, law firm of Kramer Levin Naftalis and Frankel LLP | 123 | Director, Reich & Tang Funds (6 portfolios) | ||||
Prema Mathai-Davis — 1950 Trustee | 1998 | Retired
Formerly: Chief Executive Officer, YWCA of the U.S.A. | 123 | None | ||||
Larry Soll — 1942 Trustee | 2003 | Retired
Formerly: Chairman, Chief Executive Officer and President, Synergen Corp. (a biotechnology company) | 123 | None |
T-2 Invesco Select Opportunities Fund
Trustees and Officers—(continued)
| Name, Year of Birth and Position(s) Held with the Trust | Trustee and/ or Officer Since | Principal Occupation(s) During Past 5 Years | Number of Funds in Fund Complex Overseen by Trustee | Other Directorship(s) Held by Trustee During Past 5 Years | ||||
| Independent Trustees—(continued) | ||||||||
Hugo F. Sonnenschein — 1940 Trustee | 2010 | Distinguished Service Professor and President Emeritus of the University of Chicago and the Adam Smith Distinguished Service Professor in the Department of Economics at the University of Chicago.
Formerly: President of the University of Chicago | 136 | Trustee of the University of Rochester and a member of its investment committee. Member of the National Academy of Sciences, the American Philosophical Society and a fellow of the American Academy of Arts and Sciences | ||||
Raymond Stickel, Jr. — 1944 Trustee | 2005 | Retired
Formerly: Director, Mainstay VP Series Funds, Inc. (25 portfolios) and Partner, Deloitte & Touche | 123 | None | ||||
| Other Officers | ||||||||
Russell C. Burk — 1958 Senior Vice President and Senior Officer | 2005 | Senior Vice President and Senior Officer, The Invesco Funds | N/A | N/A | ||||
John M. Zerr — 1962 Senior Vice President, Chief Legal Officer and Secretary | 2006 | Director, Senior Vice President, Secretary and General Counsel, Invesco Management Group, Inc. (formerly known as Invesco Aim Management Group, Inc.) and Van Kampen Exchange Corp.; Senior Vice President, Invesco Advisers, Inc. (formerly known as Invesco Institutional (N.A.), Inc.) (registered investment adviser); Senior Vice President and Secretary, Invesco Distributors, Inc. (formerly known as Invesco Aim Distributors, Inc.); Director, Vice President and Secretary, Invesco Investment Services, Inc. (formerly known as Invesco Aim Investment Services, Inc.) and IVZ Distributors, Inc. (formerly known as INVESCO Distributors, Inc.); Director and Vice President, INVESCO Funds Group, Inc.; Senior Vice President, Chief Legal Officer and Secretary, The Invesco Funds; Manager, Invesco PowerShares Capital Management LLC; Director, Secretary and General Counsel, Invesco Investment Advisers LLC (formerly known as Van Kampen Asset Management); Secretary and General Counsel, Invesco Capital Markets, Inc. (formerly known as Van Kampen Funds Inc.) and Chief Legal Officer, PowerShares Exchange-Traded Fund Trust, PowerShares Exchange-Traded Fund Trust II, PowerShares India Exchange-Traded Fund Trust and PowerShares Actively Managed Exchange-Traded Fund Trust
Formerly: Director and Secretary, Van Kampen Advisors Inc.; Director Vice President, Secretary and General Counsel Van Kampen Investor Services Inc.; Director, Invesco Distributors, Inc. (formerly known as Invesco Aim Distributors, Inc.); Director, Senior Vice President, General Counsel and Secretary, Invesco Advisers, Inc.; and Van Kampen Investments Inc.; Director, Vice President and Secretary, Fund Management Company; Director, Senior Vice President, Secretary, General Counsel and Vice President, Invesco Aim Capital Management, Inc.; Chief Operating Officer and General Counsel, Liberty Ridge Capital, Inc. (an investment adviser); Vice President and Secretary, PBHG Funds (an investment company) and PBHG Insurance Series Fund (an investment company); Chief Operating Officer, General Counsel and Secretary, Old Mutual Investment Partners (a broker-dealer); General Counsel and Secretary, Old Mutual Fund Services (an administrator) and Old Mutual Shareholder Services (a shareholder servicing center); Executive Vice President, General Counsel and Secretary, Old Mutual Capital, Inc. (an investment adviser); and Vice President and Secretary, Old Mutual Advisors Funds (an investment company) | N/A | N/A | ||||
Lisa O. Brinkley — 1959 Vice President | 2004 | Global Assurance Officer, Invesco Ltd. and Vice President, The Invesco Funds
Formerly: Chief Compliance Officer, Invesco Distributors, Inc. (formerly known as Invesco Aim Distributors, Inc.), Invesco Investment Services, Inc.(formerly known as Invesco Aim Investment Services, Inc.) and Van Kampen Investor Services Inc.; Senior Vice President, Invesco Management Group, Inc.; Senior Vice President and Chief Compliance Officer, Invesco Advisers, Inc. and The Invesco Funds; Vice President and Chief Compliance Officer, Invesco Aim Capital Management, Inc. and Invesco Distributors, Inc.; Vice President, Invesco Investment Services, Inc. and Fund Management Company | N/A | N/A | ||||
T-3 Invesco Select Opportunities Fund
Trustees and Officers—(continued)
| Name, Year of Birth and Position(s) Held with the Trust | Trustee and/ or Officer Since | Principal Occupation(s) During Past 5 Years | Number of Funds in Fund Complex Overseen by Trustee | Other Directorship(s) Held by Trustee During Past 5 Years | ||||
| Other Officers—(continued) | ||||||||
Karen Dunn Kelley — 1960 Vice President | 2004 | Head of Invesco’s World Wide Fixed Income and Cash Management Group; Senior Vice President, Invesco Management Group, Inc. (formerly known as Invesco Aim Management Group, Inc.) and Invesco Advisers, Inc. (formerly known as Invesco Institutional (N.A.), Inc.) (registered investment adviser); Executive Vice President, Invesco Distributors, Inc. (formerly known as Invesco Aim Distributors, Inc.); Director, Invesco Mortgage Capital Inc., INVESCO Global Asset Management Limited, Invesco Management Company Limited and INVESCO Management S.A.; Vice President, The Invesco Funds (other than AIM Treasurer’s Series Trust (Invesco Treasurer’s Series Trust) and Short-Term Investments Trust); and President and Principal Executive Officer, The Invesco Funds (AIM Treasurer’s Series Trust (Invesco Treasurer’s Series Trust) and Short-Term Investments Trust only)
Formerly: Senior Vice President, Van Kampen Investments Inc.; Vice President, Invesco Advisers, Inc. (formerly known as Invesco Institutional (N.A.), Inc.); Director of Cash Management and Senior Vice President, Invesco Advisers, Inc. and Invesco Aim Capital Management, Inc.; President and Principal Executive Officer, Tax-Free Investments Trust; Director and President, Fund Management Company; Chief Cash Management Officer, Director of Cash Management, Senior Vice President, and Managing Director, Invesco Aim Capital Management, Inc.; Director of Cash Management, Senior Vice President, and Vice President, Invesco Advisers, Inc. and The Invesco Funds (AIM Treasurer’s Series Trust (Invesco Treasurer’s Series Trust), Short-Term Investments Trust and Tax-Free Investments Trust only) | N/A | N/A | ||||
Sheri Morris — 1964 Vice President, Treasurer and Principal Financial Officer | 1999 | Vice President, Treasurer and Principal Financial Officer, The Invesco Funds; Vice President, Invesco Advisers, Inc. (formerly known as Invesco Institutional (N.A.), Inc.) (registered investment adviser); and Treasurer, PowerShares Exchange-Traded Fund Trust, PowerShares Exchange-Traded Fund Trust II, PowerShares India Exchange-Traded Fund Trust and PowerShares Actively Managed Exchange-Traded Fund Trust
Formerly: Vice President, Invesco Advisers, Inc., Invesco Aim Capital Management, Inc. and Invesco Aim Private Asset Management, Inc.; Assistant Vice President and Assistant Treasurer, The Invesco Funds and Assistant Vice President, Invesco Advisers, Inc., Invesco Aim Capital Management, Inc. and Invesco Aim Private Asset Management, Inc. | N/A | N/A | ||||
Yinka Akinsola — 1977 Anti-Money Laundering Compliance Officer | 2011 | Anti-Money Laundering Compliance Officer, Invesco Advisers, Inc. (formerly known as Invesco Institutional (N.A.), Inc.) (registered investment adviser); Invesco Distributors, Inc. (formerly known as Invesco Aim Distributors, Inc.), Invesco Investment Services, Inc. (formerly known as Invesco Aim Investment Services, Inc.), Invesco Management Group, Inc., The Invesco Funds, Invesco Van Kampen Closed-End Funds, Van Kampen Exchange Corp., Invesco Capital Markets, Inc. (formerly known as Van Kampen Funds Inc.), PowerShares Exchange-Traded Fund Trust, PowerShares Exchange-Traded Fund Trust II, PowerShares India Exchange-Traded Fund Trust, and PowerShares Actively Managed Exchange-Traded Fund Trust
Formerly: Regulatory Analyst III, Financial Industry Regulatory Authority (FINRA). | N/A | N/A | ||||
Todd L. Spillane — 1958 Chief Compliance Officer | 2006 | Senior Vice President, Invesco Management Group, Inc. (formerly known as Invesco Aim Management Group, Inc.) and Van Kampen Exchange Corp.; Senior Vice President and Chief Compliance Officer, Invesco Advisers, Inc. (registered investment adviser) (formerly known as Invesco Institutional (N.A.), Inc.); Chief Compliance Officer, The Invesco Funds; Vice President, Invesco Distributors, Inc. (formerly known as Invesco Aim Distributors, Inc.) and Invesco Investment Services, Inc. (formerly known as Invesco Aim Investment Services, Inc.)
Formerly: Chief Compliance Officer, Invesco Van Kampen Closed-End Funds; Senior Vice President, Van Kampen Investments Inc.; Senior Vice President and Chief Compliance Officer, Invesco Advisers, Inc. and Invesco Aim Capital Management, Inc.; Chief Compliance Officer, INVESCO Private Capital Investments, Inc. (holding company), Invesco Private Capital, Inc. (registered investment adviser), Invesco Global Asset Management (N.A.), Inc., Invesco Senior Secured Management, Inc. (registered investment adviser) and Van Kampen Investor Services Inc., PowerShares Exchange-Traded Fund Trust, PowerShares Exchange-Traded Fund Trust II, PowerShares India Exchange-Traded Fund Trust and PowerShares Actively Managed Exchange-Traded Fund Trust; Vice President, Invesco Aim Capital Management, Inc. and Fund Management Company | N/A | N/A | ||||
The Statement of Additional Information of the Trust includes additional information about the Fund’s Trustees and is available upon request, without charge, by calling 1.800.959.4246. Please refer to the Fund’s prospectus for information on the Fund’s sub-advisers.
Office of the Fund 11 Greenway Plaza, Suite 1000 Houston, TX 77046-1173 | Investment Adviser Invesco Advisers, Inc. 1555 Peachtree Street, N.E. Atlanta, GA 30309 | Distributor Invesco Distributors, Inc. 11 Greenway Plaza, Suite 1000 Houston, TX 77046-1173 | Auditors PricewaterhouseCoopers LLP 1201 Louisiana Street, Suite 2900 Houston, TX 77002-5678 | |||
Counsel to the Fund Stradley Ronon Stevens & Young, LLP 2005 Market Street, Suite 2600 Philadelphia, PA 19103-7018 | Counsel to the Independent Trustees Kramer Levin Naftalis & Frankel LLP 1177 Avenue of the Americas New York, NY 10036-2714 | Transfer Agent Invesco Investment Services, Inc. 11 Greenway Plaza, Suite 1000 Houston, TX 77046-1173 | Custodian State Street Bank and Trust Company 225 Franklin Street Boston, MA 02110-2801 | |||
T-4 Invesco Select Opportunities Fund

Invesco mailing information
Send general correspondence to Invesco Investment Services, Inc., P.O. Box 219078, Kansas City, MO 64121-9078.
Invesco privacy policy
You share personal and financial information with us that is necessary for your transactions and your account records. We take very seriously the obligation to keep that information confidential and private.
Invesco collects nonpublic personal information about you from account applications or other forms you complete and from your transactions with us or our affiliates. We do not disclose information about you or our former customers to service providers or other third parties except to the extent necessary to service your account and in other limited circumstances as permitted by law. For example, we use this information to facilitate the delivery of transaction confirmations, financial reports, prospectuses and tax forms.
Even within Invesco, only people involved in the servicing of your accounts and compliance monitoring have access to your information. To ensure the highest level of confidentiality and security, Invesco maintains physical, electronic and procedural safeguards that meet or exceed federal standards. Special measures, such as data encryption and authentication, apply to your communications with us on our website. More detail is available to you at invesco.com/privacy.
Important notice regarding delivery of security holder documents
To reduce Fund expenses, only one copy of most shareholder documents may be mailed to shareholders with multiple accounts at the same address (Householding). Mailing of your shareholder documents may be householded indefinitely unless you instruct us otherwise. If you do not want the mailing of these documents to be combined with those for other members of your household, please contact Invesco Investment Services, Inc. at 800 959 4246 or contact your financial institution. We will begin sending you individual copies for each account within 30 days after receiving your request.
Fund holdings and proxy voting information
The Fund provides a complete list of its holdings four times in each fiscal year, at the quarter-ends. For the second and fourth quarters, the lists appear in the Fund’s semiannual and annual reports to shareholders. For the first and third quarters, the Fund files the lists with the Securities and Exchange Commission (SEC) on Form N-Q. The most recent list of portfolio holdings is available at invesco.com/completeqtrholdings. Shareholders can also look up the Fund’s Forms N-Q on the SEC website at sec.gov. Copies of the Fund’s Forms N-Q may be reviewed and copied at the SEC Public Reference Room in Washington, D.C. You can obtain information on the operation of the Public Reference Room, including information about duplicating fee charges, by calling 202 551 8090 or 800 732 0330, or by electronic request at the following email address: publicinfo@sec.gov. The SEC file numbers for the Fund are shown below.
A description of the policies and procedures that the Fund uses to determine how to vote proxies relating to portfolio securities is available without charge, upon request, from our Client Services department at 800 959 4246 or at invesco.com/proxyguidelines. The information is also available on the SEC website, sec.gov.
Information regarding how the Fund voted proxies related to its portfolio securities during the 12 months ended June 30, 2012, is available at invesco.com/proxysearch. The information is also available on the SEC website, sec.gov. Invesco Advisers, Inc. is an investment adviser; it provides investment advisory services to individual and institutional clients and does not sell securities. Invesco Distributors, Inc. is the US distributor for Invesco Ltd.’s retail mutual funds, exchange-traded funds and institutional money market funds. Both are wholly owned, indirect subsidiaries of Invesco Ltd. |  |
| SEC file numbers: 811-06463 and 033-44611 | SOPP-AR-1 | Invesco Distributors, Inc. |
| ITEM 2. | CODE OF ETHICS. |
There were no amendments to the Code of Ethics (the “Code”) that applies to the Registrant’s Principal Executive Officer (“PEO”) and Principal Financial Officer (“PFO”) during the period covered by the report. The Registrant did not grant any waivers, including implicit waivers, from any provisions of the Code to the PEO or PFO during the period covered by this report.
| ITEM 3. | AUDIT COMMITTEE FINANCIAL EXPERT. |
The Board of Trustees has determined that the Registrant has at least one audit committee financial expert serving on its Audit Committee. The Audit Committee financial expert is Raymond Stickel, Jr. Mr. Stickel is “independent” within the meaning of that term as used in Form N-CSR.
| ITEM 4. | PRINCIPAL ACCOUNTANT FEES AND SERVICES. |
Fees Billed by Principal Accountant Related to the Registrant
PWC billed the Registrant aggregate fees for services rendered to the Registrant for the last two fiscal years as follows:
| Fees Billed for Services Rendered to the Registrant for fiscal year end 10/31/2012 | Percentage of Fees Billed Applicable to Non-Audit Services Provided for fiscal year end 10/31/2012 Pursuant to Waiver of Pre-Approval Requirement(1) | Fees Billed for Services Rendered to the Registrant for fiscal year end 10/31/2011 | Percentage of Fees Billed Applicable to Non-Audit Services Provided for fiscal year end 10/31/2011 Pursuant to Waiver of Pre-Approval Requirement(1) | |||||||||||||
Audit Fees | $ | 258,126 | N/A | $ | 212,800 | N/A | ||||||||||
Audit-Related Fees(2) | $ | 5,000 | 0 | % | $ | 4,250 | 0 | % | ||||||||
Tax Fees(3) | $ | 162,344 | 0 | % | $ | 58,400 | 0 | % | ||||||||
All Other Fees | $ | 0 | 0 | % | $ | 0 | 0 | % | ||||||||
|
|
|
| |||||||||||||
Total Fees | $ | 425,470 | 0 | % | $ | 275,450 | 0 | % | ||||||||
PWC billed the Registrant aggregate non-audit fees of $167,344 for the fiscal year ended October 31, 2012, and $62,650 for the fiscal year ended October 31, 2011, for non-audit services rendered to the Registrant.
| (1) | With respect to the provision of non-audit services, the pre-approval requirement is waived pursuant to a de minimis exception if (i) such services were not recognized as non-audit services by the Registrant at the time of engagement, (ii) the aggregate amount of all such services provided is no more than 5% of the aggregate audit and non-audit fees paid by the Registrant to PWC during a fiscal year; and (iii) such services are promptly brought to the attention of the Registrant’s Audit Committee and approved by the Registrant’s Audit Committee prior to the completion of the audit. |
| (2) | Audit-Related fees for the fiscal year end October 31, 2012 includes fees billed for agreed upon procedures related to fund mergers. Audit-Related fees for the fiscal year end October 31, 2011 includes fees billed for agreed upon procedures related to fund mergers. |
| (3) | Tax fees for the fiscal year end October 31, 2012 includes fees billed for reviewing tax returns and consultation services. Tax fees for the fiscal year end October 31, 2011 includes fees billed for reviewing tax returns. |
Fees Billed by PWC Related to Invesco and Invesco Affiliates
PWC billed Invesco Advisers, Inc. (“Invesco”), the Registrant’s adviser, and any entity controlling, controlled by or under common control with Invesco that provides ongoing services to the Registrant (“Invesco Affiliates”) aggregate fees for pre-approved non-audit services rendered to Invesco and Invesco Affiliates for the last two fiscal years as follows:
| Fees Billed for Non- Audit Services Rendered to Invesco and Invesco Affiliates for fiscal year end 10/31/2012 That Were Required to be Pre-Approved by the Registrant’s Audit Committee | Percentage of Fees Billed Applicable to Non-Audit Services Provided for fiscal year end 10/31/2012 Pursuant to Waiver of Pre-Approval Requirement(1) | Fees Billed for Non- Audit Services Rendered to Invesco and Invesco Affiliates for fiscal year end 10/31/2011 That Were Required to be Pre-Approved by the Registrant’s Audit Committee | Percentage of Fees Billed Applicable to Non-Audit Services Provided for fiscal year end 10/31/2011 Pursuant to Waiver of Pre-Approval Requirement(1) | |||||||||||||
Audit-Related Fees | $ | 0 | 0 | % | $ | 0 | 0 | % | ||||||||
Tax Fees | $ | 0 | 0 | % | $ | 0 | 0 | % | ||||||||
All Other Fees | $ | 0 | 0 | % | $ | 0 | 0 | % | ||||||||
|
|
|
| |||||||||||||
Total Fees(2) | $ | 0 | 0 | % | $ | 0 | 0 | % | ||||||||
| (1) | With respect to the provision of non-audit services, the pre-approval requirement is waived pursuant to a de minimis exception if (i) such services were not recognized as non-audit services by the Registrant at the time of engagement, (ii) the aggregate amount of all such services provided is no more than 5% of the aggregate audit and non-audit fees paid by the Registrant, Invesco and Invesco Affiliates to PWC during a fiscal year; and (iii) such services are promptly brought to the attention of the Registrant’s Audit Committee and approved by the Registrant’s Audit Committee prior to the completion of the audit. |
| (2) | Including the fees for services not required to be pre-approved by the registrant’s audit committee, PWC billed Invesco and Invesco Affiliates aggregate non-audit fees of $0 for the fiscal year ended October 31, 2012, and $0 for the fiscal year ended October 31, 2011, for non-audit services rendered to Invesco and Invesco Affiliates. |
The Audit Committee also has considered whether the provision of non-audit services that were rendered to Invesco and Invesco Affiliates that were not required to be pre-approved pursuant to SEC regulations, if any, is compatible with maintaining PWC’s independence. To the extent that such services were provided, the Audit Committee determined that the provision of such services is compatible with PWC maintaining independence with respect to the Registrant.
PRE-APPROVAL OF AUDIT AND NON-AUDIT SERVICES
POLICIES AND PROCEDURES
As adopted by the Audit Committees of
the Invesco Funds (the “Funds”)
Last Amended May 4, 2010
Statement of Principles
Under the Sarbanes-Oxley Act of 2002 and rules adopted by the Securities and Exchange Commission (“SEC”) (“Rules”), the Audit Committees of the Funds’ (the “Audit Committees”) Board of Trustees (the “Board”) are responsible for the appointment, compensation and oversight of the work of independent accountants (an “Auditor”). As part of this responsibility and to assure that the Auditor’s independence is not impaired, the Audit Committees pre-approve the audit and non-audit services provided to the Funds by each Auditor, as well as all non-audit services provided by the Auditor to the Funds’ investment adviser and to affiliates of the adviser that provide ongoing services to the Funds (“Service Affiliates”) if the services directly impact the Funds’ operations or financial reporting. The SEC Rules also specify the types of services that an Auditor may not provide to its audit client. The following policies and procedures comply with the requirements for pre-approval and provide a mechanism by which management of the Funds may request and secure pre-approval of audit and non-audit services in an orderly manner with minimal disruption to normal business operations.
Proposed services either may be pre-approved without consideration of specific case-by-case services by the Audit Committees (“general pre-approval”) or require the specific pre-approval of the Audit Committees (“specific pre-approval”). As set forth in these policies and procedures, unless a type of service has received general pre-approval, it will require specific pre-approval by the Audit Committees. Additionally, any fees exceeding 110% of estimated pre-approved fee levels provided at the time the service was pre-approved will also require specific approval by the Audit Committees before payment is made. The Audit Committees will also consider the impact of additional fees on the Auditor’s independence when determining whether to approve any additional fees for previously pre-approved services.
The Audit Committees will annually review and generally pre-approve the services that may be provided by each Auditor without obtaining specific pre-approval from the Audit Committee generally on an annual basis. The term of any general pre-approval runs from the date of such pre-approval through September 30th of the following year, unless the Audit Committees consider a different period and state otherwise. The Audit Committees will add to or subtract from the list of general pre-approved services from time to time, based on subsequent determinations.
The purpose of these policies and procedures is to set forth the guidelines to assist the Audit Committees in fulfilling their responsibilities.
Delegation
The Audit Committees may from time to time delegate pre-approval authority to one or more of its members who are Independent Trustees. All decisions to pre-approve a service by a delegated member shall be reported to the Audit Committees at the next quarterly meeting.
Audit Services
The annual audit services engagement terms will be subject to specific pre-approval of the Audit Committees. Audit services include the annual financial statement audit and other procedures such as tax provision work that is required to be performed by the independent auditor to be able to form an opinion on the Funds’ financial statements. The Audit Committees will obtain, review and consider sufficient information concerning the proposed Auditor to make a reasonable evaluation of the Auditor’s qualifications and independence.
In addition to the annual Audit services engagement, the Audit Committees may grant either general or specific pre-approval of other audit services, which are those services that only the independent auditor reasonably can provide. Other Audit services may include services such as issuing consents for the inclusion of audited financial statements with SEC registration statements, periodic reports and other documents filed with the SEC or other documents issued in connection with securities offerings.
Non-Audit Services
The Audit Committees may provide either general or specific pre-approval of any non-audit services to the Funds and its Service Affiliates if the Audit Committees believe that the provision of the service will not impair the independence of the Auditor, is consistent with the SEC’s Rules on auditor independence, and otherwise conforms to the Audit Committees’ general principles and policies as set forth herein.
Audit-Related Services
“Audit-related services” are assurance and related services that are reasonably related to the performance of the audit or review of the Fund’s financial statements or that are traditionally performed by the independent auditor. Audit-related services include, among others, accounting consultations related to accounting, financial reporting or disclosure matters not classified as “Audit services”; assistance with understanding and implementing new accounting and financial reporting guidance from rulemaking authorities; and agreed-upon procedures related to mergers, compliance with ratings agency requirements and interfund lending activities.
Tax Services
“Tax services” include, but are not limited to, the review and signing of the Funds’ federal tax returns, the review of required distributions by the Funds and consultations regarding tax matters such as the tax treatment of new investments or the impact of new regulations. The Audit Committees will scrutinize carefully the retention of the Auditor in connection with a transaction initially recommended by the Auditor, the major business purpose of which may be tax avoidance or the tax treatment of which may not be supported in the Internal Revenue Code and related regulations. The Audit Committees will consult with the Funds’ Treasurer (or his or her designee) and may consult with outside counsel or advisors as necessary to ensure the consistency of Tax services rendered by the Auditor with the foregoing policy.
No Auditor shall represent any Fund or any Service Affiliate before a tax court, district court or federal court of claims.
Under rules adopted by the Public Company Accounting Oversight Board and approved by the SEC, in connection with seeking Audit Committees’ pre-approval of permissible Tax services, the Auditor shall:
| 1. | Describe in writing to the Audit Committees, which writing may be in the form of the proposed engagement letter: |
| a. | The scope of the service, the fee structure for the engagement, and any side letter or amendment to the engagement letter, or any other agreement between the Auditor and the Fund, relating to the service; and |
| b. | Any compensation arrangement or other agreement, such as a referral agreement, a referral fee or fee-sharing arrangement, between the Auditor and any person (other than the Fund) with respect to the promoting, marketing, or recommending of a transaction covered by the service; |
| 2. | Discuss with the Audit Committees the potential effects of the services on the independence of the Auditor; and |
| 3. | Document the substance of its discussion with the Audit Committees. |
All Other Auditor Services
The Audit Committees may pre-approve non-audit services classified as “All other services” that are not categorically prohibited by the SEC, as listed in Exhibit 1 to this policy.
Pre-Approval Fee Levels or Established Amounts
Pre-approval of estimated fees or established amounts for services to be provided by the Auditor under general or specific pre-approval policies will be set periodically by the Audit Committees. Any proposed fees exceeding 110% of the maximum estimated pre-approved fees or established amounts for pre-approved audit and non-audit services will be reported to the Audit Committees at the quarterly Audit Committees meeting and will require specific approval by the Audit Committees before payment is made. The Audit Committees will always factor in the overall relationship of fees for audit and non-audit services in determining whether to pre-approve any such services and in determining whether to approve any additional fees exceeding 110% of the maximum pre-approved fees or established amounts for previously pre-approved services.
Procedures
Generally on an annual basis, Invesco Advisers, Inc. (“Invesco”) will submit to the Audit Committees for general pre-approval, a list of non-audit services that the Funds or Service Affiliates of the Funds may request from the Auditor. The list will describe the non-audit services in reasonable detail and will include an estimated range of fees and such other information as the Audit Committee may request.
Each request for services to be provided by the Auditor under the general pre-approval of the Audit Committees will be submitted to the Funds’ Treasurer (or his or her designee) and must include a detailed description of the services to be rendered. The Treasurer or his or her designee will ensure that such services are included within the list of services that have received the general pre-approval of the Audit Committees. The Audit Committees will be informed at the next quarterly scheduled Audit Committees meeting of any such services for which the Auditor rendered an invoice and whether such services and fees had been pre-approved and if so, by what means.
Each request to provide services that require specific approval by the Audit Committees shall be submitted to the Audit Committees jointly by the Fund’s Treasurer or his or her designee and the Auditor, and must include a joint statement that, in their view, such request is consistent with the policies and procedures and the SEC Rules.
Each request to provide tax services under either the general or specific pre-approval of the Audit Committees will describe in writing: (i) the scope of the service, the fee structure for the engagement, and any side letter or amendment to the engagement letter, or any other agreement between the Auditor and the audit client, relating to the service; and (ii) any compensation arrangement or other agreement between the Auditor and any person (other than the audit client) with respect to the promoting, marketing, or recommending of a transaction covered by the service. The Auditor will discuss with the Audit Committees the potential effects of the services on the Auditor’s independence and will document the substance of the discussion.
Non-audit services pursuant to the de minimis exception provided by the SEC Rules will be promptly brought to the attention of the Audit Committees for approval, including documentation that each of the conditions for this exception, as set forth in the SEC Rules, has been satisfied.
On at least an annual basis, the Auditor will prepare a summary of all the services provided to any entity in the investment company complex as defined in section 2-01(f)(14) of Regulation S-X in sufficient detail as to the nature of the engagement and the fees associated with those services.
The Audit Committees have designated the Funds’ Treasurer to monitor the performance of all services provided by the Auditor and to ensure such services are in compliance with these policies and procedures. The Funds’ Treasurer will report to the Audit Committees on a periodic basis as to the results of such monitoring. Both the Funds’ Treasurer and management of Invesco will immediately report to the chairman of the Audit Committees any breach of these policies and procedures that comes to the attention of the Funds’ Treasurer or senior management of Invesco.
Exhibit 1 to Pre-Approval of Audit and Non-Audit Services Policies and Procedures
Conditionally Prohibited Non-Audit Services (not prohibited if the Fund can reasonably conclude that the results of the service would not be subject to audit procedures in connection with the audit of the Fund’s financial statements)
| • | Bookkeeping or other services related to the accounting records or financial statements of the audit client |
| • | Financial information systems design and implementation |
| • | Appraisal or valuation services, fairness opinions, or contribution-in-kind reports |
| • | Actuarial services |
| • | Internal audit outsourcing services |
Categorically Prohibited Non-Audit Services
| • | Management functions |
| • | Human resources |
| • | Broker-dealer, investment adviser, or investment banking services |
| • | Legal services |
| • | Expert services unrelated to the audit |
| • | Any service or product provided for a contingent fee or a commission |
| • | Services related to marketing, planning, or opining in favor of the tax treatment of confidential transactions or aggressive tax position transactions, a significant purpose of which is tax avoidance |
| • | Tax services for persons in financial reporting oversight roles at the Fund |
| • | Any other service that the Public Company Oversight Board determines by regulation is impermissible. |
| ITEM 5. | AUDIT COMMITTEE OF LISTED REGISTRANTS. |
Not applicable.
| ITEM 6. | SCHEDULE OF INVESTMENTS. |
Investments in securities of unaffiliated issuers is included as part of the reports to stockholders filed under Item 1 of this Form.
| ITEM 7. | DISCLOSURE OF PROXY VOTING POLICIES AND PROCEDURES FOR CLOSED-END MANAGEMENT INVESTMENT COMPANIES. |
Not applicable.
| ITEM 8. | PORTFOLIO MANAGERS OF CLOSED-END MANAGEMENT COMPANIES. |
Not applicable.
| ITEM 9. | PURCHASES OF EQUITY SECURITIES BY CLOSED-END MANAGEMENT INVESTMENT COMPANY AND AFFILIATED PURCHASERS. |
Not applicable.
| ITEM 10. | SUBMISSION OF MATTERS TO A VOTE OF SECURITY HOLDERS. |
None
| ITEM 11. | CONTROLS AND PROCEDURES. |
| (a) | As of November 19, 2012, an evaluation was performed under the supervision and with the participation of the officers of the Registrant, including the PEO and PFO, to assess the effectiveness of the Registrant’s disclosure controls and procedures, as that term is |
| defined in Rule 30a-3(c) under the Investment Company Act of 1940 (the “Act”), as amended. Based on that evaluation, the Registrant’s officers, including the PEO and PFO, concluded that, as of November 19, 2012, the Registrant’s disclosure controls and procedures were reasonably designed to ensure: (1) that information required to be disclosed by the Registrant on Form N-CSR is recorded, processed, summarized and reported within the time periods specified by the rules and forms of the Securities and Exchange Commission; and (2) that material information relating to the Registrant is made known to the PEO and PFO as appropriate to allow timely decisions regarding required disclosure. |
| (b) | There have been no changes in the Registrant’s internal control over financial reporting (as defined in Rule 30a-3(d) under the Act) that occurred during the second fiscal quarter of the period covered by this report that have materially affected, or are reasonably likely to materially affect, the Registrant’s internal control over financial reporting. |
| ITEM 12. | EXHIBITS. |
| 12(a) (1) | Code of Ethics. |
| 12(a) (2) | Certifications of principal executive officer and principal financial officer as required by Rule 30a-2(a) under the Investment Company Act of 1940. |
| 12(a) (3) | Not applicable. |
| 12(b) | Certifications of principal executive officer and principal financial officer as required by Rule 30a-2(b) under the Investment Company Act of 1940. |
SIGNATURES
Pursuant to the requirements of the Securities Exchange Act of 1934 and the Investment Company Act of 1940, the Registrant has duly caused this report to be signed on its behalf by the undersigned, thereunto duly authorized.
Registrant: AIM International Mutual Funds (Invesco International Mutual Funds)
| By: | /s/ Philip A. Taylor | |
| Philip A. Taylor | ||
| Principal Executive Officer | ||
| Date: | January 7, 2013 | |
Pursuant to the requirements of the Securities and Exchange Act of 1934 and the Investment Company Act of 1940, this report has been signed below by the following persons on behalf of the Registrant and in the capacities and on the dates indicated.
| By: | /s/ Philip A. Taylor | |
| Philip A. Taylor | ||
| Principal Executive Officer | ||
| Date: | January 7, 2013 | |
| By: | /s/ Sheri Morris | |
| Sheri Morris | ||
| Principal Financial Officer | ||
| Date: | January 7, 2013 | |
EXHIBIT INDEX
| 12(a)(1) | Code of Ethics. | |
| 12(a)(2) | Certifications of principal executive officer and principal Financial officer as required by Rule 30a-2(a) under the Investment Company Act of 1940. | |
| 12(a)(3) | Not applicable. | |
| 12(b) | Certifications of principal executive officer and principal financial officer as required by Rule 30a-2(b) under the Investment Company Act of 1940. | |