UNITED STATES SECURITIES AND EXCHANGE COMMISSION
Washington, D.C. 20549
FORM N-CSRS
CERTIFIED SHAREHOLDER REPORT OF REGISTERED MANAGEMENT INVESTMENT COMPANIES
Investment Company Act file number 811-06481
Franklin Municipal Securities Trust
(Exact name of registrant as specified in charter)
| |
| One Franklin Parkway, San Mateo, CA | 94403-1906 |
| (Address of principal executive offices) | (Zip code) |
Craig S. Tyle, One Franklin Parkway, San Mateo, CA 94403-1906
(Name and address of agent for service)
Registrant's telephone number, including area code:_650 312-2000
Date of fiscal year end: 5/31
Date of reporting period: 11/30/10
Item 1. Reports to Stockholders.

Semiannual Report
Municipal Bond Market Overview
For the six months ended November 30, 2010, the municipal bond market posted modest results, despite a very challenging market in November. As measured by Barclays Capital (BC) Municipal Bond indexes, which track municipal securities, investment-grade municipal bonds returned +1.12% for the period under review, while high yield municipal bonds delivered a +2.67% total return.1 In comparison during the same period, Treasuries returned +3.74%, according to the BC U.S. Treasury Index, which comprises U.S. Treasury securities.1
For the first five months of the reporting period municipal bond performance was robust, supported by strong investor demand and generally low interest rates resulting in part from the Federal Reserve Board’s (Fed’s) accommodative stance. The market also benefited from lower-than-normal tax-exempt issuance due to the Build America Bonds (BAB) program. The BAB program allowed municipal issuers to sell their bonds in the taxable market and take advantage of a 35% federal government subsidy for all coupon payments made on those municipal bonds. Such taxable bonds, however, are not part of the Funds’ tax-free portfolios. This subsidy enabled municipalities to borrow at significantly lower net yields than they could otherwise obtain in the traditional tax-exempt municipal bond market, which dramatically reduced the supply of new tax-exempt bonds. Of the $389 billion in issuance for the year through November 2010, $253 billion, or 65%, was in the form of tax-exempt municipal bonds.2 For the same period in 2008 (prior to the BAB program), municipal issuance totaled $368 billion, with $322 billion, or 88%, in the form of tax-exempt municipal bonds.2
1. Source: © 2010 Morningstar. All Rights Reserved. The information contained herein: (1) is proprietary to Morningstar and/or its content providers; (2) may not be copied or distributed; and (3) is not warranted to be accurate, complete or timely. Neither Morningstar nor its content providers are responsible for any damages or losses arising from any use of this information. Past performance is no guarantee of future results.
2. Source: Thomson Reuters.
4 | Semiannual Report
November proved to be the period’s most challenging month as fixed income markets pulled back sharply after the Fed announced its intention to implement a second round of quantitative easing (QE2) with a $600 billion bond buying program. Municipal bonds fell 2.00% in November.1 Credit spreads widened considerably in November as well, as high yield municipal bonds dropped 2.83% for the month, and U.S. Treasuries dipped only 0.70%.1 Initially, markets seemed dissatisfied that the Fed indicated it would target bonds with maturities of 10 years or less, which contribu ted to a sell-off in bonds with maturities longer than 10 years. Secondly, some observers felt QE2 was unnecessary and might even ignite inflation, which contributed to weakness in shorter term bonds. The municipal bond market pulled back as yields generally rose. This was exacerbated as market concerns led to investor redemptions, forcing further sell-offs. According to the Investment Company Institute, cash flows during the period first turned negative the week of November 10 and worsened in the month’s second half. During the week of November 17, the municipal bond market had net outflows of approximately $4.8 billion, and during the last week of November, outflows were approximately $3.1 billion. A third factor affecting November’s performance was related to the BAB program. For most of the year, markets had expected the BAB program to be extended beyond 2010, and they began to anticipate a larger-than-normal supply of municipal bonds going into year-end. This belief waned, however, as Republic ans took over the majority of the House of Representatives and in an existing bill did not include language that would extend the program.
Although the municipal bond market experienced recent, short-term volatility, we maintained a long-term perspective. In our view, the pullback in yields and increasing risk premiums may provide us an opportunity to enhance the Funds’ income-earning potential.
The foregoing information reflects our analysis and opinions as of November 30, 2010, the end of the reporting period. The information is not a complete analysis of every aspect of any market, country, industry, security or fund. Statements of fact are from sources considered reliable.
Semiannual Report | 5
Franklin California
High Yield Municipal Fund
Your Fund’s Goals and Main Investments: Franklin California High Yield Municipal Fund seeks to provide a high level of income exempt from federal and California personal income taxes by investing at least 80% of its net assets in municipal securities, including higher yielding, lower rated securities, that pay interest free from such taxes.1 Its secondary goal is capital appreciation.
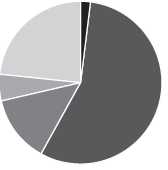
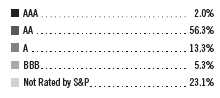
Credit Quality Breakdown*
Franklin California High Yield Municipal Fund
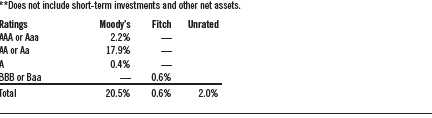
Based on Total Long-Term Investments as of 11/30/10**
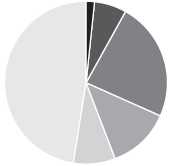
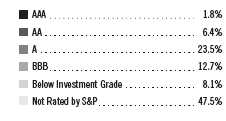
*Standard & Poor’s (S&P) is the primary independent rating agency, Moody’s is the secondary rating agency, and Fitch is the tertiary rating agency. Ratings for securities not rated by S&P are in the table below. The letter ratings are provided to indicate the creditworthiness of the Fund’s bond holdings and generally can range from AAA or Aaa (highest) nr to Below Investment Grade (lowest).
This semiannual report for Franklin California High Yield Municipal Fund covers the period ended November 30, 2010.
1. The Fund may invest up to 100% of its assets in bonds whose interest payments are subject to federal alternative minimum tax. All or a significant portion of the income on these obligations may be subject to such tax. Distributions of capital gains are generally taxable. To avoid imposition of 28% backup withholding on all Fund distributions and redemption proceeds, U.S. investors must be properly certified on Form W-9 and non-U.S. investors on Form W-8BEN.
The dollar value, number of shares or principal amount, and names of all portfolio holdings are listed in the Fund’s Statement of Investments (SOI). The SOI begins on page 27.
6 | Semiannual Report
| | | | |
| Dividend Distributions* | | | | |
| Franklin California High Yield Municipal Fund | | | |
| | | Dividend per Share | |
| Month | Class A | Class B | Class C | Advisor Class |
| June | 4.24 cents | 3.82 cents | 3.81 cents | 4.31 cents |
| July | 4.24 cents | 3.82 cents | 3.81 cents | 4.31 cents |
| August | 4.24 cents | 3.82 cents | 3.81 cents | 4.31 cents |
| September | 4.24 cents | 3.83 cents | 3.81 cents | 4.32 cents |
| October | 4.14 cents | 3.73 cents | 3.71 cents | 4.22 cents |
| November | 4.14 cents | 3.73 cents | 3.71 cents | 4.22 cents |
*Assumes shares were purchased and held for the entire accrual period, which differs from the calendar month. Since dividends accrue daily, your actual distributions will vary depending on the date you purchased your shares and any account activity. All Fund distributions will vary depending upon current market conditions, and past distributions are not indicative of future trends.
Performance Overview
The Fund’s Class A share price, as measured by net asset value, decreased from $9.40 on May 31, 2010, to $9.31 on November 30, 2010. The Fund’s Class A shares paid dividends totaling 25.43 cents per share for the reporting period.2 The Performance Summary beginning on page 10 shows that at the end of this reporting period the Fund’s Class A shares’ distribution rate was 4.99% based on an annualization of the current 4.04 cent per share monthly dividend and the maximum offering price of $9.72 on November 30, 2010. An investor in the 2010 maximum combined effective federal and California personal income tax bracket of 41.21% would need to earn a distribution rate of 8.49% from a taxable investment to match the Fund’ s Class A tax-free distribution rate. For the Fund’s Class B, C and Advisor shares’ performance, please see the Performance Summary. During the period under review, renewed investor interest in municipal bonds and limited new-issue supply tended to reduce the Fund’s income, which caused dividends to decline slightly.
State Update
California’s historically robust economy, the eighth largest in the world, faced severe headwinds during the reporting period. The state weathered tax revenue declines, more than half of which were from personal income taxes. In addition, state lawmakers struggled to pass a budget, setting a record for the longest budget impasse in California history. High unemployment compounded state budget problems as well and placed pressure on California’s weak housing
2. All Fund distributions will vary depending upon current market conditions, and past distributions are not indicative of future trends.
Performance data represent past performance, which does not guarantee future results. Investment return and principal value will fluctuate, and you may have a gain or loss when you sell your shares. Current performance may differ from figures shown. Please visit franklintempleton.com or call (800) 342-5236 for most recent month-end performance.
Semiannual Report | 7
Portfolio Breakdown
Franklin California High Yield Municipal Fund 11/30/10
|
| % of Total |
| Long-Term Investments* |
| | |
| Tax-Supported | 41.3 | % |
| Hospital & Health Care | 13.8 | % |
| General Obligation | 9.5 | % |
| Transportation | 9.3 | % |
| Other Revenue | 6.9 | % |
| Utilities | 5.8 | % |
| Higher Education | 5.5 | % |
| Refunded | 5.4 | % |
| Housing | 1.6 | % |
| Subject to Government Appropriations | 0.9 | % |
*Does not include short-term investments and other net assets.
market marred by high foreclosures and falling values. As of November, unemployment stood at 12.4%, nearly three percentage points above the 9.8% national median.3 However, the pace of job losses appeared to slow during the reporting period, notably with steady employment growth in the computer systems and design industry.
California’s budget impasse was a major challenge for the state as local governments and school districts braved deep cuts to bridge a $19 billion budget shortfall for 2011.4 The temporarily balanced 2011 budget, enacted three months late in October, relied heavily on one-time measures, payment deferrals, optimistic revenue assumptions and receipt of additional federal aid that might not come through. Also, voter-authorized propositions from the November mid-term elections further lowered the state’s flexibility in budgeting and revenue raising. These factors increased the likelihood of future midyear fiscal shortfalls.
Given the size of California’s budget, the state’s tax-supported debt was moderate at $2,362 per capita or 5.6% of personal income, compared with the $936 and 2.5% national medians.5 However, because California is implementing a long-term strategic plan with voter-authorized projects geared toward supporting ongoing economic growth, its debt burden is likely to increase in the next few years. Independent credit rating agency Moody’s Investors Service maintained its A rating of California’s general obligation bonds with a stable outlook.6 The rating and outlook reflected the difficult budgetary environment the state faced.
Investment Strategy
We use a consistent, disciplined strategy in an effort to maximize tax-exempt income for our shareholders by seeking to maintain exposure to higher coupon securities. We generally employ a buy-and-hold approach and invest in securities we believe should provide the most relative value in the market. As we invest during different interest rate environments, our portfolio becomes progressively more diversified with a broad range of securities. This broad diversification may help mitigate interest rate risk. We do not use leverage or exotic derivatives, nor do we use hedging techniques that could add volatility and contribute to underperformance in adverse markets. We generally stay fully invested to help maximize income distribution.
3. Source: Bureau of Labor Statistics.
4. Source: Moody’s Investors Service, “High Profile New Issue, California (State of),” 11/16/10.
5. Source: Moody’s Investors Service, “Special Comment: 2010 State Debt Medians Report,” May 2010.
6. This does not indicate Moody’s rating of the Fund.
8 | Semiannual Report
Manager’s Discussion
Our value-oriented philosophy of investing primarily for income, combined with a relatively steep municipal yield curve compared to Treasuries, favored longer term bonds during the reporting period. Consequently, we sought to remain fully invested in bonds typically ranging from 15 to 30 years in maturity with good call features. Furthermore, by focusing on relative value and attractive credit spreads, especially in California, we were able to find attractive investment opportunities in this volatile market. We intend to maintain our conservative, buy-and-hold investment strategy, as we attempt to provide shareholders with high, current, tax-free income.
Thank you for your continued participation in Franklin California High Yield Municipal Fund. We look forward to serving your future investment needs.
The foregoing information reflects our analysis, opinions and portfolio holdings as of November 30, 2010, the end of the reporting period. The way we implement our main investment strategies and the resulting portfolio holdings may change depending on factors such as market and economic conditions. These opinions may not be relied upon as investment advice or an offer for a particular security. The information is not a complete analysis of every aspect of any market, state, industry, security or the Fund. Statements of fact are from sources considered reliable, but the investment manager makes no representation or warranty as to their completeness or accuracy. Although historical performance is no guarantee of future results, these insights may help you understand our investment management philosophy.
Semiannual Report | 9
Performance Summary as of 11/30/10
Franklin California High Yield Municipal Fund
Your dividend income will vary depending on dividends or interest paid by securities in the Fund’s portfolio, adjusted for operating expenses of each class. Capital gain distributions are net profits realized from the sale of portfolio securities. The performance table does not reflect any taxes that a shareholder would pay on Fund dividends, capital gain distributions, if any, or any realized gains on the sale of Fund shares. Total return reflects reinvestment of the Fund’s dividends and capital gain distributions, if any, and any unrealized gains or losses.
| | | | | | | | |
| Price and Distribution Information | | | | | | |
| Class A (Symbol: FCAMX) | | | | Change | | 11/30/10 | | 5/31/10 |
| Net Asset Value (NAV) | | | -$ | 0.09 | $ | 9.31 | $ | 9.40 |
| Distributions (6/1/10–11/30/10) | | | | | | | | |
| Dividend Income | $ | 0.2543 | | | | | | |
| Class B (Symbol: FBCAX) | | | | Change | | 11/30/10 | | 5/31/10 |
| Net Asset Value (NAV) | | | -$ | 0.10 | $ | 9.36 | $ | 9.46 |
| Distributions (6/1/10–11/30/10) | | | | | | | | |
| Dividend Income | $ | 0.2291 | | | | | | |
| Class C (Symbol: FCAHX) | | | | Change | | 11/30/10 | | 5/31/10 |
| Net Asset Value (NAV) | | | -$ | 0.09 | $ | 9.36 | $ | 9.45 |
| Distributions (6/1/10–11/30/10) | | | | | | | | |
| Dividend Income | $ | 0.2282 | | | | | | |
| Advisor Class (Symbol: FVCAX) | | | | Change | | 11/30/10 | | 5/31/10 |
| Net Asset Value (NAV) | | | -$ | 0.10 | $ | 9.32 | $ | 9.42 |
| Distributions (6/1/10–11/30/10) | | | | | | | | |
| Dividend Income | $ | 0.2589 | | | | | | |
10 | Semiannual Report
Performance Summary (continued)
Performance
Cumulative total return excludes sales charges. Average a nnual total returns include maximum sales charges. Class A: 4.25% maximum initial sales charge; Class B: contingent deferred sales charge (CDSC) declining from 4% to 1% over six years, and eliminated thereafter; Class C: 1% CDSC in first year only; Advisor Class: no sales charges.
| | | | | | | | | | | | | | |
| Class A | | 6-Month | | | | | 1-Year | | | 5-Year | | | 10-Year | |
| Cumulative Total Return1 | + | 1.72 | % | | | + | 8.54 | % | + | 17.05 | % | + | 59.89 | % |
| Average Annual Total Return2 | | -2.63 | % | | | + | 3.95 | % | + | 2.30 | % | + | 4.35 | % |
| Avg. Ann. Total Return (12/31/10)3 | | | | | | + | 0.51 | % | + | 1.52 | % | + | 3.90 | % |
| Distribution Rate4 | | | | 4.99 | % | | | | | | | | | |
| Taxable Equivalent Distribution Rate5 | | | | 8.49 | % | | | | | | | | | |
| 30-Day Standardized Yield6 | | | | 4.72 | % | | | | | | | | | |
| Taxable Equivalent Yield5 | | | | 8.03 | % | | | | | | | | | |
| Total Annual Operating Expenses7 | | | | 0.63 | % | | | | | | | | | |
| Class B | | 6-Month | | | | | 1-Year | | | 5-Year | | | 10-Year | |
| Cumulative Total Return1 | + | 1.34 | % | | | + | 7.90 | % | + | 13.84 | % | + | 53.03 | % |
| Average Annual Total Return2 | | -2.62 | % | | | + | 3.90 | % | + | 2.30 | % | + | 4.35 | % |
| Avg. Ann. Total Return (12/31/10)3 | | | | | | + | 0.36 | % | + | 1.51 | % | + | 3.90 | % |
| Distribution Rate4 | | | | 4.62 | % | | | | | | | | | |
| Taxable Equivalent Distribution Rate5 | | | | 7.86 | % | | | | | | | | | |
| 30-Day Standardized Yield6 | | | | 4.38 | % | | | | | | | | | |
| Taxable Equivalent Yield5 | | | | 7.45 | % | | | | | | | | | |
| Total Annual Operating Expenses7 | | | | 1.17 | % | | | | | | | | | |
| Class C | | 6-Month | | | | | 1-Year | | | 5-Year | | | 10-Year | |
| Cumulative Total Return1 | + | 1.44 | % | | | + | 7.89 | % | + | 13.93 | % | + | 51.57 | % |
| Average Annual Total Return2 | + | 0.45 | % | | | + | 6.89 | % | + | 2.64 | % | + | 4.25 | % |
| Avg. Ann. Total Return (12/31/10)3 | | | | | | + | 3.34 | % | + | 1.85 | % | + | 3.79 | % |
| Distribution Rate4 | | | | 4.62 | % | | | | | | | | | |
| Taxable Equivalent Distribution Rate5 | | | | 7.86 | % | | | | | | | | | |
| 30-Day Standardized Yield6 | | | | 4.39 | % | | | | | | | | | |
| Taxable Equivalent Yield5 | | | | 7.47 | % | | | | | | | | | |
| Total Annual Operating Expenses7 | | | | 1.18 | % | | | | | | | | | |
| Advisor Class8 | | 6-Month | | | | | 1-Year | | | 5-Year | | | 10-Year | |
| Cumulative Total Return1 | + | 1.66 | % | | | + | 8.64 | % | + | 17.61 | % | + | 60.66 | % |
| Average Annual Total Return2 | + | 1.66 | % | | | + | 8.64 | % | + | 3.30 | % | + | 4.86 | % |
| Avg. Ann. Total Return (12/31/10)3 | | | | | | + | 5.04 | % | + | 2.50 | % | + | 4.40 | % |
| Distribution Rate4 | | | | 5.32 | % | | | | | | | | | |
| Taxable Equivalent Distribution Rate5 | | | | 9.05 | % | | | | | | | | | |
| 30-Day Standardized Yield6 | | | | 5.06 | % | | | | | | | | | |
| Taxable Equivalent Yield5 | | | | 8.61 | % | | | | | | | | | |
| Total Annual Operating Expenses7 | | | | 0.53 | % | | | | | | | | | |
Performance data represent past performance, which does not guarantee future results. Investment return and principal value will fluctuate, and you may have a gain or loss when you sell your shares. Current performance may differ from figures shown. For most recent month-end performance, go to franklintempleton.com or call (800) 342-5236.
Semiannual Report | 11
Performance Summary (continued)
Endnotes
Because municipal bonds are sensitive to interest rate movements, the Fund’s yield and share price will fluctuate with market conditions. Bond prices generally move in the opposite direction of interest rates. Thus, as prices of bonds in the Fund adjust to a rise in interest rates, the Fund’s share price may decline. Since the Fund concentrates its investments in a single state, it is subject to greater risk of adverse economic and regulatory changes in that state than a geographically diversified fund. In general, an investor is paid a higher yield to assume a greater degree of credit risk. The manager applies various techniques and analyses in making investment decisions for the Fund, but there can be no guarantee that these decisions will produce the desired results. The Fund’s prospectus also includes a description of the main investment risks.
| |
Class B: Class C: | These shares have higher annual fees and expenses than Class A shares. Prior to 1/1/04, these shares were offered with an initial sales charge; thus actual total returns would have differed. These shares have higher annual fees and expenses than Class A shares. |
Advisor Class: | Shares are available to certain eligible investors as described in the prospectus. |
1. Cumulative total return represents the change in value of an investment over the periods indicated.
2. Average annual total return represents the average annual change in value of an investment over the periods indicated. Six-month return has not been annualized.
3. In accordance with SEC rules, we provide standardized average annual total return information through the latest calendar quarter.
4. Distribution rate is based on an annualization of the respective class’s current monthly dividend and the maximum offering price (NAV for Classes B, C and Advisor) per share on 11/30/10.
5. Taxable equivalent distribution rate and yield assume the published rates as of 6/28/10 for the maximum combined federal and California state personal income tax rate of 41.21%, based on the federal income tax rate of 35.00%.
6. The 30-day standardized yield for the 30 days ended 11/30/10 reflects an estimated yield to maturity (assuming all portfolio securities are held to maturity). It should be regarded as an estimate of the Fund’s rate of investment income, and it may not equal the Fund’s actual income distribution rate (which reflects the Fund’s past dividends paid to shareholders) or the income reported in the Fund’s financial statements.
7. Figures are as stated in the Fund’s prospectus current as of the date of this report. In periods of market volatility, assets may decline significantly, causing total annual Fund operating expenses to become higher than the figures shown.
8. Effective 11/15/06, the Fund began offering Advisor Class shares, which do not have sales charges or a Rule 12b-1 plan. Performance quotations for this class reflect the following methods of calculation: (a) For periods prior to 11/15/06, a restated figure is used based upon the Fund’s Class A performance, excluding the effect of Class A’s maximum initial sales charge, but reflecting the effect of the Class A Rule 12b-1 fees; and (b) for periods after 11/14/06, actual Advisor Class performance is used reflecting all charges and fees applicable to that class. Since 11/15/06 (commencement of sales), the cumulative and average annual total returns of Advisor Class shares were +10.05% and +2.40%.
12 | Semiannual Report
Your Fund’s Expenses
Franklin California High Yield Municipal Fund
As a Fund shareholder, you can incur two types of costs:
- Transaction costs, including sales charges (loads) on Fund purchases; and
- Ongoing Fund costs, including management fees, distribution and service (12b-1) fees, and other Fund expenses. All mutual funds have ongoing costs, sometimes referred to as operating expenses.
The following table shows ongoing costs of investing in the Fund and can help you understand these costs and compare them with those of other mutual funds. The table assumes a $1,000 investment held for the six months indicated.
Actual Fund Expenses
The first line (Actual) for each share class listed in the table provides actual account values and expenses. The “Ending Account Value” is derived from the Fund’s actual return, which includes the effect of Fund expenses.
You can estimate the expenses you paid during the period by following these steps. Of course, your account value and expenses will differ from those in this illustration:
| 1. | Divide your account value by $1,000. |
| | If an account had an $8,600 value, then $8,600 ÷ $1,000 = 8.6. |
| 2. | Multiply the result by the number under the heading “Expenses Paid During Period.” |
| | If Expenses Paid During Period were $7.50, then 8.6 x $7.50 = $64.50. |
In this illustration, the estimated expenses paid this period are $64.50.
Hypothetical Example for Comparison with Other Funds
Information in the second line (Hypothetical) for each class in the table can help you compare ongoing costs of investing in the Fund with those of other mutual funds. This information may not be used to estimate the actual ending account balance or expenses you paid during the period. The hypothetical “Ending Account Value” is based on the actual expense ratio for each class and an assumed 5% annual rate of return before expenses, which does not represent the Fund’s actual return. The figure under the heading “Expenses Paid During Period” shows the hypothetical expenses your account would have incurred under this scenario. You can compare this figure with the 5% hypothetical examples that appear in shareholder reports of other funds.
Semiannual Report | 13
Your Fund’s Expenses (continued)
Please note that expenses shown in the table are meant to highlight ongoing costs and do not reflect any transaction costs, such as sales charges. Therefore, the second line for each class is useful in comparing ongoing costs only, and will not help you compare total costs of owning different funds. In addition, if transaction costs were included, your total costs would have been higher. Please refer to the Fund prospectus for additional information on operating expenses.
| | | | | | |
| | | Beginning Account | | Ending Account | | Expenses Paid During |
| Class A | | Value 6/1/10 | | Value 11/30/10 | | Period* 6/1/10–11/30/10 |
| Actual | $ | 1,000 | $ | 1,017.20 | $ | 3.14 |
| Hypothetical (5% return before expenses) | $ | 1,000 | $ | 1,021.96 | $ | 3.14 |
| Class B | | | | | | |
| Actual | $ | 1,000 | $ | 1,013.40 | $ | 5.85 |
| Hypothetical (5% return before expenses) | $ | 1,000 | $ | 1,019.25 | $ | 5.87 |
| Class C | | | | | | |
| Actual | $ | 1,000 | $ | 1,014.40 | $ | 5.91 |
| Hypothetical (5% return before expenses) | $ | 1,000 | $ | 1,019.20 | $ | 5.92 |
| Advisor Class | | | | | | |
| Actual | $ | 1,000 | $ | 1,016.60 | $ | 2.63 |
| Hypothetical (5% return before expenses) | $ | 1,000 | $ | 1,022.46 | $ | 2.64 |
*Expenses are calculated using the most recent six-month expense ratio, annualized for each class (A: 0.62%; B: 1.16%; C: 1.17%; and Advisor: 0.52%), multiplied by the average account value over the period, multiplied by 183/365 to reflect the one-half year period.
14 | Semiannual Report
Franklin Tennessee Municipal Bond Fund
Your Fund’s Goal and Main Investments: Franklin Tennessee Municipal Bond Fund seeks to maximize income exempt from federal and Tennessee personal income taxes, consistent with prudent investing and the preservation of capital, by investing at least 80% of its net assets in investment grade municipal securities that pay interest free from such taxes.1
Credit Quality Breakdown*
Franklin Tennessee Municipal Bond Fund
Based on Total Long-Term Investments as of 11/30/10**
*Standard & Poor’s (S&P) is the primary independent rating agency, Moody’s is the secondary rating agency, and Fitch is the tertiary rating agency. Ratings for securities not rated by S&P are in the table below. The letter ratings are provided to indicate the creditworthiness of the Fund’s bond holdings and generally can range from AAA or Aaa (highest) NR to Below Investment Grade (lowest).
This semiannual report for Franklin Tennessee Municipal Bond Fund covers the period ended November 30, 2010.
1. The Fund may invest as much as 100% of its assets in bonds whose interest payments are subject to federal alternative minimum tax. All or a significant portion of the income on these obligations may be subject to such tax. Distributions of capital gains are generally taxable. To avoid the imposition of 28% backup withholding on all Fund distributions and redemption proceeds, U.S. investors must be properly certified on Form W-9 and non-U.S. investors on Form W-8BEN.
The dollar value, number of shares or principal amount, and names of all portfolio holdings are listed in the Fund’s Statement of Investments (SOI). The SOI begins on page 41.
Semiannual Report | 15
Performance data represent past performance, which does not guarantee future results. Investment return and principal value will fluctuate, and you may have a gain or loss when you sell your shares. Current performance may differ from figures shown. Please visit franklintempleton.com or call (800) 342-5236 for most recent month-end performance.
Dividend Distributions*
Franklin Tennessee Municipal Bond Fund Class A
| | |
| | Month | Dividend per Share |
| | June | 3.60 cents |
| | July | 3.60 cents |
| | August | 3.60 cents |
| | September | 3.60 cents |
| | October | 3.60 cents |
| | November | 3.60 cents |
*Assumes shares were purchased and held for the entire accrual period, which differs from the calendar month. Since dividends accrue daily, your actual distributions will vary depending on the date you purchased your shares and any account activity. All Fund distributions will vary depending upon current market conditions, and past distributions are not indicative of future trends.
16 | Semiannual Report
Performance Overview
The Fund’s Class A share price, as measured by net asset value, decreased from $11.35 on May 31, 2010, to $11.14 on November 30, 2010. The Fund’s Class A shares paid dividends totaling 21.98 cents per share for the reporting period.2 The Performance Summary beginning on page 19 shows that at the end of this reporting period the Fund’s Class A shares’ distribution rate was 3.71%. An investor in the 2010 maximum combined effective federal and Tennessee personal income tax bracket of 38.90% would need to earn a distribution rate of 6.07% from a taxable investment to match the Fund’s Class A tax-free distribution rate.
State Update
During the six months under review, Tennessee’s economy and budget improved from recessionary low levels while the state’s municipal debt maintained its high credit rating. Although its economy struggled with many of the same issues affecting other states, Tennessee benefited from some high-profile, positive job announcements and a housing market that compared favorably with nationwide levels. The U.S. foreclosure crisis weighed on property values statewide, but Tennessee’s foreclosure rate was only about half of the national rate through 2010’s second quarter.3
Following two years of declining employment, preliminary figures recently showed year-over-year job growth of 0.4%, double the national expansion rate of 0.2%.4 The state’s unemployment rate was 9.4% in November 2010 compared to 9.8% for the nation.5 The manufacturing sector, which constitutes about 12% of Tennessee’s total employment (roughly 9% for the nation), stabilized in 2010 after suffering accelerating declines alongside the construction sector during the previous two years.4 As hiring picked up, year-over-year job growth in manufacturing was 1.0% versus flat performance for the U.S. as a whole.4 Improvements in manufacturing reflected stabilization in automobile industry activity foremost, while large investments by manufacturers to expand operations within the state laid the groundwork for the sector’s longer-term sustainability. The state’s economic development also remained very active, with plans for new or expanding auto assembly plants, industrial parks and multimodal facilities coming into the economic pipeline, some of which have been benefiting from the federal government’s increased focus on renewable energy.
2. All Fund distributions will vary depending upon current market conditions, and past distributions are not indicative of future trends.
3. Source: Standard & Poor’s, “Summary: Tennessee; General Obligation,” RatingsDirect, 10/5/10.
4. Source: Moody’s Investors Service, “New Issue: Moody’s Assigns Aaa Rating and Stable Outlook to $213 million Tennessee General Obligation Bonds,” 10/6/10.
5. Source: Bureau of Labor Statistics.
Recent budget planning has slowly pushed Tennessee back toward structural balance after tax receipts fell short in fiscal years 2009 and 2010. The recently enacted fiscal year 2011 budget was, as in the past two years, supported by non-recurring measures, including federal stimulus money, and assumed the use of reserves and a temporary one-year assessment to hospitals to help narrow a budget gap that is still expected to produce a $189 million deficit.3 For 2011, the state factored in a modest pick-up of 1.7% in tax collections, reflecting a return to growth for such receipts following declines in fiscal years 2009 and 2010.4 Compared with a year earlier, sales tax revenues rose for the first time in April 2010 following a 22-month downward trend.3 Tennessee’s net tax-supported debt was 0.9% of personal income and $318 per capita, both very low compared with the national medians of 2.5% and $936.4
Despite the recession’s significant impact on key tax revenues and the lingering challenges of major budget gaps in recent years, independent credit rating agency Moody’s Investors Service assigned Tennessee’s general obligation debt an Aaa rating with a stable outlook.6 This rating reflected the state’s historically moderate debt levels, aggressive cost containment measures, well funded retirement system and maintenance of adequate budgetary reserves even after accounting for large drawdowns in the current fiscal year.
Investment Strategy
We use a consistent, disciplined strategy in an effort to maximize tax-exempt income for our shareholders by seeking to invest in investment grade municipal securities. We generally employ a buy-and-hold approach and invest in securities we believe should provide the most relative value in the market. As we invest during different interest rate environments, the Fund’s portfolio becomes progressively more diversified with a broad range of securities. This broad diversification may help mitigate interest rate risk. We do not use leverage or exotic derivatives, nor do we use hedging techniques that could add volatility and contribute to underperformance in adverse markets. We generally seek to stay fully invested to help maximize income distribution.
Manager’s Discussion
Our value-oriented philosophy of investing primarily for income and a positively sloping municipal yield curve favored the use of longer term bonds during the reporting period. Consistent with our strategy, we sought to remain fully invested
6. This does not indicate Moody’s rating of the Fund.
Portfolio Breakdown
Franklin Tennessee Municipal Bond Fund 11/30/10
|
| % of Total |
| Long-Term Investments* |
| | |
| Utilities | 33.6 | %** |
| Hospital & Health Care | 15.0 | % |
| General Obligation | 13.7 | % |
| Higher Education | 11.0 | % |
| Refunded | 10.2 | % |
| Transportation | 4.7 | % |
| Housing | 3.6 | % |
| Other Revenue | 3.5 | % |
| Tax-Supported | 4.7 | % |
*Does not include short-term investments and other net assets.
**The Fund may invest more than 25% in municipal securities that finance similar types of projects such as utilities. A change that affects one project may affect all similar projects, thereby increasing market risk.
Semiannual Report | 17
in bonds generally ranging from 20 to 30 years in maturity with good call features. We took advantage of strong retail demand for highly rated essential service bonds, and sold some AA-rated and AAA-rated securities that were purchased in a lower municipal bond interest rate environment. Seeking to provide shareholders with high, current, tax-free income, the proceeds were reinvested in securities with current coupons and better call protection in a higher interest rate environment. We found value in some credit-driven securities (rated between AA and A) as credit spreads widened to the point where we felt investors were being adequately compensated for higher credit risk. We intend to maintain our conservative, buy-and-hold investment strategy as we attempt to provide shareholders with high, current, tax-free income.
Thank you for your continued participation in Franklin Tennessee Municipal Bond Fund. We look forward to serving your future investment needs.
The foregoing information reflects our analysis, opinions and portfolio holdings as of November 30, 2010, the end of the reporting period. The way we implement our main investment strategies and the resulting portfolio holdings may change depending on factors such as market and economic conditions. These opinions may not be relied upon as investment advice or an offer for a particular security. The information is not a complete analysis of every aspect of any market, state, industry, security or the Fund. Statements of fact are from sources considered reliable, but the investment manager makes no representation or warranty as to their completeness or accuracy. Although historical performance is no guarantee of future results, these insights may help you understand our investment management philosophy.
18 | Semiannual Report
Performance Summary as of 11/30/10
Franklin Tennessee Municipal Bond Fund
Your dividend income will vary depending on dividends or interest paid by securities in the Fund’s portfolio, adjusted for operating expenses. Capital gain distributions are net profits realized from the sale of portfolio securities. The performance table does not reflect any taxes that a shareholder would pay on Fund dividends, capital gain distributions, if any, or any realized gains on the sale of Fund shares. Total return reflects reinvestment of the Fund’s dividends and capital gain distributions, if any, and any unrealized gains or losses.
| | | | | | | | |
| Price and Distribution Information | | | | | | |
| Class A (Symbol: FRTIX) | | | | Change | | 11/30/10 | | 5/31/10 |
| Net Asset Value (NAV) | | | -$ | 0.21 | $ | 11.14 | $ | 11.35 |
| Distributions (6/1/10–11/30/10) | | | | | | | | |
| Dividend Income | $ | 0.2198 | | | | | | |
Performance1
Cumulative total return excludes the sales charge. Average a nnual total returns include the maximum sales charge.
Class A: 4.25% maximum initial sales charge.
| | | | | | | | | | | | | | |
| Class A | | 6-Month | | | | | 1-Year | | | 5-Year | | | 10-Year | |
| Cumulative Total Return2 | + | 0.06 | % | | | + | 3.35 | % | + | 21.24 | % | + | 61.94 | % |
| Average Annual Total Return3 | | -4.16 | % | | | | -1.07 | % | + | 3.03 | % | + | 4.48 | % |
| Avg. Ann. Total Return (12/31/10)4 | | | | | | | -3.62 | % | + | 2.45 | % | + | 3.93 | % |
| Distribution Rate5 | | | | 3.71 | % | | | | | | | | | |
| Taxable Equivalent Distribution Rate6 | | | | 6.07 | % | | | | | | | | | |
| 30-Day Standardized Yield7 | | | | 2.99 | % | | | | | | | | | |
| Taxable Equivalent Yield6 | | | | 4.89 | % | | | | | | | | | |
| Total Annual Operating Expenses8 | | | | | | | | | | | | | | |
| Without Waiver | | | | 0.72 | % | | | | | | | | | |
| With Waiver | | | | 0.70 | % | | | | | | | | | |
Performance data represent past performance, which does not guarantee future results. Investment return and principal value will fluctuate, and you may have a gain or loss when you sell your shares. Current performance may differ from figures shown. For most recent month-end performance, go to franklintempleton.com or call (800) 342-5236.
The investment manager and administrator have contractually agreed to waive or assume certain expenses so that common expenses (excluding Rule 12b-1 fees) do not exceed 0.60% (other than certain nonroutine expenses) until 9/30/11.
Semiannual Report | 19
Performance Summary (continued)
Endnotes
Because municipal bonds are sensitive to interest rate movements, the Fund’s yield and share price will fluctuate with market conditions. Bond prices generally move in the opposite direction of interest rates. Thus, as prices of bonds in the Fund adjust to a rise in interest rates, the Fund’s share price may decline. Since the Fund concentrates its investments in a single state, it is subject to greater risk of adverse economic and regulatory changes in that state than a geographically diversified fund. The manager applies various techniques and analyses in making investment decisions for the Fund, but there can be no guarantee that these decisions will produce the desired results. The Fund’s prospectus also includes a description of the main investment risks.
1. If the manager and administrator had not waived fees, the Fund’s distribution rate and total return would have been lower, and yield for the period would have been 2.99%.
2. Cumulative total return represents the change in value of an investment over the periods indicated.
3. Average annual total return represents the average annual change in value of an investment over the periods indicated. Six-month return has not been annualized.
4. In accordance with SEC rules, we provide standardized average annual total return information through the latest calendar quarter.
5. Distribution rate is based on an annualization of the current 3.60 cent per share monthly dividend and the maximum offering price of $11.63 per share on 11/30/10.
6. Taxable equivalent distribution rate and yield assume the published rates as of 6/28/10 for the maximum combined effective federal and Tennessee state personal income tax rate of 38.90%, based on the federal income tax rate of 35.00%.
7. The 30-day standardized yield for the 30 days ended 11/30/10 reflects an estimated yield to maturity (assuming all portfolio securities are held to maturity). It should be regarded as an estimate of the Fund’s rate of investment income, and it may not equal the Fund’s actual income distribution rate (which reflects the Fund’s past dividends paid to shareholders) or the income reported in the Fund’s financial statements.
8. Figures are as stated in the Fund’s prospectus current as of the date of this report. In periods of market volatility, assets may decline significantly, causing total annual Fund operating expenses to become higher than the figures shown.
20 | Semiannual Report
Your Fund’s Expenses
Franklin Tennessee Municipal Bond Fund
As a Fund shareholder, you can incur two types of costs:
- Transaction costs, including sales charges (loads) on Fund purchases; and
- Ongoing Fund costs, including management fees, distribution and service (12b-1) fees, and other Fund expenses. All mutual funds have ongoing costs, sometimes referred to as operating expenses.
The following table shows ongoing costs of investing in the Fund and can help you understand these costs and compare them with those of other mutual funds. The table assumes a $1,000 investment held for the six months indicated.
Actual Fund Expenses
The first line (Actual) for each share class listed in the table provides actual account values and expenses. The “Ending Account Value” is derived from the Fund’s actual return, which includes the effect of Fund expenses.
You can estimate the expenses you paid during the period by following these steps. Of course, your account value and expenses will differ from those in this illustration:
| 1. | Divide your account value by $1,000. |
| | If an account had an $8,600 value, then $8,600 ÷ $1,000 = 8.6. |
| 2. | Multiply the result by the number under the heading “Expenses Paid During Period.” |
| | If Expenses Paid During Period were $7.50, then 8.6 x $7.50 = $64.50. |
In this illustration, the estimated expenses paid this period are $64.50.
Hypothetical Example for Comparison with Other Funds
Information in the second line (Hypothetical) for each class in the table can help you compare ongoing costs of investing in the Fund with those of other mutual funds. This information may not be used to estimate the actual ending account balance or expenses you paid during the period. The hypothetical “Ending Account Value” is based on the actual expense ratio for each class and an assumed 5% annual rate of return before expenses, which does not represent the Fund’s actual return. The figure under the heading “Expenses Paid During Period” shows the hypothetical expenses your account would have incurred under this scenario. You can compare this figure with the 5% hypothetical examples that appear in shareholder reports of other funds.
Semiannual Report | 21
Your Fund’s Expenses (continued)
Please note that expenses shown in the table are meant to highlight ongoing costs and do not reflect any transaction costs, such as sales charges. Therefore, the second line for each class is useful in comparing ongoing costs only, and will not help you compare total costs of owning different funds. In addition, if transaction costs were included, your total costs would have been higher. Please refer to the Fund prospectus for additional information on operating expenses.
| | | | | | |
| | | Beginning Account | | Ending Account | | Expenses Paid During |
| Class A | | Value 6/1/10 | | Value 11/30/10 | | Period* 6/1/10–11/30/10 |
| Actual | $ | 1,000 | $ | 1,000.60 | $ | 3.51 |
| Hypothetical (5% return before expenses) | $ | 1,000 | $ | 1,021.56 | $ | 3.55 |
*Expenses are calculated using the most recent six-month annualized expense ratio, net of expense waivers, of 0.70%, multiplied by the average account value over the period, multiplied by 183/365 to reflect the one-half year period.
22 | Semiannual Report
| | | | | | | | | | | | | | | | | | |
| Franklin Municipal Securities Trust | | | | | | | |
| |
| Financial Highlights | | | | | | | | | | | | | | | | | | |
| |
| Franklin California High Yield Municipal Fund | | | | | | | | | | | | | | | | |
| | | Six Months Ended | | | | | | | | | | | | | |
| | | November 30, 2010 | | | | | | Year Ended May 31, | | | | |
| Class A | | (unaudited) | | | 2010 | | | 2009 | | | 2008 | | | 2007 | | | 2006 | |
| Per share operating performance | | | | | | | | | | | | | | | | | | |
| (for a share outstanding throughout | | | | | | | | | | | | | | | | | | |
| the period) | | | | | | | | | | | | | | | | | | |
| Net asset value, beginning of period | $ | 9.40 | | $ | 8.42 | | $ | 9.70 | | $ | 10.44 | | $ | 10.31 | | $ | 10.39 | |
| Income from investment operationsa: | | | | | | | | | | | | | | | | | | |
| Net investment incomeb | | 0.24 | | | 0.51 | | | 0.51 | | | 0.49 | | | 0.48 | | | 0.50 | |
| Net realized and unrealized gains | | | | | | | | | | | | | | | | | | |
| (losses) | | (0.08 | ) | | 0.98 | | | (1.29 | ) | | (0.76 | ) | | 0.13 | | | (0.08 | ) |
| Total from investment operations | | 0.16 | | | 1.49 | | | (0.78 | ) | | (0.27 | ) | | 0.61 | | | 0.42 | |
| Less distributions from net investment | | | | | | | | | | | | | | | | | | |
| income | | (0.25 | ) | | (0.51 | ) | | (0.50 | ) | | (0.47 | ) | | (0.48 | ) | | (0.50 | ) |
| Redemption feesc | | — | | | — | | | —d | | | —d | | | — | | | —d | |
| Net asset value, end of period | $ | 9.31 | | $ | 9.40 | | $ | 8.42 | | $ | 9.70 | | $ | 10.44 | | $ | 10.31 | |
| |
| Total returne | | 1.72 | % | | 18.11 | % | | (7.91 | )% | | (2.58 | )% | | 6.03 | % | | 4.13 | % |
| |
| Ratios to average net assetsf | | | | | | | | | | | | | | | | | | |
| Expenses | | 0.62 | % | | 0.63 | % | | 0.63 | % | | 0.62 | % | | 0.62 | % | | 0.62 | % |
| Net investment income | | 5.13 | % | | 5.70 | % | | 5.91 | % | | 4.87 | % | | 4.58 | % | | 4.80 | % |
| |
| Supplemental data | | | | | | | | | | | | | | | | | | |
| Net assets, end of period (000’s) | $ | 1,099,202 | | $ | 1,090,015 | | $ | 945,110 | | $ | 1,204,191 | | $ | 1,329,255 | | $ | 1,067,011 | |
| Portfolio turnover rate | | 6.94 | % | | 13.84 | % | | 9.85 | % | | 26.43 | % | | 3.34 | % | | 11.18 | % |
aThe amount shown for a share outstanding throughout the period may not correlate with the Statement of Operations for the period due to the timing of sales and repurchases of the Fund shares in relation to income earned and/or fluctuating market value of the investments of the Fund.
bBased on average daily shares outstanding.
cEffective September 1, 2008, the redemption fee was eliminated.
dAmount rounds to less than $0.01 per share.
eTotal return does not reflect sales commissions or contingent deferred sales charges, if applicable, and is not annualized for periods less than one year.
fRatios are annualized for periods less than one year.
Semiannual Report | The accompanying notes are an integral part of these financial statements. | 23
| | | | | | | | | | | | | | | | | | |
| Franklin Municipal Securities Trust | | | | | | | | | | |
| Financial Highlights (continued) | | | | | | | | | | | | | | | | | | |
| |
| Franklin California High Yield Municipal Fund | | | | | | | | | | | | | | | | | | |
| | | Six Months Ended | | | | | | | | | | | | | | | | |
| | | November 30, 2010 | | | | | | Year Ended May 31, | | | | |
| Class B | | (unaudited) | | | 2010 | | | 2009 | | | 2008 | | | 2007 | | | 2006 | |
| Per share operating performance | | | | | | | | | | | | | | | | | | |
| (for a share outstanding throughout the period) | | | | | | | | | | | | | | | | | | |
| Net asset value, beginning of period | $ | 9.46 | | $ | 8.46 | | $ | 9.75 | | $ | 10.49 | | $ | 10.36 | | $ | 10.44 | |
| Income from investment operationsa: | | | | | | | | | | | | | | | | | | |
| Net investment incomeb | | 0.22 | | | 0.46 | | | 0.46 | | | 0.43 | | | 0.42 | | | 0.44 | |
| Net realized and unrealized gains (losses) | | (0.09 | ) | | 1.00 | | | (1.30 | ) | | (0.75 | ) | | 0.14 | | | (0.08 | ) |
| Total from investment operations | | 0.13 | | | 1.46 | | | (0.84 | ) | | (0.32 | ) | | 0.56 | | | 0.36 | |
| Less distributions from net investment income | | (0.23 | ) | | (0.46 | ) | | (0.45 | ) | | (0.42 | ) | | (0.43 | ) | | (0.44 | ) |
| Redemption feesc | | — | | | — | | | —d | | | —d | | | — | | | —d | |
| Net asset value, end of period | $ | 9.36 | | $ | 9.46 | | $ | 8.46 | | $ | 9.75 | | $ | 10.49 | | $ | 10.36 | |
| |
| Total returne | | 1.34 | % | | 17.64 | % | | (8.47 | )% | | (3.10 | )% | | 5.43 | % | | 3.54 | % |
| |
| Ratios to average net assetsf | | | | | | | | | | | | | | | | | | |
| Expenses | | 1.16 | % | | 1.17 | % | | 1.17 | % | | 1.17 | % | | 1.17 | % | | 1.17 | % |
| Net investment income | | 4.59 | % | | 5.16 | % | | 5.37 | % | | 4.32 | % | | 4.03 | % | | 4.25 | % |
| |
| Supplemental data | | | | | | | | | | | | | | | | | | |
| Net assets, end of period (000’s) | $ | 5,276 | | $ | 7,591 | | $ | 12,743 | | $ | 22,308 | | $ | 27,246 | | $ | 29,980 | |
| Portfolio turnover rate | | 6.94 | % | | 13.84 | % | | 9.85 | % | | 26.43 | % | | 3.34 | % | | 11.18 | % |
aThe amount shown for a share outstanding throughout the period may not correlate with the Statement of Operations for the period due to the timing of sales and repurchases of the Fund shares in relation to income earned and/or fluctuating market value of the investments of the Fund.
bBased on average daily shares outstanding.
cEffective September 1, 2008, the redemption fee was eliminated.
dAmount rounds to less than $0.01 per share.
eTotal return does not reflect sales commissions or contingent deferred sales charges, if applicable, and is not annualized for periods less than one year.
fRatios are annualized for periods less than one year.
24 | The accompanying notes are an integral part of these financial statements. | Semiannual Report
| | | | | | | | | | | | | | | | | | |
| Franklin Municipal Securities Trust | | | | | | | |
| Financial Highlights (continued) | | | | | | | | | | | | | | | | | | |
| |
| Franklin California High Yield Municipal Fund | | | | | | | | | | | | | | | | | | |
| | | Six Months Ended | | | | | | | | | | | | | |
| | | November 30, 2010 | | | Year Ended May 31, | | | | |
| Class C | | (unaudited) | | | 2010 | | | 2009 | | | 2008 | | | 2007 | | | 2006 | |
| Per share operating performance | | | | | | | | | | | | | | | | | | |
| (for a share outstanding throughout the period) | | | | | | | | | | | | | | | | | | |
| Net asset value, beginning of period | $ | 9.45 | | $ | 8.46 | | $ | 9.75 | | $ | 10.48 | | $ | 10.35 | | $ | 10.43 | |
| Income from investment operationsa: | | | | | | | | | | | | | | | | | | |
| Net investment incomeb | | 0.22 | | | 0.47 | | | 0.46 | | | 0.43 | | | 0.42 | | | 0.44 | |
| Net realized and unrealized gains (losses) | | (0.08 | ) | | 0.98 | | | (1.30 | ) | | (0.74 | ) | | 0.14 | | | (0.08 | ) |
| Total from investment operations | | 0.14 | | | 1.45 | | | (0.84 | ) | | (0.31 | ) | | 0.56 | | | 0.36 | |
| Less distributions from net investment income | | (0.23 | ) | | (0.46 | ) | | (0.45 | ) | | (0.42 | ) | | (0.43 | ) | | (0.44 | ) |
| Redemption feesc | | — | | | — | | | —d | | | —d | | | — | | | —d | |
| Net asset value, end of period | $ | 9.36 | | $ | 9.45 | | $ | 8.46 | | $ | 9.75 | | $ | 10.48 | | $ | 10.35 | |
| |
| Total returne | | 1.44 | % | | 17.51 | % | | (8.47 | )% | | (3.01 | )% | | 5.43 | % | | 3.54 | % |
| |
| Ratios to average net assetsf | | | | | | | | | | | | | | | | | | |
| Expenses | | 1.17 | % | | 1.18 | % | | 1.17 | % | | 1.17 | % | | 1.17 | % | | 1.17 | % |
| Net investment income | | 4.58 | % | | 5.15 | % | | 5.37 | % | | 4.32 | % | | 4.03 | % | | 4.25 | % |
| |
| Supplemental data | | | | | | | | | | | | | | | | | | |
| Net assets, end of period (000’s) | $ | 257,443 | | $ | 255,392 | | $ | 212,118 | | $ | 276,902 | | $ | 285,410 | | $ | 190,670 | |
| Portfolio turnover rate | | 6.94 | % | | 13.84 | % | | 9.85 | % | | 26.43 | % | | 3.34 | % | | 11.18 | % |
aThe amount shown for a share outstanding throughout the period may not correlate with the Statement of Operations for the period due to the timing of sales and repurchases of the Fund shares in relation to income earned and/or fluctuating market value of the investments of the Fund.
bBased on average daily shares outstanding.
cEffective September 1, 2008, the redemption fee was eliminated.
dAmount rounds to less than $0.01 per share.
eTotal return does not reflect sales commissions or contingent deferred sales charges, if applicable, and is not annualized for periods less than one year.
fRatios are annualized for periods less than one year.
Semiannual Report | The accompanying notes are an integral part of these financial statements. | 25
| | | | | | | | | | | | | | | |
| Franklin Municipal Securities Trust | | | | | | | | | | |
| Financial Highlights (continued) | | | | | | | | | | | | | | | |
| |
| Franklin California High Yield Municipal Fund | | | | | | | | | | | | | | | |
| | | Six Months Ended | | | | | | | | | | |
| | | November 30, 2010 | | | Year Ended May 31, | | | | |
| Advisor Class | | (unaudited) | | | 2010 | | | 2009 | | | 2008 | | | 2007 | a |
| Per share operating performance | | | | | | | | | | | | | | | |
| (for a share outstanding throughout the period) | | | | | | | | | | | | | | | |
| Net asset value, beginning of period | $ | 9.42 | | $ | 8.42 | | $ | 9.71 | | $ | 10.45 | | $ | 10.53 | |
| Income from investment operationsb: | | | | | | | | | | | | | | | |
| Net investment incomec | | 0.25 | | | 0.52 | | | 0.51 | | | 0.50 | | | 0.26 | |
| Net realized and unrealized gains (losses) | | (0.09 | ) | | 1.00 | | | (1.29 | ) | | (0.76 | ) | | (0.08 | ) |
| Total from investment operations | | 0.16 | | | 1.52 | | | (0.78 | ) | | (0.26 | ) | | 0.18 | |
| Less distributions from net investment income | | (0.26 | ) | | (0.52 | ) | | (0.51 | ) | | (0.48 | ) | | (0.26 | ) |
| Redemption feesd | | — | | | — | | | —e | | | —e | | | — | |
| Net asset value, end of period | $ | 9.32 | | $ | 9.42 | | $ | 8.42 | | $ | 9.71 | | $ | 10.45 | |
| |
| Total returnf | | 1.66 | % | | 18.47 | % | | (7.93 | )% | | (2.48 | )% | | 1.76 | % |
| |
| Ratios to average net assetsg | | | | | | | | | | | | | | | |
| Expenses | | 0.52 | % | | 0.53 | % | | 0.53 | % | | 0.52 | % | | 0.52 | % |
| Net investment income | | 5.23 | % | | 5.80 | % | | 6.01 | % | | 4.97 | % | | 4.68 | % |
| |
| Supplemental data | | | | | | | | | | | | | | | |
| Net assets, end of period (000’s) | $ | 121,885 | | $ | 101,332 | | $ | 68,598 | | $ | 72,279 | | $ | 18,156 | |
| Portfolio turnover rate | | 6.94 | % | | 13.84 | % | | 9.85 | % | | 26.43 | % | | 3.34 | % |
aFor the period November 15, 2006 (effective date) to May 31, 2007.
bThe amount shown for a share outstanding throughout the period may not correlate with the Statement of Operations for the period due to the timing of sales and repurchases of the Fund shares in relation to income earned and/or fluctuating market value of the investments of the Fund.
cBased on average daily shares outstanding.
dEffective September 1, 2008, the redemption fee was eliminated.
eAmount rounds to less than $0.01 per share.
fTotal return is not annualized for periods less than one year.
gRatios are annualized for periods less than one year.
26 | The accompanying notes are an integral part of these financial statements. | Semiannual Report
| | | | |
| Franklin Municipal Securities Trust | | | |
| |
| Statement of Investments, November 30, 2010 (unaudited) | | | | |
| |
| |
| Franklin California High Yield Municipal Fund | Principal Amount | | Value |
| Municipal Bonds 93.5% | | | | |
| California 90.7% | | | | |
| ABAG 1915 Act Special Assessment, Windemere Ranch AD 1999-1, Pre-Refunded, | | | | |
| 6.20%, 9/02/20 | $ | 1,950,000 | $ | 2,074,858 |
| 6.30%, 9/02/25 | | 2,935,000 | | 3,125,129 |
| ABAG Finance Authority for Nonprofit Corps. Revenue, | | | | |
| Elder Care Alliance, California Mortgage Insured, 5.60%, 8/15/34 | | 4,260,000 | | 4,172,074 |
| Hamlin School, 5.00%, 8/01/37 | | 10,485,000 | | 9,457,785 |
| Windemere Ranch Financing Program, Sub Series B, 5.00%, 9/02/27 | | 3,495,000 | | 3,074,796 |
| Windemere Ranch Financing Program, Sub Series B, 5.00%, 9/02/34 | | 5,310,000 | | 4,408,150 |
| Alameda CFD No. 2 Special Tax, Refunding, 6.125%, 9/01/16 | | 900,000 | | 901,764 |
| Aliso Viejo CFD No. 2005-01 Special Tax, Glenwood at Aliso Viejo, 5.875%, 9/01/27 | | 5,115,000 | | 4,861,091 |
| American Canyon Financing Authority Infrastructure Revenue Special Assessment, American | | | | |
| Canyon Road East, | | | | |
| 5.00%, 9/02/25 | | 1,305,000 | | 1,162,481 |
| 5.00%, 9/02/30 | | 2,020,000 | | 1,686,437 |
| 5.10%, 9/02/35 | | 1,695,000 | | 1,405,630 |
| Anaheim RDA Tax Allocation, Merged Redevelopment Project Area, Refunding, Series A, | | | | |
| AGMC Insured, 5.00%, 2/01/31 | | 8,500,000 | | 8,540,035 |
| Artesia RDA Tax Allocation, | | | | |
| Artesia Redevelopment Project Area, 5.50%, 6/01/42 | | 6,355,000 | | 5,662,369 |
| Artesia Redevelopment Project Area, 5.70%, 6/01/42 | | 3,175,000 | | 2,915,475 |
| Housing Set-Aside, Artesia Redevelopment Project Area, 7.70%, 6/01/46 | | 3,355,000 | | 3,596,560 |
| Azusa Special Tax, | | | | |
| CFD No. 2005-1, Improvement Area 1, 5.00%, 9/01/27 | | 2,585,000 | | 2,204,359 |
| Escrow, CFD No. 2005-1, Improvement Area 1, 5.00%, 9/01/37 | | 9,065,000 | | 7,168,149 |
| Baldwin Park USD, GO, Capital Appreciation, Election of 2006, AGMC Insured, zero cpn., | | | | |
| 8/01/31 | | 5,735,000 | | 1,663,781 |
| Beaumont Financing Authority Local Agency Revenue, | | | | |
| Series B, 5.35%, 9/01/28 | | 935,000 | | 838,976 |
| Series B, 5.40%, 9/01/35 | | 1,390,000 | | 1,198,361 |
| Series C, 5.45%, 9/01/27 | | 6,435,000 | | 5,544,846 |
| Series C, 5.50%, 9/01/29 | | 855,000 | | 771,586 |
| Series C, 5.50%, 9/01/35 | | 1,035,000 | | 898,111 |
| Series C, 5.50%, 9/01/35 | | 3,995,000 | | 3,318,846 |
| Brentwood Infrastructure Financing Authority Infrastructure Revenue, CIFP, Series 1, | | | | |
| 5.00%, 9/02/25 | | 3,195,000 | | 2,643,575 |
| 5.125%, 9/02/30 | | 4,400,000 | | 3,531,836 |
| 5.15%, 9/02/35 | | 3,450,000 | | 2,714,080 |
| Buena Park Community RDA Tax Allocation, Consolidated Redevelopment Project, 6.25%, | | | | |
| 9/01/35 | | 5,000,000 | | 5,134,800 |
| California City RDA Tax Allocation Revenue, Refunding, Series A-1, 7.75%, 9/01/34 | | 9,105,000 | | 9,266,614 |
| California County Tobacco Securitization Agency Tobacco Revenue, Asset-Backed, | | | | |
| Gold Country Funding Corp., Refunding, 5.25%, 6/01/46 | | 5,000,000 | | 2,974,450 |
| Los Angeles County Security, zero cpn. to 12/01/10, 5.70% thereafter, 6/01/46 | | 5,000,000 | | 3,499,950 |
| California Educational Facilities Authority Revenue, | | | | |
| College and University Financing Program, 5.00%, 2/01/30 | | 5,425,000 | | 4,488,374 |
| College and University Financing Program, 5.00%, 2/01/37 | | 520,000 | | 398,476 |
| College and University Financing Program, Refunding, 5.00%, 2/01/26 | | 1,000,000 | | 875,030 |
| University of Redlands, Series A, 5.125%, 8/01/38 | | 5,000,000 | | 4,831,150 |
Semiannual Report | 27
Franklin Municipal Securities Trust
Statement of Investments, November 30, 2010 (unaudited) (continued)
| | | | |
| Franklin California High Yield Municipal Fund | | Principal Amount | | Value |
| Municipal Bonds (continued) | | | | |
| California (continued) | | | | |
| California Health Facilities Financing Authority Revenue, | | | | |
| Kaiser Permanente, Series A, ETM, 5.40%, 5/01/28 | $ | 2,500,000 | $ | 2,502,400 |
| Providence Health and Services, Refunding, Series C, 6.50%, 10/01/33 | | 4,000,000 | | 4,450,080 |
| Sutter Health, Series A, 5.25%, 11/15/46 | | 22,660,000 | | 21,775,807 |
| California Municipal Finance Authority COP, | | | | |
| 5.25%, 2/01/24 | | 5,000,000 | | 4,911,150 |
| 5.375%, 2/01/29 | | 7,000,000 | | 6,698,370 |
| 5.50%, 2/01/39 | | 10,600,000 | | 9,815,282 |
| Community Hospitals of Central California, 5.25%, 2/01/46 | | 20,500,000 | | 17,881,125 |
| California Municipal Finance Authority Revenue, | | | | |
| Biola University, Refunding, 5.625%, 10/01/23 | | 6,000,000 | | 6,283,440 |
| Biola University, Refunding, 5.80%, 10/01/28 | | 7,500,000 | | 7,747,650 |
| Biola University, Refunding, 5.875%, 10/01/34 | | 6,000,000 | | 6,137,280 |
| Harbor Regional Center Project, 8.50%, 11/01/39 | | 5,000,000 | | 5,273,700 |
| Kern Regional Center Project, Series A, 7.50%, 5/01/39 | | 9,000,000 | | 9,581,310 |
| Loma Linda University, 5.00%, 4/01/37 | | 3,500,000 | | 3,115,595 |
| Southwest Community Health Center, California Mortgage Insured, 6.125%, 2/01/40 | | 4,000,000 | | 4,071,120 |
| University Students Cooperative Associates, 5.00%, 4/01/37 | | 4,000,000 | | 3,487,880 |
| California State GO, | | | | |
| FGIC Insured, 6.00%, 8/01/19 | | 30,000 | | 30,193 |
| Various Purpose, 6.00%, 11/01/39 | | 25,000,000 | | 26,283,250 |
| Various Purpose, Refunding, 5.50%, 3/01/40 | | 5,000,000 | | 5,046,400 |
| California State Public Works Board Lease Revenue, Department of Mental Health, Coalinga, | | | | |
| Series A, 5.125%, 6/01/29 | | 5,500,000 | | 5,247,055 |
| California Statewide CDA Assisted Living Facilities Revenue, Hollenbeck Palms/Magnolia, | | | | |
| Series A, Radian Insured, 4.50%, 2/01/27 | | 1,825,000 | | 1,614,997 |
| California Statewide CDA Revenue, | | | | |
| American Baptist Home West, Refunding, 6.25%, 10/01/39 | | 5,000,000 | | 4,901,300 |
| Bentley School, Refunding, Series A, 7.00%, 7/01/40 | | 8,675,000 | | 7,326,471 |
| California Baptist University, Refunding, Series A, 5.40%, 11/01/27 | | 7,440,000 | | 6,763,406 |
| California Baptist University, Refunding, Series A, 5.50%, 11/01/38 | | 4,500,000 | | 3,882,330 |
| Capital Appreciation Bonds, Bentley School, Refunding, zero cpn., 7/01/50 | | 25,810,000 | | 688,869 |
| Catholic Healthcare West, Series C, 5.625%, 7/01/35 | | 5,000,000 | | 5,096,950 |
| CHF-Irvine LLC, UCI East Campus Apartments, Phase II, 5.75%, 5/15/32 | | 10,000,000 | | 9,854,300 |
| Drew School, Refunding, 5.30%, 10/01/37 | | 4,275,000 | | 3,167,219 |
| Elder Care Alliance, Series A, Pre-Refunded, 8.00%, 11/15/22 | | 3,000,000 | | 3,477,690 |
| Elder Care Alliance, Series A, Pre-Refunded, 8.25%, 11/15/32 | | 4,000,000 | | 4,661,920 |
| Henry Mayo Newhall Memorial Hospital, Series B, California Mortgage Insured, 5.20%, | | | | |
| 10/01/37 | | 7,500,000 | | 6,841,125 |
| Kaiser Permanente, Series B, 5.25%, 3/01/45 | | 52,910,000 | | 50,251,272 |
| Lancer Educational Student Housing Project, 5.625%, 6/01/33 | | 3,000,000 | | 2,521,200 |
| Methodist Hospital of Southern California Project, FHA Insured, 6.75%, 2/01/38 | | 10,000,000 | | 11,187,300 |
| Monterey Institute International, 5.50%, 7/01/31 | | 8,285,000 | | 8,669,921 |
| Presidio Hill School, 6.875%, 8/01/32 | | 5,970,000 | | 5,808,929 |
| Thomas Jefferson School of Law, Refunding, Series A, 7.25%, 10/01/38 | | 10,000,000 | | 10,335,600 |
| Thomas Jefferson School of Law Project, Pre-Refunded, 7.75%, 10/01/31 | | 4,610,000 | | 4,846,262 |
| ValleyCare Health System, Refunding, Series A, 5.00%, 7/15/22 | | 1,000,000 | | 917,140 |
| ValleyCare Health System, Refunding, Series A, 5.125%, 7/15/31 | | 5,850,000 | | 4,919,674 |
28 | Semiannual Report
Franklin Municipal Securities Trust
Statement of Investments, November 30, 2010 (unaudited) (continued)
| | | | |
| Franklin California High Yield Municipal Fund | | Principal Amount | | Value |
| Municipal Bonds (continued) | | | | |
| California (continued) | | | | |
| California Statewide CDA Special Tax Revenue, CFD 2007-1, Orinda, 6.00%, 9/01/29 | $ | 5,000,000 | $ | 4,429,450 |
| Capistrano USD, CFD Special Tax, No. 05-1, Rancho Madrina, 5.25%, 9/01/34 | | 1,120,000 | | 971,074 |
| Carson RDA, Tax Allocation Housing, Series A, | | | | |
| 5.00%, 10/01/30 | | 1,000,000 | | 948,110 |
| 5.25%, 10/01/36 | | 5,000,000 | | 4,671,700 |
| Cathedral City 1915 Act Special Assessment, Limited Obligation, Cove ID No. 04-02, 5.05%, | | | | |
| 9/02/35 | | 1,305,000 | | 1,091,737 |
| Ceres USD, GO, Capital Appreciation, Election of 2008, Series A, zero cpn., | | | | |
| 8/01/39 | | 6,450,000 | | 873,911 |
| 8/01/40 | | 6,730,000 | | 846,701 |
| Chatom USD, GO, Election of 2006, Capital Appreciation, Series C, XLCA Insured, zero cpn., | | | | |
| 8/01/47 | | 9,450,000 | | 739,935 |
| Chino CFD Special Tax, | | | | |
| No. 03-1, 5.875%, 9/01/33 | | 1,250,000 | | 1,157,713 |
| No. 03-3, Improvement Area 1, 5.70%, 9/01/29 | | 1,215,000 | | 1,132,805 |
| No. 03-3, Improvement Area 1, 5.75%, 9/01/34 | | 1,420,000 | | 1,269,863 |
| Chula Vista Special Tax, | | | | |
| CFD No. 01-1, Improvement Area B, San Miguel Ranch, 5.45%, 9/01/36 | | 2,170,000 | | 1,804,572 |
| CFD No. 12-I, McMillin Otay Ranch, 5.25%, 9/01/30 | | 2,060,000 | | 1,703,950 |
| CFD No. 12-I, McMillin Otay Ranch, 5.25%, 9/01/36 | | 3,585,000 | | 2,840,826 |
| Clovis USD, GO, Capital Appreciation, Election of 2004, Series A, NATL RE, FGIC Insured, | | | | |
| zero cpn., | | | | |
| 8/01/27 | | 7,500,000 | | 2,874,375 |
| 8/01/28 | | 5,000,000 | | 1,763,100 |
| Compton Community College District GO, Election of 2002, Series B, | | | | |
| 6.625%, 8/01/27 | | 3,085,000 | | 3,347,842 |
| 6.75%, 8/01/34 | | 4,000,000 | | 4,224,800 |
| Compton CRDA Tax Allocation, Redevelopment Project, second lien, Series B, | | | | |
| 5.70%, 8/01/30 | | 2,255,000 | | 2,231,165 |
| 6.00%, 8/01/42 | | 3,460,000 | | 3,401,872 |
| Compton USD, GO, Election of 2002, Series C, AMBAC Insured, 5.00%, 6/01/31 | | 5,000,000 | | 4,862,550 |
| Corona CFD No. 2001-2 Special Tax, Improvement Areas Nos. 1 and 2, Series A, 6.25%, | | | | |
| 9/01/32 | | 1,890,000 | | 1,835,152 |
| Corona CFD No. 2003-2 Special Tax, Highlands Collection, | | | | |
| 5.15%, 9/01/34 | | 2,210,000 | | 1,809,924 |
| 5.20%, 9/01/34 | | 820,000 | | 680,641 |
| Corona-Norco USD, PFA Special Tax Revenue, Series B, 5.00%, | | | | |
| 9/01/26 | | 1,760,000 | | 1,471,466 |
| 9/01/36 | | 2,000,000 | | 1,515,940 |
| Corona-Norco USD Special Tax, | | | | |
| CFD No. 04-1, 5.00%, 9/01/24 | | 1,540,000 | | 1,307,044 |
| CFD No. 04-1, 5.20%, 9/01/36 | | 2,000,000 | | 1,580,920 |
| Series A, 5.35%, 9/01/26 | | 1,005,000 | | 838,080 |
| Series A, 5.40%, 9/01/36 | | 2,530,000 | | 2,002,040 |
| Cotati South Sonoma Business Park AD Special Assessment, Improvemen t, 6.50%, | | | | |
| 9/02/33 | | 5,295,000 | | 5,183,593 |
| Daly City Housing Development Finance Agency Mobile Home Park Revenue, Franciscan | | | | |
| Mobile Home Park Acquisition Project, sub. bond, Refunding, Series B, 5.85%, 12/15/47 | | 5,105,000 | | 4,427,158 |
Semiannual Report | 29
| | | | |
| Franklin Municipal Securities Trust | | |
| |
| Statement of Investments, November 30, 2010 (unaudited) (continued) | | |
| |
| |
| Franklin California High Yield Municipal Fund | | Principal Amount | | Value |
| Municipal Bonds (continued) | | | | |
| California (continued) | | | | |
| Del Mar Race Track Authority Revenue, 5.00%, 8/15/25 | $ | 2,830,000 | $ | 2,685,585 |
| Del Paso Manor Water Dist Revenue COP, Phase I Important Project, 5.50%, 7/01/41 | | 3,050,000 | | 2,987,963 |
| Duarte RDA Tax Allocation, Capital Appreciation, Merged Redevelopment Project, ETM, | | | | |
| zero cpn., 12/01/28 | | 30,795,000 | | 12,935,132 |
| Eastern California Municipal Water District CFD No. 2003-15, Special Tax, Morgan Valley, | | | | |
| Series A, 5.20%, 9/01/37 | | 2,000,000 | | 1,669,880 |
| El Dorado County Special Tax, | | | | |
| CFD No. 1992-1, 6.125%, 9/01/16 | | 4,175,000 | | 4,180,678 |
| CFD No. 2001-1, 5.35%, 9/01/35 | | 1,900,000 | | 1,487,320 |
| CFD No. 2005-1, 5.00%, 9/01/21 | | 1,000,000 | | 868,380 |
| CFD No. 2005-1, 5.15%, 9/01/25 | | 2,075,000 | | 1,748,872 |
| CFD No. 2005-1, 5.25%, 9/01/35 | | 6,705,000 | | 5,184,708 |
| El Monte Water Authority Revenue, Refunding, AMBAC Insured, 5.00%, 9/01/31 | | 4,300,000 | | 3,827,774 |
| El Rancho USD, GO, Capital Appreciation, Election of 2003, NATL RE, FGIC Insured, | | | | |
| zero cpn., 8/01/29 | | 2,400,000 | | 716,544 |
| Escondido Revenue COP, Series A, NATL RE, FGIC Insured, 6.00%, 9/01/31 | | 750,000 | | 759,270 |
| Escondido Special Tax, CFD No. 01, Eureka, 5.15%, 9/01/36 | | 1,400,000 | | 1,098,314 |
| Fairfield CFD Special Tax, No. 3, North Cordelia General Improvements, 6.00%, | | | | |
| 9/01/32 | | 1,200,000 | | 1,227,432 |
| 9/01/37 | | 5,810,000 | | 5,920,971 |
| Foothill/Eastern Corridor Agency Toll Road Revenue, Capital Appreciation, Refunding, | | | | |
| zero cpn., | | | | |
| 1/15/26 | | 38,720,000 | | 13,079,616 |
| 1/15/30 | | 4,000,000 | | 1,019,520 |
| 1/15/31 | | 85,780,000 | | 20,118,841 |
| Golden State Tobacco Securitization Corp. Tobacco Settlement Revenue, | | | | |
| Asset-Backed, Senior Series A-1, 5.75%, 6/01/47 | | 24,500,000 | | 17,569,440 |
| Asset-Backed, Series A-2, Pre-Refunded, 7.90%, 6/01/42 | | 750,000 | | 874,538 |
| Asset-Backed, Series A-3, Pre-Refunded, 7.875%, 6/01/42 | | 6,400,000 | | 7,458,816 |
| Capital Appreciation, Asset-Backed, Refunding, Series C, second sub., zero cpn., | | | | |
| 6/01/47 | | 50,000,000 | | 1,194,000 |
| Enhanced, Asset-Backed, Series A, AGMC Insured, 5.00%, 6/01/35 | | 1,000,000 | | 929,100 |
| Hanford Joint UHSD, GO, Capital Appreciation, Election of 2004, Series B, AGMC Insured, | | | | |
| zero cpn., | | | | |
| 8/01/32 | | 3,635,000 | | 862,949 |
| 8/01/33 | | 3,705,000 | | 814,100 |
| 8/01/35 | | 4,120,000 | | 773,324 |
| Hartnell Community College District GO, Capital Appreciation, Election of 2002, Series D, | | | | |
| zero cpn., | | | | |
| 8/01/44 | | 30,000,000 | | 2,733,300 |
| 8/01/49 | | 10,000,000 | | 684,000 |
| Huntington Beach CFD Special Tax Revenue, Grand Coast Resort, 6.45%, 9/01/31 | | 5,000,000 | | 5,003,100 |
| aImperial County Special Tax, CFD No. 98-1, | | | | |
| 6.45%, 9/01/17 | | 1,530,000 | | 1,467,744 |
| 6.50%, 9/01/31 | | 5,705,000 | | 5,130,678 |
| Independent Cities Finance Authority Mobile Home Park Revenue, Lamplighter Salinas, | | | | |
| Series A, 6.25%, | | | | |
| 7/15/45 | | 2,465,000 | | 2,331,915 |
| 7/15/50 | | 2,000,000 | | 1,870,140 |
| |
| 30 | Semiannual Report | | | | |
| | | | |
| Franklin Municipal Securities Trust | | | |
| |
| Statement of Investments, November 30, 2010 (unaudited) (continued) | | |
| |
| |
| Franklin California High Yield Municipal Fund | Principal Amount | | Value |
| Municipal Bonds (continued) | | | | |
| California (continued) | | | | |
| Indio 1915 Act, GO, | | | | |
| AD No. 1999-1, 7.125%, 9/02/20 | $ | 1,615,000 | $ | 1,633,831 |
| AD No. 2001-1, 6.50%, 9/02/26 | | 3,835,000 | | 3,852,641 |
| Indio CFD Special Tax, | | | | |
| 5.00%, 9/01/25 | | 4,000,000 | | 3,177,160 |
| 5.10%, 9/01/30 | | 1,275,000 | | 935,009 |
| No. 04-3, Terra Lago, Improvement Area 1, 5.15%, 9/01/35 | | 1,275,000 | | 889,976 |
| Irvine 1915 Act Special Assessment, Limited Obligation, | | | | |
| AD No. 00-18, Group Five, 5.00%, 9/02/26 | | 1,275,000 | | 1,180,433 |
| AD No. 00-18, Group Five, Refunding, 5.00%, 9/02/29 | | 2,000,000 | | 1,696,600 |
| AD No. 03-19, Group Five, Refunding, 5.00%, 9/02/25 | | 1,500,000 | | 1,331,505 |
| AD No. 03-19, Group Four, 5.00%, 9/02/29 | | 1,500,000 | | 1,332,390 |
| AD No. 03-19, Group Three, 5.00%, 9/02/29 | | 1,110,000 | | 985,969 |
| AD No. 04-20, Group One, 5.00%, 9/02/25 | | 2,740,000 | | 2,607,905 |
| AD No. 04-20, Group One, 5.00%, 9/02/30 | | 10,975,000 | | 9,807,370 |
| Irvine Special Tax, CFD No. 2005-2, 5.25%, 9/01/36 | | 2,000,000 | | 1,785,200 |
| Irvine USD Special Tax, CFD, 6.70%, 9/01/35 | | 5,000,000 | | 5,269,900 |
| Jurupa Community Services District Special Tax, | | | | |
| CFD No. 7, Series A, 5.10%, 9/01/28 | | 2,695,000 | | 2,334,032 |
| CFD No. 7, Series A, 5.15%, 9/01/35 | | 3,690,000 | | 3,057,091 |
| CFD No. 11, Series A, 5.05%, 9/01/30 | | 2,495,000 | | 2,160,371 |
| CFD No. 11, Series A, 5.10%, 9/01/35 | | 2,065,000 | | 1,709,180 |
| CFD No. 12, Series A, 5.10%, 9/01/29 | | 2,000,000 | | 1,718,280 |
| CFD No. 12, Series A, 5.15%, 9/01/35 | | 3,000,000 | | 2,504,580 |
| CFD No. 17, Series A, 5.125%, 9/01/25 | | 1,350,000 | | 1,219,401 |
| CFD No. 17, Series A, 5.20%, 9/01/36 | | 2,825,000 | | 2,368,565 |
| CFD No. 18, Eastvale, Series A, 5.00%, 9/01/36 | | 2,400,000 | | 1,965,480 |
| CFD No. 19, Eastvale, Series A, 5.00%, 9/01/36 | | 1,500,000 | | 1,226,820 |
| CFD No. 30, Series A, 5.60%, 9/01/37 | | 1,000,000 | | 866,100 |
| Lafayette RDA Tax Allocation, 5.75%, 8/01/32 | | 1,000,000 | | 985,300 |
| Lake Elsinore 1915 Act Special Assessment, AD No. 93-1, Limited Obligation, Refunding, | | | | |
| 7.00%, 9/02/30 | | 7,910,000 | | 7,944,804 |
| Lake Elsinore Special Tax, | | | | |
| CFD No. 2003-2, Canyon Hills, Improvement Area A, Series A, 5.85%, 9/01/24 | | 1,035,000 | | 1,015,749 |
| CFD No. 2003-2, Canyon Hills, Improvement Area A, Series A, 5.95%, 9/01/34 | | 2,200,000 | | 2,051,830 |
| CFD No. 2004-3, Rosetta Canyon, Improvement Area No. 1, 5.10%, 9/01/22 | | 750,000 | | 696,600 |
| CFD No. 2004-3, Rosetta Canyon, Improvement Area No. 1, 5.15%, 9/01/25 | | 635,000 | | 576,243 |
| CFD No. 2004-3, Rosetta Canyon, Improvement Area No. 1, 5.25%, 9/01/30 | | 1,195,000 | | 1,033,639 |
| CFD No. 2004-3, Rosetta Canyon, Improvement Area No. 1, 5.25%, 9/01/35 | | 1,225,000 | | 1,031,083 |
| CFD No. 2004-3, Rosetta Canyon, Improvement Area No. 2, Series A, 5.20%, 9/01/26 | | 915,000 | | 822,914 |
| CFD No. 2004-3, Rosetta Canyon, Improvement Area No. 2, Series A, 5.25%, 9/01/37 | | 2,800,000 | | 2,274,048 |
| CFD No. 2005-2, Aberhill Ranch, Improvement Area A, Series A, 5.45%, 9/01/36 | | 5,695,000 | | 5,042,125 |
| CFD No. 2006-2, Viscaya, Series A, 5.40%, 9/01/36 | | 2,020,000 | | 1,706,193 |
| Lake Elsinore USD, CFD No. 2001-1 Special Tax, Pre-Refunded, 6.30%, 9/01/33 | | 4,370,000 | | 4,648,893 |
| Lake Hemet Municipal Water District COP, | | | | |
| 5.00%, 9/10/30 | | 2,350,000 | | 2,163,950 |
| 5.25%, 9/10/40 | | 2,935,000 | | 2,705,395 |
| Lancaster Financing Authority Tax Allocation Revenue, Redevelopment Project Nos. 5 and 6, | | | | |
| Refunding, 5.40%, 2/01/29 | | 500,000 | | 476,065 |
| |
| | | Semiannual Report | 31 |
| | | | |
| Franklin Municipal Securities Trust | | | |
| |
| Statement of Investments, November 30, 2010 (unaudited) (continued) | | |
| |
| |
| Franklin California High Yield Municipal Fund | Principal Amount | | Value |
| Municipal Bonds (continued) | | | | |
| California (continued) | | | | |
| Lancaster RDA Tax Allocation, Combined Redevelopment Project Areas, 6.875%, | | | | |
| 8/01/34 | $ | 2,000,000 | $ | 2,214,860 |
| 8/01/39 | | 2,000,000 | | 2,188,720 |
| Lee Lake Water District CFD No. 1 Special Tax, Sycamore Creek, | | | | |
| 6.50%, 9/01/24 | | 1,000,000 | | 985,610 |
| 5.25%, 9/01/28 | | 1,750,000 | | 1,480,658 |
| 5.30%, 9/01/35 | | 3,300,000 | | 2,587,629 |
| Lee Lake Water District CFD No. 3 Special Tax, Retreat, 5.875%, 9/01/27 | | 3,000,000 | | 2,713,620 |
| Lemon Grove School District GO, Capital Appreciation, Election of 2008, Series B, | | | | |
| AGMC Insured, zero cpn. to 8/01/28, 6.10% thereafter, 8/01/45 | | 6,500,000 | | 1,987,180 |
| Lincoln CFD No. 2003-1 Special Tax, Pre-Refunded, | | | | |
| 5.90%, 9/01/24 | | 1,780,000 | | 2,048,549 |
| 5.95%, 9/01/28 | | 4,450,000 | | 5,127,379 |
| 6.00%, 9/01/34 | | 3,520,000 | | 4,060,566 |
| Lincoln PFA Special Tax Revenue, Sub Series B, 5.00%, 9/01/34 | | 3,410,000 | | 2,742,561 |
| Long Beach Bond Finance Authority Natural Gas Purchase Revenue, Series A, | | | | |
| 5.00%, 11/15/29 | | 9,630,000 | | 9,154,374 |
| 5.50%, 11/15/37 | | 25,000,000 | | 24,415,750 |
| Los Angeles County Sanitation Districts Financing Authority Revenue, Capital Projects, | | | | |
| District No. 14, sub. bonds, Refunding, Series B, NATL RE, FGIC Insured, 5.00%, | | | | |
| 10/01/28 | | 6,120,000 | | 6,243,073 |
| Los Angeles County Schools Regionalized Business Services Corp. COP, Pooled Financing | | | | |
| Program, Series C, | | | | |
| 5.00%, 6/01/30 | | 3,000,000 | | 2,808,330 |
| 5.25%, 6/01/35 | | 3,580,000 | | 3,337,455 |
| aLos Angeles MFR, Refunding, Series J-2C, 8.50%, 1/01/24 | | 600,000 | | 548,850 |
| Lynwood PFA Tax Allocation, Alameda Project Area, 6.30%, 9/01/24 | | 960,000 | | 962,304 |
| M-S-R Energy Authority Gas Revenue, Series B, 6.50%, 11/01/39 | | 7,500,000 | | 8,175,450 |
| Madera PFA Water Revenue, 5.00%, 3/01/38 | | 3,000,000 | | 2,765,400 |
| Menifee USD Special Tax, CFD No. 2002-2, | | | | |
| 6.05%, 9/01/26 | | 990,000 | | 966,359 |
| 6.10%, 9/01/34 | | 3,675,000 | | 3,472,507 |
| Merced CFD No. 2005-1 Special Tax, Improvement Area No. 1, 5.30%, 9/01/36 | | 2,400,000 | | 1,378,560 |
| Merced RDA Tax Allocation, Merced Gateways Redevelopment Project, Series A, 6.50%, | | | | |
| 9/01/39 | | 6,250,000 | | 6,500,437 |
| Moorpark CFD No. 2004-1 Special Tax, Moorpark Highlands, | | | | |
| 5.25%, 9/01/26 | | 1,350,000 | | 1,192,361 |
| 5.30%, 9/01/38 | | 3,025,000 | | 2,503,974 |
| Moreland School District GO, Election of 2002, Series D, | | | | |
| FGIC Insured, zero cpn., 8/01/34 | | 4,405,000 | | 1,322,645 |
| FGIC Insured, zero cpn., 8/01/37 | | 5,700,000 | | 1,444,665 |
| NATL RE, FGIC Insured, zero cpn., 8/01/30 | | 3,400,000 | | 972,230 |
| NATL RE, FGIC Insured, zero cpn., 8/01/31 | | 2,000,000 | | 519,400 |
| NATL RE, FGIC Insured, zero cpn., 8/01/32 | | 4,405,000 | | 1,074,644 |
| Moreno Valley USD Special Tax, | | | | |
| CFD No. 2004-6, 5.00%, 9/01/22 | | 2,105,000 | | 1,868,840 |
| CFD No. 2004-6, 5.10%, 9/01/28 | | 2,000,000 | | 1,670,500 |
| CFD No. 2004-6, 5.20%, 9/01/36 | | 5,000,000 | | 3,967,300 |
| CFD No. 2005-2, 5.00%, 9/01/36 | | 815,000 | | 639,392 |
| |
| 32 | Semiannual Report | | | | |
Franklin Municipal Securities Trust
Statement of Investments, November 30, 2010 (unaudited) (continued)
| | | | |
| Franklin California High Yield Municipal Fund | | Principal Amount | | Value |
| Municipal Bonds (continued) | | | | |
| California (continued) | | | | |
| Murrieta 1915 Act Special Tax, CFD No. 2000-1, 6.375%, 9/01/30 | $ | 4,100,000 | $ | 4,069,947 |
| Murrieta CFD No. 2000-2 Special Tax, The Oaks, | | | | |
| Improvement Area A, 5.90%, 9/01/27 | | 2,000,000 | | 1,909,780 |
| Improvement Area A, 6.00%, 9/01/34 | | 3,570,000 | | 3,286,471 |
| Improvement Area B, 6.00%, 9/01/27 | | 1,285,000 | | 1,254,391 |
| Improvement Area B, 6.00%, 9/01/34 | | 1,000,000 | | 924,340 |
| Improvement Area B, 6.00%, 9/01/34 | | 2,745,000 | | 2,535,913 |
| Murrieta CFD No. 2001-1 Special Tax, Bluestone, Improvement Area A, 6.20%, 9/01/25 | | 2,105,000 | | 2,109,484 |
| Murrieta CFD No. 2003-2 Special Tax, Blackmore Ranch, 6.10%, 9/01/34 | | 2,000,000 | | 1,899,000 |
| Murrieta CFD No. 2004-1 Special Tax, Bremerton, 5.625%, 9/01/34 | | 700,000 | | 634,942 |
| Norco Special Tax, CFD No. 02-1, 6.50%, 3/01/33 | | 1,145,000 | | 1,147,794 |
| North Natomas CFD Special Tax, No. 4, Series B, 6.375%, 9/01/31 | | 4,300,000 | | 4,300,043 |
| Oceanside CFD No. 2001-1 Special Tax, Morro Hills Development, 5.50%, 9/01/34 | | 3,030,000 | | 2,594,074 |
| Orange County 1915 Act Special Assessment, Limited Obligation, AD No. 01-1-GP1, | | | | |
| 5.00%, 9/02/28 | | 3,000,000 | | 2,719,890 |
| 5.10%, 9/02/33 | | 2,000,000 | | 1,751,080 |
| Oro Grande Elementary School District COP, 5.875%, 9/15/37 | | 14,000,000 | | 13,320,020 |
| Oxnard Harbor District Revenue, | | | | |
| Series A, 5.75%, 8/01/20 | | 1,110,000 | | 1,133,465 |
| Series B, 6.00%, 8/01/24 | | 6,000,000 | | 6,174,840 |
| Oxnard Special Tax, CFD No. 3, Seabridge, 5.00%, 9/01/35 | | 4,995,000 | | 4,131,714 |
| Palomar Pomerado Health Care District COP, | | | | |
| 6.00%, 11/01/30 | | 10,000,000 | | 9,794,800 |
| 6.75%, 11/01/39 | | 10,000,000 | | 10,302,500 |
| Paso Robles Joint USD, GO, Capital Appreciation, Election of 2006, Series A, zero cpn., | | | | |
| 9/01/45 | | 15,000,000 | | 1,464,300 |
| Peralta Community College District GO, Election of 2006, Series C, 5.00%, 8/01/39 | | 2,200,000 | | 2,160,400 |
| Perris CFD No. 05-2 Special Tax, Harmony Grove, Series A, | | | | |
| 5.00%, 9/01/21 | | 1,130,000 | | 1,032,131 |
| 5.20%, 9/01/24 | | 1,505,000 | | 1,359,241 |
| 5.25%, 9/01/29 | | 3,585,000 | | 3,027,568 |
| 5.30%, 9/01/35 | | 4,200,000 | | 3,463,152 |
| Perris CFD No. 2001-1 Special Tax, | | | | |
| Improvement Area No. 4, May Farms, Series A, 5.00%, 9/01/25 | | 1,415,000 | | 1,159,423 |
| Improvement Area No. 4, May Farms, Series A, 5.10%, 9/01/30 | | 865,000 | | 692,043 |
| Improvement Area No. 4, May Farms, Series A, 5.15%, 9/01/35 | | 1,075,000 | | 849,927 |
| Improvement Area No. 5, May Ranch, Series A, 5.00%, 9/01/26 | | 565,000 | | 466,617 |
| Improvement Area No. 5, May Ranch, Series A, 5.00%, 9/01/37 | | 1,540,000 | | 1,163,716 |
| Perris CFD No. 2002-1 Special Tax, Series A, | | | | |
| 6.375%, 9/01/23 | | 1,415,000 | | 1,418,552 |
| 6.50%, 9/01/29 | | 1,970,000 | | 1,961,293 |
| 6.50%, 9/01/33 | | 2,035,000 | | 2,003,885 |
| Perris CFD No. 2004-3 Special Tax, Improvement Area No. 2, Series A, 5.30%, 9/01/35 | | 1,370,000 | | 1,194,626 |
| Perris PFA Local Agency Revenue, Series A, 6.25%, 9/01/33 | | 2,955,000 | | 2,817,031 |
| Perris PFAR Tax Allocation, | | | | |
| 5.30%, 10/01/26 | | 2,000,000 | | 1,814,320 |
| 5.35%, 10/01/36 | | 4,010,000 | | 3,413,994 |
| Housing Loan, Series A, 6.125%, 10/01/40 | | 3,135,000 | | 3,093,242 |
Semiannual Report | 33
Franklin Municipal Securities Trust
Statement of Investments, November 30, 2010 (unaudited) (continued)
| | | | |
| Franklin California High Yield Municipal Fund | | Principal Amount | | Value |
| Municipal Bonds (continued) | | | | |
| California (continued) | | | | |
| Pico Rivera Water Authority Revenue, Refunding, Series A, 6.25%, 12/01/32 | $ | 7,250,000 | $ | 7,105,797 |
| Pomona USD, GO, Election of 2008, Series A, Assured Guaranty, 5.25%, 8/01/33 | | 3,500,000 | | 3,560,655 |
| Poway USD Special Tax, | | | | |
| CFD No. 6, 4S Ranch, 5.125%, 9/01/35 | | 6,000,000 | | 5,456,220 |
| CFD No. 6, Improvement Area B, 5.125%, 9/01/36 | | 5,035,000 | | 4,533,464 |
| CFD No. 14, Area A, 5.125%, 9/01/26 | | 1,770,000 | | 1,613,479 |
| CFD No. 14, Area A, 5.25%, 9/01/36 | | 5,225,000 | | 4,418,991 |
| CFD No. 14, Del Sur, 5.125%, 9/01/26 | | 2,200,000 | | 2,005,454 |
| Rancho Cordova CFD No. 2003-1 Special Tax, Sunridge Anatolia, | | | | |
| 5.25%, 9/01/25 | | 2,235,000 | | 2,023,480 |
| 5.375%, 9/01/30 | | 1,650,000 | | 1,417,169 |
| 5.375%, 9/01/37 | | 7,130,000 | | 5,915,262 |
| 5.50%, 9/01/37 | | 2,635,000 | | 2,220,857 |
| Rancho Mirage Joint Powers Financing Authority Revenue, Eisenhower Medical Center, | | | | |
| Series A, 5.00%, 7/01/47 | | 5,000,000 | | 4,098,650 |
| Richland School District GO, Capital Appreciation, Election of 2008, Refunding, Series C, | | | | |
| AGMC Insured, zero cpn., 8/01/49 | | 17,000,000 | | 1,055,190 |
| Richmond Joint Powers Financing Authority Revenue, Reassessment, Refunding, Series A, | | | | |
| AMBAC Insured, 5.00%, 9/02/30 | | 1,085,000 | | 933,360 |
| Rio Elementary School District Special Tax, CFD No. 1, 5.20%, 9/01/35 | | 5,000,000 | | 3,948,000 |
| Riverbank USD, GO, Election of 2005, Series B, Assured Guaranty, zero cpn., | | | | |
| 8/01/38 | | 6,690,000 | | 1,021,764 |
| 8/01/43 | | 8,750,000 | | 936,600 |
| Riverside County RDA Tax Allocation, Housing, Series A, 6.00%, 10/01/39 | | 3,000,000 | | 2,947,230 |
| Riverside County Special Tax, CFD No. 87-5, senior lien, Refunding, Series A, 7.00%, | | | | |
| 9/01/13 | | 3,225,000 | | 3,240,286 |
| Riverside USD Special Tax, | | | | |
| CFD No. 13, Improvement Area 1, 5.375%, 9/01/34 | | 2,320,000 | | 1,902,423 |
| CFD No. 14, Series A, 5.45%, 9/01/35 | | 2,060,000 | | 1,809,092 |
| CFD No. 15, Improvement Area 1, 5.45%, 9/01/25 | | 2,970,000 | | 2,732,222 |
| CFD No. 15, Improvement Area 1, 5.55%, 9/01/30 | | 2,390,000 | | 2,122,224 |
| CFD No. 15, Improvement Area 1, 5.60%, 9/01/34 | | 2,000,000 | | 1,748,640 |
| CFD No. 15, Series A, 5.15%, 9/01/25 | | 1,730,000 | | 1,582,518 |
| CFD No. 15, Series A, 5.25%, 9/01/30 | | 1,230,000 | | 1,083,655 |
| CFD No. 15, Series A, 5.25%, 9/01/35 | | 1,500,000 | | 1,272,255 |
| CFD No. 17, Aldea, 5.125%, 9/01/35 | | 1,425,000 | | 1,196,060 |
| CFD No. 18, 5.00%, 9/01/34 | | 1,125,000 | | 929,183 |
| CFD No. 22, 5.25%, 9/01/35 | | 1,535,000 | | 1,283,828 |
| Road 17 Levee Area PFA Assessment Revenue, Road 17 Levee Improvement Project, 6.75%, | | | | |
| 9/01/29 | | 2,630,000 | | 2,771,520 |
| Romoland School District Special Tax, CFD No. 1, | | | | |
| Improvement Area 1, 5.45%, 9/01/38 | | 3,215,000 | | 2,847,011 |
| Improvement Area 2, 5.375%, 9/01/38 | | 3,070,000 | | 2,533,456 |
| Roseville Special Tax, CFD No. 1, | | | | |
| Fiddyment Ranch, 5.00%, 9/01/17 | | 1,495,000 | | 1,455,682 |
| Fiddyment Ranch, 5.00%, 9/01/19 | | 980,000 | | 929,951 |
| Fiddyment Ranch, 5.125%, 9/01/21 | | 980,000 | | 917,133 |
| Fiddyment Ranch, 5.00%, 9/01/24 | | 1,010,000 | | 886,113 |
34 | Semiannual Report
Franklin Municipal Securities Trust
Statement of Investments, November 30, 2010 (unaudited) (continued)
| | | | |
| Franklin California High Yield Municipal Fund | | Principal Amount | | Value |
| Municipal Bonds (continued) | | | | |
| California (continued) | | | | |
| Roseville Special Tax, CFD No. 1, (continued) | | | | |
| Fiddyment Ranch, 5.00%, 9/01/25 | $ | 1,020,000 | $ | 895,540 |
| Fiddyment Ranch, 5.125%, 9/01/26 | | 4,945,000 | | 4,234,305 |
| Fiddyment Ranch, 5.25%, 9/01/36 | | 7,880,000 | | 6,445,052 |
| Longmeadow, 5.00%, 9/01/36 | | 2,370,000 | | 1,805,513 |
| Stone Point, 6.375%, 9/01/24 | | 1,750,000 | | 1,736,367 |
| Stone Point, 6.375%, 9/01/28 | | 2,500,000 | | 2,334,350 |
| Stoneridge, Pre-Refunded, 6.20%, 9/01/21 | | 1,250,000 | | 1,328,850 |
| Stoneridge, Pre-Refunded, 6.30%, 9/01/31 | | 1,500,000 | | 1,595,730 |
| Westpark, 5.15%, 9/01/30 | | 5,500,000 | | 4,773,725 |
| Westpark, 5.20%, 9/01/36 | | 4,500,000 | | 3,724,380 |
| Roseville Westpark CFD No. 1 Special Tax, Public Facilities, | | | | |
| 5.20%, 9/01/26 | | 1,000,000 | | 892,890 |
| 5.25%, 9/01/37 | | 1,600,000 | | 1,268,176 |
| Rowland USD, GO, Capital Appreciation, Election of 2006, Series B, zero cpn., | | | | |
| 8/01/34 | | 5,000,000 | | 990,650 |
| 8/01/39 | | 15,000,000 | | 2,076,150 |
| 8/01/42 | | 10,750,000 | | 1,198,733 |
| Sacramento County Airport System Revenue, senior bond, Series B, AGMC Insured, 5.25%, | | | | |
| 7/01/39 | | 10,000,000 | | 9,613,600 |
| Sacramento County Special Tax, CFD No. 1, Refunding, 6.30%, 9/01/21 | | 1,575,000 | | 1,577,363 |
| Sacramento Special Tax, North Natomas CFD No. 97-01, Refunding, 5.10%, 9/01/35 | | 1,515,000 | | 1,290,144 |
| San Bernardino Community College District GO, Election of 2008, Series A, zero cpn., | | | | |
| 8/01/44 | | 12,495,000 | | 1,337,340 |
| San Diego Public Facilities Financing Authority Lease Revenue, Master Refunding Project, | | | | |
| Series A, 5.25%, 3/01/40 | | 7,160,000 | | 6,589,062 |
| San Diego RDA Tax Allocation, Capital Appreciation, | | | | |
| Refunding, Series B, zero cpn., 9/01/15 | | 6,810,000 | | 5,539,458 |
| Refunding, Series B, zero cpn., 9/01/16 | | 1,500,000 | | 1,154,475 |
| Refunding, Series B, zero cpn., 9/01/19 | | 1,800,000 | | 1,110,348 |
| Refunding, Series B, zero cpn., 9/01/20 | | 1,800,000 | | 1,034,370 |
| Refunding, Series B, zero cpn., 9/01/21 | | 1,800,000 | | 959,490 |
| Refunding, Series B, zero cpn., 9/01/22 | | 1,900,000 | | 942,514 |
| Refunding, Series B, zero cpn., 9/01/23 | | 1,900,000 | | 880,745 |
| Refunding, Series B, zero cpn., 9/01/24 | | 1,900,000 | | 822,472 |
| Refunding, Series B, zero cpn., 9/01/28 | | 1,900,000 | | 610,679 |
| Series B, zero cpn., 9/01/25 | | 1,900,000 | | 765,092 |
| Series B, zero cpn., 9/01/26 | | 1,900,000 | | 712,272 |
| Series B, zero cpn., 9/01/27 | | 1,900,000 | | 659,623 |
| San Diego RDA Tax Allocation Revenue, | | | | |
| City Heights Redevelopment, Series A, 5.625%, 9/01/40 | | 2,315,000 | | 2,256,060 |
| Naval Training Center, Series A, 5.50%, 9/01/30 | | 1,000,000 | | 984,530 |
| Naval Training Center, Series A, 5.75%, 9/01/40 | | 3,000,000 | | 2,960,550 |
| San Diego USD, GO, Capital Appreciation Bond, | | | | |
| Election of 2008, Series A, zero cpn. to 7/01/19, 6.00% thereafter, 7/01/33 | | 10,000,000 | | 5,969,300 |
| Series C, zero cpn. to 7/01/30, 6.625% thereafter, 7/01/47 | | 26,025,000 | | 7,447,834 |
| San Francisco City and County Redevelopment Financing Authority Tax Allocation Revenue, | | | | |
| Mission Bay South Redevelopment, Series D, 6.625%, 8/01/39 | | 2,265,000 | | 2,389,009 |
Semiannual Report | 35
Franklin Municipal Securities Trust
Statement of Investments, November 30, 2010 (unaudited) (continued)
| | | | |
| Franklin California High Yield Municipal Fund | | Principal Amount | | Value |
| Municipal Bonds (continued) | | | | |
| California (continued) | | | | |
| San Joaquin County Public Facilities Financing Corp. Revenue COP, Wastewater Conveyance | | | | |
| Project, 6.00%, 8/01/37 | $ | 1,000,000 | $ | 874,430 |
| San Joaquin Delta Community College District GO, Election of 2004, Capital Appreciation, | | | | |
| Series B, AGMC Insured, zero cpn., 8/01/30 | | 3,900,000 | | 1,092,117 |
| San Joaquin Hills Transportation Corridor Agency Toll Road Revenue, | | | | |
| Capital Appreciation, Refunding, Series A, 5.60%, 1/15/16 | | 4,500,000 | | 4,585,725 |
| Capital Appreciation, Refunding, Series A, 5.70%, 1/15/19 | | 3,000,000 | | 2,972,940 |
| Capital Appreciation, Refunding, Series A, 5.75%, 1/15/21 | | 24,750,000 | | 24,229,012 |
| Capital Appreciation, Refunding, Series A, NATL Insured, zero cpn., 1/15/26 | | 19,475,000 | | 5,745,904 |
| Capital Appreciation, Refunding, Series A, NATL Insured, zero cpn., 1/15/32 | | 50,225,000 | | 9,017,899 |
| junior lien, ETM, zero cpn., 1/01/28 | | 19,150,000 | | 9,369,329 |
| Refunding, Series A, 5.50%, 1/15/28 | | 3,645,000 | | 3,250,830 |
| senior lien, 5.00%, 1/01/33 | | 32,865,000 | | 26,246,646 |
| San Marcos Public Facilities Authority Special Tax Revenue, | | | | |
| Refunding, Series A, 5.65%, 9/01/36 | | 5,180,000 | | 4,747,107 |
| Series A, 5.05%, 9/01/38 | | 3,250,000 | | 2,557,522 |
| San Marcos RDA Tax Allocation, Affordable Housing Project, Series A, 5.65%, 10/01/28 | | 1,935,000 | | 1,935,464 |
| Santa Cruz County RDA Tax Allocation, 6.625%, 9/01/29 | | 2,650,000 | | 2,879,384 |
| Saugus USD, CFD No. 2005-4 Special Tax, 5.30%, 9/01/36 | | 2,000,000 | | 1,557,420 |
| Selma PFA Lease Revenue, Refunding, 7.00%, 2/01/40 | | 3,265,000 | | 3,036,058 |
| Sierra View Local Health Care District Revenue, 5.25%, 7/01/32 | | 3,000,000 | | 2,894,760 |
| Simi Valley 1915 Act Special Assessment, AD No. 98-1, Madera, 7.30%, 9/02/24 | | 2,135,000 | | 2,151,439 |
| Siskiyou Union High School District GO, Capital Appreciation, Election of 2008, Series B, | | | | |
| AGMC Insured, zero cpn., 8/01/49 | | 15,015,000 | | 1,004,203 |
| Southern California Public Power Authority Transmission Project Revenue, Southern | | | | |
| Transmission Project, 6.125%, 7/01/18 | | 50,000 | | 50,188 |
| Stockton 1915 Act Special Assessment, Limited Obligation, Mosher AD No. 2003-2, | | | | |
| 6.20%, 9/02/23 | | 2,955,000 | | 2,979,083 |
| 6.30%, 9/02/33 | | 3,390,000 | | 3,337,285 |
| Stockton PFA Lease Revenue, Capital Improvement Projects, Series A, 7.00%, 9/01/38 | | 7,000,000 | | 7,178,150 |
| Stockton Special Tax, Spanos Park West CFD No. 2001-1, Pre-Refunded, 6.25%, 9/01/25 | | 3,500,000 | | 3,904,670 |
| Susanville PFAR, Utility Enterprises Project, Refunding, | | | | |
| Series B, 5.50%, 6/01/30 | | 1,185,000 | | 1,085,638 |
| Series B, 6.00%, 6/01/45 | | 6,180,000 | | 5,772,923 |
| Sub Series B, 5.875%, 6/01/35 | | 1,660,000 | | 1,543,269 |
| Susanville School District GO, Capital Appreciation, Election of 2008, Assured Guaranty, | | | | |
| zero cpn., 8/01/49 | | 17,505,000 | | 1,238,304 |
| Tehachapi RDA Tax Allocation, Tehachapi Redevelopment Project, Radian Insured, 5.25%, | | | | |
| 12/01/37 | | 625,000 | | 563,481 |
| Temecula RDA Tax Allocation Revenue, sub. lien, Escrow, Redevelopment Project No. 1, | | | | |
| 5.625%, 12/15/38 | | 2,000,000 | | 1,770,840 |
| Temecula Valley USD, CFD No. 2005-1 Special Tax, 5.00%, 9/01/36 | | 1,000,000 | | 834,240 |
| Tobacco Securitization Authority Northern California Tobacco Settlement Revenue, | | | | |
| Capital Appreciation, Asset-Backed, Series A-2, 5.40%, 6/01/27 | | 1,250,000 | | 1,153,688 |
| Series A-1, 5.375%, 6/01/38 | | 5,000,000 | | 3,761,150 |
| Series A-1, 5.50%, 6/01/45 | | 1,560,000 | | 1,078,459 |
| Tobacco Securitization Authority Southern California Tobacco Settlement Revenue, | | | | |
| Second Sub. Capital Appreciation Bond, Refunding, Series C, zero cpn., 6/01/46 | | 25,000,000 | | 717,000 |
36 | Semiannual Report
Franklin Municipal Securities Trust
Statement of Investments, November 30, 2010 (unaudited) (continued)
| | | | |
| Franklin California High Yield Municipal Fund | | Principal Amount | | Value |
| Municipal Bonds (continued) | | | | |
| California (continued) | | | | |
| Torrance USD, GO, Capital Appreciation, Election of 2008, Measure Z, Series B-1, zero cpn., | | | | |
| 8/01/34 | $ | 5,640,000 | $ | 1,196,864 |
| Truckee-Donner PUD Special Tax, CFD No. 04-1, | | | | |
| 5.75%, 9/01/29 | | 2,975,000 | | 2,439,589 |
| 5.80%, 9/01/35 | | 4,630,000 | | 3,680,109 |
| Truckee-Donner PUD Special Tax Allocation, Special Tax Bonds, | | | | |
| 5.20%, 9/01/25 | | 3,000,000 | | 2,399,460 |
| 5.25%, 9/01/30 | | 5,050,000 | | 3,854,362 |
| 5.30%, 9/01/35 | | 7,395,000 | | 5,470,377 |
| Tulare RDA Tax Allocation, Merged Tulare Redevelopment, Series A, 6.25%, 8/01/40 | | 3,540,000 | | 3,483,325 |
| Tustin CFD No. 07-01 Special Tax, Tustin Legacy, 6.00%, 9/01/37 | | 2,100,000 | | 2,021,145 |
| Tustin USD Special Tax, | | | | |
| 5.75%, 9/01/30 | | 1,000,000 | | 1,003,600 |
| 6.00%, 9/01/40 | | 3,000,000 | | 3,017,250 |
| Upland CFD No. 2003-2 Special Tax, San Antonio, Improvement Area 1, Series A, | | | | |
| 5.90%, 9/01/24 | | 2,380,000 | | 2,375,311 |
| 6.00%, 9/01/34 | | 2,000,000 | | 1,902,780 |
| Vallejo RDA Tax Allocation, Housing Set-Aside, Refunding, Series A, 7.00%, 10/01/31 | | 4,425,000 | | 4,434,469 |
| Valley Sanitary District 1915 Act Special Assessment, AD No. 04, Valley Sanitary District, | | | | |
| Limited Obligation, | | | | |
| 5.00%, 9/02/25 | | 1,050,000 | | 860,328 |
| 5.20%, 9/02/30 | | 1,355,000 | | 1,098,444 |
| Victor Valley Community College District GO, Capital Appreciation, Election of 2002, Series C, | | | | |
| zero cpn., 6/01/49 | | 11,940,000 | | 823,144 |
| West Kern Community College District GO, Capital Appreciation, Election of 2004, Series B, | | | | |
| XLCA Insured, zero cpn., | | | | |
| 11/01/25 | | 2,435,000 | | 955,932 |
| 11/01/26 | | 2,480,000 | | 899,050 |
| 11/01/27 | | 1,400,000 | | 460,824 |
| 11/01/28 | | 1,445,000 | | 440,017 |
| 11/01/29 | | 1,485,000 | | 417,775 |
| West Sacramento Special Tax, | | | | |
| CFD No. 16, Pre-Refunded, 5.90%, 9/01/23 | | 1,000,000 | | 1,058,900 |
| CFD No. 20, 5.125%, 9/01/25 | | 500,000 | | 429,410 |
| CFD No. 20, 5.30%, 9/01/35 | | 1,740,000 | | 1,447,419 |
| Westside USD, CFD No. 2005-3 Special Tax, 5.00%, | | | | |
| 9/01/26 | | 700,000 | | 592,494 |
| 9/01/36 | | 2,080,000 | | 1,657,323 |
| William S. Hart UHSD, CFD No. 2005-1 Special Tax, 5.30%, 9/01/36 | | 2,500,000 | | 1,818,800 |
| Woodland Special Tax, CFD No. 1, | | | | |
| 6.00%, 9/01/28 | | 5,000,000 | | 4,445,150 |
| 6.25%, 9/01/34 | | 6,615,000 | | 5,994,976 |
| Yucca Valley RDA Tax Allocation, Yucca Valley Redevelopment Project No. 1, | | | | |
| 5.50%, 6/01/28 | | 2,110,000 | | 2,100,610 |
| 5.75%, 6/01/38 | | 5,485,000 | | 5,322,973 |
| | | | | 1,346,099,982 |
Semiannual Report | 37
Franklin Municipal Securities Trust
Statement of Investments, November 30, 2010 (unaudited) (continued)
| | | | |
| Franklin California High Yield Municipal Fund | | Principal Amount | | Value |
| Municipal Bonds (continued) | | | | |
| U.S. Territories 2.8% | | | | |
| Guam 1.5% | | | | |
| Guam Government GO, | | | | |
| Refunding, Series A, 5.00%, 11/15/23 | $ | 7,245,000 | $ | 6,867,318 |
| Refunding, Series A, 5.25%, 11/15/37 | | 6,500,000 | | 5,567,770 |
| Series A, 7.00%, 11/15/39 | | 5,000,000 | | 5,403,250 |
| Guam Government Waterworks Authority Water and Wastewater System Revenue, 5.625%, | | | | |
| 7/01/40 | | 4,000,000 | | 3,857,560 |
| | | | | 21,695,898 |
| Northern Mariana Islands 0.1% | | | | |
| Northern Mariana Islands Commonwealth Ports Authority Seaport Revenue, Series A, 6.60%, | | | | |
| 3/15/28 | | 1,620,000 | | 1,547,878 |
| Puerto Rico 1.2% | | | | |
| Puerto Rico Commonwealth Aqueduct and Sewer Authority Revenue, senior lien, Series A, | | | | |
| 6.00%, 7/01/44 | | 5,000,000 | | 5,128,050 |
| Puerto Rico Commonwealth GO, | | | | |
| Public Improvement, Refunding, Series A, 5.50%, 7/01/32 | | 10,000,000 | | 10,104,400 |
| Series A, 5.00%, 7/01/24 | | 2,650,000 | | 2,649,894 |
| | | | | 17,882,344 |
| Total U.S. Territories | | | | 41,126,120 |
| Total Municipal Bonds before Short Term Investments | | | | |
| (Cost $1,471,576,385) | | | | 1,387,226,102 |
| Short Term Investments 5.5% | | | | |
| Municipal Bonds 5.5% | | | | |
| California 4.5% | | | | |
| bCalifornia Health Facilities Financing Authority Revenue, Children’s Hospital Los Angeles, | | | | |
| Series B, Daily VRDN and Put, 0.31%, 7/01/42 | | 2,400,000 | | 2,400,000 |
| bCalifornia Infrastructure and Economic Development Bank Revenue, | | | | |
| Asian Art Museum Foundation, NATL Insured, Daily VRDN and Put, 0.40%, 6/01/34 | | 9,900,000 | | 9,900,000 |
| Pacific Gas and Electric Co., Refunding, Series A, Daily VRDN and Put, 0.27%, | | | | |
| 11/01/26 | | 1,500,000 | | 1,500,000 |
| bCalifornia PCFA, PCR, Pacific Gas and Electric Co., Refunding, Series F, Daily VRDN and Put, | | | | |
| 0.24%, 11/01/26 | | 7,500,000 | | 7,500,000 |
| bCalifornia State Economic Recovery GO, | | | | |
| Series C-3, Daily VRDN and Put, 0.26%, 7/01/23 | | 3,000,000 | | 3,000,000 |
| Series C-4, Daily VRDN and Put, 0.24%, 7/01/23 | | 2,000,000 | | 2,000,000 |
| bCalifornia State GO, Kindergarten, Series B3, Daily VRDN and Put, 0.24%, 5/01/34 | | 4,155,000 | | 4,155,000 |
| bCalifornia Statewide CDA Revenue, Los Angeles County Museum of Art Project, Refunding, | | | | |
| Series D, Daily VRDN and Put, 0.26%, 12/01/34 | | 6,675,000 | | 6,675,000 |
| bIrvine 1915 Act Special Assessment, Limited Obligation, AD No. 93-14, Daily VRDN and Put, | | | | |
| 0.26%, 9/02/25 | | 6,400,000 | | 6,400,000 |
| bIrvine Ranch Water District Revenue, ID, Consolidated, Series B, Daily VRDN and Put, 0.26%, | | | | |
| 10/01/41 | | 8,000,000 | | 8,000,000 |
| bLos Angeles Department of Water and Power Revenue, Refunding, Series B-3, Daily VRDN and | | | | |
| Put, 0.28%, 7/01/34 | | 3,900,000 | | 3,900,000 |
38 | Semiannual Report
Franklin Municipal Securities Trust
Statement of Investments, November 30, 2010 (unaudited) (continued)
| | | | |
| Franklin California High Yield Municipal Fund | | Principal Amount | | Value |
| Short Term Investments (continued) | | | | |
| Municipal Bonds (continued) | | | | |
| California (continued) | | | | |
| bSouthern California Public Power Authority Power Project Revenue, Mead-Adelanto Project, | | | | |
| Refunding, Series A, Daily VRDN and Put, 0.26%, 7/01/20 | $ | 1,000,000 | $ | 1,000,000 |
| bUniversity of California Regents Medical Center Pooled Revenue , Refunding, Series B-1, | | | | |
| Daily VRDN and Put, 0.28%, 5/15/32 | | 9,950,000 | | 9,950,000 |
| | | | | 66,380,000 |
| U.S. Territories 1.0% | | | | |
| Puerto Rico 1.0% | | | | |
| bPuerto Rico Commonwealth Revenue, BAN, Weekly VRDN and Put, 2. 00%, 4/07/11 | | 15,000,000 | | 15,000,000 |
| Total Short Term Investments (Cost $81,380,000) | | | | 81,380,000 |
| Total Investments (Cost $1,552,956,385) 99.0% | | | | 1,468,606,102 |
| Other Assets, less Liabilities 1.0% | | | | 15,200,033 |
| Net Assets 100.0% | | | $ | 1,483,806,135 |
See Abbreviations on page 58.
aSecurity has been deemed illiquid because it may not be able to be sold within seven days. At November 30, 2010, the aggregate value of these securities was $7,147,272, representing 0.48% of net assets. bVariable rate demand notes (VRDNs) are tax-exempt obligations which contain a floating or variable interest rate adjustment formula and an unconditional right of demand to receive payment of the principal balance plus accrued interest at specified dates. The coupon rate shown represents the rate at period end.
Semiannual Report | The accompanying notes are an integral part of these financial statements. | 39
| | | | | | | | | | | | | | | | | | |
| Franklin Municipal Securities Trust | | | | | | | |
| |
| Financial Highlights | | | | | | | | | | | | | | | | | | |
| |
| Franklin Tennessee Municipal Bond Fund | | | | | | | | | | | | | | | | | | |
| | | Six Months Ended | | | | | | | | | | | | | |
| | | November 30, 2010 | | | Year Ended May 31, | | | | |
| Class A | | (unaudited) | | | 2010 | | | 2009 | | | 2008 | | | 2007 | | | 2006 | |
| Per share operating performance | | | | | | | | | | | | | | | | | | |
| (for a share outstanding throughout the period) | | | | | | | | | | | | | | | | | | |
| Net asset value, beginning of period | $ | 11.35 | | $ | 10.99 | | $ | 11.04 | | $ | 11.18 | | $ | 11.18 | | $ | 11.48 | |
| Income from investment operationsa: | | | | | | | | | | | | | | | | | | |
| Net investment incomeb | | 0.22 | | | 0.45 | | | 0.45 | | | 0.45 | | | 0.46 | | | 0.47 | |
| Net realized and unrealized gains (losses) | | (0.21 | ) | | 0.35 | | | (0.04 | ) | | (0.14 | ) | | —c | | | (0.30 | ) |
| Total from investment operations | | 0.01 | | | 0.80 | | | 0.41 | | | 0.31 | | | 0.46 | | | 0.17 | |
| Less distributions from net investment income | | (0.22 | ) | | (0.44 | ) | | (0.46 | ) | | (0.45 | ) | | (0.46 | ) | | (0.47 | ) |
| Redemption feesd | | — | | | — | | | — | | | —c | | | —c | | | —c | |
| Net asset value, end of period | $ | 11.14 | | $ | 11.35 | | $ | 10.99 | | $ | 11.04 | | $ | 11.18 | | $ | 11.18 | |
| |
| Total returne | | 0.06 | % | | 7.44 | % | | 3.90 | % | | 2.80 | % | | 4.15 | % | | 1.54 | % |
| |
| Ratios to average net assetsf | | | | | | | | | | | | | | | | | | |
| Expenses before waiver and payments by | | | | | | | | | | | | | | | | | | |
| affiliates | | 0.70 | % | | 0.72 | % | | 0.74 | % | | 0.75 | % | | 0.75 | % | | 0.77 | % |
| Expenses net of waiver and payments by | | | | | | | | | | | | | | | | | | |
| affiliates | | 0.70 | % | | 0.70 | % | | 0.70 | % | | 0.70 | % | | 0.70 | % | | 0.70 | % |
| Net investment income | | 3.78 | % | | 3.99 | % | | 4.25 | % | | 4.08 | % | | 4.06 | % | | 4.15 | % |
| |
| Supplemental data | | | | | | | | | | | | | | | | | | |
| Net assets, end of period (000’s) | $ | 291,542 | | $ | 287,007 | | $ | 225,895 | | $ | 199,415 | | $ | 167,215 | | $ | 146,005 | |
| Portfolio turnover rate | | 6.25 | % | | 10.63 | % | | 11.12 | % | | 11.48 | % | | 10.25 | % | | 2.47 | % |
aThe amount shown for a share outstanding throughout the period may not correlate with the Statement of Operations for the period due to the timing of sales and repurchases of the Fund shares in relation to income earned and/or fluctuating market value of the investments of the Fund.
bBased on average daily shares outstanding.
cAmount rounds to less than $0.01 per share.
dEffective September 1, 2008, the redemption fee was eliminated.
eTotal return does not reflect sales commissions or contingent deferred sales charges, if applicable, and is not annualized for periods less than one year.
fRatios are annualized for periods less than one year.
40 | The accompanying notes are an integral part of these financial statements. | Semiannual Report
| | | | |
| Franklin Municipal Securities Trust | | | |
| |
| Statement of Investments, November 30, 2010 (unaudited) | | | | |
| |
| |
| Franklin Tennessee Municipal Bond Fund | Principal Amount | | Value |
| Municipal Bonds 98.9% | | | | |
| Tennessee 87.4% | | | | |
| aAnderson County Water Authority Water and Sewer Revenue, 5.00%, 6/01/36 | $ | 1,000,000 | $ | 1,020,460 |
| Blount County PBA, GO, Local Government Public Improvement, Series B-15-A, Assured | | | | |
| Guaranty, 5.00%, | | | | |
| 6/01/28 | | 1,100,000 | | 1,150,313 |
| 6/01/32 | | 2,565,000 | | 2,629,407 |
| Bristol Electric Revenue, System, AMBAC Insured, 5.00%, 9/01/29 | | 1,075,000 | | 1,101,811 |
| Chattanooga Electric Revenue, Series A, 5.00%, 9/01/33 | | 7,500,000 | | 7,804,425 |
| Chattanooga Health Educational and Housing Facility Board Revenue, Catholic Health Initiatives, | | | | |
| Series D, 6.25%, 10/01/33 | | 500,000 | | 544,765 |
| Chattanooga-Hamilton County Hospital Authority Hospital Revenue, Erlanger Medical Center, | | | | |
| Refunding, AGMC Insured, 5.00%, 10/01/22 | | 3,250,000 | | 3,268,200 |
| Clarksville Electric System Revenue, | | | | |
| Series A, 5.00%, 9/01/34 | | 2,000,000 | | 2,058,960 |
| Series A, 5.00%, 9/01/35 | | 3,185,000 | | 3,273,830 |
| XLCA Insured, 5.00%, 9/01/23 | | 2,325,000 | | 2,471,010 |
| XLCA Insured, 5.00%, 9/01/32 | | 4,000,000 | | 4,068,400 |
| Clarksville Water Sewer and Gas Revenue, | | | | |
| Improvement, AGMC Insured, Pre-Refunded, 5.00%, 2/01/22 | | 1,210,000 | | 1,219,111 |
| Refunding and Improvement, AGMC Insured, 5.00%, 2/01/22 | | 790,000 | | 793,326 |
| Franklin County Health and Educational Facilities Board Revenue, University South Project, | | | | |
| AMBAC Insured, 5.00%, 9/01/24 | | 2,000,000 | | 2,110,300 |
| Gallatin Water and Sewer Revenue, Assured Guaranty, 5.00%, 1/01/33 | | 2,215,000 | | 2,259,876 |
| Greene County GO, Refunding, Series B, NATL Insured, 5.00%, 6/01/24 | | 1,000,000 | | 1,041,380 |
| Hallsdale-Powell Utility District Knox County Water and Sewer Revenue, | | | | |
| NATL RE, FGIC Insured, 5.00%, 4/01/31 | | 1,000,000 | | 1,028,320 |
| Refunding and Improvement, Series A, NATL RE, FGIC Insured, 5.00%, 4/01/27 | | 2,500,000 | | 2,553,800 |
| Harpeth Valley Utilities District Davidson and Williamson Counties Revenue, Utilities, | | | | |
| Improvement, | | | | |
| NATL Insured, 5.00%, 9/01/29 | | 1,000,000 | | 1,026,690 |
| NATL Insured, 5.00%, 9/01/34 | | 2,310,000 | | 2,344,465 |
| NATL RE, FGIC Insured, 5.00%, 9/01/35 | | 3,700,000 | | 3,758,978 |
| Hawkins County First Utility District Waterworks Revenue, Series B, Assured Guaranty, 5.00%, | | | | |
| 6/01/42 | | 1,250,000 | | 1,271,088 |
| Jackson Hospital Revenue, Jackson-Madison Project, Refunding and Improvement, 5.50%, | | | | |
| 4/01/33 | | 3,000,000 | | 2,984,490 |
| Johnson City Electric Revenue, Improvement, AGMC Insured, 5.00%, 5/01/29 | | 1,000,000 | | 1,045,920 |
| Johnson City Health and Educational Facilities Board Hospital Revenue, Series A, NATL Insured, | | | | |
| Pre-Refunded, 5.125%, 7/01/25 | | 3,000,000 | | 3,008,430 |
| Johnson City Health and Educational Facilities Board Revenue, Pine Oaks Assisted Project, | | | | |
| Series A, GNMA Secured, 5.90%, 6/20/37 | | 1,330,000 | | 1,333,897 |
| Kingsport GO, Series B, Assured Guaranty, 5.00%, 3/01/29 | | 1,030,000 | | 1,091,275 |
| Kingsport IDB, MFHR, Model City Airport Project, GNMA Secured, 5.50%, 7/20/39 | | 2,995,000 | | 2,848,365 |
| Knox County First Utility District Water and Sewer Revenue, | | | | |
| NATL Insured, 5.00%, 12/01/24 | | 1,790,000 | | 1,877,764 |
| NATL Insured, 5.00%, 12/01/25 | | 1,000,000 | | 1,043,620 |
| Refunding and Improvement, 5.00%, 12/01/26 | | 1,390,000 | | 1,503,966 |
| Refunding and Improvement, 5.00%, 12/01/29 | | 1,500,000 | | 1,600,695 |
Semiannual Report | 41
Franklin Municipal Securities Trust
Statement of Investments, November 30, 2010 (unaudited) (continued)
| | | | |
| Franklin Tennessee Municipal Bond Fund | | Principal Amount | | Value |
| Municipal Bonds (continued) | | | | |
| Tennessee (continued) | | | | |
| Knox County Health Educational and Housing Facilities Board Hospital Facilities Revenue, | | | | |
| Covenant Health System, Refunding and Improvement, Series A, zero cpn., 1/01/36 | $ | 5,000,000 | $ | 1,036,450 |
| Fort Sanders Alliance, Refunding, NATL Insured, 5.75%, 1/01/14 | | 1,250,000 | | 1,349,550 |
| Knox County Health Educational and Housing Facilities Board Revenue, University Health | | | | |
| System Inc., Refunding, 5.25%, | | | | |
| 4/01/27 | | 2,500,000 | | 2,381,250 |
| 4/01/36 | | 5,000,000 | | 4,532,450 |
| Knoxville Waste Water System Revenue, Improvement, Series A, NATL Insured, 5.00%, | | | | |
| 4/01/37 | | 3,620,000 | | 3,667,494 |
| Knoxville Water Revenue, System Improvement, Series R, AGMC Insured, 5.00%, 3/01/30 | | 2,370,000 | | 2,428,966 |
| Lawrenceburg PBA, GO, Electric System, Public Works, Refunding, AMBAC Insured, 5.00%, | | | | |
| 7/01/22 | | 2,500,000 | | 2,765,600 |
| Lenoir City Electric System Revenue, Refunding and Improvement, AGMC Insured, 5.00%, | | | | |
| 6/01/21 | | 2,000,000 | | 2,016,820 |
| Manchester GO, Refunding, AGMC Insured, 5.00%, 6/01/38 | | 2,665,000 | | 2,746,256 |
| Maryville Revenue, Series A, Assured Guaranty, 5.00%, 6/01/38 | | 7,850,000 | | 7,977,484 |
| Memphis GO, | | | | |
| General Improvement, Assured Guaranty, Pre-Refunded, 5.00%, 4/01/27 | | 1,975,000 | | 2,357,162 |
| General Improvement, NATL Insured, 5.00%, 10/01/22 | | 5,000,000 | | 5,396,450 |
| Refunding, Series D, 5.00%, 7/01/23 | | 2,000,000 | | 2,256,180 |
| Memphis-Shelby County Airport Authority Airport Revenue, | | | | |
| Refunding, Series B, 5.75%, 7/01/25 | | 2,500,000 | | 2,602,575 |
| Series A, AGMC Insured, 5.00%, 7/01/35 | | 5,000,000 | | 5,026,250 |
| Series A, AGMC Insured, 5.00%, 7/01/39 | | 2,565,000 | | 2,570,694 |
| Series D, AMBAC Insured, 6.00%, 3/01/24 | | 3,460,000 | | 3,469,999 |
| Memphis-Shelby County Sports Authority Inc. Revenue, Memphis Arena Project, | | | | |
| Refunding, Series B, 5.375%, 11/01/29 | | 5,000,000 | | 5,126,050 |
| Series A, AMBAC Insured, Pre-Refunded, 5.25%, 11/01/23 | | 7,145,000 | | 7,752,468 |
| Metropolitan Government of Nashville and Davidson County Electric Revenue, Series A, | | | | |
| 5.00%, 5/15/33 | | 3,000,000 | | 3,107,430 |
| AMBAC Insured, 5.00%, 5/15/25 | | 5,000,000 | | 5,279,950 |
| Metropolitan Government of Nashville and Davidson County GO, | | | | |
| Refunding, Series B, 5.00%, 8/01/25 | | 5,000,000 | | 5,422,000 |
| Series C, 5.00%, 2/01/25 | | 3,000,000 | | 3,196,650 |
| Metropolitan Government of Nashville and Davidson County Health and Educational Facilities | | | | |
| Board Revenue, | | | | |
| Mortgage, Dandridge Towers Section 8, Series A, ETM, 6.375%, 1/01/11 | | 215,000 | | 215,987 |
| Vanderbilt University, Refunding, Series A, 5.00%, 10/01/39 | | 1,000,000 | | 1,022,860 |
| Vanderbilt University, Refunding, Series B, 5.00%, 10/01/39 | | 9,000,000 | | 9,205,740 |
| Vanderbilt University, Series A, 5.50%, 10/01/29 | | 3,500,000 | | 3,906,350 |
| Rutherford County Consolidated Utility District Waterworks Revenue, | | | | |
| AGMC Insured, 5.00%, 2/01/36 | | 3,060,000 | | 3,108,440 |
| Refunding, NATL Insured, 5.00%, 2/01/27 | | 1,000,000 | | 1,034,840 |
42 | Semiannual Report
Franklin Municipal Securities Trust
Statement of Investments, November 30, 2010 (unaudited) (continued)
| | | | |
| Franklin Tennessee Municipal Bond Fund | | Principal Amount | | Value |
| Municipal Bonds (continued) | | | | |
| Tennessee (continued) | | | | |
| Rutherford County GO, Refunding, 5.00%, 4/01/26 | $ | 1,840,000 | $ | 2,096,956 |
| Rutherford County Health and Educational Facilities Board Revenue, Ascension Health Senior | | | | |
| Credit Group, Series C, 5.00%, 11/15/40 | | 12,000,000 | | 12,137,760 |
| Shelby County Health Educational and Housing Facilities Board Revenue, | | | | |
| Baptist Memorial Health, Series A, 5.00%, 9/01/19 | | 3,015,000 | | 3,277,184 |
| Methodist, Series B, AGMC Insured, 5.25%, 9/01/27 | | 5,000,000 | | 5,126,700 |
| St. Jude Children’s Research Hospital, Refunding, 5.00%, 7/01/36 | | 5,000,000 | | 5,040,950 |
| South Blount County Utility District Waterworks Revenue, AGMC Insured, | | | | |
| 5.00%, 12/01/33 | | 1,000,000 | | 1,038,900 |
| 5.25%, 12/01/39 | | 3,310,000 | | 3,494,466 |
| Tennessee HDA Revenue, Homeownership Program, | | | | |
| 2006-3, 4.90%, 7/01/37 | | 4,520,000 | | 4,173,406 |
| Series 1, 5.00%, 7/01/29 | | 1,400,000 | | 1,415,778 |
| Series 4B, 6.00%, 7/01/25 | | 1,820,000 | | 1,908,980 |
| Tennessee State GO, Refunding, Series C, 5.00%, 5/01/29 | | 2,000,000 | | 2,152,340 |
| Tennessee State School Bond Authority Revenue, Higher Educational Facilities, Second Program, | | | | |
| Refunding, Series A, 5.00%, 5/01/39 | | 3,000,000 | | 3,118,860 |
| Refunding, Series A, NATL Insured, 5.00%, 5/01/26 | | 1,250,000 | | 1,318,138 |
| Refunding, Series A, NATL Insured, 5.00%, 5/01/30 | | 3,000,000 | | 3,107,820 |
| Series A, 5.00%, 5/01/34 | | 3,555,000 | | 3,661,757 |
| Series B, 5.50%, 5/01/38 | | 4,000,000 | | 4,293,840 |
| West Wilson Utility District Waterworks Revenue, | | | | |
| 5.00%, 6/01/33 | | 3,000,000 | | 3,157,710 |
| AMBAC Insured, Pre-Refunded, 5.25%, 6/01/23 | | 3,780,000 | | 3,872,194 |
| Improvement, NATL Insured, Pre-Refunded, 5.00%, 6/01/26 | | 1,805,000 | | 2,043,675 |
| Refunding, AMBAC Insured, 5.25%, 6/01/23 | | 720,000 | | 730,166 |
| Refunding, NATL Insured, 4.75%, 6/01/23 | | 1,805,000 | | 1,901,152 |
| Refunding and Improvement, NATL Insured, 4.75%, 6/01/28 | | 1,000,000 | | 1,032,700 |
| White House Utility District Robertson and Sumner Counties Water and Sewer Revenue, | | | | |
| AGMC Insured, Pre-Refunded, 5.125%, 1/01/26 | | 1,100,000 | | 1,104,147 |
| Improvement, Refunding, 4.50%, 1/01/35 | | 6,000,000 | | 5,678,880 |
| Refunding, AGMC Insured, Pre-Refunded, 5.125%, 1/01/26 | | 1,400,000 | | 1,405,222 |
| Williamson County GO, | | | | |
| Public Improvement, Pre-Refunded, 5.00%, 4/01/20 | | 2,000,000 | | 2,117,840 |
| Public Improvement, Refunding, 5.00%, 3/01/20 | | 2,000,000 | | 2,152,640 |
| Refunding, 5.00%, 4/01/26 | | 1,930,000 | | 2,204,369 |
| | | | | 254,862,262 |
| U.S. Territories 11.5% | | | | |
| Guam 1.7% | | | | |
| Guam Economic Development and Commerce Authority Revenue, Tobacco Settlement, | | | | |
| Asset-Backed, Refunding, 5.25%, 6/01/32 | | 2,130,000 | | 1,854,888 |
| Guam Government Limited Obligation Revenue, Section 30, Series A, 5.625%, 12/01/29 | | 3,205,000 | | 3,260,414 |
| | | | | 5,115,302 |
Semiannual Report | 43
Franklin Municipal Securities Trust
Statement of Investments, November 30, 2010 (unaudited) (continued)
| | | | |
| Franklin Tennessee Municipal Bond Fund | | Principal Amount | | Value |
| Municipal Bonds (continued) | | | | |
| U.S. Territories (continued) | | | | |
| Puerto Rico 9.8% | | | | |
| Puerto Rico Commonwealth GO, Public Improvement, | | | | |
| Refunding, Series A-4, AGMC Insured, 5.00%, 7/01/31 | $ | 2,760,000 | $ | 2,752,852 |
| Series A, FGIC Insured, Pre-Refunded, 5.00%, 7/01/32 | | 1,500,000 | | 1,605,690 |
| Puerto Rico Electric Power Authority Power Revenue, | | | | |
| Refunding, Series SS, NATL Insured, 5.00%, 7/01/25 | | 5,000,000 | | 5,106,350 |
| Series XX, 5.25%, 7/01/40 | | 2,500,000 | | 2,470,275 |
| Puerto Rico Industrial Tourist Educational Medical and Environmental Control Facilities | | | | |
| Financing Authority Hospital Revenue, Hospital Au xilio Mutuo Obligation Group Project, | | | | |
| Series A, NATL Insured, 6.25%, 7/01/24 | | 200,000 | | 200,752 |
| Puerto Rico PBA Guaranteed Revenue, Government Facilities, | | | | |
| Refunding, Series D, 5.375%, 7/01/33 | | 655,000 | | 656,585 |
| Series D, Pre-Refunded, 5.375%, 7/01/33 | | 1,845,000 | | 1,978,284 |
| Puerto Rico Sales Tax Financing Corp. Sales Tax Revenue, first sub., | | | | |
| Series B, 6.375%, 8/01/39 | | 8,000,000 | | 8,636,560 |
| Series C, 5.50%, 8/01/40 | | 5,000,000 | | 5,085,800 |
| | | | | 28,493,148 |
| Total U.S. Territories | | | | 33,608,450 |
| Total Municipal Bonds (Cost $283,480,586) 98.9% | | | | 288,470,712 |
| Other Assets, less Liabilities 1.1% | | | | 3,071,406 |
| Net Assets 100.0% | | | $ | 291,542,118 |
| |
| |
| See Abbreviations on page 58. | | | | |
| |
| aSecurity purchased on a when-issued basis. See Note 1(b). | | | | |
44 | The accompanying notes are an integral part of these financial statements. | Semiannual Report
| | | | | | |
| Franklin Municipal Securities Trust | | | | |
| |
| Financial Statements | | | | | | |
| |
| |
| Statements of Assets and Liabilities | | | | | | |
| November 30, 2010 (unaudited) | | | | | | |
| |
| | | Franklin California | | | Franklin Tennessee | |
| | | High Yield | | | Municipal | |
| | | Municipal Fund | | | Bond Fund | |
| Assets: | | | | | | |
| Investments in securities: | | | | | | |
| Cost | $ | 1,552,956,385 | | $ | 283,480,586 | |
| Value | $ | 1,468,606,102 | | $ | 288,470,712 | |
| Cash | | 98,882 | | | 624,924 | |
| Receivables: | | | | | | |
| Investment securities sold | | 509,071 | | | — | |
| Capital shares sold | | 2,995,652 | | | 561,872 | |
| Interest | | 19,584,757 | | | 3,946,164 | |
| Other assets | | 614 | | | 118 | |
| Total assets | | 1,491,795,078 | | | 293,603,790 | |
| Liabilities: | | | | | | |
| Payables: | | | | | | |
| Investment securities purchased | | — | | | 1,058,269 | |
| Capital shares redeemed | | 5,228,305 | | | 471,633 | |
| Affiliates | | 837,837 | | | 156,633 | |
| Distributions to shareholders | | 1,748,054 | | | 334,833 | |
| Accrued expenses and other liabilities | | 174,747 | | | 40,304 | |
| Total liabilities | | 7,988,943 | | | 2,061,672 | |
| Net assets, at value | $ | 1,483,806,135 | | $ | 291,542,118 | |
| Net assets consist of: | | | | | | |
| Paid-in capital | $ | 1,637,932,363 | | $ | 288,946,341 | |
| Undistributed net investment income (distributions in excess of net investment income) | | 2,819,637 | | | (83,872 | ) |
| Net unrealized appreciation (depreciation) | | (84,350,283 | ) | | 4,990,126 | |
| Accumulated net realized gain (loss) | | (72,595,582 | ) | | (2,310,477 | ) |
| Net assets, at value | $ | 1,483,806,135 | | $ | 291,542,118 | |
Semiannual Report | The accompanying notes are an integral part of these financial statements. | 45
| | | | | | |
| Franklin Municipal Securities Trust | | |
| |
| Financial Statements (continued) | | | | | | |
| |
| |
| Statements of Assets and Liabilities (continued) | | | | | | |
| November 30, 2010 (unaudited) | | | | | | |
| |
| | | Franklin California | | Franklin Tennessee |
| | | | | High Yield | | Municipal |
| | | Municipal Fund | | Bond Fund |
| Class A: | | | | | | |
| Net assets, at value | $ | 1,099,202,392 | $ | 291,542,118 |
| Shares outstanding | | | | 118,056,395 | | 26,164,429 |
| Net asset value per sharea | | | $ | 9.31 | $ | 11.14 |
| Maximum offering price per share (net asset value per share ÷ 95.75%) | | | $ | 9.72 | $ | 11.63 |
| Class B: | | | | | | |
| Net assets, at value | | $ | | 5,275,914 | | |
| Shares outstanding | | | | 563,521 | | |
| Net asset value and maximum offering price per sharea | | | $ | 9.36 | | |
| Class C: | | | | | | |
| Net assets, at value | | $ | | 257,442,510 | | |
| Shares outstanding | | | | 27,501,857 | | |
| Net asset value and maximum offering price per sharea | | | $ | 9.36 | | |
| Advisor Class: | | | | | | |
| Net assets, at value | | $ | | 121,885,319 | | |
| Shares outstanding | | | | 13,073,804 | | |
| Net asset value and maximum offering price per share | | | $ | 9.32 | | |
| |
| |
| aRedemption price is equal to net asset value less contingent deferred sales charges, if applicable. | | | | | | |
46 | The accompanying notes are an integral part of these financial statements. | Semiannual Report
| | | | | | |
| Franklin Municipal Securities Trust | | | | | | |
| |
| Financial Statements (continued) | | | | | | |
| |
| |
| Statements of Operations | | | | | | |
| for the six months ended November 30, 2010 (unaudited) | | | | | | |
| |
| | | Franklin | | | Franklin | |
| | | California | | | Tennessee | |
| | | High Yield | | | Municipal | |
| | | Municipal Fund | | | Bond Fund | |
| Investment income: | | | | | | |
| Interest | $ | 43,405,974 | | $ | 6,652,575 | |
| Expenses: | | | | | | |
| Management fees (Note 3a) | | 3,521,811 | | | 793,444 | |
| Distribution fees: (Note 3c) | | | | | | |
| Class A | | 566,447 | | | 148,500 | |
| Class B | | 21,067 | | | — | |
| Class C | | 853,898 | | | — | |
| Transfer agent fees (Note 3e) | | 234,098 | | | 51,469 | |
| Custodian fees | | 10,443 | | | 2,099 | |
| Reports to shareholders | | 31,816 | | | 7,738 | |
| Registration and filing fees | | 9,801 | | | 5,285 | |
| Professional fees | | 18,556 | | | 13,002 | |
| Trustees’ fees and expenses | | 43,287 | | | 7,873 | |
| Other | | 61,926 | | | 14,427 | |
| Total expenses | | 5,373,150 | | | 1,043,837 | |
| Expenses waived/paid by affiliates (Note 3f) | | — | | | (4,536 | ) |
| Net expenses | | 5,373,150 | | | 1,039,301 | |
| Net investment income | | 38,032,824 | | | 5,613,274 | |
| Realized and unrealized gains (losses): | | | | | | |
| Net realized gain (loss) from investments | | 288,210 | | | 12,786 | |
| Net change in unrealized appreciation (depreciation) on investments | | (15,551,155 | ) | | (5,547,236 | ) |
| Net realized and unrealized gain (loss) | | (15,262,945 | ) | | (5,534,450 | ) |
| Net increase (decrease) in net assets resulting from operations | $ | 22,769,879 | | $ | 78,824 | |
Semiannual Report | The accompanying notes are an integral part of these financial statements. | 47
| | | | | | | | | | | | |
| Franklin Municipal Securities Trust | | | | |
| |
| Financial Statements (continued) | | | | | | | | | | | | |
| |
| |
| Statements of Changes in Net Assets | | | | | | | | | | | | |
| |
| |
| | | Franklin California | | | Franklin Tennessee | |
| | | High Yield Municipal Fund | | | Municipal Bond Fund | |
| | | Six Months Ended | | | | | | Six Months Ended | | | | |
| | | November 30, 2010 | | | Year Ended | | | November 30, 2010 | | | Year Ended | |
| | | (unaudited) | | | May 31, 2010 | | | (unaudited) | | | May 31, 2010 | |
| Increase (decrease) in net assets: | | | | | | | | | | | | |
| Operations: | | | | | | | | | | | | |
| Net investment income | $ | 38,032,824 | | $ | 75,754,521 | | $ | 5,613,274 | | $ | 10,382,832 | |
| Net realized gain (loss) from investments | | 288,210 | | | (28,960,010 | ) | | 12,786 | | | 346,000 | |
| Net change in unrealized appreciation | | | | | | | | | | | | |
| (depreciation) on investments | | (15,551,155 | ) | | 174,814,718 | | | (5,547,236 | ) | | 7,802,579 | |
| Net increase (decrease) in net assets | | | | | | | | | | | | |
| resulting from operations | | 22,769,879 | | | 221,609,229 | | | 78,824 | | | 18,531,411 | |
| Distributions to shareholders from: | | | | | | | | | | | | |
| Net investment income: | | | | | | | | | | | | |
| Class A | | (30,123,058 | ) | | (57,568,890 | ) | | (5,688,612 | ) | | (10,267,183 | ) |
| Class B | | (158,751 | ) | | (537,964 | ) | | — | | | — | |
| Class C | | (6,239,220 | ) | | (11,917,188 | ) | | — | | | — | |
| Advisor Class | | (2,913,490 | ) | | (5,122,495 | ) | | — | | | — | |
| Total distributions to shareholders | | (39,434,519 | ) | | (75,146,537 | ) | | (5,688,612 | ) | | (10,267,183 | ) |
| Capital share transactions: (Note 2) | | | | | | | | | | | | |
| Class A | | 21,208,281 | | | 34,996,351 | | | 10,144,431 | | | 52,848,583 | |
| Class B | | (2,290,476 | ) | | (6,335,132 | ) | | — | | | — | |
| Class C | | 4,844,958 | | | 17,864,735 | | | — | | | — | |
| Advisor Class | | 22,378,214 | | | 22,772,160 | | | — | | | — | |
| Total capital share transactions | | 46,140,977 | | | 69,298,114 | | | 10,144,431 | | | 52,848,583 | |
| Net increase (decrease) in | | | | | | | | | | | | |
| net assets | | 29,476,337 | | | 215,760,806 | | | 4,534,643 | | | 61,112,811 | |
| Net assets: | | | | | | | | | | | | |
| Beginning of period | | 1,454,329,798 | | | 1,238,568,992 | | | 287,007,475 | | | 225,894,664 | |
| End of period | $ | 1,483,806,135 | | $ | 1,454,329,798 | | $ | 291,542,118 | | $ | 287,007,475 | |
| Undistributed net investment income | | | | | | | | | | | | |
| (distributions in excess of net investment | | | | | | | | | | | | |
| income) included in net assets: | | | | | | | | | | | | |
| End of period | $ | 2,819,637 | | $ | 4,221,332 | | $ | (83,872 | ) | $ | (8,534 | ) |
48 | The accompanying notes are an integral part of these financial statements. | Semiannual Report
Franklin Municipal Securities Trust
Notes to Financial Statements (unaudited)
1. ORGANIZATION AND SIGNIFICANT ACCOUNTING POLICIES
Franklin Municipal Securities Trust (Trust) is registered under the Investment Company Act of 1940, as amended, (1940 Act) as an open-end investment company, consisting of two funds (Funds). The classes of shares offered within each of the Funds are indicated below. Each class of shares differs by its initial sales load, contingent deferred sales charges, distribution fees, voting rights on matters affecting a single class and its exchange privilege.
Class A
Franklin Tennessee Municipal Bond Fund
Class A, Class B, Class C & Advisor Class
Franklin California High Yield Municipal Fund
The following summarizes the Funds’ significant accounting policies.
a. Financial Instrument Valuation
The Funds value their investments in securities and other assets and liabilities carried at fair value daily. Fair value is the price that would be received to sell an asset or paid to transfer a liability in an orderly transaction between market participants on the measurement date. Under procedures approved by the Funds’ Board of Trustees, the Funds may utilize independent pricing services, quotations from securities and financial instrument dealers, and other market sources to determine fair value.
Debt securities generally trade in the over-the-counter market rather than on a securities exchange. The Funds’ pricing services use multiple valuation techniques to determine fair value. In instances where sufficient market activity exists, the pricing services may utilize a market-based approach through which quotes from market makers are used to determine fair value. In instances where sufficient market activity may not exist or is limited, the pricing services also utilize proprietary valuation models which may consider market characteristics such as benchmark yield curves, option-adjusted spreads, credit spreads, estimated default rates, coupon rates, anticipated timing of principal repayments, underlying collateral, and other unique security features in order to estimate the relevant cash flows, which are then discounted to calculate the fair value.
The Funds have procedures to determine the fair value of securities and other financial instruments for which market prices are not readily available or which may not be reliably priced. Under these procedures, the Funds primarily employ a market-based approach which may use related or comparable assets or liabilities, recent transactions, market multiples, book values, and other relevant information for the investment to determine the fair value of the investment. The Funds may also use an income-based valuation approach in which the anticipated future cash flows of the investment are discounted to calculate fair value. Discounts may also be applied due to the nature or duration of any restrictions on the disposition of the investments. Due to the inherent uncertainty of valuations of such investments, the fair values may differ significantly from the values that would have been used had an active market ex isted.
Semiannual Report | 49
Franklin Municipal Securities Trust
Notes to Financial Statements (unaudited) (continued)
| 1. | ORGANIZATION AND SIGNIFICANT ACCOUNTING POLICIES (continued) |
| b. | Securities Purchased on a When-Issued Basis |
The Funds may purchase securities on a when-issued basis, with payment and delivery scheduled for a future date. These transactions are subject to market fluctuations and are subject to the risk that the value at delivery may be more or less than the trade date purchase price. Although the Funds will generally purchase these securities with the intention of holding the securities, they may sell the securities before the settlement date. Sufficient assets have been segregated for these securities.
c. Income Taxes
It is each fund’s policy to qualify as a regulated investment company under the Internal Revenue Code. Each fund intends to distribute to shareholders substantially all of its income and net realized gains to relieve it from federal income and excise taxes. As a result, no provision for U.S. federal income taxes is required. The Funds file U.S. income tax returns as well as tax returns in certain other jurisdictions. Each fund’s application of those tax rules is subject to its understanding. Each fund records a provision for taxes in its financial statements including penalties and interest, if any, for a tax position taken on a tax return (or expected to be taken) when it fails to meet the more likely than not (a greater than 50% probability) threshold and based on the technical merits, the tax position may not be sustained upon examination by the tax authorities. As of November 30, 2010, and for all open tax years, the Funds have determined that no provision for income tax is required in the Funds’ financial statements. Open tax years are those that remain subject to examination and are based on each tax jurisdiction statute of limitation. The Funds are not aware of any tax position for which it is reasonably possible that the total amounts of unrecognized tax effects will significantly change in the next twelve months.
d. Security Transactions, Investment Income, Expenses and Distributions
Security transactions are accounted for on trade date. Realized gains and losses on security transactions are determined on a specific identification basis. Interest income and estimated expenses are accrued daily. Amortization of premium and accretion of discount on debt securities are included in interest income. Dividends from net investment income are normally declared daily; these dividends may be reinvested or paid monthly to shareholders. Distributions to shareholders are determined according to income tax regulations (tax basis). Distributable earnings determined on a tax basis may differ from earnings recorded in accordance with accounting principles generally accepted in the United States of America. These differences may be permanent or temporary. Permanent differences are reclassified among capital accounts to reflect their tax character. These reclassifications have no impact on net assets or th e results of operations. Temporary differences are not reclassified, as they may reverse in subsequent periods.
50 | Semiannual Report
Franklin Municipal Securities Trust
Notes to Financial Statements (unaudited) (continued)
| 1. | ORGANIZATION AND SIGNIFICANT ACCOUNTING POLICIES (continued) |
| d. | Security Transactions, Investment Income, Expenses and Distributions (continued) |
Common expenses incurred by the Trust are allocated among the Funds based on the ratio of net assets of each fund to the combined net assets of the Trust. Fund specific expenses are charged directly to the fund that incurred the expense.
Realized and unrealized gains and losses and net investment income, not including class specific expenses, are allocated daily to each class of shares based upon the relative proportion of net assets of each class. Differences in per share distributions, by class, are generally due to differences in class specific expenses.
e. Insurance
The scheduled payments of interest and principal for each insured municipal security in the Trust are insured by either a new issue insurance policy or a secondary insurance policy. Some municipal securities in the Funds are secured by collateral guaranteed by an agency of the U.S. government. Insurance companies typically insure municipal bonds that tend to be of very high quality, with the majority of underlying municipal bonds rated A or better. However, there is a risk that in the event of an issuer default, the insurer may not be able to fulfill its obligations under the terms of the policy.
Depending on the type of coverage, premiums for insurance are either added to the cost basis of the security or paid by a third party.
f. Accounting Estimates
The preparation of financial statements in accordance with accounting principles generally accepted in the United States of America requires management to make estimates and assumptions that affect the reported amounts of assets and liabilities at the date of the financial statements and the amounts of income and expenses during the reporting period. Actual results could differ from those estimates.
g. Guarantees and Indemnifications
Under the Trust’s organizational documents, its officers and trustees are indemnified by the Trust against certain liabilities arising out of the performance of their duties to the Trust. Additionally, in the normal course of business, the Trust, on behalf of the Funds, enters into contracts with service providers that contain general indemnification clauses. The Trust’s maximum exposure under these arrangements is unknown as this would involve future claims that may be made against the Trust that have not yet occurred. Currently, the Trust expects the risk of loss to be remote.
Semiannual Report | 51
Franklin Municipal Securities Trust
Notes to Financial Statements (unaudited) (continued)
2. SHARES OF BENEFICIAL INTEREST
At November 30, 2010, there were an unlimited number of shares authorized (without par value).
Transactions in the Funds’ shares were as follows:
| | | | | | | | | | | |
| | Franklin California | | Franklin Tennessee | |
| | High Yield Municipal Fund | | Municipal Bond Fund | |
| | Shares | | | | Amount | | Shares | | | Amount | |
| Class A Shares: | | | | | | | | | | | |
| Six Months ended November 30, 2010 | | | | | | | | | | | |
| Shares sold | 13,939,351 | | $ | 133,116,433 | | 2,608,581 | | $ | 29,849,855 | |
| Shares issued in reinvestment of | | | | | | | | | | | |
| distributions | 1,900,283 | | | | 18,050,744 | | 344,639 | | | 3,929,071 | |
| Shares redeemed | (13,686,978 | ) | | | (129,958,896 | ) | (2,077,204 | ) | | (23,634,495 | ) |
| Net increase (decrease) | 2,152,656 | | | $ | 21,208,281 | | 876,016 | | $ | 10,144,431 | |
| Year ended May 31, 2010 | | | | | | | | | | | |
| Shares sold | 23,540,633 | | $ | 212,796,062 | | 6,762,280 | | $ | 75,597,034 | |
| Shares issued in reinvestment of | | | | | | | | | | | |
| distributions | 3,818,633 | | | | 34,375,029 | | 669,567 | | | 7,492,229 | |
| Shares redeemed | (23,745,896 | ) | | | (212,174,740 | ) | (2,696,919 | ) | | (30,240,680 | ) |
| Net increase (decrease) | 3,613,370 | | | $ | 34,996,351 | | 4,734,928 | | $ | 52,848,583 | |
| Class B Shares: | | | | | | | | | | | |
| Six Months ended November 30, 2010 | | | | | | | | | | | |
| Shares sold | 12,362 | | | $ | 119,583 | | | | | | |
| Shares issued in reinvestment of | | | | | | | | | | | |
| distributions | 10,141 | | | | 96,849 | | | | | | |
| Shares redeemed | (261,734 | ) | | | (2,506,908 | ) | | | | | |
| Net increase (decrease) | (239,231 | ) | | $ | (2,290,476 | ) | | | | | |
| Year ended May 31, 2010 | | | | | | | | | | | |
| Shares sold | 9,676 | | | $ | 87,916 | | | | | | |
| Shares issued in reinvestment of | | | | | | | | | | | |
| distributions | 35,196 | | | | 315,842 | | | | | | |
| Shares redeemed | (748,153 | ) | | | (6,738,890 | ) | | | | | |
| Net increase (decrease) | (703,281 | ) | | $ | (6,335,132 | ) | | | | | |
| Class C Shares: | | | | | | | | | | | |
| Six Months ended November 30, 2010 | | | | | | | | | | | |
| Shares sold | 2,633,870 | | | $ | 25,287,089 | | | | | | |
| Shares issued in reinvestment of | | | | | | | | | | | |
| distributions | 382,459 | | | | 3,653,560 | | | | | | |
| Shares redeemed | (2,528,587 | ) | | | (24,095,691 | ) | | | | | |
| Net increase (decrease) | 487,742 | | | $ | 4,844,958 | | | | | | |
| Year ended May 31, 2010 | | | | | | | | | | | |
| Shares sold | 5,871,773 | | | $ | 53,395,335 | | | | | | |
| Shares issued in reinvestment of | | | | | | | | | | | |
| distributions | 762,936 | | | | 6,898,515 | | | | | | |
| Shares redeemed | (4,698,745 | ) | | | (42,429,115 | ) | | | | | |
| Net increase (decrease) | 1,935,964 | | | $ | 17,864,735 | | | | | | |
52 | Semiannual Report
Franklin Municipal Securities Trust
Notes to Financial Statements (unaudited) (continued)
| | | | | |
| 2. SHARES OF BENEFICIAL INTEREST (continued) | | | | |
| |
| | Franklin California | |
| | High Yield Municipal Fund | |
| | Shares | | | Amount | |
| Advisor Class Shares: | | | | | |
| Six Months ended November 30, 2010 | | | | | |
| Shares sold | 3,913,776 | | $ | 37,523,410 | |
| Shares issued in reinvestment of | | | | | |
| distributions | 65,811 | | | 625,049 | |
| Shares redeemed | (1,667,900 | ) | | (15,770,245 | ) |
| Net increase (decrease) | 2,311,687 | | $ | 22,378,214 | |
| Year ended May 31, 2010 | | | | | |
| Shares sold | 4,210,188 | | $ | 37,170,013 | |
| Shares issued in reinvestment of | | | | | |
| distributions | 103,660 | | | 938,547 | |
| Shares redeemed | (1,694,146 | ) | | (15,336,400 | ) |
| Net increase (decrease) | 2,619,702 | | $ | 22,772,160 | |
3. TRANSACTIONS WITH AFFILIATES
Franklin Resources, Inc. is the holding company for various subsidiaries that together are referred to as Franklin Templeton Investments. Certain officers and trustees of the Funds are also officers and/or directors of the following subsidiaries:
| |
Subsidiary Franklin Advisers, Inc. (Advisers) Franklin Templeton Services, LLC (FT Services) Franklin Templeton Distributors, Inc. (Distributors) Franklin Templeton Investor Services, LLC (Investor Services) | Affiliation Investment manager Administrative manager Principal underwriter Transfer agent |
a. Management Fees
The Funds pay an investment management fee to Advisers based on the average daily net assets of each of the Funds as follows:
| | |
| Annualized Fee Rate | | Net Assets |
| 0.625 | % | Up to and including $100 million |
| 0.500 | % | Over $100 million, up to and including $250 million |
| 0.450 | % | Over $250 million, up to and including $7.5 billion |
| 0.440 | % | Over $7.5 billion, up to and including $10 billion |
| 0.430 | % | Over $10 billion, up to and including $12.5 billion |
| 0.420 | % | Over $12.5 billion, up to and including $15 billion |
| 0.400 | % | Over $15 billion, up to and including $17.5 billion |
| 0.380 | % | Over $17.5 billion, up to and including $20 billion |
| 0.360 | % | In excess of $20 billion |
Semiannual Report | 53
Franklin Municipal Securities Trust
Notes to Financial Statements (unaudited) (continued)
| 3. | TRANSACTIONS WITH AFFILIATES (continued) |
| b. | Administrative Fees |
Under an agreement with Advisers, FT Services provides administrative services to the Funds. The fee is paid by Advisers based on average daily net assets, and is not an additional expense of the Funds.
c. Distribution Fees
The Trust’s Board of Trustees has adopted distribution plans for each share class, with the exception of Advisor Class shares, pursuant to Rule 12b-1 under the 1940 Act. Under the Funds’ Class A reimbursement distribution plans, the Funds reimburse Distributors for costs incurred in connection with the servicing, sale and distribution of each fund’s shares up to the maximum annual plan rate. Under the Class A reimbursement distribution plans, costs exceeding the maximum for the current plan year cannot be reimbursed in subsequent periods.
In addition, under the Funds’ Class B and C compensation distribution plans, the Funds pay Distributors for costs incurred in connection with the servicing, sale and distribution of each fund’s shares up to the maximum annual plan rate for each class.
The maximum annual plan rates, based on the average daily net assets, for each class, are as follows:
| | | | |
| | Franklin California | | Franklin Tennessee | |
| | High Yield | | Municipal | |
| | Municipal Fund | | Bond Fund | |
| Reimbursement Plans: | | | | |
| Class A | 0.15 | % | 0.15 | % |
Distributors has agreed to limit the current rate to 0.10% per year for each of the Funds.
| | | |
| Compensation Plans: | | | |
| Class B | 0.65 | % | — |
| Class C | 0.65 | % | — |
d. Sales Charges/Underwriting Agreements
Distributors has advised the Funds of the following commission transactions related to the sales and redemptions of the Funds’ shares for the period:
| | | | |
| | | Franklin California | | Franklin Tennessee |
| | | High Yield | | Municipal |
| | | Municipal Fund | | Bond Fund |
| Sales charges retained net of commissions paid to unaffiliated | | | | |
| broker/dealers | $ | 176,873 | $ | 93,936 |
| Contingent deferred sales charges retained | $ | 35,337 | $ | 4,994 |
54 | Semiannual Report
Franklin Municipal Securities Trust
Notes to Financial Statements (unaudited) (continued)
| 3. | TRANSACTIONS WITH AFFILIATES (continued) |
| e. | Transfer Agent Fees |
For the period ended November 30, 2010, the Funds paid transfer agent fees as noted in the Statements of Operations of which the following amounts were retained by Investor Services:
| | | | |
| | | Franklin California | | Franklin Tennessee |
| | | High Yield | | Municipal |
| | | Municipal Fund | | Bond Fund |
| Transfer agent fees | $ | 110,760 | $ | 20,180 |
| |
| f. Waiver and Expense Reimbursements | | | | |
Advisers has contractually agreed in advance to waive or limit its fees and to assume as its own expense certain expenses otherwise payable by the Franklin Tennessee Municipal Bond Fund so that the common expenses (i.e. a combination of management fees, administrative fees, and other expenses, but excluding distribution fees and acquired fund fees and expenses) do not exceed 0.60% (other than certain non-routine expenses or costs, including those relating to litigation, indemnification, reorganizations, and liquidations) until September 30, 2011.
4. INCOME TAXES
For tax purposes, capital losses may be carried over to offset future capital gains, if any. At May 31, 2010, the capital loss carryforwards were as follows:
| | | | |
| | | Franklin California | | Franklin Tennessee |
| | | High Yield | | Municipal |
| | | Municipal Fund | | Bond Fund |
| Capital loss carryforwards expiring in: | | | | |
| 2011 | $ | — | $ | 95,080 |
| 2012 | | 7,294,061 | | 984,101 |
| 2013 | | 2,650,186 | | 422,643 |
| 2015 | | 684,955 | | 11,310 |
| 2016 | | 1,572,273 | | — |
| 2017 | | 5,767,799 | | 810,129 |
| 2018 | | 32,781,484 | | — |
| | $ | 50,750,758 | $ | 2,323,263 |
For tax purposes, realized capital losses occurring subsequent to October 31 may be deferred and treated as occurring on the first day of the following fiscal year. At May 31, 2010, the Franklin California High Yield Municipal Fund deferred realized capital losses of $21,748,133.
Semiannual Report | 55
Franklin Municipal Securities Trust
Notes to Financial Statements (unaudited) (continued)
4. INCOME TAXES (continued)
At November 30, 2010, the cost of investments and net unrealized appreciation (depreciation) for income tax purposes were as follows:
| | | | | | |
| | | Franklin California | | | Franklin Tennessee | |
| | | High Yield | | | Municipal | |
| | | Municipal Fund | | | Bond Fund | |
| Cost of investments | $ | 1,549,882,197 | | $ | 283,405,710 | |
| |
| Unrealized appreciation | $ | 34,233,773 | | $ | 7,820,448 | |
| Unrealized depreciation | | (115,509,868 | ) | | (2,755,446 | ) |
| Net unrealized appreciation (depreciation) | $ | (81,276,095 | ) | $ | 5,065,002 | |
Net investment income differs for financial statement and tax purposes primarily due to differing treatment of bond discounts.
Net realized gains (losses) differ for financial statement and tax purposes primarily due to differing treatments of wash sales and bond discounts.
5. INVESTMENT TRANSACTIONS
Purchases and sales of investments (excluding short term securities) for the period ended November 30, 2010, were as follows:
| | | | |
| | | Franklin California | | Franklin Tennessee |
| | | High Yield | | Municipal |
| | | Municipal Fund | | Bond Fund |
| Purchases | $ | 101,739,9022 | $ | 30,918,975 |
| Sales | $ | 98,537,257 | $ | 18,168,093 |
6. CREDIT RISK
At November 30, 2010, the Franklin California High Yield Municipal Fund had 30.00% of its portfolio invested in high yield securities rated below investment grade. These securities may be more sensitive to economic conditions causing greater price volatility and are potentially subject to a greater risk of loss due to default than higher rated securities.
7. CONCENTRATION OF RISK
Each of the Funds invests a large percentage of its total assets in obligations of issuers within its respective state and U.S. territories. Such concentration may subject the Funds to risks associated with industrial or regional matters, and economic, political or legal developments occurring within those states and U.S. territories. In addition, investments in these securities are sensitive to interest rate changes and credit risk of the issuer and may subject the funds to increased market volatility. The market for these investments may be limited, which may make them difficult to buy or sell.
56 | Semiannual Report
Franklin Municipal Securities Trust
Notes to Financial Statements (unaudited) (continued)
8. CREDIT FACILITY
The Funds, together with other U.S. registered and foreign investment funds (collectively “Borrowers”), managed by Franklin Templeton Investments, are borrowers in a joint syndicated senior unsecured credit facility totaling $750 million (Global Credit Facility) which matures on January 21, 2011. This Global Credit Facility provides a source of funds to the Borrowers for temporary and emergency purposes, including the ability to meet future unanticipated or unusually large redemption requests.
Under the terms of the Global Credit Facility, the Funds shall, in addition to interest charged on any borrowings made by the Funds and other costs incurred by the Funds, pay their share of fees and expenses incurred in connection with the implementation and maintenance of the Global Credit Facility, based upon its relative share of the aggregate net assets of all of the Borrowers, including an annual commitment fee of 0.10% based upon the unused portion of the Global Credit Facility, which is reflected in other expenses on the Statements of Operations. During the period ended November 30, 2010, the Funds did not use the Global Credit Facility.
9. FAIR VALUE MEASUREMENTS
The Funds follow a fair value hierarchy that distinguishes between market data obtained from independent sources (observable inputs) and the Funds’ own market assumptions (unobservable inputs). These inputs are used in determining the value of the Funds’ investments and are summarized in the following fair value hierarchy:
- Level 1 – quoted prices in active markets for identical securities
- Level 2 – other significant observable inputs (including quoted prices for similar securities, interest rates, prepayment speed, credit risk, etc.)
- Level 3 – significant unobservable inputs (including the Funds’ own assumptions in determining the fair value of investments)
The inputs or methodology used for valuing securities are not an indication of the risk associated with investing in those securities.
For movements between the levels within the fair value hierarchy, the Funds have adopted a policy of recognizing the transfers as of the date of the underlying event which caused the movement.
At November 30, 2010, all of the Funds’ investments in securities carried at fair value were in Level 2 inputs.
10. SUBSEQUENT EVENTS
The Funds have evaluated subsequent events through the issuance of the financial statements and determined that no events have occurred that require disclosure.
Semiannual Report | 57
Franklin Municipal Securities Trust
Notes to Financial Statements (unaudited) (continued)
| | | |
| Abbreviations | | |
| |
| |
| Selected Portfolio | | |
| |
| 1915 Act | - Improvement Bond Act of 1915 | ID | - Improvement District |
| ABAG | - The Association of Bay Area Governments | IDB | -IndustrialDevelopment Bond/Board |
| AD | - Assessment District | MFHR | -Multi-FamilyHousing Revenue |
| AGMC | - Assured Guaranty Municipal Corp. | MFR | -Multi-FamilyRevenue |
| AMBAC | - American Municipal Bond Assurance Corp. | NATL | - National Public Financial Guarantee Corp. |
| BAN | -BondAnticipation Note | NATL RE | - National Public Financial Guarantee Corp. Reinsured |
| CDA | - Community Development Authority/Agency | PBA | -PublicBuilding Authority |
| CFD | - Community Facilities District | PCFA | - Pollution Control Financing Authority |
| CIFP | - Capital Improvement Financing Program | PCR | - Pollution Control Revenue |
| COP | - Certificate of Participation | PFA | -PublicFinancing Authority |
| CRDA | - Community Redevelopment Authority/Agency | PFAR | -PublicFinancing Authority Revenue |
| ETM | - Escrow to Maturity | PUD | -PublicUtility District |
| FGIC | -FinancialGuaranty Insurance Co. | RDA | - Redevelopment Agency/Authority |
| FHA | - Federal Housing Authority/Agency | UHSD | -Unified/UnionHigh School District |
| GNMA | - Government National Mortgage Association | USD | -Unified/UnionSchool District |
| GO | -GeneralObligation | XLCA | - XL Capital Assurance |
| HDA | -HousingDevelopment Authority/Agency | | |
58 | Semiannual Report
Franklin Municipal Securities Trust
Shareholder Information
Proxy Voting Policies and Procedures
The Trust’s investment manager has established Proxy Voting Policies and Procedures (Policies) that the Trust uses to determine how to vote proxies relating to portfolio securities. Shareholders may view the Trust’s complete Policies online at franklintempleton.com. Alternatively, shareholders may request copies of the Policies free of charge by calling the Proxy Group collect at (954) 527-7678 or by sending a written request to: Franklin Templeton Companies, LLC, 500 East Broward Boulevard, Suite 1500, Fort Lauderdale, FL 33394, Attention: Proxy Group. Copies of the Trust’s proxy voting records are also made available online at franklintempleton.com and posted on the U.S. Securities and Exchange Commission’s website at sec.gov and reflect the most recent 12-month period ended June 30.
Quarterly Statement of Investments
The Trust files a complete statement of investments with the U.S. Securities and Exchange Commission for the first and third quarters for each fiscal year on Form N-Q. Shareholders may view the filed Form N-Q by visiting the Commission’s website at sec.gov. The filed form may also be viewed and copied at the Commission’s Public Reference Room in Washington, DC. Information regarding the operations of the Public Reference Room may be obtained by calling (800) SEC-0330.
Semiannual Report | 59
This page intentionally left blank.

Sign up for electronic delivery
on franklintempleton. com
Semiannual Report and Shareholder Letter
FRANKLIN MUNICIPAL SECURITIES TRUST
Investment Manager
Franklin Advisers, Inc.
Distributor
Franklin Templeton Distributors, Inc.
(800) DIAL BEN®
franklintempleton. com
Shareholder Services
(800) 632-2301
Authorized for distribution only when accompanied or preceded by a summary prospectus and/or prospectus. Investors should carefully consider a fund’s investment goals, risks, charges and expenses before investing. A prospectus contains this and other information; please read it carefully before investing.
To ensure the highest quality of service, telephone calls to or from our service departments may be monitored, recorded and accessed. These calls can be identified by the presence of a regular beeping tone.
© 2010 Franklin Templeton Investments. All rights reserved.
MUN S 01/11
Item 2. Code of Ethics.
(a) The Registrant has adopted a code of ethics that applies to its principal executive officers and principal financial and accounting officer.
| (c) | N/A |
| (d) | N/A |
| (f) | Pursuant to Item 12(a)(1), the Registrant is attaching as an |
exhibit a copy of its code of ethics that applies to its principal executive officers and principal financial and accounting officer.
Item 3. Audit Committee Financial Expert.
(a)(1) The Registrant has an audit committee financial expert serving on its audit committee.
(2) The audit committee financial expert is John B. Wilson and he is "independent" as defined under the relevant Securities and Exchange Commission Rules and Releases.
| |
Item 4. Principal Accountant Fees and Services. Item 5. Audit Committee of Listed Registrants. Item 6. Schedule of Investments. | N/A N/A N/A |
Item 7. Disclosure of Proxy Voting Policies and Procedures for Closed-End Management Investment Companies. N/A
Item 8. Portfolio Managers of Closed-End Management Investment Companies. N/A
Item 9. Purchases of Equity Securities by Closed-End Management
Investment Company and Affiliated Purchasers. N/A
Item 10. Submission of Matters to a Vote of Security Holders.
There have been no changes to the procedures by which shareholders may recommend nominees to the Registrant's Board of Trustees that would require disclosure herein.
Item 11. Controls and Procedures.
(a) Evaluation of Disclosure Controls and Procedures. The Registrant maintains disclosure controls and procedures that are designed to ensure that information required to be disclosed in the Registrant’s filings under the Securities Exchange Act of 1934 and the Investment Company Act of 1940 is recorded, processed, summarized and reported within the periods specified in the rules and forms of the Securities and Exchange Commission. Such information is accumulated and communicated to the Registrant’s management, including its principal executive officer and principal financial officer, as appropriate, to allow timely decisions regarding required disclosure. The Registrant’s management, including the principal executive officer and the principal financial officer, recognizes that any set of controls and procedures, no matter how well designed and operated, can provide only reasonable assurance of achieving the desired control objectives.
Within 90 days prior to the filing date of this Shareholder Report on Form N-CSR, the Registrant had carried out an evaluation, under the supervision and with the participation of the Registrant’s management, including the Registrant’s principal executive officer and the Registrant’s principal financial officer, of the effectiveness of the design and operation of the Registrant’s disclosure controls and procedures. Based on such evaluation, the Registrant’s principal executive officer and principal financial officer concluded that the Registrant’s disclosure controls and procedures are effective.
(b) Changes in Internal Controls. There have been no significant changes in the Registrant’s internal controls or in other factors that could significantly affect the internal controls subsequent to the date of their evaluation in connection with the preparation of this Shareholder Report on Form N-CSR.
Item 12. Exhibits.
(a)(1) Code of Ethics
(a)(2) Certifications pursuant to Section 302 of the Sarbanes-Oxley Act of 2002 of Laura F. Fergerson, Chief Executive Officer - Finance and Administration, and Gaston Gardey, Chief Financial Officer and Chief Accounting Officer
(b) Certifications pursuant to Section 906 of the Sarbanes-Oxley Act of 2002 of Laura F. Fergerson, Chief Executive Officer - Finance and Administration, and Gaston Gardey, Chief Financial Officer and Chief Accounting Officer
SIGNATURES
Pursuant to the requirements of the Securities Exchange Act of 1934 and the Investment Company Act of 1940, the registrant has duly caused this report to be signed on its behalf by the undersigned, thereunto duly authorized.
FRANKLIN MUNICIPAL SECURITIES TRUST
By /s/LAURA F. FERGERSON
Laura F. Fergerson
Chief Executive Officer - Finance and Administration
Date January 27, 2011
Pursuant to the requirements of the Securities Exchange Act of 1934 and the Investment Company Act of 1940, this report has been signed below by the following persons on behalf of the registrant and in the capacities and on the dates indicated.
By /s/LAURA F. FERGERSON
Laura F. Fergerson
Chief Executive Officer - Finance and Administration
Date January 27, 2011
By /s/GASTON GARDEY
Gaston Gardey
Chief Financial Officer and Chief Accounting Officer
Date January 27, 2011
4