
Semiannual Report
Municipal Bond Market Overview
For the six-month period ended November 30, 2012, the municipal bond market produced solid returns. During this period, the Barclays Municipal Bond Index, which tracks investment-grade municipal securities, returned +4.18%.1 In comparison, the Barclays U.S. Treasury Index returned +0.57%.1 The tax-exempt nature of most municipal bond coupon payments included in the Barclays Municipal Bond Index further enhanced the relative strength of municipal bond performance for the six months under review.
In a September 13, 2012, news release, the Federal Open Market Committee (FOMC) cited continued elevated unemployment levels, slowing increases to business spending and sluggish home prices as reasons to augment its highly accommodative monetary policy. Beyond keeping the federal funds target rate extremely low, the FOMC stated its intention to buy $40 billion a month in mortgages for the foreseeable future. The FOMC also intended to continue its current program of buying long-term Treasury bonds and selling short-term Treasury bills and notes, commonly called Operation Twist, through the remainder of 2012. These actions during the period under review benefited the U.S. Treasury market and the municipal bond market.
Federal Reserve Board Chairman Ben Bernanke spoke on August 31, 2012, about state and local government austerity measures as a headwind to the pace of economic growth, adding that state and local governments had made real cuts to spending and employment. Spending cuts included reducing borrowing costs by issuing new debt at a lower rate and refinancing outstanding debt. New issuance increased during the first 11 months of 2012 compared with the same period in 2011, albeit from levels that were the lowest for new municipal bond issuance in a decade. Almost half of municipalities primary market issuance was for the purpose of refinancing outstanding debt. Year-to-date in 2012, the dollar amount of bonds issued for refinancing far outpaced the same period in 2011, but such bonds generally do not affect the total amount of outstanding municipal bonds. In contrast, bonds issued for new projects were more limited, resulting in low net supply of investment opportunities for municipal bond buyers. The scarcity of new bonds drove prices higher during the period.
1. Source: © 2012 Morningstar. All Rights Reserved. The information contained herein: (1) is proprietary to Morningstar and/or its content providers; (2) may not be copied or distributed; and (3) is not warranted to be accurate, complete or timely. Neither Morningstar nor its content providers are responsible for any damages or losses arising from any use of this information. Past performance is no guarantee of future results.
4 | Semiannual Report
At period-end, we maintained our positive view of the municipal bond market. We believe municipal bonds continue to be an attractive asset class among fixed income securities, and we intend to follow our solid discipline of investing to maximize income while seeking value in the municipal bond market.
The foregoing information reflects our analysis and opinions as of November 30, 2012, the end of the reporting period. The information is not a complete analysis of every aspect of any market, country, industry, security or fund. Statements of fact are from sources considered reliable.
Semiannual Report | 5
Manager s Discussion
Consistent with our strategy, we sought to remain close to fully invested in bonds that maintain an average weighted maturity of 15 to 30 years with good call features. Based on the combination of our value-oriented philosophy of investing primarily for income and a positively sloping municipal yield curve, we favored the use of longer term bonds. We believe our conservative, buy-and-hold investment strategy can help us achieve high, current, tax-free income for shareholders.
Thank you for your continued participation in Franklin California High Yield Municipal Fund. We look forward to serving your future investment needs.
The foregoing information reflects our analysis, opinions and portfolio holdings as of November 30, 2012, the end of the reporting period. The way we implement our main investment strategies and the resulting portfolio holdings may change depending on factors such as market and economic conditions. These opinions may not be relied upon as investment advice or an offer for a particular security. The information is not a complete analysis of every aspect of any market, state, industry, security or the Fund. Statements of fact are from sources considered reliable, but the investment manager makes no representation or warranty as to their completeness or accuracy. Although historical performance is no guarantee of future results, these insights may help you understand our investment management philosophy.
Semiannual Report | 9
Your Fund s Expenses
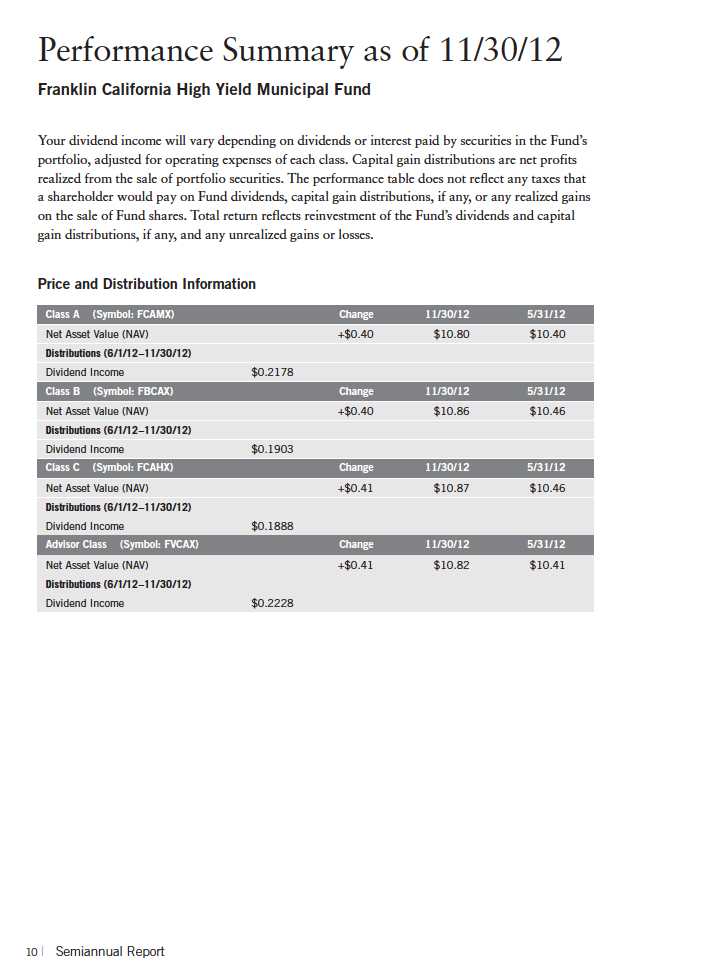
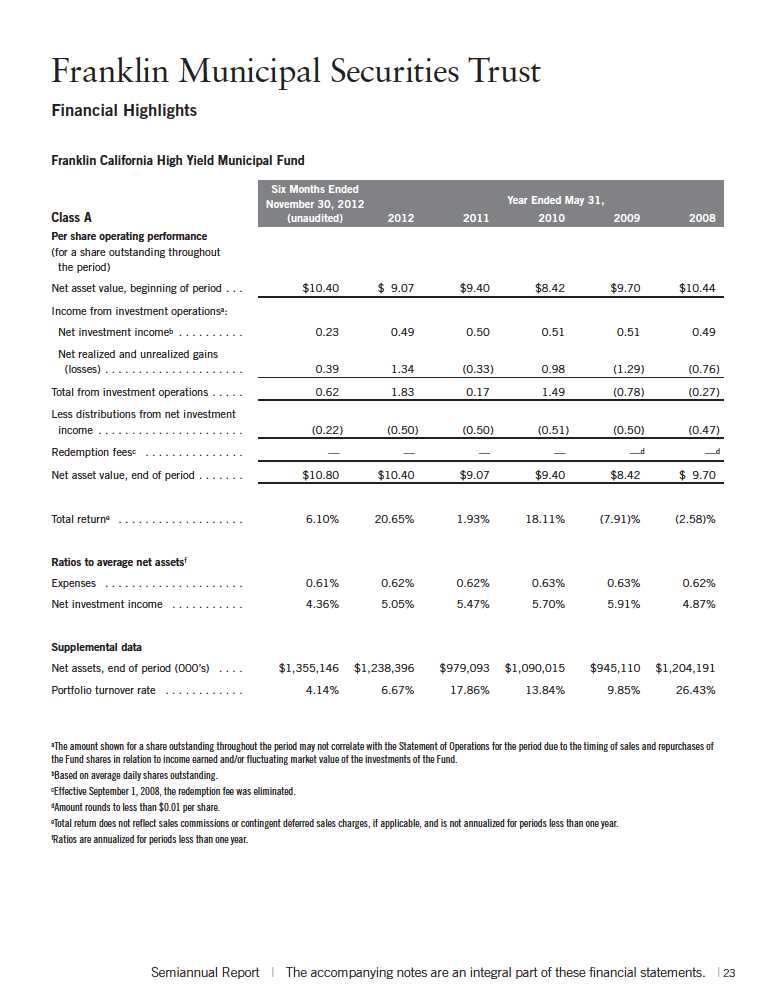
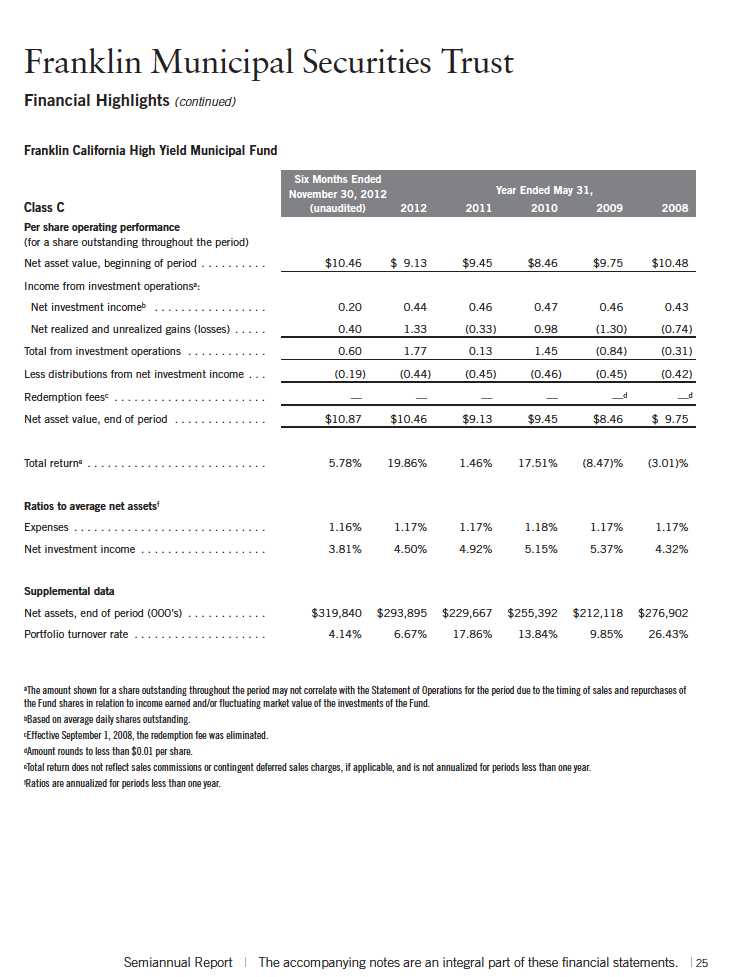
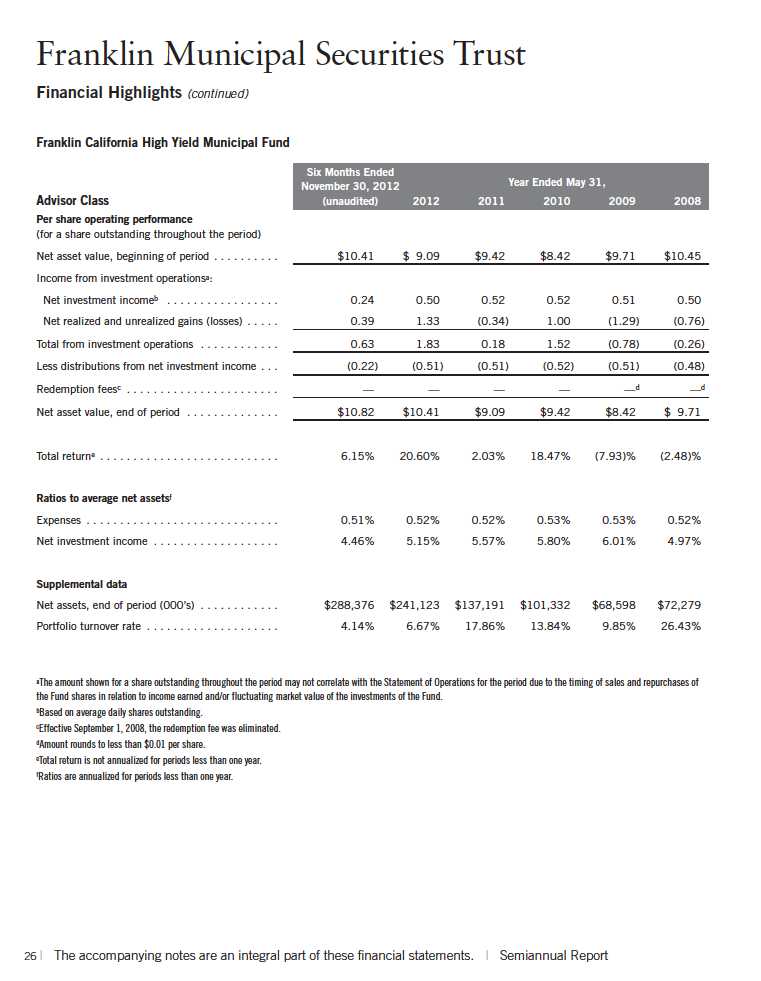
Franklin California High Yield Municipal Fund
As a Fund shareholder, you can incur two types of costs:
- Transaction costs, including sales charges (loads) on Fund purchases; and
- Ongoing Fund costs, including management fees, distribution and service (12b-1) fees, and other Fund expenses. All mutual funds have ongoing costs, sometimes referred to as operating expenses.
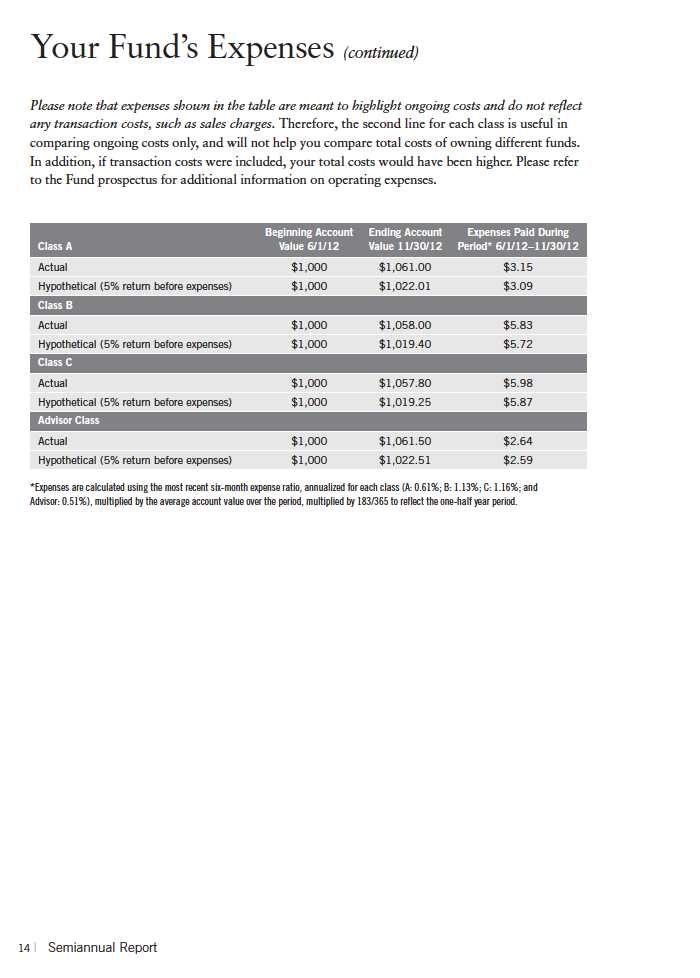
The following table shows ongoing costs of investing in the Fund and can help you understand these costs and compare them with those of other mutual funds. The table assumes a $1,000 investment held for the six months indicated.
Actual Fund Expenses
The first line (Actual) for each share class listed in the table provides actual account values and expenses. The Ending Account Value is derived from the Fund s actual return, which includes the effect of Fund expenses.
You can estimate the expenses you paid during the period by following these steps. Of course, your account value and expenses will differ from those in this illustration:
| 1. | Divide your account value by $1,000. |
| | If an account had an $8,600 value, then $8,600 ÷ $1,000 = 8.6. |
| 2. | Multiply the result by the number under the heading Expenses Paid During Period. |
| | If Expenses Paid During Period were $7.50, then 8.6 x $7.50 = $64.50. |
In this illustration, the estimated expenses paid this period are $64.50.
Hypothetical Example for Comparison with Other Funds
Information in the second line (Hypothetical) for each class in the table can help you compare ongoing costs of investing in the Fund with those of other mutual funds. This information may not be used to estimate the actual ending account balance or expenses you paid during the period. The hypothetical Ending Account Value is based on the actual expense ratio for each class and an assumed 5% annual rate of return before expenses, which does not represent the Fund s actual return. The figure under the heading Expenses Paid During Period shows the hypothetical expenses your account would have incurred under this scenario. You can compare this figure with the 5% hypothetical examples that appear in shareholder reports of other funds.
Semiannual Report | 13

Investment Strategy
We use a consistent, disciplined strategy in an effort to maximize tax-exempt
income for our shareholders while balancing risk and return within the Fund s
range of allowable investments. We generally employ a buy-and-hold approach
and invest in securities we believe should provide the most relative value in the
market. We do not use leverage or exotic derivatives, nor do we use hedging
techniques that could add volatility and contribute to underperformance in
adverse markets. We generally seek to stay close to fully invested to help maxi-
mize income distribution.
Manager s Discussion
Consistent with our strategy, we sought to remain close to fully invested in
bonds that maintain an average weighted maturity of 15 to 30 years with good
call features. Based on the combination of our value-oriented philosophy of
investing primarily for income and a positively sloping municipal yield curve,
we favored the use of longer term bonds. We believe our conservative, buy-
and-hold investment strategy can help us achieve high, current, tax-free income
for shareholders.
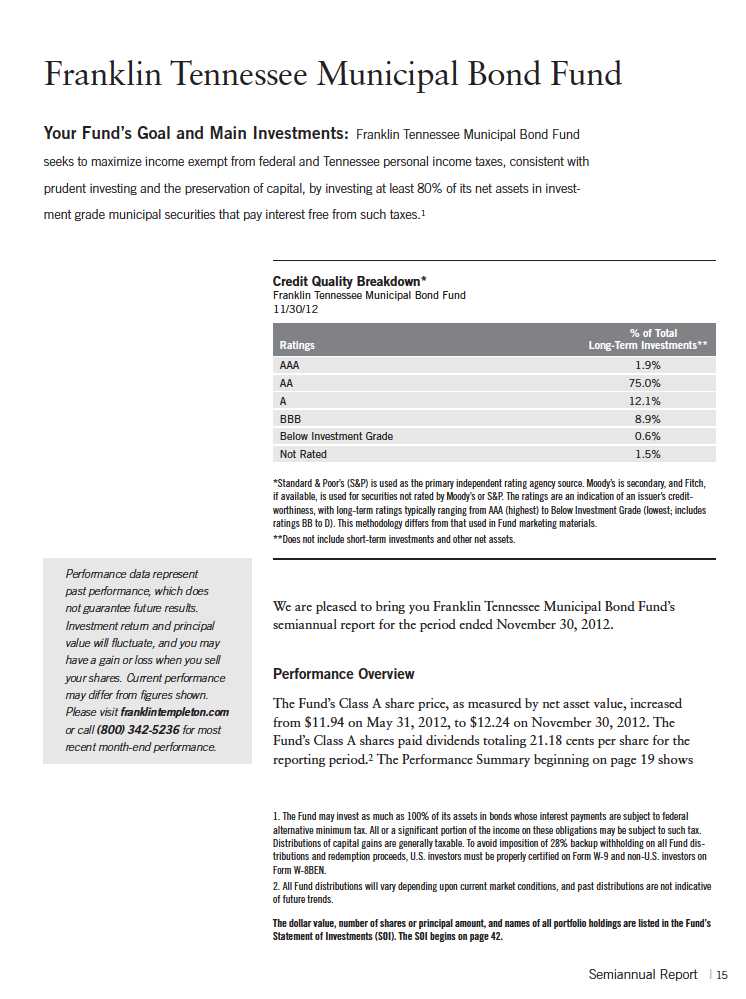
Thank you for your continued participation in Franklin Tennessee Municipal
Bond Fund. We look forward to serving your future investment needs.
The foregoing information reflects our analysis, opinions and portfolio holdings as of November 30, 2012, the end
of the reporting period. The way we implement our main investment strategies and the resulting portfolio holdings
may change depending on factors such as market and economic conditions. These opinions may not be relied upon
as investment advice or an offer for a particular security. The information is not a complete analysis of every aspect
of any market, state, industry, security or the Fund. Statements of fact are from sources considered reliable, but
the investment manager makes no representation or warranty as to their completeness or accuracy. Although
historical performance is no guarantee of future results, these insights may help you understand our investment
management philosophy.
18 | Semiannual Report
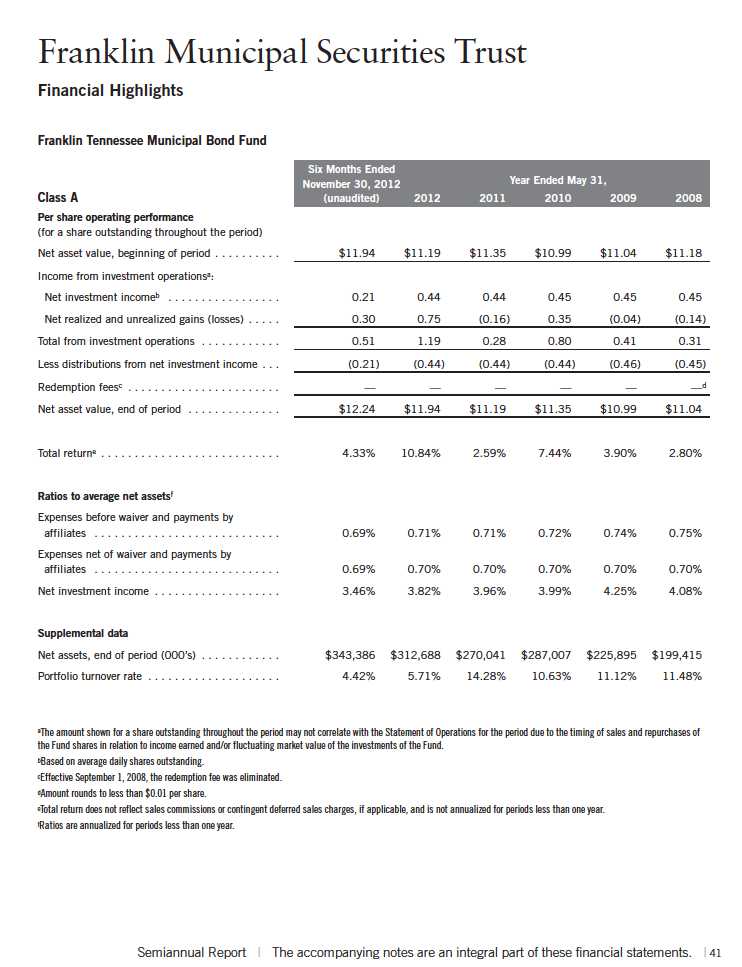
Performance Summary (continued)
Endnotes
All investments involve risks, including possible loss of principal. Because municipal bonds are sensitive to interest rate movements, the
Fund s yield and share price will fluctuate with market conditions. Bond prices generally move in the opposite direction of interest rates. Thus,
as prices of bonds in the Fund adjust to a rise in interest rates, the Fund s share price may decline. The Fund is actively managed but there is
no guarantee that the manager s investment decisions will produce the desired results. Since the Fund concentrates its investments in a single
state, it is subject to greater risk of adverse economic and regulatory changes in that state than a geographically diversified fund. Changes in
the credit rating of a bond, or in the credit rating or financial strength of a bond s issuer, insurer or guarantor, may affect the bond s value. The
Fund s prospectus also includes a description of the main investment risks.
1. Fund investment results reflect the expense reduction, without which the results would have been lower, and yield for the period would have been
1.90%.
2. Cumulative total return represents the change in value of an investment over the periods indicated.
3. Average annual total return represents the average annual change in value of an investment over the periods indicated. Six-month return has not
been annualized.
4. In accordance with SEC rules, we provide standardized average annual total return information through the latest calendar quarter.
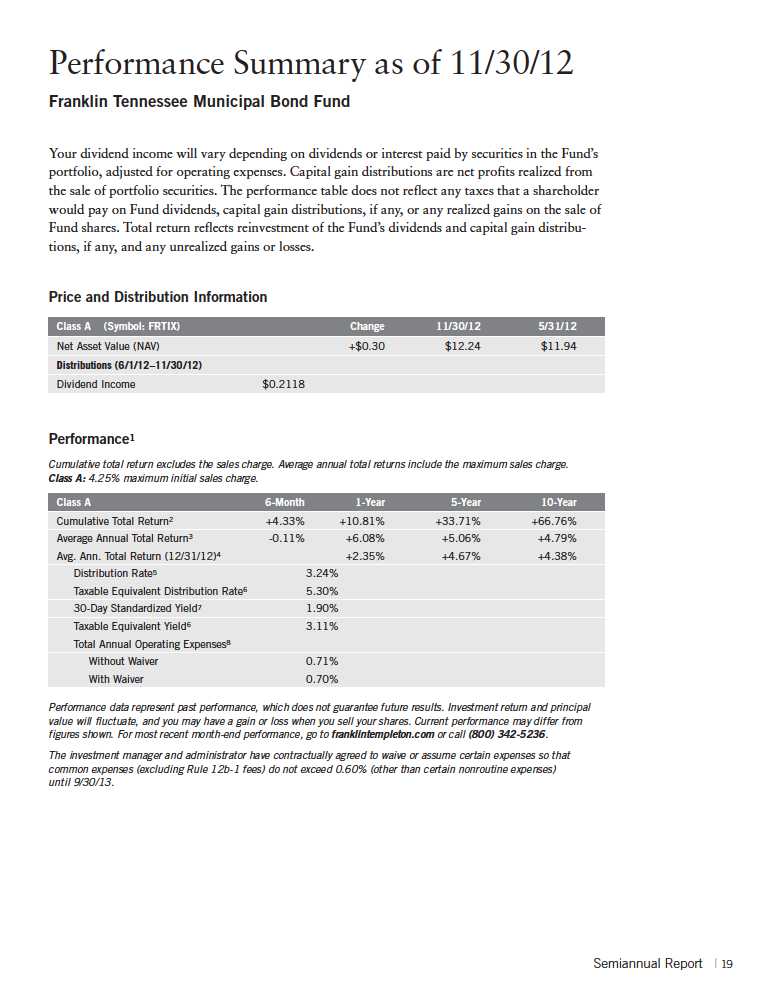
5. Distribution rate is based on an annualization of November s 3.45 cent per share monthly dividend and the maximum offering price of $12.78 per
share on 11/30/12.
6. Taxable equivalent distribution rate and yield assume the published rates as of 6/27/12 for the maximum combined effective federal and
Tennessee state personal income tax rate of 38.90%, based on the federal income tax rate of 35.00%.
7. The 30-day standardized yield for the 30 days ended 11/30/12 reflects an estimated yield to maturity (assuming all portfolio securities are held to
maturity). It should be regarded as an estimate of the Fund s rate of investment income, and it may not equal the Fund s actual income distribution
rate (which reflects the Fund s past dividends paid to shareholders) or the income reported in the Fund s financial statements.
8. Figures are as stated in the Fund s prospectus current as of the date of this report. In periods of market volatility, assets may decline significantly,
causing total annual Fund operating expenses to become higher than the figures shown.
20 | Semiannual Report
Your Fund s Expenses
Franklin Tennessee Municipal Bond Fund
As a Fund shareholder, you can incur two types of costs:
" Transaction costs, including sales charges (loads) on Fund purchases; and
" Ongoing Fund costs, including management fees, distribution and service (12b-1) fees, and other
Fund expenses. All mutual funds have ongoing costs, sometimes referred to as operating expenses.
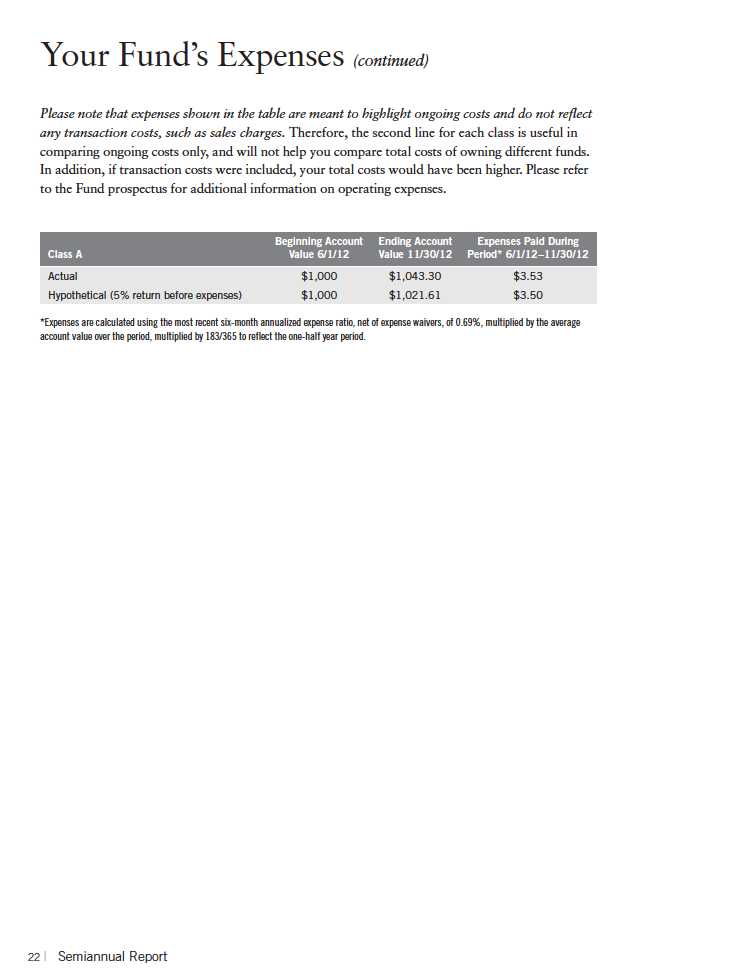
The following table shows ongoing costs of investing in the Fund and can help you understand
these costs and compare them with those of other mutual funds. The table assumes a $1,000
investment held for the six months indicated.
Actual Fund Expenses
The first line (Actual) for each share class listed in the table provides actual account values and
expenses. The Ending Account Value is derived from the Fund s actual return, which includes
the effect of Fund expenses.
You can estimate the expenses you paid during the period by following these steps. Of course,
your account value and expenses will differ from those in this illustration:
1. Divide your account value by $1,000.
If an account had an $8,600 value, then $8,600 ÷ $1,000 = 8.6.
2. Multiply the result by the number under the heading Expenses Paid During Period.
If Expenses Paid During Period were $7.50, then 8.6 x $7.50 = $64.50.
In this illustration, the estimated expenses paid this period are $64.50.
Hypothetical Example for Comparison with Other Funds
Information in the second line (Hypothetical) for each class in the table can help you compare
ongoing costs of investing in the Fund with those of other mutual funds. This information may
not be used to estimate the actual ending account balance or expenses you paid during the period.
The hypothetical Ending Account Value is based on the actual expense ratio for each class and
an assumed 5% annual rate of return before expenses, which does not represent the Fund s actual
return. The figure under the heading Expenses Paid During Period shows the hypothetical
expenses your account would have incurred under this scenario. You can compare this figure with
the 5% hypothetical examples that appear in shareholder reports of other funds.
Semiannual Report | 21


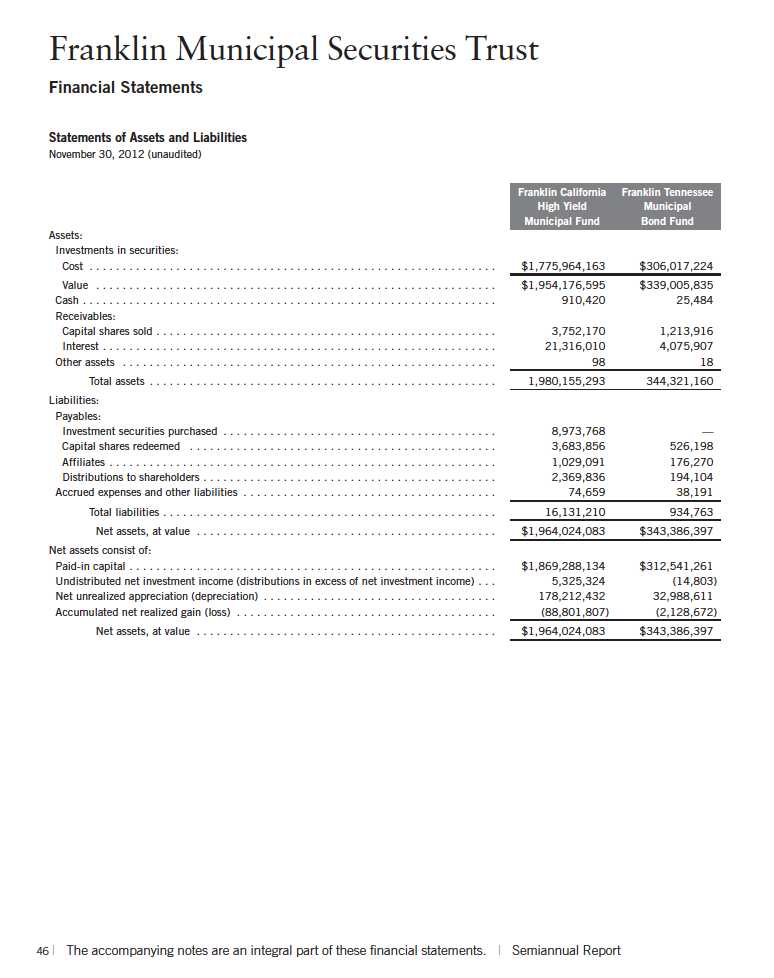
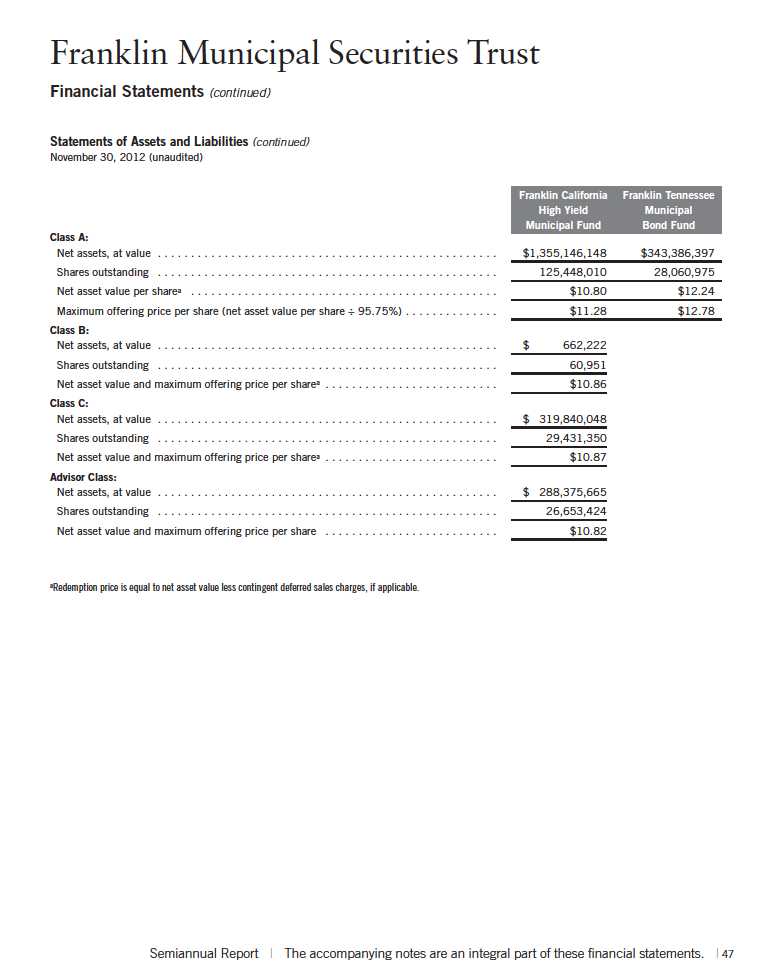
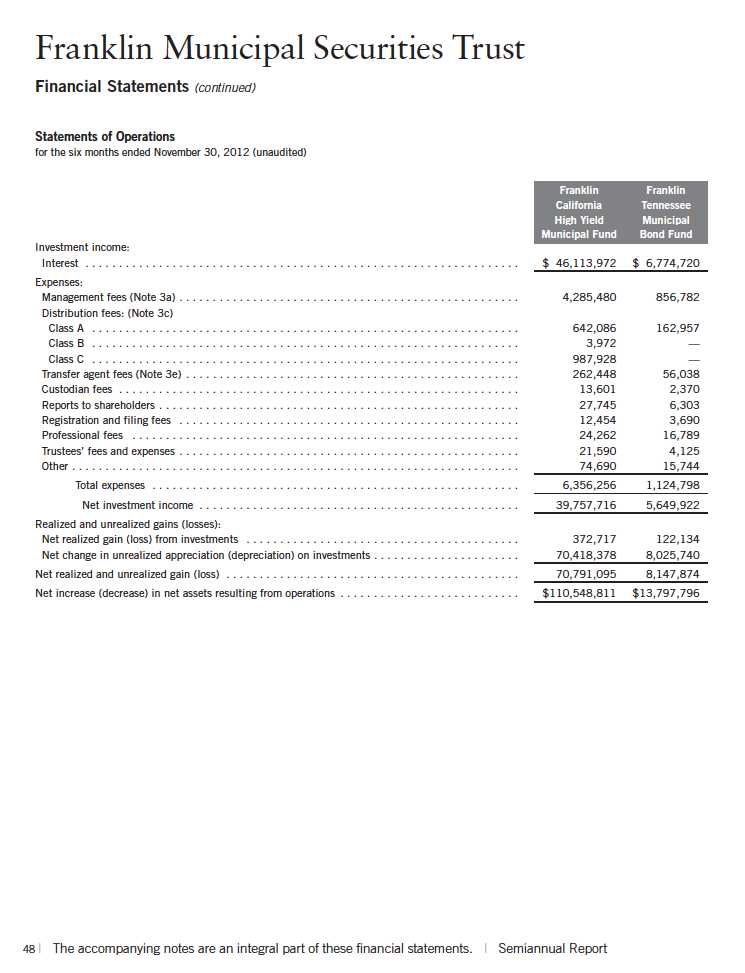
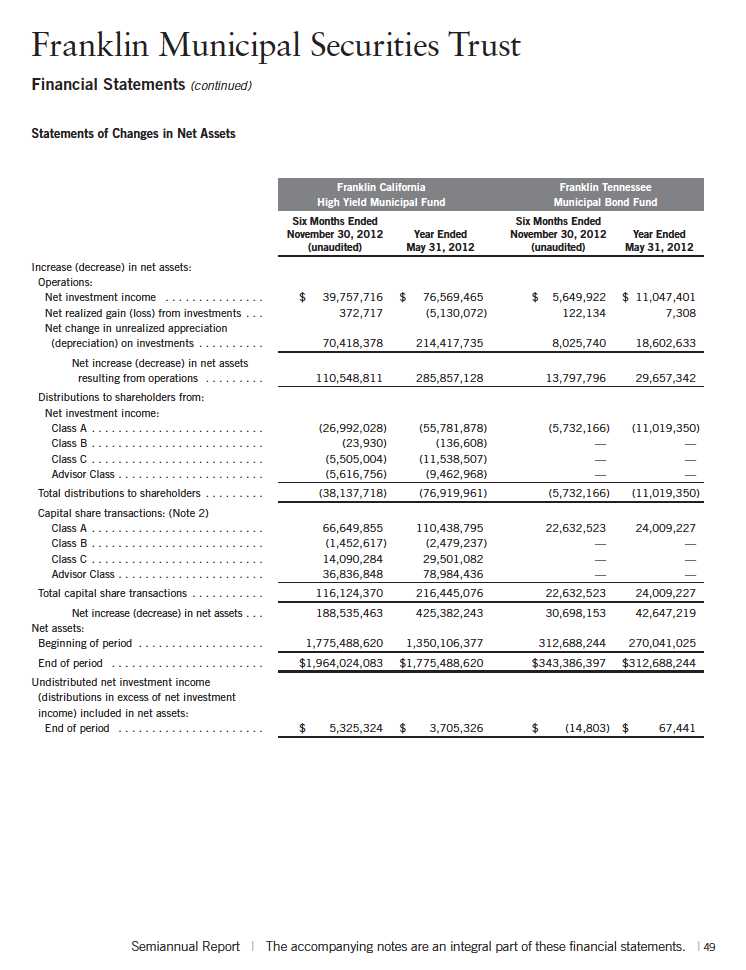
Franklin Municipal Securities Trust
Notes to Financial Statements (unaudited) (continued)
| 1. | ORGANIZATION AND SIGNIFICANT ACCOUNTING POLICIES (continued) |
| a. | Financial Instrument Valuation (continued) |
be used in which the anticipated future cash flows of the investment are discounted to calculate fair value. Discounts may also be applied due to the nature or duration of any restrictions on the disposition of the investments. Due to the inherent uncertainty of valuations of such investments, the fair values may differ significantly from the values that would have been used had an active market existed. The VLOC employs various methods for calibrating these valuation approaches including a regular review of key inputs and assumptions, transactional back-testing or disposition analysis, and reviews of any related market activity.
b. Securities Purchased on a When-Issued Basis
Certain funds purchase securities on a when-issued basis, with payment and delivery scheduled for a future date. These transactions are subject to market fluctuations and are subject to the risk that the value at delivery may be more or less than the trade date purchase price. Although the funds will generally purchase these securities with the intention of holding the securities, they may sell the securities before the settlement date. Sufficient assets have been segregated for these securities.
c. Income Taxes
It is each fund s policy to qualify as a regulated investment company under the Internal Revenue Code. Each fund intends to distribute to shareholders substantially all of its income and net realized gains to relieve it from federal income and excise taxes. As a result, no provision for U.S. federal income taxes is required.
Each fund recognizes the tax benefits of uncertain tax positions only when the position is more likely than not to be sustained upon examination by the tax authorities based on the technical merits of the tax position. As of November 30, 2012, and for all open tax years, each fund has determined that no liability for unrecognized tax benefits is required in each fund s financial statements related to uncertain tax positions taken on a tax return (or expected to be taken on future tax returns). Open tax years are those that remain subject to examination and are based on each tax jurisdiction statute of limitation.
d. Security Transactions, Investment Income, Expenses and Distributions
Security transactions are accounted for on trade date. Realized gains and losses on security transactions are determined on a specific identification basis. Interest income and estimated expenses are accrued daily. Amortization of premium and accretion of discount on debt securities are included in interest income. Dividends from net investment income are normally declared daily; these dividends may be reinvested or paid monthly to shareholders. Distributions to shareholders are determined according to income tax regulations (tax basis). Distributable earnings determined on a tax basis may differ from earnings recorded in accordance with accounting principles generally accepted in the United States of America. These differences may be permanent or temporary. Permanent differences are reclassified among capital accounts to reflect their tax character. These
Semiannual Report | 51
Franklin Municipal Securities Trust
Notes to Financial Statements (unaudited) (continued)
| 1. | ORGANIZATION AND SIGNIFICANT ACCOUNTING POLICIES (continued) |
| d. | Security Transactions, Investment Income, Expenses and Distributions (continued) |
reclassifications have no impact on net assets or the results of operations. Temporary differences are not reclassified, as they may reverse in subsequent periods.
Common expenses incurred by the Trust are allocated among the Funds based on the ratio of net assets of each fund to the combined net assets of the Trust. Fund specific expenses are charged directly to the fund that incurred the expense.
Realized and unrealized gains and losses and net investment income, not including class specific expenses, are allocated daily to each class of shares based upon the relative proportion of net assets of each class. Differences in per share distributions, by class, are generally due to differences in class specific expenses.
e. Insurance
The scheduled payments of interest and principal for each insured municipal security in the Trust are insured by either a new issue insurance policy or a secondary insurance policy. Some municipal securities in the Funds are secured by collateral guaranteed by an agency of the U.S. government. Depending on the type of coverage, premiums for insurance are either added to the cost basis of the security or paid by a third party.
Insurance companies typically insure municipal bonds that tend to be of very high quality, with the majority of underlying municipal bonds rated A or better. However, an event involving an insurer could have an adverse effect on the value of the securities insured by that insurance company. There is no guarantee the insurer will be able to fulfill its obligations under the terms of the policy.
f. Accounting Estimates
The preparation of financial statements in accordance with accounting principles generally accepted in the United States of America requires management to make estimates and assumptions that affect the reported amounts of assets and liabilities at the date of the financial statements and the amounts of income and expenses during the reporting period. Actual results could differ from those estimates.
g. Guarantees and Indemnifications
Under the Trust s organizational documents, its officers and trustees are indemnified by the Trust against certain liabilities arising out of the performance of their duties to the Trust. Additionally, in the normal course of business, the Trust, on behalf of the Funds, enters into contracts with service providers that contain general indemnification clauses. The Trust s maximum exposure under these arrangements is unknown as this would involve future claims that may be made against the Trust that have not yet occurred. Currently, the Trust expects the risk of loss to be remote.
52 | Semiannual Report


Franklin Municipal Securities Trust
Notes to Financial Statements (unaudited) (continued)
7. CONCENTRATION OF RISK
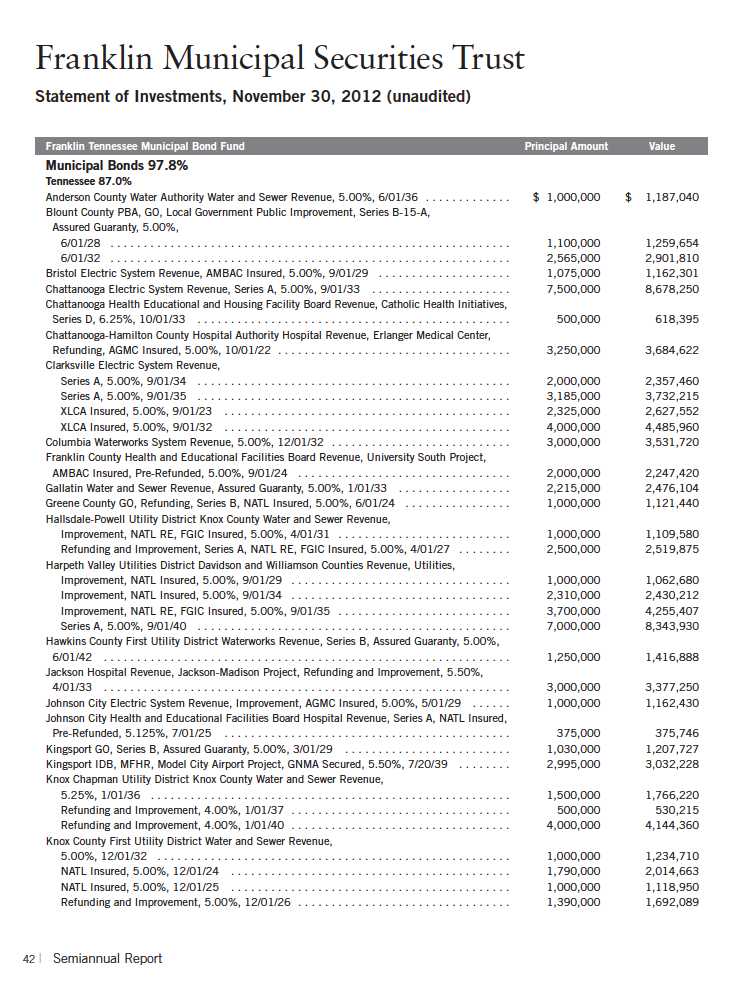
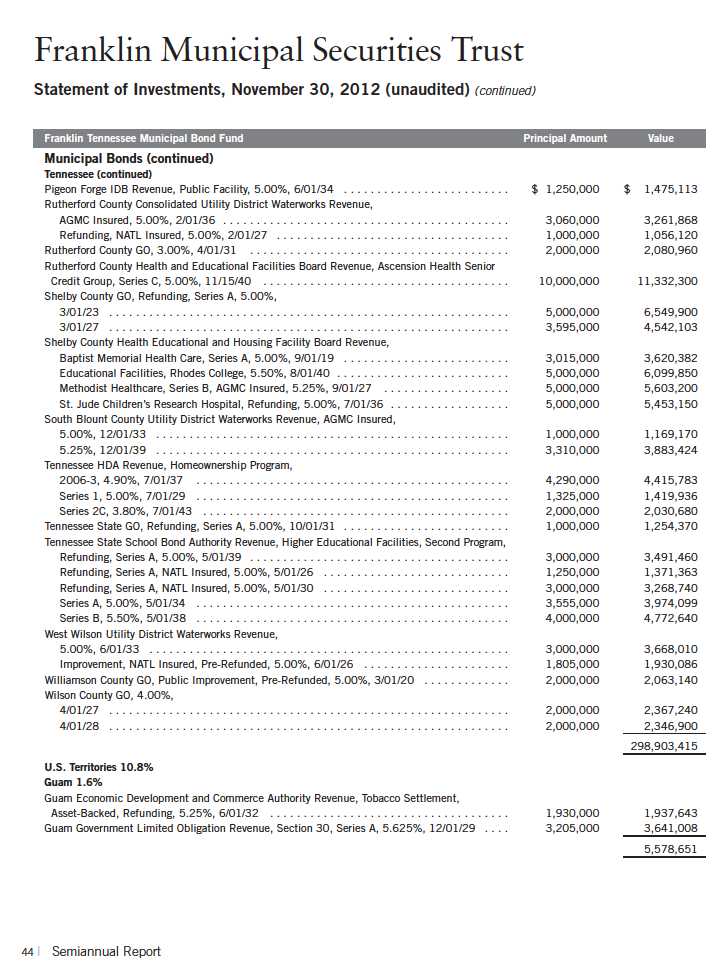
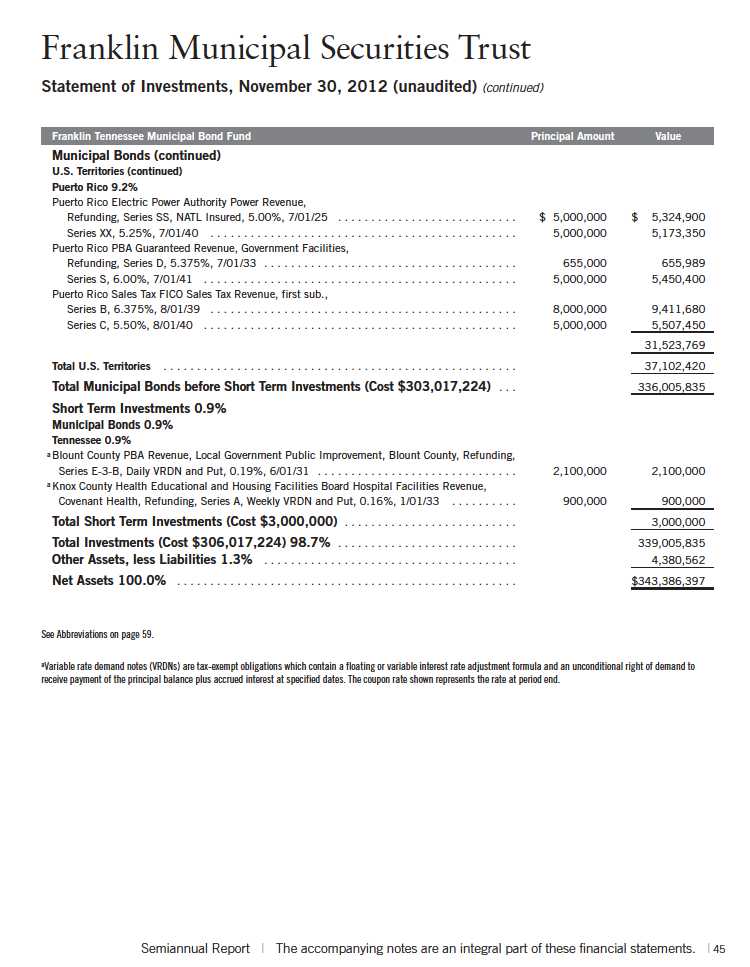
Each of the Funds invests a large percentage of its total assets in obligations of issuers within its respective state and U.S. territories. Such concentration may subject the Funds to risks associated with industrial or regional matters, and economic, political or legal developments occurring within those states and U.S. territories. In addition, investments in these securities are sensitive to interest rate changes and credit risk of the issuer and may subject the funds to increased market volatility. The market for these investments may be limited, which may make them difficult to buy or sell.
8. CREDIT FACILITY
The Funds, together with other U.S. registered and foreign investment funds (collectively, Borrowers), managed by Franklin Templeton Investments, are borrowers in a joint syndicated senior unsecured credit facility totaling $1.5 billion (Global Credit Facility) which matures on January 18, 2013. This Global Credit Facility provides a source of funds to the Borrowers for temporary and emergency purposes, including the ability to meet future unanticipated or unusually large redemption requests.
Under the terms of the Global Credit Facility, the Funds shall, in addition to interest charged on any borrowings made by the Funds and other costs incurred by the Funds, pay their share of fees and expenses incurred in connection with the implementation and maintenance of the Global Credit Facility, based upon their relative share of the aggregate net assets of all of the Borrowers, including an annual commitment fee of 0.08% based upon the unused portion of the Global Credit Facility, which is reflected in other expenses on the Statements of Operations. During the period ended November 30, 2012, the Funds did not use the Global Credit Facility.
9. FAIR VALUE MEASUREMENTS
The Funds follow a fair value hierarchy that distinguishes between market data obtained from independent sources (observable inputs) and the Funds own market assumptions (unobservable inputs). These inputs are used in determining the value of the Funds financial instruments and are summarized in the following fair value hierarchy:
- Level 1 quoted prices in active markets for identical financial instruments
- Level 2 other significant observable inputs (including quoted prices for similar financial instruments, interest rates, prepayment speed, credit risk, etc.)
- Level 3 significant unobservable inputs (including the Funds own assumptions in determining the fair value of financial instruments)
The inputs or methodology used for valuing financial instruments are not an indication of the risk associated with investing in those financial instruments.
58 | Semiannual Report

Franklin Municipal Securities Trust
Shareholder Information
Proxy Voting Policies and Procedures
The Trust s investment manager has established Proxy Voting Policies and Procedures (Policies) that the Trust uses to determine how to vote proxies relating to portfolio securities. Shareholders may view the Trust s complete Policies online at franklintempleton.com. Alternatively, shareholders may request copies of the Policies free of charge by calling the Proxy Group collect at (954) 527-7678 or by sending a written request to: Franklin Templeton Companies, LLC, 300 S.E. 2nd Street, Fort Lauderdale, FL 33301, Attention: Proxy Group. Copies of the Trust s proxy voting records are also made available online at franklintempleton.com and posted on the U.S. Securities and Exchange Commission s website at sec.gov and reflect the most recent 12-month period ended June 30.
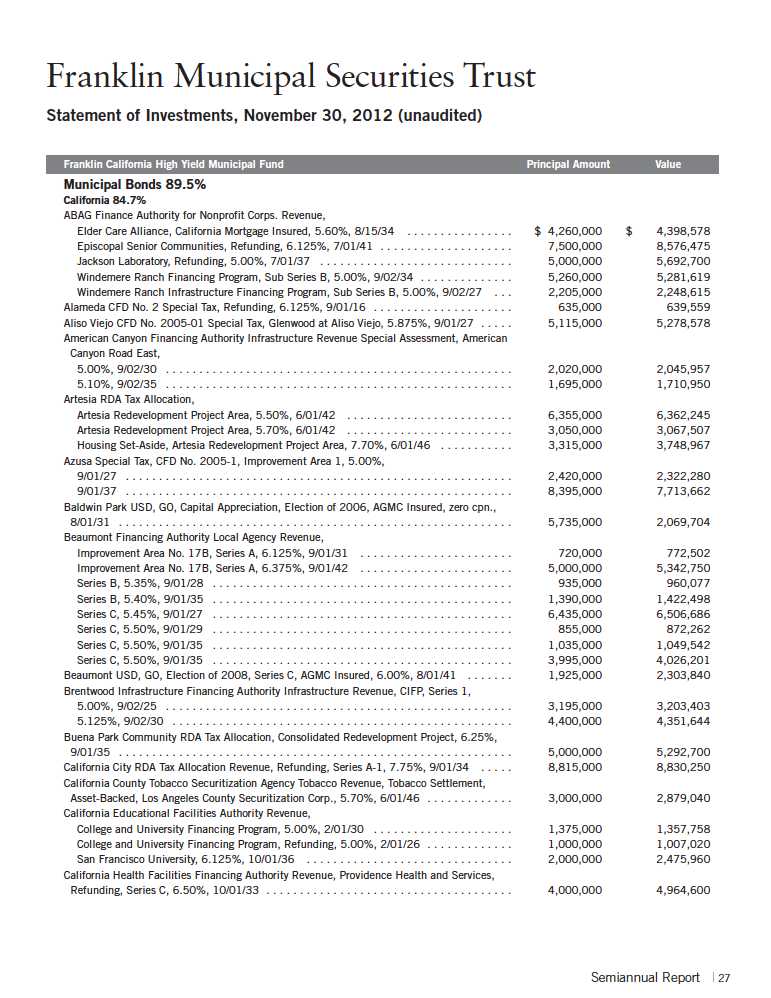
Quarterly Statement of Investments
The Trust files a complete statement of investments with the U.S. Securities and Exchange Commission for the first and third quarters for each fiscal year on Form N-Q. Shareholders may view the filed Form N-Q by visiting the Commission s website at sec.gov. The filed form may also be viewed and copied at the Commission s Public Reference Room in Washington, DC. Information regarding the operations of the Public Reference Room may be obtained by calling (800) SEC-0330.
60 | Semiannual Report