

Semiannual Report
Municipal Bond Market Overview
For the six months ended November 30, 2011, the municipal bond market posted solid gains as measured by various Barclays Capital (BC) Municipal Bond Indexes. The BC Municipal Bond Index, which tracks investment-grade securities, returned +4.40% for the reporting period, while the BC Municipal Non-Investment Grade Index, which tracks below investment-grade securities, returned +4.15%.1 However, over the reporting period municipal bonds generally underperformed Treasuries, which returned +6.04% according to the BC U.S. Treasury Index, which tracks various U.S. Treasury securities.1
During the reporting period, domestic and global events affected the municipal bond market. Domestically, the Federal Reserve Board’s commitment to maintain an accommodative monetary policy stance with historically low interest rates supported the municipal market. The market was further supported by an extended period of low supply, thus reducing the availability of bonds to meet investor demand. In Europe, several countries struggled with financial challenges that resulted in a flight to quality benefiting the U.S Treasury market, as well as the municipal bond market.
From a credit perspective, on August 2, 2011, the U.S. raised its debt ceiling and avoided defaulting on its debt obligations. Independent credit rating agency Standard & Poor’s (S&P) lowered the country’s long-term rating to AA+ from AAA, citing political risks and a rising debt burden.2 All municipal bonds backed by the U.S. government or government-sponsored enterprises (GSEs) were also downgraded along with the country’s rating and those of GSEs. S&P’s downgrade of U.S. Treasury securities led to the review of more than 11,000 municipal credits supported by federal programs and agency escrows. Primarily, prerefunded municipal bonds and housing bonds tied to federal subsidy programs were affected by the downgrade, although they generally still carried high-grade ratings. Furthermore, Moody’s Investors Service on July 19, 2011, placed five AAA-rated states on its watch list for potential rating cuts partly based on their dependency on federal funding. After the debt ceiling was raised, Moody’s reconfirmed the AAA rating to states and public finance issuers previously identified as directly or indirectly linked to the U.S. government.2 The same credits are currently assigned a negative outlook based on the identification of certain shared characteristics.
1. Source: © 2011 Morningstar. All Rights Reserved. The information contained herein: (1) is proprietary to Morningstar and/or its content providers; (2) may not be copied or distributed; and (3) is not warranted to be accurate, complete or timely. Neither Morningstar nor its content providers are responsible for any damages or losses arising from any use of this information. Past performance is no guarantee of future results.
2. This does not indicate a rating of the Funds.
4 | Semiannual Report
Congress enacted the Budget Control Act of 2011 with the potential to reduce the federal deficit by approximately $2 trillion by 2021. While the plan of action is unknown, one can expect it to impact state and local programs dependent on federal subsidies. State and local officials may need to reevaluate current budget forecasts and the potential effects. One important element to recognize is that most states are constitutionally required to balance their budgets regardless of any monetary changes in aid received from the federal government.
During this reporting period, state and local officials made unpopular and difficult decisions to close budget gaps. Proactive states successfully balanced and passed budgets on time using a variety of measures. For example, they raised tuition and fees at higher education institutions, reduced government expenditures by eliminating and consolidating departments, and lowered aid to various programs. Despite the challenges, many states continued to show mild growth in state revenues, and the actual default rate for municipal bonds was very low.
At period-end, we maintained our positive view of the municipal bond market. Municipal bond yields were well above those of comparable Treasury securities on a nominal basis and an after-tax basis. Therefore, we believe municipal bonds continue to be an attractive asset class among fixed income securities, and we intend to follow our solid discipline of investing to maximize income while seeking value in the municipal bond market.
The foregoing information reflects our analysis and opinions as of November 30, 2011, the end of the reporting period. The information is not a complete analysis of every aspect of any market, country, industry, security or fund. Statements of fact are from sources considered reliable.
Semiannual Report | 5
Franklin California
High Yield Municipal Fund
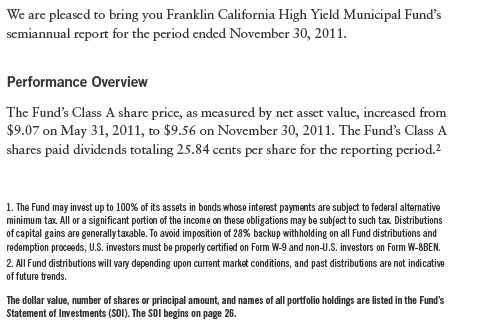
Your Fund’s Goals and Main Investments: Franklin California High Yield Municipal Fund seeks to provide a high level of income exempt from federal and California personal income taxes by investing at least 80% of its net assets in municipal securities, including higher yielding, lower rated securities, that pay interest free from such taxes.1 Its secondary goal is capital appreciation.
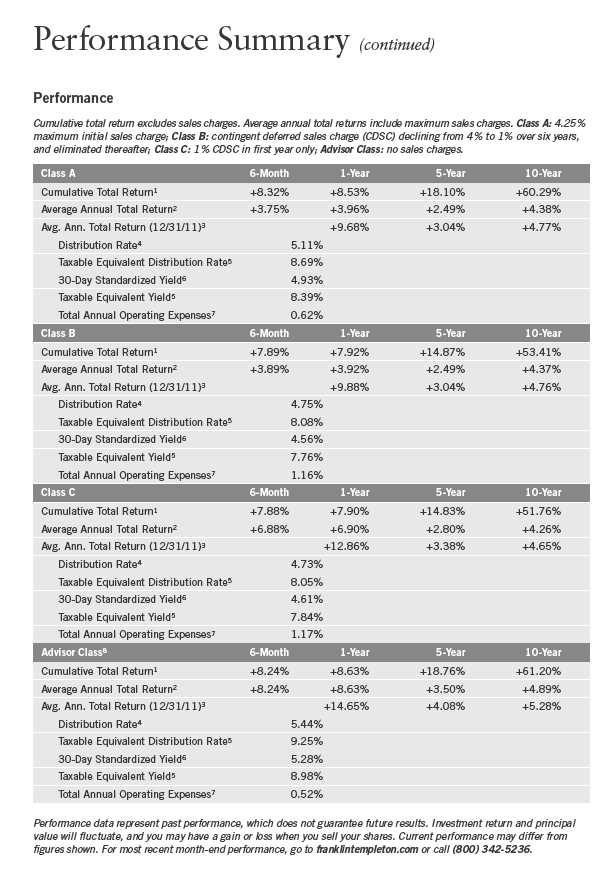
Performance data represent past performance, which does not guarantee future results. Investment return and principal value will fluctuate, and you may have a gain or loss when you sell your shares. Current performance may differ from figures shown. Please visit franklintempleton.com or call (800) 342-5236 for most recent month-end performance.
6 | Semiannual Report
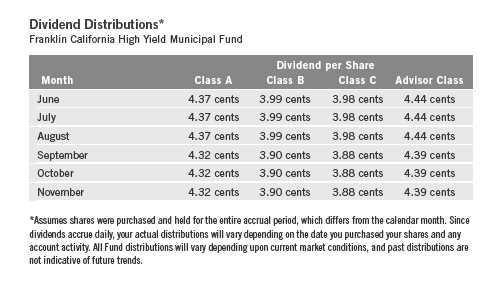
The Performance Summary beginning on page 10 shows that at the end of this reporting period the Fund’s Class A shares’ distribution rate was 5.11% based on an annualization of the current 4.25 cent per share monthly dividend and the maximum offering price of $9.98 on November 30, 2011. An investor in the 2011 maximum combined effective federal and California personal income tax bracket of 41.21% would need to earn a distribution rate of 8.69% from a taxable investment to match the Fund’s Class A tax-free distribution rate. For the Fund’s Class B, C and Advisor shares’ performance, please see the Performance Summary. Dividend distributions during the period under review were affected by decreasing interest rates. Additionally, investor demand was strong for municipal bonds in an environment of limited tax-exempt supply. These factors resulted in reduced income for the portfolio and caused dividends to decline.
State Update
California’s diverse and wealthy economy, the largest contributor to U.S. gross domestic product and the world’s eighth-largest if it were a country, continued its post-recession recovery albeit at a slower pace than the nation as a whole. Persistently weak real estate markets, high foreclosure rates and low home-building activity hindered the state’s economic advance, reducing its citizens’ higher-than-average household wealth levels. California’s 11.3% unemployment rate in November was significantly higher than the 8.7% national rate.3 The state gained jobs in all sectors except construction and manufacturing. The mining and logging, government, and education and health services sectors posted the strongest six-month growth rates. In the economic forecast included
3. Source: Bureau of Labor Statistics.
Semiannual Report | 7

with the governor’s fiscal year 2012 budget proposal, the state projected slim job growth of 1.2% in 2011, a pace that would lag working-age population growth.4 However, the state projected job growth to accelerate in 2012 and 2013, with nonfarm jobs lost during the Great Recession to be recovered fully by the third quarter of 2016.
California enacted an on-time fiscal year 2012 budget that addressed a $17 billion budget shortfall with $14 billion of deep spending cuts across state services and employment.5 Resolving the budget gap relied on a recent, above-par revenue trend but had built-in spending-cut triggers if the additional revenues did not materialize. Unlike recent years, the 2012 budget relied less on one-time revenues and accounting gimmicks. However, it was not fully structurally balanced and depended on several billion dollars of cash deferrals and one-time revenues, some of which were derived from uncertain or contentious sources. Fortunately, a combination of cash management tools and higher-than-projected revenue growth into the summer of 2011 materially improved the state’s cash position. By mid-November, however, the governor’s office announced state revenues for the first four months of the 2012 fiscal year (July-October) were running behind expectations. Without additional revenues lawmakers had optimistically relied on to help balance the budget in June, the state at period-end faced a much greater-than-planned shortfall of $13 billion in fiscal 2012, having chipped just $4 billion off of its initial estimate.6 If revenues fail to meet targets, deep and automatic mid-year cuts to health and education will be triggered.
The state’s net tax-supported debt was $2,542 per capita and 6.0% of personal income, compared with the $1,066 and 2.8% national medians.7 Although California’s debt levels ranked among the nation’s highest, they were moderate given the state’s large budget. However, Californians’ debt ratios are likely to increase in the next few years, with sizable outstanding tax-supported debt and unused voter authorizations for the future issuance of general fund-backed general obligation (GO) bonds. The state’s recession-tarnished credit standing improved slightly in mid-2011 as independent credit rating agency Standard & Poor’s in July affirmed California’s GO bond rating of A- (the nation’s lowest) while upgrading its outlook to stable from negative.8 The rating and new outlook acknowledged the state’s economic depth and diversity, prominent higher-education institutions, innovative businesses and sectors, as well
4. Source: Edmund G. Brown, Jr., Governor, State of California, “2011-12 Governor’s Budget Summary,” 1/10/11.
5. Source: Moody’s Investors Service, “Special Comment: California Enacts Timely Budget from Strengthened Position,” 7/5/11.
6. Source: California Department of Finance (www.dof.ca.gov).
7. Source: Moody’s Investors Service, “Special Comment: 2011 State Debt Medians Report,” 5/25/11.
8. This does not indicate S&P’s rating of the Fund.
8 | Semiannual Report
as improved liquidity and budgeting flexibility that maintains adequate cash for priority payments. These positives were counterbalanced by California’s large debt, retirement benefit and budgetary liabilities, as well as potentially onerous governance rules that have contributed to delayed fiscal decision making over the years.
Investment Strategy
We use a consistent, disciplined strategy in an effort to maximize tax-exempt income for our shareholders by seeking to maintain exposure to higher coupon securities while balancing risk and return within the Fund’s range of allowable investments. We generally employ a buy-and-hold approach and invest in securities we believe should provide the most relative value in the market. As we invest during different interest rate environments, the Fund’s portfolio remains diversified with a broad range of securities. This broad diversification may help mitigate interest rate risk. We do not use leverage or exotic derivatives, nor do we use hedging techniques that could add volatility and contribute to underperformance in adverse markets. We generally stay fully invested to help maximize income distribution.
Manager’s Discussion
The combination of our value-oriented philosophy of investing primarily for income and a positive-sloping municipal yield curve favored the use of longer-term bonds. Consistent with our strategy, we sought to purchase bonds that ranged from 15 to 30 years in maturity with good call features. Furthermore, by focusing on relative value and attractive credit spreads, especially in California, we were able to find attractive investment opportunities in this volatile market. We believe our conservative, buy-and-hold investment strategy can help us achieve high, current, tax-free income for shareholders.
Thank you for your continued participation in Franklin California High Yield Municipal Fund. We look forward to serving your future investment needs.
The foregoing information reflects our analysis, opinions and portfolio holdings as of November 30, 2011, the end of the reporting period. The way we implement our main investment strategies and the resulting portfolio holdings may change depending on factors such as market and economic conditions. These opinions may not be relied upon as investment advice or an offer for a particular security. The information is not a complete analysis of every aspect of any market, state, industry, security or the Fund. Statements of fact are from sources considered reliable, but the investment manager makes no representation or warranty as to their completeness or accuracy. Although historical performance is no guarantee of future results, these insights may help you understand our investment management philosophy.
Semiannual Report | 9
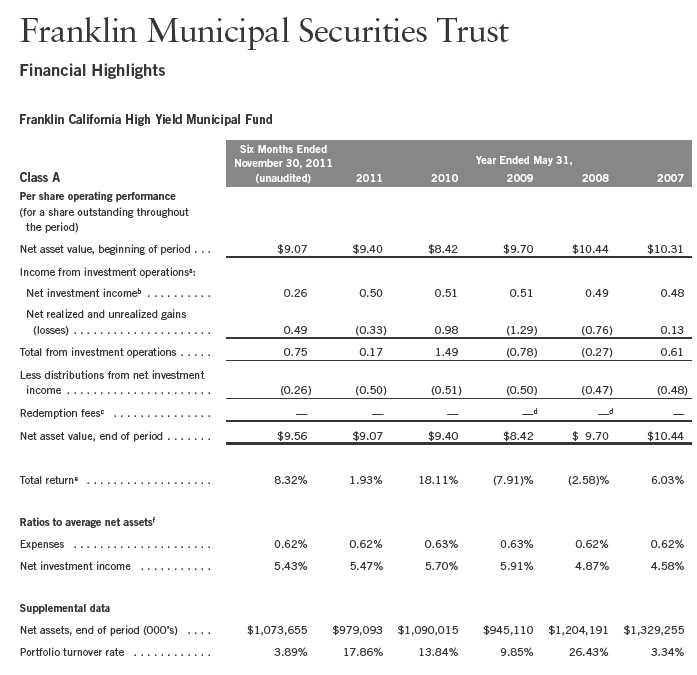
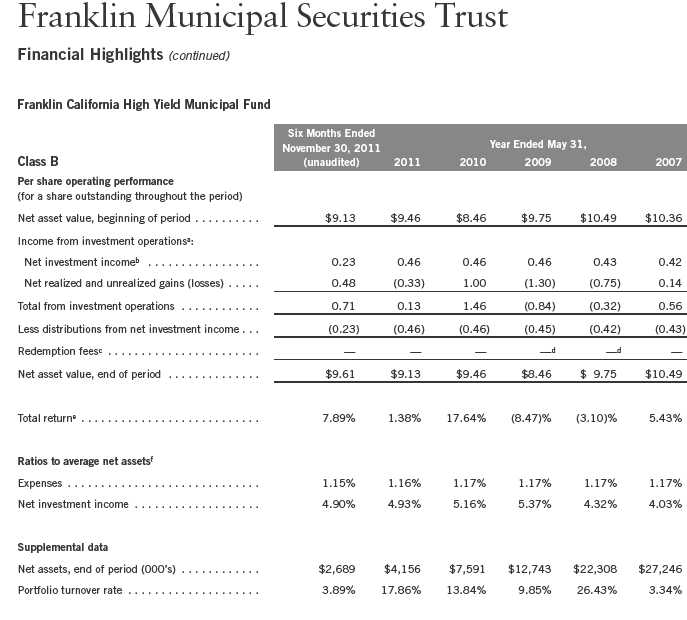
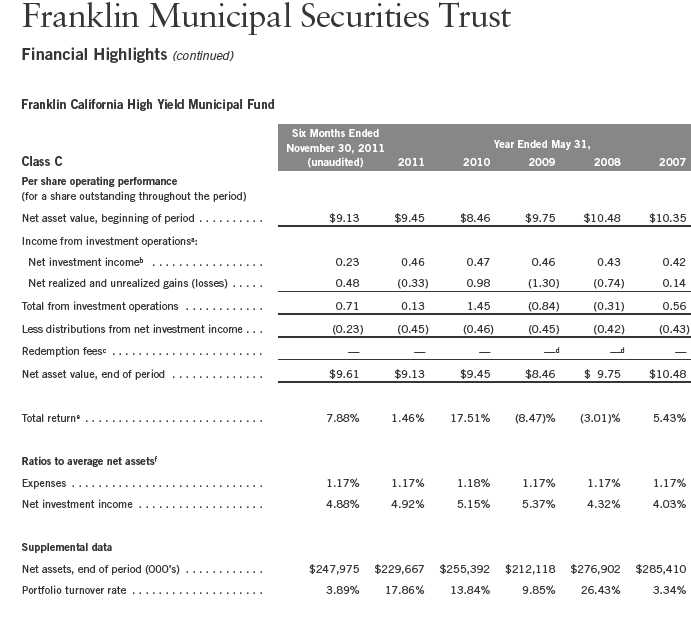
Performance Summary as of 11/30/11
Franklin California High Yield Municipal Fund
Your dividend income will vary depending on dividends or interest paid by securities in the Fund’s portfolio, adjusted for operating expenses of each class. Capital gain distributions are net profits realized from the sale of portfolio securities. The performance table does not reflect any taxes that a shareholder would pay on Fund dividends, capital gain distributions, if any, or any realized gains on the sale of Fund shares. Total return reflects reinvestment of the Fund’s dividends and capital gain distributions, if any, and any unrealized gains or losses.

10 | Semiannual Report
Semiannual Report | 11

12 | Semiannual Report
Your Fund’s Expenses
Franklin California High Yield Municipal Fund
As a Fund shareholder, you can incur two types of costs:
• Transaction costs, including sales charges (loads) on Fund purchases; and
• Ongoing Fund costs, including management fees, distribution and service (12b-1) fees, and other Fund expenses. All mutual funds have ongoing costs, sometimes referred to as operating expenses.
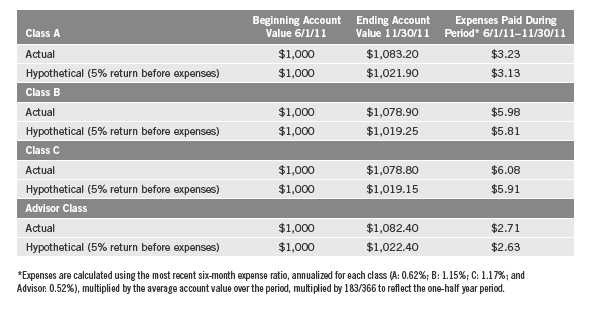
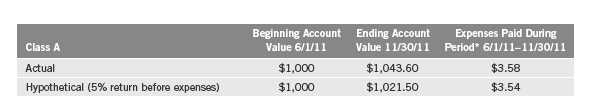
The following table shows ongoing costs of investing in the Fund and can help you understand these costs and compare them with those of other mutual funds. The table assumes a $1,000 investment held for the six months indicated.
Actual Fund Expenses
The first line (Actual) for each share class listed in the table provides actual account values and expenses. The “Ending Account Value” is derived from the Fund’s actual return, which includes the effect of Fund expenses.
You can estimate the expenses you paid during the period by following these steps. Of course, your account value and expenses will differ from those in this illustration:
1. Divide your account value by $1,000.
If an account had an $8,600 value, then $8,600 ÷ $1,000 = 8.6.
2. Multiply the result by the number under the heading “Expenses Paid During Period.”
If Expenses Paid During Period were $7.50, then 8.6 x $7.50 = $64.50.
In this illustration, the estimated expenses paid this period are $64.50.
Hypothetical Example for Comparison with Other Funds
Information in the second line (Hypothetical) for each class in the table can help you compare ongoing costs of investing in the Fund with those of other mutual funds. This information may not be used to estimate the actual ending account balance or expenses you paid during the period. The hypothetical “Ending Account Value” is based on the actual expense ratio for each class and an assumed 5% annual rate of return before expenses, which does not represent the Fund’s actual return. The figure under the heading “Expenses Paid During Period” shows the hypothetical expenses your account would have incurred under this scenario. You can compare this figure with the 5% hypothetical examples that appear in shareholder reports of other funds.
Semiannual Report | 13
Your Fund’s Expenses (continued)
Please note that expenses shown in the table are meant to highlight ongoing costs and do not reflect any transaction costs, such as sales charges. Therefore, the second line for each class is useful in comparing ongoing costs only, and will not help you compare total costs of owning different funds. In addition, if transaction costs were included, your total costs would have been higher. Please refer to the Fund prospectus for additional information on operating expenses.
14 | Semiannual Report
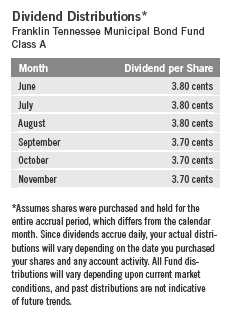
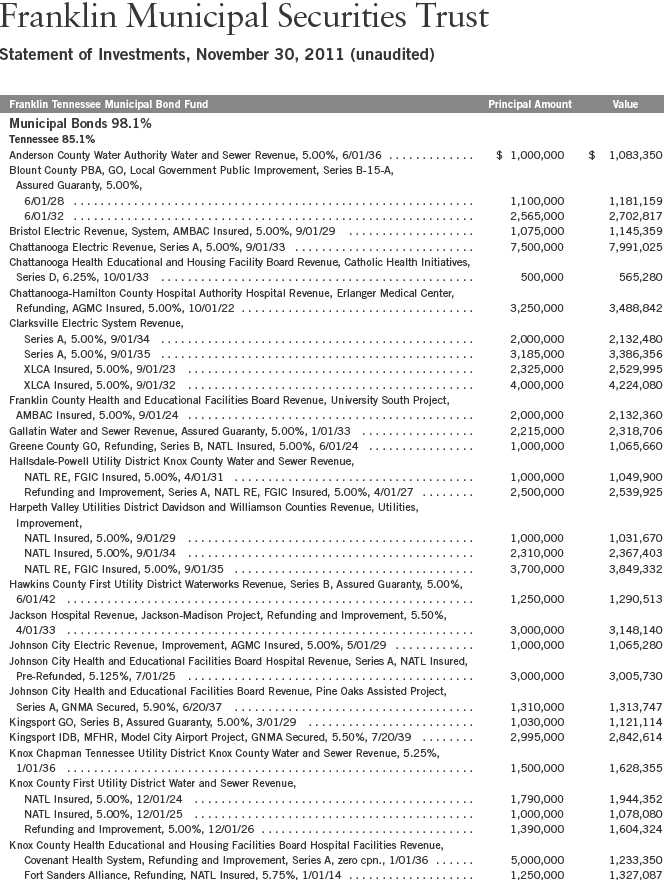
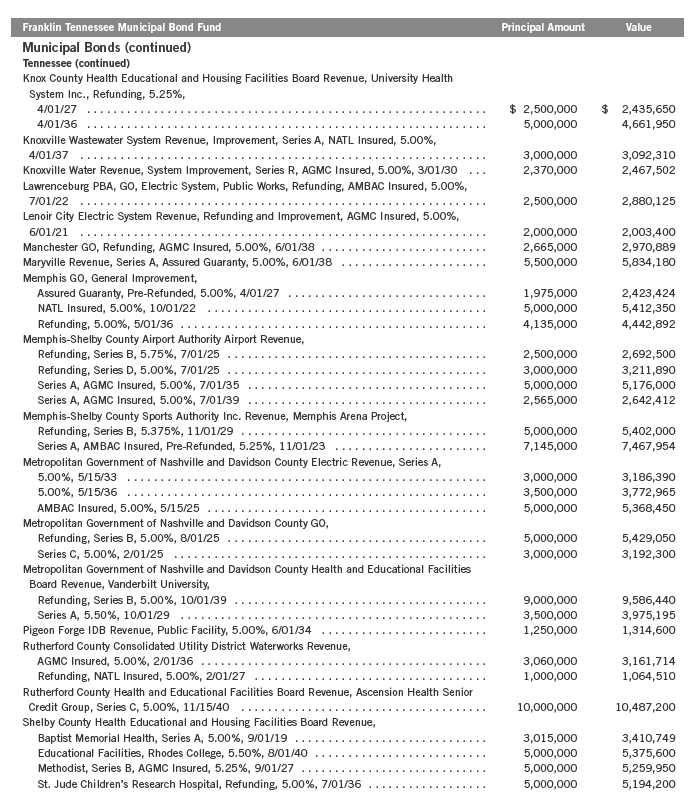
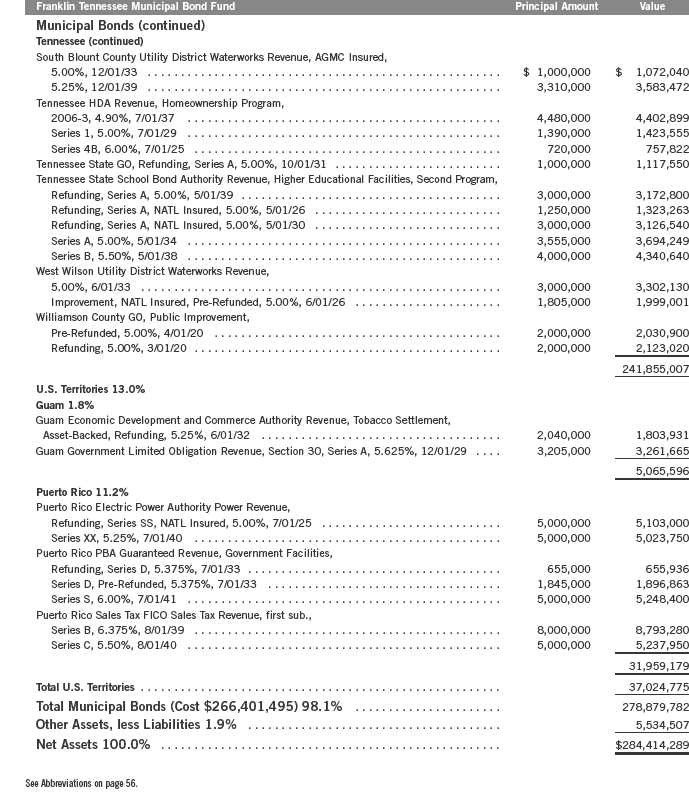
Franklin Tennessee Municipal Bond Fund
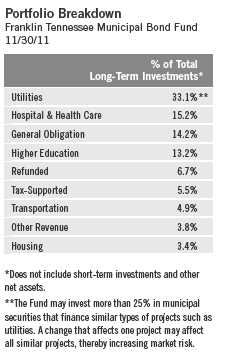
Your Fund’s Goal and Main Investments: Franklin Tennessee Municipal Bond Fund seeks to maximize income exempt from federal and Tennessee personal income taxes, consistent with prudent investing and the preservation of capital, by investing at least 80% of its net assets in investment grade municipal securities that pay interest free from such taxes.1
Performance data represent past performance, which does not guarantee future results. Investment return and principal value will fluctuate, and you may have a gain or loss when you sell your shares. Current performance may differ from figures shown. Please visit franklintempleton.com or call (800) 342-5236 for most recent month-end performance.
We are pleased to bring you Franklin Tennessee Municipal Bond Fund’s semi-annual report for the period ended November 30, 2011.
Performance Overview
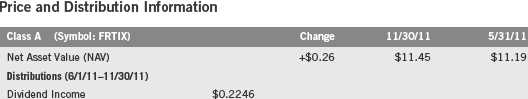
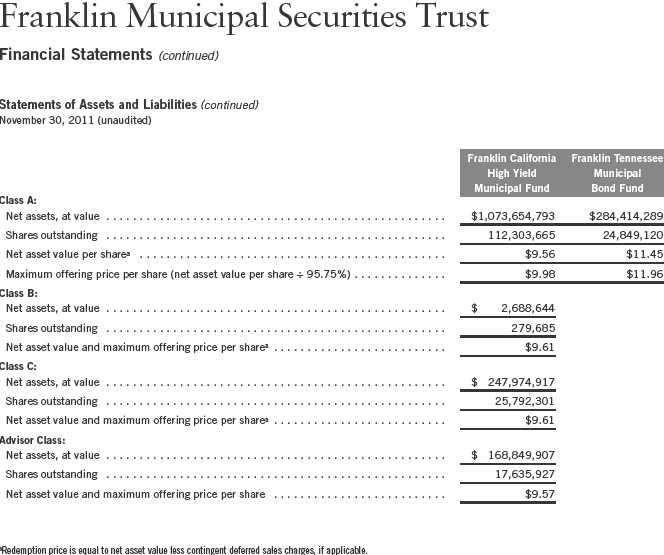
The Fund’s Class A share price, as measured by net asset value, increased from $11.19 on May 31, 2011, to $11.45 on November 30, 2011. The Fund’s Class A shares paid dividends totaling 22.46 cents per share for the reporting period.2 The Performance Summary beginning on page 18 shows that at the end of this reporting period the Fund’s Class A shares’ distribution rate was
1. The Fund may invest up to 100% of its assets in bonds whose interest payments are subject to federal alternative minimum tax. All or a significant portion of the income on these obligations may be subject to such tax. Distributions of capital gains are generally taxable. To avoid the imposition of 28% backup withholding on all Fund distributions and redemption proceeds, U.S. investors must be properly certified on Form W-9 and non-U.S. investors on Form W-8BEN.
2. All Fund distributions will vary depending upon current market conditions, and past distributions are not indicative of future trends.
The dollar value, number of shares or principal amount, and names of all portfolio holdings are listed in the Fund’s Statement of Investments (SOI). The SOI begins on page 40.
Semiannual Report | 15
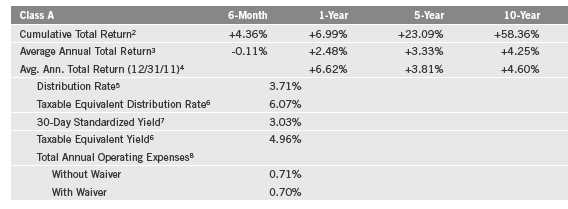
3.71%. An investor in the 2011 maximum combined effective federal and Tennessee personal income tax bracket of 38.90% would need to earn a distribution rate of 6.07% from a taxable investment to match the Fund’s Class A tax-free distribution rate. Dividend distributions during the period under review were affected by decreasing interest rates. Additionally, investor demand was strong for municipal bonds in an environment of limited tax-exempt supply. These factors resulted in reduced income for the portfolio and caused dividends to decline.
State Update
During the six months under review, Tennessee’s economy continued to improve as key revenues exceeded official estimates and the state’s economic development initiatives attracted private sector investment. The state made the largest bond issuance in its history and intended to use the proceeds to fund ongoing economic development efforts and to retire existing obligations. Indicative of high demand for Tennessee bonds, the offering was nearly four times oversubscribed.
State officials estimated development grants to Volkswagen, chemical company Wacker Chemie, Hemlock Semiconductor and appliance maker Electrolux could create nearly 4,650 permanent jobs and thousands more in related industries.3 In the automotive industry, General Motors announced it expected to add nearly 1,900 jobs over the next two years at the formerly idle Spring Hill plant after it begins producing the Chevrolet Equinox in 2012. The state’s unemployment rate was 9.1% in November compared to 8.7% for the nation.4 The government; professional and business services; and mining, logging and construction sectors had the greatest six-month gains, while the information sector and trade, transportation and utilities sector, one of the state’s largest areas of employment, lost jobs. Tennessee’s net tax-supported debt was 1.0% of personal income and $345 per capita, both very low compared with the national medians of 2.8% and $1,066.5
Fiscal year 2011 revenues were up year-over-year as building consumer confidence drove sales tax collections higher. The General Assembly unanimously approved the fiscal year 2012 budget and the governor signed it into law in June. The state expected the rainy day fund to grow 9.5% from fiscal year 2011 despite a drop in nonrecurring federal revenue.6 This reduction affected the general fund only slightly, as the 2012 fiscal year budget relied less on federal funds
3. Source: Tennessee Comptroller of the Treasury. 4. Source: Bureau of Labor Statistics.
5. Source: Moody’s Investors Service, “Special Comment: 2011 State Debt Medians Report,” 5/25/11.
6. Source: Moody’s Investors Service, “New Issue: Moody’s Assigns Aaa Rating to Tennessee’s $586 Million of General Obligation Bonds; Negative Outlook Tied to U.S. Rating,” 10/3/11.
16 | Semiannual Report
than it had in fiscal year 2011. Sales tax revenues, which constituted a substantial amount of overall collections in fiscal year 2011, rose in the first quarter of fiscal year 2012 at the highest first quarter growth rate in five years.
Independent credit rating agency Standard & Poor’s affirmed its AA+ rating and positive outlook on Tennessee’s general obligation bonds, citing the state’s adequate reserves, positive job announcements and long history of conservative fiscal policy.7
Investment Strategy
We use a consistent, disciplined strategy in an effort to maximize tax-exempt income for our shareholders by seeking to maintain exposure to higher coupon securities while balancing risk and return within the Fund’s range of allowable investments. We generally employ a buy-and-hold approach and invest in securities we believe should provide the most relative value in the market. As we invest during different interest rate environments, the Fund’s portfolio remains diversified with a broad range of securities. This broad diversification may help mitigate interest rate risk. We do not use leverage or exotic derivatives, nor do we use hedging techniques that could add volatility and contribute to underperformance in adverse markets. We generally stay fully invested to help maximize income distribution.
Manager’s Discussion
The combination of our value-oriented philosophy of investing primarily for income and a positive-sloping municipal yield curve favored the use of longer-term bonds. Consistent with our strategy, we sought to purchase bonds that ranged from 15 to 30 years in maturity with good call features. We believe our conservative, buy-and-hold investment strategy can help us achieve high, current, tax-free income for shareholders.
Thank you for your continued participation in Franklin Tennessee Municipal Bond Fund. We look forward to serving your future investment needs.
The foregoing information reflects our analysis, opinions and portfolio holdings as of November 30, 2011, the end of the reporting period. The way we implement our main investment strategies and the resulting portfolio holdings may change depending on factors such as market and economic conditions. These opinions may not be relied upon as investment advice or an offer for a particular security. The information is not a complete analysis of every aspect of any market, state, industry, security or the Fund. Statements of fact are from sources considered reliable, but the investment manager makes no representation or warranty as to their completeness or accuracy. Although historical performance is no guarantee of future results, these insights may help you understand our investment management philosophy.
7. This does not indicate S&P’s rating of the Fund.
Semiannual Report | 17
Performance Summary as of 11/30/11
Franklin Tennessee Municipal Bond Fund
Your dividend income will vary depending on dividends or interest paid by securities in the Fund’s portfolio, adjusted for operating expenses. Capital gain distributions are net profits realized from the sale of portfolio securities. The performance table does not reflect any taxes that a shareholder would pay on Fund dividends, capital gain distributions, if any, or any realized gains on the sale of Fund shares. Total return reflects reinvestment of the Fund’s dividends and capital gain distributions, if any, and any unrealized gains or losses.
Performance1
Cumulative total return excludes the sales charge. Average annual total returns include the maximum sales charge.
Class A: 4.25% maximum initial sales charge.
Performance data represent past performance, which does not guarantee future results. Investment return and principal value will fluctuate, and you may have a gain or loss when you sell your shares. Current performance may differ from figures shown. For most recent month-end performance, go to franklintempleton.com or call (800) 342-5236.
The investment manager and administrator have contractually agreed to waive or assume certain expenses so that common expenses (excluding Rule 12b-1 fees) do not exceed 0.60% (other than certain nonroutine expenses) until 9/30/12.
18 | Semiannual Report
Performance Summary (continued)
Endnotes
Because municipal bonds are sensitive to interest rate movements, the Fund’s yield and share price will fluctuate with market conditions. Bond prices generally move in the opposite direction of interest rates. Thus, as prices of bonds in the Fund adjust to a rise in interest rates, the Fund’s share price may decline. Changes in the financial strength of a bond issuer or in a bond’s credit rating may affect its value. The Fund is actively managed but there is no guarantee that the manager’s investment decisions will produce the desired results. Since the Fund concentrates its investments in a single state, it is subject to greater risk of adverse economic and regulatory changes in that state than a geographically diversified fund. The Fund’s prospectus also includes a description of the main investment risks.
1. If the manager and administrator had not waived fees, the Fund’s distribution rate and total return would have been lower, and yield for the period would have been 3.01%.
2. Cumulative total return represents the change in value of an investment over the periods indicated.
3. Average annual total return represents the average annual change in value of an investment over the periods indicated. Six-month return has not been annualized.
4. In accordance with SEC rules, we provide standardized average annual total return information through the latest calendar quarter.
5. Distribution rate is based on an annualization of the current 3.70 cent per share monthly dividend and the maximum offering price of $11.96 per share on 11/30/11.
6. Taxable equivalent distribution rate and yield assume the published rates as of 6/29/11 for the maximum combined effective federal and Tennessee state personal income tax rate of 38.90%, based on the federal income tax rate of 35.00%.
7. The 30-day standardized yield for the 30 days ended 11/30/11 reflects an estimated yield to maturity (assuming all portfolio securities are held to maturity). It should be regarded as an estimate of the Fund’s rate of investment income, and it may not equal the Fund’s actual income distribution rate (which reflects the Fund’s past dividends paid to shareholders) or the income reported in the Fund’s financial statements.
8. Figures are as stated in the Fund’s prospectus current as of the date of this report. In periods of market volatility, assets may decline significantly, causing total annual Fund operating expenses to become higher than the figures shown.
Semiannual Report | 19
Your Fund’s Expenses
Franklin Tennessee Municipal Bond Fund
As a Fund shareholder, you can incur two types of costs:
- Transaction costs, including sales charges (loads) on Fund purchases; and
- Ongoing Fund costs, including management fees, distribution and service (12b-1) fees, and other Fund expenses. All mutual funds have ongoing costs, sometimes referred to as operating expenses.
The following table shows ongoing costs of investing in the Fund and can help you understand these costs and compare them with those of other mutual funds. The table assumes a $1,000 investment held for the six months indicated.
Actual Fund Expenses
The first line (Actual) for each share class listed in the table provides actual account values and expenses. The “Ending Account Value” is derived from the Fund’s actual return, which includes the effect of Fund expenses.
You can estimate the expenses you paid during the period by following these steps. Of course, your account value and expenses will differ from those in this illustration:
| 1. | Divide your account value by $1,000. |
| | If an account had an $8,600 value, then $8,600 ÷ $1,000 = 8.6. |
| 2. | Multiply the result by the number under the heading “Expenses Paid During Period.” |
| | If Expenses Paid During Period were $7.50, then 8.6 x $7.50 = $64.50. |
In this illustration, the estimated expenses paid this period are $64.50.
Hypothetical Example for Comparison with Other Funds
Information in the second line (Hypothetical) for each class in the table can help you compare ongoing costs of investing in the Fund with those of other mutual funds. This information may not be used to estimate the actual ending account balance or expenses you paid during the period. The hypothetical “Ending Account Value” is based on the actual expense ratio for each class and an assumed 5% annual rate of return before expenses, which does not represent the Fund’s actual return. The figure under the heading “Expenses Paid During Period” shows the hypothetical expenses your account would have incurred under this scenario. You can compare this figure with the 5% hypothetical examples that appear in shareholder reports of other funds.
20 | Semiannual Report
Your Fund’s Expenses (continued)
Please note that expenses shown in the table are meant to highlight ongoing costs and do not reflect any transaction costs, such as sales charges. Therefore, the second line for each class is useful in comparing ongoing costs only, and will not help you compare total costs of owning different funds. In addition, if transaction costs were included, your total costs would have been higher. Please refer to the Fund prospectus for additional information on operating expenses.
*Expenses are calculated using the most recent six-month annualized expense ratio, net of expense waivers, of 0.70%, multiplied by the average account value over the period, multiplied by 183/366 to reflect the one-half year period.
Semiannual Report | 21
aThe amount shown for a share outstanding throughout the period may not correlate with the Statement of Operations for the period due to the timing of sales and repurchases of
the Fund shares in relation to income earned and/or fluctuating market value of the investments of the Fund.
bBased on average daily shares outstanding.
cEffective September 1, 2008, the redemption fee was eliminated.
dAmount rounds to less than $0.01 per share.
eTotal return does not reflect sales commissions or contingent deferred sales charges, if applicable, and is not annualized for periods less than one year.
fRatios are annualized for periods less than one year.
22 | The accompanying notes are an integral part of these financial statements. | Semiannual Report
aThe amount shown for a share outstanding throughout the period may not correlate with the Statement of Operations for the period due to the timing of sales and repurchases of
the Fund shares in relation to income earned and/or fluctuating market value of the investments of the Fund.
bBased on average daily shares outstanding.
cEffective September 1, 2008, the redemption fee was eliminated.
dAmount rounds to less than $0.01 per share.
eTotal return does not reflect sales commissions or contingent deferred sales charges, if applicable, and is not annualized for periods less than one year.
fRatios are annualized for periods less than one year.
Semiannual Report | The accompanying notes are an integral part of these financial statements. | 23
aThe amount shown for a share outstanding throughout the period may not correlate with the Statement of Operations for the period due to the timing of sales and repurchases of
the Fund shares in relation to income earned and/or fluctuating market value of the investments of the Fund.
bBased on average daily shares outstanding.
cEffective September 1, 2008, the redemption fee was eliminated.
dAmount rounds to less than $0.01 per share.
eTotal return does not reflect sales commissions or contingent deferred sales charges, if applicable, and is not annualized for periods less than one year.
fRatios are annualized for periods less than one year.
24 | The accompanying notes are an integral part of these financial statements. | Semiannual Report

aFor the period November 15, 2006 (effective date) to May 31, 2007.
bThe amount shown for a share outstanding throughout the period may not correlate with the Statement of Operations for the period due to the timing of sales and repurchases of
the Fund shares in relation to income earned and/or fluctuating market value of the investments of the Fund.
cBased on average daily shares outstanding.
dEffective September 1, 2008, the redemption fee was eliminated.
eAmount rounds to less than $0.01 per share.
fTotal return is not annualized for periods less than one year.
gRatios are annualized for periods less than one year.
Semiannual Report | The accompanying notes are an integral part of these financial statements. | 25
26 | Semiannual Report
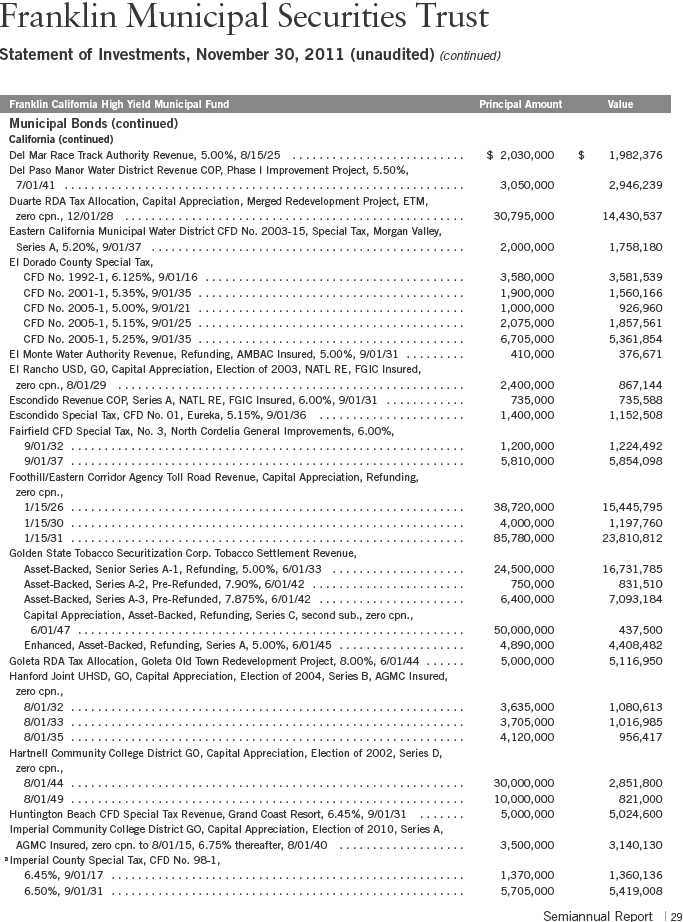
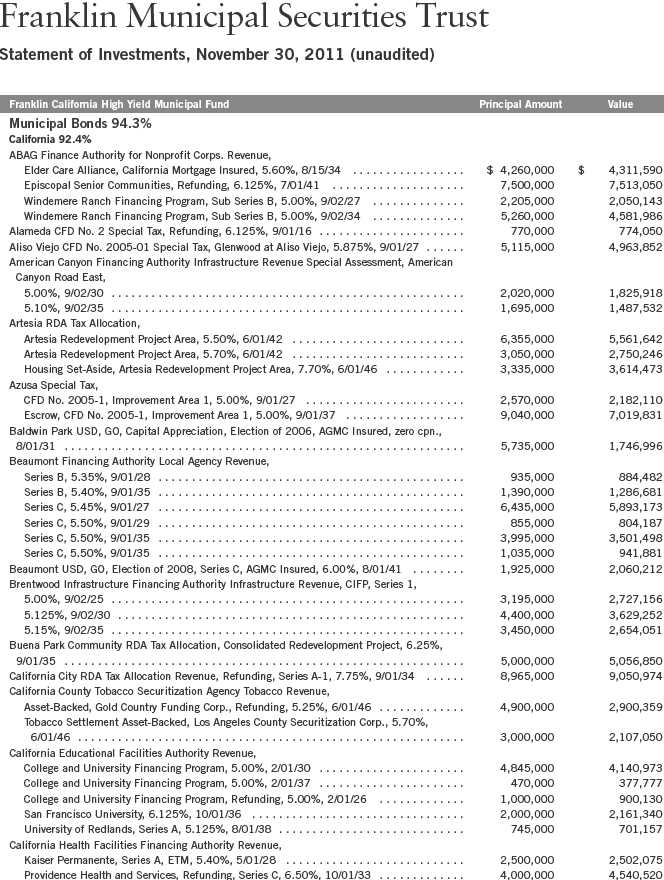
Franklin Municipal Securities Trust
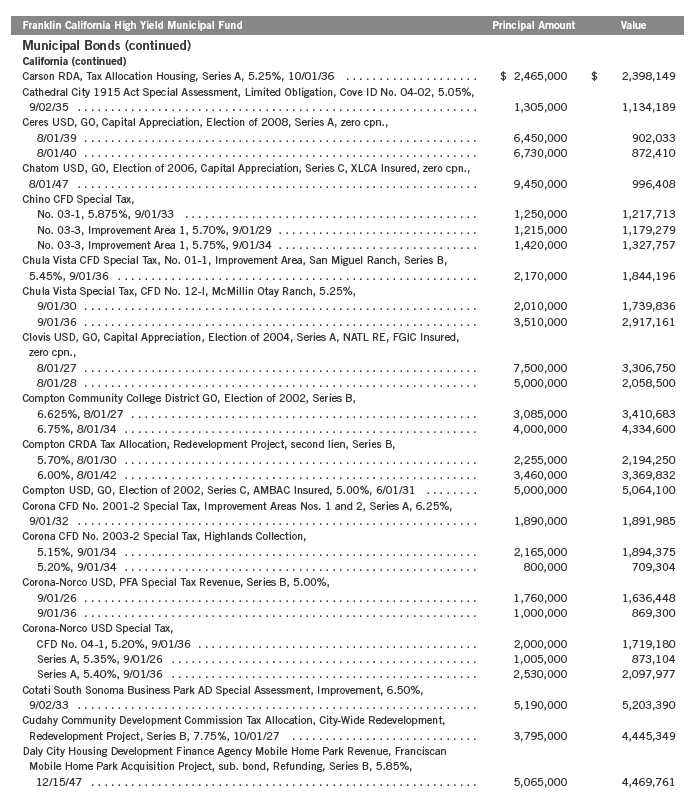
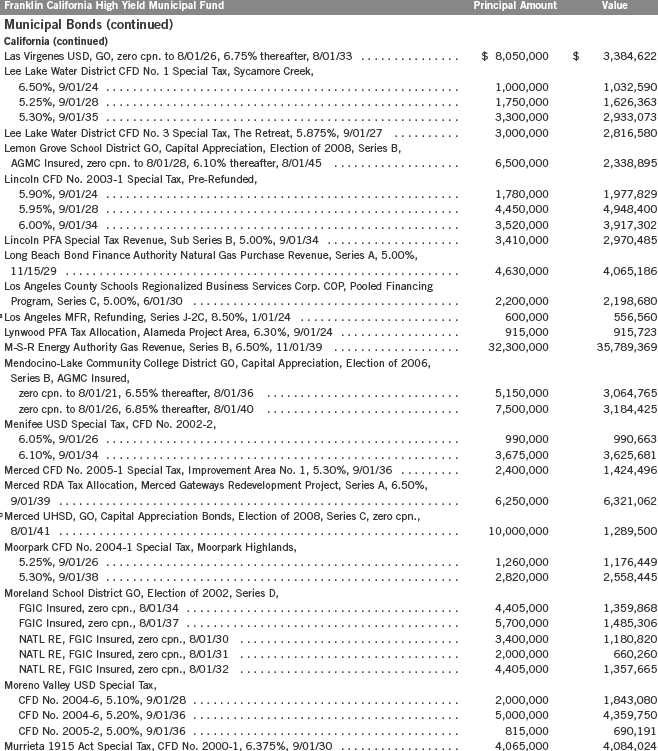
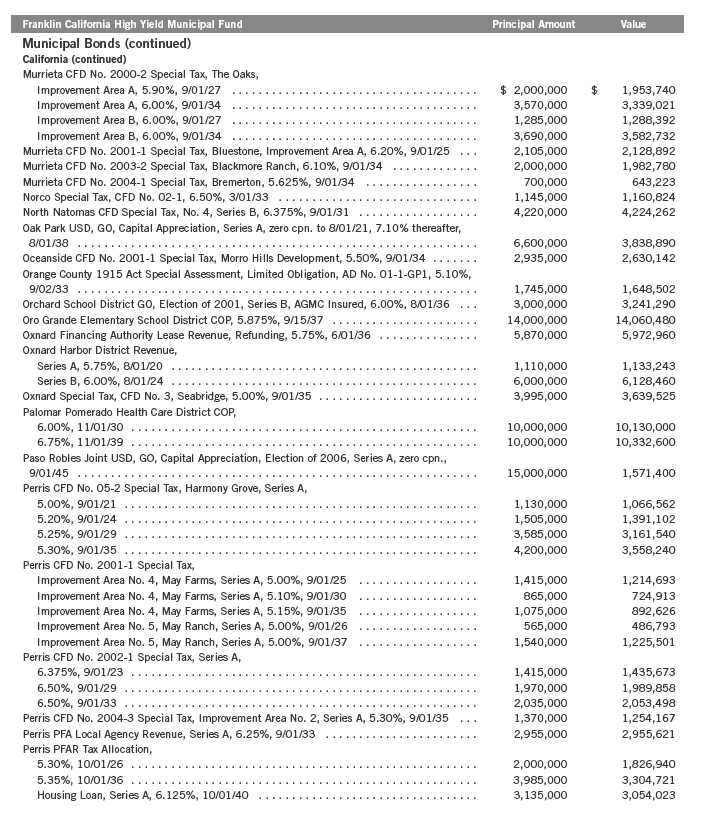
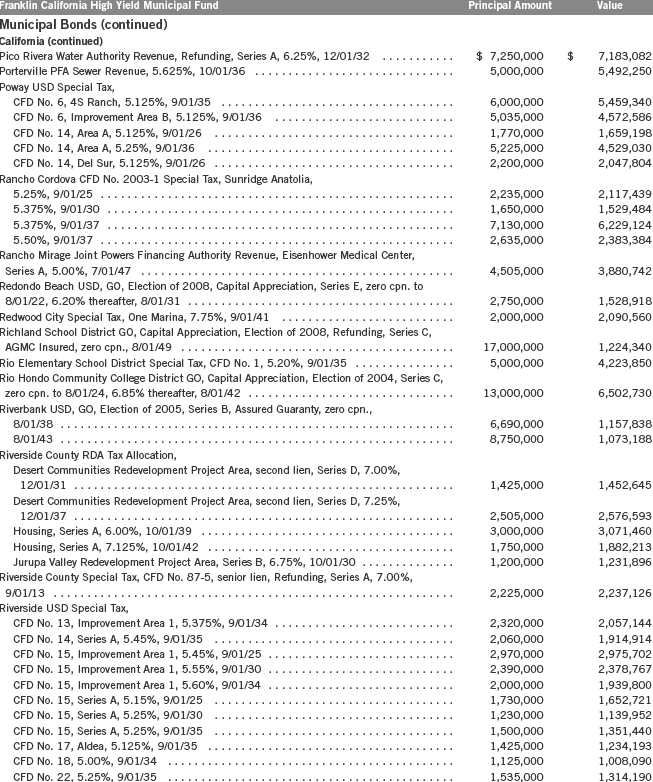
Statement of Investments, November 30, 2011 (unaudited) (continued)

Semiannual Report | 27
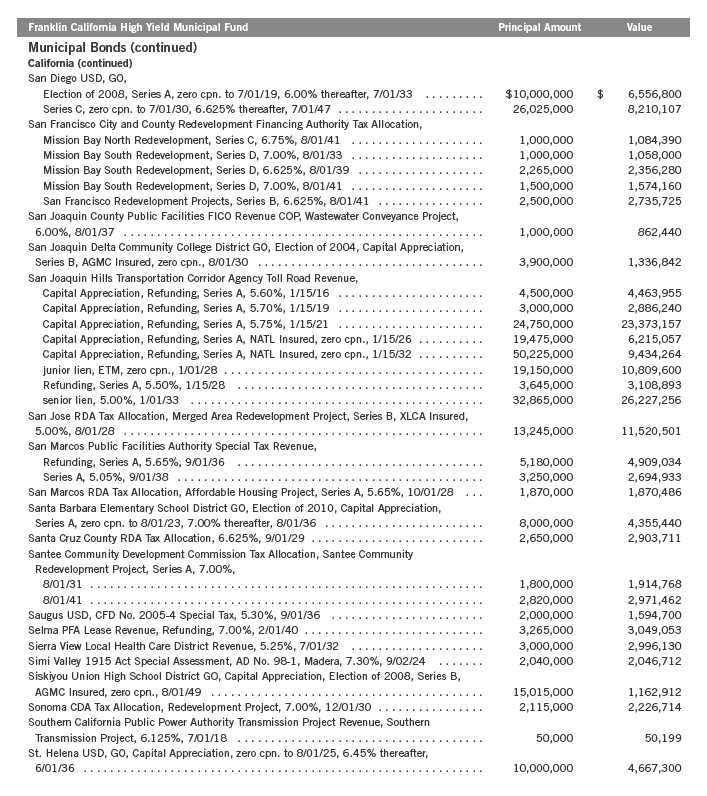
Franklin Municipal Securities Trust
Statement of Investments, November 30, 2011 (unaudited) (continued)
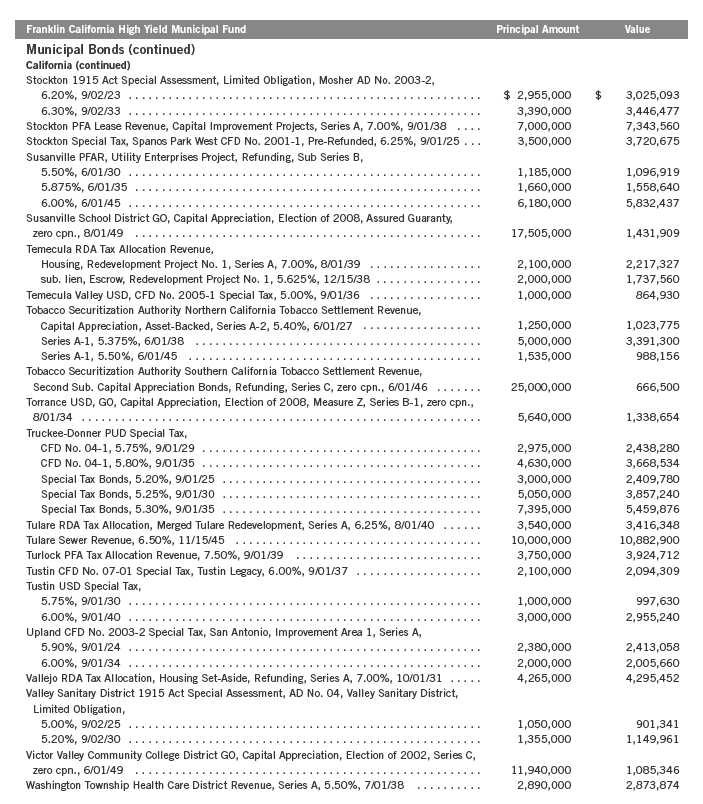
28 | Semiannual Report
Franklin Municipal Securities Trust
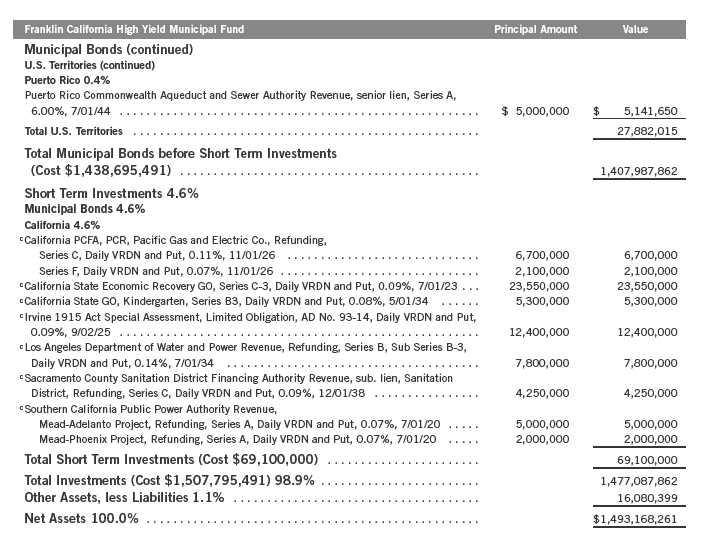
Statement of Investments, November 30, 2011 (unaudited) (continued)
Semiannual Report | 31
Franklin Municipal Securities Trust
Statement of Investments, November 30, 2011 (unaudited) (continued)
32 | Semiannual Report
Franklin Municipal Securities Trust
Statement of Investments, November 30, 2011 (unaudited) (continued)
Semiannual Report | 33
Franklin Municipal Securities Trust
Statement of Investments, November 30, 2011 (unaudited) (continued)

34 | Semiannual Report
Franklin Municipal Securities Trust
Statement of Investments, November 30, 2011 (unaudited) (continued)
Semiannual Report | 35
Franklin Municipal Securities Trust
Statement of Investments, November 30, 2011 (unaudited) (continued)
36 | Semiannual Report
Franklin Municipal Securities Trust
Statement of Investments, November 30, 2011 (unaudited) (continued)

Semiannual Report | 37
Franklin Municipal Securities Trust
Statement of Investments, November 30, 2011 (unaudited) (continued)
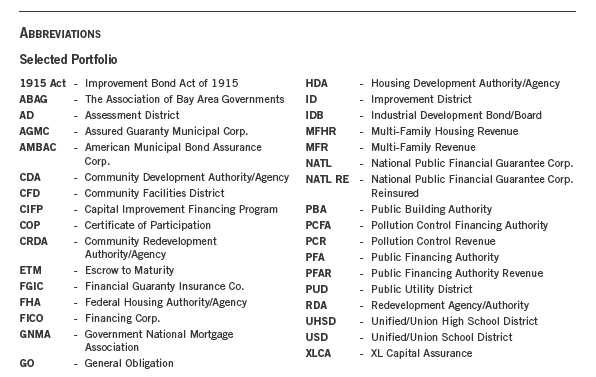
See Abbreviations on page 56.
aSecurity has been deemed illiquid because it may not be able to be sold within seven days. At November 30, 2011, the aggregate value of these securities was $7,335,704,
representing 0.49% of net assets.
bSecurity purchased on a when-issued basis. See Note 1(b).
cVariable rate demand notes (VRDNs) are tax-exempt obligations which contain a floating or variable interest rate adjustment formula and an unconditional right of demand to
receive payment of the principal balance plus accrued interest at specified dates. The coupon rate shown represents the rate at period end.
38 | The accompanying notes are an integral part of these financial statements. | Semiannual Report

aThe amount shown for a share outstanding throughout the period may not correlate with the Statement of Operations for the period due to the timing of sales and repurchases of
the Fund shares in relation to income earned and/or fluctuating market value of the investments of the Fund.
bBased on average daily shares outstanding.
cAmount rounds to less than $0.01 per share.
dEffective September 1, 2008, the redemption fee was eliminated.
eTotal return does not reflect sales commissions or contingent deferred sales charges, if applicable, and is not annualized for periods less than one year.
fRatios are annualized for periods less than one year.
Semiannual Report | The accompanying notes are an integral part of these financial statements. | 39
40 | Semiannual Report
Franklin Municipal Securities Trust
Statement of Investments, November 30, 2011 (unaudited) (continued)
Semiannual Report | 41
Franklin Municipal Securities Trust
Statement of Investments, November 30, 2011 (unaudited) (continued)
42 | The accompanying notes are an integral part of these financial statements. | Semiannual Report

Semiannual Report | The accompanying notes are an integral part of these financial statements. | 43
44 | The accompanying notes are an integral part of these financial statements. | Semiannual Report
Semiannual Report | The accompanying notes are an integral part of these financial statements. | 45
46 | The accompanying notes are an integral part of these financial statements. | Semiannual Report
Franklin Municipal Securities Trust
Notes to Financial Statements (unaudited)
1. ORGANIZATION AND SIGNIFICANT ACCOUNTING POLICIES
Franklin Municipal Securities Trust (Trust) is registered under the Investment Company Act of 1940, as amended, (1940 Act) as an open-end investment company, consisting of two funds (Funds). The classes of shares offered within each of the Funds are indicated below. Each class of shares differs by its initial sales load, contingent deferred sales charges, distribution fees, voting rights on matters affecting a single class and its exchange privilege.

The following summarizes the Funds’ significant accounting policies.
a. Financial Instrument Valuation
The Funds’ investments in securities and other financial instruments are carried at fair value daily. Fair value is the price that would be received to sell an asset or paid to transfer a liability in an orderly transaction between market participants on the measurement date. Under procedures approved by the Trust’s Board of Trustees, the Funds may utilize independent pricing services, quotations from securities and financial instrument dealers, and other market sources to determine fair value.
Debt securities generally trade in the over-the-counter market rather than on a securities exchange. The Funds’ pricing services use multiple valuation techniques to determine fair value. In instances where sufficient market activity exists, the pricing services may utilize a market-based approach through which quotes from market makers are used to determine fair value. In instances where sufficient market activity may not exist or is limited, the pricing services also utilize proprietary valuation models which may consider market characteristics such as benchmark yield curves, option-adjusted spreads, credit spreads, estimated default rates, coupon rates, anticipated timing of principal repayments, underlying collateral, and other unique security features in order to estimate the relevant cash flows, which are then discounted to calculate the fair value.
The Funds have procedures to determine the fair value of securities and other financial instruments for which market prices are not readily available or which may not be reliably priced. Under these procedures, the Funds primarily employ a market-based approach which may use related or comparable assets or liabilities, recent transactions, market multiples, book values, and other relevant information for the investment to determine the fair value of the investment. The Funds may also use an income-based valuation approach in which the anticipated future cash flows of the investment are discounted to calculate fair value. Discounts may also be applied due to the nature or duration of any restrictions on the disposition of the investments. Due to the inherent uncertainty of valuations of such investments, the fair values may differ significantly from the values that would have been used had an active market existed.
Semiannual Report | 47
Franklin Municipal Securities Trust
Notes to Financial Statements (unaudited) (continued)
| 1. | ORGANIZATION AND SIGNIFICANT ACCOUNTING POLICIES (continued) |
| b. | Securities Purchased on a When-Issued Basis |
The Funds purchase securities on a when-issued basis, with payment and delivery scheduled for a future date. These transactions are subject to market fluctuations and are subject to the risk that the value at delivery may be more or less than the trade date purchase price. Although the Funds will generally purchase these securities with the intention of holding the securities, they may sell the securities before the settlement date. Sufficient assets have been segregated for these securities.
c. Income Taxes
It is each fund’s policy to qualify as a regulated investment company under the Internal Revenue Code. Each fund intends to distribute to shareholders substantially all of its income and net realized gains to relieve it from federal income and excise taxes. As a result, no provision for U.S. federal income taxes is required. Each fund files U.S. income tax returns as well as tax returns in certain other jurisdictions. Each fund records a provision for taxes in its financial statements including penalties and interest, if any, for a tax position taken on a tax return (or expected to be taken) when it fails to meet the more likely than not (a greater than 50% probability) threshold and based on the technical merits, the tax position may not be sustained upon examination by the tax authorities. As of November 30, 2011, and for all open tax years, each fund has determined that no provision for income tax is required in each fund’s financial statements. Open tax years are those that remain subject to examination and are based on each tax jurisdiction statute of limitation.
d. Security Transactions, Investment Income, Expenses and Distributions
Security transactions are accounted for on trade date. Realized gains and losses on security transactions are determined on a specific identification basis. Interest income and estimated expenses are accrued daily. Amortization of premium and accretion of discount on debt securities are included in interest income. Dividends from net investment income are normally declared daily; these dividends may be reinvested or paid monthly to shareholders. Distributions to shareholders are determined according to income tax regulations (tax basis). Distributable earnings determined on a tax basis may differ from earnings recorded in accordance with accounting principles generally accepted in the United States of America. These differences may be permanent or temporary. Permanent differences are reclassified among capital accounts to reflect their tax character. These reclassifications have no impact on net assets or the results of operations. Temporary differences are not reclassified, as they may reverse in subsequent periods.
Common expenses incurred by the Trust are allocated among the Funds based on the ratio of net assets of each fund to the combined net assets of the Trust. Fund specific expenses are charged directly to the fund that incurred the expense.
48 | Semiannual Report
Franklin Municipal Securities Trust
Notes to Financial Statements (unaudited) (continued)
| 1. | ORGANIZATION AND SIGNIFICANT ACCOUNTING POLICIES (continued) |
| d. | Security Transactions, Investment Income, Expenses and Distributions (continued) |
Realized and unrealized gains and losses and net investment income, not including class specific expenses, are allocated daily to each class of shares based upon the relative proportion of net assets of each class. Differences in per share distributions, by class, are generally due to differences in class specific expenses.
e. Insurance
The scheduled payments of interest and principal for each insured municipal security in the Trust are insured by either a new issue insurance policy or a secondary insurance policy. Some municipal securities in the Funds are secured by collateral guaranteed by an agency of the U.S. government. Depending on the type of coverage, premiums for insurance are either added to the cost basis of the security or paid by a third party.
Insurance companies typically insure municipal bonds that tend to be of very high quality, with the majority of underlying municipal bonds rated A or better. However, an event involving an insurer could have an adverse effect on the value of the securities insured by that insurance company. There is no guarantee the insurer will be able to fulfill its obligations under the terms of the policy.
f. Accounting Estimates
The preparation of financial statements in accordance with accounting principles generally accepted in the United States of America requires management to make estimates and assumptions that affect the reported amounts of assets and liabilities at the date of the financial statements and the amounts of income and expenses during the reporting period. Actual results could differ from those estimates.
g. Guarantees and Indemnifications
Under the Trust’s organizational documents, its officers and trustees are indemnified by the Trust against certain liabilities arising out of the performance of their duties to the Trust. Additionally, in the normal course of business, the Trust, on behalf of the Funds, enters into contracts with service providers that contain general indemnification clauses. The Trust’s maximum exposure under these arrangements is unknown as this would involve future claims that may be made against the Trust that have not yet occurred. Currently, the Trust expects the risk of loss to be remote.
Semiannual Report | 49
Franklin Municipal Securities Trust
Notes to Financial Statements (unaudited) (continued)
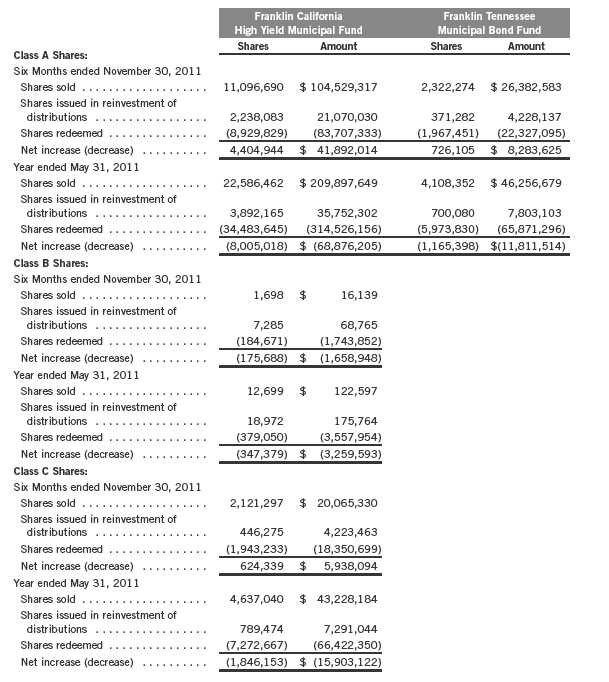
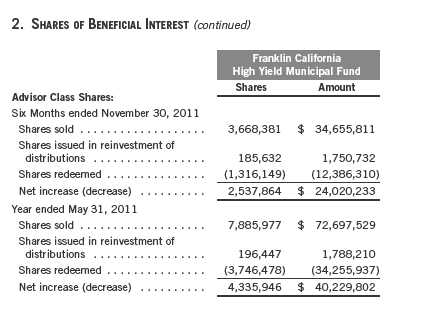
2. SHARES OF BENEFICIAL INTEREST
At November 30, 2011, there were an unlimited number of shares authorized (without par value).
Transactions in the Funds’ shares were as follows:
50 | Semiannual Report
Franklin Municipal Securities Trust
Notes to Financial Statements (unaudited) (continued)
3. TRANSACTIONS WITH AFFILIATES
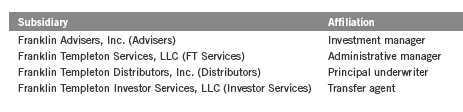
Franklin Resources, Inc. is the holding company for various subsidiaries that together are referred to as Franklin Templeton Investments. Certain officers and trustees of the Funds are also officers and/or directors of the following subsidiaries:
a. Management Fees
The Funds pay an investment management fee to Advisers based on the average daily net assets of each of the Funds as follows:

Semiannual Report | 51
Franklin Municipal Securities Trust
Notes to Financial Statements (unaudited) (continued)
| 3. | TRANSACTIONS WITH AFFILIATES (continued) |
| b. | Administrative Fees |
Under an agreement with Advisers, FT Services provides administrative services to the Funds. The fee is paid by Advisers based on average daily net assets, and is not an additional expense of the Funds.
c. Distribution Fees
The Trust’s Board of Trustees has adopted distribution plans for each share class, with the exception of Advisor Class shares, pursuant to Rule 12b-1 under the 1940 Act. Under the Funds’ Class A reimbursement distribution plans, the Funds reimburse Distributors for costs incurred in connection with the servicing, sale and distribution of each fund’s shares up to the maximum annual plan rate. Under the Class A reimbursement distribution plans, costs exceeding the maximum for the current plan year cannot be reimbursed in subsequent periods.
In addition, under the Franklin California High Yield Municipal Fund’s Class B and C compensation distribution plans, the fund pays Distributors for costs incurred in connection with the servicing, sale and distribution of each fund’s shares up to the maximum annual plan rate for each class.
The maximum annual plan rates, based on the average daily net assets, for each class, are as follows:
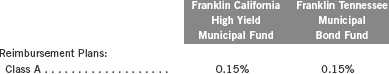
Distributors has agreed to limit the current rate to 0.10% per year for each of the Funds.
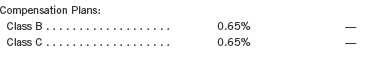
d. Sales Charges/Underwriting Agreements
Front-end sales charges and contingent deferred sales charges (CDSC) do not represent expenses of the Funds. These charges are deducted from the proceeds of sales of fund shares prior to investment or from redemption proceeds prior to remittance, as applicable. Distributors has advised the Funds of the following commission transactions related to the sales and redemptions of the Funds’ shares for the period:
52 | Semiannual Report
Franklin Municipal Securities Trust
Notes to Financial Statements (unaudited) (continued)
| 3. | TRANSACTIONS WITH AFFILIATES (continued) |
| e. | Transfer Agent Fees |
For the period ended November 30, 2011, the Funds paid transfer agent fees as noted in the Statements of Operations of which the following amounts were retained by Investor Services:

Advisers has contractually agreed in advance to waive or limit its fees and to assume as its own expense certain expenses otherwise payable by the Franklin Tennessee Municipal Bond Fund so that the common expenses (i.e. a combination of management fees, administrative fees, and other expenses, but excluding distribution fees and acquired fund fees and expenses) do not exceed 0.60% (other than certain non-routine expenses or costs, including those relating to litigation, indemnification, reorganizations, and liquidations) until September 30, 2012.
4. INCOME TAXES
For tax purposes, capital losses may be carried over to offset future capital gains, if any. At May 31, 2011, the capital loss carryforwards were as follows:
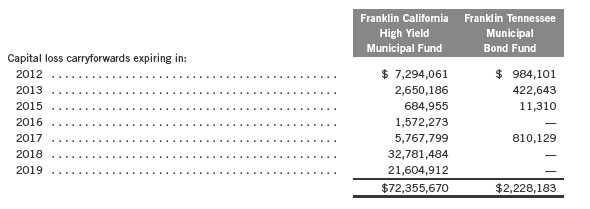
Under the Regulated Investment Company Modernization Act of 2010, the Funds will be permitted to carry forward capital losses incurred in taxable years beginning after December 22, 2010 for an unlimited period. Post-enactment capital loss carryforwards will retain their character as either short-term or long-term capital losses rather than being considered short-term as under previous law. Any post-enactment capital losses generated will be required to be utilized prior to the losses incurred in pre-enactment tax years.
Semiannual Report | 53
Franklin Municipal Securities Trust
Notes to Financial Statements (unaudited) (continued)
4. INCOME TAXES (continued)
For tax purposes, realized capital losses occurring subsequent to October 31 may be deferred and treated as occurring on the first day of the following fiscal year. At May 31, 2011, the Franklin California High Yield Municipal Fund and the Franklin Tennessee Municipal Bond Fund deferred realized capital losses of $18,568,483 and $1,040,012, respectively.
At November 30, 2011, the cost of investments and net unrealized appreciation (depreciation) for income tax purposes were as follows:
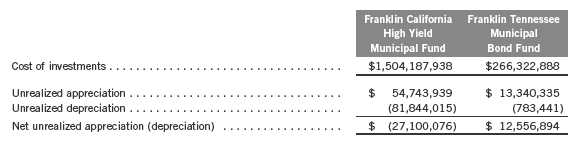
Differences between income and/or capital gains as determined on a book basis and a tax basis are primarily due to differing treatments of wash sales, bond discounts and non-deductible expenses.
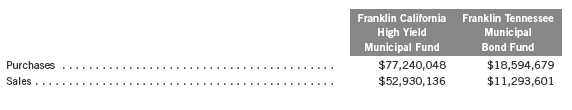
5. INVESTMENT TRANSACTIONS
Purchases and sales of investments (excluding short term securities) for the period ended November 30, 2011, were as follows:
6. CREDIT RISK
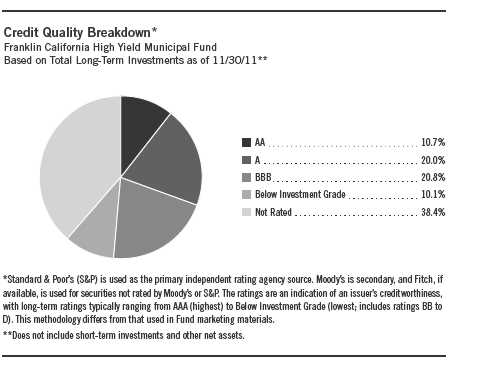
At November 30, 2011, the Franklin California High Yield Municipal Fund had 30.30% of its portfolio invested in high yield securities rated below investment grade. These securities may be more sensitive to economic conditions causing greater price volatility and are potentially subject to a greater risk of loss due to default than higher rated securities.
7. CONCENTRATION OF RISK
Each of the Funds invests a large percentage of its total assets in obligations of issuers within its respective state and U.S. territories. Such concentration may subject the Funds to risks associated with industrial or regional matters, and economic, political or legal developments occurring within
54 | Semiannual Report
Franklin Municipal Securities Trust
Notes to Financial Statements (unaudited) (continued)
7. CONCENTRATION OF RISK (continued)
those states and U.S. territories. In addition, investments in these securities are sensitive to interest rate changes and credit risk of the issuer and may subject the Funds to increased market volatility. The market for these investments may be limited, which may make them difficult to buy or sell.
8. CREDIT FACILITY
The Funds, together with other U.S. registered and foreign investment funds (collectively, Borrowers), managed by Franklin Templeton Investments, are borrowers in a joint syndicated senior unsecured credit facility totaling $750 million (Global Credit Facility) which matures on January 20, 2012. This Global Credit Facility provides a source of funds to the Borrowers for temporary and emergency purposes, including the ability to meet future unanticipated or unusually large redemption requests.
Under the terms of the Global Credit Facility, the Funds shall, in addition to interest charged on any borrowings made by the Funds and other costs incurred by the Funds, pay their share of fees and expenses incurred in connection with the implementation and maintenance of the Global Credit Facility, based upon their relative share of the aggregate net assets of all of the Borrowers, including an annual commitment fee of 0.08% based upon the unused portion of the Global Credit Facility, which is reflected in other expenses on the Statements of Operations. During the period ended November 30, 2011, the Funds did not use the Global Credit Facility.
9. FAIR VALUE MEASUREMENTS
The Funds follow a fair value hierarchy that distinguishes between market data obtained from independent sources (observable inputs) and the Funds’ own market assumptions (unobservable inputs). These inputs are used in determining the value of the Funds’ investments and are summarized in the following fair value hierarchy:
- Level 1 – quoted prices in active markets for identical securities
- Level 2 – other significant observable inputs (including quoted prices for similar securities, interest rates, prepayment speed, credit risk, etc.)
- Level 3 – significant unobservable inputs (including the Funds’ own assumptions in determining the fair value of investments)
The inputs or methodology used for valuing securities are not an indication of the risk associated with investing in those securities.
For movements between the levels within the fair value hierarchy, the Funds have adopted a policy of recognizing the transfers as of the date of the underlying event which caused the movement.
Semiannual Report | 55
Franklin Municipal Securities Trust
Notes to Financial Statements (unaudited) (continued)
9. FAIR VALUE MEASUREMENTS (continued)
At November 30, 2011, all of the Funds’ investments in securities carried at fair value were in Level 2 inputs.
10. NEW ACCOUNTING PRONOUNCEMENTS
In May 2011, the Financial Accounting Standards Board (FASB) issued Accounting Standards Update (ASU) No. 2011-04, Fair Value Measurement (Topic 820): Amendments to Achieve Common Fair Value Measurement and Disclosure Requirements in U.S. GAAP and IFRSs. The amendments in the ASU will improve the comparability of fair value measurements presented and disclosed in financial statements prepared in accordance with U.S. GAAP (Generally Accepted Accounting Principles) and IFRS (International Financial Reporting Standards) and include new guidance for certain fair value measurement principles and disclosure requirements. The ASU is effective for interim and annual periods beginning after December 15, 2011. The Funds are currently reviewing the requirements and believe the adoption of this ASU will not have a material impact on the financial statements.
11. SUBSEQUENT EVENTS
The Funds have evaluated subsequent events through the issuance of the financial statements and determined that no events have occurred that require disclosure.
56 | Semiannual Report
Franklin Municipal Securities Trust
Shareholder Information
Proxy Voting Policies and Procedures
The Trust’s investment manager has established Proxy Voting Policies and Procedures (Policies) that the Trust uses to determine how to vote proxies relating to portfolio securities. Shareholders may view the Trust’s complete Policies online at franklintempleton.com. Alternatively, shareholders may request copies of the Policies free of charge by calling the Proxy Group collect at (954) 527-7678 or by sending a written request to: Franklin Templeton Companies, LLC, 300 S.E. 2nd Street, Fort Lauderdale, FL 33301, Attention: Proxy Group. Copies of the Trust’s proxy voting records are also made available online at franklintempleton.com and posted on the U.S. Securities and Exchange Commission’s website at sec.gov and reflect the most recent 12-month period ended June 30.
Quarterly Statement of Investments
The Trust files a complete statement of investments with the U.S. Securities and Exchange Commission for the first and third quarters for each fiscal year on Form N-Q. Shareholders may view the filed Form N-Q by visiting the Commission’s website at sec.gov. The filed form may also be viewed and copied at the Commission’s Public Reference Room in Washington, DC. Information regarding the operations of the Public Reference Room may be obtained by calling (800) SEC-0330.
Semiannual Report | 57
This page intentionally left blank.

Item 2. Code of Ethics.
(a) The Registrant has adopted a code of ethics that applies to its principal executive officers and principal financial and accounting officer.
| (c) | N/A |
| (d) | N/A |
| (f) | Pursuant to Item 12(a)(1), the Registrant is attaching as an exhibit a copy of its code of ethics that applies to its principal executive officers and principal financial and accounting officer. |
Item 3. Audit Committee Financial Expert.
(a)(1) The Registrant has an audit committee financial expert serving on its audit committee.
(2) The audit committee financial expert is John B. Wilson and he is "independent" as defined under the relevant Securities and Exchange Commission Rules and Releases.
Item 4. Principal Accountant Fees and Services. Item 5. Audit Committee of Listed Registrants. Item 6. Schedule of Investments. | N/A N/A N/A |
Item 7. Disclosure of Proxy Voting Policies and Procedures for Closed-End Management Investment Companies. N/A
Item 8. Portfolio Managers of Closed-End Management Investment Companies. N/A
Item 9. Purchases of Equity Securities by Closed-End Management
Investment Company and Affiliated Purchasers. N/A
Item 10. Submission of Matters to a Vote of Security Holders.
There have been no changes to the procedures by which shareholders may recommend nominees to the Registrant's Board of Trustees that would require disclosure herein.
Item 11. Controls and Procedures.
(a) Evaluation of Disclosure Controls and Procedures. The Registrant maintains disclosure controls and procedures that are designed to ensure that information required to be disclosed in the Registrant’s filings under the Securities Exchange Act of 1934 and the Investment Company Act of 1940 is recorded, processed, summarized and reported within the periods specified in the rules and forms of the Securities and Exchange Commission. Such information is accumulated and communicated to the Registrant’s management, including its principal executive officer and principal financial officer, as appropriate, to allow timely decisions regarding required disclosure. The Registrant’s management, including the principal executive officer and the principal financial officer, recognizes that any set of controls and procedures, no matter how well designed and operated, can provide only reasonable assurance of achieving the desired control objectives.
Within 90 days prior to the filing date of this Shareholder Report on Form N-CSR, the Registrant had carried out an evaluation, under the supervision and with the participation of the Registrant’s management, including the Registrant’s principal executive officer and the Registrant’s principal financial officer, of the effectiveness of the design and operation of the Registrant’s disclosure controls and procedures. Based on such evaluation, the Registrant’s principal executive officer and principal financial officer concluded that the Registrant’s disclosure controls and procedures are effective.
(b) Changes in Internal Controls. There have been no significant changes in the Registrant’s internal controls or in other factors that could significantly affect the internal controls subsequent to the date of their evaluation in connection with the preparation of this Shareholder Report on Form N-CSR.
Item 12. Exhibits.
(a)(1) Code of Ethics
(a)(2) Certifications pursuant to Section 302 of the Sarbanes-Oxley Act of 2002 of Laura F. Fergerson, Chief Executive Officer - Finance and Administration, and Gaston Gardey, Chief Financial Officer and Chief Accounting Officer
(b) Certifications pursuant to Section 906 of the Sarbanes-Oxley Act of 2002 of Laura F. Fergerson, Chief Executive Officer - Finance and Administration, and Gaston Gardey, Chief Financial Officer and Chief Accounting Officer
SIGNATURES
Pursuant to the requirements of the Securities Exchange Act of 1934 and the Investment Company Act of 1940, the registrant has duly caused this report to be signed on its behalf by the undersigned, thereunto duly authorized.
FRANKLIN MUNICIPAL SECURITIES TRUST
By /s/LAURA F. FERGERSON
Laura F. Fergerson
Chief Executive Officer - Finance and Administration
Date January 25, 2012
Pursuant to the requirements of the Securities Exchange Act of 1934 and
the Investment Company Act of 1940, this report has been signed below
by the following persons on behalf of the registrant and in the
capacities and on the dates indicated.
By /s/LAURA F. FERGERSON
Laura F. Fergerson
Chief Executive Officer - Finance and Administration
Date January 25, 2012
By /s/GASTON GARDEY
Gaston Gardey
Chief Financial Officer and Chief Accounting Officer
Date January 25, 2012