UNITED STATES
SECURITIES AND EXCHANGE COMMISSION
Washington, DC 20549
FORM N-CSR
CERTIFIED SHAREHOLDER REPORT OF REGISTERED
MANAGEMENT INVESTMENT COMPANIES
Investment Company Act file number 811-06481
Franklin Municipal Securities Trust
(Exact name of registrant as specified in charter)
One Franklin Parkway, San Mateo, CA 94403-1906
(Address of principal executive offices) (Zip code)
Craig S. Tyle, One Franklin Parkway, San Mateo, CA 94403-1906
(Name and address of agent for service)
Registrant’s telephone number, including area code: _650 312-2000
Date of fiscal year end: 5/31
Date of reporting period: 5/31/17
Item 1. Reports to Stockholders.

| | | | | | |
| | | | Annual Report
and Shareholder Letter May 31, 2017 |
Sign up for electronic delivery at franklintempleton.com/edelivery
Franklin Templeton Investments
Gain From Our Perspective®
At Franklin Templeton Investments, we’re dedicated to one goal: delivering exceptional asset management for our clients. By bringing together multiple, world-class investment teams in a single firm, we’re able to offer specialized expertise across styles and asset classes, all supported by the strength and resources of one of the world’s largest asset managers. This has helped us to become a trusted partner to individual and institutional investors across the globe.
Dear Shareholder:
Overall, the 12 months ended May 31, 2017, benefited from mostly upbeat economic data and better corporate earnings in the U.S., signs of improvement in the Chinese and European economies and ongoing expansionary monetary policies from key central banks. The U.S. job market remained healthy as the unemployment rate declined.
After maintaining its target interest rate in the 0.25%–0.50% range for nearly a year, the U.S. Federal Reserve (Fed), at its December meeting, increased its target range for the federal funds rate to 0.50%–0.75%. In March, the Fed raised its target range 0.25% for the second time in three months to 0.75%–1.00%. The 10-year U.S. Treasury yield began the period at 1.84% and rose to 2.21% at period-end. Fixed income markets, as measured by the Bloomberg Barclays U.S. Aggregate Bond Index, had a +1.58% total return for the 12 months ended May 31, 2017.1 Investment-grade municipal bonds, as measured by the Bloomberg Barclays Municipal Bond Index, had a +1.46% total return for the 12-month period.1
A couple of weeks after the end of the reporting period, the Fed raised its target range a quarter point to 1.00%–1.25%. Despite
low inflation, the Fed made this decision amid signs of a strengthening labor market and moderately rising economic activity.
In addition, Franklin Municipal Securities Trust’s annual report includes more detail about municipal bond market conditions and discussions from the portfolio managers. On our website, franklintempleton.com, you can find updated commentary by our municipal bond experts. Municipal bonds can provide tax-free income and diversification from equities. Despite periods of volatility, municipal bonds historically have had a solid long-term record of performance, driven mostly by their income component. Please remember all securities markets fluctuate, as do mutual fund share prices.
As always, we recommend investors consult their financial advisors to help them make the best decisions for the long term. In a constantly changing market environment, we remain committed to our disciplined strategy as we manage the Fund, keeping in mind the trust you have placed in us. We appreciate your confidence in us and encourage you to contact us when you have questions about your Franklin Templeton tax-free investment.
1. Source: Morningstar.
See www.franklintempletondatasources.com for additional data provider information.
| | | | | | | | |
| Not FDIC Insured | | | | | May Lose Value | | | | | No Bank Guarantee |
| | | | | | |
| franklintempleton.com | | Not part of the annual report | | | 1 | |
Sincerely,

Rupert H. Johnson, Jr.
Chairman
Franklin Municipal Securities Trust

Sheila Amoroso

Rafael R. Costas Jr.
Senior Vice Presidents and Co-Directors
Franklin Municipal Bond Department
This letter reflects our analysis and opinions as of May 31, 2017, unless otherwise indicated. The information is not a complete analysis of every aspect of any market, state, industry, security or fund. Statements of fact are from sources considered reliable.
Contents
Annual Report
Visit franklintempleton.com for fund updates, to access your account, or to find helpful financial planning tools.
| | | | | | |
| | 2 | | | Not part of the annual report | | franklintempleton.com |
Annual Report
Municipal Bond Market Overview
The municipal bond market outperformed the U.S. Treasury market, but underperformed U.S. stock markets during the 12-month period ended May 31, 2017. Investment-grade municipal bonds, as measured by the Bloomberg Barclays Municipal Bond Index, posted a +1.46% total return for the period, while U.S. Treasuries, as measured by the Bloomberg Barclays U.S. Treasury Index, had a 0.00% total return.1 U.S. equities, as represented by the Standard & Poor’s® 500 Index, outperformed both municipals and U.S. Treasuries with a +17.47% total return for the reporting period.1
Donald Trump’s U.S. presidential victory in November shocked financial markets and pushed U.S. equities to all-time highs on the promise of lower taxes, deregulation and significant infrastructure spending. These same factors stoked fears among bond investors of inflation and higher interest rates. As a result, both the municipal bond market and U.S. Treasury market sold off sharply immediately following the election. Fixed income markets quickly stabilized, however, and generated positive returns from December through the end of the reporting period.
The election also resulted in Republican control of both the White House and Congress, marking the first time in six years that one party has controlled both the Executive and Legislative branches. Many forecasters believe the Trump presidency could usher in a new era of higher growth for the U.S. economy. As of period-end, however, there are still more questions than answers about the new administration’s ability to implement its agenda and the timing of any related legislation.
The Federal Reserve (Fed) raised its target range for the federal funds rate by 0.25% two times during the reporting period: once in December and again in March. The target range of the federal funds rate currently stands at 0.75%–1.00%. The Fed also increased the discount rate by 0.25% to 1.50% in March. After raising its target range by 0.25% just once in both 2015 and 2016, in March the Fed indicated that it expects three such increases in 2017. In its March press release, the central bank cited expanding economic activity and strong labor markets, while noting that monetary policy will remain accommodative until its desired 2% inflation target is attained.
Investors displayed a healthy appetite for risky assets through most of the period. Municipal bonds with shorter maturities generally performed better than bonds with longer maturities and high yield tax-exempt bonds outperformed their investment-grade counterparts. The Bloomberg Barclays High Yield Municipal Bond Index generated a +4.60% total return for the period and the Bloomberg Barclays Municipal Long (22+ Years) Bond Index returned +1.45%.1
Approximately $374 billion in municipal bonds were issued over the past 12 months. However, this was offset by the approximately $350 billion in municipal bonds that either matured or were called out of the market, making net supply slightly positive for the period at $24 billion.2 This net positive supply picture created a somewhat weaker technical backdrop that contributed to tepid returns for the period.
Overall, benchmark 10-year and 30-year tax-exempt interest rates ended the period higher than where they began, despite touching record low levels in July. Bond prices will decline as interest rates rise, impacting total return performance. However, bouts of volatility such as the one experienced following the election provide opportunities for Franklin Templeton’s actively managed investment strategies to seek to take advantage of market dislocations and potentially increase the income of its portfolios. In periods of low and declining interest rates, as has been the environment over the past several years, issuers can “pre-refund” their debt. As a result, our funds have heightened exposure to these pre-refunded bonds, which tend to be short duration, high quality securities. In addition to generating income at higher than current market rates, they also enhance portfolio liquidity and help reduce volatility.
Several developments affected Puerto Rico bonds over the reporting period. On May 3, 2017, the Puerto Rico federal Oversight Board filed for Title III (bankruptcy) under the Puerto Rico Oversight, Management, and Economic Stability Act (PROMESA) for Puerto Rico’s central government, and followed with a similar filing for COFINA on May 5, 2017. In doing so, the Oversight Board made the determination that Puerto Rico and COFINA each met the requirements for commencing a Title III proceeding, including that good faith efforts to reach a consensual restructuring with creditors were made without having reached an agreement. Judge Laura
1. Source: Morningstar. Treasuries, if held to maturity, offer a fixed rate of return and a fixed principal value; their interest payments and principal are guaranteed.
See www.franklintempletondatasources.com for additional data provider information.
2. Source: Goldman Sachs Securities Division, Bloomberg.
See www.franklintempletondatasources.com for additional data provider information.
| | | | | | |
| franklintempleton.com | | Annual Report | | | 3 | |
Taylor Swain, a district court judge in the Southern District of New York, is presiding over the process, and the first hearing was held on May 17, 2017, in San Juan. Legal counsel for Franklin, OppenheimerFunds and First Puerto Rico Funds appeared on their behalf at the May 17th hearing to represent their interests with respect to their COFINA holdings.
On June 30, 2016, President Obama signed PROMESA, a bipartisan congressional effort that created the independent, seven-member Oversight Board. The board, appointed by the House of Representatives, Senate and President Obama, has fiscal oversight over Puerto Rico’s finances for an initial term of five years and its term will expire once Puerto Rico has posted four structurally balanced budgets in a row and is deemed to have “adequate access… at reasonable interest rates” to the capital markets. The board has the power to approve or reject the general government’s proposed budgets until the board is satisfied that the budgets are structurally responsible and based on reasonable expectations and accounting standards.
Additionally, Title III of PROMESA provides Puerto Rico with a path for restructuring its debts following a process based on Chapter 9 of the U.S. Bankruptcy Code, with some important protections and safeguards that are not available to creditors in a Chapter 9 proceeding. This is important as the U.S. Supreme Court affirmed in June 2016 that neither Puerto Rico nor its municipalities or agencies can file for bankruptcy under Chapter 9. Title III is available to Puerto Rico and its related issuers only if negotiations under Title VI of PROMESA do not result in consensual agreements with creditors following good faith efforts to reach a consensual restructuring.
On Monday, March 13, 2017, the Oversight Board certified a 10-year Fiscal Plan for Puerto Rico, as required by PROMESA.
As part of the Puerto Rico Electric Power Authority (PREPA) forbearing creditor group (Ad Hoc Group), we have been participating in discussions related to the PREPA bonds owned by our managed funds and accounts.
After months of negotiation, PREPA and more than 70% of its creditors signed an Amended and Restated Restructuring Support Agreement (RSA) that would provide, among other things, for a restructuring of some of PREPA’s outstanding debt at 85 cents on the dollar. In our view, the implementation of the RSA would provide the basis for PREPA to provide more reliable and lower-cost service, fund its capital needs for the medium term, help ensure environmental compliance, diversify generation resources to include more natural gas, and provide jobs.
The new RSA sets forth numerous milestones, including approval from the Oversight Board, and is scheduled to expire September 1, 2017, the date on which the exchange is expected to take place.
COFINA, the Spanish name for debt secured by a dedicated portion of the sales and use tax, has through May 2017 made all principal and interest payments on time and in full. Several creditors have alleged that an event of default has occurred which could, under certain circumstances, result in acceleration. Because Judge Swain could not hear the matter prior to June 1, 2017, when a small debt service payment was due, she ordered the payment, which is on deposit with the trustee, be put in escrow for benefit of bondholders until the matter is heard in the next few months.
On July 1, 2016, Puerto Rico defaulted on the entire payment due on its General Obligation (GO) Bonds, making it the first state or territory-level issuer to do so since the Great Depression. The government has continued to default on GO bonds as of this writing; however, Puerto Rico Governor Ricardo Roselló Nevares did authorize the March 1, 2017, debt service payment of $1.4 million.
On November 22, 2016, certain Franklin Municipal Bond Funds that own COFINA bonds joined other bondholders in filing a Motion to Intervene in a lawsuit in Puerto Rico between a group of GO hedge fund bondholders and the government, in an effort to uphold the validity of the COFINA bond structure. The motion was granted on February 17, 2017. On April 4, 2017, the First Circuit Court of Appeals, in a related motion, stayed all aspects of the lawsuit until May 1, 2017. The Title III filing discussed above has further stayed this lawsuit and other litigation related to Puerto Rico’s GO and COFINA debt.
At period-end, we maintained our positive view of the municipal bond market. We believe municipal bonds continue to be an attractive asset class among fixed income securities, and we intend to follow our solid discipline of investing to maximize income, while seeking value in the municipal bond market.
The foregoing information reflects our analysis, opinions and portfolio holdings as of May 31, 2017, the end of the reporting period. The way we implement our main investment strategies and the resulting portfolio holdings may change depending on factors such as market and economic conditions. These opinions may not be relied upon as investment advice or an offer for a particular security. The information is not a complete analysis of every aspect of any market, state, industry, security or the Fund. Statements of
| | | | |
| 4 | | Annual Report | | franklintempleton.com |
fact are from sources considered reliable, but the investment manager makes no representation or warranty as to their completeness or accuracy. Although historical performance is no guarantee of future results, these insights may help you understand our investment management philosophy.
| | | | | | |
| franklintempleton.com | | Annual Report | | | 5 | |
Franklin California High Yield Municipal Fund
This annual report for Franklin California High Yield Municipal Fund covers the fiscal year ended May 31, 2017.
Your Fund’s Goal and Main Investments
The Fund seeks to provide a high level of income exempt from federal and California personal income taxes by investing at least 80% of its net assets in municipal securities in any rating category, including higher yielding, lower rated securities, that pay interest free from such taxes.1 Its secondary goal is capital appreciation to the extent possible and consistent with its principal goal.
Credit Quality Composition*
5/31/17
| | | | |
| Ratings | | % of Total
Investments | |
| AAA | | | 1.71% | |
| AA | | | 23.72% | |
| A | | | 19.07% | |
| BBB | | | 16.09% | |
| Below Investment Grade | | | 9.60% | |
| Refunded | | | 9.82% | |
| Not Rated | | | 19.99% | |
*Securities, except for those labeled Not Rated, are assigned ratings by one or more Nationally Recognized Statistical Credit Rating Organizations (NRSROs), such as Standard & Poor’s, Moody’s and Fitch, that can be considered by the investment manager as part of its independent securities analysis. When ratings from multiple agencies are available, the highest is used, consistent with the portfolio investment process. Ratings reflect an NRSRO’s opinion of an issuer’s creditworthiness and typically range from AAA (highest) to D (lowest). The Below Investment Grade category consists of bonds rated below BBB-. The Refunded category generally consists of refunded bonds secured by U.S. government or other high-quality securities and not rerated by an NRSRO. The Not Rated category consists of ratable securities that have not been rated by an NRSRO. Cash and equivalents are excluded from this composition.
Performance Overview
The Fund’s Class A share price, as measured by net asset value, decreased from $11.10 on May 31, 2016, to $10.89 on May 31, 2017. The Fund’s Class A shares paid dividends totaling 39.34 cents per share for the reporting period.2 The Performance Summary beginning on page 9 shows that at the end of this reporting period the Fund’s Class A shares’ distribution rate
was 3.60% based on an annualization of May’s 3.41 cent per share dividend and the maximum offering price of $11.37 on May 31, 2017. An investor in the 2017 maximum combined effective federal and California personal income tax bracket of 50.83% (including 3.8% Medicare tax) would need to earn a distribution rate of 7.32% from a taxable investment to match the Fund’s Class A tax-free distribution rate. For other performance data, please see the Performance Summary.
Performance data represent past performance, which does not guarantee future results. Investment return and principal value will fluctuate, and you may have a gain or loss when you sell your shares. Current performance may differ from figures shown. For most recent month-end performance, go to franklintempleton.com or call (800) 342-5236.
| | | | | | | | | | | | |
| Dividend Distributions* | |
| 6/1/16–5/31/17 | |
| | | Dividend per Share (cents) | |
| Month | | Class A | | | Class C | | | Advisor Class | |
| June | | | 3.30 | | | | 2.79 | | | | 3.39 | |
| July | | | 3.25 | | | | 2.74 | | | | 3.34 | |
| August | | | 3.20 | | | | 2.69 | | | | 3.29 | |
| September | | | 3.16 | | | | 2.63 | | | | 3.25 | |
| October | | | 3.16 | | | | 2.63 | | | | 3.25 | |
| November | | | 3.16 | | | | 2.63 | | | | 3.25 | |
| December | | | 3.21 | | | | 2.69 | | | | 3.30 | |
| January | | | 3.31 | | | | 2.79 | | | | 3.40 | |
| February | | | 3.36 | | | | 2.84 | | | | 3.45 | |
| March | | | 3.41 | | | | 2.92 | | | | 3.49 | |
| April | | | 3.41 | | | | 2.92 | | | | 3.49 | |
| May | | | 3.41 | | | | 2.92 | | | | 3.49 | |
| Total | | | 39.34 | | | | 33.19 | | | | 40.39 | |
*The distribution amount is the sum of all net investment income distributions for the period shown. Assumes shares were purchased and held for the entire accrual period. Since dividends accrue daily, your actual distributions will vary depending on the date you purchased your shares and any account activity. All Fund distributions will vary depending upon current market conditions, and past distributions are not indicative of future trends.
State Update
California’s large and diverse economy continued to expand during the past 12 months under review. Universities and
1. The Fund may invest up to 100% of its assets in bonds whose interest payments are subject to federal alternative minimum tax. All or a significant portion of the income on these obligations may be subject to such tax. Distributions of capital gains are generally taxable. To avoid imposition of 28% backup withholding on all Fund distributions and redemption proceeds, U.S. investors must be properly certified on Form W-9 and non-U.S. investors on Form W-8BEN.
2. The distribution amount is the sum of all net investment income distributions for the period shown. Assumes shares were purchased and held for the entire accrual period.
Since dividends accrue daily, your actual distributions will vary depending on the date you purchased your shares and any account activity. All Fund distributions will vary depending upon current market conditions, and past distributions are not indicative of future trends.
The dollar value, number of shares or principal amount, and names of all portfolio holdings are listed in the Fund’s Statement of Investments (SOI). The SOI begins on page 23.
| | | | |
| | | |
| 6 | | Annual Report | | franklintempleton.com |
FRANKLIN CALIFORNIA HIGH YIELD MUNICIPAL FUND
innovative businesses supported the state’s expansion. Job growth in the state outpaced that of the nation, positioning its economy for faster overall economic growth and pushing revenues higher. Unemployment declined from 5.5% in May 2016 to 4.7% at period-end, yet remained above the 4.3% national rate.3 Sales of California homes declined during the period as housing prices generally increased.
According to independent credit rating agency Standard & Poor’s (S&P), several years of improving California’s fiscal condition have enabled the state to significantly increase funding for education, establish anti-poverty programs, retire debts and build budgetary reserves. However, recent state spending growth and slower revenue collections throughout fiscal year 2017 have marginally tipped California’s general fund into an operating deficit. The governor’s new fiscal year 2017 budget proposal anticipates slower revenue growth ahead and recommends corrective action to close the budget gap.
California’s net tax-supported debt was $2,217 per capita and 4.2% of personal income, compared with the $1,006 and 2.5% national medians, respectively.4 During the period under review, S&P assigned its rating of California’s general obligations bonds at AA- with a stable outlook.5 The rating reflected S&P’s view on the state’s expanding economy, increasing budgetary reserve levels, strong overall liquidity and declining debt ratios. In contrast, S&P cited several challenges to the state including high housing costs, a volatile revenue structure, retirement benefit liabilities and a large backlog of deferred maintenance and infrastructure. Nevertheless, the stable outlook reflected S&P’s view that California has brought its finances into structural alignment and generated modest operating surpluses that could translate to larger projected budget reserves.
Investment Strategy
We use a consistent, disciplined strategy in an effort to maximize tax-exempt income for our shareholders while balancing risk and return within the Fund’s range of allowable investments. We generally employ a buy-and-hold approach and invest in securities we believe should provide the most relative value in the market. We do not use leverage or derivatives, nor do we use hedging techniques that could add volatility and contribute to underperformance in adverse markets.
| | | | |
| Portfolio Composition | | | | |
| 5/31/17 | | | | |
| | | % of Total
Investments* | |
| Tax-Supported | | | 22.6% | |
| General Obligation | | | 13.4% | |
| Transportation | | | 13.2% | |
| Hospital & Health Care | | | 12.0% | |
| Refunded** | | | 11.5% | |
| Utilities | | | 7.8% | |
| Other Revenue | | | 7.1% | |
| Higher Education | | | 4.9% | |
| Subject to Government Appropriations | | | 3.5% | |
| Housing | | | 2.9% | |
| Corporate-Backed | | | 1.1% | |
*Does not include cash and cash equivalents.
**Includes all refunded bonds; the percentage may differ from that in the Credit Quality Composition.
Manager’s Discussion
Consistent with our strategy, we sought to remain invested in bonds that maintain an average weighted maturity of 15 to 30 years with good call features. Based on the combination of our value-oriented philosophy of investing primarily for income and a positively sloping municipal yield curve, in which interest rates for longer term bonds are higher than those for shorter term bonds, we favored the use of longer term bonds. We believe our conservative, buy-and-hold investment strategy can help us achieve high, current, tax-free income for shareholders.
The Fund holds a small portion of its assets in Puerto Rico bonds, which decreased in price over the period. Additionally, Puerto Rico and its municipal issuers continued to experience significant financial difficulties, which we discussed in the Municipal Bond Market Overview on page 3. We continue to closely monitor developments in Puerto Rico; however, the municipal bond market’s overall fundamentals, such as general creditworthiness and low default rates, remained stable.
Thank you for your continued participation in Franklin California High Yield Municipal Fund. We look forward to serving your future investment needs.
3. Source: Bureau of Labor Statistics.
4. Source: Moody’s Investors Service, State Government - US: Medians - Total State Debt Remains Essentially Flat in 2017, 5/3/17.
5. This does not indicate S&P’s rating of the Fund.
See www.franklintempletondatasources.com for additional data provider information.
| | | | |
| | | |
| franklintempleton.com | | Annual Report | | 7 |
FRANKLIN CALIFORNIA HIGH YIELD MUNICIPAL FUND
The foregoing information reflects our analysis, opinions and portfolio holdings as of May 31, 2017, the end of the reporting period. The way we implement our main investment strategies and the resulting portfolio holdings may change depending on factors such as market and economic conditions. These opinions may not be relied upon as investment advice or an offer for a particular security. The information is not a complete analysis of every aspect of any market, state, industry, security or the Fund. Statements of fact are from sources considered reliable, but the investment manager makes no representation or warranty as to their completeness or accuracy. Although historical performance is no guarantee of future results, these insights may help you understand our investment management philosophy.
| | | | |
| 8 | | Annual Report | | franklintempleton.com |
FRANKLIN CALIFORNIA HIGH YIELD MUNICIPAL FUND
Performance Summary as of May 31, 2017
The performance tables and graphs do not reflect any taxes that a shareholder would pay on Fund dividends, capital gain distributions, if any, or any realized gains on the sale of Fund shares. Total return reflects reinvestment of the Fund’s dividends and capital gain distributions, if any, and any unrealized gains or losses. Your dividend income will vary depending on dividends or interest paid by securities in the Fund’s portfolio, adjusted for operating expenses of each class. Capital gain distributions are net profits realized from the sale of portfolio securities.
Performance as of 5/31/17
Cumulative total return excludes sales charges. Average annual total return includes maximum sales charges. Sales charges will vary depending on the size of the investment and the class of share purchased. The maximum is 4.25% and the minimum is 0%. Class A: 4.25% maximum initial sales charge; Advisor Class: no sales charges. For other share classes, visit franklintempleton.com.
| | | | | | | | |
| Share Class | | Cumulative
Total Return1
| | | Average Annual
Total Return2 | |
| | |
A | | | | | | | | |
1-Year | | | +1.71% | | | | -2.59% | |
5-Year | | | +28.71% | | | | +4.27% | |
10-Year | | | +67.72% | | | | +4.85% | |
| | |
Advisor | | | | | | | | |
1-Year | | | +1.80% | | | | +1.80% | |
5-Year | | | +29.42% | | | | +5.29% | |
| 10-Year | | | +69.42% | | | | +5.41% | |
| | | | | | | | | | | | | | | | |
| Share Class | | Distribution
Rate3 | | | Taxable Equivalent
Distribution Rate4 | | | 30-Day
Standardized Yield5 | | | Taxable Equivalent 30-Day
Standardized Yield4 | |
A | | | 3.60% | | | | 7.32% | | | | 2.67% | | | | 5.43% | |
Advisor | | | 3.84% | | | | 7.81% | | | | 2.89% | | | | 5.88% | |
Performance data represent past performance, which does not guarantee future results. Investment return and principal value will fluctuate, and you may have a gain or loss when you sell your shares. Current performance may differ from figures shown. For most recent month-end performance, go to franklintempleton.com or call (800) 342-5236.
See page 11 for Performance Summary footnotes.
| | | | | | |
| franklintempleton.com | | Annual Report | | | 9 | |
FRANKLIN CALIFORNIA HIGH YIELD MUNICIPAL FUND
PERFORMANCE SUMMARY
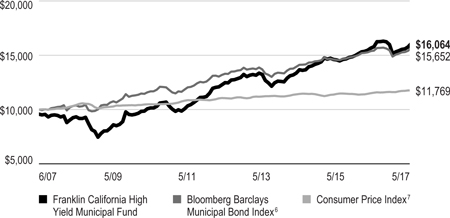
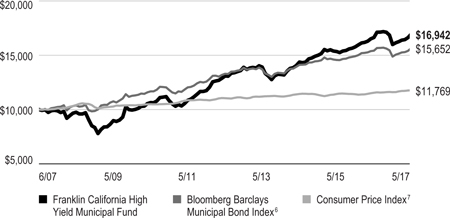
Total Return Index Comparison for a Hypothetical $10,000 Investment
Total return represents the change in value of an investment over the periods shown. It includes any applicable maximum sales charge, Fund expenses, account fees and reinvested distributions. The unmanaged indexes include reinvestment of any income or distributions. They differ from the Fund in composition and do not pay management fees or expenses. One cannot invest directly in an index.
Class A (6/1/07–5/31/17)
Advisor Class (6/1/07–5/31/17)
See page 11 for Performance Summary footnotes.
| | | | |
| 10 | | Annual Report | | franklintempleton.com |
FRANKLIN CALIFORNIA HIGH YIELD MUNICIPAL FUND
PERFORMANCE SUMMARY
Net Asset Value
| | | | | | | | | | | | |
| Share Class (Symbol) | | 5/31/17 | | | 5/31/16 | | | Change | |
A (FCAMX) | | | $10.89 | | | | $11.10 | | | | -$0.21 | |
C (FCAHX) | | | $10.97 | | | | $11.17 | | | | -$0.20 | |
Advisor (FVCAX) | | | $10.91 | | | | $11.12 | | | | -$0.21 | |
|
Distributions (6/1/16–5/31/17) | |
| Share Class | | Net Investment
Income | | | | | | | |
A | | | $0.3934 | | | | | | | | | |
C | | | $0.3319 | | | | | | | | | |
Advisor | | | $0.4039 | | | | | | | | | |
|
| Total Annual Operating Expenses8 | |
| Share Class | | | | | | | | | |
A | | | 0.65% | | | | | | | | | |
Advisor | | | 0.55% | | | | | | | | | |
Each class of shares is available to certain eligible investors and has different annual fees and expenses, as described in the prospectus.
All investments involve risks, including possible loss of principal. Because municipal bonds are sensitive to interest-rate movements, the Fund’s yield and share price will fluctuate with market conditions. Bond prices generally move in the opposite direction of interest rates. Thus, as prices of bonds in the Fund adjust to a rise in interest rates, the Fund’s share price may decline. Because the Fund invests principally in a single state, it is subject to greater risk of adverse economic and regulatory changes in that state than a geographically diversified fund. Investments in lower rated bonds include higher risk of default and loss of principal. The Fund holds a small portion of its assets in Puerto Rico municipal bonds that have been impacted by recent adverse economic and market changes, which may cause the Fund’s share price to decline. Changes in the credit rating of a bond, or in the credit rating or financial strength of a bond’s issuer, insurer or guarantor, may affect the bond’s value. The Fund may invest a significant part of its assets in municipal securities that finance similar types of projects, such as utilities, hospitals, higher education and transportation. A change that affects one project would likely affect all similar projects, there by increasing market risk. The Fund is actively managed but there is no guarantee that the manager’s investment decisions will produce the desired results. The Fund’s prospectus also includes a description of the main investment risks.
1. Cumulative total return represents the change in value of an investment over the periods indicated.
2. Average annual total return represents the average annual change in value of an investment over the periods indicated. Return for less than one year, if any, has not been annualized.
3. Distribution rate is based on an annualization of the respective class’s May dividend and the maximum offering price (NAV for Advisor Class) per share on 5/31/17.
4. Taxable equivalent distribution rate and yield assume the published rates as of 12/19/16 for the maximum combined effective federal and California state personal income tax rate of 50.83%, based on the federal income tax rate of 39.60% plus 3.8% Medicare tax.
5. The Fund’s 30-day standardized yield is calculated over a trailing 30-day period using the yield to maturity on bonds and/or the dividends accrued on stocks. It may not equal the Fund’s actual income distribution rate, which reflects the Fund’s past dividends paid to shareholders.
6. Source: Morningstar. The Bloomberg Barclays Municipal Bond Index is a market value-weighted index engineered for the long-term tax-exempt bond market. To be included in the index, bonds must be fixed rate, have at least one year to final maturity and be rated investment grade (Baa3/BBB- or higher) by at least two of the following agencies: Moody’s, S&P and Fitch.
7. Source: Bureau of Labor Statistics, bls.gov/cpi. The Consumer Price Index is a commonly used measure of the inflation rate.
8. Figures are as stated in the Fund’s current prospectus and may differ from the expense ratios disclosed in the Your Fund’s Expenses and Financial Highlights sections in this report. In periods of market volatility, assets may decline significantly, causing total annual Fund operating expenses to become higher than the figures shown.
See www.franklintempletondatasources.com for additional data provider information.
| | | | | | |
| franklintempleton.com | | Annual Report | | | 11 | |
FRANKLIN CALIFORNIA HIGH YIELD MUNICIPAL FUND
Your Fund’s Expenses
As a Fund shareholder, you can incur two types of costs: (1) transaction costs, including sales charges (loads) on Fund purchases and redemptions; and (2) ongoing Fund costs, including management fees, distribution and service (12b-1) fees, and other Fund expenses. All mutual funds have ongoing costs, sometimes referred to as operating expenses. The table below shows ongoing costs of investing in the Fund and can help you understand these costs and compare them with those of other mutual funds. The table assumes a $1,000 investment held for the six months indicated.
Actual Fund Expenses
The table below provides information about actual account values and actual expenses in the columns under the heading “Actual.” In these columns the Fund’s actual return, which includes the effect of Fund expenses, is used to calculate the “Ending Account Value” for each class of shares. You can estimate the expenses you paid during the period by following these steps (of course, your account value and expenses will differ from those in this illustration): Divide your account value by $1,000 (if your account had an $8,600 value, then $8,600 ÷ $1,000 = 8.6). Then multiply the result by the number in the row for your class of shares under the headings “Actual” and “Expenses Paid During Period” (if Actual Expenses Paid During Period were $7.50, then 8.6 x $7.50 = $64.50). In this illustration, the actual expenses paid this period are $64.50.
Hypothetical Example for Comparison with Other Funds
Under the heading “Hypothetical” in the table, information is provided about hypothetical account values and hypothetical expenses based on the Fund’s actual expense ratio and an assumed rate of return of 5% per year before expenses, which is not the Fund’s actual return. This information may not be used to estimate the actual ending account balance or expenses you paid for the period, but it can help you compare ongoing costs of investing in the Fund with those of other funds. To do so, compare this 5% hypothetical example for the class of shares you hold with the 5% hypothetical examples that appear in the shareholder reports of other funds.
Please note that expenses shown in the table are meant to highlight ongoing costs and do not reflect any transactional costs. Therefore, information under the heading “Hypothetical” is useful in comparing ongoing costs only, and will not help you compare total costs of owning different funds. In addition, if transactional costs were included, your total costs would have been higher.
| | | | | | | | | | | | | | | | | | |
| | | | | | | Actual (actual return after expenses) | | | | Hypothetical (5% annual return before expenses) | | |
Share Class | | Beginning
Account
Value 12/1/16 | | | | Ending
Account
Value 5/31/17 | | Expenses Paid During
Period 12/1/16–5/31/171 | | | | Ending
Account
Value 5/31/17 | | Expenses Paid During
Period 12/1/16–5/31/171 | | | | Annualized
Expense
Ratio |
A | | $1,000 | | | | $1,059.90 | | $3.34 | | | | $1,021.69 | | $3.28 | | | | 0.65% |
C | | $1,000 | | | | $1,056.40 | | $6.15 | | | | $1,018.95 | | $6.04 | | | | 1.20% |
Advisor | | $1,000 | | | | $1,059.20 | | $2.82 | | | | $1,022.19 | | $2.77 | | | | 0.55% |
1. Expenses are equal to the annualized expense ratio for the six-month period as indicated above–in the far right column–multiplied by the simple average account value over the period indicated, and then multiplied by 182/365 to reflect the one-half year period.
| | | | |
| 12 | | Annual Report | | franklintempleton.com |
Franklin Tennessee Municipal Bond Fund
This annual report for Franklin Tennessee Municipal Bond Fund covers the fiscal year ended May 31, 2017.
Your Fund’s Goal and Main Investments
The Fund seeks to maximize income exempt from federal and Tennessee personal income taxes, consistent with prudent investing and the preservation of capital, by investing at least 80% of its net assets in investment grade municipal securities that pay interest free from such taxes.1
Credit Quality Composition*
5/31/17
| | | | |
| Ratings | | % of Total
Investments | |
| AA | | | 55.52% | |
| A | | | 16.45% | |
| BBB | | | 3.32% | |
| Below Investment Grade | | | 2.27% | |
| Refunded | | | 20.18% | |
| Not Rated | | | 2.26% | |
*Securities, except for those labeled Not Rated, are assigned ratings by one or more Nationally Recognized Statistical Credit Rating Organizations (NRSROs), such as Standard & Poor’s, Moody’s and Fitch, that can be considered by the investment manager as part of its independent securities analysis. When ratings from multiple agencies are available, the highest is used, consistent with the portfolio investment process. Ratings reflect an NRSRO’s opinion of an issuer’s creditworthiness and typically range from AAA (highest) to D (lowest). The Below Investment Grade category consists of bonds rated below BBB-. The Refunded category generally consists of refunded bonds secured by U.S. government or other high-quality securities and not rerated by an NRSRO. The Not Rated category consists of ratable securities that have not been rated by an NRSRO. Cash and equivalents are excluded from this composition.
Performance Overview
The Fund’s Class A share price, as measured by net asset value, decreased from $11.44 on May 31, 2016, to $11.11 on May 31, 2017. The Fund’s Class A shares paid dividends totaling 37.50 cents per share for the reporting period.2 The Performance Summary beginning on page 16 shows that at the end of this reporting period the Fund’s Class A shares’ distribution rate was 3.21% based on an annualization of May’s 3.10 cent per share dividend and the maximum offering price of $11.60 on May 31, 2017. An investor in the 2017 maximum combined
effective federal and Tennessee personal income tax bracket of 46.42% (including 3.8% Medicare tax) would need to earn a distribution rate of 5.99% from a taxable investment to match the Fund’s Class A tax-free distribution rate. For other performance data, please see the Performance Summary.
Performance data represent past performance, which does not guarantee future results. Investment return and principal value will fluctuate, and you may have a gain or loss when you sell your shares. Current performance may differ from figures shown. For most recent month-end performance, go to franklintempleton.com or call (800) 342-5236.
| | | | | | | | |
| Dividend Distributions* | |
| 6/1/16–5/31/17 | |
| | | Dividend per Share (cents) | |
| Month | | Class A | | | Advisor Class** | |
| June | | | 3.20 | | | | — | |
| July | | | 3.10 | | | | — | |
| August | | | 3.10 | | | | — | |
| September | | | 3.10 | | | | 1.59 | |
| October | | | 3.10 | | | | 3.19 | |
| November | | | 3.10 | | | | 3.19 | |
| December | | | 3.10 | | | | 3.19 | |
| January | | | 3.15 | | | | 3.24 | |
| February | | | 3.15 | | | | 3.24 | |
| March | | | 3.15 | | | | 3.24 | |
| April | | | 3.15 | | | | 3.24 | |
| May | | | 3.10 | | | | 3.19 | |
| Total | | | 37.50 | | | | 27.31 | |
*The distribution amount is the sum of all net investment income distributions for the period shown. Assumes shares were purchased and held for the entire accrual period. Since dividends accrue daily, your actual distributions will vary depending on the date you purchased your shares and any account activity. All Fund distributions will vary depending upon current market conditions, and past distributions are not indicative of future trends.
**Effective 9/15/16, the Fund began offering Advisor Class shares. See the prospectus for details.
State Update
Over the 12 months under review, Tennessee’s diverse economy grew. The state is a distribution and manufacturing hub partly due to its access to the Mississippi River,
1. The Fund may invest up to 100% of its assets in bonds whose interest payments are subject to federal alternative minimum tax. All or a significant portion of the income on these obligations may be subject to such tax. Distributions of capital gains are generally taxable. To avoid imposition of 28% backup withholding on all Fund distributions and redemption proceeds, U.S. investors must be properly certified on Form W-9 and non-U.S. investors on Form W-8BEN.
2. The distribution amount is the sum of all net investment income distributions for the period shown. Assumes shares were purchased and held for the entire accrual period. Since dividends accrue daily, your actual distributions will vary depending on the date you purchased your shares and any account activity. All Fund distributions will vary depending upon current market conditions, and past distributions are not indicative of future trends.
The dollar value, number of shares or principal amount, and names of all portfolio holdings are listed in the Fund’s Statement of Investments (SOI). The SOI begins on page 40.
| | | | | | |
| franklintempleton.com | | Annual Report | | | 13 | |
FRANKLIN TENNESSEE MUNICIPAL BOND FUND
transportation network and abundant supply of land. These factors contributed to its strong–yet cyclical–trade and manufacturing businesses. Tennessee’s unemployment rate declined from 4.6% in May 2016 to 4.0% at period-end, below the nation’s 4.3% average.3
Tennessee’s fiscal year 2016 budget ended the period with better-than-budgeted revenue performance and supported the enacted fiscal year 2017 budget surplus, which includes additional funding for K-12 education, teacher pay and rural development. The state’s enacted 2016 and 2017 budgets are structurally balanced and aim to continue building rainy day reserves.
Tennessee’s net tax-supported debt was relatively low at $322 per capita and 0.8% of personal income, compared with the $1,006 and 2.5% national medians, respectively.4 During the period under review, independent credit rating agency Standard & Poor’s (S&P) assigned the state’s general obligations bonds AAA with a stable outlook.5 In S&P’s view, the rating reflected the state’s strong growth, improving rainy day reserves, strong financial management practices and performance, long-standing funding of the state’s retirement obligations and low debt burden. The outlook also reflected S&P’s view of Tennessee’s excellent management of its long-term liabilities and that the state could continue to exhibit economic growth, supported by its growing employment.
Investment Strategy
We use a consistent, disciplined strategy in an effort to maximize tax-exempt income for our shareholders while balancing risk and return within the Fund’s range of allowable investments. We generally employ a buy-and-hold approach and invest in securities we believe should provide the most relative value in the market. We do not use leverage or derivatives, nor do we use hedging techniques that could add volatility and contribute to underperformance in adverse markets.
Manager’s Discussion
Consistent with our strategy, we sought to remain invested in bonds that maintain an average weighted maturity of 15 to 30 years with good call features. Based on the combination of our value-oriented philosophy of investing primarily for income and a positively sloping municipal yield curve, in which interest rates for longer term bonds are higher than those
Portfolio Composition
5/31/17
| | | | |
| | | % of Total
Investments* | |
| Utilities | | | 26.1% | |
| Refunded** | | | 24.7% | |
| Hospital & Health Care | | | 17.2% | |
| Higher Education | | | 8.9% | |
| General Obligation | | | 7.6% | |
| Transportation | | | 6.6% | |
| Other Revenue | | | 4.3% | |
| Housing | | | 3.0% | |
| Tax-Supported | | | 1.1% | |
| Subject to Government Appropriations | | | 0.5% | |
*Does not include cash and cash equivalents.
**Includes all refunded bonds; the percentage may differ from that in the Credit Quality Composition.
for shorter term bonds, we favored the use of longer term bonds. We believe our conservative, buy-and-hold investment strategy can help us achieve high, current, tax-free income for shareholders.
The Fund holds a small portion of its assets in Puerto Rico bonds, which decreased in price over the period. The price decline of COFINA bonds outweighed an increase in price for the PREPA bond in the Fund. Additionally, Puerto Rico and its municipal issuers continued to experience significant financial difficulties, which we discussed in the Municipal Bond Market Overview on page 3. We continue to closely monitor developments in Puerto Rico; however, the municipal bond market’s overall fundamentals, such as general creditwor-thiness and low default rates, remained stable.
Thank you for your continued participation in Franklin Tennessee Municipal Bond Fund. We look forward to serving your future investment needs.
3. Source: Bureau of Labor Statistics.
4. Source: Moody’s Investors Service, State Government - US: Medians - Total State Debt Remains Essentially Flat in 2017, 5/3/17.
5. This does not indicate S&P’s rating of the Fund.
See www.franklintempletondatasources.com for additional data provider information.
| | | | |
| 14 | | Annual Report | | franklintempleton.com |
FRANKLIN TENNESSEE MUNICIPAL BOND FUND
The foregoing information reflects our analysis, opinions and portfolio holdings as of May 31, 2017, the end of the reporting period. The way we implement our main investment strategies and the resulting portfolio holdings may change depending on factors such as market and economic conditions. These opinions may not be relied upon as investment advice or an offer for a particular security. The information is not a complete analysis of every aspect of any market, state, industry, security or the Fund. Statements of fact are from sources considered reliable, but the investment manager makes no representation or warranty as to their completeness or accuracy. Although historical performance is no guarantee of future results, these insights may help you understand our investment management philosophy.
| | | | | | |
| franklintempleton.com | | Annual Report | | | 15 | |
FRANKLIN TENNESSEE MUNICIPAL BOND FUND
Performance Summary as of May 31, 2017
The performance tables and graphs do not reflect any taxes that a shareholder would pay on Fund dividends, capital gain distributions, if any, or any realized gains on the sale of Fund shares. Total return reflects reinvestment of the Fund’s dividends and capital gain distributions, if any, and any unrealized gains or losses. Your dividend income will vary depending on dividends or interest paid by securities in the Fund’s portfolio, adjusted for operating expenses of each class. Capital gain distributions are net profits realized from the sale of portfolio securities.
Performance as of 5/31/17
Cumulative total return excludes sales charges. Average annual total return includes maximum sales charges. Sales charges will vary depending on the size of the investment and the class of share purchased. The maximum is 4.25% and the minimum is 0%. Class A: 4.25% maximum initial sales charge; Advisor Class: no sales charges.
| | | | | | | | |
| Share Class | | Cumulative Total Return1 | | | Average Annual
Total Return2 | |
| | |
A | | | | | | | | |
1-Year | | | +0.40% | | | | -3.89% | |
5-Year | | | +10.91% | | | | +1.21% | |
10-Year | | | +44.73% | | | | +3.31% | |
| | |
Advisor3 | | | | | | | | |
1-Year | | | +0.56% | | | | +0.56% | |
5-Year | | | +11.08% | | | | +2.12% | |
10-Year | | | +44.96% | | | | +3.78% | |
| | | | | | | | | | | | | | | | |
| Share Class | | Distribution
Rate4 | | | Taxable Equivalent
Distribution Rate5 | | | 30-Day
Standardized Yield6 | | | Taxable Equivalent 30-Day
Standardized Yield5 | |
A | | | 3.21% | | | | 5.99% | | | | 1.74% | | | | 3.25% | |
Advisor | | | 3.44% | | | | 6.42% | | | | 1.92% | | | | 3.58% | |
Performance data represent past performance, which does not guarantee future results. Investment return and principal value will fluctuate, and you may have a gain or loss when you sell your shares. Current performance may differ from figures shown. For most recent month-end performance, go to franklintempleton.com or call (800) 342-5236.
See page 18 for Performance Summary footnotes.
| | | | |
| | | |
| 16 | | Annual Report | | franklintempleton.com |
FRANKLIN TENNESSEE MUNICIPAL BOND FUND
PERFORMANCE SUMMARY
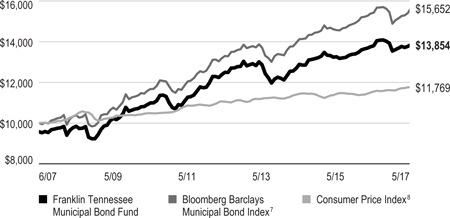
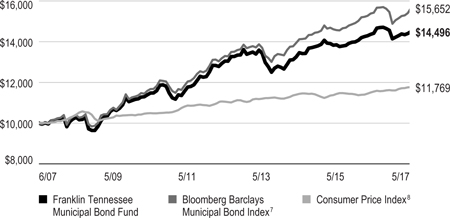
Total Return Index Comparison for a Hypothetical $10,000 Investment
Total return represents the change in value of an investment over the periods shown. It includes any applicable maximum sales charge, Fund expenses, account fees and reinvested distributions. The unmanaged indexes include reinvestment of any income or distributions. They differ from the Fund in composition and do not pay management fees or expenses. One cannot invest directly in an index.
Class A (6/1/07–5/31/17)
Advisor Class (6/1/07–5/31/17)3
See page 18 for Performance Summary footnotes.
| | | | | | |
| franklintempleton.com | | Annual Report | | | 17 | |
FRANKLIN TENNESSEE MUNICIPAL BOND FUND
PERFORMANCE SUMMARY
Net Asset Value
| | | | | | | | | | | | | | | | |
| Share Class (Symbol) | | 5/31/17 | | | 9/15/16 | | | 5/31/16 | | | Change | |
A (FRTIX) | | | $11.11 | | | | N/A | | | | $11.44 | | | | - $0.33 | |
Advisor (FTMZX) | | | $11.12 | | | | $11.50 | | | | N/A | | | | - $0.38 | |
|
Distributions (6/1/16–5/31/17) | |
| Share Class | | Net Investment
Income | | | | | | | | | | |
A | | | $0.3750 | | | | | | | | | | | | | |
Advisor (9/15/16–5/31/17) | | | $0.2731 | | | | | | | | | | | | | |
|
Total Annual Operating Expenses9 | |
| | | | |
| Share Class | | | | | | | | | | | | |
A | | | 0.72% | | | | | | | | | | | | | |
Advisor | | | 0.62% | | | | | | | | | | | | | |
Each class of shares is available to certain eligible investors and has different annual fees and expenses, as described in the prospectus.
All investments involve risks, including possible loss of principal. Because municipal bonds are sensitive to interest-rate movements, the Fund’s yield and share price will fluctuate with market conditions. Bond prices generally move in the opposite direction of interest rates. Thus, as prices of bonds in the Fund adjust to a rise in interest rates, the Fund’s share price may decline. Because the Fund invests principally in a single state, it is subject to greater risk of adverse economic and regulatory changes in that state than a geographically diversified fund. The Fund holds a small portion of its assets in Puerto Rico municipal bonds that have been impacted by recent adverse economic and market changes, which may cause the Fund’s share price to decline. Changes in the credit rating of a bond, or in the credit rating or financial strength of a bond’s issuer, insurer or guarantor, may affect the bond’s value. The Fund may invest a significant part of its assets in municipal securities that finance similar types of projects, such as utilities, hospitals, higher education and transportation. A change that affects one project would likely affect all similar projects, thereby increasing market risk. The Fund is actively managed but there is no guarantee that the manager’s investment decisions will produce the desired results. The Fund’s prospectus also includes a description of the main investment risks.
1. Cumulative total return represents the change in value of an investment over the periods indicated.
2. Average annual total return represents the average annual change in value of an investment over the periods indicated. Return for less than one year, if any, has not been annualized.
3. Effective 9/15/16, the Fund began offering Advisor class shares, which do not have sales charges or a Rule 12b-1 plan. Performance quotations for this class reflect the following methods of calculation: (a) For periods prior to 9/15/16, a restated figure is used based upon the Fund’s Class A performance, excluding the effect of Class A’s maximum initial sales charge, but reflecting the effect of the Class A Rule 12b-1 fees; and (b) for periods after 9/15/16, actual Advisor class performance is used reflecting all charges and fees applicable to that class. Since 9/15/16 (commencement of sales), the cumulative and average annual total returns of Advisor Class shares were -0.91% and -0.91%.
4. Distribution rate is based on an annualization of the respective class’s May dividend and the maximum offering price (NAV for Advisor Class) per share on 5/31/17.
5. Taxable equivalent distribution rate and yield assume the published rates as of 12/19/16 for the maximum combined effective federal and Tennessee state personal income tax rate of 46.42%, based on the federal income tax rate of 39.60% plus 3.8% Medicare tax.
6. The Fund’s 30-day standardized yield is calculated over a trailing 30-day period using the yield to maturity on bonds and/or the dividends accrued on stocks. It may not equal the Fund’s actual income distribution rate, which reflects the Fund’s past dividends paid to shareholders.
7. Source: Morningstar. The Bloomberg Barclays Municipal Bond Index is a market value-weighted index engineered for the long-term tax-exempt bond market. To be included in the index, bonds must be fixed rate, have at least one year to final maturity and be rated investment grade (Baa3/BBB- or higher) by at least two of the following agencies: Moody’s, S&P and Fitch.
8. Source: Bureau of Labor Statistics, bls.gov/cpi. The Consumer Price Index is a commonly used measure of the inflation rate.
9. Figures are as stated in the Fund’s current prospectus and may differ from the expense ratios disclosed in the Your Fund’s Expenses and Financial Highlights sections in this report. In periods of market volatility, assets may decline significantly, causing total annual Fund operating expenses to become higher than the figures shown.
See www.franklintempletondatasources.com for additional data provider information.
| | | | |
| 18 | | Annual Report | | franklintempleton.com |
FRANKLIN TENNESSEE MUNICIPAL BOND FUND
Your Fund’s Expenses
As a Fund shareholder, you can incur two types of costs: (1) transaction costs, including sales charges (loads) on Fund purchases and redemptions; and (2) ongoing Fund costs, including management fees, distribution and service (12b-1) fees, and other Fund expenses. All mutual funds have ongoing costs, sometimes referred to as operating expenses. The table below shows ongoing costs of investing in the Fund and can help you understand these costs and compare them with those of other mutual funds. The table assumes a $1,000 investment held for the six months indicated.
Actual Fund Expenses
The table below provides information about actual account values and actual expenses in the columns under the heading “Actual.” In these columns the Fund’s actual return, which includes the effect of Fund expenses, is used to calculate the “Ending Account Value” for each class of shares. You can estimate the expenses you paid during the period by following these steps (of course, your account value and expenses will differ from those in this illustration): Divide your account value by $1,000 (if your account had an $8,600 value, then $8,600 ÷ $1,000 = 8.6). Then multiply the result by the number in the row for your class of shares under the headings “Actual” and “Expenses Paid During Period” (if Actual Expenses Paid During Period were $7.50, then 8.6 x $7.50 = $64.50). In this illustration, the actual expenses paid this period are $64.50.
Hypothetical Example for Comparison with Other Funds
Under the heading “Hypothetical” in the table, information is provided about hypothetical account values and hypothetical expenses based on the Fund’s actual expense ratio and an assumed rate of return of 5% per year before expenses, which is not the Fund’s actual return. This information may not be used to estimate the actual ending account balance or expenses you paid for the period, but it can help you compare ongoing costs of investing in the Fund with those of other funds. To do so, compare this 5% hypothetical example for the class of shares you hold with the 5% hypothetical examples that appear in the shareholder reports of other funds.
Please note that expenses shown in the table are meant to highlight ongoing costs and do not reflect any transactional costs. Therefore, information under the heading “Hypothetical” is useful in comparing ongoing costs only, and will not help you compare total costs of owning different funds. In addition, if transactional costs were included, your total costs would have been higher.
| | | | | | | | | | | | | | | | | | |
| | | | | | | Actual (actual return after expenses) | | | | Hypothetical (5% annual return before expenses) | | |
Share Class | | Beginning
Account
Value 12/1/16 | | | | Ending
Account
Value 5/31/17 | | Expenses Paid During
Period 12/1/16–5/31/171 | | | | Ending
Account
Value 5/31/17 | | Expenses Paid During Period 12/1/16–5/31/171 | | | | Annualized
Expense
Ratio |
A | | $1,000 | | | | $1,023.50 | | $3.83 | | | | $1,021.14 | | $3.83 | | | | 0.76% |
Advisor | | $1,000 | | | | $1,024.90 | | $3.33 | | | | $1,021.64 | | $3.33 | | | | 0.66% |
1. Expenses are equal to the annualized expense ratio for the six-month period as indicated above–in the far right column–multiplied by the simple average account value over the period indicated, and then multiplied by 182/365 to reflect the one-half year period.
| | | | | | |
| franklintempleton.com | | Annual Report | | | 19 | |
FRANKLIN MUNICIPAL SECURITIES TRUST
Financial Highlights
Franklin California High Yield Municipal Fund
| | | | | | | | | | | | | | | | | | | | |
| | | Year Ended May 31, | |
| | | 2017 | | | 2016 | | | 2015 | | | 2014 | | | 2013 | |
Class A | | | | | | | | | | | | | | | | | | | | |
| Per share operating performance | | | | | | | | | | | | | | | | | | | | |
(for a share outstanding throughout the year) | | | | | | | | | | | | | | | | | | | | |
| | | | | |
Net asset value, beginning of year | | | $11.10 | | | | $10.65 | | | | $10.42 | | | | $10.59 | | | | $10.40 | |
| | | | |
| | | | | |
| Income from investment operationsa: | | | | | | | | | | | | | | | | | | | | |
| | | | | |
Net investment incomeb | | | 0.40 | | | | 0.41 | | | | 0.44 | | | | 0.49 | | | | 0.46 | |
| | | | | |
Net realized and unrealized gains (losses) | | | (0.22 | ) | | | 0.46 | | | | 0.24 | | | | (0.18 | ) | | | 0.17 | |
| | | | |
| | | | | |
Total from investment operations | | | 0.18 | | | | 0.87 | | | | 0.68 | | | | 0.31 | | | | 0.63 | |
| | | | |
| | | | | |
| Less distributions from net investment income | | | (0.39 | ) | | | (0.42 | ) | | | (0.45 | ) | | | (0.48 | ) | | | (0.44) | |
| | | | |
| | | | | |
Net asset value, end of year | | | $10.89 | | | | $11.10 | | | | $10.65 | | | | $10.42 | | | | $10.59 | |
| | | | |
| | | | | |
Total returnc | | | 1.71% | | | | 8.37% | | | | 6.63% | | | | 3.22% | | | | 6.10% | |
| | | | | |
| Ratios to average net assets | | | | | | | | | | | | | | | | | | | | |
| | | | | |
Expenses | | | 0.63% | | | | 0.65% | | | | 0.63% | | | | 0.63% | | | | 0.61% | |
| | | | | |
Net investment income | | | 3.66% | | | | 3.83% | | | | 4.17% | | | | 4.95% | | | | 4.31% | |
| | | | | |
| Supplemental data | | | | | | | | | | | | | | | | | | | | |
| | | | | |
Net assets, end of year (000’s) | | | $1,377,514 | | | | $1,442,703 | | | | $1,294,192 | | | | $1,203,532 | | | | $1,330,444 | |
| | | | | |
Portfolio turnover rate | | | 19.73% | | | | 12.23% | | | | 11.98% | | | | 22.26% | | | | 5.47% | |
aThe amount shown for a share outstanding throughout the period may not correlate with the Statement of Operations for the period due to the timing of sales and repurchases of the Fund’s shares in relation to income earned and/or fluctuating fair value of the investments of the Fund.
bBased on average daily shares outstanding.
cTotal return does not reflect sales commissions or contingent deferred sales charges, if applicable.
| | | | |
| 20 | | Annual Report | The accompanying notes are an integral part of these financial statements. | | franklintempleton.com |
FRANKLIN MUNICIPAL SECURITIES TRUST
FINANCIAL HIGHLIGHTS
Franklin California High Yield Municipal Fund (continued)
| | | | | | | | | | | | | | | | | | | | |
| | | Year Ended May 31, | |
| | | 2017 | | | 2016 | | | 2015 | | | 2014 | | | 2013 | |
Class C | | | | | | | | | | | | | | | | | | | | |
| Per share operating performance | | | | | | | | | | | | | | | | | | | | |
(for a share outstanding throughout the year) | | | | | | | | | | | | | | | | | | | | |
| | | | | |
Net asset value, beginning of year | | | $11.17 | | | | $10.72 | | | | $10.49 | | | | $10.65 | | | | $10.46 | |
| | | | |
| | | | | |
| Income from investment operationsa: | | | | | | | | | | | | | | | | | | | | |
| | | | | |
Net investment incomeb | | | 0.34 | | | | 0.36 | | | | 0.39 | | | | 0.44 | | | | 0.40 | |
| | | | | |
Net realized and unrealized gains (losses) | | | (0.21 | ) | | | 0.45 | | | | 0.23 | | | | (0.18 | ) | | | 0.17 | |
| | | | |
| | | | | |
Total from investment operations | | | 0.13 | | | | 0.81 | | | | 0.62 | | | | 0.26 | | | | 0.57 | |
| | | | |
| | | | | |
| Less distributions from net investment income | | | (0.33 | ) | | | (0.36 | ) | | | (0.39 | ) | | | (0.42 | ) | | | (0.38) | |
| | | | |
| | | | | |
Net asset value, end of year | | | $10.97 | | | | $11.17 | | | | $10.72 | | | | $10.49 | | | | $10.65 | |
| | | | |
| | | | | |
Total returnc | | | 1.22% | | | | 7.73% | | | | 6.01% | | | | 2.74% | | | | 5.48% | |
| | | | | |
| Ratios to average net assets | | | | | | | | | | | | | | | | | | | | |
| | | | | |
Expenses | | | 1.18% | | | | 1.20% | | | | 1.18% | | | | 1.18% | | | | 1.16% | |
| | | | | |
Net investment income | | | 3.11% | | | | 3.28% | | | | 3.62% | | | | 4.40% | | | | 3.76% | |
| | | | | |
| Supplemental data | | | | | | | | | | | | | | | | | | | | |
| | | | | |
Net assets, end of year (000’s) | | | $358,308 | | | | $377,550 | | | | $326,456 | | | | $278,775 | | | | $322,824 | |
| | | | | |
Portfolio turnover rate | | | 19.73% | | | | 12.23% | | | | 11.98% | | | | 22.26% | | | | 5.47% | |
aThe amount shown for a share outstanding throughout the period may not correlate with the Statement of Operations for the period due to the timing of sales and repurchases of the Fund’s shares in relation to income earned and/or fluctuating fair value of the investments of the Fund.
bBased on average daily shares outstanding.
cTotal return does not reflect sales commissions or contingent deferred sales charges, if applicable.
| | | | | | |
| franklintempleton.com | | The accompanying notes are an integral part of these financial statements. | Annual Report | | | 21 | |
FRANKLIN MUNICIPAL SECURITIES TRUST
FINANCIAL HIGHLIGHTS
Franklin California High Yield Municipal Fund (continued)
| | | | | | | | | | | | | | | | | | | | |
| | | Year Ended May 31, | |
| | | 2017 | | | 2016 | | | 2015 | | | 2014 | | | 2013 | |
Advisor Class | | | | | | | | | | | | | | | | | | | | |
| Per share operating performance | | | | | | | | | | | | | | | | | | | | |
(for a share outstanding throughout the year) | | | | | | | | | | | | | | | | | | | | |
| | | | | |
Net asset value, beginning of year | | | $11.12 | | | | $10.67 | | | | $10.44 | | | | $10.61 | | | | $10.41 | |
| | | | |
| | | | | |
| Income from investment operationsa: | | | | | | | | | | | | | | | | | | | | |
| | | | | |
Net investment incomeb | | | 0.41 | | | | 0.43 | | | | 0.45 | | | | 0.50 | | | | 0.47 | |
| | | | | |
Net realized and unrealized gains (losses) | | | (0.22 | ) | | | 0.45 | | | | 0.24 | | | | (0.18 | ) | | | 0.18 | |
| | | | |
| | | | | |
Total from investment operations | | | 0.19 | | | | 0.88 | | | | 0.69 | | | | 0.32 | | | | 0.65 | |
| | | | |
| | | | | |
| Less distributions from net investment income | | | (0.40 | ) | | | (0.43 | ) | | | (0.46 | ) | | | (0.49 | ) | | | (0.45) | |
| | | | |
| | | | | |
Net asset value, end of year | | | $10.91 | | | | $11.12 | | | | $10.67 | | | | $10.44 | | | | $10.61 | |
| | | | |
| | | | | |
Total return | | | 1.80% | | | | 8.46% | | | | 6.73% | | | | 3.32% | | | | 6.30% | |
| | | | | |
| Ratios to average net assets | | | | | | | | | | | | | | | | | | | | |
| | | | | |
Expenses | | | 0.53% | | | | 0.55% | | | | 0.53% | | | | 0.53% | | | | 0.51% | |
| | | | | |
Net investment income | | | 3.76% | | | | 3.93% | | | | 4.27% | | | | 5.05% | | | | 4.41% | |
| | | | | |
| Supplemental data | | | | | | | | | | | | | | | | | | | | |
| | | | | |
Net assets, end of year (000’s) | | | $720,890 | | | | $635,463 | | | | $474,392 | | | | $315,131 | | | | $303,904 | |
| | | | | |
Portfolio turnover rate | | | 19.73% | | | | 12.23% | | | | 11.98% | | | | 22.26% | | | | 5.47% | |
aThe amount shown for a share outstanding throughout the period may not correlate with the Statement of Operations for the period due to the timing of sales and repurchases of the Fund’s shares in relation to income earned and/or fluctuating fair value of the investments of the Fund.
bBased on average daily shares outstanding.
| | | | |
| 22 | | Annual Report | The accompanying notes are an integral part of these financial statements. | | franklintempleton.com |
FRANKLIN MUNICIPAL SECURITIES TRUST
Statement of Investments, May 31, 2017
Franklin California High Yield Municipal Fund
| | | | | | | | | | |
| | | | | Units | | | Value | |
| |
| | Common Stocks and Other Equity Interests (Cost $611,327) 0.0%† | |
| | Consumer Discretionary 0.0%† | | | | | | | | |
| a,b 1155 Island Avenue LLC, LP | | | 7,830,849 | | | $ | 611,323 | |
| | | | | | | | | | |
| | | |
| | | | | Principal
Amount | | | | |
| | Corporate Bonds (Cost $3,893,328) 0.1% | | | | | | | | |
| | Consumer Discretionary 0.1% | | | | | | | | |
c,d 1155 Island Avenue LLC, PIK, 10.00%, 12/11/24 | | $ | 3,893,328 | | | | 3,896,991 | |
| | | | | | | | | | |
| | Municipal Bonds 93.1% | |
| | California 88.8% | | | | | | | | |
| | ABAG Finance Authority for Nonprofit Corps. Revenue, Episcopal Senior Communities, Refunding, 6.125%, 7/01/41 | | | 7,500,000 | | | | 8,285,925 | |
| | Alameda Corridor Transportation Authority Revenue, second sub. lien, Refunding, Series B, AGMC Insured, 4.00%, 10/01/35 | | | 3,250,000 | | | | 3,415,165 | |
| | Alameda Special Tax, CFD No. 13-1, Alameda Landing Public Improvements, 5.00%, 9/01/46 | | | 1,400,000 | | | | 1,539,818 | |
| | Artesia RDA Tax Allocation, | | | | | | | | |
| | Artesia Redevelopment Project Area, 5.50%, 6/01/42 | | | 6,355,000 | | | | 6,356,716 | |
| | Artesia Redevelopment Project Area, 5.70%, 6/01/42 | | | 2,920,000 | | | | 2,921,314 | |
| | Housing Set-Aside, Artesia Redevelopment Project Area, 7.70%, 6/01/46 | | | 3,215,000 | | | | 3,463,873 | |
| | Azusa Special Tax, | | | | | | | | |
| | CFD No. 2005-1, Rosedale, Improvement Area No. 1, 5.00%, 9/01/27 | | | 1,970,000 | | | | 1,981,505 | |
| | CFD No. 2005-1, Rosedale, Improvement Area No. 1, 5.00%, 9/01/37 | | | 1,630,000 | | | | 1,638,085 | |
| | Baldwin Park USD, | | | | | | | | |
| | GO, Los Angeles County, Capital Appreciation, Election of 2006, AGMC Insured, Pre-Refunded, zero cpn., 8/01/31 | | | 5,735,000 | | | | 2,619,175 | |
| | GO, Los Angeles County, Capital Appreciation, Election of 2006, Refunding, BAM Insured, zero cpn., 8/01/42 | | | 10,000,000 | | | | 2,306,900 | |
| | Bay Area Toll Authority Toll Bridge Revenue, San Francisco Bay Area, Subordinate, Series S-4, 5.25%, 4/01/53 | | | 15,000,000 | | | | 17,099,400 | |
| | Beaumont Financing Authority Local Agency Revenue, | | | | | | | | |
| | Series C, 5.45%, 9/01/27 | | | 6,435,000 | | | | 6,436,802 | |
| | Series C, 5.50%, 9/01/29 | | | 855,000 | | | | 855,898 | |
| | Series C, 5.50%, 9/01/35 | | | 1,035,000 | | | | 1,035,859 | |
| | Series C, 5.50%, 9/01/35 | | | 3,995,000 | | | | 4,008,463 | |
| | Beaumont USD, GO, Election of 2008, Series C, AGMC Insured, 6.00%, 8/01/41 | | | 1,925,000 | | | | 2,264,166 | |
| | Buena Park Community RDA Tax Allocation, Consolidated Redevelopment Project, 6.25%, 9/01/35 | | | 5,000,000 | | | | 5,301,150 | |
| | California County Tobacco Securitization Agency Tobacco Settlement Revenue, Asset-Backed, Los Angeles County Securitization Corp., 5.70%, 6/01/46 | | | 3,000,000 | | | | 3,018,210 | |
| | California Municipal Finance Authority Revenue, | | | | | | | | |
| | American Heritage Education Foundation Project, Refunding, Series A, 5.00%, 6/01/36 | | | 1,000,000 | | | | 1,087,470 | |
| | American Heritage Education Foundation Project, Refunding, Series A, 5.00%, 6/01/46 | | | 1,750,000 | | | | 1,879,675 | |
| | California PFAR, | | | | | | | | |
| | University Housing, NCCD Claremont Properties LLC, Claremont Colleges Project, Series A, 5.00%, 7/01/27 | | | 1,125,000 | | | | 1,290,848 | |
| | University Housing, NCCD Claremont Properties LLC, Claremont Colleges Project, Series A, 5.00%, 7/01/32 | | | 825,000 | | | | 914,587 | |
| | University Housing, NCCD Claremont Properties LLC, Claremont Colleges Project, Series A, 5.00%, 7/01/37 | | | 1,325,000 | | | | 1,438,500 | |
| | University Housing, NCCD Claremont Properties LLC, Claremont Colleges Project, Series A, 5.00%, 7/01/47 | | | 1,950,000 | | | | 2,098,571 | |
| | | | | | |
| franklintempleton.com | | Annual Report | | | 23 | |
FRANKLIN MUNICIPAL SECURITIES TRUST
STATEMENT OF INVESTMENTS
Franklin California High Yield Municipal Fund (continued)
| | | | | | | | | | |
| | | | | Principal
Amount | | | Value | |
| |
| | Municipal Bonds (continued) | |
| | California (continued) | | | | | | | | |
| | California Public Finance Authority Revenue, | | | | | | | | |
| | Henry Mayo Newhall Hospital, Refunding, 5.00%, 10/15/37 | | $ | 1,100,000 | | | $ | 1,209,483 | |
| | Henry Mayo Newhall Hospital, Refunding, 5.00%, 10/15/47 | | | 5,000,000 | | | | 5,419,500 | |
| | California School Finance Authority Charter School Revenue, | | | | | | | | |
| | Aspire Public Schools-Obligated Group, Refunding, 5.00%, 8/01/36 | | | 3,200,000 | | | | 3,456,576 | |
| | Aspire Public Schools-Obligated Group, Refunding, 5.00%, 8/01/46 | | | 2,500,000 | | | | 2,636,775 | |
| | Aspire Public Schools-Obligated Group, Refunding, Series B, 5.00%, 8/01/35 | | | 1,000,000 | | | | 1,083,300 | |
| | Aspire Public Schools-Obligated Group, Refunding, Series B, 5.00%, 8/01/45 | | | 1,100,000 | | | | 1,161,732 | |
| | Rocketship Education Obligated Group, Series A, 5.00%, 6/01/34 | | | 1,000,000 | | | | 1,019,580 | |
| | Rocketship Education Obligated Group, Series A, 5.125%, 6/01/47 | | | 1,100,000 | | | | 1,113,827 | |
| | Rocketship Education Obligated Group, Series A, 5.25%, 6/01/52 | | | 1,200,000 | | | | 1,217,160 | |
| | California School Finance Authority School Facility Revenue, | | | | | | | | |
| | Alliance College, Ready Public Schools Project, Series C, 5.00%, 7/01/46 | | | 10,000,000 | | | | 10,434,700 | |
| | Green Dot Public School Project, Series A, 5.00%, 8/01/35 | | | 2,525,000 | | | | 2,722,809 | |
| | Green Dot Public School Project, Series A, 5.00%, 8/01/45 | | | 3,500,000 | | | | 3,718,820 | |
| | Kipp LA Projects, Series A, 5.00%, 7/01/35 | | | 1,200,000 | | | | 1,276,092 | |
| | Kipp LA Projects, Series A, 5.00%, 7/01/45 | | | 1,675,000 | | | | 1,792,736 | |
| | California State Educational Facilities Authority Revenue, | | | | | | | | |
| | Chapman University, 5.00%, 4/01/40 | | | 5,000,000 | | | | 5,636,650 | |
| | Loma Linda University, Refunding, Series A, 5.00%, 4/01/42 | | | 8,500,000 | | | | 9,657,615 | |
| | University of the Pacific, Refunding, 5.00%, 11/01/36 | | | 3,000,000 | | | | 3,449,970 | |
| | University of San Francisco, 6.125%, 10/01/36 | | | 2,000,000 | | | | 2,370,000 | |
| | California State GO, | | | | | | | | |
| | Various Purpose, 6.00%, 11/01/39 | | | 13,000,000 | | | | 14,550,900 | |
| | Various Purpose, FGIC Insured, 6.00%, 8/01/19 | | | 30,000 | | | | 30,237 | |
| | Various Purpose, Refunding, 5.00%, 3/01/45 | | | 5,000,000 | | | | 5,752,900 | |
| | California State Health Facilities Financing Authority Revenue, | | | | | | | | |
| | Adventist Health System/West, Refunding, Series A, 4.00%, 3/01/39 | | | 9,000,000 | | | | 9,312,930 | |
| | California-Nevada Methodist Homes, Refunding, California Mortgage Insured, 5.00%, 7/01/45 | | | 4,500,000 | | | | 5,133,960 | |
| | eChildren’s Hospital Los Angeles, Refunding, Series A, 4.00%, 8/15/49 | | | 3,375,000 | | | | 3,383,404 | |
| | El Camino Hospital, 4.00%, 2/01/42 | | | 6,500,000 | | | | 6,720,935 | |
| | El Camino Hospital, 5.00%, 2/01/42 | | | 5,000,000 | | | | 5,640,400 | |
| | Kaiser Permanente, Refunding, Series A, Subseries A-2, 4.00%, 11/01/38 | | | 10,000,000 | | | | 10,459,300 | |
| | Kaiser Permanente, Series A, Subseries A-2, 4.00%, 11/01/51 | | | 25,000,000 | | | | 25,425,750 | |
| | Lucile Salter Packard Children’s Hospital at Stanford, Series A, 5.00%, 8/15/43 | | | 7,160,000 | | | | 8,134,691 | |
| | Providence Health and Services, Series C, Pre-Refunded, 6.50%, 10/01/33 | | | 4,000,000 | | | | 4,297,000 | |
| | Sutter Health, Refunding, Series B, 5.00%, 11/15/46 | | | 26,925,000 | | | | 30,847,972 | |
| | California State Infrastructure and Economic Development Bank Revenue, Goodwill Industries of Sacramento Valley and Northern Nevada Project, Series A, 5.00%, 1/01/47 | | | 10,360,000 | | | | 10,264,792 | |
| | California State Municipal Finance Authority Charter School Lease Revenue, | | | | | | | | |
| | Santa Rosa Academy Project, 5.125%, 7/01/35 | | | 450,000 | | | | 467,919 | |
| | Santa Rosa Academy Project, 5.375%, 7/01/45 | | | 1,400,000 | | | | 1,446,676 | |
| | California State Municipal Finance Authority Charter School Revenue, | | | | | | | | |
| | King Chavez Academy of Excellence Project, Refunding, Series A, 5.00%, 5/01/36 | | | 2,675,000 | | | | 2,816,267 | |
| | King Chavez Academy of Excellence Project, Refunding, Series A, 5.00%, 5/01/46 | | | 2,775,000 | | | | 2,873,707 | |
| | Palmdale Aerospace Academy Project, 5.00%, 7/01/31 | | | 1,000,000 | | | | 1,045,210 | |
| | Palmdale Aerospace Academy Project, 5.00%, 7/01/36 | | | 2,750,000 | | | | 2,793,313 | |
| | Palmdale Aerospace Academy Project, 5.00%, 7/01/41 | | | 1,750,000 | | | | 1,758,803 | |
| | Palmdale Aerospace Academy Project, 5.00%, 7/01/46 | | | 1,670,000 | | | | 1,672,355 | |
| | | | |
| 24 | | Annual Report | | franklintempleton.com |
FRANKLIN MUNICIPAL SECURITIES TRUST
STATEMENT OF INVESTMENTS
Franklin California High Yield Municipal Fund (continued)
| | | | | | | | | | |
| | | | | Principal
Amount | | | Value | |
| |
| | Municipal Bonds (continued) | |
| | California (continued) | | | | | | | | |
| | California State Municipal Finance Authority COP, | | | | | | | | |
| | Community Hospitals of Central California Obligated Group, Pre-Refunded, 5.25%, 2/01/24 | | $ | 5,000,000 | | | $ | 5,359,150 | |
| | Community Hospitals of Central California Obligated Group, Pre-Refunded, 5.375%, 2/01/29 | | | 7,000,000 | | | | 7,517,160 | |
| | Community Hospitals of Central California Obligated Group, Pre-Refunded, 5.50%, 2/01/39 | | | 10,600,000 | | | | 11,404,858 | |
| | California State Municipal Finance Authority Mobile Home Park Revenue, | | | | | | | | |
| | Caritas Affordable Housing Inc. Projects, Senior, Series A, 5.00%, 8/15/30 | | | 1,000,000 | | | | 1,109,720 | |
| | Caritas Affordable Housing Inc. Projects, Senior, Series A, 5.25%, 8/15/39 | | | 1,200,000 | | | | 1,334,088 | |
| | Caritas Affordable Housing Inc. Projects, Senior, Series A, 5.25%, 8/15/49 | | | 3,500,000 | | | | 3,828,160 | |
| | Windsor Mobile Country Club, Refunding, Series A, 5.625%, 11/15/33 | | | 1,000,000 | | | | 1,126,230 | |
| | Windsor Mobile Country Club, Refunding, Series A, 6.00%, 11/15/48 | | | 4,000,000 | | | | 4,567,440 | |
| | California State Municipal Finance Authority Revenue, | | | | | | | | |
| | Biola University, Refunding, 5.00%, 10/01/36 | | | 1,100,000 | | | | 1,261,370 | |
| | Biola University, Refunding, 5.00%, 10/01/39 | | | 1,000,000 | | | | 1,137,320 | |
| | Biola University, Series A, Pre-Refunded, 5.625%, 10/01/23 | | | 6,000,000 | | | | 6,372,540 | |
| | Biola University, Series A, Pre-Refunded, 5.80%, 10/01/28 | | | 7,500,000 | | | | 7,982,850 | |
| | Biola University, Series A, Pre-Refunded, 5.875%, 10/01/34 | | | 6,000,000 | | | | 6,392,220 | |
| | California Baptist University, Series A, 5.00%, 11/01/36 | | | 2,500,000 | | | | 2,692,125 | |
| | California Baptist University, Series A, 5.375%, 11/01/40 | | | 5,000,000 | | | | 5,335,600 | |
| | California Baptist University, Series A, 5.50%, 11/01/45 | | | 10,000,000 | | | | 10,721,900 | |
| | Channing House Project, Refunding, Series A, 4.00%, 5/15/40 | | | 6,500,000 | | | | 6,793,085 | |
| | Community Medical Centers, Refunding, Series A, 4.00%, 2/01/42 | | | 10,000,000 | | | | 10,249,500 | |
| | Community Medical Centers, Series A, 5.00%, 2/01/40 | | | 5,000,000 | | | | 5,524,400 | |
| | The Creative Center of Los Altos Project Pinewood and Oakwood School, Refunding, Series B, 4.00%, 11/01/36 | | | 1,395,000 | | | | 1,293,360 | |
| | The Creative Center of Los Altos Project Pinewood and Oakwood School, Refunding, Series B, 4.50%, 11/01/46 | | | 1,600,000 | | | | 1,510,288 | |
| | eEisenhower Medical Center, Refunding, Series A, 5.00%, 7/01/37 | | | 2,625,000 | | | | 2,975,726 | |
| | eEisenhower Medical Center, Refunding, Series A, 4.00%, 7/01/42 | | | 4,575,000 | | | | 4,631,410 | |
| | Harbor Regional Center Project, Pre-Refunded, 8.50%, 11/01/39 | | | 5,000,000 | | | | 5,883,800 | |
| | Harbor Regional Center Project, Refunding, 5.00%, 11/01/32 | | | 3,020,000 | | | | 3,365,941 | |
| | Harbor Regional Center Project, Refunding, 5.00%, 11/01/39 | | | 6,525,000 | | | | 7,137,697 | |
| | Inland Regional Center Project, Refunding, 5.00%, 6/15/37 | | | 9,965,000 | | | | 11,301,406 | |
| | Kern Regional Center Project, Series A, 7.50%, 5/01/39 | | | 9,000,000 | | | | 9,947,520 | |
| | NorthBay Healthcare Group, 5.00%, 11/01/35 | | | 1,100,000 | | | | 1,219,658 | |
| | NorthBay Healthcare Group, 5.00%, 11/01/44 | | | 1,050,000 | | | | 1,147,640 | |
| | NorthBay Healthcare Group, Series A, 5.25%, 11/01/47 | | | 3,000,000 | | | | 3,381,660 | |
| | South Central Los Angeles Regional Center Project, 5.50%, 12/01/33 | | | 3,115,000 | | | | 3,456,653 | |
| | South Central Los Angeles Regional Center Project, 5.75%, 12/01/43 | | | 7,000,000 | | | | 7,761,460 | |
| | Southwest Community Health Center, California Mortgage Insured, Pre-Refunded, 6.125%, 2/01/40 | | | 4,000,000 | | | | 4,218,800 | |
| | University of La Verne, Refunding, Series A, 5.00%, 6/01/43 | | | 5,000,000 | | | | 5,732,050 | |
| | California State Municipal Finance Authority Student Housing Revenue, | | | | | | | | |
| | Bowles Hall Foundation, Series A, 5.00%, 6/01/35 | | | 600,000 | | | | 644,928 | |
| | Bowles Hall Foundation, Series A, 5.00%, 6/01/50 | | | 3,250,000 | | | | 3,470,350 | |
| e | | California State PCFA Solid Waste Disposal Revenue, | | | | | | | | |
| | CalPlant I Project, Green Bonds, 7.00%, 7/01/22 | | | 3,500,000 | | | | 3,548,790 | |
| | CalPlant I Project, Green Bonds, 7.50%, 7/01/32 | | | 13,000,000 | | | | 13,576,030 | |
| | CalPlant I Project, Green Bonds, 8.00%, 7/01/39 | | | 6,500,000 | | | | 7,021,495 | |
| | California State Public Works Board Lease Revenue, | | | | | | | | |
| | California State Prison Los Angeles, Various Buildings, Series C, 5.75%, 10/01/31 | | | 4,640,000 | | | | 5,419,798 | |
| | Various Capital Projects, Series A, 5.125%, 10/01/31 | | | 3,605,000 | | | | 4,101,192 | |
| | California State University Revenue, Systemwide, Refunding, Series A, 5.00%, 11/01/47 | | | 14,980,000 | | | | 17,383,990 | |
| | | | | | |
| franklintempleton.com | | Annual Report | | | 25 | |
FRANKLIN MUNICIPAL SECURITIES TRUST
STATEMENT OF INVESTMENTS
Franklin California High Yield Municipal Fund (continued)
| | | | | | | | | | |
| | | | | Principal
Amount | | | Value | |
| |
| | Municipal Bonds (continued) | |
| | California (continued) | | | | | | | | |
| | California Statewide CDA Insured Senior Living Health Facility Revenue, Los Angeles Jewish Home for the Aging, Fountainview at Gonda, Series A, California Mortgage Insured, 5.00%, 8/01/44 | | $ | 2,450,000 | | | $ | 2,796,577 | |
| | California Statewide CDA Revenue, | | | | | | | | |
| | Aldersly, Refunding, Series A, 5.00%, 5/15/32 | | | 750,000 | | | | 819,263 | |
| | Aldersly, Refunding, Series A, 5.00%, 5/15/40 | | | 1,010,000 | | | | 1,082,397 | |
| | American Baptist Homes of the West, Refunding, 6.25%, 10/01/39 | | | 5,000,000 | | | | 5,417,900 | |
| | Bentley School, Refunding, Series A, 7.00%, 7/01/40 | | | 8,675,000 | | | | 9,735,085 | |
| | California Baptist University, Refunding, 7.25%, 11/01/31 | | | 1,250,000 | | | | 1,404,463 | |
| | California Baptist University, Refunding, 7.50%, 11/01/41 | | | 2,750,000 | | | | 3,180,980 | |
| | California Baptist University, Refunding, Series A, 5.40%, 11/01/27 | | | 7,440,000 | | | | 7,663,944 | |
| | California Baptist University, Refunding, Series A, 5.50%, 11/01/38 | | | 4,500,000 | | | | 4,634,460 | |
| | California Baptist University, Series A, 5.125%, 11/01/23 | | | 715,000 | | | | 794,229 | |
| | California Baptist University, Series A, 6.125%, 11/01/33 | | | 1,565,000 | | | | 1,756,400 | |
| | California Baptist University, Series A, 6.375%, 11/01/43 | | | 4,035,000 | | | | 4,581,379 | |
| | Catholic Healthcare West, Series C, 5.625%, 7/01/35 | | | 5,000,000 | | | | 5,249,300 | |
| | Covenant Retirement Communities Inc., Series C, 5.625%, 12/01/36 | | | 8,000,000 | | | | 9,008,800 | |
| | Enloe Medical Center, Refunding, California Mortgage Insured, 5.00%, 8/15/38 | | | 6,000,000 | | | | 6,852,900 | |
| | Eskaton Properties Inc. Obligated Group, Refunding, 5.25%, 11/15/34 | | | 4,350,000 | | | | 4,708,614 | |
| | Henry Mayo Newhall Memorial Hospital, Series B, California Mortgage Insured, Pre-Refunded, 5.20%, 10/01/37 | | | 3,500,000 | | | | 3,700,200 | |
| | Huntington Memorial Hospital, Refunding, Series B, 5.00%, 7/01/44 | | | 4,450,000 | | | | 4,844,492 | |
| | Lancer Educational Student Housing Project, Pre-Refunded, 5.625%, 6/01/33 | | | 3,000,000 | | | | 3,060,000 | |
| | Lancer Educational Student Housing Project, Refunding, Series A, 5.00%, 6/01/46 | | | 10,735,000 | | | | 10,984,696 | |
| | Loma Linda University Medical Center, Refunding, Series A, 5.25%, 12/01/44 | | | 8,550,000 | | | | 9,345,577 | |
| | Loma Linda University Medical Center, Series A, 5.00%, 12/01/41 | | | 5,500,000 | | | | 5,981,085 | |
| | Loma Linda University Medical Center, Series A, 5.00%, 12/01/46 | | | 5,000,000 | | | | 5,413,650 | |
| | Loma Linda University Medical Center, Series A, 5.25%, 12/01/56 | | | 6,500,000 | | | | 7,128,940 | |
| | Methodist Hospital of Southern California Project, FHA Insured, Pre-Refunded, 6.75%, 2/01/38 | | | 8,980,000 | | | | 10,094,687 | |
| | Monterey Institute International, 5.50%, 7/01/31 | | | 8,145,000 | | | | 8,489,859 | |
| | Statewide Community Infrastructure Program, Emerson Ranch Project, 5.00%, 9/02/35 | | | 2,000,000 | | | | 2,198,040 | |
| | Statewide Community Infrastructure Program, Emerson Ranch Project, 5.00%, 9/02/45 | | | 3,810,000 | | | | 4,133,507 | |
| | Statewide Community Infrastructure Program, Refunding, Series R1, 5.00%, 9/02/40 | | | 2,395,000 | | | | 2,488,237 | |
| | Statewide Community Infrastructure Program, Series A, 4.00%, 9/02/27 | | | 2,455,000 | | | | 2,485,319 | |
| | Statewide Community Infrastructure Program, Series A, 5.00%, 9/02/36 | | | 1,035,000 | | | | 1,092,939 | |
| | Statewide Community Infrastructure Program, Series A, 5.00%, 9/02/37 | | | 2,000,000 | | | | 2,121,680 | |
| | Statewide Community Infrastructure Program, Series A, 5.00%, 9/02/45 | | | 2,255,000 | | | | 2,354,942 | |
| | Statewide Community Infrastructure Program, Series A, 5.00%, 9/02/46 | | | 2,500,000 | | | | 2,630,875 | |
| | California Statewide CDA Special Tax Revenue, | | | | | | | | |
| | CFD No. 2015-01, Improvement Area No. 1, University District, Refunding, Series A, 5.00%, 9/01/36 | | | 1,000,000 | | | | 1,061,250 | |
| | CFD No. 2015-01, Improvement Area No. 1, University District, Refunding, Series A, 5.00%, 9/01/45 | | | 1,500,000 | | | | 1,576,455 | |
| | CFD No. 2016-02, Delta Coves, Series A, 5.00%, 9/01/46 | | | 11,155,000 | | | | 11,179,541 | |
| | California Statewide CDA Student Housing Revenue, | | | | | | | | |
| | CHF-Irvine LLC, UCI East Campus Apartments, Phase II, Pre-Refunded, 5.75%, 5/15/32 | | | 10,000,000 | | | | 10,468,600 | |
| | University of California Irvine, East Campus Apartments, CHF-Irvine LLC, Refunding, 5.00%, 5/15/35 | | | 1,205,000 | | | | 1,349,624 | |
| | University of California Irvine, East Campus Apartments, CHF-Irvine LLC, Refunding, 5.00%, 5/15/40 | | | 1,500,000 | | | | 1,666,620 | |
| | Capistrano USD, CFD No. 2005-1 Special Tax, 5.50%, 9/01/43 | | | 4,955,000 | | | | 5,456,248 | |
| | Carson RDA, Tax Allocation Housing, Series A, 5.25%, 10/01/36 | | | 1,965,000 | | | | 2,117,602 | |
| | | | |
| 26 | | Annual Report | | franklintempleton.com |
FRANKLIN MUNICIPAL SECURITIES TRUST
STATEMENT OF INVESTMENTS
Franklin California High Yield Municipal Fund (continued)
| | | | | | | | | | |
| | | | | Principal
Amount | | | Value | |
| |
| | Municipal Bonds (continued) | |
| | California (continued) | | | | | | | | |
| | Casitas Municipal Water District Special Tax, | | | | | | | | |
| | CFD No. 2013-1, Ojai, Series B, BAM Insured, 5.00%, 9/01/42 | | $ | 8,000,000 | | | $ | 9,293,920 | |
| | CFD No. 2013-1, Ojai, Series B, BAM Insured, 5.25%, 9/01/47 | | | 5,000,000 | | | | 5,927,050 | |
| | Centinela Valley UHSD, | | | | | | | | |
| | GO, County of Los Angeles, Capital Appreciation, Election of 2010, Refunding, Series B, AGMC | | | | | | | | |
| | Insured, zero cpn., 8/01/45 | | | 42,000,000 | | | | 9,734,760 | |
| | GO, County of Los Angeles, Election of 2008, Series C, 5.00%, 8/01/35 | | | 4,195,000 | | | | 4,833,563 | |
| | Ceres USD, | | | | | | | | |
| | GO, Capital Appreciation, Election of 2008, Series A, zero cpn., 8/01/39 | | | 6,450,000 | | | | 1,536,003 | |
| | GO, Capital Appreciation, Election of 2008, Series A, zero cpn., 8/01/40 | | | 6,730,000 | | | | 1,488,743 | |
| | Chatom USD, GO, Capital Appreciation, Election of 2006, Series C, XLCA Insured, zero cpn., 8/01/47 | | | 9,450,000 | | | | 1,690,416 | |
| | Chino CFD Special Tax, No. 2003-3, Improvement Area No. 6, 5.00%, 9/01/45 | | | 1,665,000 | | | | 1,811,254 | |
| | City of Fullerton Special Assessment, | | | | | | | | |
| | CFD No. 2, Amerige Heights, 4.00%, 9/01/24 | | | 110,000 | | | | 118,223 | |
| | CFD No. 2, Amerige Heights, 5.00%, 9/01/34 | | | 1,075,000 | | | | 1,162,118 | |
| | CFD No. 2, Amerige Heights, 5.00%, 9/01/44 | | | 2,450,000 | | | | 2,614,616 | |
| | City of Sacramento Special Tax, North Natomas Central CFD No. 2006-02, 5.00%, 9/01/46 | | | 1,815,000 | | | | 2,020,658 | |
| | Clovis USD, | | | | | | | | |
| | GO, Capital Appreciation, Election of 2004, Series A, NATL Insured, zero cpn., 8/01/27 | | | 7,500,000 | | | | 5,711,850 | |
| | GO, Capital Appreciation, Election of 2004, Series A, NATL Insured, zero cpn., 8/01/28 | | | 3,000,000 | | | | 2,192,670 | |
| | Coachella Valley USD, | | | | | | | | |
| | GO, Riverside and Imperial Counties, Capital Appreciation, Election of 2005, Series D, AGMC Insured, zero cpn., 8/01/42 | | | 8,500,000 | | | | 2,951,030 | |
| | GO, Riverside and Imperial Counties, Capital Appreciation, Election of 2005, Series D, AGMC Insured, zero cpn., 8/01/43 | | | 3,000,000 | | | | 991,020 | |
| | Compton Community College District GO, | | | | | | | | |
| | Election of 2002, Series B, Pre-Refunded, 6.625%, 8/01/27 | | | 3,085,000 | | | | 3,459,735 | |
| | Election of 2002, Series B, Pre-Refunded, 6.75%, 8/01/34 | | | 4,000,000 | | | | 4,496,520 | |
| | Compton CRDA Tax Allocation, | | | | | | | | |
| | Redevelopment Project, second lien, Series B, 5.70%, 8/01/30 | | | 2,255,000 | | | | 2,426,335 | |
| | Redevelopment Project, second lien, Series B, 6.00%, 8/01/42 | | | 3,460,000 | | | | 3,699,017 | |
| | Corona CFD No. 2001-2 Special Tax, Improvement Areas Nos. 1 and 2, Series A, 6.25%, 9/01/32 | | | 1,825,000 | | | | 1,831,333 | |
| | Corona CFD No. 2003-2 Special Tax, Highlands Collection, 5.20%, 9/01/34 | | | 755,000 | | | | 754,970 | |
| | Corona-Norco USD, Special Tax, Refunding, CFD No. 5-1, 5.00%, 9/01/36 | | | 1,000,000 | | | | 1,093,520 | |
| | c Cotati South Sonoma Business Park AD Special Assessment, Limited Obligation Improvement, 6.50%, 9/02/33 | | | 4,545,000 | | | | 4,448,191 | |
| | Cotati-Rohnert Park USD, GO, Election of 2014, Series C, BAM Insured, 5.00%, 8/01/45 | | | 4,000,000 | | | | 4,531,480 | |
| | CSD San Bernardino County GO, | | | | | | | | |
| | Election of 2008, Series C, 5.00%, 8/01/44 | | | 3,615,000 | | | | 4,142,935 | |
| | Election of 2014, Series A, 5.00%, 8/01/44 | | | 7,375,000 | | | | 8,452,045 | |
| | Refunding, 5.00%, 8/01/47 | | | 5,500,000 | | | | 6,360,420 | |
| | Cudahy Community Development Commission Tax Allocation, City-Wide Redevelopment Project, | | | | | | | | |
| | Redevelopment Projects, Series B, 7.75%, 10/01/27 | | | 3,795,000 | | | | 4,513,621 | |
| | Daly City Housing Development Finance Agency Mobile Home Park Revenue, Franciscan Mobile Home Park Acquisition Project, sub. bond, Refunding, Series B, 5.85%, 12/15/47 | | | 4,780,000 | | | | 4,937,405 | |
| | Dana Point CFD Special Tax No. 2006-1, | | | | | | | | |
| | 5.00%, 9/01/38 | | | 1,000,000 | | | | 1,069,480 | |
| | 5.00%, 9/01/45 | | | 2,500,000 | | | | 2,662,250 | |
| | Del Mar Race Track Authority Revenue, Refunding, 5.00%, 10/01/35 | | | 2,000,000 | | | | 2,133,100 | |
| | Del Paso Manor Water District Revenue COP, Phase I Improvement Project, 5.50%, 7/01/41 | | | 3,050,000 | | | | 3,413,956 | |
| | | | | | |
| | | |
| franklintempleton.com | | Annual Report | | | 27 | |
FRANKLIN MUNICIPAL SECURITIES TRUST
STATEMENT OF INVESTMENTS
Franklin California High Yield Municipal Fund (continued)
| | | | | | | | | | |
| | | | | Principal
Amount | | | Value | |
| |
| | Municipal Bonds (continued) | |
| | California (continued) | | | | | | | | |
| | Duarte RDA Tax Allocation, Capital Appreciation, Merged Redevelopment Project, ETM, zero cpn., 12/01/28 | | $ | 30,795,000 | | | $ | 17,960,568 | |
| | El Rancho USD, GO, Capital Appreciation, Election of 2003, NATL Insured, zero cpn., 8/01/29 Fairfield Special Tax, | |
| 2,400,000
|
| |
| 1,604,520
|
|
| | CFD No. 3, North Cordelia General Improvements, 6.00%, 9/01/32 | | | 1,200,000 | | | | 1,260,444 | |
| | CFD No. 3, North Cordelia General Improvements, 6.00%, 9/01/37 | | | 5,810,000 | | | | 6,086,556 | |
| | Fillmore Special Tax, | | | | | | | | |
| | CFD No. 5 Improvement Area, Series A, 5.00%, 9/01/40 | | | 1,500,000 | | | | 1,567,860 | |
| | CFD No. 5 Improvement Area, Series A, 5.00%, 9/01/45 | | | 2,630,000 | | | | 2,736,042 | |
| | Foothill/Eastern Transportation Corridor Agency Toll Road Revenue, | | | | | | | | |
| | Capital Appreciation, Refunding, Series A, zero cpn., 1/15/42 | | | 75,000,000 | | | | 24,488,250 | |
| | Capital Appreciation, senior lien, Refunding, Series A, zero cpn., 1/15/33 | | | 19,000,000 | | | | 9,719,830 | |
| | junior lien, Refunding, Series C, 6.50%, 1/15/43 | | | 40,000,000 | | | | 46,284,800 | |
| | Fremont CFD No. 1 Special Tax, | | | | | | | | |
| | Pacific Commons, Refunding, 5.00%, 9/01/40 | | | 4,655,000 | | | | 4,951,803 | |
| | Pacific Commons, Refunding, 5.00%, 9/01/45 | | | 3,255,000 | | | | 3,442,228 | |
| | Golden State Tobacco Securitization Corp. Enhanced Tobacco Settlement Revenue, | | | | | | | | |
| | Asset-Backed, Capital Appreciation, Second Subordinate, Refunding, Series C, zero cpn., 6/01/47 | | | 50,000,000 | | | | 6,134,500 | |
| | Asset-Backed, Refunding, Senior, Series A-1, 5.00%, 6/01/33 | | | 24,500,000 | | | | 24,725,155 | |
| | Asset-Backed, Series A, 5.00%, 6/01/45 | | | 42,630,000 | | | | 48,646,372 | |
| | Goleta RDA Tax Allocation, Goleta Old Town Redevelopment Project, 8.00%, 6/01/44 | | | 5,000,000 | | | | 5,019,650 | |
| | Hanford Joint UHSD, | | | | | | | | |
| | GO, Capital Appreciation, Election of 2004, Series B, AGMC Insured, zero cpn., 8/01/32 | | | 3,635,000 | | | | 2,187,216 | |
| | GO, Capital Appreciation, Election of 2004, Series B, AGMC Insured, zero cpn., 8/01/33 | | | 3,705,000 | | | | 2,128,634 | |
| | GO, Capital Appreciation, Election of 2004, Series B, AGMC Insured, zero cpn., 8/01/35 | | | 4,120,000 | | | | 2,163,288 | |
| | Hartnell Community College District GO, | | | | | | | | |
| | Monterey and San Benito Counties, Capital Appreciation, Election of 2002, Series D, Pre-Refunded, | | | | | | | | |
| | zero cpn., 8/01/44 | | | 30,000,000 | | | | 4,560,300 | |
| | Monterey and San Benito Counties, Capital Appreciation, Election of 2002, Series D, zero cpn., | | | | | | | | |
| | 8/01/49 | | | 10,000,000 | | | | 2,694,600 | |
| | Imperial Community College District GO, Imperial County, Capital Appreciation, Election of 2010, Series A, AGMC Insured, 6.75%, 8/01/40 | | | 3,500,000 | | | | 4,582,130 | |
| | c Imperial County Special Tax, | | | | | | | | |
| | CFD No. 98-1, 6.45%, 9/01/17 | | | 270,000 | | | | 270,591 | |
| | CFD No. 98-1, 6.50%, 9/01/31 | | | 5,705,000 | | | | 5,717,038 | |
| | Independent Cities Finance Authority Mobile Home Park Revenue, | | | | | | | | |
| | Lamplighter Salinas MobileHome Park, Series A, 6.25%, 7/15/45 | | | 2,465,000 | | | | 2,753,676 | |
| | Lamplighter Salinas MobileHome Park, Series A, 6.25%, 7/15/50 | | | 2,000,000 | | | | 2,233,580 | |
| | Pillar Ridge, Series A, 5.25%, 5/15/44 | | | 2,015,000 | | | | 2,202,113 | |
| | Pillar Ridge, Series A, 5.25%, 5/15/49 | | | 4,800,000 | | | | 5,215,104 | |
| | San Juan Mobile Estates, Refunding, 5.00%, 8/15/45 | | | 5,000,000 | | | | 5,483,400 | |
| | San Juan Mobile Estates, Refunding, 5.00%, 8/15/50 | | | 4,900,000 | | | | 5,344,675 | |
| | Indio CFD Special Tax Revenue, No. 2004-3, Terra Lago, Improvement Area No. 1, Refunding, 5.00%, 9/01/35 | | | 1,250,000 | | | | 1,361,650 | |
| | Inland Valley Development Agency Successor Agency Tax Allocation, | | | | | | | | |
| | Refunding, Series A, 5.25%, 9/01/37 | | | 7,500,000 | | | | 8,670,825 | |
| | Refunding, Series A, 5.00%, 9/01/44 | | | 9,000,000 | | | | 10,003,410 | |
| | Irvine Special Tax Revenue, | | | | | | | | |
| | CFD No. 2013-3, Great Park, Improvement Area No. 1, 5.00%, 9/01/39 | | | 1,000,000 | | | | 1,075,920 | |
| | CFD No. 2013-3, Great Park, Improvement Area No. 1, 5.00%, 9/01/44 | | | 1,500,000 | | | | 1,609,950 | |
| | CFD No. 2013-3, Great Park, Improvement Area No. 1, 5.00%, 9/01/49 | | | 2,750,000 | | | | 2,933,672 | |
| | | | |
| 28 | | Annual Report | | franklintempleton.com |
FRANKLIN MUNICIPAL SECURITIES TRUST
STATEMENT OF INVESTMENTS
Franklin California High Yield Municipal Fund (continued)
| | | | | | | | | | |
| | | | | Principal
Amount | | | Value | |
| |
| | Municipal Bonds (continued) | |
| | California (continued) | | | | | | | | |
| | Irvine USD Special Tax, CFD No. 06-1, Portola Springs, 6.70%, 9/01/35 | | $ | 2,565,000 | | | $ | 2,851,074 | |
| | Jurupa PFA Special Tax Revenue, | | | | | | | | |
| | Refunding, Series A, 5.00%, 9/01/42 | | | 2,220,000 | | | | 2,461,136 | |
| | Refunding, Series A, 5.00%, 9/01/43 | | | 4,000,000 | | | | 4,416,960 | |
| | sub. lien, Series B, 5.00%, 9/01/40 | | | 4,000,000 | | | | 4,360,240 | |
| | Kaweah Delta Health Care District Revenue, Series B, 5.00%, 6/01/40 | | | 3,250,000 | | | | 3,620,727 | |
| | La Verne COP, Brethren Hillcrest Homes, 5.00%, 5/15/36 | | | 1,430,000 | | | | 1,496,123 | |
| | La Verne Mobile Home Revenue, Copacabana Mobilehome Park, Refunding, 5.00%, 6/15/49 | | | 1,765,000 | | | | 1,962,345 | |
| | Lake Elsinore PFA Local Agency Revenue, | | | | | | | | |
| | AD No. 93-1, Refunding, Series B, 5.125%, 9/02/30 | | | 4,980,000 | | | | 5,310,124 | |
| | Canyon Hills Improvement Area Development, Series A, 5.75%, 9/01/44 | | | 3,240,000 | | | | 3,568,892 | |
| | CFD No. 98-1, Series C, 5.25%, 9/01/33 | | | 8,000,000 | | | | 8,643,040 | |
| | Lake Tahoe USD, GO, Election of 2008, zero cpn. to 7/31/25, 5.30% thereafter, 8/01/40 | | | 1,140,000 | | | | 916,788 | |
| | Lancaster RDA Successor Agency Tax Allocation, Combined Redevelopment Project Areas, Housing Programs, Refunding, AGMC Insured, 4.00%, 8/01/39 | | | 3,500,000 | | | | 3,599,960 | |
| | Lancaster RDA Tax Allocation, | | | | | | | | |
| | Combined Redevelopment Project Areas, Pre-Refunded, 6.875%, 8/01/34 | | | 2,000,000 | | | | 2,251,280 | |
| | Combined Redevelopment Project Areas, Pre-Refunded, 6.875%, 8/01/39 | | | 2,000,000 | | | | 2,251,280 | |
| | Las Virgenes USD, GO, Election of 2006, Series C, zero cpn. to 8/01/26, 6.75% thereafter, 8/01/33 | | | 8,050,000 | | | | 7,250,957 | |
| | Lathrop Financing Authority Revenue, | | | | | | | | |
| | Mossdale Village, Refunding, Series A, 6.00%, 9/02/28 | | | 1,010,000 | | | | 1,127,615 | |
| | Mossdale Village, Refunding, Series A, 6.00%, 9/02/29 | | | 1,070,000 | | | | 1,189,594 | |
| | Mossdale Village, Refunding, Series A, 6.00%, 9/02/30 | | | 1,075,000 | | | | 1,190,143 | |
| | Mossdale Village, Refunding, Series A, 5.50%, 9/02/35 | | | 3,670,000 | | | | 3,890,053 | |
| | Lee Lake PFAR, | | | | | | | | |
| | Special Tax, junior lien, Refunding, Series B, 5.25%, 9/01/32 | | | 1,170,000 | | | | 1,288,275 | |
| | Special Tax, junior lien, Refunding, Series B, 5.375%, 9/01/35 | | | 805,000 | | | | 883,455 | |
| | Lemon Grove CDA Successor Agency Tax Allocation, Lemon Grove Redevelopment Project Area,
Refunding, AGMC Insured, 4.00%, 8/01/34 | | | 1,000,000 | | | | 1,068,560 | |
| | Lemon Grove School District GO, Capital Appreciation, Election of 2008, Series B, AGMC Insured, zero cpn. to 8/01/28, 6.10% thereafter, 8/01/45 | | | 6,500,000 | | | | 5,063,110 | |
| | Long Beach Bond Finance Authority Natural Gas Purchase Revenue, Series A, 5.00%, 11/15/29 | | | 4,630,000 | | | | 5,433,073 | |
| | Long Beach Marina Revenue, | | | | | | | | |
| | Los Angeles County, Alamitos Bay Marina Project, 5.00%, 5/15/34 | | | 1,300,000 | | | | 1,439,906 | |
| | Los Angeles County, Alamitos Bay Marina Project, 5.00%, 5/15/40 | | | 3,500,000 | | | | 3,833,340 | |
| | Los Angeles County, Alamitos Bay Marina Project, 5.00%, 5/15/45 | | | 2,500,000 | | | | 2,729,075 | |
| | Los Alamitos USD, | | | | | | | | |
| | COP, Capital Appreciation, Capital Projects, zero cpn. to 7/31/24, 5.95% thereafter, 8/01/34 | | | 1,500,000 | | | | 1,359,840 | |
| | COP, Capital Appreciation, Capital Projects, zero cpn. to 7/31/24, 5.95% thereafter, 8/01/42 | | | 4,500,000 | | | | 3,994,605 | |
| | Los Angeles County Schools Regionalized Business Services Corp. COP, Pooled Financing Program, Series C, Pre-Refunded, 5.00%, 6/01/30 | | | 2,200,000 | | | | 2,458,500 | |
| | Los Angeles Department of Airports Revenue, Los Angeles International Airport, Subordinate, Refunding, Series C, 5.00%, 5/15/34 | | | 2,135,000 | | | | 2,497,267 | |
| | Mendocino-Lake Community College District GO, | | | | | | | | |
| | Capital Appreciation, Election of 2006, Series B, AGMC Insured, zero cpn. to 8/01/21, 6.55% thereafter, 8/01/36 | | | 5,150,000 | | | | 5,730,817 | |
| | Capital Appreciation, Election of 2006, Series B, AGMC Insured, zero cpn. to 8/01/26, 6.85% | | | | | | | | |
| | thereafter, 8/01/40 | | | 7,500,000 | | | | 7,037,175 | |
| | Merced RDA Tax Allocation, Merced Gateways Redevelopment Project, Series A, Pre-Refunded, 6.50%, 9/01/39 | | | 6,250,000 | | | | 7,012,062 | |
| | Merced UHSD, GO, Capital Appreciation, Election of 2008, Series C, Pre-Refunded, zero cpn., 8/01/41 | | | 10,000,000 | | | | 2,342,700 | |
| | | | | | |
| franklintempleton.com | | Annual Report | | | 29 | |
FRANKLIN MUNICIPAL SECURITIES TRUST
STATEMENT OF INVESTMENTS
Franklin California High Yield Municipal Fund (continued)
| | | | | | | | | | |
| | | | | Principal
Amount | | | Value | |
| | Municipal Bonds (continued) | | | | | | | | |
| | California (continued) | | | | | | | | |
| | Monrovia Financing Authority Water and Sewer Revenue, AGMC Insured, 5.00%, 12/01/45 | | $ | 2,500,000 | | | $ | 2,866,200 | |
| | Moreland School District GO, Election of 2010, Series B, 5.00%, 8/01/41 | | | 4,045,000 | | | | 4,642,042 | |
| | M-S-R Energy Authority Gas Revenue, Series B, 6.50%, 11/01/39 | | | 32,300,000 | | | | 46,178,987 | |
| | North Natomas CFD Special Tax, No. 4, Refunding, Series E, 5.25%, 9/01/33 | | | 3,000,000 | | | | 3,312,150 | |
| | Oak Park USD, GO, Capital Appreciation, Series A, zero cpn. to 8/01/21, 7.10% thereafter, 8/01/38 | | | 6,600,000 | | | | 7,419,522 | |
| | Oakdale PFAR, Refunding, 5.00%, 9/01/35 | | | 1,270,000 | | | | 1,393,825 | |
| | Oakland USD Alameda County GO, Election of 2012, Pre-Refunded, 6.625%, 8/01/38 | | | 5,000,000 | | | | 6,109,900 | |
| | Oakley PFAR, | | | | | | | | |
| | Contra Costa County, Refunding, 5.30%, 9/02/34 | | | 995,000 | | | | 1,090,271 | |
| | Contra Costa County, Refunding, BAM Insured, 5.00%, 9/02/36 | | | 1,500,000 | | | | 1,732,965 | |
| | Ontario CFD No. 28 Special Tax, | | | | | | | | |
| | New Haven Facilities, Area A, 5.00%, 9/01/42 | | | 1,000,000 | | | | 1,060,820 | |
| | New Haven Facilities, Area A, 5.00%, 9/01/47 | | | 500,000 | | | | 527,860 | |
| | Orange County 1915 Act Special Assessment, Limited Obligation, AD No. 01-1-GP1, 5.10%, 9/02/33 | | | 1,745,000 | | | | 1,746,797 | |
| | Orange County CFD, | | | | | | | | |
| | No. 2015-1, Esencia Village, Series A, 5.00%, 8/15/34 | | | 1,530,000 | | | | 1,699,096 | |
| | No. 2015-1, Esencia Village, Series A, 5.25%, 8/15/45 | | | 5,000,000 | | | | 5,569,450 | |
| | Orchard School District GO, Election of 2001, Series B, AGMC Insured, 6.00%, 8/01/36 | | | 3,000,000 | | | | 3,441,510 | |
| | Oro Grande Elementary School District COP, | | | | | | | | |
| | 5.875%, 9/15/37 | | | 14,000,000 | | | | 15,660,400 | |
| | 6.125%, 9/15/40 | | | 1,500,000 | | | | 1,688,685 | |
| | Palomar Health Revenue, | | | | | | | | |
| | Refunding, 5.00%, 11/01/36 | | | 6,250,000 | | | | 6,859,000 | |
| | Refunding, 5.00%, 11/01/39 | | | 5,000,000 | | | | 5,441,700 | |
| | Palomar Pomerado Health Care District COP, | | | | | | | | |
| | 6.00%, 11/01/30 | | | 10,000,000 | | | | 11,022,000 | |
| | Pre-Refunded, 6.75%, 11/01/39 | | | 15,550,000 | | | | 17,693,723 | |
| | Paramount USD, GO, Los Angeles County, Capital Appreciation, Election of 2006, BAM Insured, zero cpn., 8/01/51 | | | 25,000,000 | | | | 2,839,250 | |
| | Paso Robles Joint USD, GO, Capital Appreciation, Election of 2006, Series A, zero cpn., 9/01/45 | | | 15,000,000 | | | | 4,417,800 | |
| | Perris CFD No. 2001-1 Special Tax, | | | | | | | | |
| | Improvement Area No. 4, May Farms, Series A, 5.10%, 9/01/30 | | | 815,000 | | | | 816,312 | |
| | Improvement Area No. 4, May Farms, Series A, 5.15%, 9/01/35 | | | 1,010,000 | | | | 1,011,020 | |
| | Perris CFD No. 2001-2 Special Tax, Villages of Avalon, Refunding, Series A, 5.25%, 9/01/32 | | | 4,500,000 | | | | 4,877,325 | |
| | Perris Joint Powers Authority Local Agency Revenue, | | | | | | | | |
| | CFD No. 2001-1, Improvement Area Nos. 6 and 7, Refunding, Series E, 4.25%, 9/01/38 | | | 4,195,000 | | | | 4,281,291 | |
| | May Farms Improvement Area Nos. 1, 2 and 3, Refunding, Series A, 5.375%, 9/01/33 | | | 1,980,000 | | | | 2,147,072 | |
| | Willowbrook, Refunding, Series B, 5.25%, 9/01/33 | | | 3,830,000 | | | | 4,137,855 | |
| | Perris PFAR Tax Allocation, Housing Loan, Series A, 6.125%, 10/01/40 | | | 3,135,000 | | | | 3,595,406 | |
| | Pico Rivera Water Authority Revenue, Refunding, Series A, 6.25%, 12/01/32 | | | 6,025,000 | | | | 6,106,157 | |
| | Pittsburg USD, | | | | | | | | |
| | GO, Capital Appreciation, Election of 2010, Series C, zero cpn., 8/01/47 | | | 9,000,000 | | | | 1,794,690 | |
| | GO, Capital Appreciation, Election of 2010, Series C, zero cpn., 8/01/52 | | | 15,000,000 | | | | 2,149,050 | |
| | Pomona Revenue, Water Facilities Project, Refunding, Series BE, 5.00%, 5/01/47 | | | 7,500,000 | | | | 8,791,050 | |
| | Porterville PFA Sewer Revenue, Series A, 5.625%, 10/01/36 | | | 5,000,000 | | | | 5,846,200 | |
| | Poway RDA Successor Agency Tax Allocation, Paguay Redevelopment Project, Refunding, Series A, 5.00%, 12/15/30 | | | 3,500,000 | | | | 4,318,265 | |
| | Poway USD Special Tax, CFD No. 15, Del Sur East, Improvement Area C, 5.00%, 9/01/46 | | | 2,000,000 | | | | 2,208,380 | |
| | Rancho Cordova CFD No. 2005-1 Special Tax, | | | | | | | | |
| | Sunridge North Douglas, 5.00%, 9/01/40 | | | 1,200,000 | | | | 1,286,928 | |
| | Sunridge North Douglas, 5.00%, 9/01/45 | | | 1,250,000 | | | | 1,334,213 | |
| | | | |
| 30 | | Annual Report | | franklintempleton.com |
FRANKLIN MUNICIPAL SECURITIES TRUST
STATEMENT OF INVESTMENTS
Franklin California High Yield Municipal Fund (continued)
| | | | | | | | | | |
| | | | | Principal
Amount | | | Value | |
| | Municipal Bonds (continued) | | | | | | | | |
| | California (continued) | | | | | | | | |
| | Redondo Beach USD, GO, Election of 2008, Capital Appreciation, Series E, zero cpn. to 8/01/22, 6.20% thereafter, 8/01/31 | | $ | 2,750,000 | | | $ | 2,798,950 | |
| | Richland School District GO, Capital Appreciation, Election of 2008, Refunding, Series C, AGMC | | | | | | | | |
| | Insured, zero cpn., 8/01/49 | | | 22,000,000 | | | | 6,234,580 | |
| | Rio Elementary School District CFD No. 1 Special Tax, 5.50%, 9/01/39 | | | 6,915,000 | | | | 7,582,159 | |
| | Rio Hondo Community College District GO, Capital Appreciation, Election of 2004, Series C, zero cpn. to 8/01/24, 6.85% thereafter, 8/01/42. | | | 13,000,000 | | | | 12,930,840 | |
| | Riverbank USD, | | | | | | | | |
| | GO, Election of 2005, Series B, Assured Guaranty, zero cpn., 8/01/38 | | | 6,690,000 | | | | 2,878,038 | |
| | GO, Election of 2005, Series B, Assured Guaranty, zero cpn., 8/01/43 | | | 8,750,000 | | | | 2,964,762 | |
| | Riverside County Public Financing Authority Tax Allocation, Desert Communities and Interstate 215 | | | | | | | | |
| | Corridor Projects, Series A, BAM Insured, 4.00%, 10/01/40 | | | 5,000,000 | | | | 5,210,400 | |
| | Riverside County RDA Tax Allocation, | | | | | | | | |
| | Desert Communities Redevelopment Project Area, second lien, Series D, 7.00%, 12/01/31 | | | 1,425,000 | | | | 1,754,246 | |
| | Desert Communities Redevelopment Project Area, second lien, Series D, 7.25%, 12/01/37 | | | 2,505,000 | | | | 3,107,077 | |
| | Housing, Series A, 7.125%, 10/01/42 | | | 1,750,000 | | | | 2,137,415 | |
| | Housing, Series A, Pre-Refunded, 6.00%, 10/01/39 | | | 3,000,000 | | | | 3,485,670 | |
| | Jurupa Valley Redevelopment Project Area, Series B, 6.75%, 10/01/30 | | | 1,200,000 | | | | 1,454,820 | |
| | Riverside County Redevelopment Successor Agency Tax Allocation, Housing, Refunding, Series A, 4.00%, 10/01/37 | | | 6,000,000 | | | | 6,267,000 | |
| | Riverside County Special Tax, CFD No. 03-1, Newport Road, Refunding, 5.00%, 9/01/30 | | | 1,500,000 | | | | 1,629,705 | |
| | Riverside County Transportation Commission Toll Revenue, | | | | | | | | |
| | Capital Appreciation, senior lien, Series B, zero cpn., 6/01/43 | | | 7,500,000 | | | | 2,225,400 | |
| | senior lien, Series A, 5.75%, 6/01/44 | | | 5,000,000 | | | | 5,626,050 | |
| | Riverside PFA Local Measure Sales Tax Revenue, Payment Rehabilitation Project, AGMC Insured, 5.00%, 6/01/33 | | | 4,280,000 | | | | 4,902,440 | |
| | RNR School Financing Authority Special Tax, CFD No. 92-1, Series A, BAM Insured, 5.00%, 9/01/41 | | | 3,000,000 | | | | 3,385,290 | |
| | Road 17 Levee Area PFA Assessment Revenue, Road 17 Levee Improvement Project, Pre-Refunded, 6.75%, 9/01/29 | | | 2,630,000 | | | | 2,965,193 | |
| | The Romoland School District Special Tax, | | | | | | | | |
| | CFD No. 2004-1, Heritage Lake, Improvement Area No. 3, Refunding, 5.00%, 9/01/36 | | | 1,500,000 | | | | 1,594,350 | |
| | CFD No. 2004-1, Heritage Lake, Improvement Area Nos. 1 and 2, Refunding, 5.00%, 9/01/35 | | | 4,690,000 | | | | 5,072,610 | |
| | CFD No. 2004-1, Heritage Lake, Improvement Area Nos. 1 and 2, Refunding, 5.00%, 9/01/38 | | | 3,000,000 | | | | 3,221,700 | |
| | Roseville Special Tax, | | | | | | | | |
| | CFD No. 1, Fiddyment Ranch, 5.00%, 9/01/19 | | | 980,000 | | | | 985,596 | |
| | CFD No. 1, Fiddyment Ranch, 5.125%, 9/01/21 | | | 980,000 | | | | 983,920 | |
| | CFD No. 1, Fiddyment Ranch, 5.125%, 9/01/26 | | | 4,945,000 | | | | 4,959,192 | |
| | CFD No. 1, Fiddyment Ranch, 5.25%, 9/01/36 | | | 7,880,000 | | | | 7,898,045 | |
| | CFD No. 1, HP Campus Oaks, Public Facilities, 5.00%, 9/01/36 | | | 1,550,000 | | | | 1,580,923 | |
| | CFD No. 1, HP Campus Oaks, Public Facilities, 5.50%, 9/01/46 | | | 4,050,000 | | | | 4,263,192 | |
| | CFD No. 1, Public Facilities, 5.00%, 9/01/29 | | | 500,000 | | | | 560,810 | |
| | CFD No. 1, Public Facilities, 5.00%, 9/01/34 | | | 1,100,000 | | | | 1,204,280 | |
| | CFD No. 1, Public Facilities, 5.00%, 9/01/39 | | | 1,885,000 | | | | 2,034,292 | |
| | CFD No. 1, Public Facilities, 5.00%, 9/01/44 | | | 1,650,000 | | | | 1,770,945 | |
| | CFD No. 1, Stone Point, 6.375%, 9/01/24 | | | 1,440,000 | | | | 1,449,230 | |
| | CFD No. 1, Stone Point, 6.375%, 9/01/28 | | | 2,060,000 | | | | 2,069,909 | |
| | CFD No. 1, Westpark, Public Facilities, Refunding, 5.00%, 9/01/32 | | | 1,120,000 | | | | 1,250,323 | |
| | CFD No. 1, Westpark, Public Facilities, Refunding, 5.00%, 9/01/33 | | | 1,000,000 | | | | 1,111,040 | |
| | CFD No. 1, Westpark, Public Facilities, Refunding, 5.00%, 9/01/37 | | | 1,250,000 | | | | 1,370,938 | |
| | e CFD No. 5, Fiddyment Ranch, Public Facilities, Refunding, 5.00%, 9/01/32 | | | 1,265,000 | | | | 1,377,889 | |
| | e CFD No. 5, Fiddyment Ranch, Public Facilities, Refunding, 5.00%, 9/01/47 | | | 6,500,000 | | | | 6,883,500 | |
| | | | | | |
| franklintempleton.com | | Annual Report | | | 31 | |
FRANKLIN MUNICIPAL SECURITIES TRUST
STATEMENT OF INVESTMENTS
Franklin California High Yield Municipal Fund (continued)
| | | | | | | | | | |
| �� | | | | Principal
Amount | | | Value | |
| | Municipal Bonds (continued) | | | | | | | | |
| | California (continued) | | | | | | | | |
| | Rowland USD, | | | | | | | | |
| | GO, Capital Appreciation, Election of 2006, Series B, zero cpn., 8/01/34 | | $ | 5,000,000 | | | $ | 2,640,100 | |
| | GO, Capital Appreciation, Election of 2006, Series B, zero cpn., 8/01/39 | | | 15,000,000 | | | | 6,334,500 | |
| | GO, Capital Appreciation, Election of 2006, Series B, zero cpn., 8/01/42 | | | 10,750,000 | | | | 4,048,450 | |
| | Sacramento Area Flood Control Agency Special Assessment, Natomas Basin Local Assessment, | | | | | | | | |
| | Refunding, BAM Insured, 5.00%, 10/01/44 | | | 2,000,000 | | | | 2,258,320 | |
| | Sacramento County Airport System Revenue, Senior, Series B, AGMC Insured, 5.25%, 7/01/39 | | | 7,000,000 | | | | 7,253,680 | |
| | San Bernardino Community College District GO, | | | | | | | | |
| | Capital Appreciation, Election of 2008, Series A, zero cpn., 8/01/44 | | | 12,495,000 | | | | 4,006,647 | |
| | Election of 2008, Series D, 5.00%, 8/01/45 | | | 2,755,000 | | | | 3,172,410 | |
| | Election of 2008, Series D, 5.00%, 8/01/48 | | | 3,760,000 | | | | 4,317,909 | |
| | San Bernardino County Special Tax, | | | | | | | | |
| | CFD No. 2006-1, Improvement Area No. 1, Lytle Creek North, 5.00%, 9/01/40 | | | 1,000,000 | | | | 1,048,070 | |
| | CFD No. 2006-1, Improvement Area No. 2, Lytle Creek North, 5.50%, 9/01/44 | | | 1,965,000 | | | | 2,025,424 | |
| | CFD No. 2006-1, Improvement Area No. 2, Lytle Creek North, Refunding, 5.00%, 9/01/45 | | | 1,000,000 | | | | 1,043,830 | |
| | San Buenaventura Revenue, | | | | | | | | |
| | Community Memorial Health System, 8.00%, 12/01/31 | | | 10,000,000 | | | | 11,983,000 | |
| | Community Memorial Health System, 7.50%, 12/01/41 | | | 5,000,000 | | | | 5,801,600 | |
| | San Clemente Special Tax, | | | | | | | | |
| | CFD No. 2006-1, 5.00%, 9/01/40 | | | 1,790,000 | | | | 1,952,532 | |
| | CFD No. 2006-1, 5.00%, 9/01/46 | | | 2,490,000 | | | | 2,705,036 | |
| | San Diego RDA Tax Allocation Revenue, | | | | | | | | |
| | City Heights Redevelopment Project, Series A, Pre-Refunded, 5.625%, 9/01/40 | | | 2,315,000 | | | | 2,652,944 | |
| | Naval Training Center Redevelopment Project, Series A, Pre-Refunded, 5.75%, 9/01/40 | | | 3,000,000 | | | | 3,449,880 | |
| | San Diego USD, | | | | | | | | |
| | GO, Capital Appreciation, Election of 2008, Series A, Pre-Refunded, zero cpn. to 7/01/19, 6.00% thereafter, 7/01/33 | | | 10,000,000 | | | | 11,660,000 | |
| | GO, Capital Appreciation, Election of 2008, Series C, zero cpn. to 7/01/30, 6.625% thereafter, 7/01/47 | | | 26,025,000 | | | | 19,701,185 | |
| | GO, Dedicated Unlimited Ad Valorem Property Tax, Capital Appreciation, Election of 2008, Series E, zero cpn. to 7/01/32, 5.25% thereafter, 7/01/42 | | | 6,940,000 | | | | 4,166,290 | |
| | GO, Dedicated Unlimited Ad Valorem Property Tax, Capital Appreciation, Election of 2008, Series E, zero cpn. to 7/01/32, 5.375% thereafter, 7/01/47 | | | 13,500,000 | | | | 8,248,500 | |
| | San Francisco City and County RDA Successor Agency CFD No. 6 Special Tax, Mission Bay South Public Improvements, Capital Appreciation, Refunding, Series C, zero cpn., 8/01/43 | | | 10,000,000 | | | | 2,414,100 | |
| | San Francisco City and County RDA Successor Agency Tax Allocation, | | | | | | | | |
| | Mission Bay South Redevelopment Project, Series A, 5.00%, 8/01/43 | | | 2,500,000 | | | | 2,792,425 | |
| | Mission Bay South Redevelopment Project, Subordinate, Series D, zero cpn., 8/01/23 | | | 2,000,000 | | | | 1,459,880 | |
| | Mission Bay South Redevelopment Project, Subordinate, Series D, zero cpn., 8/01/26 | | | 3,000,000 | | | | 1,815,780 | |
| | Mission Bay South Redevelopment Project, Subordinate, Series D, zero cpn., 8/01/31 | | | 6,000,000 | | | | 2,753,040 | |
| | Mission Bay South Redevelopment Project, Subordinate, Series D, zero cpn., 8/01/43 | | | 16,500,000 | | | | 3,832,455 | |
| | San Francisco City and County Redevelopment Financing Authority Tax Allocation Revenue, | | | | | | | | |
| | Mission Bay North Redevelopment Project, Series C, Pre-Refunded, 6.75%, 8/01/41 | | | 1,000,000 | | | | 1,205,080 | |
| | Mission Bay South Redevelopment Project, Series D, Pre-Refunded, 7.00%, 8/01/33 | | | 1,000,000 | | | | 1,214,020 | |
| | Mission Bay South Redevelopment Project, Series D, Pre-Refunded, 6.625%, 8/01/39 | | | 2,265,000 | | | | 2,537,547 | |
| | Mission Bay South Redevelopment Project, Series D, Pre-Refunded, 7.00%, 8/01/41 | | | 1,500,000 | | | | 1,821,030 | |
| | San Francisco Redevelopment Projects, Series B, 6.625%, 8/01/41 | | | 2,500,000 | | | | 2,933,550 | |
| | San Gorgonio Memorial Healthcare District GO, Riverside County, Refunding, 5.00%, 8/01/39 | | | 15,000,000 | | | | 16,877,250 | |
| | San Joaquin County Public Facilities FICO Revenue COP, Wastewater Conveyance Project, 6.00%, 8/01/37 | | | 1,000,000 | | | | 1,000,470 | |
| | | | |
| 32 | | Annual Report | | franklintempleton.com |
FRANKLIN MUNICIPAL SECURITIES TRUST
STATEMENT OF INVESTMENTS
Franklin California High Yield Municipal Fund (continued)
| | | | | | | | | | |
| | | | | Principal
Amount | | | Value | |
| | Municipal Bonds (continued) | |
| | California (continued) | | | | | | | | |
| | San Joaquin Delta Community College District GO, Capital Appreciation, Election of 2004, Series B, AGMC Insured, zero cpn., 8/01/30 | | $ | 3,900,000 | | | $ | 1,927,614 | |
| | San Joaquin Hills Transportation Corridor Agency Toll Road Revenue, | | | | | | | | |
| | Capital Appreciation, junior lien, ETM, zero cpn., 1/01/28 | | | 19,150,000 | | | | 15,355,044 | |
| | Capital Appreciation, Refunding, Series A, NATL Insured, zero cpn., 1/15/26 | | | 19,475,000 | | | | 14,106,911 | |
| | Capital Appreciation, Refunding, Series A, NATL Insured, zero cpn., 1/15/32 | | | 50,225,000 | | | | 26,782,481 | |
| | junior lien, Refunding, Series B, 5.25%, 1/15/44 | | | 35,000,000 | | | | 38,544,100 | |
| | junior lien, Refunding, Series B, 5.25%, 1/15/49 | | | 75,000,000 | | | | 82,334,250 | |
| | San Jose Airport Revenue, | | | | | | | | |
| | Refunding, Series A, 5.00%, 3/01/36 | | | 2,250,000 | | | | 2,606,895 | |
| | Refunding, Series A, 5.00%, 3/01/37 | | | 2,500,000 | | | | 2,887,450 | |
| | Refunding, Series A, BAM Insured, 4.00%, 3/01/42 | | | 5,000,000 | | | | 5,150,400 | |
| | Refunding, Series B, 5.00%, 3/01/42 | | | 2,550,000 | | | | 2,968,455 | |
| | San Jose RDA Tax Allocation, | | | | | | | | |
| | Merged Area Redevelopment Project, Series B, XLCA Insured, 5.00%, 8/01/28 | | | 13,245,000 | | | | 13,328,841 | |
| | Merged Area Redevelopment Project, Series B, XLCA Insured, 4.25%, 8/01/36 | | | 5,000,000 | | | | 5,025,500 | |
| | San Mateo Special Tax, | | | | | | | | |
| | CFD No. 2008-1, Bay Meadows, 5.875%, 9/01/32 | | | 1,500,000 | | | | 1,652,865 | |
| | CFD No. 2008-1, Bay Meadows, 5.375%, 9/01/38 | | | 2,500,000 | | | | 2,681,625 | |
| | CFD No. 2008-1, Bay Meadows, 6.00%, 9/01/42 | | | 5,000,000 | | | | 5,510,250 | |
| | CFD No. 2008-1, Bay Meadows, 5.50%, 9/01/44 | | | 3,300,000 | | | | 3,547,797 | |
| | Santa Barbara Elementary School District GO, Capital Appreciation, Election of 2010, Series A, zero cpn. to 8/01/23, 7.00% thereafter, 8/01/36 | | | 8,000,000 | | | | 8,528,640 | |
| | Santa Cruz County RDA Tax Allocation, Pre-Refunded, 6.625%, 9/01/29 | | | 2,650,000 | | | | 2,980,428 | |
| | Santa Margarita Water District Special Tax, | | | | | | | | |
| | CFD No. 2013-1, Village of Sendero, 5.625%, 9/01/36 | | | 3,000,000 | | | | 3,339,240 | |
| | CFD No. 2013-1, Village of Sendero, 5.625%, 9/01/43 | | | 10,000,000 | | | | 11,092,500 | |
| | Santa Paula Utility Authority Wastewater Enterprise Revenue, Series A, 5.00%, 2/01/40 | | | 7,105,000 | | | | 8,044,281 | |
| | Santee Community Development Commission Tax Allocation, | | | | | | | | |
| | Santee Community Redevelopment Project, Series A, Pre-Refunded, 7.00%, 8/01/31 | | | 1,800,000 | | | | 2,181,618 | |
| | Santee Community Redevelopment Project, Series A, Pre-Refunded, 7.00%, 8/01/41 | | | 2,820,000 | | | | 3,417,868 | |
| | Saugus Castaic School Facilities Financing Authority Special Tax, | | | | | | | | |
| | CFD No. 2006-1C, 5.875%, 9/01/33 | | | 1,370,000 | | | | 1,535,291 | |
| | CFD No. 2006-1C, 6.00%, 9/01/43 | | | 3,470,000 | | | | 3,877,794 | |
| | Saugus USD Special Tax, Senior CFD No. 2006-1, 4.25%, 9/01/44 | | | 2,500,000 | | | | 2,507,900 | |
| | Saugus/Hart School Facilities Financing Authority Special Tax, | | | | | | | | |
| | CFD No. 2006-1 Saugus USD, Refunding, 5.00%, 9/01/41 | | | 1,250,000 | | | | 1,351,888 | |
| | CFD No. 2006-1 Saugus USD, Refunding, 5.00%, 9/01/46 | | | 1,250,000 | | | | 1,343,263 | |
| | Sierra View Local Health Care District Revenue, Pre-Refunded, 5.25%, 7/01/32 | | | 3,000,000 | | | | 3,009,630 | |
| | Silicon Valley Clean Water Wastewater Revenue, 5.00%, 8/01/40 | | | 2,500,000 | | | | 2,910,350 | |
| | 5.00%, 8/01/45 | | | 1,500,000 | | | | 1,736,700 | |
| | Simi Valley 1915 Act Special Assessment, AD No. 98-1, Madera, 7.30%, 9/02/24 | | | 1,470,000 | | | | 1,477,776 | |
| | Siskiyou UHSD, GO, Capital Appreciation, Election of 2008, Series B, AGMC Insured, zero cpn.,
8/01/49 | | | 15,015,000 | | | | 4,033,179 | |
| | Sonoma CDA Tax Allocation, Redevelopment Project, 7.00%, 12/01/30 | | | 2,115,000 | | | | 2,629,601 | |
| | St. Helena USD, GO, Capital Appreciation, zero cpn. to 8/01/25, 6.45% thereafter, 6/01/36 | | | 10,000,000 | | | | 10,248,700 | |
| | Susanville PFAR, | | | | | | | | |
| | Utility Enterprises Project, Refunding, Sub Series B, 5.50%, 6/01/30 | | | 1,185,000 | | | | 1,244,428 | |
| | Utility Enterprises Project, Refunding, Sub Series B, 5.875%, 6/01/35 | | | 1,660,000 | | | | 1,757,774 | |
| | Utility Enterprises Project, Refunding, Sub Series B, 6.00%, 6/01/45 | | | 6,180,000 | | | | 6,547,710 | |
| | Susanville School District GO, Capital Appreciation, Election of 2008, AGMC Insured, zero cpn., 8/01/49 | | | 17,505,000 | | | | 4,282,248 | |
| | | | | | |
| franklintempleton.com | | Annual Report | | | 33 | |
FRANKLIN MUNICIPAL SECURITIES TRUST
STATEMENT OF INVESTMENTS
Franklin California High Yield Municipal Fund (continued)
| | | | | | | | | | |
| | | | | Principal
Amount | | | Value | |
| | Municipal Bonds (continued) | |
| | California (continued) | | | | | | | | |
| | Temecula RDA Tax Allocation Revenue, | | | | | | | | |
| | Housing, Redevelopment Project No. 1, Series A, 7.00%, 8/01/39 | | $ | 2,100,000 | | | $ | 2,510,130 | |
| | sub. lien, Escrow, Redevelopment Project No. 1, 5.625%, 12/15/38 | | | 1,785,000 | | | | 1,799,780 | |
| | Tobacco Securitization Authority Northern California Tobacco Settlement Revenue, | | | | | | | | |
| | Asset-Backed, Series A-1, 5.375%, 6/01/38. | | | 5,000,000 | | | | 4,999,950 | |
| | Asset-Backed, Series A-1, 5.50%, 6/01/45 | | | 800,000 | | | | 800,008 | |
| | Capital Appreciation, Asset-Backed, Series A-2, 5.40%, 6/01/27 | | | 1,250,000 | | | | 1,250,838 | |
| | Tobacco Securitization Authority Southern California Tobacco Settlement Revenue, Second Sub. Capital | | | | | | | | |
| | Appreciation, Refunding, Series C, zero cpn., 6/01/46 | | | 25,000,000 | | | | 3,326,500 | |
| | Torrance USD, GO, Capital Appreciation, Election of 2008, Measure Z, Series B-1, zero cpn., 8/01/34 | | | 5,640,000 | | | | 2,738,840 | |
| | Truckee-Donner PUD Special Tax, | | | | | | | | |
| | CFD No. 04-1, 5.20%, 9/01/25 | | | 3,000,000 | | | | 3,009,150 | |
| | CFD No. 04-1, 5.75%, 9/01/29 | | | 2,975,000 | | | | 2,986,811 | |
| | CFD No. 04-1, 5.25%, 9/01/30 | | | 5,050,000 | | | | 5,064,140 | |
| | CFD No. 04-1, 5.80%, 9/01/35 | | | 4,515,000 | | | | 4,532,383 | |
| | Tulare RDA Tax Allocation, Merged Tulare Redevelopment Projects, Series A, Pre-Refunded, 6.25%, 8/01/40 | | | 3,540,000 | | | | 4,101,444 | |
| | Tulare Sewer Revenue, Pre-Refunded, 6.50%, 11/15/45 | | | 10,000,000 | | | | 11,411,900 | |
| | Turlock PFA Tax Allocation Revenue, Pre-Refunded, 7.50%, 9/01/39 | | | 3,750,000 | | | | 4,629,787 | |
| | Tustin CFD No. 06-1 Special Tax, Legacy/Columbus Villages, Series A, 5.00%, 9/01/37 | | | 1,000,000 | | | | 1,102,740 | |
| | Tustin CFD No. 07-1 Special Tax, | | | | | | | | |
| | Tustin Legacy/Retail Center, Pre-Refunded, 6.00%, 9/01/37 | | | 2,100,000 | | | | 2,125,347 | |
| | Tustin Legacy/Retail Center, Refunding, Series A, 5.00%, 9/01/37 | | | 2,330,000 | | | | 2,546,760 | |
| | Tustin CFD No. 14-1 Special Tax, | | | | | | | | |
| | Legacy/Standard Pacific, Series A, 5.00%, 9/01/40 | | | 750,000 | | | | 816,990 | |
| | Legacy/Standard Pacific, Series A, 5.00%, 9/01/45 | | | 1,000,000 | | | | 1,085,620 | |
| | Tustin USD, | | | | | | | | |
| | CFD No. 06-1 Special Tax, Pre-Refunded, 5.75%, 9/01/30 | | | 1,000,000 | | | | 1,148,230 | |
| | CFD No. 06-1 Special Tax, Pre-Refunded, 6.00%, 9/01/40 | | | 3,000,000 | | | | 3,468,480 | |
| | Union City CRDA Successor Agency Tax Allocation Revenue, | | | | | | | | |
| | Community Redevelopment Project, Refunding, Series A, 5.00%, 10/01/35 | | | 1,365,000 | | | | 1,592,013 | |
| | Community Redevelopment Project, Refunding, Series A, 5.00%, 10/01/36 | | | 1,000,000 | | | | 1,162,280 | |
| | Union Elementary School District GO, Santa Clara County, Election of 2014, Series A, 5.00%, 9/01/49 | | | 2,375,000 | | | | 2,736,974 | |
| | University of California Revenue, Refunding, Series AO, 5.00%, 5/15/40 | | | 5,000,000 | | | | 5,801,750 | |
| | Val Verde USD Special Tax Revenue, | | | | | | | | |
| | Refunding, 5.00%, 9/01/29 | | | 3,200,000 | | | | 3,594,272 | |
| | Refunding, 5.00%, 9/01/37 | | | 2,000,000 | | | | 2,183,320 | |
| | Vallejo RDA Tax Allocation, Housing Set-Aside, Refunding, Series A, 7.00%, 10/01/31 | | | 3,435,000 | | | | 3,447,057 | |
| | Vernon Electric System Revenue, Series A, 5.50%, 8/01/41 | | | 7,500,000 | | | | 8,480,925 | |
| | Victor Elementary School District GO, Election of 2008, Refunding, Series B, 5.00%, 8/01/42 | | | 5,455,000 | | | | 6,208,117 | |
| | Victor Valley Community College District GO, Capital Appreciation, Election of 2002, Series C, zero cpn., 6/01/49 | | | 11,940,000 | | | | 3,226,188 | |
| | Washington Township Health Care District Revenue, Series A, 5.50%, 7/01/38 | | | 2,890,000 | | | | 3,138,540 | |
| | West Hollywood Community Development Commission Tax Allocation, | | | | | | | | |
| | East Side Redevelopment Project, Series A, 7.25%, 9/01/31 | | | 1,000,000 | | | | 1,223,720 | |
| | East Side Redevelopment Project, Series A, 7.50%, 9/01/42 | | | 5,000,000 | | | | 6,118,950 | |
| | e Western Placer USD, GO, Placer County, Election of 2016, Series A, BAM Insured, 4.00%, 8/01/47 | | | 5,000,000 | | | | 5,202,900 | |
| | Woodland Davis Clean Water Agency Water Revenue, Subordinate, Refunding, Series A, AGMC Insured, 5.00%, 3/01/39 | | | 1,600,000 | | | | 1,812,752 | |
| | | | |
| 34 | | Annual Report | | franklintempleton.com |
FRANKLIN MUNICIPAL SECURITIES TRUST
STATEMENT OF INVESTMENTS
Franklin California High Yield Municipal Fund (continued)
| | | | | | | | | | |
| | | | | Principal
Amount | | | Value | |
| | Municipal Bonds (continued) | |
| | California (continued) | | | | | | | | |
| | Woodland Finance Authority Water Revenue, | | | | | | | | |
| | 6.00%, 3/01/36 | | $ | 1,000,000 | | | $ | 1,164,190 | |
| | 6.00%, 3/01/41 | | | 1,500,000 | | | | 1,743,300 | |
| | Yorba Linda RDA Tax Allocation, sub. lien, Redevelopment Project, Series A, 6.50%, 9/01/32 | | | 2,750,000 | | | | 3,208,370 | |
| | Yucaipa Special Tax, | | | | | | | | |
| | CFD No. 98-1 Chapman Heights, Refunding, 5.00%, 9/01/26 | | | 1,000,000 | | | | 1,094,860 | |
| | CFD No. 98-1 Chapman Heights, Refunding, 5.375%, 9/01/30 | | | 1,800,000 | | | | 1,984,716 | |
| | Yucca Valley RDA Tax Allocation, | | | | | | | | |
| | Yucca Valley Redevelopment Project No. 1, 5.50%, 6/01/28 | | | 2,110,000 | | | | 2,157,074 | |
| | Yucca Valley Redevelopment Project No. 1, 5.75%, 6/01/38 | | | 5,485,000 | | | | 5,602,818 | |
| | | | | | | | | | |
| | | | | | | | | 2,180,527,202 | |
| | | | | | | | | | |
| | U.S. Territories 4.3% | | | | | | | | |
| | Guam 1.4% | | | | | | | | |
| | Government of Guam GO, | | | | | | | | |
| | Series A, Pre-Refunded, 5.00%, 11/15/23 | | | 6,745,000 | | | | 6,868,838 | |
| | Series A, Pre-Refunded, 5.25%, 11/15/37 | | | 6,500,000 | | | | 6,626,555 | |
| | Series A, Pre-Refunded, 7.00%, 11/15/39 | | | 5,000,000 | | | | 5,714,750 | |
| | Guam Government Waterworks Authority Water and Wastewater System Revenue, | | | | | | | | |
| | 5.625%, 7/01/40 | | | 4,000,000 | | | | 4,296,120 | |
| | 5.00%, 1/01/46 | | | 10,000,000 | | | | 10,834,800 | |
| | | | | | | | | | |
| | | | | | | | | 34,341,063 | |
| | | | | | | | | | |
| | Northern Mariana Islands 0.0%† | | | | | | | | |
| | Northern Mariana Islands Commonwealth Ports Authority Seaport Revenue, Senior Series A, 6.60%, 3/15/28 | | | 1,185,000 | | | | 1,201,614 | |
| | | | | | | | | | |
| | Puerto Rico2.9% | | | | | | | | |
f | | Puerto Rico Commonwealth GO, Public Improvement, Refunding, Series A, 5.50%, 7/01/39 | | | 10,000,000 | | | | 5,800,000 | |
| | Puerto Rico Electric Power Authority Power Revenue, | | | | | | | | |
| | Refunding, Series A, 5.00%, 7/01/29 | | | 10,000,000 | | | | 6,925,000 | |
| | Refunding, Series A, 5.00%, 7/01/42 | | | 6,000,000 | | | | 4,155,000 | |
| | Series A, 7.00%, 7/01/33 | | | 25,000,000 | | | | 17,475,000 | |
| | Series A, 6.75%, 7/01/36 | | | 11,735,000 | | | | 8,185,162 | |
| | Series A, 7.00%, 7/01/43 | | | 5,000,000 | | | | 3,495,000 | |
| | c Series A-4, zero cpn., 7/01/19 | | | 1,601,766 | | | | 1,669,553 | |
| | c Series B, zero cpn., 7/01/19 | | | 1,601,765 | | | | 1,669,552 | |
| | c Series E-1, zero cpn., 1/01/21 | | | 1,768,493 | | | | 1,843,336 | |
| | c Series E-2, zero cpn., 7/01/21 | | | 1,768,493 | | | | 1,843,335 | |
| | c Series E-3, zero cpn., 1/01/22 | | | 600,000 | | | | 625,392 | |
| | c Series E-4, zero cpn., 7/01/22 | | | 600,000 | | | | 625,392 | |
| | Puerto Rico Industrial Tourist Educational Medical and Environmental Control Facilities Financing Authority Revenue, Cogeneration Facility, AES Puerto Rico Project, 6.625%, 6/01/26 | | | 5,500,000 | | | | 5,293,750 | |
f | | Puerto Rico PBA Guaranteed Revenue, Government Facilities, Refunding, Series U, 5.25%, 7/01/42 | | | 20,000,000 | | | | 10,700,000 | |
| | | | | | | | | | |
| | | | | | | | | 70,305,472 | |
| | | | | | | | | | |
| | Total U.S. Territories | | | | | | | 105,848,149 | |
| | | | | | | | | | |
| | | |
| | Total Municipal Bonds (Cost $2,072,217,755) | | | | | | | 2,286,375,351 | |
| | | | | | | | | | |
| | | |
| | Total Investments before Short Term Investments (Cost $2,076,722,410) | | | | | | | 2,290,883,665 | |
| | | | | | | | | | |
| | | | | | |
| franklintempleton.com | | Annual Report | | | 35 | |
FRANKLIN MUNICIPAL SECURITIES TRUST
STATEMENT OF INVESTMENTS
Franklin California High Yield Municipal Fund (continued)
| | | | | | | | | | |
| | | | | Principal
Amount | | | Value | |
| | Short Term Investments 7.7% | | | | | | | | |
| | Municipal Bonds 7.7% | | | | | | | | |
| | California 7.7% | | | | | | | | |
g | | California Infrastructure and Economic Development Bank Revenue, Los Angeles County Museum of Natural History Foundation, Refunding, Series A, LOC Wells Fargo Bank, Daily VRDN and Put, 0.50%, 9/01/37 | | $ | 16,400,000 | | | $ | 16,400,000 | |
g | | California State GO, | | | | | | | | |
| | Kindergarten, Refunding, Series A1, LOC Citibank, Daily VRDN and Put, 0.55%, 5/01/34 | | | 4,900,000 | | | | 4,900,000 | |
| | Kindergarten, Refunding, Series A2, LOC State Street Bank & Trust Co., Daily VRDN and Put, 0.50%, 5/01/34 | | | 13,100,000 | | | | 13,100,000 | |
| | Kindergarten, Refunding, Series A3, LOC State Street Bank & Trust Co., Daily VRDN and Put, 0.53%, 5/01/34 | | | 900,000 | | | | 900,000 | |
| | Series A-1, LOC JPMorgan Chase Bank, Daily VRDN and Put, 0.53%, 5/01/33 | | | 8,930,000 | | | | 8,930,000 | |
| | Series A-3, LOC Bank of Montreal, Daily VRDN and Put, 0.50%, 5/01/33 | | | 1,500,000 | | | | 1,500,000 | |
g | | California State Municipal Finance Authority Revenue, Chevron USA Inc. Project, Recovery Zone Bonds, Series B, Daily VRDN and Put, 0.66%, 11/01/35 | | | 3,740,000 | | | | 3,740,000 | |
g | | Irvine 1915 Act Special Assessment, | | | | | | | | |
| | Limited Obligation Improvement, AD No. 94-13, LOC State Street Bank & Trust Co., Daily VRDN and Put, 0.76%, 9/02/22 | | | 1,000,000 | | | | 1,000,000 | |
| | Limited Obligation Improvement, AD No. 94-15, Refunding, LOC State Street Bank & Trust Co., Daily VRDN and Put, 0.76%, 9/02/20 | | | 853,000 | | | | 853,000 | |
g | | Irvine Ranch Water District GO, ID, Consolidated, Series B, LOC Bank of America, Daily VRDN and Put, 0.57%, 10/01/41 | | | 43,255,000 | | | | 43,255,000 | |
g | | Los Angeles Department of Water and Power Revenue, | | | | | | | | |
| | Power System, Refunding, Series A, Subseries A-4, SPA Bank of America, Daily VRDN and Put, 0.78%, 7/01/35 | | | 7,600,000 | | | | 7,600,000 | |
| | Power System, Refunding, Series B, Subseries B-6, SPA Bank of Montreal, Daily VRDN and Put, 0.60%, 7/01/34 | | | 27,600,000 | | | | 27,600,000 | |
| | Water System, Refunding, Series B, Subseries B-2, SPA Royal Bank of Canada, Daily VRDN and Put, 0.57%, 7/01/35 | | | 32,100,000 | | | | 32,100,000 | |
g | | The Metropolitan Water District of Southern California Water Revenue, Refunding, Series B-3, SPA Citibank, Daily VRDN and Put, 0.60%, 7/01/35 | | | 24,600,000 | | | | 24,600,000 | |
g | | University of California Regents Medical Center Pooled Revenue, Refunding, Series B-2, Daily VRDN and Put, 0.50%, 5/15/32 | | | 1,700,000 | | | | 1,700,000 | |
| | | | | | | | | | |
| | | |
| | Total Short Term Investments (Cost $188,178,000) | | | | | | | 188,178,000 | |
| | | | | | | | | | |
| | | |
| | Total Investments (Cost $2,264,900,410) 100.9% | | | | | | | 2,479,061,665 | |
| | | |
| | Other Assets, less Liabilities (0.9)% | | | | | | | (22,350,053 | ) |
| | | | | | | | | | |
| | | |
| | Net Assets 100.0% | | | | | | $ | 2,456,711,612 | |
| | | | | | | | | | |
| | | | |
| 36 | | Annual Report | | franklintempleton.com |
FRANKLIN MUNICIPAL SECURITIES TRUST
STATEMENT OF INVESTMENTS
Franklin California High Yield Municipal Fund (continued)
See Abbreviations on page 56.
†Rounds to less than 0.1% of net assets.
aNon-income producing.
bSee Note 8 regarding restricted securities.
cSecurity has been deemed illiquid because it may not be able to be sold within seven days. At May 31, 2017, the aggregate value of these securities was $22,609,371, representing 0.9% of net assets.
dIncome may be received in additional securities and/or cash.
eSecurity purchased on a when-issued basis. See Note 1(b).
fSee Note 6 regarding defaulted securities.
gVariable rate demand notes (VRDNs) are tax-exempt obligations which contain a floating or variable interest rate adjustment formula and an unconditional right of demand to receive payment of the principal balance plus accrued interest at specified dates. The coupon rate shown represents the rate at period end.
| | | | | | |
| franklintempleton.com | | The accompanying notes are an integral part of these financial statements. | Annual Report | | | 37 | |
FRANKLIN MUNICIPAL SECURITIES TRUST
Financial Highlights
Franklin Tennessee Municipal Bond Fund
| | | | | | | | | | | | | | | | | | | | |
| | | Year Ended May 31, | |
| | | 2017 | | | 2016 | | | 2015 | | | 2014 | | | 2013 | |
Class A | | | | | | | | | | | | | | | | | | | | |
| | | | | |
| Per share operating performance | | | | | | | | | | | | | | | | | | | | |
| | | | | |
(for a share outstanding throughout the year) | | | | | | | | | | | | | | | | | | | | |
| | | | | |
Net asset value, beginning of year | | | $11.44 | | | | $11.38 | | | | $11.47 | | | | $11.88 | | | | $11.94 | |
| | | | |
| | | | | |
Income from investment operationsa: | | | | | | | | | | | | | | | | | | | | |
| | | | | |
Net investment incomeb | | | 0.37 | | | | 0.40 | | | | 0.41 | | | | 0.43 | | | | 0.41 | |
| | | | | |
Net realized and unrealized gains (losses) | | | (0.32 | ) | | | 0.06 | | | | (0.08 | ) | | | (0.42 | ) | | | (0.06) | |
| | | | |
Total from investment operations | | | 0.05 | | | | 0.46 | | | | 0.33 | | | | 0.01 | | | | 0.35 | |
| | | | |
Less distributions from net investment income | | | (0.38 | ) | | | (0.40 | ) | | | (0.42 | ) | | | (0.42 | ) | | | (0.41) | |
| | | | |
Net asset value, end of year | | | $11.11 | | | | $11.44 | | | | $11.38 | | | | $11.47 | | | | $11.88 | |
| | | | |
| | | | | |
Total returnc | | | 0.40% | | | | 4.12% | | | | 2.86% | | | | 0.20% | | | | 2.93% | |
| | | | | |
| Ratios to average net assets | | | | | | | | | | | | | | | | | | | | |
| | | | | |
Expenses before waiver and payments by affiliates | | | 0.72% | | | | 0.72% | | | | 0.72% | | | | 0.72% | | | | 0.70% | |
| | | | | |
Expenses net of waiver and payments by affiliates | | | 0.72% | | | | 0.72% | | | | 0.71% | | | | 0.70% | | | | 0.70% | |
| | | | | |
Net investment income | | | 3.27% | | | | 3.55% | | | | 3.60% | | | | 3.82% | | | | 3.40% | |
| | | | | |
| Supplemental data | | | | | | | | | | | | | | | | | | | | |
| | | | | |
Net assets, end of year (000’s) | | | $267,442 | | | | $307,294 | | | | $293,580 | | | | $273,142 | | | | $344,157 | |
| | | | | |
Portfolio turnover rate | | | 18.95% | | | | 4.50% | | | | 11.64% | | | | 7.86% | | | | 7.89% | |
aThe amount shown for a share outstanding throughout the period may not correlate with the Statement of Operations for the period due to the timing of sales and repurchases of the Fund’s shares in relation to income earned and/or fluctuating fair value of the investments of the Fund.
bBased on average daily shares outstanding.
cTotal return does not reflect sales commissions or contingent deferred sales charges, if applicable.
| | | | |
| 38 | | Annual Report | The accompanying notes are an integral part of these financial statements. | | franklintempleton.com |
FRANKLIN MUNICIPAL SECURITIES TRUST
FINANCIAL HIGHLIGHTS
Franklin Tennessee Municipal Bond Fund (continued)
| | | | |
| | | Year Ended
May 31,
2017a | |
Advisor Class | | | | |
| |
| Per share operating performance | | | | |
| |
(for a share outstanding throughout the year) | | | | |
| |
Net asset value, beginning of year | | | $11.50 | |
| | | | |
| |
Income from investment operationsb: | | | | |
| |
Net investment incomec | | | 0.27 | |
| |
Net realized and unrealized gains (losses) | | | (0.38) | |
| | | | |
| |
Total from investment operations | | | (0.11) | |
| | | | |
| |
Less distributions from net investment income | | | (0.27) | |
| | | | |
| |
Net asset value, end of year | | | $11.12 | |
| | | | |
| |
Total returnd | | | (0.91)% | |
| |
| Ratios to average net assetse | | | | |
| |
Expenses | | | 0.62% | |
| |
Net investment income | | | 3.37% | |
| |
| Supplemental data | | | | |
| |
Net assets, end of year (000’s) | | | $23,916 | |
| |
Portfolio turnover rate | | | 18.95% | |
aFor the period September 15, 2016 (effective date) to May 31, 2017.
bThe amount shown for a share outstanding throughout the period may not correlate with the Statement of Operations for the period due to the timing of sales and repurchases of the Fund’s shares in relation to income earned and/or fluctuating fair value of the investments of the Fund.
cBased on average daily shares outstanding.
dTotal return is not annualized for periods less than one year.
eRatios are annualized for periods less than one year.
| | | | | | |
| franklintempleton.com | | The accompanying notes are an integral part of these financial statements. | Annual Report | | | 39 | |
FRANKLIN MUNICIPAL SECURITIES TRUST
Statement of Investments, May 31, 2017
Franklin Tennessee Municipal Bond Fund
| | | | | | | | | | |
| | | | | Principal
Amount | | | Value | |
| |
| | Municipal Bonds 99.4% | |
| | Tennessee 95.5% | | | | | | | | |
| | Anderson County Water Authority Water and Sewer Revenue, Pre-Refunded, 5.00%, 6/01/36 | | $ | 1,000,000 | | | $ | 1,115,930 | |
| | Blount County GO, Refunding, Series B, 5.00%, 6/01/37 | | | 2,305,000 | | | | 2,717,549 | |
| | Blount County PBA Revenue, | | | | | | | | |
| | Local Government Public Improvement, Refunding, Series B-15-A, Assured Guaranty, 5.00%, 6/01/28 | | | 220,000 | | | | 228,215 | |
| | Local Government Public Improvement, Refunding, Series B-15-A, Assured Guaranty, 5.00%, 6/01/32 | | | 1,590,000 | | | | 1,647,129 | |
| | Local Government Public Improvement, Series B-15-A, Assured Guaranty, Pre-Refunded, 5.00%, 6/01/28 | | | 880,000 | | | | 915,711 | |
| | Local Government Public Improvement, Series B-15-A, Assured Guaranty, Pre-Refunded, 5.00%, 6/01/32 | | | 975,000 | | | | 1,014,566 | |
| | Chattanooga Electric System Revenue, | | | | | | | | |
| | The Electric Power Board of Chattanooga, Refunding, Series C, 5.00%, 9/01/40 | | | 2,750,000 | | | | 3,201,055 | |
| | The Electric Power Board of Chattanooga, Series A, Pre-Refunded, 5.00%, 9/01/33 | | | 7,500,000 | | | | 7,728,675 | |
| | Chattanooga Health Educational and Housing Facility Board Revenue, | | | | | | | | |
| | Catholic Health Initiatives, Series D, 6.25%, 10/01/33 | | | 500,000 | | | | 529,400 | |
| | Student Housing, CDFI Phase I LLC, University of Tennessee at Chattanooga Project, Refunding, 5.00%, 10/01/35. | | | 1,000,000 | | | | 1,093,090 | |
| | Chattanooga-Hamilton County Hospital Authority Hospital Revenue, | | | | | | | | |
| | Erlanger Health System, AGMC Insured, Pre-Refunded, 5.00%, 10/01/22 | | | 775,000 | | | | 842,417 | |
| | Erlanger Health System, Refunding, AGMC Insured, 5.00%, 10/01/22 | | | 2,475,000 | | | | 2,684,360 | |
| | Clarksville Electric System Revenue, | | | | | | | | |
| | Series A, 5.00%, 9/01/34 | | | 2,000,000 | | | | 2,225,820 | |
| | Series A, 5.00%, 9/01/35 | | | 3,185,000 | | | | 3,541,401 | |
| | XLCA Insured, Pre-Refunded, 5.00%, 9/01/23 | | | 2,325,000 | | | | 2,347,878 | |
| | XLCA Insured, Pre-Refunded, 5.00%, 9/01/32 | | | 4,000,000 | | | | 4,039,360 | |
| | Clarksville Water Sewer and Gas Revenue, | | | | | | | | |
| | Refunding, 5.00%, 2/01/38 | | | 3,000,000 | | | | 3,440,880 | |
| | Refunding, 5.00%, 2/01/41 | | | 3,000,000 | | | | 3,504,090 | |
| | Columbia Waterworks System Revenue, 5.00%, 12/01/32 | | | 3,000,000 | | | | 3,427,530 | |
| | Gallatin Water and Sewer Revenue, | | | | | | | | |
| | Assured Guaranty, Pre-Refunded, 5.00%, 1/01/33 | | | 2,215,000 | | | | 2,267,606 | |
| | Refunding and Improvement, 5.00%, 1/01/32 | | | 1,500,000 | | | | 1,760,610 | |
| | Hallsdale-Powell Utility District of Knox County Waterworks and Sewer Revenue, Improvement, NATL Insured, 5.00%, 4/01/31 | | | 1,000,000 | | | | 1,002,550 | |
| | Harpeth Valley Utilities District of Davidson and Williamson Counties Revenue, | | | | | | | | |
| | Utilities, 5.00%, 9/01/44 | | | 4,400,000 | | | | 5,051,860 | |
| | Utilities, Improvement, NATL Insured, Pre-Refunded, 5.00%, 9/01/35 | | | 3,700,000 | | | | 3,736,852 | |
| | Utilities, Refunding, 5.00%, 9/01/42 | | | 3,000,000 | | | | 3,463,380 | |
| | Hawkins County First Utility District Waterworks Revenue, Series B, Assured Guaranty, Pre-Refunded, 5.00%, 6/01/42 | | | 1,250,000 | | | | 1,300,725 | |
| | Jackson Hospital Revenue, | | | | | | | | |
| | Jackson-Madison County General Hospital, Improvement, Pre-Refunded, 5.50%, 4/01/33 | | | 2,125,000 | | | | 2,205,771 | |
| | Jackson-Madison County General Hospital, Refunding, 5.00%, 4/01/36 | | | 7,000,000 | | | | 7,788,690 | |
| | Jackson-Madison County General Hospital, Refunding and Improvement, 5.50%, 4/01/33 | | | 875,000 | | | | 903,254 | |
| | Johnson City Electric System Revenue, Improvement, AGMC Insured, Pre-Refunded, 5.00%, 5/01/29 | | | 1,000,000 | | | | 1,037,260 | |
| | Johnson City Health and Educational Facilities Board Hospital Revenue, Johnson City Medical Center Hospital, Improvement, Series C, NATL Insured, Pre-Refunded, 5.125%, 7/01/25 | | | 155,000 | | | | 155,324 | |
| | Kingsport GO, Series B, Assured Guaranty, Pre-Refunded, 5.00%, 3/01/29 | | | 1,030,000 | | | | 1,102,131 | |
| | Kingsport IDB, MFHR, Model City Apartments Project, GNMA Secured, 5.50%, 7/20/39 | | | 2,995,000 | | | | 3,010,274 | |
| | Knox County First Utility District Water and Sewer Revenue, | | | | | | | | |
| | 5.00%, 12/01/32 | | | 1,000,000 | | | | 1,176,250 | |
| | Refunding and Improvement, 5.00%, 12/01/26 | | | 1,390,000 | | | | 1,525,608 | |
| | | | |
| 40 | | Annual Report | | franklintempleton.com |
FRANKLIN MUNICIPAL SECURITIES TRUST
STATEMENT OF INVESTMENTS
Franklin Tennessee Municipal Bond Fund (continued)
| | | | | | | | | | |
| | | | | Principal
Amount | | | Value | |
| |
| | Municipal Bonds (continued) | |
| | Tennessee (continued) | | | | | | | | |
| | Knox County Health Educational and Housing Facility Board Hospital Revenue, Covenant Health, | | | | | | | | |
| | Refunding, Series A, 5.00%, 1/01/42. | | $ | 5,000,000 | | | $ | 5,648,850 | |
| | Knox County Health Educational and Housing Facility Board Revenue, | | | | | | | | |
| | University Health System Inc., Refunding, 5.00%, 4/01/36 | | | 2,250,000 | | | | 2,510,527 | |
| | University Health System Inc., Refunding, 5.00%, 9/01/47 | | | 5,000,000 | | | | 5,496,250 | |
| | Knox-Chapman Utility District of Knox County Water and Sewer Revenue, | | | | | | | | |
| | Pre-Refunded, 5.25%, 1/01/36 | | | 1,500,000 | | | | 1,720,305 | |
| | Refunding and Improvement, 5.00%, 1/01/33 | | | 1,470,000 | | | | 1,716,548 | |
| | Refunding and Improvement, 4.00%, 1/01/40 | | | 4,000,000 | | | | 4,170,360 | |
| | Knoxville Wastewater System Revenue, Improvement, Refunding, Series A, 4.00%, 4/01/42 | | | 5,000,000 | | | | 5,189,200 | |
| | Lawrenceburg PBA, GO, Electric System, Refunding, AMBAC Insured, 5.00%, 7/01/22 | | | 2,425,000 | | | | 2,661,195 | |
| | Loudon Water and Sewer Revenue, | | | | | | | | |
| | Exempt Facility, Series A, 4.00%, 3/01/28 | | | 1,000,000 | | | | 1,047,440 | |
| | Exempt Facility, Series A, 5.00%, 3/01/32 | | | 1,300,000 | | | | 1,444,339 | |
| | Manchester GO, Refunding, AGMC Insured, 5.00%, 6/01/38 | | | 2,665,000 | | | | 2,940,748 | |
| | Maryville Water and Sewer Revenue, Series A, Assured Guaranty, 5.00%, 6/01/38 | | | 5,500,000 | | | | 5,688,815 | |
| | Maury County GO, Public Improvement, Refunding, 4.00%, 4/01/34 | | | 1,775,000 | | | | 1,902,995 | |
| | Memphis Electric System Revenue, 5.00%, 12/01/34 | | | 1,000,000 | | | | 1,175,000 | |
| | Memphis GO, | | | | | | | | |
| | General Improvement, Assured Guaranty, Pre-Refunded, 5.00%, 4/01/27 | | | 1,975,000 | | | | 2,119,511 | |
| | General Improvement, Refunding, 5.00%, 5/01/36 | | | 4,135,000 | | | | 4,656,796 | |
| | Memphis-Shelby County Airport Authority Airport Revenue, | | | | | | | | |
| | Refunding, Series B, 5.75%, 7/01/25 | | | 2,500,000 | | | | 2,815,400 | |
| | Refunding, Series D, 5.00%, 7/01/25 | | | 3,000,000 | | | | 3,399,270 | |
| | Series A, AGMC Insured, 5.00%, 7/01/35 | | | 5,000,000 | | | | 5,504,450 | |
| | Series A, AGMC Insured, 5.00%, 7/01/39 | | | 2,565,000 | | | | 2,816,498 | |
| | Memphis-Shelby County Sports Authority Inc. Revenue, Memphis Arena Project, Refunding, Series B, 5.375%, 11/01/29 | | | 5,000,000 | | | | 5,493,450 | |
| | Metropolitan Government of Nashville and Davidson County Electric System Revenue, | | | | | | | | |
| | Series A, 5.00%, 5/15/36 | | | 3,500,000 | | | | 3,945,935 | |
| | Series A, 5.00%, 5/15/39 | | | 4,000,000 | | | | 4,622,800 | |
| | aSeries A, 5.00%, 5/15/42 | | | 3,000,000 | | | | 3,573,840 | |
| | Series A, Pre-Refunded, 5.00%, 5/15/33 | | | 3,000,000 | | | | 3,116,550 | |
| | Metropolitan Government of Nashville and Davidson County Health and Educational Facilities Board Revenue, | | | | | | | | |
| | Vanderbilt University, Series A, Pre-Refunded, 5.50%, 10/01/29 | | | 2,670,000 | | | | 2,945,731 | |
| | Vanderbilt University, Series A, Pre-Refunded, 5.50%, 10/01/29 | | | 830,000 | | | | 914,702 | |
| | Vanderbilt University, Series B, Pre-Refunded, 5.00%, 10/01/39 | | | 9,000,000 | | | | 9,826,380 | |
| | Vanderbilt University Medical Center, Series A, 5.00%, 7/01/40 | | | 5,000,000 | | | | 5,636,550 | |
| | Metropolitan Government of Nashville and Davidson County Sports Authority Revenue, | | | | | | | | |
| | Public Improvement, Ballpark Project, Series A, 5.00%, 8/01/38 | | | 3,000,000 | | | | 3,407,010 | |
| | Public Improvement, Ballpark Project, Series A, 5.00%, 8/01/43 | | | 2,075,000 | | | | 2,341,409 | |
| | Metropolitan Nashville Airport Authority Revenue, Improvement, Series A, 5.00%, 7/01/45 | | | 4,000,000 | | | | 4,539,000 | |
| | Pigeon Forge IDB Revenue, Public Facility, 5.00%, 6/01/34 | | | 1,250,000 | | | | 1,392,575 | |
| | Rutherford County Health and Educational Facilities Board Revenue, Ascension Health Senior Credit Group, Series C, 5.00%, 11/15/40 | | | 10,000,000 | | | | 10,781,800 | |
| | Shelby County Health Educational and Housing Facility Board Revenue, | | | | | | | | |
| | Baptist Memorial Health Care, Series A, 5.00%, 9/01/19. | | | 3,015,000 | | | | 3,231,899 | |
| | Educational Facilities, Rhodes College, 5.00%, 8/01/40 | | | 750,000 | | | | 860,115 | |
| | Educational Facilities, Rhodes College, 5.50%, 8/01/40 | | | 5,000,000 | | | | 5,739,550 | |
| | Educational Facilities, Rhodes College, 5.00%, 8/01/45 | | | 1,700,000 | | | | 1,941,655 | |
| | | | | | |
| franklintempleton.com | | Annual Report | | | 41 | |
FRANKLIN MUNICIPAL SECURITIES TRUST
STATEMENT OF INVESTMENTS
Franklin Tennessee Municipal Bond Fund (continued)
| | | | | | | | | | |
| | | | | Principal
Amount | | | Value | |
| |
| | Municipal Bonds (continued) | |
| | Tennessee (continued) | | | | | | | | |
| | Shelby County Health Educational and Housing Facility Board Revenue, (continued) | | | | | | | | |
| | Methodist Le Bonheur Healthcare, Series A, 5.00%, 5/01/36. | | $ | 4,000,000 | | | $ | 4,640,160 | |
| | Methodist Le Bonheur Healthcare, Series B, AGMC Insured, Pre-Refunded, 5.25%, 9/01/27 | | | 5,000,000 | | | | 5,161,650 | |
| | South Blount County Utility District Waterworks Revenue, | | | | | | | | |
| | Improvement, AGMC Insured, Pre-Refunded, 5.00%, 12/01/33 | | | 315,000 | | | | 345,977 | |
| | Improvement, AGMC Insured, Pre-Refunded, 5.25%, 12/01/39 | | | 1,040,000 | | | | 1,148,649 | |
| | Refunding and Improvement, AGMC Insured, 5.00%, 12/01/33 | | | 685,000 | | | | 747,404 | |
| | Refunding and Improvement, AGMC Insured, 5.25%, 12/01/39 | | | 2,270,000 | | | | 2,486,535 | |
| | Tennessee HDA Residential Financing Program Revenue, Issue 1C, 4.00%, 7/01/43 | | | 2,200,000 | | | | 2,304,104 | |
| | Tennessee HDA Revenue, | | | | | | | | |
| | Homeownership Program, Series 1, 5.00%, 7/01/29 | | | 865,000 | | | | 886,608 | |
| | Homeownership Program, Series 2C, 3.80%, 7/01/43 | | | 1,405,000 | | | | 1,386,637 | |
| | Tennessee State School Bond Authority Revenue, | | | | | | | | |
| | Higher Educational Facilities, Second Program, Refunding, Series B, 5.00%, 11/01/40 | | | 10,000,000 | | | | 11,629,200 | |
| | Higher Educational Facilities, Second Program, Refunding, Series B, 5.00%, 11/01/45 | | | 5,000,000 | | | | 5,782,150 | |
| | Higher Educational Facilities, Second Program, Series A, Pre-Refunded, 5.00%, 5/01/39 | | | 3,000,000 | | | | 3,228,870 | |
| | Higher Educational Facilities, Second Program, Series B, Pre-Refunded, 5.50%, 5/01/38 | | | 4,000,000 | | | | 4,167,040 | |
| | West Knox Utility District Knox County Water and Sewer Revenue, Refunding and Improvement, 5.00%, 6/01/41 | | | 1,000,000 | | | | 1,146,970 | |
| | West Wilson Utility District of Wilson County Water Revenue, | | | | | | | | |
| | Pre-Refunded, 5.00%, 6/01/33 | | | 3,000,000 | | | | 3,446,520 | |
| | Refunding and Improvement, 5.00%, 6/01/40 | | | 1,545,000 | | | | 1,766,599 | |
| | Wilson County GO, School, Series A, 4.00%, 4/01/42 | | | 5,000,000 | | | | 5,332,900 | |
| | | | | | | | | | |
| | | | | | | | | 278,276,622 | |
| | | | | | | | | | |
| | U.S. Territories 3.9% | | | | | | | | |
| | Guam 1.7% | | | | | | | | |
| | Guam Economic Development and Commerce Authority Revenue, Tobacco Settlement, Asset-Backed, | | | | | | | | |
| | Refunding, 5.25%, 6/01/32 | | | 1,325,000 | | | | 1,325,238 | |
| | Guam Government Limited Obligation Revenue, Section 30, Series A, Pre-Refunded, 5.625%, 12/01/29 | | | 3,205,000 | | | | 3,567,646 | |
| | | | | | | | | | |
| �� | | | | | | | | 4,892,884 | |
| | | | | | | | | | |
| | Puerto Rico 2.2% | | | | | | | | |
| | Puerto Rico Electric Power Authority Power Revenue, Series XX, 5.25%, 7/01/40 | | | 5,000,000 | | | | 3,462,500 | |
b | | Puerto Rico Sales Tax FICO Sales Tax Revenue, | | | | | | | | |
| | First Subordinate, Series A, 6.50%, 8/01/44 | | | 7,500,000 | | | | 2,025,000 | |
| | First Subordinate, Series C, 5.50%, 8/01/40 | | | 4,000,000 | | | | 1,070,000 | |
| | | | | | | | | | |
| | | | | | | | | 6,557,500 | |
| | | | | | | | | | |
| | Total U.S. Territories | | | | | | | 11,450,384 | |
| | | | | | | | | | |
| | | |
| | Total Municipal Bonds before Short Term Investments (Cost $284,196,856) | | | | | | | 289,727,006 | |
| | | | | | | | | | |
| | | | |
| 42 | | Annual Report | | franklintempleton.com |
FRANKLIN MUNICIPAL SECURITIES TRUST
STATEMENT OF INVESTMENTS
Franklin Tennessee Municipal Bond Fund (continued)
| | | | | | | | | | |
| | | | | Principal
Amount | | | Value | |
| |
| | | |
| | Short Term Investments (Cost $1,900,000) 0.7% | | | | | | | | |
| | Municipal Bonds 0.7% | | | | | | | | |
| | Tennessee 0.7% | | | | | | | | |
c | | Shelby County Health Educational and Housing Facility Board Revenue, Methodist Le Bonheur Healthcare, Refunding, Series A, AGMC Insured, SPA US Bank National Association, Daily VRDN and Put, 0.78%, 6/01/42 | | $ | 1,900,000 | | | $ | 1,900,000 | |
| | | |
| | Total Investments (Cost $286,096,856) 100.1% | | | | | | | 291,627,006 | |
| | | | | | | | | | |
| | Other Assets, less Liabilities (0.1)% | | | | | | | (269,302 | ) |
| | | | | | | | | | |
| | | |
| | Net Assets 100.0% | | | | | | $ | 291,357,704 | |
| | | | | | | | | | |
See Abbreviations on page 56.
aSecurity purchased on a when-issued basis. See Note 1(b).
bSee Note 6 regarding defaulted securities.
cVariable rate demand notes (VRDNs) are tax-exempt obligations which contain a floating or variable interest rate adjustment formula and an unconditional right of demand to receive payment of the principal balance plus accrued interest at specified dates. The coupon rate shown represents the rate at period end.
| | | | | | |
| franklintempleton.com | | The accompanying notes are an integral part of these financial statements. | Annual Report | | | 43 | |
FRANKLIN MUNICIPAL SECURITIES TRUST
Financial Statements
Statements of Assets and Liabilities
May 31, 2017
| | | | | | | | |
| | | Franklin
California High Yield
Municipal Fund | | | Franklin
Tennessee
Municipal
Bond Fund | |
| |
Assets: | |
Investments in securities: | |
Cost - Unaffiliated issuers | | $ | 2,264,900,410 | | | $ | 286,096,856 | |
| | | | |
Value - Unaffiliated issuers | | $ | 2,479,061,665 | | | $ | 291,627,006 | |
Cash | | | 62,281 | | | | 20,312 | |
Receivables: | |
Investment securities sold | | | 561,103 | | | | — | |
Capital shares sold | | | 5,693,797 | | | | 567,323 | |
Interest | | | 26,405,197 | | | | 3,576,106 | |
Affiliates | | | 75,166 | | | | — | |
Other assets | | | 1,728 | | | | 217 | |
| | | | |
Total assets | | | 2,511,860,937 | | | | 295,790,964 | |
| | | | |
Liabilities: | |
Payables: | |
Investment securities purchased | | | 46,783,301 | | | | 3,533,940 | |
Capital shares redeemed | | | 5,227,668 | | | | 598,356 | |
Management fees | | | 948,806 | | | | 132,382 | |
Distribution fees | | | 316,689 | | | | 22,751 | |
Transfer agent fees | | | 216,462 | | | | 26,536 | |
Distributions to shareholders | | | 1,508,906 | | | | 66,386 | |
Accrued expenses and other liabilities | | | 147,493 | | | | 52,909 | |
| | | | |
Total liabilities | | | 55,149,325 | | | | 4,433,260 | |
| | | | |
| | |
Net assets, at value | | $ | 2,456,711,612 | | | $ | 291,357,704 | |
| | | | |
Net assets consist of: | |
Paid-in capital | | $ | 2,350,822,355 | | | $ | 292,840,969 | |
Undistributed net investment income | | | 4,416,736 | | | | 391,514 | |
Net unrealized appreciation (depreciation) | | | 214,161,255 | | | | 5,530,150 | |
Accumulated net realized gain (loss) | | | (112,688,734 | ) | | | (7,404,929 | ) |
| | | | |
| | |
Net assets, at value | | $ | 2,456,711,612 | | | $ | 291,357,704 | |
| | | | |
Class A: | |
Net assets, at value | | $ | 1,377,513,597 | | | $ | 267,442,111 | |
| | | | |
Shares outstanding. | | | 126,531,016 | | | | 24,064,654 | |
| | | | |
Net asset value per sharea | | | $10.89 | | | | $11.11 | |
| | | | |
Maximum offering price per share (net asset value per share ÷ 95.75%) | | | $11.37 | | | | $11.60 | |
| | | | |
Class C: | |
Net assets, at value | | $ | 358,308,409 | | | | | |
| | | | | | | | |
Shares outstanding | | | 32,677,270 | | | | | |
| | | | | | | | |
Net asset value and maximum offering price per sharea | | $ | 10.97 | | | | | |
| | | | | | | | |
Advisor Class: | |
Net assets, at value | | $ | 720,889,606 | | | $ | 23,915,593 | |
| | | | |
Shares outstanding | | | 66,073,263 | | | | 2,150,833 | |
| | | | |
Net asset value and maximum offering price per share | | | $10.91 | | | | $11.12 | |
| | | | |
aRedemption price is equal to net asset value less contingent deferred sales charges, if applicable.
| | | | |
| 44 | | Annual Report | The accompanying notes are an integral part of these financial statements. | | franklintempleton.com |
FRANKLIN MUNICIPAL SECURITIES TRUST
FINANCIAL STATEMENTS
Statements of Operations
for the year ended May 31, 2017
| | | | | | | | |
| | | Franklin
California High Yield
Municipal Fund | | | Franklin
Tennessee
Municipal
Bond Fund | |
Investment income: | | | | | |
Interest | | $ | 105,561,081 | | | $ | 12,265,049 | |
| | | | |
Expenses: | | | | | |
Management fees (Note 3a) | | | 11,323,349 | | | | 1,615,323 | |
Distribution fees: (Note 3c) | | | | | |
Class A | | | 1,416,803 | | | | 293,100 | |
Class C | | | 2,479,932 | | | | — | |
Transfer agent fees: (Note 3e) | | | | | |
Class A | | | 558,458 | | | | 122,658 | |
Class C | | | 150,430 | | | | — | |
Advisor Class | | | 259,803 | | | | 4,026 | |
Custodian fees | | | 20,372 | | | | 2,509 | |
Reports to shareholders | | | 80,875 | | | | 14,719 | |
Registration and filing fees | | | 85,612 | | | | 10,271 | |
Professional fees | | | 165,070 | | | | 99,683 | |
Trustees’ fees and expenses | | | 60,221 | | | | 7,507 | |
Other | | | 409,805 | | | | 44,432 | |
| | | | |
| | |
Total expenses | | | 17,010,730 | | | | 2,214,228 | |
| | | | |
| | |
Net investment income | | | 88,550,351 | | | | 10,050,821 | |
| | | | |
Realized and unrealized gains (losses): | | | | | |
Net realized gain (loss) from investments | | | (18,352,854 | ) | | | (818,022 | ) |
Net change in unrealized appreciation (depreciation) on investments | | | (34,323,790 | ) | | | (8,256,443 | ) |
| | | | |
| | |
Net realized and unrealized gain (loss) | | | (52,676,644 | ) | | | (9,074,465 | ) |
| | | | |
| | |
Net increase (decrease) in net assets resulting from operations | | $ | 35,873,707 | | | $ | 976,356 | |
| | | | |
| | | | | | |
| franklintempleton.com | | The accompanying notes are an integral part of these financial statements. | Annual Report | | | 45 | |
FRANKLIN MUNICIPAL SECURITIES TRUST
FINANCIAL STATEMENTS
Statements of Changes in Net Assets
| | | | | | | | | | | | | | | | |
| | | Franklin California | | | Franklin Tennessee | |
| | | High Yield Municipal Fund | | | Municipal Bond Fund | |
| | | | | | | | |
| | | Year Ended May 31, | | | Year Ended May 31, | |
| | | | |
| | | 2017 | | | 2016 | | | 2017 | | | 2016 | |
| | | | |
| | | | |
Increase (decrease) in net assets: | | | | | | | | | | | | | | | | |
Operations: | | | | | | | | | | | | | | | | |
Net investment income | | $ | 88,550,351 | | | $ | 84,120,399 | | | $ | 10,050,821 | | | $ | 10,441,637 | |
Net realized gain (loss) | | | (18,352,854 | ) | | | (3,670,661 | ) | | | (818,022 | ) | | | (1,191,121 | ) |
Net change in unrealized appreciation (depreciation) | | | (34,323,790 | ) | | | 98,799,680 | | | | (8,256,443 | ) | | | 2,575,461 | |
| | | | |
| | | | |
Net increase (decrease) in net assets resulting from operations | | | 35,873,707 | | | | 179,249,418 | | | | 976,356 | | | | 11,825,977 | |
| | | | |
Distributions to shareholders from: | | | | | | | | | | | | | | | | |
Net investment income: | | | | | | | | | | | | | | | | |
Class A | | | (51,026,975 | ) | | | (52,806,784 | ) | | | (9,757,030 | ) | | | (10,343,510 | ) |
Class C | | | (11,517,585 | ) | | | (11,394,081 | ) | | | — | | | | — | |
Advisor Class | | | (24,364,295 | ) | | | (21,295,565 | ) | | | (334,234 | ) | | | — | |
| | | | |
| | | | |
Total distributions to shareholders | | | (86,908,855 | ) | | | (85,496,430 | ) | | | (10,091,264 | ) | | | (10,343,510 | ) |
| | | | |
Capital share transactions: (Note 2) | | | | | | | | | | | | | | | | |
Class A | | | (34,287,887 | ) | | | 92,169,914 | | | | (30,909,215 | ) | | | 12,230,945 | |
Class C | | | (10,735,616 | ) | | | 36,708,855 | | | | — | | | | — | |
Advisor Class | | | 97,054,533 | | | | 138,044,150 | | | | 24,088,272 | | | | — | |
| | | | |
| | | | |
Total capital share transactions | | | 52,031,030 | | | | 266,922,919 | | | | (6,820,943 | ) | | | 12,230,945 | |
| | | | |
Net increase (decrease) in net assets | | | 995,882 | | | | 360,675,907 | | | | (15,935,851 | ) | | | 13,713,412 | |
Net assets: | | | | | | | | | | | | | | | | |
Beginning of year | | | 2,455,715,730 | | | | 2,095,039,823 | | | | 307,293,555 | | | | 293,580,143 | |
| | | | |
| | | | |
End of year. | | $ | 2,456,711,612 | | | $ | 2,455,715,730 | | | $ | 291,357,704 | | | $ | 307,293,555 | |
| | | | |
Undistributed net investment income included in net assets: | | | | | | | | | | | | | | | | |
End of year | | $ | 4,416,736 | | | $ | 3,126,930 | | | $ | 391,514 | | | $ | 450,309 | |
| | | | |
| | | | |
| 46 | | Annual Report | The accompanying notes are an integral part of these financial statements. | | franklintempleton.com |
FRANKLIN MUNICIPAL SECURITIES TRUST
Notes to Financial Statements
1. Organization and Significant Accounting Policies
Franklin Municipal Securities Trust (Trust) is registered under the Investment Company Act of 1940 (1940 Act) as an open-end management investment company, consisting of two separate funds (Funds) and applies the specialized accounting and reporting guidance in U.S. Generally Accepted Accounting Principles (U.S. GAAP). The classes of shares offered within each of the Funds are indicated below. Effective September 15, 2016, Franklin Tennessee Municipal Bond Fund began offering a new class of shares, Advisor class. Each class of shares may differ by its initial sales load, contingent deferred sales charges, voting rights on matters affecting a single class, its exchange privilege and fees primarily due to differing arrangements for distribution and transfer agent fees.
|
| Class A & Advisor Class |
| Franklin Tennessee Municipal Bond Fund |
|
| Class A, Class C & Advisor Class |
| Franklin California High Yield Municipal Fund |
The following summarizes the Funds’ significant accounting policies.
a. Financial Instrument Valuation
The Funds’ investments in financial instruments are carried at fair value daily. Fair value is the price that would be received to sell an asset or paid to transfer a liability in an orderly transaction between market participants on the measurement date. The Funds calculate the net asset value (NAV) per share as of 4 p.m. Eastern time each day the New York Stock Exchange (NYSE) is open for trading. Under compliance policies and procedures approved by the Trust’s Board of Trustees (the Board), the Funds’ administrator has responsibility for oversight of valuation, including leading the cross-functional Valuation Committee (VC). The VC provides administration and oversight of the Funds’ valuation policies and procedures, which are approved annually by the Board. Among other things, these procedures allow the Funds to utilize independent pricing services, quotations from securities and financial instrument dealers, and other market sources to determine fair value.
Debt securities generally trade in the over-the-counter market rather than on a securities exchange. The Funds’ pricing services use multiple valuation techniques to determine fair value. In instances where sufficient market activity exists, the
pricing services may utilize a market-based approach through which quotes from market makers are used to determine fair value. In instances where sufficient market activity may not exist or is limited, the pricing services also utilize proprietary valuation models which may consider market characteristics such as benchmark yield curves, credit spreads, estimated default rates, anticipated market interest rate volatility, coupon rates, anticipated timing of principal repayments, underlying collateral, and other unique security features in order to estimate the relevant cash flows, which are then discounted to calculate the fair value.
The Funds have procedures to determine the fair value of financial instruments for which market prices are not reliable or readily available. Under these procedures, the VC convenes on a regular basis to review such financial instruments and considers a number of factors, including significant unobservable valuation inputs, when arriving at fair value. The VC primarily employs a market-based approach which may use related or comparable assets or liabilities, recent transactions, market multiples, book values, and other relevant information for the investment to determine the fair value of the investment. An income-based valuation approach may also be used in which the anticipated future cash flows of the investment are discounted to calculate fair value. Discounts may also be applied due to the nature or duration of any restrictions on the disposition of the investments. Due to the inherent uncertainty of valuations of such investments, the fair values may differ significantly from the values that would have been used had an active market existed. The VC employs various methods for calibrating these valuation approaches including a regular review of key inputs and assumptions, transactional back-testing or disposition analysis, and reviews of any related market activity.
b. Securities Purchased on a When-Issued Basis
Certain or all Funds purchase securities on a when-issued basis, with payment and delivery scheduled for a future date. These transactions are subject to market fluctuations and are subject to the risk that the value at delivery may be more or less than the trade date purchase price. Although the Funds will generally purchase these securities with the intention of holding the securities, they may sell the securities before the settlement date. Sufficient assets have been segregated for these securities.
| | | | | | |
| franklintempleton.com | | Annual Report | | | 47 | |
FRANKLIN MUNICIPAL SECURITIES TRUST
NOTES TO FINANCIAL STATEMENTS
1. Organization and Significant Accounting Policies (continued)
c. Income Taxes
It is each Fund’s policy to qualify as a regulated investment company under the Internal Revenue Code. Each Fund intends to distribute to shareholders substantially all of its income and net realized gains to relieve it from federal income and excise taxes. As a result, no provision for U.S. federal income taxes is required.
Each Fund may recognize an income tax liability related to its uncertain tax positions under U.S. GAAP when the uncertain tax position has a less than 50% probability that it will be sustained upon examination by the tax authorities based on its technical merits. As of May 31, 2017, each Fund has determined that no tax liability is required in its financial statements related to uncertain tax positions for any open tax years (or expected to be taken in future tax years). Open tax years are those that remain subject to examination and are based on each tax jurisdiction’s statute of limitation.
d. Security Transactions, Investment Income, Expenses and Distributions
Security transactions are accounted for on trade date. Realized gains and losses on security transactions are determined on a specific identification basis. Interest income and estimated expenses are accrued daily. Amortization of premium and accretion of discount on debt securities are included in interest income. Dividends from net investment income are normally declared daily; these dividends may be reinvested or paid monthly to shareholders. Distributions to shareholders are determined according to income tax regulations (tax basis). Distributable earnings determined on a tax basis may differ from earnings recorded in accordance with U.S. GAAP. These differences may be permanent or temporary. Permanent differences are reclassified among capital accounts to reflect their tax character. These reclassifications have no impact on net assets or the results of operations. Temporary differences are not reclassified, as they may reverse in subsequent periods.
Common expenses incurred by the Trust are allocated among the Funds based on the ratio of net assets of each Fund to the combined net assets of the Trust. Fund specific expenses are charged directly to the Fund that incurred the expense.
Realized and unrealized gains and losses and net investment income, not including class specific expenses, are allocated daily to each class of shares based upon the relative proportion of net assets of each class. Differences in per share distributions, by class, are generally due to differences in class specific expenses.
e. Insurance
The scheduled payments of interest and principal for each insured municipal security in the Trust are insured by either a new issue insurance policy or a secondary insurance policy. Some municipal securities in the Funds are secured by collateral guaranteed by an agency of the U.S. government. Depending on the type of coverage, premiums for insurance are either added to the cost basis of the security or paid by a third party.
Insurance companies typically insure municipal bonds that tend to be of very high quality, with the majority of underlying municipal bonds rated A or better. However, an event involving an insurer could have an adverse effect on the value of the securities insured by that insurance company. There can be no assurance the insurer will be able to fulfill its obligations under the terms of the policy.
f. Accounting Estimates
The preparation of financial statements in accordance with U.S. GAAP requires management to make estimates and assumptions that affect the reported amounts of assets and liabilities at the date of the financial statements and the amounts of income and expenses during the reporting period. Actual results could differ from those estimates.
g. Guarantees and Indemnifications
Under the Trust’s organizational documents, its officers and trustees are indemnified by the Trust against certain liabilities arising out of the performance of their duties to the Trust. Additionally, in the normal course of business, the Trust, on behalf of the Funds, enters into contracts with service providers that contain general indemnification clauses. The Trust’s maximum exposure under these arrangements is unknown as this would involve future claims that may be made against the Trust that have not yet occurred. Currently, the Trust expects the risk of loss to be remote.
| | | | |
| 48 | | Annual Report | | franklintempleton.com |
FRANKLIN MUNICIPAL SECURITIES TRUST
NOTES TO FINANCIAL STATEMENTS
2. Shares of Beneficial Interest
At May 31, 2017, there were an unlimited number of shares authorized (without par value). Transactions in the Funds’ shares were as follows:
| | | | | | | | | | | | | | | | |
| | | Franklin California | | | Franklin Tennessee | |
| | | High Yield Municipal Fund | | | Municipal Bond Fund | |
| | | | |
| | | Shares | | | Amount | | | Shares | | | Amount | |
| |
| | | | |
| Class A Shares: | | | | | | | | | | | | | | | | |
Year ended May 31, 2017 | | | | | | | | | | | | | | | | |
Shares sold | | | 31,697,553 | | | $ | 345,600,673 | | | | 2,948,487 | | | $ | 33,501,178 | |
Shares issued in reinvestment of distributions | | | 4,015,363 | | | | 43,789,074 | | | | 793,864 | | | | 8,950,558 | |
Shares redeemed | | | (39,209,150 | ) | | | (423,677,634 | ) | | | (6,536,070 | ) | | | (73,360,951) | |
| | | | |
| | | | |
Net increase (decrease) | | | (3,496,234 | ) | | $ | (34,287,887 | ) | | | (2,793,719 | ) | | $ | (30,909,215) | |
| | | | |
| | | | |
Year ended May 31, 2016 | | | | | | | | | | | | | | | | |
Shares sold | | | 30,832,731 | | | $ | 332,124,577 | | | | 3,943,392 | | | $ | 44,794,337 | |
Shares issued in reinvestment of distributions | | | 4,080,352 | | | | 44,055,673 | | | | 817,838 | | | | 9,280,939 | |
Shares redeemed | | | (26,391,263 | ) | | | (284,010,336 | ) | | | (3,691,266 | ) | | | (41,844,331) | |
| | | | |
Net increase (decrease) | | | 8,521,820 | | | $ | 92,169,914 | | | | 1,069,964 | | | $ | 12,230,945 | |
| | | | |
| | | | |
| Class C Shares: | | | | | | | | | | | | | | | | |
Year ended May 31, 2017 | | | | | | | | | | | | | | | | |
Shares sold | | | 6,119,658 | | | $ | 67,989,851 | | | | | | | | | |
Shares issued in reinvestment of distributions | | | 833,005 | | | | 9,144,337 | | | | | | | | | |
Shares redeemed | | | (8,072,631 | ) | | | (87,869,804 | ) | | | | | | | | |
| | | | | | | | | | | | |
| | | | |
Net increase (decrease) | | | (1,119,968 | ) | | $ | (10,735,616 | ) | | | | | | | | |
| | | | | | | | | | | | |
| | | | |
Year ended May 31, 2016 | | | | | | | | | | | | | | | | |
Shares sold | | | 6,876,895 | | | $ | 74,909,800 | | | | | | | | | |
Shares issued in reinvestment of distributions | | | 808,943 | | | | 8,791,576 | | | | | | | | | |
Shares redeemed | | | (4,335,827 | ) | | | (46,992,521 | ) | | | | | | | | |
| | | | | | | | | | | | |
| | | | |
Net increase (decrease) | | | 3,350,011 | | | $ | 36,708,855 | | | | | | | | | |
| | | | | | | | | | | | |
| | | | |
| Advisor Class Shares: | | | | | | | | | | | | | | | | |
Year ended May 31, 2017a | | | | | | | | | | | | | | | | |
Shares sold | | | 29,267,976 | | | $ | 317,060,971 | | | | 2,530,972 | | | $ | 28,323,128 | |
Shares issued in reinvestment of distributions | | | 1,526,824 | | | | 16,667,915 | | | | 30,102 | | | | 334,104 | |
Shares redeemed | | | (21,879,971 | ) | | | (236,674,353 | ) | | | (410,241 | ) | | | (4,568,960) | |
| | | | |
| | | | |
Net increase (decrease) | | | 8,914,829 | | | $ | 97,054,533 | | | | 2,150,833 | | | $ | 24,088,272 | |
| | | | |
| | | | |
Year ended May 31, 2016 | | | | | | | | | | | | | | | | |
Shares sold | | | 20,333,235 | | | $ | 220,443,000 | | | | | | | | | |
Shares issued in reinvestment of distributions | | | 1,270,053 | | | | 13,749,421 | | | | | | | | | |
Shares redeemed | | | (8,901,598 | ) | | | (96,148,271 | ) | | | | | | | | |
| | | | | | | | | | | | |
Net increase (decrease) | | | 12,701,690 | | | $ | 138,044,150 | | | | | | | | | |
| | | | | | | | | | | | |
aFor the period September 15, 2016 (effective date) to May 31, 2017 for Franklin Tennessee Muncipal Bond Fund.
| | | | | | |
| franklintempleton.com | | Annual Report | | | 49 | |
FRANKLIN MUNICIPAL SECURITIES TRUST
NOTES TO FINANCIAL STATEMENTS
3. Transactions with Affiliates
Franklin Resources, Inc. is the holding company for various subsidiaries that together are referred to as Franklin Templeton Investments. Certain officers and trustees of the Trust are also officers and/or directors of the following subsidiaries:
| | |
Subsidiary | | Affiliation |
| |
Franklin Advisers, Inc. (Advisers) | | Investment manager |
| |
Franklin Templeton Services, LLC (FT Services) | | Administrative manager |
| |
Franklin Templeton Distributors, Inc. (Distributors) | | Principal underwriter |
| |
Franklin Templeton Investor Services, LLC (Investor Services) | | Transfer agent |
a. Management Fees
The Funds pay an investment management fee to Advisers based on the average daily net assets of each of the Funds as follows:
| | |
| Annualized Fee Rate | | Net Assets |
| |
0.625% | | Up to and including $100 million |
| |
0.500% | | Over $100 million, up to and including $250 million |
| |
0.450% | | Over $250 million, up to and including $7.5 billion |
| |
0.440% | | Over $7.5 billion, up to and including $10 billion |
| |
0.430% | | Over $10 billion, up to and including $12.5 billion |
| |
0.420% | | Over $12.5 billion, up to and including $15 billion |
| |
0.400% | | Over $15 billion, up to and including $17.5 billion |
| |
0.380% | | Over $17.5 billion, up to and including $20 billion |
| |
0.360% | | In excess of $20 billion |
For the year ended May 31, 2017, each Fund’s effective investment management fee rate based on average daily net assets was as follows:
| | |
Franklin California High Yield Municipal Fund | | Franklin Tennessee Municipal
Bond Fund |
0.460% | | 0.526% |
b. Administrative Fees
Under an agreement with Advisers, FT Services provides administrative services to the Funds. The fee is paid by Advisers based on each of the Funds’ average daily net assets, and is not an additional expense of the Funds.
c. Distribution Fees
The Board has adopted distribution plans for each share class, with the exception of Advisor Class shares, pursuant to Rule 12b-1 under the 1940 Act. Under the Funds’ Class A reimbursement distribution plans, the Funds reimburse Distributors for costs incurred in connection with the servicing, sale and distribution of each Fund’s shares up to the maximum annual plan rate. Under the Class A reimbursement distribution plans, costs exceeding the maximum for the current plan year cannot be reimbursed in subsequent periods. In addition, under the Funds’ Class C compensation distribution plans, Franklin California High Yield Municipal Fund pays Distributors for costs incurred in connection with the servicing, sale and distribution of each Fund’s shares up to the maximum annual plan rate. The plan year, for purposes of monitoring compliance with the maximum annual plan rates, is February 1 through January 31 for each Fund.
| | | | |
| 50 | | Annual Report | | franklintempleton.com |
FRANKLIN MUNICIPAL SECURITIES TRUST
NOTES TO FINANCIAL STATEMENTS
The maximum annual plan rates, based on the average daily net assets, for each class, are as follows:
| | | | | | | | |
| | | Franklin
California
High Yield
Municipal Fund | | | Franklin
Tennessee
Municipal
Bond Fund | |
| | |
Reimbursement Plans: | | | | | | | | |
| | |
Class A | | | 0.15% | | | | 0.15% | |
| | |
Compensation Plans: | | | | | | | | |
| | |
Class C | | | 0.65% | | | | — | |
Distributors has agreed to limit the current rate to 0.10% per year for each of the Funds for Class A shares.
d. Sales Charges/Underwriting Agreements
Front-end sales charges and contingent deferred sales charges (CDSC) do not represent expenses of the Funds. These charges are deducted from the proceeds of sales of fund shares prior to investment or from redemption proceeds prior to remittance, as applicable. Distributors has advised the Funds of the following commission transactions related to the sales and redemptions of the Funds’ shares for the year:
| | | | | | | | |
| | | Franklin
California
High Yield
Municipal Fund | | | Franklin
Tennessee
Municipal
Bond Fund | |
| | |
Sales charges retained net of commissions paid to unaffiliated brokers/dealers | | | $305,914 | | | | $85,327 | |
| | |
CDSC retained | | | $ 66,734 | | | | $ 71 | |
e. Transfer Agent Fees
Each class of shares pays transfer agent fees to Investor Services for its performance of shareholder servicing obligations and reimburses Investor Services for out of pocket expenses incurred, including shareholder servicing fees paid to third parties. These fees are allocated daily based upon their relative proportion of such classes’ aggregate net assets.
For the year ended May 31, 2017, the Funds paid transfer agent fees as noted in the Statements of Operations of which the following amounts were retained by Investor Services:
| | | | | | | | |
| | | Franklin
California
High Yield
Municipal Fund | | | Franklin
Tennessee
Municipal
Bond Fund | |
| | |
Transfer agent fees | | | $261,898 | | | | $30,119 | |
f. Interfund Transactions
Certain or all Funds engaged in purchases and sales of investments with funds or other accounts that have common investment managers (or affiliated investment managers), directors, trustees or officers. Purchases and sales for the year ended May 31, 2017, were as follows:
| | | | | | | | |
| | | Franklin
California
High Yield
Municipal Fund | | | Franklin
Tennessee
Municipal
Bond Fund | |
| | |
Purchases | | | $204,920,000 | | | | $8,600,000 | |
Sales | | | $111,155,000 | | | | $7,200,000 | |
| | | | | | |
| franklintempleton.com | | Annual Report | | | 51 | |
FRANKLIN MUNICIPAL SECURITIES TRUST
NOTES TO FINANCIAL STATEMENTS
4. Income Taxes
For tax purposes, capital losses may be carried over to offset future capital gains, if any. Capital loss carryforwards with no expiration, if any, must be fully utilized before those losses with expiration dates.
At May 31, 2017, the capital loss carryforwards were as follows:
| | | | | | | | |
| | | Franklin
California
High Yield
Municipal Fund | | | Franklin Tennessee Municipal Bond Fund | |
| Capital loss carryforwards subject to expiration: | | | | | | | | |
2018 | | $ | 32,781,484 | | | $ | – | |
2019 | | | 21,604,912 | | | | – | |
| Capital loss carryforwards not subject to expiration: | | | | | | | | |
Short term | | | 44,227,219 | | | | 4,714,607 | |
Long term | | | 13,599,648 | | | | 2,363,545 | |
| | | | |
Total capital loss carryforwards | | $ | 112,213,263 | | | $ | 7,078,152 | |
| | | | |
On May 31, 2017, Franklin California High Yield Municipal Fund and Franklin Tennessee Municipal Bond Fund had expired capital loss carryforwards of $5,767,799 and $810,129 respectively, which were reclassified to paid-in capital.
The tax character of distributions paid during the years ended May 31, 2017 and 2016, was as follows:
| | | | | | | | | | | | | | | | |
| | | Franklin California High Yield��Municipal Fund | | | Franklin Tennessee Municipal Bond Fund | |
| | | 2017 | | | 2016 | | | 2017 | | | 2016 | |
Distributions paid from tax exempt income. | | $ | 86,908,855 | | | $ | 85,496,430 | | | $ | 10,091,264 | | | $ | 10,343,510 | |
| | | | |
At May 31, 2017, the cost of investments, net unrealized appreciation (depreciation), undistributed tax exempt and ordinary income for income tax purposes were as follows:
| | | | | | | | |
| | | Franklin
California
High Yield
Municipal Fund | | | Franklin
Tennessee
Municipal
Bond Fund | |
Cost of investments | | | $2,262,959,288 | | | | $286,528,152 | |
| | | | |
| | |
Unrealized appreciation | | | $ 250,066,315 | | | | $14,942,697 | |
Unrealized depreciation | | | (33,963,938) | | | | (9,843,843) | |
| | | | |
Net unrealized appreciation (depreciation) | | | $ 216,102,377 | | | | $ 5,098,854 | |
| | | | |
| | |
Undistributed tax exempt income | | | $ 5,214,251 | | | | $ 411,237 | |
Undistributed ordinary income | | | 63,033 | | | | 151,180 | |
| | | | |
Distributable earnings. | | | $ 5,277,284 | | | | $ 562,417 | |
| | | | |
Differences between income and/or capital gains as determined on a book basis and a tax basis are primarily due to differing treatments of bond discounts and premiums.
| | | | |
| 52 | | Annual Report | | franklintempleton.com |
FRANKLIN MUNICIPAL SECURITIES TRUST
NOTES TO FINANCIAL STATEMENTS
5. Investment Transactions
Purchases and sales of investments (excluding short term securities) for the year ended May 31, 2017, were as follows:
| | | | | | | | |
| | | Franklin
California
High Yield
Municipal Fund | | | Franklin
Tennessee
Municipal
Bond Fund | |
| Purchases | | | $551,593,239 | | | | $56,558,086 | |
| Sales | | | $450,733,431 | | | | $57,732,039 | |
6. Credit Risk and Defaulted Securities
At May 31, 2017, Franklin California High Yield Municipal Fund had 23.9% of its portfolio invested in high yield securities, rated below investment grade and unrated securities, if any. These securities may be more sensitive to economic conditions causing greater price volatility and are potentially subject to a greater risk of loss due to default than higher rated securities.
Certain or all Funds held defaulted securities and/or other securities for which the income has been deemed uncollectible. At May 31, 2017, the aggregate value of these securities for Franklin California High Yield Municipal Fund and Franklin Tennessee Municipal Bond Fund was $16,500,000 and $3,095,000, representing 0.7% and 1.1% respectively, of each Fund’s net assets. The Funds discontinue accruing income on securities for which income has been deemed uncollectible and provide an estimate for losses on interest receivable. The securities have been identified in the accompanying Statements of Investments.
7. Concentration of Risk
Certain or all Funds invest a large percentage of their total assets in obligations of issuers within their respective state and U.S. territories. Such concentration may subject the Funds to risks associated with industrial or regional matters, and economic, political or legal developments occurring within those states and U.S. territories. Investing in Puerto Rico securities may expose the Funds to heightened risks due to recent adverse economic and market changes, credit downgrades and ongoing restructuring discussions. In addition, investments in these securities are sensitive to interest rate changes and credit risk of the issuer and may subject the Funds to increased market volatility. The market for these investments may be limited, which may make them difficult to buy or sell.
8. Restricted Securities
Certain or all Funds invest in securities that are restricted under the Securities Act of 1933 (1933 Act) or which are subject to legal, contractual, or other agreed upon restrictions on resale. Restricted securities are often purchased in private placement transactions, and cannot be sold without prior registration unless the sale is pursuant to an exemption under the 1933 Act. Disposal of these securities may require greater effort and expense, and prompt sale at an acceptable price may be difficult. The Funds may have registration rights for restricted securities. The issuer generally incurs all registration costs.
At May 31, 2017, investments in restricted securities, excluding certain securities exempt from registration under the 1933 Act deemed to be liquid, were as follows:
| | | | | | | | | | | | | | |
| Units | | Issuer | | Acquisition Date | | | Cost | | | Value | |
| Franklin California High Yield Municipal Fund | | | | | | | | | | | | |
7,830,849 | | a1155 Island Avenue LLC, LP (Value is 0.0%† of Net Assets) | | | 12/04/14 | | | | $611,327 | | | | $611,323 | |
| | | | | | | | | | |
†Rounds to less than 0.1% of net assets.
aThe Fund also invests in unrestricted securities or other investments in the issuer, valued at $3,896,991 as of May 31, 2017.
| | | | | | |
| franklintempleton.com | | Annual Report | | | 53 | |
FRANKLIN MUNICIPAL SECURITIES TRUST
NOTES TO FINANCIAL STATEMENTS
9. Credit Facility
The Funds, together with other U.S. registered and foreign investment funds (collectively, Borrowers), managed by Franklin Templeton Investments, are borrowers in a joint syndicated senior unsecured credit facility totaling $2 billion (Global Credit Facility) which matures on February 9, 2018. This Global Credit Facility provides a source of funds to the Borrowers for temporary and emergency purposes, including the ability to meet future unanticipated or unusually large redemption requests.
Under the terms of the Global Credit Facility, the Funds shall, in addition to interest charged on any borrowings made by the Funds and other costs incurred by the Funds, pay their share of fees and expenses incurred in connection with the implementation and maintenance of the Global Credit Facility, based upon their relative share of the aggregate net assets of all of the Borrowers, including an annual commitment fee of 0.15% based upon the unused portion of the Global Credit Facility. These fees are reflected in other expenses in the Statements of Operations. During the year ended May 31, 2017, the Funds did not use the Global Credit Facility.
10. Fair Value Measurements
The Funds follows a fair value hierarchy that distinguishes between market data obtained from independent sources (observable inputs) and the Funds’ own market assumptions (unobservable inputs). These inputs are used in determining the value of the Funds’ financial instruments and are summarized in the following fair value hierarchy:
| | • | | Level 1 – quoted prices in active markets for identical financial instruments |
| | • | | Level 2 – other significant observable inputs (including quoted prices for similar financial instruments, interest rates, prepayment speed, credit risk, etc.) |
| | • | | Level 3 – significant unobservable inputs (including the Funds’ own assumptions in determining the fair value of financial instruments) |
The input levels are not necessarily an indication of the risk or liquidity associated with financial instruments at that level.
For movements between the levels within the fair value hierarchy, the Funds have adopted a policy of recognizing the transfers as of the date of the underlying event which caused the movement.
A summary of inputs used as of May 31, 2017, in valuing the Funds’ assets carried at fair value, is as follows:
| | | | | | | | | | | | | | | | |
| | | Level 1 | | | Level 2 | | | Level 3 | | | Total | |
| Franklin California High Yield Municipal Fund | | | | | | | | | | | | | | | | |
Assets: | | | | | | | | | | | | | | | | |
Investments in Securities: | | | | | | | | | | | | | | | | |
Common Stocks and Other Equity Interests | | $ | — | | | $ | — | | | $ | 611,323 | | | $ | 611,323 | |
Corporate Bonds | | | — | | | | 3,896,991 | | | | — | | | | 3,896,991 | |
Municipal Bonds | | | — | | | | 2,286,375,351 | | | | — | | | | 2,286,375,351 | |
Short Term Investments | | | — | | | | 188,178,000 | | | | — | | | | 188,178,000 | |
| | | | |
Total Investments in Securities | | $ | — | | | $ | 2,478,450,342 | | | $ | 611,323 | | | $ | 2,479,061,665 | |
| | | | |
| Franklin Tennessee Municipal Bond Fund | | | | | | | | | | | | | | | | |
Assets: | | | | | | | | | | | | | | | | |
Investments in Securities: | | | | | | | | | | | | | | | | |
Municipal Bonds | | $ | — | | | $ | 289,727,006 | | | $ | — | | | $ | 289,727,006 | |
Short Term Investments | | | — | | | | 1,900,000 | | | | — | | | | 1,900,000 | |
| | | | |
Total Investments in Securities | | $ | — | | | $ | 291,627,006 | | | $ | — | | | $ | 291,627,006 | |
| | | | |
| | | | |
| 54 | | Annual Report | | franklintempleton.com |
FRANKLIN MUNICIPAL SECURITIES TRUST
NOTES TO FINANCIAL STATEMENTS
A reconciliation of assets in which Level 3 inputs are used in determining fair value is presented when there are significant Level 3 financial instruments at the end of the year.
11. New Accounting Pronouncements
In March 2017, the Financial Accounting Standards Board (FASB) issued Accounting Standards Update (ASU) No. 2017-08, Receivables—Nonrefundable Fees and Other Costs (Subtopic 310-20): Premium Amortization on Purchased Callable Debt Securities. The amendments in the ASU shorten the amortization period for certain callable debt securities, held at a premium, to be amortized to the earliest call date. The ASU does not require an accounting change for securities held at a discount; which continues to be amortized to maturity. The ASU is effective for fiscal years and interim periods within those fiscal years beginning after December 15, 2018. Management is currently evaluating the impact, if any, of applying this provision.
12. Investment Company Reporting Modernization
In October 2016, the U.S. Securities and Exchange Commission adopted new rules and amended existing rules (together, final rules) intended to modernize the reporting and disclosure of information by registered investment companies. In part, the final rules amend Regulation S-X and require standardized, enhanced disclosures about derivatives in investment company financial statements, as well as other amendments. The compliance date for the amendments to Regulation S-X is August 1, 2017. Management has reviewed the requirements and believes the adoption of the amendments to Regulation S-X will not have a material impact on the Funds’ financial statements and related disclosures.
13. Subsequent Events
The Funds have evaluated subsequent events through the issuance of the financial statements and determined that no events have occurred that require disclosure.
| | | | | | |
| franklintempleton.com | | Annual Report | | | 55 | |
FRANKLIN MUNICIPAL SECURITIES TRUST
NOTES TO FINANCIAL STATEMENTS
Abbreviations
| | | | | | |
Selected Portfolio | | | | |
| | | |
| 1915 Act | | Improvement Bond Act of 1915 | | HDA | | Housing Development Authority/Agency |
| ABAG | | The Association of Bay Area Governments | | ID | | Improvement District |
| AD | | Assessment District | | IDB | | Industrial Development Bond/Board |
| AGMC | | Assured Guaranty Municipal Corp. | | LOC | | Letter of Credit |
| AMBAC | | American Municipal Bond Assurance Corp. | | MFHR | | Multi-Family Housing Revenue |
| BAM | | Build America Mutual Assurance Co. | | NATL | | National Public Financial Guarantee Corp. |
| CDA | | Community Development Authority/Agency | | PBA | | Public Building Authority |
| CFD | | Community Facilities District | | PCFA | | Pollution Control Financing Authority |
| COP | | Certificate of Participation | | PFA | | Public Financing Authority |
| CRDA | | Community Redevelopment Authority/Agency | | PFAR | | Public Financing Authority Revenue |
| CSD | | Central School District | | PIK | | Payment-In-Kind |
| ETM | | Escrow to Maturity | | PUD | | Public Utility District |
| FGIC | | Financial Guaranty Insurance Co. | | RDA | | Redevelopment Agency/Authority |
| FHA | | Federal Housing Authority/Agency | | SPA | | Standby Purchase Agreement |
| FICO | | Financing Corp. | | UHSD | | Unified/Union High School District |
| GNMA | | Government National Mortgage Association | | USD | | Unified/Union School District |
| GO | | General Obligation | | XLCA | | XL Capital Assurance |
| | | | |
| 56 | | Annual Report | | franklintempleton.com |
FRANKLIN MUNICIPAL SECURITIES TRUST
Report of Independent Registered Public Accounting Firm
To the Board of Trustees of Franklin Municipal Securities Trust and Shareholders of Franklin California High Yield Municipal Fund and Franklin Tennessee Municipal Bond Fund:
In our opinion, the accompanying statements of assets and liabilities, including the statements of investments, and the related statements of operations and of changes in net assets and the financial highlights present fairly, in all material respects, the financial position of the Franklin California High Yield Municipal Fund and Franklin Tennessee Municipal Bond Fund (the “Funds”) as of May 31, 2017, the results of each of their operations for the year then ended, the changes in each of their net assets for each of the two years in the period then ended and the financial highlights for each of the periods indicated, in conformity with accounting principles generally accepted in the United States of America. These financial statements and financial highlights (hereafter referred to as “financial statements”) are the responsibility of the Funds’ management. Our responsibility is to express an opinion on these financial statements based on our audits. We conducted our audits of these financial statements in accordance with the standards of the Public Company Accounting Oversight Board (United States). Those standards require that we plan and perform the audit to obtain reasonable assurance about whether the financial statements are free of material misstatement. An audit includes examining, on a test basis, evidence supporting the amounts and disclosures in the financial statements, assessing the accounting principles used and significant estimates made by management, and evaluating the overall financial statement presentation. We believe that our audits, which included confirmation of securities as of May 31, 2017 by correspondence with the custodian and brokers, provide a reasonable basis for our opinion.
PricewaterhouseCoopers LLP
San Francisco, California
July 17, 2017
| | | | | | |
| franklintempleton.com | | Annual Report | | | 57 | |
FRANKLIN MUNICIPAL SECURITIES TRUST
Tax Information (unaudited)
Under Section 852(b)(5)(A) of the Internal Revenue Code, the Funds hereby report 100% of the distributions paid from net investment income as exempt-interest dividends for the fiscal year ended May 31, 2017. A portion of the Funds’ exempt-interest dividends may be subject to the federal alternative minimum tax. By mid-February 2018, shareholders will be notified of amounts for use in preparing their 2017 income tax returns.
| | | | |
| 58 | | Annual Report | | franklintempleton.com |
FRANKLIN MUNICIPAL SECURITIES TRUST
Board Members and Officers
The name, year of birth and address of the officers and board members, as well as their affiliations, positions held with the Trust, principal occupations during at least the past five years and number of U.S. registered portfolios overseen in the Franklin Templeton Investments fund complex, are shown below. Generally, each board member serves until that person’s successor is elected and qualified.
Independent Board Members
| | | | | | | | |
Name, Year of Birth
and Address | | Position | | Length of
Time Served | | Number of Portfolios in
Fund Complex Overseen
by Board Member* | | Other Directorships Held
During at Least the Past 5 Years |
| | | | |
Harris J. Ashton (1932) One Franklin Parkway San Mateo, CA 94403-1906 | | Trustee | | Since 1991 | | 140 | | Bar-S Foods (meat packing company) (1981-2010). |
|
| Principal Occupation During at Least the Past 5 Years: |
Director of various companies; and formerly, Director, RBC Holdings, Inc. (bank holding company) (until 2002); and President, Chief Executive Officer and Chairman of the Board, General Host Corporation (nursery and craft centers) (until 1998). |
| | | | |
Mary C. Choksi (1950) One Franklin Parkway San Mateo, CA 94403-1906 | | Trustee | | Since 2014 | | 134 | | Avis Budget Group Inc. (car rental) (2007-present), Omnicom Group Inc. (advertising and marketing communications services) (2011-present) and H.J. Heinz Company (processed foods and allied products) (1998-2006) |
|
| Principal Occupation During at Least the Past 5 Years: |
Senior Advisor, Strategic Investment Group (investment management group) (2015-present); director of various companies; and formerly, Founding Partner and Senior Managing Director, Strategic Investment Group (1987–2015); Founding Partner and Managing Director, Emerging Markets Management LLC (investment management firm) (1987-2011); and Loan Officer/Senior Loan Officer/Senior Pension Investment Officer, World Bank Group (international financial institution) (1977-1987). |
| | | | |
Edith E. Holiday (1952) One Franklin Parkway San Mateo, CA 94403-1906 | | Trustee | | Since 1998 | | 140 | | Hess Corporation (exploration and refining of oil and gas) (1993-present), Canadian National Railway (railroad) (2001-present), White Mountains Insurance Group, Ltd. (holding company) (2004-present), Santander Consumer USA Holdings, Inc. (consumer finance) (2016-present). RTI International Metals, Inc. (manufacture and distribution of titanium) (1999-2015) and H.J. Heinz Company (processed foods and allied products) (1994-2013). |
|
| Principal Occupation During at Least the Past 5 Years: |
Director or Trustee of various companies and trusts; and formerly, Assistant to the President of the United States and Secretary of the Cabinet (1990-1993); General Counsel to the United States Treasury Department (1989-1990); and Counselor to the Secretary and Assistant Secretary for Public Affairs and Public Liaison-United States Treasury Department (1988-1989). |
| | | | |
J. Michael Luttig (1954) One Franklin Parkway San Mateo, CA 94403-1906 | | Trustee | | Since 2009 | | 140 | | Boeing Capital Corporation (aircraft financing) (2006-2013). |
|
| Principal Occupation During at Least the Past 5 Years: |
Executive Vice President, General Counsel and member of the Executive Council, The Boeing Company (aerospace company) (2006-present); and formerly, Federal Appeals Court Judge, U.S. Court of Appeals for the Fourth Circuit (1991-2006). |
| | | | | | |
| franklintempleton.com | | Annual Report | | | 59 | |
FRANKLIN MUNICIPAL SECURITIES TRUST
Independent Board Members (continued)
| | | | | | | | |
Name, Year of Birth
and Address | | Position | | Length of
Time Served | | Number of Portfolios in
Fund Complex Overseen
by Board Member* | | Other Directorships Held
During at Least the Past 5 Years |
| | | | |
Larry D. Thompson (1945) One Franklin Parkway San Mateo, CA 94403-1906 | | Trustee | | Since 2007 | | 140 | | The Southern Company (energy company) (2014-present; previously 2010-2012), Graham Holdings Company (education and media organization) (2011-present) and Cbeyond, Inc. (business communications provider) (2010-2012). |
|
| Principal Occupation During at Least the Past 5 Years: |
Director of various companies; John A. Sibley Professor of Corporate and Business Law, University of Georgia School of Law (2015-present; previously 2011-2012); and formerly, Executive Vice President - Government Affairs, General Counsel and Corporate Secretary, PepsiCo, Inc. (consumer products) (2012-2014); Senior Vice President - Government Affairs, General Counsel and Secretary, PepsiCo, Inc. (2004-2011); Senior Fellow of The Brookings Institution (2003-2004); Visiting Professor, University of Georgia School of Law (2004); and Deputy Attorney General, U.S. Department of Justice (2001-2003). |
| | | | |
John B. Wilson (1959) One Franklin Parkway San Mateo, CA 94403-1906 | | Lead Independent Trustee | | Trustee since 2006 and Lead Independent Trustee since 2008 | | 114 | | None |
|
| Principal Occupation During at Least the Past 5 Years: |
President, Staples Europe (office supplies) (2012-present); President and Founder, Hyannis Port Capital, Inc. (real estate and private equity investing); serves on private and non-profit boards; and formerly, Chief Operating Officer and Executive Vice President, Gap, Inc. (retail) (1996-2000); Chief Financial Officer and Executive Vice President – Finance and Strategy, Staples, Inc. (1992-1996); Senior Vice President –Corporate Planning, Northwest Airlines, Inc. (airlines) (1990-1992); and Vice President and Partner, Bain & Company (consulting firm) (1986-1990). |
Interested Board Members and Officers
| | | | | | | | |
Name, Year of Birth
and Address | | Position | | Length of
Time Served | | Number of Portfolios in
Fund Complex Overseen
by Board Member* | | Other Directorships Held
During at Least the Past 5 Years |
| | | | |
**Gregory E. Johnson (1961) One Franklin Parkway San Mateo, CA 94403-1906 | | Trustee | | Since 2007 | | 156 | | None |
|
| Principal Occupation During at Least the Past 5 Years: |
Chairman of the Board, Member - Office of the Chairman, Director and Chief Executive Officer, Franklin Resources, Inc.; officer and/or director or trustee, as the case may be, of some of the other subsidiaries of Franklin Resources, Inc. and of 44 of the investment companies in Franklin Templeton Investments; Vice Chairman, Investment Company Institute; and formerly, President, Franklin Resources, Inc. (1994-2015). |
| | | | |
**Rupert H. Johnson, Jr. (1940)
One Franklin Parkway San Mateo, CA 94403-1906 | | Chairman of the Board and Trustee | | Chairman of the Board and Trustee since 2013 | | 140 | | None |
|
| Principal Occupation During at Least the Past 5 Years: |
Vice Chairman, Member - Office of the Chairman and Director, Franklin Resources, Inc.; Director, Franklin Advisers, Inc.; Senior Vice President, Franklin Advisory Services, LLC; and officer and/or director or trustee, as the case may be, of some of the other subsidiaries of Franklin Resources, Inc. and of 42 of the investment companies in Franklin Templeton Investments. |
| | | | |
Sheila Amoroso (1959) One Franklin Parkway San Mateo, CA 94403-1906 | | Vice President | | Since 1999 | | Not Applicable | | Not Applicable |
|
| Principal Occupation During at Least the Past 5 Years: |
Senior Vice President, Franklin Advisers, Inc.; and officer of seven of the investment companies in Franklin Templeton Investments. |
| | | | |
| 60 | | Annual Report | | franklintempleton.com |
FRANKLIN MUNICIPAL SECURITIES TRUST
Interested Board Members and Officers (continued)
| | | | | | | | |
Name, Year of Birth
and Address | | Position | | Length of
Time Served | | Number of Portfolios in
Fund Complex Overseen
by Board Member* | | Other Directorships Held
During at Least the Past 5 Years |
| | | | |
Alison E. Baur (1964) One Franklin Parkway San Mateo, CA 94403-1906 | | Vice President | | Since 2012 | | Not Applicable | | Not Applicable |
|
| Principal Occupation During at Least the Past 5 Years: |
Deputy General Counsel, Franklin Templeton Investments; and officer of some of the other subsidiaries of Franklin Resources, Inc. and of 45 of the investment companies in Franklin Templeton Investments. |
| | | | |
Rafael R. Costas, Jr. (1965) One Franklin Parkway San Mateo, CA 94403-1906 | | Vice President | | Since 1999 | | Not Applicable | | Not Applicable |
|
| Principal Occupation During at Least the Past 5 Years: |
Senior Vice President, Franklin Advisers, Inc.; and officer of seven of the investment companies in Franklin Templeton Investments. |
| | | | |
Gaston Gardey (1967) One Franklin Parkway San Mateo, CA 94403-1906 | | Chief Financial Officer, Chief Accounting Officer and Treasurer | | Since 2009 | | Not Applicable | | Not Applicable |
|
| Principal Occupation During at Least the Past 5 Years: |
Treasurer, U.S. Fund Administration & Reporting, Franklin Templeton Investments; and officer of 27 of the investment companies in Franklin Templeton Investments. |
| | | | |
Aliya S. Gordon (1973) One Franklin Parkway San Mateo, CA 94403-1906 | | Vice President | | Since 2009 | | Not Applicable | | Not Applicable |
|
| Principal Occupation During at Least the Past 5 Years: |
Senior Associate General Counsel, Franklin Templeton Investments; and officer of 45 of the investment companies in Franklin Templeton Investments. |
| | | | |
Steven J. Gray (1955) One Franklin Parkway San Mateo, CA 94403-1906 | | Vice President | | Since 2009 | | Not Applicable | | Not Applicable |
|
| Principal Occupation During at Least the Past 5 Years: |
Senior Associate General Counsel, Franklin Templeton Investments; Vice President, Franklin Templeton Distributors, Inc. and FT AlphaParity, LLC; and officer of 45 of the investment companies in Franklin Templeton Investments. |
| | | | |
Matthew T. Hinkle (1971) One Franklin Parkway San Mateo, CA 94403-1906 | | Chief Executive Officer – Finance and Administration | | Since June 2017 | | Not Applicable | | Not Applicable |
|
| Principal Occupation During at Least the Past 5 Years: |
Senior Vice President, U.S. Fund Administration Reporting & Fund Tax, Franklin Templeton Investments; officer of 45 of the investment companies in Franklin Templeton Investments; and formerly, Vice President, Global Tax (2012-April 2017) and Treasurer/Assistant Treasurer, Franklin Templeton Investments (2009-2017). |
| | | | |
Robert Lim (1948) One Franklin Parkway San Mateo, CA 94403-1906 | | Vice President – AML Compliance | | Since 2016 | | Not Applicable | | Not Applicable |
|
| Principal Occupation During at Least the Past 5 Years: |
Vice President, Franklin Templeton Companies, LLC; Chief Compliance Officer, Franklin Templeton Distributors, Inc. and Franklin Templeton Investor Services, LLC; and officer of 45 of the investment companies in Franklin Templeton Investments. |
| | | | | | |
| franklintempleton.com | | Annual Report | | | 61 | |
FRANKLIN MUNICIPAL SECURITIES TRUST
Interested Board Members and Officers (continued)
| | | | | | | | |
Name, Year of Birth
and Address | | Position | | Length of
Time Served | | Number of Portfolios in
Fund Complex Overseen
by Board Member* | | Other Directorships Held
During at Least the Past 5 Years |
| | | | |
Christopher J. Molumphy (1962) One Franklin Parkway San Mateo, CA 94403-1906 | | President and Chief Executive Officer – Investment Management | | Since 2010 | | Not Applicable | | Not Applicable |
|
| Principal Occupation During at Least the Past 5 Years: |
Director and Executive Vice President, Franklin Advisers, Inc.; Executive Vice President, Franklin Templeton Institutional, LLC; and officer of some of the other subsidiaries of Franklin Resources, Inc. and of 22 of the investment companies in Franklin Templeton Investments. |
| | | | |
Kimberly H. Novotny (1972) 300 S.E. 2nd Street Fort Lauderdale, FL 33301-1923 | | Vice President | | Since 2013 | | Not Applicable | | Not Applicable |
|
| Principal Occupation During at Least the Past 5 Years: |
Associate General Counsel, Franklin Templeton Investments; Vice President and Corporate Secretary, Fiduciary Trust International of the South; Vice President, Templeton Investment Counsel, LLC; Assistant Secretary, Franklin Resources, Inc.; and officer of 45 of the investment companies in Franklin Templeton Investments. |
| | | | |
Robert C. Rosselot (1960) 300 S.E. 2nd Street Fort Lauderdale, FL 33301-1923 | | Chief Compliance Officer | | Since 2013 | | Not Applicable | | Not Applicable |
|
| Principal Occupation During at Least the Past 5 Years: |
Director, Global Compliance, Franklin Templeton Investments; Vice President, Franklin Templeton Companies, LLC; officer of 45 of the investment companies in Franklin Templeton Investments; and formerly, Senior Associate General Counsel, Franklin Templeton Investments (2007-2013); and Secretary and Vice President, Templeton Group of Funds (2004-2013). |
| | | | |
Karen L. Skidmore (1952) One Franklin Parkway San Mateo, CA 94403-1906 | | Vice President and Secretary | | Since 2006 | | Not Applicable | | Not Applicable |
|
| Principal Occupation During at Least the Past 5 Years: |
Senior Associate General Counsel, Franklin Templeton Investments; and officer of 45 of the investment companies in Franklin Templeton Investments. |
| | | | |
Navid J. Tofigh (1972) One Franklin Parkway San Mateo, CA 94403-1906 | | Vice President | | Since 2015 | | Not Applicable | | Not Applicable |
|
| Principal Occupation During at Least the Past 5 Years: |
Associate General Counsel, Franklin Templeton Investments; and officer of 45 of the investment companies in Franklin Templeton Investments. |
| | | | |
Craig S. Tyle (1960) One Franklin Parkway San Mateo, CA 94403-1906 | | Vice President | | Since 2005 | | Not Applicable | | Not Applicable |
|
| Principal Occupation During at Least the Past 5 Years: |
General Counsel and Executive Vice President, Franklin Resources, Inc.; and officer of some of the other subsidiaries of Franklin Resources, Inc. and of 45 of the investment companies in Franklin Templeton Investments. |
| | | | |
Thomas Walsh (1961) One Franklin Parkway San Mateo, CA 94403-1906 | | Vice President | | Since 1999 | | Not Applicable | | Not Applicable |
|
| Principal Occupation During at Least the Past 5 Years: |
Senior Vice President, Franklin Advisers, Inc.; and officer of seven of the investment companies in Franklin Templeton Investments. |
| | | | |
| 62 | | Annual Report | | franklintempleton.com |
FRANKLIN MUNICIPAL SECURITIES TRUST
Interested Board Members and Officers (continued)
| | | | | | | | |
Name, Year of Birth
and Address | | Position | | Length of
Time Served | | Number of Portfolios in
Fund Complex Overseen
by Board Member* | | Other Directorships Held
During at Least the Past 5 Years |
| | | | |
Lori A. Weber (1964) 300 S.E. 2nd Street Fort Lauderdale, FL 33301-1923 | | Vice President | | Since 2011 | | Not Applicable | | Not Applicable |
|
| Principal Occupation During at Least the Past 5 Years: |
Senior Associate General Counsel, Franklin Templeton Investments; Assistant Secretary, Franklin Resources, Inc.; Vice President and Secretary, Templeton Investment Counsel, LLC; and officer of 45 of the investment companies in Franklin Templeton Investments. |
*We base the number of portfolios on each separate series of the U.S. registered investment companies within the Franklin Templeton Investments fund complex. These portfolios have a common investment manager or affiliated investment managers.
**Gregory E. Johnson is considered to be an interested person of the Fund under the federal securities laws due to his position as an officer and director of Franklin Resources, Inc. (Resources), which is the parent company of the Fund’s investment manager and distributor. Rupert H. Johnson, Jr. is considered to be an interested person of the Fund under the federal securities laws due to his position as officer and director and major shareholder of Resources.
Note 1: Rupert H. Johnson, Jr. is the uncle of Gregory E. Johnson.
Note 2: Officer information is current as of the date of this report. It is possible that after this date, information about officers may change.
Note 3: Effective November 1, 2016, Frank Olson ceased to be a trustee of the Trust.
The Sarbanes-Oxley Act of 2002 and Rules adopted by the Securities and Exchange Commission require the Fund to disclose whether the Fund’s Audit Committee includes at least one member who is an audit committee financial expert within the meaning of such Act and Rules. The Fund’s Board has determined that there is at least one such financial expert on the Audit Committee and has designated John B. Wilson as its audit committee financial expert. The Board believes that Mr. Wilson qualifies as such an expert in view of his extensive business background and experience, including service as chief financial officer of Staples, Inc. from 1992 to 1996. Mr. Wilson has been a Member and Chairman of the Fund’s Audit Committee since 2006. As a result of such background and experience, the Board believes that Mr. Wilson has acquired an understanding of generally accepted accounting principles and financial statements, the general application of such principles in connection with the accounting estimates, accruals and reserves, and analyzing and evaluating financial statements that present a breadth and level of complexity of accounting issues generally comparable to those of the Fund, as well as an understanding of internal controls and procedures for financial reporting and an understanding of audit committee functions. Mr. Wilson is an independent Board member as that term is defined under the relevant Securities and Exchange Commission Rules and Releases.
The Statement of Additional Information (SAI) includes additional information about the board members and is available, without charge, upon request. Shareholders may call (800) DIAL BEN/342-5236 to request the SAI.
| | | | | | |
| franklintempleton.com | | Annual Report | | | 63 | |
FRANKLIN MUNICIPAL SECURITIES TRUST
Shareholder Information
Board Approval of Investment Management Agreements
FRANKLIN MUNICIPAL SECURITIES TRUST
Franklin California High Yield Municipal Fund
Franklin Tennessee Municipal Bond Fund
(each a Fund)
At an in-person meeting held on February 28, 2017 (Meeting), the Board of Trustees (Board) of Franklin Municipal Securities Trust, including a majority of the trustees who are not “interested persons” as defined in the Investment Company Act of 1940 (Independent Trustees), reviewed and approved the continuance of the investment management agreement between Franklin Advisers, Inc. (Manager) and each Fund (each a Management Agreement) for an additional one-year period. The Independent Trustees received advice from and met separately with Independent Trustee counsel in considering whether to approve the continuation of each Management Agreement. Although the Management Agreements for the Funds were considered at the same Board meeting, the Board considered the information provided to it about the Funds together and with respect to each Fund separately as the Board deemed appropriate.
In considering the continuation of each Management Agreement, the Board reviewed and considered information provided by the Manager at the Meeting and throughout the year at meetings of the Board and its committees. The Board also reviewed and considered information provided in response to a detailed set of requests for information submitted to the Manager by Independent Trustee counsel on behalf of the Independent Trustees in connection with the annual contract renewal process. In addition, prior to the Meeting, the Independent Trustees held a telephonic contract renewal meeting at which the Independent Trustees conferred amongst themselves and Independent Trustee counsel about contract renewal matters. The Board reviewed and considered all of the factors it deemed relevant in approving the continuance of each Management Agreement, including, but not limited to: (i) the nature, extent, and quality of the services provided by the Manager; (ii) the investment performance of each Fund; (iii) the costs of the services provided and profits realized by the Manager and its affiliates from the relationship with each Fund; (iv) the extent to which economies of scale are realized as each Fund grows; and (v) whether fee levels reflect these economies of scale for the benefit of Fund investors.
In approving the continuance of each Management Agreement, the Board, including a majority of the Independent Trustees,
determined that the existing management fees are fair and reasonable and that the continuance of such Management Agreement is in the interests of the applicable Fund and its shareholders. While attention was given to all information furnished, the following discusses some primary factors relevant to the Board’s determination.
Nature, Extent and Quality of Services
The Board reviewed and considered information regarding the nature, extent and quality of investment management services provided by the Manager and its affiliates to the Funds and their shareholders. This information included, among other things, the qualifications, background and experience of the senior management and investment personnel of the Manager; the structure of investment personnel compensation; oversight of third-party service providers; investment performance reports and related financial information for each Fund; reports on expenses, shareholder services, marketing support payments made to financial intermediaries and third party servicing arrangements; legal and compliance matters; risk controls; pricing and other services provided by the Manager and its affiliates; and management fees charged by the Manager and its affiliates to U.S. funds and other accounts, including management’s explanation of differences among accounts where relevant. The Board noted management’s continual efforts and expenditures in establishing effective business continuity plans and developing strategies to address areas of heightened concern in the mutual fund industry, such as cybersecurity, derivatives and liquidity risk management.
The Board also reviewed and considered the benefits provided to Fund shareholders of investing in a fund that is part of the Franklin Templeton family of funds. The Board noted the financial position of Franklin Resources, Inc. (FRI), the Manager’s parent, and its commitment to the mutual fund business as evidenced by its continued introduction of new funds, reassessment of the fund offerings in response to the market environment and project initiatives and capital investments relating to the services provided to the Funds by the Franklin Templeton Investments (FTI) organization.
Following consideration of such information, the Board was satisfied with the nature, extent and quality of services provided by the Manager and its affiliates to the Funds and their shareholders.
Fund Performance
The Board reviewed and considered the performance results of each Fund over various time periods ended December 31, 2016. The Board considered the performance returns for each Fund in
| | | | |
| 64 | | Annual Report | | franklintempleton.com |
FRANKLIN MUNICIPAL SECURITIES TRUST
SHAREHOLDER INFORMATION
comparison to the performance returns of mutual funds deemed comparable to the Fund included in a universe (Performance Universe) selected by Broadridge Financial Solutions, Inc. (Broadridge), an independent provider of investment company data. The Board received a description of the methodology used by Broadridge to select the mutual funds included in a Performance Universe. The Board also reviewed and considered Fund performance reports provided and discussions that occurred with portfolio managers at Board meetings throughout the year. A summary of each Fund’s performance results is below.
Franklin California High Yield Municipal Fund - The Performance Universe for this Fund included the Fund and all retail and institutional California municipal debt funds. The Board noted that the Fund’s annualized income return and annualized total return for the one-, three-, five- and 10-year periods were above the medians of its Performance Universe. The Board concluded that the Fund’s performance was satisfactory.
Franklin Tennessee Municipal Bond Fund - The Performance Universe for this Fund included the Fund and all retail and institutional “other states” municipal debt funds. The Board noted that the Fund’s annualized income return for the one-, three-, five- and 10-year periods was above the median of its Performance Universe. The Board also noted that the Fund’s annualized total return for the one- and 10-year periods was above the median of its Performance Universe, but for the three- and five-year periods was below the median of its Performance Universe. Given the Fund’s income-oriented investment objective, the Board concluded that the Fund’s performance was satisfactory.
Comparative Fees and Expenses
The Board reviewed and considered information regarding each Fund’s actual total expense ratio and its various components, including, as applicable, management fees; transfer agent expenses; underlying fund expenses; Rule 12b-1 and non-Rule 12b-1 service fees; and other non-management fees. The Board also noted that at its February meeting each year, it receives an annual report on all marketing support payments made by FTI to financial intermediaries. The Board considered the actual total expense ratio and, separately, the contractual management fee rate, without the effect of fee waivers, if any (Management Rate) of each Fund in comparison to the median ratio and median Management Rate, respectively, of other mutual funds deemed comparable to and with a similar expense structure as the Fund selected by Broadridge (Expense Group).
Broadridge fee and expense data is based upon information taken from each fund’s most recent annual report, which reflects historical asset levels that may be quite different from those currently existing, particularly in a period of market volatility. While recognizing such inherent limitation and the fact that expense ratios and Management Rates generally increase as assets decline and decrease as assets grow, the Board believed the independent analysis conducted by Broadridge to be an appropriate measure of comparative fees and expenses. The Broadridge Management Rate includes administrative charges, and the actual total expense ratio, for comparative consistency, was shown for Class A shares for funds with multiple classes of shares. The Board received a description of the methodology used by Broadridge to select the mutual funds included in an Expense Group.
Franklin California High Yield Municipal Fund and Franklin Tennessee Municipal Bond Fund - The Expense Group for the Franklin California High Yield Municipal Fund included the Fund and nine other California municipal debt funds. The Expense Group for the Franklin Tennessee Municipal Bond Fund included the Fund and eight other “other states” municipal debt funds. The Board noted that the Management Rates for these Funds were above the medians of their respective Expense Groups, but their actual total expense ratios were below the medians and in the first quintile of their respective Expense Groups. The Board concluded that the Management Rates charged to these Funds are fair and reasonable.
Profitability
The Board reviewed and considered information regarding the profits realized by the Manager and its affiliates in connection with the operation of each Fund. In this respect, the Board considered the Fund profitability analysis provided by the Manager that addresses the overall profitability of FTI’s U.S. fund business, as well as its profits in providing investment management and other services to each of the individual funds during the 12-month period ended September 30, 2016, being the most recent fiscal year-end for FRI. The Board noted that although management continually makes refinements to its methodologies used in calculating profitability in response to organizational and product-related changes, the overall methodology has remained consistent with that used in the Funds’ profitability report presentations from prior years. Additionally, the Funds’ independent registered public accounting firm has been engaged by the Manager to periodically review the reasonableness of the allocation
| | | | | | |
| franklintempleton.com | | Annual Report | | | 65 | |
FRANKLIN MUNICIPAL SECURITIES TRUST
SHAREHOLDER INFORMATION
methodologies to be used solely by the Funds’ Board with respect to the profitability analysis.
The Board noted management’s belief that costs incurred in establishing the infrastructure necessary for the type of mutual fund operations conducted by the Manager and its affiliates may not be fully reflected in the expenses allocated to each Fund in determining its profitability, as well as the fact that the level of profits, to a certain extent, reflected operational cost savings and efficiencies initiated by management. The Board also noted management’s expenditures in improving shareholder services provided to the Funds, as well as the need to implement systems and meet additional regulatory and compliance requirements resulting from recent SEC and other regulatory requirements.
The Board also considered the extent to which the Manager and its affiliates might derive ancillary benefits from fund operations, including revenues generated from transfer agent services, potential benefits resulting from personnel and systems enhancements necessitated by fund growth, as well as increased leverage with service providers and counterparties. Based upon its consideration of all these factors, the Board concluded that the level of profits realized by the Manager and its affiliates from providing services to each Fund was not excessive in view of the nature, quality and extent of services provided to each Fund.
Economies of Scale
The Board reviewed and considered the extent to which the Manager may realize economies of scale, if any, as each Fund grows larger and whether the Fund’s management fee structure reflects any economies of scale for the benefit of shareholders. With respect to possible economies of scale, the Board noted the existence of management fee breakpoints, which operate generally to share any economies of scale with a Fund’s shareholders by reducing the Fund’s effective management fees as the Fund grows in size. The Board considered the Manager’s view that any analyses of potential economies of scale in managing a particular fund are inherently limited in light of the joint and common costs and investments the Manager incurs across the Franklin Templeton family of funds as a whole. The Board concluded that to the extent economies of scale may be realized by the Manager and its affiliates, each Fund’s management fee structure provided a sharing of benefits with the Fund and its shareholders as the Fund grows.
Conclusion
Based on its review, consideration and evaluation of all factors it believed relevant, including the above-described factors and
conclusions, the Board unanimously approved the continuation of each Management Agreement for an additional one-year period.
Proxy Voting Policies and Procedures
The Trust’s investment manager has established Proxy Voting Policies and Procedures (Policies) that the Trust uses to determine how to vote proxies relating to portfolio securities. Shareholders may view the Trust’s complete Policies online at franklintempleton.com. Alternatively, shareholders may request copies of the Policies free of charge by calling the Proxy Group collect at (954) 527-7678 or by sending a written request to: Franklin Templeton Companies, LLC, 300 S.E. 2nd Street, Fort Lauderdale, FL 33301, Attention: Proxy Group. Copies of the Trust’s proxy voting records are also made available online at franklintempleton.com and posted on the U.S. Securities and Exchange Commission’s website at sec.gov and reflect the most recent 12-month period ended June 30.
Quarterly Statement of Investments
The Trust files a complete statement of investments with the U.S. Securities and Exchange Commission for the first and third quarters for each fiscal year on Form N-Q. Shareholders may view the filed Form N-Q by visiting the Commission’s website at sec.gov. The filed form may also be viewed and copied at the Commission’s Public Reference Room in Washington, DC. Information regarding the operations of the Public Reference Room may be obtained by calling (800) SEC-0330.
Householding of Reports and Prospectuses
You will receive each Fund’s financial reports every six months as well as an annual updated summary prospectus (prospectus available upon request). To reduce Fund expenses, we try to identify related shareholders in a household and send only one copy of the financial reports and summary prospectus. This process, called “householding,” will continue indefinitely unless you instruct us otherwise. If you prefer not to have these documents householded, please call us at (800) 632-2301. At any time you may view current prospectuses/summary prospectuses and financial reports on our website. If you choose, you may receive these documents through electronic delivery.
| | | | |
| 66 | | Annual Report | | franklintempleton.com |
This page intentionally left blank.
This page intentionally left blank.
| | | | |
 | | | | Annual Report and Shareholder Letter Franklin Municipal Securities Trust |
| | | | Investment Manager Franklin Advisers, Inc. |
| | | | Distributor |
| | | | Franklin Templeton Distributors, Inc. (800) DIAL BEN® / 342-5236 franklintempleton.com |
| | | | Shareholder Services (800) 632-2301 |
Authorized for distribution only when accompanied or preceded by a summary prospectus and/or prospectus. Investors should carefully consider a fund’s investment goals, risks, charges and expenses before investing. A prospectus contains this and other information; please read it carefully before investing.
To help ensure we provide you with quality service, all calls to and from our service areas are monitored and/or recorded.
| | |
| © 2017 Franklin Templeton Investments. All rights reserved. | | MUN A 07/17 |
Item 2. Code of Ethics.
(a) The Registrant has adopted a code of ethics that applies to its principal executive officers and principal financial and accounting officer.
(c) N/A
(d) N/A
(f) Pursuant to Item 12(a)(1), the Registrant is attaching as an exhibit a copy of its code of ethics that applies to its principal executive officers and principal financial and accounting officer.
Item 3. Audit Committee Financial Expert.
(a)(1) The Registrant has an audit committee financial expert serving on its audit committee.
(2) The audit committee financial expert is John B. Wilson and he is “independent” as defined under the relevant Securities and Exchange Commission Rules and Releases.
Item 4. Principal Accountant Fees and Services.
(a) Audit Fees
The aggregate fees paid to the principal accountant for professional services rendered by the principal accountant for the audit of the registrant’s annual financial statements or for services that are normally provided by the principal accountant in connection with statutory and regulatory filings or engagements were $72,690 for the fiscal year ended May 31, 2017 and $78,227 for the fiscal year ended May 31, 2016.
(b) Audit-Related Fees
There were no fees paid to the principal accountant for assurance and related services rendered by the principal accountant to the registrant that are reasonably related to the performance of the audit of the registrant’s financial statements and are not reported under paragraph (a) of Item 4.
There were no fees paid to the principal accountant for assurance and related services rendered by the principal accountant to the registrant’s investment adviser and any entity controlling, controlled by or under common control with the investment adviser that provides ongoing services to the registrant that are reasonably related to the performance of the audit of their financial statements.
(c) Tax Fees
There were no fees paid to the principal accountant for professional services rendered by the principal accountant to the registrant for tax compliance, tax advice and tax planning.
There were no fees paid to the principal accountant for professional services rendered by the principal accountant to the registrant’s investment adviser and any entity controlling, controlled by or under common control with the investment adviser that provides ongoing services to the registrant for tax compliance, tax advice and tax planning.
(d) All Other Fees
There were no fees paid to the principal accountant for products and services rendered by the principal accountant to the registrant not reported in paragraphs (a)-(c) of Item 4 were $0 for the fiscal year ended May 31, 2017 and $957 for the fiscal year ended May 31, 2016. The services for which these fees were paid included review of materials provided to the fund Board in connection with the investment management contract renewal process.
The aggregate fees paid to the principal accountant for products and services rendered by the principal accountant to the registrant’s investment adviser and any entity controlling, controlled by or under common control with the investment adviser that provides ongoing services to the registrant other than services reported in paragraphs (a)-(c) of Item 4 were $255,000 for the fiscal year ended May 31, 2017 and $663,151 for the fiscal year ended May 31, 2016. The services for which these fees were paid included preparation and review of materials provided to the fund Board in connection with the investment management contract renewal process and derivatives assessment, and review of system processes related to fixed income securities.
(e) (1) The registrant’s audit committee is directly responsible for approving the services to be provided by the auditors, including:
(i) pre-approval of all audit and audit related services;
(ii) pre-approval of all non-audit related services to be provided to the Fund by the auditors;
(iii) pre-approval of all non-audit related services to be provided to the registrant by the auditors to the registrant’s investment adviser or to any entity that controls, is controlled by or is under common control with the registrant’s investment adviser and that provides ongoing services to the registrant where the non-audit services relate directly to the operations or financial reporting of the registrant; and
(iv) establishment by the audit committee, if deemed necessary or appropriate, as an alternative to committee pre-approval of services to be provided by the auditors, as required by paragraphs (ii) and (iii) above, of policies and procedures to permit such services to be pre-approved by other means, such as through establishment of guidelines or by action of a designated member or members of the committee; provided the policies and procedures are detailed as to the particular service and the committee is informed of each service and such policies and procedures do not include delegation of audit committee responsibilities, as contemplated under the Securities Exchange Act of 1934, to management; subject, in the case of (ii) through (iv), to any waivers, exceptions or exemptions that may be available under applicable law or rules.
(e) (2) None of the services provided to the registrant described in paragraphs (b)-(d) of Item 4 were approved by the audit committee pursuant to paragraph (c)(7)(i)(C) of Rule 2-01 of regulation S-X.
(f) No disclosures are required by this Item 4(f).
(g) The aggregate non-audit fees paid to the principal accountant for services rendered by the principal accountant to the registrant and the registrant’s investment adviser and any entity controlling, controlled by or under common control with the investment adviser that provides ongoing services to the registrant were $255,000 for the fiscal year ended May 31, 2017 and $664,108 for the fiscal year ended May 31, 2016.
(h) The registrant’s audit committee of the board has considered whether the provision of non-audit services that were rendered to the registrant’s investment adviser (not including any sub-adviser whose role is primarily portfolio management and is subcontracted with or overseen by another investment adviser), and any entity controlling, controlled by, or under common control with the investment adviser that provides ongoing services to the registrant that were not pre-approved pursuant to paragraph (c)(7)(ii) of Rule 2-01 of Regulation S-X is compatible with maintaining the principal accountant’s independence.
Item 5. Audit Committee of Listed Registrants. N/A
Item 6. Schedule of Investments. N/A
Item 7. Disclosure of Proxy Voting Policies and Procedures for Closed-End Management Investment Companies. N/A
Item 8. Portfolio Managers of Closed-End Management Investment Companies. N/A
Item 9. Purchases of Equity Securities by Closed-End Management Investment Company and Affiliated Purchasers. N/A
Item 10. Submission of Matters to a Vote of Security Holders.
There have been no changes to the procedures by which shareholders may recommend nominees to the Registrant’s Board of Trustees that would require disclosure herein.
Item 11. Controls and Procedures.
(a) Evaluation of Disclosure Controls and Procedures. The Registrant maintains disclosure controls and procedures that are designed to ensure that information required to be disclosed in the Registrant’s filings under the Securities Exchange Act of 1934 and the Investment Company Act of 1940 is recorded, processed, summarized and reported within the periods specified in the rules and forms of the Securities and Exchange Commission. Such information is accumulated and communicated to the Registrant’s management, including its principal executive officer and principal financial officer, as appropriate, to allow timely decisions regarding required disclosure. The Registrant’s management, including the principal executive officer and the principal financial officer, recognizes that any set of controls and procedures, no matter how well designed and operated, can provide only reasonable assurance of achieving the desired control objectives.
Within 90 days prior to the filing date of this Shareholder Report on Form N-CSR, the Registrant had carried out an evaluation, under the supervision and with the participation of the Registrant’s management, including the Registrant’s principal executive officer and the Registrant’s principal financial officer, of the effectiveness of the design and operation of the Registrant’s disclosure controls and procedures. Based on such evaluation, the Registrant’s principal executive officer and principal financial officer concluded that the Registrant’s disclosure controls and procedures are effective.
(b) Changes in Internal Controls. There have been no changes in the Registrant’s internal controls or in other factors that could materially affect the internal controls over financial reporting subsequent to the date of their evaluation in connection with the preparation of this Shareholder Report on Form N-CSR.
Item 12. Exhibits.
(a)(1) Code of Ethics
(a)(2) Certifications pursuant to Section 302 of the Sarbanes-Oxley Act of 2002 of Matthew T. Hinkle, Chief Executive Officer—Finance and Administration, and Gaston Gardey, Chief Financial Officer and Chief Accounting Officer
(b) Certifications pursuant to Section 906 of the Sarbanes-Oxley Act of 2002 of Matthew T. Hinkle, Chief Executive Officer—Finance and Administration, and Gaston Gardey, Chief Financial Officer and Chief Accounting Officer
SIGNATURES
Pursuant to the requirements of the Securities Exchange Act of 1934 and the Investment Company Act of 1940, the registrant has duly caused this report to be signed on its behalf by the undersigned, thereunto duly authorized.
| | |
| FRANKLIN MUNICIPAL SECURITIES TRUST |
| |
| By | | /s/ Matthew T. Hinkle |
| | Matthew T. Hinkle |
| | Chief Executive Officer - Finance and Administration |
| |
| Date | | July 27, 2017 |
Pursuant to the requirements of the Securities Exchange Act of 1934 and the Investment Company Act of 1940, this report has been signed below by the following persons on behalf of the registrant and in the capacities and on the dates indicated.
| | |
| By | | /s/ Matthew T. Hinkle |
| | Matthew T. Hinkle |
| | Chief Executive Officer - Finance and Administration |
| |
| Date | | July 27, 2017 |
| | |
| By | | /s/ Gaston Gardey |
| | Gaston Gardey |
| | Chief Financial Officer and Chief Accounting Officer |
| |
| Date | | July 27, 2017 |