UNITED STATES
SECURITIES AND EXCHANGE COMMISSION
Washington, DC 20549
FORM N-CSR
CERTIFIED SHAREHOLDER REPORT OF REGISTERED MANAGEMENT INVESTMENT COMPANIES
Investment Company Act file number 811-06481
Franklin Municipal Securities Trust
(Exact name of registrant as specified in charter)
One Franklin Parkway, San Mateo, CA 94403-1906
(Address of principal executive offices) (Zip code)
Craig S. Tyle, One Franklin Parkway, San Mateo, CA 94403-1906
(Name and address of agent for service)
Registrant's telephone number, including area code: 650 312-2000
Date of fiscal year end: 5/31
Date of reporting period: 5/31/15
Item 1. Reports to Stockholders.
Franklin Templeton Investments
Gain From Our Perspective®
At Franklin Templeton Investments, we’re dedicated to one goal: delivering exceptional asset management for our clients. By bringing together multiple, world-class investment teams in a single firm, we’re able to offer specialized expertise across styles and asset classes, all supported by the strength and resources of one of the world’s largest asset managers. This has helped us to become a trusted partner to individual and institutional investors across the globe.
Focus on Investment Excellence
At the core of our firm, you’ll find multiple independent investment teams—each with a focused area of expertise—from traditional to alternative strategies and multi-asset solutions. And because our portfolio groups operate autonomously, their strategies can be combined to deliver true style and asset class diversification.
All of our investment teams share a common commitment to excellence grounded in rigorous, fundamental research and robust, disciplined risk management. Decade after decade, our consistent, research-driven processes have helped Franklin Templeton earn an impressive record of strong, long-term results.
Global Perspective Shaped by Local Expertise
In today’s complex and interconnected world, smart investing demands a global perspective. Franklin Templeton pioneered international investing over 60 years ago, and our expertise in emerging markets spans more than a quarter of a century. Today, our investment professionals are on the ground across the globe, spotting investment ideas and potential risks firsthand. These locally based teams bring in-depth understanding of local companies, economies and cultural nuances, and share their best thinking across our global research network.
Strength and Experience
Franklin Templeton is a global leader in asset management serving clients in over 150 countries.1 We run our business with the same prudence we apply to asset management, staying focused on delivering relevant investment solutions, strong long-term results and reliable, personal service. This approach, focused on putting clients first, has helped us to become one of the most trusted names in financial services.
1. As of 12/31/14. Clients are represented by the total number of shareholder accounts.
Not FDIC Insured | May Lose Value | No Bank Guarantee
| |
| Contents | |
| |
| Annual Report | |
| Municipal Bond Market Overview | 3 |
| Franklin California | |
| High Yield Municipal Fund | 4 |
| Franklin Tennessee | |
| Municipal Bond Fund | 12 |
| Financial Highlights and | |
| Statements of Investments | 18 |
| Financial Statements | 37 |
| Notes to Financial Statements | 40 |
| Report of Independent Registered | |
| Public Accounting Firm | 49 |
| Tax Information | 50 |
| Board Members and Officers | 51 |
| Shareholder Information | 56 |
franklintempleton.com
1
Annual Report
Municipal Bond Market Overview
Despite more than $350 billion in issuance during the 12 months ended May 31, 2015,1 municipal bonds performed well as evidenced by the +3.18% total return of the Barclays Municipal Bond Index, which tracks investment-grade municipal securities.2 In comparison, the Barclays U.S. Treasury Index posted a +3.07% total return for the same period.2 The municipal bond market benefited from a combination of healthy positive cash flows and a large number of bonds that were redeemed during the period. In the municipal bond market, $320 billion in bonds were either called or matured, which brought net new issuance to just $30 billion for the reporting period.1
October 2014 marked the end of the Federal Reserve Board’s (Fed’s) bond buying program, which began in 2009. In sharp contrast to 2013 when the Fed changed the extent of its bond buying program, the Fed was consistent with tapering and ended the program during the reporting period, which seemed to reduce financial market volatility. Confidence in an orderly tapering led investors to purchase municipal securities through municipal bond mutual funds. According to the Investment Company Institute, municipal bond fund flows were positive for the reporting period. Furthermore, as a result of investor confidence, bonds with longer maturities generally outperformed bonds with shorter maturities. In addition, bonds with lower ratings generally outperformed those with higher ratings.
For most of the reporting period, the economy grew moderately, amid continued manufacturing and services sector expansion, but it slowed during 2015’s first quarter, resulting largely from harsh weather, labor disruptions and reduced business and government spending. The unemployment rate declined from 6.3% in May 2014 to 5.5% in May 2015, while inflation remained benign.3 Of the Fed’s two mandates, facilitating maximum employment and controlling inflation, the Fed has appeared to be more concerned with the former, seeking to foster greater economic growth. In the Fed’s March policy statement, Fed Chair Janet Yellen removed the word “patient” in relation to raising the target rate. Despite removing this word, the Fed reaffirmed its commitment to keeping interest rates lower than what it views as normal and kept its target rate at 0%–0.25%.
On June 28, 2014, Puerto Rico Governor Alejandro Garcia Padilla signed into law the Public Corporation Debt Enforcement and Recovery Act. By virtue of its status as a U.S. territory, Puerto Rico, as well as its public agencies, corporations and cities, is not currently eligible to file for bankruptcy under chapter 9 of the U.S. Bankruptcy Code. The governor’s stated intent for this law was to provide an organized, legal framework for Puerto Rico’s public corporations to restructure their debt should they become insolvent. With passage of the act, the market anticipated a significant likelihood that at least one of Puerto Rico’s public corporations would file for bankruptcy under the new act. Franklin Templeton Investments joined in a lawsuit filed in Puerto Rico challenging the constitutionality of the act. On February 6, 2015, a federal judge ruled that Puerto Rico’s Public Corporation Debt Enforcement and Recovery Act was unconstitutional. As expected, Puerto Rico appealed the ruling on February 10, 2015, and a hearing was held in May 2015, with a ruling expected in the near future. The February 6 ruling led to price volatility among several Puerto Rico municipal bond issues.
The ruling also prompted independent credit rating agencies Standard & Poor’s (S&P), Moody’s Investors Service and Fitch Ratings to further lower Puerto Rico’s general obligation debt rating, which was already below investment grade. Correspondingly, ratings on several other Puerto Rico credits were cut. With further uncertainty regarding Puerto Rico’s financial position and its potential effect on other Puerto Rico bonds, S&P reduced Puerto Rico credit ratings again in April, as did Moody’s in May.
In addition, Franklin Templeton is a member of a creditors committee made up of bondholders of the Puerto Rico Electric Power Authority (PREPA) with the goal of achieving a negotiated market-based, long-term solution to PREPA’s liquidity and structural issues.
At period-end, we maintained our positive view of the municipal bond market. We believe municipal bonds continue to be an attractive asset class among fixed income securities, and we intend to follow our solid discipline of investing to maximize income while seeking value in the municipal bond market.
The foregoing information reflects our analysis, opinions and portfolio holdings as of May 31, 2015, the end of the reporting period. The way we implement our main investment strategies and the resulting portfolio holdings may change depending on factors such as market and economic conditions. These opinions may not be relied upon as investment advice or an offer for a particular security. The information is not a complete analysis of every aspect of any market, state, industry, security or fund. Statements of fact are from sources considered reliable, but the investment manager makes no representation or warranty as to their completeness or accuracy. Although historical performance is no guarantee of future results, these insights may help you understand our investment management philosophy.
1. Source: Goldman Sachs Securities Division, Bloomberg.
2. Source: Morningstar.
3. Source: Bureau of Labor Statistics.
See www.franklintempletondatasources.com for additional data provider information.
franklintempleton.com
Annual Report
| 3
Franklin California High Yield Municipal Fund
We are pleased to bring you Franklin California High Yield Municipal Fund’s annual report for the fiscal year ended May 31, 2015.
Your Fund’s Goals and Main Investments
The Fund seeks to provide a high level of income exempt from federal and California personal income taxes by investing at least 80% of its net assets in municipal securities in any rating category, including higher yielding, lower rated securities, that pay interest free from such taxes.1 Its secondary goal is capital appreciation to the extent possible and consistent with its principal goal.
| | |
| Credit Quality Breakdown* | | |
| 5/31/15 | | |
| | % of Total | |
| Ratings | Long-Term Investments | |
| AAA | 1.11 | % |
| AA | 19.41 | % |
| A | 25.36 | % |
| BBB | 14.40 | % |
| Below Investment Grade | 17.19 | % |
| Refunded | 1.94 | % |
| Not Rated | 20.59 | % |
*Securities, except for those labeled Not Rated, are assigned ratings by one or
more Nationally Recognized Statistical Credit Rating Organizations (NRSROs),
such as Standard & Poor’s, Moody’s and Fitch, that can be considered by the
investment manager as part of its independent securities analysis. When ratings
from multiple agencies are available, the highest is used, consistent with the
portfolio investment process. Ratings reflect an NRSRO’s opinion of an issuer’s
creditworthiness and typically range from AAA or Aaa (highest) to D (lowest).
The Below Investment Grade category consists of bonds rated below BBB-. The
Refunded category generally consists of refunded bonds secured by U.S. govern-
ment or other high-quality securities. The Not Rated category consists of ratable
securities that have not been rated by an NRSRO. Cash and equivalents (defined
as bonds with stated maturities, or redemption features, of seven days or less), as
well as short-term bonds (defined as bonds maturing in more than seven days but
less than one year), are excluded from this breakdown.
Performance Overview
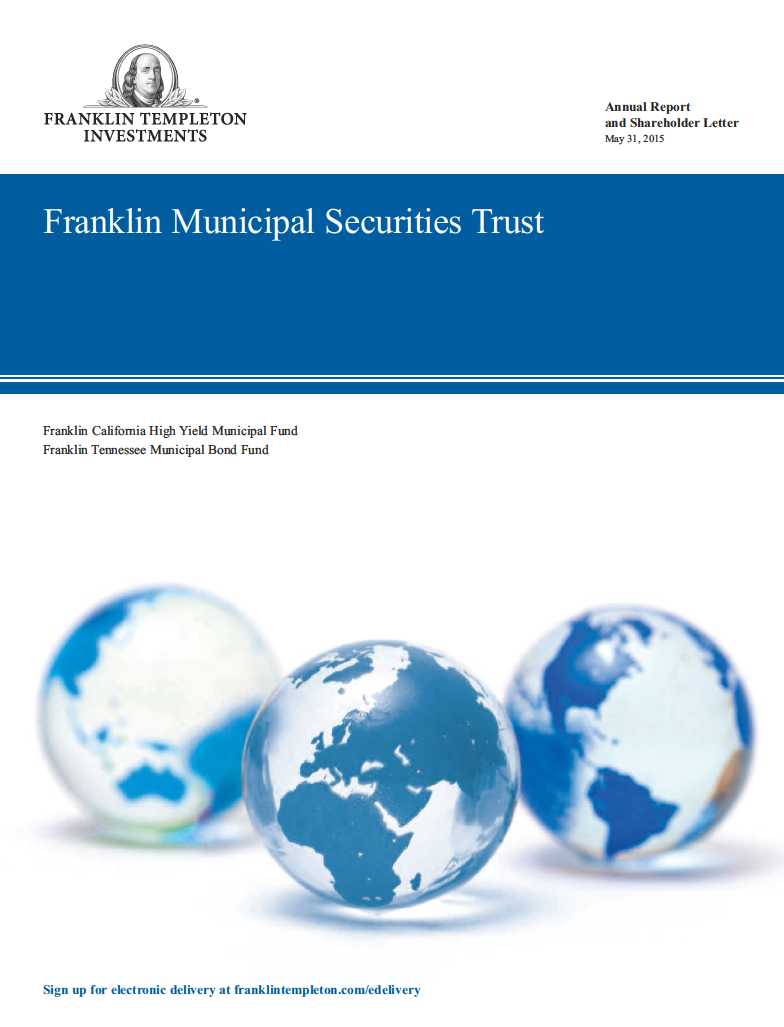
The Fund’s Class A share price, as measured by net asset value, increased from $10.42 on May 31, 2014, to $10.65 on May 31, 2015. The Fund’s Class A shares paid dividends totaling 45.10 cents per share for the reporting period.2 The Performance Summary beginning on page 7 shows that at the end of this reporting period the Fund’s Class A shares’ distribution rate was 3.88% based on an annualization of May’s 3.60 cent per share monthly dividend and the maximum offering price of $11.12 on May 31, 2015. An investor in the 2015 maximum combined effective federal and California personal income tax bracket of 50.83% (including 3.8% Medicare tax) would need to earn a distribution rate of 7.89% from a taxable investment to match the Fund’s Class A tax-free distribution rate. For the Fund’s Class C and Advisor shares’ performance, please see the Performance Summary. Dividend distributions were affected by lower interest rates during the period. This and other factors resulted in reduced income for the portfolio and caused dividends to be lower at the end of the period.
Performance data represent past performance, which does not guarantee future results. Investment return and principal value will fluctuate, and you may have a gain or loss when you sell your shares. Current performance may differ from figures shown. Please visit franklintempleton.com or call (800) 342-5236 for most recent month-end performance.
| | | |
| Dividend Distributions* | | |
| 6/1/14–5/31/15 | | | |
| | Dividend per Share (cents) |
| Month | Class A | Class C | Advisor Class |
| June | 4.05 | 3.57 | 4.13 |
| July | 4.00 | 3.52 | 4.08 |
| August | 3.95 | 3.47 | 4.03 |
| September | 3.95 | 3.48 | 4.03 |
| October | 3.85 | 3.38 | 3.93 |
| November | 3.70 | 3.23 | 3.78 |
| December | 3.60 | 3.11 | 3.69 |
| January | 3.60 | 3.11 | 3.69 |
| February | 3.60 | 3.11 | 3.69 |
| March | 3.60 | 3.10 | 3.73 |
| April | 3.60 | 3.10 | 3.73 |
| May | 3.60 | 3.10 | 3.73 |
| Total | 45.10 | 39.28 | 46.24 |
*Assumes shares were purchased and held for the entire accrual period. Since
dividends accrue daily, your actual distributions will vary depending on the date
you purchased your shares and any account activity. All Fund distributions will
vary depending upon current market conditions, and past distributions are not
indicative of future trends.
1. The Fund may invest up to 100% of its assets in bonds whose interest payments are subject to federal alternative minimum tax. All or a significant portion of the income
on these obligations may be subject to such tax. Distributions of capital gains are generally taxable. To avoid imposition of 28% backup withholding on all Fund distributions
and redemption proceeds, U.S. investors must be properly certified on Form W-9 and non-U.S. investors on Form W-8BEN.
2. All Fund distributions will vary depending upon current market conditions, and past distributions are not indicative of future trends.
The dollar value, number of shares or principal amount, and names of all portfolio holdings are listed in the Fund’s Statement of Investments (SOI).
The SOI begins on page 21.
4 | Annual Report
franklintempleton.com
FRANKLIN CALIFORNIA HIGH YIELD MUNICIPAL FUND
State Update
California’s large, diverse economy strengthened during the Fund’s fiscal year. Employment grew at a faster rate than the nation’s, with widespread gains, particularly in key services sectors such as professional and business services and education and health services. These gains led the state’s unemployment rate to decline from 7.6% in May 2014 to a seven-year low of 6.3% in April 2015.3 The unemployment rate was 6.4% at period-end, compared with the 5.5% national average.3 The real estate market strengthened as existing home sales and prices increased, notably in the San Francisco area, and issuance of residential and non-residential building permits also increased. The state’s economic advantages included prominent universities and businesses in innovative sectors, which helped attract venture capital. California’s average personal income grew faster than the national average.
The state closed fiscal year 2014 (ended June 30) with a positive general fund cash balance for the first time since 2007, resulting from greater-than-projected tax revenues. The enacted fiscal year 2015 budget assumed continued economic recovery and steady revenue gains. Furthermore, it was designed to make additional payments to budgetary debt, fully pay off economic recovery bonds initially issued in response to the 2003–2004 budget crisis, and leave a sizable general fund balance to be used largely for the state’s rainy day fund. In September 2014, the state made a deposit to the budget stabilization account for the first time in several years. After the governor’s fiscal year 2016 budget proposal was released in January, California’s economy strengthened and revenues surged, prompting revisions to fiscal years 2015 and 2016 revenue estimates. Under Proposition 2, the windfall from capital gains tax collections will be used to pay down the state’s debt and liabilities and make an additional deposit to the rainy day fund. The revised budget proposal would increase general fund spending for K-12 schools and community colleges, create the first-ever California earned income credit to assist the state’s lowest income workers, maintain California undergraduate students’ current tuition levels for two more years, provide health care and other safety net services to currently undocumented immigrants who gain permanent residence, and increase funding to address the impacts of a severe drought.
| | |
| Portfolio Breakdown | | |
| 5/31/15 | | |
| | % of Total | |
| | Long-Term Investments* | |
| Tax-Supported | 28.8 | % |
| General Obligation | 17.4 | % |
| Transportation | 15.2 | % |
| Hospital & Health Care | 13.6 | % |
| Utilities | 7.9 | % |
| Subject to Government Appropriations | 4.6 | % |
| Other Revenue | 3.6 | % |
| Higher Education | 3.4 | % |
| Refunded | 2.9 | % |
| Housing | 2.4 | % |
| Corporate-Backed | 0.2 | % |
*Does not include short-term investments and other net assets.
California’s net tax-supported debt was $2,407 per capita and 5.1% of personal income, compared with the $1,012 and 2.5% national medians.4 Independent credit rating agency Moody’s Investors Service assigned California’s general obligation bonds an Aa3 rating with a stable outlook.5 The rating and outlook reflected Moody’s view of the state’s rapidly improving financial position, high but declining debt, adjusted net pension liability ratios that were close to the state median, strong liquidity and robust employment growth. Additionally, Moody’s cited the state’s large and diverse economy, high wealth, significant improvement in budget deficits and governance improvement that led to on-time budget enactments in recent years. However, Moody’s noted some challenges, including California’s highly volatile revenue structure, super-majority requirement to raise taxes that make it difficult to respond to revenue volatility, lack of significant reserves to cushion state finances from future downturns, and the continued impact of past reliance on deficit borrowing and other one-time solutions to resolve prior years’ budgetary gaps.
Investment Strategy
We use a consistent, disciplined strategy in an effort to maximize tax-exempt income for our shareholders while balancing risk and return within the Fund’s range of allowable investments.
3. Source: Bureau of Labor Statistics.
4. Source: Moody’s Investors Service, State Debt Medians 2015: Total Debt Falls for First Time in Almost 30 Years, 6/24/15.
5. This does not indicate Moody’s rating of the Fund.
See www.franklintempletondatasources.com for additional data provider information.
franklintempleton.com
Annual Report
| 5
FRANKLIN CALIFORNIA HIGH YIELD MUNICIPAL FUND
We generally employ a buy-and-hold approach and invest in securities we believe should provide the most relative value in the market. We do not use leverage or derivatives, nor do we use hedging techniques that could add volatility and contribute to underperformance in adverse markets.
Manager’s Discussion
Consistent with our strategy, we sought to remain invested in bonds that maintain an average weighted maturity of 15 to 30 years with good call features. Based on the combination of our value-oriented philosophy of investing primarily for income and a positively sloping municipal yield curve, in which interest rates for longer term bonds are higher than those for shorter term bonds, we favored the use of longer term bonds. We believe our conservative, buy-and-hold investment strategy can help us achieve high, current, tax-free income for shareholders.
Puerto Rico’s municipal bond market is widely traded because of its federal and state tax-exemption advantages. After Puerto Rico enacted legislation in June 2014 related to bankruptcy protection for public corporations, Standard & Poor’s, Moody’s and Fitch downgraded ratings of Puerto Rico and many of its public corporations and authorities, which were already below investment grade. In February 2015, after a federal judge ruled the legislation unconstitutional, the rating agencies downgraded
Puerto Rico’s general obligation bond rating even further. The Fund is not required to sell securities that have been downgraded to below investment grade, and may invest in municipal securities in any rating category. Rating actions combined with news related to the commonwealth’s financial position and future financing endeavors caused the Puerto Rico bond market to experience volatility during the reporting period.
Thank you for your continued participation in Franklin California High Yield Municipal Fund. We look forward to serving your future investment needs.
The foregoing information reflects our analysis, opinions and portfolio holdings as of May 31, 2015, the end of the reporting period. The way we implement our main investment strategies and the resulting portfolio holdings may change depending on factors such as market and economic conditions. These opinions may not be relied upon as investment advice or an offer for a particular security. The information is not a complete analysis of every aspect of any market, state, industry, security or the Fund. Statements of fact are from sources considered reliable, but the investment manager makes no representation or warranty as to their completeness or accuracy. Although historical performance is no guarantee of future results, these insights may help you understand our investment management philosophy.
6 | Annual Report
franklintempleton.com
FRANKLIN CALIFORNIA HIGH YIELD MUNICIPAL FUND
Performance Summary as of May 31, 2015
Your dividend income will vary depending on dividends or interest paid by securities in the Fund’s portfolio, adjusted for operating expenses of each class. Capital gain distributions are net profits realized from the sale of portfolio securities. The performance tables and graphs do not reflect any taxes that a shareholder would pay on Fund dividends, capital gain distributions, if any, or any realized gains on the sale of Fund shares. Total return reflects reinvestment of the Fund’s dividends and capital gain distributions, if any, and any unrealized gains or losses.
| | | | | |
| Net Asset Value | | | | | |
| Share Class (Symbol) | | 5/31/15 | | 5/31/14 | Change |
| A (FCAMX) | $ | 10.65 | $ | 10.42 | +$0.23 |
| C (FCAHX) | $ | 10.72 | $ | 10.49 | +$0.23 |
| Advisor (FVCAX) | $ | 10.67 | $ | 10.44 | +$0.23 |
| |
| |
| Distributions (6/1/14–5/31/15) | | | | | |
| Dividend |
| Share Class | | Income | | | |
| A | $ | 0.4510 | | | |
| C | $ | 0.3928 | | | |
| Advisor | $ | 0.4624 | | | |
franklintempleton.com
Annual Report
| 7
FRANKLIN CALIFORNIA HIGH YIELD MUNICIPAL FUND
PERFORMANCE SUMMARY
Performance as of 5/31/15
Cumulative total return excludes sales charges. Average annual total returns include maximum sales charges. Class A: 4.25% maximum initial sales charge; Class C: 1% contingent deferred sales charge in first year only; Advisor Class: no sales charges.
| | | | | | | | |
| | Cumulative | | Average Annual | | Average Annual | | Total Annual | |
| Share Class | Total Return1 | | Total Return2 | | Total Return (6/30/15)3 | | Operating Expenses4 | |
| A | | | | | | | 0.63 | % |
| 1-Year | +6.63 | % | +2.12 | % | +1.86 | % | | |
| 5-Year | +43.61 | % | +6.57 | % | +6.43 | % | | |
| 10-Year | +68.02 | % | +4.87 | % | +4.72 | % | | |
| C | | | | | | | 1.18 | % |
| 1-Year | +6.01 | % | +5.01 | % | +4.78 | % | | |
| 5-Year | +39.71 | % | +6.92 | % | +6.78 | % | | |
| 10-Year | +59.11 | % | +4.75 | % | +4.61 | % | | |
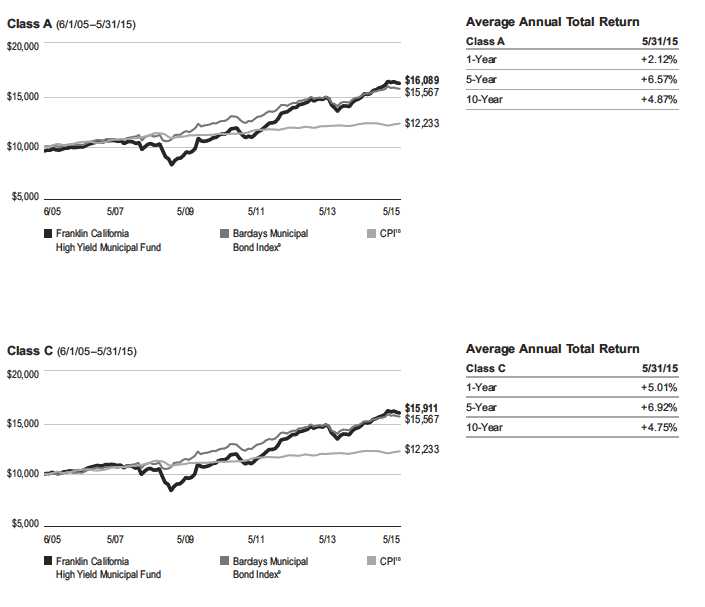
| Advisor5 | | | | | | | 0.53 | % |
| 1-Year | +6.73 | % | +6.73 | % | +6.50 | % | | |
| 5-Year | +44.24 | % | +7.60 | % | +7.48 | % | | |
| 10-Year | +69.67 | % | +5.43 | % | +5.28 | % | | |
| |
| |
| | Distribution | | Taxable Equivalent | �� | 30-Day | | Taxable Equivalent 30-Day | |
| Share Class | Rate6 | | Distribution Rate7 | | Standardized Yield8 | | Standardized Yield7 | |
| A | 3.88 | % | 7.89 | % | 3.04 | % | 6.18 | % |
| C | 3.47 | % | 7.06 | % | 2.60 | % | 5.29 | % |
| Advisor | 4.19 | % | 8.52 | % | 3.27 | % | 6.65 | % |
Performance data represent past performance, which does not guarantee future results. Investment return and principal value will fluctuate, and you may have a gain or loss when you sell your shares. Current performance may differ from figures shown. For most recent month-end performance, go to franklintempleton.com or call (800) 342-5236.
8 | Annual Report
franklintempleton.com
FRANKLIN CALIFORNIA HIGH YIELD MUNICIPAL FUND
PERFORMANCE SUMMARY
Total Return Index Comparison for a Hypothetical $10,000 Investment
Total return represents the change in value of an investment over the periods shown. It includes any applicable maximum sales charge, Fund expenses, account fees and reinvested distributions. The unmanaged index includes reinvestment of any income or distributions. It differs from the Fund in composition and does not pay management fees or expenses. One cannot invest directly in an index.
franklintempleton.com
Annual Report
| 9
FRANKLIN CALIFORNIA HIGH YIELD MUNICIPAL FUND
PERFORMANCE SUMMARY
Total Return Index Comparison for a Hypothetical $10,000 Investment (continued)
All investments involve risks, including possible loss of principal. Because municipal bonds are sensitive to interest rate movements, the Fund’s yield and share price will fluctuate with market conditions. Bond prices generally move in the opposite direction of interest rates. Thus, as prices of bonds in the Fund adjust to a rise in interest rates, the Fund’s share price may decline. Because the Fund invests principally in a single state, it is subject to greater risk of adverse economic and regulatory changes in that state than a geographically diversified fund. Investments in lower rated bonds include higher risk of default and loss of principal. The Fund holds a small portion of its assets in Puerto Rico municipal bonds that have been impacted by recent adverse economic and market changes, which may cause the Fund’s share price to decline. Changes in the credit rating of a bond, or in the credit rating or financial strength of a bond’s issuer, insurer or guarantor, may affect the bond’s value. The Fund may invest a significant part of its assets in municipal securities that finance similar types of projects, such as utilities, hospitals, higher education and transportation. A change that affects one project would likely affect all similar projects, thereby increasing market risk. The Fund is actively managed but there is no guarantee that the manager’s investment decisions will produce the desired results. The Fund’s prospectus also includes a description of the main investment risks.
| |
| Class C: | These shares have higher annual fees and expenses than Class A shares. |
| Advisor Class: | Shares are available to certain eligible investors as described in the prospectus. |
1. Cumulative total return represents the change in value of an investment over the periods indicated.
2. Average annual total return represents the average annual change in value of an investment over the periods indicated.
3. In accordance with SEC rules, we provide standardized average annual total return information through the latest calendar quarter.
4. Figures are as stated in the Fund’s current prospectus. In periods of market volatility, assets may decline significantly, causing total annual Fund operating expenses
to become higher than the figures shown.
5. Effective 11/15/06, the Fund began offering Advisor class shares, which do not have sales charges or a Rule 12b-1 plan. Performance quotations for this class reflect
the following methods of calculation: (a) For periods prior to 11/15/06, a restated figure is used based upon the Fund’s Class A performance, excluding the effect of
Class A’s maximum initial sales charge, but reflecting the effect of the Class A Rule 12b-1 fees; and (b) for periods after 11/15/06, actual Advisor class performance is
used reflecting all charges and fees applicable to that class. Since 11/15/06 (commencement of sales), the cumulative and average annual total returns of Advisor Class
shares were +56.14% and +5.36%.
6. Distribution rate is based on an annualization of the respective class’s May dividend and the maximum offering price (NAV for Classes C and Advisor) per share on
5/31/15.
7. Taxable equivalent distribution rate and yield assume the published rates as of 12/29/14 for the maximum combined effective federal and California state personal income
tax bracket of 50.83%, based on the federal income tax rate of 39.60% plus 3.8% Medicare tax. This combined rate does not consider the impact of California’s surcharge
on taxable income in excess of $1 million.
8. The 30-day standardized yield for the 30 days ended 5/31/15 reflects an estimated yield to maturity (assuming all portfolio securities are held to maturity). It should be
regarded as an estimate of the Fund’s rate of investment income, and it may not equal the Fund’s actual income distribution rate (which reflects the Fund’s past dividends
paid to shareholders) or the income reported in the Fund’s financial statements.
9. Source: Morningstar. The Barclays Municipal Bond Index is a market value-weighted index engineered for the long-term tax-exempt bond market. To be included in the
index, bonds must be fixed rate, have at least one year to final maturity and be rated investment grade (Baa3/BBB- or higher) by at least two of the following agencies:
Moody’s, S&P and Fitch.
10. Source: Bureau of Labor Statistics, bls.gov/cpi. The CPI is a commonly used measure of the inflation rate.
See www.franklintempletondatasources.com for additional data provider information.
10 | Annual Report
franklintempleton.com
FRANKLIN CALIFORNIA HIGH YIELD MUNICIPAL FUND
Your Fund’s Expenses
As a Fund shareholder, you can incur two types of costs:
- Transaction costs, including sales charges (loads) on Fund purchases; and
- Ongoing Fund costs, including management fees, distribu- tion and service (12b-1) fees, and other Fund expenses. All mutual funds have ongoing costs, sometimes referred to as operating expenses.
The following table shows ongoing costs of investing in the Fund and can help you understand these costs and compare them with those of other mutual funds. The table assumes a $1,000 investment held for the six months indicated.
Actual Fund Expenses
The first line (Actual) for each share class listed in the table provides actual account values and expenses. The “Ending Account Value” is derived from the Fund’s actual return, which includes the effect of Fund expenses.
You can estimate the expenses you paid during the period by following these steps. Of course, your account value and expenses will differ from those in this illustration:
| 1. | Divide your account value by $1,000. |
| | If an account had an $8,600 value, then $8,600 ÷ $1,000 = 8.6. |
| 2. | Multiply the result by the number under the heading “Expenses Paid During Period.” |
| | If Expenses Paid During Period were $7.50, then 8.6 x $7.50 = $64.50. |
In this illustration, the estimated expenses paid this period are $64.50.
Hypothetical Example for Comparison with Other Funds
Information in the second line (Hypothetical) for each class in the table can help you compare ongoing costs of investing in the Fund with those of other mutual funds. This information may not be used to estimate the actual ending account balance or expenses you paid during the period. The hypothetical “Ending Account Value” is based on the actual expense ratio for each class and an assumed 5% annual rate of return before expenses, which does not represent the Fund’s actual return. The figure under the heading “Expenses Paid During Period” shows the hypothetical expenses your account would have incurred under this scenario. You can compare this figure with the 5% hypothetical examples that appear in shareholder reports of other funds.
Please note that expenses shown in the table are meant to highlight ongoing costs and do not reflect any transaction costs, such as sales charges. Therefore, the second line for each class is useful in comparing ongoing costs only, and will not help you compare total costs of owning different funds. In addition, if transaction costs were included, your total costs would have been higher. Please refer to the Fund prospectus for additional information on operating expenses.
| | | | | | |
| | | Beginning Account | | Ending Account | | Expenses Paid During |
| Share Class | | Value 12/1/14 | | Value 5/31/15 | | Period* 12/1/14–5/31/15 |
| A | | | | | | |
| Actual | $ | 1,000 | $ | 1,022.10 | $ | 3.18 |
| Hypothetical (5% return before expenses) | $ | 1,000 | $ | 1,021.79 | $ | 3.18 |
| C | | | | | | |
| Actual | $ | 1,000 | $ | 1,019.20 | $ | 5.94 |
| Hypothetical (5% return before expenses) | $ | 1,000 | $ | 1,019.05 | $ | 5.94 |
| Advisor | | | | | | |
| Actual | $ | 1,000 | $ | 1,022.70 | $ | 2.67 |
| Hypothetical (5% return before expenses) | $ | 1,000 | $ | 1,022.29 | $ | 2.67 |
*Expenses are calculated using the most recent six-month expense ratio, annualized for each class (A: 0.63%; C: 1.18%; and Advisor: 0.53%),
multiplied by the average account value over the period, multiplied by 182/365 to reflect the one-half year period.
franklintempleton.com
Annual Report
| 11
Franklin Tennessee Municipal Bond Fund
This annual report for Franklin Tennessee Municipal Bond Fund covers the fiscal year ended May 31, 2015.
Your Fund’s Goal and Main Investments
The Fund seeks to maximize income exempt from federal and Tennessee personal income taxes, consistent with prudent investing and the preservation of capital, by investing at least 80% of its net assets in investment grade municipal securities that pay interest free from such taxes.1
| | |
| Credit Quality Breakdown* | | |
| 5/31/15 | | |
| | % of Total | |
| Ratings | Long-Term Investments | |
| AAA | 2.95 | % |
| AA | 61.99 | % |
| A | 12.15 | % |
| BBB | 4.06 | % |
| Below Investment Grade | 5.52 | % |
| Refunded | 11.42 | % |
| Not Rated | 1.91 | % |
*Securities, except for those labeled Not Rated, are assigned ratings by one or
more Nationally Recognized Statistical Credit Rating Organizations (NRSROs),
such as Standard & Poor’s, Moody’s and Fitch, that can be considered by the
investment manager as part of its independent securities analysis. When ratings
from multiple agencies are available, the highest is used, consistent with the
portfolio investment process. Ratings reflect an NRSRO’s opinion of an issuer’s
creditworthiness and typically range from AAA or Aaa (highest) to D (lowest).
The Below Investment Grade category consists of bonds rated below BBB-. The
Refunded category generally consists of refunded bonds secured by U.S. govern-
ment or other high-quality securities. The Not Rated category consists of ratable
securities that have not been rated by an NRSRO. Cash and equivalents (defined
as bonds with stated maturities, or redemption features, of seven days or less),
as well as short-term bonds (defined as bonds maturing in more than seven days
but less than one year), are excluded from this breakdown.
Performance Overview
The Fund’s Class A share price, as measured by net asset value, decreased from $11.47 on May 31, 2014, to $11.38 on May 31, 2015. The Fund’s Class A shares paid dividends totaling 41.60 cents per share for the reporting period.2 The Performance Summary beginning on page 15 shows that at the end of this
| |
| Dividend Distributions* | |
| Class A | |
| 6/1/14–5/31/15 | |
| | Dividend per Share |
| Month | (cents) |
| June | 3.60 |
| July | 3.55 |
| August | 3.55 |
| September | 3.55 |
| October | 3.55 |
| November | 3.50 |
| December | 3.50 |
| January | 3.50 |
| February | 3.40 |
| March | 3.30 |
| April | 3.30 |
| May | 3.30 |
| Total | 41.60 |
*Assumes shares were purchased and held for the entire accrual period. Since
dividends accrue daily, your actual distributions will vary depending on the date
you purchased your shares and any account activity. All Fund distributions will
vary depending upon current market conditions, and past distributions are not
indicative of future trends.
reporting period the Fund’s Class A shares’ distribution rate was 3.33%. An investor in the 2015 maximum combined effective federal and Tennessee personal income tax bracket of 47.02% (including 3.8% Medicare tax) would need to earn a distribution rate of 6.29% from a taxable investment to match the Fund’s Class A tax-free distribution rate. Dividend distributions were affected by lower interest rates during the period. This and other factors resulted in reduced income for the portfolio and caused dividends to be lower at the end of the period.
Performance data represent past performance, which does not guarantee future results. Investment return and principal value will fluctuate, and you may have a gain or loss when you sell your shares. Current performance may differ from figures shown. Please visit franklintempleton.com or call (800) 342-5236 for most recent month-end performance.
1. The Fund may invest up to 100% of its assets in bonds whose interest payments are subject to federal alternative minimum tax. All or a significant portion of the income
on these obligations may be subject to such tax. Distributions of capital gains are generally taxable. To avoid imposition of 28% backup withholding on all Fund distributions
and redemption proceeds, U.S. investors must be properly certified on Form W-9 and non-U.S. investors on Form W-8BEN.
2. All Fund distributions will vary depending upon current market conditions, and past distributions are not indicative of future trends.
The dollar value, number of shares or principal amount, and names of all portfolio holdings are listed in the Fund’s Statement of Investments (SOI).
The SOI begins on page 34.
12 | Annual Report
franklintempleton.com
FRANKLIN TENNESSEE MUNICIPAL BOND FUND
State Update
Tennessee’s economy grew during the 12 months under review. The unemployment rate began the period at 6.5% and declined to a seven-year low of 5.8% at period-end.3 With strong contributions from leisure and hospitality as well as professional and business services, almost all private sectors contributed to employment growth. The manufacturing sector, one of the state’s large employment sectors, benefited from auto manufacturing growth spurred by rising employment and wages, continued low interest rates and lower gasoline prices. The state also experienced an increase in new business filings during the first quarter of 2015, indicating a rise in newly formed companies. Tennessee’s employment gains helped the housing market stage a strong recovery amid increasing home prices and shrinking inventory levels. The Nashville market’s recovery was among the nation’s strongest following the recession as home prices surged and sales increased there.
The state’s fiscal year 2015 budget was approved in April, after withholding pay increases for teachers and other state workers that had been proposed earlier. Dealing with inflationary pressures in two of the largest budget items, health care and education, against a backdrop of declining revenues from corporate taxes was a key budgetary challenge. The result was increased funding for TennCare and education but reduced funding for state employees’ salaries and benefits. Near period-end, the governor signed the fiscal year 2016 budget into law. The budget largely reflected the state’s economic growth and included state employee raises, more money toward teachers’ health insurance costs and funding for a new state museum.
Historically, Tennessee has been a low-debt state, with recent debt levels at 0.8% of personal income and $327 per capita, compared with the national medians of 2.5% and $1,012.4 Independent credit rating agency Standard & Poor’s (S&P) affirmed its AA+ rating and stable outlook on the state’s general obligation bonds.5 The rating reflected S&P’s opinion of the state’s cyclical but recovering economy, adequate reserves that were projected to grow, strong financial management practices and performance, long-term record of fully funding the annual required contribution to its retirement system, low debt burden and limited future debt issuance plans. S&P’s outlook reflected its view of the state’s strongly funded debt levels and long track record of conservative management practices.
| | |
| Portfolio Breakdown | | |
| 5/31/15 | | |
| | % of Total | |
| | Long-Term Investments* | |
| Utilities | 29.0 | % |
| Refunded | 16.4 | % |
| Hospital & Health Care | 16.1 | % |
| Higher Education | 12.1 | % |
| General Obligation | 9.1 | % |
| Other Revenue | 5.9 | % |
| Transportation | 5.1 | % |
| Tax-Supported | 3.2 | % |
| Housing | 3.1 | % |
| *Does not include short-term investments and other net assets. | |
Investment Strategy
We use a consistent, disciplined strategy in an effort to maximize tax-exempt income for our shareholders while balancing risk and return within the Fund’s range of allowable investments. We generally employ a buy-and-hold approach and invest in securities we believe should provide the most relative value in the market. We do not use leverage or derivatives, nor do we use hedging techniques that could add volatility and contribute to underperformance in adverse markets.
Manager’s Discussion
Consistent with our strategy, we sought to remain invested in bonds that maintain an average weighted maturity of 15 to 30 years with good call features. Based on the combination of our value-oriented philosophy of investing primarily for income and a positively sloping municipal yield curve, in which interest rates for longer term bonds are greater than those for shorter term bonds, we favored the use of longer term bonds. We believe our conservative, buy-and-hold investment strategy can help us achieve high, current, tax-free income for shareholders.
Puerto Rico’s municipal bond market is widely traded because of its federal and state tax-exemption advantages. After Puerto Rico enacted legislation in June 2014 related to bankruptcy protection for public corporations, S&P, Moody’s Investors Service and Fitch downgraded ratings of Puerto Rico and
3. Source: Bureau of Labor Statistics.
4. Source: Moody’s Investors Service, State Debt Medians 2015: Total Debt Falls for First Time in Almost 30 Years, 6/24/15.
5. This does not indicate S&P’s rating of the Fund.
See www.franklintempletondatasources.com for additional data provider information.
franklintempleton.com
Annual Report
| 13
FRANKLIN TENNESSEE MUNICIPAL BOND FUND
many of its public corporations and authorities, which were already below investment grade. In February 2015, after a federal judge ruled the legislation unconstitutional, the rating agencies downgraded Puerto Rico’s general obligation bond rating even further. The Fund is not required to sell securities that have been downgraded to below investment grade, but it is prohibited from making further purchases of such securities as long as the securities are not rated investment grade by at least one U.S. nationally recognized rating service. Rating actions combined with news related to the commonwealth’s financial position and future financing endeavors caused the Puerto Rico bond market to experience volatility during the reporting period.
Thank you for your continued participation in Franklin Tennessee Municipal Bond Fund. We look forward to serving your future investment needs.
The foregoing information reflects our analysis, opinions and portfolio holdings as of May 31, 2015, the end of the reporting period. The way we implement our main investment strategies and the resulting portfolio holdings may change depending on factors such as market and economic conditions. These opinions may not be relied upon as investment advice or an offer for a particular security. The information is not a complete analysis of every aspect of any market, state, industry, security or the Fund. Statements of fact are from sources considered reliable, but the investment manager makes no representation or warranty as to their completeness or accuracy. Although historical performance is no guarantee of future results, these insights may help you understand our investment management philosophy.
14 | Annual Report
franklintempleton.com
FRANKLIN TENNESSEE MUNICIPAL BOND FUND
Performance Summary as of May 31, 2015
Your dividend income will vary depending on dividends or interest paid by securities in the Fund’s portfolio, adjusted for operating expenses. Capital gain distributions are net profits realized from the sale of portfolio securities. The performance tables and graph do not reflect any taxes that a shareholder would pay on Fund dividends, capital gain distributions, if any, or any realized gains on the sale of Fund shares. Total return reflects reinvestment of the Fund’s dividends and capital gain distributions, if any, and any unrealized gains or losses.
| | | | | | |
| Net Asset Value | | | | | | |
| Share Class (Symbol) | | 5/31/15 | | 5/31/14 | | Change |
| A (FRTIX) | $ | 11.38 | $ | 11.47 | -$ | 0.09 |
| | |
| Distributions (6/1/14–5/31/15) | | |
| | | Dividend |
| Share Class | | Income |
| A | $ | 0.4160 |
Performance
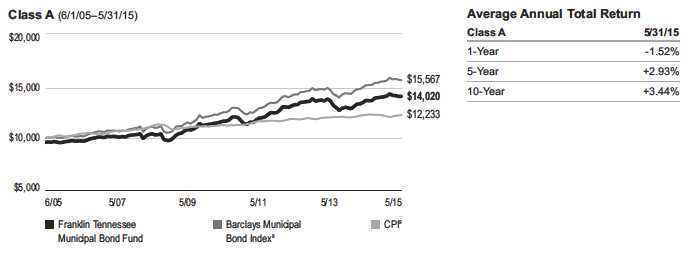
Cumulative total return excludes the sales charge. Average annual total returns include the maximum sales charge.
Class A: 4.25% maximum initial sales charge.
| | | | | | | | |
| | Cumulative | | Average Annual | | Average Annual | | Total Annual | |
| Share Class | Total Return1 | | Total Return2 | | Total Return (6/30/15)3 | | Operating Expenses4 | |
| A | | | | | | | 0.72 | % |
| 1-Year | +2.86 | % | -1.52 | % | -1.83 | % | | |
| 5-Year | +20.64 | % | +2.93 | % | +2.79 | % | | |
| 10-Year | +46.43 | % | +3.44 | % | +3.33 | % | | |
| |
| |
| | Distribution | | Taxable Equivalent | | 30-Day | | Taxable Equivalent 30-Day | |
| Share Class | Rate5 | | Distribution Rate6 | | Standardized Yield7 | | Standardized Yield6 | |
| A | 3.33 | % | 6.29 | % | 1.77 | % | 3.34 | % |
Performance data represent past performance, which does not guarantee future results. Investment return and principal value will fluctuate, and you may have a gain or loss when you sell your shares. Current performance may differ from figures shown. For most recent month-end performance, go to franklintempleton.com or call (800) 342-5236.
franklintempleton.com
Annual Report
| 15
FRANKLIN TENNESSEE MUNICIPAL BOND FUND
PERFORMANCE SUMMARY
Total Return Index Comparison for a Hypothetical $10,000 Investment
Total return represents the change in value of an investment over the periods shown. It includes any applicable maximum sales charge, Fund expenses, account fees and reinvested distributions. The unmanaged index includes reinvestment of any income or distributions. It differs from the Fund in composition and does not pay management fees or expenses. One cannot invest directly in an index.
All investments involve risks, including possible loss of principal. Because municipal bonds are sensitive to interest rate movements, the Fund’s yield and
share price will fluctuate with market conditions. Bond prices generally move in the opposite direction of interest rates. Thus, as prices of bonds in the Fund
adjust to a rise in interest rates, the Fund’s share price may decline. Because the Fund invests principally in a single state, it is subject to greater risk of
adverse economic and regulatory changes in that state than a geographically diversified fund. The Fund holds a small portion of its assets in Puerto Rico
municipal bonds that have been impacted by recent adverse economic and market changes, which may cause the Fund’s share price to decline. Changes in
the credit rating of a bond, or in the credit rating or financial strength of a bond’s issuer, insurer or guarantor, may affect the bond’s value. The Fund may invest
a significant part of its assets in municipal securities that finance similar types of projects, such as utilities, hospitals, higher education and transportation.
A change that affects one project would likely affect all similar projects, thereby increasing market risk. The Fund is actively managed but there is no guarantee
that the manager’s investment decisions will produce the desired results. The Fund’s prospectus also includes a description of the main investment risks.
1. Cumulative total return represents the change in value of an investment over the periods indicated.
2. Average annual total return represents the average annual change in value of an investment over the periods indicated.
3. In accordance with SEC rules, we provide standardized average annual total return information through the latest calendar quarter.
4. Figures are as stated in the Fund’s current prospectus. In periods of market volatility, assets may decline significantly, causing total annual Fund operating expenses
to become higher than the figures shown.
5. Distribution rate is based on an annualization of May’s 3.30 cent per share dividend and the maximum offering price of $11.89 per share on 5/31/15.
6. Taxable equivalent distribution rate and yield assume the published rates as of 12/29/14 for the maximum combined effective federal and Tennessee state personal
income tax rate of 47.02%, based on the federal income tax rate of 39.60% plus 3.8% Medicare tax.
7. The 30-day standardized yield for the 30 days ended 5/31/15 reflects an estimated yield to maturity (assuming all portfolio securities are held to maturity). It should be
regarded as an estimate of the Fund’s rate of investment income, and it may not equal the Fund’s actual income distribution rate (which reflects the Fund’s past dividends
paid to shareholders) or the income reported in the Fund’s financial statements.
8. Source: Morningstar. The Barclays Municipal Bond Index is a market value-weighted index engineered for the long-term tax-exempt bond market. To be included in the
index, bonds must be fixed rate, have at least one year to final maturity and be rated investment grade (Baa3/BBB- or higher) by at least two of the following agencies:
Moody’s, S&P and Fitch.
9. Source: Bureau of Labor Statistics, bls.gov/cpi. The CPI is a commonly used measure of the inflation rate.
See www.franklintempletondatasources.com for additional data provider information.
16 | Annual Report
franklintempleton.com
FRANKLIN TENNESSEE MUNICIPAL BOND FUND
Your Fund’s Expenses
As a Fund shareholder, you can incur two types of costs:
- Transaction costs, including sales charges (loads) on Fund purchases; and
- Ongoing Fund costs, including management fees, distribu- tion and service (12b-1) fees, and other Fund expenses. All mutual funds have ongoing costs, sometimes referred to as operating expenses.
The following table shows ongoing costs of investing in the Fund and can help you understand these costs and compare them with those of other mutual funds. The table assumes a $1,000 investment held for the six months indicated.
Actual Fund Expenses
The first line (Actual) for each share class listed in the table provides actual account values and expenses. The “Ending Account Value” is derived from the Fund’s actual return, which includes the effect of Fund expenses.
You can estimate the expenses you paid during the period by following these steps. Of course, your account value and expenses will differ from those in this illustration:
| 1. | Divide your account value by $1,000. |
| | If an account had an $8,600 value, then $8,600 ÷ $1,000 = 8.6. |
| 2. | Multiply the result by the number under the heading “Expenses Paid During Period.” |
| | If Expenses Paid During Period were $7.50, then 8.6 x $7.50 = $64.50. |
In this illustration, the estimated expenses paid this period are $64.50.
Hypothetical Example for Comparison with Other Funds
Information in the second line (Hypothetical) for each class in the table can help you compare ongoing costs of investing in the Fund with those of other mutual funds. This information may not be used to estimate the actual ending account balance or expenses you paid during the period. The hypothetical “Ending Account Value” is based on the actual expense ratio for each class and an assumed 5% annual rate of return before expenses, which does not represent the Fund’s actual return. The figure under the heading “Expenses Paid During Period” shows the hypothetical expenses your account would have incurred under this scenario. You can compare this figure with the 5% hypothetical examples that appear in shareholder reports of other funds.
Please note that expenses shown in the table are meant to highlight ongoing costs and do not reflect any transaction costs, such as sales charges. Therefore, the second line for each class is useful in comparing ongoing costs only, and will not help you compare total costs of owning different funds. In addition, if transaction costs were included, your total costs would have been higher. Please refer to the Fund prospectus for additional information on operating expenses.
| | | | | | |
| | | Beginning Account | | Ending Account | | Expenses Paid During |
| Share Class | | Value 12/1/14 | | Value 5/31/15 | | Period* 12/1/14–5/31/15 |
| A | | | | | | |
| Actual | $ | 1,000 | $ | 1,003.60 | $ | 3.60 |
| Hypothetical (5% return before expenses) | $ | 1,000 | $ | 1,021.34 | $ | 3.63 |
*Expenses are calculated using the most recent six-month annualized expense ratio of 0.72%, multiplied by the average account value over
the period, multiplied by 182/365 to reflect the one-half year period.
franklintempleton.com
Annual Report
| 17
| | | | | | | | | | | | | | | |
| FRANKLIN MUNICIPAL SECURITIES TRUST | | | | | | | | | | | | | | | |
| |
| |
| Financial Highlights | | | | | | | | | | | | | | | |
| Franklin California High Yield Municipal Fund | | | | | | | | | | | | | | | |
| | | | | | | | | Year Ended May 31, | | | | |
| | | 2015 | | | 2014 | | | 2013 | | | 2012 | | | 2011 | |
| Class A | | | | | | | | | | | | | | | |
| Per share operating performance | | | | | | | | | | | | | | | |
| (for a share outstanding throughout the year) | | | | | | | | | | | | | | | |
| Net asset value, beginning of year | $ | 10.42 | | $ | 10.59 | | $ | 10.40 | | $ | 9.07 | | $ | 9.40 | |
| Income from investment operationsa: | | | | | | | | | | | | | | | |
| Net investment incomeb | | 0.44 | | | 0.49 | | | 0.46 | | | 0.49 | | | 0.50 | |
| Net realized and unrealized gains (losses) | | 0.24 | | | (0.18 | ) | | 0.17 | | | 1.34 | | | (0.33 | ) |
| Total from investment operations | | 0.68 | | | 0.31 | | | 0.63 | | | 1.83 | | | 0.17 | |
| Less distributions from net investment income | | (0.45 | ) | | (0.48 | ) | | (0.44 | ) | | (0.50 | ) | | (0.50 | ) |
| Net asset value, end of year | $ | 10.65 | | $ | 10.42 | | $ | 10.59 | | $ | 10.40 | | $ | 9.07 | |
| |
| Total returnc | | 6.63 | % | | 3.22 | % | | 6.10 | % | | 20.65 | % | | 1.93 | % |
| |
| Ratios to average net assets | | | | | | | | | | | | | | | |
| Expenses | | 0.63 | % | | 0.63 | % | | 0.61 | % | | 0.62 | % | | 0.62 | % |
| Net investment income | | 4.17 | % | | 4.95 | % | | 4.31 | % | | 5.05 | % | | 5.47 | % |
| |
| Supplemental data | | | | | | | | | | | | | | | |
| Net assets, end of year (000’s) | $ | 1,294,192 | | $ | 1,203,532 | | $ | 1,330,444 | | $ | 1,238,396 | | $ | 979,093 | |
| Portfolio turnover rate | | 11.98 | % | | 22.26 | % | | 5.47 | % | | 6.67 | % | | 17.86 | % |
aThe amount shown for a share outstanding throughout the period may not correlate with the Statement of Operations for the period due to the timing of sales and
repurchases of the Fund’s shares in relation to income earned and/or fluctuating fair value of the investments of the Fund.
bBased on average daily shares outstanding.
cTotal return does not reflect sales commissions or contingent deferred sales charges, if applicable.
18 | Annual Report | The accompanying notes are an integral part of these financial statements.
franklintempleton.com
| | | | | | | | | | | | | | | |
| | | | | | FRANKLIN MUNICIPAL SECURITIES TRUST | |
| | | | | | | | | FINANCIAL HIGHLIGHTS | |
| |
| |
| |
| Franklin California High Yield Municipal Fund (continued) | | | | | | | | | | | | | | | |
| | | | | | | | | Year Ended May 31, | | | | |
| | | 2015 | | | 2014 | | | 2013 | | | 2012 | | | 2011 | |
| Class C | | | | | | | | | | | | | | | |
| Per share operating performance | | | | | | | | | | | | | | | |
| (for a share outstanding throughout the year) | | | | | | | | | | | | | | | |
| Net asset value, beginning of year | $ | 10.49 | | $ | 10.65 | | $ | 10.46 | | $ | 9.13 | | $ | 9.45 | |
| Income from investment operationsa: | | | | | | | | | | | | | | | |
| Net investment incomeb | | 0.39 | | | 0.44 | | | 0.40 | | | 0.44 | | | 0.46 | |
| Net realized and unrealized gains (losses) | | 0.23 | | | (0.18 | ) | | 0.17 | | | 1.33 | | | (0.33 | ) |
| Total from investment operations | | 0.62 | | | 0.26 | | | 0.57 | | | 1.77 | | | 0.13 | |
| Less distributions from net investment income | | (0.39 | ) | | (0.42 | ) | | (0.38 | ) | | (0.44 | ) | | (0.45 | ) |
| Net asset value, end of year | $ | 10.72 | | $ | 10.49 | | $ | 10.65 | | $ | 10.46 | | $ | 9.13 | |
| |
| Total returnc | | 6.01 | % | | 2.74 | % | | 5.48 | % | | 19.86 | % | | 1.46 | % |
| |
| Ratios to average net assets | | | | | | | | | | | | | | | |
| Expenses | | 1.18 | % | | 1.18 | % | | 1.16 | % | | 1.17 | % | | 1.17 | % |
| Net investment income | | 3.62 | % | | 4.40 | % | | 3.76 | % | | 4.50 | % | | 4.92 | % |
| |
| Supplemental data | | | | | | | | | | | | | | | |
| Net assets, end of year (000’s) | $ | 326,456 | | $ | 278,775 | | $ | 322,824 | | $ | 293,895 | | $ | 229,667 | |
| Portfolio turnover rate | | 11.98 | % | | 22.26 | % | | 5.47 | % | | 6.67 | % | | 17.86 | % |
aThe amount shown for a share outstanding throughout the period may not correlate with the Statement of Operations for the period due to the timing of sales and
repurchases of the Fund’s shares in relation to income earned and/or fluctuating fair value of the investments of the Fund.
bBased on average daily shares outstanding.
cTotal return does not reflect sales commissions or contingent deferred sales charges, if applicable.
franklintempleton.com
The accompanying notes are an integral part of these financial statements. | Annual Report | 19
| | | | | | | | | | | | | | | |
| FRANKLIN MUNICIPAL SECURITIES TRUST | | | | | | | | | | | | | | | |
| FINANCIAL HIGHLIGHTS | | | | | | | | | | | | | | | |
| |
| |
| |
| Franklin California High Yield Municipal Fund (continued) | | | | | | | | | | | | | | | |
| | | | | | | | | Year Ended May 31, | | | | |
| | | 2015 | | | 2014 | | | 2013 | | | 2012 | | | 2011 | |
| Advisor Class | | | | | | | | | | | | | | | |
| Per share operating performance | | | | | | | | | | | | | | | |
| (for a share outstanding throughout the year) | | | | | | | | | | | | | | | |
| Net asset value, beginning of year | $ | 10.44 | | $ | 10.61 | | $ | 10.41 | | $ | 9.09 | | $ | 9.42 | |
| Income from investment operationsa: | | | | | | | | | | | | | | | |
| Net investment incomeb | | 0.45 | | | 0.50 | | | 0.47 | | | 0.50 | | | 0.52 | |
| Net realized and unrealized gains (losses) | | 0.24 | | | (0.18 | ) | | 0.18 | | | 1.33 | | | (0.34 | ) |
| Total from investment operations | | 0.69 | | | 0.32 | | | 0.65 | | | 1.83 | | | 0.18 | |
| Less distributions from net investment income | | (0.46 | ) | | (0.49 | ) | | (0.45 | ) | | (0.51 | ) | | (0.51 | ) |
| Net asset value, end of year | $ | 10.67 | | $ | 10.44 | | $ | 10.61 | | $ | 10.41 | | $ | 9.09 | |
| |
| Total return | | 6.73 | % | | 3.32 | % | | 6.30 | % | | 20.60 | % | | 2.03 | % |
| |
| Ratios to average net assets | | | | | | | | | | | | | | | |
| Expenses | | 0.53 | % | | 0.53 | % | | 0.51 | % | | 0.52 | % | | 0.52 | % |
| Net investment income | | 4.27 | % | | 5.05 | % | | 4.41 | % | | 5.15 | % | | 5.57 | % |
| |
| Supplemental data | | | | | | | | | | | | | | | |
| Net assets, end of year (000’s) | $ | 474,392 | | $ | 315,131 | | $ | 303,904 | | $ | 241,123 | | $ | 137,191 | |
| Portfolio turnover rate | | 11.98 | % | | 22.26 | % | | 5.47 | % | | 6.67 | % | | 17.86 | % |
aThe amount shown for a share outstanding throughout the period may not correlate with the Statement of Operations for the period due to the timing of sales and
repurchases of the Fund’s shares in relation to income earned and/or fluctuating fair value of the investments of the Fund.
bBased on average daily shares outstanding.
20 | Annual Report | The accompanying notes are an integral part of these financial statements.
franklintempleton.com
FRANKLIN MUNICIPAL SECURITIES TRUST
| | | | |
| Statement of Investments, May 31, 2015 | | | | |
| |
| Franklin California High Yield Municipal Fund | | | | |
| |
| | | Units | | Value |
| |
| Common Stocks and Other Equity Interests (Cost $611,327) 0.0%† | | | | |
| Diversified Financial Services 0.0%† | | | | |
| a,b 1155 Island Avenue LLC, LP | | 7,830,849 | $ | 611,323 |
| |
| | | Principal | | |
| | | Amount | | |
| |
| Corporate Bonds (Cost $3,523,882) 0.2% | | | | |
| Diversified Financial Services 0.2% | | | | |
| b,c 1155 Island Avenue LLC, PIK, 10.00%, 12/11/24 | $ | 3,523,882 | | 3,541,501 |
| Municipal Bonds 91.0% | | | | |
| California 86.7% | | | | |
| ABAG Finance Authority for Nonprofit Corps. Revenue, Episcopal Senior Communities, | | | | |
| Refunding, 6.125%, 7/01/41 | | 7,500,000 | | 8,600,177 |
| Artesia RDA Tax Allocation, | | | | |
| Artesia Redevelopment Project Area, 5.50%, 6/01/42 | | 6,355,000 | | 6,356,589 |
| Artesia Redevelopment Project Area, 5.70%, 6/01/42 | | 3,015,000 | | 3,016,296 |
| Housing Set-Aside, Artesia Redevelopment Project Area, 7.70%, 6/01/46 | | 3,270,000 | | 3,632,349 |
| Azusa Special Tax, CFD No. 2005-1, Improvement Area No. 1, 5.00%, | | | | |
| 9/01/27 | | 2,000,000 | | 2,028,240 |
| 9/01/37 | | 1,665,000 | | 1,682,116 |
| Baldwin Park USD, GO, | | | | |
| Capital Appreciation, Election of 2006, AGMC Insured, zero cpn., 8/01/31 | | 5,735,000 | | 2,339,593 |
| Los Angeles County, Capital Appreciation, Election of 2006, Refunding, BAM Insured, zero cpn., | | | | |
| 8/01/42 | | 10,000,000 | | 2,086,000 |
| Bay Area Toll Authority Toll Bridge Revenue, San Francisco Bay Area, Subordinate, Series S-4, | | | | |
| 5.25%, 4/01/53 | | 15,000,000 | | 16,717,800 |
| Beaumont Financing Authority Local Agency Revenue, | | | | |
| Improvement Area No. 17B, Series A, 6.125%, 9/01/31 | | 720,000 | | 799,135 |
| Improvement Area No. 17B, Series A, 6.375%, 9/01/42 | | 5,000,000 | | 5,505,000 |
| Improvement Area No. 19A, Refunding, Series B, 5.00%, 9/01/35 | | 3,750,000 | | 4,023,300 |
| Series B, Pre-Refunded, 5.35%, 9/01/28 | | 935,000 | | 965,546 |
| Series B, Pre-Refunded, 5.40%, 9/01/35 | | 1,390,000 | | 1,435,578 |
| Series C, 5.45%, 9/01/27 | | 6,435,000 | | 6,436,480 |
| Series C, 5.50%, 9/01/29 | | 855,000 | | 869,321 |
| Series C, 5.50%, 9/01/35 | | 1,035,000 | | 1,050,442 |
| Series C, 5.50%, 9/01/35 | | 3,995,000 | | 3,995,879 |
| Beaumont USD, GO, Election of 2008, Series C, AGMC Insured, 6.00%, 8/01/41 | | 1,925,000 | | 2,300,144 |
| Buena Park Community RDA Tax Allocation, Consolidated Redevelopment Project, 6.25%, | | | | |
| 9/01/35 | | 5,000,000 | | 5,552,550 |
| California County Tobacco Securitization Agency Tobacco Settlement Revenue, Asset-Backed, | | | | |
| Los Angeles County Securitization Corp., 5.70%, 6/01/46 | | 3,000,000 | | 2,617,290 |
| California Educational Facilities Authority Revenue, | | | | |
| College and University Financing Program, Pre-Refunded, 5.00%, 2/01/26 | | 250,000 | | 268,413 |
| College and University Financing Program, Pre-Refunded, 5.00%, 2/01/30 | | 615,000 | | 660,295 |
| University of San Francisco, 6.125%, 10/01/36 | | 2,000,000 | | 2,414,000 |
| California State GO, Various Purpose, | | | | |
| 6.00%, 11/01/39 | | 13,000,000 | | 15,536,950 |
| FGIC Insured, 6.00%, 8/01/19 | | 30,000 | | 30,285 |
| Refunding, 5.00%, 3/01/45 | | 20,000,000 | | 22,528,200 |
franklintempleton.com
Annual Report
| 21
FRANKLIN MUNICIPAL SECURITIES TRUST
STATEMENT OF INVESTMENTS
| | | | |
| Franklin California High Yield Municipal Fund (continued) | | | | |
| | | Principal | | |
| | | Amount | | Value |
| |
| Municipal Bonds (continued) | | | | |
| California (continued) | | | | |
| California State Health Facilities Financing Authority Revenue, | | | | |
| El Camino Hospital, Refunding, Series A, 5.00%, 2/01/40 | $ | 7,000,000 | $ | 7,697,410 |
| Lucile Salter Packard Children’s Hospital at Stanford, Series A, 5.00%, 8/15/43 | | 7,160,000 | | 7,950,607 |
| Providence Health and Services, Series C, Pre-Refunded, 6.50%, 10/01/33 | | 4,000,000 | | 4,708,120 |
| California State Municipal Finance Authority COP, Community Hospitals of Central California | | | | |
| Obligated Group, | | | | |
| 5.25%, 2/01/24 | | 5,000,000 | | 5,612,200 |
| 5.375%, 2/01/29 | | 7,000,000 | | 7,861,490 |
| 5.50%, 2/01/39 | | 10,600,000 | | 11,903,164 |
| 5.25%, 2/01/46 | | 15,965,000 | | 16,786,719 |
| California State Municipal Finance Authority Mobile Home Park Revenue, | | | | |
| Caritas Affordable Housing Inc. Projects, Senior, Series A, 5.00%, 8/15/30 | | 1,000,000 | | 1,110,390 |
| Caritas Affordable Housing Inc. Projects, Senior, Series A, 5.25%, 8/15/39 | | 1,200,000 | | 1,319,280 |
| Caritas Affordable Housing Inc. Projects, Senior, Series A, 5.25%, 8/15/49 | | 3,500,000 | | 3,808,490 |
| Windsor Mobile Country Club, Refunding, Series A, 5.625%, 11/15/33 | | 1,000,000 | | 1,051,760 |
| Windsor Mobile Country Club, Refunding, Series A, 6.00%, 11/15/48 | | 4,000,000 | | 4,287,040 |
| California State Municipal Finance Authority Revenue, | | | | |
| Biola University, Refunding, Series A, 5.625%, 10/01/23 | | 6,000,000 | | 6,629,820 |
| Biola University, Refunding, Series A, 5.80%, 10/01/28 | | 7,500,000 | | 8,312,325 |
| Biola University, Refunding, Series A, 5.875%, 10/01/34 | | 6,000,000 | | 6,576,840 |
| Harbor Regional Center Project, 8.50%, 11/01/39 | | 5,000,000 | | 6,077,300 |
| Kern Regional Center Project, Series A, 7.50%, 5/01/39 | | 9,000,000 | | 10,763,010 |
| NorthBay Healthcare Group, 5.00%, 11/01/35 | | 1,100,000 | | 1,184,634 |
| NorthBay Healthcare Group, 5.00%, 11/01/44 | | 1,050,000 | | 1,123,983 |
| South Central Los Angeles Regional Center Project, 5.50%, 12/01/33 | | 3,115,000 | | 3,380,959 |
| South Central Los Angeles Regional Center Project, 5.75%, 12/01/43 | | 7,000,000 | | 7,591,500 |
| Southwest Community Health Center, California Mortgage Insured, 6.125%, 2/01/40 | | 4,000,000 | | 4,525,960 |
| California State Public Works Board Lease Revenue, | | | | |
| California State Prison Los Angeles, Various Buildings, Series C, 5.75%, 10/01/31 | | 4,640,000 | | 5,499,421 |
| Various Capital Projects, Series A, 5.125%, 10/01/31 | | 3,605,000 | | 4,074,407 |
| California State Statewide CDA Senior Living Health Facility Revenue, Series A, 5.00%, 8/01/44 | | 2,450,000 | | 2,684,710 |
| California Statewide CDA Revenue, | | | | |
| Aldersly, Refunding, Series A, 5.00%, 5/15/32 | | 750,000 | | 814,905 |
| Aldersly, Refunding, Series A, 5.00%, 5/15/40 | | 1,010,000 | | 1,076,832 |
| American Baptist Homes of the West, Refunding, 6.25%, 10/01/39 | | 5,000,000 | | 5,585,100 |
| Bentley School, Refunding, Series A, 7.00%, 7/01/40 | | 8,675,000 | | 9,602,010 |
| California Baptist University, Refunding, 7.25%, 11/01/31 | | 1,250,000 | | 1,485,450 |
| California Baptist University, Refunding, 7.50%, 11/01/41 | | 2,750,000 | | 3,284,270 |
| California Baptist University, Refunding, Series A, 5.40%, 11/01/27 | | 7,440,000 | | 7,865,122 |
| California Baptist University, Refunding, Series A, 5.50%, 11/01/38 | | 4,500,000 | | 4,708,755 |
| California Baptist University, Series A, 5.125%, 11/01/23 | | 715,000 | | 756,520 |
| California Baptist University, Series A, 6.125%, 11/01/33 | | 1,565,000 | | 1,747,182 |
| California Baptist University, Series A, 6.375%, 11/01/43 | | 4,035,000 | | 4,550,471 |
| Catholic Healthcare West, Series C, 5.625%, 7/01/35 | | 5,000,000 | | 5,521,000 |
| CHF-Irvine LLC, UCI East Campus Apartments, Phase II, 5.75%, 5/15/32 | | 10,000,000 | | 10,865,000 |
| Cottage Health System Obligation Group, Refunding, 5.00%, 11/01/43 | | 7,300,000 | | 8,063,434 |
| Covenant Retirement Communities Inc., Series C, 5.625%, 12/01/36 | | 8,000,000 | | 8,670,640 |
| Eskaton Properties Inc. Obligated Group, Refunding, 5.25%, 11/15/34 | | 4,350,000 | | 4,691,431 |
| Henry Mayo Newhall Memorial Hospital, Series B, California Mortgage Insured, Pre-Refunded, | | | | |
| 5.20%, 10/01/37 | | 3,500,000 | | 3,965,115 |
| Huntington Memorial Hospital, Refunding, Series B, 5.00%, 7/01/44 | | 4,450,000 | | 4,896,068 |
| |
| |
| 22 | Annual Report | | | | franklintempleton.com |
FRANKLIN MUNICIPAL SECURITIES TRUST
STATEMENT OF INVESTMENTS
| | | | |
| Franklin California High Yield Municipal Fund (continued) | | | | |
| | | Principal | | |
| | | Amount | | Value |
| |
| Municipal Bonds (continued) | | | | |
| California (continued) | | | | |
| California Statewide CDA Revenue, (continued) | | | | |
| Kaiser Permanente, Series B, 5.25%, 3/01/45 | $ | 37,325,000 | $ | 38,302,915 |
| Lancer Educational Student Housing Project, 5.625%, 6/01/33 | | 3,000,000 | | 3,074,760 |
| Loma Linda University Medical Center, Refunding, Series A, 5.25%, 12/01/44 | | 17,300,000 | | 18,612,032 |
| Loma Linda University Medical Center, Refunding, Series A, 5.50%, 12/01/54 | | 20,000,000 | | 21,724,800 |
| Methodist Hospital of Southern California Project, FHA Insured, 6.75%, 2/01/38 | | 8,980,000 | | 10,666,713 |
| Monterey Institute International, 5.50%, 7/01/31 | | 8,275,000 | | 9,413,143 |
| California Statewide CDA Special Tax Revenue, CFD No. 2007-1, Orinda, 6.00%, 9/01/29 | | 4,955,000 | | 5,107,218 |
| Capistrano USD, CFD No. 2005-1 Special Tax, 5.50%, 9/01/43 | | 4,955,000 | | 5,324,593 |
| Carson RDA, Tax Allocation Housing, Series A, 5.25%, 10/01/36 | | 1,965,000 | | 2,144,699 |
| Centinela Valley UHSD, GO, County of Los Angeles, | | | | |
| Election of 2008, Series C, 5.00%, 8/01/35 | | 4,195,000 | | 4,677,383 |
| Election of 2010, Series B, AGMC Insured, zero cpn., 8/01/45 | | 42,000,000 | | 7,617,540 |
| Ceres USD, GO, Capital Appreciation, Election of 2008, Series A, zero cpn., | | | | |
| 8/01/39 | | 6,450,000 | | 1,426,160 |
| 8/01/40 | | 6,730,000 | | 1,381,669 |
| Chatom USD, GO, Election of 2006, Capital Appreciation, Series C, XLCA Insured, zero cpn., | | | | |
| 8/01/47 | | 9,450,000 | | 1,524,285 |
| Chula Vista CFD Special Tax, | | | | |
| No. 12-I, McMillin Otay Ranch Village Seven, 5.25%, 9/01/30 | | 1,435,000 | | 1,442,979 |
| No. 12-I, McMillin Otay Ranch Village Seven, 5.25%, 9/01/36 | | 2,500,000 | | 2,512,675 |
| No. 2001-1, Improvement Area, San Miguel Ranch, Series B, 5.45%, 9/01/36 | | 2,170,000 | | 2,171,302 |
| City of Fullerton Special Assessment, Community Facilities District No. 2, Amerige Heights, | | | | |
| 4.00%, 9/01/24 | | 110,000 | | 115,433 |
| 5.00%, 9/01/34 | | 1,075,000 | | 1,145,133 |
| 5.00%, 9/01/44 | | 2,450,000 | | 2,574,779 |
| Clovis USD, GO, Capital Appreciation, Election of 2004, Series A, NATL Insured, zero cpn., | | | | |
| 8/01/27 | | 7,500,000 | | 5,019,225 |
| 8/01/28 | | 3,000,000 | | 1,905,120 |
| Coachella Valley USD, GO, Capital Appreciation, Election of 2005, Series D, zero cpn., | | | | |
| 8/01/42 | | 8,500,000 | | 2,252,330 |
| 8/01/43 | | 3,000,000 | | 754,920 |
| Coalinga PFAR, Water and Wastewater Refinancing Projects, Refunding, 5.00%, | | | | |
| 4/01/35 | | 1,000,000 | | 1,051,850 |
| 4/01/48 | | 6,350,000 | | 6,538,214 |
| Compton Community College District GO, Election of 2002, Series B, | | | | |
| 6.625%, 8/01/27 | | 3,085,000 | | 3,673,618 |
| 6.75%, 8/01/34 | | 4,000,000 | | 4,747,800 |
| Compton CRDA Tax Allocation, Redevelopment Project, second lien, Series B, | | | | |
| 5.70%, 8/01/30 | | 2,255,000 | | 2,307,339 |
| 6.00%, 8/01/42 | | 3,460,000 | | 3,534,944 |
| Compton USD, GO, Election of 2002, Series C, AMBAC Insured, | | | | |
| 5.00%, 6/01/31 | | 3,270,000 | | 3,396,451 |
| Pre-Refunded, 5.00%, 6/01/31 | | 1,730,000 | | 1,810,860 |
| Corona CFD No. 2001-2 Special Tax, Improvement Areas Nos. 1 and 2, Series A, 6.25%, | | | | |
| 9/01/32 | | 1,825,000 | | 1,831,333 |
| Corona CFD No. 2003-2 Special Tax, Highlands Collection, 5.20%, 9/01/34 | | 770,000 | | 769,931 |
| b Cotati South Sonoma Business Park AD Special Assessment, Limited Obligation Improvement, | | | | |
| 6.50%, 9/02/33 | | 4,825,000 | | 4,197,895 |
| CSD San Bernardino County GO, | | | | |
| Election of 2008, Series C, 5.00%, 8/01/44 | | 3,615,000 | | 3,984,055 |
| Election of 2014, Series A, 5.00%, 8/01/44 | | 7,375,000 | | 8,127,914 |
franklintempleton.com Annual Report | 23
FRANKLIN MUNICIPAL SECURITIES TRUST
STATEMENT OF INVESTMENTS
| | | | |
| Franklin California High Yield Municipal Fund (continued) | | | | |
| | | Principal | | |
| | | Amount | | Value |
| |
| Municipal Bonds (continued) | | | | |
| California (continued) | | | | |
| Cudahy Community Development Commission Tax Allocation, City-Wide Redevelopment Project, | | | | |
| Redevelopment Projects, Series B, 7.75%, 10/01/27 | $ | 3,795,000 | $ | 4,799,157 |
| Daly City Housing Development Finance Agency Mobile Home Park Revenue, Franciscan Mobile | | | | |
| Home Park Acquisition Project, sub. bond, Refunding, Series B, 5.85%, 12/15/47 | | 4,885,000 | | 5,263,050 |
| Dana Point CFD Special Tax No. 2006-1, 5.00%, | | | | |
| 9/01/38 | | 1,000,000 | | 1,068,130 |
| 9/01/45 | | 2,500,000 | | 2,659,500 |
| Del Paso Manor Water District Revenue COP, Phase I Improvement Project, 5.50%, 7/01/41 | | 3,050,000 | | 3,466,569 |
| Duarte RDA Tax Allocation, Capital Appreciation, Merged Redevelopment Project, ETM, zero | | | | |
| cpn., 12/01/28 | | 30,795,000 | | 16,568,326 |
| Eastern Municipal Water District CFD Special Tax, No. 2001-01, French Valley, Improvement, | | | | |
| Refunding, 5.00%, 9/01/36 | | 1,800,000 | | 1,996,290 |
| El Dorado County Special Tax, | | | | |
| CFD No. 2001-1, 5.35%, 9/01/35 | | 1,900,000 | | 1,904,123 |
| CFD No. 2005-1, 5.00%, 9/01/21 | | 1,000,000 | | 1,010,750 |
| CFD No. 2005-1, 5.15%, 9/01/25 | | 2,075,000 | | 2,100,440 |
| CFD No. 2005-1, 5.25%, 9/01/35 | | 6,705,000 | | 6,737,452 |
| El Rancho USD, GO, Capital Appreciation, Election of 2003, NATL Insured, zero cpn., 8/01/29 | | 2,400,000 | | 1,324,872 |
| Etiwanda School District Community Facilities District No. 9 Special Tax, Refunding, 5.00%, | | | | |
| 9/01/35 | | 4,260,000 | | 4,724,084 |
| Fairfield Special Tax, CFD No. 3, North Cordelia General Improvements, 6.00%, | | | | |
| 9/01/32 | | 1,200,000 | | 1,321,776 |
| 9/01/37 | | 5,810,000 | | 6,395,764 |
| Foothill/Eastern Transportation Corridor Agency Toll Road Revenue, | | | | |
| Capital Appreciation, Refunding, Series A, zero cpn., 1/15/42 | | 75,000,000 | | 20,784,000 |
| Capital Appreciation, senior lien, Refunding, Series A, zero cpn., 1/15/33 | | 19,000,000 | | 8,410,540 |
| junior lien, Refunding, Series C, 6.50%, 1/15/43 | | 40,000,000 | | 47,354,000 |
| Golden State Tobacco Securitization Corp. Enhanced Tobacco Settlement Revenue, | | | | |
| Asset-Backed, Refunding, Senior Series A-1, 5.00%, 6/01/33 | | 24,500,000 | | 20,384,245 |
| Asset-Backed, Refunding, Series A, 5.00%, 6/01/45 | | 4,890,000 | | 4,890,000 |
| Asset-Backed, Series A, 5.00%, 6/01/45 | | 36,975,000 | | 40,314,582 |
| Capital Appreciation, Asset-Backed, second subordinate, Refunding, Series C, zero cpn., | | | | |
| 6/01/47 | | 50,000,000 | | 1,933,000 |
| Goleta RDA Tax Allocation, Goleta Old Town Redevelopment Project, 8.00%, 6/01/44 | | 5,000,000 | | 5,322,550 |
| Hanford Joint UHSD, GO, Capital Appreciation, Election of 2004, Series B, AGMC Insured, | | | | |
| zero cpn., | | | | |
| 8/01/32 | | 3,635,000 | | 1,657,160 |
| 8/01/33 | | 3,705,000 | | 1,596,410 |
| 8/01/35 | | 4,120,000 | | 1,589,620 |
| Hartnell Community College District GO, Capital Appreciation, Monterey and San Benito | | | | |
| Counties, Election of 2002, Series D, zero cpn., | | | | |
| 8/01/44 | | 30,000,000 | | 4,175,100 |
| 8/01/49 | | 10,000,000 | | 1,863,000 |
| Hemet USD Financing Authority Special Tax Revenue, 5.00%, 9/01/39 | | 1,100,000 | | 1,162,491 |
| Imperial Community College District GO, Capital Appreciation, Election of 2010, Series A, AGMC | | | | |
| Insured, zero cpn. to 8/01/15, 6.75% thereafter, 8/01/40 | | 3,500,000 | | 4,229,995 |
| bImperial County Special Tax, CFD No. 98-1, | | | | |
| 6.45%, 9/01/17 | | 755,000 | | 757,212 |
| 6.50%, 9/01/31 | | 5,705,000 | | 5,716,809 |
24 | Annual Report
franklintempleton.com
FRANKLIN MUNICIPAL SECURITIES TRUST
STATEMENT OF INVESTMENTS
| | | | |
| Franklin California High Yield Municipal Fund (continued) | | | | |
| | | Principal | | |
| | | Amount | | Value |
| |
| Municipal Bonds (continued) | | | | |
| California (continued) | | | | |
| Independent Cities Finance Authority Mobile Home Park Revenue, | | | | |
| Lamplighter Salinas MobileHome Park, Series A, 6.25%, 7/15/45 | $ | 2,465,000 | $ | 2,700,112 |
| Lamplighter Salinas MobileHome Park, Series A, 6.25%, 7/15/50 | | 2,000,000 | | 2,171,560 |
| Pillar Ridge, Series A, 5.25%, 5/15/44 | | 2,015,000 | | 2,198,143 |
| Pillar Ridge, Series A, 5.25%, 5/15/49 | | 4,800,000 | | 5,217,456 |
| Indio CFD No. 04-3 Special Tax, Terra Lago, Improvement Area No. 1, | | | | |
| 5.10%, 9/01/30 | | 1,275,000 | | 1,290,530 |
| 5.15%, 9/01/35 | | 3,000,000 | | 3,033,300 |
| Inland Valley Development Agency Successor Agency Tax Allocation, Refunding, Series A, | | | | |
| 5.25%, 9/01/37 | | 7,500,000 | | 8,432,850 |
| 5.00%, 9/01/44 | | 9,000,000 | | 9,810,630 |
| Irvine Special Tax Revenue, CFD No. 2013-3, Great Park, Improvement Area No. 1, 5.00%, | | | | |
| 9/01/39 | | 1,000,000 | | 1,106,720 |
| 9/01/44 | | 1,500,000 | | 1,647,720 |
| 9/01/49 | | 2,750,000 | | 3,005,062 |
| Irvine USD Special Tax, CFD No. 06-1, Portola Springs, 6.70%, 9/01/35 | | 2,565,000 | | 3,027,675 |
| Jurupa PFA Special Tax Revenue, Refunding, Series A, 5.00%, 9/01/42 | | 2,220,000 | | 2,436,805 |
| La Verne COP, Brethren Hillcrest Homes, 5.00%, 5/15/36 | | 1,430,000 | | 1,509,022 |
| La Verne Mobile Home Revenue, Copacbana Mobile HomePark, Refunding, 5.00%, 6/15/49 | | 1,765,000 | | 1,911,601 |
| Lake Elsinore PFA Local Agency Revenue, | | | | |
| AD No. 93-1, Refunding, Series B, 5.125%, 9/02/30 | | 4,980,000 | | 5,361,617 |
| Canyon Hills Improvement Area Development, Series A, 5.75%, 9/01/44 | | 3,240,000 | | 3,353,562 |
| CFD No. 98-1, Series C, 5.25%, 9/01/33 | | 8,000,000 | | 8,258,640 |
| Lake Elsinore Special Tax, CFD No. 2004-3, Rosetta Canyon, Improvement Area No. 1, Series A, | | | | |
| Pre-Refunded, | | | | |
| 5.10%, 9/01/22 | | 750,000 | | 774,045 |
| 5.15%, 9/01/25 | | 635,000 | | 655,434 |
| 5.25%, 9/01/30 | | 1,195,000 | | 1,233,742 |
| 5.25%, 9/01/35 | | 1,225,000 | | 1,264,715 |
| Lake Tahoe USD, GO, Election of 2008, zero cpn. to 7/31/25, 5.30% thereafter, 8/01/40 | | 1,140,000 | | 746,746 |
| Lancaster Financing Authority Tax Allocation Revenue, Redevelopment Project Nos. 5 and 6, | | | | |
| School Districts, Refunding, 5.40%, 2/01/29 | | 475,000 | | 475,504 |
| Lancaster RDA Tax Allocation, Combined Redevelopment Project Areas, | | | | |
| 6.875%, 8/01/34 | | 2,000,000 | | 2,324,760 |
| 6.875%, 8/01/39 | | 830,000 | | 964,775 |
| Pre-Refunded, 6.875%, 8/01/39 | | 1,170,000 | | 1,431,752 |
| Las Virgenes USD, GO, Election of 2006, Series C, zero cpn. to 8/01/26, 6.75% thereafter, | | | | |
| 8/01/33 | | 8,050,000 | | 5,886,562 |
| Lathrop Financing Authority Revenue, Mossdale Village, Refunding, Series A, | | | | |
| 6.00%, 9/02/28 | | 1,045,000 | | 1,214,426 |
| 6.00%, 9/02/29 | | 1,110,000 | | 1,278,887 |
| 6.00%, 9/02/30 | | 1,125,000 | | 1,290,173 |
| 5.50%, 9/02/35 | | 3,825,000 | | 4,085,827 |
| Lee Lake PFAR, Special Tax, junior lien, Refunding, Series B, | | | | |
| 5.25%, 9/01/32 | | 1,475,000 | | 1,576,583 |
| 5.375%, 9/01/35 | | 1,095,000 | | 1,168,080 |
| Lemon Grove CDA Successor Agency Tax Allocation, Lemon Grove Redevelopment Project Area, | | | | |
| Refunding, AGMC Insured, 4.00%, 8/01/34 | | 1,000,000 | | 1,019,510 |
| Lemon Grove School District GO, Capital Appreciation, Election of 2008, Series B, AGMC Insured, | | | | |
| zero cpn. to 8/01/28, 6.10% thereafter, 8/01/45 | | 6,500,000 | | 3,949,335 |
franklintempleton.com
Annual Report
| 25
FRANKLIN MUNICIPAL SECURITIES TRUST
STATEMENT OF INVESTMENTS
| | | | |
| Franklin California High Yield Municipal Fund (continued) | | | | |
| | | Principal | | |
| | | Amount | | Value |
| |
| Municipal Bonds (continued) | | | | |
| California (continued) | | | | |
| Long Beach Bond Finance Authority Natural Gas Purchase Revenue, Series A, 5.00%, | | | | |
| 11/15/29 | $ | 4,630,000 | $ | 5,193,934 |
| dLong Beach Marina Revenue, Alamitos Bay Marina Project, 5.00%, | | | | |
| 5/15/34 | | 1,300,000 | | 1,401,387 |
| 5/15/40 | | 3,500,000 | | 3,734,535 |
| 5/15/45 | | 2,500,000 | | 2,652,875 |
| Los Alamitos USD, COP, Capital Appreciation, Capital Projects, zero cpn. to 7/31/24, 5.95% | | | | |
| thereafter, | | | | |
| 8/01/34 | | 1,500,000 | | 1,121,430 |
| 8/01/42 | | 4,500,000 | | 3,293,910 |
| Los Angeles County Schools Regionalized Business Services Corp. COP, Pooled Financing | | | | |
| Program, Series C, 5.00%, 6/01/30 | | 2,200,000 | | 2,487,628 |
| Los Angeles Department of Airports Revenue, Los Angeles International Airport, | | | | |
| Senior, Series B, 5.00%, 5/15/40 | | 3,945,000 | | 4,470,435 |
| Subordinate, Refunding, Series C, 5.00%, 5/15/34 | | 3,135,000 | | 3,601,049 |
| Subordinate, Refunding, Series C, 5.00%, 5/15/35 | | 4,425,000 | | 5,066,625 |
| Subordinate, Refunding, Series C, 5.00%, 5/15/38 | | 4,765,000 | | 5,408,275 |
| M-S-R Energy Authority Gas Revenue, Series B, 6.50%, 11/01/39 | | 32,300,000 | | 42,620,173 |
| Mendocino-Lake Community College District GO, Capital Appreciation, Election of 2006, Series B, | | | | |
| AGMC Insured, | | | | |
| zero cpn. to 8/01/21, 6.55% thereafter, 8/01/36 | | 5,150,000 | | 4,764,471 |
| zero cpn. to 8/01/26, 6.85% thereafter, 8/01/40 | | 7,500,000 | | 5,430,150 |
| Merced CFD No. 2005-1 Special Tax, Improvement Area No. 1, 5.30%, 9/01/36 | | 2,400,000 | | 2,030,304 |
| Merced RDA Tax Allocation, Merced Gateways Redevelopment Project, Series A, 6.50%, | | | | |
| 9/01/39 | | 6,250,000 | | 6,456,812 |
| Merced UHSD, GO, Capital Appreciation, Election of 2008, Series C, zero cpn., 8/01/41 | | 10,000,000 | | 2,139,400 |
| Murrieta CFD No. 2000-2 Special Tax, The Oaks, | | | | |
| Improvement Area A, 5.90%, 9/01/27 | | 1,960,000 | | 1,963,156 |
| Improvement Area A, 6.00%, 9/01/34 | | 3,490,000 | | 3,494,781 |
| Improvement Area B, 6.00%, 9/01/27 | | 1,275,000 | | 1,275,803 |
| Improvement Area B, 6.00%, 9/01/34 | | 3,485,000 | | 3,486,464 |
| Murrieta CFD No. 2004-1 Special Tax, Bremerton, 5.625%, 9/01/34 | | 670,000 | | 671,568 |
| North Natomas CFD Special Tax, No. 4, Refunding, Series E, 5.25%, 9/01/33 | | 3,000,000 | | 3,320,910 |
| Oak Park USD, GO, Capital Appreciation, Series A, zero cpn. to 8/01/21, 7.10% thereafter, | | | | |
| 8/01/38 | | 6,600,000 | | 6,317,124 |
| Oakdale PFAR, Refunding, 5.00%, 9/01/35 | | 1,270,000 | | 1,372,489 |
| Oakland USD Alameda County GO, Election of 2012, 6.625%, 8/01/38 | | 5,000,000 | | 5,904,450 |
| Oakley PFAR, Contra Costa County, Refunding, | | | | |
| 5.30%, 9/02/34 | | 995,000 | | 1,090,032 |
| BAM Insured, 5.00%, 9/02/36 | | 1,500,000 | | 1,646,520 |
| Orange County 1915 Act Special Assessment, Limited Obligation, AD No. 01-1-GP1, 5.10%, | | | | |
| 9/02/33 | | 1,745,000 | | 1,746,972 |
| Orchard School District GO, Election of 2001, Series B, AGMC Insured, 6.00%, 8/01/36 | | 3,000,000 | | 3,614,970 |
| Oro Grande Elementary School District COP, | | | | |
| 5.875%, 9/15/37 | | 14,000,000 | | 16,339,400 |
| 6.125%, 9/15/40 | | 1,500,000 | | 1,765,050 |
| Oxnard Financing Authority Lease Revenue, Refunding, 5.75%, 6/01/36 | | 5,870,000 | | 6,851,229 |
| Palomar Pomerado Health Care District COP, | | | | |
| 6.00%, 11/01/30 | | 10,000,000 | | 10,852,700 |
| 6.75%, 11/01/39 | | 15,550,000 | | 17,143,875 |
26 | Annual Report
franklintempleton.com
FRANKLIN MUNICIPAL SECURITIES TRUST
STATEMENT OF INVESTMENTS
| | | | |
| Franklin California High Yield Municipal Fund (continued) | | | | |
| | | Principal | | |
| | | Amount | | Value |
| |
| Municipal Bonds (continued) | | | | |
| California (continued) | | | | |
| Paramount USD, GO, County of Los Angeles, Election of 2006, BAM Insured, zero cpn., | | | | |
| 8/01/51 | $ | 25,000,000 | $ | 2,469,750 |
| Paso Robles Joint USD, GO, Capital Appreciation, Election of 2006, Series A, zero cpn., | | | | |
| 9/01/45 | | 15,000,000 | | 3,342,900 |
| Perris CFD No. 2001-1 Special Tax, Improvement Area No. 4, May Farms, Series A, | | | | |
| 5.10%, 9/01/30 | | 865,000 | | 873,330 |
| 5.15%, 9/01/35 | | 1,075,000 | | 1,084,202 |
| Perris CFD No. 2001-2 Special Tax, Refunding, Series A, 5.25%, 9/01/32 | | 4,500,000 | | 4,720,545 |
| Perris CFD No. 2004-3 Special Tax, Improvement Area No. 2, Series A, 5.30%, 9/01/35 | | 1,370,000 | | 1,391,879 |
| Perris Joint Powers Authority Local Agency Revenue, | | | | |
| CFD, Refunding, Series E, 4.25%, 9/01/38 | | 4,250,000 | | 4,175,795 |
| May Farms Improvement Area Nos. 1, 2 and 3, Refunding, Series A, 5.375%, 9/01/33 | | 2,000,000 | | 2,108,020 |
| Willowbrook, Refunding, Series B, 5.25%, 9/01/33 | | 3,950,000 | | 4,091,331 |
| Perris PFAR Tax Allocation, | | | | |
| 5.30%, 10/01/26 | | 1,950,000 | | 1,950,254 |
| 5.35%, 10/01/36 | | 3,410,000 | | 3,410,375 |
| Housing Loan, Series A, 6.125%, 10/01/40 | | 3,135,000 | | 3,465,868 |
| Perris UHSD Financing Authority Revenue, 5.00%, 9/01/41 | | 2,725,000 | | 2,868,716 |
| Pico Rivera Water Authority Revenue, Refunding, Series A, 6.25%, 12/01/32 | | 6,675,000 | | 6,680,473 |
| Pittsburg USD, GO, Capital Appreciation, Election of 2010, Series C, zero cpn., | | | | |
| 8/01/47 | | 9,000,000 | | 1,575,630 |
| 8/01/52 | | 15,000,000 | | 1,884,900 |
| Pomona USD, GO, Series F, BAM Insured, 5.00%, 8/01/39 | | 2,500,000 | | 2,777,125 |
| Porterville PFA Sewer Revenue, Series A, 5.625%, 10/01/36 | | 5,000,000 | | 5,986,650 |
| Poway USD Special Tax, | | | | |
| CFD No. 6, 4S Ranch, 5.125%, 9/01/35 | | 5,955,000 | | 6,027,234 |
| CFD No. 6, Improvement Area B, 5.125%, 9/01/36 | | 4,915,000 | | 4,975,209 |
| CFD No. 14, Improvement Area A, Pre-Refunded, 5.25%, 9/01/36 | | 5,225,000 | | 5,342,197 |
| Rancho Cordova CFD No. 2003-1 Special Tax, Sunridge Anatolia, | | | | |
| 5.25%, 9/01/25 | | 2,235,000 | | 2,238,732 |
| 5.375%, 9/01/30 | | 1,650,000 | | 1,652,921 |
| 5.375%, 9/01/37 | | 7,130,000 | | 7,324,720 |
| 5.50%, 9/01/37 | | 2,635,000 | | 2,640,191 |
| Redondo Beach USD, GO, Election of 2008, Capital Appreciation, Series E, zero cpn. to 8/01/22, | | | | |
| 6.20% thereafter, 8/01/31 | | 2,750,000 | | 2,375,368 |
| Redwood City Special Tax, One Marina, 7.75%, 9/01/41 | | 2,000,000 | | 2,138,940 |
| Richland School District GO, Capital Appreciation, Election of 2008, Refunding, Series C, AGMC | | | | |
| Insured, zero cpn., 8/01/49 | | 22,000,000 | | 3,809,080 |
| Rio Elementary School District CFD No. 1 Special Tax, 5.50%, 9/01/39 | | 7,750,000 | | 8,519,110 |
| Rio Hondo Community College District GO, Capital Appreciation, Election of 2004, Series C, zero | | | | |
| cpn. to 8/01/24, 6.85% thereafter, 8/01/42 | | 13,000,000 | | 10,474,230 |
| Riverbank USD, GO, Election of 2005, Series B, Assured Guaranty, zero cpn., | | | | |
| 8/01/38 | | 6,690,000 | | 2,067,009 |
| 8/01/43 | | 8,750,000 | | 2,045,575 |
| Riverside County CFD Special Tax, CFD No. 03-1, Newport Road, Refunding, 5.00%, 9/01/30 | | 1,500,000 | | 1,500,990 |
| Riverside County RDA Tax Allocation, | | | | |
| Desert Communities Redevelopment Project Area, second lien, Series D, 7.00%, 12/01/31 | | 1,425,000 | | 1,765,732 |
| Desert Communities Redevelopment Project Area, second lien, Series D, 7.25%, 12/01/37 | | 2,505,000 | | 3,132,352 |
| Housing, Series A, 6.00%, 10/01/39 | | 3,000,000 | | 3,391,050 |
| Housing, Series A, 7.125%, 10/01/42 | | 1,750,000 | | 2,165,415 |
| Jurupa Valley Redevelopment Project Area, Series B, 6.75%, 10/01/30 | | 1,200,000 | | 1,458,312 |
franklintempleton.com Annual Report | 27
FRANKLIN MUNICIPAL SECURITIES TRUST
STATEMENT OF INVESTMENTS
| | | | |
| Franklin California High Yield Municipal Fund (continued) | | | | |
| | | Principal | | |
| | | Amount | | Value |
| |
| Municipal Bonds (continued) | | | | |
| California (continued) | | | | |
| Riverside County Redevelopment Successor Agency Tax Allocation, Refunding, Series A, 4.00%, | | | | |
| 10/01/37 | $ | 6,000,000 | $ | 5,990,940 |
| Riverside County Transportation Commission Toll Revenue, senior lien, Series A, | | | | |
| 5.75%, 6/01/44 | | 5,000,000 | | 5,729,850 |
| zero cpn., 6/01/43 | | 7,500,000 | | 1,913,175 |
| Riverside PFA Local Measure Sales Tax Revenue, Payment Rehabilitation Project, AGMC Insured, | | | | |
| 5.00%, 6/01/33 | | 4,280,000 | | 4,674,402 |
| Road 17 Levee Area PFA Assessment Revenue, Road 17 Levee Improvement Project, 6.75%, | | | | |
| 9/01/29 | | 2,630,000 | | 3,064,634 |
| Romoland School District Special Tax, CFD No. 2004-1, Heritage Lake, | | | | |
| Improvement Area No. 1, 5.45%, 9/01/38 | | 3,205,000 | | 3,209,679 |
| Improvement Area No. 2, 5.375%, 9/01/38 | | 2,995,000 | | 2,998,235 |
| Improvement Area No. 3, Refunding, 5.00%, 9/01/36 | | 1,500,000 | | 1,574,265 |
| Roseville Special Tax, CFD No. 1, | | | | |
| Fiddyment Ranch, 5.00%, 9/01/19 | | 980,000 | | 994,004 |
| Fiddyment Ranch, 5.125%, 9/01/21 | | 980,000 | | 993,348 |
| Fiddyment Ranch, 5.125%, 9/01/26 | | 4,945,000 | | 4,964,384 |
| Fiddyment Ranch, 5.25%, 9/01/36 | | 7,880,000 | | 7,882,128 |
| Public Facilities, 5.00%, 9/01/29 | | 500,000 | | 505,870 |
| Public Facilities, 5.00%, 9/01/34 | | 1,100,000 | | 1,083,874 |
| Public Facilities, 5.00%, 9/01/39 | | 1,885,000 | | 1,830,712 |
| Public Facilities, 5.00%, 9/01/44 | | 1,650,000 | | 1,588,554 |
| Stone Point, 6.375%, 9/01/24 | | 1,440,000 | | 1,443,830 |
| Stone Point, 6.375%, 9/01/28 | | 2,060,000 | | 2,064,305 |
| Westpark, 5.15%, 9/01/30 | | 5,500,000 | | 5,505,720 |
| Westpark, 5.20%, 9/01/36 | | 2,500,000 | | 2,501,725 |
| Roseville Westpark CFD No. 1 Special Tax, Public Facilities, | | | | |
| 5.20%, 9/01/26 | | 1,000,000 | | 1,003,380 |
| 5.25%, 9/01/37 | | 1,600,000 | | 1,604,832 |
| Rowland USD, GO, Capital Appreciation, Election of 2006, Series B, zero cpn., | | | | |
| 8/01/34 | | 5,000,000 | | 2,175,700 |
| 8/01/39 | | 15,000,000 | | 5,009,100 |
| 8/01/42 | | 10,750,000 | | 2,971,945 |
| Sacramento Area Flood Control Agency Special Assessment, Natomas Basin Local Assessment, | | | | |
| Refunding, BAM Insured, 5.00%, 10/01/44 | | 2,000,000 | | 2,198,460 |
| Sacramento County Airport System Revenue, Senior, Series B, AGMC Insured, 5.25%, 7/01/39 | | 7,000,000 | | 7,500,080 |
| San Bernardino Community College District GO, Election of 2008, Series A, zero cpn., 8/01/44 | | 12,495,000 | | 3,278,063 |
| San Bernardino County Special Tax, CFD No. 2006-1, Improvement Area No. 2, Lytle Creek | | | | |
| North, 5.50%, 9/01/44 | | 1,965,000 | | 2,025,581 |
| San Buenaventura Revenue, Community Memorial Health System, | | | | |
| 8.00%, 12/01/31 | | 10,000,000 | | 12,767,700 |
| 7.50%, 12/01/41 | | 5,000,000 | | 6,133,300 |
| San Diego RDA Tax Allocation Revenue, | | | | |
| City Heights Redevelopment Project, Series A, 5.625%, 9/01/40 | | 2,315,000 | | 2,487,838 |
| Naval Training Center Redevelopment Project, Series A, 5.75%, 9/01/40 | | 3,000,000 | | 3,357,270 |
| San Diego RDA Tax Allocation, Capital Appreciation, Refunding, Series B, zero cpn., | | | | |
| 9/01/15 | | 1,490,000 | | 1,486,797 |
| 9/01/16 | | 1,500,000 | | 1,429,515 |
| 9/01/19 | | 1,800,000 | | 1,422,090 |
| 9/01/20 | | 1,800,000 | | 1,333,800 |
| 9/01/21 | | 1,800,000 | | 1,253,574 |
28 | Annual Report franklintempleton.com
FRANKLIN MUNICIPAL SECURITIES TRUST
STATEMENT OF INVESTMENTS
| | | | |
| Franklin California High Yield Municipal Fund (continued) | | | | |
| | | Principal | | |
| | | Amount | | Value |
| |
| Municipal Bonds (continued) | | | | |
| California (continued) | | | | |
| San Diego RDA Tax Allocation, Capital Appreciation, Refunding, Series B, zero cpn., (continued) | | | | |
| 9/01/22 | $ | 1,900,000 | $ | 1,239,408 |
| 9/01/23 | | 1,900,000 | | 1,164,149 |
| 9/01/24 | | 1,900,000 | | 1,093,925 |
| 9/01/25 | | 1,900,000 | | 1,022,523 |
| 9/01/26 | | 1,900,000 | | 959,956 |
| 9/01/27 | | 1,900,000 | | 900,695 |
| 9/01/28 | | 1,900,000 | | 845,595 |
| San Diego USD, GO, Election of 2008, | | | | |
| Series A, zero cpn. to 7/01/19, 6.00% thereafter, 7/01/33 | | 10,000,000 | | 9,350,600 |
| Series C, zero cpn. to 7/01/30, 6.625% thereafter, 7/01/47 | | 26,025,000 | | 16,342,659 |
| Series E, zero cpn. to 7/01/32, 5.25% thereafter, 7/01/42 | | 6,940,000 | | 3,508,101 |
| Series E, zero cpn. to 7/01/32, 5.375% thereafter, 7/01/47 | | 13,500,000 | | 6,705,180 |
| San Francisco City and County Redevelopment Agency Successor Agency CFD No. 6 Special Tax, | | | | |
| Mission Bay South Public Improvements, Refunding, Series C, zero cpn., 8/01/43 | | 10,000,000 | | 1,981,900 |
| San Francisco City and County Redevelopment Agency Successor Agency Tax Allocation, | | | | |
| Mission Bay South Redevelopment Project, Series A, 5.00%, 8/01/43 | | 2,500,000 | | 2,716,025 |
| San Francisco City and County Redevelopment Financing Authority Tax Allocation, | | | | |
| Mission Bay North Redevelopment Project, Series C, 6.75%, 8/01/41 | | 1,000,000 | | 1,208,330 |
| Mission Bay South Redevelopment Project, Series D, 7.00%, 8/01/33 | | 1,000,000 | | 1,207,940 |
| Mission Bay South Redevelopment Project, Series D, 6.625%, 8/01/39 | | 2,265,000 | | 2,584,773 |
| Mission Bay South Redevelopment Project, Series D, 7.00%, 8/01/41 | | 1,500,000 | | 1,810,170 |
| San Francisco Redevelopment Projects, Series B, 6.625%, 8/01/41 | | 2,500,000 | | 3,067,775 |
| San Gorgonio Memorial Healthcare District GO, Riverside County, Refunding, 5.00%, 8/01/39 | | 15,000,000 | | 16,200,000 |
| San Joaquin County Public Facilities FICO Revenue COP, Wastewater Conveyance Project, | | | | |
| 6.00%, 8/01/37 | | 1,000,000 | | 1,011,190 |
| San Joaquin Delta Community College District GO, Election of 2004, Capital Appreciation, | | | | |
| Series B, AGMC Insured, zero cpn., 8/01/30 | | 3,900,000 | | 1,830,309 |
| San Joaquin Hills Transportation Corridor Agency Toll Road Revenue, | | | | |
| Capital Appreciation, junior lien, ETM, zero cpn., 1/01/28 | | 19,150,000 | | 13,464,939 |
| Capital Appreciation, Refunding, Series A, NATL Insured, zero cpn., 1/15/26 | | 19,475,000 | | 12,923,805 |
| Capital Appreciation, Refunding, Series A, NATL Insured, zero cpn., 1/15/32 | | 50,225,000 | | 24,250,137 |
| Refunding, Series B, 5.25%, 1/15/44 | | 35,000,000 | | 37,623,250 |
| Refunding, Series B, 5.25%, 1/15/49 | | 75,000,000 | | 80,011,500 |
| San Jose RDA Tax Allocation, Merged Area Redevelopment Project, Series B, XLCA Insured, | | | | |
| 5.00%, 8/01/28 | | 13,245,000 | | 13,701,952 |
| 4.25%, 8/01/36 | | 5,000,000 | | 5,067,800 |
| San Marcos RDA Tax Allocation, Affordable Housing Project, Series A, 5.65%, 10/01/28 | | 1,655,000 | | 1,656,324 |
| San Mateo Special Tax, CFD No. 2008-1, Bay Meadows, | | | | |
| 5.875%, 9/01/32 | | 1,500,000 | | 1,666,305 |
| 5.375%, 9/01/38 | | 2,500,000 | | 2,755,475 |
| 6.00%, 9/01/42 | | 5,000,000 | | 5,576,600 |
| 5.50%, 9/01/44 | | 3,300,000 | | 3,647,754 |
| Santa Ana College Improvement District No. 1 of Rancho Santiago Community College District GO, | | | | |
| Election 2012, Series A, 5.00%, 8/01/39 | | 3,750,000 | | 4,212,450 |
| Santa Barbara Elementary School District GO, Election of 2010, Capital Appreciation, Series A, | | | | |
| zero cpn. to 8/01/23, 7.00% thereafter, 8/01/36 | | 8,000,000 | | 7,357,760 |
| Santa Cruz County RDA Tax Allocation, 6.625%, 9/01/29 | | 2,650,000 | | 3,062,366 |
| Santa Margarita Water District Special Tax, CFD No. 2013-1, Village of Sendero, 5.625%, | | | | |
| 9/01/36 | | 3,000,000 | | 3,310,500 |
| 9/01/43 | | 10,000,000 | | 11,005,600 |
franklintempleton.com Annual Report | 29
FRANKLIN MUNICIPAL SECURITIES TRUST
STATEMENT OF INVESTMENTS
| | | | |
| Franklin California High Yield Municipal Fund (continued) | | | | |
| | | Principal | | |
| | | Amount | | Value |
| |
| Municipal Bonds (continued) | | | | |
| California (continued) | | | | |
| Santa Paula Utility Authority Wastewater Enterprise Revenue, Series A, 5.00%, 2/01/40 | $ | 7,105,000 | $ | 7,806,761 |
| Santee Community Development Commission Tax Allocation, Santee Community Redevelopment | | | | |
| Project, Series A, 7.00%, | | | | |
| 8/01/31 | | 1,800,000 | | 2,122,920 |
| 8/01/41 | | 2,820,000 | | 3,325,908 |
| Saugus Castaic School Facilities Financing Authority Special Tax, Community Facilities District | | | | |
| No. 2006-1C, | | | | |
| 5.875%, 9/01/33 | | 1,375,000 | | 1,479,390 |
| 6.00%, 9/01/43 | | 3,485,000 | | 3,903,653 |
| Saugus USD Special Tax, | | | | |
| CFD No. 2005-1, 5.30%, 9/01/36 | | 2,000,000 | | 2,006,720 |
| CFD No. 2006-1, Improvement Area No. 1, 5.375%, 9/01/42 | | 2,000,000 | | 2,061,860 |
| CFD No. 2006-1, Improvement Area No. 2, 5.75%, 9/01/43 | | 2,000,000 | | 2,062,440 |
| CFD No. 2006-2, Improvement Area No. 2, 4.25%, 9/01/44 | | 2,000,000 | | 1,934,820 |
| Senior CFD No. 2006-1, 4.25%, 9/01/39 | | 1,150,000 | | 1,131,117 |
| Senior CFD No. 2006-1, 4.25%, 9/01/44 | | 2,500,000 | | 2,438,500 |
| Selma PFA Lease Revenue, Bank Qualified, Refunding, 7.00%, 2/01/40 | | 3,265,000 | | 3,281,292 |
| Sierra View Local Health Care District Revenue, 5.25%, 7/01/32 | | 3,000,000 | | 3,208,830 |
| Simi Valley 1915 Act Special Assessment, AD No. 98-1, Madera, 7.30%, 9/02/24 | | 1,720,000 | | 1,729,529 |
| Siskiyou UHSD, GO, Capital Appreciation, Election of 2008, Series B, AGMC Insured, zero cpn., | | | | |
| 8/01/49 | | 15,015,000 | | 2,481,229 |
| Sonoma CDA Tax Allocation, Redevelopment Project, 7.00%, 12/01/30 | | 2,115,000 | | 2,495,933 |
| Southern California Public Power Authority Transmission Project Revenue, Southern | | | | |
| Transmission Project, 6.125%, 7/01/18 | | 50,000 | | 50,203 |
| St. Helena USD, GO, Capital Appreciation, zero cpn. to 8/01/25, 6.45% thereafter, 6/01/36 | | 10,000,000 | | 7,646,600 |
| b,e,fStockton PFA Lease Revenue, Capital Improvement Projects, Series A, 7.00%, 9/01/38 | | 7,000,000 | | 175,000 |
| Susanville PFAR, Utility Enterprises Project, Refunding, Sub Series B, | | | | |
| 5.50%, 6/01/30 | | 1,185,000 | | 1,264,075 |
| 5.875%, 6/01/35 | | 1,660,000 | | 1,781,379 |
| 6.00%, 6/01/45 | | 6,180,000 | | 6,635,342 |
| Susanville School District GO, Capital Appreciation, Election of 2008, AGMC Insured, zero cpn., | | | | |
| 8/01/49 | | 17,505,000 | | 2,671,088 |
| Temecula RDA Tax Allocation Revenue, | | | | |
| Housing, Redevelopment Project No. 1, Series A, 7.00%, 8/01/39 | | 2,100,000 | | 2,715,594 |
| sub. lien, Escrow, Redevelopment Project No. 1, 5.625%, 12/15/38 | | 1,860,000 | | 1,911,206 |
| Tobacco Securitization Authority Northern California Tobacco Settlement Revenue, | | | | |
| Asset-Backed, Series A-1, 5.375%, 6/01/38 | | 5,000,000 | | 4,202,750 |
| Asset-Backed, Series A-1, 5.50%, 6/01/45 | | 800,000 | | 653,736 |
| Capital Appreciation, Asset-Backed, Series A-2, 5.40%, 6/01/27 | | 1,250,000 | | 1,185,488 |
| Tobacco Securitization Authority Southern California Tobacco Settlement Revenue, Second Sub. | | | | |
| Capital Appreciation, Refunding, Series C, zero cpn., 6/01/46 | | 25,000,000 | | 863,250 |
| Torrance USD, GO, Capital Appreciation, Election of 2008, Measure Z, Series B-1, zero cpn., | | | | |
| 8/01/34 | | 5,640,000 | | 2,384,197 |
| Truckee-Donner PUD Special Tax, CFD No. 04-1, | | | | |
| 5.20%, 9/01/25 | | 3,000,000 | | 3,002,910 |
| 5.75%, 9/01/29 | | 2,975,000 | | 2,977,410 |
| 5.25%, 9/01/30 | | 5,050,000 | | 5,053,636 |
| 5.80%, 9/01/35 | | 4,530,000 | | 4,531,993 |
| Tulare RDA Tax Allocation, Merged Tulare Redevelopment Projects, Series A, 6.25%, 8/01/40 | | 3,540,000 | | 3,909,611 |
30 | Annual Report
franklintempleton.com
FRANKLIN MUNICIPAL SECURITIES TRUST
STATEMENT OF INVESTMENTS
| | | | |
| Franklin California High Yield Municipal Fund (continued) | | | | |
| | | Principal | | |
| | | Amount | | Value |
| |
| Municipal Bonds (continued) | | | | |
| California (continued) | | | | |
| Tulare Sewer Revenue, 6.50%, 11/15/45 | $ | 10,000,000 | $ | 11,984,000 |
| Turlock PFA Tax Allocation Revenue, 7.50%, 9/01/39 | | 3,750,000 | | 4,474,650 |
| Tustin CFD No. 07-1 Special Tax, Tustin Legacy, 6.00%, 9/01/37 | | 2,100,000 | | 2,241,603 |
| Tustin USD Special Tax, CFD No. 06-1, | | | | |
| 5.75%, 9/01/30 | | 1,000,000 | | 1,092,360 |
| 6.00%, 9/01/40 | | 3,000,000 | | 3,306,450 |
| Union Elementary School District GO, Santa Clara County, Election of 2014, Series A, 5.00%, | | | | |
| 9/01/49 | | 2,375,000 | | 2,662,137 |
| University of California Revenue, Refunding, Series AO, 5.00%, 5/15/40 | | 5,000,000 | | 5,697,650 |
| Val Verde USD Special Tax Revenue, Refunding, 5.00%, | | | | |
| 9/01/29 | | 3,200,000 | | 3,515,584 |
| 9/01/37 | | 2,000,000 | | 2,163,320 |
| Vallejo RDA Tax Allocation, Housing Set-Aside, Refunding, Series A, 7.00%, 10/01/31 | | 3,765,000 | | 3,767,824 |
| Vernon Electric System Revenue, Series A, 5.50%, 8/01/41 | | 7,500,000 | | 8,302,275 |
| d Victor Elementary School District GO, Election of 2008, Refunding, Series B, 5.00%, 8/01/42 | | 5,455,000 | | 6,045,067 |
| Victor Valley Community College District GO, Capital Appreciation, Election of 2002, Series C, | | | | |
| zero cpn., 6/01/49 | | 11,940,000 | | 2,181,557 |
| Washington Township Health Care District Revenue, Series A, 5.50%, 7/01/38 | | 2,890,000 | | 3,091,433 |
| West Hollywood Community Development Commission Tax Allocation, East Side Redevelopment | | | | |
| Project, Series A, | | | | |
| 7.25%, 9/01/31 | | 1,000,000 | | 1,259,790 |
| 7.50%, 9/01/42 | | 5,000,000 | | 6,353,850 |
| William S. Hart UHSD, CFD No. 2005-1 Special Tax, Refunding, 5.00%, 9/01/36 | | 2,505,000 | | 2,747,760 |
| Woodland Finance Authority Water Revenue, 6.00%, | | | | |
| 3/01/36 | | 1,000,000 | | 1,214,200 |
| 3/01/41 | | 1,500,000 | | 1,785,435 |
| Yorba Linda RDA Tax Allocation, sub. lien, Redevelopment Project, Series A, 6.50%, 9/01/32 | | 2,750,000 | | 3,405,490 |
| Yucaipa Special Tax, CFD No. 98-1 Chapman Heights, Refunding, | | | | |
| 5.00%, 9/01/26 | | 1,000,000 | | 1,072,410 |
| 5.375%, 9/01/30 | | 1,800,000 | | 1,981,242 |
| Yucca Valley RDA Tax Allocation, Yucca Valley Redevelopment Project No. 1, | | | | |
| 5.50%, 6/01/28 | | 2,110,000 | | 2,172,055 |
| 5.75%, 6/01/38 | | 5,485,000 | | 5,676,591 |
| | | | | 1,816,190,158 |
| U.S. Territories 4.3% | | | | |
| Guam 1.2% | | | | |
| Guam Government GO, | | | | |
| Refunding, Series A, 5.00%, 11/15/23 | | 6,745,000 | | 7,044,208 |
| Refunding, Series A, 5.25%, 11/15/37 | | 6,500,000 | | 6,796,660 |
| Series A, 7.00%, 11/15/39 | | 5,000,000 | | 5,990,350 |
| Guam Government Waterworks Authority Water and Wastewater System Revenue, 5.625%, | | | | |
| 7/01/40 | | 4,000,000 | | 4,434,360 |
| | | | | 24,265,578 |
| Northern Mariana Islands 0.1% | | | | |
| Northern Mariana Islands Commonwealth Ports Authority Seaport Revenue, Senior Series A, | | | | |
| 6.60%, 3/15/28 | | 1,325,000 | | 1,341,708 |
franklintempleton.com
Annual Report
| 31
FRANKLIN MUNICIPAL SECURITIES TRUST
STATEMENT OF INVESTMENTS
| | | | |
| Franklin California High Yield Municipal Fund (continued) | | | | |
| | | Principal | | |
| | | Amount | | Value |
| |
| Municipal Bonds (continued) | | | | |
| U.S. Territories (continued) | | | | |
| Puerto Rico 3.0% | | | | |
| Puerto Rico Commonwealth GO, Public Improvement, Refunding, Series A, 5.50%, 7/01/39 | $ | 15,000,000 | $ | 10,912,650 |
| Puerto Rico Electric Power Authority Power Revenue, | | | | |
| Refunding, Series A, 5.00%, 7/01/29 | | 10,000,000 | | 5,875,800 |
| Refunding, Series A, 5.00%, 7/01/42 | | 6,000,000 | | 3,495,000 |
| Series A, 7.00%, 7/01/33 | | 25,000,000 | | 14,562,500 |
| Series A, 6.75%, 7/01/36 | | 11,735,000 | | 6,835,638 |
| Series A, 7.00%, 7/01/43 | | 5,000,000 | | 2,912,500 |
| Puerto Rico Industrial Tourist Educational Medical and Environmental Control Facilities Financing | | | | |
| Authority Revenue, Cogeneration Facility, AES Puerto Rico Project, 6.625%, 6/01/26 | | 5,500,000 | | 5,230,555 |
| Puerto Rico PBA Guaranteed Revenue, Government Facilities, Refunding, Series U, 5.25%, | | | | |
| 7/01/42 | | 20,000,000 | | 13,475,000 |
| | | | | 63,299,643 |
| Total U.S. Territories | | | | 88,906,929 |
| Total Municipal Bonds (Cost $1,755,429,337) | | | | 1,905,097,087 |
| Total Investments before Short Term Investments (Cost $1,759,564,546) | | | | 1,909,249,911 |
| Short Term Investments 3.3% | | | | |
| Municipal Bonds 3.3% | | | | |
| California 3.3% | | | | |
| gCalifornia State GO, | | | | |
| Kindergarten, Refunding, Series A3, Daily VRDN and Put, 0.06%, 5/01/34 | | 11,800,000 | | 11,800,000 |
| Series A-1, Daily VRDN and Put, 0.06%, 5/01/33 | | 28,600,000 | | 28,600,000 |
| g Los Angeles Department of Water and Power Revenue, Water System, Series B, Sub Series B-2, | | | | |
| Daily VRDN and Put, 0.08%, 7/01/35 | | 29,200,000 | | 29,200,000 |
| Total Short Term Investments (Cost $69,600,000) | | | | 69,600,000 |
| Total Investments (Cost $1,829,164,546) 94.5% | | | | 1,978,849,911 |
| Other Assets, less Liabilities 5.5% | | | | 116,189,912 |
| Net Assets 100.0% | | | $ | 2,095,039,823 |
See Abbreviations on page 48.
†Rounds to less than 0.1% of net assets.
aNon-income producing.
bSecurity has been deemed illiquid because it may not be able to be sold within seven days. At May 31, 2015, the aggregate value of these securities was $14,999,740,
representing 0.72% of net assets.
cIncome may be received in additional securities and/or cash.
dSecurity purchased on a when-issued basis. See Note 1(b).
eSee Note 6 regarding defaulted securities.
fAt May 31, 2015, pursuant to the Fund’s policies and the requirements of applicable securities law, the Fund may be restricted from trading this security for a limited
or extended period of time.
gVariable rate demand notes (VRDNs) are tax-exempt obligations which contain a floating or variable interest rate adjustment formula and an unconditional right of
demand to receive payment of the principal balance plus accrued interest at specified dates. The coupon rate shown represents the rate at period end.
32 | Annual Report | The accompanying notes are an integral part of these financial statements.
franklintempleton.com
| | | | | | | | | | | | | | | |
| | | | | | FRANKLIN MUNICIPAL SECURITIES TRUST | |
| |
| |
| Financial Highlights | | | | | | | | | | | | | | | |
| Franklin Tennessee Municipal Bond Fund | | | | | | | | | | | | | | | |
| | | | | | | | | Year Ended May 31, | | | | |
| | | 2015 | | | 2014 | | | 2013 | | | 2012 | | | 2011 | |
| Class A | | | | | | | | | | | | | | | |
| Per share operating performance | | | | | | | | | | | | | | | |
| (for a share outstanding throughout the year) | | | | | | | | | | | | | | | |
| Net asset value, beginning of year | $ | 11.47 | | $ | 11.88 | | $ | 11.94 | | $ | 11.19 | | $ | 11.35 | |
| Income from investment operationsa: | | | | | | | | | | | | | | | |
| Net investment incomeb | | 0.41 | | | 0.43 | | | 0.41 | | | 0.44 | | | 0.44 | |
| Net realized and unrealized gains (losses) | | (0.08 | ) | | (0.42 | ) | | (0.06 | ) | | 0.75 | | | (0.16 | ) |
| Total from investment operations | | 0.33 | | | 0.01 | | | 0.35 | | | 1.19 | | | 0.28 | |
| Less distributions from net investment income | | (0.42 | ) | | (0.42 | ) | | (0.41 | ) | | (0.44 | ) | | (0.44 | ) |
| Net asset value, end of year | $ | 11.38 | | $ | 11.47 | | $ | 11.88 | | $ | 11.94 | | $ | 11.19 | |
| |
| Total returnc | | 2.86 | % | | 0.20 | % | | 2.93 | % | | 10.84 | % | | 2.59 | % |
| |
| Ratios to average net assets | | | | | | | | | | | | | | | |
| Expenses before waiver and payments by affiliates | | 0.72 | % | | 0.72 | % | | 0.70 | % | | 0.71 | % | | 0.71 | % |
| Expenses net of waiver and payments by affiliates | | 0.71 | % | | 0.70 | % | | 0.70 | % | | 0.70 | % | | 0.70 | % |
| Net investment income | | 3.60 | % | | 3.82 | % | | 3.40 | % | | 3.82 | % | | 3.96 | % |
| |
| Supplemental data | | | | | | | | | | | | | | | |
| Net assets, end of year (000’s) | $ | 293,580 | | $ | 273,142 | | $ | 344,157 | | $ | 312,688 | | $ | 270,041 | |
| Portfolio turnover rate | | 11.64 | % | | 7.86 | % | | 7.89 | % | | 5.71 | % | | 14.28 | % |
aThe amount shown for a share outstanding throughout the period may not correlate with the Statement of Operations for the period due to the timing of sales and
repurchases of the Fund’s shares in relation to income earned and/or fluctuating fair value of the investments of the Fund.
bBased on average daily shares outstanding.
cTotal return does not reflect sales commissions or contingent deferred sales charges, if applicable.
franklintempleton.com
The accompanying notes are an integral part of these financial statements. | Annual Report | 33
| | | | |
| FRANKLIN MUNICIPAL SECURITIES TRUST | | | | |
| |
| |
| |
| |
| Statement of Investments, May 31, 2015 | | | | |
| |
| Franklin Tennessee Municipal Bond Fund | | | | |
| | | Principal | | |
| | | Amount | | Value |
| Municipal Bonds 96.4% | | | | |
| Tennessee 89.9% | | | | |
| Anderson County Water Authority Water and Sewer Revenue, 5.00%, 6/01/36 | $ | 1,000,000 | $ | 1,132,760 |
| Blount County PBA Revenue, Local Government Public Improvement, | | | | |
| Refunding, Series B-15-A, Assured Guaranty, 5.00%, 6/01/28 | | 425,000 | | 469,187 |
| Refunding, Series B-15-A, Assured Guaranty, 5.00%, 6/01/32 | | 1,590,000 | | 1,745,979 |
| Refunding, Series B-15-A, Assured Guaranty, Pre-Refunded, 5.00%, 6/01/28 | | 675,000 | | 750,857 |
| Series B-15-A, Assured Guaranty, Pre-Refunded, 5.00%, 6/01/32 | | 975,000 | | 1,084,571 |
| Bristol Electric System Revenue, AMBAC Insured, Pre-Refunded, 5.00%, 9/01/29 | | 1,075,000 | | 1,087,846 |
| Chattanooga Electric System Revenue, Series A, 5.00%, 9/01/33 | | 7,500,000 | | 8,217,900 |
| Chattanooga Health Educational and Housing Facility Board Revenue, Catholic Health Initiatives, | | | | |
| Series D, 6.25%, 10/01/33 | | 500,000 | | 569,455 |
| Chattanooga-Hamilton County Hospital Authority Hospital Revenue, | | | | |
| AGMC Insured, Pre-Refunded, 5.00%, 10/01/22 | | 775,000 | | 887,181 |
| Refunding, AGMC Insured, 5.00%, 10/01/22 | | 2,475,000 | | 2,796,651 |
| Clarksville Electric System Revenue, | | | | |
| Refunding, 5.00%, 9/01/31 | | 1,000,000 | | 1,171,830 |
| Series A, 5.00%, 9/01/34 | | 2,000,000 | | 2,289,740 |
| Series A, 5.00%, 9/01/35 | | 3,185,000 | | 3,639,627 |
| XLCA Insured, Pre-Refunded, 5.00%, 9/01/23 | | 2,325,000 | | 2,545,038 |
| XLCA Insured, Pre-Refunded, 5.00%, 9/01/32 | | 4,000,000 | | 4,378,560 |
| Clarksville Water Sewer and Gas Revenue, Refunding, 5.00%, 2/01/38 | | 3,000,000 | | 3,351,240 |
| Columbia Waterworks System Revenue, 5.00%, 12/01/32 | | 3,000,000 | | 3,378,060 |
| Franklin County Health and Educational Facilities Board Revenue, The University of the South Project, | | | | |
| AMBAC Insured, Pre-Refunded, 5.00%, 9/01/24 | | 2,000,000 | | 2,023,900 |
| Gallatin Water and Sewer Revenue, | | | | |
| Assured Guaranty, Pre-Refunded, 5.00%, 1/01/33 | | 2,215,000 | | 2,439,313 |
| Refunding and Improvement, 5.00%, 1/01/32 | | 1,500,000 | | 1,748,100 |
| Greene County GO, Rural School, Refunding, Series B, NATL Insured, 5.00%, 6/01/24 | | 1,000,000 | | 1,043,360 |
| Hallsdale-Powell Utility District of Knox County Waterworks and Sewer Revenue, Improvement, NATL | | | | |
| Insured, 5.00%, 4/01/31 | | 1,000,000 | | 1,060,240 |
| Harpeth Valley Utilities District of Davidson and Williamson Counties Revenue, Utilities, | | | | |
| 5.00%, 9/01/44 | | 4,400,000 | | 4,913,524 |
| Improvement, NATL Insured, 5.00%, 9/01/35 | | 3,700,000 | | 3,971,913 |
| Hawkins County First Utility District Waterworks Revenue, Series B, Assured Guaranty, 5.00%, | | | | |
| 6/01/42 | | 1,250,000 | | 1,355,812 |
| Jackson Hospital Revenue, | | | | |
| Jackson-Madison County General Hospital, Improvement, Pre-Refunded, 5.50%, 4/01/33 | | 2,125,000 | | 2,387,119 |
| Jackson-Madison County General Hospital, Refunding, 5.00%, 4/01/36 | | 7,000,000 | | 7,725,480 |
| Jackson-Madison County General Hospital, Refunding and Improvement, 5.50%, 4/01/33 | | 875,000 | | 959,525 |
| Johnson City Electric System Revenue, Improvement, AGMC Insured, 5.00%, 5/01/29 | | 1,000,000 | | 1,102,930 |
| Johnson City Health and Educational Facilities Board Hospital Revenue, Johnson City Medical Center | | | | |
| Hospital, Improvement, Series C, NATL Insured, Pre-Refunded, 5.125%, 7/01/25 | | 260,000 | | 260,606 |
| Kingsport GO, Series B, Assured Guaranty, 5.00%, 3/01/29 | | 1,030,000 | | 1,161,170 |
| Kingsport IDB, MFHR, Model City Apartments Project, GNMA Secured, 5.50%, 7/20/39 | | 2,995,000 | | 3,026,717 |
| Knox County First Utility District Water and Sewer Revenue, | | | | |
| 5.00%, 12/01/32 | | 1,000,000 | | 1,158,050 |
| NATL Insured, Pre-Refunded, 5.00%, 12/01/24 | | 1,790,000 | | 1,910,342 |
| NATL Insured, Pre-Refunded, 5.00%, 12/01/25 | | 1,000,000 | | 1,067,230 |
| Refunding and Improvement, 5.00%, 12/01/26 | | 1,390,000 | | 1,606,576 |
| Knox County Health Educational and Housing Facility Board Hospital Revenue, Covenant Health, | | | | |
| Refunding and Improvement, Series A, zero cpn., 1/01/36 | | 2,000,000 | | 713,800 |
34 | Annual Report
franklintempleton.com
FRANKLIN MUNICIPAL SECURITIES TRUST
STATEMENT OF INVESTMENTS
| | | | |
| Franklin Tennessee Municipal Bond Fund (continued) | | | | |
| | | Principal | | |
| | | Amount | | Value |
| Municipal Bonds (continued) | | | | |
| Tennessee (continued) | | | | |
| Knox County Health Educational and Housing Facility Board Revenue, University Health System Inc., | | | | |
| Refunding, 5.25%, | | | | |
| 4/01/27 | $ | 2,500,000 | $ | 2,654,800 |
| 4/01/36 | | 5,000,000 | | 5,211,150 |
| Knox-Chapman Utility District of Knox County Water and Sewer Revenue, | | | | |
| 5.25%, 1/01/36 | | 1,500,000 | | 1,678,665 |
| Refunding and Improvement, 5.00%, 1/01/33 | | 1,470,000 | | 1,709,154 |
| Refunding and Improvement, 4.00%, 1/01/40 | | 4,000,000 | | 4,107,880 |
| Knoxville Wastewater System Revenue, Improvement, Refunding, Series A, 4.00%, 4/01/42 | | 5,000,000 | | 5,043,300 |
| Lawrenceburg PBA, GO, Electric System, Refunding, AMBAC Insured, 5.00%, 7/01/22 | | 2,455,000 | | 2,727,775 |
| Loudon Water and Sewer Revenue, Exempt Facility, Series A, | | | | |
| 4.00%, 3/01/28 | | 1,000,000 | | 1,012,350 |
| 5.00%, 3/01/32 | | 1,300,000 | | 1,419,444 |
| Manchester GO, Refunding, AGMC Insured, 5.00%, 6/01/38 | | 2,665,000 | | 3,016,114 |
| Maryville Water and Sewer Revenue, Series A, Assured Guaranty, 5.00%, 6/01/38 | | 5,500,000 | | 5,995,715 |
| aMaury County GO, Public Improvement, Refunding, 4.00%, 4/01/34 | | 1,775,000 | | 1,857,236 |
| Memphis Electric System Revenue, 5.00%, 12/01/34 | | 1,000,000 | | 1,150,800 |
| Memphis GO, General Improvement, | | | | |
| Assured Guaranty, Pre-Refunded, 5.00%, 4/01/27 | | 1,975,000 | | 2,246,977 |
| Refunding, 5.00%, 5/01/36 | | 4,135,000 | | 4,610,608 |
| Memphis-Shelby County Airport Authority Airport Revenue, | | | | |
| Refunding, Series B, 5.75%, 7/01/25 | | 2,500,000 | | 2,872,275 |
| Refunding, Series D, 5.00%, 7/01/25 | | 3,000,000 | | 3,442,260 |
| Series A, AGMC Insured, 5.00%, 7/01/35 | | 5,000,000 | | 5,413,700 |
| Series A, AGMC Insured, 5.00%, 7/01/39 | | 2,565,000 | | 2,730,212 |
| Memphis-Shelby County Sports Authority Inc. Revenue, Memphis Arena Project, Refunding, Series B, | | | | |
| 5.375%, 11/01/29 | | 5,000,000 | | 5,784,550 |
| Metropolitan Government of Nashville and Davidson County Electric System Revenue, Series A, | | | | |
| 5.00%, 5/15/36 | | 3,500,000 | | 3,878,805 |
| 5.00%, 5/15/39 | | 4,000,000 | | 4,579,880 |
| Pre-Refunded, 5.00%, 5/15/33 | | 3,000,000 | | 3,347,040 |
| Metropolitan Government of Nashville and Davidson County GO, | | | | |
| Improvement, Refunding, Series A, 5.00%, 1/01/33 | | 5,000,000 | | 5,691,350 |
| Series B, Pre-Refunded, 5.00%, 8/01/25 | | 5,000,000 | | 5,270,950 |
| Metropolitan Government of Nashville and Davidson County Health and Educational Facilities Board | | | | |
| Revenue, Vanderbilt University, | | | | |
| Refunding, Series B, 5.00%, 10/01/39 | | 9,000,000 | | 10,157,670 |
| Series A, 5.50%, 10/01/29 | | 3,500,000 | | 4,113,375 |
| Metropolitan Government of Nashville and Davidson County Sports Authority Revenue, Public | | | | |
| Improvement, Ballpark Project, Series A, 5.00%, | | | | |
| 8/01/38 | | 3,000,000 | | 3,339,450 |
| 8/01/43 | | 2,075,000 | | 2,295,759 |
| Pigeon Forge IDB Revenue, Public Facility, 5.00%, 6/01/34 | | 1,250,000 | | 1,385,500 |
| Rutherford County Consolidated Utility District Waterworks Revenue, AGMC Insured, Pre-Refunded, | | | | |
| 5.00%, 2/01/36 | | 3,060,000 | | 3,156,574 |
| Rutherford County Health and Educational Facilities Board Revenue, Ascension Health Senior Credit | | | | |
| Group, Series C, 5.00%, 11/15/40 | | 10,000,000 | | 10,936,200 |
| Shelby County Health Educational and Housing Facility Board Revenue, | | | | |
| Baptist Memorial Health Care, Series A, 5.00%, 9/01/19 | | 3,015,000 | | 3,400,890 |
| Educational Facilities, Rhodes College, 5.00%, 8/01/40 | | 750,000 | | 848,895 |
| Educational Facilities, Rhodes College, 5.50%, 8/01/40 | | 5,000,000 | | 5,731,500 |
franklintempleton.com Annual Report | 35
FRANKLIN MUNICIPAL SECURITIES TRUST
STATEMENT OF INVESTMENTS
| | | | |
| Franklin Tennessee Municipal Bond Fund (continued) | | | | |
| | | Principal | | |
| | | Amount | | Value |
| Municipal Bonds (continued) | | | | |
| Tennessee (continued) | | | | |
| Shelby County Health Educational and Housing Facility Board Revenue, (continued) | | | | |
| Educational Facilities, Rhodes College, 5.00%, 8/01/45 | $ | 1,700,000 | $ | 1,913,299 |
| Methodist Healthcare, Series B, AGMC Insured, 5.25%, 9/01/27 | | 5,000,000 | | 5,462,550 |
| St. Jude Children’s Research Hospital, Refunding, 5.00%, 7/01/36 | | 5,000,000 | | 5,194,550 |
| South Blount County Utility District Waterworks Revenue, Refunding and Improvement, AGMC Insured, | | | | |
| 5.00%, 12/01/33 | | 1,000,000 | | 1,129,260 |
| 5.25%, 12/01/39 | | 3,310,000 | | 3,744,305 |
| Tennessee HDA Residential Financing Program Revenue, Issue 1C, 4.00%, 7/01/43 | | 2,870,000 | | 2,871,779 |
| Tennessee HDA Revenue, Homeownership Program, | | | | |
| Series 1, 5.00%, 7/01/29 | | 1,090,000 | | 1,134,537 |
| Series 2C, 3.80%, 7/01/43 | | 1,875,000 | | 1,843,125 |
| Tennessee State School Bond Authority Revenue, Higher Educational Facilities, Second Program, | | | | |
| Refunding, Series B, 5.00%, 11/01/40 | | 10,000,000 | | 11,477,800 |
| Series A, Pre-Refunded, 5.00%, 5/01/34 | | 3,555,000 | | 3,707,901 |
| Series A, Pre-Refunded, 5.00%, 5/01/39 | | 3,000,000 | | 3,421,920 |
| Series B, Pre-Refunded, 5.50%, 5/01/38 | | 4,000,000 | | 4,513,920 |
| West Wilson Utility District of Wilson County Water Revenue, 5.00%, 6/01/33 | | 3,000,000 | | 3,431,280 |
| | | | | 263,797,218 |
| U.S. Territories 6.5% | | | | |
| Guam 1.8% | | | | |
| Guam Economic Development and Commerce Authority Revenue, Tobacco Settlement, Asset-Backed | | | | |
| Bonds, Refunding, 5.25%, 6/01/32 | | 1,680,000 | | 1,630,390 |
| Guam Government Limited Obligation Revenue, Section 30, Series A, 5.625%, 12/01/29 | | 3,205,000 | | 3,618,092 |
| | | | | 5,248,482 |
| Puerto Rico 4.7% | | | | |
| Puerto Rico Electric Power Authority Power Revenue, Series XX, 5.25%, 7/01/40 | | 5,000,000 | | 2,912,500 |
| Puerto Rico PBA Guaranteed Revenue, Government Facilities, Series S, 6.00%, 7/01/41 | | 5,000,000 | | 3,470,100 |
| Puerto Rico Sales Tax FICO Sales Tax Revenue, first subordinate, | | | | |
| Series A, 6.50%, 8/01/44 | | 8,000,000 | | 5,120,000 |
| Series C, 5.50%, 8/01/40 | | 4,000,000 | | 2,480,080 |
| | | | | 13,982,680 |
| Total U.S. Territories | | | | 19,231,162 |
| Total Municipal Bonds (Cost $271,817,248) 96.4% | | | | 283,028,380 |
| Other Assets, less Liabilities 3.6% | | | | 10,551,763 |
| Net Assets 100.0% | | | $ | 293,580,143 |
See Abbreviations on page 48.
aSecurity purchased on a when-issued basis. See Note 1(b).
36 | Annual Report | The accompanying notes are an integral part of these financial statements.
franklintempleton.com
FRANKLIN MUNICIPAL SECURITIES TRUST
| | | | | | | |
| Financial Statements | | | | | | | |
| |
| Statements of Assets and Liabilities | | | | | | | |
| May 31, 2015 | | | | | | | |
| |
| | | | Franklin | | | Franklin | |
| | | | California | | | Tennessee | |
| | | | High Yield | | | Municipal | |
| | | | Municipal Fund | | | Bond Fund | |
| Assets: | | | | | | | |
| Investments in securities: | | | | | | | |
| Cost | $ | | 1,829,164,546 | | $ | 271,817,248 | |
| Value | $ | | 1,978,849,911 | | $ | 283,028,380 | |
| Cash | | | 109,226,112 | | | 9,003,841 | |
| Receivables: | | | | | | | |
| Capital shares sold | | | 3,624,937 | | | 824,299 | |
| Interest | | | 24,044,467 | | | 3,656,124 | |
| Other assets | | | 996 | | | 139 | |
| Total assets | | | 2,115,746,423 | | | 296,512,783 | |
| Liabilities: | | | | | | | |
| Payables: | | | | | | | |
| Investment securities purchased | | | 13,685,199 | | | 1,833,273 | |
| Capital shares redeemed | | | 3,941,146 | | | 759,714 | |
| Management fees | | | 821,459 | | | 133,034 | |
| Distribution fees | | | 289,893 | | | 24,846 | |
| Transfer agent fees | | | 168,567 | | | 22,246 | |
| Distributions to shareholders | | | 1,710,956 | | | 111,066 | |
| Accrued expenses and other liabilities | | | 89,380 | | | 48,461 | |
| Total liabilities | | | 20,706,600 | | | 2,932,640 | |
| Net assets, at value | $ | | 2,095,039,823 | | $ | 293,580,143 | |
| Net assets consist of: | | | | | | | |
| Paid-in capital | $ | | 2,037,660,282 | | $ | 288,241,099 | |
| Undistributed net investment income | | | 5,806,673 | | | 352,918 | |
| Net unrealized appreciation (depreciation) | | | 149,685,365 | | | 11,211,132 | |
| Accumulated net realized gain (loss) | | | (98,112,497 | ) | | (6,225,006 | ) |
| Net assets, at value | $ | | 2,095,039,823 | | $ | 293,580,143 | |
| Class A: | | | | | | | |
| Net assets, at value | $ | | 1,294,191,854 | | $ | 293,580,143 | |
| Shares outstanding | | | 121,505,430 | | | 25,788,409 | |
| Net asset value per sharea | | $ | 10.65 | | $ | 11.38 | |
| Maximum offering price per share (net asset value per share ÷ 95.75%) | | $ | 11.12 | | $ | 11.89 | |
| Class C: | | | | | | | |
| Net assets, at value | $ | | 326,455,572 | | | | |
| Shares outstanding | | | 30,447,227 | | | | |
| Net asset value and maximum offering price per sharea | | $ | 10.72 | | | | |
| Advisor Class: | | | | | | | |
| Net assets, at value | $ | | 474,392,397 | | | | |
| Shares outstanding | | | 44,456,744 | | | | |
| Net asset value and maximum offering price per share | | $ | 10.67 | | | | |
aRedemption price is equal to net asset value less contingent deferred sales charges, if applicable.
franklintempleton.com The accompanying notes are an integral part of these financial statements. | Annual Report | 37
FRANKLIN MUNICIPAL SECURITIES TRUST
FINANCIAL STATEMENTS
| | | | | |
| Statements of Operations | | | | | |
| for the year ended May 31, 2015 | | | | | |
| |
| | | Franklin | | Franklin | |
| | | California | | Tennessee | |
| | | High Yield | | Municipal | |
| | | Municipal Fund | | Bond Fund | |
| Investment income: | | | | | |
| Interest | $ | 93,921,029 | $ | 12,145,755 | |
| Expenses: | | | | | |
| Management fees (Note 3a) | | 9,057,554 | | 1,516,607 | |
| Distribution fees: (Note 3c) | | | | | |
| Class A | | 1,250,572 | | 281,584 | |
| Class C | | 1,995,458 | | — | |
| Transfer agent fees: (Note 3e) | | | | | |
| Class A | | 413,998 | | 119,246 | |
| Class C | | 101,571 | | — | |
| Advisor Class | | 132,127 | | — | |
| Custodian fees | | 16,266 | | 2,455 | |
| Reports to shareholders | | 65,580 | | 14,409 | |
| Registration and filing fees | | 52,529 | | 10,284 | |
| Professional fees | | 102,845 | | 47,554 | |
| Trustees’ fees and expenses | | 61,856 | | 9,035 | |
| Other | | 334,541 | | 32,423 | |
| Total expenses | | 13,584,897 | | 2,033,597 | |
| Expenses waived/paid by affiliates (Note 3f) | | — | | (23,272 | ) |
| Net expenses | | 13,584,897 | | 2,010,325 | |
| Net investment income | | 80,336,132 | | 10,135,430 | |
| Realized and unrealized gains (losses): | | | | | |
| Net realized gain (loss) from investments | | 5,162,029 | | (324,127 | ) |
| Net change in unrealized appreciation (depreciation) on investments | | 35,837,571 | | (1,922,664 | ) |
| Net realized and unrealized gain (loss) | | 40,999,600 | | (2,246,791 | ) |
| Net increase (decrease) in net assets resulting from operations | $ | 121,335,732 | $ | 7,888,639 | |
38 | Annual Report | The accompanying notes are an integral part of these financial statements.
franklintempleton.com
| | | | | | | | | | | | |
| | | | | | FRANKLIN MUNICIPAL SECURITIES TRUST | |
| | | | | | | | | FINANCIAL STATEMENTS | |
| |
| |
| Statements of Changes in Net Assets | | | | | | | | | | | | |
| |
| |
| | | Franklin California | | | Franklin Tennessee | |
| | | High Yield Municipal Fund | | | Municipal Bond Fund | |
| | | Year Ended May 31, | | | Year Ended May 31, | |
| | | 2015 | | | 2014 | | | 2015 | | | 2014 | |
| Increase (decrease) in net assets: | | | | | | | | | | | | |
| Operations: | | | | | | | | | | | | |
| Net investment income | $ | 80,336,132 | | $ | 81,282,717 | | $ | 10,135,430 | | $ | 10,766,594 | |
| Net realized gain (loss) | | 5,162,029 | | | (20,925,718 | ) | | (324,127 | ) | | (4,255,849 | ) |
| Net change in unrealized appreciation (depreciation) | | 35,837,571 | | | (23,275,229 | ) | | (1,922,664 | ) | | (9,475,045 | ) |
| Net increase (decrease) in net assets resulting | | | | | | | | | | | | |
| from operations | | 121,335,732 | | | 37,081,770 | | | 7,888,639 | | | (2,964,300 | ) |
| Distributions to shareholders from: | | | | | | | | | | | | |
| Net investment income: | | | | | | | | | | | | |
| Class A | | (53,034,252 | ) | | (54,530,179 | ) | | (10,170,322 | ) | | (10,463,435 | ) |
| Class C | | (11,238,791 | ) | | (11,377,311 | ) | | — | | | — | |
| Advisor Class | | (17,287,886 | ) | | (12,746,545 | ) | | — | | | — | |
| Total distributions to shareholders | | (81,560,929 | ) | | (78,654,035 | ) | | (10,170,322 | ) | | (10,463,435 | ) |
| Capital share transactions: (Note 2) | | | | | | | | | | | | |
| Class A | | 64,853,862 | | | (98,295,143 | ) | | 22,719,591 | | | (57,586,987 | ) |
| Class C | | 41,310,047 | | | (36,905,643 | ) | | — | | | — | |
| Advisor Class | | 151,663,957 | | | 17,037,991 | | | — | | | — | |
| Total capital share transactions | | 257,827,866 | | | (118,162,795 | ) | | 22,719,591 | | | (57,586,987 | ) |
| Net increase (decrease) in net assets | | 297,602,669 | | | (159,735,060 | ) | | 20,437,908 | | | (71,014,722 | ) |
| Net assets: | | | | | | | | | | | | |
| Beginning of year | | 1,797,437,154 | | | 1,957,172,214 | | | 273,142,235 | | | 344,156,957 | |
| End of year | $ | 2,095,039,823 | | $ | 1,797,437,154 | | $ | 293,580,143 | | $ | 273,142,235 | |
| Undistributed net investment income included in net assets: | | | | | | | | | | | | |
| End of year | $ | 5,806,673 | | $ | 7,130,668 | | $ | 352,918 | | $ | 388,354 | |
franklintempleton.com
The accompanying notes are an integral part of these financial statements. | Annual Report | 39
FRANKLIN MUNICIPAL SECURITIES TRUST
Notes to Financial Statements
1. Organization and Significant Accounting Policies
Franklin Municipal Securities Trust (Trust) is registered under the Investment Company Act of 1940 (1940 Act) as an open-end management investment company, consisting of two separate funds (Funds) and applies the specialized accounting and reporting guidance in U.S. Generally Accepted Accounting Principles (U.S. GAAP). The classes of shares offered within each of the Funds are indicated below. Each class of shares differs by its initial sales load, contingent deferred sales charges, voting rights on matters affecting a single class, its exchange privilege and fees primarily due to differing arrangements for distribution and transfer agent fees.
|
| Class A |
| Franklin Tennessee Municipal Bond Fund |
| |
| Class A, Class C & Advisor Class |
| Franklin California High Yield Municipal Fund |
The following summarizes the Funds’ significant accounting policies.
a. Financial Instrument Valuation
The Funds’ investments in financial instruments are carried at fair value daily. Fair value is the price that would be received to sell an asset or paid to transfer a liability in an orderly transaction between market participants on the measurement date. The Funds calculate the net asset value per share at the close of the New York Stock Exchange (NYSE), generally at 4 p.m. Eastern time (NYSE close) on each day the NYSE is open for trading. Under compliance policies and procedures approved by the Trust’s Board of Trustees (the Board), the Funds’ admin istrator has responsibility for oversight of valuation, including leading the cross-functional Valuation and Liquidity Oversight Committee (VLOC). The VLOC provides administration and oversight of the Funds’ valuation policies and procedures, which are approved annually by the Board. Among other things, these procedures allow the Funds to utilize independent pricing services, quotations from securities and financial instru ment dealers, and other market sources to determine fair value.
Equity securities listed on an exchange or on the NASDAQ National Market System are valued at the last quoted sale price or the official closing price of the day, respectively. Over-the-counter (OTC) securities are valued within the range of the most recent quoted bid and ask prices. Securities that trade in multiple markets or on multiple exchanges are valued according to the broadest and most representative market. Certain equity securities are valued based upon fundamental characteristics or relationships to similar securities.
Debt securities generally trade in the OTC market rather than on a securities exchange. The Funds’ pricing services use multiple valuation techniques to determine fair value. In instances where sufficient market activity exists, the pricing services may utilize a market-based approach through which quotes from market makers are used to determine fair value. In instances where sufficient market activity may not exist or is limited, the pricing services also utilize proprietary valuation models which may consider market characteristics such as benchmark yield curves, credit spreads, estimated default rates, anticipated market interest rate volatility, coupon rates, anticipated timing of principal repayments, underlying collateral, and other unique security features in order to estimate the relevant cash flows, which are then discounted to calculate the fair value.
The Funds have procedures to determine the fair value of financial instruments for which market prices are not reliable or readily available. Under these procedures, the VLOC convenes on a regular basis to review such financial instruments and considers a number of factors, including significant unobservable valuation inputs, when arriving at fair value. The VLOC primarily employs a market-based approach which may use related or comparable assets or liabilities, recent transactions, market multiples, book values, and other relevant information for the investment to determine the fair value of the investment. An income-based valuation approach may also be used in which the anticipated future cash flows of the investment are discounted to calculate fair value. Discounts may also be applied due to the nature or duration of any restrictions on the disposition of the investments. Due to the inherent uncertainty of valuations of such investments, the fair values may differ significantly from the values that would have been used had an active market existed. The VLOC employs various methods for calibrating these valuation approaches including a regular review of key inputs and assumptions, transactional back-testing or disposition analysis, and reviews of any related market activity.
b. Securities Purchased on a When-Issued Basis
The Funds purchase securities on a when-issued basis, with payment and delivery scheduled for a future date. These transactions are subject to market fluctuations and are subject to the risk that the value at delivery may be more or less than the trade date purchase price. Although the Funds will generally
40 | Annual Report
franklintempleton.com
FRANKLIN MUNICIPAL SECURITIES TRUST
NOTES TO FINANCIAL STATEMENTS
purchase these securities with the intention of holding the securities, they may sell the securities before the settlement date. Sufficient assets have been segregated for these securities.
c. Income Taxes
It is each fund’s policy to qualify as a regulated investment company under the Internal Revenue Code. Each fund intends to distribute to shareholders substantially all of its income and net realized gains to relieve it from federal income and excise taxes. As a result, no provision for U.S. federal income taxes is required.
Each fund recognizes the tax benefits of uncertain tax positions only when the position is “more likely than not” to be sustained upon examination by the tax authorities based on the technical merits of the tax position. As of May 31, 2015, and for all open tax years, each fund has determined that no liability for unrecognized tax benefits is required in each fund’s financial statements related to uncertain tax positions taken on a tax return (or expected to be taken on future tax returns). Open tax years are those that remain subject to examination and are based on each tax jurisdiction’s statute of limitation.
d. Security Transactions, Investment Income, Expenses and Distributions
Security transactions are accounted for on trade date. Realized gains and losses on security transactions are determined on a specific identification basis. Interest income and estimated expenses are accrued daily. Amortization of premium and accretion of discount on debt securities are included in interest income. Dividends from net investment income are normally declared daily; these dividends may be reinvested or paid monthly to shareholders. Distributions to shareholders are determined according to income tax regulations (tax basis). Distributable earnings determined on a tax basis may differ from earnings recorded in accordance with U.S. GAAP. These differences may be permanent or temporary. Permanent differences are reclassified among capital accounts to reflect their tax character. These reclassifications have no impact on net assets or the results of operations. Temporary differences are not reclassified, as they may reverse in subsequent periods.
Common expenses incurred by the Trust are allocated among the Funds based on the ratio of net assets of each fund to the combined net assets of the Trust. Fund specific expenses are charged directly to the fund that incurred the expense.
Realized and unrealized gains and losses and net investment income, not including class specific expenses, are allocated daily to each class of shares based upon the relative proportion of net assets of each class. Differences in per share distributions, by class, are generally due to differences in class specific expenses.
e. Insurance
The scheduled payments of interest and principal for each insured municipal security in the Trust are insured by either a new issue insurance policy or a secondary insurance policy. Some municipal securities in the Funds are secured by collateral guaranteed by an agency of the U.S. government. Depending on the type of coverage, premiums for insurance are either added to the cost basis of the security or paid by a third party.
Insurance companies typically insure municipal bonds that tend to be of very high quality, with the majority of underlying municipal bonds rated A or better. However, an event involving an insurer could have an adverse effect on the value of the securities insured by that insurance company. There can be no assurance the insurer will be able to fulfill its obligations under the terms of the policy.
f. Accounting Estimates
The preparation of financial statements in accordance with U.S. GAAP requires management to make estimates and assumptions that affect the reported amounts of assets and liabilities at the date of the financial statements and the amounts of income and expenses during the reporting period. Actual results could differ from those estimates.
g. Guarantees and Indemnifications
Under the Trust’s organizational documents, its officers and trustees are indemnified by the Trust against certain liabilities arising out of the performance of their duties to the Trust. Additionally, in the normal course of business, the Trust, on behalf of the Funds, enters into contracts with service providers that contain general indemnification clauses. The Trust’s maximum exposure under these arrangements is unknown as this would involve future claims that may be made against the Trust that have not yet occurred. Currently, the Trust expects the risk of loss to be remote.
franklintempleton.com
Annual Report
| 41
FRANKLIN MUNICIPAL SECURITIES TRUST
NOTES TO FINANCIAL STATEMENTS
2. Shares of Beneficial Interest
At May 31, 2015, there were an unlimited number of shares authorized (without par value). Transactions in the Funds’ shares were as follows:
| | | | | | | | | | |
| | Franklin California | | Franklin Tennessee | |
| | High Yield Municipal Fund | | Municipal Bond Fund | |
| | Shares | | | Amount | | Shares | | | Amount | |
| |
| Class A Shares: | | | | | | | | | | |
| Year ended May 31, 2015 | | | | | | | | | | |
| Shares sold | 28,917,496 | | $ | 307,735,923 | | 4,401,520 | | $ | 50,647,129 | |
| Shares issued in reinvestment of distributions | 4,002,390 | | | 42,528,258 | | 759,985 | | | 8,741,901 | |
| Shares redeemed | (26,903,050 | ) | | (285,410,319 | ) | (3,190,560 | ) | | (36,669,439 | ) |
| Net increase (decrease) | 6,016,836 | | $ | 64,853,862 | | 1,970,945 | | $ | 22,719,591 | |
| Year ended May 31, 2014 | | | | | | | | | | |
| Shares sold | 21,524,074 | | $ | 216,031,324 | | 2,979,756 | | $ | 33,390,976 | |
| Shares issued in reinvestment of distributions | 4,387,697 | | | 43,817,573 | | 786,891 | | | 8,809,463 | |
| Shares redeemed | (36,065,686 | ) | | (358,144,040 | ) | (8,925,100 | ) | | (99,787,426 | ) |
| Net increase (decrease) | (10,153,915 | ) | $ | (98,295,143 | ) | (5,158,453 | ) | $ | (57,586,987 | ) |
| Class C Shares: | | | | | | | | | | |
| Year ended May 31, 2015 | | | | | | | | | | |
| Shares sold | 6,546,407 | | $ | 69,976,837 | | | | | | |
| Shares issued in reinvestment of distributions | 800,399 | | | 8,562,458 | | | | | | |
| Shares redeemed | (3,480,379 | ) | | (37,229,248 | ) | | | | | |
| Net increase (decrease) | 3,866,427 | | $ | 41,310,047 | | | | | | |
| Year ended May 31, 2014 | | | | | | | | | | |
| Shares sold | 4,402,781 | | $ | 44,466,486 | | | | | | |
| Shares issued in reinvestment of distributions | 867,684 | | | 8,717,269 | | | | | | |
| Shares redeemed | (8,988,985 | ) | | (90,089,398 | ) | | | | | |
| Net increase (decrease) | (3,718,520 | ) | $ | (36,905,643 | ) | | | | | |
| Advisor Class Shares: | | | | | | | | | | |
| Year ended May 31, 2015 | | | | | | | | | | |
| Shares sold | 19,382,205 | | $ | 205,805,608 | | | | | | |
| Shares issued in reinvestment of distributions | 990,180 | | | 10,559,655 | | | | | | |
| Shares redeemed | (6,102,813 | ) | | (64,701,306 | ) | | | | | |
| Net increase (decrease) | 14,269,572 | | $ | 151,663,957 | | | | | | |
| Year ended May 31, 2014 | | | | | | | | | | |
| Shares sold | 14,978,666 | | $ | 150,547,562 | | | | | | |
| Shares issued in reinvestment of distributions | 710,574 | | | 7,112,474 | | | | | | |
| Shares redeemed | (14,155,559 | ) | | (140,622,045 | ) | | | | | |
| Net increase (decrease) | 1,533,681 | | $ | 17,037,991 | | | | | | |
3. Transactions with Affiliates
Franklin Resources, Inc. is the holding company for various subsidiaries that together are referred to as Franklin Templeton Investments. Certain officers and trustees of the Funds are also officers and/or directors of the following subsidiaries:
| |
| Subsidiary | Affiliation |
| Franklin Advisers, Inc. (Advisers) | Investment manager |
| Franklin Templeton Services, LLC (FT Services) | Administrative manager |
| Franklin Templeton Distributors, Inc. (Distributors) | Principal underwriter |
| Franklin Templeton Investor Services, LLC (Investor Services) | Transfer agent |
42 | Annual Report franklintempleton.com
FRANKLIN MUNICIPAL SECURITIES TRUST
NOTES TO FINANCIAL STATEMENTS
a. Management Fees
The Funds pay an investment management fee to Advisers based on the average daily net assets of each of the Funds as follows:
| | |
| Annualized Fee Rate | | Net Assets |
| 0.625 | % | Up to and including $100 million |
| 0.500 | % | Over $100 million, up to and including $250 million |
| 0.450 | % | Over $250 million, up to and including $7.5 billion |
| 0.440 | % | Over $7.5 billion, up to and including $10 billion |
| 0.430 | % | Over $10 billion, up to and including $12.5 billion |
| 0.420 | % | Over $12.5 billion, up to and including $15 billion |
| 0.400 | % | Over $15 billion, up to and including $17.5 billion |
| 0.380 | % | Over $17.5 billion, up to and including $20 billion |
| 0.360 | % | In excess of $20 billion |
b. Administrative Fees
Under an agreement with Advisers, FT Services provides administrative services to the Funds. The fee is paid by Advisers based on the Funds’ average daily net assets, and is not an additional expense of the Funds.
c. Distribution Fees
The Board has adopted distribution plans for each share class, with the exception of Advisor Class shares, pursuant to Rule 12b-1 under the 1940 Act. Distribution fees are not charged on shares held by affiliates. Under the Funds’ Class A reimbursement distribution plans, the Funds reimburse Distributors for costs incurred in connection with the servicing, sale and distribution of each fund’s shares up to the maximum annual plan rate. Under the Class A reimbursement distribution plans, costs exceeding the maximum for the current plan year cannot be reimbursed in subsequent periods. In addition, under the fund’s Class C compensation distribution plans, Franklin California High Yield Municipal Fund pays Distributors for costs incurred in connection with the servicing, sale and distribution of each fund’s shares up to the maximum annual plan rate. The plan year, for purposes of monitoring compliance with the maximum annual plan rates, is February 1 through January 31 for each fund.
The maximum annual plan rates, based on the average daily net assets, for each class, are as follows:
| | | | |
| | Franklin California | | | |
| | High Yield | | Franklin Tennessee | |
| | Municipal Fund | | Municipal Bond Fund | |
| Reimbursement Plans: | | | | |
| Class A | 0.15 | % | 0.15 | % |
| Distributors has agreed to limit the current rate to 0.10% per year for each of the Funds. | |
| Compensation Plans: | | | | |
| Class C | 0.65 | % | — | |
franklintempleton.com
Annual Report
| 43
FRANKLIN MUNICIPAL SECURITIES TRUST
NOTES TO FINANCIAL STATEMENTS
3. Transactions with Affiliates (continued)
d. Sales Charges/Underwriting Agreements
Front-end sales charges and contingent deferred sales charges (CDSC) do not represent expenses of the Funds. These charges are deducted from the proceeds of sales of fund shares prior to investment or from redemption proceeds prior to remittance, as applicable. Distributors has advised the Funds of the following commission transactions related to the sales and redemptions of the Funds’ shares for the year:
| | | | |
| | | Franklin California | | |
| | | High Yield | | Franklin Tennessee |
| | | Municipal Fund | | Municipal Bond Fund |
| Sales charges retained net of commissions paid to | | | | |
| unaffiliated broker/dealers | $ | 351,495 | $ | 105,024 |
| CDSC retained | $ | 40,400 | $ | 1,748 |
e. Transfer Agent Fees
Each class of shares pays transfer agent fees to Investor Services for its performance of shareholder servicing obligations and reimburses Investor Services for out of pocket expenses incurred, including shareholding servicing fees paid to third parties. These fees are allocated daily based upon their relative proportion of such classes’ aggregate net assets.
For the year ended May 31, 2015, the Funds paid transfer agent fees as noted in the Statements of Operations of which the following amounts were retained by Investor Services:
| | | | |
| | | Franklin California | | |
| | | High Yield | | Franklin Tennessee |
| | | Municipal Fund | | Municipal Bond Fund |
| |
| Transfer agent fees | $ | 216,898 | $ | 31,956 |
f. Waiver and Expense Reimbursements
Advisers has contractually agreed in advance to waive or limit its fees and to assume as its own expense certain expenses otherwise payable by Franklin Tennessee Municipal Bond Fund so that the expenses (excluding distribution fees, and acquired fund fees and expenses) of the funds do not exceed 0.60%, (other than certain non-routine expenses or costs, including those relating to litigation, indemnification, reorganizations, and liquidations) until September 30, 2014. Effective October 1, 2014, the contractual fee waiver was eliminated.
4. Income Taxes
For tax purposes, capital losses may be carried over to offset future capital gains. Capital loss carryforwards with no expiration, if any, must be fully utilized before those losses with expiration dates.
44 | Annual Report
franklintempleton.com
FRANKLIN MUNICIPAL SECURITIES TRUST
NOTES TO FINANCIAL STATEMENTS
| | | | |
| At May 31, 2015, the capital loss carryforwards were as follows: | | |
| |
| | | Franklin California | | |
| | | High Yield | | Franklin Tennessee |
| | | Municipal Fund | | Municipal Bond Fund |
| Capital loss carryforwards subject to expiration: | | | | |
| 2016 | $ | 1,572,273 | $ | — |
| 2017 | | 5,767,799 | | 810,129 |
| 2018 | | 32,781,484 | | — |
| 2019 | | 21,604,912 | | — |
| Capital loss carryforwards not subject to expiration: | | | | |
| Short term | | 22,084,247 | | 3,538,963 |
| Long term | | 13,876,616 | | 1,875,913 |
| Total capital loss carryforwards | $ | 97,687,331 | $ | 6,225,005 |
During the year ended May 31, 2015, Franklin California High Yield Municipal Fund utilized $5,173,891 of capital loss carryforwards.
On May 31, 2015, Franklin California High Yield Municipal Fund and Franklin Tennessee Municipal Bond Fund had expired capital loss carryforwards of $684,955 and $11,310, respectively, which were reclassified to paid-in capital.
The tax character of distributions paid during the years ended May 31, 2015 and 2014, was as follows:
| | | | | | | | |
| | | Franklin California High Yield | | Franklin Tennessee |
| | | Municipal Fund | | Municipal Bond Fund |
| | | 2015 | | 2014 | | 2015 | | 2014 |
| Distributions paid from tax exempt income | $ | 81,560,929 | $ | 78,654,035 | $ | 10,170,322 | $ | 10,463,435 |
At May 31, 2015, the cost of investments, net unrealized appreciation (depreciation), undistributed tax exempt and ordinary income for income tax purposes were as follows:
| | | | | | |
| | | Franklin California | | | | |
| | | High Yield | | | Franklin Tennessee | |
| | | Municipal Fund | | | Municipal Bond Fund | |
| Cost of investments | $ | 1,827,674,830 | | $ | 271,654,779 | |
| |
| Unrealized appreciation | $ | 203,914,458 | | $ | 19,136,061 | |
| Unrealized depreciation | | (52,739,377 | ) | | (7,762,460 | ) |
| Net unrealized appreciation (depreciation) | $ | 151,175,081 | | $ | 11,373,601 | |
| |
| Undistributed tax exempt income | $ | 4,219,329 | | $ | 301,513 | |
| Undistributed ordinary income | | 1,560,665 | | | — | |
| Distributable earnings | $ | 5,779,994 | | $ | 301,513 | |
Differences between income and/or capital gains as determined on a book basis and a tax basis are primarily due to differing treatments of bond discounts and premiums.
franklintempleton.com
Annual Report
| 45
FRANKLIN MUNICIPAL SECURITIES TRUST
NOTES TO FINANCIAL STATEMENTS
5. Investment Transactions
Purchases and sales of investments (excluding short term securities) for the year ended May 31, 2015, were as follows:
| | | | |
| | | Franklin California | | |
| | | High Yield | | Franklin Tennessee |
| | | Municipal Fund | | Municipal Bond Fund |
| |
| Purchases | $ | 412,109,843 | $ | 49,422,272 |
| Sales | $ | 213,216,911 | $ | 31,732,830 |
6. Credit Risk and Defaulted Securities
At May 31, 2015, Franklin California High Yield Municipal Fund and Franklin Tennessee Municipal Bond Fund had 30.10% and 5.50%, respectively, of their portfolio invested in high yield securities rated below investment grade. These securities may be more sensitive to economic conditions causing greater price volatility and are potentially subject to a greater risk of loss due to default than higher rated securities.
Franklin California High Yield Municipal Fund held a defaulted security and/or other securities for which the income has been deemed uncollectible. At May 31, 2015, the value of this security represents less than 0.05%, of the fund’s net assets. The Funds discontinue accruing income on securities for which income has been deemed uncollectible and provide an estimate for losses on interest receivable. The security has been identified in the accompanying Statement of Investments.
7. Concentration of Risk
Each of the Funds invests a large percentage of its total assets in obligations of issuers within its respective state and U.S. territories. Such concentration may subject the Funds to risks associated with industrial or regional matters, and economic, political or legal developments occurring within those states and U.S. territories. In addition, investments in these securities are sensitive to interest rate changes and credit risk of the issuer and may subject the funds to increased market volatility. The market for these investments may be limited, which may make them difficult to buy or sell.
8. Credit Facility
The Funds, together with other U.S. registered and foreign investment funds (collectively, Borrowers), managed by Franklin Templeton Investments, are borrowers in a joint syndicated senior unsecured credit facility totaling $2 billion (Global Credit Facility) which matures on February 12, 2016. This Global Credit Facility provides a source of funds to the Borrowers for temporary and emergency purposes, including the ability to meet future unanticipated or unusually large redemption requests.
Under the terms of the Global Credit Facility, the Funds shall, in addition to interest charged on any borrowings made by the Funds and other costs incurred by the Funds, pay their share of fees and expenses incurred in connection with the implementation and maintenance of the Global Credit Facility, based upon their relative share of the aggregate net assets of all of the Borrowers, including an annual commitment fee of 0.07% based upon the unused portion of the Global Credit Facility. These fees are reflected in other expenses in the Statements of Operations. During the year ended May 31, 2015, the Funds did not use the Global Credit Facility.
46 | Annual Report
franklintempleton.com
FRANKLIN MUNICIPAL SECURITIES TRUST
NOTES TO FINANCIAL STATEMENTS
9. Fair Value Measurements
The Funds follow a fair value hierarchy that distinguishes between market data obtained from independent sources (observable inputs) and the Funds’ own market assumptions (unobservable inputs). These inputs are used in determining the value of the Funds’ financial instruments and are summarized in the following fair value hierarchy:
- Level 1 – quoted prices in active markets for identical financial instruments
- Level 2 – other significant observable inputs (including quoted prices for similar financial instruments, interest rates, prepayment speed, credit risk, etc.)
- Level 3 – significant unobservable inputs (including the Funds’ own assumptions in determining the fair value of financial instruments)
The input levels are not necessarily an indication of the risk or liquidity associated with financial instruments at that level.
For movements between the levels within the fair value hierarchy, the Funds have adopted a policy of recognizing the transfers as of the date of the underlying event which caused the movement.
A summary of inputs used as of May 31, 2015, in valuing the Funds’ assets carried at fair value, is as follows:
| | | | | | | | |
| | | Level 1 | | Level 2 | | Level 3 | | Total |
| |
| Franklin California High Yield Municipal Fund | | | | | | | | |
| Assets: | | | | | | | | |
| Investments in Securities: | | | | | | | | |
| Common Stocks and Other Equity Interests | $ | — | $ | — | $ | 611,323 | $ | 611,323 |
| Corporate Bonds | | — | | 3,541,501 | | — | | 3,541,501 |
| Municipal Bonds | | — | | 1,902,125,837 | | 2,971,250 | | 1,905,097,087 |
| Short Term Investments | | — | | 69,600,000 | | — | | 69,600,000 |
| Total Investments in Securities | $ | — | $ | 1,975,267,338 | $ | 3,582,573 | $ | 1,978,849,911 |
| |
| Franklin Tennessee Municipal Bond Fund | | | | | | | | |
| Assets: | | | | | | | | |
| Investments in Securities: | | | | | | | | |
| Municipal Bonds | $ | — | $ | 283,028,380 | $ | — | $ | 283,028,380 |
A reconciliation of assets in which Level 3 inputs are used in determining fair value is presented when there are significant Level 3 financial instruments at the end of the year.
10. Subsequent Events
The Funds have evaluated subsequent events through the issuance of the financial statements and determined that no events have occurred that require disclosure.
franklintempleton.com
Annual Report
| 47
| | | |
| FRANKLIN MUNICIPAL SECURITIES TRUST | | |
| NOTES TO FINANCIAL STATEMENTS | | |
| |
| |
| |
| |
| Abbreviations | | |
| Selected Portfolio | | |
| 1915 Act | Improvement Bond Act of 1915 | GNMA | Government National Mortgage Association |
| ABAG | The Association of Bay Area Governments | GO | General Obligation |
| AD | Assessment District | HDA | Housing Development Authority/Agency |
| AGMC | Assured Guaranty Municipal Corp. | IDB | Industrial Development Bond/Board |
| AMBAC | American Municipal Bond Assurance Corp. | MFHR | Multi-Family Housing Revenue |
| BAM | Build America Mutual Assurance Co. | NATL | National Public Financial Guarantee Corp. |
| CDA | Community Development Authority/Agency | PBA | Public Building Authority |
| CFD | Community Facilities District | PFA | Public Financing Authority |
| COP | Certificate of Participation | PFAR | Public Financing Authority Revenue |
| CRDA | Community Redevelopment Authority/Agency | PIK | Payment-In-Kind |
| CSD | Central School District | PUD | Public Utility District |
| ETM | Escrow to Maturity | RDA | Redevelopment Agency/Authority |
| FGIC | Financial Guaranty Insurance Co. | UHSD | Unified/Union High School District |
| FHA | Federal Housing Authority/Agency | USD | Unified/Union School District |
| FICO | Financing Corp. | XLCA | XL Capital Assurance |
48 | Annual Report
franklintempleton.com
FRANKLIN MUNICIPAL SECURITIES TRUST
Report of Independent Registered Public Accounting Firm
To the Board of Trustees and Shareholders of Franklin Municipal Securities Trust
In our opinion, the accompanying statements of assets and liabilities, including the statements of investments, and the related statements of operations and of changes in net assets and the financial highlights present fairly, in all material respects, the financial position of Franklin California High Yield Municipal Fund and Franklin Tennessee Municipal Bond Fund (separate portfolios of Franklin Municipal Securities Trust, hereafter referred to as the “Funds”) at May 31, 2015, the results of each of their operations for the year then ended, the changes in each of their net assets for each of the two years in the period then ended and the financial highlights for each of the five years in the period then ended, in conformity with accounting principles generally accepted in the United States of America. These financial statements and financial highlights (hereafter referred to as “financial statements”) are the responsibility of the Funds’ management. Our responsibility is to express an opinion on these financial statements based on our audits. We conducted our audits of these financial statements in accordance with the standards of the Public Company Accounting Oversight Board (United States). Those standards require that we plan and perform the audit to obtain reasonable assurance about whether the financial statements are free of material misstatement. An audit includes examining, on a test basis, evidence supporting the amounts and disclosures in the financial statements, assessing the accounting principles used and significant estimates made by management, and evaluating the overall financial statement presentation. We believe that our audits, which included confirmation of securities at May 31, 2015 by correspondence with the custodian, transfer agent and brokers, provide a reasonable basis for our opinion.
PricewaterhouseCoopers LLP
San Francisco, California
July 16, 2015
franklintempleton.com
Annual Report
| 49
FRANKLIN MUNICIPAL SECURITIES TRUST
Tax Information (unaudited)
Under Section 852(b)(5)(A) of the Internal Revenue Code, the Funds hereby report 100% of the distributions paid from net investment income as exempt-interest dividends for the fiscal year ended May 31, 2015. A portion of the Fund’s exempt-interest dividends may be subject to the federal alternative minimum tax. By mid-February 2016, shareholders will be notified of amounts for use in preparing their 2015 income tax returns.
50 | Annual Report
franklintempleton.com
FRANKLIN MUNICIPAL SECURITIES TRUST
Board Members and Officers
The name, year of birth and address of the officers and board members, as well as their affiliations, positions held with the Trust, principal occupations during at least the past five years and number of portfolios overseen in the Franklin Templeton Investments fund complex are shown below. Generally, each board member serves until that person’s successor is elected and qualified.
| | | | |
| Independent Board Members | | | |
| |
| | | | Number of Portfolios in | |
| Name, Year of Birth | | Length of | Fund Complex Overseen | Other Directorships Held |
| and Address | Position | Time Served | by Board Member* | During at Least the Past 5 Years |
| |
| Harris J. Ashton (1932) | Trustee | Since 1991 | 145 | Bar-S Foods (meat packing company) |
| One Franklin Parkway | | | | (1981-2010). |
| San Mateo, CA 94403-1906 | | | | |
| Principal Occupation During at Least the Past 5 Years: | | |
| Director of various companies; and formerly, Director, RBC Holdings, Inc. (bank holding company) (until 2002); and President, Chief |
| Executive Officer and Chairman of the Board, General Host Corporation (nursery and craft centers) (until 1998). |
| |
| Mary C. Choksi (1950) | Trustee | Since | 119 | Avis Budget Group Inc. (car rental) |
| One Franklin Parkway | | October 2014 | | (2007-present), Omnicom Group Inc. |
| San Mateo, CA 94403-1906 | | | | (advertising and marketing communi- |
| | | | | cations services) (2011-present) and |
| | | | | H.J. Heinz Company (processed foods |
| | | | | and allied products) (1998-2006). |
| Principal Occupation During at Least the Past 5 Years: | | |
| Founding Partner and Senior Managing Director, Strategic Investment Group (investment management group) (1987-present); director of |
| various companies; and formerly, Founding Partner and Managing Director, Emerging Markets Management LLC (investment management |
| firm) (1987-2011); and Loan Officer/Senior Loan Officer/Senior Pension Investment Officer, World Bank Group (international financial |
| institution) (1977-1987). | | | | |
| |
| Edith E. Holiday (1952) | Trustee | Since 1998 | 145 | Hess Corporation (exploration and |
| One Franklin Parkway | | | | refining of oil and gas) (1993-present), |
| San Mateo, CA 94403-1906 | | | | RTI International Metals, Inc. (manu- |
| | | | | facture and distribution of titanium) |
| | | | | (1999-present), Canadian National |
| | | | | Railway (railroad) (2001-present), |
| | | | | White Mountains Insurance Group, |
| | | | | Ltd. (holding company) (2004-present) |
| | | | | and H.J. Heinz Company (processed |
| | | | | foods and allied products) (1994-2013). |
| Principal Occupation During at Least the Past 5 Years: | | |
| Director or Trustee of various companies and trusts; and formerly, Assistant to the President of the United States and Secretary of the |
| Cabinet (1990-1993); General Counsel to the United States Treasury Department (1989-1990); and Counselor to the Secretary and Assistant |
| Secretary for Public Affairs and Public Liaison – United States Treasury Department (1988-1989). | |
| |
| J. Michael Luttig (1954) | Trustee | Since 2009 | 145 | Boeing Capital Corporation |
| One Franklin Parkway | | | | (aircraft financing) (2006-2013). |
| San Mateo, CA 94403-1906 | | | | |
| Principal Occupation During at Least the Past 5 Years: | | |
| Executive Vice President, General Counsel and member of the Executive Council, The Boeing Company (aerospace company); and formerly, |
| Federal Appeals Court Judge, U.S. Court of Appeals for the Fourth Circuit (1991-2006). | |
franklintempleton.com
Annual Report
| 51
FRANKLIN MUNICIPAL SECURITIES TRUST
| | | | |
| Independent Board Members (continued) | | |
| |
| | | | Number of Portfolios in | |
| Name, Year of Birth | | Length of | Fund Complex Overseen | Other Directorships Held |
| and Address | Position | Time Served | by Board Member* | During at Least the Past 5 Years |
| |
| Frank A. Olson (1932) | Trustee | Since 2005 | 145 | Hess Corporation (exploration and |
| One Franklin Parkway | | | | refining of oil and gas) (1998-2013). |
| San Mateo, CA 94403-1906 | | | | |
| Principal Occupation During at Least the Past 5 Years: | | |
| Director of various companies; and formerly, Chairman of the Board, The Hertz Corporation (car rental) (1980-2000) and Chief Executive |
| Officer (1977-1999); and Chairman of the Board, President and Chief Executive Officer, UAL Corporation (airlines) (June-December 1987). |
| |
| Larry D. Thompson (1945) | Trustee | Since 2007 | 145 | Cbeyond, Inc. (business commu- |
| One Franklin Parkway | | | | nications provider) (2010-2012), |
| San Mateo, CA 94403-1906 | | | | The Southern Company (energy |
| | | | | company) (December 2014; pre- |
| | | | | viously 2010-2012) and Graham |
| | | | | Holdings Company (education and |
| | | | | media organization) (2011-present). |
| Principal Occupation During at Least the Past 5 Years: | | |
| Director of various companies; John A. Sibley Professor of Corporate and Business Law, University of Georgia School of Law (January 2015; |
| previously 2011-2012); and formerly, Executive Vice President – Government Affairs, General Counsel and Corporate Secretary, PepsiCo, |
| Inc. (consumer products) (2012-2014); Senior Vice President – Government Affairs, General Counsel and Secretary, PepsiCo, Inc. |
| (2004-2011); Senior Fellow of The Brookings Institution (2003-2004); Visiting Professor, University of Georgia School of Law (2004); and |
| Deputy Attorney General, U.S. Department of Justice (2001-2003). | | |
| |
| John B. Wilson (1959) | Lead | Trustee since 2006 119 | None |
| One Franklin Parkway | Independent | and Lead | | |
| San Mateo, CA 94403-1906 | Trustee | Independent | | |
| | | Trustee since 2008 | | |
| Principal Occupation During at Least the Past 5 Years: | | |
| President, Staples Europe (office supplies) (2012-present); President and Founder, Hyannis Port Capital, Inc. (real estate and private equity |
| investing); serves on private and non-profit boards; and formerly, Chief Operating Officer and Executive Vice President, Gap, Inc. (retail) |
| (1996-2000); Chief Financial Officer and Executive Vice President – Finance and Strategy, Staples, Inc. (1992-1996); Senior Vice President – |
| Corporate Planning, Northwest Airlines, Inc. (airlines) (1990-1992); and Vice President and Partner, Bain & Company (consulting firm) |
| (1986-1990). | | | | |
| |
| |
| |
| Interested Board Members and Officers | | |
| |
| | | | Number of Portfolios in | |
| Name, Year of Birth | | Length of | Fund Complex Overseen | Other Directorships Held |
| and Address | Position | Time Served | by Board Member* | During at Least the Past 5 Years |
| |
| **Gregory E. Johnson (1961) | Trustee | Since 2007 | 162 | None |
| One Franklin Parkway | | | | |
| San Mateo, CA 94403-1906 | | | | |
| Principal Occupation During at Least the Past 5 Years: | | |
| Chairman of the Board, Member – Office of the Chairman, Director, President and Chief Executive Officer, Franklin Resources, Inc.; officer |
| and/or director or trustee, as the case may be, of some of the other subsidiaries of Franklin Resources, Inc. and of 46 of the investment |
| companies in Franklin Templeton Investments; and Vice Chairman, Investment Company Institute. | |
52 | Annual Report
franklintempleton.com
FRANKLIN MUNICIPAL SECURITIES TRUST
| | | | |
| Interested Board Members and Officers (continued) | |
| |
| | | | Number of Portfolios in | |
| Name, Year of Birth | | Length of | Fund Complex Overseen | Other Directorships Held |
| and Address | Position | Time Served | by Board Member* | During at Least the Past 5 Years |
| |
| **Rupert H. Johnson, Jr. (1940) Chairman of | Chairman of the | 145 | None |
| One Franklin Parkway | the Board and | Board and Trustee | | |
| San Mateo, CA 94403-1906 | Trustee | since 2013 | | |
| Principal Occupation During at Least the Past 5 Years: | | |
| Vice Chairman, Member – Office of the Chairman and Director, Franklin Resources, Inc.; Director, Franklin Advisers, Inc.; Senior Vice |
| President, Franklin Advisory Services, LLC; and officer and/or director or trustee, as the case may be, of some of the other subsidiaries of |
| Franklin Resources, Inc. and of 43 of the investment companies in Franklin Templeton Investments. | |
| |
| Sheila Amoroso (1959) | Vice President | Since 1999 | Not Applicable | Not Applicable |
| One Franklin Parkway | | | | |
| San Mateo, CA 94403-1906 | | | | |
| Principal Occupation During at Least the Past 5 Years: | | |
| Senior Vice President, Franklin Advisers, Inc.; and officer of seven of the investment companies in Franklin Templeton Investments. |
| |
| Alison E. Baur (1964) | Vice President | Since 2012 | Not Applicable | Not Applicable |
| One Franklin Parkway | | | | |
| San Mateo, CA 94403-1906 | | | | |
| Principal Occupation During at Least the Past 5 Years: | | |
| Deputy General Counsel, Franklin Templeton Investments; and officer of some of the other subsidiaries of Franklin Resources, Inc. and of 46 |
| of the investment companies in Franklin Templeton Investments. | | |
| |
| Rafael R. Costas, Jr. (1965) | Vice President | Since 1999 | Not Applicable | Not Applicable |
| One Franklin Parkway | | | | |
| San Mateo, CA 94403-1906 | | | | |
| Principal Occupation During at Least the Past 5 Years: | | |
| Senior Vice President, Franklin Advisers, Inc.; and officer of seven of the investment companies in Franklin Templeton Investments. |
| |
| Laura F. Fergerson (1962) | Chief | Since 2009 | Not Applicable | Not Applicable |
| One Franklin Parkway | Executive | | | |
| San Mateo, CA 94403-1906 | Officer – | | | |
| | Finance and | | | |
| | Administration | | | |
| Principal Occupation During at Least the Past 5 Years: | | |
| Senior Vice President, Franklin Templeton Services, LLC; Vice President, Franklin Advisers, Inc. and Franklin Templeton Institutional, LLC; |
| and officer of 46 of the investment companies in Franklin Templeton Investments. | |
| |
| Gaston Gardey (1967) | Treasurer, | Since 2009 | Not Applicable | Not Applicable |
| One Franklin Parkway | Chief Financial | | | |
| San Mateo, CA 94403-1906 | Officer and | | | |
| | Chief | | | |
| | Accounting | | | |
| | Officer | | | |
| |
| Principal Occupation During at Least the Past 5 Years: | | |
| Treasurer, U.S. Fund Administration & Reporting, Franklin Templeton Investments; and officer of 27 of the investment companies in Franklin |
| Templeton Investments. | | | | |
franklintempleton.com
Annual Report
| 53
| | | | |
| FRANKLIN MUNICIPAL SECURITIES TRUST | | |
| |
| |
| |
| |
| Interested Board Members and Officers (continued) | |
| |
| | | | Number of Portfolios in | |
| Name, Year of Birth | | Length of | Fund Complex Overseen | Other Directorships Held |
| and Address | Position | Time Served | by Board Member* | During at Least the Past 5 Years |
| |
| Aliya S. Gordon (1973) | Vice President | Since 2009 | Not Applicable | Not Applicable |
| One Franklin Parkway | | | | |
| San Mateo, CA 94403-1906 | | | | |
| Principal Occupation During at Least the Past 5 Years: | | |
| Senior Associate General Counsel, Franklin Templeton Investments; officer of 46 of the investment companies in Franklin Templeton |
| Investments; and formerly, Litigation Associate, Steefel, Levitt & Weiss, LLP (2000-2004). | |
| |
| Steven J. Gray (1955) | Vice President | Since 2009 | Not Applicable | Not Applicable |
| One Franklin Parkway | | | | |
| San Mateo, CA 94403-1906 | | | | |
| Principal Occupation During at Least the Past 5 Years: | | |
| Senior Associate General Counsel, Franklin Templeton Investments; Vice President, Franklin Templeton Distributors, Inc. and Franklin |
| Alternative Strategies Advisers, LLC; and officer of 46 of the investment companies in Franklin Templeton Investments. |
| |
| Selena L. Holmes (1965) | Vice President | Since 2012 | Not Applicable | Not Applicable |
| 100 Fountain Parkway | – AML | | | |
| St. Petersburg, FL 33716-1205 | Compliance | | | |
| Principal Occupation During at Least the Past 5 Years: | | |
| Director, Global Compliance Monitoring; Chief Compliance Officer, Franklin Alternative Strategies Advisers, LLC; Vice President, Franklin |
| Templeton Companies, LLC; and officer of 46 of the investment companies in Franklin Templeton Investments. |
| |
| Christopher J. Molumphy | President and | Since 2010 | Not Applicable | Not Applicable |
| (1962) | Chief Executive | | | |
| One Franklin Parkway | Officer – | | | |
| San Mateo, CA 94403-1906 | Investment | | | |
| | Management | | | |
| |
| Principal Occupation During at Least the Past 5 Years: | | |
| Director and Executive Vice President, Franklin Advisers, Inc.; Executive Vice President, Franklin Templeton Institutional, LLC; and officer of |
| some of the other subsidiaries of Franklin Resources, Inc. and of 22 of the investment companies in Franklin Templeton Investments. |
| |
| Kimberly H. Novotny (1972) | Vice President | Since 2013 | Not Applicable | Not Applicable |
| 300 S.E. 2nd Street | | | | |
| Fort Lauderdale, FL 33301-1923 | | | | |
| |
| Principal Occupation During at Least the Past 5 Years: | | |
| Associate General Counsel, Franklin Templeton Investments; Vice President and Secretary, Fiduciary Trust International of the South; Vice |
| President, Templeton Investment Counsel, LLC; Assistant Secretary, Franklin Resources, Inc.; and officer of 46 of the investment companies |
| in Franklin Templeton Investments. | | | |
| |
| Robert C. Rosselot (1960) | Chief | Since 2013 | Not Applicable | Not Applicable |
| 300 S.E. 2nd Street | Compliance | | | |
| Fort Lauderdale, FL 33301-1923 | Officer | | | |
| |
| Principal Occupation During at Least the Past 5 Years: | | |
| Director, Global Compliance, Franklin Templeton Investments; Vice President, Franklin Templeton Companies, LLC; officer of 46 of the |
| investment companies in Franklin Templeton Investments; and formerly, Senior Associate General Counsel, Franklin Templeton Investments |
| (2007-2013); and Secretary and Vice President, Templeton Group of Funds (2004-2013). | |
54 | Annual Report
franklintempleton.com
FRANKLIN MUNICIPAL SECURITIES TRUST
| | | | |
| Interested Board Members and Officers (continued) | |
| |
| | | | Number of Portfolios in | |
| Name, Year of Birth | | Length of | Fund Complex Overseen | Other Directorships Held |
| and Address | Position | Time Served | by Board Member* | During at Least the Past 5 Years |
| |
| Karen L. Skidmore (1952) | Vice President | Since 2006 | Not Applicable | Not Applicable |
| One Franklin Parkway | and Secretary | | | |
| San Mateo, CA 94403-1906 | | | | |
| Principal Occupation During at Least the Past 5 Years: | | |
| Senior Associate General Counsel, Franklin Templeton Investments; and officer of 46 of the investment companies in Franklin Templeton |
| Investments. | | | | |
| |
| Craig S. Tyle (1960) | Vice President | Since 2005 | Not Applicable | Not Applicable |
| One Franklin Parkway | | | | |
| San Mateo, CA 94403-1906 | | | | |
| Principal Occupation During at Least the Past 5 Years: | | |
| General Counsel and Executive Vice President, Franklin Resources, Inc.; and officer of some of the other subsidiaries of Franklin Resources, |
| Inc. and of 46 of the investment companies in Franklin Templeton Investments. | |
| |
| Thomas Walsh (1961) | Vice President | Since 1999 | Not Applicable | Not Applicable |
| One Franklin Parkway | | | | |
| San Mateo, CA 94403-1906 | | | | |
| Principal Occupation During at Least the Past 5 Years: | | |
| Senior Vice President, Franklin Advisers, Inc.; and officer of seven of the investment companies in Franklin Templeton Investments. |
| |
| Lori A. Weber (1964) | Vice President | Since 2011 | Not Applicable | Not Applicable |
| 300 S.E. 2nd Street | | | | |
| Fort Lauderdale, FL 33301-1923 | | | | |
| Principal Occupation During at Least the Past 5 Years: | | |
| Senior Associate General Counsel, Franklin Templeton Investments; Assistant Secretary, Franklin Resources, Inc.; Vice President and |
| Secretary, Templeton Investment Counsel, LLC; Vice President, Fiduciary Trust International of the South; and officer of 46 of the investment |
| companies in Franklin Templeton Investments. | | | |
*We base the number of portfolios on each separate series of the U.S. registered investment companies within the Franklin Templeton Investments fund complex.
These portfolios have a common investment manager or affiliated investment managers.
**Gregory E. Johnson is considered to be an interested person of the Trust under the federal securities laws due to his position as an officer and director of Franklin
Resources, Inc. (Resources), which is the parent company of the Trust’s investment manager and distributor. Rupert H. Johnson, Jr. is considered to be an interested
person of the Fund under the federal securities laws due to his position as officer and director and major shareholder of Resources.
Note 1: Rupert H. Johnson, Jr. is the uncle of Gregory E. Johnson.
Note 2: Officer information is current as of the date of this report. It is possible that after this date, information about officers may change.
Note 3: Effective April 30, 2015, Sam Ginn ceased to be a trustee of the Trust.
The Sarbanes-Oxley Act of 2002 and Rules adopted by the Securities and Exchange Commission require the Fund to disclose whether the Fund’s Audit
Committee includes at least one member who is an audit committee financial expert within the meaning of such Act and Rules. The Fund’s Board has deter-
mined that there is at least one such financial expert on the Audit Committee and has designated John B. Wilson as its audit committee financial expert.
The Board believes that Mr. Wilson qualifies as such an expert in view of his extensive business background and experience, including service as chief
financial officer of Staples, Inc. from 1992 to 1996. Mr. Wilson has been a Member and Chairman of the Fund’s Audit Committee since 2006. As a result of
such background and experience, the Board believes that Mr. Wilson has acquired an understanding of generally accepted accounting principles and finan-
cial statements, the general application of such principles in connection with the accounting estimates, accruals and reserves, and analyzing and evaluating
financial statements that present a breadth and level of complexity of accounting issues generally comparable to those of the Fund, as well as an under-
standing of internal controls and procedures for financial reporting and an understanding of audit committee functions. Mr. Wilson is an independent Board
member as that term is defined under the relevant Securities and Exchange Commission Rules and Releases.
The Statement of Additional Information (SAI) includes additional information about the board members and is available, without charge, upon request.
Shareholders may call (800) DIAL BEN/342-5236 to request the SAI.
franklintempleton.com
Annual Report
| 55
FRANKLIN MUNICIPAL SECURITIES TRUST
Shareholder Information
Board Review of Investment Management Agreement
At a meeting held February 24, 2015, the Board of Trustees (Board), including a majority of non-interested or independent Trustees, approved renewal of the investment management agreement for each of the two separate tax-exempt funds within the Trust (Fund(s)). In reaching this decision, the Board took into account information furnished throughout the year at regular Board meetings, as well as information prepared specifically in connection with the annual renewal review process. Information furnished and discussed throughout the year included investment performance reports and related financial information for each Fund, along with periodic reports on expenses, shareholder services, legal and compliance matters, pricing and other services provided by the Investment Manager (Manager) and its affiliates, as well as marketing support payments made to financial intermediaries. Information furnished specifically in connection with the renewal process included a report for each Fund prepared by Lipper, Inc. (Lipper), an independent organization, as well as additional material, including a Fund profitability analysis prepared by management. The Lipper reports compared each Fund’s investment performance and expenses with those of other mutual funds deemed comparable to the Fund as selected by Lipper. The Fund profitability analysis discussed the profitability to Franklin Templeton Investments (FTI) from its overall U.S. fund operations, as well as on an individual fund-by-fund basis. Additional material accompanying such profitability analysis included information on a fund-by-fund basis listing portfolio managers and other accounts they manage, as well as information on management fees charged by the Manager and its affiliates to U.S. mutual funds and other accounts, including management’s explanation of differences where relevant. Such material also included a memorandum prepared by management describing project initiatives and capital investments relating to the services provided to the Funds by the FTI organization, as well as a memorandum relating to economies of scale and an analysis concerning transfer agent fees charged by an affiliate of the Manager. The Board also noted that at the February meetings each year, it receives an annual report on all marketing support payments made by FTI to financial intermediaries.
In considering such materials, the independent Trustees received assistance and advice from and met separately with independent counsel. While the investment management agreements for both Funds were considered at the same Board meeting, the Board dealt with each Fund separately. In approving continuance of the investment management agreement for each Fund, the Board, including a majority of independent Trustees, determined that the existing management fee structure was fair and reasonable and that continuance of the investment management agreement was in the best interests of each Fund and its shareholders. While attention was given to all information furnished, the following discusses some primary factors relevant to the Board’s decision.
NATURE, EXTENT AND QUALITY OF SERVICE. The Board was satisfied with the nature and quality of the overall services provided by the Manager and its affiliates to the Funds and their shareholders. In addition to investment performance and expenses discussed later, the Board’s opinion was based, in part, upon periodic reports furnished it showing that the investment policies and restrictions for each Fund were consistently complied with as well as other reports periodically furnished the Board covering matters such as the compliance of portfolio managers and other management personnel with the code of ethics adopted throughout the Franklin Templeton fund complex, the adherence to fair value pricing procedures established by the Board, and the accuracy of net asset value calculations. The Board also noted the extent of benefits provided Fund shareholders from being part of the Franklin Templeton family of funds, including the right to exchange investments between the same class of shares of different funds without a sales charge, the ability to reinvest Fund dividends into other funds and the right to combine holdings in other funds to obtain a reduced sales charge. Favorable consideration was given to management’s continual efforts and expenditures in establishing effective business continuity plans and developing strategies to address cybersecurity threats. Consideration was also given to the experience of each Fund’s portfolio management team, the number of accounts managed and general method of compensation. In this latter respect, the Board noted that a primary factor in management’s determination of a portfolio manager’s bonus compensation was the relative investment performance of the funds he or she managed and that a portion of such bonus was required to be invested in a predesignated list of funds within such person’s fund management area so as to be aligned with the interests of shareholders. The Board also took into account the quality of transfer agent and shareholder services provided Fund shareholders by an affiliate of the Manager noting the changes taking place in the nature of transfer agency services throughout the industry and regulatory initiatives in this area, and the continual enhancements to the Franklin Templeton website. Particular attention was given
56 | Annual Report
franklintempleton.com
FRANKLIN MUNICIPAL SECURITIES TRUST
SHAREHOLDER INFORMATION
to management’s conservative approach and diligent risk management procedures, including continual monitoring of counterparty credit risk and attention given to derivatives and other complex instruments. The Board also took into account, among other things, management’s efforts in establishing a global credit facility for the benefit of the Funds and other accounts managed by FTI to provide a source of cash for temporary and emergency purposes or to meet unusual redemption requests as well as the strong financial position of the Manager’s parent company and its commitment to the mutual fund business as evidenced by its continued subsidization of money market funds.
INVESTMENT PERFORMANCE. The Board placed significant emphasis on the investment performance of each Fund in view of its importance to shareholders. While consideration was given to performance reports and discussions with portfolio managers at Board meetings during the year, particular attention in assessing performance was given to the Lipper reports furnished for the agreement renewals. The Lipper reports prepared for each individual Fund showed its investment performance in comparison with a performance universe selected by Lipper. The following summarizes the performance results for each of the Funds.
Franklin California High Yield Municipal Fund – The Lipper report for this Fund showed the investment performance of its Class A shares for the year ended December 31, 2014, and the previous 10 years ended that date in comparison with a performance universe consisting of all retail and institutional California municipal debt funds as selected by Lipper. Such comparison showed the Fund’s income return during 2014, as shown in the Lipper report, and for the previous three-, five-and 10-year periods on an annualized basis to be in the highest quintile of its performance universe. The Lipper report showed the Fund’s total return during 2014 to be in the highest or best performing quintile of its Lipper performance universe and on an annualized basis to be in the highest performing quintile of such universe for each of the previous three-, five- and 10-year periods. The Board was satisfied with the Fund’s performance, as shown in the Lipper report.
Franklin Tennessee Municipal Bond Fund – The Lipper report for this Fund showed the investment performance of its only share class for the year ended December 31, 2014, and the previous 10 years ended that date in comparison with a performance universe consisting of all retail and institutional “other states” municipal debt funds as selected by Lipper. Such comparison showed the Fund’s income return in 2014, as shown in the Lipper report, to be in the second-highest quintile of its performance universe, and during each of the previous three-, five- and 10-year periods on an annualized basis to also be in the second-highest quintile of such universe. The Lipper report showed the Fund’s total return during 2014 to be in the middle performing quintile of its Lipper performance universe, and on an annualized basis to be in the middle performing quintile of its performance universe for the previous three- and five-year periods, and in the second-highest performing quintile of such universe for the previous 10-year period. The Board was satisfied with the Fund’s performance as shown in the Lipper report and noted its income oriented investment objective.
COMPARATIVE EXPENSES. Consideration was given to a comparative analysis of the management fees and total expense ratio of each Fund compared with those of a group of other funds selected by Lipper as its appropriate Lipper expense group. Lipper expense data is based upon information taken from each fund’s most recent annual report, which reflects historical asset levels that may be quite different from those currently existing, particularly in a period of market volatility. While recognizing such inherent limitation and the fact that expense ratios generally increase as assets decline and decrease as assets grow, the Board believed the independent analysis conducted by Lipper to be appropriate measure of comparative expenses. In reviewing comparative costs, Lipper provides information on each Fund’s contractual investment management fee in comparison with the contractual investment management fee that would have been charged by other funds within its Lipper expense group assuming they were similar in size to the Fund, as well as the actual total expense ratio of the Fund in comparison with those of its Lipper expense group. The Lipper contractual investment management fee analysis includes administrative charges as being part of a management fee, and total expenses, for comparative consistency, were shown by Lipper for Fund Class A shares. The Lipper report for Franklin California High Yield Municipal Fund showed its contractual investment management fee rate to be below the median of its Lipper expense group, and its actual total expense ratio to be the least expensive within such expense group. The Lipper report for Franklin Tennessee Municipal Bond Fund showed its contractual investment management fee rate to be at the median of its Lipper expense group, and its actual total expense ratio to be the second least expensive within such expense group. The Board was satisfied with the comparative expenses of both Funds.
franklintempleton.com
Annual Report
| 57
FRANKLIN MUNICIPAL SECURITIES TRUST
SHAREHOLDER INFORMATION
Board Review of Investment Management
Agreement (continued)
MANAGEMENT PROFITABILITY. The Board also considered the level of profits realized by the Manager and its affiliates in connection with the operation of each Fund. In this respect, the Board reviewed the Fund profitability analysis that addresses the overall profitability of Franklin Templeton’s U.S. fund business, as well as its profits in providing management and other services to each of the individual funds during the 12-month period ended September 30, 2014, being the most recent fiscal year-end for Franklin Resources, Inc., the Manager’s parent. In reviewing the analysis, the Board recognized that allocation methodologies are inherently subjective and various allocation methodologies may be reasonable while producing different results. In this respect, the Board noted that while management continually makes refinements to its methodologies in response to organizational and product related changes, the overall approach as defined by the primary drivers and activity measurements has remained consistent with that used in the Funds’ profitability report presentations from prior years. Additionally, the Funds’ independent registered public accounting firm had been engaged by the Manager to periodically review the reasonableness of the allocation methodologies to be used solely by the Funds’ Board in reference to the profitability analysis. In reviewing and discussing such analysis, management discussed with the Board its belief that costs incurred in establishing the infrastructure necessary for the type of mutual fund operations conducted by the Manager and its affiliates may not be fully reflected in the expenses allocated to each Fund in determining its profitability, as well as the fact that the level of profits, to a certain extent, reflected operational cost savings and efficiencies initiated by management. The Board also took into account management’s expenditures in improving shareholder services provided the Funds, as well as the need to implement systems and meet additional regulatory and compliance requirements resulting from statutes such as the Sarbanes-Oxley and Dodd-Frank Acts and recent SEC and other regulatory requirements. In addition, the Board considered a third-party study comparing the profitability of the Manager’s parent on an overall basis to other publicly held managers broken down to show profitability from management operations exclusive of distribution expenses, as well as profitability including distribution expenses. The Board also considered the extent to which the Manager and its affiliates might derive ancillary benefits from fund operations, including revenues generated from transfer agent services, potential benefits resulting from personnel and systems enhancements necessitated by fund growth, as well as increased leverage with the service providers and counterparties. Based upon its consideration of all these factors, the Board determined that the level of profits realized by the Manager and its affiliates from providing services to each Fund was not excessive in view of the nature, quality and extent of services provided.
ECONOMIES OF SCALE. The Board also considered whether economies of scale are realized by the Manager as the Funds grow larger and the extent to which this is reflected in the level of management fees charged. While recognizing any precise determination is inherently subjective, the Board noted that based upon the Fund profitability analysis, it appeared as some funds get larger, at some point economies of scale do result in the Manager realizing a larger profit margin on management services provided such fund. The Board also noted that any economies of scale are shared with each of these Funds and their shareholders through management fee breakpoints existing in each of the Fund’s investment management agreements so that as a Fund grows in size, its effective management fee rate declines. The fee structure under the investment management agreement for each Fund provides an initial fee of 0.625% on the first $100 million of net assets; 0.50% on the next $150 million of net assets; and 0.45% on the next $7.25 billion of net assets with additional breakpoints continuing thereafter until reaching a final breakpoint for net assets in excess of $20 billion. As of December 31, 2014, the net assets of Franklin California High Yield Municipal Fund were approximately $1.99 billion and those of Franklin Tennessee Municipal Bond Fund were approximately $283 million. The Board believed that to the extent economies of scale may be realized by the Manager and its affiliates, the schedule of fees under the investment management agreements for both Funds provided a sharing of benefits with the Funds and their shareholders.
58 | Annual Report
franklintempleton.com
FRANKLIN MUNICIPAL SECURITIES TRUST
SHAREHOLDER INFORMATION
Proxy Voting Policies and Procedures
The Trust’s investment manager has established Proxy Voting Policies and Procedures (Policies) that the Trust uses to determine how to vote proxies relating to portfolio securities. Shareholders may view the Trust’s complete Policies online at franklintempleton.com. Alternatively, shareholders may request copies of the Policies free of charge by calling the Proxy Group collect at (954) 527-7678 or by sending a written request to: Franklin Templeton Companies, LLC, 300 S.E. 2nd Street, Fort Lauderdale, FL 33301, Attention: Proxy Group. Copies of the Trust’s proxy voting records are also made available online at franklintempleton.com and posted on the U.S. Securities and Exchange Commission’s website at sec.gov and reflect the most recent 12-month period ended June 30.
Quarterly Statement of Investments
The Trust files a complete statement of investments with the U.S. Securities and Exchange Commission for the first and third quarters for each fiscal year on Form N-Q. Shareholders may view the filed Form N-Q by visiting the Commission’s website at sec.gov. The filed form may also be viewed and copied at the Commission’s Public Reference Room in Washington, DC. Information regarding the operations of the Public Reference Room may be obtained by calling (800) SEC-0330.
Householding of Reports and Prospectuses
You will receive each Funds’ financial reports every six months as well as an annual updated summary prospectus (prospectus available upon request). To reduce Fund expenses, we try to identify related shareholders in a household and send only one copy of the financial reports and summary prospectus. This process, called “householding,” will continue indefinitely unless you instruct us otherwise. If you prefer not to have these documents householded, please call us at (800) 632-2301. At any time you may view current prospectuses/summary prospectuses and financial reports on our website. If you choose, you may receive these documents through electronic delivery.
franklintempleton.com
Annual Report
| 59
This page intentionally left blank.

Item 2. Code of Ethics.
(a) The Registrant has adopted a code of ethics that applies to its principal executive officers and principal financial and accounting officer.
(c) N/A
(d) N/A
(f) Pursuant to Item 12(a)(1), the Registrant is attaching as an exhibit a copy of its code of ethics that applies to its principal executive officers and principal financial and accounting officer.
Item 3. Audit Committee Financial Expert.
(a)(1) The Registrant has an audit committee financial expert serving on its audit committee.
(2) The audit committee financial expert is John B. Wilson and he is "independent" as defined under the relevant Securities and Exchange Commission Rules and Releases.
Item 4. Principal Accountant Fees and Services.
(a) Audit Fees
The aggregate fees paid to the principal accountant for professional services rendered by the principal accountant for the audit of the registrant’s annual financial statements or for services that are normally provided by the principal accountant in connection with statutory and regulatory filings or engagements were $69,019 for the fiscal year ended May 31, 2015 and $68,254 for the fiscal year ended May 31, 2014.
(b) Audit-Related Fees
There were no fees paid to the principal accountant for assurance and related services rendered by the principal accountant to the registrant that are reasonably related to the performance of the audit of the registrant's financial statements and are not reported under paragraph (a) of Item 4.
There were no fees paid to the principal accountant for assurance and related services rendered by the principal accountant to the registrant's investment adviser and any entity controlling, controlled by or under common control with the investment adviser that provides ongoing services to the registrant that are reasonably related to the performance of the audit of their financial statements.
(c) Tax Fees
There were no fees paid to the principal accountant for professional services rendered by the principal accountant to the registrant for tax compliance, tax advice and tax planning.
The aggregate fees paid to the principal accountant for professional services rendered by the principal accountant to the registrant’s investment adviser and any entity controlling, controlled by or under common control with the investment adviser that provides ongoing services to the registrant for tax compliance, tax advice and tax planning were $0 for the fiscal year ended May 31, 2015 and $6,930 for the fiscal year ended May 31, 2014. The services for which these fees were paid included technical tax consultation for capital gain tax and withholding tax reporting for foreign governments and requirements on local country’s self-certification forms.
(d) All Other Fees
The aggregate fees paid to the principal accountant for products and services rendered by the principal accountant to the registrant not reported in paragraphs (a)-(c) of Item 4 were $0 for the fiscal year ended May 31, 2015 and $569 for the fiscal year ended May 31, 2014. The services for which these fees were paid included review of materials provided to the fund Board in connection with the investment management contract renewal process.
The aggregate fees paid to the principal accountant for products and services rendered by the principal accountant to the registrant’s investment adviser and any entity controlling, controlled by or under common control with the investment adviser that provides ongoing services to the registrant other than services reported in paragraphs (a)-(c) of Item 4 were $9,000 for the fiscal year ended May 31, 2015 and $159,167 for the fiscal year ended May 31, 2014. The services for which these fees were paid included preparation and review of materials provided to the fund Board in connection with the investment management contract renewal process.
(e) (1) The registrant’s audit committee is directly responsible for approving the services to be provided by the auditors, including:
(i) pre-approval of all audit and audit related services;
(ii) pre-approval of all non-audit related services to be provided to the Fund by the auditors;
(iii) pre-approval of all non-audit related services to be provided to the registrant by the auditors to the registrant’s investment adviser or to any entity that controls, is controlled by or is under common control with the registrant’s investment adviser and that provides ongoing services to the registrant where the non-audit services relate directly to the operations or financial reporting of the registrant; and
(iv) establishment by the audit committee, if deemed necessary or appropriate, as an alternative to committee pre-approval of services to be provided by the auditors, as required by paragraphs (ii) and (iii) above, of policies and procedures to permit such services to be pre-approved by other means, such as through establishment of guidelines or by action of a designated member or members of the committee; provided the policies and procedures are detailed as to the particular service and the committee is informed of each service and such policies and procedures do not include delegation of audit committee responsibilities, as contemplated under the Securities Exchange Act of 1934, to management; subject, in the case of (ii) through (iv), to any waivers, exceptions or exemptions that may be available under applicable law or rules.
(e) (2) None of the services provided to the registrant described in paragraphs (b)-(d) of Item 4 were approved by the audit committee pursuant to paragraph (c)(7)(i)(C) of Rule 2-01 of regulation S-X.
(f) No disclosures are required by this Item 4(f).
(g) The aggregate non-audit fees paid to the principal accountant for services rendered by the principal accountant to the registrant and the registrant’s investment adviser and any entity controlling, controlled by or under common control with the investment adviser that provides ongoing services to the registrant were $9,000 for the fiscal year ended May 31, 2015 and $166,666 for the fiscal year ended May 31, 2014.
(h) The registrant’s audit committee of the board has considered whether the provision of non-audit services that were rendered to the registrant’s investment adviser (not including any sub-adviser whose role is primarily portfolio management and is subcontracted with or overseen by another investment adviser), and any entity controlling, controlled by, or under common control with the investment adviser that provides ongoing services to the registrant that were not pre-approved pursuant to paragraph (c)(7)(ii) of Rule 2-01 of Regulation S-X is compatible with maintaining the principal accountant’s independence.
Item 5. Audit Committee of Listed Registrants. N/A
Item 6. Schedule of Investments. N/A
Item 7. Disclosure of Proxy Voting Policies and Procedures for Closed-End Management Investment Companies. N/A
Item 8. Portfolio Managers of Closed-End Management Investment Companies. N/A
Item 9. Purchases of Equity Securities by Closed-End Management Investment Company and Affiliated Purchasers. N/A
Item 10. Submission of Matters to a Vote of Security Holders.
There have been no changes to the procedures by which shareholders may recommend nominees to the Registrant's Board of Trustees that would require disclosure herein.
Item 11. Controls and Procedures.
(a) Evaluation of Disclosure Controls and Procedures. The Registrant maintains disclosure controls and procedures that are designed to ensure that information required to be disclosed in the Registrant’s filings under the Securities Exchange Act of 1934 and the Investment Company Act of 1940 is recorded, processed, summarized and reported within the periods specified in the rules and forms of the Securities and Exchange Commission. Such information is accumulated and communicated to the Registrant’s management, including its principal executive officer and principal financial officer, as appropriate, to allow timely decisions regarding required disclosure. The Registrant’s management, including the principal executive officer and the principal financial officer, recognizes that any set of controls and procedures, no matter how well designed and operated, can provide only reasonable assurance of achieving the desired control objectives.
Within 90 days prior to the filing date of this Shareholder Report on Form N-CSR, the Registrant had carried out an evaluation, under the supervision and with the participation of the Registrant’s management, including the Registrant’s principal executive officer and the Registrant’s principal financial officer, of the effectiveness of the design and operation of the Registrant’s disclosure controls and procedures. Based on such evaluation, the Registrant’s principal executive officer and principal financial officer concluded that the Registrant’s disclosure controls and procedures are effective.
(b) Changes in Internal Controls. There have been no changes in the Registrant’s internal controls or in other factors that could materially affect the internal controls over financial reporting subsequent to the date of their evaluation in connection with the preparation of this Shareholder Report on Form N-CSR.
Item 12. Exhibits.
(a)(1) Code of Ethics
(a)(2) Certifications pursuant to Section 302 of the Sarbanes-Oxley Act of 2002 of Laura F. Fergerson, Chief Executive Officer - Finance and Administration, and Gaston Gardey, Chief Financial Officer and Chief Accounting Officer
(b) Certifications pursuant to Section 906 of the Sarbanes-Oxley Act of 2002 of Laura F. Fergerson, Chief Executive Officer - Finance and Administration, and Gaston Gardey, Chief Financial Officer and Chief Accounting Officer
SIGNATURES
Pursuant to the requirements of the Securities Exchange Act of 1934 and the Investment Company Act of 1940, the registrant has duly caused this report to be signed on its behalf by the undersigned, thereunto duly authorized.
FRANKLIN MUNICIPAL SECURITIES TRUST
By /s/Laura F. Fergerson
Laura F. Fergerson
Chief Executive Officer - Finance and Administration
Date July 27, 2015
Pursuant to the requirements of the Securities Exchange Act of 1934 and the Investment Company Act of 1940, this report has been signed below by the following persons on behalf of the registrant and in the capacities and on the dates indicated.
By /s/Laura F. Fergerson
Laura F. Fergerson
Chief Executive Officer - Finance and Administration
Date July 27, 2015
By /s/Gaston Gardey
Gaston Gardey
Chief Financial Officer and Chief Accounting Officer
Date July 27, 2015