| UNITED STATES |
| SECURITIES AND EXCHANGE COMMISSION |
| Washington, D.C. 20549 |
| FORM N-CSR |
| CERTIFIED SHAREHOLDER REPORT OF REGISTERED MANAGEMENT |
| INVESTMENT COMPANIES |
| Investment Company Act file number | 811- 6490 |
| Dreyfus Premier Investment Funds, Inc. |
| (Exact name of Registrant as specified in charter) |
| c/o The Dreyfus Corporation | ||
| 200 Park Avenue | ||
| New York, New York 10166 | ||
| (Address of principal executive offices) | (Zip code) | |
| Michael A. Rosenberg, Esq. |
| 200 Park Avenue |
| New York, New York 10166 |
| (Name and address of agent for service) |
| Registrant's telephone number, including area code: | (212) 922-6000 | |||
| Date of fiscal year end: | 10/31 | |||
| Date of reporting period: | 10/31/08 | |||
The following N-CSR relates only to the Registrant’s series listed below and does not affect the other series of the Registrant, which has a different fiscal year end and, therefore, different N-CSR reporting requirements. A separate N-CSR Form will be filed for this series, as appropriate.
DREYFUS PREMIER INVESTMENT FUNDS, INC.
- DREYFUS DIVERSIFIED INTERNATIONAL FUND
- DREYFUS EMERGING ASIA FUND
- DREYFUS GREATER CHINA FUND
- DREYFUS INTERNATIONAL GROWTH FUND
| FORM N-CSR |
| Item 1. | Reports to Stockholders. |
-2-
Save time. Save paper. View your next shareholder report online as soon as it’s available. Log into www.dreyfus.com and sign up for Dreyfus eCommunications. It’s simple and only takes a few minutes.
The views expressed in this report reflect those of the portfolio manager only through the end of the period covered and do not necessarily represent the views of Dreyfus or any other person in the Dreyfus organization. Any such views are subject to change at any time based upon market or other conditions and Dreyfus disclaims any responsibility to update such views.These views may not be relied on as investment advice and, because investment decisions for a Dreyfus fund are based on numerous factors, may not be relied on as an indication of trading intent on behalf of any Dreyfus fund.
Not FDIC-Insured Not Bank-Guaranteed May Lose Value
| Contents | ||
| THE FUND | ||
| 2 | A Letter from the CEO | |
| 3 | Discussion of Fund Performance | |
| 6 | Fund Performance | |
| 8 | Understanding Your Fund’s Expenses | |
| 8 | Comparing Your Fund’s Expenses | |
| With Those of Other Funds | ||
| 9 | Statement of Investments | |
| 10 | Statement of Assets and Liabilities | |
| 11 | Statement of Operations | |
| 12 | Statement of Changes in Net Assets | |
| 13 | Financial Highlights | |
| 14 | Notes to Financial Statements | |
| 23 | Report of Independent Registered | |
| Public Accounting Firm | ||
| 24 | Board Members Information | |
| 27 | Officers of the Fund | |
| FOR MORE INFORMATION | ||
| Back Cover | ||
| Dreyfus |
| Diversified |
| International Fund |
| The Fund |

A LETTER FROM THE CEO
Dear Shareholder:
We present to you this report for Dreyfus Diversified International Fund, covering the period from the fund’s inception on December 19, 2007, through October 31, 2008.
These are difficult times for international investors.A credit crunch that began in the United States in 2007 has developed into a full-blown global financial crisis, recently resulting in the failure of several major financial institutions. Meanwhile, the global economic slowdown has gathered momentum, depressing investor sentiment, consumer confidence and business investment around the world. These factors undermined equity returns in most regions, including formerly high-flying emerging markets.
The depth and duration of the economic downturn will depend on how quickly the global financial system can be stabilized.We believe that government efforts in the United States and Europe meet several critical requirements for addressing today’s financial stresses, and we expect them to contribute to a more orderly deleveraging process. However, recuperation from the financial crisis is likely to take time. In the mean-time,we encourage you to keep in touch with your financial advisor and maintain a long-term and disciplined perspective to investing. Indeed, we already are seeing some positive signs, including a likely peak in global inflationary pressures, attractive valuations among fundamentally sound companies and a large pool of worldwide financial liquidity that could be deployed gradually as the economic cycle turns.
For information about how the fund performed during the reporting period, as well as market perspectives, we have provided a Discussion of Fund Performance given by the fund’s Portfolio Managers.
Thank you for your continued confidence and support.

2

DISCUSSION OF FUND PERFORMANCE
For the period of December 19, 2007, through October 31, 2008, as provided by Phillip N. Maisano, Richard B. Hoey and William J. Reilly, CFA, Portfolio Managers
Fund and Market Performance Overview
Between its inception on December 19, 2007, and the end of the reporting period on October 31, 2008, Dreyfus Diversified International Fund’s Class A shares produced a total return of –39.28%, Class C shares returned –39.68%, Class I shares returned –39.12% and Class T shares returned –39.44% .1 In comparison, the fund’s benchmark, the Morgan Stanley Capital International (MSCI) Europe, Australasia and Far East (EAFE) Index (the “Index”), produced a total return of –41.35% for the same period.2
Stock markets throughout the world posted sharp declines due to a slowing global economy and a severe financial crisis.The fund’s returns were higher than its benchmark, primarily due to the fund’s allocations to Dreyfus International Stock Fund and,to a lesser extent,Dreyfus/Newton International Equity Fund and Dreyfus InternationalValue Fund.
The Fund’s Investment Approach
The fund seeks long-term capital appreciation. To pursue its goal, the fund normally allocates its assets among other mutual funds advised by The Dreyfus Corporation (Dreyfus), or its affiliates, that invest primarily in stocks issued by foreign companies.The underlying funds are selected by the Dreyfus Investment Committee based on their investment objectives and management policies, portfolio holdings, risk/reward profiles, historical performance and other factors. Dreyfus seeks to diversify the fund’s investments by market capitalization, investment style and geographic region. The Dreyfus Investment Committee will rebalance the fund’s investments in the underlying funds at least annually, but may do so more often in response to market conditions.
Global Financial Crisis Sparked Broad Declines
Following a downward trend established by the United States, most regions of the world suffered from slowing economic growth, fueling
The Fund 3
| DISCUSSION OF FUND PERFORMANCE (continued) |
fears of a potentially deep and prolonged global recession. Commodity prices that had soared over the reporting period’s first half plummeted over the second half as worldwide demand eased.
Meanwhile, a global credit crunch that began in the U.S. sub-prime mortgage market in 2007 developed into a global financial crisis later in the reporting period, and poor liquidity conditions in the credit markets nearly led to the collapse of the global banking system in September 2008. Government and regulatory authorities intervened, pumping billions of dollars into the system to restore a degree of investor confidence. These efforts included capital infusions by the United States, United Kingdom and other governments, as well as unprecedented, coordinated reductions of short-term interest rates by major central banks.
As market conditions deteriorated, many highly leveraged institutional investors were forced to de-lever their portfolios, selling their more liquid investments to raise cash for margin calls and redemptions. Selling pressure led to broadly lower prices even among fundamentally sound markets and stocks.
Allocation Changes Helped Support Relative Performance
In this challenging environment, the fund began operations with roughly 20% of its assets allocated to each of the following: Dreyfus International Equity Fund,Dreyfus InternationalValue Fund,International Stock Fund and Dreyfus/Newton International Equity Fund. We initially allocated 10% each to Dreyfus International Small Cap Fund and Emerging Markets Opportunity Fund. In July 2008, when the financial crisis began to intensify, we shifted approximately 5% of the fund’s assets from Dreyfus International Small Cap Fund into Dreyfus/Newton International Equity Fund, a move that proved beneficial to performance. In late September, we moved another 9% of assets from Emerging Markets Opportunity Fund into International Stock Fund, further benefiting relative performance.
Indeed, the fund’s strong relative performance during the reporting period was driven mainly by the allocation to International Stock Fund, which outperformed the benchmark by more than 10 percentage points. Dreyfus International Value Fund and Dreyfus/Newton International Equity Fund also bolstered relative performance, but more mildly. Dreyfus International Equity Fund, Dreyfus International Small
4
Cap Fund and Emerging Markets Opportunity Fund detracted from performance as all three funds underperformed the Index.
From a market sector perspective, relatively light exposure to the financial sector aided relative performance as financial stocks comprised the worst performing sector in the Index.An overweighted position in the health care sector, the Index’s best-performing sector, also contributed positively to the fund’s relative performance since inception. On a country basis, a mild emphasis on Switzerland, the strongest performing market in the Index, helped relative performance, as did a recent increase in exposure to Japan, where currency appreciation helped bolster returns. Conversely, the fund’s exposure to the emerging markets, which are not represented in the Index, detracted from relative performance.
Among individual stocks, strongly positive contributors during the reporting period included pharmaceutical developer Novartis, Shin-Etsu Chemical and Takeda Pharmaceutical. Individual detractors included Roche Holdings, Public Power Corp. and Nobel Biocare Holdings.
Maintaining a Cautious Posture
We expect the global economic downturn and portfolio deleverag-ing to persist. Therefore, we have maintained a relatively cautious investment posture, including only small allocations to the emerging markets and international small-cap funds. Instead we have placed greater emphasis on funds holding larger, higher-quality companies in traditionally defensive industry groups.
November 15, 2008
| 1 | Total return includes reinvestment of dividends and any capital gains paid, and does not take into | |
| consideration the maximum initial sales charges in the case of Class A and Class T shares, or the | ||
| applicable contingent deferred sales charges imposed on redemptions in the case of Class C shares. | ||
| Had these charges been reflected, returns would have been lower. Past performance is no guarantee | ||
| of future results. Share price and investment return fluctuate such that upon redemption, fund | ||
| shares may be worth more or less than their original cost. Return figures provided reflect the | ||
| absorption of certain fund expenses by The Dreyfus Corporation through March 1, 2010, at | ||
| which time it may be extended, terminated or modified. Had these expenses not been absorbed, | ||
| the fund’s returns would have been lower. | ||
| 2 | SOURCE: BLOOMBERG L.P. — Reflects reinvestment of net dividends and, where | |
| applicable, capital gain distributions.The Morgan Stanley Capital International Europe, | ||
| Australasia, Far East (MSCI EAFE) Index is an unmanaged index composed of a sample of | ||
| companies representative of the market structure of European and Pacific Basin countries. |
The Fund 5
FUND PERFORMANCE

| † Source: Lipper Inc. |
| Past performance is not predictive of future performance.The fund’s performance shown in the graph and table does not |
| reflect the deduction of taxes that a shareholder would pay on fund distributions or the redemption of fund shares. |
| The above graph compares a $10,000 investment made in Class A, Class C, Class I and Class T shares of Dreyfus |
| Diversified International Fund on 12/18/07 (inception date) to a $10,000 investment made in the Morgan Stanley |
| Capital International Europe,Australasia, Far East (MSCI EAFE) Free Index (the “Index”) on that date.All |
| dividends and capital gain distributions are reinvested. For comparative purposes, the value of the Index on 12/31/07 is |
| used as the beginning value on 12/18/07. |
| The fund’s performance shown in the line graph takes into account the maximum initial sales charges on Class A shares |
| and Class T shares, the applicable contingent deferred sales charge on Class C shares and all other applicable fees and |
| expenses on all classes.The Index is an unmanaged index composed of a sample of companies representative of the |
| market structure of European and Pacific Basin countries. Unlike a mutual fund, the Index is not subject to charges, fees |
| and other expenses. Investors cannot invest directly in any index. Further information relating to fund performance, |
| including expense reimbursements, if applicable, is contained in the Financial Highlights section of the prospectus and |
| elsewhere in this report. |
6
| Actual Aggregate Total Return as of 10/31/08 | ||||
| Inception | From | |||
| Date | Inception | |||
| Class A shares | ||||
| with maximum sales charge (5.75%) | 12/18/07 | (42.76)% | ||
| without sales charge | 12/18/07 | (39.28)% | ||
| Class C shares | ||||
| with applicable redemption charge † | 12/18/07 | (40.28)% | ||
| without redemption | 12/18/07 | (39.68)% | ||
| Class I shares | 12/18/07 | (39.12)% | ||
| Class T shares | ||||
| with applicable sales charge (4.5%) | 12/18/07 | (42.17)% | ||
| without sales charge | 12/18/07 | (39.44)% | ||
| Past performance is not predictive of future performance.The fund’s performance shown in the graph and table does not |
| reflect the deduction of taxes that a shareholder would pay on fund distributions or the redemption of fund shares. |
| † The maximum contingent deferred sales charge for Class C shares is 1% for shares redeemed within one year of the |
| date of purchase. |
The Fund 7
UNDERSTANDING YOUR FUND’S EXPENSES (Unaudited)
As a mutual fund investor, you pay ongoing expenses, such as management fees and other expenses. Using the information below, you can estimate how these expenses affect your investment and compare them with the expenses of other funds.You also may pay one-time transaction expenses, including sales charges (loads) and redemption fees, which are not shown in this section and would have resulted in higher total expenses. For more information, see your fund’s prospectus or talk to your financial adviser.
Review your fund’s expenses
The table below shows the expenses you would have paid on a $1,000 investment in Dreyfus Diversified International Fund from May 1, 2008 to October 31, 2008. It also shows how much a $1,000 investment would be worth at the close of the period, assuming actual returns and expenses.
| Expenses and Value of a $1,000 Investment | ||||||||
| assuming actual returns for the six months ended October 31, 2008 | ||||||||
| Class A | Class C | Class I | Class T | |||||
| Expenses paid per $1,000† | $ 5.86 | $ 8.88 | $ 4.85 | $ 6.87 | ||||
| Ending value (after expenses) | $607.20 | $605.10 | $608.80 | $606.60 | ||||
| COMPARING YOUR FUND’S EXPENSES |
| WITH THOSE OF OTHER FUNDS (Unaudited) |
Using the SEC’s method to compare expenses
The Securities and Exchange Commission (SEC) has established guidelines to help investors assess fund expenses. Per these guidelines, the table below shows your fund’s expenses based on a $1,000 investment, assuming a hypothetical 5% annualized return. You can use this information to compare the ongoing expenses (but not transaction expenses or total cost) of investing in the fund with those of other funds.All mutual fund shareholder reports will provide this information to help you make this comparison. Please note that you cannot use this information to estimate your actual ending account balance and expenses paid during the period.
| Expenses and Value of a $1,000 Investment | ||||||||
| assuming a hypothetical 5% annualized return for the six months ended October 31, 2008 | ||||||||
| Class A | Class C | Class I | Class T | |||||
| Expenses paid per $1,000† | $ 7.35 | $ 11.14 | $ 6.09 | $ 8.62 | ||||
| Ending value (after expenses) | $1,017.85 | $1,014.08 | $1,019.10 | $1,016.59 | ||||
† Expenses are equal to the fund’s annualized expense ratio of 1.45% for Class A, 2.20% for Class C, 1.20% for Class I and 1.70% for Class T, multiplied by the average account value over the period, multiplied by 184/366 (to reflect the one-half year period).
8
| STATEMENT OF INVESTMENTS |
| October 31, 2008 |
| Other Investment—100.4% | Shares | Value ($) | ||
| Registered Investment Companies | ||||
| Dreyfus International | ||||
| Equity Fund, Cl. I | 14,189 a | 327,342 | ||
| Dreyfus International | ||||
| Small Cap Fund, Cl. I | 9,058 a | 74,913 | ||
| Dreyfus International | ||||
| Value Fund, Cl. I | 40,134 a | 366,018 | ||
| Newton International Equity Fund, Cl. I | 29,548 a | 424,016 | ||
| Dreyfus International Stock Fund, Cl. I | 61,628 a | 560,198 | ||
| Total Investments (cost $2,597,523) | 100.4% | 1,752,487 | ||
| Liabilities, Less Cash and Receivables | (.4%) | (6,516) | ||
| Net Assets | 100.0% | 1,745,971 | ||
a Investment in affiliated mutual fund.
| Portfolio Summary (Unaudited)† | ||
| Value (%) | ||
| Affiliated Mutual Funds | 100.4 |
| † Based on net assets. |
| See notes to financial statements. |
The Fund 9
| STATEMENT OF ASSETS AND LIABILITIES |
| October 31, 2008 |
| Cost | Value | |||||||
| Assets ($): | ||||||||
| Investments in affiliated issuers—See Statement of Investments | 2,597,523 | 1,752,487 | ||||||
| Prepaid expenses | 98,943 | |||||||
| Due from The Dreyfus Corporation and affiliates—Note 3(c) | 13,950 | |||||||
| 1,865,380 | ||||||||
| Liabilities ($): | ||||||||
| Cash overdraft due to Custodian | 24,149 | |||||||
| Interest payable—Note 2 | 19 | |||||||
| Accrued expenses | 95,241 | |||||||
| 119,409 | ||||||||
| Net Assets ($) | 1,745,971 | |||||||
| Composition of Net Assets ($): | ||||||||
| Paid-in capital | 2,704,910 | |||||||
| Accumulated undistributed investment income—net | 1,296 | |||||||
| Accumulated net realized gain (loss) on investments | (115,199) | |||||||
| Accumulated net unrealized appreciation | ||||||||
| (depreciation) on investments | (845,036) | |||||||
| Net Assets ($) | 1,745,971 | |||||||
| Net Asset Value Per Share | ||||||||
| Class A | Class C | Class I | Class T | |||||
| Net Assets ($) | 1,646,375 | 38,868 | 30,430 | 30,298 | ||||
| Shares Outstanding | 216,853 | 5,152 | 4,000 | 4,000 | ||||
| Net Asset Value Per Share ($) | 7.59 | 7.54 | 7.61 | 7.57 | ||||
| See notes to financial statements. | ||||||||
10
| STATEMENT OF OPERATIONS |
| From December 18, 2007 (commencement of operations) to October 31, 2008 |
| Investment Income ($): | ||
| Income: | ||
| Cash dividends from affiliated issuers | 2,852 | |
| Expenses: | ||
| Prospectus and shareholders’ reports | 61,790 | |
| Registration fees | 38,419 | |
| Auditing fees | 33,414 | |
| Directors’ fees and expenses—Note 3(d) | 20,900 | |
| Legal fees | 15,024 | |
| Shareholder servicing costs—Note 3(c) | 5,205 | |
| Custodian fees—Note 3(c) | 1,629 | |
| Distribution fees—Note 3(b) | 427 | |
| Interest expense—Note 2 | 46 | |
| Loan commitment fees—Note 2 | 2 | |
| Miscellaneous | 11,609 | |
| Total Expenses | 188,465 | |
| Less—expense reimbursement from The Dreyfus | ||
| Corporation due to undertaking—Note 3(a) | (184,071) | |
| Less—reduction in fees due to earnings credits—Note 1(b) | (67) | |
| Net Expenses | 4,327 | |
| Investment (Loss)—Net | (1,475) | |
| Realized and Unrealized Gain (Loss) on Investments—Note 4 ($): | ||
| Net realized gain (loss) on investments in affiliated issuers | (123,428) | |
| Capital gain distributions from affiliated issuers | 10,849 | |
| Net Realized Gain (Loss) | (112,579) | |
| Net unrealized appreciation (depreciation) | ||
| on investments in affiliated issuers | (845,036) | |
| Net Realized and Unrealized Gain (Loss) on Investments | (957,615) | |
| Net (Decrease) in Net Assets Resulting from Operations | (959,090) | |
| See notes to financial statements. | ||
The Fund 11
| STATEMENT OF CHANGES IN NET ASSETS |
| From December 18, 2007 (commencement of operations) to October 31, 2008 |
| Operations ($): | ||
| Investment (loss)—net | (1,475) | |
| Net realized gain (loss) on investments | (112,579) | |
| Net unrealized appreciation | ||
| (depreciation) on investments | (845,036) | |
| Net Increase (Decrease) in Net Assets | ||
| Resulting from Operations | (959,090) | |
| Capital Stock Transactions ($): | ||
| Net proceeds from shares sold: | ||
| Class A Shares | 2,676,174 | |
| Class C Shares | 64,497 | |
| Class I Shares | 50,000 | |
| Class T Shares | 50,000 | |
| Cost of shares redeemed: | ||
| Class A Shares | (134,395) | |
| Class C Shares | (1,215) | |
| Increase (Decrease) in Net Assets | ||
| from Capital Stock Transactions | 2,705,061 | |
| Total Increase (Decrease) in Net Assets | 1,745,971 | |
| Net Assets ($): | ||
| Beginning of Period | — | |
| End of Period | 1,745,971 | |
| Undistributed investment income—net | 1,296 | |
| Capital Share Transactions (Shares): | ||
| Class A | ||
| Shares sold | 230,150 | |
| Shares redeemed | (13,297) | |
| Net Increase (Decrease) in Shares Outstanding | 216,853 | |
| Class C | ||
| Shares sold | 5,312 | |
| Shares redeemed | (160) | |
| Net Increase (Decrease) in Shares Outstanding | 5,152 | |
| Class I | ||
| Shares sold | 4,000 | |
| Class T | ||
| Shares sold | 4,000 | |
| See notes to financial statements. |
12
FINANCIAL HIGHLIGHTS
The following table describes the performance for each share class for the period from December 18, 2007 (commencement of operations) to October 31, 2008. All information (except portfolio turnover rate) reflects financial results for a single fund share. Total return shows how much your investment in the fund would have increased (or decreased) during each period, assuming you had reinvested all dividends and distributions.These figures have been derived from the fund’s financial statements.
| Class A | Class C | Class I | Class T | |||||
| Shares | Shares | Shares | Shares | |||||
| Per Share Data ($): | ||||||||
| Net asset value, beginning of period | 12.50 | 12.50 | 12.50 | 12.50 | ||||
| Investment Operations: | ||||||||
| Investment income (loss)—neta | (.01) | (.05) | .05 | .00b | ||||
| Net realized and unrealized | ||||||||
| gain (loss) on investments | (4.90) | (4.91) | (4.94) | (4.93) | ||||
| Total from Investment Operations | (4.91) | (4.96) | (4.89) | (4.93) | ||||
| Net asset value, end of period | 7.59 | 7.54 | 7.61 | 7.57 | ||||
| Total Return (%)c | (39.28)d | (39.68)d | (39.12) | (39.44)d | ||||
| Ratios/Supplemental Data (%): | ||||||||
| Ratio of total expenses | ||||||||
| to average net assetse,f | 14.57 | 15.79 | 14.86 | 15.36 | ||||
| Ratio of net expenses | ||||||||
| to average net assetse,f | 1.45 | 2.20 | 1.20 | 1.70 | ||||
| Ratio of net investment (loss) | ||||||||
| to average net assetse,f | (.13) | (.51) | .54 | .04 | ||||
| Portfolio Turnover Ratec | 25.65 | 25.65 | 25.65 | 25.65 | ||||
| Net Assets, end of period ($ x 1,000) | 1,646 | 39 | 30 | 30 |
| a | Based on average shares outstanding at each month end. | |
| b | Amount represents less than $.01 per share. | |
| c | Not annualized. | |
| d | Exclusive of sales charge. | |
| e | Annualized. | |
| f | Amounts do not include the activity of the underlying funds. | |
| See notes to financial statements. | ||
The Fund 13
NOTES TO FINANCIAL STATEMENTS
NOTE 1—Significant Accounting Policies:
Dreyfus Diversified International Fund (the “fund”) is a separate diversified series of Dreyfus Premier Investment Funds, Inc. (the “Company,” formerly known as Dreyfus Premier International Funds, Inc.) which is registered under the Investment Company Act of 1940, as amended (the “Act”), as an open-end management investment company and operates as a series company currently offering four series, including the fund.The fund commenced operations on December 18, 2007.The fund’s investment objective is long-term capital appreciation. The Dreyfus Corporation (the “Manager” or “Dreyfus”), a wholly-owned subsidiary of The Bank of New York Mellon Corporation (“BNY Mellon”), serves as the fund’s investment adviser.
At a meeting of the fund’s Board of Directors held on July 10, 2008, the Board approved, effective December 1, 2008, a proposal to change the name of the fund from “Dreyfus Premier Diversified International Fund” to “Dreyfus Diversified International Fund.”
Effective July 1, 2008, BNY Mellon has reorganized and consolidated a number of its banking and trust company subsidiaries. As a result of the reorganization, any services previously provided to the fund by Mellon Bank, N.A. or Mellon Trust of New England, N.A. are now provided by The Bank of New York, which has changed its name to The Bank of New York Mellon.
MBSC Securities Corporation (the “Distributor”), a wholly-owned subsidiary of the Manager, is the distributor of the fund’s shares. The fund is authorized to issue 100 million shares of $.001 par value Common Stock in each of the following classes of shares: Class A, Class C, Class I and Class T. Class A and Class T shares are subject to a sales charge imposed at the time of purchase. Class C shares are subject to a CDSC imposed on Class C shares redeemed within one year of purchase. Class I shares are sold at net asset value per share only to
14
institutional investors. Other differences between the classes include the services offered to and the expenses borne by each class, the allocation of certain transfer agency costs and certain voting rights. Income, expenses (other than expenses attributable to a specific class), and realized and unrealized gains or losses on investments are allocated to each class of shares based on its relative net assets.
As of October 31, 2008, MBSC Investments Corp., an indirect subsidiary of BNY Mellon, held 4,000 Class C, Class I and Class T shares of the fund.
The Company accounts separately for the assets, liabilities and operations of each series. Expenses directly attributable to each series are charged to that series’ operations; expenses which are applicable to all series are allocated among them on a pro rata basis.
The fund’s financial statements are prepared in accordance with U.S. generally accepted accounting principles, which may require the use of management estimates and assumptions. Actual results could differ from those estimates.
The fund enters into contracts that contain a variety of indemnifications. The fund’s maximum exposure under these arrangements is unknown.The fund does not anticipate recognizing any loss related to these arrangements.
(a) Portfolio valuation: Investments are valued at the net asset value of each underlying fund determined as of the close of the New York Stock Exchange (generally 4 p.m., Eastern time) on the valuation date.
The Financial Accounting Standards Board (“FASB”) released Statement of Financial Accounting Standards No. 157 “Fair Value Measurements” (“FAS 157”). FAS 157 establishes an authoritative def-
The Fund 15
| NOTES TO FINANCIAL STATEMENTS (continued) |
inition of fair value, sets out a framework for measuring fair value, and requires additional disclosures about fair-value measurements. The application of FAS 157 is required for fiscal years beginning after November 15, 2007 and interim periods within those fiscal years. Management does not believe that the application of this standard will have a material impact on the financial statements of the fund.
(b) Securities transactions and investment income: Securities transactions are recorded on a trade date basis. Realized gains and losses from securities transactions are recorded on the identified cost basis. Income and capital gain distributions from investments in other investment companies are recorded on the ex-dividend date. Interest income, including, where applicable, accretion of discount and amortization of premium on investments, is recognized on the accrual basis.
The fund has arrangements with the custodian and cash management banks whereby the fund may receive earnings credits when positive cash balances are maintained, which are used to offset custody and cash management fees. For financial reporting purposes, the fund includes net earnings credits as an expense offset in the Statement of Operations.
(c) Affiliated issuers: Investments in other investment companies advised by the Manager are defined as “affiliated” in the Act.
(d) Dividends to shareholders: Dividends are recorded on the ex-dividend date. Dividends from investment income-net and dividends from net realized capital gains, if any, are normally declared and paid annually, but the fund may make distributions on a more frequent basis to comply with the distribution requirements of the Internal Revenue Code of 1986, as amended (the “Code”).To the extent that net realized capital gains can be offset by capital loss carryovers, it is the policy of the fund not to distribute such gains. Income and capital gain distributions are determined in accordance with income tax regulations, which may differ from U.S. generally accepted accounting principles.
16
(e) Federal income taxes: It is the policy of the fund to continue to qualify as a regulated investment company, if such qualification is in the best interests of its shareholders, by complying with the applicable provisions of the Code, and to make distributions of taxable income sufficient to relieve it from substantially all federal income and excise taxes.
The fund adopted FASB Interpretation No. 48 “Accounting for Uncertainty in Income Taxes” (“FIN 48”). FIN 48 provides guidance for how uncertain tax positions should be recognized, measured, presented and disclosed in the financial statements. FIN 48 requires the evaluation of tax positions taken or expected to be taken in the course of preparing the fund’s tax returns to determine whether the tax positions are “more-likely-than-not” of being sustained by the applicable tax authority. Liability for tax positions not deemed to meet the more-likely-than-not threshold would be recorded as a tax expense in the current year.The adoption of FIN 48 had no impact on the operations of the fund for the period ended October 31, 2008.
As of and during the period ended October 31, 2008, the fund did not have any liabilities for any unrecognized tax positions. The fund recognizes interest and penalties, if any, related to unrecognized tax positions as income tax expense in the Statement of Operations. During the period, the fund did not incur any interest or penalties.
The tax period ended October 31, 2008 remains subject to examination by the Internal Revenue Service and state taxing authorities.
At October 31, 2008, the components of accumulated earnings on a tax basis were as follows: undistributed ordinary income $1,296, accumulated capital losses $71,729 and unrealized depreciation $888,506.
The accumulated capital loss carryover is available to be applied against future net securities profits, if any, realized subsequent to October 31, 2008. If not applied, the carryover expires in fiscal 2016.
The Fund 17
| NOTES TO FINANCIAL STATEMENTS (continued) |
During the period ended October 31, 2008, as a result of permanent book to tax differences, primarily due to fund start-up costs, the fund increased accumulated undistributed investment income-net by $2,771, decreased accumulated net realized gain (loss) on investments by $2,620 and decreased paid-in capital by $151. Net assets and net asset value per share were not affected by this reclassification.
NOTE 2—Bank Lines of Credit:
Prior to October 15, 2008, the fund participated with other Dreyfus-managed funds in a $350 million redemption credit facility. Effective October 15, 2008, the fund participates with other Dreyfus-managed funds in a $145 million redemption credit facility (the “Facility”) to be utilized for temporary or emergency purposes, including the financing of redemptions. In connection therewith, the fund has agreed to pay commitment fees on its pro rata portion of the Facility. Interest is charged to the fund based on prevailing market rates in effect at the time of borrowing.
The average daily amount of borrowings outstanding under the Facilities during the period ended October 31, 2008, was approximately $2,200 with a related weighted average annualized interest rate of 2.08% .
NOTE 3—Management Fee and Other Transactions With Affiliates:
(a) Pursuant to a Management Agreement (“Agreement”) with the Manager, there is no management fee paid to the Manager.The fund invests in other mutual funds advised by the Manager. All fees and expenses of the underlying funds are reflected in the underlying funds net asset value. During the period ended October 31, 2008, the Manager reimbursed fees and expenses of the fund.The expense reimbursement, pursuant to the undertaking, amounted to $184,071 during the period ended October 31, 2008.
18
(b) Under the Distribution Plan (the “Plan”) adopted pursuant to Rule 12b-1 under the Act, Class C and Class T shares pay the Distributor for distributing their shares at an annual rate of .75% of the value of the average daily net assets of Class C shares and .25% of the value of the average daily net assets of Class T shares. During the period ended October 31, 2008, Class C and Class T shares were charged $328 and $99, respectively, pursuant to the Plan.
(c) Under the Shareholder Services Plan, Class A, Class C and Class T shares pay the Distributor at an annual rate of ..25% of the value of their average daily net assets for the provision of certain services.The services provided may include personal services relating to shareholder accounts, such as answering shareholder inquiries regarding the fund and providing reports and other information, and services related to the maintenance of shareholder accounts. The Distributor may make payments to Service Agents (a securities dealer, financial institution or other industry professional) in respect of these services. The Distributor determines the amounts to be paid to Service Agents. During the period ended October 31, 2008, Class A, Class C and Class T shares were charged $2,920, $109, and $99, respectively, pursuant to the Shareholder Services Plan.
The fund compensates Dreyfus Transfer, Inc., a wholly-owned subsidiary of the Manager, under a transfer agency agreement for providing personnel and facilities to perform transfer agency services for the fund. During the period ended October 31, 2008, the fund was charged $1,029 pursuant to the transfer agency agreement.
During the period ended October 31, 2008, the fund was charged $4,996 for services performed by the Chief Compliance Officer.
The Fund 19
| NOTES TO FINANCIAL STATEMENTS (continued) |
The fund compensates The Bank of New York Mellon, a subsidiary of BNY Mellon and an affiliate of Dreyfus, under a cash management agreement for performing cash management services related to fund subscriptions and redemptions. During the period ended October 31, 2008, the fund was charged $67 pursuant to the cash management agreement.
The fund compensates The Bank of New York Mellon under a custody agreement for providing custodial services for the fund. During the period ended October 31, 2008, the fund was charged $1,629 pursuant to the custody agreement.
The components of “Due from The Dreyfus Corporation and affiliates” in the Statement of Assets and Liabilities consist of: an expense reimbursement of $17,649, which is offset by Rule 12b-1 distribution plan fees $32, shareholder services plan fees $367, custodian fees $1,067, chief compliance officer fees $1,973, and transfer agency per account fees $260.
(d) Each Board member also serves as a Board member of other funds within the Dreyfus complex. Annual retainer fees and attendance fees are allocated to each fund based on net assets.
(e) A 2% redemption fee is charged and retained by the fund on certain shares redeemed within sixty days following the date of issuance subject to exceptions, including redemptions made through use of the fund’s exchange privilege. During the period ended October 31, 2008, redemption fees charged and retained by the fund amounted to $639.
NOTE 4—Securities Transactions:
The aggregate amount of purchases and sales of investment securities, excluding short-term securities, (all of which were affiliated issuers),
20
during the period ended October 31, 2008, amounted to $3,105,063 and $384,112, respectively.
At October 31, 2008, the cost of investments for federal income tax purposes was $2,640,993; accordingly, accumulated net unrealized depreciation on investments was $888,506 consisting of gross unrealized depreciation.
In March 2008, the FASB released Statement of Financial Accounting Standards No. 161, “Disclosures about Derivative Instruments and Hedging Activities” (“FAS 161”). FAS 161 requires qualitative disclosures about objectives and strategies for using derivatives, quantitative disclosures about fair value amounts of gains and losses on derivative instruments, and disclosures about credit-risk-related contingent features in derivative agreements.The application of FAS 161 is required for fiscal years and interim periods beginning after November 15, 2008. At this time, management is evaluating the implications of FAS 161 and its impact on the financial statements and the accompanying notes has not yet been determined.
NOTE 5—Subsequent Event:
Effective on or about February 4, 2009 (the “Effective Date”), the fund will issue to each holder of its Class T shares, in exchange for said shares, Class A shares of the fund having an aggregate net asset value equal to the aggregate net asset value of the shareholder’s Class T shares.Thereafter, the fund will no longer offer Class T shares.
Effective on or about December 3, 2008, no investments for new accounts were permitted in Class T of the fund, except that participants in certain group retirement plans were able to open a new account in Class T of the fund, provided that the fund was established
The Fund 21
| NOTES TO FINANCIAL STATEMENTS (continued) |
as an investment option under the plans before December 3, 2008. After the Effective Date, subsequent investments in the fund’s Class A shares made by holders of the fund’s Class T shares who received Class A shares of the fund in exchange for their Class T shares will be subject to the front-end sales load schedule currently in effect for Class T shares. Otherwise, all other Class A share attributes will be in effect.
22
| REPORT OF INDEPENDENT REGISTERED |
| PUBLIC ACCOUNTING FIRM |
Shareholders and Board of Directors Dreyfus Diversified International Fund
We have audited the accompanying statement of assets and liabilities, including the statement of investments, of Dreyfus Diversified International Fund (one of the series comprising Dreyfus Premier Investment Funds, Inc.) as of October 31, 2008, and the related statements of operations and changes in net assets and financial highlights for the period from December 18, 2007 (commencement of operations) to October 31, 2008.These financial statements and financial highlights are the responsibility of the Fund’s management. Our responsibility is to express an opinion on these financial statements and financial highlights based on our audit.
We conducted our audit in accordance with the standards of the Public Company Accounting Oversight Board (United States). Those standards require that we plan and perform the audit to obtain reasonable assurance about whether the financial statements and financial highlights are free of material misstatement.We were not engaged to perform an audit of the Fund’s internal control over financial reporting. Our audit included consideration of internal control over financial reporting as a basis for designing audit procedures that are appropriate in the circumstances, but not for the purpose of expressing an opinion on the effectiveness of the Fund’s internal control over financial reporting. Accordingly, we express no such opinion. An audit also includes examining, on a test basis, evidence supporting the amounts and disclosures in the financial statements and financial highlights, assessing the accounting principles used and significant estimates made by management, and evaluating the overall financial statement presentation. Our procedures included confirmation of securities owned as of October 31, 2008 by correspondence with the custodian and others.We believe that our audit provides a reasonable basis for our opinion.
In our opinion, the financial statements and financial highlights referred to above present fairly, in all material respects, the financial position of Dreyfus Diversified International Fund at October 31, 2008, and the results of its operations, the changes in its net assets and the financial highlights for the period from December 18, 2007 to October 31, 2008, in conformity with U. S. generally accepted accounting principles.
New York, New York December 23, 2008
The Fund 23
BOARD MEMBERS INFORMATION ( U n a u d i t e d )
| Joseph S. DiMartino (65) Chairman of the Board (1995) |
Principal Occupation During Past 5Years:
- Corporate Director and Trustee
Other Board Memberships and Affiliations:
- The Muscular Dystrophy Association, Director
- Century Business Services, Inc., a provider of outsourcing functions for small and medium size companies, Director
- The Newark Group, a provider of a national market of paper recovery facilities, paperboard mills and paperboard converting plants, Director
- Sunair Services Corporation, a provider of certain outdoor-related services to homes and businesses, Director
No. of Portfolios for which Board Member Serves: 167
| ——————— |
| Gordon J. Davis (67) Board Member (1993) Principal Occupation During Past 5Years: |
- Partner in the law firm of Dewey & LeBoeuf LLP
- President, Lincoln Center for the Performing Arts, Inc. (2001)
| Other Board Memberships and Affiliations: |
- Consolidated Edison, Inc., a utility company, Director
- Phoenix Companies Inc., a life insurance company, Director
- Board Member/Trustee for several not-for-profit groups
| No. of Portfolios for which Board Member Serves: 41 |
| ——————— |
| David P. Feldman (68) Board Member (1991) |
Principal Occupation During Past 5Years:
- Corporate Director and Trustee
Other Board Memberships and Affiliations:
- BBH Mutual Funds Group (11 funds), Director
- The Jeffrey Company, a private investment company, Director
| No. of Portfolios for which Board Member Serves: 50 |
24
| Lynn Martin (68) Board Member (1993) Principal Occupation During Past 5Years: |
- Advisor to the international accounting firm of Deloitte &Touche, LLP and Chair to its Council for the Advancement of Women from March 1993-September 2005
| Other Board Memberships and Affiliations: |
- AT&T Inc., a telecommunications company, Director
- Ryder System, Inc., a supply chain and transportation management company, Director
- The Proctor & Gamble Co., a consumer products company, Director
- Constellation Energy Group, Director
- Chicago Council on Global Affairs
- Coca-Cola International Advisory Council
- Deutsche Bank Advisory Council
| No. of Portfolios for which Board Member Serves: 14 |
| ——————— |
| Daniel Rose (79) Board Member (1992) Principal Occupation During Past 5Years: |
- Chairman and Chief Executive Officer of Rose Associates, Inc., a New York based real estate development and management firm
| Other Board Memberships and Affiliations: |
- Baltic-American Enterprise Fund,Vice Chairman and Director
- Harlem Educational Activities Fund, Inc., Chairman
- Housing Committee of the Real Estate Board of New York, Inc., Director
| No. of Portfolios for which Board Member Serves: 36 |
| ——————— |
| Philip L. Toia (75) Board Member (1997) |
Principal Occupation During Past 5Years:
- Private Investor
No. of Portfolios for which Board Member Serves: 25
The Fund 25
BOARD MEMBERS INFORMATION (Unaudited) (continued)
| Anne Wexler (78) Board Member (1994) Principal Occupation During Past 5Years: |
- Chairman of the Wexler & Walker Public Policy Associates, consultants specializing in govern- ment relations and public affairs from January 1981 to present
| Other Board Memberships and Affiliations: |
- The Community Foundation for the National Capital Region, Director
- Member of the Council of Foreign Relations
- WETA-DC’s Public TV and Radio Station,Vice Chairman
| No. of Portfolios for which Board Member Serves: 50 |
| ——————— |
Once elected all Board Members serve for an indefinite term, but achieve Emeritus status upon reaching age 80.The address of the Board Members and Officers is in c/o The Dreyfus Corporation, 200 Park Avenue, NewYork, NewYork 10166.Additional information about the Board Members is available in the fund’s Statement of Additional Information which can be obtained from Dreyfus free of charge by calling this toll free number: 1-800-554-4611.
Sander Vanocur, Emeritus Board Member
26
OFFICERS OF THE FUND (Unaudited)
J. DAVID OFFICER, President since December 2006.
Chief Operating Officer,Vice Chairman and a Director of the Manager, and an officer of 77 investment companies (comprised of 167 portfolios) managed by the Manager. He is 60 years old and has been an employee of the Manager since April 1998.
PHILLIP N. MAISANO, Executive Vice President since July 2007.
Chief Investment Officer,Vice Chair and a director of the Manager, and an officer of 77 investment companies (comprised of 167 portfolios) managed by the Manager. Mr. Maisano also is an officer and/or Board member of certain other investment management subsidiaries of The Bank of New York Mellon Corporation, each of which is an affiliate of the Manager. He is 61 years old and has been an employee of the Manager since November 2006. Prior to joining the Manager, Mr. Maisano served as Chairman and Chief Executive Officer of EACM Advisors, an affiliate of the Manager, since August 2004, and served as Chief Executive Officer of Evaluation Associates, a leading institutional investment consulting firm, from 1988 until 2004.
MICHAEL A. ROSENBERG, Vice President and Secretary since August 2005.
Assistant General Counsel of BNY Mellon, and an officer of 78 investment companies (comprised of 188 portfolios) managed by the Manager. He is 48 years old and has been an employee of the Manager since October 1991.
JAMES BITETTO, Vice President and Assistant Secretary since August 2005.
Senior Counsel of BNY Mellon and Secretary of the Manager, and an officer of 78 investment companies (comprised of 188 portfolios) managed by the Manager. He is 42 years old and has been an employee of the Manager since December 1996.
JONI LACKS CHARATAN, Vice President and Assistant Secretary since August 2005.
Senior Counsel of BNY Mellon, and an officer of 78 investment companies (comprised of 188 portfolios) managed by the Manager. She is 53 years old and has been an employee of the Manager since October 1988.
JOSEPH M. CHIOFFI, Vice President and Assistant Secretary since August 2005.
Senior Counsel of BNY Mellon, and an officer of 78 investment companies (comprised of 188 portfolios) managed by the Manager. He is 47 years old and has been an employee of the Manager since June 2000.
JANETTE E. FARRAGHER, Vice President and Assistant Secretary since August 2005.
Assistant General Counsel of BNY Mellon, and an officer of 78 investment companies (comprised of 188 portfolios) managed by the Manager. She is 45 years old and has been an employee of the Manager since February 1984.
JOHN B. HAMMALIAN, Vice President and Assistant Secretary since August 2005.
Managing Counsel of BNY Mellon, and an officer of 78 investment companies (comprised of 188 portfolios) managed by the Manager. He is 45 years old and has been an employee of the Manager since February 1991.
ROBERT R. MULLERY, Vice President and Assistant Secretary since August 2005.
Managing Counsel of BNY Mellon, and an officer of 78 investment companies (comprised of 188 portfolios) managed by the Manager. He is 56 years old and has been an employee of the Manager since May 1986.
The Fund 27
OFFICERS OF THE FUND (Unaudited) (continued)
JEFF PRUSNOFSKY, Vice President and Assistant Secretary since August 2005.
Managing Counsel of BNY Mellon, and an officer of 78 investment companies (comprised of 188 portfolios) managed by the Manager. He is 43 years old and has been an employee of the Manager since October 1990.
JAMES WINDELS, Treasurer since November 2001.
Director – Mutual Fund Accounting of the Manager, and an officer of 78 investment companies (comprised of 188 portfolios) managed by the Manager. He is 49 years old and has been an employee of the Manager since April 1985.
RICHARD CASSARO, Assistant Treasurer since January 2008.
Senior Accounting Manager – Money Market and Municipal Bond Funds of the Manager, and an officer of 78 investment companies (comprised of 188 portfolios) managed by the Manager. He is 49 years old and has been an employee of the Manager since September 1982.
GAVIN C. REILLY, Assistant Treasurer since December 2005.
Tax Manager of the Investment Accounting and Support Department of the Manager, and an officer of 78 investment companies (comprised of 188 portfolios) managed by the Manager. He is 40 years old and has been an employee of the Manager since April 1991.
ROBERT ROBOL, Assistant Treasurer since August 2003.
Senior Accounting Manager – Fixed Income Funds of the Manager, and an officer of 78 investment companies (comprised of 188 portfolios) managed by the Manager. He is 44 years old and has been an employee of the Manager since October 1988.
ROBERT SALVIOLO, Assistant Treasurer since May 2007.
Senior Accounting Manager – Equity Funds of the Manager, and an officer of 78 investment companies (comprised of 188 portfolios) managed by the Manager. He is 41 years old and has been an employee of the Manager since June 1989.
ROBERT SVAGNA, Assistant Treasurer since August 2005.
Senior Accounting Manager – Equity Funds of the Manager, and an officer of 78 investment companies (comprised of 188 portfolios) managed by the Manager. He is 41 years old and has been an employee of the Manager since November 1990.
JOSEPH W. CONNOLLY, Chief Compliance Officer since October 2004.
Chief Compliance Officer of the Manager and The Dreyfus Family of Funds (78 investment companies, comprised of 188 portfolios). From November 2001 through March 2004, Mr. Connolly was first Vice-President, Mutual Fund Servicing for Mellon Global Securities Services. In that capacity, Mr. Connolly was responsible for managing Mellon’s Custody, Fund Accounting and Fund Administration services to third-party mutual fund clients. He is 51 years old and has served in various capacities with the Manager since 1980, including manager of the firm’s Fund Accounting Department from 1997 through October 2001.
WILLIAM GERMENIS, Anti-Money Laundering Compliance Officer since October 2002.
Vice President and Anti-Money Laundering Compliance Officer of the Distributor, and the Anti-Money Laundering Compliance Officer of 74 investment companies (comprised of 184 portfolios) managed by the Manager. He is 38 years old and has been an employee of the Distributor since October 1998.
28
Save time. Save paper. View your next shareholder report online as soon as it’s available. Log into www.dreyfus.com and sign up for Dreyfus eCommunications. It’s simple and only takes a few minutes.
The views expressed in this report reflect those of the portfolio manager only through the end of the period covered and do not necessarily represent the views of Dreyfus or any other person in the Dreyfus organization. Any such views are subject to change at any time based upon market or other conditions and Dreyfus disclaims any responsibility to update such views.These views may not be relied on as investment advice and, because investment decisions for a Dreyfus fund are based on numerous factors, may not be relied on as an indication of trading intent on behalf of any Dreyfus fund.
Not FDIC-Insured Not Bank-Guaranteed May Lose Value
| Contents | ||
| THE FUND | ||
| 2 | A Letter from the CEO | |
| 3 | Discussion of Fund Performance | |
| 6 | Fund Performance | |
| 8 | Understanding Your Fund’s Expenses | |
| 8 | Comparing Your Fund’s Expenses | |
| With Those of Other Funds | ||
| 9 | Statement of Investments | |
| 11 | Statement of Assets and Liabilities | |
| 12 | Statement of Operations | |
| 13 | Statement of Changes in Net Assets | |
| 15 | Financial Highlights | |
| 16 | Notes to Financial Statements | |
| 26 | Report of Independent Registered | |
| Public Accounting Firm | ||
| 27 | Board Members Information | |
| 30 | Officers of the Fund | |
| FOR MORE INFORMATION | ||
| Back Cover | ||
| Dreyfus |
| Emerging Asia Fund |
| The Fund |

A LETTER FROM THE CEO
Dear Shareholder:
We present to you this report for Dreyfus Emerging Asia Fund, covering the period from the fund’s inception, December 13, 2007, through October 31, 2008.
These are difficult times for international investors. A credit crunch that began in the United States in 2007 has developed into a full-blown global financial crisis, recently resulting in the failure of several major financial institutions. Meanwhile, the global economic slowdown has gathered momentum, depressing investor sentiment, consumer confidence and business investment around the world.These factors undermined equity returns in most regions,including formerly high-flying emerging markets.
The depth and duration of the economic downturn will depend on how quickly the global financial system can be stabilized.We believe that government efforts in the United States and Europe meet several critical requirements for addressing today’s financial stresses, and we expect them to contribute to a more orderly deleveraging process. However, recuperation from the financial crisis is likely to take time. In the mean-time,we encourage you to keep in touch with your financial advisor and maintain a long-term and disciplined perspective to investing. Indeed, we already are seeing some positive signs, including a likely peak in global inflationary pressures, attractive valuations among fundamentally sound companies and a large pool of worldwide financial liquidity that could be deployed gradually as the economic cycle turns.
For information about how the fund performed during the reporting period, as well as market perspectives, we have provided a Discussion of Fund Performance given by the fund’s Portfolio Managers.
Thank you for your continued confidence and support.

2

DISCUSSION OF FUND PERFORMANCE
For the period of December 13, 2007, through October 31, 2008, as provided by Hugh Simon, Nina Wu and Abhijit Sarkar, Portfolio Managers
Fund and Market Performance Overview
Between its inception on December 13, 2007, and the end of its annual reporting period on October 31, 2008, Dreyfus Emerging Asia Fund’s Class A shares produced a total return of –68.00%, Class C shares produced a total return of –68.16%, Class I shares produced a total return of –68.00% and Class T shares produced a total return of –68.40% .1 In comparison, the fund’s benchmark, the MSCI Emerging Markets Asia Index, produced a total return of –54.17% for the same period.2
A global financial crisis that had been building since mid-2007 intensified in September and October 2008, sparking sharp declines among stocks throughout the world. Although the crisis originated in the United States, emerging equity markets sold off even more steeply than developed markets as newly risk-averse investors shifted funds to traditional safe havens. The fund’s investments in China, India and Vietnam were particularly hard-hit by the “flight to quality,” causing the fund’s returns to lag its benchmark.
The Fund’s Investment Approach
The fund, which seeks long-term capital appreciation, normally invests at least 80% of its assets in stocks of companies that are principally traded in China, Hong Kong, India, Indonesia, Malaysia, Pakistan, Philippines, Singapore, South Korea,Taiwan,Thailand andVietnam.The fund may invest in the stocks of companies of any market capitalization. To determine where the fund will invest, we analyze several factors, including economic and political trends, the current financial condition and future prospects of individual companies and sectors in the region, and the valuation of one market or company relative to that of another.
Western Economic Woes Affected Asian Markets
Asian markets were unable to decouple from the financial crisis in theWest despite the more robust financial health of Asian banks, little exposure to
The Fund 3
| DISCUSSION OF FUND PERFORMANCE (continued) |
U.S. sub-prime mortgages and the region’s sound economic growth prospects. Indeed, Asian governments learned a lesson in fiscal prudence from a regional financial crisis that occurred in 1997.Since then,bank and government balance sheets have become stronger throughout the region.
However, Asian markets were hurt by concerns that a U.S. recession might adversely affect Asian exporters. The region’s financial markets were fragile even prior to these concerns, as worries had intensified at the time regarding accelerating inflation due to higher commodity prices. Food costs also rose, fueling fears of shortages in less developed countries. In India, the fund’s second largest market and a net importer of oil, stocks generally declined when oil prices soared early in the reporting period.Although inflation fears later ebbed as oil prices moderated, a deluge of bad economic news — including the failure of major U.S. investment banks — dominated headlines and led to a substantial outflow of capital from Asian markets.These trends were exacerbated by the behavior of hedge funds, which were heavily leveraged and needed to sell even fundamentally sound stocks to meet margin calls.
Macroeconomic Themes Dominated Market Performance
During the reporting period, the performance of a company’s shares had more to do with broad economic themes than company-specific factors. For example, despite posting excellent financial results, the fund’s worst performer was an Indian energy company that was hurt by the outflow of assets from midcap stocks.A Beijing-based property developer also saw a disproportionate fall in its stock price compared to the actual decline in underlying property prices. An India-based chemicals producer saw its stock price cut in half, as its relatively attractive valuation did not spare it from a broad-based sell-off.
Similarly, the best performing stocks involved companies benefiting from macroeconomic trends.The fund’s top performer was a Vietnam insurance company that benefited from slowing inflation. In addition, a Chinese government-owned railway company stood to gain from the government’s infrastructure spending, and a Vietnam oil drilling company’s stock fared well in the first half of the reporting period when oil prices surged.We sold the fund’s position in the latter company before oil prices plunged.
4
Cautious Optimism in a Turbulent Market
Recent developments have given us reason for optimism. Just days after the reporting period’s end, China announced a $600 billion stimulus package designed to boost domestic demand, including spending on housing, infrastructure, agriculture, health care and social welfare. Korea and Taiwan have cut interest rates to stimulate their economies. India has reduced its banking system’s cash reserve requirement, the amount that banks must have on deposit with the central bank.
Because of investors’ worries about economic and market conditions in 2009, shares of Asian companies are trading, on average, at price/earnings ratios in the single digits and are paying dividend yields that are higher than many bond yields. Current market turmoil has enabled us to identify high-quality businesses at what we believe to be attractive valuations, particularly among companies that focus on domestic consumption, infrastructure and alternative energy.
November 17, 2008
| Emerging Asia markets tend to be more volatile than the markets of more mature economies, | ||
| and generally have less diverse and less mature economic structures and less stable political | ||
| systems than those of developed countries. The securities of companies located in emerging | ||
| markets are often subject to rapid and large changes in price. An investment in this fund | ||
| should be considered only as a supplement to a complete investment program. | ||
| 1 | Total return includes reinvestment of dividends and any capital gains paid, and does not take into | |
| consideration the maximum initial sales charges in the case of Class A and Class T shares, or the | ||
| applicable contingent deferred sales charges imposed on redemptions in the case of Class C shares. | ||
| Had these charges been reflected, returns would have been lower. Past performance is no guarantee | ||
| of future results. Share price and investment return fluctuate such that upon redemption, fund | ||
| shares may be worth more or less than their original cost. Return figures provided reflect the | ||
| absorption of certain fund expenses by The Dreyfus Corporation pursuant to an agreement in | ||
| effect through March 1, 2010, at which time it may be extended, terminated or modified. Had | ||
| these expenses not been absorbed, the fund’s returns would have been lower. | ||
| Part of the fund’s performance is attributable to positive returns from its initial public | ||
| offering (IPO) investments. There can be no guarantee that IPOs will have or continue to | ||
| have a positive effect on fund performance. Currently, the fund is relatively small in asset | ||
| size. IPOs tend to have a reduced effect on performance as a fund’s asset base grows. | ||
| 2 | SOURCE: BLOOMBERG L.P. – Reflects reinvestment of dividends and, where applicable, | |
| capital gain distributions.The MSCI Emerging Markets Asia Index is a free float adjusted | ||
| market capitalization weighted index designed to measure equity market performance in the | ||
| emerging market countries of Asia. |
The Fund 5
| FUND PERFORMANCE |
† Source: Lipper Inc.
Past performance is not predictive of future performance.
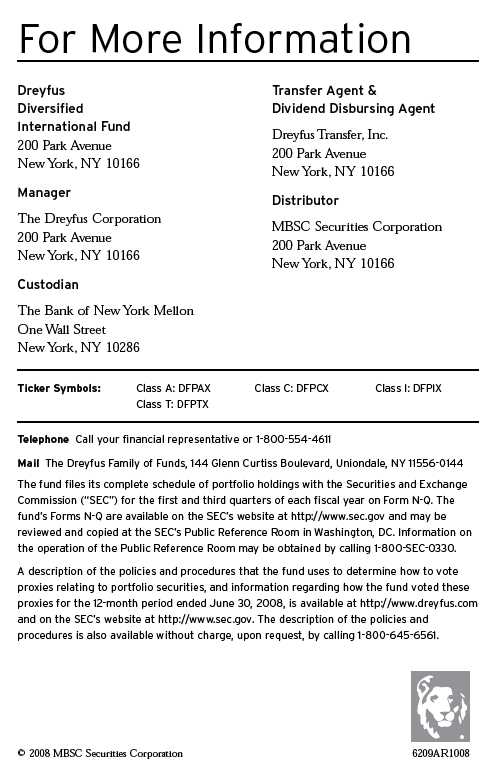
The above graph compares a $10,000 investment made in Class A, Class C, Class I and Class T shares of Dreyfus Emerging Asia Fund on 12/13/07 (inception date) to a $10,000 investment made in the MSCI Emerging Markets Asia Index (the “Index”) on that date. All dividends and capital gain distributions are reinvested. For comparative purposes, the value of the Index on 11/30/07 is used as the beginning value on 12/13/07.
Part of the fund’s recent performance is attributable to positive returns from its initial public offering (IPO) investments. There can be no guarantee that IPOs will have or continue to have a positive effect on fund performance. Currently, the fund is relatively small in asset size. IPOs tend to have a reduced effect on performance as a fund’s asset base grows. The fund’s performance shown in the line graph takes into account the maximum initial sales charges on Class A shares and Class T shares, the applicable contingent deferred sales charge on Class C shares and all other applicable fees and expenses on all classes.The Index is a free-floated adjusted market capitalization weighted index designed to measure equity market performance in the emerging market countries of Asia. Unlike a mutual fund, the Index is not subject to charges, fees and other expenses. Investors cannot invest directly in any index. Further information relating to fund performance, including expense reimbursements, if applicable, is contained in the Financial Highlights section of the prospectus and elsewhere in this report.
6
| Actual Aggregate Total Return as of 10/31/08 | ||||
| Inception | From | |||
| Date | Inception | |||
| Class A shares | ||||
| with maximum sales charge (5.75%) | 12/13/07 | (69.83)% | ||
| without sales charge | 12/13/07 | (68.00)% | ||
| Class C shares | ||||
| with applicable redemption charge † | 12/13/07 | (68.48)% | ||
| without redemption | 12/13/07 | (68.16)% | ||
| Class I shares | 12/13/07 | (68.00)% | ||
| Class T shares | ||||
| with applicable sales charge (4.5%) | 12/13/07 | (69.82)% | ||
| without sales charge | 12/13/07 | (68.40)% | ||
| Past performance is not predictive of future performance.The fund’s performance shown in the graph and table does not |
| reflect the deduction of taxes that a shareholder would pay on fund distributions or the redemption of fund shares. |
| † The maximum contingent deferred sales charge for Class C shares is 1% for shares redeemed within one year of the |
| date of purchase. |
The Fund 7
UNDERSTANDING YOUR FUND’S EXPENSES (Unaudited)
As a mutual fund investor, you pay ongoing expenses, such as management fees and other expenses. Using the information below, you can estimate how these expenses affect your investment and compare them with the expenses of other funds.You also may pay one-time transaction expenses, including sales charges (loads) and redemption fees, which are not shown in this section and would have resulted in higher total expenses. For more information, see your fund’s prospectus or talk to your financial adviser.
Review your fund’s expenses
The table below shows the expenses you would have paid on a $1,000 investment in Dreyfus Emerging Asia Fund from May 1, 2008 to October 31, 2008. It also shows how much a $1,000 investment would be worth at the close of the period, assuming actual returns and expenses.
| Expenses and Value of a $1,000 Investment | ||||||||
| assuming actual returns for the six months ended October 31, 2008 | ||||||||
| Class A | Class C | Class I | Class | |||||
| Expenses paid per $1,000† | $ 7.10 | $ 9.75 | $ 6.21 | $ 7.96 | ||||
| Ending value (after expenses) | $411.90 | $410.30 | $411.90 | $407.20 | ||||
| COMPARING YOUR FUND’S EXPENSES |
| WITH THOSE OF OTHER FUNDS (Unaudited) |
Using the SEC’s method to compare expenses
The Securities and Exchange Commission (SEC) has established guidelines to help investors assess fund expenses. Per these guidelines, the table below shows your fund’s expenses based on a $1,000 investment, assuming a hypothetical 5% annualized return. You can use this information to compare the ongoing expenses (but not transaction expenses or total cost) of investing in the fund with those of other funds.All mutual fund shareholder reports will provide this information to help you make this comparison. Please note that you cannot use this information to estimate your actual ending account balance and expenses paid during the period.
| Expenses and Value of a $1,000 Investment | ||||||||
| assuming a hypothetical 5% annualized return for the six months ended October 31, 2008 | ||||||||
| Class A | Class C | Class I | Class T | |||||
| Expenses paid per $1,000† | $ 10.13 | $ 13.90 | $ 8.87 | $ 11.39 | ||||
| Ending value (after expenses) | $1,015.08 | $1,011.31 | $1,016.34 | $1,013.83 | ||||
† Expenses are equal to the fund’s annualized expense ratio of 2.00% for Class A, 2.75% for Class C, 1.75% for Class I and 2.25% for Class T, multiplied by the average account value over the period, multiplied by 184/366 (to reflect the one-half year period).
8
| STATEMENT OF INVESTMENTS |
| October 31, 2008 |
| Common Stocks—94.4% | Shares | Value ($) | ||
| China—32.8% | ||||
| Beijing Capital Land, Cl. H | 4,000,000 | 366,248 | ||
| Bengang Steel Plates, Cl. B | 622,300 | 162,529 | ||
| China Citic Bank, Cl. H | 500,000 | 151,395 | ||
| China Coal Energy, Cl. H | 183,000 | 107,793 | ||
| China Communication Services, Cl. H | 500,000 | 259,930 | ||
| China Merchants Property Development | 350,000 | 267,585 | ||
| China Telecom, Cl. H | 600,000 | 211,581 | ||
| Chongqing Changan Automobile, Cl. B | 999,979 c | 190,963 | ||
| Hunan Non-Ferrous Metal, Cl. H | 1,522,000 | 135,510 | ||
| Shanghai Friendship Group, Cl. B | 466,840 | 272,287 | ||
| Sino-Ocean Land Holdings | 1,704,500 | 449,616 | ||
| 2,575,437 | ||||
| Hong Kong—15.1% | ||||
| China Everbright | 290,000 | 263,007 | ||
| China Shanshui Cement Group | 100,000 a | 16,256 | ||
| China Travel International Investment Hong Kong | 1,400,000 | 196,365 | ||
| Dynasty Fine Wines Group | 2,000,000 | 260,580 | ||
| Jutal Offshore Oil Services | 1,759,000 | 72,373 | ||
| Zhuzhou CSR Times Electric, Cl. H | 700,000 | 380,133 | ||
| 1,188,714 | ||||
| India—28.8% | ||||
| Binani Cement | 119,000 | 76,409 | ||
| Country Club India | 91,000 | 54,822 | ||
| Engineers India | 58,928 | 466,297 | ||
| Fedders Lloyd | 30,000 | 13,294 | ||
| Gujarat Alkalies & Chemicals | 262,000 | 370,963 | ||
| Hinduja Ventures | 20,000 | 48,149 | ||
| Indiabulls Financial | 110,000 | 243,898 | ||
| Indiabulls Securities | 130,000 | 66,064 | ||
| Indo Asian Fusegear | 61,991 a | 45,486 | ||
| K.S. Oils | 556,500 | 446,385 | ||
| Raj Television Network | 45,500 | 53,222 | ||
| Sanwaria Agro Oils | 241,000 | 157,125 | ||
| XL Telecom & Energy | 182,500 a | 231,145 | ||
| 2,273,259 |
The Fund 9
| STATEMENT OF INVESTMENTS (continued) |
| Common Stocks (continued) | Shares | Value ($) | ||
| Indonesia—1.7% | ||||
| United Tractors | 450,000 | 134,398 | ||
| South Korea—1.5% | ||||
| CJ Home Shopping | 4,185 | 119,327 | ||
| Taiwan—.0% | ||||
| Sino-American Silicon Products | 753 | 1,588 | ||
| United Kingdom—1.6% | ||||
| Standard Chartered | 8,000 | 126,514 | ||
| Vietnam—12.9% | ||||
| Petrovietnam General Services (Warrants 4/1/10) | 130,000 a | 140,732 | ||
| Petrovietnam Insurance (Warrants 2/26/18) | 109,223 a | 147,316 | ||
| Pha Lai Thermal Power (Warrants 1/17/12) | 227,580 a,b | 300,217 | ||
| Saigon Securities (Warrants 1/17/12) | 155,700 a,b | 292,896 | ||
| Vietnam Dairy Products (Warrants 1/20/10) | 30,000 a | 138,424 | ||
| 1,019,585 | ||||
| Total Investments (cost $17,443,398) | 94.4% | 7,438,822 | ||
| Cash and Receivables (Net) | 5.6% | 441,215 | ||
| Net Assets | 100.0% | 7,880,037 | ||
| a Non-income producing security. |
| b Securities exempt from registration under Rule 144A of the Securities Act of 1933.These securities may be resold in |
| transactions exempt from registration, normally to qualified institutional buyers. At October 31, 2008, these securities |
| amounted to $593,113 or 7.5% of net assets. |
| c The value of this security has been determined in good faith under the direction of the Board of Directors. |
| Portfolio Summary (Unaudited)† | ||||||
| Value (%) | Value (%) | |||||
| Financial | 16.3 | Telecommunication Services | 6.0 | |||
| Consumer Staples | 16.2 | Utilities | 5.6 | |||
| Real Estate | 13.7 | Information Technology | 3.6 | |||
| Industrials | 13.2 | Energy | 2.3 | |||
| Materials | 9.7 | |||||
| Consumer Discretionary | 7.8 | 94.4 | ||||
| † Based on net assets. |
| See notes to financial statements. |
10
| STATEMENT OF ASSETS AND LIABILITIES |
| October 31, 2008 |
| Cost | Value | |||||||
| Assets ($): | ||||||||
| Investments in securities—See Statement of Investments | 17,443,398 | 7,438,822 | ||||||
| Cash | 133,952 | |||||||
| Cash denominated in foreign currencies | 194,862 | 195,609 | ||||||
| Receivable for investment securities sold | 183,984 | |||||||
| Receivable for shares of Capital Stock subscribed | 13,521 | |||||||
| Dividends receivable | 11,869 | |||||||
| Prepaid expenses | 68,827 | |||||||
| 8,046,584 | ||||||||
| Liabilities ($): | ||||||||
| Due to The Dreyfus Corporation and affiliates—Note 3(c) | 24,893 | |||||||
| Payable for investment securities purchased | 64,575 | |||||||
| Payable for shares of Capital Stock redeemed | 47,946 | |||||||
| Interest payable—Note 2 | 68 | |||||||
| Accrued expenses | 29,065 | |||||||
| 166,547 | ||||||||
| Net Assets ($) | 7,880,037 | |||||||
| Composition of Net Assets ($): | ||||||||
| Paid-in capital | 25,127,898 | |||||||
| Accumulated net realized gain (loss) on investments | (7,243,676) | |||||||
| Accumulated net unrealized appreciation (depreciation) | ||||||||
| on investments and foreign currency transactions | (10,004,185) | |||||||
| Net Assets ($) | 7,880,037 | |||||||
| Net Asset Value Per Share | ||||||||
| Class A | Class C | Class I | Class T | |||||
| Net Assets ($) | 5,528,092 | 2,233,456 | 100,316 | 18,173 | ||||
| Shares Outstanding | 1,379,674 | 561,482 | 25,075 | 4,600 | ||||
| Net Asset Value Per Share ($) | 4.01 | 3.98 | 4.00 | 3.95 | ||||
| See notes to financial statements. | ||||||||
The Fund 11
| STATEMENT OF OPERATIONS |
| From December 13, 2007 |
| (commencement of operations) to October 31, 2008 |
| Investment Income ($): | ||
| Income: | ||
| Cash dividends (net of $15,313 foreign taxes withheld at source) | 459,713 | |
| Expenses: | ||
| Management fee—Note 3(a) | 190,877 | |
| Custodian fees—Note 3(c) | 76,222 | |
| Legal fees | 74,177 | |
| Shareholder servicing costs—Note 3(c) | 55,312 | |
| Registration fees | 36,198 | |
| Auditing fees | 34,008 | |
| Distribution fees—Note 3(b) | 29,915 | |
| Prospectus and shareholders’ reports | 11,360 | |
| Interest expense—Note 2 | 7,040 | |
| Directors’ fees and expenses—Note 3(d) | 3,713 | |
| Miscellaneous | 15,678 | |
| Total Expenses | 534,500 | |
| Less—expense reimbursement from The Dreyfus | ||
| Corporation due to undertaking—Note 3(a) | (195,597) | |
| Less—reduction in fees due to earnings credits—Note 1(c) | (4,238) | |
| Net Expenses | 334,665 | |
| Investment Income—Net | 125,048 | |
| Realized and Unrealized Gain (Loss) on Investments—Note 4 ($): | ||
| Net realized gain (loss) on investments and foreign currency transactions | (7,291,420) | |
| Net realized gain (loss) on forward currency exchange contracts | (184,567) | |
| Net Realized Gain (Loss) | (7,475,987) | |
| Net unrealized appreciation (depreciation) on | ||
| investments and foreign currency transactions | (10,004,185) | |
| Net Realized and Unrealized Gain (Loss) on Investments | (17,480,172) | |
| Net (Decrease) in Net Assets Resulting from Operations | (17,355,124) | |
| See notes to financial statements. | ||
12
| STATEMENT OF CHANGES IN NET ASSETS |
| From December 13, 2007 |
| (commencement of operations) to October 31, 2008 |
| Operations ($): | ||
| Investment income—net | 125,048 | |
| Net realized gain (loss) on investments | (7,475,987) | |
| Net unrealized appreciation | ||
| (depreciation) on investments | (10,004,185) | |
| Net Increase (Decrease) in Net Assets | ||
| Resulting from Operations | (17,355,124) | |
| Capital Stock Transactions ($): | ||
| Net proceeds from shares sold: | ||
| Class A Shares | 27,465,111 | |
| Class C Shares | 8,588,528 | |
| Class I Shares | 623,722 | |
| Class T Shares | 326,238 | |
| Cost of shares redeemed: | ||
| Class A Shares | (9,418,720) | |
| Class C Shares | (1,923,676) | |
| Class I Shares | (233,004) | |
| Class T Shares | (193,038) | |
| Increase (Decrease) in Net Assets | ||
| from Capital Stock Transactions | 25,235,161 | |
| Total Increase (Decrease) in Net Assets | 7,880,037 | |
| Net Assets ($): | ||
| Beginning of Period | — | |
| End of Period | 7,880,037 |
The Fund 13
STATEMENT OF CHANGES IN NET ASSETS (continued)
| Capital Share Transactions: | ||
| Class A | ||
| Shares sold | 2,692,915 | |
| Shares redeemed | (1,313,241) | |
| Net Increase (Decrease) in Shares Outstanding | 1,379,674 | |
| Class C | ||
| Shares sold | 808,488 | |
| Shares redeemed | (247,006) | |
| Net Increase (Decrease) in Shares Outstanding | 561,482 | |
| Class I | ||
| Shares sold | 52,693 | |
| Shares redeemed | (27,618) | |
| Net Increase (Decrease) in Shares Outstanding | 25,075 | |
| Class T | ||
| Shares sold | 26,355 | |
| Shares redeemed | (21,755) | |
| Net Increase (Decrease) in Shares Outstanding | 4,600 | |
| See notes to financial statements. | ||
14
FINANCIAL HIGHLIGHTS
The following table describes the performance for each share class for the period from December 13, 2007 (commencement of operations) to October 31, 2008. All information (except portfolio turnover rate) reflects financial results for a single fund share.Total return shows how much your investment in the fund would have increased (or decreased) during the period, assuming you had reinvested all dividends and distributions.These figures have been derived from the fund’s financial statements.
| Class A | Class C | Class I | Class T | |||||
| Shares | Shares | Shares | Shares | |||||
| Per Share Data ($): | ||||||||
| Net asset value, beginning of period | 12.50 | 12.50 | 12.50 | 12.50 | ||||
| Investment Operations: | ||||||||
| Investment income (loss)—neta | .08 | .02 | .02 | (.12) | ||||
| Net realized and unrealized | ||||||||
| gain (loss) on investments | (8.57) | (8.54) | (8.52) | (8.43) | ||||
| Total from Investment Operations | (8.49) | (8.52) | (8.50) | (8.55) | ||||
| Net asset value, end of period | 4.01 | 3.98 | 4.00 | 3.95 | ||||
| Total Return (%)b | (68.00)c | (68.16)c | (68.00) | (68.40)c | ||||
| Ratios/Supplemental Data (%): | ||||||||
| Ratio of total expenses | ||||||||
| to average net assetsd | 3.31 | 4.08 | 2.86 | 3.09 | ||||
| Ratio of net expenses | ||||||||
| to average net assetsd | 2.00 | 2.75 | 1.75 | 2.25 | ||||
| Ratio of net investment income | ||||||||
| (loss) to average net assetsd | 1.03 | .31 | .29 | (1.25) | ||||
| Portfolio Turnover Rateb | 217.53 | 217.53 | 217.53 | 217.53 | ||||
| Net Assets, end of period ($ x 1,000) | 5,528 | 2,233 | 100 | 18 |
| a | Based on average shares outstanding at each month end. | |
| b | Not annualized. | |
| c | Exclusive of sales charge. | |
| d | Annualized. | |
| See notes to financial statements. | ||
The Fund 15
NOTES TO FINANCIAL STATEMENTS
NOTE 1—Significant Accounting Policies:
Dreyfus Emerging Asia Fund (the “fund”) is a separate non-diversified series of Dreyfus Premier Investment Funds, Inc. (the “Company”) which is registered under the Investment Company Act of 1940, as amended (the “Act”), as an open-end management investment company and operates as a series company currently offering nine series, including the fund, which commenced operations on December 13, 2007. The fund’s investment objective is long-term capital appreciation. The Dreyfus Corporation (the “Manager” or “Dreyfus”), a wholly-owned subsidiary of The Bank of New York Mellon Corporation (“BNY Mellon”), serves as the fund’s investment adviser. Hamon U.S. Investment Advisors Limited (“Hamon”) serves as the fund’s sub-investment adviser. Hamon is an affiliate of Dreyfus.
The Board of Directors approved, effective March 31, 2008, a change in the Company name from “Dreyfus Premier International Funds, Inc.” to “Dreyfus Premier Investment Funds, Inc.”
At a meeting of the fund’s Board of Directors held on July 10, 2008, the Board approved, effective December 1, 2008, a proposal to change the name of the fund from “Dreyfus Premier Emerging Asia Fund” to “Dreyfus Emerging Asia Fund.”
Effective July 1, 2008, BNY Mellon has reorganized and consolidated a number of its banking and trust company subsidiaries. As a result of the reorganization, any services previously provided to the fund by Mellon Bank, N.A. or Mellon Trust of New England, N.A. are now provided by The Bank of New York, which has changed its name to The Bank of New York Mellon.
MBSC Securities Corporation (the “Distributor”), a wholly-owned subsidiary of Dreyfus, is the distributor of the fund’s shares.The fund is authorized to issue 200 million shares of $.001 par value Common Stock in each of the following classes of shares: Class A, Class C, Class I and Class T. Class A and Class T shares are subject to a sales charge imposed at the time of purchase. Class C shares are subject to a contin-
16
gent deferred sales charge (“CDSC”) imposed on Class C shares redeemed within one year of purchase. Class I shares are sold at net asset value per share only to institutional investors. Other differences between the classes include the services offered to and the expenses borne by each class, the allocation of certain transfer agency costs and certain voting rights. Income, expenses (other than expenses attributable to a specific class) and realized and unrealized gains or losses on investments are allocated to each class of shares based on its relative net assets.
As of October 31, 2008, MBC Investments Corp., an indirect subsidiary of BNY Mellon, held 3,250 Class T shares.
The Company accounts separately for the assets, liabilities and operations of each series. Expenses directly attributable to each series are charged to that series’ operations; expenses which are applicable to all series are allocated among them on a pro rata basis.
The fund’s financial statements are prepared in accordance with U.S. generally accepted accounting principles, which may require the use of management estimates and assumptions. Actual results could differ from those estimates.
The fund enters into contracts that contain a variety of indemnifications. The fund’s maximum exposure under these arrangements is unknown.The fund does not anticipate recognizing any loss related to these arrangements.
(a) Portfolio valuation: Investments in securities are valued at the last sales price on the securities exchange or national securities market on which such securities are primarily traded. Securities listed on the National Market System for which market quotations are available, are valued at the official closing price or, if there is no official closing price that day, at the last sales price. Securities not listed on an exchange or the national securities market, or securities for which there were no transactions, are valued at the average of the most recent bid and asked prices, except for open short positions, where the asked price is used for valuation purposes. Bid price is used when no asked price is avail-
The Fund 17
| NOTES TO FINANCIAL STATEMENTS (continued) |
able. Registered investment companies that are not traded on an exchange are valued at their net asset value.When market quotations or official closing prices are not readily available, or are determined not to reflect accurately fair value, such as when the value of a security has been significantly affected by events after the close of the exchange or market on which the security is principally traded (for example, a foreign exchange or market), but before the fund calculates its net asset value, the fund may value these investments at fair value as determined in accordance with the procedures approved by the Board of Directors. Fair valuing of securities may be determined with the assistance of a pricing service using calculations based on indices of domestic securities and other appropriate indicators, such as prices of relevant ADRs and futures contracts. For other securities that are fair valued by the Board of Directors, certain factors may be considered such as: fundamental analytical data, the nature and duration of restrictions on disposition, an evaluation of the forces that influence the market in which the securities are purchased and sold, and public trading in similar securities of the issuer or comparable issuers. Financial futures and options are valued at the last sales price. Investments denominated in foreign currencies are translated to U.S. dollars at the prevailing rates of exchange. Forward currency exchange contracts are valued at the forward rate.
The Financial Accounting Standards Board (“FASB”) released Statement of Financial Accounting Standards No. 157 “Fair Value Measurements” (“FAS 157”). FAS 157 establishes an authoritative definition of fair value, sets out a framework for measuring fair value, and requires additional disclosures about fair-value measurements. The application of FAS 157 is required for fiscal years beginning after November 15, 2007 and interim periods within those fiscal years. Management does not believe that the application of this standard will have a material impact on the financial statements of the fund.
(b) Foreign currency transactions: The fund does not isolate that portion of the results of operations resulting from changes in foreign exchange rates on investments from the fluctuations arising from changes
18
in market prices of securities held. Such fluctuations are included with the net realized and unrealized gain or loss on investments.
Net realized foreign exchange gains or losses arise from sales and maturities of short-term securities, sales of foreign currencies, currency gains or losses realized on securities transactions and the difference between the amounts of dividends, interest, and foreign withholding taxes recorded on the fund’s books and the U.S. dollar equivalent of the amounts actually received or paid. Net unrealized foreign exchange gains and losses arise from changes in the value of assets and liabilities other than investments in securities, resulting from changes in exchange rates. Such gains and losses are included with net realized and unrealized gain or loss on investments.
(c) Securities transactions and investment income: Securities transactions are recorded on a trade date basis. Realized gains and losses from securities transactions are recorded on the identified cost basis. Dividend income is recognized on the ex-dividend date and interest income, including, where applicable, accretion of discount and amortization of premium on investments, is recognized on the accrual basis.
The fund has arrangements with the custodian and cash management banks whereby the fund may receive earnings credits when positive cash balances are maintained, which are used to offset custody and cash management fees. For financial reporting purposes, the fund includes net earnings credits as an expense offset in the Statement of Operations.
The fund follows an investment policy of investing primarily in emerging markets of Asia. Economic changes in the continent of Asia or other aspects that effect valuation of securities may have a greater effect on the fund’s net asset value than other funds that do not have similar investment objectives.
Investing in foreign markets may involve special risks and considerations not typically associated with investing in the U.S. These risks include revaluation of currencies, high rates of inflation, repatriation restrictions on income and capital, and adverse political and economic
The Fund 19
| NOTES TO FINANCIAL STATEMENTS (continued) |
developments. Moreover, securities issued in these markets may be less liquid, subject to government ownership controls and delayed settlements, and their prices may be more volatile than those of comparable securities in the U.S.
(d) Dividends to shareholders: Dividends are recorded on the ex-dividend date. Dividends from investment income-net and dividends from net realized capital gains, if any, are normally declared and paid annually, but the fund may make distributions on a more frequent basis to comply with the distribution requirements of the Internal Revenue Code of 1986, as amended (the “Code”).To the extent that net realized capital gains can be offset by capital loss carryovers, it is the policy of the fund not to distribute such gains. Income and capital gain distributions are determined in accordance with income tax regulations, which may differ from U.S. generally accepted accounting principles.
(e) Federal income taxes: It is the policy of the fund to continue to qualify as a regulated investment company, if such qualification is in the best interests of its shareholders, by complying with the applicable provisions of the Code, and to make distributions of taxable income sufficient to relieve it from substantially all federal income and excise taxes.
The fund adopted FASB Interpretation No. 48 “Accounting for Uncertainty in Income Taxes” (“FIN 48”). FIN 48 provides guidance for how uncertain tax positions should be recognized, measured, presented and disclosed in the financial statements. FIN 48 requires the evaluation of tax positions taken or expected to be taken in the course of preparing the fund’s tax returns to determine whether the tax positions are “more-likely-than-not” of being sustained by the applicable tax authority. Liability for tax positions not deemed to meet the more-likely-than-not threshold would be recorded as a tax expense in the current year.The adoption of FIN 48 had no impact on the operations of the fund for the period ended October 31, 2008.
As of and during the period ended October 31, 2008, the fund did not have any liabilities for any unrecognized tax positions.The fund recognizes interest and penalties, if any, related to unrecognized tax positions
20
as income tax expense in the Statement of Operations. During the period, the fund did not incur any interest or penalties.
The tax year for the period ended October 31, 2008 remains subject to examination by the Internal Revenue Service and state taxing authorities.
At October 31, 2008, the components of accumulated earnings on a tax basis were as follows: accumulated capital losses $6,828,118 and unrealized depreciation $10,419,743.
The accumulated capital loss carryover is available for federal income tax purposes to be applied against future net securities profits, if any, realized subsequent to October 31, 2008. If not applied, the carryover expires in fiscal 2016.
During the period ended October 31, 2008, as a result of permanent book to tax differences, primarily due to the tax treatment for foreign currency gains and losses, the fund decreased accumulated undistributed investment income-net by $125,048, increased accumulated net realized gain (loss) on investments by $232,311 and decreased paid-in capital by $107,263. Net assets and net asset value per share were not affected by this reclassification.
NOTE 2—Bank Lines of Credit:
The fund may borrow up to $2 million for leveraging purposes under a short-term unsecured line of credit. Prior to May 1, 2008, the fund participated with other Dreyfus-managed funds in a $100 million unsecured line of credit. Effective May 1, 2008, the fund participates with other Dreyfus-managed funds in a $300 million unsecured line of credit primarily to be utilized for temporary or emergency purposes, including the financing of redemptions.The terms of the line of credit agreement limit the amount of individual fund borrowings. Interest is charged to the fund based on prevailing market rates in effect at the time of borrowing. Effective October 15, 2008, in connection therewith, the fund has agreed to pay commitment fees on its pro rata portion of the unsecured line of credit.
The Fund 21
| NOTES TO FINANCIAL STATEMENTS (continued) |
The average daily amount of borrowings outstanding under the lines of credit during the period ended October 31, 2008, was approximately $303,000, with a related weighted average annualized interest rate of 2.32% .
NOTE 3—Management Fee, Sub-Investment Advisory Fee and Other Transactions With Affiliates:
(a) Pursuant to a Managment Agreement (“Agreement”) with Dreyfus, the management fee is computed at the annual rate of 1.25% of the value of the fund’s average daily net assets and is payable monthly.
Dreyfus has contractually agreed to waive receipt of its fees and/or assume the expenses of the fund, until March 1, 2010, so that the direct expenses of none of the classes (excluding Rule 12b-1 fees, shareholder services fees, taxes, interest, brokerage commissions and extraordinary expenses) exceed 1.75% of the value of the fund’s average daily net assets. The expense reimbursement, pursuant to the undertaking, amounted to $195,597 during the period ended October 31, 2008.
Pursuant to a Sub-Investment Advisory Agreement between Dreyfus and Hamon, Dreyfus pays Hamon a fee payable monthly at the annual rate of .625% of the value of the fund’s average daily net assets.
During the period ended October 31, 2008, the Distributor retained $13,233 from commissions earned on sales of the fund’s Class A shares and $7,047 from CDSCs on redemptions of the fund’s Class C shares.
(b) Under the Distribution Plan (the “Plan”) adopted pursuant to Rule 12b-1 under the Act, Class C and Class T shares pay the Distributor for distributing their shares at an annual rate of .75% of the value of the average daily net assets of Class C shares and .25% of the value of the average daily net assets of Class T shares. During the period ended October 31, 2008, Class C and Class T shares were charged $29,669 and $246, respectively, pursuant to the Plan.
(c) Under the Shareholder Services Plan, Class A, Class C and Class T shares pay the Distributor at an annual rate of ..25% of the value of
22
their average daily net assets for the provision of certain services.The services provided may include personal services relating to shareholder accounts, such as answering shareholder inquiries regarding the fund and providing reports and other information, and services related to the maintenance of shareholder accounts. The Distributor may make payments to Service Agents (a securities dealer, financial institution or other industry professional) in respect of these services. The Distributor determines the amounts to be paid to Service Agents. During the period ended October 31, 2008, Class A, Class C and Class T shares were charged $27,411, $9,890 and $246, respectively, pursuant to the Shareholder Services Plan.
The fund compensates Dreyfus Transfer, Inc., a wholly-owned subsidiary of Dreyfus, under a transfer agency agreement for providing personnel and facilities to perform transfer agency services for the fund. During the period ended October 31, 2008, the fund was charged $1,650 pursuant to the transfer agency agreement.
The fund compensates The Bank of NewYork Mellon, a subsidiary of BNY Mellon and an affiliate of Dreyfus, under a cash management agreement for performing cash management services related to fund subscriptions and redemptions. During the period ended October 31, 2008, the fund was charged $1,006 pursuant to the cash management agreement.
The fund compensates The Bank of New York Mellon under a custody agreement for providing custodial services for the fund. During the period ended October 31, 2008, the fund was charged $76,222 pursuant to the custody agreement.
During the period ended October 31, 2008, the fund was charged $5,491 for services performed by the Chief Compliance Officer.
The components of “Due to The Dreyfus Corporation and affiliates” in the Statement of Assets and Liabilities consist of: management fees $10,963, Rule 12b-1 distribution plan fees $1,755, shareholder ser-
The Fund 23
| NOTES TO FINANCIAL STATEMENTS (continued) |
vices plan fees $2,169, custodian fees $22,268, chief compliance officer fees $1,973 and transfer agency per account fees $1,805, which are offset against an expense reimbursement currently in effect in the amount of $16,040.
(d) Each Board member also serves as a Board member of other funds within the Dreyfus complex. Annual retainer fees and attendance fees are allocated to each fund based on net assets.
NOTE 4—Securities Transactions:
The aggregate amount of purchases and sales of investment securities, excluding short-term securities and forward currency exchange contracts, during the period ended October 31, 2008, amounted to $52,582,208 and $35,138,810, respectively.
The fund enters into forward currency exchange contracts in order to hedge its exposure to changes in foreign currency exchange rates on its foreign portfolio holdings and to settle foreign currency transac-tions.When executing forward currency exchange contracts, the fund is obligated to buy or sell a foreign currency at a specified rate on a certain date in the future. With respect to sales of forward currency exchange contracts, the fund would incur a loss if the value of the contract increases between the date the forward contract is opened and the date the forward contract is closed.The fund realizes a gain if the value of the contract decreases between those dates. With respect to purchases of forward currency exchange contracts, the fund would incur a loss if the value of the contract decreases between the date the forward contract is opened and the date the forward contract is closed. The fund realizes a gain if the value of the contract increases between those dates. The fund is also exposed to credit risk associated with counterparty nonperformance on these forward currency exchange contracts which is typically limited to the unrealized gain on each open contract.At October 31, 2008, there were no open forward currency exchange contracts outstanding.
At October 31, 2008, the cost of investments for federal income tax purposes was $17,858,956; accordingly, accumulated net unrealized depre-
24
ciation on investments was $10,420,134, consisting of $62,664 gross unrealized appreciation and $10,482,798 gross unrealized depreciation.
In March 2008, the FASB released Statement of Financial Accounting Standards No. 161 “Disclosures about Derivative Instruments and Hedging Activities” (“FAS 161”). FAS 161 requires qualitative disclosures about objectives and strategies for using derivatives, quantitative disclosures about fair value amounts of gains and losses on derivative instruments and disclosures about credit-risk-related contingent features in derivative agreements.The application of FAS 161 is required for fiscal years and interim periods beginning after November 15, 2008. At this time, management is evaluating the implications of FAS 161 and its impact on the financial statements and the accompanying notes has not yet been determined.
NOTE 5—Subsequent Event:
Effective on or about February 4, 2009 (the “Effective Date”), the fund will issue to each holder of its Class T shares, in exchange for said shares, Class A shares of the fund having an aggregate net asset value equal to the aggregate net asset value of the shareholder’s Class T shares.Thereafter, the fund will no longer offer Class T shares.
Effective on or about December 3, 2008, no investments for new accounts were permitted in Class T of the fund, except that participants in certain group retirement plans were able to open a new account in Class T of the fund, provided that the fund was established as an investment option under the plans before December 3, 2008. After the Effective Date, subsequent investments in the fund’s Class A shares made by holders of the fund’s Class T shares who received Class A shares of the fund in exchange for their Class T shares will be subject to the front-end sales load schedule currently in effect for Class T shares. Otherwise, all other Class A share attributes will be in effect.
The Fund 25
REPORT OF INDEPENDENT REGISTERED PUBLIC ACCOUNTING FIRM
| Shareholders and Board of Directors |
| Dreyfus Emerging Asia Fund |
We have audited the accompanying statement of assets and liabilities, including the statement of investments, of Dreyfus Emerging Asia Fund (one of the series comprising Dreyfus Premier Investment Funds, Inc.) as of October 31, 2008, and the related statements of operations and changes in net assets and financial highlights for the period from December 13, 2007 (commencement of operations) to October 31, 2008.These financial statements and financial highlights are the responsibility of the Fund’s management. Our responsibility is to express an opinion on these financial statements and financial highlights based on our audit.
We conducted our audit in accordance with the standards of the Public Company Accounting Oversight Board (United States).Those standards require that we plan and perform the audit to obtain reasonable assurance about whether the financial statements and financial highlights are free of material misstatement.We were not engaged to perform an audit of the Fund’s internal control over financial reporting. Our audit included consideration of internal control over financial reporting as a basis for designing audit procedures that are appropriate in the circumstances, but not for the purpose of expressing an opinion on the effectiveness of the Fund’s internal control over financial reporting. Accordingly, we express no such opinion.An audit also includes examining, on a test basis, evidence supporting the amounts and disclosures in the financial statements and financial highlights, assessing the accounting principles used and significant estimates made by management, and evaluating the overall financial statement presentation. Our procedures included confirmation of securities owned as of October 31, 2008 by correspondence with the custodian and others.We believe that our audit provides a reasonable basis for our opinion.
In our opinion, the financial statements and financial highlights referred to above present fairly, in all material respects, the financial position of Dreyfus Emerging Asia Fund at October 31, 2008, and the results of its operations, the changes in its net assets and the financial highlights for the period from December 13, 2007 to October 31, 2008, in conformity with U. S. generally accepted accounting principles.

| New York, New York |
| December 23, 2008 |
26
BOARD MEMBERS INFORMATION ( U n a u d i t e d )
| Joseph S. DiMartino (65) Chairman of the Board (1995) |
Principal Occupation During Past 5Years:
- Corporate Director and Trustee
Other Board Memberships and Affiliations:
- The Muscular Dystrophy Association, Director
- Century Business Services, Inc., a provider of outsourcing functions for small and medium size companies, Director
- The Newark Group, a provider of a national market of paper recovery facilities, paperboard mills and paperboard converting plants, Director
- Sunair Services Corporation, a provider of certain outdoor-related services to homes and businesses, Director
No. of Portfolios for which Board Member Serves: 167
| ——————— |
| Gordon J. Davis (67) Board Member (1993) Principal Occupation During Past 5Years: |
- Partner in the law firm of Dewey & LeBoeuf LLP
- President, Lincoln Center for the Performing Arts, Inc. (2001)
| Other Board Memberships and Affiliations: |
- Consolidated Edison, Inc., a utility company, Director
- Phoenix Companies Inc., a life insurance company, Director
- Board Member/Trustee for several not-for-profit groups
| No. of Portfolios for which Board Member Serves: 41 |
| ——————— |
| David P. Feldman (68) Board Member (1991) |
Principal Occupation During Past 5Years:
- Corporate Director and Trustee
Other Board Memberships and Affiliations:
- BBH Mutual Funds Group (11 funds), Director
- The Jeffrey Company, a private investment company, Director
No. of Portfolios for which Board Member Serves: 50x
The Fund 27
BOARD MEMBERS INFORMATION (Unaudited) (continued)
| Lynn Martin (68) Board Member (1993) |
Principal Occupation During Past 5Years:
- Advisor to the international accounting firm of Deloitte & Touche, LLP and
Chair to its Council for the Advancement of Women from March 1993-September 2005
Other Board Memberships and Affiliations:
- AT&T Inc., a telecommunications company, Director
- Ryder System, Inc., a supply chain and transportation management company, Director
- The Proctor & Gamble Co., a consumer products company, Director
- Constellation Energy Group, Director
- Chicago Council on Global Affairs
- Coca-Cola International Advisory Council
- Deutsche Bank Advisory Council
| No. of Portfolios for which Board Member Serves: 14 |
| ——————— |
| Daniel Rose (79) Board Member (1992) Principal Occupation During Past 5Years: |
- Chairman and Chief Executive Officer of Rose Associates, Inc., a New York based real estate development and management firm
| Other Board Memberships and Affiliations: |
- Baltic-American Enterprise Fund,Vice Chairman and Director
- Harlem Educational Activities Fund, Inc., Chairman
- Housing Committee of the Real Estate Board of New York, Inc., Director
| No. of Portfolios for which Board Member Serves: 36 |
| ——————— |
| Philip L. Toia (75) Board Member (1997) |
Principal Occupation During Past 5Years:
- Private Investor
No. of Portfolios for which Board Member Serves: 25
28
| Anne Wexler (78) Board Member (1994) Principal Occupation During Past 5Years: |
- Chairman of the Wexler & Walker Public Policy Associates, consultants specializing in govern- ment relations and public affairs from January 1981 to present
| Other Board Memberships and Affiliations: |
- The Community Foundation for the National Capital Region, Director
- Member of the Council of Foreign Relations
- WETA-DC’s Public TV and Radio Station,Vice Chairman
| No. of Portfolios for which Board Member Serves: 50 |
| ——————— |
Once elected all Board Members serve for an indefinite term, but achieve Emeritus status upon reaching age 80.The address of the Board Members and Officers is in c/o The Dreyfus Corporation, 200 Park Avenue, NewYork, NewYork 10166. Additional information about the Board Members is available in the fund’s Statement of Additional Information which can be obtained from Dreyfus free of charge by calling this toll free number: 1-800-554-4611.
The Fund 29
OFFICERS OF THE FUND ( U n a u d i t e d )
J. DAVID OFFICER, President since December 2006.
Chief Operating Officer,Vice Chairman and a Director of the Manager, and an officer of 77 investment companies (comprised of 167 portfolios) managed by the Manager. He is 60 years old and has been an employee of the Manager since April 1998.
PHILLIP N. MAISANO, Executive Vice President since July 2007.
Chief Investment Officer,Vice Chair and a director of the Manager, and an officer of 77 investment companies (comprised of 167 portfolios) managed by the Manager. Mr. Maisano also is an officer and/or Board member of certain other investment management subsidiaries of The Bank of New York Mellon Corporation, each of which is an affiliate of the Manager. He is 61 years old and has been an employee of the Manager since November 2006. Prior to joining the Manager, Mr. Maisano served as Chairman and Chief Executive Officer of EACM Advisors, an affiliate of the Manager, since August 2004, and served as Chief Executive Officer of Evaluation Associates, a leading institutional investment consulting firm, from 1988 until 2004.
MICHAEL A. ROSENBERG, Vice President and Secretary since August 2005.
Assistant General Counsel of BNY Mellon, and an officer of 78 investment companies (comprised of 188 portfolios) managed by the Manager. He is 48 years old and has been an employee of the Manager since October 1991.
JAMES BITETTO, Vice President and Assistant Secretary since August 2005.
Senior Counsel of BNY Mellon and Secretary of the Manager, and an officer of 78 investment companies (comprised of 188 portfolios) managed by the Manager. He is 42 years old and has been an employee of the Manager since December 1996.
JONI LACKS CHARATAN, Vice President and Assistant Secretary since August 2005.
Senior Counsel of BNY Mellon, and an officer of 78 investment companies (comprised of 188 portfolios) managed by the Manager. She is 53 years old and has been an employee of the Manager since October 1988.
JOSEPH M. CHIOFFI, Vice President and Assistant Secretary since August 2005.
Senior Counsel of BNY Mellon, and an officer of 78 investment companies (comprised of 188 portfolios) managed by the Manager. He is 47 years old and has been an employee of the Manager since June 2000.
JANETTE E. FARRAGHER, Vice President and Assistant Secretary since August 2005.
Assistant General Counsel of BNY Mellon, and an officer of 78 investment companies (comprised of 188 portfolios) managed by the Manager. She is 45 years old and has been an employee of the Manager since February 1984.
JOHN B. HAMMALIAN, Vice President and Assistant Secretary since August 2005.
Managing Counsel of BNY Mellon, and an officer of 78 investment companies (comprised of 188 portfolios) managed by the Manager. He is 45 years old and has been an employee of the Manager since February 1991.
ROBERT R. MULLERY, Vice President and Assistant Secretary since August 2005.
Managing Counsel of BNY Mellon, and an officer of 78 investment companies (comprised of 188 portfolios) managed by the Manager. He is 56 years old and has been an employee of the Manager since May 1986.
30
JEFF PRUSNOFSKY, Vice President and Assistant Secretary since August 2005.
Managing Counsel of BNY Mellon, and an officer of 78 investment companies (comprised of 188 portfolios) managed by the Manager. He is 43 years old and has been an employee of the Manager since October 1990.
JAMES WINDELS, Treasurer since November 2001.
Director – Mutual Fund Accounting of the Manager, and an officer of 78 investment companies (comprised of 188 portfolios) managed by the Manager. He is 49 years old and has been an employee of the Manager since April 1985.
RICHARD CASSARO, Assistant Treasurer since September 2007.
Senior Accounting Manager – Money Market and Municipal Bond Funds of the Manager, and an officer of 78 investment companies (comprised of 188 portfolios) managed by the Manager. He is 49 years old and has been an employee of the Manager since September 1982.
GAVIN C. REILLY, Assistant Treasurer since December 2005.
Tax Manager of the Investment Accounting and Support Department of the Manager, and an officer of 78 investment companies (comprised of 188 portfolios) managed by the Manager. He is 40 years old and has been an employee of the Manager since April 1991.
ROBERT ROBOL, Assistant Treasurer since August 2005.
Senior Accounting Manager – Fixed Income Funds of the Manager, and an officer of 78 investment companies (comprised of 188 portfolios) managed by the Manager. He is 44 years old and has been an employee of the Manager since October 1988.
ROBERT SALVIOLO, Assistant Treasurer since May 2007.
Senior Accounting Manager – Equity Funds of the Manager, and an officer of 78 investment companies (comprised of 188 portfolios) managed by the Manager. He is 41 years old and has been an employee of the Manager since June 1989.
ROBERT SVAGNA, Assistant Treasurer since August 2002.
Senior Accounting Manager – Equity Funds of the Manager, and an officer of 78 investment companies (comprised of 188 portfolios) managed by the Manager. He is 41 years old and has been an employee of the Manager since November 1990.
JOSEPH W. CONNOLLY, Chief Compliance Officer since October 2004.
Chief Compliance Officer of the Manager and The Dreyfus Family of Funds (78 investment companies, comprised of 188 portfolios). From November 2001 through March 2004, Mr. Connolly was first Vice-President, Mutual Fund Servicing for Mellon Global Securities Services. In that capacity, Mr. Connolly was responsible for managing Mellon’s Custody, Fund Accounting and Fund Administration services to third-party mutual fund clients. He is 51 years old and has served in various capacities with the Manager since 1980, including manager of the firm’s Fund Accounting Department from 1997 through October 2001.
WILLIAM GERMENIS, Anti-Money Laundering Compliance Officer since October 2002.
Vice President and Anti-Money Laundering Compliance Officer of the Distributor, and the Anti-Money Laundering Compliance Officer of 74 investment companies (comprised of 184 portfolios) managed by the Manager. He is 38 years old and has been an employee of the Distributor since October 1998.
The Fund 31
NOTES
Save time. Save paper. View your next shareholder report online as soon as it’s available. Log into www.dreyfus.com and sign up for Dreyfus eCommunications. It’s simple and only takes a few minutes.
The views expressed in this report reflect those of the portfolio manager only through the end of the period covered and do not necessarily represent the views of Dreyfus or any other person in the Dreyfus organization. Any such views are subject to change at any time based upon market or other conditions and Dreyfus disclaims any responsibility to update such views.These views may not be relied on as investment advice and, because investment decisions for a Dreyfus fund are based on numerous factors, may not be relied on as an indication of trading intent on behalf of any Dreyfus fund.
Not FDIC-Insured Not Bank-Guaranteed May Lose Value
| Contents | ||
| THE FUND | ||
| 2 | A Letter from the CEO | |
| 3 | Discussion of Fund Performance | |
| 6 | Fund Performance | |
| 8 | Understanding Your Fund’s Expenses | |
| 8 | Comparing Your Fund’s Expenses | |
| With Those of Other Funds | ||
| 9 | Statement of Investments | |
| 11 | Statement of Assets and Liabilities | |
| 12 | Statement of Operations | |
| 13 | Statement of Changes in Net Assets | |
| 16 | Financial Highlights | |
| 21 | Notes to Financial Statements | |
| 31 | Report of Independent Registered | |
| Public Accounting Firm | ||
| 32 | Important Tax Information | |
| 33 | Information About the Review and Approval | |
| of the Fund’s Management Agreement | ||
| 37 | Board Members Information | |
| 40 | Officers of the Fund | |
| FOR MORE INFORMATION | ||
| Back Cover | ||
| Dreyfus |
| Greater China Fund |
| The Fund |

A LETTER FROM THE CEO
Dear Shareholder:
We present to you this annual report for Dreyfus Greater China Fund, covering the 12-month period from November 1, 2007, through October 31, 2008.
These are difficult times for international investors.A credit crunch that began in the United States in 2007 has developed into a full-blown global financial crisis, recently resulting in the failure of several major financial institutions. Meanwhile, the global economic slowdown has gathered momentum, depressing investor sentiment, consumer confidence and business investment around the world. These factors undermined equity returns in most regions, including formerly high-flying emerging markets.
The depth and duration of the economic downturn will depend on how quickly the global financial system can be stabilized. We believe that government efforts in the United States and Europe meet several critical requirements for addressing today’s financial stresses, and we expect them to contribute to a more orderly deleveraging process. However, recuperation from the financial crisis is likely to take time. In the meantime, we encourage you to keep in touch with your financial advisor and maintain a long-term and disciplined perspective to investing. Indeed, we already are seeing some positive signs, including a likely peak in global inflationary pressures, attractive valuations among fundamentally sound companies and a large pool of worldwide financial liquidity that could be deployed gradually as the economic cycle turns.
For information about how the fund performed during the reporting period, as well as market perspectives, we have provided a Discussion of Fund Performance given by the fund’s Portfolio Managers.
Thank you for your continued confidence and support.
2

DISCUSSION OF FUND PERFORMANCE
For the period of November 1, 2007, through October 31, 2008, as provided by Hugh Simon and Nina Wu, Portfolio Managers
Fund and Market Performance Overview
For the 12-month period ended October 31, 2008, Dreyfus Greater China Fund’s Class A shares produced a total return of –72.40%, Class B shares produced a total return of –72.60%,Class C shares produced a total return of –72.60%, Class I shares produced a total return of –72.31% and Class T shares produced a total return of –72.49% .1 In comparison, the fund’s benchmark, the Hang Seng Index, produced a total return of –54.03% for the same period.2
Although China’s banks remained strong and its economy continued to grow, the China/Hong Kong stock markets were not immune from the global banking crisis or economic downturns in other parts of the world. The Chinese government attempted to bolster investor confidence by easing short-term interest rates and reducing lending restrictions, but it could not stem the surge of selling pressure among newly risk-averse investors. The fund underperformed its benchmark, largely due to its positions in China’s B-shares, which were more vulnerable to capital flight from foreigners than A-shares that are restricted to domestic investors. Furthermore, liquidity fled out of mid-small cap stocks and, as a result, hurt the fund’s performance.
The Fund’s Investment Approach
The fund, which seeks long-term capital appreciation, normally invests at least 80% of its assets in stocks of companies that (i) are principally traded in China, Hong Kong or Taiwan (Greater China), (ii) derive at least 50% of their revenues from Greater China, or (iii) have at least 50% of their assets in Greater China.To determine where the fund will invest, we analyze several factors, including economic and political trends in Greater China, the current financial condition and future prospects of individual companies and sectors in the region, and the valuation of one market or company relative to that of another.
The Fund 3
| DISCUSSION OF FUND PERFORMANCE (continued) |
China Caught in a Global Financial Tsunami
China has limited exposure to U.S. and European banks or the problems caused by the financial crisis. In addition, China’s economy has continued to grow, albeit not as strongly as before. Nevertheless, China’s stock market sold off sharply over the reporting period, with especially steep losses during the global financial meltdown of September and October 2008.
Selling pressure in sectors such as cyclical industry and finance was intense. The Chinese branch of the largest publicly traded cement company in Taiwan saw its shares decline more than 90% from its peak as midcap stocks were sold off across the board. Another holding that focuses on hotels, holiday resorts and online travel agency business saw its shares decline sharply as its clients’ wealth deteriorated along with stock prices. One of the few bright spots was the country’s leading supermarket chain, which continued to benefit from steady revenues and enhanced cost controls.
The market’s swoon comes in the wake of the prior year’s surge, as the Shanghai B Share Index more than tripled during the 12-month period ended in October 2007. Part of this surge was driven by international liquidity, which are lightly regulated pools of investment capital that typically use debt to leverage their investment positions. As the downturn intensified, these investors were forced to sell even their fundamentally sound positions to meet margin calls and redemption requests.
In our judgment, the Chinese economy is likely to grow at rates of 9.5% and 8% for calendar years 2008 and 2009. However, many investors believe that economic weakness in theWest will cause China’s economy to slow more substantially. While export growth is likely to be constrained, net exports account for only about 16% of China’s nominal GDP growth. Domestic consumption has remained robust, with growth of approximately 10% expected in 2009.Yet, shares of companies that benefit from domestic infrastructure spending performed poorly. With the “twin surplus,” the Chinese government is deploying a series of stimulus programs to prevent a more severe economic slowdown, including boosting infrastructure projects. Indeed, state spending on infrastructure rose by 38% through August compared to the same period last year.The government has also cut interest rates, reduced taxes and begun subsidizing lower income families.
4
Stock Market Sell-Off Creates Opportunity
In our view, recent market turmoil has created opportunities to purchase high-quality growth companies in China at reasonable valuations. Even assuming lower earnings for the second half of calendar 2008 and early 2009, Chinese stocks are trading at about eight times earnings for 2008, compared to 13 for the U.S. market. During the reporting period, we have consolidated the portfolio and intensified our focus on the balance sheets and cash flow of individual companies to ensure that they can weather the storm. Moreover, we have increased the fund’s holdings of larger companies that appear to be oversold and attractively valued.We believe that commodity producers are sensitive to falling prices; however, we will consider accumulating selective names if the valuations have reached an attractive level.We also believe the market concern over the Chinese financial services and property stock has been overdone and the effect of lightening liquidity should be limited. Taking into account undemanding valuation, we will look into investing in some quality financial names.
In this environment, we intend to maintain the fund’s focus on the healthy domestic growth of China, emphasizing companies in the infrastructure, consumption, technology, energy and alternative energy industry groups.
November 17, 2008
| Emerging markets, such as those of China and Taiwan, tend to be more volatile than the | ||
| markets of more mature economies, and generally have less diverse and less mature | ||
| economic structures and less stable political systems than those of developed countries. The | ||
| securities of companies located in emerging markets are often subject to rapid and large | ||
| changes in price. An investment in this fund should be considered only as a supplement to | ||
| a complete investment program. | ||
| 1 | Total return includes reinvestment of dividends and any capital gains paid, and does not take into | |
| consideration the maximum initial sales charges in the case of Class A and Class T shares, or the | ||
| applicable contingent deferred sales charges imposed on redemptions in the case of Class B and | ||
| Class C shares. Had these charges been reflected, returns would have been lower. Past performance | ||
| is no guarantee of future results. Share price and investment return fluctuate such that upon | ||
| redemption, fund shares may be worth more or less than their original cost. | ||
| A significant portion of the fund’s longer-term performance is attributable to positive returns | ||
| from its initial public offering (IPO) investments. There can be no guarantee that IPOs | ||
| will have or continue to have a positive effect on the fund’s performance. | ||
| 2 | SOURCE: BLOOMBERG L.P. – Reflects reinvestment of dividends and, where applicable, | |
| capital gain distributions.The Hang Seng Index is a free-float capitalization-weighted index of | ||
| 36 companies that represents approximately 66% of the total market cap of the Stock Exchange | ||
| of Hong Kong. Index components are capped at 25% and divided into four sub-indexes. Return | ||
| quoted is in U.S. dollars. |
The Fund 5
FUND PERFORMANCE
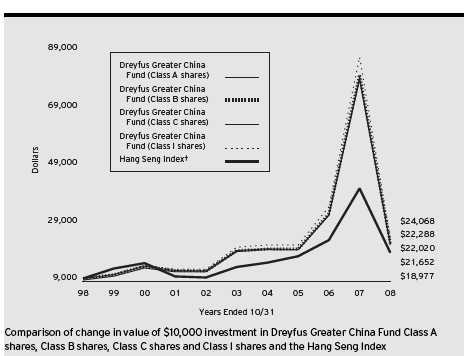
† Source: Bloomberg L.P.
Past performance is not predictive of future performance.
A significant portion of the fund’s longer-term performance is attributable to positive returns from initial public offering (IPO) investments.There can be no guarantee that IPOs will have or continue to have a positive effect on the fund’s performance. IPOs tend to have a reduced effect on performance as a fund’s asset base grows.
The above graph compares a $10,000 investment made in each of the Class A, Class B, Class C and Class I shares of Dreyfus Greater China Fund on 10/31/98 to a $10,000 investment made in the Hang Seng Index (the “Index”) on that date.All dividends and capital gain distributions are reinvested. Performance for Class T shares will vary from the performance of Class A, Class B, Class C and Class I shares shown above due to differences in charges and expenses. The fund’s performance shown in the line graph takes into account the maximum initial sales charge on Class A shares and all other applicable fees and expenses on all classes.The Index is a capitalization-weighted index of approximately 33 companies that represent 70 percent of the total market capitalization of the Stock Exchange of Hong Kong.The components of the Index are divided into four subindices: Commerce, Finance, Utilities and Properties.The Index reflects reinvestment of net dividends and where applicable, capital gain distributions. Unlike a mutual fund, the Index is not subject to charges, fees and other expenses. Investors cannot invest directly in any index. Further information relating to fund performance, including expense reimbursements, if applicable, is contained in the Financial Highlights section of the prospectus and elsewhere in this report.
6
| Average Annual Total Returns as of 10/31/08 | ||||||||
| Inception | ||||||||
| Date | 1 Year | 5 Years | 10 Years | |||||
| Class A shares | ||||||||
| with maximum sales charge (5.75%) | (73.98)% | 1.46% | 8.21% | |||||
| without sales charge | (72.40)% | 2.67% | 8.86% | |||||
| Class B shares | ||||||||
| with applicable redemption charge † | (73.52)% | 1.56% | 8.35% | |||||
| without redemption | (72.60)% | 1.86% | 8.35% | |||||
| Class C shares | ||||||||
| with applicable redemption charge †† | (72.83)% | 1.89% | 8.03% | |||||
| without redemption | (72.60)% | 1.89% | 8.03% | |||||
| Class I shares | (72.31)% | 2.95% | 9.18% | |||||
| Class T shares | ||||||||
| with applicable sales charge (4.5%) | 3/1/00 | (73.73)% | 1.41% | 8.07%††† | ||||
| without sales charge | 3/1/00 | (72.49)% | 2.35% | 8.57%††† | ||||
| Past performance is not predictive of future performance.The fund’s performance shown in the graph and table does not | ||
| reflect the deduction of taxes that a shareholder would pay on fund distributions or the redemption of fund shares. | ||
| Performance for Class B shares assumes the conversion of Class B shares to Class A shares at the end of the sixth year | ||
| following the date of purchase. | ||
| † | The maximum contingent deferred sales charge for Class B shares is 4%.After six years Class B shares convert to | |
| Class A shares. | ||
| †† | The maximum contingent deferred sales charge for Class C shares is 1% for shares redeemed within one year of the | |
| date of purchase. | ||
| ††† | The total return performance figures presented for Class T shares of the fund reflect the performance of the fund’s | |
| Class A shares for periods prior to 3/1/00 (the inception date for Class T shares), adjusted to reflect the applicable | ||
| sales load for that class and the applicable distribution/servicing fees thereafter. | ||
The Fund 7
UNDERSTANDING YOUR FUND’S EXPENSES (Unaudited)
As a mutual fund investor, you pay ongoing expenses, such as management fees and other expenses. Using the information below, you can estimate how these expenses affect your investment and compare them with the expenses of other funds.You also may pay one-time transaction expenses, including sales charges (loads) and redemption fees, which are not shown in this section and would have resulted in higher total expenses. For more information, see your fund’s prospectus or talk to your financial adviser.
Review your fund’s expenses
The table below shows the expenses you would have paid on a $1,000 investment in Dreyfus Greater China Fund from May 1, 2008 to October 31, 2008. It also shows how much a $1,000 investment would be worth at the close of the period, assuming actual returns and expenses.
| Expenses and Value of a $1,000 Investment | ||||||||||
| assuming actual returns for the six months ended October 31, 2008 | ||||||||||
| Class A | Class B | Class C | Class I | Class T | ||||||
| Expenses paid per $1,000† | $ 6.94 | $ 8.93 | $ 9.63 | $ 6.17 | $ 8.02 | |||||
| Ending value (after expenses) | $394.00 | $392.80 | $392.40 | $394.50 | $393.20 | |||||
| COMPARING YOUR FUND’S EXPENSES |
| WITH THOSE OF OTHER FUNDS (Unaudited) |
Using the SEC’s method to compare expenses
The Securities and Exchange Commission (SEC) has established guidelines to help investors assess fund expenses. Per these guidelines, the table below shows your fund’s expenses based on a $1,000 investment, assuming a hypothetical 5% annualized return. You can use this information to compare the ongoing expenses (but not transaction expenses or total cost) of investing in the fund with those of other funds.All mutual fund shareholder reports will provide this information to help you make this comparison. Please note that you cannot use this information to estimate your actual ending account balance and expenses paid during the period.
| Expenses and Value of a $1,000 Investment | ||||||||||
| assuming a hypothetical 5% annualized return for the six months ended October 31, 2008 | ||||||||||
| Class A | Class B | Class C | Class I | Class T | ||||||
| Expenses paid per $1,000† | $ 10.03 | $ 12.90 | $ 13.90 | $ 8.92 | $ 11.59 | |||||
| Ending value (after expenses) | $1,015.18 | $1,012.32 | $1,011.31 | $1,016.29 | $1,013.62 | |||||
† Expenses are equal to the fund’s annualized expense ratio of 1.98% for Class A, 2.55% for Class B, 2.75% for Class C, 1.76% for Class I and 2.29% for Class T, multiplied by the average account value over the period, multiplied by 184/366 (to reflect the one-half year period).
8
| STATEMENT OF INVESTMENTS |
| October 31, 2008 |
| Common Stocks—96.5% | Shares | Value ($) | ||
| China—57.7% | ||||
| AviChina Industry & Technology, Cl. H | 110,090,000 | 7,614,883 | ||
| Beijing Capital Land, Cl. H | 63,340,000 | 5,799,545 | ||
| Bengang Steel Plates, Cl. B | 44,875,855 | 11,720,412 | ||
| CGS Holding, Cl. B | 6,023,795 | 2,564,593 | ||
| China Automation Group | 32,598,000 | 4,886,299 | ||
| China Citic Bank, Cl. H | 25,092,000 | 7,597,620 | ||
| China Coal Energy, Cl. H | 15,257,000 | 8,986,902 | ||
| China Communication Services, Cl. H | 20,649,000 | 10,734,607 | ||
| China Merchants Property Development | 7,779,041 | 5,947,294 | ||
| China Petroleum & Chemical, Cl. H | 3,574,000 | 2,360,988 | ||
| China Telecom, Cl. H | 20,032,000 | 7,063,978 | ||
| ChinaSoft International | 26,270,000 | 1,571,226 | ||
| Chongqing Changan Automobile, Cl. B | 5,711,537 a,b | 1,090,712 | ||
| Dalian Refrigeration, Cl. B | 16,033,167 | 4,828,539 | ||
| Giant Interactive Group, ADR | 355,150 a | 2,482,498 | ||
| Huadian Power International, Cl. H | 28,328,000 | 5,225,994 | ||
| Huaneng Power International, Cl. H | 6,186,000 | 3,064,762 | ||
| Hunan Non-Ferrous Metal, Cl. H | 67,080,000 | 5,972,399 | ||
| Inner Mongolia Yitai Coal, Cl. B | 2,759,349 | 4,665,048 | ||
| Lianhua Supermarket Holdings, Cl. H | 11,555,000 | 13,530,521 | ||
| Shandong Chenming Paper Holdings, Cl. B | 23,239,570 | 8,265,041 | ||
| Shanghai Forte Land, Cl. H | 19,374,000 a | 2,331,128 | ||
| Shanghai Friendship Group, Cl. B | 19,582,546 | 11,421,648 | ||
| Sino-Ocean Land Holdings | 59,919,000 | 15,805,541 | ||
| Spreadtrum Communications, ADR | 2,181,522 a | 2,770,533 | ||
| Xinjiang Xinxin Mining Industry, Cl. H | 22,681,000 | 4,479,164 | ||
| 162,781,875 | ||||
| Hong Kong—31.1% | ||||
| Belle International Holdings | 10,171,000 | 4,820,845 | ||
| China Agri-Industries Holdings | 17,002,000 a | 6,148,127 | ||
| China Everbright | 11,894,000 | 10,786,911 | ||
| China Foods | 19,304,000 | 5,116,060 | ||
| China Shanshui Cement Group | 18,489,000 a | 3,005,567 | ||
| China Travel International Investment Hong Kong | 47,000,000 | 6,592,263 | ||
| CITIC International Financial Holdings | 24,627,000 a,b | 14,165,041 | ||
| Dynasty Fine Wines Group | 55,507,000 | 7,232,017 |
The Fund 9
| STATEMENT OF INVESTMENTS (continued) |
| Common Stocks (continued) | Shares | Value ($) | ||
| Hong Kong (continued) | ||||
| Far East Pharmaceutical Technology | 1,626,400 a | 66,105 | ||
| Greentown China Holdings | 8,701,300 | 2,663,541 | ||
| Hua Han Bio-Pharmaceutical Holdings, Cl. H | 19,298,000 | 1,867,536 | ||
| Jutal Offshore Oil Services | 3,674,000 | 151,164 | ||
| Lifestyle International Holdings | 11,000,000 | 7,153,623 | ||
| LK Technology Holdings | 61,742,500 | 2,111,182 | ||
| Neo-China Land Group Holdings | 16,580,000 b | 2,246,308 | ||
| TCC International Holdings | 17,332,000 a | 2,109,360 | ||
| Zhuzhou CSR Times Electric, Cl. H | 21,513,000 | 11,682,585 | ||
| 87,918,235 | ||||
| Taiwan—7.7% | ||||
| Gemtek Technology | 5,536,904 | 6,765,652 | ||
| HON HAI Precision Industry | 124,500 | 301,401 | ||
| KGI Securities | 26,520,000 | 6,175,588 | ||
| Motech Industries | 2,125,197 | 5,802,607 | ||
| Shin Kong Financial Holding | 10,000,000 | 2,651,627 | ||
| Yang Ming Marine Transport | 55 | 15 | ||
| 21,696,890 | ||||
| Total Investments (cost $625,859,475) | 96.5% | 272,397,000 | ||
| Cash and Receivables (Net) | 3.5% | 9,865,365 | ||
| Net Assets | 100.0% | 282,262,365 | ||
| ADR—American Depository Receipts |
| a Non-income producing security. |
| b The value of this security has been determined in good faith under the direction of the Board of Directors. |
| Portfolio Summary (Unaudited)† | ||||||
| Value (%) | Value (%) | |||||
| Financial | 19.3 | Information Technology | 6.9 | |||
| Consumer Staples | 15.4 | Telecommunication Services | 6.3 | |||
| Materials | 13.5 | Energy | 5.7 | |||
| Consumer Discretionary | 9.7 | Utilities | 2.9 | |||
| Industrial | 8.4 | Health Care | .7 | |||
| Banks | 7.7 | 96.5 | ||||
| † Based on net assets. | ||||||
| See notes to financial statements. | ||||||
10
| STATEMENT OF ASSETS AND LIABILITIES |
| October 31, 2008 |
| Cost | Value | |||||||||
| Assets ($): | ||||||||||
| Investments in securities—See Statement of Investments | 625,859,475 | 272,397,000 | ||||||||
| Cash | 3,504,004 | |||||||||
| Cash denominated in foreign currencies | 918,159 | 921,344 | ||||||||
| Receivable for investment securities sold | 7,589,654 | |||||||||
| Receivable for shares of Common Stock subscribed | 769,787 | |||||||||
| Dividends and interest receivable | 140,243 | |||||||||
| Prepaid expenses | 10,205 | |||||||||
| 285,332,237 | ||||||||||
| Liabilities ($): | ||||||||||
| Due to The Dreyfus Corporation and affiliates—Note 3(c) | 975,598 | |||||||||
| Payable for investment securities purchased | 1,106,132 | |||||||||
| Payable for shares of Common Stock redeemed | 599,175 | |||||||||
| Unrealized depreciation on forward | ||||||||||
| currency exchange contracts—Note 4 | 2,380 | |||||||||
| Interest payable—Note 2 | 1,300 | |||||||||
| Accrued expenses | 385,287 | |||||||||
| 3,069,872 | ||||||||||
| Net Assets ($) | 282,262,365 | |||||||||
| Composition of Net Assets ($): | ||||||||||
| Paid-in capital | 705,815,404 | |||||||||
| Accumulated net realized gain (loss) on investments | (70,092,698) | |||||||||
| Accumulated net unrealized appreciation (depreciation) | ||||||||||
| on investments and foreign currency transactions | (353,460,341) | |||||||||
| Net Assets ($) | 282,262,365 | |||||||||
| Net Asset Value Per Share | ||||||||||
| Class A | Class B | Class C | Class I | Class T | ||||||
| Net Assets ($) | 157,681,552 | 11,021,356 | 86,642,651 | 24,146,893 | 2,769,913 | |||||
| Shares Outstanding | 9,899,764 | 746,274 | 5,868,202 | 1,484,075 | 180,488 | |||||
| Net Asset Value | ||||||||||
| Per Share ($) | 15.93 | 14.77 | 14.76 | 16.27 | 15.35 | |||||
| See notes to financial statements. | ||||||||||
The Fund 11
| STATEMENT OF OPERATIONS |
| Year Ended October 31, 2008 |
| Investment Income ($): | ||
| Income: | ||
| Cash dividends (net of $719,949 foreign taxes withheld at source) | 17,457,655 | |
| Interest | 364,172 | |
| Total Income | 17,821,827 | |
| Expenses: | ||
| Management fee—Note 3(a) | 11,607,897 | |
| Shareholder servicing costs—Note 3(c) | 3,709,769 | |
| Distribution fees—Note 3(b) | 2,304,412 | |
| Custodian fees—Note 3(c) | 1,771,400 | |
| Registration fees | 153,897 | |
| Prospectus and shareholders’ reports | 148,607 | |
| Directors’ fees and expenses—Note 3(d) | 139,820 | |
| Interest expense—Note 2 | 126,095 | |
| Professional fees | 98,430 | |
| Miscellaneous | 60,044 | |
| Total Expenses | 20,120,371 | |
| Less—reduction in fees due to | ||
| earnings credits—Note 1(c) | (69,925) | |
| Net Expenses | 20,050,446 | |
| Investment (Loss)—Net | (2,228,619) | |
| Realized and Unrealized Gain (Loss) on Investments—Note 4 ($): | ||
| Net realized gain (loss) on investments and foreign currency transactions | (69,242,926) | |
| Net realized gain (loss) on forward currency exchange contracts | (826,443) | |
| Net Realized Gain (Loss) | (70,069,369) | |
| Net unrealized appreciation (depreciation) | ||
| on investments and foreign currency transactions | (968,794,797) | |
| Net Realized and Unrealized Gain (Loss) on Investments | (1,038,864,166) | |
| Net (Decrease) in Net Assets Resulting from Operations | (1,041,092,785) | |
| See notes to financial statements. | ||
12
STATEMENT OF CHANGES IN NET ASSETS
| Year Ended October 31, | ||||
| 2008 | 2007a | |||
| Operations ($): | ||||
| Investment (loss)—net | (2,228,619) | (4,110,046) | ||
| Net realized gain (loss) on investments | (70,069,369) | 221,304,450 | ||
| Net unrealized appreciation | ||||
| (depreciation) on investments | (968,794,797) | 582,688,386 | ||
| Net Increase (Decrease) in Net Assets | ||||
| Resulting from Operations | (1,041,092,785) | 799,882,790 | ||
| Dividends to Shareholders from ($): | ||||
| Investment income—net: | ||||
| Class A Shares | — | (2,778,893) | ||
| Class B Shares | — | (241,195) | ||
| Class C Shares | — | (938,449) | ||
| Class I Shares | — | (472,716) | ||
| Class T Shares | — | (18,762) | ||
| Net realized gain on investments: | ||||
| Class A Shares | (116,312,707) | (25,280,635) | ||
| Class B Shares | (7,485,381) | (4,586,585) | ||
| Class C Shares | (63,447,172) | (13,094,855) | ||
| Class I Shares | (24,029,441) | (3,775,788) | ||
| Class T Shares | (1,901,255) | (204,147) | ||
| Total Dividends | (213,175,956) | (51,392,025) | ||
| Capital Stock Transactions ($): | ||||
| Net proceeds from shares sold: | ||||
| Class A Shares | 193,142,208 | 718,938,070 | ||
| Class B Shares | 2,379,532 | 5,796,182 | ||
| Class C Shares | 85,615,474 | 344,453,119 | ||
| Class I Shares | 14,824,826 | 247,388,031 | ||
| Class T Shares | 2,728,564 | 12,165,266 | ||
The Fund 13
STATEMENT OF CHANGES IN NET ASSETS (continued)
| Year Ended October 31, | ||||
| 2008 | 2007a | |||
| Capital Stock Transactions ($) (continued): | ||||
| Dividends reinvested: | ||||
| Class A Shares | 96,508,013 | 22,474,328 | ||
| Class B Shares | 5,778,243 | 3,608,275 | ||
| Class C Shares | 44,867,564 | 8,908,370 | ||
| Class I Shares | 22,846,268 | 3,951,021 | ||
| Class T Shares | 1,482,437 | 188,437 | ||
| Cost of shares redeemed: | ||||
| Class A Shares | (443,693,229) | (307,319,084) | ||
| Class B Shares | (13,334,300) | (18,553,199) | ||
| Class C Shares | (188,191,782) | (128,746,883) | ||
| Class I Shares | (113,776,172) | (133,597,356) | ||
| Class T Shares | (4,935,762) | (3,256,517) | ||
| Increase (Decrease) in Net Assets | ||||
| from Capital Stock Transactions | (293,758,116) | 776,398,060 | ||
| Total Increase (Decrease) in Net Assets | (1,548,026,857) | 1,524,888,825 | ||
| Net Assets ($): | ||||
| Beginning of Period | 1,830,289,222 | 305,400,397 | ||
| End of Period | 282,262,365 | 1,830,289,222 | ||
14
| Year Ended October 31, | ||||
| 2008 | 2007a | |||
| Capital Share Transactions: | ||||
| Class Ab | ||||
| Shares sold | 4,382,322 | 15,557,507 | ||
| Shares issued for dividends reinvested | 2,042,028 | 666,219 | ||
| Shares redeemed | (11,368,418) | (6,711,173) | ||
| Net Increase (Decrease) in Shares Outstanding | (4,944,068) | 9,512,553 | ||
| Class Bb | ||||
| Shares sold | 57,876 | 139,160 | ||
| Shares issued for dividends reinvested | 130,937 | 112,442 | ||
| Shares redeemed | (382,308) | (442,791) | ||
| Net Increase (Decrease) in Shares Outstanding | (193,495) | (191,189) | ||
| Class C | ||||
| Shares sold | 1,978,042 | 7,692,714 | ||
| Shares issued for dividends reinvested | 1,017,921 | 277,922 | ||
| Shares redeemed | (5,127,241) | (2,902,931) | ||
| Net Increase (Decrease) in Shares Outstanding | (2,131,278) | 5,067,705 | ||
| Class I | ||||
| Shares sold | 307,472 | 5,620,916 | ||
| Shares issued for dividends reinvested | 474,173 | 115,561 | ||
| Shares redeemed | (2,684,428) | (2,946,234) | ||
| Net Increase (Decrease) in Shares Outstanding | (1,902,783) | 2,790,243 | ||
| Class T | ||||
| Shares sold | 65,971 | 253,629 | ||
| Shares issued for dividends reinvested | 32,460 | 5,734 | ||
| Shares redeemed | (143,897) | (73,618) | ||
| Net Increase (Decrease) in Shares Outstanding | (45,466) | 185,745 | ||
| a | Effective June 1, 2007, Class R shares were redesignated as Class I shares. | |
| b | During the period ended October 31, 2008, 54,371 Class B shares representing $2,290,849 were automatically | |
| converted to 50,807 Class A shares and during the period ended October 31, 2007, 28,729 Class B shares | ||
| representing $1,217,976 were automatically converted to 27,253 Class A shares. | ||
| See notes to financial statements. | ||
The Fund 15
FINANCIAL HIGHLIGHTS
The following tables describe the performance for each share class for the fiscal periods indicated.All information (except portfolio turnover rate) reflects financial results for a single fund share.Total return shows how much your investment in the fund would have increased (or decreased) during each period, assuming you had reinvested all dividends and distributions.These figures have been derived from the fund’s financial statements.
| Year Ended October 31, | ||||||||||
| Class A Shares | 2008 | 2007 | 2006 | 2005 | 2004 | |||||
| Per Share Data ($): | ||||||||||
| Net asset value, beginning of period | 67.93 | 31.02 | 19.32 | 19.64 | 19.18 | |||||
| Investment Operations: | ||||||||||
| Investment income (loss)—neta | (.00)b | (.12) | .12 | .12 | .21 | |||||
| Net realized and unrealized | ||||||||||
| gain (loss) on investments | (43.59) | 41.61 | 11.59 | (.15) | .48 | |||||
| Total from Investment Operations | (43.59) | 41.49 | 11.71 | (.03) | .69 | |||||
| Distributions: | ||||||||||
| Dividends from | ||||||||||
| investment income—net | — | (.45) | (.01) | (.13) | (.04) | |||||
| Dividends from net realized | ||||||||||
| gain on investments | (8.41) | (4.13) | — | (.16) | (.19) | |||||
| Total Distributions | (8.41) | (4.58) | (.01) | (.29) | (.23) | |||||
| Net asset value, end of period | 15.93 | 67.93 | 31.02 | 19.32 | 19.64 | |||||
| Total Return (%)c | (72.40) | 148.75 | 60.66 | (.29) | 3.70 | |||||
| Ratios/Supplemental Data (%): | ||||||||||
| Ratio of total expenses | ||||||||||
| to average net assets | 1.95 | 1.77 | 1.92 | 2.05 | 2.09 | |||||
| Ratio of net expenses | ||||||||||
| to average net assets | 1.94 | 1.75 | 1.88 | 2.04 | 2.09d | |||||
| Ratio of net investment income | ||||||||||
| (loss) to average net assets | (.01) | (.26) | .44 | .56 | 1.02 | |||||
| Portfolio Turnover Rate | 66.07 | 106.59 | 188.08 | 178.32 | 154.41 | |||||
| Net Assets, end of period | ||||||||||
| ($ x 1,000) | 157,682 | 1,008,291 | 165,363 | 65,371 | 70,072 | |||||
| a | Based on average shares outstanding at each month end. | |
| b | Amount represents less than $.01 per share. | |
| c | Exclusive of sales charge. | |
| d | Expense waivers and/or reimbursements amounted to less than .01%. | |
| See notes to financial statements. | ||
16
| Year Ended October 31, | ||||||||||
| Class B Shares | 2008 | 2007 | 2006 | 2005 | 2004 | |||||
| Per Share Data ($): | ||||||||||
| Net asset value, beginning of period | 64.18 | 29.53 | 18.53 | 18.89 | 18.56 | |||||
| Investment Operations: | ||||||||||
| Investment income (loss)—neta | (.24) | (.50) | (.14) | (.05) | .08 | |||||
| Net realized and unrealized | ||||||||||
| gain (loss) on investments | (40.76) | 39.50 | 11.14 | (.13) | .44 | |||||
| Total from Investment Operations | (41.00) | 39.00 | 11.00 | (.18) | .52 | |||||
| Distributions: | ||||||||||
| Dividends from investment income—net | — | (.22) | — | (.02) | — | |||||
| Dividends from net realized | ||||||||||
| gain on investments | (8.41) | (4.13) | — | (.16) | (.19) | |||||
| Total Distributions | (8.41) | (4.35) | — | (.18) | (.19) | |||||
| Net asset value, end of period | 14.77 | 64.18 | 29.53 | 18.53 | 18.89 | |||||
| Total Return (%)b | (72.60) | 146.79 | 59.37 | (1.08) | 2.88 | |||||
| Ratios/Supplemental Data (%): | ||||||||||
| Ratio of total expenses | ||||||||||
| to average net assets | 2.68 | 2.58 | 2.73 | 2.84 | 2.87 | |||||
| Ratio of net expenses | ||||||||||
| to average net assets | 2.67 | 2.56 | 2.70 | 2.83 | 2.86 | |||||
| Ratio of net investment income | ||||||||||
| (loss) to average net assets | (.68) | (1.19) | (.55) | (.23) | .38 | |||||
| Portfolio Turnover Rate | 66.07 | 106.59 | 188.08 | 178.32 | 154.41 | |||||
| Net Assets, end of period ($ x 1,000) | 11,021 | 60,319 | 33,402 | 20,160 | 20,601 | |||||
| a | Based on average shares outstanding at each month end. | |
| b | Exclusive of sales charge. | |
| See notes to financial statements. | ||
The Fund 17
| FINANCIAL HIGHLIGHTS (continued) |
| Year Ended October 31, | ||||||||||
| Class C Shares | 2008 | 2007 | 2006 | 2005 | 2004 | |||||
| Per Share Data ($): | ||||||||||
| Net asset value, beginning of period | 64.13 | 29.56 | 18.54 | 18.91 | 18.57 | |||||
| Investment Operations: | ||||||||||
| Investment income (loss)—neta | (.27) | (.46) | (.11) | (.04) | .07 | |||||
| Net realized and unrealized | ||||||||||
| gain (loss) on investments | (40.69) | 39.46 | 11.13 | (.15) | .46 | |||||
| Total from Investment Operations | (40.96) | 39.00 | 11.02 | (.19) | .53 | |||||
| Distributions: | ||||||||||
| Dividends from investment income—net | — | (.30) | — | (.02) | (.00)b | |||||
| Dividends from net realized | ||||||||||
| gain on investments | (8.41) | (4.13) | — | (.16) | (.19) | |||||
| Total Distributions | (8.41) | (4.43) | — | (.18) | (.19) | |||||
| Net asset value, end of period | 14.76 | 64.13 | 29.56 | 18.54 | 18.91 | |||||
| Total Return (%)c | (72.60) | 146.90 | 59.44 | (1.07) | 2.90 | |||||
| Ratios/Supplemental Data (%): | ||||||||||
| Ratio of total expenses | ||||||||||
| to average net assets | 2.71 | 2.53 | 2.69 | 2.82 | 2.83 | |||||
| Ratio of net expenses | ||||||||||
| to average net assets | 2.70 | 2.51 | 2.66 | 2.82d | 2.83d | |||||
| Ratio of net investment income | ||||||||||
| (loss) to average net assets | (.74) | (1.03) | (.42) | (.21) | .33 | |||||
| Portfolio Turnover Rate | 66.07 | 106.59 | 188.08 | 178.32 | 154.41 | |||||
| Net Assets, end of period ($ x 1,000) | 86,643 | 513,012 | 86,666 | 39,748 | 40,423 | |||||
| a | Based on average shares outstanding at each month end. | |
| b | Amount represents less than $.01 per share. | |
| c | Exclusive of sales charge. | |
| d | Expense waivers and/or reimbursements amounted to less than .01%. | |
| See notes to financial statements. | ||
18
| Year Ended October 31, | ||||||||||
| Class I Shares | 2008 | 2007a | 2006 | 2005 | 2004 | |||||
| Per Share Data ($): | ||||||||||
| Net asset value, beginning of period | 69.02 | 31.43 | 19.56 | 19.88 | 19.38 | |||||
| Investment Operations: | ||||||||||
| Investment income—netb | .03 | .08 | .33 | .14 | .28 | |||||
| Net realized and unrealized | ||||||||||
| gain (loss) on investments | (44.37) | 42.16 | 11.60 | (.13) | .48 | |||||
| Total from Investment Operations | (44.34) | 42.24 | 11.93 | .01 | .76 | |||||
| Distributions: | ||||||||||
| Dividends from investment income—net | — | (.52) | (.06) | (.17) | (.07) | |||||
| Dividends from net realized | ||||||||||
| gain on investments | (8.41) | (4.13) | — | (.16) | (.19) | |||||
| Total Distributions | (8.41) | (4.65) | (.06) | (.33) | (.26) | |||||
| Net asset value, end of period | 16.27 | 69.02 | 31.43 | 19.56 | 19.88 | |||||
| Total Return (%) | (72.31) | 149.45 | 61.14 | (.04) | 3.96 | |||||
| Ratios/Supplemental Data (%): | ||||||||||
| Ratio of total expenses | ||||||||||
| to average net assets | 1.66 | 1.49 | 1.62 | 1.77 | 1.80 | |||||
| Ratio of net expenses | ||||||||||
| to average net assets | 1.65 | 1.47 | 1.58 | 1.77c | 1.80c | |||||
| Ratio of net investment income | ||||||||||
| to average net assets | .07 | .16 | 1.13 | .68 | 1.28 | |||||
| Portfolio Turnover Rate | 66.07 | 106.59 | 188.08 | 178.32 | 154.41 | |||||
| Net Assets, end of period ($ x 1,000) | 24,147 | 233,751 | 18,752 | 3,179 | 4,854 | |||||
| a | Effective June 1, 2007, Class R shares were redesignated as Class I shares. | |
| b | Based on average shares outstanding at each month end. | |
| c | Expense waivers and/or reimbursements amounted to less than .01%. | |
| See notes to financial statements. | ||
The Fund 19
| FINANCIAL HIGHLIGHTS (continued) |
| Year Ended October 31, | ||||||||||
| Class T Shares | 2008 | 2007 | 2006 | 2005 | 2004 | |||||
| Per Share Data ($): | ||||||||||
| Net asset value, beginning of period | 66.02 | 30.27 | 18.91 | 19.26 | 18.83 | |||||
| Investment Operations: | ||||||||||
| Investment income (loss)—neta | (.08) | (.26) | .01 | .17 | .18 | |||||
| Net realized and unrealized | ||||||||||
| gain (loss) on investments | (42.18) | 40.52 | 11.35 | (.27) | .46 | |||||
| Total from Investment Operations | (42.26) | 40.26 | 11.36 | (.10) | .64 | |||||
| Distributions: | ||||||||||
| Dividends from investment income—net | — | (.38) | — | (.09) | (.02) | |||||
| Dividends from net realized | ||||||||||
| gain on investments | (8.41) | (4.13) | — | (.16) | (.19) | |||||
| Total Distributions | (8.41) | (4.51) | — | (.25) | (.21) | |||||
| Net asset value, end of period | 15.35 | 66.02 | 30.27 | 18.91 | 19.26 | |||||
| Total Return (%)b | (72.49) | 148.04 | 60.07 | (.58) | 3.44 | |||||
| Ratios/Supplemental Data (%): | ||||||||||
| Ratio of total expenses | ||||||||||
| to average net assets | 2.24 | 2.08 | 2.28 | 2.29 | 2.43 | |||||
| Ratio of net expenses | ||||||||||
| to average net assets | 2.23 | 2.04 | 2.25 | 2.29c | 2.40 | |||||
| Ratio of net investment income | ||||||||||
| (loss) to average net assets | (.22) | (.55) | .02 | .81 | .85 | |||||
| Portfolio Turnover Rate | 66.07 | 106.59 | 188.08 | 178.32 | 154.41 | |||||
| Net Assets, end of period ($ x 1,000) | 2,770 | 14,917 | 1,217 | 617 | 855 | |||||
| a | Based on average shares outstanding at each month end. | |
| b | Exclusive of sales charge. | |
| c | Expense waivers and/or reimbursements amounted to less than .01%. | |
| See notes to financial statements. | ||
20
NOTES TO FINANCIAL STATEMENTS
NOTE 1—Significant Accounting Policies:
Dreyfus Greater China Fund (the “fund”) is a separate non-diversified series of Dreyfus Premier Investment Funds,Inc.(the“Company”) which is registered under the Investment Company Act of 1940, as amended (the “Act”), as an open-end management investment company and operates as a series company currently offering nine series,including the fund. The fund’s investment objective is long-term capital appreciation. The Dreyfus Corporation (the “Manager” or “Dreyfus”), a wholly-owned subsidiary of The Bank of New York Mellon Corporation (“BNY Mellon”), serves as the fund’s investment adviser. Hamon U.S. Investment Advisors Limited (“Hamon”) serves as the fund’s sub-investment adviser. Hamon is an affiliate of Dreyfus.
The Board of Directors approved, effective March 31, 2008, a change in the Company name from “Dreyfus Premier International Funds, Inc.” to “Dreyfus Premier Investment Funds, Inc.”
At a meeting of the fund’s Board of Directors held on July 10, 2008, the Board approved, effective December 1, 2008, a proposal to change the name of the fund from “Dreyfus Premier Greater China Fund” to “Dreyfus Greater China Fund.”
Effective July 1, 2008, BNY Mellon has reorganized and consolidated a number of its banking and trust company subsidiaries. As a result of the reorganization, any services previously provided to the fund by Mellon Bank, N.A. or Mellon Trust of New England, N.A. are now provided by The Bank of New York, which has changed its name to The Bank of New York Mellon.
MBSC Securities Corporation (the “Distributor”), a wholly-owned subsidiary of Dreyfus, is the distributor of the fund’s shares.The fund is authorized to issue 200 million shares of $.001 par value Common Stock in each of the following classes of shares: Class A, Class B, Class C, Class I and Class T. Class A and Class T shares are subject to a sales charge imposed at the time of purchase. Class B shares are subject to a contingent deferred sales charge (“CDSC”) imposed on Class B share redemptions made within six years of purchase and automatically
The Fund 21
| NOTES TO FINANCIAL STATEMENTS (continued) |
convert to Class A shares after six years. The fund does not offer Class B shares, except in connection with dividend reinvestment and permitted exchanges of Class B shares. Class C shares are subject to a CDSC imposed on Class C shares redeemed within one year of purchase. Class I shares are sold at net asset value per share only to institutional investors. Other differences between the classes include the services offered to and the expenses borne by each class, the allocation of certain transfer agency costs and certain voting rights. Income, expenses (other than expenses attributable to a specific class), and realized and unrealized gains or losses on investments are allocated to each class of shares based on its relative net assets.
The Company accounts separately for the assets, liabilities and operations of each series. Expenses directly attributable to each series are charged to that series’ operations; expenses which are applicable to all series are allocated among them on a pro rata basis.
The fund’s financial statements are prepared in accordance with U.S. generally accepted accounting principles, which may require the use of management estimates and assumptions. Actual results could differ from those estimates.
The fund enters into contracts that contain a variety of indemnifications. The fund’s maximum exposure under these arrangements is unknown.The fund does not anticipate recognizing any loss related to these arrangements.
(a) Portfolio valuation: Investments in securities are valued at the last sales price on the securities exchange or national securities market on which such securities are primarily traded. Securities listed on the National Market System for which market quotations are available, are valued at the official closing price or, if there is no official closing price that day, at the last sales price. Securities not listed on an exchange or the national securities market, or securities for which there were no transactions, are valued at the average of the most recent bid and asked prices, except for open short positions, where the asked price is used for valuation purposes. Bid price is used when no asked price is available.
22
Registered investment companies that are not traded on an exchange are valued at their net asset value. When market quotations or official closing prices are not readily available, or are determined not to reflect accurately fair value, such as when the value of a security has been significantly affected by events after the close of the exchange or market on which the security is principally traded (for example, a foreign exchange or market),but before the fund calculates its net asset value,the fund may value these investments at fair value as determined in accordance with the procedures approved by the Board of Directors. Fair valuing of securities may be determined with the assistance of a pricing service using calculations based on indices of domestic securities and other appropriate indicators, such as prices of relevant ADRs and futures contracts. For other securities that are fair valued by the Board of Directors, certain factors may be considered such as: fundamental analytical data, the nature and duration of restrictions on disposition, an evaluation of the forces that influence the market in which the securities are purchased and sold, and public trading in similar securities of the issuer or comparable issuers. Financial futures are valued at the last sales price. Investments denominated in foreign currencies are translated to U.S. dollars at the prevailing rates of exchange. Forward currency exchange contracts are valued at the forward rate.
The Financial Accounting Standards Board (“FASB”) released Statement of Financial Accounting Standards No. 157 “Fair Value Measurements” (“FAS 157”). FAS 157 establishes an authoritative definition of fair value, sets out a framework for measuring fair value, and requires additional disclosures about fair-value measurements. The application of FAS 157 is required for fiscal years beginning after November 15, 2007 and interim periods within those fiscal years. Management does not believe that the application of this standard will have a material impact on the financial statements of the fund.
(b) Foreign currency transactions: The fund does not isolate that portion of the results of operations resulting from changes in foreign exchange rates on investments from the fluctuations arising from changes
The Fund 23
| NOTES TO FINANCIAL STATEMENTS (continued) |
in market prices of securities held. Such fluctuations are included with the net realized and unrealized gain or loss on investments.
Net realized foreign exchange gains or losses arise from sales and maturities of short-term securities, sales of foreign currencies, currency gains or losses realized on securities transactions and the difference between the amounts of dividends, interest, and foreign withholding taxes recorded on the fund’s books and the U.S. dollar equivalent of the amounts actually received or paid. Net unrealized foreign exchange gains and losses arise from changes in the value of assets and liabilities other than investments in securities, resulting from changes in exchange rates. Such gains and losses are included with net realized and unrealized gain or loss on investments.
(c) Securities transactions and investment income: Securities transactions are recorded on a trade date basis. Realized gains and losses from securities transactions are recorded on the identified cost basis. Dividend income is recognized on the ex-dividend date and interest income, including, where applicable, accretion of discount and amortization of premium on investments, is recognized on the accrual basis.
The fund has arrangements with the custodian and cash management banks whereby the fund may receive earnings credits when positive cash balances are maintained, which are used to offset custody and cash management fees. For financial reporting purposes, the fund includes net earnings credits as an expense offset in the Statement of Operations.
Investing in foreign markets may involve special risks and considerations not typically associated with investing in the U.S. These risks include revaluation of currencies, high rates of inflation, repatriation restrictions on income and capital, and adverse political and economic developments. Moreover, securities issued in these markets may be less liquid, subject to government ownership controls and delayed settlements, and their prices may be more volatile than those of comparable securities in the U.S.
(d) Dividends to shareholders: Dividends are recorded on the ex-dividend date. Dividends from investment income-net and dividends from
24
net realized capital gains, if any, are normally declared and paid annually, but the fund may make distributions on a more frequent basis to comply with the distribution requirements of the Internal Revenue Code of 1986, as amended (the “Code”).To the extent that net realized capital gains can be offset by capital loss carryovers, it is the policy of the fund not to distribute such gains. Income and capital gain distributions are determined in accordance with income tax regulations, which may differ from U.S. generally accepted accounting principles.
(e) Federal income taxes: It is the policy of the fund to continue to qualify as a regulated investment company, if such qualification is in the best interests of its shareholders, by complying with the applicable provisions of the Code, and to make distributions of taxable income sufficient to relieve it from substantially all federal income and excise taxes.
The fund adopted FASB Interpretation No. 48 “Accounting for Uncertainty in Income Taxes” (“FIN 48”). FIN 48 provides guidance for how uncertain tax positions should be recognized, measured, presented and disclosed in the financial statements. FIN 48 requires the evaluation of tax positions taken or expected to be taken in the course of preparing the fund’s tax returns to determine whether the tax positions are “more-likely-than-not” of being sustained by the applicable tax authority. Liability for tax positions not deemed to meet the more-likely-than-not threshold would be recorded as a tax expense in the current year.The adoption of FIN 48 had no impact on the operations of the fund for the period ended October 31, 2008.
As of and during the period ended October 31, 2008, the fund did not have any liabilities for any unrecognized tax positions. The fund recognizes interest and penalties, if any, related to unrecognized tax positions as income tax expense in the Statement of Operations. During the period, the fund did not incur any interest or penalties.
Each of the tax years in the four-year period ended October 31, 2008 remains subject to examination by the Internal Revenue Service and state taxing authorities.
The Fund 25
| NOTES TO FINANCIAL STATEMENTS (continued) |
At October 31, 2008, the components of accumulated earnings on a tax basis were as follows: accumulated capital losses $61,303,392 and unrealized depreciation $362,249,647.
The accumulated capital loss carryover is available for federal income tax purposes to be applied against future net securities profits, if any, realized subsequent to October 31, 2008. If not applied, the carryover expires in fiscal 2016.
The tax character of distributions paid to shareholders during the fiscal periods ended October 31, 2008 and October 31, 2007, were as follows: ordinary income $178,580,834 and $34,234,798 and long-term capital gains $34,595,122 and $17,157,227, respectively.
During the period ended October 31, 2008, as a result of permanent book to tax differences, primarily due to the tax treatment for foreign currency gains and losses and net operating losses, the fund increased accumulated undistributed investment income-net by $2,228,619, increased accumulated net realized gain (loss) on investments by $1,376,311 and decreased paid-in capital by $3,604,930. Net assets and net asset value per share were not affected by this reclassification.
NOTE 2—Bank Lines of Credit:
The fund may borrow up to $5 million for leveraging purposes under a short-term unsecured line of credit. Prior to May 1, 2008, the fund participated with other Dreyfus-managed funds in a $100 million unsecured line of credit. Effective May 1, 2008, the fund participates with other Dreyfus-managed funds in a $300 million unsecured line of credit primarily to be utilized for temporary or emergency purposes, including the financing of redemptions.The terms of the line of credit agreement limit the amount of individual fund borrowings. Interest is charged to the fund based on prevailing market rates in effect at the time of borrowing. Effective October 15, 2008, in connection therewith, the fund has agreed to pay commitment fees on its pro rata portion of the unsecured line of credit.
26
The average daily amount of borrowings outstanding under the lines of credit during the period ended October 31, 2008, was approximately $4,424,000, with a related weighted average annualized interest rate of 2.85% .
NOTE 3—Management Fee, Sub-Investment Advisory Fee and Other Transactions With Affiliates:
(a) Pursuant to an Management Agreement (“Agreement”) with Dreyfus, the management fee is computed at the annual rate of 1.25% of the value of the fund’s average daily net assets and is payable monthly.
Pursuant to a Sub-Investment Advisory Agreement between Dreyfus and Hamon, Dreyfus pays Hamon a fee payable monthly at the annual rate of .625% of the value of the fund’s average daily net assets.
During the period ended October 31, 2008, the Distributor retained $614,490 and $5,159 from commissions earned on sales of the fund’s Class A and Class T shares, respectively, and $93,242 and $770,486 from CDSCs on redemptions of the fund’s Class B and Class C shares, respectively.
(b) Under the Distribution Plan (the “Plan”) adopted pursuant to Rule 12b-1 under the Act, Class B, Class C and Class T shares pay the Distributor for distributing their shares at an annual rate of .75% of the value of the average daily net assets of Class B and Class C shares and .25% of the value of the average daily net assets of Class T shares. During the period ended October 31, 2008, Class B, Class C and Class T shares were charged $244,966, $2,037,941 and $21,505, respectively, pursuant to the Plan.
(c) Under the Shareholder Services Plan, Class A, Class B, Class C and Class T shares pay the Distributor at an annual rate of .25% of the value of their average daily net assets for the provision of certain services.The services provided may include personal services relating to shareholder accounts, such as answering shareholder inquiries regarding the fund
The Fund 27
| NOTES TO FINANCIAL STATEMENTS (continued) |
and providing reports and other information, and services related to the maintenance of shareholder accounts.The Distributor may make payments to Service Agents (a securities dealer, financial institution or other industry professional) in respect of these services.The Distributor determines the amounts to be paid to Service Agents. During the period ended October 31, 2008, Class A, Class B, Class C and Class T shares were charged $1,297,224, $81,655, $679,314 and $21,505, respectively, pursuant to the Shareholder Services Plan.
The fund compensates Dreyfus Transfer, Inc., a wholly-owned subsidiary of Dreyfus, under a transfer agency agreement for providing personnel and facilities to perform transfer agency services for the fund. During the period ended October 31, 2008, the fund was charged $561,620 pursuant to the transfer agency agreement.
The fund compensates The Bank of New York Mellon, a subsidiary of BNY Mellon and an affiliate of Dreyfus, under a cash management agreement for performing cash management services related to fund subscriptions and redemptions. During the period ended October 31, 2008, the fund was charged $66,034 pursuant to the cash management agreement.
The fund compensates The Bank of New York Mellon under a custody agreement for providing custodial services for the fund. During the period ended October 31, 2008, the fund was charged $1,771,400 pursuant to the custody agreement.
During the period ended October 31, 2008, the fund was charged $6,203 for services performed by the Chief Compliance Officer.
The components of “Due to The Dreyfus Corporation and affiliates” in the Statement of Assets and Liabilities consist of: management fees $351,328, Rule 12b-1 distribution plan fees $73,556, shareholder services plan fees $64,204, custodian fees $400,517, chief compliance officer fees $1,973 and transfer agency per account fees $84,020.
(d) Each Board member also serves as a Board member of other funds within the Dreyfus complex. Annual retainer fees and attendance fees are allocated to each fund based on net assets.
28
NOTE 4—Securities Transactions:
The aggregate amount of purchases and sales of investment securities, excluding short-term securities and forward currency exchange contracts, during the period ended October 31, 2008, amounted to $625,792,555 and $1,098,219,322, respectively.
The fund enters into forward currency exchange contracts in order to hedge its exposure to changes in foreign currency exchange rates on its foreign portfolio holdings and to settle foreign currency transactions. When executing forward currency exchange contracts, the fund is obligated to buy or sell a foreign currency at a specified rate on a certain date in the future.With respect to sales of forward currency exchange contracts, the fund would incur a loss if the value of the contract increases between the date the forward contract is opened and the date the forward contract is closed.The fund realizes a gain if the value of the contract decreases between those dates.With respect to purchases of forward currency exchange contracts, the fund would incur a loss if the value of the contract decreases between the date the forward contract is opened and the date the forward contract is closed.The fund realizes a gain if the value of the contract increases between those dates. The fund is also exposed to credit risk associated with counterparty nonperformance on these forward currency exchange contracts which is typically limited to the unrealized gain on each open contract. The following summarizes open forward currency exchange contracts at October 31, 2008:
| Foreign | ||||||||
| Forward Currency | Currency | Unrealized | ||||||
| Exchange Contracts | Amounts | Proceeds ($) | Value ($) (Depreciation) ($) | |||||
| Sale: | ||||||||
| Hong Kong Dollar, | ||||||||
| expiring 11/3/2008 | 18,000,000 | 2,320,186 | 2,322,566 | (2,380) | ||||
At October 31, 2008, the cost of investments for federal income tax purposes was $634,648,781; accordingly, accumulated net unrealized depreciation on investments was $362,251,781, consisting of $3,255,270 gross unrealized appreciation and $365,507,051 gross unrealized depreciation.
The Fund 29
| NOTES TO FINANCIAL STATEMENTS (continued) |
In March 2008, the FASB released Statement of Financial Accounting Standards No. 161 “Disclosures about Derivative Instruments and Hedging Activities” (“FAS 161”). FAS 161 requires qualitative disclosures about objectives and strategies for using derivatives, quantitative disclosures about fair value amounts of gains and losses on derivative instruments and disclosures about credit-risk-related contingent features in derivative agreements.The application of FAS 161 is required for fiscal years and interim periods beginning after November 15, 2008. At this time, management is evaluating the implications of FAS 161 and its impact on the financial statements and the accompanying notes has not yet been determined.
NOTE 5—Subsequent Event:
Effective on or about February 4, 2009 (the “Effective Date”), the fund will issue to each holder of its ClassT shares, in exchange for said shares, Class A shares of the fund having an aggregate net asset value equal to the aggregate net asset value of the shareholder’s Class T shares. Thereafter, the fund will no longer offer Class T shares.
Effective on or about December 3, 2008, no investments for new accounts were permitted in Class T of the fund, except that participants in certain group retirement plans were able to open a new account in Class T of the fund, provided that the fund was established as an investment option under the plans before December 3, 2008. After the Effective Date, subsequent investments in the fund’s Class A shares made by holders of the fund’s Class T shares who received Class A shares of the fund in exchange for their Class T shares will be subject to the front-end sales load schedule currently in effect for Class T shares. Otherwise, all other Class A share attributes will be in effect.
30
REPORT OF INDEPENDENT REGISTERED PUBLIC ACCOUNTING FIRM
| Shareholders and Board of Directors Dreyfus Greater China Fund |
We have audited the accompanying statement of assets and liabilities, including the statement of investments, of Dreyfus Greater China Fund (formerly, Dreyfus Premier Greater China Fund), one of the series comprising Dreyfus Premier Investment Funds, Inc. (formerly, Dreyfus Premier International Funds, Inc.) as of October 31, 2008, and the related statement of operations for the year then ended, the statement of changes in net assets for each of the two years in the period then ended, and financial highlights for each of the years indicated therein. These financial statements and financial highlights are the responsibility of the Fund’s management. Our responsibility is to express an opinion on these financial statements and financial highlights based on our audits.
We conducted our audits in accordance with the standards of the Public Company Accounting Oversight Board (United States).Those standards require that we plan and perform the audit to obtain reasonable assurance about whether the financial statements and financial highlights are free of material misstatement.We were not engaged to perform an audit of the Fund’s internal control over financial reporting. Our audits included consideration of internal control over financial reporting as a basis for designing audit procedures that are appropriate in the circumstances, but not for the purpose of expressing an opinion on the effectiveness of the Fund’s internal control over financial reporting. Accordingly, we express no such opinion.An audit also includes examining, on a test basis, evidence supporting the amounts and disclosures in the financial statements and financial highlights, assessing the accounting principles used and significant estimates made by management, and evaluating the overall financial statement presentation. Our procedures included confirmation of securities owned as of October 31, 2008 by correspondence with the custodian and others. We believe that our audits provide a reasonable basis for our opinion.
In our opinion, the financial statements and financial highlights referred to above present fairly, in all material respects, the financial position of Dreyfus Greater China Fund at October 31, 2008, the results of its operations for the year then ended, the changes in its net assets for each of the two years in the period then ended, and the financial highlights for each of the indicated years, in conformity with U.S. generally accepted accounting principles.
| New York, New York |
| December 23, 2008 |
The Fund 31
IMPORTANT TAX INFORMATION (Unaudited)
In accordance with federal tax law, the fund elects to provide each shareholder with their portion of the fund’s foreign taxes paid and the income sourced from foreign countries. Accordingly, the fund hereby makes the following designations regarding its fiscal year ended October 31, 2008:
| —the total amount of taxes paid to foreign countries was $719,949 |
| —the total amount of income sourced from foreign countries was $719,949. |
As required by federal tax law rules, shareholders will receive notification of their proportionate share of foreign taxes paid and foreign sourced income for the 2008 calendar year with Form 1099-DIV which will be mailed by January 31, 2009. For the fiscal year ended October 31, 2008, certain dividends paid by the fund may be subject to a maximum tax rate of 15%, as provided for by the Jobs and Growth Tax Relief Reconciliation Act of 2003. Of the distributions paid during the fiscal year, $4,058 represents the maximum amount that may be considered qualified dividend income. Also, the fund hereby designates $1.3640 per share as a long-term capital gain distribution and $7.0410 per share as a short-term capital gain distribution paid on December 21, 2007.
32
| INFORMATION ABOUT THE REVIEW AND APPROVAL |
| OF THE FUND’S MANAGEMENT AGREEMENT (Unaudited) |
At a meeting of the fund’s Board held on July 10, 2008, the Board unanimously approved the continuation of the fund’s Management Agreement with Dreyfus and the Sub-Investment Advisory Agreement between Dreyfus and Hamon U.S. Investment Advisors Limited (“Hamon”) (together, the “Agreements”) for a one-year term ending July 31, 2009.The Board members, none of whom are “interested persons” (as defined in the Investment Company Act of 1940, as amended) of the fund, were assisted in their review by independent legal counsel and met with counsel in executive session separate from representatives of Dreyfus. In approving the continuance of the Agreements, the Board considered all factors that they believed to be relevant, including, among other things, the factors discussed below.
Analysis of Nature, Extent and Quality of Services Provided to the Fund. The Board members received a presentation from representatives of Dreyfus regarding services provided to the fund and other funds in the Dreyfus fund complex, and discussed the nature, extent and quality of the services provided to the fund pursuant to the Agreements. Dreyfus’ representatives reviewed the fund’s distribution of accounts and the relationships Dreyfus has with various intermediaries and the different needs of each. Dreyfus’ representatives noted the various distribution channels for the fund as well as the diverse methods of distribution among other funds in the Dreyfus fund complex, and Dreyfus’ corresponding need for broad, deep, and diverse resources to be able to provide ongoing shareholder services to each distribution channel, including those of the fund. Dreyfus also provided the number of accounts investing in the fund, as well as the fund’s asset size.
The Board members also considered Dreyfus’ and Hamon’s research and portfolio management capabilities, the division of responsibilities between Dreyfus and Hamon, and Dreyfus’ oversight of day-to-day fund operations, including fund accounting, administration and assistance in meeting legal and regulatory requirements. The Board also considered Dreyfus’ brokerage policies and practices, the standards applied in seeking best execution and Dreyfus’ policies and practices regarding soft dollars. The Board members also considered Dreyfus’ extensive administrative, accounting and compliance infrastructure.
The Fund 33
| INFORMATION ABOUT THE REVIEW AND APPROVAL OF THE |
| FUND’S MANAGEMENT AGREEMENT (Unaudited) (continued) |
Comparative Analysis of the Fund’s Performance and Management Fee and Expense Ratio. The Board members reviewed the fund’s performance for the one-, three-, five- and ten-year periods ended May 31, 2008, and compared the fund’s performance to the performance of a group of comparable retail China region funds (the “Performance Group”) and to a larger universe of funds consisting of all retail and institutional China region funds (the “Performance Universe”) selected and provided by Lipper, Inc., an independent provider of investment company data. The Board was provided with a description of the methodology Lipper used to select the Performance Group and Performance Universe, as well as the Expense Group and Expense Universe (discussed below). The Board members noted that they also had received and discussed with management information at periodic intervals comparing the fund’s performance to that of its benchmark index.The Board members discussed the results of the comparisons and noted that the fund’s total return performance for one-, three-, five-and ten-year periods ended May 31, 2008 was in the fourth, first, second and first quartile, respectively, of the Performance Group and in the fourth, first, first and first quartile, respectively, of the Performance Universe. The Board members then discussed with representatives of Dreyfus and Hamon the reasons for the fund’s underperformance versus the Performance Group and Performance Universe during the most recent one-year period.The Board members noted that the fund’s portfolio managers are very experienced with an impressive long-term track record and continued to apply a consistent investment strategy.
The Board members also discussed the fund’s management fee and expense ratio and reviewed the range of management fees and expense ratios as compared to a a group of comparable retail China region funds (the “Expense Group”) and a broader group of funds consisting of all retail China region funds (the “Expense Universe”), each selected and provided by Lipper. The Board members noted that the fund’s management fee was higher than the median management fees paid by the other funds in the Expense Group.The Board members also noted that while the total expense ratio of the fund was higher than the median total expense ratio for the funds in the Expense Group, it was
34
lower than the median total expense ratio for the funds in the Expense Universe. The Board noted that Dreyfus, and not the fund, pays the sub-advisory fee to Hamon and, accordingly, that the retention of Hamon does not increase the fees and expenses incurred by the fund.
Representatives of Dreyfus reviewed with the Board members the fees paid to Dreyfus or its affiliates by mutual funds managed by Dreyfus with similar investment objectives, policies and strategies as the fund (the “Similar Funds”). Dreyfus’ representatives also reviewed the costs associated with distribution through intermediaries. The Board analyzed differences in fees paid to Dreyfus and discussed the relationship of the advisory fees paid in light of Dreyfus’ performance, and the services provided. The Board members considered the relevance of the fee information provided for the Similar Funds managed by Dreyfus or its affiliates to evaluate the appropriateness and reasonableness of the fund’s management fees.The Board acknowledged that the differences in fees paid by the Similar Funds seemed to be consistent with the services provided.
Analysis of Profitability and Economies of Scale. Dreyfus’ representatives reviewed the dollar amount of expenses allocated and profit received by Dreyfus and the method used to determine such expenses and profit.The Board members evaluated the profitability analysis in light of the relevant circumstances for the fund and the extent to which economies of scale would be realized if the fund grows and whether fee levels reflect these economies of scale for the benefit of fund investors.The Board members also considered potential benefits to Dreyfus from acting as investment adviser and noted the soft dollar arrangements with respect to trading the fund’s investments.
It was noted that the Board members should consider Dreyfus’ profitability with respect to the fund as part of their evaluation of whether the fees under the Agreements bear a reasonable relationship to the mix of services provided by Dreyfus, including the nature, extent and quality of such services and that a discussion of economies of scale is predicated on a fund having achieved a substantial size with increasing assets and that, if a fund’s assets had been static or decreasing, the
The Fund 35
| INFORMATION ABOUT THE REVIEW AND APPROVAL OF THE |
| FUND’S MANAGEMENT AGREEMENT (Unaudited) (continued) |
possibility that Dreyfus may have realized any economies of scale would be less.The Board noted that as the fund’s assets have increased over time, the fund and its shareholders have realized economies of scale as certain expenses, such as fixed fund fees, became a smaller percentage of overall assets. It also was noted that the profitability percentage for managing the fund was within ranges determined by appropriate court cases to be reasonable given the services rendered and generally superior service levels provided.
At the conclusion of these discussions, the Board agreed that it had been furnished with sufficient information to make an informed business decision with respect to continuation of the fund’s Agreements. Based on the discussions and considerations as described above, the Board made the following conclusions and determinations.
- The Board concluded that the nature, extent and quality of the ser- vices provided by Dreyfus and Hamon are adequate and appropriate.
- The Board was generally satisfied with the fund’s long-term perfor- mance and Hamon’s efforts to improve performance going forward.
- The Board concluded that the fee paid by the fund to Dreyfus was reasonable in light of the considerations described above.
- The Board determined that the economies of scale which may accrue to Dreyfus and its affiliates in connection with the manage- ment of the fund had been adequately considered by Dreyfus in connection with the management fee rate charged to the fund and that, to the extent in the future it were determined that material economies of scale had not been shared with the fund, the Board would seek to have those economies of scale shared with the fund.
The Board members considered these conclusions and determinations, along with information received on a routine and regular basis throughout the year, and, without any one factor being dispositive, the Board determined that continuation of the fund’s Management Agreement and Sub-Investment Advisory Agreement was in the best interests of the fund and its shareholders.
36
BOARD MEMBERS INFORMATION (Unaudited)
| Joseph S. DiMartino (65) Chairman of the Board (1995) |
Principal Occupation During Past 5Years:
- Corporate Director and Trustee
Other Board Memberships and Affiliations:
- The Muscular Dystrophy Association, Director
- Century Business Services, Inc., a provider of outsourcing functions for small and medium size companies, Director
- The Newark Group, a provider of a national market of paper recovery facilities, paperboard mills and paperboard converting plants, Director
- Sunair Services Corporation, a provider of certain outdoor-related services to homes and businesses, Director
No. of Portfolios for which Board Member Serves: 167
| ——————— |
| Gordon J. Davis (67) Board Member (1993) Principal Occupation During Past 5Years: |
- Partner in the law firm of Dewey & LeBoeuf LLP
- President, Lincoln Center for the Performing Arts, Inc. (2001)
| Other Board Memberships and Affiliations: |
- Consolidated Edison, Inc., a utility company, Director
- Phoenix Companies Inc., a life insurance company, Director
- Board Member/Trustee for several not-for-profit groups
| No. of Portfolios for which Board Member Serves: 41 |
| ——————— |
| David P. Feldman (68) Board Member (1991) |
Principal Occupation During Past 5Years:
- Corporate Director and Trustee
Other Board Memberships and Affiliations:
- BBH Mutual Funds Group (11 funds), Director
- The Jeffrey Company, a private investment company, Director
| No. of Portfolios for which Board Member Serves: 50 |
The Fund 37
BOARD MEMBERS INFORMATION (Unaudited) (continued)
| Lynn Martin (68) Board Member (1993) Principal Occupation During Past 5Years: |
- Advisor to the international accounting firm of Deloitte & Touche, LLP and Chair to its Council for the Advancement of Women from March 1993-September 2005
| Other Board Memberships and Affiliations: |
- AT&T Inc., a telecommunications company, Director
- Ryder System, Inc., a supply chain and transportation management company, Director
- The Proctor & Gamble Co., a consumer products company, Director
- Constellation Energy Group, Director
- Chicago Council on Global Affairs
- Coca-Cola International Advisory Council
- Deutsche Bank Advisory Council
No. of Portfolios for which Board Member Serves: 14
| ——————— |
| Daniel Rose (79) Board Member (1992) Principal Occupation During Past 5Years: |
- Chairman and Chief Executive Officer of Rose Associates, Inc., a New York based real estate development and management firm
| Other Board Memberships and Affiliations: |
- Baltic-American Enterprise Fund,Vice Chairman and Director
- Harlem Educational Activities Fund, Inc., Chairman
- Housing Committee of the Real Estate Board of New York, Inc., Director
No. of Portfolios for which Board Member Serves: 36
| ——————— |
| Philip L. Toia (75) Board Member (1997) |
Principal Occupation During Past 5Years:
- Private Investor
No. of Portfolios for which Board Member Serves: 25
38
| Anne Wexler (78) Board Member (1994) Principal Occupation During Past 5Years: |
- Chairman of the Wexler & Walker Public Policy Associates, consultants specializing in government relations and public affairs from January 1981 to present
| Other Board Memberships and Affiliations: |
- The Community Foundation for the National Capital Region, Director
- Member of the Council of Foreign Relations
- WETA-DC’s Public TV and Radio Station,Vice Chairman
| No. of Portfolios for which Board Member Serves: 50 |
| ——————— |
Once elected all Board Members serve for an indefinite term, but achieve Emeritus status upon reaching age 80.The address of the Board Members and Officers is in c/o The Dreyfus Corporation, 200 Park Avenue, NewYork, NewYork 10166.Additional information about the Board Members is available in the fund’s Statement of Additional Information which can be obtained from Dreyfus free of charge by calling this toll free number: 1-800-554-4611.
Sander Vanocur, Emeritus Board Member
The Fund 39
OFFICERS OF THE FUND (Unaudited)
J. DAVID OFFICER, President since December 2006.
Chief Operating Officer,Vice Chairman and a Director of the Manager, and an officer of 77 investment companies (comprised of 167 portfolios) managed by the Manager. He is 60 years old and has been an employee of the Manager since April 1998.
PHILLIP N. MAISANO, Executive Vice President since July 2007.
Chief Investment Officer,Vice Chair and a director of the Manager, and an officer of 77 investment companies (comprised of 167 portfolios) managed by the Manager. Mr. Maisano also is an officer and/or Board member of certain other investment management subsidiaries of The Bank of New York Mellon Corporation, each of which is an affiliate of the Manager. He is 61 years old and has been an employee of the Manager since November 2006. Prior to joining the Manager, Mr. Maisano served as Chairman and Chief Executive Officer of EACM Advisors, an affiliate of the Manager, since August 2004, and served as Chief Executive Officer of Evaluation Associates, a leading institutional investment consulting firm, from 1988 until 2004.
MICHAEL A. ROSENBERG, Vice President and Secretary since August 2005.
Assistant General Counsel of BNY Mellon, and an officer of 78 investment companies (comprised of 188 portfolios) managed by the Manager. He is 48 years old and has been an employee of the Manager since October 1991.
JAMES BITETTO, Vice President and Assistant Secretary since August 2005.
Senior Counsel of BNY Mellon and Secretary of the Manager, and an officer of 78 investment companies (comprised of 188 portfolios) managed by the Manager. He is 42 years old and has been an employee of the Manager since December 1996.
JONI LACKS CHARATAN, Vice President and Assistant Secretary since August 2005.
Senior Counsel of BNY Mellon, and an officer of 78 investment companies (comprised of 188 portfolios) managed by the Manager. She is 53 years old and has been an employee of the Manager since October 1988.
JOSEPH M. CHIOFFI, Vice President and Assistant Secretary since August 2005.
Senior Counsel of BNY Mellon, and an officer of 78 investment companies (comprised of 188 portfolios) managed by the Manager. He is 47 years old and has been an employee of the Manager since June 2000.
JANETTE E. FARRAGHER, Vice President and Assistant Secretary since August 2005.
Assistant General Counsel of BNY Mellon, and an officer of 78 investment companies (comprised of 188 portfolios) managed by the Manager. She is 45 years old and has been an employee of the Manager since February 1984.
JOHN B. HAMMALIAN, Vice President and Assistant Secretary since August 2005.
Managing Counsel of BNY Mellon, and an officer of 78 investment companies (comprised of 188 portfolios) managed by the Manager. He is 45 years old and has been an employee of the Manager since February 1991.
ROBERT R. MULLERY, Vice President and Assistant Secretary since August 2005.
Managing Counsel of BNY Mellon, and an officer of 78 investment companies (comprised of 188 portfolios) managed by the Manager. He is 56 years old and has been an employee of the Manager since May 1986.
40
JEFF PRUSNOFSKY, Vice President and Assistant Secretary since August 2005.
Managing Counsel of BNY Mellon, and an officer of 78 investment companies (comprised of 188 portfolios) managed by the Manager. He is 43 years old and has been an employee of the Manager since October 1990.
JAMES WINDELS, Treasurer since November 2001.
Director – Mutual Fund Accounting of the Manager, and an officer of 78 investment companies (comprised of 188 portfolios) managed by the Manager. He is 49 years old and has been an employee of the Manager since April 1985.
RICHARD CASSARO, Assistant Treasurer since September 2007.
Senior Accounting Manager – Money Market and Municipal Bond Funds of the Manager, and an officer of 78 investment companies (comprised of 188 portfolios) managed by the Manager. He is 49 years old and has been an employee of the Manager since September 1982.
GAVIN C. REILLY, Assistant Treasurer since December 2005.
Tax Manager of the Investment Accounting and Support Department of the Manager, and an officer of 78 investment companies (comprised of 188 portfolios) managed by the Manager. He is 40 years old and has been an employee of the Manager since April 1991.
ROBERT ROBOL, Assistant Treasurer since August 2005.
Senior Accounting Manager – Fixed Income Funds of the Manager, and an officer of 78 investment companies (comprised of 188 portfolios) managed by the Manager. He is 44 years old and has been an employee of the Manager since October 1988.
ROBERT SALVIOLO, Assistant Treasurer since May 2007.
Senior Accounting Manager – Equity Funds of the Manager, and an officer of 78 investment companies (comprised of 188 portfolios) managed by the Manager. He is 41 years old and has been an employee of the Manager since June 1989.
ROBERT SVAGNA, Assistant Treasurer since August 2002.
Senior Accounting Manager – Equity Funds of the Manager, and an officer of 78 investment companies (comprised of 188 portfolios) managed by the Manager. He is 41 years old and has been an employee of the Manager since November 1990.
JOSEPH W. CONNOLLY, Chief Compliance Officer since October 2004.
Chief Compliance Officer of the Manager and The Dreyfus Family of Funds (78 investment companies, comprised of 188 portfolios). From November 2001 through March 2004, Mr. Connolly was first Vice-President, Mutual Fund Servicing for Mellon Global Securities Services. In that capacity, Mr. Connolly was responsible for managing Mellon’s Custody, Fund Accounting and Fund Administration services to third-party mutual fund clients. He is 51 years old and has served in various capacities with the Manager since 1980, including manager of the firm’s Fund Accounting Department from 1997 through October 2001.
WILLIAM GERMENIS, Anti-Money Laundering Compliance Officer since October 2002.
Vice President and Anti-Money Laundering Compliance Officer of the Distributor, and the Anti-Money Laundering Compliance Officer of 74 investment companies (comprised of 184 portfolios) managed by the Manager. He is 38 years old and has been an employee of the Distributor since October 1998.
The Fund 41
Save time. Save paper. View your next shareholder report online as soon as it’s available. Log into www.dreyfus.com and sign up for Dreyfus eCommunications. It’s simple and only takes a few minutes.
The views expressed in this report reflect those of the portfolio manager only through the end of the period covered and do not necessarily represent the views of Dreyfus or any other person in the Dreyfus organization. Any such views are subject to change at any time based upon market or other conditions and Dreyfus disclaims any responsibility to update such views.These views may not be relied on as investment advice and, because investment decisions for a Dreyfus fund are based on numerous factors, may not be relied on as an indication of trading intent on behalf of any Dreyfus fund.
Not FDIC-Insured Not Bank-Guaranteed May Lose Value
| Contents | ||
| THE FUND | ||
| 2 | A Letter from the CEO | |
| 3 | Discussion of Fund Performance | |
| 6 | Fund Performance | |
| 8 | Understanding Your Fund’s Expenses | |
| 8 | Comparing Your Fund’s Expenses | |
| With Those of Other Funds | ||
| 9 | Statement of Investments | |
| 14 | Statement of Assets and Liabilities | |
| 15 | Statement of Operations | |
| 16 | Statement of Changes in Net Assets | |
| 18 | Financial Highlights | |
| 23 | Notes to Financial Statements | |
| 34 | Report of Independent Registered | |
| Public Accounting Firm | ||
| 35 | Important Tax Information | |
| 36 | Information About the Review and Approval | |
| of the Fund’s Management Agreement | ||
| 40 | Board Members Information | |
| 43 | Officers of the Fund | |
| FOR MORE INFORMATION | ||
| Back Cover | ||
| Dreyfus |
| International Growth Fund |
| The Fund |

A LETTER FROM THE CEO
Dear Shareholder:
We present to you this annual report for Dreyfus International Growth Fund, covering the 12-month period from November 1, 2007, through October 31, 2008.
These are difficult times for international investors. A credit crunch that began in the United States in 2007 has developed into a full-blown global financial crisis, recently resulting in the failure of several major financial institutions. Meanwhile, the global economic slowdown has gathered momentum, depressing investor sentiment, consumer confidence and business investment around the world.These factors undermined equity returns in most regions, including formerly high-flying emerging markets.
The depth and duration of the economic downturn will depend on how quickly the global financial system can be stabilized.We believe that government efforts in the United States and Europe meet several critical requirements for addressing today’s financial stresses, and we expect them to contribute to a more orderly deleveraging process. However, recuperation from the financial crisis is likely to take time. In the mean-time,we encourage you to keep in touch with your financial advisor and maintain a long-term and disciplined perspective to investing. Indeed, we already are seeing some positive signs, including a likely peak in global inflationary pressures, attractive valuations among fundamentally sound companies and a large pool of worldwide financial liquidity that could be deployed gradually as the economic cycle turns.
For information about how the fund performed during the reporting period, as well as market perspectives, we have provided a Discussion of Fund Performance given by the fund’s Portfolio Manager.
Thank you for your continued confidence and support.

2

DISCUSSION OF FUND PERFORMANCE
For the period of November 1, 2007, through October 31, 2008, as provided by William S. Patzer, Portfolio Manager
Fund and Market Performance Overview
For the 12-month period ended October 31,2008,Dreyfus International Growth Fund’s Class A shares produced a total return of –48.89%,Class B shares produced a total return of –49.29%,Class C shares produced a total return of –49.28%, Class I shares produced a total return of –48.82% and Class T shares produced a total return of –49.57% .1 For comparison purposes, the Morgan Stanley Capital International World ex U.S. Index produced a total return of –46.55% for the period.2
A global financial crisis and economic slowdown weighed heavily on investor sentiment, causing equity markets worldwide to plummet.Weak stock selection strategies in Japan, the United Kingdom, the consumer discretionary sector, the industrials sector and the materials sector were the primary causes of the fund’s lagging returns relative to its benchmark.
The Fund’s Investment Approach
The fund invests primarily in growth stocks of foreign companies. Normally, the fund invests at least 80% of its assets in stocks, including common stocks, preferred stocks and convertible securities, including those purchased in initial public offerings.
In choosing stocks, we seek to identify companies with positive growth characteristics and improving business momentum not yet recognized by the market.We look to add value through security selection and earnings growth and valuation (as measured by traditional value measures, such as price-to-earnings, price-to-cash flow and price-to-book value). Companies are then ranked within region, country and economic sector. Higher ranked companies are reviewed and an investment decision made using traditional fundamental techniques.
Equity Markets Tumbled Amid Financial Crisis
A worldwide economic downturn and turmoil in global credit markets were the primary drivers of poor international stock market performance over the reporting period.Tighter credit conditions, sluggish consumer
The Fund 3
| DISCUSSION OF FUND PERFORMANCE (continued) |
spending and higher energy and food costs took their toll on stock prices. Although aggressive efforts by several central banks and, later in the reporting period, falling commodity prices appeared at times to stabilize the financial markets, global economic conditions deteriorated. By the reporting period’s end, Asian and European equity markets had experienced their worst performance since the stock market crash of 1987, and U.S. consumer confidence posted its steepest decline on record.
Ineffective Japanese and British Stock Selections
This challenging environment was reflected in the fund’s lack of success in Japan and the United Kingdom, where disappointing security selections detracted from relative performance. In Japan the real estate investment company Kenedix fell as the housing market tumbled. Isuzu Motors dropped on weakened truck demand both domestically and in North America, while many Japanese exporters were hurt by an appreciating local currency. Disappointments among British energy and industrial firms constrained performance, as did exposure to British consumer discretionary stocks. In addition, Canadian miner Teck Cominco declined as metal prices fell, while intensifying competition hurt smartphones maker Research In Motion. Lack of exposure to the stronger performing Royal Bank of Canada also constrained the fund’s results, while Dutch commercial bank ING Groep sustained a substantial loss in the troubled financials sector.
The fund’s lack of exposure to benchmark componentVolkswagen produced the majority of relative underperformance in the consumer discretionary sector. Porsche quietly purchased 70% of the German automaker in October, a move that created a triple-digit spike inVolkswagen’s stock price. Falling commodity prices affected many materials stocks, including Australian smelter BHP Billiton and British steel manufacturer Xstrata. Road and rail stocks in the industrials sector felt the pinch of reduced demand, including Britain’s Stagecoach Group. Not investing in Japanese railways also hurt the fund’s performance as these firms benefited from a strong yen. Other poor performers included Finland’s Nokia, which was hurt by pricing pressures in the mobile handset market.
Despite the economic slowdown, a strong trading strategy in several European countries added to relative performance. Lack of exposure to Switzerland’s UBS and Belgium’s Fortis and Dexia buoyed the
4
fund’s financial component. An investment in Nestlé also contributed as the Swiss consumer-staple giant’s diversification, strong sales and ability to pass on increasing costs to consumers boosted its stock price. Swiss pharmaceutical giant Roche Holding benefited from strong product demand and a recent FDA approval.
Substantially reduced exposure to weaker financial firms secured a positive contribution to performance, while an overweighted allocation to the more defensive health care area also aided the fund. British pharmaceutical company AstraZeneca, surpassed earnings targets due in part to increased sales of its anti-cholesterol drug. In addition, the fund’s cash position proved beneficial.
Notable performance by individual stocks during the reporting period included Norwegian videoconferencing firmTandberg and Finnish paper producer UPM-Kymmene, both of which were purchased at opportune times, and Spanish utility Union Fenosa and Canadian software developer Cognos, which benefited from acquisitions.Advantageous selling of Italy’s gas and oil producer Eni also aided the fund’s return.
Potentially Attractive Opportunities
Although the global market downturn has been painful, we believe it has produced some potentially attractive opportunities in the financials sector.Therefore, we plan to be more aggressive in securing attractively valued stocks in which we have conviction.
November 17, 2008
| Investing in foreign companies involves special risks, including changes in currency rates, | ||
| political, economic and social instability, a lack of comprehensive company information, | ||
| differing auditing and legal standards and less market liquidity. An investment in this fund | ||
| should be considered only as a supplement to an overall investment program. | ||
| 1 | Total return includes reinvestment of dividends and any capital gains paid, and does not take into | |
| consideration the maximum initial sales charges in the case of Class A and Class T shares, or the | ||
| applicable contingent deferred sales charges imposed on redemptions in the case of Class B and | ||
| Class C shares. Had these charges been reflected, returns would have been lower. Past performance | ||
| is no guarantee of future results. Share price and investment return fluctuate such that upon | ||
| redemption, fund shares may be worth more or less than their original cost. | ||
| 2 | SOURCE: LIPPER INC. – Reflects reinvestment of net dividends and, where applicable, | |
| capital gain distributions.The Morgan Stanley Capital International (MSCI) World ex U.S. | ||
| Index is an unmanaged index of global stock market performance, excluding the United States, | ||
| consisting solely of equity securities.The index does not take into account charges, fees and other | ||
| expenses. |
The Fund 5
FUND PERFORMANCE
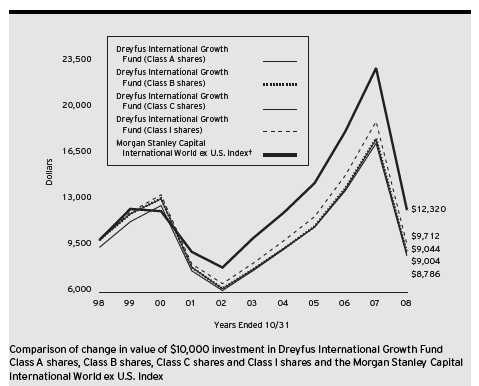
| † Source: Lipper Inc. |
| Past performance is not predictive of future performance. |
| The above graph compares a $10,000 investment made in Class A, Class B, Class C and Class I shares of Dreyfus |
| International Growth Fund on 10/31/98 to a $10,000 investment made in the Morgan Stanley Capital International |
| World ex U.S. Index (the “Index”) on that date. All dividends and capital gain distributions are reinvested. Performance |
| for Class T shares will vary from the performance of Class A, Class B, Class C and Class I shares shown above due to |
| differences in charges and expenses. |
| The fund’s performance shown in the line graph takes into account the maximum initial sales charge on Class A shares |
| and all other applicable fees and expenses.The Index is an unmanaged index of global stock market performance, |
| excluding the U.S., consisting solely of equity securities and includes net dividends reinvested. Unlike a mutual fund, the |
| Index is not subject to charges, fees and other expenses. Investors cannot invest directly in any index. Further information |
| relating to fund performance, including expense reimbursements, if applicable, is contained in the Financial Highlights |
| section of the prospectus and elsewhere in this report. |
6
| Average Annual Total Returns as of 10/31/08 | ||||||||
| Inception | ||||||||
| Date | 1 Year | 5 Years | 10 Years | |||||
| Class A shares | ||||||||
| with maximum sales charge (5.75%) | (51.83)% | 2.08% | (1.04)% | |||||
| without sales charge | (48.89)% | 3.29% | (0.46)% | |||||
| Class B shares | ||||||||
| with applicable redemption charge † | (51.31)% | 2.09% | (1.00)% | |||||
| without redemption | (49.29)% | 2.46% | (1.00)% | |||||
| Class C shares | ||||||||
| with applicable redemption charge †† | (49.79)% | 2.49% | (1.29)% | |||||
| without redemption | (49.28)% | 2.49% | (1.29)% | |||||
| Class I shares | (48.82)% | 3.37% | (0.29)% | |||||
| Class T shares | ||||||||
| with applicable sales charge (4.5%) | 3/1/00 | (51.85)% | 1.38% | (1.72)%††† | ||||
| without sales charge | 3/1/00 | (49.57)% | 2.32% | (1.26)%††† | ||||
| Past performance is not predictive of future performance.The fund’s performance shown in the graph and table does not | ||
| reflect the deduction of taxes that a shareholder would pay on fund distributions or the redemption of fund shares. | ||
| Performance for Class B shares assumes the conversion of Class B shares to Class A shares at the end of the sixth year | ||
| following the date of purchase. | ||
| † | The maximum contingent deferred sales charge for Class B shares is 4%. After six years Class B shares convert to | |
| Class A shares. | ||
| †† | The maximum contingent deferred sales charge for Class C shares is 1% for shares redeemed within one year of the | |
| date of purchase. | ||
| ††† | The total return performance figures presented for Class T shares of the fund reflect the performance of the fund’s | |
| Class A shares for periods prior to 3/1/00 (the inception date for Class T shares), adjusted to reflect the applicable | ||
| sales load for that class and the applicable distribution/servicing fees thereafter. | ||
The Fund 7
UNDERSTANDING YOUR FUND’S EXPENSES (Unaudited)
As a mutual fund investor, you pay ongoing expenses, such as management fees and other expenses. Using the information below, you can estimate how these expenses affect your investment and compare them with the expenses of other funds.You also may pay one-time transaction expenses, including sales charges (loads) and redemption fees, which are not shown in this section and would have resulted in higher total expenses. For more information, see your fund’s prospectus or talk to your financial adviser.
Review your fund’s expenses
The table below shows the expenses you would have paid on a $1,000 investment in Dreyfus International Growth Fund from May 1, 2008 to October 31, 2008. It also shows how much a $1,000 investment would be worth at the close of the period, assuming actual returns and expenses.
| Expenses and Value of a $1,000 Investment | ||||||||||
| assuming actual returns for the six months ended October 31, 2008 | ||||||||||
| Class A | Class B | Class C | Class I | Class T | ||||||
| Expenses paid per $1,000† | $ 6.31 | $ 9.72 | $ 9.49 | $ 5.48 | $ 13.55 | |||||
| Ending value (after expenses) | $568.20 | $566.10 | $566.00 | $568.40 | $563.00 | |||||
| COMPARING YOUR FUND’S EXPENSES |
| WITH THOSE OF OTHER FUNDS (Unaudited) |
Using the SEC’s method to compare expenses
The Securities and Exchange Commission (SEC) has established guidelines to help investors assess fund expenses. Per these guidelines, the table below shows your fund’s expenses based on a $1,000 investment, assuming a hypothetical 5% annualized return. You can use this information to compare the ongoing expenses (but not transaction expenses or total cost) of investing in the fund with those of other funds.All mutual fund shareholder reports will provide this information to help you make this comparison. Please note that you cannot use this information to estimate your actual ending account balance and expenses paid during the period.
| Expenses and Value of a $1,000 Investment | ||||||||||
| assuming a hypothetical 5% annualized return for the six months ended October 31, 2008 | ||||||||||
| Class A | Class B | Class C | Class I | Class T | ||||||
| Expenses paid per $1,000† | $ 8.11 | $ 12.50 | $ 12.19 | $ 7.05 | $ 17.41 | |||||
| Ending value (after expenses) | $1,017.09 | $1,012.72 | $1,013.02 | $1,018.15 | $1,007.79 | |||||
† Expenses are equal to the fund’s annualized expense ratio of 1.60% for Class A, 2.47% for Class B, 2.41% for Class C, 1.39% for Class I and 3.45% for ClassT, multiplied by the average account value over the period, multiplied by 184/366 (to reflect the one-half year period).
8
| STATEMENT OF INVESTMENTS |
| October 31, 2008 |
| Common Stocks—94.1% | Shares | Value ($) | ||
| Australia—4.6% | ||||
| BHP Billiton | 39,545 | 759,773 | ||
| Commonwealth Bank of Australia | 4,700 | 127,824 | ||
| Computershare | 21,244 | 119,098 | ||
| Sonic Healthcare | 16,330 | 149,155 | ||
| 1,155,850 | ||||
| Austria—.3% | ||||
| Raiffeisen International Bank Holding | 2,275 | 71,040 | ||
| Belgium—1.5% | ||||
| Colruyt | 1,650 | 370,130 | ||
| Canada—6.0% | ||||
| Barrick Gold | 6,000 | 137,194 | ||
| Bombardier, Cl. B | 57,800 | 222,990 | ||
| Canadian Natural Resources | 4,274 | 215,668 | ||
| EnCana | 9,200 | 467,366 | ||
| Ensign Energy Services | 10,190 | 131,127 | ||
| Fairfax Financial Holdings | 860 | 241,239 | ||
| Teck Cominco, Cl. B | 8,970 | 89,306 | ||
| 1,504,890 | ||||
| Finland—2.7% | ||||
| Nokia | 34,170 | 530,456 | ||
| UPM-Kymmene | 10,540 | 148,577 | ||
| 679,033 | ||||
| France—6.3% | ||||
| AXA | 6,423 | 121,569 | ||
| BNP Paribas | 2,782 | 198,565 | ||
| Cap Gemini | 3,735 | 119,344 | ||
| Casino Guichard Perrachon | 5,773 | 401,010 | ||
| France Telecom | 5,160 | 129,561 | ||
| GDF SUEZ | 8,480 | 374,558 | ||
| Total | 4,402 | 240,217 | ||
| 1,584,824 | ||||
| Germany—9.0% | ||||
| Adidas | 4,230 | 148,424 | ||
| BASF | 6,180 | 205,346 | ||
| Bayer | 6,900 | 379,566 | ||
| Deutsche Telekom | 11,711 | 172,846 |
The Fund 9
| STATEMENT OF INVESTMENTS (continued) |
| Common Stocks (continued) | Shares | Value ($) | ||
| Germany (continued) | ||||
| E.ON | 8,580 | 324,351 | ||
| Linde | 1,922 | 159,499 | ||
| MAN | 3,200 | 157,963 | ||
| Muenchener Rueckversicherungs | 840 | 110,167 | ||
| RWE | 1,990 | 164,331 | ||
| Salzgitter | 1,935 | 126,174 | ||
| Siemens | 3,060 | 181,200 | ||
| Software | 2,880 | 142,680 | ||
| 2,272,547 | ||||
| Hong Kong—1.6% | ||||
| Esprit Holdings | 55,700 | 312,696 | ||
| Hutchison Whampoa | 18,000 | 98,528 | ||
| 411,224 | ||||
| Ireland—1.6% | ||||
| CRH | 10,784 | 236,410 | ||
| Kerry Group, Cl. A | 7,801 | 176,981 | ||
| 413,391 | ||||
| Italy—1.9% | ||||
| ACEA | 11,363 | 147,724 | ||
| Prysmian | 16,978 | 204,492 | ||
| Snam Rete Gas | 23,930 | 120,872 | ||
| 473,088 | ||||
| Japan—20.1% | ||||
| Air Water | 15,000 | 140,049 | ||
| Canon | 8,600 | 295,939 | ||
| Chubu Electric Power | 5,300 | 139,542 | ||
| Daihatsu Motor | 31,000 | 230,272 | ||
| Daiichi Sankyo | 5,400 | 110,506 | ||
| Fujitsu | 40,000 | 159,181 | ||
| Hitachi | 31,000 | 143,958 | ||
| Honda Motor | 18,300 | 454,494 | ||
| INPEX | 23 | 133,748 | ||
| Isuzu Motors | 80,000 | 139,423 | ||
| JFE Holdings | 4,800 | 125,835 | ||
| KDDI | 50 | 298,718 | ||
| Konica Minolta Holdings | 18,500 | 120,429 |
10
| Common Stocks (continued) | Shares | Value ($) | ||
| Japan (continued) | ||||
| Marubeni | 42,000 | 166,489 | ||
| Mitsubishi | 12,800 | 212,454 | ||
| Mitsubishi Electric | 28,000 | 172,568 | ||
| Mitsubishi Tanabe Pharma | 16,000 | 166,357 | ||
| Mitsubishi UFJ Financial Group | 37,800 | 232,772 | ||
| Mitsumi Electric | 8,300 | 105,825 | ||
| Nintendo | 500 | 157,699 | ||
| Nippon Sheet Glass | 60,000 | 195,030 | ||
| Nippon Yusen | 38,700 | 185,520 | ||
| Panasonic | 13,000 | 202,143 | ||
| Shin-Etsu Chemical | 2,300 | 120,365 | ||
| Sumitomo Electric Industries | 21,700 | 174,329 | ||
| Tokio Marine Holdings | 5,400 | 168,439 | ||
| Tsumura & Co. | 9,300 | 237,628 | ||
| Yamaguchi Financial Group | 7,000 | 66,373 | ||
| 5,056,085 | ||||
| Netherlands—1.5% | ||||
| European Aeronautic Defence and Space | 9,320 | 153,712 | ||
| Imtech | 8,275 | 125,508 | ||
| Koninklijke BAM Groep | 10,076 | 88,869 | ||
| 368,089 | ||||
| Norway—1.3% | ||||
| Tandberg | 18,300 | 224,970 | ||
| Yara International | 4,900 | 101,306 | ||
| 326,276 | ||||
| Spain—1.6% | ||||
| Telefonica | 22,500 | 413,528 | ||
| Sweden—1.5% | ||||
| Alfa Laval | 21,600 | 152,397 | ||
| Nordea Bank | 28,200 | 221,675 | ||
| 374,072 | ||||
| Switzerland—11.0% | ||||
| ABB | 8,350 a | 107,642 | ||
| Credit Suisse Group | 5,430 | 203,303 | ||
| Lonza Group | 1,619 | 134,021 | ||
| Nestle | 30,520 | 1,184,272 |
The Fund 11
| STATEMENT OF INVESTMENTS (continued) |
| Common Stocks (continued) | Shares | Value ($) | ||
| Switzerland (continued) | ||||
| Novartis | 9,038 | 455,134 | ||
| Roche Holding | 4,535 | 691,375 | ||
| 2,775,747 | ||||
| United Kingdom—19.0% | ||||
| AstraZeneca | 18,600 | 787,260 | ||
| Aveva Group | 10,862 | 137,748 | ||
| Barclays | 52,870 | 152,219 | ||
| British American Tobacco | 12,570 | 343,901 | ||
| Charter International | 16,660 | 108,587 | ||
| Cookson Group | 17,747 | 57,265 | ||
| Dana Petroleum | 7,025 a | 112,831 | ||
| HSBC Holdings | 13,190 | 161,752 | ||
| IG Group | 17,620 | 81,526 | ||
| Imperial Tobacco Group | 26,070 | 698,562 | ||
| Regus | 96,470 | 72,581 | ||
| Rexam | 25,480 | 153,056 | ||
| Royal Dutch Shell, Cl. B | 6,900 | 184,224 | ||
| Scottish & Southern Energy | 11,670 | 228,002 | ||
| Stagecoach Group | 50,570 | 150,562 | ||
| Standard Chartered | 6,420 | 104,870 | ||
| Standard Life | 38,860 | 149,312 | ||
| Tesco | 92,420 | 504,809 | ||
| Thomas Cook Group | 36,270 | 98,063 | ||
| WPP Group | 62,270 | 375,803 | ||
| Xstrata | 6,910 | 117,322 | ||
| 4,780,255 | ||||
| United States—2.6% | ||||
| iShares MSCI EAFE Index Fund | 14,440 | 643,591 | ||
| Total Common Stocks | ||||
| (cost $34,143,047) | 23,673,660 | |||
| Preferred Stocks—1.3% | ||||
| Germany | ||||
| Fresenius | ||||
| (cost $264,697) | 4,930 | 314,177 | ||
12
| Other Investment—.8% | Shares | Value ($) | ||
| Registered Investment Company; | ||||
| Dreyfus Institutional Preferred | ||||
| Plus Money Market Fund | ||||
| (cost $200,000) | 200,000 b | 200,000 | ||
| Total Investments (cost $34,607,744) | 96.2% | 24,187,837 | ||
| Cash and Receivables (Net) | 3.8% | 943,550 | ||
| Net Assets | 100.0% | 25,131,387 | ||
| a | Non-income producing security. | |
| b | Investment in affiliated money market mutual fund. |
| Portfolio Summary (Unaudited)† | ||||||
| Value (%) | Value (%) | |||||
| Health Care | 13.5 | Utilities | 6.0 | |||
| Consumer Staples | 13.2 | Energy | 5.9 | |||
| Industrial | 11.9 | Telecommunication Services | 4.0 | |||
| Materials | 10.4 | Exchange Traded Funds | 2.6 | |||
| Financial | 9.6 | Electrical & Electronics | 1.0 | |||
| Consumer Discretionary | 9.3 | Money Market Investment | .8 | |||
| Information Technology | 8.0 | 96.2 | ||||
| † Based on net assets. |
| See notes to financial statements. |
The Fund 13
| STATEMENT OF ASSETS AND LIABILITIES |
| October 31, 2008 |
| Cost | Value | |||||||||||
| Assets ($): | ||||||||||||
| Investments in securities—See Statement of Investments: | ||||||||||||
| Unaffiliated issuers | 34,407,744 23,987,837 | |||||||||||
| Affiliated issuers | 200,000 | 200,000 | ||||||||||
| Cash | 5,820 | |||||||||||
| Cash denominated in foreign currencies | 140,655 | 137,282 | ||||||||||
| Receivable for investment securities sold | 1,053,843 | |||||||||||
| Dividends and interest receivable | 815,451 | |||||||||||
| Unrealized appreciation on forward | ||||||||||||
| currency exchange contracts—Note 4 | 1,987 | |||||||||||
| Receivable for shares of Common Stock subscribed | 293 | |||||||||||
| Prepaid expenses | 14,458 | |||||||||||
| 26,216,971 | ||||||||||||
| Liabilities ($): | ||||||||||||
| Due to The Dreyfus Corporation and affiliates—Note 3(c) | 54,022 | |||||||||||
| Payable for investment securities purchased | 982,922 | |||||||||||
| Payable for shares of Common Stock redeemed | 7,065 | |||||||||||
| Unrealized depreciation on forward | ||||||||||||
| currency exchange contracts—Note 4 | 620 | |||||||||||
| Accrued expenses | 40,955 | |||||||||||
| 1,085,584 | ||||||||||||
| Net Assets ($) | 25,131,387 | |||||||||||
| Composition of Net Assets ($): | ||||||||||||
| Paid-in capital | 40,820,744 | |||||||||||
| Accumulated undistributed investment income—net | 218,188 | |||||||||||
| Accumulated net realized gain (loss) on investments | (5,476,812) | |||||||||||
| Accumulated net unrealized appreciation (depreciation) on | ||||||||||||
| investments and foreign currency transactions | (10,430,733) | |||||||||||
| Net Assets ($) | 25,131,387 | |||||||||||
| Net Asset Value Per Share | ||||||||||||
| Class A | Class B | Class C | Class I | Class T | ||||||||
| Net Assets ($) | 22,471,810 | 1,121,876 | 1,388,294 | 122,159 | 27,248 | |||||||
| Shares Outstanding | 2,821,462 | 153,322 | 199,785 | 15,003 | 3,549 | |||||||
| Net Asset Value Per Share ($) | 7.96 | 7.32 | 6.95 | 8.14 | 7.68 | |||||||
See notes to financial statements.
14
| STATEMENT OF OPERATIONS |
| Year Ended October 31, 2008 |
| Investment Income ($): | ||
| Income: | ||
| Cash dividends (net of $123,892 foreign taxes withheld at source): | ||
| Unaffiliated issuers | 1,165,006 | |
| Affiliated issuers | 15,807 | |
| Interest | 17,230 | |
| Total Income | 1,198,043 | |
| Expenses: | ||
| Management fee—Note 3(a) | 330,041 | |
| Shareholder servicing costs—Note 3(c) | 194,423 | |
| Custodian fees—Note 3(c) | 96,122 | |
| Registration fees | 69,046 | |
| Professional fees | 37,665 | |
| Distribution fees—Note 3(b) | 36,647 | |
| Prospectus and shareholders’ reports | 18,489 | |
| Directors’ fees and expenses—Note 3(d) | 8,805 | |
| Miscellaneous | 24,804 | |
| Total Expenses | 816,042 | |
| Less—reduction in management fee due to undertaking—Note 3(a) | (76,198) | |
| Less—reduction in fees due to earnings credits—Note 1(c) | (6,589) | |
| Net Expenses | 733,255 | |
| Investment Income—Net | 464,788 | |
| Realized and Unrealized Gain (Loss) on Investments—Note 4 ($): | ||
| Net realized gain (loss) on investments and foreign currency transactions | (372,472) | |
| Net realized gain (loss) on financial futures | (237,932) | |
| Net realized gain (loss) on forward currency exchange contracts | (9,536) | |
| Net Realized Gain (Loss) | (619,940) | |
| Net unrealized appreciation (depreciation) on investments and | ||
| foreign currency transactions [including ($18,917) net | ||
| unrealized (depreciation) on financial futures] | (25,338,327) | |
| Net Realized and Unrealized Gain (Loss) on Investments | (25,958,267) | |
| Net (Decrease) in Net Assets Resulting from Operations | (25,493,479) | |
| See notes to financial statements. | ||
The Fund 15
STATEMENT OF CHANGES IN NET ASSETS
| Year Ended October 31, | ||||
| 2008 | 2007a | |||
| Operations ($): | ||||
| Investment income—net | 464,788 | 265,898 | ||
| Net realized gain (loss) on investments | (619,940) | 6,005,660 | ||
| Net unrealized appreciation | ||||
| (depreciation) on investments | (25,338,327) | 5,475,974 | ||
| Net Increase (Decrease) in Net Assets | ||||
| Resulting from Operations | (25,493,479) | 11,747,532 | ||
| Dividends to Shareholders from ($): | ||||
| Investment income—net: | ||||
| Class A Shares | (432,288) | (233,857) | ||
| Class B Shares | (9,698) | — | ||
| Class C Shares | (18,694) | — | ||
| Class I Shares | (3,354) | (1,216) | ||
| Class T Shares | (19) | (67) | ||
| Total Dividends | (464,053) | (235,140) | ||
| Capital Stock Transactions ($): | ||||
| Net proceeds from shares sold: | ||||
| Class A Shares | 2,351,926 | 5,187,244 | ||
| Class B Shares | 511,652 | 738,289 | ||
| Class C Shares | 718,401 | 1,326,086 | ||
| Class I Shares | 77,750 | 827,170 | ||
| Class T Shares | 32,832 | 13,981 | ||
| Dividends reinvested: | ||||
| Class A Shares | 413,207 | 225,147 | ||
| Class B Shares | 8,574 | — | ||
| Class C Shares | 13,251 | — | ||
| Class I Shares | 3,354 | 1,216 | ||
| Class T Shares | 19 | 67 | ||
| Cost of shares redeemed: | ||||
| Class A Shares | (5,974,358) | (6,226,155) | ||
| Class B Shares | (1,351,173) | (928,231) | ||
| Class C Shares | (881,798) | (549,263) | ||
| Class I Shares | (124,561) | (767,808) | ||
| Class T Shares | (13,572) | (25,057) | ||
| Increase (Decrease) in Net Assets | ||||
| from Capital Stock Transactions | (4,214,496) | (177,314) | ||
| Total Increase (Decrease) in Net Assets | (30,172,028) | 11,335,078 | ||
| Net Assets ($): | ||||
| Beginning of Period | 55,303,415 | 43,968,337 | ||
| End of Period | 25,131,387 | 55,303,415 | ||
| Undistributed investment income—net | 218,188 | 251,005 | ||
16
| Year Ended October 31, | ||||
| 2008 | 2007a | |||
| Capital Share Transactions: | ||||
| Class Ab | ||||
| Shares sold | 171,676 | 373,575 | ||
| Shares issued for dividends reinvested | 29,304 | 17,279 | ||
| Shares redeemed | (473,404) | (450,659) | ||
| Net Increase (Decrease) in Shares Outstanding | (272,424) | (59,805) | ||
| Class Bb | ||||
| Shares sold | 39,786 | 56,560 | ||
| Shares issued for dividends reinvested | 644 | — | ||
| Shares redeemed | (110,209) | (72,890) | ||
| Net Increase (Decrease) in Shares Outstanding | (69,779) | (16,330) | ||
| Class C | ||||
| Shares sold | 58,701 | 108,575 | ||
| Shares issued for dividends reinvested | 1,061 | — | ||
| Shares redeemed | (82,894) | (45,492) | ||
| Net Increase (Decrease) in Shares Outstanding | (23,132) | 63,083 | ||
| Class I | ||||
| Shares sold | 5,301 | 60,746 | ||
| Shares issued for dividends reinvested | 234 | 91 | ||
| Shares redeemed | (8,858) | (54,218) | ||
| Net Increase (Decrease) in Shares Outstanding | (3,323) | 6,619 | ||
| Class T | ||||
| Shares sold | 2,639 | 1,056 | ||
| Shares issued for dividends reinvested | 2 | 5 | ||
| Shares redeemed | (1,091) | (1,936) | ||
| Net Increase (Decrease) in Shares Outstanding | 1,550 | (875) | ||
| a | Effective June 1, 2007, Class R shares were redesignated as Class I shares. | |
| b | During the period ended October 31, 2008, 25,579 Class B shares representing $327,555 were automatically | |
| converted to 23,600 Class A shares and during the period ended October 31, 2007, 31,581 Class B shares | ||
| representing $403,866 were automatically converted to 29,194 Class A shares. | ||
| See notes to financial statements. | ||
The Fund 17
FINANCIAL HIGHLIGHTS
The following tables describe the performance for each share class for the fiscal periods indicated.All information (except portfolio turnover rate) reflects financial results for a single fund share.Total return shows how much your investment in the fund would have increased (or decreased) during each period, assuming you had reinvested all dividends and distributions.These figures have been derived from the fund’s financial statements.
| Year Ended October 31, | ||||||||||
| Class A Shares | 2008 | 2007 | 2006 | 2005 | 2004 | |||||
| Per Share Data ($): | ||||||||||
| Net asset value, beginning of period | 15.73 | 12.46 | 9.94 | 8.57 | 7.28 | |||||
| Investment Operations: | ||||||||||
| Investment income—neta | .15 | .09 | .07 | .07 | .09 | |||||
| Net realized and unrealized | ||||||||||
| gain (loss) on investments | (7.78) | 3.26 | 2.53 | 1.48 | 1.42 | |||||
| Total from Investment Operations | (7.63) | 3.35 | 2.60 | 1.55 | 1.51 | |||||
| Distributions: | ||||||||||
| Dividends from investment income—net | (.14) | (.08) | (.08) | (.18) | (.22) | |||||
| Net asset value, end of period | 7.96 | 15.73 | 12.46 | 9.94 | 8.57 | |||||
| Total Return (%)b | (48.89) | 26.98 | 26.27 | 18.18 | 21.40 | |||||
| Ratios/Supplemental Data (%): | ||||||||||
| Ratio of total expenses | ||||||||||
| to average net assets | 1.76 | 1.50 | 1.58 | 1.72 | 1.95 | |||||
| Ratio of net expenses | ||||||||||
| to average net assets | 1.57 | 1.46 | 1.55 | 1.39 | 1.95c | |||||
| Ratio of net investment income | ||||||||||
| to average net assets | 1.15 | .62 | .60 | .74 | 1.08 | |||||
| Portfolio Turnover Rate | 118.44 | 83.37 | 80.76 | 64.27 | 174.49 | |||||
| Net Assets, end of period ($ x 1,000) | 22,472 | 48,674 | 39,284 | 34,063 | 45,440 | |||||
| a | Based on average shares outstanding at each month end. | |
| b | Exclusive of sales charge. | |
| c | Expense waivers and/or reimbursements amounted to less than .01%. | |
| See notes to financial statements. | ||
18
| Year Ended October 31, | ||||||||||
| Class B Shares | 2008 | 2007 | 2006 | 2005 | 2004 | |||||
| Per Share Data ($): | ||||||||||
| Net asset value, beginning of period | 14.48 | 11.49 | 9.19 | 7.94 | 6.75 | |||||
| Investment Operations: | ||||||||||
| Investment income (loss)—neta | .03 | (.03) | (.02) | .00b | .02 | |||||
| Net realized and unrealized | ||||||||||
| gain (loss) on investments | (7.15) | 3.02 | 2.33 | 1.37 | 1.33 | |||||
| Total from Investment Operations | (7.12) | 2.99 | 2.31 | 1.37 | 1.35 | |||||
| Distributions: | ||||||||||
| Dividends from investment income—net | (.04) | — | (.01) | (.12) | (.16) | |||||
| Net asset value, end of period | 7.32 | 14.48 | 11.49 | 9.19 | 7.94 | |||||
| Total Return (%)c | (49.29) | 26.02 | 25.19 | 17.32 | 20.30 | |||||
| Ratios/Supplemental Data (%): | ||||||||||
| Ratio of total expenses | ||||||||||
| to average net assets | 2.61 | 2.32 | 2.39 | 2.53 | 2.78 | |||||
| Ratio of net expenses | ||||||||||
| to average net assets | 2.42 | 2.28 | 2.37 | 2.19 | 2.78d | |||||
| Ratio of net investment income | ||||||||||
| (loss) to average net assets | .26 | (.21) | (.22) | .04 | .24 | |||||
| Portfolio Turnover Rate | 118.44 | 83.37 | 80.76 | 64.27 | 174.49 | |||||
| Net Assets, end of period ($ x 1,000) | 1,122 | 3,230 | 2,752 | 2,419 | 2,168 | |||||
| a | Based on average shares outstanding at each month end. | |
| b | Amount represents less than $.01 per share. | |
| c | Exclusive of sales charge. | |
| d | Expense waivers and/or reimbursements amounted to less than .01%. | |
| See notes to financial statements. | ||
The Fund 19
| FINANCIAL HIGHLIGHTS (continued) |
| Year Ended October 31, | ||||||||||
| Class C Shares | 2008 | 2007 | 2006 | 2005 | 2004 | |||||
| Per Share Data ($): | ||||||||||
| Net asset value, beginning of period | 13.79 | 10.94 | 8.77 | 7.59 | 6.47 | |||||
| Investment Operations: | ||||||||||
| Investment income (loss)—neta | .04 | (.02) | (.02) | .01 | .02 | |||||
| Net realized and unrealized | ||||||||||
| gain (loss) on investments | (6.80) | 2.87 | 2.23 | 1.30 | 1.27 | |||||
| Total from Investment Operations | (6.76) | 2.85 | 2.21 | 1.31 | 1.29 | |||||
| Distributions: | ||||||||||
| Dividends from investment income—net | (.08) | — | (.04) | (.13) | (.17) | |||||
| Net asset value, end of period | 6.95 | 13.79 | 10.94 | 8.77 | 7.59 | |||||
| Total Return (%)b | (49.28) | 26.05 | 25.24 | 17.35 | 20.33 | |||||
| Ratios/Supplemental Data (%): | ||||||||||
| Ratio of total expenses | ||||||||||
| to average net assets | 2.57 | 2.28 | 2.38 | 2.48 | 2.77 | |||||
| Ratio of net expenses | ||||||||||
| to average net assets | 2.38 | 2.24 | 2.35 | 2.14 | 2.77c | |||||
| Ratio of net investment income | ||||||||||
| (loss) to average net assets | .34 | (.16) | (.18) | .11 | .23 | |||||
| Portfolio Turnover Rate | 118.44 | 83.37 | 80.76 | 64.27 | 174.49 | |||||
| Net Assets, end of period ($ x 1,000) | 1,388 | 3,074 | 1,749 | 1,210 | 840 | |||||
| a | Based on average shares outstanding at each month end. | |
| b | Exclusive of sales charge. | |
| c | Expense waivers and/or reimbursements amounted to less than .01%. | |
| See notes to financial statements. | ||
20
| Year Ended October 31, | ||||||||||
| Class I Shares | 2008 | 2007a | 2006 | 2005 | 2004 | |||||
| Per Share Data ($): | ||||||||||
| Net asset value, beginning of period | 16.08 | 12.72 | 10.15 | 8.72 | 7.40 | |||||
| Investment Operations: | ||||||||||
| Investment income—netb | .21 | .23 | .11 | .09 | .06 | |||||
| Net realized and unrealized | ||||||||||
| gain (loss) on investments | (7.99) | 3.23 | 2.57 | 1.49 | 1.45 | |||||
| Total from Investment Operations | (7.78) | 3.46 | 2.68 | 1.58 | 1.51 | |||||
| Distributions: | ||||||||||
| Dividends from investment income—net | (.16) | (.10) | (.11) | (.15) | (.19) | |||||
| Net asset value, end of period | 8.14 | 16.08 | 12.72 | 10.15 | 8.72 | |||||
| Total Return (%) | (48.82) | 27.40 | 26.57 | 18.31 | 20.89 | |||||
| Ratios/Supplemental Data (%): | ||||||||||
| Ratio of total expenses | ||||||||||
| to average net assets | 1.55 | 1.23 | 1.33 | 1.63 | 2.24 | |||||
| Ratio of net expenses | ||||||||||
| to average net assets | 1.36 | 1.21 | 1.31 | 1.28 | 2.24c | |||||
| Ratio of net investment income | ||||||||||
| to average net assets | 1.52 | 1.44 | .91 | .98 | .69 | |||||
| Portfolio Turnover Rate | 118.44 | 83.37 | 80.76 | 64.27 | 174.49 | |||||
| Net Assets, end of period ($ x 1,000) | 122 | 295 | 149 | 47 | 19 | |||||
| a | Effective June 1, 2007, Class R shares were redesignated as Class I shares. | |
| b | Based on average shares outstanding at each month end. | |
| c | Expense waivers and/or reimbursements amounted to less than .01%. | |
| See notes to financial statements. | ||
The Fund 21
| FINANCIAL HIGHLIGHTS (continued) |
| Year Ended October 31, | ||||||||||
| Class T Shares | 2008 | 2007 | 2006 | 2005 | 2004 | |||||
| Per Share Data ($): | ||||||||||
| Net asset value, beginning of period | 15.24 | 12.12 | 9.68 | 8.39 | 7.17 | |||||
| Investment Operations: | ||||||||||
| Investment income (loss)—neta | (.03) | .02 | .03 | .08 | (.03) | |||||
| Net realized and unrealized | ||||||||||
| gain (loss) on investments | (7.52) | 3.12 | 2.45 | 1.40 | 1.39 | |||||
| Total from Investment Operations | (7.55) | 3.14 | 2.48 | 1.48 | 1.36 | |||||
| Distributions: | ||||||||||
| Dividends from investment income—net | (.01) | (.02) | (.04) | (.19) | (.14) | |||||
| Net asset value, end of period | 7.68 | 15.24 | 12.12 | 9.68 | 8.39 | |||||
| Total Return (%)b | (49.57) | 25.98 | 25.65 | 17.87 | 19.22 | |||||
| Ratios/Supplemental Data (%): | ||||||||||
| Ratio of total expenses | ||||||||||
| to average net assets | 3.26 | 2.08 | 2.30 | 2.13 | 3.75 | |||||
| Ratio of net expenses | ||||||||||
| to average net assets | 3.07 | 2.05 | 1.98 | 1.78 | 3.75c | |||||
| Ratio of net investment income | ||||||||||
| (loss) to average net assets | (.24) | .17 | .23 | .77 | (.44) | |||||
| Portfolio Turnover Rate | 118.44 | 83.37 | 80.76 | 64.27 | 174.49 | |||||
| Net Assets, end of period ($ x 1,000) | 27 | 30 | 35 | 26 | 3 | |||||
| a | Based on average shares outstanding at each month end. | |
| b | Exclusive of sales charge. | |
| c | Expense waivers and/or reimbursements amounted to less than .01%. | |
| See notes to financial statements. | ||
22
NOTES TO FINANCIAL STATEMENTS
NOTE 1—Significant Accounting Policies:
Dreyfus International Growth Fund (the “fund”) is a separate non-diversified series of Dreyfus Premier Investment Funds, Inc. (the “Company”) which is registered under the Investment Company Act of 1940, as amended (the “Act”), as an open-end management investment company and operates as a series company currently offering nine series, including the fund.The fund’s investment objective is to maximize capital growth. The Dreyfus Corporation (the “Manager” or “Dreyfus”), a wholly-owned subsidiary ofThe Bank of NewYork Mellon Corporation (“BNY Mellon”), serves as the fund’s investment adviser.
The Board of Directors approved, effective March 31, 2008, a change in the Company name from “Dreyfus Premier International Funds, Inc.” to “Dreyfus Premier Investment Funds, Inc.”
At a meeting of the fund’s Board of Directors held on July 10, 2008, the Board approved, effective December 1, 2008, a proposal to change the name of the fund from “Dreyfus Premier International Growth Fund” to “Dreyfus International Growth Fund”.
Effective July 1, 2008, BNY Mellon has reorganized and consolidated a number of its banking and trust company subsidiaries. As a result of the reorganization, any services previously provided to the fund by Mellon Bank, N.A. or Mellon Trust of New England, N.A. are now provided by The Bank of New York, which has changed its name to The Bank of New York Mellon.
MBSC Securities Corporation (the “Distributor”), a wholly-owned subsidiary of Dreyfus, is the distributor of the fund’s shares.The fund is authorized to issue 300 million shares of $.001 par value Common Stock in each of the following classes of shares: Class A, Class B, Class C, Class I and Class T. Class A and Class T shares are subject to a sales charge imposed at the time of purchase. Class B shares are subject to a contingent deferred sales charge (“CDSC”) imposed on Class B share redemptions made within six years of purchase and automatically convert to Class A shares after six years. The fund does not offer Class B shares, except in connection with dividend reinvestment and
The Fund 23
| NOTES TO FINANCIAL STATEMENTS (continued) |
permitted exchanges of Class B shares. Class C shares are subject to a CDSC imposed on Class C shares redeemed within one year of purchase. Class I shares are sold at net asset value per share only to institutional investors. Other differences between the classes include the services offered to and the expenses borne by each class, the allocation of certain transfer agency costs and certain voting rights. Income, expenses (other than expenses attributable to a specific class), and realized and unrealized gains or losses on investments are allocated to each class of shares based on its relative net assets.
The Company accounts separately for the assets, liabilities and operations of each series. Expenses directly attributable to each series are charged to that series’ operations; expenses which are applicable to all series are allocated among them on a pro rata basis.
The fund’s financial statements are prepared in accordance with U.S. generally accepted accounting principles, which may require the use of management estimates and assumptions. Actual results could differ from those estimates.
The fund enters into contracts that contain a variety of indemnifications. The fund’s maximum exposure under these arrangements is unknown.The fund does not anticipate recognizing any loss related to these arrangements.
(a) Portfolio valuation: Investments in securities are valued at the last sales price on the securities exchange or national securities market on which such securities are primarily traded. Securities listed on the National Market System for which market quotations are available are valued at the official closing price or, if there is no official closing price that day, at the last sales price. Securities not listed on an exchange or the national securities market, or securities for which there were no transactions, are valued at the average of the most recent bid and asked prices, except for open short positions, where the asked price is used for valuation purposes. Bid price is used when no asked price is available. Registered investment companies that are not traded on an exchange are valued at their net asset value.When market quotations or
24
official closing prices are not readily available, or are determined not to reflect accurately fair value, such as when the value of a security has been significantly affected by events after the close of the exchange or market on which the security is principally traded (for example, a foreign exchange or market), but before the fund calculates its net asset value, the fund may value these investments at fair value as determined in accordance with the procedures approved by the Board of Directors. Fair valuing of securities may be determined with the assistance of a pricing service using calculations based on indices of domestic securities and other appropriate indicators, such as prices of relevant ADRs and futures contracts. For other securities that are fair valued by the Board of Directors, certain factors may be considered such as: fundamental analytical data, the nature and duration of restrictions on disposition, an evaluation of the forces that influence the market in which the securities are purchased and sold, and public trading in similar securities of the issuer or comparable issuers. Financial futures are valued at the last sales price. Investments denominated in foreign currencies are translated to U.S. dollars at the prevailing rates of exchange. Forward currency exchange contracts are valued at the forward rate.
The Financial Accounting Standards Board (“FASB”) released Statement of Financial Accounting Standards No. 157 “Fair Value Measurements” (“FAS 157”). FAS 157 establishes an authoritative definition of fair value, sets out a framework for measuring fair value, and requires additional disclosures about fair-value measurements. The application of FAS 157 is required for fiscal years beginning after November 15, 2007 and interim periods within those fiscal years. Management does not believe that the application of this standard will have a material impact on the financial statements of the fund.
(b) Foreign currency transactions: The fund does not isolate that portion of the results of operations resulting from changes in foreign exchange rates on investments from the fluctuations arising from changes in market prices of securities held. Such fluctuations are included with the net realized and unrealized gain or loss on investments.
The Fund 25
| NOTES TO FINANCIAL STATEMENTS (continued) |
Net realized foreign exchange gains or losses arise from sales and maturities of short-term securities, sales of foreign currencies, currency gains or losses realized on securities transactions and the difference between the amounts of dividends, interest, and foreign withholding taxes recorded on the fund’s books and the U.S. dollar equivalent of the amounts actually received or paid. Net unrealized foreign exchange gains and losses arise from changes in the value of assets and liabilities other than investments in securities, resulting from changes in exchange rates. Such gains and losses are included with net realized and unrealized gain or loss on investments.
(c) Securities transactions and investment income: Securities transactions are recorded on a trade date basis. Realized gains and losses from securities transactions are recorded on the identified cost basis. Dividend income is recognized on the ex-dividend date and interest income, including, where applicable, accretion of discount and amortization of premium on investments, is recognized on the accrual basis.
The fund has arrangements with the custodian and cash management banks whereby the fund may receive earnings credits when positive cash balances are maintained, which are used to offset custody and cash management fees. For financial reporting purposes, the fund includes net earnings credits as an expense offset in the Statement of Operations.
Investing in foreign markets may involve special risks and considerations not typically associated with investing in the U.S. These risks include revaluation of currencies, high rates of inflation, repatriation restrictions on income and capital, and adverse political and economic developments. Moreover, securities issued in these markets may be less liquid, subject to government ownership controls and delayed settlements, and their prices may be more volatile than those of comparable securities in the U.S.
(d) Affiliated issuers: Investments in other investment companies advised by the Manager are defined as “affiliated” in the Act.
26
(e) Dividends to shareholders: Dividends are recorded on the ex-dividend date. Dividends from investment income-net and dividends from net realized capital gains, if any, are normally declared and paid annually, but the fund may make distributions on a more frequent basis to comply with the distribution requirements of the Internal Revenue Code of 1986, as amended (the “Code”).To the extent that net realized capital gains can be offset by capital loss carryovers, it is the policy of the fund not to distribute such gains. Income and capital gain distributions are determined in accordance with income tax regulations, which may differ from U.S. generally accepted accounting principles.
(f) Federal income taxes: It is the policy of the fund to continue to qualify as a regulated investment company, if such qualification is in the best interests of its shareholders, by complying with the applicable provisions of the Code, and to make distributions of taxable income sufficient to relieve it from substantially all federal income and excise taxes.
The fund adopted FASB Interpretation No. 48 “Accounting for Uncertainty in Income Taxes” (“FIN 48”). FIN 48 provides guidance for how uncertain tax positions should be recognized, measured, presented and disclosed in the financial statements. FIN 48 requires the evaluation of tax positions taken or expected to be taken in the course of preparing the fund’s tax returns to determine whether the tax positions are “more-likely-than-not” of being sustained by the applicable tax authority. Liability for tax positions not deemed to meet the more-likely-than-not threshold would be recorded as a tax expense in the current year.The adoption of FIN 48 had no impact on the operations of the fund for the period ended October 31, 2008.
As of and during the period ended October 31, 2008, the fund did not have any liabilities for any unrecognized tax positions. The fund recognizes interest and penalties, if any, related to unrecognized tax positions as income tax expense in the Statement of Operations. During the period, the fund did not incur any interest or penalties.
The Fund 27
| NOTES TO FINANCIAL STATEMENTS (continued) |
Each of the tax years in the four-year period ended October 31, 2008 remains subject to examination by the Internal Revenue Service and state taxing authorities.
At October 31, 2008, the components of accumulated earnings on a tax basis were as follows: undistributed ordinary income $218,188, accumulated capital losses $4,871,235 and unrealized depreciation $11,036,310.
The accumulated capital loss carryover is available for federal income tax purposes to be applied against future net securities profits, if any, realized subsequent to October 31, 2008. If not applied, $246,712 of the carryover expires in fiscal 2009, $3,503,697 expires in fiscal 2010, $1,048,532 expires in fiscal 2011 and $72,294 expires in fiscal 2016.
The tax character of distributions paid to shareholders during the fiscal periods ended October 31, 2008 and October 31, 2007, was as follows: ordinary income $464,053 and $235,140, respectively.
During the period ended October 31, 2008, as a result of permanent book to tax differences, primarily due to the tax treatment for foreign currency gains and losses, the fund decreased accumulated undistributed investment income-net by $33,552 and increased accumulated net realized gain (loss) on investments by the same amount. Net assets and net asset value per share were not affected by this reclassification.
NOTE 2—Bank Lines of Credit:
Prior to May 1, 2008, the fund had the ability to borrow up to $10 million for leveraging purposes under a short-term unsecured line of credit and participated with other Dreyfus-managed funds in a $100 million unsecured line of credit. Effective May 1, 2008, the fund participates with other Dreyfus-managed funds in a $300 million unsecured line of credit primarily to be utilized for temporary or emergency purposes, including the financing of redemptions.The terms of the line of credit agreement limit the amount of individual fund borrowings. Interest is charged to the fund based on prevailing market rates in effect at the time
28
of borrowing. Effective October 15, 2008, in connection therewith, the fund has agreed to pay commitment fees on its pro rata portion of the unsecured line of credit. During the period ended October 31, 2008, the fund did not borrow under the lines of credit.
NOTE 3—Management Fee and Other Transactions With Affiliates:
(a) Pursuant to a Management Agreement (“Agreement”) with the Manager, the management fee is computed at the annual rate of .75% of the value of the fund’s average daily net assets and is payable monthly. The Manager had undertaken from November 1, 2007 to September 13, 2008 to waive 25% of the fund’s management fee.The reduction in management fee, pursuant to the undertaking, amounted to $76,198 during the period ended October 31, 2008.
During the period ended October 31, 2008, the Distributor retained $2,985 from commissions earned on sales of the fund’s Class A shares and $4,315 and $2,848 from CDSCs on redemptions of the fund’s Class B and Class C shares, respectively.
(b) Under the Distribution Plan (the “Plan”) adopted pursuant to Rule 12b-1 under the Act, Class B, Class C and Class T shares pay the Distributor for distributing their shares at an annual rate of .75% of the value of the average daily net assets of Class B and Class C shares and .25% of the value of the average daily net assets of Class T shares. During the period ended October 31, 2008, Class B, Class C and Class T shares were charged $17,351, $19,207 and $89, respectively, pursuant to the Plan.
(c) Under the Shareholder Services Plan, Class A, Class B, Class C and ClassT shares pay the Distributor at an annual rate of .25% of the value of their average daily net assets for the provision of certain services. The services provided may include personal services relating to shareholder accounts, such as answering shareholder inquiries regarding the fund and providing reports and other information, and services related to the maintenance of shareholder accounts. The Distributor may
The Fund 29
| NOTES TO FINANCIAL STATEMENTS (continued) |
make payments to Service Agents (a securities dealer, financial institution or other industry professional) in respect of these services. The Distributor determines the amounts to be paid to Service Agents. During the period ended October 31, 2008, Class A, Class B, Class C and Class T shares were charged $97,120, $5,784, $6,402 and $89, respectively, pursuant to the Shareholder Services Plan.
The fund compensates Dreyfus Transfer, Inc., a wholly-owned subsidiary of the Manager, under a transfer agency agreement for providing personnel and facilities to perform transfer agency services for the fund. During the period ended October 31, 2008, the fund was charged $34,063 pursuant to the transfer agency agreement.
The fund compensates The Bank of NewYork Mellon, a subsidiary of BNY Mellon and an affiliate of Dreyfus, under a cash management agreement for performing cash management services related to fund subscriptions and redemptions. During the period ended October 31, 2008, the fund was charged $3,902 pursuant to the cash management agreement.
The fund compensates The Bank of New York Mellon under a custody agreement for providing custodial services for the fund. During the period ended October 31, 2008, the fund was charged $96,122 pursuant to the custody agreement.
During the period ended October 31, 2008, the fund was charged $6,203 for services performed by the Chief Compliance Officer.
The components of “Due to The Dreyfus Corporation and affiliates” in the Statement of Assets and Liabilities consist of: management fees $17,005, Rule 12b-1 distribution plan fees $1,720, shareholder services plan fees $5,609, custodian fees $21,856, chief compliance officer fees $1,973 and transfer agency per account fees $5,859.
(d) Each Board member also serves as a Board member of other funds within the Dreyfus complex. Annual retainer fees and attendance fees are allocated to each fund based on net assets.
30
NOTE 4—Securities Transactions:
The aggregate amount of purchases and sales of investment securities, excluding short-term securities, financial futures and forward currency exchange contracts, during the period ended October 31, 2008, amounted to $50,734,351 and $54,430,595, respectively.
The fund enters into forward currency exchange contracts in order to hedge its exposure to changes in foreign currency exchange rates on its foreign portfolio holdings and to settle foreign currency transac-tions.When executing forward currency exchange contracts, the fund is obligated to buy or sell a foreign currency at a specified rate on a certain date in the future. With respect to sales of forward currency exchange contracts, the fund would incur a loss if the value of the contract increases between the date the forward contract is opened and the date the forward contract is closed.The fund realizes a gain if the value of the contract decreases between those dates. With respect to purchases of forward currency exchange contracts, the fund would incur a loss if the value of the contract decreases between the date the forward contract is opened and the date the forward contract is closed. The fund realizes a gain if the value of the contract increases between those dates. The fund is also exposed to credit risk associated with counterparty nonperformance on these forward currency exchange contracts which is typically limited to the unrealized gain on each open contract. The following summarizes open forward currency exchange contracts at October 31, 2008:
| Foreign | ||||||||
| Forward Currency | Currency | Unrealized | ||||||
| Exchange Contracts | Amounts | Cost ($) | Value ($) | (Depreciation) ($) | ||||
| Purchases: | ||||||||
| British Pound, | ||||||||
| expiring 11/3/2008 | 16,485 | 27,126 | 26,530 | (596) | ||||
| Euro, | ||||||||
| expiring 11/3/2008 | 28,686 | 36,586 | 36,562 | (24) |
The Fund 31
| NOTES TO FINANCIAL STATEMENTS (continued) |
| Foreign | ||||||||
| Forward Currency | Currency | Unrealized | ||||||
| Exchange Contracts | Amounts | Proceeds ($) | Value ($) | Appreciation ($) | ||||
| Sales: | ||||||||
| British Pound, | ||||||||
| expiring 11/4/2008 | 15,238 | 24,705 | 24,523 | 182 | ||||
| Euro, | ||||||||
| expiring 11/3/2008 | 24,463 | 31,904 | 31,179 | 725 | ||||
| Euro, | ||||||||
| expiring 11/4/2008 | 180,015 | 229,447 | 229,438 | 9 | ||||
| Norwegian Krone, | ||||||||
| expiring 11/4/2008 | 400,009 | 59,636 | 59,390 | 246 | ||||
| Swiss Franc, | ||||||||
| expiring 11/4/2008 | 134,335 | 116,661 | 115,836 | 825 | ||||
| Total | 1,367 |
The fund may invest in financial futures contracts in order to gain exposure to or protect against changes in the market.The fund is exposed to market risk as a result of changes in the value of the underlying financial instruments. Investments in financial futures require the fund to “mark to market” on a daily basis, which reflects the change in market value of the contracts at the close of each day’s trading.Accordingly, variation margin payments are received or made to reflect daily unrealized gains or losses.When the contracts are closed, the fund recognizes a realized gain or loss.These investments require initial margin deposits with a broker, which consist of cash or cash equivalents.The amount of these deposits is determined by the exchange or Board of Trade on which the contract is traded and is subject to change. At October 31, 2008, there were no open financial futures contracts outstanding.
At October 31, 2008, the cost of investments for federal income tax purposes was $35,213,321; accordingly, accumulated net unrealized depreciation on investments was $11,025,484, consisting of $299,276 gross unrealized appreciation and $11,324,760 gross unrealized depreciation.
In March 2008, the FASB released Statement of Financial Accounting Standards No. 161 “Disclosures about Derivative Instruments and Hedging Activities” (“FAS 161”). FAS 161 requires qualitative disclosures about objectives and strategies for using derivatives, quantitative disclosures about fair value amounts of gains and losses on derivative
32
instruments and disclosures about credit-risk-related contingent features in derivative agreements.The application of FAS 161 is required for fiscal years and interim periods beginning after November 15, 2008. At this time, management is evaluating the implications of FAS 161 and its impact on the financial statements and the accompanying notes has not yet been determined.
NOTE 5—Subsequent Event:
Effective on or about February 4, 2009 (the “Effective Date”), the fund will issue to each holder of its Class T shares, in exchange for said shares, Class A shares of the fund having an aggregate net asset value equal to the aggregate net asset value of the shareholder’s Class T shares.Thereafter, the fund will no longer offer Class T shares.
Effective on or about December 3, 2008, no investments for new accounts were permitted in Class T of the fund, except that participants in certain group retirement plans were able to open a new account in Class T of the fund, provided that the fund was established as an investment option under the plans before December 3, 2008. After the Effective Date, subsequent investments in the fund’s Class A shares made by holders of the fund’s Class T shares who received Class A shares of the fund in exchange for their Class T shares will be subject to the front-end sales load schedule currently in effect for Class T shares. Otherwise, all other Class A share attributes will be in effect.
The Fund 33
REPORT OF INDEPENDENT REGISTERED PUBLIC ACCOUNTING FIRM
| Shareholders and Board of Directors Dreyfus International Growth Fund |
We have audited the accompanying statement of assets and liabilities, including the statement of investments, of Dreyfus International Growth Fund (formerly, Dreyfus Premier International Growth Fund), one of the series comprising Dreyfus Premier Investment Funds, Inc. (formerly, Dreyfus Premier International Funds, Inc.) as of October 31, 2008, and the related statement of operations for the year then ended, the statement of changes in net assets for each of the two years in the period then ended, and financial highlights for each of the years indicated therein. These financial statements and financial highlights are the responsibility of the Fund’s management. Our responsibility is to express an opinion on these financial statements and financial highlights based on our audits. We conducted our audits in accordance with the standards of the Public Company Accounting Oversight Board (United States). Those standards require that we plan and perform the audit to obtain reasonable assurance about whether the financial statements and financial highlights are free of material misstatement. We were not engaged to perform an audit of the Fund’s internal control over financial reporting. Our audits included consideration of internal control over financial reporting as a basis for designing audit procedures that are appropriate in the circumstances, but not for the purpose of expressing an opinion on the effectiveness of the Fund’s internal control over financial reporting. Accordingly, we express no such opinion. An audit also includes examining, on a test basis, evidence supporting the amounts and disclosures in the financial statements and financial highlights, assessing the accounting principles used and significant estimates made by management, and evaluating the overall financial statement presentation. Our procedures included confirmation of securities owned as of October 31, 2008 by correspondence with the custodian and others. We believe that our audits provide a reasonable basis for our opinion. In our opinion, the financial statements and financial highlights referred to above present fairly, in all material respects, the financial position of Dreyfus International Growth Fund at October 31, 2008, the results of its operations for the year then ended, the changes in its net assets for each of the two years in the period then ended, and the financial highlights for each of the indicated years, in conformity with U.S. generally accepted accounting principles.

New York, New York December 23, 2008
34
IMPORTANT TAX INFORMATION ( U n a u d i t e d )
In accordance with federal tax law, the fund elects to provide each shareholder with their portion of the fund’s foreign taxes paid and the income sourced from foreign countries. Accordingly, the fund hereby makes the following designations regarding its fiscal year ended October 31, 2008:
| — the total amount of taxes paid to foreign countries was $123,892. |
| — the total amount of income sourced from foreign countries was |
| $395,208. |
As required by federal tax law rules, shareholders will receive notification of their proportionate share of foreign taxes paid and foreign sourced income for the 2008 calendar year with Form 1099-DIV which will be mailed by January 31, 2009. For the fiscal year ended October 31, 2008, certain dividends paid by the fund may be subject to a maximum tax rate of 15%, as provided for by the Jobs and Growth Tax Relief Reconciliation Act of 2003. Of the distributions paid during the fiscal year, $464,053 represents the maximum amount that may be considered qualified dividend income.
The Fund 35
| INFORMATION ABOUT THE REVIEW AND APPROVAL |
| OF THE FUND’S MANAGEMENT AGREEMENT (Unaudited) |
At a meeting of the fund’s Board held on July 10, 2008, the Board unanimously approved the continuation of the fund’s Management Agreement with Dreyfus for a one-year term ending July 31, 2009. The Board members, none of whom are “interested persons” (as defined in the Investment Company Act of 1940, as amended) of the fund, were assisted in their review by independent legal counsel and met with counsel in executive session separate from representatives of Dreyfus. In approving the continuance of the Management Agreement, the Board considered all factors that they believed to be relevant, including, among other things, the factors discussed below.
Analysis of Nature, Extent and Quality of Services Provided to the Fund. The Board members received a presentation from representatives of Dreyfus regarding services provided to the fund and other funds in the Dreyfus fund complex, and discussed the nature, extent and quality of the services provided to the fund pursuant to its Management Agreement. Dreyfus’ representatives reviewed the fund’s distribution of accounts and the relationships Dreyfus has with various intermediaries and the different needs of each. Dreyfus’ representatives noted the various distribution channels for the fund as well as the diverse methods of distribution among other funds in the Dreyfus fund complex, and Dreyfus’ corresponding need for broad, deep, and diverse resources to be able to provide ongoing shareholder services to each distribution channel, including those of the fund. Dreyfus also provided the number of accounts investing in the fund, as well as the fund’s asset size.
The Board members also considered Dreyfus’ research and portfolio management capabilities and Dreyfus’ oversight of day-to-day fund operations, including fund accounting, administration and assistance in meeting legal and regulatory requirements.The Board also considered Dreyfus’ brokerage policies and practices, the standards applied in seeking best execution and Dreyfus’ policies and practices regarding soft dollars.The Board members also considered Dreyfus’ extensive administrative, accounting and compliance infrastructure.
36
Comparative Analysis of the Fund’s Performance and Management Fee and Expense Ratio. The Board members reviewed the fund’s performance for the one-, three-, five- and ten-year periods ended May 31, 2008, and compared the fund’s performance to the performance of a group of comparable retail international large-cap core funds (the “Performance Group”) and to a larger universe of funds consisting of all retail and institutional international large-cap core funds (the “Performance Universe”) selected and provided by Lipper, Inc., an independent provider of investment company data.The Board was provided with a description of the methodology Lipper used to select the Performance Group and Performance Universe, as well as the Expense Group and Expense Universe (discussed below). The Board members noted that they also had received and discussed with management information at periodic intervals comparing the fund’s performance to that of its benchmark index.The Board members discussed the results of the comparisons and noted that the fund’s total return performance for the one-, three- and five-year periods ended May 31, 2008 was in the second quartile, respectively, of the Performance Group, and in the second quartile for the one- and three-year periods and in the first quartile for the five-year period of the Performance Universe. The Board noted that although the fund’s total return performance for the ten-year period ended May 31, 2008 was in the fourth quartile of the Performance Group and the Performance Universe, a new portfolio management team assumed responsibility for the fund’s investment portfolio during the recent performance periods.
The Board members also discussed the fund’s management fee and expense ratio and reviewed the range of management fees and expense ratios as compared to a group of comparable retail international large-cap core funds (the “Expense Group”) and a broader group of funds consisting of all retail international large-cap core funds (the “Expense Universe”), each selected and provided by Lipper.The Board members noted that the fund’s management fee was lower than the median
The Fund 37
| INFORMATION ABOUT THE REVIEW AND APPROVAL OF THE |
| FUND’S MANAGEMENT AGREEMENT (Unaudited) (continued) |
management fees paid by the other funds in the Expense Group and that the total expense ratio of the fund also was lower than the median total expense ratio for the funds in the Expense Group and the Expense Universe.
Representatives of Dreyfus reviewed with the Board members the fees paid to Dreyfus or its affiliates by mutual funds managed by Dreyfus with similar investment objectives, policies and strategies as the fund (the “Similar Funds”). Dreyfus’ representatives also reviewed the costs associated with distribution through intermediaries. The Board analyzed differences in fees paid to Dreyfus and discussed the relationship of the advisory fees paid in light of Dreyfus’ performance, and the services provided.The Board members considered the relevance of the fee information provided for the Similar Funds managed by Dreyfus to evaluate the appropriateness and reasonableness of the fund’s management fees.The Board acknowledged that the differences in fees paid by the Similar Funds seemed to be consistent with the services provided.
Analysis of Profitability and Economies of Scale. Dreyfus’ representatives reviewed the dollar amount of expenses allocated and profit received by Dreyfus and the method used to determine such expenses and profit. The Board members evaluated the profitability analysis in light of the relevant circumstances for the fund and the extent to which economies of scale would be realized if the fund grows and whether fee levels reflect these economies of scale for the benefit of fund investors.The Board members also considered potential benefits to Dreyfus from acting as investment adviser and noted the soft dollar arrangements with respect to trading the fund’s investments.
It was noted that the Board members should consider Dreyfus’ profitability with respect to the fund as part of their evaluation of whether the fees under the Management Agreement bear a reasonable relationship to the mix of services provided by Dreyfus, including the nature, extent and quality of such services and that a discussion of economies of scale is predicated on a fund having achieved a substantial size with increasing assets and that, if a fund’s assets had been static or decreas-
38
ing, the possibility that Dreyfus may have realized any economies of scale would be less. It also was noted that the profitability percentage for managing the fund was within ranges determined by appropriate court cases to be reasonable given the services rendered and generally superior service levels provided.
At the conclusion of these discussions, the Board agreed that it had been furnished with sufficient information to make an informed business decision with respect to continuation of the fund’s Management Agreement. Based on the discussions and considerations as described above, the Board made the following conclusions and determinations.
- The Board concluded that the nature, extent and quality of the ser- vices provided by Dreyfus are adequate and appropriate.
- The Board was generally satisfied with the fund’s performance.
- The Board concluded that the fee paid by the portfolio to Dreyfus was reasonable in light of the considerations described above.
- The Board determined that the economies of scale which may accrue to Dreyfus and its affiliates in connection with the manage- ment of the fund had been adequately considered by Dreyfus in connection with the management fee rate charged to the fund and that, to the extent in the future it were determined that material economies of scale had not been shared with the fund, the Board would seek to have those economies of scale shared with the fund.
The Board members considered these conclusions and determinations, along with information received on a routine and regular basis throughout the year, and, without any one factor being dispositive, the Board determined that continuation of the fund’s Management Agreement was in the best interests of the fund and its shareholders.
The Fund 39
BOARD MEMBERS INFORMATION ( U n a u d i t e d )
| Joseph S. DiMartino (65) Chairman of the Board (1995) |
Principal Occupation During Past 5Years:
- Corporate Director and Trustee
Other Board Memberships and Affiliations:
- The Muscular Dystrophy Association, Director
- Century Business Services, Inc., a provider of outsourcing functions for small and medium size companies, Director
- The Newark Group, a provider of a national market of paper recovery facilities, paperboard mills and paperboard converting plants, Director
- Sunair Services Corporation, a provider of certain outdoor-related services to homes and businesses, Director
No. of Portfolios for which Board Member Serves: 167
| ——————— |
| Gordon J. Davis (67) Board Member (1993) Principal Occupation During Past 5Years: |
- Partner in the law firm of Dewey & LeBoeuf LLP
- President, Lincoln Center for the Performing Arts, Inc. (2001)
| Other Board Memberships and Affiliations: |
- Consolidated Edison, Inc., a utility company, Director
- Phoenix Companies Inc., a life insurance company, Director
- Board Member/Trustee for several not-for-profit groups
| No. of Portfolios for which Board Member Serves: 41 |
| ——————— |
| David P. Feldman (68) Board Member (1991) |
Principal Occupation During Past 5Years:
- Corporate Director and Trustee
Other Board Memberships and Affiliations:
- BBH Mutual Funds Group (11 funds), Director
- The Jeffrey Company, a private investment company, Director
| No. of Portfolios for which Board Member Serves: 50 |
40
| Lynn Martin (68) Board Member (1993) Principal Occupation During Past 5Years: |
- Advisor to the international accounting firm of Deloitte &Touche, LLP and Chair to its Council for the Advancement of Women from March 1993-September 2005
| Other Board Memberships and Affiliations: |
- AT&T Inc., a telecommunications company, Director
- Ryder System, Inc., a supply chain and transportation management company, Director
- The Proctor & Gamble Co., a consumer products company, Director
- Constellation Energy Group, Director
- Chicago Council on Global Affairs
- Coca-Cola International Advisory Council
- Deutsche Bank Advisory Council
| No. of Portfolios for which Board Member Serves: 14 |
| ——————— |
| Daniel Rose (79) Board Member (1992) Principal Occupation During Past 5Years: |
- Chairman and Chief Executive Officer of Rose Associates, Inc., a New York based real estate development and management firm
| Other Board Memberships and Affiliations: |
- Baltic-American Enterprise Fund,Vice Chairman and Director
- Harlem Educational Activities Fund, Inc., Chairman
- Housing Committee of the Real Estate Board of New York, Inc., Director
| No. of Portfolios for which Board Member Serves: 36 |
| ——————— |
| Philip L. Toia (75) Board Member (1997) |
Principal Occupation During Past 5 Years:
- Private Investor
No. of Portfolios for which Board Member Serves: 25
The Fund 41
BOARD MEMBERS INFORMATION (Unaudited) (continued)
| Anne Wexler (78) Board Member (1994) Principal Occupation During Past 5Years: |
- Chairman of the Wexler & Walker Public Policy Associates, consultants specializing in govern- ment relations and public affairs from January 1981 to present
| Other Board Memberships and Affiliations: |
- The Community Foundation for the National Capital Region, Director
- Member of the Council of Foreign Relations
- WETA-DC’s Public TV and Radio Station,Vice Chairman
| No. of Portfolios for which Board Member Serves: 50 |
| ——————— |
Once elected all Board Members serve for an indefinite term, but achieve Emeritus status upon reaching age 80.The address of the Board Members and Officers is in c/o The Dreyfus Corporation, 200 Park Avenue, NewYork, NewYork 10166. Additional information about the Board Members is available in the fund’s Statement of Additional Information which can be obtained from Dreyfus free of charge by calling this toll free number: 1-800-554-4611.
Sander Vanocur, Emeritus Board Member
42
OFFICERS OF THE FUND (Unaudited)
J. DAVID OFFICER, President since December 2006.
Chief Operating Officer,Vice Chairman and a Director of the Manager, and an officer of 77 investment companies (comprised of 167 portfolios) managed by the Manager. He is 60 years old and has been an employee of the Manager since April 1998.
PHILLIP N. MAISANO, Executive Vice President since July 2007.
Chief Investment Officer,Vice Chair and a director of the Manager, and an officer of 77 investment companies (comprised of 167 portfolios) managed by the Manager. Mr. Maisano also is an officer and/or Board member of certain other investment management subsidiaries of The Bank of New York Mellon Corporation, each of which is an affiliate of the Manager. He is 61 years old and has been an employee of the Manager since November 2006. Prior to joining the Manager, Mr. Maisano served as Chairman and Chief Executive Officer of EACM Advisors, an affiliate of the Manager, since August 2004, and served as Chief Executive Officer of Evaluation Associates, a leading institutional investment consulting firm, from 1988 until 2004.
MICHAEL A. ROSENBERG, Vice President and Secretary since August 2005.
Assistant General Counsel of BNY Mellon, and an officer of 78 investment companies (comprised of 188 portfolios) managed by the Manager. He is 48 years old and has been an employee of the Manager since October 1991.
JAMES BITETTO, Vice President and Assistant Secretary since August 2005.
Senior Counsel of BNY Mellon and Secretary of the Manager, and an officer of 78 investment companies (comprised of 188 portfolios) managed by the Manager. He is 42 years old and has been an employee of the Manager since December 1996.
JONI LACKS CHARATAN, Vice President and Assistant Secretary since August 2005.
Senior Counsel of BNY Mellon, and an officer of 78 investment companies (comprised of 188 portfolios) managed by the Manager. She is 53 years old and has been an employee of the Manager since October 1988.
JOSEPH M. CHIOFFI, Vice President and Assistant Secretary since August 2005.
Senior Counsel of BNY Mellon, and an officer of 78 investment companies (comprised of 188 portfolios) managed by the Manager. He is 47 years old and has been an employee of the Manager since June 2000.
JANETTE E. FARRAGHER, Vice President and Assistant Secretary since August 2005.
Assistant General Counsel of BNY Mellon, and an officer of 78 investment companies (comprised of 188 portfolios) managed by the Manager. She is 45 years old and has been an employee of the Manager since February 1984.
JOHN B. HAMMALIAN, Vice President and Assistant Secretary since August 2005.
Managing Counsel of BNY Mellon, and an officer of 78 investment companies (comprised of 188 portfolios) managed by the Manager. He is 45 years old and has been an employee of the Manager since February 1991.
ROBERT R. MULLERY, Vice President and Assistant Secretary since August 2005.
Managing Counsel of BNY Mellon, and an officer of 78 investment companies (comprised of 188 portfolios) managed by the Manager. He is 56 years old and has been an employee of the Manager since May 1986.
The Fund 43
OFFICERS OF THE FUND (Unaudited) (continued)
JEFF PRUSNOFSKY, Vice President and Assistant Secretary since August 2005.
Managing Counsel of BNY Mellon, and an officer of 78 investment companies (comprised of 188 portfolios) managed by the Manager. He is 43 years old and has been an employee of the Manager since October 1990.
JAMES WINDELS, Treasurer since November 2001.
Director – Mutual Fund Accounting of the Manager, and an officer of 78 investment companies (comprised of 188 portfolios) managed by the Manager. He is 49 years old and has been an employee of the Manager since April 1985.
RICHARD CASSARO, Assistant Treasurer since September 2007.
Senior Accounting Manager – Money Market and Municipal Bond Funds of the Manager, and an officer of 78 investment companies (comprised of 188 portfolios) managed by the Manager. He is 49 years old and has been an employee of the Manager since September 1982.
GAVIN C. REILLY, Assistant Treasurer since December 2005.
Tax Manager of the Investment Accounting and Support Department of the Manager, and an officer of 78 investment companies (comprised of 188 portfolios) managed by the Manager. He is 40 years old and has been an employee of the Manager since April 1991.
ROBERT ROBOL, Assistant Treasurer since August 2003.
Senior Accounting Manager – Fixed Income Funds of the Manager, and an officer of 78 investment companies (comprised of 188 portfolios) managed by the Manager. He is 44 years old and has been an employee of the Manager since October 1988.
ROBERT SALVIOLO, Assistant Treasurer since May 2007.
Senior Accounting Manager – Equity Funds of the Manager, and an officer of 78 investment companies (comprised of 188 portfolios) managed by the Manager. He is 41 years old and has been an employee of the Manager since June 1989.
ROBERT SVAGNA, Assistant Treasurer since August 2005.
Senior Accounting Manager – Equity Funds of the Manager, and an officer of 78 investment companies (comprised of 188 portfolios) managed by the Manager. He is 41 years old and has been an employee of the Manager since November 1990.
JOSEPH W. CONNOLLY, Chief Compliance Officer since October 2004.
Chief Compliance Officer of the Manager and The Dreyfus Family of Funds (78 investment companies, comprised of 188 portfolios). From November 2001 through March 2004, Mr. Connolly was first Vice-President, Mutual Fund Servicing for Mellon Global Securities Services. In that capacity, Mr. Connolly was responsible for managing Mellon’s Custody, Fund Accounting and Fund Administration services to third-party mutual fund clients. He is 51 years old and has served in various capacities with the Manager since 1980, including manager of the firm’s Fund Accounting Department from 1997 through October 2001.
WILLIAM GERMENIS, Anti-Money Laundering Compliance Officer since October 2002.
Vice President and Anti-Money Laundering Compliance Officer of the Distributor, and the Anti-Money Laundering Compliance Officer of 74 investment companies (comprised of 184 portfolios) managed by the Manager. He is 38 years old and has been an employee of the Distributor since October 1998.
44
| Item 2. | Code of Ethics. |
The Registrant has adopted a code of ethics that applies to the Registrant's principal executive officer, principal financial officer, principal accounting officer or controller, or persons performing similar functions. There have been no amendments to, or waivers in connection with, the Code of Ethics during the period covered by this Report.
| Item 3. | Audit Committee Financial Expert. |
The Registrant's Board has determined that David P. Feldman, a member of the Audit Committee of the Board, is an audit committee financial expert as defined by the Securities and Exchange Commission (the "SEC"). David P. Feldman is "independent" as defined by the SEC for purposes of audit committee financial expert determinations.
| Item 4. | Principal Accountant Fees and Services. |
(a) Audit Fees. The aggregate fees billed for each of the last two fiscal years (the "Reporting Periods") for professional services rendered by the Registrant's principal accountant (the "Auditor") for the audit of the Registrant's annual financial statements or services that are normally provided by the Auditor in connection with the statutory and regulatory filings or engagements for the Reporting Periods, were $50,316 in 2007 and $102,784 in 2008.
(b) Audit-Related Fees. The aggregate fees billed in the Reporting Periods for assurance and related services by the Auditor that are reasonably related to the performance of the audit of the Registrant's financial statements and are not reported under paragraph (a) of this Item 4 were $0 in 2007 and $26,072 in 2008.
The aggregate fees billed in the Reporting Periods for non-audit assurance and related services by the Auditor to the Registrant's investment adviser (not including any sub-investment adviser whose role is primarily portfolio management and is subcontracted with or overseen by another investment adviser), and any entity controlling, controlled by or under common control with the investment adviser that provides ongoing services to the Registrant ("Service Affiliates"), that were reasonably related to the performance of the annual audit of the Service Affiliate, which required pre-approval by the Audit Committee were $0 in 2007 and $0 in 2008.
Note: For the second paragraph in each of (b) through (d) of this Item 4, certain of such services were not pre-approved prior to May 6, 2003, when such services were required to be pre-approved. On and after May 6, 2003, 100% of all services provided by the Auditor were pre-approved as required. For comparative purposes, the fees shown assume that all such services were pre-approved, including services that were not pre-approved prior to the compliance date of the pre-approval requirement.
(c) Tax Fees. The aggregate fees billed in the Reporting Periods for professional services rendered by the Auditor for tax compliance, tax advice, and tax planning ("Tax Services") were $9,953 in 2007 and $12,716 in 2008. These services consisted of: (i) review or preparation of U.S. federal, state, local and excise tax returns; (ii) U.S. federal, state and local tax planning, advice and assistance regarding statutory, regulatory or administrative developments; (iii) tax advice regarding tax qualification matters and/or treatment of various financial instruments held or proposed to be acquired or held. The aggregate fees billed in the Reporting
-3-
Periods for Tax Services by the Auditor to Service Affiliates, which required pre-approval by the Audit Committee were $0 in 2007 and $0 in 2008.
(d) All Other Fees. The aggregate fees billed in the Reporting Periods for products and services provided by the Auditor, other than the services reported in paragraphs (a) through (c) of this Item, were $0 in 2007 and $564 in 2008. [These services consisted of a review of the Registrant's anti-money laundering program].
The aggregate fees billed in the Reporting Periods for Non-Audit Services by the Auditor to Service Affiliates, other than the services reported in paragraphs (b) through (c) of this Item, which required pre-approval by the Audit Committee, were $0 in 2007 and $0 in 2008.
Audit Committee Pre-Approval Policies and Procedures. The Registrant's Audit Committee has established policies and procedures (the "Policy") for pre-approval (within specified fee limits) of the Auditor's engagements for non-audit services to the Registrant and Service Affiliates without specific case-by-case consideration. Pre-approval considerations include whether the proposed services are compatible with maintaining the Auditor's independence. Pre-approvals pursuant to the Policy are considered annually.
Non-Audit Fees. The aggregate non-audit fees billed by the Auditor for services rendered to the Registrant, and rendered to Service Affiliates, for the Reporting Periods were $1,627,514 in 2007 and $7,879,835 in 2008.
Auditor Independence. The Registrant's Audit Committee has considered whether the provision of non-audit services that were rendered to Service Affiliates, which were not pre-approved (not requiring pre-approval), is compatible with maintaining the Auditor's independence.
| Item 5. | Audit Committee of Listed Registrants. | |
| Not applicable. [CLOSED-END FUNDS ONLY] | ||
| Item 6. | Investments. | |
| (a) | Not applicable. | |
| Item 7. | Disclosure of Proxy Voting Policies and Procedures for Closed-End Management | |
| Investment Companies. | ||
| Not applicable. [CLOSED-END FUNDS ONLY] | ||
| Item 8. | Portfolio Managers of Closed-End Management Investment Companies. | |
| Not applicable. [CLOSED-END FUNDS ONLY, beginning with reports for periods ended | ||
| on and after December 31, 2005] | ||
| Item 9. | Purchases of Equity Securities by Closed-End Management Investment Companies and | |
| Affiliated Purchasers. | ||
| Not applicable. [CLOSED-END FUNDS ONLY] | ||
| Item 10. | Submission of Matters to a Vote of Security Holders. |
The Registrant has a Nominating Committee (the "Committee"), which is responsible for selecting and nominating persons for election or appointment by the Registrant's Board as Board members. The
-4-
Committee has adopted a Nominating Committee Charter (the "Charter"). Pursuant to the Charter, the Committee will consider recommendations for nominees from shareholders submitted to the Secretary of the Registrant, c/o The Dreyfus Corporation Legal Department, 200 Park Avenue, 8th Floor East, New York, New York 10166. A nomination submission must include information regarding the recommended nominee as specified in the Charter. This information includes all information relating to a recommended nominee that is required to be disclosed in solicitations or proxy statements for the election of Board members, as well as information sufficient to evaluate the factors to be considered by the Committee, including character and integrity, business and professional experience, and whether the person has the ability to apply sound and independent business judgment and would act in the interests of the Registrant and its shareholders. Nomination submissions are required to be accompanied by a written consent of the individual to stand for election if nominated by the Board and to serve if elected by the shareholders, and such additional information must be provided regarding the recommended nominee as reasonably requested by the Committee.
| Item 11. | Controls and Procedures. |
(a) The Registrant's principal executive and principal financial officers have concluded, based on their evaluation of the Registrant's disclosure controls and procedures as of a date within 90 days of the filing date of this report, that the Registrant's disclosure controls and procedures are reasonably designed to ensure that information required to be disclosed by the Registrant on Form N-CSR is recorded, processed, summarized and reported within the required time periods and that information required to be disclosed by the Registrant in the reports that it files or submits on Form N-CSR is accumulated and communicated to the Registrant's management, including its principal executive and principal financial officers, as appropriate to allow timely decisions regarding required disclosure.
(b) There were no changes to the Registrant's internal control over financial reporting that occurred during the second fiscal quarter of the period covered by this report that have materially affected, or are reasonably likely to materially affect, the Registrant's internal control over financial reporting.
| Item 12. | Exhibits. |
(a)(1) Code of ethics referred to in Item 2.
(a)(2) Certifications of principal executive and principal financial officers as required by Rule 30a-2(a) under the Investment Company Act of 1940.
(a)(3) Not applicable.
(b) Certification of principal executive and principal financial officers as required by Rule 30a-2(b) under the Investment Company Act of 1940.
-5-
| SIGNATURES |
Pursuant to the requirements of the Securities Exchange Act of 1934 and the Investment Company Act of 1940, the Registrant has duly caused this Report to be signed on its behalf by the undersigned, thereunto duly authorized.
Dreyfus Premier Investment Funds, Inc.
| By: | /s/ J. David Officer | |
| J. David Officer, | ||
| President | ||
| Date: | December 18, 2008 | |
Pursuant to the requirements of the Securities Exchange Act of 1934 and the Investment Company Act of 1940, this Report has been signed below by the following persons on behalf of the Registrant and in the capacities and on the dates indicated.
| By: | /s/ J. David Officer | |
| J. David Officer, | ||
| President | ||
| Date: | December 18, 2008 | |
| By: | /s/ James Windels | |
| James Windels, | ||
| Treasurer | ||
| Date: | December 18, 2008 | |
EXHIBIT INDEX
(a)(1) Code of ethics referred to in Item 2.
(a)(2) Certifications of principal executive and principal financial officers as required by Rule 30a-2(a) under the Investment Company Act of 1940. (EX-99.CERT)
(b) Certification of principal executive and principal financial officers as required by Rule 30a-2(b) under the Investment Company Act of 1940. (EX-99.906CERT)
-6-