| UNITED STATES |
| SECURITIES AND EXCHANGE COMMISSION |
| Washington, D.C. 20549 |
| FORM N-CSR |
| CERTIFIED SHAREHOLDER REPORT OF REGISTERED MANAGEMENT |
| INVESTMENT COMPANIES |
| Investment Company Act file number 811- 6490 |
| DREYFUS PREMIER INTERNATIONAL FUNDS, INC. |
| (Exact name of Registrant as specified in charter) |
| c/o The Dreyfus Corporation |
| 200 Park Avenue |
| New York, New York 10166 |
| (Address of principal executive offices) (Zip code) |
| Michael A. Rosenberg, Esq. |
| 200 Park Avenue |
| New York, New York 10166 |
| (Name and address of agent for service) |
| Registrant's telephone number, including area code: (212) 922-6000 |
| Date of fiscal year end: | 10/31 | |
| Date of reporting period: | 10/31/2007 |
FORM N-CSR
Item 1. Reports to Stockholders.
Save time. Save paper. View your next shareholder report online as soon as it’s available. Log into www.dreyfus.com and sign up for Dreyfus eCommunications. It’s simple and only takes a few minutes.
The views expressed in this report reflect those of the portfolio manager only through the end of the period covered and do not necessarily represent the views of Dreyfus or any other person in the Dreyfus organization. Any such views are subject to change at any time based upon market or other conditions and Dreyfus disclaims any responsibility to update such views.These views may not be relied on as investment advice and, because investment decisions for a Dreyfus fund are based on numerous factors, may not be relied on as an indication of trading intent on behalf of any Dreyfus fund.
Not FDIC-Insured • Not Bank-Guaranteed • May Lose Value
| Contents | ||
| THE FUND | ||
| 2 | A Letter from the CEO | |
| 3 | Discussion of Fund Performance | |
| 6 | Fund Performance | |
| 8 | Understanding Your Fund’s Expenses | |
| 8 | Comparing Your Fund’s Expenses | |
| With Those of Other Funds | ||
| 9 | Statement of Investments | |
| 12 | Statement of Assets and Liabilities | |
| 13 | Statement of Operations | |
| 14 | Statement of Changes in Net Assets | |
| 17 | Financial Highlights | |
| 22 | Notes to Financial Statements | |
| 30 | Report of Independent Registered | |
| Public Accounting Firm | ||
| 31 | Important Tax Information | |
| 32 | Information About the Review and Approval | |
| of the Fund’s Management Agreement | ||
| 36 | Board Members Information | |
| 39 | Officers of the Fund | |
| FOR MORE INFORMATION | ||
| Back Cover | ||
The Fund
| Dreyfus Premier |
| Greater China Fund |

A LETTER FROM THE CEO
Dear Shareholder:
We are pleased to present this annual report for Dreyfus Premier Greater China Fund, covering the 12-month period from November
1, 2006, through October 31, 2007.
After an extended period of steady gains, turmoil in U.S. credit markets over the summer of 2007 has led to heightened volatility in many international equity markets. Nonetheless, fundamentals in the global economy have remained relatively robust, particularly in the “Greater China” region, and recent rate cuts in the United States helped to sustain market rebounds in many regions of the world.
While we expect the global expansion to continue, it probably will do so at a slower rate as U.S. consumer spending moderates and as some high-flying emerging markets,notably China,take steps to reduce unsustainably high growth rates by tightening their respective monetary policies.However,the U.S.dollar has declined against most major currencies throughout most of the reporting period, making investments denominated in foreign currencies more valuable for U.S. residents. Lastly, a stubborn U.S. trade deficit and stronger economic growth in overseas markets continue to attract global capital away from U.S. markets and toward those with higher potential returns.As always, we encourage you to discuss these developments with your financial advisor, who can help you make any adjustments that may be right for your portfolio.
For information about how the fund performed during the reporting period, as well as market perspectives, we have provided a Discussion of Fund Performance given by the fund’s Portfolio Managers.
Thank you for your continued confidence and support.

| Thomas F. Eggers |
| Chief Executive Officer |
| The Dreyfus Corporation |
| November 15, 2007 |
2

DISCUSSION OF FUND PERFORMANCE
For the period of November 1, 2006, through October 31, 2007, as provided by Hugh Simon and Nina Wu, Portfolio Managers
Fund and Market Performance Overview
Chinese companies continued to post impressive earnings growth in a fast-growing economy that was driven by robust export investment, booming domestic consumption, strong government spending on infrastructure and ample trade surpluses. In fact, China’s export growth is still impressive in 2007, but foreign direct investment growth is not so strong as before.These conditions led to triple-digit gains in share prices of some companies trading on China stock exchanges. In comparison, the fund’s benchmark, which reflects the performance of more established companies that trade on the Hong Kong exchange, produced more moderate, though still excellent, returns.
For the 12-month period ended October 31, 2007, Dreyfus Premier Greater China Fund produced total returns of 148.75% for Class A shares, 146.79% for Class B shares, 146.90% for Class C shares, 149.45% for Class I shares and 148.04% for Class T shares.1 In comparison, the fund’s benchmark, the Hang Seng Index, produced a total return of 76.85% for the same period.2
As of June 1, 2007, Class R shares were renamed Class I shares.
Please note that the fund’s returns were achieved during a period in which market conditions were favorable to the Chinese market in general and the fund’s investment strategy in particular. Such returns are not sustainable and should not be expected to continue over the long run. An investment in the fund is suitable only as a supplement to an overall investment program for those investors willing to accept the greater risks and market volatility associated with investments in the Greater China region and should be viewed as a long-term investment.
The Fund’s Investment Approach
The fund, which seeks long-term capital appreciation, normally invests at least 80% of its assets in stocks of companies that (i) are principally traded in China, Hong Kong or Taiwan (Greater China), (ii) derive at least 50% of their revenues from Greater China, or (iii) have at least 50% of their assets in Greater China.To determine where the fund will invest, we analyze several factors, including economic and political trends in Greater China, the current financial condition and future prospects of individual companies and sectors in the region, and the valuation of one market or company relative to that of another.
The Fund 3
DISCUSSION OF FUND PERFORMANCE (continued)
Chinese Government Allows Investors to Buy Elsewhere
Longstanding government restrictions on investments outside the country have lifted gradually, benefiting share prices in nearby regions. To reduce pressure on its currency, certain qualified institutional investors are now allowed to invest outside of China. Most of that money is invested in Hong Kong, where stocks generally have lower valuations than on the mainland. The resulting rapid appreciation of Hong Kong stocks has benefited the fund. Some privately issued funds, retail investors and some large companies were front-runners.
China’s “B” shares, which are available to both non-Chinese investors and Chinese investors with foreign currency assets, have surged along with the region’s economy. In addition, concerns regarding a U.S. economic slowdown led to enhanced global capital flows into this high growth market. As a result, the Shanghai B Share Index more than tripled during the 12-month period. We enlarged the fund’s B-share portfolio during that period.
Our B-share selection strategy focused primarily on construction materials, consumption, energy, finance, machinery, and real estate companies. For example, Inner Mongolia Yitai Coal was up about 1500% during the reporting period on the strength of rising commodity prices and expanded capacity. China Everbright, which is not a Class B-share company, but a Class H-share company listed in Hong Kong with both commercial and investment bank businesses, appreciated 670% during the reporting period.
We reduced our exposure to the export sector due to an increasingly bellicose trade war between China and the United States. The only sector in which the fund has export exposure is the machinery and equipment area, as Chinese companies continue to upgrade their products to compete with world-class companies.These upgrades have led to a robust growth in sales and profit margins.
Sub-Prime Lending Woes Felt In Greater China
Despite the soaring Chinese market, some of the fund’s holdings proved disappointing. L.K.Technology Holdings, a small-cap manufacturer that went public in October 2006, has not yet received sufficient research coverage, causing the stock to languish. Shin Kong Financial Group, which was added to the fund in the third quarter, lost value due to exposure to sub-prime mortgages. Still, we have faith in China’s real estate industry, which we believe represents a hedge against inflation. In addition, the fund’s holdings in Chinese property companies recently have traded at attractive discounts to their underlying asset values.
4
A Continuing Focus on Small- and Midcap Companies
In our judgment, strong liquidity flows from China will continue to support the Hong Kong market, with robust earnings growth momentum potentially offsetting valuation concerns. In addition, we have increased the fund’s investment in the more attractively priced Taiwan stock market, where we have focused on domestic sectors.After its significant rally, we believe that China’s portfolio managers will be more cautious and selective when investing in the Hong Kong market.These managers are likely to turn their attention from richly valued large-cap stocks to more attractively priced small- and midcap companies, areas that remain the fund’s investment focus.
November 15, 2007
| Emerging markets, such as those of China and Taiwan, tend to be more volatile than the | ||
| markets of more mature economies, and generally have less diverse and less mature | ||
| economic structures and less stable political systems than those of developed countries. The | ||
| securities of companies located in emerging markets are often subject to rapid and large | ||
| changes in price. An investment in this fund should be considered only as a supplement to | ||
| a complete investment program. | ||
| 1 | Total return includes reinvestment of dividends and any capital gains paid, and does not take into | |
| consideration the maximum initial sales charges in the case of Class A and Class T shares, or the | ||
| applicable contingent deferred sales charges imposed on redemptions in the case of Class B and | ||
| Class C shares. Had these charges been reflected, returns would have been lower. Past performance | ||
| is no guarantee of future results. Share price and investment return fluctuate such that upon | ||
| redemption, fund shares may be worth more or less than their original cost. | ||
| A significant portion of the fund’s performance is attributable to positive returns from its | ||
| initial public offering (IPO) investments. There can be no guarantee that IPOs will have or | ||
| continue to have a positive effect on the fund’s performance. IPOs tend to have a reduced | ||
| effect on performance as a fund’s asset base grows. | ||
| 2 | SOURCE: BLOOMBERG L.P. – Reflects reinvestment of dividends and, where applicable, | |
| capital gain distributions.The Hang Seng Index is a free-float capitalization-weighted index of | ||
| 36 companies that represents approximately 66% of the total market cap of the Stock Exchange | ||
| of Hong Kong. Index components are capped at 25% and divided into four sub-indexes. Return | ||
| quoted is in U.S. dollars. |
The Fund 5
FUND PERFORMANCE
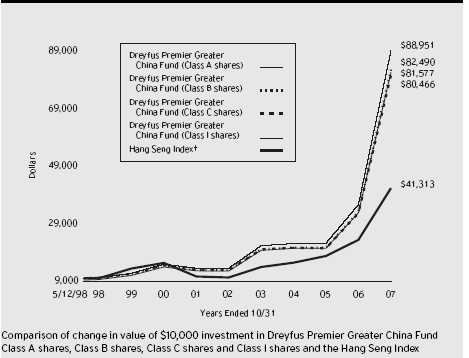
| † Source: Bloomberg L.P. |
| Past performance is not predictive of future performance. |
| A significant portion of the fund’s performance is attributable to positive returns from its initial public offering (IPO) |
| investments.There can be no guarantee that IPOs will have or continue to have a positive effect on the fund’s |
| performance. IPOs tend to have a reduced effect on performance as a fund’s asset base grows. |
| The above graph compares a $10,000 investment made in each of the Class A, Class B, Class C and Class I shares of |
| Dreyfus Premier Greater China Fund on 5/12/98 (inception date) to a $10,000 investment made in the Hang Seng |
| Index (the “Index”) on that date. For comparative purposes, the value of the Index on 4/30/98 is used as the |
| beginning value on 5/12/98. All dividends and capital gain distributions are reinvested. Performance for Class T shares |
| will vary from the performance of Class A, Class B, Class C and Class I shares shown above due to differences in |
| charges and expenses. |
| The fund’s performance shown in the line graph takes into account the maximum initial sales charge on Class A shares |
| and all other applicable fees and expenses on all classes.The Index is a capitalization-weighted index of approximately |
| 33 companies that represent 70 percent of the total market capitalization of the Stock Exchange of Hong Kong.The |
| components of the Index are divided into four subindices: Commerce, Finance, Utilities and Properties.The Index does |
| not take into account charges, fees and other expenses.The Index reflects reinvestment of net dividends and where |
| applicable, capital gain distribution. Further information relating to fund performance, including expense reimbursements, |
| if applicable, is contained in the Financial Highlights section of the prospectus and elsewhere in this report. |
6
| Average Annual Total Returns as of 10/31/07 | ||||||||
| Inception | From | |||||||
| Date | 1 Year | 5 Years | Inception | |||||
| Class A shares | ||||||||
| with maximum sales charge (5.75%) | 5/12/98 | 134.47% | 43.68% | 24.81% | ||||
| without sales charge | 5/12/98 | 148.75% | 45.40% | 25.59% | ||||
| Class B shares | ||||||||
| with applicable redemption charge † | 5/12/98 | 142.79% | 44.17% | 24.96% | ||||
| without redemption | 5/12/98 | 146.79% | 44.26% | 24.96% | ||||
| Class C shares | ||||||||
| with applicable redemption charge †† | 5/12/98 | 145.90% | 44.30% | 24.63% | ||||
| without redemption | 5/12/98 | 146.90% | 44.30% | 24.63% | ||||
| Class I shares | 5/12/98 | 149.45% | 45.84% | 25.96% | ||||
| Class T shares | ||||||||
| with applicable sales charge (4.5%) | 3/1/00 | 136.85% | 43.70% | 24.68%††† | ||||
| without sales charge | 3/1/00 | 148.04% | 45.03% | 25.29%††† | ||||
Past performance is not predictive of future performance.The fund’s performance shown in the graph and table does not reflect the deduction of taxes that a shareholder would pay on fund distributions or the redemption of fund shares. Performance for Class B shares assumes the conversion of Class B shares to Class A shares at the end of the sixth year following the date of purchase.
| † | The maximum contingent deferred sales charge for Class B shares is 4%. After six years Class B shares convert to | |
| Class A shares. | ||
| †† | The maximum contingent deferred sales charge for Class C shares is 1% for shares redeemed within one year of the | |
| date of purchase. | ||
| ††† | The total return performance figures presented for Class T shares of the fund reflect the performance of the fund’s | |
| Class A shares for periods prior to 3/1/00 (the inception date for Class T shares), adjusted to reflect the applicable | ||
| sales load for that class and the applicable distribution/servicing fees thereafter. |
The Fund 7
UNDERSTANDING YOUR FUND’S EXPENSES (Unaudited)
As a mutual fund investor, you pay ongoing expenses, such as management fees and other expenses. Using the information below, you can estimate how these expenses affect your investment and compare them with the expenses of other funds.You also may pay one-time transaction expenses, including sales charges (loads) and redemption fees, which are not shown in this section and would have resulted in higher total expenses. For more information, see your fund’s prospectus or talk to your financial adviser.
Review your fund’s expenses
The table below shows the expenses you would have paid on a $1,000 investment in Dreyfus Premier Greater China Fund from May 1, 2007 to October 31, 2007. It also shows how much a $1,000 investment would be worth at the close of the period, assuming actual returns and expenses.
| Expenses and Value of a $1,000 Investment | ||||||||||
| assuming actual returns for the six months ended October 31, 2007 | ||||||||||
| Class A | Class B | Class C | Class I | Class T | ||||||
| Expenses paid per $1,000 † | $ 11.53 | $ 16.95 | $ 16.43 | $ 9.69 | $ 13.43 | |||||
| Ending value (after expenses) | $1,613.50 | $1,606.90 | $1,607.30 | $1,615.60 | $1,611.00 | |||||
| COMPARING YOUR FUND’S EXPENSES |
| WITH THOSE OF OTHER FUNDS (Unaudited) |
Using the SEC’s method to compare expenses
The Securities and Exchange Commission (SEC) has established guidelines to help investors assess fund expenses. Per these guidelines, the table below shows your fund’s expenses based on a $1,000 investment, assuming a hypothetical 5% annualized return. You can use this information to compare the ongoing expenses (but not transaction expenses or total cost) of investing in the fund with those of other funds.All mutual fund shareholder reports will provide this information to help you make this comparison. Please note that you cannot use this information to estimate your actual ending account balance and expenses paid during the period.
| Expenses and Value of a $1,000 Investment | ||||||||||
| assuming a hypothetical 5% annualized return for the six months ended October 31, 2007 | ||||||||||
| Class A | Class B | Class C | Class I | Class T | ||||||
| Expenses paid per $1,000 † | $ 8.89 | $ 13.09 | $ 12.68 | $ 7.48 | $ 10.36 | |||||
| Ending value (after expenses) | $1,016.38 | $1,012.20 | $1,012.60 | $1,017.80 | $1,014.92 | |||||
| † Expenses are equal to the fund's annualized expense ratio of 1.75% for Class A, 2.58% for Class B, 2.50% for |
| Class C, 1.47% for Class I and 2.04% for Class T; multiplied by the average account value over the period, multiplied |
| by 184/365 (to reflect the one-half year period). |
8
| STATEMENT OF INVESTMENTS |
| October 31, 2007 |
| Common Stocks—97.4% | Shares | Value ($) | ||||
| China—59.7% | ||||||
| Air China, Cl. H | 27,389,000 | 42,736,612 | ||||
| AviChina Industry & Technology, Cl. H | 110,090,000 a | 32,186,613 | ||||
| Beijing Capital Land, Cl. H | 36,478,000 | 32,580,286 | ||||
| Bengang Steel Plates, Cl. B | 48,562,876 | 57,830,467 | ||||
| C.C Land Holdings | 13,659,000 | 27,209,274 | ||||
| CGS Holding, Cl. B | 20,250,766 | 28,188,791 | ||||
| China Aoyuan Property Group | 7,996,000 a | 6,881,097 | ||||
| China Automation Group | 878,000 a | 337,158 | ||||
| China Communication Services, Cl. H | 48,000,000 a | 42,068,694 | ||||
| China Merchants Property Development | 4,662,830 | 27,082,878 | ||||
| China Petroleum & Chemical, Cl. H | 36,000,000 | 54,764,093 | ||||
| China Telecom, Cl. H | 84,000,000 | 74,396,567 | ||||
| ChinaSoft International | 26,190,000 | 5,282,989 | ||||
| Chongqing Changan Automobile, Cl. B | 9,410,600 | 11,975,263 | ||||
| Dalian Refrigeration, Cl. B | 16,159,277 | 16,210,344 | ||||
| Datang International Power Generation, Cl. H | 22,000,000 | 25,690,460 | ||||
| Dongfeng Motor Group, Cl. H | 35,000,000 | 32,269,366 | ||||
| Guangshen Railway, Cl. H | 22,674,000 | 19,466,688 | ||||
| Guangzhou Pharmaceutical, Cl. H | 8,361,000 | 9,204,241 | ||||
| Haitian International Holdings | 14,835,000 | 11,933,407 | ||||
| Huaxin Cement, Cl. B | 7,226,277 | 26,888,263 | ||||
| Hunan Non-Ferrous Metal, Cl. H | 50,930,000 | 46,725,598 | ||||
| Inner Mongolia Yitai Coal, Cl. B | 7,278,460 | 72,714,385 | ||||
| Lianhua Supermarket Holdings, Cl. H | 15,499,000 | 24,798,632 | ||||
| Maanshan Iron and Steel, Cl. H | 24,560,000 | 21,833,985 | ||||
| PetroChina, Cl. H | 14,000,000 | 36,365,112 | ||||
| Shandong Chenming Paper Holdings, Cl. B | 34,583,845 | 39,877,972 | ||||
| Shanghai Forte Land, Cl. H | 46,000,000 | 35,931,741 | ||||
| Shanghai Friendship Group, Cl. B | 19,407,671 | 36,161,986 | ||||
| Shanghai Prime Machinery, Cl. H | 36,015,000 | 17,032,898 | ||||
| Sino-Ocean Land Holdings | 19,145,000 a | 34,482,589 | ||||
| Solarfun Power Holdings, ADR | 603,500 a | 8,461,070 | ||||
| Spreadtrum Communications, ADR | 1,264,060 a | 16,331,655 | ||||
| Tong Ren Tang Technologies, Cl. H | 2,763,000 | 5,942,819 | ||||
| Xinjiang Xinxin Mining Industry, Cl. H | 19,807,000 a | 36,646,029 | ||||
| Yangzijiang Shipbuilding Holdings | 23,472,000 a | 42,140,143 | ||||
| Zijin Mining Group, Cl. H | 15,268,000 | 27,366,915 |
The Fund 9
STATEMENT OF INVESTMENTS (continued)
| Common Stocks (continued) | Shares | Value ($) | ||||
| China (continued) | ||||||
| ZTE, Cl. H | 600,000 | 3,668,732 | ||||
| 1,091,665,812 | ||||||
| Hong Kong—26.6% | ||||||
| BOC Hong Kong Holdings | 8,000,000 | 22,921,206 | ||||
| China Everbright | 14,000,000 a | 64,464,466 | ||||
| China Foods | 19,800,000 | 15,244,879 | ||||
| China Oil and Gas Group | 26,000,000 a | 3,563,320 | ||||
| China Sciences Conservational Power | 19,450,000 a | 376,418 | ||||
| China Travel International Investment Hong Kong | 57,742,000 | 46,399,083 | ||||
| CITIC International Financial Holdings | 28,700,000 | 24,626,934 | ||||
| Comba Telecom Systems Holdings | 31,338,000 | 12,200,194 | ||||
| Dynasty Fine Wines Group | 52,768,000 | 23,522,156 | ||||
| Fubon Bank Hong Kong | 11,374,000 | 8,348,515 | ||||
| Global Green Tech Group | 43,111,000 | 17,166,896 | ||||
| Greentown China Holdings | 16,475,300 | 35,170,925 | ||||
| Hang Fung Gold Technology | 22,147,800 | 3,886,792 | ||||
| HKR International | 5,509,600 | 5,648,338 | ||||
| Hua Han Bio-Pharmaceutical Holdings, Cl. H | 24,302,000 | 6,902,748 | ||||
| Jutual Offshore Oil Services | 4,870,000 | 2,185,227 | ||||
| L.K. Technology Holdings | 62,242,500 | 7,386,410 | ||||
| Lifestyle International Holdings | 3,896,000 a | 10,757,015 | ||||
| Luk Fook Holdings | 5,184,000 | 3,891,109 | ||||
| Ming Fung Jewellery Group | 10,780,000 | 1,684,738 | ||||
| Neo-China Group Holdings | 16,580,000 | 20,284,921 | ||||
| New World Development | 6,000,000 | 21,520,253 | ||||
| Samling Global | 30,130,000 | 10,365,595 | ||||
| Shanghai Industrial Holdings | 6,967,000 | 41,309,977 | ||||
| TCC International Holdings | 2,206,000 | 3,322,360 | ||||
| Wasion Meters Group | 23,383,000 | 16,677,161 | ||||
| Wharf Holdings | 4,000,000 | 24,214,326 | ||||
| Zhuzhou CSR Times Electric, Cl. H | 17,245,000 | 33,042,578 | ||||
| 487,084,540 | ||||||
| Singapore—4.3% | ||||||
| Beauty China Holdings | 13,000,000 | 12,644,608 | ||||
| China Sky Chemical Fibre | 7,998,000 | 13,252,105 |
10
| Common Stocks (continued) | Shares | Value ($) | ||||
| Singapore (continued) | ||||||
| Cosco Singapore | 4,000,000 | 21,931,696 | ||||
| Yanlord Land Group | 11,223,000 | 30,638,334 | ||||
| 78,466,743 | ||||||
| Taiwan—6.7% | ||||||
| Catcher Technology | 562,900 | 3,912,247 | ||||
| Everlight Electronics | 446 | 1,983 | ||||
| First Steamship | 7,000,000 a | 19,622,990 | ||||
| Gemtek Technology | 7,709,014 | 17,510,630 | ||||
| KGI Securities | 40,000,000 | 23,156,112 | ||||
| Shin Kong Financial Holding | 12,581,954 | 11,855,160 | ||||
| Taiwan Fertilizer | 7,905,000 | 20,574,021 | ||||
| Yang Ming Marine Transport | 31,057,701 | 25,753,399 | ||||
| 122,386,542 | ||||||
| United States—.1% | ||||||
| Far East Energy | 1,730,000 a | 2,370,100 | ||||
| Far East Energy (warrants) | 625,000 a | 0 | ||||
| 2,370,100 | ||||||
| Total Investments (cost $1,166,903,959) | 97.4% | 1,781,973,737 | ||||
| Cash and Receivables (Net) | 2.6% | 48,315,485 | ||||
| Net Assets | 100.0% | 1,830,289,222 | ||||
| ADR—American Depository Receipts |
| a Non-income producing security. |
| Portfolio Summary (Unaudited) † | ||||||
| Value (%) | Value (%) | |||||
| Financial | 23.5 | Telecommunication Services | 6.4 | |||
| Industrial | 17.7 | Technology | 3.2 | |||
| Materials | 16.2 | Utilities | 1.4 | |||
| Consumer Discretionary | 11.5 | Health Care | 1.2 | |||
| Energy | 9.2 | |||||
| Consumer Staples | 7.1 | 97.4 | ||||
| † Based on net assets. |
| See notes to financial statements. |
The Fund 11
| STATEMENT OF ASSETS AND LIABILITIES |
| October 31, 2007 |
| Cost | Value | |||
| Assets ($): | ||||
| Investments in securities—See Statement of Investments | 1,166,903,959 | 1,781,973,737 | ||
| Cash | 14,537,370 | |||
| Cash denominated in foreign currencies | 24,370,807 | 24,634,949 | ||
| Receivable for shares of Common Stock subscribed | 20,560,255 | |||
| Dividends receivable | 539,206 | |||
| Prepaid expenses | 45,572 | |||
| 1,842,291,089 | ||||
| Liabilities ($): | ||||
| Due to The Dreyfus Corporation and affiliates—Note 3(c) | 2,972,905 | |||
| Payable for shares of Common Stock redeemed | 4,540,175 | |||
| Payable for investment securities purchased | 4,173,337 | |||
| Net unrealized depreciation on forward | ||||
| currency exchange contracts—Note 4 | 2,942 | |||
| Accrued expenses | 312,508 | |||
| 12,001,867 | ||||
| Net Assets ($) | 1,830,289,222 | |||
| Composition of Net Assets ($): | ||||
| Paid-in capital | 1,003,178,450 | |||
| Accumulated net realized gain (loss) on investments | 211,776,316 | |||
| Accumulated net unrealized appreciation (depreciation) | ||||
| on investments and foreign currency transactions | 615,334,456 | |||
| Net Assets ($) | 1,830,289,222 |
| Net Asset Value Per Share | ||||||||||
| Class A | Class B | Class C | Class I | Class T | ||||||
| Net Assets ($) | 1,008,290,916 | 60,318,612 | 513,012,463 | 233,750,558 | 14,916,673 | |||||
| Shares Outstanding | 14,843,832 | 939,769 | 7,999,480 | 3,386,858 | 225,954 | |||||
| Net Asset Value | ||||||||||
| Per Share ($) | 67.93 | 64.18 | 64.13 | 69.02 | 66.02 | |||||
See notes to financial statements.
12
| STATEMENT OF OPERATIONS |
| Year Ended October 31, 2007 |
| Investment Income ($): | ||
| Cash dividends (net of $397,659 foreign taxes withheld at source) | 13,347,128 | |
| Interest | 138,613 | |
| Total Income | 13,485,741 | |
| Expenses: | ||
| Investment advisory fees—Note 3(a) | 11,237,742 | |
| Shareholder servicing costs—Note 3(c) | 2,865,952 | |
| Distribution fees—Note 3(b) | 2,151,101 | |
| Custodian fees—Note 3(c) | 1,009,383 | |
| Registration fees | 206,842 | |
| Directors’ fees and expenses—Note 3(d) | 133,153 | |
| Prospectus and shareholders’ reports | 91,762 | |
| Professional fees | 52,222 | |
| Miscellaneous | 46,518 | |
| Total Expenses | 17,794,675 | |
| Less—reduction in custody fees due to | ||
| earnings credits—Note 1(c) | (198,888) | |
| Net Expenses | 17,595,787 | |
| Investment (Loss)—Net | (4,110,046) | |
| Realized and Unrealized Gain (Loss) on Investments—Note 4 ($): | ||
| Net realized gain (loss) on investments and foreign currency transactions | 223,291,998 | |
| Net realized gain (loss) on forward currency exchange contracts | (1,987,548) | |
| Net Realized Gain (Loss) | 221,304,450 | |
| Net unrealized appreciation (depreciation) | ||
| on investments and foreign currency transactions | 582,688,386 | |
| Net Realized and Unrealized Gain (Loss) on Investments | 803,992,836 | |
| Net Increase in Net Assets Resulting from Operations | 799,882,790 | |
See notes to financial statements.
The Fund 13
STATEMENT OF CHANGES IN NET ASSETS
| Year Ended October 31, | ||||
| 2007a | 2006 | |||
| Operations ($): | ||||
| Investment income (loss)—net | (4,110,046) | 240,621 | ||
| Net realized gain (loss) on investments | 221,304,450 | 47,166,456 | ||
| Net unrealized appreciation | ||||
| (depreciation) on investments | 582,688,386 | 31,508,736 | ||
| Net Increase (Decrease) in Net Assets | ||||
| Resulting from Operations | 799,882,790 | 78,915,813 | ||
| Dividends to Shareholders from ($): | ||||
| Investment income—net: | ||||
| Class A shares | (2,778,893) | (42,341) | ||
| Class B shares | (241,195) | — | ||
| Class C shares | (938,449) | — | ||
| Class I shares | (472,716) | (9,713) | ||
| Class T shares | (18,762) | — | ||
| Net realized gain on investments: | ||||
| Class A shares | (25,280,635) | — | ||
| Class B shares | (4,586,585) | — | ||
| Class C shares | (13,094,855) | — | ||
| Class I shares | (3,775,788) | — | ||
| Class T shares | (204,147) | — | ||
| Total Dividends | (51,392,025) | (52,054) | ||
| Capital Stock Transactions ($): | ||||
| Net proceeds from shares sold: | ||||
| Class A shares | 718,938,070 | 125,360,265 | ||
| Class B shares | 5,796,182 | 10,088,044 | ||
| Class C shares | 344,453,119 | 42,577,169 | ||
| Class I shares | 247,388,031 | 33,060,006 | ||
| Class T shares | 12,165,266 | 1,025,598 | ||
14
| Year Ended October 31, | ||||
| 2007a | 2006 | |||
| Capital Stock Transactions ($) (continued): | ||||
| Dividends reinvested: | ||||
| Class A shares | 22,474,328 | 33,289 | ||
| Class B shares | 3,608,275 | — | ||
| Class C shares | 8,908,370 | — | ||
| Class I shares | 3,951,021 | 8,607 | ||
| Class T shares | 188,437 | — | ||
| Cost of shares redeemed: | ||||
| Class A shares | (307,319,084) | (67,011,749) | ||
| Class B shares | (18,553,199) | (8,343,532) | ||
| Class C shares | (128,746,883) | (18,741,572) | ||
| Class I shares | (133,597,356) | (19,869,755) | ||
| Class T shares | (3,256,517) | (724,629) | ||
| Increase (Decrease) in Net Assets | ||||
| from Capital Stock Transactions | 776,398,060 | 97,461,741 | ||
| Total Increase (Decrease) in Net Assets | 1,524,888,825 | 176,325,500 | ||
| Net Assets ($): | ||||
| Beginning of Period | 305,400,397 | 129,074,897 | ||
| End of Period | 1,830,289,222 | 305,400,397 | ||
| Investment (loss)—net | — | (602,339) | ||
The Fund 15
STATEMENT OF CHANGES IN NET ASSETS (continued)
| Year Ended October 31, | ||||
| 2007a | 2006 | |||
| Capital Share Transactions: | ||||
| Class Ab | ||||
| Shares sold | 15,557,507 | 4,346,522 | ||
| Shares issued for dividends reinvested | 666,219 | 1,545 | ||
| Shares redeemed | (6,711,173) | (2,400,824) | ||
| Net Increase (Decrease) in Shares Outstanding | 9,512,553 | 1,947,243 | ||
| Class B b | ||||
| Shares sold | 139,160 | 369,187 | ||
| Shares issued for dividends reinvested | 112,442 | — | ||
| Shares redeemed | (442,791) | (326,226) | ||
| Net Increase (Decrease) in Shares Outstanding | (191,189) | 42,961 | ||
| Class C | ||||
| Shares sold | 7,692,714 | 1,529,838 | ||
| Shares issued for dividends reinvested | 277,922 | — | ||
| Shares redeemed | (2,902,931) | (741,776) | ||
| Net Increase (Decrease) in Shares Outstanding | 5,067,705 | 788,062 | ||
| Class I | ||||
| Shares sold | 5,620,916 | 1,120,363 | ||
| Shares issued for dividends reinvested | 115,561 | 395 | ||
| Shares redeemed | (2,946,234) | (686,656) | ||
| Net Increase (Decrease) in Shares Outstanding | 2,790,243 | 434,102 | ||
| Class T | ||||
| Shares sold | 253,629 | 35,069 | ||
| Shares issued for dividends reinvested | 5,734 | — | ||
| Shares redeemed | (73,618) | (27,506) | ||
| Net Increase (Decrease) in Shares Outstanding | 185,745 | 7,563 | ||
| a | Effective June 1, 2007, the fund redesignated Class R shares to Class I shares. | |
| b | During the period ended October 31, 2007, 28,729 Class B shares representing $1,217,976 were automatically | |
| converted to 27,253 Class A shares and during the period ended October 31, 2006, 34,258 Class B shares | ||
| representing $894,279 were automatically converted to 32,730 Class A shares. | ||
| See notes to financial statements. | ||
16
FINANCIAL HIGHLIGHTS
The following tables describe the performance for each share class for the fiscal periods indicated. All information (except portfolio turnover rate) reflects financial results for a single fund share.Total return shows how much your investment in the fund would have increased (or decreased) during each period, assuming you had reinvested all dividends and distributions.These figures have been derived from the fund’s financial statements.
| Year Ended October 31, | ||||||||||
| Class A Shares | 2007 | 2006 | 2005 | 2004 | 2003 | |||||
| Per Share Data ($): | ||||||||||
| Net asset value, beginning of period | 31.02 | 19.32 | 19.64 | 19.18 | 12.26 | |||||
| Investment Operations: | ||||||||||
| Investment income (loss)-net a | (.12) | .12 | .12 | .21 | .10 | |||||
| Net realized and unrealized | ||||||||||
| gain (loss) on investments | 41.61 | 11.59 | (.15) | .48 | 6.88 | |||||
| Total from Investment Operations | 41.49 | 11.71 | (.03) | .69 | 6.98 | |||||
| Distributions: | ||||||||||
| Dividends from investment income—net | (.45) | (.01) | (.13) | (.04) | (.06) | |||||
| Dividends from net realized | ||||||||||
| gain on investments | (4.13) | — | (.16) | (.19) | — | |||||
| Total Distributions | (4.58) | (.01) | (.29) | (.23) | (.06) | |||||
| Net asset value, end of period | 67.93 | 31.02 | 19.32 | 19.64 | 19.18 | |||||
| Total Return (%) b | 148.75 | 60.66 | (.29) | 3.70 | 57.25 | |||||
| Ratios/Supplemental Data (%): | ||||||||||
| Ratio of total expenses | ||||||||||
| to average net assets | 1.77 | 1.92 | 2.05 | 2.09 | 2.82 | |||||
| Ratio of net expenses | ||||||||||
| to average net assets | 1.75 | 1.88 | 2.04 | 2.09 | 2.25 | |||||
| Ratio of net investment income | ||||||||||
| (loss) to average net assets | (.26) | .44 | .56 | 1.02 | .68 | |||||
| Portfolio Turnover Rate | 106.59 | 188.08 | 178.32 | 154.41 | 194.40 | |||||
| Net Assets, end of period ($ x 1,000) | 1,008,291 | 165,363 | 65,371 | 70,072 | 33,324 | |||||
| a | Based on average shares outstanding at each month end. | |
| b | Exclusive of sales charge. | |
| See notes to financial statements. | ||
The Fund 17
FINANCIAL HIGHLIGHTS (continued)
| Year Ended October 31, | ||||||||||
| Class B Shares | 2007 | 2006 | 2005 | 2004 | 2003 | |||||
| Per Share Data ($): | ||||||||||
| Net asset value, beginning of period | 29.53 | 18.53 | 18.89 | 18.56 | 11.89 | |||||
| Investment Operations: | ||||||||||
| Investment income (loss)-net a | (.50) | (.14) | (.05) | .08 | .00b | |||||
| Net realized and unrealized gain | ||||||||||
| (loss) on investments | 39.50 | 11.14 | (.13) | .44 | 6.67 | |||||
| Total from Investment Operations | 39.00 | 11.00 | (.18) | .52 | 6.67 | |||||
| Distributions: | ||||||||||
| Dividends from investment income—net | (.22) | — | (.02) | — | — | |||||
| Dividends from net realized | ||||||||||
| gain on investments | (4.13) | — | (.16) | (.19) | — | |||||
| Total Distributions | (4.35) | — | (.18) | (.19) | — | |||||
| Net asset value, end of period | 64.18 | 29.53 | 18.53 | 18.89 | 18.56 | |||||
| Total Return (%) c | 146.79 | 59.37 | (1.08) | 2.88 | 56.10 | |||||
| Ratios/Supplemental Data (%): | ||||||||||
| Ratio of total expenses | ||||||||||
| to average net assets | 2.58 | 2.73 | 2.84 | 2.87 | 3.66 | |||||
| Ratio of net expenses | ||||||||||
| to average net assets | 2.56 | 2.70 | 2.83 | 2.86 | 3.00 | |||||
| Ratio of net investment income | ||||||||||
| (loss) to average net assets | (1.19) | (.55) | (.23) | .38 | .01 | |||||
| Portfolio Turnover Rate | 106.59 | 188.08 | 178.32 | 154.41 | 194.40 | |||||
| Net Assets, end of period ($ x 1,000) | 60,319 | 33,402 | 20,160 | 20,601 | 6,420 | |||||
| a | Based on average shares outstanding at each month end. | |
| b | Amount represents less than $.01 per share. | |
| c | Exclusive of sales charge. | |
| See notes to financial statements. | ||
18
| Year Ended October 31, | ||||||||||
| Class C Shares | 2007 | 2006 | 2005 | 2004 | 2003 | |||||
| Per Share Data ($): | ||||||||||
| Net asset value, beginning of period | 29.56 | 18.54 | 18.91 | 18.57 | 11.90 | |||||
| Investment Operations: | ||||||||||
| Investment income (loss)-net a | (.46) | (.11) | (.04) | .07 | (.01) | |||||
| Net realized and unrealized gain | ||||||||||
| (loss) on investments | 39.46 | 11.13 | (.15) | .46 | 6.68 | |||||
| Total from Investment Operations | 39.00 | 11.02 | (.19) | .53 | 6.67 | |||||
| Distributions: | ||||||||||
| Dividends from investment income—net | (.30) | — | (.02) | (.00)b | (.00)b | |||||
| Dividends from net realized | ||||||||||
| gain on investments | (4.13) | — | (.16) | (.19) | — | |||||
| Total Distributions | (4.43) | — | (.18) | (.19) | (.00)b | |||||
| Net asset value, end of period | 64.13 | 29.56 | 18.54 | 18.91 | 18.57 | |||||
| Total Return (%) c | 146.90 | 59.44 | (1.07) | 2.90 | 56.08 | |||||
| Ratios/Supplemental Data (%): | ||||||||||
| Ratio of total expenses | ||||||||||
| to average net assets | 2.53 | 2.69 | 2.82 | 2.83 | 3.42 | |||||
| Ratio of net expenses | ||||||||||
| to average net assets | 2.51 | 2.66 | 2.82 | 2.83 | 2.97 | |||||
| Ratio of net investment income | ||||||||||
| (loss) to average net assets | (1.03) | (.42) | (.21) | .33 | (.08) | |||||
| Portfolio Turnover Rate | 106.59 | 188.08 | 178.32 | 154.41 | 194.40 | |||||
| Net Assets, end of period ($ x 1,000) | 513,012 | 86,666 | 39,748 | 40,423 | 14,363 | |||||
| a | Based on average shares outstanding at each month end. | |
| b | Amount represents less than $.01 per share. | |
| c | Exclusive of sales charge. | |
| See notes to financial statements. | ||
The Fund 19
FINANCIAL HIGHLIGHTS (continued)
| Year Ended October 31, | ||||||||||
| Class I Shares | 2007a | 2006 | 2005 | 2004 | 2003 | |||||
| Per Share Data ($): | ||||||||||
| Net asset value, beginning of period | 31.43 | 19.56 | 19.88 | 19.38 | 12.36 | |||||
| Investment Operations: | ||||||||||
| Investment income—net b | .08 | .33 | .14 | .28 | .14 | |||||
| Net realized and unrealized | ||||||||||
| gain (loss) on investments | 42.16 | 11.60 | (.13) | .48 | 6.97 | |||||
| Total from Investment Operations | 42.24 | 11.93 | .01 | .76 | 7.11 | |||||
| Distributions: | ||||||||||
| Dividends from investment income—net | (.52) | (.06) | (.17) | (.07) | (.09) | |||||
| Dividends from net realized | ||||||||||
| gain on investments | (4.13) | — | (.16) | (.19) | — | |||||
| Total Distributions | (4.65) | (.06) | (.33) | (.26) | (.09) | |||||
| Net asset value, end of period | 69.02 | 31.43 | 19.56 | 19.88 | 19.38 | |||||
| Total Return (%) | 149.45 | 61.14 | (.04) | 3.96 | 57.93 | |||||
| Ratios/Supplemental Data (%): | ||||||||||
| Ratio of total expenses | ||||||||||
| to average net assets | 1.49 | 1.62 | 1.77 | 1.80 | 2.56 | |||||
| Ratio of net expenses | ||||||||||
| to average net assets | 1.47 | 1.58 | 1.77 | 1.80 | 1.92 | |||||
| Ratio of net investment income | ||||||||||
| to average net assets | .16 | 1.13 | .68 | 1.28 | 1.04 | |||||
| Portfolio Turnover Rate | 106.59 | 188.08 | 178.32 | 154.41 | 194.40 | |||||
| Net Assets, end of period ($ x 1,000) | 233,751 | 18,752 | 3,179 | 4,854 | 1,570 | |||||
| a | Effective June 1, 2007, the fund redesignated Class R shares to Class I shares. | |
| b | Based on average shares outstanding at each month end. | |
| See notes to financial statements. | ||
20
| Year Ended October 31, | ||||||||||
| Class T Shares | 2007 | 2006 | 2005 | 2004 | 2003 | |||||
| Per Share Data ($): | ||||||||||
| Net asset value, beginning of period | 30.27 | 18.91 | 19.26 | 18.83 | 12.07 | |||||
| Investment Operations: | ||||||||||
| Investment income (loss)—net a | (.26) | .01 | .17 | .18 | .21 | |||||
| Net realized and unrealized | ||||||||||
| gain (loss) on investments | 40.52 | 11.35 | (.27) | .46 | 6.64 | |||||
| Total from Investment Operations | 40.26 | 11.36 | (.10) | .64 | 6.85 | |||||
| Distributions: | ||||||||||
| Dividends from investment income—net | (.38) | — | (.09) | (.02) | (.09) | |||||
| Dividends from net realized | ||||||||||
| gain on investments | (4.13) | — | (.16) | (.19) | — | |||||
| Total Distributions | (4.51) | — | (.25) | (.21) | (.09) | |||||
| Net asset value, end of period | 66.02 | 30.27 | 18.91 | 19.26 | 18.83 | |||||
| Total Return (%) b | 148.04 | 60.07 | (.58) | 3.44 | 57.16 | |||||
| Ratios/Supplemental Data (%): | ||||||||||
| Ratio of total expenses | ||||||||||
| to average net assets | 2.08 | 2.28 | 2.29 | 2.43 | 3.46 | |||||
| Ratio of net expenses | ||||||||||
| to average net assets | 2.04 | 2.25 | 2.29 | 2.40 | 2.36 | |||||
| Ratio of net investment income | ||||||||||
| (loss) to average net assets | (.55) | .02 | .81 | .85 | 1.51 | |||||
| Portfolio Turnover Rate | 106.59 | 188.08 | 178.32 | 154.41 | 194.40 | |||||
| Net Assets, end of period ($ x 1,000) | 14,917 | 1,217 | 617 | 855 | 295 | |||||
| a | Based on average shares outstanding at each month end. | |
| b | Exclusive of sales charge. | |
| See notes to financial statements. | ||
The Fund 21
NOTES TO FINANCIAL STATEMENTS
NOTE 1—Significant Accounting Policies:
Dreyfus Premier Greater China Fund (the “fund”) is a separate non-diversified portfolio of Dreyfus Premier International Funds, Inc. (the “Company”) which is registered under the Investment Company Act of 1940, as amended (the “Act”), as an open-end management investment company and operates as a series company currently offering two series, including the fund.The fund’s investment objective is long-term capital appreciation.The Dreyfus Corporation (the “Manager” or “Dreyfus”) serves as the fund’s investment adviser. Hamon U.S. Investment Advisors Limited (“Hamon”) serves as the fund’s sub-investment adviser. Hamon is an affiliate of Dreyfus.
On July 1,2007,Mellon Financial Corporation (“Mellon Financial”) and The Bank of New York Company, Inc. merged, forming The Bank of New York Mellon Corporation (“BNY Mellon”). As part of this transaction, Dreyfus became a wholly-owned subsidiary of BNY Mellon.
The fund’s Board of Directors approved the redesignation of the fund’s Class R shares as Class I shares, effective June 1, 2007.The description of the eligibility requirements for Class I shares remains the same as it was for Class R shares.
MBSC Securities Corporation (the “Distributor”), a wholly-owned subsidiary of Dreyfus, is the distributor of the fund’s shares.The fund is authorized to issue 200 million shares of $.001 par value Common Stock in each of the following classes of shares: Class A, Class B, Class C, Class I and Class T. Class A and Class T shares are subject to a sales charge imposed at the time of purchase. Class B shares are subject to a contingent deferred sales charge (“CDSC”) imposed on Class B share redemptions made within six years of purchase and automatically convert to Class A shares after six years. Class C shares are subject to a CDSC imposed on Class C shares redeemed within one year of purchase and Class I shares are sold at net asset value per share only to institutional investors. Other differences between the classes include the services offered to and the expenses borne by each class, the allocation of certain transfer agency costs and certain voting rights. Income, expenses (other than expenses attributable to a specific class), and realized and unrealized gains or losses on investments are allocated to each class of shares based on its relative net assets.
22
The Company accounts separately for the assets, liabilities and operations of each series. Expenses directly attributable to each series are charged to that series’ operations; expenses which are applicable to all series are allocated among them on a pro rata basis.
The fund’s financial statements are prepared in accordance with U.S. generally accepted accounting principles, which may require the use of management estimates and assumptions. Actual results could differ from those estimates.
The fund enters into contracts that contain a variety of indemnifications. The fund’s maximum exposure under these arrangements is unknown.The fund does not anticipate recognizing any loss related to these arrangements.
(a) Portfolio valuation: Investments in securities are valued at the last sales price on the securities exchange or national securities market on which such securities are primarily traded. Securities listed on the National Market System for which market quotations are available, are valued at the official closing price or, if there is no official closing price that day, at the last sale price. Securities not listed on an exchange or the national securities market, or securities for which there were no transactions, are valued at the average of the most recent bid and asked prices, except for open short positions, where the asked price is used for valuation purposes. Bid price is used when no asked price is available. Registered open-end investment companies that are not traded on an exchange are valued at their net asset value.When market quotations or official closing prices are not readily available, or are determined not to reflect accurately fair value, such as when the value of a security has been significantly affected by events after the close of the exchange or market on which the security is principally traded (for example, a foreign exchange or market), but before the fund calculates its NAV, the fund may value these investments at fair value as determined in accordance with the procedures approved by the Board of Directors. Fair valuing of securities may be determined with the assistance of a pricing service using calculations based on indices of domestic securities and other appropriate indicators, such as prices of relevant ADR’s and futures contracts. For other securities that are fair valued by the Board of Directors, certain factors may be considered such as: fundamental analytical data, the nature and duration of restrictions on disposition, an evaluation of the forces that influence the market in which the securities are purchased and sold, and public trading in similar securities of the issuer or comparable issuers. Financial futures and options are valued at the last sales price. Investments denominated in foreign currencies are translated to U.S. dollars at the prevailing rates of exchange. Forward currency exchange contracts are valued at the forward rate.
The Fund 23
NOTES TO FINANCIAL STATEMENTS (continued)
The Financial Accounting Standards Board (“FASB”) released Statement of Financial Accounting Standards No. 157 “Fair Value Measurements” (“FAS 157”). FAS 157 establishes an authoritative definition of fair value, sets out a framework for measuring fair value, and requires additional disclosures about fair-value measurements.The application of FAS 157 is required for fiscal years beginning after November 15, 2007 and interim periods within those fiscal years. Management does not believe that the application of this standard will have a material impact on the financial statements of the fund.
(b) Foreign currency transactions: The fund does not isolate that portion of the results of operations resulting from changes in foreign exchange rates on investments from the fluctuations arising from changes in market prices of securities held. Such fluctuations are included with the net realized and unrealized gain or loss on investments.
Net realized foreign exchange gains or losses arise from sales and maturities of short-term securities, sales of foreign currencies, currency gains or losses realized on securities transactions and the difference between the amounts of dividends, interest, and foreign withholding taxes recorded on the fund’s books and the U.S. dollar equivalent of the amounts actually received or paid. Net unrealized foreign exchange gains and losses arise from changes in the value of assets and liabilities other than investments in securities, resulting from changes in exchange rates. Such gains and losses are included with net realized and unrealized gain or loss on investments.
24
(c) Securities transactions and investment income: Securities transactions are recorded on a trade date basis. Realized gain and loss from securities transactions are recorded on the identified cost basis. Dividend income is recognized on the ex-dividend date and interest income, including, where applicable, accretion of discount and amortization of premium on investments, is recognized on the accrual basis.
The fund has an arrangement with the custodian bank whereby the fund receives earnings credits from the custodian when positive cash balances are maintained, which are used to offset custody fees. For financial reporting purposes, the fund includes net earnings credits as an expense offset in the Statement of Operations.
(d) Dividends to shareholders: Dividends are recorded on the ex-dividend date. Dividends from investment income-net and dividends from net realized capital gain, if any, are normally declared and paid annually, but the fund may make distributions on a more frequent basis to comply with the distribution requirements of the Internal Revenue Code of 1986, as amended (the “Code”).To the extent that net realized capital gain can be offset by capital loss carryovers, if any, it is the policy of the fund not to distribute such gain. Income and capital gain distributions are determined in accordance with income tax regulations, which may differ from U.S. generally accepted accounting principles.
(e) Federal income taxes: It is the policy of the fund to continue to qualify as a regulated investment company, if such qualification is in the best interests of its shareholders, by complying with the applicable provisions of the Code, and to make distributions of taxable income sufficient to relieve it from substantially all federal income and excise taxes.
The Fund 25
NOTES TO FINANCIAL STATEMENTS (continued)
The FASB released FASB Interpretation No. 48 “Accounting for Uncertainty in Income Taxes” (FIN 48). FIN 48 provides guidance for how uncertain tax positions should be recognized, measured, presented and disclosed in the financial statements.FIN 48 requires the evaluation of tax positions taken or expected to be taken in the course of preparing the fund’s tax returns to determine whether the tax positions are “more-likely-than-not” of being sustained by the applicable tax authority. Tax positions not deemed to meet the more-likely-than-not threshold would be recorded as a tax benefit or expense in the current year. Adoption of FIN 48 is required for fiscal years beginning after December 15, 2006 and is to be applied to all open tax years as of the effective date. Management does not believe that the application of this standard will have a material impact on the financial statements of the fund.
At October 31, 2007, the components of accumulated earnings on a tax basis were as follows: undistributed ordinary income $178,576,776, undistributed capital gains $34,592,967 and unrealized appreciation $613,941,029.
The tax character of distributions paid to shareholders during the fiscal years ended October 31, 2007 and October 31, 2006, were as follows: ordinary income $34,234,798 and $52,054 and long-term capital gains $17,157,227 and $0, respectively.
During the period ended October 31, 2007, as a result of permanent book to tax differences, primarily due to the tax treatment for foreign currency gains and losses, passive foreign investment companies and net operating losses, the fund increased accumulated undistributed investment income-net by $9,162,400 and decreased accumulated net realized gain (loss) on investments by the same amount. Net assets and net asset value per shares were not affected by this reclassification.
NOTE 2—Bank Lines of Credit:
The fund may borrow up to $5 million for leveraging purposes under a short-term unsecured line of credit and participates with other Dreyfus-managed funds in a $100 million unsecured line of credit primarily to be utilized for temporary or emergency purposes, including the financing of redemptions. Interest is charged to the fund based on prevailing market rates in effect at the time of borrowing. During the period ended October 31, 2007, the fund did not borrow under either line of credit.
26
NOTE 3—Investment Advisory Fee, Sub-Investment Advisory Fee and Other Transactions With Affiliates:
(a) Pursuant to an Investment Advisory Agreement (“Agreement”) with Dreyfus, the investment advisory fee is computed at the annual rate of 1.25% of the value of the fund’s average daily net assets and is payable monthly.
Pursuant to a Sub-Investment Advisory Agreement between Dreyfus and Hamon, Dreyfus pays Hamon a fee payable monthly at the annual rate of .625% of the value of the fund’s average daily net assets.
During the period ended October 31, 2007, the Distributor retained $1,897,541 and $33,758 from commissions earned on sales of the fund’s Class A and Class T shares, respectively, and $176,722 and $491,857 from CDSC on redemptions of the fund’s Class B and Class C shares, respectively.
(b) Under the Distribution Plan (the “Plan”) adopted pursuant to Rule 12b-1 under the Act, Class B, Class C and Class T shares pay the Distributor for distributing their shares at an annual rate of .75% of the value of the average daily net assets of Class B and Class C shares and .25% of the value of the average daily net assets of Class T shares. During the period ended October 31, 2007, Class B, Class C and Class T shares were charged $341,547, $1,796,799 and $12,755, respectively, pursuant to the Plan.
(c) Under the Shareholder Services Plan, Class A, Class B, Class C and Class T shares pay the Distributor at an annual rate of .25% of the value of their average daily net assets for the provision of certain services. The services provided may include personal services relating to shareholder accounts, such as answering shareholder inquiries regarding the fund and providing reports and other information, and services related to the maintenance of shareholder accounts. The Distributor may make payments to Service Agents (a securities dealer, financial institution or other industry professional) in respect of these services. The Distributor determines the amounts to be paid to Service Agents. During the period ended October 31, 2007, Class A, Class B, Class C and Class T shares were charged $1,216,539, $113,849, $598,933 and $12,755, respectively, pursuant to the Shareholder Services Plan.
The Fund 27
NOTES TO FINANCIAL STATEMENTS (continued)
The fund compensates Dreyfus Transfer, Inc., a wholly-owned subsidiary of Dreyfus, under a transfer agency agreement for providing personnel and facilities to perform transfer agency services for the fund. During the period ended October 31, 2007, the fund was charged $372,362 pursuant to the transfer agency agreement.
Effective July 1, 2007, the fund’s custodian, The Bank of New York, became an affiliate of the Manager. Under the fund’s pre-existing custody agreement with The Bank of New York, for providing custodial services for the fund for the four months ended October 31, 2007, the fund was charged $536,609. Prior to becoming an affiliate,The Bank of New York was paid $472,774 for custody services to the fund for the eight months ended June 30, 2007.
During the period ended October 31, 2007, the fund was charged $4,660 for services performed by the Chief Compliance Officer.
The components of “Due to The Dreyfus Corporation and affiliates” in the Statement of Assets and Liabilities consist of:investment advisory fees $1,813,410, Rule 12b-1 distribution plan fees $342,482, shareholder services plan fees $315,520, custodian fees $418,281, chief compliance officer fees $2,812 and transfer agency per account fees $80,400.
(d) Each Board member also serves as a Board member of other funds within the Dreyfus complex. Annual retainer fees and attendance fees are allocated to each fund based on net assets.
NOTE 4-Securities Transactions:
The aggregate amount of purchases and sales of investment securities, excluding short-term securities and forward currency exchange con-
28
tracts, during the period ended October 31, 2007, amounted to $1,634,743,290 and $950,483,449, respectively.
The fund enters into forward currency exchange contracts in order to hedge its exposure to changes in foreign currency exchange rates on its foreign portfolio holdings and to settle foreign currency transac-tions.When executing forward currency exchange contracts, the fund is obligated to buy or sell a foreign currency at a specified rate on a certain date in the future. With respect to sales of forward currency exchange contracts, the fund would incur a loss if the value of the contract increases between the date the forward contract is opened and the date the forward contract is closed.The fund realizes a gain if the value of the contract decreases between those dates. With respect to purchases of forward currency exchange contracts, the fund would incur a loss if the value of the contract decreases between the date the forward contract is opened and the date the forward contract is closed. The fund realizes a gain if the value of the contract increases between those dates. The fund is also exposed to credit risk associated with counter party nonperformance on these forward currency exchange contracts which is typically limited to the unrealized gain on each open contract. The following summarizes open forward currency exchange contracts at October 31, 2007:
| Foreign | ||||||||
| Forward Currency | Currency | Unrealized | ||||||
| Exchange Contracts | Amounts | Cost ($) | Value ($) | (Depreciation) ($) | ||||
| Purchases: | ||||||||
| Hong Kong Dollar, | ||||||||
| expiring 11/1/2007 | 30,980,000 | 4,000,000 | 3,997,058 | (2,942) |
At October 31, 2007, the cost of investments for federal income tax purposes was $1,168,297,386; accordingly, accumulated net unrealized appreciation on investments was $613,676,351, consisting of $626,518,739 gross unrealized appreciation and $12,842,388 gross unrealized depreciation.
The Fund 29
| REPORT OF INDEPENDENT REGISTERED |
| PUBLIC ACCOUNTING FIRM |
| Shareholders and Board of Directors |
| Dreyfus Premier Greater China Fund |
We have audited the accompanying statement of assets and liabilities, including the statement of investments, of Dreyfus Premier Greater China Fund (one of the series comprising Dreyfus Premier International Funds, Inc.) as of October 31, 2007, and the related statement of operations for the year then ended, the statement of changes in net assets for each of the two years in the period then ended, and financial highlights for each of the years indicated therein.These financial statements and financial highlights are the responsibility of the Fund’s management. Our responsibility is to express an opinion on these financial statements and financial highlights based on our audits.
We conducted our audits in accordance with the standards of the Public Company Accounting Oversight Board (United States).Those standards require that we plan and perform the audit to obtain reasonable assurance about whether the financial statements and financial highlights are free of material misstatement.We were not engaged to perform an audit of the Fund’s internal control over financial reporting. Our audits included consideration of internal control over financial reporting as a basis for designing audit procedures that are appropriate in the circumstances, but not for the purpose of expressing an opinion on the effectiveness of the Fund’s internal control over financial reporting. Accordingly, we express no such opinion.An audit also includes examining, on a test basis, evidence supporting the amounts and disclosures in the financial statements and financial highlights, assessing the accounting principles used and significant estimates made by management, and evaluating the overall financial statement presentation. Our procedures included confirmation of securities owned as of October 31, 2007 by correspondence with the custodian and others or by other appropriate auditing procedures where replies from others were not received. We believe that our audits provide a reasonable basis for our opinion.
In our opinion, the financial statements and financial highlights referred to above present fairly, in all material respects, the financial position of Dreyfus Premier Greater China Fund at October 31, 2007, the results of its operations for the year then ended, the changes in its net assets for each of the two years in the period then ended, and the financial highlights for each of the indicated years, in conformity with U.S. generally accepted accounting principles.

| New York, New York |
| December 20, 2007 |
30
IMPORTANT TAX INFORMATION ( U n a u d i t e d )
In accordance with federal tax law, the fund elects to provide each shareholder with their portion of the fund’s foreign taxes paid and the income sourced from foreign countries. Accordingly, the fund hereby makes the following designations regarding its fiscal year ended October 31, 2007:
As required by federal tax law rules, shareholders will receive notification of their proportionate share of foreign taxes paid and foreign sourced income for the 2007 calendar year with Form 1099-DIV which will be mailed by January 31, 2008. For the fiscal year ended October 31, 2007, certain dividends paid by the fund may be subject to a maximum tax rate of 15%, as provided for by the Jobs and Growth Tax Relief Reconciliation Act of 2003. Of the distributions paid during the fiscal year, $2,081,434 represents the maximum amount that may be considered qualified dividend income. Also, the fund hereby designates $1.5096 per share as a long-term capital gain distribution and $2.6207 per share as a short-term capital gain distribution paid on December 22, 2006.
The Fund 31
| INFORMATION ABOUT THE REVIEW AND APPROVAL |
| OF THE FUND’S MANAGEMENT AGREEMENT (Unaudited) |
At a meeting of the fund’s Board held on May 23, 2007, the Board unanimously approved the continuation of the fund’s Management Agreement with Dreyfus and the Sub-Investment Advisory Agreement between Dreyfus and Hamon U.S. Investment Advisors Limited (“Hamon”) (together, the “Agreements”) for a one-year term ending July 31, 2008.The Board members, none of whom are “interested persons” (as defined in the Investment Company Act of 1940, as amended) of the fund were assisted in their review by independent legal counsel and met with counsel in executive session separate from representatives of Dreyfus. In approving the continuance of the Agreements, the Board considered all factors that they believed to be relevant, including, among other things, the factors discussed below.
Analysis of Nature, Extent and Quality of Services Provided to the Fund. The Board members received a presentation from representatives of Dreyfus regarding services provided to the fund and other funds in the Dreyfus fund complex, and discussed the nature, extent and quality of the services provided to the fund by Dreyfus and Hamon pursuant to their Agreements. Dreyfus’s representatives reviewed the fund’s distribution of accounts and the relationships Dreyfus has with various intermediaries and the different needs of each. Dreyfus’s representatives noted the various distribution channels for the fund as well as the diverse methods of distribution among other funds in the Dreyfus fund complex, and Dreyfus’s corresponding need for broad, deep, and diverse resources to be able to provide ongoing shareholder services to each distribution channel, including those of the fund. Dreyfus also provided the number of accounts investing in the fund, as well as the fund’s asset size.
The Board members also considered Dreyfus’s and Hamon’s research and portfolio management capabilities and Dreyfus’s oversight of day-to-day fund operations, including fund accounting and administration and assistance in meeting legal and regulatory requirements.The Board members also considered Dreyfus’s extensive administrative, accounting and compliance infrastructure.
32
Comparative Analysis of the Fund’s Performance and Advisory Fee and Expense Ratio. The Board members reviewed the fund’s performance, advisory fee and expense ratio, placing significant emphasis on comparative data supplied by Lipper, Inc., an independent provider of mutual fund data, including contractual and actual (net of fee waivers and expense reimbursements) management fees, operating expense components and total return performance. The fund’s performance was compared to that of a Performance Universe, consisting of all funds with the same Lipper classification/objective, and a Performance Group, consisting of comparable funds chosen by Lipper based on guidelines previously approved by the Board. Similarly, the fund’s contractual and actual advisory fees and operating expenses were compared to those of an Expense Universe, consisting of funds with the same or similar Lipper classification/objective, and an Expense Group, consisting comparable funds chosen by Lipper based on guidelines previously approved by the Board.As part of its review of expenses, the Board also considered other fund expenses, such as transfer agent fees, custody fees, 12b-1 or non-12b-1 service fees (if any), and other non-management fees.
In its review of performance, the Board noted that the fund’s average annual total return ranked in the first quintile of its Performance Group and its Performance Universe for the one-, two-, three-, four-and five-year periods ended March 31, 2007.
In its review of the fund’s advisory fee and operating expenses, the Board examined the range of advisory fees and expense ratios of the funds in the Expense Group and Expense Universe, noting, among other things, that the fund’s actual management fee was higher than the median of the Expense Group, but that the fund’s total expense ratio was lower than the median of the Expense Group.
Representatives of Dreyfus reviewed with the Board members the fees paid to Dreyfus or its affiliates by mutual funds and/or separate accounts managed by Dreyfus with similar investment objectives, policies and strategies as the fund (the “Similar Accounts”), and explained the nature
The Fund 33
| INFORMATION ABOUT THE REVIEW AND APPROVAL OF THE |
| FUND’S MANAGEMENT AGREEMENT (Unaudited) (continued) |
of the Similar Accounts and the differences, from Dreyfus’s perspective, as applicable, in providing services to the Similar Accounts as compared to the fund. Dreyfus’s representatives also reviewed the costs associated with distribution through intermediaries. The Board analyzed differences in fees paid to Dreyfus and discussed the relationship of the advisory fees paid in light of Dreyfus’s performance, and the services provided. The Board members considered the relevance of the fee information provided for the Similar Accounts managed by Dreyfus to evaluate the appropriateness and reasonableness of the fund’s advisory fees. The Board acknowledged that differences in fees paid by the Similar Accounts seemed to be consistent with the services provided.
Analysis of Profitability and Economies of Scale. Dreyfus’s representatives reviewed the dollar amount of expenses allocated and profit received by Dreyfus and the method used to determine such expenses and profit. The Board members evaluated the profitability analysis in light of the relevant circumstances for the fund and the extent to which economies of scale would be realized if the fund grows and whether fee levels reflect these economies of scale for the benefit of fund investors. The Board members also considered potential benefits to Dreyfus from acting as investment adviser and noted that there were no soft dollar arrangements with respect to trading the fund’s investments.
It was noted that the Board members should consider Dreyfus’s profitability with respect to the fund as part of their evaluation of whether the fees under the Advisory Agreement bear a reasonable relationship to the mix of services provided by Dreyfus, including the nature, extent and quality of such services and that a discussion of economies of scale is predicated on a fund having achieved a substantial size increasing assets and that, if a fund’s assets had been static or decreasing, the possibility that Dreyfus may have realized any economies of scale would be less. It also was noted that the profitability percentage for managing the fund was within ranges determined by appropriate court cases to be reasonable given the services rendered and generally superior service levels provided.
34
At the conclusion of these discussions, the Board agreed that it had been furnished with sufficient information to make an informed business decision with respect to continuation of the fund’s Agreements. Based on the discussions and considerations as described above, the Board made the following conclusions and determinations.
- The Board concluded that the nature, extent and quality of the ser- vices provided by Dreyfus and Hamon are adequate and appropriate.
- The Board generally was satisfied with the fund’s performance.
- The Board concluded that the fee paid by the fund to Dreyfus was reasonable in light of the services provided, comparative performance, expense and advisory fee information, costs of the services provided and profits to be realized and benefits derived or to be derived by Dreyfus from its relationship with the fund.
- The Board determined that the economies of scale which may accrue to Dreyfus and its affiliates in connection with the management of the fund had been adequately considered by Dreyfus in connection with the management fee rate charged to the fund and that, to the extent in the future it were determined that material economies of scale had not been shared with the fund, the Board would seek to have those economies of scale shared with the fund.
The Board members considered these conclusions and determinations, along with information received on a routine and regular basis throughout the year, and, without any one factor being dispositive, the Board determined that continuation of the fund’s Agreements was in the best interests of the fund and its shareholders.
The Fund 35
| Joseph S. DiMartino (64) |
| Chairman of the Board (1995) |
| Principal Occupation During Past 5 Years: |
| • Corporate Director and Trustee |
Other Board Memberships and Affiliations:
- The Muscular Dystrophy Association, Director
- Century Business Services, Inc., a provider of outsourcing functions for small and medium size companies, Director
- The Newark Group, a provider of a national market of paper recovery facilities, paperboard mills and paperboard converting plants, Director
- Sunair Services Corporation, a provider of certain outdoor-related services to homes and businesses, Director
No. of Portfolios for which Board Member Serves: 165
———————
| Gordon J. Davis (66) |
| Board Member (1993) |
Principal Occupation During Past 5 Years:
- Partner in the law firm of LeBoeuf, Lamb, Greene & MacRae, LLP
- President, Lincoln Center for the Performing Arts, Inc. (2001)
Other Board Memberships and Affiliations:
- Consolidated Edison, Inc., a utility company, Director
- Phoenix Companies Inc., a life insurance company, Director
- Board Member/Trustee for several not-for-profit groups
No. of Portfolios for which Board Member Serves: 36
———————
| David P. Feldman (68) |
| Board Member (1991) |
| Principal Occupation During Past 5 Years: |
| • Corporate Director and Trustee |
Other Board Memberships and Affiliations:
- BBH Mutual Funds Group (11 funds), Director
- The Jeffrey Company, a private investment company, Director
No. of Portfolios for which Board Member Serves: 49
BOARD MEMBERS INFORMATION ( U n a u d i t e d )
36
| Lynn Martin (67) |
| Board Member (1993) |
Principal Occupation During Past 5 Years:
- Advisor to the international accounting firm of Deloitte & Touche, LLP and Chair to its Council for the Advancement of Women from March 1993-September 2005
Other Board Memberships and Affiliations:
- AT&T Inc., a telecommunications company, Director
- Ryder System, Inc., a supply chain and transportation management company, Director
- The Proctor & Gamble Co., a consumer products company, Director
- Constellation Energy Group, Director
- Chicago Council on Global Affairs
- Coca-Cola International Advisory Council
- Deutsche Bank Advisory Council
No. of Portfolios for which Board Member Serves: 9
———————
| Daniel Rose (78) |
| Board Member (1992) |
Principal Occupation During Past 5 Years:
- Chairman and Chief Executive Officer of Rose Associates, Inc., a New York based real estate development and management firm
Other Board Memberships and Affiliations:
- Baltic-American Enterprise Fund,Vice Chairman and Director
- Harlem Educational Activities Fund, Inc., Chairman
- Housing Committee of the Real Estate Board of New York, Inc., Director
No. of Portfolios for which Board Member Serves: 34
———————
| Philip L. Toia (74) |
| Board Member (1997) |
| Principal Occupation During Past 5 Years: |
| • Private Investor |
No. of Portfolios for which Board Member Serves: 19
———————
| Sander Vanocur (79) |
| Board Member (1992) |
| Principal Occupation During Past 5 Years: |
| • President, Old Owl Communications |
No. of Portfolios for which Board Member Serves: 34
The Fund 37
BOARD MEMBERS INFORMATION (Unaudited) (continued)
| Anne Wexler (77) |
| Board Member (1994) |
Principal Occupation During Past 5 Years:
- Chairman of the Wexler & Walker Public Policy Associates, consultants specializing in govern- ment relations and public affairs from January 1981 to present
Other Board Memberships and Affiliations:
- Wilshire Mutual Funds (5 funds), Director
- The Community Foundation for the National Capital Region, Director
- Member of the Council of Foreign Relations
- Member of the National Park Foundation
No. of Portfolios for which Board Member Serves: 49
———————
Once elected all Board Members serve for an indefinite term, but achieve Emeritus status upon reaching age 80.The address of the Board Members and Officers is in c/o The Dreyfus Corporation, 200 Park Avenue, New York, New York 10166. Additional information about the Board Members is available in the fund’s Statement of Additional Information which can be obtained from Dreyfus free of charge by calling this toll free number: 1-800-554-4611.
38
OFFICERS OF THE FUND (Unaudited)
| J. DAVID OFFICER, President since |
| December 2006. |
Chief Operating Officer,Vice Chairman and a Director of the Manager, and an officer of 82 investment companies (comprised of 165 portfolios) managed by the Manager. He is 59 years old and has been an employee of the Manager since April 1998.
| PHILLIP N. MAISANO, Executive Vice |
| President since July 2007. |
Chief Investment Officer,Vice Chair and a director of the Manager, and an officer of 82 investment companies (comprised of 165 portfolios) managed by the Manager. Mr. Maisano also is an officer and/or Board member of certain other investment management subsidiaries of The Bank of New York Mellon Corporation, each of which is an affiliate of the Manager. He is 60 years old and has been an employee of the Manager since November 2006. Prior to joining the Manager, Mr. Maisano served as Chairman and Chief Executive Officer of EACM Advisors, an affiliate of the Manager, since August 2004, and served as Chief Executive Officer of Evaluation Associates, a leading institutional investment consulting firm, from 1988 until 2004.
| MICHAEL A. ROSENBERG, Vice President |
| and Secretary since August 2005. |
Associate General Counsel of the Manager, and an officer of 83 investment companies (comprised of 182 portfolios) managed by the Manager. He is 47 years old and has been an employee of the Manager since October 1991.
| JAMES BITETTO, Vice President and |
| Assistant Secretary since August 2005. |
Associate General Counsel and Secretary of the Manager, and an officer of 83 investment companies (comprised of 182 portfolios) managed by the Manager. He is 41 years old and has been an employee of the Manager since December 1996.
| JONI LACKS CHARATAN, Vice President |
| and Assistant Secretary since |
| August 2005. |
Associate General Counsel of the Manager, and an officer of 83 investment companies (comprised of 182 portfolios) managed by the Manager. She is 51 years old and has been an employee of the Manager since October 1988.
| JOSEPH M. CHIOFFI, Vice President and |
| Assistant Secretary since August 2005. |
Associate General Counsel of the Manager, and an officer of 83 investment companies (comprised of 182 portfolios) managed by the Manager. He is 45 years old and has been an employee of the Manager since June 2000.
| JANETTE E. FARRAGHER, Vice President |
| and Assistant Secretary since |
| August 2005. |
Associate General Counsel of the Manager, and an officer of 83 investment companies (comprised of 182 portfolios) managed by the Manager. She is 44 years old and has been an employee of the Manager since February 1984.
| JOHN B. HAMMALIAN, Vice President and |
| Assistant Secretary since August 2005. |
Associate General Counsel of the Manager, and an officer of 83 investment companies (comprised of 182 portfolios) managed by the Manager. He is 44 years old and has been an employee of the Manager since February 1991.
| ROBERT R. MULLERY, Vice President and |
| Assistant Secretary since August 2005. |
Associate General Counsel of the Manager, and an officer of 83 investment companies (comprised of 182 portfolios) managed by the Manager. He is 55 years old and has been an employee of the Manager since May 1986.
The Fund 39
OFFICERS OF THE FUND (Unaudited) (continued)
| JEFF PRUSNOFSKY, Vice President and |
| Assistant Secretary since August 2005. |
Associate General Counsel of the Manager, and an officer of 83 investment companies (comprised of 182 portfolios) managed by the Manager. He is 42 years old and has been an employee of the Manager since October 1990.
| JAMES WINDELS, Treasurer since |
| November 2001. |
Director-Mutual Fund Accounting of the Manager, and an officer of 83 investment companies (comprised of 182 portfolios) managed by the Manager. He is 49 years old and has been an employee of the Manager since April 1985.
| ROBERT ROBOL, Assistant Treasurer |
| since August 2005. |
Senior Accounting Manager — Money Market and Municipal Bond Funds of the Manager, and an officer of 83 investment companies (comprised of 182 portfolios) managed by the Manager. He is 43 years old and has been an employee of the Manager since October 1988.
| ROBERT SALVIOLO, Assistant Treasurer |
| since May 2007. |
Senior Accounting Manager - Equity Funds of the Manager, and an officer of 83 investment companies (comprised of 182 portfolios) managed by the Manager. He is 40 years old and has been an employee of the Manager since June 1989.
| ROBERT SVAGNA, Assistant Treasurer |
| since August 2002. |
Senior Accounting Manager - Equity Funds of the Manager, and an officer of 83 investment companies (comprised of 182 portfolios) managed by the Manager. He is 40 years old and has been an employee of the Manager since November 1990.
| GAVIN C. REILLY, Assistant Treasurer |
| since December 2005. |
Tax Manager of the Investment Accounting and Support Department of the Manager, and an officer of 83 investment companies (comprised of 182 portfolios) managed by the Manager. He is 39 years old and has been an employee of the Manager since April 1991.
| JOSEPH W. CONNOLLY, Chief Compliance |
| Officer since October 2004. |
Chief Compliance Officer of the Manager and The Dreyfus Family of Funds (83 investment companies, comprised of 182 portfolios). From November 2001 through March 2004, Mr. Connolly was first Vice-President, Mutual Fund Servicing for Mellon Global Securities Services. In that capacity, Mr. Connolly was responsible for managing Mellon’s Custody, Fund Accounting and Fund Administration services to third-party mutual fund clients. He is 50 years old and has served in various capacities with the Manager since 1980, including manager of the firm’s Fund Accounting Department from 1997 through October 2001.
| WILLIAM GERMENIS, Anti-Money |
| Laundering Compliance Officer since |
| October 2002. |
Vice President and Anti-Money Laundering Compliance Officer of the Distributor, and the Anti-Money Laundering Compliance Officer of 79 investment companies (comprised of 178 portfolios) managed by the Manager. He is 37 years old and has been an employee of the Distributor since October 1998.
40
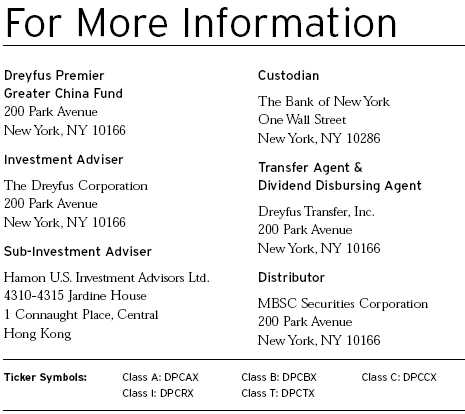
Telephone Call your financial representative or 1-800-554-4611
| The Dreyfus Premier Family of Funds | ||
| 144 Glenn Curtiss Boulevard, Uniondale, NY 11556-0144 |
The fund files its complete schedule of portfolio holdings with the Securities and Exchange Commission (“SEC”) for the first and third quarters of each fiscal year on Form N-Q. The fund’s Forms N-Q are available on the SEC’s website at http://www.sec.gov and may be reviewed and copied at the SEC’s Public Reference Room in Washington, DC. Information on the operation of the Public Reference Room may be obtained by calling 1-202-551-8090.
A description of the policies and procedures that the fund uses to determine how to vote proxies relating to portfolio securities, and information regarding how the fund voted these proxies for the 12-month period ended June 30, 2007, is available at http://www.dreyfus.com and on the SEC’s website at http://www.sec.gov. The description of the policies and procedures is also available without charge, upon request, by calling 1-800-645-6561.

© 2007 MBSC Securities Corporation
Save time. Save paper. View your next shareholder report online as soon as it’s available. Log into www.dreyfus.com and sign up for Dreyfus eCommunications. It’s simple and only takes a few minutes.
The views expressed in this report reflect those of the portfolio manager only through the end of the period covered and do not necessarily represent the views of Dreyfus or any other person in the Dreyfus organization. Any such views are subject to change at any time based upon market or other conditions and Dreyfus disclaims any responsibility to update such views.These views may not be relied on as investment advice and, because investment decisions for a Dreyfus fund are based on numerous factors, may not be relied on as an indication of trading intent on behalf of any Dreyfus fund.
Not FDIC-Insured • Not Bank-Guaranteed • May Lose Value
| Contents | ||
| THE FUND | ||
| 2 | A Letter from the CEO | |
| 3 | Discussion of Fund Performance | |
| 6 | Fund Performance | |
| 8 | Understanding Your Fund’s Expenses | |
| 8 | Comparing Your Fund’s Expenses | |
| With Those of Other Funds | ||
| 9 | Statement of Investments | |
| 14 | Statement of Financial Futures | |
| 15 | Statement of Assets and Liabilities | |
| 16 | Statement of Operations | |
| 17 | Statement of Changes in Net Assets | |
| 19 | Financial Highlights | |
| 24 | Notes to Financial Statements | |
| 33 | Report of Independent Registered | |
| Public Accounting Firm | ||
| 34 | Important Tax Information | |
| 35 | Information About the Review and Approval | |
| of the Fund’s Management Agreement | ||
| 39 | Board Members Information | |
| 42 | Officers of the Fund | |
| FOR MORE INFORMATION | ||
| Back Cover | ||
The Fund
| Dreyfus Premier |
| International Growth Fund |

A LETTER FROM THE CEO
Dear Shareholder:
We are pleased to present this annual report for Dreyfus Premier International Growth Fund covering the 12-month period from November 1, 2006, through October 31, 2007.
After an extended period of steady gains, turmoil in U.S. credit markets over the summer of 2007 has led to heightened volatility in many international equity markets. Nonetheless, fundamentals in the global economy have remained relatively robust, particularly in the “Greater China” region, and recent rate cuts in the United States helped to sustain market rebounds in many regions of the world.
While we expect the global expansion to continue, it probably will do so at a slower rate as U.S. consumer spending moderates and as some high-flying emerging markets, notably China, take steps to reduce unsustainably high growth rates by tightening their respective monetary policies. However, the U.S. dollar has declined against most major currencies throughout most of the reporting period, making investments denominated in foreign currencies more valuable for U.S. residents. Lastly, a stubborn U.S. trade deficit and stronger economic growth in overseas markets continue to attract global capital away from U.S. markets and toward those with higher potential returns. As always, we encourage you to discuss these developments with your financial advisor, who can help you make any adjustments that may be right for your portfolio.
For information about how the fund performed during the reporting period, as well as market perspectives, we have provided a Discussion of Fund Performance given by the fund’s Portfolio Manager.
Thank you for your continued confidence and support.
| Thomas F. Eggers |
| Chief Executive Officer |
| The Dreyfus Corporation |
| November 15, 2007 |
2

DISCUSSION OF FUND PERFORMANCE
For the period of November 1, 2006, through October 31, 2007, as provided by William S. Patzer, Portfolio Manager
On August 8, 2007,William S. Patzer became the fund’s primary portfolio manager.
Fund and Market Performance Overview
International stock markets performed strongly during the reporting period despite bouts of volatility brought on by sharp declines in Chinese equity markets and credit concerns in the U.S. sub-prime mortgage market. Robust mergers-and-acquisitions activity, vigorous global economic growth and ongoing demand for basic materials and commodities from emerging markets fueled the markets’ advance.The fund produced returns comparable to its benchmark, mainly due to favorable selections of materials and consumer-staples stocks.
For the 12-month period ended October 31, 2007, Dreyfus Premier International Growth Fund produced total returns of 26.98% for Class A shares, 26.02% for Class B shares, 26.05% for Class C shares, 27.40% for Class I shares and 25.98% for Class T shares.1 For comparison purposes, the Morgan Stanley Capital International World ex U.S. Index produced a total return of 26.33% for the period.2 Please note that effective June 1, 2007, the fund’s Class R shares were renamed Class I shares.
The Fund’s Investment Approach
The fund invests primarily in growth stocks of foreign companies. Normally, the fund invests at least 80% of its assets in stocks, including common stocks, preferred stocks and convertible securities, including those purchased in initial public offerings.
In choosing stocks, we seek to identify companies with positive growth characteristics and improving business momentum not yet recognized by the market.We look to add value through security selection and earnings growth and valuation (as measured by traditional value measures, such as price-to-earnings, price-to-cash flow and price-to-book value). Companies are then ranked within region, country and economic sector. Higher ranked companies are reviewed and an investment decision made using traditional fundamental techniques.
The Fund 3
DISCUSSION OF FUND PERFORMANCE (continued)
Resource-Hungry Emerging Markets Spurred Advance
Robust economic growth in many emerging markets provided a catalyst for the international stock markets’ advance.As industrial construction activity in developing markets such as China and India increased, numerous materials producers and consumer staples companies posted double- and triple-digit returns. Heightened levels of mergers-and-acquisitions activity also put upward pressure on stock prices in the developed economies of Europe. Japan remained a laggard in the global markets, as investors waited for a sustainable economic recovery in a nation still struggling to reform its financial system.
Materials and Consumer Staples Stocks Bolstered the Fund’s Results
Our modest overweight in the materials sector along with strong security selections in this market sector boosted the fund’s performance. Australia-based materials producer BHP Billiton, British diversified-mining group Xstrata, and Japanese industrial developer Mistui & Co. fared well due to their participation in fast-growing emerging markets and the effects of rising commodities prices.
Consumer staples stocks also bolstered the fund’s relative performance, with Belgian brewer InBev and Danish brewer Carlsberg Group increasing their market shares in developing countries. In the information technology sector, an increase in Chinese and Indian contracts for Nokia handsets sent the Finnish mobile-phone company’s stock price higher.The growing popularity of Nintendo’s Wii gaming system benefited the Japanese technology company, while gains posted by Canada’s Research In Motion were driven by strong sales of its Blackberry handheld wireless device.
In addition, a strong security selection strategy in Japan, Belgium and Australia proved advantageous. Active weights in the strong-performing Norway and Denmark equity markets also assisted the fund’s relative performance.
On the other hand, credit issues stemming from the burgeoning sub-prime mortgage crisis in the United States hurt a number of international financial companies that held securities backed by sub-prime loans, such as Royal Bank of Scotland Group and Halifax Bank of Scotland in the United Kingdom, and Pacific Management Corp., Sumitomo Trust & Banking Company and Orix Corp. in Japan. Pacific Management Corp. was sold during the reporting period. In the consumer discretionary sector, shares of consumer electronics manufacturer Sony declined due to competitive pressures in its video-game console business, and U.K. developer Barratt Developments, also sold during the reporting period, struggled in a softening local real-estate market.The fund’s lack of exposure to strong-performing benchmark components Porsche and Volkswagen, in which the fund did not find compelling growth opportunities, also detracted from relative performance. The fund also did not participate in gains in benchmark components Dutch bank ABN Amro and the Hong Kong Exchange as neither company met our investment criteria.
4
The Fund Remains Positioned for Robust Global Economic Growth
Low interest rates in many overseas markets coupled with strong industrial and consumer demand suggest to us that the global economic expansion is likely to continue. We believe the need for infrastructure construction and basic consumer goods and services in emerging markets will persist, potentially leading to additional growth opportunities for materials and consumer staples businesses.We also believe that the volatility stemming from the U.S. sub-prime mortgage crisis will not abate in the near-term, making it difficult to find financial companies that meet our investment criteria.We intend to maintain our sector- and country-neutral approach, focusing on our bottom-up stock selection strategy to find companies with strong growth potential at attractive valuations.
November 15, 2007
| Investing in foreign companies involves special risks, including changes in currency rates, | ||
| political, economic and social instability, a lack of comprehensive company information, | ||
| differing auditing and legal standards and less market liquidity. An investment in this fund | ||
| should be considered only as a supplement to an overall investment program. | ||
| 1 | Total return includes reinvestment of dividends and any capital gains paid, and does not take into | |
| consideration the maximum initial sales charges in the case of Class A and Class T shares, or the | ||
| applicable contingent deferred sales charges imposed on redemptions in the case of Class B and | ||
| Class C shares. Had these charges been reflected, returns would have been lower. Past performance | ||
| is no guarantee of future results. Share price and investment return fluctuate such that upon | ||
| redemption, fund shares may be worth more or less than their original cost. Return figures | ||
| provided reflect the absorption of certain fund expenses by The Dreyfus Corporation pursuant to | ||
| an agreement in effect from September 14, 2007, until September 13, 2008, at which time may | ||
| be extended, modified or terminated. Had these expenses not been absorbed, the fund’s returns | ||
| would have been lower. | ||
| 2 | SOURCE: LIPPER INC. – Reflects reinvestment of net dividends and, where applicable, capital | |
| gain distributions.The Morgan Stanley Capital International (MSCI) World ex U.S. Index is an | ||
| unmanaged index of global stock market performance, excluding the United States, consisting solely | ||
| of equity securities.The index does not take into account charges, fees and other expenses. |
The Fund 5
FUND PERFORMANCE

| † Source: Lipper Inc. |
| Past performance is not predictive of future performance. |
| The above graph compares a $10,000 investment made in Class A, Class B, Class C and Class I shares of Dreyfus |
| Premier International Growth Fund on 10/31/97 to a $10,000 investment made in the Morgan Stanley Capital |
| International World ex U.S. Index (the “Index”) on that date. All dividends and capital gain distributions are reinvested. |
| Performance for Class T shares will vary from the performance of Class A, Class B, Class C and Class I shares shown |
| above due to differences in charges and expenses. |
| The fund’s performance shown in the line graph takes into account the maximum initial sales charge on Class A shares |
| and all other applicable fees and expenses.The Index is an unmanaged index of global stock market performance, |
| excluding the U.S., consisting solely of equity securities and includes net dividends reinvested.The Index does not take |
| into account charges, fees and other expenses. Further information relating to fund performance, including expense |
| reimbursements, if applicable, is contained in the Financial Highlights section of the prospectus and elsewhere in this report. |
6
| Average Annual Total Returns as of 10/31/07 | ||||||||
| Inception | ||||||||
| Date | 1 Year | 5 Years | 10 Years | |||||
| Class A shares | ||||||||
| with maximum sales charge (5.75%) | 19.68% | 21.99% | 5.34% | |||||
| without sales charge | 26.98% | 23.43% | 5.96% | |||||
| Class B shares | ||||||||
| with applicable redemption charge † | 22.02% | 22.16% | 5.40% | |||||
| without redemption | 26.02% | 22.34% | 5.40% | |||||
| Class C shares | ||||||||
| with applicable redemption charge †† | 25.05% | 22.44% | 5.07% | |||||
| without redemption | 26.05% | 22.44% | 5.07% | |||||
| Class I shares | 27.40% | 23.23% | 6.13% | |||||
| Class T shares | ||||||||
| with applicable sales charge (4.5%) | 3/1/00 | 20.32% | 21.12% | 4.77%††† | ||||
| without sales charge | 3/1/00 | 25.98% | 22.26% | 5.25%††† | ||||
Past performance is not predictive of future performance.The fund’s performance shown in the graph and table does not reflect the deduction of taxes that a shareholder would pay on fund distributions or the redemption of fund shares. Performance for Class B shares assumes the conversion of Class B shares to Class A shares at the end of the sixth year following the date of purchase.
| † | The maximum contingent deferred sales charge for Class B shares is 4%. After six years Class B shares convert to | |
| Class A shares. | ||
| †† | The maximum contingent deferred sales charge for Class C shares is 1% for shares redeemed within one year of the | |
| date of purchase. | ||
| ††† | The total return performance figures presented for Class T shares of the fund reflect the performance of the fund’s | |
| Class A shares for periods prior to 3/1/00 (the inception date for Class T shares), adjusted to reflect the applicable | ||
| sales load for that class and the applicable distribution/servicing fees thereafter. |
The Fund 7
UNDERSTANDING YOUR FUND’S EXPENSES (Unaudited)
As a mutual fund investor, you pay ongoing expenses, such as management fees and other expenses. Using the information below, you can estimate how these expenses affect your investment and compare them with the expenses of other funds.You also may pay one-time transaction expenses, including sales charges (loads) and redemption fees, which are not shown in this section and would have resulted in higher total expenses. For more information, see your fund’s prospectus or talk to your financial adviser.
Review your fund’s expenses
The table below shows the expenses you would have paid on a $1,000 investment in Dreyfus Premier International Growth Fund from May 1, 2007 to October 31, 2007. It also shows how much a $1,000 investment would be worth at the close of the period, assuming actual returns and expenses.
| Expenses and Value of a $1,000 Investment | ||||||||||
| assuming actual returns for the six months ended October 31, 2007 | ||||||||||
| Class A | Class B | Class C | Class I | Class T | ||||||
| Expenses paid per $1,000 † | $ 7.65 | $ 12.09 | $ 11.83 | $ 6.54 | $ 13.23 | |||||
| Ending value (after expenses) | $1,107.80 | $1,103.70 | $1,104.10 | $1,109.70 | $1,099.60 | |||||
| COMPARING YOUR FUND’S EXPENSES |
| WITH THOSE OF OTHER FUNDS (Unaudited) |
Using the SEC’s method to compare expenses
The Securities and Exchange Commission (SEC) has established guidelines to help investors assess fund expenses. Per these guidelines, the table below shows your fund’s expenses based on a $1,000 investment, assuming a hypothetical 5% annualized return. You can use this information to compare the ongoing expenses (but not transaction expenses or total cost) of investing in the fund with those of other funds.All mutual fund shareholder reports will provide this information to help you make this comparison. Please note that you cannot use this information to estimate your actual ending account balance and expenses paid during the period.
| Expenses and Value of a $1,000 Investment | ||||||||||
| assuming a hypothetical 5% annualized return for the six months ended October 31, 2007 | ||||||||||
| Class A | Class B | Class C | Class I | Class T | ||||||
| Expenses paid per $1,000 † | $ 7.32 | $ 11.57 | $ 11.32 | $ 6.26 | $ 12.68 | |||||
| Ending value (after expenses) | $1,017.95 | $1,013.71 | $1,013.96 | $1,019.00 | $1,012.60 | |||||
| † Expenses are equal to the fund’s annualized expense ratio of 1.44% for Class A, 2.28% for Class B, 2.23% for |
| Class C, 1.23% for Class I and 2.50% for Class T; multiplied by the average account value over the period, |
| multiplied by 184/365 (to reflect the one-half year period). |
8
| STATEMENT OF INVESTMENTS |
| October 31, 2007 |
| Common Stocks—96.4% | Shares | Value ($) | ||
| Australia—5.5% | ||||
| BHP Billiton | 47,620 | 2,073,841 | ||
| Coca-Cola Amatil | 70,130 | 671,519 | ||
| Commonwealth Bank of Australia | 5,000 | 288,683 | ||
| 3,034,043 | ||||
| Austria—.5% | ||||
| OMV | 3,690 | 275,816 | ||
| Belgium—2.7% | ||||
| Delhaize Group | 6,860 | 650,467 | ||
| InBev | 8,900 | 839,904 | ||
| 1,490,371 | ||||
| Canada—7.3% | ||||
| Bank of Nova Scotia | 4,700 | 265,508 | ||
| Barrick Gold | 10,400 | 461,392 | ||
| Bombardier, Cl. B | 93,900 a | 555,445 | ||
| Cognos | 6,140 a | 309,026 | ||
| Research In Motion | 4,800 a | 597,021 | ||
| Rogers Communication, Cl. B | 9,800 | 498,333 | ||
| Teck Cominco Ltd., Cl. B | 21,300 | 1,064,437 | ||
| TransCanada | 6,200 | 263,141 | ||
| 4,014,303 | ||||
| Denmark—2.1% | ||||
| Carlsberg, Cl. B | 4,560 | 614,073 | ||
| Novo Nordisk, Cl. B | 4,600 | 570,296 | ||
| 1,184,369 | ||||
| Finland���2.5% | ||||
| Neste Oil | 7,030 | 252,604 | ||
| Nokia | 28,500 | 1,128,914 | ||
| 1,381,518 | ||||
| France—8.3% | ||||
| Alstom | 2,020 | 476,575 | ||
| AXA | 9,860 | 440,688 | ||
| BNP Paribas | 5,432 | 598,613 | ||
| Cap Gemini | 4,270 | 272,107 | ||
| Compagnie Generale de | ||||
| Geophysique-Veritas | 1,018 a | 333,429 |
The Fund 9
STATEMENT OF INVESTMENTS (continued)
| Common Stocks (continued) | Shares | Value ($) | ||
| France (continued) | ||||
| Lafarge | 4,201 | 682,964 | ||
| Sanofi-Aventis | 3,807 | 333,798 | ||
| Total | 7,752 | 624,795 | ||
| Vivendi | 18,500 | 832,743 | ||
| 4,595,712 | ||||
| Germany—7.0% | ||||
| BASF | 5,810 | 803,596 | ||
| Bayerische Motoren Werke | 3,600 | 241,038 | ||
| E.ON | 1,720 | 336,046 | ||
| MAN | 3,800 | 678,036 | ||
| Merck | 2,960 | 370,180 | ||
| RWE | 1,990 | 271,611 | ||
| Salzgitter | 1,770 | 347,891 | ||
| ThyssenKrupp | 5,300 | 353,096 | ||
| Wacker Chemie | 1,840 | 451,696 | ||
| 3,853,190 | ||||
| Greece—.5% | ||||
| National Bank of Greece | 4,300 | 298,805 | ||
| Hong Kong—1.1% | ||||
| Esprit Holdings | 35,000 | 595,132 | ||
| Ireland—.8% | ||||
| Allied Irish Banks | 8,200 | 204,743 | ||
| Kerry Group, Cl. A | 8,700 | 264,100 | ||
| 468,843 | ||||
| Italy—2.8% | ||||
| ENI | 15,102 | 551,180 | ||
| Fiat | 15,700 | 507,292 | ||
| Prysmian | 9,230 a | 265,752 | ||
| UniCredito Italiano | 23,200 | 199,083 | ||
| 1,523,307 | ||||
| Japan—15.6% | ||||
| Aisin Seiki | 7,100 | 290,686 | ||
| KDDI | 30 | 227,240 | ||
| Kenedix | 342 | 751,292 | ||
| Marubeni | 41,000 | 351,157 | ||
| Mitsubishi | 26,700 | 830,569 |
10
| Common Stocks (continued) | Shares | Value ($) | ||
| Japan (continued) | ||||
| Mitsui & Co. | 32,000 | 832,405 | ||
| Mitsumi Electric | 8,100 | 376,201 | ||
| Nikon | 14,000 | 446,925 | ||
| Nintendo | 2,300 | 1,450,256 | ||
| Nippon Yusen | 36,400 | 375,794 | ||
| Sony | 10,600 | 524,023 | ||
| Star Micronics | 6,300 | 199,986 | ||
| Sumitomo Trust & Banking | 43,000 | 319,526 | ||
| Takeda Pharmaceutical | 5,300 | 331,008 | ||
| TDK | 5,200 | 427,414 | ||
| Terumo | 5,400 | 263,207 | ||
| Toyota Motor | 11,400 | 651,649 | ||
| 8,649,338 | ||||
| Netherlands—3.0% | ||||
| ASML Holding | 11,267 a | 392,273 | ||
| ING Groep | 22,100 | 993,511 | ||
| Royal KPN | 14,400 | 271,539 | ||
| 1,657,323 | ||||
| Norway—1.8% | ||||
| Orkla | 37,700 | 700,020 | ||
| Telenor | 11,800 a | 276,902 | ||
| 976,922 | ||||
| Singapore—.4% | ||||
| Singapore Press Holdings | 78,000 | 248,552 | ||
| Spain—4.8% | ||||
| ACS-Actividades de Construccion y Servicios | 10,870 | 672,384 | ||
| Banco Santander | 18,100 | 393,213 | ||
| Inditex | 4,440 | 330,204 | ||
| Repsol | 6,400 a | 252,584 | ||
| Telefonica | 29,800 | 983,601 | ||
| 2,631,986 | ||||
| Sweden—.9% | ||||
| Sandvik | 25,800 | 487,160 | ||
| Switzerland—7.0% | ||||
| ABB | 22,650 | 681,574 | ||
| Baloise-Holding | 3,350 | 356,180 |
The Fund 11
STATEMENT OF INVESTMENTS (continued)
| Common Stocks (continued) | Shares | Value ($) | ||
| Switzerland (continued) | ||||
| Credit Suisse Group | 9,900 | 666,100 | ||
| Nestle | 1,832 | 845,745 | ||
| Roche Holding | 6,310 | 1,076,918 | ||
| Swiss Reinsurance | 2,500 | 234,712 | ||
| 3,861,229 | ||||
| United Kingdom—17.3% | ||||
| AstraZeneca | 4,800 | 236,898 | ||
| BT Group | 76,700 | 516,847 | ||
| Charter | 16,660 a | 373,647 | ||
| Firstgroup | 26,800 | 443,018 | ||
| GKN | 37,340 | 281,823 | ||
| Greene King | 18,100 | 340,283 | ||
| HBOS | 21,300 | 386,799 | ||
| International Power | 85,260 | 857,680 | ||
| Michael Page International | 48,990 | 439,154 | ||
| National Grid | 29,400 | 474,561 | ||
| Next | 8,990 | 406,964 | ||
| Prudential | 32,040 | 514,625 | ||
| Reckitt Benckiser Group PLC | 4,800 | 279,418 | ||
| Royal Bank of Scotland Group | 38,900 | 416,649 | ||
| Royal Dutch Shell, Cl. A | 7,058 | 307,944 | ||
| Royal Dutch Shell, Cl. B | 6,900 | 298,217 | ||
| SABMiller | 16,000 | 478,527 | ||
| Shire | 26,200 | 653,417 | ||
| Tullet Prebon | 29,590 | 271,877 | ||
| William Morrison Supermarkets | 71,080 | 437,654 | ||
| Xstrata | 16,780 | 1,197,648 | ||
| 9,613,650 | ||||
| United States—4.5% | ||||
| iShares MSCI EAFE Index Fund | 23,970 | 2,063,817 | ||
| PowerShares BLDRS Developed | ||||
| Markets 100 ADR Index Fund | 12,760 | 435,882 | ||
| 2,499,699 | ||||
| Total Common Stocks | ||||
| (cost $38,713,806) | 53,341,268 |
12
| Preferred Stocks—1.5% | Shares | Value ($) | ||
| Germany | ||||
| Fresenius | ||||
| (cost $559,644) | 10,520 | 833,873 | ||
| Principal | ||||
| Short-Term Investments—.1% | Amount ($) | Value ($) | ||
| U.S. Treasury Bills; | ||||
| 4.96%, 12/13/07 | ||||
| (cost $29,863) | 30,000 b | 29,865 | ||
| Other Investment—.9% | Shares | Value ($) | ||
| Registered Investment Company; | ||||
| Dreyfus Institutional Preferred Plus Money Market Fund | ||||
| (cost $500,000) | 500,000 c | 500,000 | ||
| Total Investments (cost $39,803,313) | 98.9% | 54,705,006 | ||
| Cash and Receivables (Net) | 1.1% | 598,409 | ||
| Net Assets | 100.0% | 55,303,415 | ||
| ADR—American Depository Receipts | ||
| a | Non-income producing security. | |
| b | All or partially held by a broker as collateral for open financial futures positions. | |
| c | Investment in affiliated money market mutual fund. | |
| Portfolio Summary | (Unaudited) † | |||||
| Value (%) | Value (%) | |||||
| Industrial | 14.3 | Energy | 5.7 | |||
| Financial | 13.7 | Telecommunication Services | 5.0 | |||
| Materials | 13.5 | Exchange Traded Funds | 4.5 | |||
| Consumer Discretionary | 10.3 | Utilities | 4.0 | |||
| Information Technology | 9.3 | Short-Term/ | ||||
| Consumer Staples | 9.2 | Money Market Investments | 1.0 | |||
| Health Care | 8.4 | 98.9 | ||||
| † Based on net assets. |
| See notes to financial statements. |
The Fund 13
| STATEMENT OF FINANCIAL FUTURES |
| October 31, 2007 |
| Market Value | Unrealized | |||||||
| Covered by | Appreciation | |||||||
| Contracts | Contracts ($) | Expiration | at 10/31/2007 ($) | |||||
| Financial Futures Long | ||||||||
| MSCI PAN EURO | 16 | 605,274 | December 2007 | 10,450 | ||||
| TOPIX | 1 | 140,206 | December 2007 | 8,467 | ||||
| 18,917 |
See notes to financial statements.
14
| STATEMENT OF ASSETS AND LIABILITIES |
| October 31, 2007 |
| Cost | Value | |||
| Assets ($): | ||||
| Investments in securities—See Statement of Investments: | ||||
| Unaffiliated issuers | 39,303,313 | 54,205,006 | ||
| Affiliated issuers | 500,000 | 500,000 | ||
| Cash | 194,639 | |||
| Cash denominated in foreign currencies | 774,851 | 785,236 | ||
| Dividends and interest receivable | 62,530 | |||
| Receivable for shares of Common Stock subscribed | 58,795 | |||
| Receivable for futures variation margin—Note 4 | 4,862 | |||
| Unrealized appreciation on forward currency | ||||
| exchange contracts—Note 4 | 16 | |||
| Prepaid expenses | 16,492 | |||
| 55,827,576 | ||||
| Liabilities ($): | ||||
| Due to The Dreyfus Corporation and affiliates—Note 3(c) | 57,629 | |
| Payable for investment securities purchased | 407,167 | |
| Payable for shares of Common Stock redeemed | 15,639 | |
| Unrealized depreciation on forward currency | ||
| exchange contracts—Note 4 | 507 | |
| Accrued expenses | 43,219 | |
| 524,161 | ||
| Net Assets ($) | 55,303,415 | |
| Composition of Net Assets ($): | ||
| Paid-in capital | 45,035,240 | |
| Accumulated undistributed investment income—net | 251,005 | |
| Accumulated net realized gain (loss) on investments | (4,890,424) | |
| Accumulated net unrealized appreciation (depreciation) on | ||
| investments and foreign currency transactions (including | ||
| $18,917 net unrealized appreciation on financial futures) | 14,907,594 | |
| Net Assets ($) | 55,303,415 |
| Net Asset Value Per Share | ||||||||||
| Class A | Class B | Class C | Class I | Class T | ||||||
| Net Assets ($) | 48,674,189 | 3,230,303 | 3,073,837 | 294,612 | 30,474 | |||||
| Shares Outstanding | 3,093,886 | 223,101 | 222,917 | 18,326 | 1,999 | |||||
| Net Asset Value | ||||||||||
| Per Share ($) | 15.73 | 14.48 | 13.79 | 16.08 | 15.24 | |||||
See notes to financial statements.
The Fund 15
| STATEMENT OF OPERATIONS |
| Year Ended October 31, 2007 |
| Investment Income ($): | ||
| Income: | ||
| Cash dividends (net of $103,556 foreign taxes withheld at source): | ||
| Unaffiliated issuers | 949,068 | |
| Affiliated issuers | 36,424 | |
| Interest | 37,044 | |
| Total Income | 1,022,536 | |
| Expenses: | ||
| Management fee—Note 3(a) | 368,684 | |
| Shareholder servicing costs—Note 3(c) | 180,502 | |
| Registration fees | 62,802 | |
| Custodian fees—Note 3(c) | 50,890 | |
| Distribution fees—Note 3(b) | 39,118 | |
| Professional fees | 33,604 | |
| Prospectus and shareholders’ reports | 10,249 | |
| Directors’ fees and expenses—Note 3(d) | 9,977 | |
| Miscellaneous | 19,818 | |
| Total Expenses | 775,644 | |
| Less—reduction in management fee | ||
| due to undertaking—Note 3(a) | (13,499) | |
| Less—reduction in custody fees | ||
| due to earnings credits—Note 1(c) | (5,507) | |
| Net Expenses | 756,638 | |
| Investment Income—Net | 265,898 | |
| Realized and Unrealized Gain (Loss) on Investments—Note 4 ($): | ||
| Net realized gain (loss) on investments and foreign currency transactions | 5,954,867 | |
| Net realized gain (loss) on financial futures | 58,182 | |
| Net realized gain (loss) on forward currency exchange contracts | (7,389) | |
| Net Realized Gain (Loss) | 6,005,660 | |
| Net unrealized appreciation (depreciation) on investments | ||
| and foreign currency transactions [including ($5,660) | ||
| net unrealized (depreciation) on financial futures] | 5,475,974 | |
| Net Realized and Unrealized Gain (Loss) on Investments | 11,481,634 | |
| Net Increase in Net Assets Resulting from Operations | 11,747,532 | |
See notes to financial statements.
16
STATEMENT OF CHANGES IN NET ASSETS
| Year Ended October 31, | ||||
| 2007 a | 2006 | |||
| Operations ($): | ||||
| Investment income—net | 265,898 | 215,571 | ||
| Net realized gain (loss) on investments | 6,005,660 | 5,421,169 | ||
| Net unrealized appreciation | ||||
| (depreciation) on investments | 5,475,974 | 3,781,238 | ||
| Net Increase (Decrease) in Net Assets | ||||
| Resulting from Operations | 11,747,532 | 9,417,978 | ||
| Dividends to Shareholders from ($): | ||||
| Investment income—net: | ||||
| Class A shares | (233,857) | (255,718) | ||
| Class B shares | — | (3,223) | ||
| Class C shares | — | (5,191) | ||
| Class I shares | (1,216) | (721) | ||
| Class T shares | (67) | (98) | ||
| Total Dividends | (235,140) | (264,951) | ||
| Capital Stock Transactions ($): | ||||
| Net proceeds from shares sold: | ||||
| Class A shares | 5,187,244 | 3,763,554 | ||
| Class B shares | 738,290 | 673,536 | ||
| Class C shares | 1,326,086 | 347,458 | ||
| Class I shares | 827,170 | 80,404 | ||
| Class T shares | 13,980 | 5,096 | ||
| Dividends reinvested: | ||||
| Class A shares | 225,147 | 244,082 | ||
| Class B shares | — | 2,762 | ||
| Class C shares | — | 3,538 | ||
| Class I shares | 1,216 | 721 | ||
| Class T shares | 67 | 98 | ||
| Cost of shares redeemed: | ||||
| Class A shares | (6,226,155) | (7,008,739) | ||
| Class B shares | (928,231) | (924,073) | ||
| Class C shares | (549,263) | (132,500) | ||
| Class I shares | (767,808) | (2,500) | ||
| Class T shares | (25,057) | (2,890) | ||
| Increase (Decrease) in Net Assets | ||||
| from Capital Stock Transactions | (177,314) | (2,949,453) | ||
| Total Increase (Decrease) in Net Assets | 11,335,078 | 6,203,574 | ||
| Net Assets ($): | ||||
| Beginning of Period | 43,968,337 | 37,764,763 | ||
| End of Period | 55,303,415 | 43,968,337 | ||
| Undistributed investment income—net | 251,005 | 181,315 | ||
The Fund 17
STATEMENT OF CHANGES IN NET ASSETS (continued)
| Year Ended October 31, | ||||
| 2007 a | 2006 | |||
| Capital Share Transactions: | ||||
| Class A b | ||||
| Shares sold | 373,575 | 329,952 | ||
| Shares issued for dividends reinvested | 17,279 | 23,155 | ||
| Shares redeemed | (450,659) | (625,940) | ||
| Net Increase (Decrease) in Shares Outstanding | (59,805) | (272,833) | ||
| Class B b | ||||
| Shares sold | 56,560 | 64,740 | ||
| Shares issued for dividends reinvested | — | 282 | ||
| Shares redeemed | (72,890) | (88,698) | ||
| Net Increase (Decrease) in Shares Outstanding | (16,330) | (23,676) | ||
| Class C | ||||
| Shares sold | 108,575 | 34,897 | ||
| Shares issued for dividends reinvested | — | 380 | ||
| Shares redeemed | (45,492) | (13,356) | ||
| Net Increase (Decrease) in Shares Outstanding | 63,083 | 21,921 | ||
| Class I | ||||
| Shares sold | 60,746 | 7,215 | ||
| Shares issued for dividends reinvested | 91 | 67 | ||
| Shares redeemed | (54,218) | (213) | ||
| Net Increase (Decrease) in Shares Outstanding | 6,619 | 7,069 | ||
| Class T | ||||
| Shares sold | 1,056 | 447 | ||
| Shares issued for dividends reinvested | 5 | 10 | ||
| Shares redeemed | (1,936) | (252) | ||
| Net Increase (Decrease) in Shares Outstanding | (875) | 205 | ||
| a | Effective June 1, 2007, the fund redesignated Class R shares to Class I shares. | |
| b | During the period ended October 31, 2007, 31,581 Class B shares representing $403,866 were automatically | |
| converted to 29,194 Class A shares and during the period ended October 31, 2006, 45,645 Class B shares | ||
| representing $474,930 were automatically converted to 42,293 Class A shares. | ||
| See notes to financial statements. | ||
18
FINANCIAL HIGHLIGHTS
The following tables describe the performance for each share class for the fiscal periods indicated.All information (except portfolio turnover rate) reflects financial results for a single fund share.Total return shows how much your investment in the fund would have increased (or decreased) during each period, assuming you had reinvested all dividends and distributions.These figures have been derived from the fund’s financial statements.
| Year Ended October 31, | ||||||||||
| Class A Shares | 2007 | 2006 | 2005 | 2004 | 2003 | |||||
| Per Share Data ($): | ||||||||||
| Net asset value, beginning of period | 12.46 | 9.94 | 8.57 | 7.28 | 5.97 | |||||
| Investment Operations: | ||||||||||
| Investment income—net a | .09 | .07 | .07 | .09 | .03 | |||||
| Net realized and unrealized | ||||||||||
| gain (loss) on investments | 3.26 | 2.53 | 1.48 | 1.42 | 1.41 | |||||
| Total from Investment Operations | 3.35 | 2.60 | 1.55 | 1.51 | 1.44 | |||||
| Distributions: | ||||||||||
| Dividends from investment income—net | (.08) | (.08) | (.18) | (.22) | (.13) | |||||
| Net asset value, end of period | 15.73 | 12.46 | 9.94 | 8.57 | 7.28 | |||||
| Total Return (%) b | 26.98 | 26.27 | 18.18 | 21.40 | 24.53 | |||||
| Ratios/Supplemental Data (%): | ||||||||||
| Ratio of total expenses | ||||||||||
| to average net assets | 1.50 | 1.58 | 1.72 | 1.95 | 2.02 | |||||
| Ratio of net expenses | ||||||||||
| to average net assets | 1.46 | 1.55 | 1.39 | 1.95 | 2.02 | |||||
| Ratio of net investment income | ||||||||||
| to average net assets | .62 | .60 | .74 | 1.08 | .45 | |||||
| Portfolio Turnover Rate | 83.37 | 80.76 | 64.27 | 174.49 | 122.55 | |||||
| Net Assets, end of period ($ x 1,000) | 48,674 | 39,284 | 34,063 | 45,440 | 29,246 | |||||
| a | Based on average shares outstanding at each month end. | |
| b | Exclusive of sales charge. | |
| See notes to financial statements. | ||
The Fund 19
FINANCIAL HIGHLIGHTS (continued)
| Year Ended October 31, | ||||||||||
| Class B Shares | 2007 | 2006 | 2005 | 2004 | 2003 | |||||
| Per Share Data ($): | ||||||||||
| Net asset value, beginning of period | 11.49 | 9.19 | 7.94 | 6.75 | 5.54 | |||||
| Investment Operations: | ||||||||||
| Investment income (loss)—net a | (.03) | (.02) | .00b | .02 | (.03) | |||||
| Net realized and unrealized | ||||||||||
| gain (loss) on investments | 3.02 | 2.33 | 1.37 | 1.33 | 1.30 | |||||
| Total from Investment Operations | 2.99 | 2.31 | 1.37 | 1.35 | 1.27 | |||||
| Distributions: | ||||||||||
| Dividends from investment income—net | — | (.01) | (.12) | (.16) | (.06) | |||||
| Net asset value, end of period | 14.48 | 11.49 | 9.19 | 7.94 | 6.75 | |||||
| Total Return (%) c | 26.02 | 25.19 | 17.32 | 20.30 | 23.07 | |||||
| Ratios/Supplemental Data (%): | ||||||||||
| Ratio of total expenses | ||||||||||
| to average net assets | 2.32 | 2.39 | 2.53 | 2.78 | 3.04 | |||||
| Ratio of net expenses | ||||||||||
| to average net assets | 2.28 | 2.37 | 2.19 | 2.78 | 3.04 | |||||
| Ratio of net investment income | ||||||||||
| (loss) to average net assets | (.21) | (.22) | .04 | .24 | (.60) | |||||
| Portfolio Turnover Rate | 83.37 | 80.76 | 64.27 | 174.49 | 122.55 | |||||
| Net Assets, end of period ($ x 1,000) | 3,230 | 2,752 | 2,419 | 2,168 | 1,936 | |||||
| a | Based on average shares outstanding at each month end. | |
| b | Amount represents less than $.01 per share. | |
| c | Exclusive of sales charge. | |
| See notes to financial statements. | ||
20
| Year Ended October 31, | ||||||||||
| Class C Shares | 2007 | 2006 | 2005 | 2004 | 2003 | |||||
| Per Share Data ($): | ||||||||||
| Net asset value, beginning of period | 10.94 | 8.77 | 7.59 | 6.47 | 5.30 | |||||
| Investment Operations: | ||||||||||
| Investment income (loss)—net a | (.02) | (.02) | .01 | .02 | (.02) | |||||
| Net realized and unrealized | ||||||||||
| gain (loss) on investments | 2.87 | 2.23 | 1.30 | 1.27 | 1.25 | |||||
| Total from Investment Operations | 2.85 | 2.21 | 1.31 | 1.29 | 1.23 | |||||
| Distributions: | ||||||||||
| Dividends from investment income—net | — | (.04) | (.13) | (.17) | (.06) | |||||
| Net asset value, end of period | 13.79 | 10.94 | 8.77 | 7.59 | 6.47 | |||||
| Total Return (%) b | 26.05 | 25.24 | 17.35 | 20.33 | 23.45 | |||||
| Ratios/Supplemental Data (%): | ||||||||||
| Ratio of total expenses | ||||||||||
| to average net assets | 2.28 | 2.38 | 2.48 | 2.77 | 2.89 | |||||
| Ratio of net expenses | ||||||||||
| to average net assets | 2.24 | 2.35 | 2.14 | 2.77 | 2.89 | |||||
| Ratio of net investment income | ||||||||||
| (loss) to average net assets | (.16) | (.18) | .11 | .23 | (.41) | |||||
| Portfolio Turnover Rate | 83.37 | 80.76 | 64.27 | 174.49 | 122.55 | |||||
| Net Assets, end of period ($ x 1,000) | 3,074 | 1,749 | 1,210 | 840 | 663 | |||||
| a | Based on average shares outstanding at each month end. | |
| b | Exclusive of sales charge. | |
| See notes to financial statements. | ||
The Fund 21
FINANCIAL HIGHLIGHTS (continued)
| Year Ended October 31, | ||||||||||
| Class I Shares | 2007 a | 2006 | 2005 | 2004 | 2003 | |||||
| Per Share Data ($): | ||||||||||
| Net asset value, beginning of period | 12.72 | 10.15 | 8.72 | 7.40 | 6.08 | |||||
| Investment Operations: | ||||||||||
| Investment income—net b | .23 | .11 | .09 | .06 | .11 | |||||
| Net realized and unrealized | ||||||||||
| gain (loss) on investments | 3.23 | 2.57 | 1.49 | 1.45 | 1.30 | |||||
| Total from Investment Operations | 3.46 | 2.68 | 1.58 | 1.51 | 1.41 | |||||
| Distributions: | ||||||||||
| Dividends from investment income—net | (.10) | (.11) | (.15) | (.19) | (.09) | |||||
| Net asset value, end of period | 16.08 | 12.72 | 10.15 | 8.72 | 7.40 | |||||
| Total Return (%) | 27.40 | 26.57 | 18.31 | 20.89 | 23.21 | |||||
| Ratios/Supplemental Data (%): | ||||||||||
| Ratio of total expenses | ||||||||||
| to average net assets | 1.23 | 1.33 | 1.63 | 2.24 | 2.21 | |||||
| Ratio of net expenses | ||||||||||
| to average net assets | 1.21 | 1.31 | 1.28 | 2.24 | 2.21 | |||||
| Ratio of net investment income | ||||||||||
| to average net assets | 1.44 | .91 | .98 | .69 | 1.24 | |||||
| Portfolio Turnover Rate | 83.37 | 80.76 | 64.27 | 174.49 | 122.55 | |||||
| Net Assets, end of period ($ x 1,000) | 295 | 149 | 47 | 19 | 20 | |||||
| a | Effective June 1, 2007, the fund redesignated Class R shares to Class I shares. | |
| b | Based on average shares outstanding at each month end. | |
| See notes to financial statements. | ||
22
| Year Ended October 31, | ||||||||||
| Class T Shares | 2007 | 2006 | 2005 | 2004 | 2003 | |||||
| Per Share Data ($): | ||||||||||
| Net asset value, beginning of period | 12.12 | 9.68 | 8.39 | 7.17 | 5.84 | |||||
| Investment Operations: | ||||||||||
| Investment income (loss)—net a | .02 | .03 | .08 | (.03) | (.06) | |||||
| Net realized and unrealized | ||||||||||
| gain (loss) on investments | 3.12 | 2.45 | 1.40 | 1.39 | 1.39 | |||||
| Total from Investment Operations | 3.14 | 2.48 | 1.48 | 1.36 | 1.33 | |||||
| Distributions: | ||||||||||
| Dividends from investment income—net | (.02) | (.04) | (.19) | (.14) | — | |||||
| Net asset value, end of period | 15.24 | 12.12 | 9.68 | 8.39 | 7.17 | |||||
| Total Return (%) b | 25.98 | 25.65 | 17.87 | 19.22 | 22.77 | |||||
| Ratios/Supplemental Data (%): | ||||||||||
| Ratio of total expenses | ||||||||||
| to average net assets | 2.08 | 2.30 | 2.13 | 3.75 | 3.47 | |||||
| Ratio of net expenses | ||||||||||
| to average net assets | 2.05 | 1.98 | 1.78 | 3.75 | 3.47 | |||||
| Ratio of net investment income | ||||||||||
| (loss) to average net assets | .17 | .23 | .77 | (.44) | (1.05) | |||||
| Portfolio Turnover Rate | 83.37 | 80.76 | 64.27 | 174.49 | 122.55 | |||||
| Net Assets, end of period ($ x 1,000) | 30 | 35 | 26 | 3 | 1 | |||||
| a | Based on average shares outstanding at each month end. | |
| b | Exclusive of sales charge. | |
| See notes to financial statements. | ||
The Fund 23
NOTES TO FINANCIAL STATEMENTS
NOTE 1—Significant Accounting Policies:
Dreyfus Premier International Growth Fund (the “fund”) is a separate non-diversified series of Dreyfus Premier International Funds, Inc. (the “Company”) which is registered under the Investment Company Act of 1940, as amended (the “Act”), as an open-end management investment company and operates as a series company currently offering two series, including the fund. The fund’s investment objective is to maximize capital growth.The Dreyfus Corporation (the “Manager” or “Dreyfus”) serves as the fund’s investment adviser.
On July 1,2007,Mellon Financial Corporation (“Mellon Financial”) and The Bank of New York Company, Inc. merged, forming The Bank of New York Mellon Corporation (“BNY Mellon”). As part of this transaction, Dreyfus became a wholly-owned subsidiary of BNY Mellon.
The fund’s Board of Directors approved the redesignation of the fund’s Class R shares as Class I shares, effective June 1, 2007.The description of the eligibility requirements for Class I shares remains the same as it was for Class R shares.
MBSC Securities Corporation (the “Distributor”), a wholly-owned subsidiary of Dreyfus, is the distributor of the fund’s shares.The fund is authorized to issue 300 million shares of $.001 par value Common Stock in each of the following classes of shares: Class A, Class B, Class C, Class I and Class T. Class A and Class T shares are subject to a sales charge imposed at the time of purchase. Class B shares are subject to a contingent deferred sales charge (“CDSC”) imposed on Class B share redemptions made within six years of purchase and automatically convert to Class A shares after six years. Class C shares are subject to a CDSC imposed on Class C shares redeemed within one year of purchase. Class I shares are sold at net asset value per share only to institutional investors. Other differences between the classes include the services offered to and the expenses borne by each class, the allocation of certain transfer agency costs and certain voting rights. Income, expenses (other than expenses attributable to a specific class), and realized and unrealized gains or losses on investments are allocated to each class of shares based on its relative net assets.
24
The Company accounts separately for the assets, liabilities and operations of each series. Expenses directly attributable to each series are charged to that series’ operations; expenses which are applicable to all series are allocated among them on a pro rata basis.
The fund’s financial statements are prepared in accordance with U.S. generally accepted accounting principles, which may require the use of management estimates and assumptions. Actual results could differ from those estimates.
The fund enters into contracts that contain a variety of indemnifications. The fund’s maximum exposure under these arrangements is unknown.The fund does not anticipate recognizing any loss related to these arrangements.
(a) Portfolio valuation: Investments in securities are valued at the last sales price on the securities exchange or national securities market on which such securities are primarily traded. Securities listed on the National Market System for which market quotations are available are valued at the official closing price or, if there is no official closing price that day, at the last sale price. Securities not listed on an exchange or the national securities market, or securities for which there were no transactions, are valued at the average of the most recent bid and asked prices, except for open short positions, where the asked price is used for valuation purposes. Bid price is used when no asked price is available. Registered open-end investment companies that are not traded on an exchange are valued at their net asset value.When market quotations or official closing prices are not readily available, or are determined not to reflect accurately fair value, such as when the value of a security has been significantly affected by events after the close of the exchange or market on which the security is principally traded (for example, a foreign exchange or market), but before the fund calculates its net asset value, the fund may value these investments at fair value as determined in accordance with the procedures approved by the Board of Directors. Fair valuing of securities may be determined with the assistance of a pricing service using calculations based on indices of domestic securities and other appropriate indicators, such as prices of relevant ADR’s and futures contracts. For other securities that are fair valued by the Board of Directors,certain factors may be considered such as:fundamental analytical data, the nature and duration of restrictions on disposition, an evaluation of the forces that influence the market in which the securities are purchased and sold, and public trading in similar securities of the issuer or comparable issuers. Financial futures are valued at the last sales price. Investments denominated in foreign currencies are translated to U.S. dollars at the prevailing rates of exchange. Forward currency exchange contracts are valued at the forward rate.
The Fund 25
NOTES TO FINANCIAL STATEMENTS (continued)
The Financial Accounting Standards Board (“FASB”) released Statement of Financial Accounting Standards No. 157 “Fair Value Measurements” (“FAS 157”). FAS 157 establishes an authoritative definition of fair value, sets out a framework for measuring fair value, and requires additional disclosures about fair-value measurements.The application of FAS 157 is required for fiscal years beginning after November 15, 2007 and interim periods within those fiscal years. Management does not believe that the application of this standard will have a material impact on the financial statements of the fund.
(b) Foreign currency transactions: The fund does not isolate that portion of the results of operations resulting from changes in foreign exchange rates on investments from the fluctuations arising from changes in market prices of securities held. Such fluctuations are included with the net realized and unrealized gain or loss on investments.
Net realized foreign exchange gains or losses arise from sales and maturities of short-term securities, sales of foreign currencies, currency gains or losses realized on securities transactions and the difference between the amounts of dividends, interest, and foreign withholding taxes recorded on the fund’s books and the U.S. dollar equivalent of the amounts actually received or paid. Net unrealized foreign exchange gains and losses arise from changes in the value of assets and liabilities other than investments in securities, resulting from changes in exchange rates. Such gains and losses are included with net realized and unrealized gain or loss on investments.
26
(c) Securities transactions and investment income: Securities transactions are recorded on a trade date basis. Realized gain and loss from securities transactions are recorded on the identified cost basis. Dividend income is recognized on the ex-dividend date and interest income, including, where applicable, accretion of discount and amortization of premium on investments, is recognized on the accrual basis.
The fund has an arrangement with the custodian bank whereby the fund receives earnings credits from the custodian when positive cash balances are maintained, which are used to offset custody fees. For financial reporting purposes, the fund includes net earnings credits as an expense offset in the Statement of Operations.
(d) Affiliated issuers: Investments in other investment companies advised by Dreyfus are defined as “affiliated” in the Act.
(e) Dividends to shareholders: Dividends are recorded on the ex-dividend date. Dividends from investment income-net and dividends from net realized capital gain, if any, are normally declared and paid annually, but the fund may make distributions on a more frequent basis to comply with the distribution requirements of the Internal Revenue Code of 1986, as amended (the “Code”).To the extent that net realized capital gain can be offset by capital loss carryovers, it is the policy of the fund not to distribute such gain. Income and capital gain distributions are determined in accordance with income tax regulations, which may differ from U.S. generally accepted accounting principles.
(f) Federal income taxes: It is the policy of the fund to continue to qualify as a regulated investment company, if such qualification is in the best interests of its shareholders, by complying with the applicable provisions of the Code, and to make distributions of taxable income sufficient to relieve it from substantially all federal income and excise taxes.
The Fund 27
NOTES TO FINANCIAL STATEMENTS (continued)
The FASB released FASB Interpretation No. 48 “Accounting for Uncertainty in Income Taxes” (FIN 48). FIN 48 provides guidance for how uncertain tax positions should be recognized, measured, presented and disclosed in the financial statements. FIN 48 requires the evaluation of tax positions taken or expected to be taken in the course of preparing the fund’s tax returns to determine whether the tax positions are “more-likely-than-not” of being sustained by the applicable tax authority. Tax positions not deemed to meet the more-likely-than-not threshold would be recorded as a tax benefit or expense in the current year.Adoption of FIN 48 is required for fiscal years beginning after December 15, 2006 and is to be applied to all open tax years as of the effective date. Management does not believe that the application of this standard will have a material impact on the financial statements of the fund.
At October 31, 2007, the components of accumulated earnings on a tax basis were as follows: undistributed ordinary income $410,924, accumulated capital losses $4,798,941 and unrealized appreciation $14,656,192.
The accumulated capital loss carryover is available to be applied against future net securities profits, if any, realized subsequent to October 31, 2007. If not applied, $246,712 of the carryover expires in fiscal 2009, $3,503,697 expires in fiscal 2010 and $1,048,532 expires in fiscal 2011.
The tax character of distributions paid to shareholders during the fiscal periods ended October 31, 2007 and October 31, 2006, were as follows: ordinary income of $235,140 and $264,951, respectively.
During the period ended October 31, 2007, as a result of permanent book to tax differences, primarily due to the tax treatment for foreign currency gains and losses, the fund increased accumulated undistributed investment income-net by $38,932 and decreased accumulated net realized gain (loss) on investments by the same amount. Net assets and net asset value per share were not affected by this reclassification.
NOTE 2—Bank Lines of Credit:
The fund may borrow up to $10 million for leveraging purposes under a short-term unsecured line of credit and participates with other Dreyfus-managed funds in a $100 million unsecured line of credit primarily to be utilized for temporary or emergency purposes, including the financing of redemptions. Interest is charged to the fund based on prevailing market rates in effect at the time of borrowing. During the period ended October 31, 2007, the fund did not borrow under either line of credit.
28
NOTE 3—Management Fee and Other Transactions With Affiliates:
(a) Pursuant to a Management Agreement (“Agreement”) with Dreyfus, the management fee is computed at the annual rate of .75% of the value of the fund’s average daily net assets and is payable monthly. Dreyfus has undertaken from September 14, 2007 to waive 25% of the fund’s management fee through September 13, 2008.The reduction in management fee, pursuant to the undertaking, amounted to $13,499 during the period ended October 31, 2007.
During the period ended October 31, 2007, the Distributor retained $6,561 and $1 from commissions earned on sales of the fund’s Class A and Class T shares, respectively and $3,477 and $240 from CDSC on redemptions of the fund’s Class B and Class C shares, respectively.
(b) Under the Distribution Plan (the “Plan”) adopted pursuant to Rule 12b-1 under the Act, Class B, Class C and Class T shares pay the Distributor for distributing their shares at an annual rate of .75% of the value of the average daily net assets of Class B and Class C shares and .25% of the value of the average daily net assets of Class T shares. During the period ended October 31, 2007, Class B, Class C and Class T shares were charged $21,676, $17,341 and $101, respectively, pursuant to the Plan.
(c) Under the Shareholder Services Plan, Class A, Class B, Class C and Class T shares pay the Distributor at an annual rate of .25% of the value of their average daily net assets for the provision of certain services.The services provided may include personal services relating to shareholder accounts, such as answering shareholder inquiries regarding the fund and providing reports and other information, and services related to the maintenance of shareholder accounts.The Distributor may make payments to Service Agents (a securities dealer, financial institution or other industry professional) in respect of these services.The Distributor determines the amounts to be paid to Service Agents. During the period ended October 31, 2007, Class A, Class B, Class C and Class T shares were charged $108,321, $7,225, $5,781 and $101, respectively, pursuant to the Shareholder Services Plan.
The Fund 29
NOTES TO FINANCIAL STATEMENTS (continued)
The fund compensates Dreyfus Transfer, Inc., a wholly-owned subsidiary of Dreyfus, under a transfer agency agreement for providing personnel and facilities to perform transfer agency services for the fund. During the period ended October 31, 2007, the fund was charged $33,329 pursuant to the transfer agency agreement.
Effective July 1, 2007, the fund’s custodian, The Bank of New York, became an affiliate of the Manager. Under the fund’s pre-existing custody agreement with The Bank of New York, for providing custodial services for the fund for the four months ended October 31, 2007, the fund was charged $13,374. Prior to becoming an affiliate,The Bank of New York was paid $37,516 for custody services to the fund for the eight months ended June 30, 2007.
During the period ended October 31, 2007, the fund was charged $4,660 for services performed by the Chief Compliance Officer.
The components of “Due to The Dreyfus Corporation and affiliates” in the Statement of Assets and Liabilities consist of: management fees $34,399, Rule 12b-1 distribution plan fees $3,857, shareholder services plan fees $11,406, custody fees $8,058, chief compliance officer fees $2,812 and transfer agency per account fees $5,798, which are offset against an expense reimbursement currently in effect in the amount of $8,701.
(d) Each Board member also serves as a Board member of other funds within the Dreyfus complex. Annual retainer fees and attendance fees are allocated to each fund based on net assets.
30
NOTE 4—Securities Transactions:
The aggregate amount of purchases and sales of investment securities, excluding short-term securities, financial futures and forward currency exchange contracts, during the period ended October 31, 2007, amounted to $40,073,047 and $40,123,390, respectively.
The fund enters into forward currency exchange contracts in order to hedge its exposure to changes in foreign currency exchange rates on its foreign portfolio holdings and to settle foreign currency transac-tions.When executing forward currency exchange contracts, the fund is obligated to buy or sell a foreign currency at a specified rate on a certain date in the future. With respect to sales of forward currency exchange contracts, the fund would incur a loss if the value of the contract increases between the date the forward contract is opened and the date the forward contract is closed.The fund realizes a gain if the value of the contract decreases between those dates. With respect to purchases of forward currency exchange contracts, the fund would incur a loss if the value of the contract decreases between the date the forward contract is opened and the date the forward contract is closed.The fund realizes a gain if the value of the contract increases between those dates.The fund is also exposed to credit risk associated with counter-party nonperformance on these forward currency exchange contracts which is typically limited to the unrealized gain on each open contract. The following summarizes open forward currency exchange contracts at October 31, 2007:
| Foreign | Unrealized | |||||||
| Forward Currency | Currency | Appreciation | ||||||
| Exchange Contracts | Amounts | Cost ($) | Value ($) | (Depreciation) ($) | ||||
| Buys: | ||||||||
| Japanese Yen, expiring | ||||||||
| 11/1/2007 | 3,261,889 | 28,441 | 28,292 | (149) | ||||
| Japanese Yen, | ||||||||
| expiring 11/2/2007 | 6,041,556 | 52,385 | 52,401 | 16 | ||||
| Sells: | Proceeds ($) | |||||||
| British Pound, | ||||||||
| expiring 11/1/2007 | 30,095 | 62,234 | 62,592 | (358) | ||||
| Total | (491) |
The Fund 31
NOTES TO FINANCIAL STATEMENTS (continued)
The fund may invest in financial futures contracts in order to gain exposure to or protect against changes in the market. The fund is exposed to market risk as a result of changes in the value of the underlying financial instruments. Investments in financial futures require the fund to “mark to market” on a daily basis, which reflects the change in market value of the contracts at the close of each day’s trading. Accordingly, variation margin payments are received or made to reflect daily unrealized gains or losses.When the contracts are closed, the fund recognizes a realized gain or loss.These investments require initial margin deposits with a broker, which consist of cash or cash equivalents. The amount of these deposits is determined by the exchange or Board of Trade on which the contract is traded and is subject to change. Contracts open at October 31, 2007, are set forth in the Statement of Financial Futures.
At October 31, 2007, the cost of investments for federal income tax purposes was $40,054,715; accordingly, accumulated net unrealized appreciation on investments was $14,650,291, consisting of $15,388,575 gross unrealized appreciation and $738,284 gross unrealized depreciation.
32
| REPORT OF INDEPENDENT REGISTERED |
| PUBLIC ACCOUNTING FIRM |
| Shareholders and Board of Directors |
| Dreyfus Premier International Growth Fund |
We have audited the accompanying statement of assets and liabilities, including the statements of investments and financial futures, of Dreyfus Premier International Growth Fund (one of the funds comprising Dreyfus Premier International Funds, Inc.) as of October 31, 2007, and the related statement of operations for the year then ended, the statement of changes in net assets for each of the two years in the period then ended,and financial highlights for each of the years indicated therein. These financial statements and financial highlights are the responsibility of the Fund’s management. Our responsibility is to express an opinion on these financial statements and financial highlights based on our audits.
We conducted our audits in accordance with the standards of the Public Company Accounting Oversight Board (United States).Those standards require that we plan and perform the audit to obtain reasonable assurance about whether the financial statements and financial highlights are free of material misstatement.We were not engaged to perform an audit of the Fund’s internal control over financial reporting. Our audits included consideration of internal control over financial reporting as a basis for designing audit procedures that are appropriate in the circumstances, but not for the purpose of expressing an opinion on the effectiveness of the Fund’s internal control over financial reporting. Accordingly, we express no such opinion. An audit also includes examining, on a test basis, evidence supporting the amounts and disclosures in the financial statements and financial highlights, assessing the accounting principles used and significant estimates made by management, and evaluating the overall financial statement presentation. Our procedures included confirmation of securities owned as of October 31, 2007 by correspondence with the custodian and others or by other appropriate auditing procedures where replies from others were not received.We believe that our audits provide a reasonable basis for our opinion.
In our opinion, the financial statements and financial highlights referred to above present fairly, in all material respects, the financial position of Dreyfus Premier International Growth Fund at October 31, 2007, the results of its operations for the year then ended, the changes in its net assets for each of the two years in the period then ended, and the financial highlights for each of the indicated years, in conformity with U.S. generally accepted accounting principles.

| New York, New York |
| December 20, 2007 |
The Fund 33
IMPORTANT TAX INFORMATION (Unaudited)
In accordance with federal tax law, the fund elects to provide each shareholder with their portion of the fund’s foreign taxes paid and the income sourced from foreign countries.Accordingly, the fund hereby makes the following designations regarding its fiscal year ended October 31, 2007:
—the total amount of taxes paid to foreign countries was $103,556
—the total amount of income sourced from foreign countries was $443,352.
As required by federal tax law rules, shareholders will receive notification of their proportionate share of foreign taxes paid and foreign sourced income for the 2007 calendar year with Form 1099-DIV which will be mailed by January 31, 2008. For the fiscal year ended October 31, 2007, certain dividends paid by the fund may be subject to a maximum tax rate of 15%, as provided for by the Jobs and Growth Tax Relief Reconciliation Act of 2003. Of the distributions paid during the fiscal year, $235,140 represents the maximum amount that may be considered qualified dividend income.
34
| INFORMATION ABOUT THE REVIEW AND APPROVAL |
| OF THE FUND’S MANAGEMENT AGREEMENT (Unaudited) |
At a meeting of the fund’s Board held on May 23, 2007, the Board unanimously approved the continuation of the fund’s Management Agreement with Dreyfus for a one-year term ending July 31, 2008.The Board members, none of whom are "interested persons" (as defined in the Investment Company Act of 1940, as amended) of the fund were assisted in their review by independent legal counsel and met with counsel in executive session separate from representatives of Dreyfus. In approving the continuance of the Management Agreement, the Board considered all factors that they believed to be relevant, including, among other things, the factors discussed below.
Analysis of Nature, Extent and Quality of Services Provided to the Fund. The Board members received a presentation from representatives of Dreyfus regarding services provided to the fund and other funds in the Dreyfus fund complex, and discussed the nature, extent and quality of the services provided to the fund pursuant to its Management Agreement. Dreyfus’s representatives reviewed the fund’s distribution of accounts and the relationships Dreyfus has with various intermediaries and the different needs of each. Dreyfus’s representatives noted the various distribution channels for the fund as well as the diverse methods of distribution among other funds in the Dreyfus fund complex, and Dreyfus’s corresponding need for broad, deep, and diverse resources to be able to provide ongoing shareholder services to each distribution channel, including those of the fund. Dreyfus also provided the number of accounts investing in the fund, as well as the fund’s asset size.
The Board members also considered Dreyfus’s research and portfolio management capabilities and Dreyfus’s oversight of day-to-day fund operations, including fund accounting and administration and assistance in meeting legal and regulatory requirements.The Board members also considered Dreyfus’s extensive administrative, accounting and compliance infrastructure.
The Fund 35
| INFORMATION ABOUT THE REVIEW AND APPROVAL OF THE |
| FUND’S MANAGEMENT AGREEMENT (Unaudited) (continued) |
Comparative Analysis of the Fund’s Performance and Management Fee and Expense Ratio. The Board members reviewed the fund’s performance, management fee and expense ratio, placing significant emphasis on comparative data supplied by Lipper, Inc., an independent provider of mutual fund data, including contractual and actual (net of fee waivers and expense reimbursements) management fees, operating expense components and total return performance.The fund’s performance was compared to that of a Performance Universe, consisting of all funds with the same Lipper classification/objective, and a Performance Group, consisting of comparable funds chosen by Lipper based on guidelines previously approved by the Board. Similarly, the fund’s contractual and actual management fee and operating expenses were compared to those of an Expense Universe, consisting of funds with the same or similar Lipper classification/objective, and an Expense Group, consisting comparable funds chosen by Lipper based on guidelines previously approved by the Board. As part of its review of expenses, the Board also considered other fund expenses, such as transfer agent fees, custody fees, 12b-1 or non-12b-1 service fees (if any), and other non-management fees.
In its review of performance, the Board noted that the fund’s average annual total return exceeded the median of the Performance Group and Performance Universe for the one-, three-, and five-year periods ended March 31, 2007.
In its review of the fund’s management fee and operating expenses, the Board examined the range of management fees and expense ratios of the funds in the Expense Group and Expense Universe, noting, among other things,that the fund’s actual management fee and total expense ratio were lower than the median of the Expense Group and Expense Universe.
Representatives of Dreyfus reviewed with the Board members the fees paid to Dreyfus or its affiliates by mutual funds and/or separate accounts managed by Dreyfus with similar investment objectives, policies and strategies as the fund (the "Similar Accounts"), and explained the nature of the Similar Accounts and the differences, from Dreyfus’s perspective, as applicable, in providing services to the Similar Accounts as compared to the fund. Dreyfus’s representatives also reviewed the costs associated with distribution through intermediaries.The Board analyzed differences in fees paid to Dreyfus and discussed the relationship of the advisory fees paid in light of Dreyfus’s performance, and the services provided.The Board members considered the relevance of the fee information provided for the Similar Accounts managed by Dreyfus to evaluate the appropriateness and reasonableness of the fund’s management fees.The Board acknowledged that differences in fees paid by the Similar Accounts seemed to be consistent with the services provided.
36
Analysis of Profitability and Economies of Scale. Dreyfus’s representatives reviewed the dollar amount of expenses allocated and profit received by Dreyfus and the method used to determine such expenses and profit. The Board members evaluated the profitability analysis in light of the relevant circumstances for the fund and the extent to which economies of scale would be realized if the fund grows and whether fee levels reflect these economies of scale for the benefit of fund investors.The Board members also considered potential benefits to Dreyfus from acting as investment adviser and noted the soft dollar arrangements with respect to trading the fund’s investments.
It was noted that the Board members should consider Dreyfus’s profitability with respect to the fund as part of their evaluation of whether the fees under the Management Agreement bear a reasonable relationship to the mix of services provided by Dreyfus, including the nature, extent and quality of such services and that a discussion of economies of scale is predicated on a fund having achieved a substantial size increasing assets and that, if a fund’s assets had been static or decreasing, the possibility that Dreyfus may have realized any economies of scale would be less. It also was noted that the profitability percentage for managing the fund was within ranges determined by appropriate court cases to be reasonable given the services rendered and generally superior service levels provided.
The Fund 37
| INFORMATION ABOUT THE REVIEW AND APPROVAL OF THE |
| FUND’S MANAGEMENT AGREEMENT (Unaudited) (continued) |
At the conclusion of these discussions, the Board agreed that it had been furnished with sufficient information to make an informed business decision with respect to continuation of the fund’s Management Agreement. Based on the discussions and considerations as described above, the Board made the following conclusions and determinations.
- The Board concluded that the nature, extent and quality of the ser- vices provided by Dreyfus are adequate and appropriate.
- The Board generally was satisfied with the fund’s performance.
- The Board concluded that the fee paid by the fund to Dreyfus was reasonable in light of the services provided, comparative performance, expense and advisory fee information, costs of the services provided and profits to be realized and benefits derived or to be derived by Dreyfus from its relationship with the fund.
- The Board determined that the economies of scale which may accrue to Dreyfus and its affiliates in connection with the management of the fund had been adequately considered by Dreyfus in connection with the management fee rate charged to the fund and that, to the extent in the future it were determined that material economies of scale had not been shared with the fund, the Board would seek to have those economies of scale shared with the fund.
The Board members considered these conclusions and determinations, along with information received on a routine and regular basis throughout the year, and, without any one factor being dispositive, the Board determined that continuation of the fund’s Management Agreement was in the best interests of the fund and its shareholders.
38
BOARD MEMBERS INFORMATION (Unaudited)
| Joseph S. DiMartino (64) |
| Chairman of the Board (1995) |
| Principal Occupation During Past 5 Years: |
| • Corporate Director and Trustee |
Other Board Memberships and Affiliations:
- The Muscular Dystrophy Association, Director
- Century Business Services, Inc., a provider of outsourcing functions for small and medium size companies, Director
- The Newark Group, a provider of a national market of paper recovery facilities, paperboard mills and paperboard converting plants, Director
- Sunair Services Corporation, a provider of certain outdoor-related services to homes and businesses, Director
No. of Portfolios for which Board Member Serves: 165
———————
| Gordon J. Davis (66) |
| Board Member (1993) |
Principal Occupation During Past 5 Years:
- Partner in the law firm of LeBoeuf, Lamb, Greene & MacRae, LLP
- President, Lincoln Center for the Performing Arts, Inc. (2001)
Other Board Memberships and Affiliations:
- Consolidated Edison, Inc., a utility company, Director
- Phoenix Companies Inc., a life insurance company, Director
- Board Member/Trustee for several not-for-profit groups
No. of Portfolios for which Board Member Serves: 36
———————
| David P. Feldman (68) |
| Board Member (1991) |
Principal Occupation During Past 5 Years:
• Corporate Director and Trustee
Other Board Memberships and Affiliations:
- BBH Mutual Funds Group (11 funds), Director
- The Jeffrey Company, a private investment company, Director
No. of Portfolios for which Board Member Serves: 49
The Fund 39
BOARD MEMBERS INFORMATION (Unaudited) (continued)
| Lynn Martin (67) |
| Board Member (1993) |
Principal Occupation During Past 5 Years:
- Advisor to the international accounting firm of Deloitte & Touche, LLP and Chair to its Council for the Advancement of Women from March 1993-September 2005
Other Board Memberships and Affiliations:
- AT&T Inc., a telecommunications company, Director
- Ryder System, Inc., a supply chain and transportation management company, Director
- The Proctor & Gamble Co., a consumer products company, Director
- Constellation Energy Group, Director
- Chicago Council on Global Affairs
- Coca-Cola International Advisory Council
- Deutsche Bank Advisory Council
No. of Portfolios for which Board Member Serves: 9
———————
| Daniel Rose (78) |
| Board Member (1992) |
Principal Occupation During Past 5 Years:
- Chairman and Chief Executive Officer of Rose Associates, Inc., a New York based real estate development and management firm
Other Board Memberships and Affiliations:
- Baltic-American Enterprise Fund,Vice Chairman and Director
- Harlem Educational Activities Fund, Inc., Chairman
- Housing Committee of the Real Estate Board of New York, Inc., Director
No. of Portfolios for which Board Member Serves: 34
———————
| Philip L. Toia (74) |
| Board Member (1997) |
| Principal Occupation During Past 5 Years: |
| • Private Investor |
No. of Portfolios for which Board Member Serves: 19
40
| Sander Vanocur (79) |
| Board Member (1992) |
| Principal Occupation During Past 5 Years: |
| • President, Old Owl Communications |
No. of Portfolios for which Board Member Serves: 34
———————
| Anne Wexler (77) |
| Board Member (1994) |
Principal Occupation During Past 5 Years:
- Chairman of the Wexler & Walker Public Policy Associates, consultants specializing in government relations and public affairs from January 1981 to present
Other Board Memberships and Affiliations:
- Wilshire Mutual Funds (5 funds), Director
- The Community Foundation for the National Capital Region, Director
- Member of the Council of Foreign Relations
- Member of the National Park Foundation
No. of Portfolios for which Board Member Serves: 49
———————
Once elected all Board Members serve for an indefinite term, but achieve Emeritus status upon reaching age 80.The address of the Board Members and Officers is in c/o The Dreyfus Corporation, 200 Park Avenue, New York, New York 10166. Additional information about the Board Members is available in the fund’s Statement of Additional Information which can be obtained from Dreyfus free of charge by calling this toll free number: 1-800-554-4611.
The Fund 41
OFFICERS OF THE FUND (Unaudited)
| J. DAVID OFFICER, President since |
| December 2006. |
Chief Operating Officer,Vice Chairman and a Director of the Manager, and an officer of 82 investment companies (comprised of 165 portfolios) managed by the Manager. He is 59 years old and has been an employee of the Manager since April 1998.
| PHILLIP N. MAISANO, Executive Vice |
| President since July 2007. |
Chief Investment Officer,Vice Chair and a director of the Manager, and an officer of 82 investment companies (comprised of 165 portfolios) managed by the Manager. Mr. Maisano also is an officer and/or Board member of certain other investment management subsidiaries of The Bank of New York Mellon Corporation, each of which is an affiliate of the Manager. He is 60 years old and has been an employee of the Manager since November 2006. Prior to joining the Manager, Mr. Maisano served as Chairman and Chief Executive Officer of EACM Advisors, an affiliate of the Manager, since August 2004, and served as Chief Executive Officer of Evaluation Associates, a leading institutional investment consulting firm, from 1988 until 2004.
| MICHAEL A. ROSENBERG, Vice President |
| and Secretary since August 2005. |
Associate General Counsel of the Manager, and an officer of 83 investment companies (comprised of 182 portfolios) managed by the Manager. He is 47 years old and has been an employee of the Manager since October 1991.
| JAMES BITETTO, Vice President and |
| Assistant Secretary since August 2005. |
Associate General Counsel and Secretary of the Manager, and an officer of 83 investment companies (comprised of 182 portfolios) managed by the Manager. He is 41 years old and has been an employee of the Manager since December 1996.
| JONI LACKS CHARATAN, Vice President |
| and Assistant Secretary since |
| August 2005. |
Associate General Counsel of the Manager, and an officer of 83 investment companies (comprised of 182 portfolios) managed by the Manager. She is 51 years old and has been an employee of the Manager since October 1988.
| JOSEPH M. CHIOFFI, Vice President and |
| Assistant Secretary since August 2005. |
Associate General Counsel of the Manager, and an officer of 83 investment companies (comprised of 182 portfolios) managed by the Manager. He is 45 years old and has been an employee of the Manager since June 2000.
| JANETTE E. FARRAGHER, Vice President |
| and Assistant Secretary since |
| August 2005. |
Associate General Counsel of the Manager, and an officer of 83 investment companies (comprised of 182 portfolios) managed by the Manager. She is 44 years old and has been an employee of the Manager since February 1984.
| JOHN B. HAMMALIAN, Vice President and |
| Assistant Secretary since August 2005. |
Associate General Counsel of the Manager, and an officer of 83 investment companies (comprised of 182 portfolios) managed by the Manager. He is 44 years old and has been an employee of the Manager since February 1991.
| ROBERT R. MULLERY, Vice President and |
| Assistant Secretary since August 2005. |
Associate General Counsel of the Manager, and an officer of 83 investment companies (comprised of 182 portfolios) managed by the Manager. He is 55 years old and has been an employee of the Manager since May 1986.
42
| JEFF PRUSNOFSKY, Vice President and |
| Assistant Secretary since August 2005. |
Associate General Counsel of the Manager, and an officer of 83 investment companies (comprised of 182 portfolios) managed by the Manager. He is 42 years old and has been an employee of the Manager since October 1990.
| JAMES WINDELS, Treasurer since |
| November 2001. |
Director – Mutual Fund Accounting of the Manager, and an officer of 83 investment companies (comprised of 182 portfolios) managed by the Manager. He is 49 years old and has been an employee of the Manager since April 1985.
| ROBERT ROBOL, Assistant Treasurer |
| since August 2005. |
Senior Accounting Manager – Money Market and Municipal Bond Funds of the Manager, and an officer of 83 investment companies (comprised of 182 portfolios) managed by the Manager. He is 43 years old and has been an employee of the Manager since October 1988.
| ROBERT SALVIOLO, Assistant Treasurer |
| since May 2007. |
Senior Accounting Manager – Equity Funds of the Manager, and an officer of 83 investment companies (comprised of 182 portfolios) managed by the Manager. He is 40 years old and has been an employee of the Manager since June 1989.
| ROBERT SVAGNA, Assistant Treasurer |
| since August 2002. |
Senior Accounting Manager – Equity Funds of the Manager, and an officer of 83 investment companies (comprised of 182 portfolios) managed by the Manager. He is 40 years old and has been an employee of the Manager since November 1990.
| GAVIN C. REILLY, Assistant Treasurer |
| since December 2005. |
Tax Manager of the Investment Accounting and Support Department of the Manager, and an officer of 83 investment companies (comprised of 182 portfolios) managed by the Manager. He is 39 years old and has been an employee of the Manager since April 1991.
| JOSEPH W. CONNOLLY, Chief Compliance |
| Officer since October 2004. |
Chief Compliance Officer of the Manager and The Dreyfus Family of Funds (83 investment companies, comprised of 182 portfolios). From November 2001 through March 2004, Mr. Connolly was first Vice-President, Mutual Fund Servicing for Mellon Global Securities Services. In that capacity, Mr. Connolly was responsible for managing Mellon’s Custody, Fund Accounting and Fund Administration services to third-party mutual fund clients. He is 50 years old and has served in various capacities with the Manager since 1980, including manager of the firm’s Fund Accounting Department from 1997 through October 2001.
| WILLIAM GERMENIS, Anti-Money |
| Laundering Compliance Officer since |
| October 2002. |
Vice President and Anti-Money Laundering Compliance Officer of the Distributor, and the Anti-Money Laundering Compliance Officer of 79 investment companies (comprised of 178 portfolios) managed by the Manager. He is 37 years old and has been an employee of the Distributor since October 1998.
The Fund 43
NOTES
Telephone Call your financial representative or 1-800-554-4611
| The Dreyfus Premier Family of Funds | ||
| 144 Glenn Curtiss Boulevard, Uniondale, NY 11556-0144 |
The fund files its complete schedule of portfolio holdings with the Securities and Exchange Commission (“SEC”) for the first and third quarters of each fiscal year on Form N-Q. The fund’s Forms N-Q are available on the SEC’s website at http://www.sec.gov and may be reviewed and copied at the SEC’s Public Reference Room in Washington, DC. Information on the operation of the Public Reference Room may be obtained by calling 1-202-551-8090.
A description of the policies and procedures that the fund uses to determine how to vote proxies relating to portfolio securities, and information regarding how the fund voted these proxies for the 12-month period ended June 30, 2007, is available at http://www.dreyfus.com and on the SEC’s website at http://www.sec.gov. The description of the policies and procedures is also available without charge, upon request, by calling 1-800-645-6561.

© 2007 MBSC Securities Corporation
Item 2. Code of Ethics.
The Registrant has adopted a code of ethics that applies to the Registrant's principal executive officer, principal financial officer, principal accounting officer or controller, or persons performing similar functions There have been no amendments to, or waivers in connection with, the Code of Ethics during the period covered by this Report.
Item 3. Audit Committee Financial Expert.
The Registrant's Board has determined that David Feldman, a member of the Audit Committee of the Board, is an audit committee financial expert as defined by the Securities and Exchange Commission (the "SEC"). Mr. Feldman is "independent" as defined by the SEC for purposes of audit committee financial expert determinations.
Item 4. Principal Accountant Fees and Services
(a) Audit Fees. The aggregate fees billed for each of the last two fiscal years (the "Reporting Periods") for professional services rendered by the Registrant's principal accountant (the "Auditor") for the audit of the Registrant's annual financial statements, or services that are normally provided by the Auditor in connection with the statutory and regulatory filings or engagements for the Reporting Periods, were $50,316 in 2006 and $50,316 in 2007.
(b) Audit-Related Fees. The aggregate fees billed in the Reporting Periods for assurance and related services by the Auditor that are reasonably related to the performance of the audit of the Registrant's financial statements and are not reported under paragraph (a) of this Item 4 were $0 in 2006 and $0 in 2007.
The aggregate fees billed in the Reporting Periods for non-audit assurance and related services by the Auditor to the Registrant's investment adviser (not including any sub-investment adviser whose role is primarily portfolio management and is subcontracted with or overseen by another investment adviser), and any entity controlling, controlled by or under common control with the investment adviser that provides ongoing services to the Registrant ("Service Affiliates"), that were reasonably related to the performance of the annual audit of the Service Affiliate, which required pre-approval by the Audit Committee were $0 in 2006 and $0 in 2007.
Note: For the second paragraph in each of (b) through (d) of this Item 4, certain of such services were not pre-approved prior to May 6, 2003, when such services were required to be pre-approved. On and after May 6, 2003, 100% of all services provided by the Auditor were pre-approved as required. For comparative purposes, the fees shown assume that all such services were pre-approved, including services that were not pre-approved prior to the compliance date of the pre-approval requirement.
(c) Tax Fees. The aggregate fees billed in the Reporting Periods for professional services rendered by the Auditor for tax compliance, tax advice and tax planning ("Tax Services") were $8,735 in 2006 and $9953 in 2007. These services consisted of (i) review or preparation of U.S. federal, state, local and excise tax returns; (ii) U.S. federal, state and local tax planning, advice and assistance regarding statutory, regulatory or administrative developments, (iii) tax advice regarding tax qualification matters and/or treatment of various financial instruments held or proposed to be acquired or held, and (iv) determination of Passive Foreign Investment Companies (as applicable).
The aggregate fees billed in the Reporting Periods for Tax Services by the Auditor to Service Affiliates which required pre-approval by the Audit Committee were $0 in 2006 and $0 in 2007.
(d) All Other Fees. The aggregate fees billed in the Reporting Periods for products and services provided by the Auditor, other than the services reported in paragraphs (a) through (c) of this Item, were $1,338 in 2006 and $0 in 2007. These services consisted of a review of the Registrant's anti-money laundering program.
The aggregate fees billed in the Reporting Periods for Non-Audit Services by the Auditor to Service Affiliates, other than the services reported in paragraphs (b) through (c) of this Item, which required pre-approval by the Audit Committee were $0 in 2006 and $0 in 2007.
Audit Committee Pre-Approval Policies and Procedures. The Registrant's Audit Committee has established policies and procedures (the "Policy") for pre-approval (within specified fee limits) of the Auditor's engagements for non-audit services to the Registrant and Service Affiliates without specific case-by-case consideration. Pre-approval considerations include whether the proposed services are compatible with maintaining the Auditor's independence. Pre-approvals pursuant to the Policy are considered annually.
Non-Audit Fees. The aggregate non-audit fees billed by the Auditor for services rendered to the Registrant, and rendered to Service Affiliates, for the Reporting Periods were $436,321 in 2006 and $1,627,514 in 2007.
Auditor Independence. The Registrant's Audit Committee has considered whether the provision of non-audit services that were rendered to Service Affiliates which were not pre-approved (not requiring pre-approval) is compatible with maintaining the Auditor's independence.
| Item 5. | Audit Committee of Listed Registrants. | |
| Not applicable. [CLOSED-END FUNDS ONLY] | ||
| Item 6. | Schedule of Investments. | |
| Not applicable. | ||
| Item 7. | Disclosure of Proxy Voting Policies and Procedures for Closed-End Management | |
| Investment Companies. | ||
| Not applicable. [CLOSED-END FUNDS ONLY] | ||
| Item 8. | Portfolio Managers of Closed-End Management Investment Companies. | |
| Not applicable. [CLOSED-END FUNDS ONLY, beginning with reports for periods ended | ||
| on and after December 31, 2005] | ||
| Item 9. | Purchases of Equity Securities by Closed-End Management Investment Companies and | |
| Affiliated Purchasers. | ||
| Not applicable. [CLOSED-END FUNDS ONLY] | ||
| Item 10. | Submission of Matters to a Vote of Security Holders. |
The Registrant has a Nominating Committee (the "Committee"), which is responsible for selecting and nominating persons for election or appointment by the Registrant's Board as Board members. The Committee has adopted a Nominating Committee Charter (the "Charter"). Pursuant to the Charter, the Committee will consider recommendations for nominees from shareholders submitted to the Secretary of the Registrant, c/o The Dreyfus Corporation Legal Department, 200 Park Avenue, 8th Floor East, New York, New York 10166. A nomination submission must include information regarding the recommended nominee as specified in the Charter. This information includes all information relating to a recommended nominee that is required to be disclosed in solicitations or proxy statements for the election of Board members, as well as information sufficient to evaluate the factors to be considered by the Committee, including character and integrity, business and professional experience, and whether the person has the ability to apply sound and independent business judgment and would act in the interests of the Registrant and its shareholders.
Nomination submissions are required to be accompanied by a written consent of the individual to stand for election if nominated by the Board and to serve if elected by the shareholders, and such additional information must be provided regarding the recommended nominee as reasonably requested by the Committee.
Item 11. Controls and Procedures.
(a) The Registrant's principal executive and principal financial officers have concluded, based on their evaluation of the Registrant's disclosure controls and procedures as of a date within 90 days of the filing date of this report, that the Registrant's disclosure controls and procedures are reasonably designed to ensure that information required to be disclosed by the Registrant on Form N-CSR is recorded, processed, summarized and reported within the required time periods and that information required to be disclosed by the Registrant in the reports that it files or submits on Form N-CSR is accumulated and communicated to the Registrant's management, including its principal executive and principal financial officers, as appropriate to allow timely decisions regarding required disclosure.
(b) There were no changes to the Registrant's internal control over financial reporting that occurred during the second fiscal quarter of the period covered by this report that have materially affected, or are reasonably likely to materially affect, the Registrant's internal control over financial reporting.
Item 12. Exhibits.
| (a)(1) | Code of ethics referred to in Item 2. | |
| (a)(2) | Certifications of principal executive and principal financial officers as required by Rule 30a-2(a) | |
| under the Investment Company Act of 1940. | ||
| (a)(3) | Not applicable. | |
| (b) | Certification of principal executive and principal financial officers as required by Rule 30a-2(b) | |
| under the Investment Company Act of 1940. | ||
| SIGNATURES |
Pursuant to the requirements of the Securities Exchange Act of 1934 and the Investment Company Act of 1940, the Registrant has duly caused this Report to be signed on its behalf by the undersigned, thereunto duly authorized.
Dreyfus Premier International Funds, Inc.
| By: | /s/ J. David Officer | |||
| J. David Officer | ||||
| President | ||||
| Date: | December 18, 2007 | |||
| Pursuant to the requirements of the Securities Exchange Act of 1934 and the Investment Company Act of | ||||
| 1940, this Report has been signed below by the following persons on behalf of the Registrant and in the | ||||
| capacities and on the dates indicated. | ||||
| By: | /s/ J. David Officer | |||
| J. David Officer | ||||
| President | ||||
| Date: | December 18, 2007 | |||
| By: | /s/ James Windels | |||
| James Windels | ||||
| Treasurer | ||||
| Date: | December 18, 2007 | |||
| EXHIBIT INDEX | ||||
| (a)(1) | Code of ethics referred to in Item 2. | |||
| (a)(2) | Certifications of principal executive and principal financial officers as required by Rule 30a- | |||
| 2(a) under the Investment Company Act of 1940. (EX-99.CERT) | ||||
| (b) | Certification of principal executive and principal financial officers as required by Rule 30a- | |||
| 2(b) under the Investment Company Act of 1940. (EX-99.906CERT) | ||||
Exhibit (a)(1)