UNITED STATES
SECURITIES AND EXCHANGE COMMISSION
Washington, D.C. 20549
FORM N-CSR
CERTIFIED SHAREHOLDER REPORT OF REGISTERED MANAGEMENT
INVESTMENT COMPANIES
Investment Company Act file number | 811- 6490 | |||||
|
| |||||
| Dreyfus Premier Investment Funds, Inc. |
| ||||
| (Exact name of Registrant as specified in charter) |
| ||||
|
|
| ||||
|
c/o The Dreyfus Corporation 200 Park Avenue New York, New York 10166 |
| ||||
| (Address of principal executive offices) (Zip code) |
| ||||
|
|
| ||||
| John Pak, Esq. 200 Park Avenue New York, New York 10166 |
| ||||
| (Name and address of agent for service) |
| ||||
| ||||||
Registrant's telephone number, including area code: | (212) 922-6000 | |||||
|
| |||||
Date of fiscal year end:
| 12/31 |
| ||||
Date of reporting period: | 12/31/14 |
| ||||
The following N-CSR relates only to the Registrant's series listed below and does not affect the other series of the Registrant, which has a different fiscal year end and, therefore, different N-CSR reporting requirements. A separate N-CSR Form will be filed for this series, as appropriate.
DREYFUS PREMIER INVESTMENT FUNDS, INC.
- Dreyfus Large Cap Equity Fund
- Dreyfus Large Cap Growth Fund
| Dreyfus |
| Large Cap Equity Fund |
ANNUAL REPORT December 31, 2014
Save time. Save paper. View your next shareholder report online as soon as it’s available. Log into www.dreyfus.com and sign up for Dreyfus eCommunications. It’s simple and only takes a few minutes.
The views expressed in this report reflect those of the portfolio manager only through the end of the period covered and do not necessarily represent the views of Dreyfus or any other person in the Dreyfus organization. Any such views are subject to change at any time based upon market or other conditions and Dreyfus disclaims any responsibility to update such views.These views may not be relied on as investment advice and, because investment decisions for a Dreyfus fund are based on numerous factors, may not be relied on as an indication of trading intent on behalf of any Dreyfus fund.
| Not FDIC-Insured • Not Bank-Guaranteed • May Lose Value |
Contents | |
THE FUND | |
| 2 | A Letter from the President |
| 3 | Discussion of Fund Performance |
| 6 | Fund Performance |
| 8 | Understanding Your Fund’s Expenses |
| 8 | Comparing Your Fund’s Expenses With Those of Other Funds |
| 9 | Statement of Investments |
| 14 | Statement of Assets and Liabilities |
| 15 | Statement of Operations |
| 16 | Statement of Changes in Net Assets |
| 18 | Financial Highlights |
| 21 | Notes to Financial Statements |
| 31 | Report of Independent Registered Public Accounting Firm |
| 32 | Important Tax Information |
| 33 | Board Members Information |
| 35 | Officers of the Fund |
FOR MORE INFORMATION | |
Back Cover |
Dreyfus
Large Cap Equity Fund
The Fund
A LETTER FROM THE PRESIDENT
Dear Shareholder:
We are pleased to present this annual report for Dreyfus Large Cap Equity Fund, covering the 12-month period from January 1, 2014, through December 31, 2014. For information about how the fund performed during the reporting period, as well as general market perspectives, we provide a Discussion of Fund Performance on the pages that follow.
While U.S. equities’ 2014 gains fell short of their impressive 2013 performance, some broad measures of stock market performance posted their sixth consecutive year of positive results. Investor sentiment remained strong in an environment of sustained economic growth, rising corporate profits, muted inflation, and historically low interest rates. It also is noteworthy that stocks advanced despite persistent headwinds stemming from a sluggish global economy, which was characterized by economic weakness in Europe, Japan and China; intensifying geopolitical conflicts; and plummeting commodity prices.
Many economists appear to be optimistic about the prospects for 2015. Our own analysts agree and, in light of the ongoing benefits of low interest rates and depressed energy prices, see the potential for a somewhat faster pace of global growth in 2015 than in 2014. U.S. economic growth also seems poised to accelerate, largely due to the fading of drags from tight fiscal policies adopted in the wake of the Great Recession. Of course, a number of risks to U.S. and global economic growth remain, and changing conditions in 2015 are likely to benefit some industry groups more than others. That’s why we urge you to talk regularly with your financial advisor about the potential impact of macroeconomic developments on your investments.
Thank you for your continued confidence and support.

J. Charles Cardona
President
The Dreyfus Corporation
January 15, 2015
2
DISCUSSION OF FUND PERFORMANCE
For the period of January 1, 2014, through December 31, 2014, as provided by Irene D. O’Neill, Portfolio Manager
Fund and Market Performance Overview
For the 12-month period ended December 31, 2014, Dreyfus Large Cap Equity Fund’s Class A shares achieved a total return of 9.58%, Class C shares returned 8.74%, and Class I shares returned 9.95%.1 In comparison, the fund’s benchmark, the Standard & Poor’s 500® Composite Stock Price Index (“S&P 500 Index”), produced a total return of 13.66% for the same period.2
U.S. equities advanced during the reporting period when a domestic economic recovery gained momentum, but gains mostly were concentrated among very large companies with defensive characteristics. The fund lagged its benchmark, mainly due to its focus on companies with strong earnings growth.
The Fund’s Investment Approach
The fund seeks to provide long-term capital appreciation.To pursue its goal, the fund normally invests at least 80% of its assets in equity securities of large-capitalization companies with market capitalizations of $5 billion or more at the time of purchase.
The fund invests primarily in large, established companies that we believe have proven track records and the potential for superior relative earnings growth. The investment process begins with a top-down assessment of broad economic, political, and social trends and their implications for different market and industry sectors. Using a bottom-up approach, fundamental research is used to identify companies with characteristics such as: earnings power unrecognized by the market, sustainable revenue and cash flow growth, positive operational and/or financial catalysts, attractive relative value versus history and peers, and strong or improving financial condition.
Stocks Climbed Despite Global Headwinds
U.S. stocks began 2014 in the midst of a rally fueled by falling unemployment and intensifying manufacturing activity, but they gave up some of their gains in January when concerns arose regarding economic and political instability in the emerging markets. Equities began to rebound in February, and the S&P 500 Index climbed to
The Fund 3
DISCUSSION OF FUND PERFORMANCE (continued)
new highs through June as it became clear that the economic recovery was gaining traction. Investors also responded positively to low inflation and expectations that short-term interest rates would stay low.
The market encountered renewed volatility in July and September when concerns resurfaced that a faltering global economy might derail the U.S. expansion. Stocks soon rebounded when U.S. economic data stayed strong, but ongoing turmoil in overseas markets and plummeting commodity prices caused investors to turn toward very large, traditionally defensive stocks with high dividend yields. In contrast, companies with high levels of earnings growth generally fell out of favor.
Focus on Growth Dampened Relative Results
Although the fund participated substantially in the overall market’s advance in 2014, its results compared to the benchmark were undermined by its positioning in the financials sector, where a lack of dividend-paying real estate investment trusts (“REITs”) weighed on relative results. In addition, mortgage servicer Ocwen Financial lost value when a proposed acquisition was blocked by state regulators, prompting us to eliminate the fund’s position before the stock suffered further declines.After a strong 2013, Intercontinental Exchange lagged when earnings were dampened by a relatively low volume, low volatility trading environment in 2014.
In the consumer discretionary sector, casino operator Las Vegas Sands saw reduced traffic in its Macau facilities, internet retailer Amazon.com proved unable to boost profit margins when management maintained a high level of investment spending, and apparel producer PVH had difficulty integrating a recent acquisition and was exposed to weak European markets. Plummeting oil prices hurt holdings in the energy sector, including Devon Energy, Southwestern Energy, Halliburton, and
Nabors Industries.
On a more positive note, the health care sector ranked as the fund’s top performing industry group in 2014. Drug developer Shire climbed after receiving an acquisition offer, and the fund benefited by selling its position before the deal was canceled amid political pressures. Multi-specialty health care company Allergan also gained value after a takeover bid, while its ultimate acquirer, Actavis, was rewarded for several accretive
4
transactions. Hospitals operator HCA Holdings benefited from higher utilization rates and less bad debt after full implementation of the Affordable Care Act. In the information technology sector, semiconductor manufacturers Avago Technologies and Micron Technology fared well when pricing pressures waned in a consolidating industry. Other technology companies—including Facebook, ServiceNow, and Electronic Arts—benefited from the growth of cloud and mobile computing.
Finding Secular Growth Opportunities
We currently expect U.S. economic growth to continue even as headwinds persist in international markets. Lower oil prices are likely to benefit consumers but may weigh on the financial results of certain companies. In this mixed environment, we intend to focus on companies poised to benefit from secular growth trends such as cloud computing, and those engaged in “self-help” activities such as restructurings. We have identified a number of opportunities meeting our criteria in the information technology and health care sectors, but relatively few among utilities and telecommunications services companies.
January 15, 2015
Please note, the position in any security highlighted with italicized typeface was sold during the reporting period. Equity funds are subject generally to market, market sector, market liquidity, issuer, and investment style risks, among other factors, to varying degrees, all of which are more fully described in the fund’s prospectus.
| 1 | Total return includes reinvestment of dividends and any capital gains paid, and does not take into consideration the |
| maximum initial sales charge in the case of Class A shares, or the applicable contingent deferred sales charge imposed | |
| on the redemption of Class C shares. Had these charges been reflected, returns would have been lower. Past performance | |
| is no guarantee of future results. Share price and investment return fluctuate such that upon redemption fund shares | |
| may be worth more or less than their original cost. Return figures provided reflect the absorption of certain fund | |
| expenses by The Dreyfus Corporation pursuant to an agreement through May 1, 2015, at which time it may be | |
| extended, terminated, or modified. Had these expenses not been absorbed, the fund’s returns would have been lower. | |
| 2 | SOURCE: LIPPER INC. — Reflects reinvestment of dividends and, where applicable, capital gain distributions. |
| The Standard & Poor’s 500® Composite Stock Price Index is a widely accepted, unmanaged index of U.S. stock | |
| market performance. Investors cannot invest directly in any index. |
The Fund 5
FUND PERFORMANCE

| † | Source: Lipper Inc. |
| †† | The total return figures presented for Class C shares of the fund reflect the performance of the fund’s Class A shares |
| for the period prior to 9/13/08 (the inception date for Class C shares), not reflecting the applicable sales charges for | |
| Class A shares. |
Past performance is not predictive of future performance.
The above graph compares a $10,000 investment made in each of the Class A, Class C and Class I shares of Dreyfus Large Cap Equity Fund on 12/31/04 to a $10,000 investment made in the Standard & Poor’s 500 Composite Stock Price Index (the “Index”) on that date. All dividends and capital gain distributions are reinvested.
The fund’s performance shown in the line graph above takes into account the maximum initial sales charge on Class A shares and all other applicable fees and expenses on all classes.The Index is a widely accepted, unmanaged index of U.S. stock market performance. Unlike a mutual fund, the Index is not subject to charges, fees and other expenses. Investors cannot invest directly in any index. Further information relating to fund performance, including expense reimbursements, if applicable, is contained in the Financial Highlights section of the prospectus and elsewhere in this report.
6
| Average Annual Total Returns as of 12/31/14 | |||||||
| Inception | |||||||
| Date | 1 Year | 5 Years | 10 Years | ||||
| Class A shares | |||||||
| with maximum sales charge (5.75%) | 8/10/92 | 3.27 | % | 11.86 | % | 4.85 | % |
| without sales charge | 8/10/92 | 9.58 | % | 13.20 | % | 5.48 | % |
| Class C shares | |||||||
| with applicable redemption charge † | 9/13/08 | 7.74 | % | 12.41 | % | 5.39 | %†† |
| without redemption | 9/13/08 | 8.74 | % | 12.41 | % | 5.39 | %†† |
| Class I shares | 8/10/92 | 9.95 | % | 13.71 | % | 6.23 | % |
| Standard & Poor’s 500 | |||||||
| Composite Stock Price Index | 13.66 | % | 15.44 | % | 7.67 | % | |
Past performance is not predictive of future performance.The fund’s performance shown in the graph and table does not reflect the deduction of taxes that a shareholder would pay on fund distributions or the redemption of fund shares. In addition to the performance of Class A shares shown with and without a maximum sales charge, the fund’s performance shown in the table takes into account all other applicable fees and expenses on all classes.
| † | The maximum contingent deferred sales charge for Class C shares is 1% for shares redeemed within one year of the |
| date of purchase. | |
| †† | The total return performance figures presented for Class C shares of the fund reflect the performance of the fund’s |
| Class A shares for the period prior to 9/13/08 (the inception date for Class C shares), not reflecting the applicable | |
| sales charges for Class A shares. |
The Fund 7
UNDERSTANDING YOUR FUND’S EXPENSES (Unaudited)
As a mutual fund investor, you pay ongoing expenses, such as management fees and other expenses. Using the information below, you can estimate how these expenses affect your investment and compare them with the expenses of other funds.You also may pay one-time transaction expenses, including sales charges (loads) and redemption fees, which are not shown in this section and would have resulted in higher total expenses. For more information, see your fund’s prospectus or talk to your financial adviser.
Review your fund’s expenses
The table below shows the expenses you would have paid on a $1,000 investment in Dreyfus Large Cap Equity Fund from July 1, 2014 to December 31, 2014. It also shows how much a $1,000 investment would be worth at the close of the period, assuming actual returns and expenses.
Expenses and Value of a $1,000 Investment
assuming actual returns for the six months ended December 31, 2014
| Class A | Class C | Class I | ||||
| Expenses paid per $1,000† | $5.51 | $ 9.62 | $ 3.83 | |||
| Ending value (after expenses) | $1,022.60 | $ 1,018.40 | $1,024.40 |
COMPARING YOUR FUND’S EXPENSES
WITH THOSE OF OTHER FUNDS (Unaudited)
Using the SEC’s method to compare expenses
The Securities and Exchange Commission (SEC) has established guidelines to help investors assess fund expenses. Per these guidelines, the table below shows your fund’s expenses based on a $1,000 investment, assuming a hypothetical 5% annualized return. You can use this information to compare the ongoing expenses (but not transaction expenses or total cost) of investing in the fund with those of other funds. All mutual fund shareholder reports will provide this information to help you make this comparison. Please note that you cannot use this information to estimate your actual ending account balance and expenses paid during the period.
Expenses and Value of a $1,000 Investment
assuming a hypothetical 5% annualized return for the six months ended December 31, 2014
| Class A | Class C | Class I | ||||
| Expenses paid per $1,000† | $ 5.50 | $ 9.60 | $ 3.82 | |||
| Ending value (after expenses) | $ 1,019.76 | $ 1,015.68 | $ 1,021.42 |
| † Expenses are equal to the fund’s annualized expense ratio of 1.08% for Class A, 1.89% for Class C and .75% |
| for Class I, multiplied by the average account value over the period, multiplied by 184/365 (to reflect the one-half |
| year period). |
8
| STATEMENT OF INVESTMENTS |
| December 31, 2014 |
| Common Stocks—98.1% | Shares | Value ($) |
| Automobiles & Components—2.0% | ||
| Harley-Davidson | 68,130 | 4,490,448 |
| Johnson Controls | 96,530 | 4,666,260 |
| 9,156,708 | ||
| Banks—4.7% | ||
| JPMorgan Chase & Co. | 131,220 | 8,211,748 |
| PNC Financial Services Group | 57,740 | 5,267,620 |
| Wells Fargo & Co. | 142,930 | 7,835,423 |
| 21,314,791 | ||
| Capital Goods—9.1% | ||
| Caterpillar | 44,960 | 4,115,189 |
| Dover | 72,860 | 5,225,519 |
| Eaton | 83,240 | 5,656,990 |
| Honeywell International | 69,300 | 6,924,456 |
| Illinois Tool Works | 59,730 | 5,656,431 |
| Ingersoll-Rand | 112,500 | 7,131,375 |
| United Technologies | 54,145 | 6,226,675 |
| 40,936,635 | ||
| Consumer Durables & Apparel—1.0% | ||
| PVH | 36,750 | 4,710,248 |
| Consumer Services—2.5% | ||
| Cheesecake Factory | 44,850 | 2,256,403 |
| Las Vegas Sands | 63,570 | 3,697,231 |
| Yum! Brands | 74,280 | 5,411,298 |
| 11,364,932 | ||
| Diversified Financials—7.1% | ||
| Capital One Financial | 87,720 | 7,241,286 |
| Intercontinental Exchange | 38,670 | 8,479,944 |
| Invesco | 202,476 | 8,001,852 |
| State Street | 106,370 | 8,350,045 |
| 32,073,127 | ||
| Energy—8.4% | ||
| Chevron | 45,730 | 5,129,991 |
| Exxon Mobil | 63,080 | 5,831,746 |
The Fund 9
STATEMENT OF INVESTMENTS (continued)
| Common Stocks (continued) | Shares | Value ($) | |
| Energy (continued) | |||
| Halliburton | 142,570 | 5,607,278 | |
| Marathon Oil | 151,450 | 4,284,520 | |
| Phillips 66 | 50,050 | 3,588,585 | |
| Schlumberger | 59,170 | 5,053,710 | |
| Southwestern Energy | 131,130 | a | 3,578,538 |
| Valero Energy | 101,390 | 5,018,805 | |
| 38,093,173 | |||
| Food & Staples Retailing—1.2% | |||
| Costco Wholesale | 39,460 | 5,593,455 | |
| Food, Beverage & Tobacco—7.0% | |||
| Anheuser-Busch InBev, ADR | 39,410 | 4,426,531 | |
| Hershey | 39,400 | 4,094,842 | |
| Mead Johnson Nutrition | 47,663 | 4,792,038 | |
| Monster Beverage | 59,790 | a | 6,478,247 |
| PepsiCo | 83,070 | 7,855,099 | |
| Philip Morris International | 46,060 | 3,751,587 | |
| 31,398,344 | |||
| Health Care Equipment & Services—3.4% | |||
| Abbott Laboratories | 124,600 | 5,609,492 | |
| Cardinal Health | 64,540 | 5,210,314 | |
| HCA Holdings | 63,150 | a | 4,634,578 |
| 15,454,384 | |||
| Household & Personal Products—.8% | |||
| Procter & Gamble | 39,415 | 3,590,312 | |
| Insurance—3.7% | |||
| Aflac | 90,060 | 5,501,765 | |
| FNF Group | 158,600 | 5,463,770 | |
| Hartford Financial Services Group | 135,940 | 5,667,339 | |
| 16,632,874 | |||
| Materials—3.0% | |||
| Celanese, Ser. A | 75,970 | 4,555,161 |
10
| Common Stocks (continued) | Shares | Value ($) | |
| Materials (continued) | |||
| Dow Chemical | 104,980 | 4,788,138 | |
| Nucor | 80,950 | 3,970,598 | |
| 13,313,897 | |||
| Media—3.8% | |||
| Comcast, Cl. A | 119,140 | 6,911,311 | |
| Time Warner | 82,250 | 7,025,795 | |
| Walt Disney | 35,890 | 3,380,479 | |
| 17,317,585 | |||
| Pharmaceuticals, Biotech & Life Sciences—12.4% | |||
| AbbVie | 116,690 | 7,636,194 | |
| Actavis | 20,310 | a | 5,227,997 |
| Alexion Pharmaceuticals | 12,200 | a | 2,257,366 |
| Amgen | 19,285 | 3,071,908 | |
| Biogen Idec | 10,700 | a | 3,632,115 |
| Bristol-Myers Squibb | 63,570 | 3,752,537 | |
| Celgene | 44,793 | a | 5,010,545 |
| Gilead Sciences | 55,203 | a | 5,203,435 |
| Mallinckrodt | 54,065 | a | 5,354,057 |
| Merck & Co. | 101,820 | 5,782,358 | |
| Pfizer | 148,650 | 4,630,448 | |
| Thermo Fisher Scientific | 33,960 | 4,254,848 | |
| 55,813,808 | |||
| Real Estate—.9% | |||
| Outfront Media | 151,297 | 4,060,820 | |
| Retailing—2.7% | |||
| Amazon.com | 18,819 | a | 5,840,477 |
| Lowe’s | 89,210 | 6,137,648 | |
| 11,978,125 | |||
| Semiconductors & Semiconductor Equipment—4.7% | |||
| Avago Technologies | 76,390 | 7,684,070 | |
| Intel | 225,890 | 8,197,548 |
The Fund 11
STATEMENT OF INVESTMENTS (continued)
| Common Stocks (continued) | Shares | Value ($) | |
| Semiconductors & Semiconductor | |||
| Equipment (continued) | |||
| Lam Research | 66,330 | 5,262,622 | |
| 21,144,240 | |||
| Software & Services—10.6% | |||
| Accenture, Cl. A | 63,450 | 5,666,719 | |
| Adobe Systems | 63,570 | a | 4,621,539 |
| Electronic Arts | 130,000 | a | 6,111,950 |
| Facebook, Cl. A | 92,560 | a | 7,221,531 |
| Google, Cl. A | 9,051 | a | 4,803,004 |
| Google, Cl. C | 4,218 | a | 2,220,355 |
| salesforce.com | 107,630 | a | 6,383,535 |
| ServiceNow | 110,830 | a | 7,519,816 |
| 88,820 | a | 3,185,973 | |
| 47,734,422 | |||
| Technology Hardware & Equipment—5.5% | |||
| Apple | 163,950 | 18,096,801 | |
| TE Connectivity | 104,920 | 6,636,190 | |
| 24,732,991 | |||
| Telecommunication Services—.7% | |||
| AT&T | 37,820 | b | 1,270,374 |
| Verizon Communications | 38,460 | 1,799,159 | |
| 3,069,533 | |||
| Transportation—1.1% | |||
| Union Pacific | 43,184 | 5,144,510 | |
| Utilities—1.8% | |||
| CenterPoint Energy | 207,990 | 4,873,206 | |
| Sempra Energy | 30,863 | 3,436,904 | |
| 8,310,110 | |||
| Total Common Stocks | |||
| (cost $365,567,717) | 442,939,024 |
12
| Other Investment—1.0% | Shares | Value ($) | |
| Registered Investment Company; | |||
| Dreyfus Institutional Preferred | |||
| Plus Money Market Fund | |||
| (cost $4,248,044) | 4,248,044 | c | 4,248,044 |
| Total Investments (cost $369,815,761) | 99.1 | % | 447,187,068 |
| Cash and Receivables (Net) | .9 | % | 4,175,447 |
| Net Assets | 100.0 | % | 451,362,515 |
ADR—American Depository Receipts
| a Non-income producing security. |
| b Security, or portion thereof, on loan.At December 31, 2014, the value of the fund’s securities on loan was |
| $1,257,643 and the value of the collateral held by the fund was $1,301,546, consisting of U.S. Government and |
| Agency securities. |
| c Investment in affiliated money market mutual fund. |
| Portfolio Summary (Unaudited)† | |||
| Value (%) | Value (%) | ||
| Pharmaceuticals, Biotech & | Materials | 3.0 | |
| Life Sciences | 12.4 | Retailing | 2.7 |
| Software & Services | 10.6 | Consumer Services | 2.5 |
| Capital Goods | 9.1 | Automobiles & Components | 2.0 |
| Energy | 8.4 | Utilities | 1.8 |
| Diversified Financials | 7.1 | Food & Staples Retailing | 1.2 |
| Food, Beverage & Tobacco | 7.0 | Transportation | 1.1 |
| Technology Hardware & Equipment | 5.5 | Consumer Durables & Apparel | 1.0 |
| Banks | 4.7 | Money Market Investment | 1.0 |
| Semiconductors & Semiconductor | Real Estate | .9 | |
| Equipment | 4.7 | Household & Personal Products | .8 |
| Media | 3.8 | Telecommunication Services | .7 |
| Insurance | 3.7 | ||
| Health Care Equipment & Services | 3.4 | 99.1 | |
| † Based on net assets. | |||
| See notes to financial statements. | |||
The Fund 13
| STATEMENT OF ASSETS AND LIABILITIES |
| December 31, 2014 |
| Cost | Value | |||
| Assets ($): | ||||
| Investments in securities—See Statement of Investments | ||||
| (including securities on loan, valued at $1,257,643)—Note 1(b): | ||||
| Unaffiliated issuers | 365,567,717 | 442,939,024 | ||
| Affiliated issuers | 4,248,044 | 4,248,044 | ||
| Cash | 1,946,334 | |||
| Receivable for investment securities sold | 1,157,820 | |||
| Receivable for shares of Common Stock subscribed | 1,086,128 | |||
| Dividends and securities lending income receivable | 536,187 | |||
| Prepaid expenses | 22,779 | |||
| 451,936,316 | ||||
| Liabilities ($): | ||||
| Due to The Dreyfus Corporation and affiliates—Note 3(c) | 290,303 | |||
| Payable for shares of Common Stock redeemed | 219,932 | |||
| Accrued expenses | 63,566 | |||
| 573,801 | ||||
| Net Assets ($) | 451,362,515 | |||
| Composition of Net Assets ($): | ||||
| Paid-in capital | 374,879,496 | |||
| Accumulated undistributed investment income—net | 152,381 | |||
| Accumulated net realized gain (loss) on investments | (1,040,669 | ) | ||
| Accumulated net unrealized appreciation | ||||
| (depreciation) on investments | 77,371,307 | |||
| Net Assets ($) | 451,362,515 | |||
| Net Asset Value Per Share | ||||
| Class A | Class C | Class I | ||
| Net Assets ($) | 2,262,131 | 515,104 | 448,585,280 | |
| Shares Outstanding | 140,364 | 31,507 | 26,518,077 | |
| Net Asset Value Per Share ($) | 16.12 | 16.35 | 16.92 | |
| See notes to financial statements. | ||||
14
| STATEMENT OF OPERATIONS |
| Year Ended December 31, 2014 |
| Investment Income ($): | ||
| Income: | ||
| Cash dividends (net of $37,329 foreign taxes withheld at source): | ||
| Unaffiliated issuers | 7,708,128 | |
| Affiliated issuers | 3,081 | |
| Income from securities lending—Note 1(b) | 6,148 | |
| Total Income | 7,717,357 | |
| Expenses: | ||
| Management fee—Note 3(a) | 2,986,060 | |
| Professional fees | 68,999 | |
| Custodian fees—Note 3(c) | 60,029 | |
| Registration fees | 44,031 | |
| Directors’ fees and expenses—Note 3(d) | 33,899 | |
| Shareholder servicing costs—Note 3(c) | 29,348 | |
| Prospectus and shareholders’ reports | 12,569 | |
| Loan commitment fees—Note 2 | 4,217 | |
| Distribution fees—Note 3(b) | 2,164 | |
| Miscellaneous | 23,139 | |
| Total Expenses | 3,264,455 | |
| Less—reduction in expenses due to undertaking—Note 3(a) | (788 | ) |
| Less—reduction in fees due to earnings credits—Note 3(c) | (42 | ) |
| Net Expenses | 3,263,625 | |
| Investment Income—Net | 4,453,732 | |
| Realized and Unrealized Gain (Loss) on Investments—Note 4 ($): | ||
| Net realized gain (loss) on investments | 27,911,836 | |
| Net unrealized appreciation (depreciation) on investments | 8,936,179 | |
| Net Realized and Unrealized Gain (Loss) on Investments | 36,848,015 | |
| Net Increase in Net Assets Resulting from Operations | 41,301,747 | |
| See notes to financial statements. | ||
The Fund 15
STATEMENT OF CHANGES IN NET ASSETS
| Year Ended December 31, | ||||
| 2014 | 2013 | |||
| Operations ($): | ||||
| Investment income—net | 4,453,732 | 2,894,535 | ||
| Net realized gain (loss) on investments | 27,911,836 | 34,399,554 | ||
| Net unrealized appreciation | ||||
| (depreciation) on investments | 8,936,179 | 39,436,409 | ||
| Net Increase (Decrease) in Net Assets | ||||
| Resulting from Operations | 41,301,747 | 76,730,498 | ||
| Dividends to Shareholders from ($): | ||||
| Investment income—net: | ||||
| Class A | (24,796 | ) | (5,771 | ) |
| Class C | (498 | ) | (1,642 | ) |
| Class I | (7,168,756 | ) | (2,796,096 | ) |
| Net realized gain on investments: | ||||
| Class A | (24,211 | ) | — | |
| Class C | (4,070 | ) | — | |
| Class I | (4,686,583 | ) | — | |
| Total Dividends | (11,908,914 | ) | (2,803,509 | ) |
| Capital Stock Transactions ($): | ||||
| Net proceeds from shares sold: | ||||
| Class A | 816,883 | 995,589 | ||
| Class C | 411,680 | 247,217 | ||
| Class I | 100,862,171 | 172,180,663 | ||
| Dividends reinvested: | ||||
| Class A | 43,492 | 4,986 | ||
| Class C | 3,609 | 1,435 | ||
| Class I | 4,318,878 | 690,049 | ||
| Cost of shares redeemed: | ||||
| Class A | (227,396 | ) | (436,057 | ) |
| Class C | (206,201 | ) | (210,386 | ) |
| Class I | (68,494,309 | ) | (90,449,110 | ) |
| Increase (Decrease) in Net Assets | ||||
| from Capital Stock Transactions | 37,528,807 | 83,024,386 | ||
| Total Increase (Decrease) in Net Assets | 66,921,640 | 156,951,375 | ||
| Net Assets ($): | ||||
| Beginning of Period | 384,440,875 | 227,489,500 | ||
| End of Period | 451,362,515 | 384,440,875 | ||
| Undistributed investment income—net | 152,381 | 2,893,970 | ||
16
| Year Ended December 31, | ||||
| 2014 | 2013 | |||
| Capital Share Transactions: | ||||
| Class Aa | ||||
| Shares sold | 52,648 | 76,054 | ||
| Shares issued for dividends reinvested | 2,711 | 405 | ||
| Shares redeemed | (14,702 | ) | (34,432 | ) |
| Net Increase (Decrease) in Shares Outstanding | 40,657 | 42,027 | ||
| Class Ca | ||||
| Shares sold | 25,583 | 18,013 | ||
| Shares issued for dividends reinvested | 218 | 114 | ||
| Shares redeemed | (13,178 | ) | (15,228 | ) |
| Net Increase (Decrease) in Shares Outstanding | 12,623 | 2,899 | ||
| Class I | ||||
| Shares sold | 6,230,125 | 12,126,494 | ||
| Shares issued for dividends reinvested | 255,443 | 53,492 | ||
| Shares redeemed | (4,174,651 | ) | (6,936,847 | ) |
| Net Increase (Decrease) in Shares Outstanding | 2,310,917 | 5,243,139 | ||
| a During the period ended December 31, 2013, 3,922 Class C shares representing $52,365 were exchanged for |
| 3,985 Class A shares. |
See notes to financial statements.
The Fund 17
FINANCIAL HIGHLIGHTS
The following tables describe the performance for each share class for the fiscal periods indicated. All information (except portfolio turnover rate) reflects financial results for a single fund share.Total return shows how much your investment in the fund would have increased (or decreased) during each period, assuming you had reinvested all dividends and distributions.These figures have been derived from the fund’s financial statements.
| Year Ended December 31, | ||||||||||
| Class A Shares | 2014 | 2013 | 2012 | 2011 | 2010 | |||||
| Per Share Data ($): | ||||||||||
| Net asset value, beginning of period | 15.06 | 11.38 | 9.79 | 10.45 | 9.14 | |||||
| Investment Operations: | ||||||||||
| Investment income—neta | .11 | .11 | .11 | .06 | .03 | |||||
| Net realized and unrealized gain | ||||||||||
| (loss) on investments | 1.33 | 3.69 | 1.54 | (.66 | ) | 1.35 | ||||
| Total from Investment Operations | 1.44 | 3.80 | 1.65 | (.60 | ) | 1.38 | ||||
| Distributions: | ||||||||||
| Dividends from investment income—net | (.20 | ) | (.12 | ) | (.06 | ) | (.06 | ) | (.08 | ) |
| Dividends from net realized | ||||||||||
| gain on investments | (.18 | ) | — | — | — | — | ||||
| Total Distributions | (.38 | ) | (.12 | ) | (.06 | ) | (.06 | ) | (.08 | ) |
| Settlement payment from | ||||||||||
| unaffiliated third party | — | — | — | — | .01 | |||||
| Net asset value, end of period | 16.12 | 15.06 | 11.38 | 9.79 | 10.45 | |||||
| Total Return (%)b | 9.58 | 33.64 | 16.90 | (5.78 | ) | 15.23 | c | |||
| Ratios/Supplemental Data (%): | ||||||||||
| Ratio of total expenses | ||||||||||
| to average net assets | 1.13 | 1.19 | 1.30 | 1.34 | 2.04 | |||||
| Ratio of net expenses | ||||||||||
| to average net assets | 1.11 | 1.13 | 1.25 | 1.17 | 1.50 | |||||
| Ratio of net investment income | ||||||||||
| to average net assets | .72 | .81 | .96 | .56 | .30 | |||||
| Portfolio Turnover Rate | 57.11 | 66.65 | 34.07 | 47.87 | 43.92 | |||||
| Net Assets, end of period ($ x 1,000) | 2,262 | 1,501 | 657 | 503 | 374 | |||||
| a Based on average shares outstanding. |
| b Exclusive of sales charge. |
| c If settlement payment from an unaffiliated third party was not made, total return would have been 15.12%. |
See notes to financial statements.
18
| Year Ended December 31, | |||||||||
| Class C Shares | 2014 | 2013 | 2012 | 2011 | 2010 | ||||
| Per Share Data ($): | |||||||||
| Net asset value, beginning of period | 15.22 | 11.57 | 9.97 | 10.68 | 9.40 | ||||
| Investment Operations: | |||||||||
| Investment income (loss)—neta | (.00 | )b | .01 | .03 | (.03 | ) | (.02 | ) | |
| Net realized and unrealized | |||||||||
| gain (loss) on investments | 1.33 | 3.74 | 1.57 | (.66 | ) | 1.39 | |||
| Total from Investment Operations | 1.33 | 3.75 | 1.60 | (.69 | ) | 1.37 | |||
| Distributions: | |||||||||
| Dividends from investment income—net | (.02 | ) | (.10 | ) | — | (.02 | ) | (.09 | ) |
| Dividends from net realized | |||||||||
| gain on investments | (.18 | ) | — | — | — | — | |||
| Total Distributions | (.20 | ) | (.10 | ) | — | (.02 | ) | (.09 | ) |
| Settlement payment from | |||||||||
| unaffiliated third party | — | — | — | — | .00 | b | |||
| Net asset value, end of period | 16.35 | 15.22 | 11.57 | 9.97 | 10.68 | ||||
| Total Return (%)c | 8.74 | 32.57 | 16.05 | (6.47 | ) | 14.69 | d | ||
| Ratios/Supplemental Data (%): | |||||||||
| Ratio of total expenses | |||||||||
| to average net assets | 2.05 | 2.03 | 2.21 | 2.04 | 2.02 | ||||
| Ratio of net expenses | |||||||||
| to average net assets | 1.89 | 1.90 | 2.02 | 2.00 | 1.98 | ||||
| Ratio of net investment income | |||||||||
| (loss) to average net assets | (.00 | )e | .07 | .31 | (.24 | ) | (.18 | ) | |
| Portfolio Turnover Rate | 57.11 | 66.65 | 34.07 | 47.87 | 43.92 | ||||
| Net Assets, end of period ($ x 1,000) | 515 | 287 | 185 | 94 | 55 | ||||
| a Based on average shares outstanding. |
| b Amount represents less than $.01 per share. |
| c Exclusive of sales charge. |
| d The impact of the settlement payment from an unaffiliated third party on total return amounted to less than .01%. |
| e Amount represents less than .01%. |
See notes to financial statements.
The Fund 19
FINANCIAL HIGHLIGHTS (continued)
| Year Ended December 31, | ||||||||||
| Class I Shares | 2014 | 2013 | 2012 | 2011 | 2010 | |||||
| Per Share Data ($): | ||||||||||
| Net asset value, beginning of period | 15.81 | 11.95 | 10.26 | 10.95 | 9.55 | |||||
| Investment Operations: | ||||||||||
| Investment income—neta | .17 | .16 | .16 | .10 | .10 | |||||
| Net realized and unrealized | ||||||||||
| gain (loss) on investments | 1.40 | 3.88 | 1.63 | (.69 | ) | 1.41 | ||||
| Total from Investment Operations | 1.57 | 4.04 | 1.79 | (.59 | ) | 1.51 | ||||
| Distributions: | ||||||||||
| Dividends from investment income—net | (.28 | ) | (.18 | ) | (.10 | ) | (.10 | ) | (.12 | ) |
| Dividends from net realized | ||||||||||
| gain on investments | (.18 | ) | — | — | — | — | ||||
| Total Distributions | (.46 | ) | (.18 | ) | (.10 | ) | (.10 | ) | (.12 | ) |
| Settlement payment from | ||||||||||
| unaffiliated third party | — | — | — | — | .01 | |||||
| Net asset value, end of period | 16.92 | 15.81 | 11.95 | 10.26 | 10.95 | |||||
| Total Return (%) | 9.95 | 34.12 | 17.46 | (5.46 | ) | 16.09 | b | |||
| Ratios/Supplemental Data (%): | ||||||||||
| Ratio of total expenses | ||||||||||
| to average net assets | .76 | .78 | .81 | .81 | .80 | |||||
| Ratio of net expenses | ||||||||||
| to average net assets | .76 | .78 | .81 | .81 | .77 | |||||
| Ratio of net investment income | ||||||||||
| to average net assets | 1.05 | 1.14 | 1.39 | .92 | 1.02 | |||||
| Portfolio Turnover Rate | 57.11 | 66.65 | 34.07 | 47.87 | 43.92 | |||||
| Net Assets, end of period ($ x 1,000) | 448,585 | 382,652 | 226,648 | 168,688 | 194,970 | |||||
| a Based on average shares outstanding. |
| b If settlement payment from an unaffiliated third party was not made, total return would have been 15.99%. |
See notes to financial statements.
20
NOTES TO FINANCIAL STATEMENTS
NOTE 1—Significant Accounting Policies:
Dreyfus Large Cap Equity Fund (the “fund”) is a separate diversified series of Dreyfus Premier Investment Funds, Inc. (the “Company”), which is registered under the Investment Company Act of 1940, as amended (the “Act”), as an open-end management investment company and operates as a series company currently offering six series, including the fund. The fund’s investment objective seeks to provide long-term capital appreciation. The Dreyfus Corporation (the “Manager” or “Dreyfus”), a wholly-owned subsidiary of The Bank of New York Mellon Corporation (“BNY Mellon”), serves as the fund’s investment adviser.
MBSC Securities Corporation (the “Distributor”), a wholly-owned subsidiary of the Manager, is the distributor of the fund’s shares. The fund is authorized to issue 250 million shares of $.001 par value Common Stock.The fund currently offers three classes of shares: Class A (100 million shares authorized), Class C (50 million shares authorized) and Class I (100 million shares authorized). Class A shares generally are subject to a sales charge imposed at the time of purchase. Class C shares are subject to a contingent deferred sales charge (“CDSC”) imposed on Class C shares redeemed within one year of purchase. Class I shares are sold at net asset value per share generally to institutional investors. Other differences between the classes include the services offered to and the expenses borne by each class, the allocation of certain transfer agency costs, and certain voting rights. Income, expenses (other than expenses attributable to a specific class), and realized and unrealized gains or losses on investments are allocated to each class of shares based on its relative net assets.
The Company accounts separately for the assets, liabilities and operations of each series. Expenses directly attributable to each series are
The Fund 21
NOTES TO FINANCIAL STATEMENTS (continued)
charged to that series’ operations; expenses which are applicable to all series are allocated among them on a pro rata basis.
The Financial Accounting Standards Board (“FASB”) Accounting Standards Codification (“ASC”) is the exclusive reference of authoritative U.S. generally accepted accounting principles (“GAAP”) recognized by the FASB to be applied by nongovernmental entities. Rules and interpretive releases of the Securities and Exchange Commission (“SEC”) under authority of federal laws are also sources of authoritative GAAP for SEC registrants. The fund’s financial statements are prepared in accordance with GAAP, which may require the use of management estimates and assumptions. Actual results could differ from those estimates.
The Company enters into contracts that contain a variety of indemnifications. The fund’s maximum exposure under these arrangements is unknown.The fund does not anticipate recognizing any loss related to these arrangements.
(a) Portfolio valuation: The fair value of a financial instrument is the amount that would be received to sell an asset or paid to transfer a liability in an orderly transaction between market participants at the measurement date (i.e., the exit price). GAAP establishes a fair value hierarchy that prioritizes the inputs of valuation techniques used to measure fair value. This hierarchy gives the highest priority to unadjusted quoted prices in active markets for identical assets or liabilities (Level 1 measurements) and the lowest priority to unobservable inputs (Level 3 measurements).
Additionally, GAAP provides guidance on determining whether the volume and activity in a market has decreased significantly and whether such a decrease in activity results in transactions that are not orderly. GAAP requires enhanced disclosures around valuation inputs and techniques used during annual and interim periods.
22
Various inputs are used in determining the value of the fund’s investments relating to fair value measurements.These inputs are summarized in the three broad levels listed below:
Level 1—unadjusted quoted prices in active markets for identical investments.
Level 2—other significant observable inputs (including quoted prices for similar investments, interest rates, prepayment speeds, credit risk, etc.).
Level 3—significant unobservable inputs (including the fund’s own assumptions in determining the fair value of investments).
The inputs or methodology used for valuing securities are not necessarily an indication of the risk associated with investing in those securities.
Changes in valuation techniques may result in transfers in or out of an assigned level within the disclosure hierarchy. Valuation techniques used to value the fund’s investments are as follows:
Investments in securities are valued at the last sales price on the securities exchange or national securities market on which such securities are primarily traded. Securities listed on the National Market System for which market quotations are available are valued at the official closing price or, if there is no official closing price that day, at the last sales price. For open short positions, asked prices are used for valuation purposes. Bid price is used when no asked price is available. Registered investment companies that are not traded on an exchange are valued at their net asset value.All of the preceding securities are generally categorized within Level 1 of the fair value hierarchy.
Securities not listed on an exchange or the national securities market, or securities for which there were no transactions, are valued at the average of the most recent bid and asked prices. These securities are generally categorized within Level 2 of the fair value hierarchy.
The Fund 23
NOTES TO FINANCIAL STATEMENTS (continued)
Fair valuing of securities may be determined with the assistance of a pricing service using calculations based on indices of domestic securities and other appropriate indicators, such as prices of relevant ADRs and financial futures. Utilizing these techniques may result in transfers between Level 1 and Level 2 of the fair value hierarchy.
When market quotations or official closing prices are not readily available, or are determined not to reflect accurately fair value, such as when the value of a security has been significantly affected by events after the close of the exchange or market on which the security is principally traded (for example, a foreign exchange or market), but before the fund calculates its net asset value, the fund may value these investments at fair value as determined in accordance with the procedures approved by the Company’s Board of Directors (the “Board”). Certain factors may be considered when fair valuing investments such as: fundamental analytical data, the nature and duration of restrictions on disposition, an evaluation of the forces that influence the market in which the securities are purchased and sold, and public trading in similar securities of the issuer or comparable issuers. These securities are either categorized within Level 2 or 3 of the fair value hierarchy depending on the relevant inputs used.
For restricted securities where observable inputs are limited, assumptions about market activity and risk are used and are generally categorized within Level 3 of the fair value hierarchy.
The following is a summary of the inputs used as of December 31, 2014 in valuing the fund’s investments:
| Level 2—Other | Level 3— | ||
| Level 1— | Significant | Significant | |
| Unadjusted | Observable | Unobservable | |
| Quoted Prices | Inputs | Inputs | Total |
| Assets ($) | |||
| Investments in Securities: | |||
| Equity Securities— | |||
| Domestic | |||
| Common Stocks† 430,828,423 | — | — | 430,828,423 |
24
| Level 2—Other | Level 3— | |||
| Level 1— | Significant | Significant | ||
| Unadjusted | Observable | Unobservable | ||
| Quoted Prices | Inputs | Inputs | Total | |
| Assets ($) (continued) | ||||
| Investments in | ||||
| Securities (continued): | ||||
| Equity Securities— | ||||
| Foreign | ||||
| Common Stocks† | 12,110,601 | — | — | 12,110,601 |
| Mutual Funds | 4,248,044 | — | — | 4,248,044 |
| † See Statement of Investments for additional detailed categorizations. | ||||
At December 31, 2014, there were no transfers between Level 1 and Level 2 of the fair value hierarchy.
(b) Securities transactions and investment income: Securities transactions are recorded on a trade date basis. Realized gains and losses from securities transactions are recorded on the identified cost basis. Dividend income is recognized on the ex-dividend date and interest income, including, where applicable, accretion of discount and amortization of premium on investments, is recognized on the accrual basis.
Pursuant to a securities lending agreement with The Bank of New York Mellon, a subsidiary of BNY Mellon and an affiliate of Dreyfus, the fund may lend securities to qualified institutions. It is the fund’s policy that, at origination, all loans are secured by collateral of at least 102% of the value of U.S. securities loaned and 105% of the value of foreign securities loaned. Collateral equivalent to at least 100% of the market value of securities on loan is maintained at all times. Collateral is either in the form of cash, which can be invested in certain money market mutual funds managed by the Manager or U.S. Government and Agency securities. The fund is entitled to receive all dividends, interest and distributions on securities loaned, in addition to income earned as a result of the lending transaction. Should a borrower fail to return the securities in a timely manner, The Bank of New York Mellon is required to replace the securities for the benefit of the fund
The Fund 25
NOTES TO FINANCIAL STATEMENTS (continued)
or credit the fund with the market value of the unreturned securities and is subrogated to the fund’s rights against the borrower and the collateral. During the period ended December 31, 2014, The Bank of New York Mellon earned $1,813 from lending portfolio securities, pursuant to the securities lending agreement.
(c) Affiliated issuers: Investments in other investment companies advised by Dreyfus are defined as “affiliated” under the Act. Investments in affiliated investment companies during the period ended December 31, 2014 were as follows:
| Affiliated | |||||
| Investment | Value | Value | Net | ||
| Company | 12/31/2013 ($) | Purchases ($) | Sales ($) | 12/31/2014 ($) | Assets (%) |
| Dreyfus | |||||
| Institutional | |||||
| Preferred | |||||
| Plus Money | |||||
| Market | |||||
| Fund | 7,247,616 | 70,051,343 | 73,050,915 | 4,248,044 | 1.0 |
| Dreyfus | |||||
| Institutional | |||||
| Cash | |||||
| Advantage | |||||
| Fund | 1,930,400 | 19,343,087 | 21,273,487 | — | — |
| Total | 9,178,016 | 89,394,430 | 94,324,402 | 4,248,044 | 1.0 |
(d) Dividends to shareholders: Dividends are recorded on the ex-dividend date. Dividends from investment income-net and dividends from net realized capital gains, if any, are normally declared and paid annually, but the fund may make distributions on a more frequent basis to comply with the distribution requirements of the Internal Revenue Code of 1986, as amended (the “Code”). To the extent that net realized capital gains can be offset by capital loss carryovers, it is the policy of the fund not to distribute such gains. Income and capital gain distributions are determined in accordance with income tax regulations, which may differ from GAAP.
(e) Federal income taxes: It is the policy of the fund to continue to qualify as a regulated investment company, if such qualification is in the best interests of its shareholders, by complying with the applicable pro-
26
visions of the Code, and to make distributions of taxable income sufficient to relieve it from substantially all federal income and excise taxes.
As of and during the period ended December 31, 2014, the fund did not have any liabilities for any uncertain tax positions.The fund recognizes interest and penalties, if any, related to uncertain tax positions as income tax expense in the Statement of Operations. During the period ended December 31, 2014, the fund did not incur any interest or penalties.
Each tax year in the four-year period ended December 31, 2014 remains subject to examination by the Internal Revenue Service and state taxing authorities.
At December 31, 2014, the components of accumulated earnings on a tax basis were as follows: undistributed ordinary income $152,381 and unrealized appreciation $76,462,910. In addition, the fund had $132,272 of capital losses realized after October 31, 2014, which were deferred for tax purposes to the first day of the following fiscal year.
The tax character of distributions paid to shareholders during the fiscal periods ended December 31, 2014 and December 31, 2013 were as follows: ordinary income $7,195,321 and $2,803,509, and long-term capital gains $4,713,593 and $0, respectively.
During the period ended December 31, 2014, as a result of permanent book to tax differences, primarily due to the tax treatment for dividend reclassification, the fund decreased accumulated undistributed investment income-net by $1,271 and increased accumulated net realized gain (loss) on investments by the same amount. Net assets and net asset value per share were not affected by this reclassification.
NOTE 2—Bank Lines of Credit:
The fund participates with other Dreyfus-managed funds in a $430 million unsecured credit facility led by Citibank, N.A. and a $300 million unsecured credit facility provided by The Bank of New York Mellon (each, a “Facility”), each to be utilized primarily for temporary or emergency purposes, including the financing of redemptions. Prior to October
The Fund 27
NOTES TO FINANCIAL STATEMENTS (continued)
8, 2014, the unsecured credit facility with Citibank, N.A. was $265 million. In connection therewith, the fund has agreed to pay its pro rata portion of commitment fees for each Facility. Interest is charged to the fund based on rates determined pursuant to the terms of the respective Facility at the time of borrowing. During the period ended December 31, 2014, the fund did not borrow under the Facilities.
NOTE 3—Management Fee and Other Transactions with Affiliates:
(a) Pursuant to a management agreement with the Manager, the management fee is computed at an annual rate of .70% of the value of the fund’s average daily net assets and is payable monthly.The Manager has contractually agreed, from January 1, 2014 through May 1, 2015, to waive receipt of its fees and/or assume the direct expenses of the fund, so that the expenses of none of the classes (excluding Rule 12b-1 Distribution Plan fees, Shareholder Services Plan fees, taxes, interest expense, brokerage commissions, commitment fees on borrowings and extraordinary expenses) exceed .90% of the value of the fund’s average daily net assets. The reduction in expenses, pursuant to the undertaking, amounted to $788 during the period ended December 31, 2014.
During the period ended December 31, 2014, the Distributor retained $500 from CDSCs on redemptions of the fund’s Class C shares.
(b) Under the Distribution Plan adopted pursuant to Rule 12b-1 under the Act, Class C shares pay the Distributor for distributing its shares at an annual rate of .75% of the value of its average daily net assets. During the period ended December 31, 2014, Class C shares were charged $2,164 pursuant to the Distribution Plan.
(c) Under the Shareholder Services Plan, Class A and Class C shares pay the Distributor at an annual rate of .25% of the value of their average daily net assets for the provision of certain services. The services provided may include personal services relating to shareholder accounts, such as answering shareholder inquiries regarding the fund
28
and providing reports and other information, and services related to the maintenance of shareholder accounts. The Distributor may make payments to Service Agents (securities dealers, financial institutions or other industry professionals) with respect to these services. The Distributor determines the amounts to be paid to Service Agents. During the period ended December 31, 2014, Class A and Class C shares were charged $4,699 and $721, respectively, pursuant to the Shareholder Services Plan.
The fund has arrangements with the transfer agent and the custodian whereby the fund may receive earnings credits when positive cash balances are maintained, which are used to offset transfer agency and custody fees. For financial reporting purposes, the fund includes net earnings credits as an expense offset in the Statement of Operations.
The fund compensates Dreyfus Transfer, Inc., a wholly-owned subsidiary of the Manager, under a transfer agency agreement for providing transfer agency and cash management services for the fund. The majority of transfer agency fees are comprised of amounts paid on a per account basis, while cash management fees are related to fund subscriptions and redemptions. During the period ended December 31, 2014, the fund was charged $12,295 for transfer agency services and $707 for cash management services.These fees are included in Shareholder servicing costs in the Statement of Operations. Cash management fees were partially offset by earnings credits of $42.
The fund compensates The Bank of New York Mellon under a custody agreement for providing custodial services for the fund. These fees are determined based on net assets, geographic region and transaction activity. During the period ended December 31, 2014, the fund was charged $60,029 pursuant to the custody agreement.
During the period ended December 31, 2014, the fund was charged $7,771 for services performed by the Chief Compliance Officer and his staff.
The Fund 29
NOTES TO FINANCIAL STATEMENTS (continued)
The components of “Due to The Dreyfus Corporation and affiliates” in the Statement of Assets and Liabilities consist of: management fees $268,569, Distribution Plan fees $271, Shareholder Services Plan fees $557, custodian fees $16,454, Chief Compliance Officer fees $1,851 and transfer agency fees $2,711, which are offset against an expense reimbursement currently in effect in the amount of $110.
(d) Each Board member also serves as a Board member of other funds within the Dreyfus complex. Annual retainer fees and attendance fees are allocated to each fund based on net assets.
NOTE 4—Securities Transactions:
The aggregate amount of purchases and sales of investment securities, excluding short-term securities, during the period ended December 31, 2014, amounted to $275,251,942 and $240,849,291, respectively.
At December 31, 2014, the cost of investments for federal income tax purposes was $370,724,158; accordingly, accumulated net unrealized appreciation on investments was $76,462,910, consisting of $83,656,371 gross unrealized appreciation and $7,193,461 gross unrealized depreciation.
30
REPORT OF INDEPENDENT REGISTERED
PUBLIC ACCOUNTING FIRM
Shareholders and Board of Directors
Dreyfus Large Cap Equity Fund
We have audited the accompanying statement of assets and liabilities, including the statement of investments, of Dreyfus Large Cap Equity Fund (one of the series comprising Dreyfus Premier Investment Funds, Inc.) as of December 31, 2014, and the related statement of operations for the year then ended, the statement of changes in net assets for each of the two years in the period then ended, and the financial highlights for each of the five years in the period then ended. These financial statements and financial highlights are the responsibility of the Fund’s management. Our responsibility is to express an opinion on these financial statements and financial highlights based on our audits.
We conducted our audits in accordance with the standards of the Public Company Accounting Oversight Board (United States). Those standards require that we plan and perform the audit to obtain reasonable assurance about whether the financial statements and financial highlights are free of material misstatement. We were not engaged to perform an audit of the Fund’s internal control over financial reporting. Our audits included consideration of internal control over financial reporting as a basis for designing audit procedures that are appropriate in the circumstances, but not for the purpose of expressing an opinion on the effectiveness of the Fund’s internal control over financial reporting. Accordingly, we express no such opinion. An audit also includes examining, on a test basis, evidence supporting the amounts and disclosures in the financial statements and financial highlights, assessing the accounting principles used and significant estimates made by management, and evaluating the overall financial statement presentation. Our procedures included confirmation of securities owned as of December 31, 2014 by correspondence with the custodian and others.We believe that our audits provide a reasonable basis for our opinion.
In our opinion, the financial statements and financial highlights referred to above present fairly, in all material respects, the financial position of Dreyfus Large Cap Equity Fund at December 31, 2014, the results of its operations for the year then ended, the changes in its net assets for each of the two years in the period then ended, and the financial highlights for each of the five years in the period then ended, in conformity with U.S. generally accepted accounting principles.
New York, New York
February 26, 2015
The Fund 31
IMPORTANT TAX INFORMATION (Unaudited)
In accordance with federal tax law, the fund hereby reports 100% of the ordinary dividends paid during the fiscal year ended December 31, 2014 as qualifying for the corporate dividends received deduction. For the fiscal year ended December 31, 2014, certain dividends paid by the fund may be subject to a maximum tax rate of 15%, as provided for by the Jobs and Growth Tax Relief Reconciliation Act of 2003. Of the distributions paid during the fiscal year, $7,195,321 represents the maximum amount that may be considered qualified dividend income. Shareholders will receive notification in early 2015 of the percentage applicable to the preparation of their 2014 income tax returns. Also, the fund hereby reports $.1799 per share as a long-term capital gain distribution paid on December 19, 2014.
32
| BOARD MEMBERS INFORMATION (Unaudited) |
| INDEPENDENT BOARD MEMBERS |
| Joseph S. DiMartino (71) |
| Chairman of the Board (1995) |
| Principal Occupation During Past 5Years: |
| • Corporate Director and Trustee (1995-present) |
| Other Public Company Board Memberships During Past 5Years: |
| • CBIZ (formerly, Century Business Services, Inc.), a provider of outsourcing functions for small |
| and medium size companies, Director (1997-present) |
| • The Newark Group, a provider of a national market of paper recovery facilities, paperboard |
| mills and paperboard converting plants, Director (2000-2010) |
| • Sunair Services Corporation, a provider of certain outdoor-related services to homes and |
| businesses, Director (2005-2009) |
| No. of Portfolios for which Board Member Serves: 146 |
| ——————— |
| Peggy C. Davis (71) |
| Board Member (2012) |
| Principal Occupation During Past 5Years: |
| • Shad Professor of Law, New York University School of Law (1983-present) |
| No. of Portfolios for which Board Member Serves: 52 |
| ——————— |
| David P. Feldman (75) |
| Board Member (1991) |
| Principal Occupation During Past 5Years: |
| • Corporate Director and Trustee (1985-present) |
| Other Public Company Board Membership During Past 5Years: |
| • BBH Mutual Funds Group (5 registered mutual funds), Director (1992-present) |
| No. of Portfolios for which Board Member Serves: 38 |
| ——————— |
| Ehud Houminer (74) |
| Board Member (2012) |
| Principal Occupation During Past 5Years: |
| • Executive-in-Residence at the Columbia Business School, Columbia University (1992-present) |
| Other Public Company Board Membership During Past 5Years: |
| • Avnet, Inc., an electronics distributor, Director (1993-2012) |
| No. of Portfolios for which Board Member Serves: 62 |
The Fund 33
| BOARD MEMBERS INFORMATION (Unaudited) (continued) |
| INDEPENDENT BOARD MEMBERS (continued) |
| Lynn Martin (75) |
| Board Member (1994) |
| Principal Occupation During Past 5Years: |
| • President of The Martin Hall Group LLC, a human resources consulting firm (2005-2012) |
| Other Public Company Board Memberships During Past 5Years: |
| • AT&T, Inc., a telecommunications company, Director (1999-2012) |
| • Ryder System, Inc., a supply chain and transportation management company, Director (1993-2012) |
| • The Proctor & Gamble Co., a consumer products company, Director (1994-2009) |
| • Constellation Energy Group, Inc., Director (2003-2009) |
| No. of Portfolios for which Board Member Serves: 38 |
| ——————— |
| Robin A. Melvin (51) |
| Board Member (2011) |
| Principal Occupation During Past 5Years: |
| • Board Member, Illinois Mentoring Partnership, non-profit organization dedicated to increasing |
| the quantity and quality of mentoring services in Illinois (2013-present) |
| • Director, Boisi Family Foundation, a private family foundation that supports youth-serving orga- |
| nizations that promote the self sufficiency of youth from disadvantaged circumstances (1995-2012) |
| No. of Portfolios for which Board Member Serves: 114 |
| ——————— |
| Dr. Martin Peretz (75) |
| Board Member (2012) |
| Principal Occupation During Past 5Years: |
| • Editor-in-Chief Emeritus of The New Republic Magazine (2010-2011) (previously, |
| Editor-in-Chief, 1974-2010) |
| • Director of TheStreet.com, a financial information service on the web (1996-2010) |
| No. of Portfolios for which Board Member Serves: 38 |
| ——————— |
| Once elected all Board Members serve for an indefinite term, but achieve Emeritus status upon reaching age 80.The |
| address of the Board Members and Officers is c/o The Dreyfus Corporation, 200 Park Avenue, NewYork, NewYork |
| 10166.Additional information about the Board Members is available in the fund’s Statement of Additional Information |
| which can be obtained from Dreyfus free of charge by calling this toll free number: 1-800-DREYFUS. |
| Daniel Rose, Emeritus Board Member |
| Philip L.Toia, Emeritus Board Member |
| Sander Vanocur, Emeritus Board Member |
34
OFFICERS OF THE FUND (Unaudited)
BRADLEY J. SKAPYAK, President since January 2010.
Chief Operating Officer and a director of the Manager since June 2009, Chairman of Dreyfus Transfer, Inc., an affiliate of the Manager and the transfer agent of the funds, since May 2011 and Executive Vice President of the Distributor since June 2007. From April 2003 to June 2009, Mr. Skapyak was the head of the Investment Accounting and Support Department of the Manager. He is an officer of 69 investment companies (comprised of 146 portfolios) managed by the Manager. He is 56 years old and has been an employee of the Manager since February 1988.
JOHN PAK, Chief Legal Officer since March 2013.
Deputy General Counsel, Investment Management, of BNY Mellon since August 2014; Chief Legal Officer of the Manager since August 2012; from March 2005 to July 2012, Managing Director of Deutsche Bank, Deputy Global Head of Deutsche Asset Management Legal and Regional Head of Deutsche Asset Management Americas Legal. He is an officer of 70 investment companies (comprised of 171 portfolios) managed by the Manager. He is 46 years old and has been an employee of the Manager since August 2012.
JANETTE E. FARRAGHER, Vice President and Secretary since December 2011.
Assistant General Counsel of BNY Mellon, and an officer of 70 investment companies (comprised of 171 portfolios) managed by the Manager. She is 52 years old and has been an employee of the Manager since February 1984.
KIESHA ASTWOOD, Vice President and Assistant Secretary since January 2010.
Counsel of BNY Mellon, and an officer of 70 investment companies (comprised of 171 portfolios) managed by the Manager. She is 41 years old and has been an employee of the Manager since July 1995.
JAMES BITETTO, Vice President and Assistant Secretary since August 2005.
Managing Counsel of BNY Mellon and Secretary of the Manager, and an officer of 70 investment companies (comprised of 171 portfolios) managed by the Manager. He is 48 years old and has been an employee of the Manager since December 1996.
JONI LACKS CHARATAN, Vice President and Assistant Secretary since August 2005.
Managing Counsel of BNY Mellon, and an officer of 70 investment companies (comprised of 171 portfolios) managed by the Manager. She is 59 years old and has been an employee of the Manager since October 1988.
JOSEPH M. CHIOFFI, Vice President and Assistant Secretary since August 2005.
Managing Counsel of BNY Mellon, and an officer of 70 investment companies (comprised of 171 portfolios) managed by the Manager. He is 53 years old and has been an employee of the Manager since June 2000.
JOHN B. HAMMALIAN, Vice President and Assistant Secretary since August 2005.
Senior Managing Counsel of BNY Mellon, and an officer of 70 investment companies (comprised of 171 portfolios) managed by the Manager. He is 51 years old and has been an employee of the Manager since February 1991.
SARAH S. KELLEHER, Vice President and Assistant Secretary since April 2014.
Senior Counsel of BNY Mellon, and an officer of 70 investment companies (comprised of 171 portfolios) managed by the Manager; from August 2005 to March 2013, Associate General Counsel of Third Avenue Management. She is 39 years old and has been an employee of the Manager since March 2013.
The Fund 35
OFFICERS OF THE FUND (Unaudited) (continued)
JEFF PRUSNOFSKY, Vice President and Assistant Secretary since August 2005.
Senior Managing Counsel of BNY Mellon, and an officer of 70 investment companies (comprised of 171 portfolios) managed by the Manager. He is 49 years old and has been an employee of the Manager since October 1990.
JAMES WINDELS, Treasurer since November 2001.
Director – Mutual Fund Accounting of the Manager, and an officer of 70 investment companies (comprised of 171 portfolios) managed by the Manager. He is 56 years old and has been an employee of the Manager since April 1985.
RICHARD CASSARO, Assistant Treasurer since January 2008.
Senior Accounting Manager – Money Market and Municipal Bond Funds of the Manager, and an officer of 70 investment companies (comprised of 171 portfolios) managed by the Manager. He is 55 years old and has been an employee of the Manager since September 1982.
GAVIN C. REILLY, Assistant Treasurer since December 2005.
Tax Manager of the Investment Accounting and Support Department of the Manager, and an officer of 70 investment companies (comprised of 171 portfolios) managed by the Manager. He is 46 years old and has been an employee of the Manager since April 1991.
ROBERT S. ROBOL, Assistant Treasurer since August 2005.
Senior Accounting Manager – Fixed Income Funds of the Manager, and an officer of 70 investment companies (comprised of 171 portfolios) managed by the Manager. He is 50 years old and has been an employee of the Manager since October 1988.
ROBERT SALVIOLO, Assistant Treasurer since July 2007.
Senior Accounting Manager – Equity Funds of the Manager, and an officer of 70 investment companies (comprised of 171 portfolios) managed by the Manager. He is 47 years old and has been an employee of the Manager since June 1989.
ROBERT SVAGNA, Assistant Treasurer since December 2002.
Senior Accounting Manager – Equity Funds of the Manager, and an officer of 70 investment companies (comprised of 171 portfolios) managed by the Manager. He is 47 years old and has been an employee of the Manager since November 1990.
JOSEPH W. CONNOLLY, Chief Compliance Officer since October 2004.
Chief Compliance Officer of the Manager and The Dreyfus Family of Funds (70 investment companies, comprised of 171 portfolios). He is 57 years old and has served in various capacities with the Manager since 1980, including manager of the firm’s Fund Accounting Department from 1997 through October 2001.
MATTHEW D. CONNOLLY, Anti-Money Laundering Compliance Officer since April 2012.
Anti-Money Laundering Compliance Officer of the Distributor since October 2011; from March 2010 to September 2011, Global Head, KYC Reviews and Director of UBS Investment Bank; until March 2010, AML Compliance Officer and Senior Vice President of Citi Global Wealth Management. He is an officer of 65 investment companies (comprised of 166 portfolios) managed by the Manager. He is 42 years old and has been an employee of the Distributor since October 2011.
36
For More Information
| Telephone Call your financial representative or 1-800-DREYFUS |
| Mail The Dreyfus Family of Funds, 144 Glenn Curtiss Boulevard, Uniondale, NY 11556-0144 |
The fund files its complete schedule of portfolio holdings with the Securities and Exchange Commission (“SEC”) for the first and third quarters of each fiscal year on Form N-Q. The fund’s Forms N-Q are available on the SEC’s website at http://www.sec.gov and may be reviewed and copied at the SEC’s Public Reference Room in Washington, DC. Information on the operation of the Public Reference Room may be obtained by calling 1-800-SEC-0330.
A description of the policies and procedures that the fund uses to determine how to vote proxies relating to portfolio securities, and information regarding how the fund voted these proxies for the most recent 12-month period ended June 30 is available at http://www.dreyfus.com and on the SEC’s website at http://www.sec.gov. The description of the policies and procedures is also available without charge, upon request, by calling 1-800-DREYFUS.

| Dreyfus |
| Large Cap Growth Fund |
ANNUAL REPORT December 31, 2014
Save time. Save paper. View your next shareholder report online as soon as it’s available. Log into www.dreyfus.com and sign up for Dreyfus eCommunications. It’s simple and only takes a few minutes.
The views expressed in this report reflect those of the portfolio manager only through the end of the period covered and do not necessarily represent the views of Dreyfus or any other person in the Dreyfus organization. Any such views are subject to change at any time based upon market or other conditions and Dreyfus disclaims any responsibility to update such views.These views may not be relied on as investment advice and, because investment decisions for a Dreyfus fund are based on numerous factors, may not be relied on as an indication of trading intent on behalf of any Dreyfus fund.
| Not FDIC-Insured • Not Bank-Guaranteed • May Lose Value |
Contents | |
THE FUND | |
| 2 | A Letter from the President |
| 3 | Discussion of Fund Performance |
| 6 | Fund Performance |
| 8 | Understanding Your Fund’s Expenses |
| 8 | Comparing Your Fund’s Expenses With Those of Other Funds |
| 9 | Statement of Investments |
| 13 | Statement of Assets and Liabilities |
| 14 | Statement of Operations |
| 15 | Statement of Changes in Net Assets |
| 17 | Financial Highlights |
| 20 | Notes to Financial Statements |
| 29 | Report of Independent Registered Public Accounting Firm |
| 30 | Important Tax Information |
| 31 | Board Members Information |
| 33 | Officers of the Fund |
FOR MORE INFORMATION | |
Back Cover |
Dreyfus
Large Cap Growth Fund
The Fund
A LETTER FROM THE PRESIDENT
Dear Shareholder:
We are pleased to present this annual report for Dreyfus Large Cap Growth Fund, covering the 12-month period from January 1, 2014, through December 31, 2014. For information about how the fund performed during the reporting period, as well as general market perspectives, we provide a Discussion of Fund Performance on the pages that follow.
While U.S. equities’ 2014 gains fell short of their impressive 2013 performance, some broad measures of stock market performance posted their sixth consecutive year of positive results. Investor sentiment remained strong in an environment of sustained economic growth, rising corporate profits, muted inflation, and historically low interest rates. It also is noteworthy that stocks advanced despite persistent headwinds stemming from a sluggish global economy, which was characterized by economic weakness in Europe, Japan and China; intensifying geopolitical conflicts; and plummeting commodity prices.
Many economists appear to be optimistic about the prospects for 2015. Our own analysts agree and, in light of the ongoing benefits of low interest rates and depressed energy prices, see the potential for a somewhat faster pace of global growth in 2015 than in 2014. U.S. economic growth also seems poised to accelerate, largely due to the fading of drags from tight fiscal policies adopted in the wake of the Great Recession. Of course, a number of risks to U.S. and global economic growth remain, and changing conditions in 2015 are likely to benefit some industry groups more than others. That’s why we urge you to talk regularly with your financial advisor about the potential impact of macroeconomic developments on your investments.
Thank you for your continued confidence and support.

J. Charles Cardona
President
The Dreyfus Corporation
January 15, 2015
2
DISCUSSION OF FUND PERFORMANCE
For the period of January 1, 2014, through December 31, 2014, as provided by Irene D. O’Neill, Portfolio Manager
Fund and Market Performance Overview
For the 12-month period ended December 31, 2014, Dreyfus Large Cap Growth Fund’s Class A shares achieved a total return of 14.49%, Class C shares returned 13.66%, and Class I shares returned 14.79%.1 In comparison, the Russell 1000® Growth Index, the fund’s benchmark, produced a total return of 13.05%.2
U.S. equities advanced in 2014 when a domestic economic recovery gained momentum.The fund outperformed its benchmark, mainly due to favorable results in the information technology and health care sectors.
The Fund’s Investment Approach
The fund seeks to provide long-term capital appreciation.To pursue its goal, the fund normally invests at least 80% of its assets in equity securities of large-capitalization companies with market capitalizations of $5 billion or more at the time of purchase.
The fund’s investment philosophy is based on the premise that earnings growth is the primary determinant of long-term stock appreciation. With this, we use an approach that combines top-down and bottom-up analysis, so stock selection and sector allocation are both factors in determining the fund’s holdings. Fundamental financial analysis is used to identify companies with characteristics such as: expected earnings growth rate exceeds market and industry trends; potential for positive earnings surprise relative to market expectations; positive operational or financial catalysts; attractive valuation based on growth prospects; and strong financial condition.
Stocks Climbed Despite Global Headwinds
U.S. stocks began 2014 in the midst of a rally fueled by falling unemployment and intensifying manufacturing activity, but they gave up some of their gains in January when concerns arose regarding economic and political instability in the emerging markets. Equities began to rebound in February, and the S&P 500 Index climbed to new highs through June as the economic recovery gained momentum. Investors also responded positively to low inflation and expectations that short-term interest rates would stay low.
The Fund 3
DISCUSSION OF FUND PERFORMANCE (continued)
The market encountered renewed volatility in July and September when concerns resurfaced that a faltering global economy might derail the U.S. expansion. Stocks soon rebounded when U.S. economic data stayed strong, but ongoing turmoil in overseas markets and plummeting commodity prices caused investors to turn toward traditionally defensive stocks with high dividend yields. In contrast, companies with high levels of earnings growth generally fell out of favor.
Focus on Growth Dampened Relative Results
The fund participated more than fully in the benchmark’s gains during 2014. Results were especially robust in the information technology sector, where overweighted exposure enabled the fund to benefit more strongly from the sector’s performance. Semiconductor manufacturers Avago Technologies, Skyworks Solutions, Freescale, and Micron Technology fared especially well as pricing pressures waned in a consolidating industry. Other technology companies—including Facebook, ServiceNow, and Electronic Arts—participated in the growth of secular technological trends, such as cloud and mobile computing. A relatively heavy position in consumer electronics giant Apple also buoyed relative results.
An overweighted position and good stock selections in the health care sector further boosted relative performance. Drug developer Shire climbed after receiving an acquisition offer, and the fund benefited by selling its position before the deal was canceled amid political pressures. Multi-specialty health care company Allergan also gained value after a takeover bid, while its ultimate acquirer,Actavis PLC, was rewarded for several accretive transactions. Hospitals operator HCA Holdings benefited from higher utilization rates and less bad debt after full implementation of the Affordable Care Act. In the consumer staples sector, food producer Hillshire Brands and spirits maker Beam were acquired at premiums to their stock prices at the time, and energy drinks seller Monster Beverage advanced after The Coca-Cola Companies purchased an equity stake in the company.
On the other hand, the fund’s relative performance was undermined to a degree by the financials sector, where a lack of dividend-paying real estate investment trusts (“REITs”) weighed on relative results. In addition, mortgage servicer Ocwen Financial lost value when a proposed acquisition was blocked by regulators, prompting us to
4
eliminate the position before the stock suffered further declines. In the consumer discretionary sector, casino operator LasVegas Sands saw reduced traffic in its Macau facilities, internet retailer Amazon.com proved unable to boost profit margins when management maintained a high level of investment spending, and casual dining company Yum! Brands was hurt by food quality issues surrounding a supplier in China.
Finding Secular Growth Opportunities
We currently expect U.S. economic growth to continue even as headwinds persist in international markets. Lower oil prices are likely to benefit consumers but may weigh on the financial results of certain companies. In this mixed environment, we intend to focus on companies poised to benefit from secular growth trends such as cloud computing, and those engaged in “self-help” activities such as restructurings. We have identified a number of opportunities meeting our criteria in the information technology and health care sectors, but relatively few among utilities and telecommunications services companies.
January 15, 2015
Please note, the position in any security highlighted with italicized typeface was sold during the reporting period. Equity funds are subject generally to market, market sector, market liquidity, issuer, and investment style risks, among other factors, to varying degrees, all of which are more fully described in the fund’s prospectus.
| 1 Total return includes reinvestment of dividends and any capital gains paid, and does not take into consideration the |
| maximum initial sales charge in the case of Class A shares, or the applicable contingent deferred sales charge imposed |
| on the redemption of Class C shares. Had these charges been reflected, returns would have been lower. Past |
| performance is no guarantee of future results. Share price and investment return fluctuate such that upon redemption |
| fund shares may be worth more or less than their original cost. Return figures provided reflect the absorption of certain |
| fund expenses by The Dreyfus Corporation pursuant to an undertaking in effect through May 1, 2015, at which |
| time it may be extended, terminated, or modified. Had these expenses not been absorbed, the fund’s returns would |
| have been lower. |
| 2 SOURCE: LIPPER INC. — Reflects reinvestment of net dividends and, where applicable, capital gain |
| distributions.The Russell 1000® Growth Index is an unmanaged index that measures the performance of those |
| Russell 1000® companies with higher price-to-book ratios and higher forecasted growth values. Index return does not |
| reflect fees and expenses associated with operating a mutual fund. Investors cannot invest directly in any index. |
The Fund 5
FUND PERFORMANCE
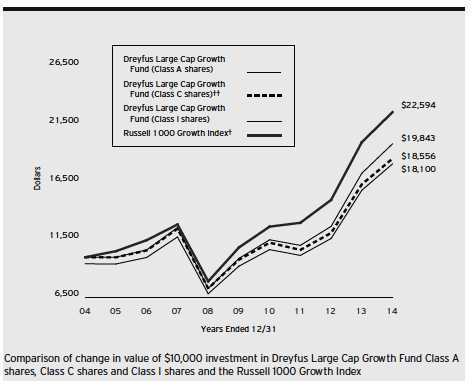
| † | Source: Lipper Inc. |
| †† | The total return figures presented for Class C shares of the fund reflect the performance of the fund’s Class A shares |
| for the period prior to 9/13/08 (the inception date for Class C shares), not reflecting the applicable sales charges for | |
| Class A shares. |
Past performance is not predictive of future performance.
The above graph compares a $10,000 investment made in each of the Class A, Class C and Class I shares of Dreyfus Large Cap Growth Fund on 12/31/04 to a $10,000 investment made in the Russell 1000 Growth Index (the “Index”) on that date. All dividends and capital gain distributions are reinvested.
The fund’s performance shown in the line graph above takes into account the maximum initial sales charge on Class A shares and all other applicable fees and expenses on all classes.The Index is an unmanaged index which measures the performance of those Russell 1000 companies with higher price-to-book ratios and higher forecasted growth values. Unlike a mutual fund, the Index is not subject to charges, fees and other expenses. Investors cannot invest directly in any index. Further information relating to fund performance, including expense reimbursements, if applicable, is contained in the Financial Highlights section of the prospectus and elsewhere in this report.
6
| Average Annual Total Returns as of 12/31/14 | |||||||
| Inception | |||||||
| Date | 1 Year | 5 Years | 10 Years | ||||
| Class A shares | |||||||
| with maximum sales charge (5.75%) | 12/31/86 | 7.86 | % | 13.10 | % | 6.11 | % |
| without sales charge | 12/31/86 | 14.49 | % | 14.44 | % | 6.74 | % |
| Class C shares | |||||||
| with applicable redemption charge † | 9/13/08 | 12.69 | % | 13.66 | % | 6.38 | %†† |
| without redemption | 9/13/08 | 13.66 | % | 13.66 | % | 6.38 | %†† |
| Class I shares | 4/1/97 | 14.79 | % | 14.93 | % | 7.09 | % |
| Russell 1000 Growth Index | 13.05 | % | 15.81 | % | 8.49 | % | |
Past performance is not predictive of future performance.The fund’s performance shown in the graph and table does not reflect the deduction of taxes that a shareholder would pay on fund distributions or the redemption of fund shares. In addition to the performance of Class A shares shown with and without a maximum sales charge, the fund’s performance shown in the table takes into account all other applicable fees and expenses on all classes.
| † | The maximum contingent deferred sales charge for Class C shares is 1% for shares redeemed within one year of the |
| date of purchase. | |
| †† | The total return performance figures presented for Class C shares of the fund reflect the performance of the fund’s |
| Class A shares for the period prior to 9/13/08 (the inception date for Class C shares). |
The Fund 7
UNDERSTANDING YOUR FUND’S EXPENSES (Unaudited)
As a mutual fund investor, you pay ongoing expenses, such as management fees and other expenses. Using the information below, you can estimate how these expenses affect your investment and compare them with the expenses of other funds.You also may pay one-time transaction expenses, including sales charges (loads) and redemption fees, which are not shown in this section and would have resulted in higher total expenses. For more information, see your fund’s prospectus or talk to your financial adviser.
Review your fund’s expenses
The table below shows the expenses you would have paid on a $1,000 investment in Dreyfus Large Cap Growth Fund from July 1, 2014 to December 31, 2014. It also shows how much a $1,000 investment would be worth at the close of the period, assuming actual returns and expenses.
Expenses and Value of a $1,000 Investment
assuming actual returns for the six months ended December 31, 2014
| Class A | Class C | Class I | ||||
| Expenses paid per $1,000† | $ 5.97 | $ 9.85 | $ 4.68 | |||
| Ending value (after expenses) | $ 1,061.20 | $ 1,056.80 | $ 1,063.30 |
COMPARING YOUR FUND’S EXPENSES
WITH THOSE OF OTHER FUNDS (Unaudited)
Using the SEC’s method to compare expenses
The Securities and Exchange Commission (SEC) has established guidelines to help investors assess fund expenses. Per these guidelines, the table below shows your fund’s expenses based on a $1,000 investment, assuming a hypothetical 5% annualized return. You can use this information to compare the ongoing expenses (but not transaction expenses or total cost) of investing in the fund with those of other funds. All mutual fund shareholder reports will provide this information to help you make this comparison. Please note that you cannot use this information to estimate your actual ending account balance and expenses paid during the period.
Expenses and Value of a $1,000 Investment
assuming a hypothetical 5% annualized return for the six months ended December 31, 2014
| Class A | Class C | Class I | ||||
| Expenses paid per $1,000† | $ 5.85 | $ 9.65 | $ 4.58 | |||
| Ending value (after expenses) | $ 1,019.41 | $ 1,015.63 | $ 1,020.67 |
| † Expenses are equal to the fund’s annualized expense ratio of 1.15% for Class A, 1.90% for Class C and .90% |
| for Class I, multiplied by the average account value over the period, multiplied by 184/365 (to reflect the one-half |
| year period). |
8
| STATEMENT OF INVESTMENTS |
| December 31, 2014 |
| Common Stocks—97.3% | Shares | Value ($) | |
| Automobiles & Components—2.2% | |||
| Harley-Davidson | 6,220 | 409,960 | |
| Johnson Controls | 6,760 | 326,778 | |
| 736,738 | |||
| Capital Goods—9.7% | |||
| Boeing | 4,139 | 537,987 | |
| Caterpillar | 4,350 | 398,155 | |
| Dover | 6,420 | 460,442 | |
| Honeywell International | 7,252 | 724,620 | |
| Ingersoll-Rand | 10,680 | 677,005 | |
| United Technologies | 4,031 | 463,565 | |
| 3,261,774 | |||
| Consumer Durables & Apparel—1.9% | |||
| NIKE, Cl. B | 2,950 | 283,643 | |
| PVH | 2,868 | 367,592 | |
| 651,235 | |||
| Consumer Services—3.6% | |||
| Cheesecake Factory | 8,520 | a | 428,641 |
| Las Vegas Sands | 5,590 | 325,114 | |
| Yum! Brands | 6,110 | 445,114 | |
| 1,198,869 | |||
| Diversified Financials—2.0% | |||
| Intercontinental Exchange | 977 | 214,246 | |
| Invesco | 11,338 | 448,078 | |
| 662,324 | |||
| Energy—4.5% | |||
| Baker Hughes | 4,580 | 256,801 | |
| Devon Energy | 4,910 | 300,541 | |
| EOG Resources | 3,640 | 335,135 | |
| Halliburton | 4,910 | 193,110 | |
| Memorial Resource Development | 10,350 | 186,611 | |
| Valero Energy | 4,790 | 237,105 | |
| 1,509,303 | |||
| Food & Staples Retailing—1.6% | |||
| Costco Wholesale | 3,769 | 534,256 | |
| Food, Beverage & Tobacco—7.1% | |||
| Hershey | 3,380 | 351,283 | |
| Mead Johnson Nutrition | 5,122 | 514,966 |
The Fund 9
STATEMENT OF INVESTMENTS (continued)
| Common Stocks (continued) | Shares | Value ($) | |
| Food, Beverage & Tobacco (continued) | |||
| Monster Beverage | 4,302 | b | 466,122 |
| PepsiCo | 7,190 | 679,886 | |
| Philip Morris International | 4,630 | 377,114 | |
| 2,389,371 | |||
| Health Care Equipment & Services—2.0% | |||
| AmerisourceBergen | 3,760 | 339,002 | |
| HCA Holdings | 4,350 | b | 319,246 |
| 658,248 | |||
| Household & Personal Products—1.0% | |||
| Procter & Gamble | 3,600 | 327,924 | |
| Insurance—1.2% | |||
| Arthur J. Gallagher & Co. | 8,390 | 395,001 | |
| Materials—2.9% | |||
| Celanese, Ser. A | 5,560 | 333,378 | |
| Dow Chemical | 5,020 | 228,962 | |
| Nucor | 8,280 | 406,134 | |
| 968,474 | |||
| Media—5.6% | |||
| Comcast, Cl. A | 11,230 | 651,452 | |
| DISH Network, Cl. A | 2,400 | b | 174,936 |
| Time Warner | 6,420 | 548,396 | |
| Walt Disney | 5,230 | 492,614 | |
| 1,867,398 | |||
| Pharmaceuticals, Biotech & Life Sciences—13.6% | |||
| AbbVie | 10,790 | 706,098 | |
| ACADIA Pharmaceuticals | 8,495 | a,b | 269,716 |
| Achillion Pharmaceuticals | 18,310 | a,b | 224,297 |
| Actavis | 1,863 | b | 479,555 |
| Alexion Pharmaceuticals | 1,146 | b | 212,044 |
| Amgen | 2,526 | 402,367 | |
| Biogen Idec | 1,027 | b | 348,615 |
| BioMarin Pharmaceutical | 2,835 | b | 256,284 |
| Bristol-Myers Squibb | 8,390 | 495,262 | |
| Celgene | 2,613 | b | 292,290 |
| Gilead Sciences | 5,344 | b | 503,725 |
| Mallinckrodt | 3,920 | b | 388,198 |
| 4,578,451 |
10
| Common Stocks (continued) | Shares | Value ($) | |
| Real Estate—.7% | |||
| DDR | 13,620 | c | 250,063 |
| Retailing—4.9% | |||
| Amazon.com | 1,918 | b | 595,251 |
| Best Buy | 10,240 | 399,155 | |
| Lowe’s | 9,370 | 644,656 | |
| 1,639,062 | |||
| Semiconductors & | |||
| Semiconductor Equipment—4.7% | |||
| Avago Technologies | 4,353 | 437,868 | |
| Intel | 10,570 | 383,585 | |
| Lam Research | 6,320 | 501,429 | |
| Skyworks Solutions | 3,330 | 242,124 | |
| 1,565,006 | |||
| Software & Services—16.5% | |||
| Accenture, Cl. A | 3,050 | 272,396 | |
| Adobe Systems | 4,030 | b | 292,981 |
| Electronic Arts | 8,450 | b | 397,277 |
| Facebook, Cl. A | 9,980 | b | 778,640 |
| Google, Cl. A | 1,689 | b | 896,285 |
| LinkedIn, Cl. A | 2,417 | b | 555,209 |
| Microsoft | 11,550 | 536,498 | |
| NetSuite | 2,917 | a,b | 318,449 |
| salesforce.com | 7,830 | b | 464,397 |
| ServiceNow | 6,750 | b | 457,988 |
| 7,410 | b | 265,797 | |
| Yahoo! | 6,410 | b | 323,769 |
| 5,559,686 | |||
| Technology Hardware & Equipment—9.4% | |||
| Apple | 20,253 | 2,235,526 | |
| CDW | 10,100 | 355,217 | |
| Palo Alto Networks | 2,613 | b | 320,275 |
| QUALCOMM | 3,430 | 254,952 | |
| 3,165,970 | |||
| Transportation—2.2% | |||
| Union Pacific | 6,209 | 739,678 | |
| Total Common Stocks | |||
| (cost $24,448,924) | 32,658,831 |
The Fund 11
STATEMENT OF INVESTMENTS (continued)
| Other Investment—2.4% | Shares | Value ($) | ||
| Registered Investment Company; | ||||
| Dreyfus Institutional Preferred | ||||
| Plus Money Market Fund | ||||
| (cost $812,778) | 812,778 | d | 812,778 | |
| Investment of Cash Collateral | ||||
| for Securities Loaned—3.0% | ||||
| Registered Investment Company; | ||||
| Dreyfus Institutional Cash Advantage Fund | ||||
| (cost $994,316) | 994,316 | d | 994,316 | |
| Total Investments (cost $26,256,018) | 102.7 | % | 34,465,925 | |
| Liabilities, Less Cash and Receivables | (2.7 | %) | (898,223 | ) |
| Net Assets | 100.0 | % | 33,567,702 | |
| a Security, or portion thereof, on loan.At December 31, 2014, the value of the fund’s securities on loan was $962,429 |
| and the value of the collateral held by the fund was $994,316. |
| b Non-income producing security. |
| c Investment in real estate investment trust. |
| d Investment in affiliated money market mutual fund. |
| Portfolio Summary (Unaudited)† | |||
| Value (%) | Value (%) | ||
| Software & Services | 16.5 | Consumer Services | 3.6 |
| Pharmaceuticals, | Materials | 2.9 | |
| Biotech & Life Sciences | 13.6 | Automobiles & Components | 2.2 |
| Capital Goods | 9.7 | Transportation | 2.2 |
| Technology Hardware & Equipment | 9.4 | Diversified Financials | 2.0 |
| Food, Beverage & Tobacco | 7.1 | Health Care Equipment & Services | 2.0 |
| Media | 5.6 | Consumer Durables & Apparel | 1.9 |
| Money Market Investments | 5.4 | Food & Staples Retailing | 1.6 |
| Retailing | 4.9 | Insurance | 1.2 |
| Semiconductors & | Household & Personal Products | 1.0 | |
| Semiconductor Equipment | 4.7 | Real Estate | .7 |
| Energy | 4.5 | 102.7 | |
| † Based on net assets. | |||
| See notes to financial statements. | |||
12
| STATEMENT OF ASSETS AND LIABILITIES |
| December 31, 2014 |
| Cost | Value | ||
| Assets ($): | |||
| Investments in securities—See Statement of Investments (including | |||
| securities on loan, valued at $962,429)—Note 1(b): | |||
| Unaffiliated issuers | 24,448,924 | 32,658,831 | |
| Affiliated issuers | 1,807,094 | 1,807,094 | |
| Cash | 55,639 | ||
| Receivable for shares of Common Stock subscribed | 62,714 | ||
| Dividends and securities lending income receivable | 32,682 | ||
| Prepaid expenses | 17,613 | ||
| 34,634,573 | |||
| Liabilities ($): | |||
| Due to The Dreyfus Corporation and affiliates—Note 3(c) | 25,181 | ||
| Liability for securities on loan—Note 1(b) | 994,316 | ||
| Accrued expenses | 47,374 | ||
| 1,066,871 | |||
| Net Assets ($) | 33,567,702 | ||
| Composition of Net Assets ($): | |||
| Paid-in capital | 25,140,155 | ||
| Accumulated undistributed investment income—net | 43,380 | ||
| Accumulated net realized gain (loss) on investments | 174,260 | ||
| Accumulated net unrealized appreciation | |||
| (depreciation) on investments | 8,209,907 | ||
| Net Assets ($) | 33,567,702 | ||
| Net Asset Value Per Share | |||
| Class A | Class C | Class I | |
| Net Assets ($) | 6,878,283 | 1,634,573 | 25,054,846 |
| Shares Outstanding | 778,040 | 189,984 | 2,762,811 |
| Net Asset Value Per Share ($) | 8.84 | 8.60 | 9.07 |
| See notes to financial statements. | |||
The Fund 13
| STATEMENT OF OPERATIONS |
| Year Ended December 31, 2014 |
| Investment Income ($): | ||
| Income: | ||
| Cash dividends: | ||
| Unaffiliated issuers | 356,540 | |
| Affiliated issuers | 341 | |
| Income from securities lending—Note 1(b) | 2,182 | |
| Total Income | 359,063 | |
| Expenses: | ||
| Management fee—Note 3(a) | 203,988 | |
| Professional fees | 46,871 | |
| Registration fees | 41,962 | |
| Shareholder servicing costs—Note 3(c) | 22,789 | |
| Custodian fees—Note 3(c) | 11,108 | |
| Prospectus and shareholders’ reports | 6,461 | |
| Distribution fees—Note 3(b) | 4,472 | |
| Directors’ fees and expenses—Note 3(d) | 2,270 | |
| Loan commitment fees—Note 2 | 261 | |
| Miscellaneous | 15,395 | |
| Total Expenses | 355,577 | |
| Less—reduction in expenses due to undertaking—Note 3(a) | (78,264 | ) |
| Less—reduction in fees due to earnings credits—Note 3(c) | (25 | ) |
| Net Expenses | 277,288 | |
| Investment Income—Net | 81,775 | |
| Realized and Unrealized Gain (Loss) on Investments—Note 4 ($): | ||
| Net realized gain (loss) on investments | 4,315,736 | |
| Net unrealized appreciation (depreciation) on investments | (387,699 | ) |
| Net Realized and Unrealized Gain (Loss) on Investments | 3,928,037 | |
| Net Increase in Net Assets Resulting from Operations | 4,009,812 | |
| See notes to financial statements. | ||
14
STATEMENT OF CHANGES IN NET ASSETS
| Year Ended December 31, | ||||
| 2014 | 2013 | |||
| Operations ($): | ||||
| Investment income—net | 81,775 | 147,708 | ||
| Net realized gain (loss) on investments | 4,315,736 | 3,087,641 | ||
| Net unrealized appreciation | ||||
| (depreciation) on investments | (387,699 | ) | 5,534,566 | |
| Net Increase (Decrease) in Net Assets | ||||
| Resulting from Operations | 4,009,812 | 8,769,915 | ||
| Dividends to Shareholders from ($): | ||||
| Investment income—net: | ||||
| Class A | (1,664 | ) | (9,692 | ) |
| Class I | (71,854 | ) | (318,978 | ) |
| Net realized gain on investments: | ||||
| Class A | (875,885 | ) | (197,525 | ) |
| Class C | (206,333 | ) | (33,311 | ) |
| Class I | (3,503,279 | ) | (2,865,839 | ) |
| Total Dividends | (4,659,015 | ) | (3,425,345 | ) |
| Capital Stock Transactions ($): | ||||
| Net proceeds from shares sold: | ||||
| Class A | 5,092,997 | 592,597 | ||
| Class C | 1,509,268 | 131,054 | ||
| Class I | 1,855,703 | 1,400,443 | ||
| Dividends reinvested: | ||||
| Class A | 805,637 | 174,697 | ||
| Class C | 66,349 | 10,902 | ||
| Class I | 2,946,936 | 2,470,822 | ||
| Cost of shares redeemed: | ||||
| Class A | (580,714 | ) | (260,767 | ) |
| Class C | (128,455 | ) | (32,863 | ) |
| Class I | (5,899,478 | ) | (8,557,051 | ) |
| Increase (Decrease) in Net Assets | ||||
| from Capital Stock Transactions | 5,668,243 | (4,070,166 | ) | |
| Total Increase (Decrease) in Net Assets | 5,019,040 | 1,274,404 | ||
| Net Assets ($): | ||||
| Beginning of Period | 28,548,662 | 27,274,258 | ||
| End of Period | 33,567,702 | 28,548,662 | ||
| Undistributed investment income—net | 43,380 | 35,123 | ||
The Fund 15
STATEMENT OF CHANGES IN NET ASSETS (continued)
| Year Ended December 31, | ||||
| 2014 | 2013 | |||
| Capital Share Transactions: | ||||
| Class Aa | ||||
| Shares sold | 538,074 | 68,981 | ||
| Shares issued for dividends reinvested | 90,134 | 20,037 | ||
| Shares redeemed | (62,787 | ) | (30,816 | ) |
| Net Increase (Decrease) in Shares Outstanding | 565,421 | 58,202 | ||
| Class Ca | ||||
| Shares sold | 160,499 | 16,326 | ||
| Shares issued for dividends reinvested | 7,628 | 1,267 | ||
| Shares redeemed | (13,819 | ) | (3,529 | ) |
| Net Increase (Decrease) in Shares Outstanding | 154,308 | 14,064 | ||
| Class I | ||||
| Shares sold | 191,579 | 168,335 | ||
| Shares issued for dividends reinvested | 320,933 | 279,298 | ||
| Shares redeemed | (622,845 | ) | (986,197 | ) |
| Net Increase (Decrease) in Shares Outstanding | (110,333 | ) | (538,564 | ) |
| a During the period ended December 31, 2013, 418 Class C shares representing $3,481 were exchanged for 413 |
| Class A shares. |
See notes to financial statements.
16
FINANCIAL HIGHLIGHTS
The following tables describe the performance for each share class for the fiscal periods indicated. All information (except portfolio turnover rate) reflects financial results for a single fund share.Total return shows how much your investment in the fund would have increased (or decreased) during each period, assuming you had reinvested all dividends and distributions.These figures have been derived from the fund’s financial statements.
| Year Ended December 31, | |||||||||
| Class A Shares | 2014 | 2013 | 2012 | 2011 | 2010 | ||||
| Per Share Data ($): | |||||||||
| Net asset value, beginning of period | 8.96 | 7.44 | 6.50 | 6.84 | 5.94 | ||||
| Investment Operations: | |||||||||
| Investment income (loss)—neta | .01 | .02 | .02 | (.02 | ) | (.01 | ) | ||
| Net realized and unrealized | |||||||||
| gain (loss) on investments | 1.28 | 2.61 | .92 | (.30 | ) | .92 | |||
| Total from Investment Operations | 1.29 | 2.63 | .94 | (.32 | ) | .91 | |||
| Distributions: | |||||||||
| Dividends from investment income—net | (.00 | )b | (.06 | ) | — | (.02 | ) | (.02 | ) |
| Dividends from net realized | |||||||||
| gain on investments | (1.41 | ) | (1.05 | ) | — | — | — | ||
| Total Distributions | (1.41 | ) | (1.11 | ) | — | (.02 | ) | (.02 | ) |
| Settlement payment from | |||||||||
| unaffiliated third party | — | — | — | — | .01 | ||||
| Net asset value, end of period | 8.84 | 8.96 | 7.44 | 6.50 | 6.84 | ||||
| Total Return (%)c | 14.49 | 36.02 | 14.46 | (4.73 | ) | 15.60 | d | ||
| Ratios/Supplemental Data (%): | |||||||||
| Ratio of total expenses | |||||||||
| to average net assets | 1.51 | 1.50 | 1.57 | 1.47 | 1.66 | ||||
| Ratio of net expenses | |||||||||
| to average net assets | 1.15 | 1.19 | 1.49 | 1.47 | 1.51 | ||||
| Ratio of net investment income | |||||||||
| (loss) to average net assets | .12 | .29 | .28 | (.24 | ) | (.13 | ) | ||
| Portfolio Turnover Rate | 91.53 | 76.66 | 61.52 | 58.58 | 63.42 | ||||
| Net Assets, end of period ($ x 1,000) | 6,878 | 1,906 | 1,149 | 670 | 475 | ||||
| a Based on average shares outstanding. |
| b Amount represents less than $.01 per share. |
| c Exclusive of sales charge. |
| d If settlement payment from unaffiliated third party was not made, total return would have been 15.43%. |
See notes to financial statements.
The Fund 17
FINANCIAL HIGHLIGHTS (continued)
| Year Ended December 31, | ||||||||||
| Class C Shares | 2014 | 2013 | 2012 | 2011 | 2010 | |||||
| Per Share Data ($): | ||||||||||
| Net asset value, beginning of period | 8.82 | 7.34 | 6.45 | 6.83 | 5.95 | |||||
| Investment Operations: | ||||||||||
| Investment (loss)—neta | (.05 | ) | (.04 | ) | (.04 | ) | (.07 | ) | (.05 | ) |
| Net realized and unrealized | ||||||||||
| gain (loss) on investments | 1.24 | 2.57 | .93 | (.31 | ) | .93 | ||||
| Total from Investment Operations | 1.19 | 2.53 | .89 | (.38 | ) | .88 | ||||
| Distributions: | ||||||||||
| Dividends from investment income—net | — | — | — | — | (.01 | ) | ||||
| Dividends from net realized | ||||||||||
| gain on investments | (1.41 | ) | (1.05 | ) | — | — | — | |||
| Total Distributions | (1.41 | ) | (1.05 | ) | — | — | (.01 | ) | ||
| Settlement payment from | ||||||||||
| unaffiliated third party | — | — | — | — | .01 | |||||
| Net asset value, end of period | 8.60 | 8.82 | 7.34 | 6.45 | 6.83 | |||||
| Total Return (%)b | 13.66 | 34.92 | 13.80 | (5.56 | ) | 15.10 | c | |||
| Ratios/Supplemental Data (%): | ||||||||||
| Ratio of total expenses | ||||||||||
| to average net assets | 2.29 | 2.31 | 2.57 | 2.42 | 2.16 | |||||
| Ratio of net expenses | ||||||||||
| to average net assets | 1.90 | 1.90 | 2.26 | 2.25 | 2.16 | |||||
| Ratio of net investment (loss) | ||||||||||
| to average net assets | (.60 | ) | (.42 | ) | (.51 | ) | (1.02 | ) | (.81 | ) |
| Portfolio Turnover Rate | 91.53 | 76.66 | 61.52 | 58.58 | 63.42 | |||||
| Net Assets, end of period ($ x 1,000) | 1,635 | 315 | 159 | 209 | 52 | |||||
| a Based on average shares outstanding. |
| b Exclusive of sales charge. |
| c If settlement payment from unaffiliated third party was not made, total return would have been 14.76%. |
See notes to financial statements.
18
| Year Ended December 31, | ||||||||||
| Class I Shares | 2014 | 2013 | 2012 | 2011 | 2010 | |||||
| Per Share Data ($): | ||||||||||
| Net asset value, beginning of period | 9.16 | 7.61 | 6.64 | 6.97 | 6.03 | |||||
| Investment Operations: | ||||||||||
| Investment income—neta | .03 | .05 | .05 | .02 | .03 | |||||
| Net realized and unrealized | ||||||||||
| gain (loss) on investments | 1.32 | 2.66 | .94 | (.31 | ) | .94 | ||||
| Total from Investment Operations | 1.35 | 2.71 | .99 | (.29 | ) | .97 | ||||
| Distributions: | ||||||||||
| Dividends from investment income—net | (.03 | ) | (.11 | ) | (.02 | ) | (.04 | ) | (.04 | ) |
| Dividends from net realized | ||||||||||
| gain on investments | (1.41 | ) | (1.05 | ) | — | — | — | |||
| Total Distributions | (1.44 | ) | (1.16 | ) | (.02 | ) | (.04 | ) | (.04 | ) |
| Settlement payment from | ||||||||||
| unaffiliated third party | — | — | — | — | .01 | |||||
| Net asset value, end of period | 9.07 | 9.16 | 7.61 | 6.64 | 6.97 | |||||
| Total Return (%) | 14.79 | 36.40 | 14.93 | (4.23 | ) | 16.34 | b | |||
| Ratios/Supplemental Data (%): | ||||||||||
| Ratio of total expenses | ||||||||||
| to average net assets | 1.15 | 1.14 | 1.11 | 1.00 | .92 | |||||
| Ratio of net expenses | ||||||||||
| to average net assets | .90 | .93 | 1.05 | .97 | .88 | |||||
| Ratio of net investment income | ||||||||||
| to average net assets | .32 | .55 | .64 | .24 | .47 | |||||
| Portfolio Turnover Rate | 91.53 | 76.66 | 61.52 | 58.58 | 63.42 | |||||
| Net Assets, end of period ($ x 1,000) | 25,055 | 26,328 | 25,967 | 38,356 | 56,083 | |||||
| a Based on average shares outstanding. |
| b If settlement payment from unaffiliated third party was not made, total return would have been 16.18%. |
See notes to financial statements.
The Fund 19
NOTES TO FINANCIAL STATEMENTS
NOTE 1—Significant Accounting Policies:
Dreyfus Large Cap Growth Fund (the “fund”) is a separate diversified series of Dreyfus Premier Investment Funds, Inc. (the “Company”), which is registered under the Investment Company Act of 1940, as amended (the “Act”), as an open-end management investment company and operates as a series company currently offering eight series, including the fund. The fund’s investment objective seeks to provide long-term capital appreciation. The Dreyfus Corporation (the “Manager” or “Dreyfus”), a wholly-owned subsidiary of The Bank of New York Mellon Corporation (“BNY Mellon”), serves as the fund’s investment adviser.
MBSC Securities Corporation (the “Distributor”), a wholly-owned subsidiary of the Manager, is the distributor of the fund’s shares. The fund is authorized to issue 250 million shares of $.001 par value Common Stock.The fund currently offers three classes of shares: Class A (100 million shares authorized), Class C (50 million shares authorized) and Class I (100 million shares authorized). Class A shares generally are subject to a sales charge imposed at the time of purchase. Class C shares are subject to a contingent deferred sales charge (“CDSC”) imposed on Class C shares redeemed within one year of purchase. Class I shares are sold at net asset value per share generally to institutional investors. Other differences between the classes include the services offered to and the expenses borne by each class, the allocation of certain transfer agency costs, and certain voting rights. Income, expenses (other than expenses attributable to a specific class), and realized and unrealized gains or losses on investments are allocated to each class of shares based on its relative net assets.
The Company accounts separately for the assets, liabilities and operations of each series. Expenses directly attributable to each series are charged to that series’ operations; expenses which are applicable to all series are allocated among them on a pro rata basis.
The Financial Accounting Standards Board (“FASB”) Accounting Standards Codification (“ASC”) is the exclusive reference of authoritative U.S. generally accepted accounting principles (“GAAP”) recognized
20
by the FASB to be applied by nongovernmental entities. Rules and interpretive releases of the Securities and Exchange Commission (“SEC”) under authority of federal laws are also sources of authoritative GAAP for SEC registrants. The fund’s financial statements are prepared in accordance with GAAP, which may require the use of management estimates and assumptions. Actual results could differ from those estimates.
The Company enters into contracts that contain a variety of indemnifications. The fund’s maximum exposure under these arrangements is unknown.The fund does not anticipate recognizing any loss related to these arrangements.
(a) Portfolio valuation: The fair value of a financial instrument is the amount that would be received to sell an asset or paid to transfer a liability in an orderly transaction between market participants at the measurement date (i.e., the exit price). GAAP establishes a fair value hierarchy that pri-oritizes the inputs of valuation techniques used to measure fair value.This hierarchy gives the highest priority to unadjusted quoted prices in active markets for identical assets or liabilities (Level 1 measurements) and the lowest priority to unobservable inputs (Level 3 measurements).
Additionally, GAAP provides guidance on determining whether the volume and activity in a market has decreased significantly and whether such a decrease in activity results in transactions that are not orderly. GAAP requires enhanced disclosures around valuation inputs and techniques used during annual and interim periods.
Various inputs are used in determining the value of the fund’s investments relating to fair value measurements.These inputs are summarized in the three broad levels listed below:
Level 1—unadjusted quoted prices in active markets for identical investments.
Level 2—other significant observable inputs (including quoted prices for similar investments, interest rates, prepayment speeds, credit risk, etc.).
Level 3—significant unobservable inputs (including the fund’s own assumptions in determining the fair value of investments).
The Fund 21
NOTES TO FINANCIAL STATEMENTS (continued)
The inputs or methodology used for valuing securities are not necessarily an indication of the risk associated with investing in those securities.
Changes in valuation techniques may result in transfers in or out of an assigned level within the disclosure hierarchy. Valuation techniques used to value the fund’s investments are as follows:
Investments in securities are valued at the last sales price on the securities exchange or national securities market on which such securities are primarily traded. Securities listed on the National Market System for which market quotations are available are valued at the official closing price or, if there is no official closing price that day, at the last sales price. For open short positions, asked prices are used for valuation purposes. Bid price is used when no asked price is available. Registered investment companies that are not traded on an exchange are valued at their net asset value.All of the preceding securities are generally categorized within Level 1 of the fair value hierarchy.
Securities not listed on an exchange or the national securities market, or securities for which there were no transactions, are valued at the average of the most recent bid and asked prices. These securities are generally categorized within Level 2 of the fair value hierarchy.
Fair valuing of securities may be determined with the assistance of a pricing service using calculations based on indices of domestic securities and other appropriate indicators, such as prices of relevant American Depositary Receipts and financial futures. Utilizing these techniques may result in transfers between Level 1 and Level 2 of the fair value hierarchy.
When market quotations or official closing prices are not readily available, or are determined not to reflect accurately fair value, such as when the value of a security has been significantly affected by events after the close of the exchange or market on which the security is principally traded (for example, a foreign exchange or market), but before the fund calculates its net asset value, the fund may value these investments at fair value as determined in accordance with the procedures approved by the Company’s Board of Directors (the “Board”).
22
Certain factors may be considered when fair valuing investments such as: fundamental analytical data, the nature and duration of restrictions on disposition, an evaluation of the forces that influence the market in which the securities are purchased and sold, and public trading in similar securities of the issuer or comparable issuers. These securities are either categorized within Level 2 or 3 of the fair value hierarchy depending on the relevant inputs used.
For restricted securities where observable inputs are limited, assumptions about market activity and risk are used and are generally categorized within Level 3 of the fair value hierarchy.
The following is a summary of the inputs used as of December 31, 2014 in valuing the fund’s investments:
| Level 2—Other | Level 3— | |||
| Level 1— | Significant | Significant | ||
| Unadjusted | Observable | Unobservable | ||
| Quoted Prices | Inputs | Inputs | Total | |
| Assets ($) | ||||
| Investments in Securities: | ||||
| Equity Securities— | ||||
| Domestic | ||||
| Common Stocks† | 32,220,963 | — | — | 32,220,963 |
| Equity Securities— | ||||
| Foreign | ||||
| Common Stocks† | 437,868 | — | — | 437,868 |
| Mutual Funds | 1,807,094 | — | — | 1,807,094 |
| † See Statement of Investments for additional detailed categorizations. | ||||
At December 31, 2014, there were no transfers between Level 1 and Level 2 of the fair value hierarchy.
(b) Securities transactions and investment income: Securities transactions are recorded on a trade date basis. Realized gains and losses from securities transactions are recorded on the identified cost basis. Dividend income is recognized on the ex-dividend date and interest income, including, where applicable, accretion of discount and amortization of premium on investments, is recognized on the accrual basis.
The Fund 23
NOTES TO FINANCIAL STATEMENTS (continued)
Pursuant to a securities lending agreement with The Bank of New York Mellon, a subsidiary of BNY Mellon and an affiliate of Dreyfus, the fund may lend securities to qualified institutions. It is the fund’s policy that, at origination, all loans are secured by collateral of at least 102% of the value of U.S. securities loaned and 105% of the value of foreign securities loaned. Collateral equivalent to at least 100% of the market value of securities on loan is maintained at all times. Collateral is either in the form of cash, which can be invested in certain money market mutual funds managed by the Manager or U.S. Government and Agency securities. The fund is entitled to receive all dividends, interest and distributions on securities loaned, in addition to income earned as a result of the lending transaction. Should a borrower fail to return the securities in a timely manner, The Bank of New York Mellon is required to replace the securities for the benefit of the fund or credit the fund with the market value of the unreturned securities and is subrogated to the fund’s rights against the borrower and the collateral. During the period ended December 31, 2014,The Bank of NewYork Mellon earned $536 from lending portfolio securities, pursuant to the securities lending agreement.
(c) Affiliated issuers: Investments in other investment companies advised by Dreyfus are defined as “affiliated” under the Act. Investments in affiliated investment companies during the period ended December 31, 2014 were as follows:
| Affiliated | |||||
| Investment | Value | Value | Net | ||
| Company | 12/31/2013 ($) | Purchases ($) | Sales ($) | 12/31/2014 ($) | Assets (%) |
| Dreyfus | |||||
| Institutional | |||||
| Preferred | |||||
| Plus Money | |||||
| Market Fund | 135,292 | 9,665,857 | 8,988,371 | 812,778 | 2.4 |
| Dreyfus | |||||
| Institutional | |||||
| Cash Advantage | |||||
| Fund | 55,575 | 10,162,400 | 9,223,659 | 994,316 | 3.0 |
| Total | 190,867 | 19,828,257 | 18,212,030 | 1,807,094 | 5.4 |
24
(d) Dividends to shareholders: Dividends are recorded on the ex-dividend date. Dividends from investment income-net and dividends from net realized capital gains, if any, are normally declared and paid annually, but the fund may make distributions on a more frequent basis to comply with the distribution requirements of the Internal Revenue Code of 1986, as amended (the “Code”). To the extent that net realized capital gains can be offset by capital loss carryovers, it is the policy of the fund not to distribute such gains. Income and capital gain distributions are determined in accordance with income tax regulations, which may differ from GAAP.
(e) Federal income taxes: It is the policy of the fund to continue to qualify as a regulated investment company, if such qualification is in the best interests of its shareholders, by complying with the applicable provisions of the Code, and to make distributions of taxable income sufficient to relieve it from substantially all federal income and excise taxes.
As of and during the period ended December 31, 2014, the fund did not have any liabilities for any uncertain tax positions.The fund recognizes interest and penalties, if any, related to uncertain tax positions as income tax expense in the Statement of Operations. During the period ended December 31, 2014, the fund did not incur any interest or penalties.
Each tax year in the four-year period ended December 31, 2014 remains subject to examination by the Internal Revenue Service and state taxing authorities.
At December 31, 2014, the components of accumulated earnings on a tax basis were as follows: undistributed ordinary income $52,937, undistributed capital gains $315,433 and unrealized appreciation $8,057,269.
The tax character of distributions paid to shareholders during the fiscal periods ended December 31, 2014 and December 31, 2013 were as follows: ordinary income $1,807,763 and $1,274,249, and long-term capital gains $2,851,252 and $2,151,096, respectively.
The Fund 25
NOTES TO FINANCIAL STATEMENTS (continued)
NOTE 2—Bank Lines of Credit:
The fund participates with other Dreyfus-managed funds in a $430 million unsecured credit facility led by Citibank, N.A. and a $300 million unsecured credit facility provided by The Bank of New York Mellon (each, a “Facility”), each to be utilized primarily for temporary or emergency purposes, including the financing of redemptions. Prior to October 8, 2014, the unsecured credit facility with Citibank, N.A. was $265 million. In connection therewith, the fund has agreed to pay its pro rata portion of commitment fees for each Facility. Interest is charged to the fund based on rates determined pursuant to the terms of the respective Facility at the time of borrowing. During the period ended December 31, 2014, the fund did not borrow under the Facilities.
NOTE 3—Management Fee and Other Transactions with Affiliates:
(a) Pursuant to a management agreement with the Manager, the management fee is computed at an annual rate of .70% of the value of the fund’s average daily net assets and is payable monthly.The Manager has agreed, from January 1, 2014 through May 1, 2015, to waive receipt of its fees and/or assume the expenses of the fund so that the expenses of none of the classes (excluding Rule 12b-1 Distribution Plan fees, Shareholder Services Plan fees, taxes, interest expense, brokerage commissions, commitment fees on borrowings and extraordinary expenses) exceed .90% of the value of the fund’s average daily net assets. The reduction in expenses, pursuant to the undertaking, amounted to $78,264 during the period ended December 31, 2014.
During the period ended December 31, 2014, the Distributor retained $5,279 from commissions earned on sales of the fund’s Class A shares.
(b) Under the Distribution Plan adopted pursuant to Rule 12b-1 under the Act, Class C shares pay the Distributor for distributing its shares at an annual rate of .75% of the value of its average daily net assets. During the period ended December 31, 2014, Class C shares were charged $4,472 pursuant to the Distribution Plan.
26
(c) Under the Shareholder Services Plan, Class A and Class C shares pay the Distributor at an annual rate of .25% of the value of their average daily net assets for the provision of certain services.The services provided may include personal services relating to shareholder accounts, such as answering shareholder inquiries regarding the fund and providing reports and other information, and services related to the maintenance of shareholder accounts.The Distributor may make payments to Service Agents (securities dealers, financial institutions or other industry professionals) with respect to these services.The Distributor determines the amounts to be paid to Service Agents. During the period ended December 31, 2014, Class A and Class C shares were charged $8,794 and $1,490, respectively, pursuant to the Shareholder Services Plan.
The fund has arrangements with the transfer agent and the custodian whereby the fund may receive earnings credits when positive cash balances are maintained, which are used to offset transfer agency and custody fees. For financial reporting purposes, the fund includes net earnings credits as an expense offset in the Statement of Operations.
The fund compensates Dreyfus Transfer, Inc., a wholly-owned subsidiary of the Manager, under a transfer agency agreement for providing transfer agency and cash management services for the fund. The majority of transfer agency fees are comprised of amounts paid on a per account basis, while cash management fees are related to fund subscriptions and redemptions. During the period ended December 31, 2014, the fund was charged $8,902 for transfer agency services and $428 for cash management services.These fees are included in Shareholder servicing costs in the Statement of Operations. Cash management fees were partially offset by earnings credits of $25.
The fund compensates The Bank of New York Mellon under a custody agreement for providing custodial services for the fund. These fees are determined based on net assets, geographic region and transaction activity. During the period ended December 31, 2014, the fund was charged $11,108 pursuant to the custody agreement.
The Fund 27
NOTES TO FINANCIAL STATEMENTS (continued)
During the period ended December 31, 2014, the fund was charged $7,771 for services performed by the Chief Compliance Officer and his staff.
The components of “Due to The Dreyfus Corporation and affiliates” in the Statement of Assets and Liabilities consist of: management fees $19,711, Distribution Plan fees $975, Shareholder Services Plan fees $1,739, custodian fees $5,889, Chief Compliance Officer fees $1,851 and transfer agency fees $1,881, which are offset against an expense reimbursement currently in effect in the amount of $6,865.
(d) Each Board member also serves as a Board member of other funds within the Dreyfus complex. Annual retainer fees and attendance fees are allocated to each fund based on net assets.
NOTE 4—Securities Transactions:
The aggregate amount of purchases and sales of investment securities, excluding short-term securities, during the period ended December 31, 2014, amounted to $26,910,720 and $26,557,570, respectively.
At December 31, 2014, the cost of investments for federal income tax purposes was $26,408,656; accordingly, accumulated net unrealized appreciation on investments was $8,057,269, consisting of $8,549,964 gross unrealized appreciation and $492,695 gross unrealized depreciation.
28
REPORT OF INDEPENDENT REGISTERED
PUBLIC ACCOUNTING FIRM
Shareholders and Board of Directors
Dreyfus Large Cap Growth Fund
We have audited the accompanying statement of assets and liabilities, including the statement of investments, of Dreyfus Large Cap Growth Fund (one of the series comprising Dreyfus Premier Investment Funds, Inc.) as of December 31, 2014, and the related statement of operations for the year then ended, the statement of changes in net assets for each of the two years in the period then ended, and the financial highlights for each of the five years in the period then ended.These financial statements and financial highlights are the responsibility of the Fund’s management. Our responsibility is to express an opinion on these financial statements and financial highlights based on our audits.
We conducted our audits in accordance with the standards of the Public Company Accounting Oversight Board (United States). Those standards require that we plan and perform the audit to obtain reasonable assurance about whether the financial statements and financial highlights are free of material misstatement. We were not engaged to perform an audit of the Fund’s internal control over financial reporting. Our audits included consideration of internal control over financial reporting as a basis for designing audit procedures that are appropriate in the circumstances, but not for the purpose of expressing an opinion on the effectiveness of the Fund’s internal control over financial reporting. Accordingly, we express no such opinion. An audit also includes examining, on a test basis, evidence supporting the amounts and disclosures in the financial statements and financial highlights, assessing the accounting principles used and significant estimates made by management, and evaluating the overall financial statement presentation. Our procedures included confirmation of securities owned as of December 31, 2014 by correspondence with the custodian and others.We believe that our audits provide a reasonable basis for our opinion.
In our opinion, the financial statements and financial highlights referred to above present fairly, in all material respects, the financial position of Dreyfus Large Cap Growth Fund at December 31, 2014, the results of its operations for the year then ended, the changes in its net assets for each of the two years in the period then ended, and the financial highlights for each of the five years in the period then ended, in conformity with U.S. generally accepted accounting principles.
![]()
New York, New York
February 26, 2015
The Fund 29
IMPORTANT TAX INFORMATION (Unaudited)
In accordance with federal tax law, the fund hereby reports 23.49% of the ordinary dividends paid during the fiscal year ended December 31, 2014 as qualifying for the corporate dividends received deduction. For the fiscal year ended December 31, 2014, certain dividends paid by the fund may be subject to a maximum tax rate of 15%, as provided for by the Jobs and Growth Tax Relief Reconciliation Act of 2003. Of the distributions paid during the fiscal year, $352,975 represents the maximum amount that may be considered qualified dividend income. Shareholders will receive notification in early 2015 of the percentage applicable to the preparation of their 2014 income tax returns. Also, the fund hereby reports $.0712 per share as a short-term capital gain distribution and $.0791 per share as a long-term capital gain distribution paid on March 17, 2014 and the fund also reports $.4640 per share as a short-term capital gain distribution and $.7981 per share as a long-term capital gain distribution paid on December 19, 2014.
30
| BOARD MEMBERS INFORMATION (Unaudited) |
| INDEPENDENT BOARD MEMBERS |
| Joseph S. DiMartino (71) |
| Chairman of the Board (1995) |
| Principal Occupation During Past 5Years: |
| • Corporate Director and Trustee (1995-present) |
| Other Public Company Board Memberships During Past 5Years: |
| • CBIZ (formerly, Century Business Services, Inc.), a provider of outsourcing functions for small |
| and medium size companies, Director (1997-present) |
| • The Newark Group, a provider of a national market of paper recovery facilities, paperboard |
| mills and paperboard converting plants, Director (2000-2010) |
| • Sunair Services Corporation, a provider of certain outdoor-related services to homes and |
| businesses, Director (2005-2009) |
| No. of Portfolios for which Board Member Serves: 146 |
| ——————— |
| Peggy C. Davis (71) |
| Board Member (2012) |
| Principal Occupation During Past 5Years: |
| • Shad Professor of Law, New York University School of Law (1983-present) |
| No. of Portfolios for which Board Member Serves: 52 |
| ——————— |
| David P. Feldman (75) |
| Board Member (1991) |
| Principal Occupation During Past 5Years: |
| • Corporate Director and Trustee (1985-present) |
| Other Public Company Board Membership During Past 5Years: |
| • BBH Mutual Funds Group (5 registered mutual funds), Director (1992-present) |
| No. of Portfolios for which Board Member Serves: 38 |
| ——————— |
| Ehud Houminer (74) |
| Board Member (2012) |
| Principal Occupation During Past 5Years: |
| • Executive-in-Residence at the Columbia Business School, Columbia University (1992-present) |
| Other Public Company Board Membership During Past 5Years: |
| • Avnet, Inc., an electronics distributor, Director (1993-2012) |
| No. of Portfolios for which Board Member Serves: 62 |
The Fund 31
| BOARD MEMBERS INFORMATION (Unaudited) (continued) |
| INDEPENDENT BOARD MEMBERS (continued) |
| Lynn Martin (75) |
| Board Member (1994) |
| Principal Occupation During Past 5Years: |
| • President of The Martin Hall Group LLC, a human resources consulting firm (2005-2012) |
| Other Public Company Board Memberships During Past 5Years: |
| • AT&T, Inc., a telecommunications company, Director (1999-2012) |
| • Ryder System, Inc., a supply chain and transportation management company, Director (1993-2012) |
| • The Proctor & Gamble Co., a consumer products company, Director (1994-2009) |
| • Constellation Energy Group Inc., Director (2003-2009) |
| No. of Portfolios for which Board Member Serves: 38 |
| ——————— |
| Robin A. Melvin (51) |
| Board Member (2011) |
| Principal Occupation During Past 5Years: |
| • Board Member, Illinois Mentoring Partnership, non-profit organization dedicated to increasing |
| the quantity and quality of mentoring services in Illinois (2013-present) |
| • Director, Boisi Family Foundation, a private family foundation that supports youth-serving orga- |
| nizations that promote the self sufficiency of youth from disadvantaged circumstances (1995-2012) |
| No. of Portfolios for which Board Member Serves: 114 |
| ——————— |
| Dr. Martin Peretz (75) |
| Board Member (2012) |
| Principal Occupation During Past 5Years: |
| • Editor-in-Chief Emeritus of The New Republic Magazine (2010-2011) (previously, |
| Editor-in-Chief, 1974-2010) |
| • Director of TheStreet.com, a financial information service on the web (1996-2010) |
| No. of Portfolios for which Board Member Serves: 38 |
| ——————— |
| Once elected all Board Members serve for an indefinite term, but achieve Emeritus status upon reaching age 80.The |
| address of the Board Members and Officers is c/o The Dreyfus Corporation, 200 Park Avenue, NewYork, NewYork |
| 10166.Additional information about the Board Members is available in the fund’s Statement of Additional Information |
| which can be obtained from Dreyfus free of charge by calling this toll free number: 1-800-DREYFUS. |
| Daniel Rose, Emeritus Board Member |
| Philip L.Toia, Emeritus Board Member |
| Sander Vanocur, Emeritus Board Member |
32
OFFICERS OF THE FUND (Unaudited)
BRADLEY J. SKAPYAK, President since January 2010.
Chief Operating Officer and a director of the Manager since June 2009, Chairman of Dreyfus Transfer, Inc., an affiliate of the Manager and the transfer agent of the funds, since May 2011 and Executive Vice President of the Distributor since June 2007. From April 2003 to June 2009, Mr. Skapyak was the head of the Investment Accounting and Support Department of the Manager. He is an officer of 69 investment companies (comprised of 146 portfolios) managed by the Manager. He is 56 years old and has been an employee of the Manager since February 1988.
JOHN PAK, Chief Legal Officer since March 2013.
Deputy General Counsel, Investment Management, of BNY Mellon since August 2014; Chief Legal Officer of the Manager since August 2012; from March 2005 to July 2012, Managing Director of Deutsche Bank, Deputy Global Head of Deutsche Asset Management Legal and Regional Head of Deutsche Asset Management Americas Legal. He is an officer of 70 investment companies (comprised of 171 portfolios) managed by the Manager. He is 46 years old and has been an employee of the Manager since August 2012.
JANETTE E. FARRAGHER, Vice President and Secretary since December 2011.
Assistant General Counsel of BNY Mellon, and an officer of 70 investment companies (comprised of 171 portfolios) managed by the Manager. She is 52 years old and has been an employee of the Manager since February 1984.
KIESHA ASTWOOD, Vice President and Assistant Secretary since January 2010.
Counsel of BNY Mellon, and an officer of 70 investment companies (comprised of 171 portfolios) managed by the Manager. She is 41 years old and has been an employee of the Manager since July 1995.
JAMES BITETTO, Vice President and Assistant Secretary since August 2005.
Managing Counsel of BNY Mellon and Secretary of the Manager, and an officer of 70 investment companies (comprised of 171 portfolios) managed by the Manager. He is 48 years old and has been an employee of the Manager since December 1996.
JONI LACKS CHARATAN, Vice President and Assistant Secretary since August 2005.
Managing Counsel of BNY Mellon, and an officer of 70 investment companies (comprised of 171 portfolios) managed by the Manager. She is 59 years old and has been an employee of the Manager since October 1988.
JOSEPH M. CHIOFFI, Vice President and Assistant Secretary since August 2005.
Managing Counsel of BNY Mellon, and an officer of 70 investment companies (comprised of 171 portfolios) managed by the Manager. He is 53 years old and has been an employee of the Manager since June 2000.
JOHN B. HAMMALIAN, Vice President and Assistant Secretary since August 2005.
Senior Managing Counsel of BNY Mellon, and an officer of 70 investment companies (comprised of 171 portfolios) managed by the Manager. He is 51 years old and has been an employee of the Manager since February 1991.
SARAH S. KELLEHER, Vice President and Assistant Secretary since April 2014.
Senior Counsel of BNY Mellon, and an officer of 70 investment companies (comprised of 171 portfolios) managed by the Manager; from August 2005 to March 2013, Associate General Counsel of Third Avenue Management. She is 39 years old and has been an employee of the Manager since March 2013.
The Fund 33
OFFICERS OF THE FUND (Unaudited) (continued)
JEFF PRUSNOFSKY, Vice President and Assistant Secretary since August 2005.
Senior Managing Counsel of BNY Mellon, and an officer of 70 investment companies (comprised of 171 portfolios) managed by the Manager. He is 49 years old and has been an employee of the Manager since October 1990.
JAMES WINDELS, Treasurer since November 2001.
Director – Mutual Fund Accounting of the Manager, and an officer of 70 investment companies (comprised of 171 portfolios) managed by the Manager. He is 56 years old and has been an employee of the Manager since April 1985.
RICHARD CASSARO, Assistant Treasurer since January 2008.
Senior Accounting Manager – Money Market and Municipal Bond Funds of the Manager, and an officer of 70 investment companies (comprised of 171 portfolios) managed by the Manager. He is 55 years old and has been an employee of the Manager since September 1982.
GAVIN C. REILLY, Assistant Treasurer since December 2005.
Tax Manager of the Investment Accounting and Support Department of the Manager, and an officer of 70 investment companies (comprised of 171 portfolios) managed by the Manager. He is 46 years old and has been an employee of the Manager since April 1991.
ROBERT S. ROBOL, Assistant Treasurer since August 2005.
Senior Accounting Manager – Fixed Income Funds of the Manager, and an officer of 70 investment companies (comprised of 171 portfolios) managed by the Manager. He is 50 years old and has been an employee of the Manager since October 1988.
ROBERT SALVIOLO, Assistant Treasurer since July 2007.
Senior Accounting Manager – Equity Funds of the Manager, and an officer of 70 investment companies (comprised of 171 portfolios) managed by the Manager. He is 47 years old and has been an employee of the Manager since June 1989.
ROBERT SVAGNA, Assistant Treasurer since December 2002.
Senior Accounting Manager – Equity Funds of the Manager, and an officer of 70 investment companies (comprised of 171 portfolios) managed by the Manager. He is 47 years old and has been an employee of the Manager since November 1990.
JOSEPH W. CONNOLLY, Chief Compliance Officer since October 2004.
Chief Compliance Officer of the Manager and The Dreyfus Family of Funds (70 investment companies, comprised of 171 portfolios). He is 57 years old and has served in various capacities with the Manager since 1980, including manager of the firm’s Fund Accounting Department from 1997 through October 2001.
MATTHEW D. CONNOLLY, Anti-Money Laundering Compliance Officer since April 2012.
Anti-Money Laundering Compliance Officer of the Distributor since October 2011; from March 2010 to September 2011, Global Head, KYC Reviews and Director of UBS Investment Bank; until March 2010, AML Compliance Officer and Senior Vice President of Citi Global Wealth Management. He is an officer of 65 investment companies (comprised of 166 portfolios) managed by the Manager. He is 42 years old and has been an employee of the Distributor since October 2011.
34
NOTES
For More Information
| Telephone Call your financial representative or 1-800-DREYFUS |
| Mail The Dreyfus Family of Funds, 144 Glenn Curtiss Boulevard, Uniondale, NY 11556-0144 |
The fund files its complete schedule of portfolio holdings with the Securities and Exchange Commission (“SEC”) for the first and third quarters of each fiscal year on Form N-Q. The fund’s Forms N-Q are available on the SEC’s website at http://www.sec.gov and may be reviewed and copied at the SEC’s Public Reference Room in Washington, DC. Information on the operation of the Public Reference Room may be obtained by calling 1-800-SEC-0330.
A description of the policies and procedures that the fund uses to determine how to vote proxies relating to portfolio securities, and information regarding how the fund voted these proxies for the most recent 12-month period ended June 30 is available at http://www.dreyfus.com and on the SEC’s website at http://www.sec.gov. The description of the policies and procedures is also available without charge, upon request, by calling 1-800-DREYFUS.

Item 2. Code of Ethics.
The Registrant has adopted a code of ethics that applies to the Registrant's principal executive officer, principal financial officer, principal accounting officer or controller, or persons performing similar functions. There have been no amendments to, or waivers in connection with, the Code of Ethics during the period covered by this Report.
Item 3. Audit Committee Financial Expert.
The Registrant's Board has determined that David P. Feldman, a member of the Audit Committee of the Board, is an audit committee financial expert as defined by the Securities and Exchange Commission (the "SEC"). David P. Feldman is "independent" as defined by the SEC for purposes of audit committee financial expert determinations.
Item 4. Principal Accountant Fees and Services.
(a) Audit Fees. The aggregate fees billed for each of the last two fiscal years (the "Reporting Periods") for professional services rendered by the Registrant's principal accountant (the "Auditor") for the audit of the Registrant's annual financial statements or services that are normally provided by the Auditor in connection with the statutory and regulatory filings or engagements for the Reporting Periods, were $63,188 in 2013 and $64,452 in 2014.
(b) Audit-Related Fees. The aggregate fees billed in the Reporting Periods for assurance and related services by the Auditor that are reasonably related to the performance of the audit of the Registrant's financial statements and are not reported under paragraph (a) of this Item 4 were $12,000 in 2013 and $12,240 in 2014. These services consisted of one or more of the following: (i) agreed upon procedures related to compliance with Internal Revenue Code section 817(h), (ii) security counts required by Rule 17f-2 under the Investment Company Act of 1940, as amended, (iii) advisory services as to the accounting or disclosure treatment of Registrant transactions or events and (iv) advisory services to the accounting or disclosure treatment of the actual or potential impact to the Registrant of final or proposed rules, standards or interpretations by the Securities and Exchange Commission, the Financial Accounting Standards Boards or other regulatory or standard-setting bodies.
The aggregate fees billed in the Reporting Periods for non-audit assurance and related services by the Auditor to the Registrant's investment adviser (not including any sub-investment adviser whose role is primarily portfolio management and is subcontracted with or overseen by another investment adviser), and any entity controlling, controlled by or under common control with the investment adviser that provides ongoing services to the Registrant ("Service Affiliates"), that were reasonably related to the performance of the annual audit of the Service Affiliate, which required pre-approval by the Audit Committee were $-0- in 2013 and $-0- in 2014.
(c) Tax Fees. The aggregate fees billed in the Reporting Periods for professional services rendered by the Auditor for tax compliance, tax advice, and tax planning ("Tax Services") were $7,681 in 2013 and $5,914 in 2014. These services consisted of: (i) review or preparation of U.S. federal, state, local and excise tax returns; (ii) U.S. federal, state and local tax planning, advice and assistance regarding statutory, regulatory or administrative developments; (iii) tax advice regarding tax qualification matters and/or treatment of various financial instruments held or proposed to be acquired or held, and (iv) determination of Passive Foreign Investment Companies. The aggregate fees billed in the Reporting Periods for Tax Services by the Auditor to Service Affiliates, which required pre-approval by the Audit Committee were $-0- in 2013 and $-0- in 2014.
(d) All Other Fees. The aggregate fees billed in the Reporting Periods for products and services provided by the Auditor, other than the services reported in paragraphs (a) through (c) of this Item, were $119 in 2013 and $1,489 in 2014. These services consisted of a review of the Registrant's anti-money laundering program.
The aggregate fees billed in the Reporting Periods for Non-Audit Services by the Auditor to Service Affiliates, other than the services reported in paragraphs (b) through (c) of this Item, which required pre-approval by the Audit Committee, were $-0- in 2013 and $-0- in 2014.
(e)(1) Audit Committee Pre-Approval Policies and Procedures. The Registrant's Audit Committee has established policies and procedures (the "Policy") for pre-approval (within specified fee limits) of the Auditor's engagements for non-audit services to the Registrant and Service Affiliates without specific case-by-case consideration. The pre-approved services in the Policy can include pre-approved audit services, pre-approved audit-related services, pre-approved tax services and pre-approved all other services. Pre-approval considerations include whether the proposed services are compatible with maintaining the Auditor's independence. Pre-approvals pursuant to the Policy are considered annually.
(e)(2) Note: None of the services described in paragraphs (b) through (d) of this Item 4 were approved by the Audit Committee pursuant to paragraph (c)(7)(i)(C) of Rule 2-01 of Regulation S-X.
(f) None of the hours expended on the principal accountant's engagement to audit the registrant's financial statements for the most recent fiscal year were attributed to work performed by persons other than the principal account's full-time, permanent employees.
Non-Audit Fees. The aggregate non-audit fees billed by the Auditor for services rendered to the Registrant, and rendered to Service Affiliates, for the Reporting Periods were $50,384,343 in 2013 and $23,307,177 in 2014.
Auditor Independence. The Registrant's Audit Committee has considered whether the provision of non-audit services that were rendered to Service Affiliates, which were not pre-approved (not requiring pre-approval), is compatible with maintaining the Auditor's independence.
Item 5. Audit Committee of Listed Registrants.
Not applicable. [CLOSED-END FUNDS ONLY]
Item 6. Investments.
(a) Not applicable.
Item 7. Disclosure of Proxy Voting Policies and Procedures for Closed-End Management Investment Companies.
Not applicable. [CLOSED-END FUNDS ONLY]
Item 8. Portfolio Managers of Closed-End Management Investment Companies.
Not applicable. [CLOSED-END FUNDS ONLY, beginning with reports for periods ended
�� Affiliated Purchasers.
Not applicable. [CLOSED-END FUNDS ONLY]
Item 10. Submission of Matters to a Vote of Security Holders.
There have been no material changes to the procedures applicable to Item 10.
Item 11. Controls and Procedures.
(a) The Registrant's principal executive and principal financial officers have concluded, based on their evaluation of the Registrant's disclosure controls and procedures as of a date within 90 days of the filing date of this report, that the Registrant's disclosure controls and procedures are reasonably designed to ensure that information required to be disclosed by the Registrant on Form N-CSR is recorded, processed, summarized and reported within the required time periods and that information required to be disclosed by the Registrant in the reports that it files or submits on Form N-CSR is accumulated and communicated to the Registrant's management, including its principal executive and principal financial officers, as appropriate to allow timely decisions regarding required disclosure.
(b) There were no changes to the Registrant's internal control over financial reporting that occurred during the second fiscal quarter of the period covered by this report that have materially affected, or are reasonably likely to materially affect, the Registrant's internal control over financial reporting.
Item 12. Exhibits.
(a)(1) Code of ethics referred to in Item 2.
(a)(2) Certifications of principal executive and principal financial officers as required by Rule 30a-2(a) under the Investment Company Act of 1940.
(a)(3) Not applicable.
(b) Certification of principal executive and principal financial officers as required by Rule 30a-2(b) under the Investment Company Act of 1940.
SIGNATURES
Pursuant to the requirements of the Securities Exchange Act of 1934 and the Investment Company Act of 1940, the Registrant has duly caused this Report to be signed on its behalf by the undersigned, thereunto duly authorized.
Dreyfus Premier Investment Funds, Inc.
By: /s/ Bradley J. Skapyak
Bradley J. Skapyak,
President
Date: February 24, 2015
Pursuant to the requirements of the Securities Exchange Act of 1934 and the Investment Company Act of 1940, this Report has been signed below by the following persons on behalf of the Registrant and in the capacities and on the dates indicated.
By: /s/ Bradley J. Skapyak
Bradley J. Skapyak,
President
Date: February 24, 2015
By: /s/ James Windels
James Windels,
Treasurer
Date: February 24, 2015
EXHIBIT INDEX
(a)(1) Code of ethics referred to in Item 2.
(a)(2) Certifications of principal executive and principal financial officers as required by Rule 30a-2(a) under the Investment Company Act of 1940. (EX-99.CERT)
(b) Certification of principal executive and principal financial officers as required by Rule 30a-2(b) under the Investment Company Act of 1940. (EX-99.906CERT)
Revised as of January 1, 2010