UNITED STATES
SECURITIES AND EXCHANGE COMMISSION
Washington, D.C. 20549
FORM N-CSR
CERTIFIED SHAREHOLDER REPORT OF REGISTERED MANAGEMENT
INVESTMENT COMPANIES
Investment Company Act file number | 811- 6490 | |||||
|
| |||||
| Dreyfus Premier Investment Funds, Inc. |
| ||||
| (Exact name of Registrant as specified in charter) |
| ||||
|
|
| ||||
|
c/o The Dreyfus Corporation 200 Park Avenue New York, New York 10166 |
| ||||
| (Address of principal executive offices) (Zip code) |
| ||||
|
|
| ||||
| John Pak, Esq. 200 Park Avenue New York, New York 10166 |
| ||||
| (Name and address of agent for service) |
| ||||
| ||||||
Registrant's telephone number, including area code: | (212) 922-6000 | |||||
|
| |||||
Date of fiscal year end:
| 10/31 |
| ||||
Date of reporting period: | 10/31/13 |
| ||||
The following N-CSR relates only to the Registrant's series listed below and does not affect the other series of the Registrant, which has a different fiscal year end and, therefore, different N-CSR reporting requirements. A separate N-CSR Form will be filed for this series, as appropriate.
DREYFUS PREMIER INVESTMENT FUNDS, INC.
- Dreyfus Diversified International Fund
- Dreyfus Emerging Asia Fund
- Dreyfus India Fund
- Dreyfus Global Real Estate Securities Fund
- Dreyfus Greater China Fund
- Dreyfus Satellite Alpha Fund
| Dreyfus |
| Diversified |
| International Fund |
ANNUAL REPORT October 31, 2013
Save time. Save paper. View your next shareholder report online as soon as it’s available. Log into www.dreyfus.com and sign up for Dreyfus eCommunications. It’s simple and only takes a few minutes.
The views expressed in this report reflect those of the portfolio manager only through the end of the period covered and do not necessarily represent the views of Dreyfus or any other person in the Dreyfus organization. Any such views are subject to change at any time based upon market or other conditions and Dreyfus disclaims any responsibility to update such views.These views may not be relied on as investment advice and, because investment decisions for a Dreyfus fund are based on numerous factors, may not be relied on as an indication of trading intent on behalf of any Dreyfus fund.
| Not FDIC-Insured • Not Bank-Guaranteed • May Lose Value |
Contents | |
THE FUND | |
| 2 | A Letter from the President |
| 3 | Discussion of Fund Performance |
| 6 | Fund Performance |
| 8 | Understanding Your Fund’s Expenses |
| 8 | Comparing Your Fund’s Expenses With Those of Other Funds |
| 9 | Statement of Investments |
| 10 | Statement of Assets and Liabilities |
| 11 | Statement of Operations |
| 12 | Statement of Changes in Net Assets |
| 14 | Financial Highlights |
| 17 | Notes to Financial Statements |
| 26 | Report of Independent Registered Public Accounting Firm |
| 27 | Important Tax Information |
| 28 | Board Members Information |
| 30 | Officers of the Fund |
FOR MORE INFORMATION | |
Back Cover |
Dreyfus
Diversified
International Fund
The Fund
A LETTER FROM THE PRESIDENT
Dear Shareholder:
We are pleased to present this annual report for Dreyfus Diversified International Fund, covering the 12-month period from November 1, 2012, through October 31, 2013. For information about how the fund performed during the reporting period, as well as general market perspectives, we provide a Discussion of Fund Performance on the pages that follow.
Improving global economic conditions drove developed stock markets higher over much of the reporting period. Europe appeared to put the worst of its sovereign debt and banking crises behind it, and Japan embarked on a new economic course designed to reflate its long-stagnant domestic economy. However, the world’s emerging markets struggled with the effects of local economic slowdowns. As a result, equity market returns varied widely from one country to another over the past 12 months.
We currently expect global economic conditions to continue to improve in 2014, with stronger growth in many developed countries fueled by past and continuing monetary ease. The emerging markets seem poised for moderate economic expansion despite recently negative investor sentiment. In the United States, we anticipate accelerating growth supported by the fading drags of tighter federal fiscal policies and downsizing on the state and local levels. For more information on how these observations may affect your investments, we encourage you to speak with your financial advisor.
Thank you for your continued confidence and support.

J. Charles Cardona
President
The Dreyfus Corporation
November 15, 2013
2
DISCUSSION OF FUND PERFORMANCE
For the reporting period of November 1, 2012, through October 31, 2013, as provided by Richard B. Hoey and Keith L. Stransky, CFA, Portfolio Managers
Fund and Market Performance Overview
For the 12-month period ended October 31, 2013, Dreyfus Diversified International Fund’s Class A shares produced a total return of 21.29%, Class C shares returned 20.33%, and Class I shares returned 21.69%.1 This compares with a 26.88% total return for the fund’s benchmark, the Morgan Stanley Capital International Europe, Australasia, Far East Index (the “MSCI EAFE Index” or the “Index”), during the same period.2
Stocks in most developed markets responded positively to improved economic trends over the reporting period, but emerging markets equities generally struggled with slowing economic growth. Although the fund participated significantly in the international markets’ gains, it lagged the benchmark largely due to exposure to emerging markets that are not represented in the Index.
The Fund’s Investment Approach
The fund seeks long-term capital appreciation.To pursue its goal, the fund normally allocates its assets among other mutual funds advised by The Dreyfus Corporation or its affiliates, referred to as underlying funds, that invest primarily in stocks issued by foreign companies. The underlying funds are selected by the Dreyfus Investment Committee based on their investment objectives and management policies, portfolio holdings, risk/reward profiles, historical performance and other factors.The Dreyfus Investment Committee will rebalance the fund’s investments in the underlying funds at least annually, but may do so more often in response to market conditions. As of October 31, 2013, the fund’s investments were allocated as follows:
| Underlying Funds | (%) |
| International Stock Fund | 22.07 |
| Dreyfus International Equity Fund | 28.05 |
| Dreyfus/Newton International Equity Fund | 29.95 |
| Dreyfus International Value Fund | 11.04 |
| Dreyfus Emerging Markets Fund | 8.89 |
| The Fund | 3 |
DISCUSSION OF FUND PERFORMANCE (continued)
Many of the underlying funds tend to have relatively low measured volatility, which is reflected in a low measured volatility in the fund. This position may potentially cushion declines in weak markets, but during strong markets it may result in lesser gains, such as the period under review.
The fund had a significant investment in emerging markets.The outlook for emerging market stocks is a complex function of global growth, domestic growth, capital discipline, international flows and valuation.
Stocks Rallied in a Recovering Global Economy
Stock markets throughout the developed world rallied in response to the aggressively accommodative monetary policies adopted by many nations. In the United States, employment gains, rebounding housing markets, and a massive quantitative easing program helped drive major stock market indices to record highs. The worst of Europe’s financial crisis seems to be over, as evidenced by stronger economic data and rebounding stock prices in previously hard hit nations. Japan’s stock market was lifted by newly stimulative fiscal and monetary policies from a new government seeking to reflate the domestic economy. However, most emerging economies struggled with economic slowdowns, and resulting outflows of investment capital hurt local stock markets.
Emerging Markets Dampened Performance
The fund produced strong absolute returns during the reporting period, but its results lagged the MSCI EAFE Index due to relatively weak performance in the emerging markets, as Dreyfus Emerging Markets Fund weighed on relative performance. In addition, the fund encountered shortfalls in International Stock Fund, which underperformed developed market averages when its conservative investment approach fell out of favor in a rallying market. Although International Stock Fund’s higher quality portfolio exhibited less volatility than the overall market, its results were undermined by underweighted exposure to Europe and an overweighted position in the energy and consumer staples sectors.
On a more positive note, other underlying investments fared better than the benchmark. Dreyfus International Equity Fund produced especially strong results, buoyed by successful stock selections in the consumer discretionary, materials, and information technology sectors. Dreyfus International Value Fund also outperformed the benchmark on the strength of successful stock selections in Japan, Switzerland, and Australia.
4
Maintaining a Constructive Investment Posture
As of the reporting period’s end, we believe that global economic growth is likely to accelerate in 2014, which could support stock prices as monetary policies remain accommodative in most countries. In this improving macroeconomic environment, we expect market volatility to moderate compared to the relatively wide fluctuations experienced in 2013. Meanwhile, many emerging stock markets have become more attractively valued, suggesting that the performance disparity between developed and emerging markets is likely to narrow.
Consequently, we generally have maintained the fund’s existing allocations, including overweighted exposure to the emerging markets. However, in June 2013, we adjusted the fund’s developed market exposure by reducing its position in International Stock Fund and increasing exposure to Dreyfus/Newton International Equity Fund. In our view, this change positions the fund more constructively for greater participation in developed market gains.
November 15, 2013
Equity funds are subject generally to market, market sector, market liquidity, issuer and investment style risks, among other factors, to varying degrees, all of which are more fully described in the prospectus of the fund and that of each underlying fund.
The ability of the fund to achieve its investment goal depends, in part, on the ability of the Dreyfus Investment Committee to allocate effectively the fund’s assets among the underlying funds.There can be no assurance that the actual allocations will be effective in achieving the fund’s investment goal.
Each underlying fund’s performance will be influenced by political, social and economic factors affecting investments in foreign companies. Special risks associated with such companies include exposure to currency fluctuations, less liquidity, less developed or less efficient trading markets, lack of comprehensive company information, political instability and differing auditing and legal standards.These risks are higher in emerging market countries.
| 1 Total return includes reinvestment of dividends and any capital gains paid, and does not take into consideration the |
| maximum initial sales charge in the case of Class A shares, or the applicable contingent deferred sales charge imposed |
| on redemptions in the case of Class C shares. Had these charges been reflected, returns would have been lower. Past |
| performance is no guarantee of future results. Share price and investment return fluctuate such that upon redemption, |
| fund shares may be worth more or less than their original cost. Return figures provided reflect the absorption of certain |
| fund expenses pursuant to an agreement by The Dreyfus Corporation through March 1, 2014, at which time it may |
| be extended, terminated or modified. Had these expenses not been absorbed, the fund’s returns would have been lower. |
| 2 SOURCE: LIPPER INC. — Reflects reinvestment of net dividends and, where applicable, capital gain |
| distributions. The Morgan Stanley Capital International Europe, Australasia, Far East (MSCI EAFE) Index is an |
| unmanaged index composed of a sample of companies representative of the market structure of European and Pacific |
| Basin countries. |
| The Fund | 5 |
FUND PERFORMANCE
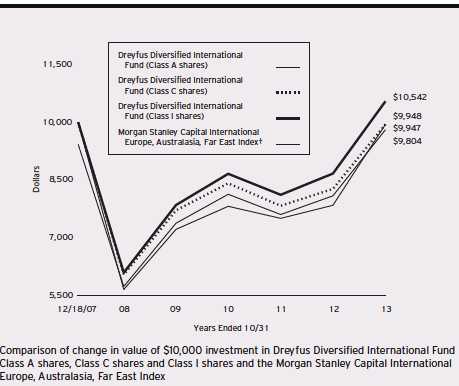
| † Source: Lipper Inc. |
| Past performance is not predictive of future performance. |
| The above graph compares a $10,000 investment made in each of the Class A, Class C and Class I shares of Dreyfus |
| Diversified International Fund on 12/18/07 (the fund’s inception date) to a $10,000 investment made in the Morgan |
| Stanley Capital International Europe,Australasia, Far East Index (the “Index”) on that date.All dividends and capital |
| gain distributions are reinvested. |
| The fund’s performance shown in the line graph above takes into account the maximum initial sales charge on Class A |
| shares and all other applicable fees and expenses on all classes.The Index is an unmanaged index composed of a sample |
| of companies representative of the market structure of European and Pacific Basin countries. Unlike a mutual fund, the |
| Index is not subject to charges, fees and other expenses. Investors cannot invest directly in any index. Further information |
| relating to fund performance, including expense reimbursements, if applicable, is contained in the Financial Highlights |
| section of the prospectus and elsewhere in this report. |
6
| Average Annual Total Returns as of 10/31/13 | |||||||
| Inception | From | ||||||
| Date | 1 Year | 5 Years | Inception | ||||
| Class A shares | |||||||
| with maximum sales charge (5.75%) | 12/18/07 | 14.28 | % | 10.06 | % | –0.34 | % |
| without sales charge | 12/18/07 | 21.29 | % | 11.36 | % | 0.67 | % |
| Class C shares | |||||||
| with applicable redemption charge † | 12/18/07 | 19.33 | % | 10.52 | % | –0.09 | % |
| without redemption | 12/18/07 | 20.33 | % | 10.52 | % | –0.09 | % |
| Class I shares | 12/18/07 | 21.69 | % | 11.61 | % | 0.90 | % |
| Morgan Stanley Capital International | |||||||
| Europe, Australasia, Far East Index | 12/31/07 | 26.88 | % | 11.99 | % | –0.09 | %†† |
Past performance is not predictive of future performance.The fund’s performance shown in the graph and table does not reflect the deduction of taxes that a shareholder would pay on fund distributions or the redemption of fund shares.
| † | The maximum contingent deferred sales charge for Class C shares is 1% for shares redeemed within one year of the |
| date of purchase. | |
| †† | For comparative purposes, the value of the Index as of 12/31/07 is used as the beginning value on 12/18/07. |
| The Fund | 7 |
UNDERSTANDING YOUR FUND’S EXPENSES (Unaudited)
As a mutual fund investor, you pay ongoing expenses, such as management fees and other expenses. Using the information below, you can estimate how these expenses affect your investment and compare them with the expenses of other funds.You also may pay one-time transaction expenses, including sales charges (loads) and redemption fees, which are not shown in this section and would have resulted in higher total expenses. For more information, see your fund’s prospectus or talk to your financial adviser.
Review your fund’s expenses
The table below shows the expenses you would have paid on a $1,000 investment in Dreyfus Diversified International Fund from May 1, 2013 to October 31, 2013. It also shows how much a $1,000 investment would be worth at the close of the period, assuming actual returns and expenses.
Expenses and Value of a $1,000 Investment
assuming actual returns for the six months ended October 31, 2013
| Class A | Class C | Class I | |
| Expenses paid per $1,000† | $1.56 | $5.49 | $.21 |
| Ending value (after expenses) | $1,057.00 | $1,053.40 | $1,058.70 |
COMPARING YOUR FUND’S EXPENSES
WITH THOSE OF OTHER FUNDS (Unaudited)
Using the SEC’s method to compare expenses
The Securities and Exchange Commission (SEC) has established guidelines to help investors assess fund expenses. Per these guidelines, the table below shows your fund’s expenses based on a $1,000 investment, assuming a hypothetical 5% annualized return. You can use this information to compare the ongoing expenses (but not transaction expenses or total cost) of investing in the fund with those of other funds.All mutual fund shareholder reports will provide this information to help you make this comparison. Please note that you cannot use this information to estimate your actual ending account balance and expenses paid during the period.
Expenses and Value of a $1,000 Investment
assuming a hypothetical 5% annualized return for the six months ended October 31, 2013
| Class A | Class C | Class I | |
| Expenses paid per $1,000† | $1.53 | $5.40 | $.20 |
| Ending value (after expenses) | $1,023.69 | $1,019.86 | $1,025.00 |
| † Expenses are equal to the fund’s annualized expense ratio of .30% for Class A, 1.06% for Class C and .04% for Class |
| I, multiplied by the average account value over the period, multiplied by 184/365 (to reflect the one-half year period). |
8
| STATEMENT OF INVESTMENTS |
| October 31, 2013 |
| Registered Investment Companies—99.8% | Shares | Value ($) | |
| Foreign Common Stocks | |||
| Dreyfus Emerging Markets Fund, Cl. I | 4,217,009 | a | 42,549,620 |
| Dreyfus International Equity Fund, Cl. I | 3,793,840 | a | 134,226,049 |
| Dreyfus International Value Fund, Cl. I | 4,165,044 | a | 52,812,751 |
| Dreyfus/Newton International Equity Fund, Cl. I | 6,959,662 | a | 143,299,437 |
| International Stock Fund, Cl. I | 6,699,356 | a | 105,648,846 |
| Total Investments (cost $352,712,942) | 99.8 | % | 478,536,703 |
| Cash and Receivables (Net) | .2 | % | 985,625 |
| Net Assets | 100.0 | % | 479,522,328 |
| a | Investment in affiliated mutual fund. |
| Portfolio Summary (Unaudited)† | |
| Value (%) | |
| Mutual Funds: Foreign | 99.8 |
| † Based on net assets. |
| See notes to financial statements. |
| The Fund | 9 |
| STATEMENT OF ASSETS AND LIABILITIES |
| October 31, 2013 |
| Cost | Value | ||
| Assets ($): | |||
| Investments in securities of affiliated issuers—See Statement of | |||
| Investments—Note 1(c) | 352,712,942 | 478,536,703 | |
| Cash | 862,994 | ||
| Receivable for shares of Common Stock subscribed | 402,754 | ||
| Receivable for investment securities sold | 106,319 | ||
| Prepaid expenses | 28,090 | ||
| 479,936,860 | |||
| Liabilities ($): | |||
| Due to The Dreyfus Corporation and affiliates—Note 3(c) | 11,941 | ||
| Payable for shares of Common Stock redeemed | 333,403 | ||
| Accrued expenses | 69,188 | ||
| 414,532 | |||
| Net Assets ($) | 479,522,328 | ||
| Composition of Net Assets ($): | |||
| Paid-in capital | 381,998,402 | ||
| Accumulated distributions in excess of investment income—net | (126,530 | ) | |
| Accumulated net realized gain (loss) on investments | (28,173,305 | ) | |
| Accumulated net unrealized appreciation | |||
| (depreciation) on investments | 125,823,761 | ||
| Net Assets ($) | 479,522,328 |
| Net Asset Value Per Share | |||
| Class A | Class C | Class I | |
| Net Assets ($) | 8,702,155 | 186,050 | 470,634,123 |
| Shares Outstanding | 744,710 | 15,973 | 40,172,852 |
| Net Asset Value Per Share ($) | 11.69 | 11.65 | 11.72 |
| See notes to financial statements. |
10
| STATEMENT OF OPERATIONS |
| Year Ended October 31, 2013 |
| Investment Income ($): | ||
| Income: | ||
| Cash dividends from affiliated issuers | 8,970,605 | |
| Expenses: | ||
| Professional fees | 79,251 | |
| Registration fees | 38,549 | |
| Directors’ fees and expenses—Note 3(d) | 35,920 | |
| Shareholder servicing costs—Note 3(c) | 34,216 | |
| Prospectus and shareholders’ reports | 11,048 | |
| Custodian fees—Note 3(c) | 4,173 | |
| Loan commitment fees—Note 2 | 3,562 | |
| Distribution fees—Note 3(b) | 1,089 | |
| Interest expense—Note 2 | 853 | |
| Miscellaneous | 19,798 | |
| Total Expenses | 228,459 | |
| Less—reduction in expenses due to undertaking—Note 3(a) | (5,615 | ) |
| Less—reduction in fees due to earnings credits—Note 3(c) | (19 | ) |
| Net Expenses | 222,825 | |
| Investment Income—Net | 8,747,780 | |
| Realized and Unrealized Gain (Loss) on Investments—Note 4 ($): | ||
| Net realized gain (loss) on investments in affiliated issuers | 3,891,226 | |
| Net unrealized appreciation (depreciation) on investments in affiliated issuers | 78,056,777 | |
| Net Realized and Unrealized Gain (Loss) on Investments | 81,948,003 | |
| Net Increase in Net Assets Resulting from Operations | 90,695,783 | |
| See notes to financial statements. | ||
| The Fund | 11 |
STATEMENT OF CHANGES IN NET ASSETS
| Year Ended October 31, | ||||
| 2013 | 2012 | |||
| Operations ($): | ||||
| Investment income—net | 8,747,780 | 9,036,846 | ||
| Net realized gain (loss) on | ||||
| investments in affiliated issuers | 3,891,226 | (26,269,067 | ) | |
| Net unrealized appreciation (depreciation) | ||||
| on investments in affiliated issuers | 78,056,777 | 43,344,469 | ||
| Net Increase (Decrease) in Net Assets | ||||
| Resulting from Operations | 90,695,783 | 26,112,248 | ||
| Dividends to Shareholders from ($): | ||||
| Investment income—net: | ||||
| Class A | (130,063 | ) | (194,199 | ) |
| Class C | (108 | ) | (5,620 | ) |
| Class I | (8,676,444 | ) | (9,324,691 | ) |
| Total Dividends | (8,806,615 | ) | (9,524,510 | ) |
| Capital Stock Transactions ($): | ||||
| Net proceeds from shares sold: | ||||
| Class A | 1,079,773 | 1,663,492 | ||
| Class C | 93,121 | 227,447 | ||
| Class I | 68,610,954 | 151,019,904 | ||
| Dividends reinvested: | ||||
| Class A | 129,623 | 189,297 | ||
| Class C | 92 | 5,320 | ||
| Class I | 963,573 | 1,239,699 | ||
| Cost of shares redeemed: | ||||
| Class A | (2,696,371 | ) | (3,939,062 | ) |
| Class C | (49,772 | ) | (225,861 | ) |
| Class I | (141,739,068 | ) | (180,962,996 | ) |
| Increase (Decrease) in Net Assets | ||||
| from Capital Stock Transactions | (73,608,075 | ) | (30,782,760 | ) |
| Total Increase (Decrease) in Net Assets | 8,281,093 | (14,195,022 | ) | |
| Net Assets ($): | ||||
| Beginning of Period | 471,241,235 | 485,436,257 | ||
| End of Period | 479,522,328 | 471,241,235 | ||
| Undistributed (distributions in excess of) | ||||
| investment income–net | (126,530 | ) | (67,695 | ) |
12
| Year Ended October 31, | ||||
| 2013 | 2012 | |||
| Capital Share Transactions: | ||||
| Class Aa | ||||
| Shares sold | 99,708 | 180,699 | ||
| Shares issued for dividends reinvested | 12,671 | 21,808 | ||
| Shares redeemed | (254,552 | ) | (415,349 | ) |
| Net Increase (Decrease) in Shares Outstanding | (142,173 | ) | (212,842 | ) |
| Class Ca | ||||
| Shares sold | 8,495 | 25,121 | ||
| Shares issued for dividends reinvested | 9 | 614 | ||
| Shares redeemed | (4,552 | ) | (25,351 | ) |
| Net Increase (Decrease) in Shares Outstanding | 3,952 | 384 | ||
| Class I | ||||
| Shares sold | 6,423,133 | 16,045,955 | ||
| Shares issued for dividends reinvested | 94,191 | 142,658 | ||
| Shares redeemed | (13,466,771 | ) | (19,633,403 | ) |
| Net Increase (Decrease) in Shares Outstanding | (6,949,447 | ) | (3,444,790 | ) |
| a During the period ended October 31, 2013, 2,490 Class C shares representing $28,107 were exchanged for 2,492 |
| Class A shares. |
See notes to financial statements.
| The Fund | 13 |
FINANCIAL HIGHLIGHTS
The following tables describe the performance for each share class for the fiscal periods indicated. All information (except portfolio turnover rate) reflects financial results for a single fund share.Total return shows how much your investment in the fund would have increased (or decreased) during each period, assuming you had reinvested all dividends and distributions.These figures have been derived from the fund’s financial statements.
| Year Ended October 31, | ||||||||||
| Class A Shares | 2013 | 2012 | 2011 | 2010 | 2009 | |||||
| Per Share Data ($): | ||||||||||
| Net asset value, beginning of period | 9.78 | 9.38 | 10.16 | 9.45 | 7.59 | |||||
| Investment Operations: | ||||||||||
| Investment income—neta | .17 | .16 | .09 | .09 | .16 | |||||
| Net realized and unrealized | ||||||||||
| gain (loss) on investments | 1.89 | .42 | (.73 | ) | .86 | 1.96 | ||||
| Total from Investment Operations | 2.06 | .58 | (.64 | ) | .95 | 2.12 | ||||
| Distributions: | ||||||||||
| Dividends from investment income—net | (.15 | ) | (.18 | ) | (.14 | ) | (.12 | ) | (.26 | ) |
| Dividends from net realized | ||||||||||
| gain on investments | — | — | — | (.12 | ) | — | ||||
| Total Distributions | (.15 | ) | (.18 | ) | (.14 | ) | (.24 | ) | (.26 | ) |
| Net asset value, end of period | 11.69 | 9.78 | 9.38 | 10.16 | 9.45 | |||||
| Total Return (%)b | 21.29 | 6.39 | (6.47 | ) | 10.18 | 28.80 | ||||
| Ratios/Supplemental Data (%): | ||||||||||
| Ratio of total expenses | ||||||||||
| to average net assetsc | .40 | .41 | .40 | .40 | 1.89 | |||||
| Ratio of net expenses | ||||||||||
| to average net assetsc | .34 | .41 | .24 | .30 | .37 | |||||
| Ratio of net investment income | ||||||||||
| to average net assetsc | 1.64 | 1.70 | .90 | .92 | 2.01 | |||||
| Portfolio Turnover Rate | 10.28 | 30.63 | 16.15 | 20.78 | 36.68 | |||||
| Net Assets, end of period ($ x 1,000) | 8,702 | 8,675 | 10,310 | 7,701 | 4,578 | |||||
| a | Based on average shares outstanding at each month end. |
| b | Exclusive of sales charge. |
| c | Amounts do not include the expenses of the underlying funds. |
See notes to financial statements.
14
| Year Ended October 31, | ||||||||||
| Class C Shares | 2013 | 2012 | 2011 | 2010 | 2009 | |||||
| Per Share Data ($): | ||||||||||
| Net asset value, beginning of period | 9.69 | 9.35 | 10.10 | 9.38 | 7.54 | |||||
| Investment Operations: | ||||||||||
| Investment income—neta | .05 | .17 | .01 | .08 | .14 | |||||
| Net realized and unrealized | ||||||||||
| gain (loss) on investments | 1.92 | .34 | (.71 | ) | .78 | 1.90 | ||||
| Total from Investment Operations | 1.97 | .51 | (.70 | ) | .86 | 2.04 | ||||
| Distributions: | ||||||||||
| Dividends from investment income—net | (.01 | ) | (.17 | ) | (.05 | ) | (.02 | ) | (.20 | ) |
| Dividends from net realized | ||||||||||
| gain on investments | — | — | — | (.12 | ) | — | ||||
| Total Distributions | (.01 | ) | (.17 | ) | (.05 | ) | (.14 | ) | (.20 | ) |
| Net asset value, end of period | 11.65 | 9.69 | 9.35 | 10.10 | 9.38 | |||||
| Total Return (%)b | 20.33 | 5.65 | (7.01 | ) | 9.21 | 27.73 | ||||
| Ratios/Supplemental Data (%): | ||||||||||
| Ratio of total expenses | ||||||||||
| to average net assetsc | 1.63 | 1.47 | 1.48 | 1.63 | 3.33 | |||||
| Ratio of net expenses | ||||||||||
| to average net assetsc | 1.10 | 1.17 | .70 | 1.07 | 1.12 | |||||
| Ratio of net investment income | ||||||||||
| to average net assetsc | .47 | 1.71 | .13 | .85 | 1.76 | |||||
| Portfolio Turnover Rate | 10.28 | 30.63 | 16.15 | 20.78 | 36.68 | |||||
| Net Assets, end of period ($ x 1,000) | 186 | 116 | 109 | 69 | 84 | |||||
| a | Based on average shares outstanding at each month end. |
| b | Exclusive of sales charge. |
| c | Amounts do not include the expenses of the underlying funds. |
See notes to financial statements.
| The Fund | 15 |
FINANCIAL HIGHLIGHTS (continued)
| Year Ended October 31, | ||||||||||
| Class I Shares | 2013 | 2012 | 2011 | 2010 | 2009 | |||||
| Per Share Data ($): | ||||||||||
| Net asset value, beginning of period | 9.81 | 9.39 | 10.18 | 9.47 | 7.61 | |||||
| Investment Operations: | ||||||||||
| Investment income—neta | .21 | .18 | .11 | .11 | .01 | |||||
| Net realized and unrealized | ||||||||||
| gain (loss) on investments | 1.89 | .44 | (.74 | ) | .86 | 2.12 | ||||
| Total from Investment Operations | 2.10 | .62 | (.63 | ) | .97 | 2.13 | ||||
| Distributions: | ||||||||||
| Dividends from investment income—net | (.19 | ) | (.20 | ) | (.16 | ) | (.14 | ) | (.27 | ) |
| Dividends from net realized | ||||||||||
| gain on investments | — | — | — | (.12 | ) | — | ||||
| Total Distributions | (.19 | ) | (.20 | ) | (.16 | ) | (.26 | ) | (.27 | ) |
| Net asset value, end of period | 11.72 | 9.81 | 9.39 | 10.18 | 9.47 | |||||
| Total Return (%) | 21.69 | 6.82 | (6.33 | ) | 10.34 | 28.89 | ||||
| Ratios/Supplemental Data (%): | ||||||||||
| Ratio of total expenses | ||||||||||
| to average net assetsb | .04 | .06 | .05 | .05 | .24 | |||||
| Ratio of net expenses | ||||||||||
| to average net assetsb | .04 | .06 | .04 | .04 | .08 | |||||
| Ratio of net investment income | ||||||||||
| to average net assetsb | 1.94 | 1.91 | 1.07 | 1.10 | .16 | |||||
| Portfolio Turnover Rate | 10.28 | 30.63 | 16.15 | 20.78 | 36.68 | |||||
| Net Assets, end of period ($ x 1,000) | 470,634 | 462,450 | 475,017 | 352,131 | 163,611 | |||||
| a | Based on average shares outstanding at each month end. |
| b | Amounts do not include the expenses of the underlying funds. |
See notes to financial statements.
16
NOTES TO FINANCIAL STATEMENTS
NOTE 1—Significant Accounting Policies:
Dreyfus Diversified International Fund (the “fund”) is a separate diversified series of Dreyfus Premier Investment Funds, Inc. (the “Company”), which is registered under the Investment Company Act of 1940, as amended (the “Act”), as an open-end management investment company and operates as a series company currently offering eight series, including the fund. The fund’s investment objective is to seek long-term capital appreciation. The Dreyfus Corporation (the “Manager” or “Dreyfus”), a wholly-owned subsidiary of The Bank of New York Mellon Corporation (“BNY Mellon”), serves as the fund’s investment adviser.
MBSC Securities Corporation (the “Distributor”), a wholly-owned subsidiary of the Manager, is the distributor of the fund’s shares. The fund is authorized to issue 400 million shares of $.001 par value Common Stock.The fund currently offers three classes of shares: Class A (200 million shares authorized), Class C (100 million shares authorized) and Class I (100 million shares authorized). Class A shares generally are subject to a sales charge imposed at the time of purchase. Class C shares are subject to a contingent deferred sales charge (“CDSC”) imposed on Class C shares redeemed within one year of purchase. Class I shares are sold at net asset value per share only to institutional investors. Other differences between the classes include the services offered to and the expenses borne by each class, the allocation of certain transfer agency costs and certain voting rights. Income, expenses (other than expenses attributable to a specific class), and realized and unrealized gains or losses on investments are allocated to each class of shares based on its relative net assets.
The Company accounts separately for the assets, liabilities and operations of each series. Expenses directly attributable to each series are
| The Fund | 17 |
NOTES TO FINANCIAL STATEMENTS (continued)
charged to that series’ operations; expenses which are applicable to all series are allocated among them on a pro rata basis.
The Financial Accounting Standards Board (“FASB”) Accounting Standards Codification is the exclusive reference of authoritative U.S. generally accepted accounting principles (“GAAP”) recognized by the FASB to be applied by nongovernmental entities. Rules and interpretive releases of the Securities and Exchange Commission (“SEC”) under authority of federal laws are also sources of authoritative GAAP for SEC registrants. The fund’s financial statements are prepared in accordance with GAAP, which may require the use of management estimates and assumptions.Actual results could differ from those estimates.
The Company enters into contracts that contain a variety of indemnifications. The fund’s maximum exposure under these arrangements is unknown.The fund does not anticipate recognizing any loss related to these arrangements.
(a) Portfolio valuation: The fair value of a financial instrument is the amount that would be received to sell an asset or paid to transfer a liability in an orderly transaction between market participants at the measurement date (i.e., the exit price). GAAP establishes a fair value hierarchy that prioritizes the inputs of valuation techniques used to measure fair value. This hierarchy gives the highest priority to unadjusted quoted prices in active markets for identical assets or liabilities (Level 1 measurements) and the lowest priority to unobservable inputs (Level 3 measurements).
Additionally, GAAP provides guidance on determining whether the volume and activity in a market has decreased significantly and whether such a decrease in activity results in transactions that are not orderly. GAAP requires enhanced disclosures around valuation inputs and techniques used during annual and interim periods.
18
Various inputs are used in determining the value of the fund’s investments relating to fair value measurements.These inputs are summarized in the three broad levels listed below:
Level 1—unadjusted quoted prices in active markets for identical investments.
Level 2—other significant observable inputs (including quoted prices for similar investments, interest rates, prepayment speeds, credit risk, etc.).
Level 3—significant unobservable inputs (including the fund’s own assumptions in determining the fair value of investments).
The inputs or methodology used for valuing securities are not necessarily an indication of the risk associated with investing in those securities.
Investments are valued at the net asset value of each underlying fund determined as of the close of the NewYork Stock Exchange (generally 4 p.m., Eastern time) on the valuation date and are generally categorized within Level 1 of the fair value hierarchy.
The following is a summary of the inputs used as of October 31, 2013 in valuing the fund’s investments:
| Level 2—Other | Level 3— | |||
| Level 1— | Significant | Significant | ||
| Unadjusted | Observable | Unobservable | ||
| Quoted Prices | Inputs | Inputs | Total | |
| Assets ($) | ||||
| Investments in Securities: | ||||
| Mutual Funds† | 478,536,703 | — | — | 478,536,703 |
| † See Statement of Investments for additional detailed categorizations. | ||||
At October 31, 2013, there were no transfers between Level 1 and Level 2 of the fair value hierarchy.
| The Fund | 19 |
NOTES TO FINANCIAL STATEMENTS (continued)
(b) Securities transactions and investment income: Securities transactions are recorded on a trade date basis. Realized gains and losses from securities transactions are recorded on the identified cost basis. Dividend income is recognized on the ex-dividend date and interest income, including, where applicable, accretion of discount and amortization of premium on investments, is recognized on the accrual basis.
(c) Affiliated issuers: Investments in other investment companies advised by Dreyfus are defined as “affiliated” under the Act. Investments in affiliated investment companies during the period ended October 31, 2013 were as follows:
| Affiliated | ||||||||
| Investment | Value | Net Realized | ||||||
| Company | 10/31/2012 ($) | Purchases ($)† | Sales ($) | Gain (Loss) ($) | ||||
| Dreyfus Emerging | ||||||||
| Markets Fund, Cl. I | 51,803,713 | 3,399,186 | 14,211,983 | (1,169,076 | ) | |||
| Dreyfus | ||||||||
| International | ||||||||
| Equity Fund, Cl. I | 121,197,281 | 8,026,475 | 25,079,970 | 966,829 | ||||
| Dreyfus | ||||||||
| International | ||||||||
| Value Fund, Cl. I | 51,310,718 | 3,982,976 | 13,584,984 | 330,233 | ||||
| Dreyfus/Newton | ||||||||
| International | ||||||||
| Equity Fund, Cl. I | 119,982,886 | 24,173,782 | 26,453,119 | 1,201,640 | ||||
| International | ||||||||
| Stock Fund, Cl. I | 127,287,436 | 6,804,122 | 42,049,819 | 2,561,600 | ||||
| Total | 471,582,034 | 46,386,541 | 121,379,875 | 3,891,226 | ||||
| † Includes reinvested dividends/distributions. | ||||||||
| Change in Net | ||||||||
| Affiliated | Unrealized | |||||||
| Investment | Appreciation | Value | Net | Dividends/ | ||||
| Company | (Depreciation) ($) | 10/31/2013 | ($) | Assets (%) Distributions ($) | ||||
| Dreyfus Emerging | ||||||||
| Markets Fund, Cl. I | 2,727,780 | 42,549,620 | 8.9 | 606,362 | ||||
| Dreyfus International | ||||||||
| Equity Fund, Cl. I | 29,115,434 | 134,226,049 | 28.0 | 3,097,500 | ||||
| Dreyfus International | ||||||||
| Value Fund, Cl. I | 10,773,808 | 52,812,751 | 11.0 | 1,313,364 | ||||
| Dreyfus/Newton | ||||||||
| International | ||||||||
| Equity Fund, Cl. I | 24,394,248 | 143,299,437 | 29.9 | 1,833,288 | ||||
| International | ||||||||
| Stock Fund, Cl. I | 11,045,507 | 105,648,846 | 22.0 | 2,120,091 | ||||
| Total | 78,056,777 | 478,536,703 | 99.8 | 8,970,605 | ||||
20
(d) Dividends to shareholders: Dividends are recorded on the ex-dividend date. Dividends from investment income-net and dividends from net realized capital gains, if any, are normally declared and paid annually, but the fund may make distributions on a more frequent basis to comply with the distribution requirements of the Internal Revenue Code of 1986, as amended (the “Code”).To the extent that net realized capital gains can be offset by capital loss carryovers, it is the policy of the fund not to distribute such gains. Income and capital gain distributions are determined in accordance with income tax regulations, which may differ from GAAP.
(e) Federal income taxes: It is the policy of the fund to continue to qualify as a regulated investment company, if such qualification is in the best interests of its shareholders, by complying with the applicable provisions of the Code, and to make distributions of taxable income sufficient to relieve it from substantially all federal income and excise taxes.
As of and during the period ended October 31, 2013, the fund did not have any liabilities for any uncertain tax positions.The fund recognizes interest and penalties, if any, related to uncertain tax positions as income tax expense in the Statement of Operations. During the period ended October 31, 2013, the fund did not incur any interest or penalties.
Each tax year in the four-year period ended October 31, 2013 remains subject to examination by the Internal Revenue Service and state taxing authorities.
At October 31, 2013, the components of accumulated earnings on a tax basis were as follows: accumulated capital losses $16,221,837 and unrealized appreciation $113,872,293. In addition, the fund deferred for tax purposes late year ordinary losses of $126,530 to the first day of the following fiscal year.
Under the Regulated Investment Company Modernization Act of 2010 (the “2010 Act”), the fund is permitted to carry forward capital losses incurred in taxable years beginning after December 22, 2010 (“post-enactment losses”) for an unlimited period. Furthermore, post-
| The Fund | 21 |
NOTES TO FINANCIAL STATEMENTS (continued)
enactment capital loss carryovers retain their character as either short-term or long-term capital losses rather than short-term as they were under previous statute.The 2010 Act requires post-enactment losses to be utilized before the utilization of losses incurred in taxable years prior to the effective date of the 2010 Act (“pre-enactment losses”).As a result of this ordering rule, pre-enactment losses may be more likely to expire unused.
The accumulated capital loss carryover is available for federal income tax purposes to be applied against future net realized capital gains, if any, realized subsequent to October 31, 2013. If not applied, $415,833 of the carryover expires in fiscal year 2018 and $943,756 expires in fiscal year 2019.The fund has $4,527,844 of post-enactment short-term capital losses and $10,334,404 of post-enactment long-term capital losses which can be carried forward for an unlimited period.
The tax character of distributions paid to shareholders during the fiscal periods ended October 31, 2013 and October 31, 2012 were as follows: ordinary income $8,806,615 and $9,524,510, respectively.
NOTE 2—Bank Lines of Credit:
The fund participates with other Dreyfus-managed funds in a $265 million unsecured credit facility led by Citibank, N.A. and a $300 million unsecured credit facility provided by The Bank of New York Mellon, a subsidiary of BNY Mellon and an affiliate of Dreyfus (each, a “Facility”), each to be utilized primarily for temporary or emergency purposes, including the financing of redemptions. Prior to October 9, 2013, the unsecured credit facility with Citibank, N.A. was $210 million. In connection therewith, the fund has agreed to pay its pro rata portion of commitment fees for each Facility. Interest is charged to the fund based on rates determined pursuant to the terms of the respective Facility at the time of borrowing.
The average amount of borrowings outstanding under the Facilities during the period ended October 31, 2013 was approximately $75,300 with a related weighted average annualized interest rate of 1.13%.
22
NOTE 3—Management Fee and Other Transactions with Affiliates:
(a) Pursuant to a management agreement with the Manager, there is no management fee paid to the Manager.The fund invests in other mutual funds advised by the Manager. All fees and expenses of the underlying funds are reflected in the underlying funds’ net asset value.
The Manager had contractually agreed, from November 1, 2012 through March 1, 2013, to waive receipt of its fees and/or assume the direct expenses of the fund, so that the expenses of none of the classes (excluding Rule 12b-1 Distribution Plan fees, Shareholder Services Plan fees, taxes, interest expense, brokerage commissions, commitment fees on borrowings and extraordinary expenses) exceeded 1.20% of the value of the fund’s average daily net assets. The Manager has also contractually agreed, from March 2, 2013 through March 1, 2015, to waive receipt of its fees and/or assume the direct expenses of the fund, so that the expenses of none of the classes (excluding certain expenses as described above) exceed 1.05% of the value of the fund’s average daily net assets.The reduction in expenses, pursuant to the undertaking, amounted to $5,615 during the period ended October 31, 2013.
During the period ended October 31, 2013, the Distributor retained $209 from commissions earned on sales of the fund’s Class A shares.
(b) Under the Distribution Plan adopted pursuant to Rule 12b-1 under the Act, Class C shares pay the Distributor for distributing its shares at an annual rate of .75% of the value of its average daily net assets. During the period ended October 31, 2013, Class C shares were charged $1,089 pursuant to the Distribution Plan.
(c) Under the Shareholder Services Plan, Class A and Class C shares pay the Distributor at an annual rate of .25% of the value of their average daily net assets for the provision of certain services.The services provided may include personal services relating to shareholder accounts, such as answering shareholder inquiries regarding the fund
| The Fund | 23 |
NOTES TO FINANCIAL STATEMENTS (continued)
and providing reports and other information, and services related to the maintenance of shareholder accounts.The Distributor may make payments to Service Agents (securities dealers, financial institutions or other industry professionals) with respect to these services. The Distributor determines the amounts to be paid to Service Agents. During the period ended October 31, 2013, Class A and Class C shares were charged $20,917 and $363, respectively, pursuant to the Shareholder Services Plan.
The fund has arrangements with the transfer agent and the custodian whereby the fund may receive earnings credits when positive cash balances are maintained, which are used to offset transfer agency and custody fees. For financial reporting purposes, the fund includes net earnings credits as an expense offset in the Statement of Operations.
The fund compensates DreyfusTransfer, Inc., a wholly-owned subsidiary of the Manager, under a transfer agency agreement for providing transfer agency and cash management services for the fund.The majority of transfer agency fees are comprised of amounts paid on a per account basis, while cash management fees are related to fund subscriptions and redemptions. During the period ended October 31, 2013, the fund was charged $5,053 for transfer agency services and $157 for cash management services.These fees are included in Shareholder servicing costs in the Statement of Operations. Cash management fees were partially offset by earnings credits of $19.
The fund compensates The Bank of NewYork Mellon under a custody agreement for providing custodial services for the fund.These fees are determined based on net assets, geographic region and transaction activity. During the period ended October 31, 2013, the fund was charged $4,173 pursuant to the custody agreement.
24
The fund compensated The Bank of New York Mellon under a cash management agreement that was in effect until September 30, 2013 for performing certain cash management services related to fund subscriptions and redemptions. During the period ended October 31, 2013, the fund was charged $77 pursuant to the cash management agreement, which is included in Shareholder servicing costs in the Statement of Operations.
During the period ended October 31, 2013, the fund was charged $8,887 for services performed by the Chief Compliance Officer and his staff.
The components of “Due to The Dreyfus Corporation and affiliates” in the Statement of Assets and Liabilities consist of: Distribution Plan fees $117, Shareholder Services Plan fees $1,848, custodian fees $1,600, Chief Compliance Officer fees $7,445 and transfer agency fees $1,468, which are offset against an expense reimbursement currently in effect in the amount of $537.
(d) Each Board member also serves as a Board member of other funds within the Dreyfus complex. Annual retainer fees and attendance fees are allocated to each fund based on net assets.
NOTE 4—Securities Transactions:
The aggregate amount of purchases and sales of investment securities, excluding short-term securities, during the period ended October 31, 2013, amounted to $46,386,541 and $121,379,875, respectively.
At October 31, 2013, the cost of investments for federal income tax purposes was $364,664,410; accordingly, accumulated net unrealized appreciation on investments was $113,872,293, consisting of gross unrealized appreciation.
| The Fund | 25 |
| REPORT OF INDEPENDENT REGISTERED |
| PUBLIC ACCOUNTING FIRM |
Shareholders and Board of Directors Dreyfus Diversified International Fund
We have audited the accompanying statement of assets and liabilities, including the statement of investments, of Dreyfus Diversified International Fund (one of the series comprising Dreyfus Premier Investment Funds, Inc.) as of October 31, 2013, and the related statement of operations for the year then ended, the statement of changes in net assets for each of the two years in the period then ended, and the financial highlights for each of the five years in the period then ended.These financial statements and financial highlights are the responsibility of the Fund’s management. Our responsibility is to express an opinion on these financial statements and financial highlights based on our audits.
We conducted our audits in accordance with the standards of the Public Company Accounting Oversight Board (United States).Those standards require that we plan and perform the audit to obtain reasonable assurance about whether the financial statements and financial highlights are free of material misstatement.We were not engaged to perform an audit of the Fund’s internal control over financial reporting. Our audits included consideration of internal control over financial reporting as a basis for designing audit procedures that are appropriate in the circumstances, but not for the purpose of expressing an opinion on the effectiveness of the Fund’s internal control over financial reporting. Accordingly, we express no such opinion. An audit also includes examining, on a test basis, evidence supporting the amounts and disclosures in the financial statements and financial highlights, assessing the accounting principles used and significant estimates made by management, and evaluating the overall financial statement presentation. Our procedures included confirmation of securities owned as of October 31, 2013 by correspondence with the custodian and others. We believe that our audits provide a reasonable basis for our opinion.
In our opinion, the financial statements and financial highlights referred to above present fairly, in all material respects, the financial position of Dreyfus Diversified International Fund at October 31, 2013, the results of its operations for the year then ended, the changes in its net assets for each of the two years in the period then ended, and the financial highlights for each of the five years in the period then ended, in conformity with U.S. generally accepted accounting principles.

New York, New York
December 27, 2013
26
IMPORTANT TAX INFORMATION (Unaudited)
In accordance with federal tax law, the fund elects to provide each shareholder with their portion of the fund’s foreign taxes paid and the income sourced from foreign countries.Accordingly, the fund hereby reports the following information regarding its fiscal year ended October 31, 2013:
—the total amount of taxes paid to foreign countries was $1,077,705
—the total amount of income sourced from foreign countries was $8,971,067.
Where required by federal tax law rules, shareholders will receive notification of their proportionate share of foreign taxes paid and foreign sourced income for the 2013 calendar year with Form 1099-DIV which will be mailed in early 2014. For federal tax purposes, the fund hereby reports 100% of the ordinary dividends paid during the fiscal year ended October 31, 2013 as qualifying for the corporate dividends received deduction. For the fiscal year ended October 31, 2013, certain dividends paid by the fund may be subject to a maximum tax rate of 15%, as provided for by the Jobs and Growth Tax Relief Reconciliation Act of 2003. Of the distributions paid during the fiscal year, $8,806,615 represents the maximum amount that may be considered qualified dividend income.
| The Fund | 27 |
BOARD MEMBERS INFORMATION (Unaudited)
| Joseph S. DiMartino (70) |
| Chairman of the Board (1995) |
| Principal Occupation During Past 5Years: |
| • Corporate Director and Trustee |
| Other Public Company Board Memberships During Past 5Years: |
| • CBIZ (formerly, Century Business Services, Inc.), a provider of outsourcing functions for small |
| and medium size companies, Director (1997-present) |
| • The Newark Group, a provider of a national market of paper recovery facilities, paperboard |
| mills and paperboard converting plants, Director (2000-2010) |
| • Sunair Services Corporation, a provider of certain outdoor-related services to homes and |
| businesses, Director (2005-2009) |
| No. of Portfolios for which Board Member Serves: 141 |
| ——————— |
| Peggy C. Davis (70) |
| Board Member (2012) |
| Principal Occupation During Past 5Years: |
| • Shad Professor of Law, New York University School of Law (1983-present) |
| No. of Portfolios for which Board Member Serves: 56 |
| ——————— |
| David P. Feldman (73) |
| Board Member (1991) |
| Principal Occupation During Past 5Years: |
| • Corporate Director and Trustee |
| Other Public Company Board Memberships During Past 5Years: |
| • BBH Mutual Funds Group (4 registered mutual funds), Director (1992-present) |
| No. of Portfolios for which Board Member Serves: 42 |
| ——————— |
| Ehud Houminer (73) |
| Board Member (2012) |
| Principal Occupation During Past 5Years: |
| • Executive-in-Residence at the Columbia Business School, Columbia University (1992-present) |
| Other Public Company Board Memberships During Past 5Years: |
| • Avnet Inc., an electronics distributor, Director (1993-2012) |
| No. of Portfolios for which Board Member Serves: 66 |
28
| Lynn Martin (73) |
| Board Member (1993) |
| Principal Occupation During Past 5Years: |
| • President ofThe Martin Hall Group LLC, a human resources consulting firm (January 2005-2012) |
| Other Public Company Board Memberships During Past 5Years: |
| • AT&T Inc., a telecommunications company, Director (1999-2012) |
| • Ryder System, Inc., a supply chain and transportation management company, Director (1993-2012) |
| • The Proctor & Gamble Co., a consumer products company, Director (1994-2009) |
| • Constellation Energy Group Inc., Director (2003-2009) |
| No. of Portfolios for which Board Member Serves: 42 |
| ——————— |
| Robin A. Melvin (50) |
| Board Member (2011) |
| Principal Occupation During Past 5Years: |
| • Board Member, Illinois Mentoring Partnership, non-profit organization dedicated to increasing |
| the quantity and quality of mentoring services in Illinois (2013-present) |
| • Director, Boisi Family Foundation, a private family foundation that supports youth-serving orga- |
| nizations that promote the self sufficiency of youth from disadvantaged circumstances (1995-2012) |
| No. of Portfolios for which Board Member Serves: 90 |
| ——————— |
| Dr. Martin Peretz (74) |
| Board Member (2012) |
| Principal Occupation During Past 5Years: |
| • Editor-in-Chief Emeritus of The New Republic Magazine (2010-2011) (previously, |
| Editor-in-Chief, 1974-2010) |
| • Director of TheStreet.com, a financial information service on the web (1996-2010) |
| Other Public Company Board Memberships During Past 5Years: |
| • Pershing Square Capital Management,Adviser (2009-present) |
| No. of Portfolios for which Board Member Serves: 42 |
| ——————— |
Once elected all Board Members serve for an indefinite term, but achieve Emeritus status upon reaching age 80.The address of the Board Members and Officers is c/o The Dreyfus Corporation, 200 Park Avenue, NewYork, NewYork 10166. Additional information about the Board Members is available in the fund’s Statement of Additional Information which can be obtained from Dreyfus free of charge by calling this toll free number: 1-800-DREYFUS.
Daniel Rose, Emeritus Board Member
Philip L.Toia, Emeritus Board Member
Sander Vanocur, Emeritus Board Member
| The Fund | 29 |
OFFICERS OF THE FUND (Unaudited)
BRADLEY J. SKAPYAK, President since January 2010.
Chief Operating Officer and a director of the Manager since June 2009, Chairman of Dreyfus Transfer, Inc., an affiliate of the Manager and the transfer agent of the funds, since May 2011 and Executive Vice President of the Distributor since June 2007. From April 2003 to June 2009, Mr. Skapyak was the head of the Investment Accounting and Support Department of the Manager. He is an officer of 68 investment companies (comprised of 141 portfolios) managed by the Manager. He is 55 years old and has been an employee of the Manager since February 1988.
JOHN PAK, Chief Legal Officer since March 2013.
Chief Legal Officer of the Manager and Associate General Counsel and Managing Director of BNY Mellon since August 2012; from March 2005 to July 2012, Managing Director of Deutsche Bank, Deputy Global Head of Deutsche Asset Management Legal and Regional Head of Deutsche Asset Management Americas Legal. He is an officer of 69 investment companies (comprised of 166 portfolios) managed by the Manager. He is 45 years old and has been an employee of the Manager since August 2012.
JANETTE E. FARRAGHER, Vice President and Secretary since December 2011.
Assistant General Counsel of BNY Mellon, and an officer of 69 investment companies (comprised of 166 portfolios) managed by the Manager. She is 50 years old and has been an employee of the Manager since February 1984.
KIESHA ASTWOOD, Vice President and Assistant Secretary since January 2010.
Counsel of BNY Mellon, and an officer of 69 investment companies (comprised of 166 portfolios) managed by the Manager. She is 40 years old and has been an employee of the Manager since July 1995.
JAMES BITETTO, Vice President and Assistant Secretary since August 2005.
Senior Counsel of BNY Mellon and Secretary of the Manager, and an officer of 69 investment companies (comprised of 166 portfolios) managed by the Manager. He is 47 years old and has been an employee of the Manager since December 1996.
JONI LACKS CHARATAN, Vice President and Assistant Secretary since August 2005.
Senior Counsel of BNY Mellon, and an officer of 69 investment companies (comprised of 166 portfolios) managed by the Manager. She is 58 years old and has been an employee of the Manager since October 1988.
JOSEPH M. CHIOFFI, Vice President and Assistant Secretary since August 2005.
Senior Counsel of BNY Mellon, and an officer of 69 investment companies (comprised of 166 portfolios) managed by the Manager. He is 52 years old and has been an employee of the Manager since June 2000.
JOHN B. HAMMALIAN, Vice President and Assistant Secretary since August 2005.
Senior Managing Counsel of BNY Mellon, and an officer of 69 investment companies (comprised of 166 portfolios) managed by the Manager. He is 50 years old and has been an employee of the Manager since February 1991.
ROBERT R. MULLERY, Vice President and Assistant Secretary since August 2005.
Managing Counsel of BNY Mellon, and an officer of 69 investment companies (comprised of 166 portfolios) managed by the Manager. He is 61 years old and has been an employee of the Manager since May 1986.
30
JEFF PRUSNOFSKY, Vice President and Assistant Secretary since August 2005.
Senior Managing Counsel of BNY Mellon, and an officer of 69 investment companies (comprised of 166 portfolios) managed by the Manager. He is 48 years old and has been an employee of the Manager since October 1990.
JAMES WINDELS, Treasurer since November 2001.
Director – Mutual Fund Accounting of the Manager, and an officer of 69 investment companies (comprised of 166 portfolios) managed by the Manager. He is 55 years old and has been an employee of the Manager since April 1985.
RICHARD CASSARO, Assistant Treasurer since January 2008.
Senior Accounting Manager – Money Market and Municipal Bond Funds of the Manager, and an officer of 69 investment companies (comprised of 166 portfolios) managed by the Manager. He is 54 years old and has been an employee of the Manager since September 1982.
GAVIN C. REILLY, Assistant Treasurer since December 2005.
Tax Manager of the Investment Accounting and Support Department of the Manager, and an officer of 69 investment companies (comprised of 166 portfolios) managed by the Manager. He is 45 years old and has been an employee of the Manager since April 1991.
ROBERT S. ROBOL, Assistant Treasurer since August 2005.
Senior Accounting Manager – Fixed Income Funds of the Manager, and an officer of 69 investment companies (comprised of 166 portfolios) managed by the Manager. He is 49 years old and has been an employee of the Manager since October 1988.
ROBERT SALVIOLO, Assistant Treasurer since July 2007.
Senior Accounting Manager – Equity Funds of the Manager, and an officer of 69 investment companies (comprised of 166 portfolios) managed by the Manager. He is 46 years old and has been an employee of the Manager since June 1989.
ROBERT SVAGNA, Assistant Treasurer since December 2002.
Senior Accounting Manager – Equity Funds of the Manager, and an officer of 69 investment companies (comprised of 166 portfolios) managed by the Manager. He is 46 years old and has been an employee of the Manager since November 1990.
JOSEPH W. CONNOLLY, Chief Compliance Officer since October 2004.
Chief Compliance Officer of the Manager and The Dreyfus Family of Funds (69 investment companies, comprised of 166 portfolios). He is 56 years old and has served in various capacities with the Manager since 1980, including manager of the firm’s Fund Accounting Department from 1997 through October 2001.
MATTHEW D. CONNOLLY, Anti-Money Laundering Compliance Officer since April 2012.
Anti-Money Laundering Compliance Officer of the Distributor since October 2011; from March 2010 to September 2011, Global Head, KYC Reviews and Director, UBS Investment Bank; until March 2010, AML Compliance Officer and Senior Vice President, Citi Global Wealth Management. He is an officer of 64 investment companies (comprised of 161 portfolios) managed by the Manager. He is 41 years old and has been an employee of the Distributor since October 2011.
| The Fund | 31 |
NOTES
For More Information
Telephone Call your financial representative or 1-800-DREYFUS
Mail The Dreyfus Family of Funds, 144 Glenn Curtiss Boulevard, Uniondale, NY 11556-0144
The fund files its complete schedule of portfolio holdings with the Securities and Exchange Commission (“SEC”) for the first and third quarters of each fiscal year on Form N-Q. The fund’s Forms N-Q are available on the SEC’s website at http://www.sec.gov and may be reviewed and copied at the SEC’s Public Reference Room in Washington, DC. Information on the operation of the Public Reference Room may be obtained by calling 1-800-SEC-0330.
A description of the policies and procedures that the fund uses to determine how to vote proxies relating to portfolio securities, and information regarding how the fund voted these proxies for the most recent 12-month period ended June 30 is available at http://www.dreyfus.com and on the SEC’s website at http://www.sec.gov. The description of the policies and procedures is also available without charge, upon request, by calling 1-800-DREYFUS.

| Dreyfus |
| Emerging Asia Fund |
ANNUAL REPORT October 31, 2013
Save time. Save paper. View your next shareholder report online as soon as it’s available. Log into www.dreyfus.com and sign up for Dreyfus eCommunications. It’s simple and only takes a few minutes.
The views expressed in this report reflect those of the portfolio manager only through the end of the period covered and do not necessarily represent the views of Dreyfus or any other person in the Dreyfus organization. Any such views are subject to change at any time based upon market or other conditions and Dreyfus disclaims any responsibility to update such views.These views may not be relied on as investment advice and, because investment decisions for a Dreyfus fund are based on numerous factors, may not be relied on as an indication of trading intent on behalf of any Dreyfus fund.
| Not FDIC-Insured • Not Bank-Guaranteed • May Lose Value |
Contents | |
THE FUND | |
| 2 | A Letter from the President |
| 3 | Discussion of Fund Performance |
| 6 | Fund Performance |
| 8 | Understanding Your Fund’s Expenses |
| 8 | Comparing Your Fund’s Expenses With Those of Other Funds |
| 9 | Statement of Investments |
| 12 | Statement of Assets and Liabilities |
| 13 | Statement of Operations |
| 14 | Statement of Changes in Net Assets |
| 15 | Financial Highlights |
| 18 | Notes to Financial Statements |
| 32 | Report of Independent Registered Public Accounting Firm |
| 33 | Important Tax Information |
| 34 | Board Members Information |
| 36 | Officers of the Fund |
FOR MORE INFORMATION | |
Back Cover |
Dreyfus
Emerging Asia Fund
The Fund
A LETTER FROM THE PRESIDENT
Dear Shareholder:
We are pleased to present this annual report for Dreyfus Emerging Asia Fund, covering the 12-month period from November 1, 2012, through October 31, 2013. For information about how the fund performed during the reporting period, as well as general market perspectives, we provide a Discussion of Fund Performance on the pages that follow.
Improving global economic conditions drove developed stock markets higher over much of the reporting period. Europe appeared to put the worst of its sovereign debt and banking crises behind it, and Japan embarked on a new economic course designed to reflate its long-stagnant domestic economy. However, the world’s emerging markets struggled with the effects of local economic slowdowns. As a result, equity market returns varied widely from one country to another over the past 12 months.
We currently expect global economic conditions to continue to improve in 2014, with stronger growth in many developed countries fueled by past and continuing monetary ease. The emerging markets seem poised for moderate economic expansion despite recently negative investor sentiment. In the United States, we anticipate accelerating growth supported by the fading drags of tighter federal fiscal policies and downsizing on the state and local levels. For more information on how these observations may affect your investments, we encourage you to speak with your financial advisor.
Thank you for your continued confidence and support.

J. Charles Cardona
President
The Dreyfus Corporation
November 15, 2013
2
DISCUSSION OF FUND PERFORMANCE
For the period of November 1, 2012, through October 31, 2013, as provided by Hugh Simon, Raymond Chan and Abhijit Sarkar, Portfolio Managers of Hamon Asian Advisors Limited, Sub-Investment Adviser
Fund and Market Performance Overview
For the 12-month period ended October 31, 2013, Dreyfus Emerging Asia Fund’s Class A shares produced a total return of 0.48%, Class C shares returned –0.25% and Class I shares returned 0.72%.1 In comparison, the fund’s benchmark, the MSCI® Emerging Markets Asia Index (the “Index”), produced a total return of 9.69% for the same period.2
Weakness among emerging Asian equities early in the reporting period was more than offset by subsequent gains in some markets when fears of a more severe economic slowdown were not realized and foreign investment capital returned to the region. The fund produced lower returns than its benchmark, mainly due to overweighted exposure to the struggling Indian stock market.
The Fund’s Investment Approach
The fund, which seeks long-term capital appreciation, normally invests at least 80% of its net assets in stocks of companies that are located or principally traded in Asian emerging market countries or other investments that are tied economically to Asian emerging markets. The fund may invest in the stocks of companies of any market capitalization. To determine where the fund will invest, we analyze several factors, including economic, demographic, and political trends in Asian emerging market countries, the current financial condition and future prospects of individual companies and sectors in the Asian emerging markets, and the valuation of one market or company relative to that of another.
Shifting Economic Expectations Sparked Market Volatility
Uncertainty surrounding the impact of the global economic slowdown on Asian emerging markets led to capital outflows toward more developed regions of the world, such as the United States, where economic recoveries had gained traction. In addition, corporations in some markets reported soft earnings while credit growth slowed in other markets, adding to investor uncertainty. Declines were especially steep
| The Fund | 3 |
DISCUSSION OF FUND PERFORMANCE (continued)
in the spring, when relatively hawkish comments from U.S. monetary policymakers further dampened global investor sentiment.
However, most Asian markets rallied in June when it became clearer that their local economies were not slowing as much as investors had feared. Despite continued market volatility over the summer, this development reassured investors, and capital inflows began to return to parts of the region. Investors were especially attracted to Chinese technology companies that appeared poised for significant domestic growth. Chinese health care companies and consumer-oriented businesses also fared well late in the reporting period. On the other hand, stocks in India remained under pressure when global investors responded negatively to actions and inactions by the Indian government. Smaller markets, such as Thailand and Indonesia, also struggled with capital outflows despite relatively strong local economic growth.
Midcap Focus Dampened Relative Results
The fund’s relative performance was undermined by overweight exposure to midcap companies, which generally lagged their large-cap counterparts in most Asia markets. Shortfalls were particularly severe in the financials sector, where disappointing stock selections included Indian banks that were hurt by rising interest rates. Commercial banks in the Philippines, such as Rizal Commercial Banking, also struggled in a rising interest rate environment, and Chinese insurance company China Taiping Insurance Holdings reported slowing premium growth amid challenging conditions in the financial markets. In Malaysia, property developer UEM Sunrise Berhad struggled with capital outflows, higher interest rates, and changes in government policies.
The fund also produced below-average results in the consumer discretionary sector, primarily due to weakness among Indian media companies. For example, Hinduja Ventures was hurt by rising interest rates after borrowing heavily to acquire new media assets.
On a more positive note, the fund’s stock selection strategy fared well in China. Chinese enterprise and gaming software developer Kingsoft more than doubled in value after reporting robust gains in its mobile applications unit. Carmaker Chongqing Changan Automobile, Cl. B encountered rising demand for the SUVs it manufactures through a joint venture with General Motors. Drug distributor China Medical System Holdings profited from higher health care spending by an expanding middle class of consumers.
4
Finally, the fund benefited from underweight exposure to the energy sector, which struggled due to lower commodity prices in the sluggish global economy.
Finding Opportunities in Certain Markets
While economic growth may be slower in the region compared to the past decade, we note that some individual Asian economies are substantially larger than they were 10 years ago and are expanding from a larger base.
We have emphasized individual markets that we believe will prove relatively attractive to foreign investors.As of the reporting period’s end, approximately 45% of the fund’s assets was allocated to China, and we have increased the fund’s exposure to Taiwan and Korea. Conversely, we reduced the fund’s positions inThailand and Indonesia.Although we trimmed exposure to India by eliminating some of the fund’s more interest rate-sensitive holdings, we have emphasized industrial and health care companies that, in our analysis, are well positioned for a market rebound.
November 15, 2013
Please note, the position in any security highlighted with italicized typeface was sold during the reporting period. Emerging markets, such as those of China and Taiwan, tend to be more volatile than the markets of more mature economies, and generally have less diverse and less mature economic structures and less stable political systems than those of developed countries.The securities of companies located in emerging markets are often subject to rapid and large changes in price. An investment in this fund should be considered only as a supplement to a complete investment program for those investors willing to accept the greater risks associated with investing in emerging market countries. Equity funds are subject generally to market, market sector, market liquidity, issuer and investment style risks, among other factors, to varying degrees, all of which are more fully described in the fund’s prospectus.
The fund’s performance will be influenced by political, social and economic factors affecting investments in foreign companies. Special risks associated with investments in foreign companies include exposure to currency fluctuations, less liquidity, less developed or less efficient trading markets, lack of comprehensive company information, political instability and differing auditing and legal standards.These risks are enhanced in emerging market countries.
| 1 Total return includes reinvestment of dividends and any capital gains paid, and does not take into consideration the |
| maximum initial sales charge in the case of Class A shares, or the applicable contingent deferred sales charge imposed |
| on redemptions in the case of Class C shares. Had these charges been reflected, returns would have been lower. Past |
| performance is no guarantee of future results. Share price and investment return fluctuate such that upon redemption, |
| fund shares may be worth more or less than their original cost. Return figures provided reflect an undertaking for the |
| absorption of certain fund expenses by The Dreyfus Corporation through March 1, 2015, at which time it may be |
| extended, terminated or modified. Had these expenses not been absorbed, the fund’s returns would have been lower. |
| 2 SOURCE: FACTSET – Reflects reinvestment of dividends and, where applicable, capital gain distributions.The |
| MSCI Emerging Markets Asia Index is a free-float adjusted market capitalization-weighted index designed to measure |
| equity market performance in the emerging market countries of Asia. Investors cannot invest directly in any index. |
| The Fund | 5 |
FUND PERFORMANCE
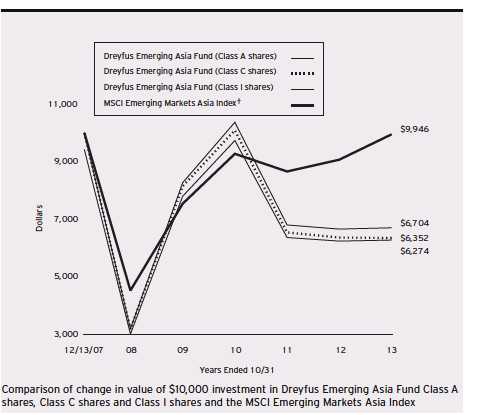
| † Source: Lipper Inc. |
| Past performance is not predictive of future performance. |
| The above graph compares a $10,000 investment made in each of the Class A, Class C and Class I shares of Dreyfus |
| Emerging Asia Fund on 12/13/07 (the fund’s inception date) to a $10,000 investment made in the MSCI Emerging |
| Markets Asia Index (the “Index”) on that date.All dividends and capital gain distributions are reinvested. |
| The fund’s performance shown in the line graph above takes into account the maximum initial sales charge on Class A |
| shares and all other applicable fees and expenses on all classes.The Index is a free-float adjusted market capitalization |
| weighted index designed to measure equity market performance in the emerging market countries of Asia. Unlike a |
| mutual fund, the Index is not subject to charges, fees and other expenses. Investors cannot invest directly in any index. |
| Further information relating to fund performance, including expense reimbursements, if applicable, is contained in the |
| Financial Highlights section of the prospectus and elsewhere in this report. |
6
| Average Annual Total Returns as of 10/31/13 | |||||||
| Inception | From | ||||||
| Date | 1 Year | 5 Years | Inception | ||||
| Class A shares | |||||||
| with maximum sales charge (5.75%) | 12/13/07 | –5.35 | % | 14.43 | % | –7.62 | % |
| without sales charge | 12/13/07 | 0.48 | % | 15.77 | % | –6.69 | % |
| Class C shares | |||||||
| with applicable redemption charge † | 12/13/07 | –1.25 | % | 14.81 | % | –7.43 | % |
| without redemption | 12/13/07 | –0.25 | % | 14.81 | % | –7.43 | % |
| Class I shares | 12/13/07 | 0.72 | % | 15.94 | % | –6.58 | % |
| MSCI Emerging Markets Asia Index | 11/30/07 | 9.69 | % | 17.04 | % | –0.09 | %†† |
Past performance is not predictive of future performance.The fund’s performance shown in the graph and table does not reflect the deduction of taxes that a shareholder would pay on fund distributions or the redemption of fund shares.
| † | The maximum contingent deferred sales charge for Class C shares is 1% for shares redeemed within one year of the |
| date of purchase. | |
| †† | For comparative purposes, the value of the Index as of 11/30/07 is used as the beginning value on 12/13/07. |
| The Fund | 7 |
UNDERSTANDING YOUR FUND’S EXPENSES (Unaudited)
As a mutual fund investor, you pay ongoing expenses, such as management fees and other expenses. Using the information below, you can estimate how these expenses affect your investment and compare them with the expenses of other funds.You also may pay one-time transaction expenses, including sales charges (loads) and redemption fees, which are not shown in this section and would have resulted in higher total expenses. For more information, see your fund’s prospectus or talk to your financial adviser.
Review your fund’s expenses
The table below shows the expenses you would have paid on a $1,000 investment in Dreyfus Emerging Asia Fund from May 1, 2013 to October 31, 2013. It also shows how much a $1,000 investment would be worth at the close of the period, assuming actual returns and expenses.
Expenses and Value of a $1,000 Investment
assuming actual returns for the six months ended October 31, 2013
| Class A | Class C | Class I | |
| Expenses paid per $1,000† | $9.29 | $12.93 | $8.07 |
| Ending value (after expenses) | $940.10 | $936.30 | $940.50 |
COMPARING YOUR FUND’S EXPENSES
WITH THOSE OF OTHER FUNDS (Unaudited)
Using the SEC’s method to compare expenses
The Securities and Exchange Commission (SEC) has established guidelines to help investors assess fund expenses. Per these guidelines, the table below shows your fund’s expenses based on a $1,000 investment, assuming a hypothetical 5% annualized return. You can use this information to compare the ongoing expenses (but not transaction expenses or total cost) of investing in the fund with those of other funds.All mutual fund shareholder reports will provide this information to help you make this comparison. Please note that you cannot use this information to estimate your actual ending account balance and expenses paid during the period.
Expenses and Value of a $1,000 Investment
assuming a hypothetical 5% annualized return for the six months ended October 31, 2013
| Class A | Class C | Class I | |
| Expenses paid per $1,000† | $9.65 | $13.44 | $8.39 |
| Ending value (after expenses) | $1,015.63 | $1,011.85 | $1,016.89 |
| † Expenses are equal to the fund’s annualized expense ratio of 1.90% for Class A, 2.65% for Class C and 1.65% |
| for Class I, multiplied by the average account value over the period, multiplied by 184/365 (to reflect the one-half |
| year period). |
8
| STATEMENT OF INVESTMENTS |
| October 31, 2013 |
| Common Stocks—100.5% | Shares | Value ($) | |
| China—37.1% | |||
| AutoNavi Holdings, ADR | 17,000 | a | 262,905 |
| AviChina Industry & Technology, Cl. H | 1,392,000 | 660,720 | |
| Baidu, ADR | 5,300 | a | 852,770 |
| Baoxin Auto Group | 570,500 | 587,939 | |
| China Huishan Dairy Holdings | 2,260,000 | 897,820 | |
| China Medical System Holdings | 1,055,500 | 948,902 | |
| Chongqing Changan Automobile, Cl. B | 600,000 | 1,106,668 | |
| CNOOC | 513,000 | 1,053,393 | |
| Ctrip.com International, ADR | 5,000 | a | 271,250 |
| Kingsoft | 114,000 | 283,199 | |
| SPT Energy Group | 1,122,000 | 617,947 | |
| Sunny Optical Technology Group | 585,000 | 566,664 | |
| Tencent Holdings | 14,600 | 796,946 | |
| Youku Tudou, ADR | 27,500 | a | 749,100 |
| 9,656,223 | |||
| Hong Kong—11.0% | |||
| AIA Group | 110,000 | 558,300 | |
| China Resources Land | 158,000 | 457,513 | |
| China State Construction | |||
| International Holdings | 504,000 | 848,993 | |
| Hutchison Whampoa | 34,000 | 423,630 | |
| Sands China | 80,000 | 568,554 | |
| 2,856,990 | |||
| India—11.9% | |||
| Glenmark Pharmaceuticals | 55,800 | 511,738 | |
| Hinduja Ventures | 117,218 | 513,276 | |
| Jain Irrigation Systems | 670,000 | 729,363 | |
| Larsen & Toubro | 25,000 | 396,103 | |
| Manappuram Finance | 853,803 | 222,290 |
| The Fund | 9 |
STATEMENT OF INVESTMENTS (continued)
| Common Stocks (continued) | Shares | Value ($) | |
| India (continued) | |||
| Tulip Telecom | 957,447 | a | 118,405 |
| Yes Bank | 101,567 | 609,518 | |
| 3,100,693 | |||
| Indonesia—1.6% | |||
| Electronic City Indonesia | 1,445,000 | 423,021 | |
| Malaysia—6.7% | |||
| Gamuda | 380,000 | 586,459 | |
| Mah Sing Group | 360,000 | 255,550 | |
| MY E.G. Services | 100,000 | 73,521 | |
| Oldtown | 358,300 | 281,594 | |
| Sapurakencana Petroleum | 441,000 | a | 559,015 |
| 1,756,139 | |||
| Philippines—3.4% | |||
| D&L Industries | 1,700,000 | 257,302 | |
| LT Group | 465,000 | 178,854 | |
| Metro Pacific Investments | 1,866,000 | 210,740 | |
| Vista Land & Lifescapes | 1,911,400 | 244,178 | |
| 891,074 | |||
| South Korea—14.0% | |||
| Hyundai Motor | 3,800 | 906,340 | |
| Sapphire Technology | 24,450 | a | 1,032,628 |
| SK Hynix | 40,500 | a | 1,219,868 |
| Woori Finance Holdings | 40,000 | 475,135 | |
| 3,633,971 | |||
| Taiwan—9.4% | |||
| Ledlink Optics | 157,000 | 438,197 | |
| MediaTek | 89,000 | 1,217,788 | |
| Parade Technologies | 105,602 | 790,770 | |
| 2,446,755 |
10
| Common Stocks (continued) | Shares | Value ($) | ||
| Thailand—5.4% | ||||
| Advanced Info Service | 89,000 | 729,157 | ||
| Pruksa Real Estate, NVDR | 787,100 | 563,930 | ||
| Sino Thai Engineering & Construction, NVDR | 160,000 | 119,261 | ||
| 1,412,348 | ||||
| Total Investments (cost $25,710,579) | 100.5 | % | 26,177,214 | |
| Liabilities, Less Cash and Receivables | (.5 | %) | (132,876 | ) |
| Net Assets | 100.0 | % | 26,044,338 | |
| ADR—American Depository Receipts |
| NVDR—Non-Voting Depository Receipts |
| a Non-income producing security. |
| Portfolio Summary (Unaudited)† | |||
| Value (%) | Value (%) | ||
| Information Technology | 31.8 | Health Care | 5.6 |
| Consumer Discretionary | 16.8 | Consumer Staples | 5.2 |
| Industrial | 14.5 | Telecommunication Services | 3.2 |
| Financial | 13.8 | Materials | 1.0 |
| Energy | 8.6 | 100.5 | |
| † Based on net assets. |
| See notes to financial statements. |
| The Fund | 11 |
| STATEMENT OF ASSETS AND LIABILITIES |
| October 31, 2013 |
| Cost | Value | |||
| Assets ($): | ||||
| Investments in securities—See Statement of Investments | 25,710,579 | 26,177,214 | ||
| Cash denominated in foreign currencies | 264,596 | 264,073 | ||
| Receivable for investment securities sold | 605,250 | |||
| Receivable for shares of Common Stock subscribed | 24,481 | |||
| Dividends receivable | 1,489 | |||
| Unrealized appreciation on forward foreign | ||||
| currency exchange contracts—Note 4 | 105 | |||
| Prepaid expenses | 21,976 | |||
| 27,094,588 | ||||
| Liabilities ($): | ||||
| Due to The Dreyfus Corporation and affiliates—Note 3(c) | 63,823 | |||
| Cash overdraft due to Custodian | 250,030 | |||
| Payable for investment securities purchased | 514,422 | |||
| Payable for shares of Common Stock redeemed | 143,635 | |||
| Unrealized depreciation on forward foreign | ||||
| currency exchange contracts—Note 4 | 40 | |||
| Accrued expenses | 78,300 | |||
| 1,050,250 | ||||
| Net Assets ($) | 26,044,338 | |||
| Composition of Net Assets ($): | ||||
| Paid-in capital | 44,107,218 | |||
| Accumulated investment (loss)—net | (132,217 | ) | ||
| Accumulated net realized gain (loss) on investments | (18,395,999 | ) | ||
| Accumulated net unrealized appreciation (depreciation) | ||||
| on investments and foreign currency transactions | 465,336 | |||
| Net Assets ($) | 26,044,338 | |||
| Net Asset Value Per Share | ||||
| Class A | Class C | Class I | ||
| Net Assets ($) | 14,859,998 | 6,352,020 | 4,832,320 | |
| Shares Outstanding | 1,786,498 | 800,120 | 576,471 | |
| Net Asset Value Per Share ($) | 8.32 | 7.94 | 8.38 | |
| See notes to financial statements. | ||||
12
| STATEMENT OF OPERATIONS |
| Year Ended October 31, 2013 |
| Investment Income ($): | ||
| Income: | ||
| Cash dividends (net of $43,925 foreign taxes withheld at source): | ||
| Unaffiliated issuers | 505,557 | |
| Affiliated issuers | 92 | |
| Total Income | 505,649 | |
| Expenses: | ||
| Management fee—Note 3(a) | 405,548 | |
| Shareholder servicing costs—Note 3(c) | 129,176 | |
| Professional fees | 84,594 | |
| Custodian fees—Note 3(c) | 74,881 | |
| Distribution fees—Note 3(b) | 58,435 | |
| Registration fees | 40,777 | |
| Prospectus and shareholders’ reports | 19,052 | |
| Directors’ fees and expenses—Note 3(d) | 6,344 | |
| Interest expense—Note 2 | 981 | |
| Loan commitment fees—Note 2 | 466 | |
| Miscellaneous | 20,727 | |
| Total Expenses | 840,981 | |
| Less—reduction in expenses due to undertaking—Note 3(a) | (180,025 | ) |
| Less—reduction in fees due to earnings credits—Note 3(c) | (74 | ) |
| Net Expenses | 660,882 | |
| Investment (Loss)—Net | (155,233 | ) |
| Realized and Unrealized Gain (Loss) on Investments—Note 4 ($): | ||
| Net realized gain (loss) on investments and foreign currency transactions | (1,492,263 | ) |
| Net realized gain (loss) on forward foreign currency exchange contracts | (86,373 | ) |
| Net Realized Gain (Loss) | (1,578,636 | ) |
| Net unrealized appreciation (depreciation) on | ||
| investments and foreign currency transactions | 1,783,207 | |
| Net unrealized appreciation (depreciation) on | ||
| forward foreign currency exchange contracts | 374 | |
| Net Unrealized Appreciation (Depreciation) | 1,783,581 | |
| Net Realized and Unrealized Gain (Loss) on Investments | 204,945 | |
| Net Increase in Net Assets Resulting from Operations | 49,712 | |
| See notes to financial statements. | ||
| The Fund | 13 |
STATEMENT OF CHANGES IN NET ASSETS
| Year Ended October 31, | ||||
| 2013 | 2012 | |||
| Operations ($): | ||||
| Investment (loss)—net | (155,233 | ) | (149,795 | ) |
| Net realized gain (loss) on investments | (1,578,636 | ) | (12,309,104 | ) |
| Net unrealized appreciation | ||||
| (depreciation) on investments | 1,783,581 | 9,729,022 | ||
| Net Increase (Decrease) in Net Assets | ||||
| Resulting from Operations | 49,712 | (2,729,877 | ) | |
| Capital Stock Transactions ($): | ||||
| Net proceeds from shares sold: | ||||
| Class A | 3,159,693 | 6,651,031 | ||
| Class C | 667,773 | 917,692 | ||
| Class I | 4,227,828 | 7,671,096 | ||
| Cost of shares redeemed: | ||||
| Class A | (9,265,196 | ) | (16,835,029 | ) |
| Class C | (2,837,379 | ) | (4,634,784 | ) |
| Class I | (6,467,658 | ) | (16,666,744 | ) |
| Increase (Decrease) in Net Assets | ||||
| from Capital Stock Transactions | (10,514,939 | ) | (22,896,738 | ) |
| Total Increase (Decrease) in Net Assets | (10,465,227 | ) | (25,626,615 | ) |
| Net Assets ($): | ||||
| Beginning of Period | 36,509,565 | 62,136,180 | ||
| End of Period | 26,044,338 | 36,509,565 | ||
| Accumulated investment (loss)—net | (132,217 | ) | (200,005 | ) |
| Capital Share Transactions (Shares): | ||||
| Class Aa | ||||
| Shares sold | 356,575 | 840,371 | ||
| Shares redeemed | (1,090,529 | ) | (2,112,104 | ) |
| Net Increase (Decrease) in Shares Outstanding | (733,954 | ) | (1,271,733 | ) |
| Class Ca | ||||
| Shares sold | 80,380 | 121,721 | ||
| Shares redeemed | (350,794 | ) | (599,289 | ) |
| Net Increase (Decrease) in Shares Outstanding | (270,414 | ) | (477,568 | ) |
| Class I | ||||
| Shares sold | 465,710 | 940,521 | ||
| Shares redeemed | (743,965 | ) | (2,141,531 | ) |
| Net Increase (Decrease) in Shares Outstanding | (278,255 | ) | (1,201,010 | ) |
| a During the period ended October 31, 2013, 9,987 Class C shares representing $87,288 were exchanged for 9,571 |
| Class A shares. |
See notes to financial statements.
14
FINANCIAL HIGHLIGHTS
The following tables describe the performance for each share class for the fiscal periods indicated.All information (except portfolio turnover rate) reflects financial results for a single fund share.Total return shows how much your investment in the fund would have increased (or decreased) during each period, assuming you had reinvested all dividends and distributions.These figures have been derived from the fund’s financial statements.
| Year Ended October 31, | ||||||||||
| Class A Shares | 2013 | 2012 | 2011 | 2010 | 2009 | |||||
| Per Share Data ($): | ||||||||||
| Net asset value, beginning of period | 8.28 | 8.44 | 12.90 | 10.34 | 4.01 | |||||
| Investment Operations: | ||||||||||
| Investment (loss)—neta | (.03 | ) | (.02 | ) | (.09 | ) | (.02 | ) | (.02 | ) |
| Net realized and unrealized | ||||||||||
| gain (loss) on investments | .07 | (.14 | ) | (4.38 | ) | 2.57 | 6.33 | |||
| Total from Investment Operations | .04 | (.16 | ) | (4.47 | ) | 2.55 | 6.31 | |||
| Proceeds from redemption fees | .00 | b | .00 | b | .01 | .01 | .02 | |||
| Net asset value, end of period | 8.32 | 8.28 | 8.44 | 12.90 | 10.34 | |||||
| Total Return (%)c | .48 | (1.90 | ) | (34.63 | ) | 24.86 | 158.50 | |||
| Ratios/Supplemental Data (%): | ||||||||||
| Ratio of total expenses | ||||||||||
| to average net assets | 2.43 | 2.30 | 1.99 | 2.05 | 2.80 | |||||
| Ratio of net expenses | ||||||||||
| to average net assets | 1.90 | 1.92 | 1.99 | 1.95 | 2.00 | |||||
| Ratio of net investment (loss) | ||||||||||
| to average net assets | (.32 | ) | (.28 | ) | (.77 | ) | (.17 | ) | (.29 | ) |
| Portfolio Turnover Rate | 170.92 | 187.30 | 131.78 | 75.72 | 100.74 | |||||
| Net Assets, end of period ($ x 1,000) | 14,860 | 20,870 | 32,000 | 81,709 | 58,548 | |||||
| a | Based on average shares outstanding at each month end. |
| b | Amount represents less than $.01 per share. |
| c | Exclusive of sales charge. |
See notes to financial statements.
| The Fund | 15 |
FINANCIAL HIGHLIGHTS (continued)
| Year Ended October 31, | ||||||||||
| Class C Shares | 2013 | 2012 | 2011 | 2010 | 2009 | |||||
| Per Share Data ($): | ||||||||||
| Net asset value, beginning of period | 7.96 | 8.18 | 12.61 | 10.18 | 3.98 | |||||
| Investment Operations: | ||||||||||
| Investment (loss)—neta | (.09 | ) | (.08 | ) | (.17 | ) | (.09 | ) | (.08 | ) |
| Net realized and unrealized | ||||||||||
| gain (loss) on investments | .07 | (.14 | ) | (4.27 | ) | 2.51 | 6.27 | |||
| Total from Investment Operations | (.02 | ) | (.22 | ) | (4.44 | ) | 2.42 | 6.19 | ||
| Proceeds from redemption fees | .00 | b | .00 | b | .01 | .01 | .01 | |||
| Net asset value, end of period | 7.94 | 7.96 | 8.18 | 12.61 | 10.18 | |||||
| Total Return (%)c | (.25 | ) | (2.69 | ) | (35.13 | ) | 23.87 | 155.78 | ||
| Ratios/Supplemental Data (%): | ||||||||||
| Ratio of total expenses | ||||||||||
| to average net assets | 3.25 | 3.12 | 2.75 | 2.77 | 3.71 | |||||
| Ratio of net expenses | ||||||||||
| to average net assets | 2.65 | 2.66 | 2.75 | 2.70 | 2.75 | |||||
| Ratio of net investment (loss) | ||||||||||
| to average net assets | (1.07 | ) | (1.00 | ) | (1.51 | ) | (.83 | ) | (.98 | ) |
| Portfolio Turnover Rate | 170.92 | 187.30 | 131.78 | 75.72 | 100.74 | |||||
| Net Assets, end of period ($ x 1,000) | 6,352 | 8,525 | 12,663 | 32,166 | 15,090 | |||||
| a | Based on average shares outstanding at each month end. |
| b | Amount represents less than $.01 per share. |
| c | Exclusive of sales charge. |
See notes to financial statements.
16
| Year Ended October 31, | |||||||||
| Class I Shares | 2013 | 2012 | 2011 | 2010 | 2009 | ||||
| Per Share Data ($): | |||||||||
| Net asset value, beginning of period | 8.32 | 8.50 | 12.96 | 10.34 | 4.00 | ||||
| Investment Operations: | |||||||||
| Investment income (loss)—neta | (.02 | ) | .01 | (.05 | ) | .01 | (.03 | ) | |
| Net realized and unrealized | |||||||||
| gain (loss) on investments | .08 | (.19 | ) | (4.42 | ) | 2.60 | 6.35 | ||
| Total from Investment Operations | .06 | (.18 | ) | (4.47 | ) | 2.61 | 6.32 | ||
| Proceeds from redemption fees | .00 | b | .00 | b | .01 | .01 | .02 | ||
| Net asset value, end of period | 8.38 | 8.32 | 8.50 | 12.96 | 10.34 | ||||
| Total Return (%) | .72 | (2.12 | ) | (34.41 | ) | 25.34 | 158.50 | ||
| Ratios/Supplemental Data (%): | |||||||||
| Ratio of total expenses | |||||||||
| to average net assets | 2.25 | 2.28 | 1.72 | 1.74 | 2.05 | ||||
| Ratio of net expenses | |||||||||
| to average net assets | 1.65 | 1.67 | 1.72 | 1.69 | 1.75 | ||||
| Ratio of net investment income | |||||||||
| (loss) to average net assets | (.20 | ) | .14 | (.43 | ) | .13 | (.31 | ) | |
| Portfolio Turnover Rate | 170.92 | 187.30 | 131.78 | 75.72 | 100.74 | ||||
| Net Assets, end of period ($ x 1,000) | 4,832 | 7,115 | 17,473 | 38,356 | 17,558 | ||||
| a | Based on average shares outstanding at each month end. |
| b | Amount represents less than $.01 per share. |
See notes to financial statements.
| The Fund | 17 |
NOTES TO FINANCIAL STATEMENTS
NOTE 1—Significant Accounting Policies:
Dreyfus Emerging Asia Fund (the “fund”) is a separate non-diversified series of Dreyfus Premier Investment Funds, Inc. (the “Company”), which is registered under the Investment Company Act of 1940, as amended (the “Act”), as an open-end management investment company and operates as a series company currently offering eight series, including the fund. The fund’s investment objective is to seek long-term capital appreciation.The Dreyfus Corporation (the “Manager” or “Dreyfus”), a wholly-owned subsidiary of The Bank of New York Mellon Corporation (“BNY Mellon”), serves as the fund’s investment adviser. Hamon Asian Advisors Limited (“Hamon”), a wholly-owned subsidiary of BNY Mellon and an affiliate of Dreyfus, serves as the fund’s sub-investment adviser.
MBSC Securities Corporation (the “Distributor”), a wholly-owned subsidiary of Dreyfus, is the distributor of the fund’s shares.The fund is authorized to issue 800 million shares of $.001 par value Common Stock. The fund currently offers three classes of shares: Class A (300 million shares authorized), Class C (250 million shares authorized), and Class I (250 million shares authorized). Class A shares generally are subject to a sales charge imposed at the time of purchase. Class C shares are subject to a contingent deferred sales charge (“CDSC”) imposed on Class C shares redeemed within one year of purchase. Class I shares are sold at net asset value per share only to institutional investors. Other differences between the classes include the services offered to and the expenses borne by each class, the allocation of certain transfer agency costs and certain voting rights. Income, expenses (other than expenses attributable to a specific class) and realized and unrealized gains or losses on investments are allocated to each class of shares based on its relative net assets.
The Company accounts separately for the assets, liabilities and operations of each series. Expenses directly attributable to each series are
18
charged to that series’ operations; expenses which are applicable to all series are allocated among them on a pro rata basis.
The Financial Accounting Standards Board (“FASB”) Accounting Standards Codification is the exclusive reference of authoritative U.S. generally accepted accounting principles (“GAAP”) recognized by the FASB to be applied by nongovernmental entities. Rules and interpretive releases of the Securities and Exchange Commission (“SEC”) under authority of federal laws are also sources of authoritative GAAP for SEC registrants. The fund’s financial statements are prepared in accordance with GAAP, which may require the use of management estimates and assumptions.Actual results could differ from those estimates.
The Company enters into contracts that contain a variety of indemnifications. The fund’s maximum exposure under these arrangements is unknown.The fund does not anticipate recognizing any loss related to these arrangements.
(a) Portfolio valuation: The fair value of a financial instrument is the amount that would be received to sell an asset or paid to transfer a liability in an orderly transaction between market participants at the measurement date (i.e., the exit price). GAAP establishes a fair value hierarchy that prioritizes the inputs of valuation techniques used to measure fair value. This hierarchy gives the highest priority to unadjusted quoted prices in active markets for identical assets or liabilities (Level 1 measurements) and the lowest priority to unobservable inputs (Level 3 measurements).
Additionally, GAAP provides guidance on determining whether the volume and activity in a market has decreased significantly and whether such a decrease in activity results in transactions that are not orderly. GAAP requires enhanced disclosures around valuation inputs and techniques used during annual and interim periods.
| The Fund | 19 |
NOTES TO FINANCIAL STATEMENTS (continued)
Various inputs are used in determining the value of the fund’s investments relating to fair value measurements.These inputs are summarized in the three broad levels listed below:
Level 1—unadjusted quoted prices in active markets for identical investments.
Level 2—other significant observable inputs (including quoted prices for similar investments, interest rates, prepayment speeds, credit risk, etc.).
Level 3—significant unobservable inputs (including the fund’s own assumptions in determining the fair value of investments).
The inputs or methodology used for valuing securities are not necessarily an indication of the risk associated with investing in those securities.
Changes in valuation techniques may result in transfers in or out of an assigned level within the disclosure hierarchy. Valuation techniques used to value the fund’s investments are as follows:
Investments in securities are valued at the last sales price on the securities exchange or national securities market on which such securities are primarily traded. Securities listed on the National Market System for which market quotations are available are valued at the official closing price or, if there is no official closing price that day, at the last sales price. Securities not listed on an exchange or the national securities market, or securities for which there were no transactions, are valued at the average of the most recent bid and asked prices, except for open short positions, where the asked price is used for valuation purposes. Bid price is used when no asked price is available. Registered investment companies that are not traded on an exchange are valued at their net asset value. All of the preceding securities are categorized within Level 1 of the fair value hierarchy.
20
Fair valuing of securities may be determined with the assistance of a pricing service using calculations based on indices of domestic securities and other appropriate indicators, such as prices of relevant ADRs and financial futures. Utilizing these techniques may result in transfers between Level 1 and Level 2 of the fair value hierarchy.
When market quotations or official closing prices are not readily available, or are determined not to reflect accurately fair value, such as when the value of a security has been significantly affected by events after the close of the exchange or market on which the security is principally traded (for example, a foreign exchange or market), but before the fund calculates its net asset value, the fund may value these investments at fair value as determined in accordance with the procedures approved by the Company’s Board of Directors (the “Board”). Certain factors may be considered when fair valuing investments such as: fundamental analytical data, the nature and duration of restrictions on disposition, an evaluation of the forces that influence the market in which the securities are purchased and sold, and public trading in similar securities of the issuer or comparable issuers.These securities are either categorized within Level 2 or 3 of the fair value hierarchy depending on the relevant inputs used.
For restricted securities where observable inputs are limited, assumptions about market activity and risk are used and are categorized within Level 3 of the fair value hierarchy.
Investments denominated in foreign currencies are translated to U.S. dollars at the prevailing rates of exchange.
Forward foreign currency exchange contracts (“forward contracts”) are valued at the forward rate and are generally categorized within Level 2 of the fair value hierarchy.
| The Fund | 21 |
NOTES TO FINANCIAL STATEMENTS (continued)
The following is a summary of the inputs used as of October 31, 2013 in valuing the fund’s investments:
| Level 2—Other | Level 3— | |||||
| Level 1— | Significant | Significant | ||||
| Unadjusted | Observable | Unobservable | ||||
| Quoted Prices | Inputs | Inputs | Total | |||
| Assets ($) | ||||||
| Investments in Securities: | ||||||
| Equity Securities—Foreign | ||||||
| Common Stocks† | 26,177,214 | — | — | 26,177,214 | ||
| Other Financial | ||||||
| Instruments: | ||||||
| Forward Foreign | ||||||
| Currency Exchange | ||||||
| Contracts†† | — | 105 | — | 105 | ||
| Liabilities ($) | ||||||
| Other Financial | ||||||
| Instruments: | ||||||
| Forward Foreign | ||||||
| Currency Exchange | ||||||
| Contracts†† | — | (40 | ) | — | (40 | ) |
| † | See Statement of Investments for additional detailed categorizations. |
| †† | Amount shown represents unrealized appreciation (depreciation) at period end. |
At October 31, 2012, $1,427,704 of participation notes were classified within Level 2 of the fair value hierarchy pursuant to the fund’s fair valuation procedures.
(b) Foreign currency transactions: The fund does not isolate that portion of the results of operations resulting from changes in foreign exchange rates on investments from the fluctuations arising from changes in the market prices of securities held. Such fluctuations are included with the net realized and unrealized gain or loss on investments.
Net realized foreign exchange gains or losses arise from sales of foreign currencies, currency gains or losses realized on securities transactions between trade and settlement date, and the difference between the amounts of dividends, interest and foreign withholding taxes recorded
22
on the fund’s books and the U.S. dollar equivalent of the amounts actually received or paid. Net unrealized foreign exchange gains and losses arise from changes in the value of assets and liabilities other than investments resulting from changes in exchange rates. Foreign currency gains and losses on foreign currency transactions are also included with net realized and unrealized gain or loss on investments.
(c) Securities transactions and investment income: Securities transactions are recorded on a trade date basis. Realized gains and losses from securities transactions are recorded on the identified cost basis. Dividend income is recognized on the ex-dividend date and interest income, including, where applicable, accretion of discount and amortization of premium on investments, is recognized on the accrual basis.
(d) Affiliated issuers: Investments in other investment companies advised by Dreyfus are defined as “affiliated” under the Act. Investments in affiliated investment companies during the period ended October 31, 2013 were as follows:
| Affiliated | |||||
| Investment | Value | Value | Net | ||
| Company | 10/31/2012 ($) | Purchases ($) | Sales ($) | 10/31/2013 ($) | Assets (%) |
| Dreyfus | |||||
| Institutional | |||||
| Preferred | |||||
| Plus Money | |||||
| Market Fund | — | 13,338,000 | 13,338,000 | — | — |
(e) Risk: Investing in foreign markets may involve special risks and considerations not typically associated with investing in the U.S.These risks include revaluation of currencies, high rates of inflation, repatriation restrictions on income and capital, and adverse political and economic developments. Moreover, securities issued in these markets may be less liquid, subject to government ownership controls and delayed settlements, and their prices may be more volatile than those of comparable securities in the U.S.
| The Fund | 23 |
NOTES TO FINANCIAL STATEMENTS (continued)
The fund follows an investment policy of investing primarily in Asian emerging market countries. Because the fund’s investments are concentrated in Asian emerging market countries, the fund’s performance is expected to be closely tied to social, political and economic conditions within Asia and to be more volatile than the performance of more geographically diversified funds.
(f) Dividends to shareholders: Dividends are recorded on the ex-dividend date. Dividends from investment income-net and dividends from net realized capital gains, if any, are normally declared and paid annually, but the fund may make distributions on a more frequent basis to comply with the distribution requirements of the Internal Revenue Code of 1986, as amended (the “Code”).To the extent that net realized capital gains can be offset by capital loss carryovers, it is the policy of the fund not to distribute such gains. Income and capital gain distributions are determined in accordance with income tax regulations, which may differ from GAAP.
(g) Federal income taxes: It is the policy of the fund to continue to qualify as a regulated investment company, if such qualification is in the best interests of its shareholders, by complying with the applicable provisions of the Code, and to make distributions of taxable income sufficient to relieve it from substantially all federal income and excise taxes.
As of and during the period ended October 31, 2013, the fund did not have any liabilities for any uncertain tax positions.The fund recognizes interest and penalties, if any, related to uncertain tax positions as income tax expense in the Statement of Operations. During the period ended October 31, 2013, the fund did not incur any interest or penalties.
Each tax year in the four-year period ended October 31, 2013 remains subject to examination by the Internal Revenue Service and state taxing authorities.
At October 31, 2013, the components of accumulated earnings on a tax basis were as follows: accumulated capital losses $18,395,994 and unrealized appreciation $381,092. In addition, the fund deferred for
24
tax purposes late year ordinary losses of $47,978 to the first day of the following fiscal year.
Under the Regulated Investment Company Modernization Act of 2010 (the “2010 Act”), the fund is permitted to carry forward capital losses incurred in taxable years beginning after December 22, 2010 (“post-enactment losses”) for an unlimited period. Furthermore, post-enactment capital loss carryovers retain their character as either short-term or long-term capital losses rather than short-term as they were under previous statute.The 2010 Act requires post-enactment losses to be utilized before the utilization of losses incurred in taxable years prior to the effective date of the 2010 Act (“pre-enactment losses”).As a result of this ordering rule, pre-enactment losses may be more likely to expire unused.
The accumulated capital loss carryover is available for federal income tax purposes to be applied against future net realized capital gains, if any, realized subsequent to October 31, 2013. If not applied, $938,643 of the carryover expires in fiscal year 2016 and $3,614,006 expires in fiscal year 2019.The fund has $4,836,711 of post-enactment short-term capital losses and $9,006,634 of post-enactment long-term capital losses which can be carried forward for an unlimited period.
The fund has analyzed its tax positions with respect to applicable income tax issues for open tax years (in each respective jurisdiction) and determined no material tax liabilities existed. The fund operates in certain jurisdictions where the tax laws are evolving and, therefore, the application and interpretation of these laws and regulations is uncertain. In the future, the fund’s tax position in these jurisdictions may be subject to review from time to time which could result in tax liabilities.
During the period ended October 31, 2013, as a result of permanent book to tax differences, primarily due to the tax treatment for foreign currency gains and losses, passive foreign investment companies and net operating losses, the fund increased accumulated undistributed investment income-net by $223,021, increased accumulated net real-
| The Fund | 25 |
NOTES TO FINANCIAL STATEMENTS (continued)
ized gain (loss) on investments by $68,856 and decreased paid-in capital by $291,877. Net assets and net asset value per share were not affected by this reclassification.
(h) Accounting Pronouncement: In January 2013, FASB issued Accounting Standards Update No. 2013-01 (“ASU 2013-01”), “Clarifying the Scope of Disclosures about Offsetting Assets and Liabilities”, which replaced Accounting Standards Update No. 2011-11 (“ASU 2011-11”),“Disclosures about Offsetting Assets and Liabilities”. ASU 2013-01 is effective for fiscal years beginning on or after January 1, 2013, and interim periods within those annual periods.ASU 2011-11 was intended to enhance disclosure requirements on the offsetting of financial assets and liabilities.ASU 2013-01 limits the scope of the new balance sheet offsetting disclosures to derivatives, repurchase agreements, and securities lending transactions to the extent that they are (1) offset in the financial statements or (2) subject to enforceable master netting arrangements (“MNA”) or similar agreements. Management is currently evaluating the application of ASU 2013-01 and its impact on the fund’s financial statements.
NOTE 2—Bank Lines of Credit:
The fund participates with other Dreyfus-managed funds in a $265 million unsecured credit facility led by Citibank, N.A. and a $300 million unsecured credit facility provided by The Bank of New York Mellon, a subsidiary of BNY Mellon and an affiliate of Dreyfus (each, a “Facility”), each to be utilized primarily for temporary or emergency purposes, including the financing of redemptions. Prior to October 9, 2013, the unsecured credit facility with Citibank, N.A. was $210 million. In connection therewith, the fund has agreed to pay its pro rata portion of commitment fees for each Facility. Interest is charged to the fund based on rates determined pursuant to the terms of the respective Facility at the time of borrowing.
The average amount of borrowings outstanding under the Facilities during the period ended October 31, 2013 was approximately $86,300 with a related weighted average annualized interest rate of 1.14%.
26
NOTE 3—Management Fee, Sub-Investment Advisory Fee and Other Transactions with Affiliates:
(a) Pursuant to a management agreement with Dreyfus, the management fee is computed at the annual rate of 1.25% of the value of the fund’s average daily net assets and is payable monthly.
Dreyfus has contractually agreed, from November 1, 2012 through March 1, 2015, to waive receipt of its fees and/or assume the expenses of the fund so that the direct expenses of none of the classes (excluding Rule 12b-1 Distribution Plan fees, Shareholder Services Plan fees, taxes, interest expense, brokerage commissions, commitment fees on borrowings and extraordinary expenses) exceed 1.65% of the value of the fund’s average daily net assets.The reduction in expenses, pursuant to the undertaking, amounted to $180,025 during the period ended October 31, 2013.
Pursuant to a sub-investment advisory agreement between Dreyfus and Hamon, Dreyfus pays Hamon a fee at the annual rate of .625% of the value of the fund’s average daily net assets and is payable monthly.
During the period ended October 31, 2013, the Distributor retained $3,043 from commissions earned on sales of the fund’s Class A shares and $490 from CDSCs on redemptions of the fund’s Class C shares.
(b) Under the Distribution Plan adopted pursuant to Rule 12b-1 under the Act, Class C shares pay the Distributor for distributing its shares at an annual rate of .75% of the value of its average daily net assets. During the period ended October 31, 2013, Class C shares were charged $58,435 pursuant to the Distribution Plan.
(c) Under the Shareholder Services Plan, Class A and Class C shares pay the Distributor at an annual rate of .25% of the value of their average daily net assets for the provision of certain services.The services provided may include personal services relating to shareholder accounts, such as answering shareholder inquiries regarding the fund and providing reports and other information, and services related to the maintenance of share-
| The Fund | 27 |
NOTES TO FINANCIAL STATEMENTS (continued)
holder accounts.The Distributor may make payments to Service Agents (securities dealers, financial institutions or other industry professionals) with respect to these services.The Distributor determines the amounts to be paid to Service Agents. During the period ended October 31, 2013, Class A and Class C shares were charged $46,183 and $19,478, respectively, pursuant to the Shareholder Services Plan.
The fund has arrangements with the transfer agent and the custodian whereby the fund may receive earnings credits when positive cash balances are maintained, which are used to offset transfer agency and custody fees. For financial reporting purposes, the fund includes net earnings credits as an expense offset in the Statement of Operations.
The fund compensates DreyfusTransfer, Inc., a wholly-owned subsidiary of Dreyfus, under a transfer agency agreement for providing transfer agency and cash management services for the fund. The majority of transfer agency fees are comprised of amounts paid on a per account basis, while cash management fees are related to fund subscriptions and redemptions. During the period ended October 31, 2013, the fund was charged $16,039 for transfer agency services and $583 for cash management services. These fees are included in Shareholder servicing costs in the Statement of Operations. Cash management fees were partially offset by earnings credits of $73.
The fund compensates The Bank of NewYork Mellon under a custody agreement for providing custodial services for the fund.These fees are determined based on net assets, geographic region and transaction activity. During the period ended October 31, 2013, the fund was charged $74,881 pursuant to the custody agreement.
The fund compensated The Bank of New York Mellon under a cash management agreement that was in effect until September 30, 2013 for performing certain cash management services related to fund subscriptions and redemptions. During the period ended October 31, 2013, the fund was charged $296 pursuant to the cash management agreement, which is included in Shareholder servicing costs in the Statement of Operations.These fees were partially offset by earnings credits of $1.
28
During the period ended October 31, 2013, the fund was charged $8,887 for services performed by the Chief Compliance Officer and his staff.
The components of “Due to The Dreyfus Corporation and affiliates” in the Statement of Assets and Liabilities consist of: management fees $28,253, Distribution Plan fees $4,134, Shareholder Services Plan fees $4,575, custodian fees $24,863, Chief Compliance Officer fees $7,445 and transfer agency fees $3,273, which are offset against an expense reimbursement currently in effect in the amount of $8,720.
(d) Each Board member also serves as a Board member of other funds within the Dreyfus complex. Annual retainer fees and attendance fees are allocated to each fund based on net assets.
(e) A 2% redemption fee is charged and retained by the fund on certain shares redeemed within sixty days following the date of issuance subject to certain exceptions, including redemptions made through the use of the fund’s exchange privilege. During the period ended October 31, 2013, redemption fees charged and retained by the fund amounted to $2,700.
NOTE 4—Securities Transactions:
The aggregate amount of purchases and sales of investment securities, excluding short-term securities and forward contracts, during the period ended October 31, 2013, amounted to $55,049,206 and $65,789,324, respectively.
Derivatives: A derivative is a financial instrument whose performance is derived from the performance of another asset. Each type of derivative instrument that was held by the fund during the period ended October 31, 2013 is discussed below.
Forward Foreign Currency Exchange Contracts: The fund enters into forward contracts in order to hedge its exposure to changes in foreign currency exchange rates on its foreign portfolio holdings, to settle foreign currency transactions or as a part of its investment strategy. When executing forward contracts, the fund is obligated to buy or sell
| The Fund | 29 |
NOTES TO FINANCIAL STATEMENTS (continued)
a foreign currency at a specified rate on a certain date in the future.With respect to sales of forward contracts, the fund incurs a loss if the value of the contract increases between the date the forward contract is opened and the date the forward contract is closed.The fund realizes a gain if the value of the contract decreases between those dates.With respect to purchases of forward contracts, the fund incurs a loss if the value of the contract decreases between the date the forward contract is opened and the date the forward contract is closed. The fund realizes a gain if the value of the contract increases between those dates. Any realized or unrealized gains or losses which occurred during the period are reflected in the Statement of Operations.The fund is exposed to foreign currency risk as a result of changes in value of underlying financial instruments. The fund is also exposed to credit risk associated with counterparty nonperformance on these forward contracts, which is generally limited to the unrealized gain on each open contract.The following summarizes open forward contracts at October 31, 2013:
| Foreign | Unrealized | ||||
| Forward Foreign Currency | Currency | Appreciation | |||
| Exchange Contracts | Amounts | Cost ($) | Value ($) | (Depreciation) ($) | |
| Purchases: | |||||
| Hong Kong Dollar, | |||||
| Expiring 11/1/2013a | 570,000 | 73,528 | 73,520 | (8 | ) |
| Sales: | Proceeds ($) | ||||
| Thai Baht, Expiring: | |||||
| 11/1/2013a | 4,089,094 | 131,482 | 131,377 | 105 | |
| 11/4/2013a | 6,228,294 | 200,074 | 200,106 | (32 | ) |
| Gross Unrealized | |||||
| Appreciation | 105 | ||||
| Gross Unrealized | |||||
| Depreciation | (40 | ) |
| Counterparty: |
| a Standard Chartered Bank |
30
The following summarizes the average market value of derivatives outstanding during the period ended October 31, 2013:
| Average Market Value ($) | |
| Forward contracts | 403,257 |
At October 31, 2013, the cost of investments for federal income tax purposes was $25,794,823; accordingly, accumulated net unrealized appreciation on investments was $382,391, consisting of $2,857,231 gross unrealized appreciation and $2,474,840 gross unrealized depreciation.
| The Fund | 31 |
| REPORT OF INDEPENDENT REGISTERED |
| PUBLIC ACCOUNTING FIRM |
Shareholders and Board of Directors
Dreyfus Emerging Asia Fund
We have audited the accompanying statement of assets and liabilities, including the statement of investments, of Dreyfus Emerging Asia Fund (one of the series comprising Dreyfus Premier Investment Funds, Inc.) as of October 31, 2013, and the related statement of operations for the year then ended, the statement of changes in net assets for each of the two years in the period then ended, and the financial highlights for each of the five years in the period then ended. These financial statements and financial highlights are the responsibility of the Fund’s management. Our responsibility is to express an opinion on these financial statements and financial highlights based on our audits.
We conducted our audits in accordance with the standards of the Public Company Accounting Oversight Board (United States).Those standards require that we plan and perform the audit to obtain reasonable assurance about whether the financial statements and financial highlights are free of material misstatement.We were not engaged to perform an audit of the Fund’s internal control over financial reporting. Our audits included consideration of internal control over financial reporting as a basis for designing audit procedures that are appropriate in the circumstances, but not for the purpose of expressing an opinion on the effectiveness of the Fund’s internal control over financial reporting. Accordingly, we express no such opinion. An audit also includes examining, on a test basis, evidence supporting the amounts and disclosures in the financial statements and financial highlights, assessing the accounting principles used and significant estimates made by management, and evaluating the overall financial statement presentation. Our procedures included confirmation of securities owned as of October 31, 2013 by correspondence with the custodian and others. We believe that our audits provide a reasonable basis for our opinion.
In our opinion, the financial statements and financial highlights referred to above present fairly, in all material respects, the financial position of Dreyfus Emerging Asia Fund at October 31, 2013, the results of its operations for the year then ended, the changes in its net assets for each of the two years in the period then ended, and the financial highlights for each of the five years in the period then ended, in conformity with U.S. generally accepted accounting principles.

New York, New York
December 27, 2013
32
IMPORTANT TAX INFORMATION (Unaudited)
In accordance with federal tax law, the fund elects to provide each shareholder with their portion of the fund’s foreign taxes paid and the income sourced from foreign countries.Accordingly, the fund hereby reports the following information regarding its fiscal year ended October 31, 2013:
—the total amount of taxes paid to foreign countries was $39, 608
—the total amount of income sourced from foreign countries was $553,188.
Where required by federal tax law rules, shareholders will receive notification of their proportionate share of foreign taxes paid and foreign sourced income for the 2013 calendar year with Form 1099-DIV which will be mailed in early 2014.
| The Fund | 33 |
BOARD MEMBERS INFORMATION (Unaudited)
| Joseph S. DiMartino (70) |
| Chairman of the Board (1995) |
| Principal Occupation During Past 5Years: |
| • Corporate Director and Trustee |
| Other Public Company Board Memberships During Past 5Years: |
| • CBIZ (formerly, Century Business Services, Inc.), a provider of outsourcing functions for small |
| and medium size companies, Director (1997-present) |
| • The Newark Group, a provider of a national market of paper recovery facilities, paperboard |
| mills and paperboard converting plants, Director (2000-2010) |
| • Sunair Services Corporation, a provider of certain outdoor-related services to homes and |
| businesses, Director (2005-2009) |
| No. of Portfolios for which Board Member Serves: 141 |
| ——————— |
| Peggy C. Davis (70) |
| Board Member (2012) |
| Principal Occupation During Past 5Years: |
| • Shad Professor of Law, New York University School of Law (1983-present) |
| No. of Portfolios for which Board Member Serves: 56 |
| ——————— |
| David P. Feldman (73) |
| Board Member (1991) |
| Principal Occupation During Past 5Years: |
| • Corporate Director and Trustee |
| Other Public Company Board Memberships During Past 5Years: |
| • BBH Mutual Funds Group (4 registered mutual funds), Director (1992-present) |
| No. of Portfolios for which Board Member Serves: 42 |
| ——————— |
| Ehud Houminer (73) |
| Board Member (2012) |
| Principal Occupation During Past 5Years: |
| • Executive-in-Residence at the Columbia Business School, Columbia University (1992-present) |
| Other Public Company Board Memberships During Past 5Years: |
| • Avnet Inc., an electronics distributor, Director (1993-2012) |
| No. of Portfolios for which Board Member Serves: 66 |
34
| Lynn Martin (73) |
| Board Member (1993) |
| Principal Occupation During Past 5Years: |
| • President ofThe Martin Hall Group LLC, a human resources consulting firm (January 2005-2012) |
| Other Public Company Board Memberships During Past 5Years: |
| • AT&T Inc., a telecommunications company, Director (1999-2012) |
| • Ryder System, Inc., a supply chain and transportation management company, Director (1993-2012) |
| • The Proctor & Gamble Co., a consumer products company, Director (1994-2009) |
| • Constellation Energy Group Inc., Director (2003-2009) |
| No. of Portfolios for which Board Member Serves: 42 |
| ——————— |
| Robin A. Melvin (50) |
| Board Member (2011) |
| Principal Occupation During Past 5Years: |
| • Board Member, Illinois Mentoring Partnership, non-profit organization dedicated to increasing |
| the quantity and quality of mentoring services in Illinois (2013-present) |
| • Director, Boisi Family Foundation, a private family foundation that supports youth-serving orga- |
| nizations that promote the self sufficiency of youth from disadvantaged circumstances (1995-2012) |
| No. of Portfolios for which Board Member Serves: 90 |
| ——————— |
| Dr. Martin Peretz (74) |
| Board Member (2012) |
| Principal Occupation During Past 5Years: |
| • Editor-in-Chief Emeritus of The New Republic Magazine (2010-2011) (previously, |
| Editor-in-Chief, 1974-2010) |
| • Director of TheStreet.com, a financial information service on the web (1996-2010) |
| Other Public Company Board Memberships During Past 5Years: |
| • Pershing Square Capital Management,Adviser (2009-present) |
| No. of Portfolios for which Board Member Serves: 42 |
| ——————— |
Once elected all Board Members serve for an indefinite term, but achieve Emeritus status upon reaching age 80.The address of the Board Members and Officers is c/o The Dreyfus Corporation, 200 Park Avenue, NewYork, NewYork 10166. Additional information about the Board Members is available in the fund’s Statement of Additional Information which can be obtained from Dreyfus free of charge by calling this toll free number: 1-800-DREYFUS.
Daniel Rose, Emeritus Board Member
Philip L.Toia, Emeritus Board Member
Sander Vanocur, Emeritus Board Member
| The Fund | 35 |
OFFICERS OF THE FUND (Unaudited)
BRADLEY J. SKAPYAK, President since January 2010.
Chief Operating Officer and a director of the Manager since June 2009, Chairman of Dreyfus Transfer, Inc., an affiliate of the Manager and the transfer agent of the funds, since May 2011 and Executive Vice President of the Distributor since June 2007. From April 2003 to June 2009, Mr. Skapyak was the head of the Investment Accounting and Support Department of the Manager. He is an officer of 68 investment companies (comprised of 141 portfolios) managed by the Manager. He is 55 years old and has been an employee of the Manager since February 1988.
JOHN PAK, Chief Legal Officer since March 2013.
Chief Legal Officer of the Manager and Associate General Counsel and Managing Director of BNY Mellon since August 2012; from March 2005 to July 2012, Managing Director of Deutsche Bank, Deputy Global Head of Deutsche Asset Management Legal and Regional Head of Deutsche Asset Management Americas Legal. He is an officer of 69 investment companies (comprised of 166 portfolios) managed by the Manager. He is 45 years old and has been an employee of the Manager since August 2012.
JANETTE E. FARRAGHER, Vice President and Secretary since December 2011.
Assistant General Counsel of BNY Mellon, and an officer of 69 investment companies (comprised of 166 portfolios) managed by the Manager. She is 50 years old and has been an employee of the Manager since February 1984.
KIESHA ASTWOOD, Vice President and Assistant Secretary since January 2010.
Counsel of BNY Mellon, and an officer of 69 investment companies (comprised of 166 portfolios) managed by the Manager. She is 40 years old and has been an employee of the Manager since July 1995.
JAMES BITETTO, Vice President and Assistant Secretary since August 2005.
Senior Counsel of BNY Mellon and Secretary of the Manager, and an officer of 69 investment companies (comprised of 166 portfolios) managed by the Manager. He is 47 years old and has been an employee of the Manager since December 1996.
JONI LACKS CHARATAN, Vice President and Assistant Secretary since August 2005.
Senior Counsel of BNY Mellon, and an officer of 69 investment companies (comprised of 166 portfolios) managed by the Manager. She is 58 years old and has been an employee of the Manager since October 1988.
JOSEPH M. CHIOFFI, Vice President and Assistant Secretary since August 2005.
Senior Counsel of BNY Mellon, and an officer of 69 investment companies (comprised of 166 portfolios) managed by the Manager. He is 52 years old and has been an employee of the Manager since June 2000.
JOHN B. HAMMALIAN, Vice President and Assistant Secretary since August 2005.
Senior Managing Counsel of BNY Mellon, and an officer of 69 investment companies (comprised of 166 portfolios) managed by the Manager. He is 50 years old and has been an employee of the Manager since February 1991.
ROBERT R. MULLERY, Vice President and Assistant Secretary since August 2005.
Managing Counsel of BNY Mellon, and an officer of 69 investment companies (comprised of 166 portfolios) managed by the Manager. He is 61 years old and has been an employee of the Manager since May 1986.
36
JEFF PRUSNOFSKY, Vice President and Assistant Secretary since August 2005.
Senior Managing Counsel of BNY Mellon, and an officer of 69 investment companies (comprised of 166 portfolios) managed by the Manager. He is 48 years old and has been an employee of the Manager since October 1990.
JAMES WINDELS, Treasurer since November 2001.
Director – Mutual Fund Accounting of the Manager, and an officer of 69 investment companies (comprised of 166 portfolios) managed by the Manager. He is 55 years old and has been an employee of the Manager since April 1985.
RICHARD CASSARO, Assistant Treasurer since January 2008.
Senior Accounting Manager – Money Market and Municipal Bond Funds of the Manager, and an officer of 69 investment companies (comprised of 166 portfolios) managed by the Manager. He is 54 years old and has been an employee of the Manager since September 1982.
GAVIN C. REILLY, Assistant Treasurer since December 2005.
Tax Manager of the Investment Accounting and Support Department of the Manager, and an officer of 69 investment companies (comprised of 166 portfolios) managed by the Manager. He is 45 years old and has been an employee of the Manager since April 1991.
ROBERT S. ROBOL, Assistant Treasurer since August 2005.
Senior Accounting Manager – Fixed Income Funds of the Manager, and an officer of 69 investment companies (comprised of 166 portfolios) managed by the Manager. He is 49 years old and has been an employee of the Manager since October 1988.
ROBERT SALVIOLO, Assistant Treasurer since July 2007.
Senior Accounting Manager – Equity Funds of the Manager, and an officer of 69 investment companies (comprised of 166 portfolios) managed by the Manager. He is 46 years old and has been an employee of the Manager since June 1989.
ROBERT SVAGNA, Assistant Treasurer since December 2002.
Senior Accounting Manager – Equity Funds of the Manager, and an officer of 69 investment companies (comprised of 166 portfolios) managed by the Manager. He is 46 years old and has been an employee of the Manager since November 1990.
JOSEPH W. CONNOLLY, Chief Compliance Officer since October 2004.
Chief Compliance Officer of the Manager and The Dreyfus Family of Funds (69 investment companies, comprised of 166 portfolios). He is 56 years old and has served in various capacities with the Manager since 1980, including manager of the firm’s Fund Accounting Department from 1997 through October 2001.
MATTHEW D. CONNOLLY, Anti-Money Laundering Compliance Officer since April 2012.
Anti-Money Laundering Compliance Officer of the Distributor since October 2011; from March 2010 to September 2011, Global Head, KYC Reviews and Director, UBS Investment Bank; until March 2010, AML Compliance Officer and Senior Vice President, Citi Global Wealth Management. He is an officer of 64 investment companies (comprised of 161 portfolios) managed by the Manager. He is 41 years old and has been an employee of the Distributor since October 2011.
| The Fund | 37 |
For More Information
Telephone Call your financial representative or 1-800-DREYFUS
Mail The Dreyfus Family of Funds, 144 Glenn Curtiss Boulevard, Uniondale, NY 11556-0144
The fund files its complete schedule of portfolio holdings with the Securities and Exchange Commission (“SEC”) for the first and third quarters of each fiscal year on Form N-Q. The fund’s Forms N-Q are available on the SEC’s website at http://www.sec.gov and may be reviewed and copied at the SEC’s Public Reference Room in Washington, DC. Information on the operation of the Public Reference Room may be obtained by calling 1-800-SEC-0330.
A description of the policies and procedures that the fund uses to determine how to vote proxies relating to portfolio securities, and information regarding how the fund voted these proxies for the most recent 12-month period ended June 30 is available at http://www.dreyfus.com and on the SEC’s website at http://www.sec.gov. The description of the policies and procedures is also available without charge, upon request, by calling 1-800-DREYFUS.

| Dreyfus |
| Greater China Fund |
ANNUAL REPORT October 31, 2013
Save time. Save paper. View your next shareholder report online as soon as it’s available. Log into www.dreyfus.com and sign up for Dreyfus eCommunications. It’s simple and only takes a few minutes.
The views expressed in this report reflect those of the portfolio manager only through the end of the period covered and do not necessarily represent the views of Dreyfus or any other person in the Dreyfus organization. Any such views are subject to change at any time based upon market or other conditions and Dreyfus disclaims any responsibility to update such views.These views may not be relied on as investment advice and, because investment decisions for a Dreyfus fund are based on numerous factors, may not be relied on as an indication of trading intent on behalf of any Dreyfus fund.
| Not FDIC-Insured • Not Bank-Guaranteed • May Lose Value |
Contents | |
THE FUND | |
| 2 | A Letter from the President |
| 3 | Discussion of Fund Performance |
| 6 | Fund Performance |
| 8 | Understanding Your Fund’s Expenses |
| 8 | Comparing Your Fund’s Expenses With Those of Other Funds |
| 9 | Statement of Investments |
| 12 | Statement of Assets and Liabilities |
| 13 | Statement of Operations |
| 14 | Statement of Changes in Net Assets |
| 16 | Financial Highlights |
| 19 | Notes to Financial Statements |
| 33 | Report of Independent Registered Public Accounting Firm |
| 34 | Important Tax Information |
| 35 | Board Members Information |
| 37 | Officers of the Fund |
FOR MORE INFORMATION | |
Back Cover |
Dreyfus
Greater China Fund
The Fund
A LETTER FROM THE PRESIDENT
Dear Shareholder:
We are pleased to present this annual report for Dreyfus Greater China Fund, covering the 12-month period from November 1, 2012, through October 31, 2013. For information about how the fund performed during the reporting period, as well as general market perspectives, we provide a Discussion of Fund Performance on the pages that follow.
Improving global economic conditions drove developed stock markets higher over much of the reporting period. Europe appeared to put the worst of its sovereign debt and banking crises behind it, and Japan embarked on a new economic course designed to reflate its long-stagnant domestic economy. However, the world’s emerging markets struggled with the effects of local economic slowdowns. As a result, equity market returns varied widely from one country to another over the past 12 months.
We currently expect global economic conditions to continue to improve in 2014, with stronger growth in many developed countries fueled by past and continuing monetary ease. The emerging markets seem poised for moderate economic expansion despite recently negative investor sentiment. In the United States, we anticipate accelerating growth supported by the fading drags of tighter federal fiscal policies and downsizing on the state and local levels. For more information on how these observations may affect your investments, we encourage you to speak with your financial advisor.
Thank you for your continued confidence and support.

J. Charles Cardona
President
The Dreyfus Corporation
November 15, 2013
2
DISCUSSION OF FUND PERFORMANCE
For the period of November 1, 2012, through October 31, 2013, as provided by Hugh Simon, Raymond Chan, and William Liu, Portfolio Managers of Hamon Asian Advisors Limited, Sub-Investment Adviser
Fund and Market Performance Overview
For the 12-month period ended October 31, 2013, Dreyfus Greater China Fund’s Class A shares produced a total return of 28.18%, Class C shares returned 27.17%, and Class I shares returned 28.52%.1 In comparison, the fund’s benchmark, the Hang Seng Index, produced a total return of 10.90% (USD terms) for the same period.2
Weakness among Chinese stocks early in the reporting period was more than offset by subsequent gains when fears of a more severe economic slowdown were not realized and foreign investment capital returned to the region. The fund produced higher returns than its benchmark, mainly due to its focus on midcap stocks in market sectors experiencing positive secular growth trends.
The Fund’s Investment Approach
The fund, which seeks long-term capital appreciation, normally invests at least 80% of its net assets in stocks of companies that (i) are principally traded in China, Hong Kong, orTaiwan (Greater China), (ii) derive at least 50% of their revenues from Greater China, or (iii) have at least 50% of their assets in Greater China.To determine where the fund will invest, we analyze several factors, including economic and political trends in Greater China, the current financial condition and future prospects of individual companies and sectors in the region, and the valuation of one market or company relative to that of another.
Shifting Economic Expectations Sparked Market Volatility
Uncertainty surrounding a domestic economic slowdown and the installation of new government leadership in China made foreign investors nervous early in the reporting period, leading to capital outflows from emerging markets. Instead, investors favored more developed regions of the world, such as the United States, where economic recoveries had gained traction. In addition, Chinese corporations generally reported soft earnings at the time, adding to investor uncertainty. Market
| The Fund | 3 |
DISCUSSION OF FUND PERFORMANCE (continued)
declines were especially steep in the spring, when relatively hawkish comments from U.S. monetary policymakers further dampened global investor sentiment.
Chinese equities began to rally in July when it became clearer that the nation’s domestic economy was not slowing as much as investors had feared, Chinese banks demonstrated that they were able to manage their debt loads, and property markets proved resilient. Despite continued market volatility over the summer, these developments reassured investors, and capital inflows returned to the region. Investors were especially attracted to Chinese technology companies that appeared poised for significant growth. Health care companies and consumer-oriented businesses also fared well late in the reporting period.
Midcap Focus Buoyed Relative Results
The fund’s relative performance was bolstered by overweight exposure to midcap companies in the information technology sector, where security software and e-commerce platform provider Qihoo 360 Technology ADR gained market share at the expense of larger rivals as consumers increasingly purchased goods through the Internet. Enterprise and gaming software developer Kingsoft more than doubled in value after reporting robust gains in its mobile applications unit. Among large-cap technology companies, social media providerTencent Holdings also saw greater adoption of its mobile services, enabling it to gain subscribers and post higher advertising revenues.
The fund also scored successes in other areas. For example, in the consumer discretionary sector, carmaker Chongqing Changan Automobile, Cl. B encountered rising demand for the SUVs it manufactures through a joint venture with General Motors. In the health care sector, drug distributor China Medical Systems Holdings profited from higher health care spending by an expanding middle class of consumers. Finally, the fund benefited from underweight exposure to the energy sector, which struggled due to lower commodity prices in the sluggish global economy.
The fund encountered disappointments among individual stocks across several market sectors. Among financial companies, China Taiping Insurance Holdings reported slowing premium growth amid challenging conditions in the financial markets, prompting its elimination from the portfolio. In the energy sector, solar energy equipment maker GCL-Poly Energy Holdings struggled with lower silicon prices. In the consumer discretionary sector, luxury watch purveyor Hengdeli Holdings was hurt by slowing demand amid economic concerns and a government anti-corruption campaign.
4
Finding Opportunities Among Domestic Companies
Although market volatility may persist over the near term, we believe that fears of a severe economic slowdown in China have been overblown. Indeed, we currently expect China’s gross domestic product to grow at a 7% to 8% annual rate in 2014. While this is a slower growth rate than the country achieved over the past decade, we note that the economy is substantially larger than it was 10 years ago and therefore is expanding from a larger base.
We have identified a number of companies that we expect to benefit from China’s shift from an export-driven economy to a more domestic focus.As of the reporting period’s end, the fund held overweight exposure to domestic-oriented companies in the information technology, health care, housing, and aviation equipment industries.
November 15, 2013
Please note, the position in any security highlighted with italicized typeface was sold during the reporting period. Emerging markets, such as those of China and Taiwan, tend to be more volatile than the markets of more mature economies, and generally have less diverse and less mature economic structures and less stable political systems than those of developed countries.The securities of companies located in emerging markets are often subject to rapid and large changes in price. An investment in this fund should be considered only as a supplement to a complete investment program for those investors willing to accept the greater risks associated with investments in emerging markets. Equity funds are subject generally to market, market sector, market liquidity, issuer and investment style risks, among other factors, to varying degrees, all of which are more fully described in the fund’s prospectus.
The fund’s performance will be influenced by political, social and economic factors affecting investments in foreign companies. Special risks associated with investments in foreign companies include exposure to currency fluctuations, less liquidity, less developed or less efficient trading markets, lack of comprehensive company information, political instability and differing auditing and legal standards.These risks are enhanced in emerging market countries.
| 1 Total return includes reinvestment of dividends and any capital gains paid, and does not take into consideration the |
| maximum initial sales charge in the case of Class A shares, or the applicable contingent deferred sales charge imposed on |
| redemptions in the case of Class C shares. Had these charges been reflected, returns would have been lower. Past |
| performance is no guarantee of future results. Share price and investment return fluctuate such that upon redemption, fund |
| shares may be worth more or less than their original cost. Return figures provided reflect the absorption of certain fund |
| expenses by The Dreyfus Corporation pursuant to an agreement in effect until March 31, 2014, at which time it may |
| be extended, terminated or modified. Had these expenses not been absorbed, the fund’s returns would have been lower. |
| 2 SOURCE: BLOOMBERG L.P. – Reflects reinvestment of dividends and, where applicable, capital gain |
| distributions.The Hang Seng Index is a free-float capitalization-weighted index of 36 companies that represents |
| approximately 66% of the total market cap of the Stock Exchange of Hong Kong. Index components are capped at |
| 25% and divided into four sub-indexes. Return quoted is in U.S. dollars. Investors cannot invest directly in any index. |
| The Fund | 5 |
FUND PERFORMANCE
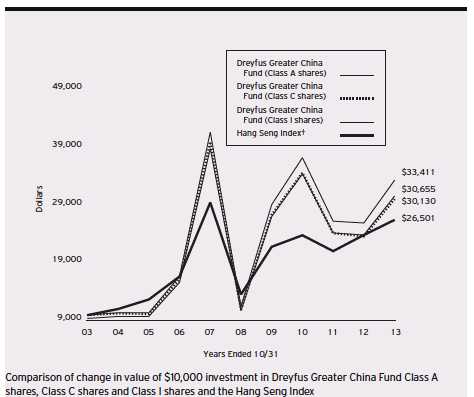
| † Source: Bloomberg L.P. |
| Past performance is not predictive of future performance. |
| The above graph compares a $10,000 investment made in each of the Class A, Class C and Class I shares of Dreyfus |
| Greater China Fund on 10/31/03 to a $10,000 investment made in the Hang Seng Index (the “Index”) on that |
| date.All dividends and capital gain distributions are reinvested. |
| The fund’s performance shown in the line graph above takes into account the maximum initial sales charge on Class A |
| shares and all other applicable fees and expenses on all classes.The Index is a capitalization-weighted index of |
| approximately 33 companies that represent 70 percent of the total market capitalization of the Stock Exchange of Hong |
| Kong.The components of the Index are divided into four subindices: Commerce, Finance, Utilities and Properties.The |
| Index reflects reinvestment of net dividends and where applicable, capital gain distributions. Unlike a mutual fund, the |
| Index is not subject to charges, fees and other expenses. Investors cannot invest directly in any index. Further information |
| relating to fund performance, including expense reimbursements, if applicable, is contained in the Financial Highlights |
| section of the prospectus and elsewhere in this report. |
6
| Average Annual Total Returns as of 10/31/13 | ||||||
| 1 Year | 5 Years | 10 Years | ||||
| Class A shares | ||||||
| with maximum sales charge (5.75%) | 20.82 | % | 21.86 | % | 11.85 | % |
| without sales charge | 28.18 | % | 23.31 | % | 12.52 | % |
| Class C shares | ||||||
| with applicable redemption charge † | 26.17 | % | 22.37 | % | 11.66 | % |
| without redemption | 27.17 | % | 22.37 | % | 11.66 | % |
| Class I shares | 28.52 | % | 23.64 | % | 12.82 | % |
| Hang Seng Index | 10.90 | % | 14.32 | % | 10.23 | % |
Past performance is not predictive of future performance.The fund’s performance shown in the graph and table does not reflect the deduction of taxes that a shareholder would pay on fund distributions or the redemption of fund shares.
| † The maximum contingent deferred sales charge for Class C shares is 1% for shares redeemed within one year of the |
| date of purchase. |
| The Fund | 7 |
UNDERSTANDING YOUR FUND’S EXPENSES (Unaudited)
As a mutual fund investor, you pay ongoing expenses, such as management fees and other expenses. Using the information below, you can estimate how these expenses affect your investment and compare them with the expenses of other funds.You also may pay one-time transaction expenses, including sales charges (loads) and redemption fees, which are not shown in this section and would have resulted in higher total expenses. For more information, see your fund’s prospectus or talk to your financial adviser.
Review your fund’s expenses
The table below shows the expenses you would have paid on a $1,000 investment in Dreyfus Greater China Fund from May 1, 2013 to October 31, 2013. It also shows how much a $1,000 investment would be worth at the close of the period, assuming actual returns and expenses.
Expenses and Value of a $1,000 Investment
assuming actual returns for the six months ended October 31, 2013
| Class A | Class C | Class I | |
| Expenses paid per $1,000† | $9.17 | $13.29 | $7.59 |
| Ending value (after expenses) | $1,165.60 | $1,161.50 | $1,167.60 |
COMPARING YOUR FUND’S EXPENSES
WITH THOSE OF OTHER FUNDS (Unaudited)
Using the SEC’s method to compare expenses
The Securities and Exchange Commission (SEC) has established guidelines to help investors assess fund expenses. Per these guidelines, the table below shows your fund’s expenses based on a $1,000 investment, assuming a hypothetical 5% annualized return. You can use this information to compare the ongoing expenses (but not transaction expenses or total cost) of investing in the fund with those of other funds.All mutual fund shareholder reports will provide this information to help you make this comparison. Please note that you cannot use this information to estimate your actual ending account balance and expenses paid during the period.
Expenses and Value of a $1,000 Investment
assuming a hypothetical 5% annualized return for the six months ended October 31, 2013
| Class A | Class C | Class I | |
| Expenses paid per $1,000† | $8.54 | $12.38 | $7.07 |
| Ending value (after expenses) | $1,016.74 | $1,012.91 | $1,018.20 |
| † Expenses are equal to the fund’s annualized expense ratio of 1.68% for Class A, 2.44% for Class C and 1.39% |
| for Class I, multiplied by the average account value over the period, multiplied by 184/365 (to reflect the one-half |
| year period). |
8
| STATEMENT OF INVESTMENTS |
| October 31, 2013 |
| Common Stocks—96.2% | Shares | Value ($) | |
| Automobiles & Components—6.3% | |||
| Chongqing Changan Automobile, Cl. B | 12,343,500 | 22,766,935 | |
| Banks—1.1% | |||
| BOC Hong Kong Holdings | 1,202,000 | 3,922,430 | |
| Capital Goods—14.9% | |||
| AviChina Industry & Technology, Cl. H | 29,400,000 | 13,954,856 | |
| China State Construction | |||
| International Holdings | 11,566,000 | 19,483,034 | |
| Hutchison Whampoa | 998,000 | 12,434,774 | |
| L.K. Technology Holdings | 41,090,000 | a | 8,108,822 |
| 53,981,486 | |||
| Consumer Services—2.3% | |||
| Sands China | 1,176,000 | 8,357,745 | |
| Diversified Financials—3.3% | |||
| Far East Horizon | 16,212,000 | 11,856,319 | |
| Energy—8.2% | |||
| CNOOC | 8,658,000 | 17,778,326 | |
| SPT Energy Group | 21,508,000 | 11,845,629 | |
| 29,623,955 | |||
| Food, Beverage & Tobacco—3.3% | |||
| China Huishan Dairy Holdings | 29,700,000 | 11,798,788 | |
| Health Care Equipment & | |||
| Services—.8% | |||
| Biosensors International Group | 4,000,000 | 3,026,888 | |
| Insurance—4.3% | |||
| AIA Group | 3,090,000 | 15,683,155 | |
| Pharmaceuticals, Biotech & | |||
| Life Sciences—5.0% | |||
| China Medical System Holdings | 19,909,000 | 17,898,327 |
| The Fund | 9 |
STATEMENT OF INVESTMENTS (continued)
| Common Stocks (continued) | Shares | Value ($) | |
| Real Estate—5.7% | |||
| China Merchants Property Development, Cl. B | 1,120,000 | 3,357,255 | |
| China Resources Land | 4,268,000 | 12,358,648 | |
| Yuexiu Real Estate Investment Trust | 9,600,000 | 4,829,098 | |
| 20,545,001 | |||
| Retailing—6.1% | |||
| Baoxin Auto Group | 11,090,500 | 11,429,523 | |
| China ZhengTong Auto Services Holdings | 10,035,000 | a | 6,989,423 |
| Ctrip.com International, ADR | 67,000 | a | 3,634,750 |
| 22,053,696 | |||
| Semiconductors & Semiconductor | |||
| Equipment—8.2% | |||
| MediaTek | 1,360,000 | 18,608,894 | |
| Parade Technologies | 1,464,032 | 10,962,986 | |
| 29,571,880 | |||
| Software & Services—19.6% | |||
| AutoNavi Holdings, ADR | 230,000 | a | 3,555,800 |
| Baidu, ADR | 72,500 | a | 11,665,250 |
| Kingsoft | 2,943,000 | 7,311,000 | |
| Qihoo 360 Technology, ADR | 86,754 | a | 7,169,351 |
| Tencent Holdings | 455,000 | 24,836,321 | |
| Youku Tudou, ADR | 590,000 | a | 16,071,600 |
| 70,609,322 | |||
| Technology Hardware & Equipment—6.0% | |||
| Sunny Optical Technology Group | 9,940,000 | 9,628,454 | |
| ZTE, Cl. H | 5,560,000 | a | 12,119,696 |
| 21,748,150 | |||
| Utilities—1.1% | |||
| Guangdong Investment | 4,656,000 | 4,005,613 | |
| Total Common Stocks | |||
| (cost $266,312,866) | 347,449,690 |
10
| Number of | ||||
| Participation Notes—3.9% | Participation Notes | Value ($) | ||
| Diversified Financials—2.9% | ||||
| CITIC Securities, Cl. A (12/16/13) | 5,379,552 | a,b | 10,460,001 | |
| Real Estate—1.0% | ||||
| China Vanke, Cl. A (1/22/15) | 2,400,000 | a,b | 3,626,880 | |
| Total Participation Notes | ||||
| (cost $15,140,076) | 14,086,881 | |||
| Total Investments (cost $281,452,942) | 100.1 | % | 361,536,571 | |
| Liabilities, Less Cash and Receivables | (.1 | %) | (496,216 | ) |
| Net Assets | 100.0 | % | 361,040,355 | |
ADR—American Depository Receipts
| a Non-income producing security. |
| b Securities exempt from registration pursuant to Rule 144A under the Securities Act of 1933.These securities may be |
| resold in transactions exempt from registration, normally to qualified institutional buyers.At October 31, 2013, these |
| securities were valued at $14,086,881 or 3.9% of net assets. |
| Portfolio Summary (Unaudited)† | |||
| Value (%) | Value (%) | ||
| Software & Services | 19.6 | Pharmaceuticals, | |
| Capital Goods | 14.9 | Biotech & Life Sciences | 5.0 |
| Energy | 8.2 | Insurance | 4.3 |
| Semiconductors & | Food, Beverage & Tobacco | 3.3 | |
| Semiconductor Equipment | 8.2 | Consumer Services | 2.3 |
| Real Estate | 6.7 | Banks | 1.1 |
| Automobiles & Components | 6.3 | Utilities | 1.1 |
| Diversified Financials | 6.2 | Health Care Equipment & Services | .8 |
| Retailing | 6.1 | ||
| Technology Hardware & Equipment | 6.0 | 100.1 | |
| † Based on net assets. | |||
| See notes to financial statements. | |||
| The Fund | 11 |
| STATEMENT OF ASSETS AND LIABILITIES |
| October 31, 2013 |
| Cost | Value | |||
| Assets ($): | ||||
| Investments in securities—See Statement of Investments | 281,452,942 | 361,536,571 | ||
| Cash | 113,445 | |||
| Cash denominated in foreign currencies | 95,588 | 96,583 | ||
| Receivable for investment securities sold | 6,462,795 | |||
| Receivable for shares of Common Stock subscribed | 223,679 | |||
| Dividends receivable | 44,096 | |||
| Prepaid expenses | 20,736 | |||
| 368,497,905 | ||||
| Liabilities ($): | ||||
| Due to The Dreyfus Corporation and affiliates—Note 3(c) | 615,196 | |||
| Bank loan payable—Note 2 | 4,100,000 | |||
| Payable for investment securities purchased | 1,384,614 | |||
| Payable for shares of Common Stock redeemed | 1,162,124 | |||
| Unrealized depreciation on forward foreign | ||||
| currency exchange contracts—Note 4 | 401 | |||
| Interest payable—Note 2 | 211 | |||
| Accrued expenses | 195,004 | |||
| 7,457,550 | ||||
| Net Assets ($) | 361,040,355 | |||
| Composition of Net Assets ($): | ||||
| Paid-in capital | 329,238,478 | |||
| Accumulated net realized gain (loss) on investments | (48,282,547 | ) | ||
| Accumulated net unrealized appreciation (depreciation) | ||||
| on investments and foreign currency transactions | 80,084,424 | |||
| Net Assets ($) | 361,040,355 | |||
| Net Asset Value Per Share | ||||
| Class A | Class C | Class I | ||
| Net Assets ($) | 200,987,636 | 99,380,362 | 60,672,357 | |
| Shares Outstanding | 4,823,439 | 2,698,711 | 1,402,657 | |
| Net Asset Value Per Share ($) | 41.67 | 36.83 | 43.26 | |
| See notes to financial statements. | ||||
12
| STATEMENT OF OPERATIONS |
| Year Ended October 31, 2013 |
| Investment Income ($): | ||
| Income: | ||
| Cash dividends (net of $33,059 foreign taxes withheld at source): | ||
| Unaffiliated issuers | 5,986,207 | |
| Affiliated issuers | 3,133 | |
| Total Income | 5,989,340 | |
| Expenses: | ||
| Management fee—Note 3(a) | 4,614,031 | |
| Shareholder servicing costs—Note 3(c) | 1,391,544 | |
| Distribution fees—Note 3(b) | 770,115 | |
| Custodian fees—Note 3(c) | 266,944 | |
| Prospectus and shareholders’ reports | 82,128 | |
| Professional fees | 78,482 | |
| Registration fees | 48,297 | |
| Directors’ fees and expenses—Note 3(d) | 32,856 | |
| Interest expense—Note 2 | 3,375 | |
| Loan commitment fees—Note 2 | 3,359 | |
| Miscellaneous | 37,253 | |
| Total Expenses | 7,328,384 | |
| Less—reduction in expenses due to undertaking—Note 3(a) | (538,190 | ) |
| Less—reduction in fees due to earnings credits—Note 3(c) | (875 | ) |
| Net Expenses | 6,789,319 | |
| Investment (Loss)—Net | (799,979 | ) |
| Realized and Unrealized Gain (Loss) on Investments—Note 4 ($): | ||
| Net realized gain (loss) on investments and foreign currency transactions | 37,084,138 | |
| Net realized gain (loss) on forward foreign currency exchange contracts | (98,124 | ) |
| Net Realized Gain (Loss) | 36,986,014 | |
| Net unrealized appreciation (depreciation) on | ||
| investments and foreign currency transactions | 51,556,988 | |
| Net unrealized appreciation (depreciation) on | ||
| forward foreign currency exchange contracts | (99 | ) |
| Net Unrealized Appreciation (Depreciation) | 51,556,889 | |
| Net Realized and Unrealized Gain (Loss) on Investments | 88,542,903 | |
| Net Increase in Net Assets Resulting from Operations | 87,742,924 | |
| See notes to financial statements. | ||
| The Fund | 13 |
STATEMENT OF CHANGES IN NET ASSETS
| Year Ended October 31, | ||||
| 2013 | 2012 | a | ||
| Operations ($): | ||||
| Investment (loss)—net | (799,979 | ) | (2,123,024 | ) |
| Net realized gain (loss) on investments | 36,986,014 | (80,765,548 | ) | |
| Net unrealized appreciation | ||||
| (depreciation) on investments | 51,556,889 | 66,358,939 | ||
| Net Increase (Decrease) in Net Assets | ||||
| Resulting from Operations | 87,742,924 | (16,529,633 | ) | |
| Dividends to Shareholders from ($): | ||||
| Net realized gain on investments: | ||||
| Class A | — | (14,953,486 | ) | |
| Class B | — | (204,333 | ) | |
| Class C | — | (8,394,746 | ) | |
| Class I | — | (4,147,846 | ) | |
| Total Dividends | — | (27,700,411 | ) | |
| Capital Stock Transactions ($): | ||||
| Net proceeds from shares sold: | ||||
| Class A | 35,858,935 | 37,990,641 | ||
| Class B | — | 31,633 | ||
| Class C | 6,312,798 | 7,848,943 | ||
| Class I | 19,253,255 | 24,347,409 | ||
| Dividends reinvested: | ||||
| Class A | — | 13,088,516 | ||
| Class B | — | 166,227 | ||
| Class C | — | 5,521,449 | ||
| Class I | — | 2,537,328 | ||
| Cost of shares redeemed: | ||||
| Class A | (92,222,816 | ) | (122,160,289 | ) |
| Class B | — | (4,074,040 | ) | |
| Class C | (37,658,853 | ) | (46,635,460 | ) |
| Class I | (30,566,844 | ) | (49,011,034 | ) |
| Increase (Decrease) in Net Assets | ||||
| from Capital Stock Transactions | (99,023,525 | ) | (130,348,677 | ) |
| Total Increase (Decrease) in Net Assets | (11,280,601 | ) | (174,578,721 | ) |
| Net Assets ($): | ||||
| Beginning of Period | 372,320,956 | 546,899,677 | ||
| End of Period | 361,040,355 | 372,320,956 | ||
| Accumulated investment (loss)—net | — | (517,873 | ) | |
14
| Year Ended October 31, | ||||
| 2013 | 2012 | a | ||
| Capital Share Transactions: | ||||
| Class Ab,c | ||||
| Shares sold | 966,205 | 1,178,701 | ||
| Shares issued for dividends reinvested | — | 439,507 | ||
| Shares redeemed | (2,539,184 | ) | (3,883,864 | ) |
| Net Increase (Decrease) in Shares Outstanding | (1,572,979 | ) | (2,265,656 | ) |
| Class Bb | ||||
| Shares sold | — | 1,183 | ||
| Shares issued for dividends reinvested | — | 6,233 | ||
| Shares redeemed | — | (135,407 | ) | |
| Net Increase (Decrease) in Shares Outstanding | — | (127,991 | ) | |
| Class Cc | ||||
| Shares sold | 192,868 | 280,952 | ||
| Shares issued for dividends reinvested | — | 206,796 | ||
| Shares redeemed | (1,170,647 | ) | (1,655,291 | ) |
| Net Increase (Decrease) in Shares Outstanding | (977,779 | ) | (1,167,543 | ) |
| Class I | ||||
| Shares sold | 495,874 | 730,275 | ||
| Shares issued for dividends reinvested | — | 82,488 | ||
| Shares redeemed | (813,560 | ) | (1,502,704 | ) |
| Net Increase (Decrease) in Shares Outstanding | (317,686 | ) | (689,941 | ) |
| a Effective as of the close of business on March 13, 2012, the fund no longer offers Class B shares. |
| b During the period ended October 31, 2012, 34,313 Class B shares representing $1,050,013 were automatically |
| converted to 30,865 Class A shares. |
| c During the period ended October 31, 2013, 120,388 Class C shares representing $3,992,053 were exchanged for |
| 106,768 Class A shares. |
See notes to financial statements.
| The Fund | 15 |
FINANCIAL HIGHLIGHTS
The following tables describe the performance for each share class for the fiscal periods indicated. All information (except portfolio turnover rate) reflects financial results for a single fund share.Total return shows how much your investment in the fund would have increased (or decreased) during each period, assuming you had reinvested all dividends and distributions.These figures have been derived from the fund’s financial statements.
| Year Ended October 31, | ||||||||||
| Class A Shares | 2013 | 2012 | 2011 | 2010 | 2009 | |||||
| Per Share Data ($): | ||||||||||
| Net asset value, beginning of period | 32.51 | 34.97 | 51.10 | 40.09 | 15.93 | |||||
| Investment Operations: | ||||||||||
| Investment (loss)—neta | (.01 | ) | (.10 | ) | (.13 | ) | (.27 | ) | (.10 | ) |
| Net realized and unrealized | ||||||||||
| gain (loss) on investments | 9.17 | (.55 | ) | (14.65 | ) | 11.26 | 24.22 | |||
| Total from Investment Operations | 9.16 | (.65 | ) | (14.78 | ) | 10.99 | 24.12 | |||
| Distributions: | ||||||||||
| Dividends from net realized | ||||||||||
| gain on investments | — | (1.81 | ) | (1.36 | ) | — | — | |||
| Proceeds from redemption fees | .00 | b | .00 | b | .01 | .02 | .04 | |||
| Net asset value, end of period | 41.67 | 32.51 | 34.97 | 51.10 | 40.09 | |||||
| Total Return (%)c | 28.18 | (1.37 | ) | (29.73 | ) | 27.43 | 151.88 | |||
| Ratios/Supplemental Data (%): | ||||||||||
| Ratio of total expenses | ||||||||||
| to average net assets | 1.82 | 1.92 | 1.84 | 1.89 | 1.95 | |||||
| Ratio of net expenses | ||||||||||
| to average net assets | 1.67 | 1.88 | 1.84 | 1.89 | 1.94 | |||||
| Ratio of net investment (loss) | ||||||||||
| to average net assets | (.04 | ) | (.30 | ) | (.27 | ) | (.60 | ) | (.33 | ) |
| Portfolio Turnover Rate | 128.56 | 141.37 | 91.44 | 71.53 | 75.14 | |||||
| Net Assets, end of period ($ x 1,000) | 200,988 | 207,965 | 302,932 | 610,538 | 630,399 | |||||
| a | Based on average shares outstanding at each month end. |
| b | Amount represents less than $.01 per share. |
| c | Exclusive of sales charge. |
See notes to financial statements.
16
| Year Ended October 31, | ||||||||||
| Class C Shares | 2013 | 2012 | 2011 | 2010 | 2009 | |||||
| Per Share Data ($): | ||||||||||
| Net asset value, beginning of period | 28.96 | 31.60 | 46.64 | 36.86 | 14.76 | |||||
| Investment Operations: | ||||||||||
| Investment (loss)—neta | (.27 | ) | (.30 | ) | (.41 | ) | (.53 | ) | (.31 | ) |
| Net realized and unrealized | ||||||||||
| gain (loss) on investments | 8.14 | (.53 | ) | (13.28 | ) | 10.29 | 22.40 | |||
| Total from Investment Operations | 7.87 | (.83 | ) | (13.69 | ) | 9.76 | 22.09 | |||
| Distributions: | ||||||||||
| Dividends from net realized | ||||||||||
| gain on investments | — | (1.81 | ) | (1.36 | ) | — | — | |||
| Proceeds from redemption fees | .00 | b | .00 | b | .01 | .02 | .01 | |||
| Net asset value, end of period | 36.83 | 28.96 | 31.60 | 46.64 | 36.86 | |||||
| Total Return (%)c | 27.17 | (2.13 | ) | (30.26 | ) | 26.56 | 149.73 | |||
| Ratios/Supplemental Data (%): | ||||||||||
| Ratio of total expenses | ||||||||||
| to average net assets | 2.59 | 2.68 | 2.58 | 2.60 | 2.69 | |||||
| Ratio of net expenses | ||||||||||
| to average net assets | 2.44 | 2.64 | 2.58 | 2.60 | 2.68 | |||||
| Ratio of net investment (loss) | ||||||||||
| to average net assets | (.83 | ) | (1.07 | ) | (.98 | ) | (1.31 | ) | (1.13 | ) |
| Portfolio Turnover Rate | 128.56 | 141.37 | 91.44 | 71.53 | 75.14 | |||||
| Net Assets, end of period ($ x 1,000) | 99,380 | 106,457 | 153,058 | 283,842 | 258,190 | |||||
| a | Based on average shares outstanding at each month end. |
| b | Amount represents less than $.01 per share. |
| c | Exclusive of sales charge. |
See notes to financial statements.
| The Fund | 17 |
FINANCIAL HIGHLIGHTS (continued)
| Year Ended October 31, | ||||||||||
| Class I Shares | 2013 | 2012 | 2011 | 2010 | 2009 | |||||
| Per Share Data ($): | ||||||||||
| Net asset value, beginning of period | 33.66 | 36.04 | 52.51 | 41.06 | 16.27 | |||||
| Investment Operations: | ||||||||||
| Investment income (loss)—neta | .08 | (.02 | ) | (.03 | ) | (.10 | ) | (.03 | ) | |
| Net realized and unrealized | ||||||||||
| gain (loss) on investments | 9.52 | (.55 | ) | (15.09 | ) | 11.53 | 24.81 | |||
| Total from Investment Operations | 9.60 | (.57 | ) | (15.12 | ) | 11.43 | 24.78 | |||
| Distributions: | ||||||||||
| Dividends from net realized | ||||||||||
| gain on investments | — | (1.81 | ) | (1.36 | ) | — | — | |||
| Proceeds from redemption fees | .00 | b | .00 | b | .01 | .02 | .01 | |||
| Net asset value, end of period | 43.26 | 33.66 | 36.04 | 52.51 | 41.06 | |||||
| Total Return (%) | 28.52 | (1.10 | ) | (29.57 | ) | 27.86 | 152.43 | |||
| Ratios/Supplemental Data (%): | ||||||||||
| Ratio of total expenses | ||||||||||
| to average net assets | 1.54 | 1.64 | 1.60 | 1.56 | 1.63 | |||||
| Ratio of net expenses | ||||||||||
| to average net assets | 1.39 | 1.60 | 1.60 | 1.56 | 1.62 | |||||
| Ratio of net investment income | ||||||||||
| (loss) to average net assets | .22 | (.05 | ) | (.07 | ) | (.22 | ) | (.09 | ) | |
| Portfolio Turnover Rate | 128.56 | 141.37 | 91.44 | 71.53 | 75.14 | |||||
| Net Assets, end of period ($ x 1,000) | 60,672 | 57,899 | 86,871 | 165,622 | 80,875 | |||||
| a | Based on average shares outstanding at each month end. |
| b | Amount represents less than $.01 per share. |
See notes to financial statements.
18
NOTES TO FINANCIAL STATEMENTS
NOTE 1—Significant Accounting Policies:
Dreyfus Greater China Fund (the “fund”) is a separate non-diversified series of Dreyfus Premier Investment Funds, Inc. (the “Company”), which is registered under the Investment Company Act of 1940, as amended (the “Act”), as an open-end management investment company and operates as a series company currently offering eight series, including the fund. The fund’s investment objective is to seek long-term capital appreciation.The Dreyfus Corporation (the “Manager” or “Dreyfus”), a wholly-owned subsidiary of The Bank of New York Mellon Corporation (“BNY Mellon”), serves as the fund’s investment adviser. Hamon Asian Advisors Limited (“Hamon”), a wholly-owned subsidiary of BNY Mellon and an affiliate of Dreyfus, serves as the fund’s sub-investment adviser.
MBSC Securities Corporation (the “Distributor”), a wholly-owned subsidiary of Dreyfus, is the distributor of the fund’s shares.The fund is authorized to issue 1 billion shares of $.001 par value Common Stock. The fund currently offers three classes of shares: Class A (400 million shares authorized), Class C (200 million shares authorized), and Class I (400 million shares authorized). Class A shares generally are subject to a sales charge imposed at the time of purchase. Class C shares are subject to a contingent deferred sales charge (“CDSC”) imposed on Class C shares redeemed within one year of purchase. Class I shares are sold at net asset value per share only to institutional investors. Other differences between the classes include the services offered to and the expenses borne by each class, the allocation of certain transfer agency costs and certain voting rights. Income, expenses (other than expenses attributable to a specific class), and realized and unrealized gains or losses on investments are allocated to each class of shares based on its relative net assets.
| The Fund | 19 |
NOTES TO FINANCIAL STATEMENTS (continued)
The Company accounts separately for the assets, liabilities and operations of each series. Expenses directly attributable to each series are charged to that series’ operations; expenses which are applicable to all series are allocated among them on a pro rata basis.
The Financial Accounting Standards Board (“FASB”) Accounting Standards Codification is the exclusive reference of authoritative U.S. generally accepted accounting principles (“GAAP”) recognized by the FASB to be applied by nongovernmental entities. Rules and interpretive releases of the Securities and Exchange Commission (“SEC”) under authority of federal laws are also sources of authoritative GAAP for SEC registrants. The fund’s financial statements are prepared in accordance with GAAP, which may require the use of management estimates and assumptions.Actual results could differ from those estimates.
The Company enters into contracts that contain a variety of indemnifications. The fund’s maximum exposure under these arrangements is unknown.The fund does not anticipate recognizing any loss related to these arrangements.
(a) Portfolio valuation: The fair value of a financial instrument is the amount that would be received to sell an asset or paid to transfer a liability in an orderly transaction between market participants at the measurement date (i.e., the exit price). GAAP establishes a fair value hierarchy that prioritizes the inputs of valuation techniques used to measure fair value. This hierarchy gives the highest priority to unadjusted quoted prices in active markets for identical assets or liabilities (Level 1 measurements) and the lowest priority to unobservable inputs (Level 3 measurements).
Additionally, GAAP provides guidance on determining whether the volume and activity in a market has decreased significantly and whether such a decrease in activity results in transactions that are not orderly. GAAP requires enhanced disclosures around valuation inputs and techniques used during annual and interim periods.
20
Various inputs are used in determining the value of the fund’s investments relating to fair value measurements.These inputs are summarized in the three broad levels listed below:
Level 1—unadjusted quoted prices in active markets for identical investments.
Level 2—other significant observable inputs (including quoted prices for similar investments, interest rates, prepayment speeds, credit risk, etc.).
Level 3—significant unobservable inputs (including the fund’s own assumptions in determining the fair value of investments).
The inputs or methodology used for valuing securities are not necessarily an indication of the risk associated with investing in those securities.
Changes in valuation techniques may result in transfers in or out of an assigned level within the disclosure hierarchy. Valuation techniques used to value the fund’s investments are as follows:
Investments in securities are valued at the last sales price on the securities exchange or national securities market on which such securities are primarily traded. Securities listed on the National Market System for which market quotations are available are valued at the official closing price or, if there is no official closing price that day, at the last sales price. Securities not listed on an exchange or the national securities market, or securities for which there were no transactions, are valued at the average of the most recent bid and asked prices, except for open short positions, where the asked price is used for valuation purposes. Bid price is used when no asked price is available. Registered investment companies that are not traded on an exchange are valued at their net asset value. All of the preceding securities are categorized within Level 1 of the fair value hierarchy.
| The Fund | 21 |
NOTES TO FINANCIAL STATEMENTS (continued)
Fair valuing of securities may be determined with the assistance of a pricing service using calculations based on indices of domestic securities and other appropriate indicators, such as prices of relevant ADRs and financial futures. Utilizing these techniques may result in transfers between Level 1 and Level 2 of the fair value hierarchy.
When market quotations or official closing prices are not readily available, or are determined not to reflect accurately fair value, such as when the value of a security has been significantly affected by events after the close of the exchange or market on which the security is principally traded (for example, a foreign exchange or market), but before the fund calculates its net asset value, the fund may value these investments at fair value as determined in accordance with the procedures approved by the Company’s Board of Directors (the “Board”). Certain factors may be considered when fair valuing investments such as: fundamental analytical data, the nature and duration of restrictions on disposition, an evaluation of the forces that influence the market in which the securities are purchased and sold, and public trading in similar securities of the issuer or comparable issuers. These securities are either categorized within Level 2 or 3 of the fair value hierarchy depending on the relevant inputs used.
For restricted securities where observable inputs are limited, assumptions about market activity and risk are used and are categorized within Level 3 of the fair value hierarchy.
Investments denominated in foreign currencies are translated to U.S. dollars at the prevailing rates of exchange.
Forward foreign currency exchange contracts (“forward contracts”) are valued at the forward rate and are generally categorized within Level 2 of the fair value hierarchy.
22
The following is a summary of the inputs used as of October 31, 2013 in valuing the fund’s investments:
| Level 2—Other | Level 3— | |||||
| Level 1— | Significant | Significant | ||||
| Unadjusted | Observable Unobservable | |||||
| Quoted Prices | Inputs | Inputs | Total | |||
| Assets ($) | ||||||
| Investments in Securities: | ||||||
| Equity Securities— | ||||||
| Foreign | ||||||
| Common Stocks† | 347,449,690 | — | — | 347,449,690 | ||
| Participation Notes† | 14,086,881 | — | — | 14,086,881 | ||
| Liabilities ($) | ||||||
| Other Financial | ||||||
| Instruments: | ||||||
| Forward Foreign | ||||||
| Currency Exchange | ||||||
| Contracts†† | — | (401 | ) | — | (401 | ) |
| † | See Statement of Investments for additional detailed categorizations. |
| †† | Amount shown represents unrealized (depreciation) at period end. |
At October 31, 2013, there were no transfers between Level 1 and Level 2 of the fair value hierarchy.
(b) Foreign currency transactions: The fund does not isolate that portion of the results of operations resulting from changes in foreign exchange rates on investments from the fluctuations arising from changes in the market prices of securities held. Such fluctuations are included with the net realized and unrealized gain or loss on investments.
Net realized foreign exchange gains or losses arise from sales of foreign currencies, currency gains or losses realized on securities transactions between trade and settlement date, and the difference between the amounts of dividends, interest and foreign withholding taxes recorded
| The Fund | 23 |
NOTES TO FINANCIAL STATEMENTS (continued)
on the fund’s books and the U.S. dollar equivalent of the amounts actually received or paid. Net unrealized foreign exchange gains and losses arise from changes in the value of assets and liabilities other than investments resulting from changes in exchange rates. Foreign currency gains and losses on foreign currency transactions are also included with net realized and unrealized gain or loss on investments.
(c) Securities transactions and investment income: Securities transactions are recorded on a trade date basis. Realized gains and losses from securities transactions are recorded on the identified cost basis. Dividend income is recognized on the ex-dividend date and interest income, including, where applicable, accretion of discount and amortization of premium on investments, is recognized on the accrual basis.
(d) Affiliated issuers: Investments in other investment companies advised by Dreyfus are defined as “affiliated” under the Act. Investments in affiliated investment companies during the period ended October 31, 2013 were as follows:
| Affiliated | |||||
| Investment | Value | Value | Net | ||
| Company | 10/31/2012 ($) | Purchases ($) | Sales ($) | 10/31/2013 ($) | Assets (%) |
| Dreyfus | |||||
| Institutional | |||||
| Preferred | |||||
| Plus Money | |||||
| Market | |||||
| Fund | 3,102,000 | 181,178,000 | 184,280,000 | — | — |
(e) Risk: Investing in foreign markets may involve special risks and considerations not typically associated with investing in the U.S.These risks include revaluation of currencies, high rates of inflation, repatriation restrictions on income and capital, and adverse political and economic developments. Moreover, securities issued in these markets may be less liquid, subject to government ownership controls and delayed settlements, and their prices may be more volatile than those of comparable securities in the U.S.
24
The fund follows an investment policy of investing primarily in the securities of Chinese issuers and other investments that are tied economically to China. Because the fund’s investments are concentrated in China, the fund’s performance is expected to be closely tied to social, political and economic conditions within China and to be more volatile than the performance of more geographically diversified funds.
(f) Dividends to shareholders: Dividends are recorded on the ex-dividend date. Dividends from investment income-net and dividends from net realized capital gains, if any, are normally declared and paid annually, but the fund may make distributions on a more frequent basis to comply with the distribution requirements of the Internal Revenue Code of 1986, as amended (the “Code”).To the extent that net realized capital gains can be offset by capital loss carryovers, it is the policy of the fund not to distribute such gains. Income and capital gain distributions are determined in accordance with income tax regulations, which may differ from GAAP.
(g) Federal income taxes: It is the policy of the fund to continue to qualify as a regulated investment company, if such qualification is in the best interests of its shareholders, by complying with the applicable provisions of the Code, and to make distributions of taxable income sufficient to relieve it from substantially all federal income and excise taxes.
As of and during the period ended October 31, 2013, the fund did not have any liabilities for any uncertain tax positions.The fund recognizes interest and penalties, if any, related to uncertain tax positions as income tax expense in the Statement of Operations. During the period ended October 31, 2013, the fund did not incur any interest or penalties.
Each tax year in the four-year period ended October 31, 2013 remains subject to examination by the Internal Revenue Service and state taxing authorities.
| The Fund | 25 |
NOTES TO FINANCIAL STATEMENTS (continued)
At October 31, 2013, the components of accumulated earnings on a tax basis were as follows: accumulated capital losses $48,198,306 and unrealized appreciation $80,000,183.
Under the Regulated Investment Company Modernization Act of 2010 (the “2010 Act”), the fund is permitted to carry forward capital losses incurred in taxable years beginning after December 22, 2010 (“post-enactment losses”) for an unlimited period. Furthermore, post-enactment capital loss carryovers retain their character as either short-term or long-term capital losses rather than short-term as they were under previous statute.
The accumulated capital loss carryover is available for federal income tax purposes to be applied against future net realized capital gains, if any, realized subsequent to October 31, 2013.The fund has $15,792,196 of post-enactment short-term capital losses and $32,406,110 of post-enactment long-term capital losses which can be carried forward for an unlimited period.
The tax character of distributions paid to shareholders during the fiscal periods ended October 31, 2013 and October 31, 2012 were as follows: long-term capital gains $0 and $27,700,411, respectively.
The fund has analyzed its tax positions with respect to applicable income tax issues for open tax years (in each respective jurisdiction) and determined no material tax liabilities existed. The fund operates in certain jurisdictions where the tax laws are evolving and, therefore, the application and interpretation of these laws and regulations is uncertain. In the future, the fund’s tax position in these jurisdictions may be subject to review from time to time which could result in tax liabilities.
During the period ended October 31, 2013, as a result of permanent book to tax differences, primarily due to the tax treatment for foreign currency gains and losses and net operating losses, the fund increased accumulated undistributed investment income-net by $1,317,852, increased accumulated net realized gain (loss) on investments by $145,683 and decreased paid-in capital by $1,463,535. Net assets and net asset value per share were not affected by this reclassification.
26
(h) Accounting Pronouncement: In January 2013, FASB issued Accounting Standards Update No. 2013-01 (“ASU 2013-01”), “Clarifying the Scope of Disclosures about Offsetting Assets and Liabilities”, which replaced Accounting Standards Update No. 2011-11 (“ASU 2011-11”),“Disclosures about Offsetting Assets and Liabilities”. ASU 2013-01 is effective for fiscal years beginning on or after January 1, 2013, and interim periods within those annual periods.ASU 2011-11 was intended to enhance disclosure requirements on the offsetting of financial assets and liabilities.ASU 2013-01 limits the scope of the new balance sheet offsetting disclosures to derivatives, repurchase agreements, and securities lending transactions to the extent that they are (1) offset in the financial statements or (2) subject to enforceable master netting arrangements (“MNA”) or similar agreements. Management is currently evaluating the application of ASU 2013-01 and its impact on the fund’s financial statements.
NOTE 2—Bank Lines of Credit:
The fund participates with other Dreyfus-managed funds in a $265 million unsecured credit facility led by Citibank, N.A. and a $300 million unsecured credit facility provided by The Bank of New York Mellon, a subsidiary of BNY Mellon and an affiliate of Dreyfus (each, a “Facility”), each to be utilized primarily for temporary or emergency purposes, including the financing of redemptions. Prior to October 9, 2013, the unsecured credit facility with Citibank, N.A. was $210 million. In connection therewith, the fund has agreed to pay its pro rata portion of commitment fees for each Facility. Interest is charged to the fund based on rates determined pursuant to the terms of the respective Facility at the time of borrowing.
The average amount of borrowings outstanding under the Facilities during the period ended October 31, 2013 was approximately $302,200 with a related weighted average annualized interest rate of 1.12%.
| The Fund | 27 |
NOTES TO FINANCIAL STATEMENTS (continued)
NOTE 3—Management Fee, Sub-Investment Advisory Fee and Other Transactions with Affiliates:
(a) Pursuant to a management agreement with Dreyfus, the management fee is computed at the annual rate of 1.25% of the value of the fund’s average daily net assets and is payable monthly.
Dreyfus had agreed, from November 1, 2012 through September 30, 2013 to waive receipt of a portion of the fund’s management fee, in the amount of .15% of the value of the fund’s average daily net assets. Dreyfus has also contractually agreed, from October 1, 2013 through March 31, 2014 to waive receipt of its fees and/or assume the expenses of the fund so that the direct expenses of none of the classes (excluding Rule 12b-1 Distribution Plan fees, Shareholder Services Plan fees, taxes, interest expense, brokerage commissions, commitment fees on borrowings and extraordinary expenses) exceed 1.45% of the value of the fund’s average daily net assets.The reduction in expenses, pursuant to the undertaking, amounted to $538,190 during the period ended October 31, 2013.
Pursuant to a sub-investment advisory agreement between Dreyfus and Hamon, Dreyfus pays Hamon a fee at the annual rate of .625% of the value of the fund’s average daily net assets and is payable monthly.
During the period ended October 31, 2013, the Distributor retained $28,880 from commissions earned on sales of the fund’s Class A shares and $11,921 from CDSCs on redemptions of the fund’s Class C shares.
(b) Under the Distribution Plan adopted pursuant to Rule 12b-1 under the Act, Class C shares pay the Distributor for distributing its shares at an annual rate of .75% of the value of its average daily net assets. During the period ended October 31, 2013, Class C shares were charged $770,115 pursuant to the Distribution Plan.
(c) Under the Shareholder Services Plan, Class A and Class C shares pay the Distributor at an annual rate of .25% of the value of their average daily net assets for the provision of certain services.The services provided
28
may include personal services relating to shareholder accounts, such as answering shareholder inquiries regarding the fund and providing reports and other information, and services related to the maintenance of shareholder accounts.The Distributor may make payments to Service Agents (securities dealers, financial institutions or other industry professionals) with respect to these services.The Distributor determines the amounts to be paid to Service Agents. During the period ended October 31, 2013, Class A and Class C shares were charged $515,804 and $256,705, respectively, pursuant to the Shareholder Services Plan.
The fund has arrangements with the transfer agent and the custodian whereby the fund may receive earnings credits when positive cash balances are maintained, which are used to offset transfer agency and custody fees. For financial reporting purposes, the fund includes net earnings credits as an expense offset in the Statement of Operations.
The fund compensates DreyfusTransfer, Inc., a wholly-owned subsidiary of Dreyfus, under a transfer agency agreement for providing transfer agency and cash management services for the fund. The majority of transfer agency fees are comprised of amounts paid on a per account basis, while cash management fees are related to fund subscriptions and redemptions. During the period ended October 31, 2013, the fund was charged $153,855 for transfer agency services and $6,731 for cash management services.These fees are included in Shareholder servicing costs in the Statement of Operations. Cash management fees were partially offset by earnings credits of $868.
The fund compensates The Bank of NewYork Mellon under a custody agreement for providing custodial services for the fund.These fees are determined based on net assets, geographic region and transaction activity. During the period ended October 31, 2013, the fund was charged $266,944 pursuant to the custody agreement.
| The Fund | 29 |
NOTES TO FINANCIAL STATEMENTS (continued)
The fund compensated The Bank of New York Mellon under a cash management agreement that was in effect until September 30, 2013 for performing certain cash management services related to fund subscriptions and redemptions. During the period ended October 31, 2013, the fund was charged $3,457 pursuant to the cash management agreement, which is included in Shareholder servicing costs in the Statement of Operations.These fees were partially offset by earnings credits of $7.
During the period ended October 31, 2013, the fund was charged $8,887 for services performed by the Chief Compliance Officer and his staff.
The components of “Due to The Dreyfus Corporation and affiliates” in the Statement of Assets and Liabilities consist of: management fees $387,881, Distribution Plan fees $64,028, Shareholder Services Plan fees $64,964, custodian fees $99,412, Chief Compliance Officer fees $7,445 and transfer agency fees $22,519, which are offset against an expense reimbursement currently in effect in the amount of $31,053.
(d) Each Board member also serves as a Board member of other funds within the Dreyfus complex. Annual retainer fees and attendance fees are allocated to each fund based on net assets.
(e) A 2% redemption fee is charged and retained by the fund on certain shares redeemed within sixty days following the date of issuance subject to certain exceptions, including redemptions made through the use of the fund’s exchange privilege. During the period ended October 31, 2013, redemption fees charged and retained by the fund amounted to $31,139.
NOTE 4—Securities Transactions:
The aggregate amount of purchases and sales of investment securities, excluding short-term securities and forward contracts, during the period ended October 31, 2013, amounted to $468,299,127 and $563,230,649, respectively.
Derivatives: A derivative is a financial instrument whose performance is derived from the performance of another asset. Each type of derivative instrument that was held by the fund during the period ended October 31, 2013 is discussed below.
30
Forward Foreign Currency Exchange Contracts: The fund enters into forward contracts in order to hedge its exposure to changes in foreign currency exchange rates on its foreign portfolio holdings, to settle foreign currency transactions or as a part of its investment strategy.When executing forward contracts, the fund is obligated to buy or sell a foreign currency at a specified rate on a certain date in the future. With respect to sales of forward contracts, the fund incurs a loss if the value of the contract increases between the date the forward contract is opened and the date the forward contract is closed.The fund realizes a gain if the value of the contract decreases between those dates.With respect to purchases of forward contracts, the fund incurs a loss if the value of the contract decreases between the date the forward contract is opened and the date the forward contract is closed. The fund realizes a gain if the value of the contract increases between those dates. Any realized or unrealized gains or losses which occurred during the period are reflected in the Statement of Operations.The fund is exposed to foreign currency risk as a result of changes in value of underlying financial instruments. The fund is also exposed to credit risk associated with counterparty nonperformance on these forward contracts, which is generally limited to the unrealized gain on each open contract.The following summarizes open forward contracts at October 31, 2013:
| Foreign | |||||
| Forward Foreign Currency | Currency | Unrealized | |||
| Exchange Contracts | Amounts | Proceeds ($) | Value ($) (Depreciation) ($) | ||
| Sales: | |||||
| Hong Kong Dollar, Expiring | |||||
| 11/1/2013 a | 17,200,000 | 2,218,095 | 2,218,496 | (401 | ) |
| Counterparty: | |||||
| a Standard Chartered Bank | |||||
The following summarizes the average market value of derivatives outstanding during the period ended October 31, 2013:
| Average Market Value ($) | |
| Forward contracts | 1,547,309 |
| The Fund | 31 |
NOTES TO FINANCIAL STATEMENTS (continued)
At October 31, 2013, the cost of investments for federal income tax purposes was $281,537,183; accordingly, accumulated net unrealized appreciation on investments was $79,999,388, consisting of $91,932,005 gross unrealized appreciation and $11,932,617 gross unrealized depreciation.
32
| REPORT OF INDEPENDENT REGISTERED |
| PUBLIC ACCOUNTING FIRM |
Shareholders and Board of Directors
Dreyfus Greater China Fund
We have audited the accompanying statement of assets and liabilities, including the statement of investments, of Dreyfus Greater China Fund (one of the series comprising Dreyfus Premier Investment Funds, Inc.) as of October 31, 2013, and the related statement of operations for the year then ended, the statement of changes in net assets for each of the two years in the period then ended, and the financial highlights for each of the five years in the period then ended. These financial statements and financial highlights are the responsibility of the Fund’s management. Our responsibility is to express an opinion on these financial statements and financial highlights based on our audits.
We conducted our audits in accordance with the standards of the Public Company Accounting Oversight Board (United States).Those standards require that we plan and perform the audit to obtain reasonable assurance about whether the financial statements and financial highlights are free of material misstatement.We were not engaged to perform an audit of the Fund’s internal control over financial reporting. Our audits included consideration of internal control over financial reporting as a basis for designing audit procedures that are appropriate in the circumstances, but not for the purpose of expressing an opinion on the effectiveness of the Fund’s internal control over financial reporting. Accordingly, we express no such opinion.An audit also includes examining, on a test basis, evidence supporting the amounts and disclosures in the financial statements and financial highlights, assessing the accounting principles used and significant estimates made by management, and evaluating the overall financial statement presentation. Our procedures included confirmation of securities owned as of October 31, 2013 by correspondence with the custodian and others. We believe that our audits provide a reasonable basis for our opinion.
In our opinion, the financial statements and financial highlights referred to above present fairly, in all material respects, the financial position of Dreyfus Greater China Fund at October 31, 2013, the results of its operations for the year then ended, the changes in its net assets for each of the two years in the period then ended, and the financial highlights for each of the five years in the period then ended, in conformity with U.S. generally accepted accounting principles.

New York, New York
December 27, 2013
| The Fund | 33 |
IMPORTANT TAX INFORMATION (Unaudited)
In accordance with federal tax law, the fund elects to provide each shareholder with their portion of the fund’s foreign taxes paid and the income sourced from foreign countries. Accordingly, the fund hereby reports the following information regarding its fiscal year ended October 31, 2013:
—the total amount of taxes paid to foreign countries was $33,059
—the total amount of income sourced from foreign countries was $6,023,356.
Where required by Federal tax law rules, shareholders will receive notification of their proportionate share of foreign taxes paid and foreign sourced income for the 2013 calendar year with Form 1099-DIV which will be mailed in early 2014.
34
BOARD MEMBERS INFORMATION (Unaudited)
| Joseph S. DiMartino (70) |
| Chairman of the Board (1995) |
| Principal Occupation During Past 5Years: |
| • Corporate Director and Trustee |
| Other Public Company Board Memberships During Past 5Years: |
| • CBIZ (formerly, Century Business Services, Inc.), a provider of outsourcing functions for small |
| and medium size companies, Director (1997-present) |
| • The Newark Group, a provider of a national market of paper recovery facilities, paperboard |
| mills and paperboard converting plants, Director (2000-2010) |
| • Sunair Services Corporation, a provider of certain outdoor-related services to homes and |
| businesses, Director (2005-2009) |
| No. of Portfolios for which Board Member Serves: 141 |
| ——————— |
| Peggy C. Davis (70) |
| Board Member (2012) |
| Principal Occupation During Past 5Years: |
| • Shad Professor of Law, New York University School of Law (1983-present) |
| No. of Portfolios for which Board Member Serves: 56 |
| ——————— |
| David P. Feldman (73) |
| Board Member (1991) |
| Principal Occupation During Past 5Years: |
| • Corporate Director and Trustee |
| Other Public Company Board Memberships During Past 5Years: |
| • BBH Mutual Funds Group (4 registered mutual funds), Director (1992-present) |
| No. of Portfolios for which Board Member Serves: 42 |
| ——————— |
| Ehud Houminer (73) |
| Board Member (2012) |
| Principal Occupation During Past 5Years: |
| • Executive-in-Residence at the Columbia Business School, Columbia University (1992-present) |
| Other Public Company Board Memberships During Past 5Years: |
| • Avnet Inc., an electronics distributor, Director (1993-2012) |
| No. of Portfolios for which Board Member Serves: 66 |
| The Fund | 35 |
BOARD MEMBERS INFORMATION (Unaudited) (continued)
| Lynn Martin (73) |
| Board Member (1993) |
| Principal Occupation During Past 5Years: |
| • President ofThe Martin Hall Group LLC, a human resources consulting firm (January 2005-2012) |
| Other Public Company Board Memberships During Past 5Years: |
| • AT&T Inc., a telecommunications company, Director (1999-2012) |
| • Ryder System, Inc., a supply chain and transportation management company, Director (1993-2012) |
| • The Proctor & Gamble Co., a consumer products company, Director (1994-2009) |
| • Constellation Energy Group Inc., Director (2003-2009) |
| No. of Portfolios for which Board Member Serves: 42 |
| ——————— |
| Robin A. Melvin (50) |
| Board Member (2011) |
| Principal Occupation During Past 5Years: |
| • Board Member, Illinois Mentoring Partnership, non-profit organization dedicated to increasing |
| the quantity and quality of mentoring services in Illinois (2013-present) |
| • Director, Boisi Family Foundation, a private family foundation that supports youth-serving orga- |
| nizations that promote the self sufficiency of youth from disadvantaged circumstances (1995-2012) |
| No. of Portfolios for which Board Member Serves: 90 |
| ——————— |
| Dr. Martin Peretz (74) |
| Board Member (2012) |
| Principal Occupation During Past 5Years: |
| • Editor-in-Chief Emeritus of The New Republic Magazine (2010-2011) (previously, |
| Editor-in-Chief, 1974-2010) |
| • Director of TheStreet.com, a financial information service on the web (1996-2010) |
| Other Public Company Board Memberships During Past 5Years: |
| • Pershing Square Capital Management,Adviser (2009-present) |
| No. of Portfolios for which Board Member Serves: 42 |
| ——————— |
Once elected all Board Members serve for an indefinite term, but achieve Emeritus status upon reaching age 80.The address of the Board Members and Officers is c/o The Dreyfus Corporation, 200 Park Avenue, NewYork, NewYork 10166. Additional information about the Board Members is available in the fund’s Statement of Additional Information which can be obtained from Dreyfus free of charge by calling this toll free number: 1-800-DREYFUS.
Daniel Rose, Emeritus Board Member
Philip L.Toia, Emeritus Board Member
Sander Vanocur, Emeritus Board Member
36
OFFICERS OF THE FUND (Unaudited)
BRADLEY J. SKAPYAK, President since January 2010.
Chief Operating Officer and a director of the Manager since June 2009, Chairman of Dreyfus Transfer, Inc., an affiliate of the Manager and the transfer agent of the funds, since May 2011 and Executive Vice President of the Distributor since June 2007. From April 2003 to June 2009, Mr. Skapyak was the head of the Investment Accounting and Support Department of the Manager. He is an officer of 68 investment companies (comprised of 141 portfolios) managed by the Manager. He is 55 years old and has been an employee of the Manager since February 1988.
JOHN PAK, Chief Legal Officer since March 2013.
Chief Legal Officer of the Manager and Associate General Counsel and Managing Director of BNY Mellon since August 2012; from March 2005 to July 2012, Managing Director of Deutsche Bank, Deputy Global Head of Deutsche Asset Management Legal and Regional Head of Deutsche Asset Management Americas Legal. He is an officer of 69 investment companies (comprised of 166 portfolios) managed by the Manager. He is 45 years old and has been an employee of the Manager since August 2012.
JANETTE E. FARRAGHER, Vice President and Secretary since December 2011.
Assistant General Counsel of BNY Mellon, and an officer of 69 investment companies (comprised of 166 portfolios) managed by the Manager. She is 50 years old and has been an employee of the Manager since February 1984.
KIESHA ASTWOOD, Vice President and Assistant Secretary since January 2010.
Counsel of BNY Mellon, and an officer of 69 investment companies (comprised of 166 portfolios) managed by the Manager. She is 40 years old and has been an employee of the Manager since July 1995.
JAMES BITETTO, Vice President and Assistant Secretary since August 2005.
Senior Counsel of BNY Mellon and Secretary of the Manager, and an officer of 69 investment companies (comprised of 166 portfolios) managed by the Manager. He is 47 years old and has been an employee of the Manager since December 1996.
JONI LACKS CHARATAN, Vice President and Assistant Secretary since August 2005.
Senior Counsel of BNY Mellon, and an officer of 69 investment companies (comprised of 166 portfolios) managed by the Manager. She is 58 years old and has been an employee of the Manager since October 1988.
JOSEPH M. CHIOFFI, Vice President and Assistant Secretary since August 2005.
Senior Counsel of BNY Mellon, and an officer of 69 investment companies (comprised of 166 portfolios) managed by the Manager. He is 52 years old and has been an employee of the Manager since June 2000.
JOHN B. HAMMALIAN, Vice President and Assistant Secretary since August 2005.
Senior Managing Counsel of BNY Mellon, and an officer of 69 investment companies (comprised of 166 portfolios) managed by the Manager. He is 50 years old and has been an employee of the Manager since February 1991.
ROBERT R. MULLERY, Vice President and Assistant Secretary since August 2005.
Managing Counsel of BNY Mellon, and an officer of 69 investment companies (comprised of 166 portfolios) managed by the Manager. He is 61 years old and has been an employee of the Manager since May 1986.
| The Fund | 37 |
OFFICERS OF THE FUND (Unaudited) (continued)
JEFF PRUSNOFSKY, Vice President and Assistant Secretary since August 2005.
Senior Managing Counsel of BNY Mellon, and an officer of 69 investment companies (comprised of 166 portfolios) managed by the Manager. He is 48 years old and has been an employee of the Manager since October 1990.
JAMES WINDELS, Treasurer since November 2001.
Director – Mutual Fund Accounting of the Manager, and an officer of 69 investment companies (comprised of 166 portfolios) managed by the Manager. He is 55 years old and has been an employee of the Manager since April 1985.
RICHARD CASSARO, Assistant Treasurer since January 2008.
Senior Accounting Manager – Money Market and Municipal Bond Funds of the Manager, and an officer of 69 investment companies (comprised of 166 portfolios) managed by the Manager. He is 54 years old and has been an employee of the Manager since September 1982.
GAVIN C. REILLY, Assistant Treasurer since December 2005.
Tax Manager of the Investment Accounting and Support Department of the Manager, and an officer of 69 investment companies (comprised of 166 portfolios) managed by the Manager. He is 45 years old and has been an employee of the Manager since April 1991.
ROBERT S. ROBOL, Assistant Treasurer since August 2005.
Senior Accounting Manager – Fixed Income Funds of the Manager, and an officer of 69 investment companies (comprised of 166 portfolios) managed by the Manager. He is 49 years old and has been an employee of the Manager since October 1988.
ROBERT SALVIOLO, Assistant Treasurer since July 2007.
Senior Accounting Manager – Equity Funds of the Manager, and an officer of 69 investment companies (comprised of 166 portfolios) managed by the Manager. He is 46 years old and has been an employee of the Manager since June 1989.
ROBERT SVAGNA, Assistant Treasurer since December 2002.
Senior Accounting Manager – Equity Funds of the Manager, and an officer of 69 investment companies (comprised of 166 portfolios) managed by the Manager. He is 46 years old and has been an employee of the Manager since November 1990.
JOSEPH W. CONNOLLY, Chief Compliance Officer since October 2004.
Chief Compliance Officer of the Manager and The Dreyfus Family of Funds (69 investment companies, comprised of 166 portfolios). He is 56 years old and has served in various capacities with the Manager since 1980, including manager of the firm’s Fund Accounting Department from 1997 through October 2001.
MATTHEW D. CONNOLLY, Anti-Money Laundering Compliance Officer since April 2012.
Anti-Money Laundering Compliance Officer of the Distributor since October 2011; from March 2010 to September 2011, Global Head, KYC Reviews and Director, UBS Investment Bank; until March 2010, AML Compliance Officer and Senior Vice President, Citi Global Wealth Management. He is an officer of 64 investment companies (comprised of 161 portfolios) managed by the Manager. He is 41 years old and has been an employee of the Distributor since October 2011.
38
NOTES
For More Information
Telephone Call your financial representative or 1-800-DREYFUS
Mail The Dreyfus Family of Funds, 144 Glenn Curtiss Boulevard, Uniondale, NY 11556-0144
The fund files its complete schedule of portfolio holdings with the Securities and Exchange Commission (“SEC”) for the first and third quarters of each fiscal year on Form N-Q. The fund’s Forms N-Q are available on the SEC’s website at http://www.sec.gov and may be reviewed and copied at the SEC’s Public Reference Room in Washington, DC. Information on the operation of the Public Reference Room may be obtained by calling 1-800-SEC-0330.
A description of the policies and procedures that the fund uses to determine how to vote proxies relating to portfolio securities, and information regarding how the fund voted these proxies for the most recent 12-month period ended June 30 is available at http://www.dreyfus.com and on the SEC’s website at http://www.sec.gov. The description of the policies and procedures is also available without charge, upon request, by calling 1-800-DREYFUS.

Save time. Save paper. View your next shareholder report online as soon as it’s available. Log into www.dreyfus.com and sign up for Dreyfus eCommunications. It’s simple and only takes a few minutes.
The views expressed in this report reflect those of the portfolio manager only through the end of the period covered and do not necessarily represent the views of Dreyfus or any other person in the Dreyfus organization. Any such views are subject to change at any time based upon market or other conditions and Dreyfus disclaims any responsibility to update such views.These views may not be relied on as investment advice and, because investment decisions for a Dreyfus fund are based on numerous factors, may not be relied on as an indication of trading intent on behalf of any Dreyfus fund.
| Not FDIC-Insured • Not Bank-Guaranteed • May Lose Value |
Contents | |
THE FUND | |
| 2 | A Letter from the President |
| 3 | Discussion of Fund Performance |
| 6 | Fund Performance |
| 8 | Understanding Your Fund’s Expenses |
| 8 | Comparing Your Fund’s Expenses With Those of Other Funds |
| 9 | Statement of Investments |
| 14 | Statement of Assets and Liabilities |
| 15 | Statement of Operations |
| 16 | Statement of Changes in Net Assets |
| 18 | Financial Highlights |
| 22 | Notes to Financial Statements |
| 34 | Report of Independent Registered Public Accounting Firm |
| 35 | Important Tax Information |
| 36 | Board Members Information |
| 38 | Officers of the Fund |
FOR MORE INFORMATION | |
Back Cover |
Dreyfus
Global Real Estate
Securities Fund
The Fund
A LETTER FROM THE PRESIDENT
Dear Shareholder:
We are pleased to present this annual report for Dreyfus Global Real Estate Securities Fund, covering the 10-month period from January 1, 2013, through October 31, 2013. For information about how the fund performed during the reporting period, as well as general market perspectives, we provide a Discussion of Fund Performance on the pages that follow.
Improving global economic conditions drove developed stock markets higher over much of the reporting period. Europe appeared to put the worst of its sovereign debt and banking crises behind it, and Japan embarked on a new economic course designed to reflate its long-stagnant domestic economy. However, the world’s emerging markets struggled with the effects of local economic slowdowns. As a result, equity market returns varied widely from one country to another over the past 12 months.
We currently expect global economic conditions to continue to improve in 2014, with stronger growth in many developed countries fueled by past and continuing monetary ease. The emerging markets seem poised for moderate economic expansion despite recently negative investor sentiment. In the United States, we anticipate accelerating growth supported by the fading drags of tighter federal fiscal policies and downsizing on the state and local levels. For more information on how these observations may affect your investments, we encourage you to speak with your financial advisor.

J. Charles Cardona
President
The Dreyfus Corporation
November 15, 2013
2
DISCUSSION OF FUND PERFORMANCE
For the period of January 1, 2013, through October 31, 2013, as provided by Dean Frankel, Portfolio Manager, CenterSquare Investment Management, Inc., Sub-Investment Adviser
Fund and Market Performance Overview
The fund’s fiscal year end has changed to October 31 from December 31.
For the 10-month period ended October 31, 2013, Dreyfus Global Real Estate Securities Fund’s Class A shares produced a total return of 6.07%, Class C shares returned 5.30% and Class I shares returned 6.41%.1 In comparison, the FTSE EPRA/NAREIT Developed Index, the fund’s benchmark, achieved a total return of 7.89% for the same period.2 The fund’s Class Y shares produced a total return of 5.64% for the period since their inception of July 1, 2013, through October 31, 2013.
Global real estate markets generally strengthened over the reporting period as economic recoveries gained traction in major markets.Although the fund participated in the markets’ gains, its performance compared to its benchmark was dampened mainly by shortfalls in the United States and Europe.
The Fund’s Investment Approach
The fund seeks to maximize total return consisting of capital appreciation and current income by investing at least 80% of its assets in companies principally engaged in the real estate sector. Under normal market conditions, the fund expects to invest at least 40% of its assets in companies located outside the United States, and to invest in at least 10 different countries.The fund also may invest in companies located in emerging markets and in companies of any market capitalization. Our proprietary approach quantifies investment opportunity both from a real estate and stock perspective.
Recovering Economy Fueled Real Estate Gains
The reporting period began soon after the start of sustained stock market rallies throughout the developed world as global economic conditions improved. In the United States, employment gains, a rebounding housing market, and an accommodative monetary policy drove some stock market indices to record highs. Europe seems to have put the worst of its financial crisis behind it, as evidenced by stronger economic data in core nations. Japan’s economy was lifted by newly stimulative fiscal and
| The Fund | 3 |
DISCUSSION OF FUND PERFORMANCE (continued)
monetary policies in an effort to end a long period of economic stagnation. Chinese property markets fared relatively well despite a slowing domestic economy.
The performance of real estate securities varied from one market to another. U.S. REITs lagged broader market averages amid rising long-term interest rates. In contrast, Japanese real estate securities rallied sharply in anticipation of moderating deflationary pressures. European property stocks also rose strongly from previously depressed levels. In other markets, Singapore struggled with weak demand for office properties, Australia’s retail and commercial properties failed to follow residential properties into recovery, Hong Kong remained sluggish despite better-than-expected Chinese growth, and Canadian REITs were hurt by high debt levels and flagging demand for dividend-paying stocks.
Fund Participated in Most of the Benchmark’s Gains
The fund delivered strong absolute returns but lagged its benchmark due to cash drag, relative performance in Europe, and fees. In the United States, a shift away from higher yielding securities proved too early, causing the fund to miss some of the market’s gains. Fund relative performance also was hurt by an overweight to European small-cap stocks, which trailed their larger counterparts. In addition, disappointing stock selections in Europe included Germany’s TAG Immobilien, where investors reacted negatively to allegations surrounding its CEO, and Norwegian Property, which took write-offs on underperforming assets. In Hong Kong, New World Development suffered amid a weak local residential property market.
On a more positive note, our focus on small-cap stocks in the United Kingdom buoyed relative performance. Our bias away from income-oriented real estate stocks in Singapore and Hong Kong worked well when fears of higher long-term interest rates intensified. Strong stock selections more than offset the dampening impact of a mild underweight to Japan.We added to the fund’s China exposure early in the reporting period, enabling it to participate more fully in subsequent gains. Among individual stocks, Australian commercial property manager Mirvac Group climbed after a management change was well received by investors, and Canada’s Brookfield Office Properties advanced after receiving a buy-out offer at a premium. In the United Kingdom, residential developer Capital & Counties Properties prospered along with local residential property markets, and student housing specialist Unite Group gained value as investors increasingly recognized its strong underlying business fundamentals.
4
Anticipating Slow but Steady Global Growth
The macroeconomic environment has turned more benign into November, as the U.S. government shutdown came to an end and the debt ceiling negotiations were pushed into 2014. The markets continue to drift upwards as investors take each piece of marginal economic news as a sign that tapering is further away, and accommodative policies will continue. Property fundamentals are improving in many markets, and capital continues to flow into Europe and the UK as investors bet on further recovery – however, we remain cautious. Globally, we are focused on listed property companies that offer a good risk-adjusted balance of income and total return, those with demonstrated resilience and/or growth, and those that offer compelling valuations that take into account the ongoing uncertain environment.
November 15, 2013
Equity funds are subject generally to market, market sector, market liquidity, issuer and investment style risks, among other factors, to varying degrees, all of which are more fully described in the fund’s prospectus.
The fund’s performance will be influenced by political, social and economic factors affecting investments in foreign companies. Special risks associated with investments in foreign companies include exposure to currency fluctuations, less liquidity, less developed or less efficient trading markets, lack of comprehensive company information, political instability and differing auditing and legal standards.These risks are enhanced in emerging market countries. Because the fund’s investments are concentrated in the securities of companies principally engaged in the real estate sector, the value of the fund’s shares will be affected by factors particular to the real estate sector and may fluctuate more widely than that of a fund which invests in a broader range of industries.The securities of issuers that are principally engaged in the real estate sector may be subject to risks similar to those associated with the direct ownership of real estate.These include declines in real estate values and defaults by mortgagors or other borrowers.
In addition to the risks which are linked to the real estate sector in general, REITs are subject to additional risks. Equity REITs may be affected by changes in the value of the underlying property owned by the trust, while mortgage REITs may be affected by the quality of any credit extended. Further, REITs are highly dependent upon management skill and often are not diversified. REITs also are subject to heavy cash flow dependency and to defaults by borrowers or lessees.
| 1 Total returns include reinvestment of dividends and any capital gains paid, and does not take into consideration the |
| maximum initial sales charge in the case of Class A shares, or the applicable contingent deferred sales charges imposed |
| on redemptions in the case of Class C shares. Had these charges been reflected, returns would have been lower. Past |
| performance is no guarantee of future results. Share price and investment return fluctuate such that upon redemption |
| fund shares may be worth more or less than their original cost. Return figures provided reflect the absorption of certain |
| fund expenses by The Dreyfus Corporation pursuant to an undertaking in effect through July 1, 2014, at which time |
| it may be extended, terminated or modified. |
| 2 SOURCE: LIPPER Inc. — Reflects reinvestment of net dividends and, where applicable, capital gain distributions. |
| The FTSE European Public Real Estate Association (EPRA) National Association of Real Estate Investment |
| Trusts (NAREIT) Developed Global Real Estate Securities Index is an unmanaged index designed to track the |
| performance of listed real estate companies and REITs worldwide. Investors cannot invest directly in any index. |
| The Fund | 5 |
FUND PERFORMANCE
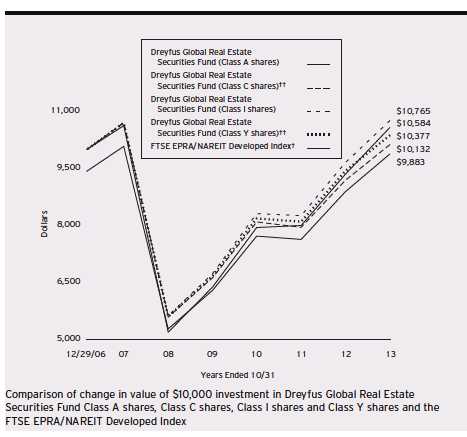
| † | Source: Lipper Inc. |
| †† | The total return figures presented for Class C shares of the fund reflect the performance of the fund’s Class A shares |
| for the period prior to 9/13/08 (the inception date for Class C shares). | |
| The total return figures presented for ClassY shares of the fund reflect the performance of the fund’s Class A shares | |
| for the period prior to 7/1/13 (the inception date for ClassY shares). |
| Past performance is not predictive of future performance. |
| The above graph compares a $10,000 investment made in each of the Class A, Class C, Class I and ClassY shares of |
| Dreyfus Global Real Estate Securities Fund on 12/29/06 (the fund’s inception date) to a $10,000 investment made |
| in the FTSE EPRA/NAREIT Developed Index (the “Index”) on that date.All dividends and capital gain |
| distributions are reinvested. |
| On March 27, 2013, the Board approved changing the fund’s fiscal year end to October 31 from December 31. |
| On June 18, 2013, the Board authorized the fund to offer ClassY shares, as a new class of shares, to certain investors, |
| including certain institutional investors. On July 1, 2013, ClassY shares were offered at net asset value and are not |
| subject to certain fees, including Distribution Plan and Shareholder Services Plan fees. |
| The fund’s performance shown in the line graph above takes into account the maximum initial sales charge on Class A |
| shares and all other applicable fees and expenses on all classes.The Index is an unmanaged market-capitalization |
| weighted index designed to measure the performance of exchange-listed real estate companies and REITs worldwide. |
| Unlike a mutual fund, the Index is not subject to charges, fees and other expenses. Investors cannot invest directly in any |
| index. Further information relating to fund performance, including expense reimbursements, if applicable, is contained in |
| the Financial Highlights section of the prospectus and elsewhere in this report. |
6
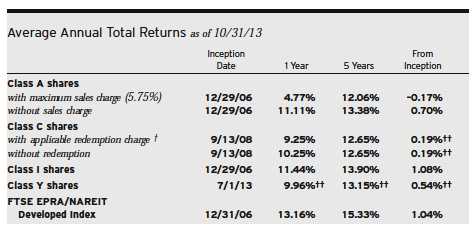
Past performance is not predictive of future performance.The fund’s performance shown in the graph and table does not reflect the deduction of taxes that a shareholder would pay on fund distributions or the redemption of fund shares.
| † | The maximum contingent deferred sales charge for Class C shares is 1% for shares redeemed within one year of the |
| date of purchase. | |
| †† | The total return performance figures presented for Class C shares of the fund reflect the performance of the fund’s |
| Class A shares for the period prior to 9/13/08 (the inception date for Class C shares). | |
| The total return figures presented for ClassY shares of the fund reflect the performance of the fund’s Class A shares | |
| for the period prior to 7/1/13 (the inception date for ClassY shares). |
The Fund 7
UNDERSTANDING YOUR FUND’S EXPENSES (Unaudited)
As a mutual fund investor, you pay ongoing expenses, such as management fees and other expenses. Using the information below, you can estimate how these expenses affect your investment and compare them with the expenses of other funds.You also may pay one-time transaction expenses, including sales charges (loads) and redemption fees, which are not shown in this section and would have resulted in higher total expenses. For more information, see your fund’s prospectus or talk to your financial adviser.
Review your fund’s expenses
The table below shows the expenses you would have paid on a $1,000 investment in Dreyfus Global Real Estate Securities Fund from May 1, 2013 to October 31, 2013. It also shows how much a $1,000 investment would be worth at the close of the period, assuming actual returns and expenses.
Expenses and Value of a $1,000 Investment
assuming actual returns for the six months ended October 31, 2013 †
| Class A | Class C | Class I | Class Y | |
| Expenses paid per $1,000†† | $6.38 | $10.04 | $5.11 | $3.61 |
| Ending value (after expenses) | $947.80 | $943.70 | $949.30 | $1,056.40 |
COMPARING YOUR FUND’S EXPENSES
WITH THOSE OF OTHER FUNDS (Unaudited)
Using the SEC’s method to compare expenses
The Securities and Exchange Commission (SEC) has established guidelines to help investors assess fund expenses. Per these guidelines, the table below shows your fund’s expenses based on a $1,000 investment, assuming a hypothetical 5% annualized return. You can use this information to compare the ongoing expenses (but not transaction expenses or total cost) of investing in the fund with those of other funds.All mutual fund shareholder reports will provide this information to help you make this comparison. Please note that you cannot use this information to estimate your actual ending account balance and expenses paid during the period.
Expenses and Value of a $1,000 Investment
assuming a hypothetical 5% annualized return for the six months ended October 31, 2013
| Class A | Class C | Class I | Class Y | |
| Expenses paid per $1,000†††† | $6.61 | $10.41 | $5.30 | $5.35 |
| Ending value (after expenses) | $1,018.65 | $1,014.87 | $1,019.96 | $1,019.91 |
| † | From July 1, 2013 (commencement of initial offering) to October 31, 2013 for ClassY shares. |
| †† | Expenses are equal to the fund’s annualized expense ratio of 1.30% for Class A, 2.05% for Class C and |
| 1.04% for Class I, multiplied by the average account value over the period, multiplied by 184/365 (to reflect the | |
| one-half year period). Expenses are equal to the fund’s annualized expense ratio of 1.05% for ClassY, multiplied | |
| by the average account value over the period, multiplied by 122/365 (to reflect the actual days in the period). | |
| ††† | Please note that while ClassY shares commenced operations on July 1, 2013, the hypothetical expenses paid during |
| the period reflect projected activity for the full six month period for purposes of comparability.This projection | |
| assumes that annualized expense ratios were in effect during the period May 1, 2013 to October 31, 2013. | |
| †††† | Expenses are equal to the fund’s annualized expense ratio of 1.30% for Class A, 2.05% for Class C, 1.04% for |
| Class I and 1.05% for ClassY, multiplied by the average account value over the period, multiplied by 184/365 | |
| (to reflect the one-half year period). |
8
STATEMENT OF INVESTMENTS
October 31, 2013
| Common Stocks—97.5% | Shares | Value ($) | |
| Australia—6.9% | |||
| Charter Hall Retail REIT | 321,370 | 1,227,125 | |
| Dexus Property Group | 2,468,916 | 2,531,851 | |
| Federation Centres | 1,517,050 | 3,555,933 | |
| Goodman Group | 658,930 | 3,151,315 | |
| Lend Lease Group | 65,490 | 705,638 | |
| Mirvac Group | 5,810,540 | 9,555,816 | |
| Stockland | 484,860 | 1,837,650 | |
| Westfield Group | 1,307,737 | 13,373,642 | |
| Westfield Retail Trust | 3,603,030 | 10,522,729 | |
| 46,461,699 | |||
| Brazil—.4% | |||
| BR Malls Participacoes | 285,600 | 2,766,503 | |
| Canada—3.3% | |||
| Allied Properties Real Estate Investment Trust | 65,790 | 2,116,966 | |
| Allied Properties Real Estate Investment Trust | 27,280 | a | 877,805 |
| Boardwalk Real Estate Investment Trust | 61,990 | 3,526,233 | |
| Brookfield Office Properties | 192,500 | 3,596,509 | |
| Calloway Real Estate Investment Trust | 224,440 | 5,403,006 | |
| Chartwell Retirement Residences | 247,480 | 2,544,464 | |
| Chartwell Retirement Residences | 6,040 | a | 62,100 |
| Dundee Real Estate Investment Trust | 155,990 | 4,325,201 | |
| 22,452,284 | |||
| Finland—.3% | |||
| Sponda | 361,770 | 1,876,365 | |
| France—3.7% | |||
| ICADE | 33,380 | 3,075,994 | |
| Mercialys | 72,442 | 1,561,441 | |
| Unibail-Rodamco | 78,251 | 20,505,415 | |
| 25,142,850 | |||
| Germany—2.0% | |||
| Alstria Office REIT | 432,400 | b | 5,482,276 |
| Deutsche Wohnen | 223,890 | 4,213,270 |
| The Fund | 9 |
STATEMENT OF INVESTMENTS (continued)
| Common Stocks (continued) | Shares | Value ($) | |
| Germany (continued) | |||
| LEG Immobilien | 47,370 | 2,701,308 | |
| TAG Immobilien | 85,560 | 1,033,909 | |
| 13,430,763 | |||
| Hong Kong—7.8% | |||
| China Overseas Land & Investment | 214,000 | 662,453 | |
| Hongkong Land Holdings | 749,511 | 4,616,988 | |
| Link REIT | 1,291,721 | 6,514,419 | |
| Longfor Properties | 1,713,500 | 2,793,582 | |
| New World Development | 5,021,000 | 6,955,442 | |
| Shimao Property Holdings | 2,360,500 | 5,943,114 | |
| Sun Hung Kai Properties | 894,000 | 11,715,517 | |
| Wharf Holdings | 1,566,200 | 13,191,392 | |
| 52,392,907 | |||
| Japan—13.9% | |||
| GLP J-REIT | 5,692 | 5,910,233 | |
| Industrial & Infrastructure Fund Investment | 138 | 1,277,128 | |
| Japan Real Estate Investment | 467 | 5,342,978 | |
| Japan Retail Fund Investment | 2,268 | 4,596,892 | |
| Kenedix Realty Investment | 568 | 2,544,534 | |
| Mitsubishi Estate | 616,000 | 17,522,140 | |
| Mitsui Fudosan | 765,000 | 25,168,057 | |
| Mori Hills REIT Investment | 275 | 1,926,930 | |
| Nippon Building Fund | 927 | 11,473,192 | |
| Sumitomo Realty & Development | 347,000 | 16,321,316 | |
| Tokyo Tatemono | 181,000 | 1,687,959 | |
| 93,771,359 | |||
| Luxembourg—.1% | |||
| GAGFAH | 47,160 | b | 670,412 |
| Norway—.4% | |||
| Norwegian Property | 2,243,918 | 2,872,251 | |
| Singapore—4.7% | |||
| Ascendas Real Estate Investment Trust | 1,836,000 | 3,502,914 | |
| CapitaLand | 3,188,000 | 8,007,213 | |
| CapitaMalls Asia | 2,804,000 | 4,559,717 |
10
| Common Stocks (continued) | Shares | Value ($) | |
| Singapore (continued) | |||
| Fortune Real Estate Investment Trust | 5,669,000 | 4,591,941 | |
| Global Logistic Properties | 2,744,000 | 6,825,761 | |
| Mapletree Greater China Commercial Trust | 5,959,000 | 4,413,363 | |
| 31,900,909 | |||
| Sweden—1.1% | |||
| Wihlborgs Fastigheter | 421,670 | 7,288,067 | |
| Switzerland—.8% | |||
| Mobimo Holding | 3,764 | b | 788,185 |
| PSP Swiss Property | 50,810 | b | 4,367,862 |
| 5,156,047 | |||
| United Kingdom—6.0% | |||
| British Land | 870,697 | 8,683,655 | |
| Capital & Counties Properties | 1,544,688 | 8,589,443 | |
| Land Securities Group | 639,673 | 10,138,643 | |
| Londonmetric Property | 2,433,780 | 5,034,034 | |
| Safestore Holdings | 724,760 | 1,722,797 | |
| Unite Group | 941,160 | 5,975,906 | |
| 40,144,478 | |||
| United States—46.1% | |||
| Alexandria Real Estate Equities | 74,130 | 4,876,271 | |
| Ashford Hospitality Trust | 84,613 | 1,105,046 | |
| AvalonBay Communities | 82,980 | 10,376,649 | |
| Aviv REIT | 79,890 | 2,029,206 | |
| Boston Properties | 95,150 | 9,848,025 | |
| BRE Properties | 50,740 | 2,770,911 | |
| Brixmor Property Group | 67,440 | 1,392,636 | |
| Camden Property Trust | 134,160 | 8,613,072 | |
| Cousins Properties | 167,420 | 1,896,869 | |
| CubeSmart | 183,470 | 3,351,997 | |
| CyrusOne | 31,248 | 609,024 | |
| DDR | 178,750 | 3,029,813 | |
| Digital Realty Trust | 70,870 | 3,377,664 | |
| Duke Realty | 474,490 | 7,862,299 | |
| Empire State Realty Trust | 273,153 | 3,865,115 |
| The Fund | 11 |
STATEMENT OF INVESTMENTS (continued)
| Common Stocks (continued) | Shares | Value ($) |
| United States (continued) | ||
| Equity Residential | 87,630 | 4,588,307 |
| Essex Property Trust | 45,910 | 7,391,510 |
| Federal Realty Investment Trust | 34,620 | 3,586,632 |
| First Industrial Realty Trust | 109,485 | 1,978,394 |
| General Growth Properties | 313,080 | 6,646,688 |
| HCP | 245,260 | 10,178,290 |
| Health Care REIT | 102,280 | 6,632,858 |
| Highwoods Properties | 204,190 | 7,881,734 |
| Host Hotels & Resorts | 570,170 | 10,576,653 |
| Hudson Pacific Properties | 31,595 | 653,701 |
| Kilroy Realty | 102,230 | 5,434,547 |
| Kimco Realty | 564,300 | 12,121,164 |
| LaSalle Hotel Properties | 62,690 | 1,946,525 |
| Liberty Property Trust | 273,855 | 10,184,667 |
| Macerich | 151,320 | 8,959,657 |
| Mid-America Apartment Communities | 60,640 | 4,026,496 |
| Omega Healthcare Investors | 65,150 | 2,165,586 |
| Prologis | 392,590 | 15,683,970 |
| Public Storage | 59,320 | 9,904,660 |
| QTS Realty Trust, Cl. A | 91,540 | 1,966,279 |
| Regency Centers | 186,400 | 9,629,424 |
| RLJ Lodging Trust | 111,920 | 2,827,099 |
| Simon Property Group | 283,900 | 43,876,745 |
| SL Green Realty | 86,870 | 8,215,296 |
| Sovran Self Storage | 57,950 | 4,432,595 |
| Sunstone Hotel Investors | 402,460 | 5,332,595 |
| Tanger Factory Outlet Centers | 293,120 | 10,215,232 |
| UDR | 314,350 | 7,799,023 |
| Ventas | 211,460 | 13,795,650 |
| Vornado Realty Trust | 81,390 | 7,248,593 |
| 310,885,167 | ||
| Total Common Stocks | ||
| (cost $594,402,490) | 657,212,061 |
12
| Other Investment—1.2% | Shares | Value ($) | |
| Registered Investment Company; | |||
| Dreyfus Institutional Preferred | |||
| Plus Money Market Fund | |||
| (cost $7,812,000) | 7,812,000 | c | 7,812,000 |
| Total Investments (cost $602,214,490) | 98.7 | % | 665,024,061 |
| Cash and Receivables (Net) | 1.3 | % | 8,617,585 |
| Net Assets | 100.0 | % | 673,641,646 |
REIT—Real Estate Investment Trust
| a Securities exempt from registration pursuant to Rule 144A under the Securities Act of 1933.These securities may be |
| resold in transactions exempt from registration, normally to qualified institutional buyers.At October 31, 2013, these |
| securities were valued at $939,905 or .1% of net assets. |
| b Non-income producing security. |
| c Investment in affiliated money market mutual fund. |
| Portfolio Summary (Unaudited)† | |||
| Value (%) | Value (%) | ||
| Diversified | 19.6 | Real Estate Services | 5.5 |
| Office | 18.4 | Hotel | 3.2 |
| Regional Malls | 11.0 | Self Storage | 2.9 |
| Retail | 8.9 | Residential | 1.5 |
| Multifamily | 7.8 | Money Market Investment | 1.2 |
| Shopping Centers | 6.3 | Office & Industrial | .7 |
| Health Care | 5.6 | Specialty | .6 |
| Industrial | 5.5 | 98.7 | |
| † Based on net assets. | |||
| See notes to financial statements. | |||
| The Fund | 13 |
| STATEMENT OF ASSETS AND LIABILITIES |
| October 31, 2013 |
| Cost | Value | ||||
| Assets ($): | |||||
| Investments in securities—See Statement of Investments: | |||||
| Unaffiliated issuers | 594,402,490 657,212,061 | ||||
| Affiliated issuers | 7,812,000 | 7,812,000 | |||
| Cash | 1,452,914 | ||||
| Cash denominated in foreign currencies | 5,071,703 | 5,058,581 | |||
| Receivable for investment securities sold | 7,830,853 | ||||
| Dividends receivable | 1,020,001 | ||||
| Receivable for shares of Common Stock subscribed | 1,145,322 | ||||
| Prepaid expenses | 30,588 | ||||
| 681,562,320 | |||||
| Liabilities ($): | |||||
| Due to The Dreyfus Corporation and affiliates—Note 3(c) | 624,778 | ||||
| Payable for investment securities purchased | 6,315,410 | ||||
| Payable for shares of Common Stock redeemed | 874,625 | ||||
| Accrued expenses | 105,861 | ||||
| 7,920,674 | |||||
| Net Assets ($) | 673,641,646 | ||||
| Composition of Net Assets ($): | |||||
| Paid-in capital | 623,109,635 | ||||
| Accumulated distributions in excess of investment income—net | (4,891,902 | ) | |||
| Accumulated net realized gain (loss) on investments | (7,352,980 | ) | |||
| Accumulated net unrealized appreciation (depreciation) | |||||
| on investments and foreign currency transactions | 62,776,893 | ||||
| Net Assets ($) | 673,641,646 | ||||
| Net Asset Value Per Share | |||||
| Class A | Class C | Class I | Class Y | ||
| Net Assets ($) | 9,812,248 | 1,303,523 | 662,524,819 | 1,056 | |
| Shares Outstanding | 1,127,059 | 152,398 | 76,892,620 | 122.55 | |
| Net Asset Value Per Share ($) | 8.71 | 8.55 | 8.62 | 8.62 | |
| See notes to financial statements. | |||||
14
STATEMENT OF OPERATIONS
| Ten Months Ended | Year Ended | |||
| October 31, 2013a | December 31, 2012 | |||
| Investment Income ($): | ||||
| Income: | ||||
| Cash dividends (net of $661,408 and $466,867, | ||||
| respectively, foreign taxes withheld at source): | ||||
| Unaffiliated issuers | 12,455,975 | 10,550,564 | ||
| Affiliated issuers | 6,701 | 8,607 | ||
| Interest | 442 | 2,208 | ||
| Total Income | 12,463,118 | 10,561,379 | ||
| Expenses: | ||||
| Management fee—Note 3(a) | 4,773,894 | 3,383,266 | ||
| Custodian fees—Note 3(c) | 169,634 | 136,258 | ||
| Shareholder servicing costs—Note 3(c) | 100,505 | 53,865 | ||
| Professional fees | 89,726 | 86,812 | ||
| Registration fees | 63,128 | 66,796 | ||
| Directors’ fees and expenses—Note 3(d) | 42,206 | 59,602 | ||
| Prospectus and shareholders’ reports | 25,403 | 21,800 | ||
| Distribution fees—Note 3(b) | 9,416 | 5,896 | ||
| Loan commitment fees—Note 2 | 4,603 | 3,211 | ||
| Interest expense—Note 2 | — | 407 | ||
| Miscellaneous | 27,053 | 28,871 | ||
| Total Expenses | 5,305,568 | 3,846,784 | ||
| Less—reduction in expenses | ||||
| due to undertaking—Note 3(a) | (17,847 | ) | (5,909 | ) |
| Less—reduction in fees due to | ||||
| earnings credits—Note 3(c) | (98 | ) | (85 | ) |
| Net Expenses | 5,287,623 | 3,840,790 | ||
| Investment Income—Net | 7,175,495 | 6,720,589 | ||
| Realized and Unrealized Gain (Loss) | ||||
| on Investments—Note 4 ($): | ||||
| Net realized gain (loss) on investments | ||||
| and foreign currency transactions | 13,956,599 | 14,001,809 | ||
| Net realized gain (loss) on forward | ||||
| foreign currency exchange contracts | (77,558 | ) | 11,983 | |
| Net Realized Gain (Loss) | 13,879,041 | 14,013,792 | ||
| Net unrealized appreciation (depreciation) on | ||||
| investments and foreign currency transactions | 12,549,566 | 60,066,333 | ||
| Net unrealized appreciation (depreciation) on | ||||
| forward foreign currency exchange contracts | (1,020 | ) | 1,020 | |
| Net Unrealized Appreciation (Depreciation) | 12,548,546 | 60,067,353 | ||
| Net Realized and Unrealized | ||||
| Gain (Loss) on Investments | 26,427,587 | 74,081,145 | ||
| Net Increase in Net Assets | ||||
| Resulting from Operations | 33,603,082 | 80,801,734 |
| a The fund has changed its fiscal year end from December 31 to October 31. |
| See notes to financial statements. |
| The Fund | 15 |
STATEMENT OF CHANGES IN NET ASSETS
| Ten Months Ended | Year Ended | Year Ended | ||||
| October 31, 2013a,b | December 31, 2012 | December 31, 2011 | ||||
| Operations ($): | ||||||
| Investment income—net | 7,175,495 | 6,720,589 | 3,700,692 | |||
| Net realized gain (loss) on investments | 13,879,041 | 14,013,792 | 9,109,210 | |||
| Net unrealized appreciation | ||||||
| (depreciation) on investments | 12,548,546 | 60,067,353 | (26,677,193 | ) | ||
| Net Increase (Decrease) in Net Assets | ||||||
| Resulting from Operations | 33,603,082 | 80,801,734 | (13,867,291 | ) | ||
| Dividends to Shareholders from ($): | ||||||
| Investment income—net: | ||||||
| Class A | (25,635 | ) | (446,322 | ) | (41,829 | ) |
| Class C | — | (49,721 | ) | (5,238 | ) | |
| Class I | (2,022,420 | ) | (24,162,459 | ) | (6,128,543 | ) |
| Total Dividends | (2,048,055 | ) | (24,658,502 | ) | (6,175,610 | ) |
| Capital Stock Transactions ($): | ||||||
| Net proceeds from shares sold: | ||||||
| Class A | 5,902,065 | 7,284,056 | 1,038,288 | |||
| Class C | 968,342 | 825,015 | 370,801 | |||
| Class I | 228,787,092 | 208,668,448 | 157,797,881 | |||
| Class Y | 1,000 | — | — | |||
| Dividends reinvested: | ||||||
| Class A | 24,808 | 437,212 | 38,234 | |||
| Class C | — | 23,805 | 5,084 | |||
| Class I | 614,725 | 7,320,117 | 1,720,687 | |||
| Cost of shares redeemed: | ||||||
| Class A | (6,156,426 | ) | (787,528 | ) | (580,624 | ) |
| Class C | (843,948 | ) | (218,376 | ) | (140,411 | ) |
| Class I | (59,405,722 | ) | (44,386,786 | ) | (43,892,760 | ) |
| Increase (Decrease) in Net Assets | ||||||
| from Capital Stock Transactions | 169,891,936 | 179,165,963 | 116,357,180 | |||
| Total Increase (Decrease) | ||||||
| in Net Assets | 201,446,963 | 235,309,195 | 96,314,279 | |||
| Net Assets ($): | ||||||
| Beginning of Period | 472,194,683 | 236,885,488 | 140,571,209 | |||
| End of Period | 673,641,646 | 472,194,683 | 236,885,488 | |||
| Distributions in excess of | ||||||
| investment income—net | (4,891,902 | ) | (15,833,588 | ) | (2,633,434 | ) |
16
| Ten Months Ended | Year Ended | Year Ended | ||||
| October 31, 2013a,b | December 31, 2012 | December 31, 2011 | ||||
| Capital Share Transactions: | ||||||
| Class Ac | ||||||
| Shares sold | 689,171 | 896,907 | 140,304 | |||
| Shares issued for dividends reinvested | 2,888 | 53,580 | 5,466 | |||
| Shares redeemed | (717,163 | ) | (100,371 | ) | (80,702 | ) |
| Net Increase (Decrease) | ||||||
| in Shares Outstanding | (25,104 | ) | 850,116 | 65,068 | ||
| Class Cc | ||||||
| Shares sold | 114,510 | 105,724 | 49,908 | |||
| Shares issued for dividends reinvested | — | 2,957 | 738 | |||
| Shares redeemed | (101,894 | ) | (27,305 | ) | (19,215 | ) |
| Net Increase (Decrease) in | ||||||
| Shares Outstanding | 12,616 | 81,376 | 31,431 | |||
| Class I | ||||||
| Shares sold | 27,128,378 | 26,817,101 | 21,673,063 | |||
| Shares issued for dividends reinvested | 72,406 | 907,078 | 248,289 | |||
| Shares redeemed | (7,066,971 | ) | (5,681,746 | ) | (6,128,211 | ) |
| Net Increase (Decrease) in | ||||||
| Shares Outstanding | 20,133,813 | 22,042,433 | 15,793,141 | |||
| Class Y | ||||||
| Shares sold | 122.55 | — | — |
| a The fund has changed its fiscal year end from December 31 to October 31. |
| b Effective July 1, 2013, the fund commenced offering ClassY shares. |
| c During the period ended October 31, 2013, 8,684 Class C shares representing $78,761 were exchanged for 8,561 |
| Class A shares. |
See notes to financial statements.
| The Fund | 17 |
FINANCIAL HIGHLIGHTS
Please note that the financial highlights information in the following tables for the fund’s Class A and Class I shares represents the financial highlights of the Class A and Institutional shares, respectively, of the fund’s predecessor, BNY Hamilton Global Real Estate Securities Fund (“Hamilton Global Real Estate Securities Fund”), before the fund commenced operations as of the close of business on September 12, 2008, and represents the performance of the fund’s Class A and Class I shares thereafter. Before the fund commenced operations, all of the net assets of the Hamilton Global Real Estate Securities Fund were transferred to the fund in exchange for Class A and Class I shares of the fund in a tax-free reorganization.Total return shows how much your investment in the fund would have increased (or decreased) during each period, assuming you had reinvested all dividends and distributions.These figures have been derived from the fund’s and the fund’s predecessor’s financial statements.
| Ten Months Ended | Year Ended December 31, | ||||||||||||
| Class A Shares† | October 31, 2013a | 2012 | 2011 | 2010 | 2009 | 2008 | |||||||
| Per Share Data ($): | |||||||||||||
| Net asset value, | |||||||||||||
| beginning of period | 8.23 | 6.84 | 7.41 | 6.56 | 5.02 | 9.04 | |||||||
| Investment Operations: | |||||||||||||
| Investment income—netb | .09 | .09 | .10 | .05 | .08 | .16 | |||||||
| Net realized and unrealized | |||||||||||||
| gain (loss) on investments | .41 | 1.72 | (.52 | ) | 1.07 | 1.74 | (4.08 | ) | |||||
| Total from Investment Operations | .50 | 1.81 | (.42 | ) | 1.12 | 1.82 | (3.92 | ) | |||||
| Distributions: | |||||||||||||
| Dividends from | |||||||||||||
| investment income—net | (.02 | ) | (.42 | ) | (.15 | ) | (.27 | ) | (.28 | ) | (.10 | ) | |
| Net asset value, end of period | 8.71 | 8.23 | 6.84 | 7.41 | 6.56 | 5.02 | |||||||
| Total Return (%)c | 6.07 | d | 26.50 | (5.74 | ) | 17.15 | 36.38 | (43.60 | ) | ||||
| Ratios/Supplemental Data (%): | |||||||||||||
| Ratio of total expenses | |||||||||||||
| to average net assets | 1.51 | e | 1.55 | 1.57 | 1.67 | 4.36 | 1.62 | ||||||
| Ratio of net expenses | |||||||||||||
| to average net assets | 1.34 | e | 1.43 | 1.55 | 1.60 | 1.60 | 1.41 | ||||||
| Ratio of net investment income | |||||||||||||
| to average net assets | 1.23 | e | 1.13 | 1.36 | .74 | 1.44 | 1.83 | ||||||
| Portfolio Turnover Rate | 44.80 | d | 46.17 | 80.41 | 86.02 | 97.43 | 79 | ||||||
| Net Assets, end of period | |||||||||||||
| ($ x 1,000) | 9,812 | 9,478 | 2,066 | 1,756 | 162 | 12 | |||||||
| † Represents information for Class A shares of the fund’s predecessor, Hamilton Global Real Estate Securities Fund, |
| through September 12, 2008. |
| a The fund has changed its fiscal year end from December 31 to October 31. |
| b Based on average shares outstanding at each month end. |
| c Exclusive of sales charge. |
| d Not annualized. |
| e Annualized. |
See notes to financial statements.
18
| Ten Months Ended | Year Ended December 31, | ||||||||||||
| Class C Shares | October 31, 2013a | 2012 | 2011 | 2010 | 2009 | 2008 | b | ||||||
| Per Share Data ($): | |||||||||||||
| Net asset value, | |||||||||||||
| beginning of period | 8.11 | 6.76 | 7.32 | 6.50 | 5.02 | 7.78 | |||||||
| Investment Operations: | |||||||||||||
| Investment income—netc | .04 | .06 | .05 | .00 | d | .04 | .01 | ||||||
| Net realized and unrealized | |||||||||||||
| gain (loss) on investments | .40 | 1.66 | (.51 | ) | 1.07 | 1.75 | (2.74 | ) | |||||
| Total from Investment Operations | .44 | 1.72 | (.46 | ) | 1.07 | 1.79 | (2.73 | ) | |||||
| Distributions: | |||||||||||||
| Dividends from | |||||||||||||
| investment income—net | — | (.37 | ) | (.10 | ) | (.25 | ) | (.31 | ) | (.03 | ) | ||
| Net asset value, end of period | 8.55 | 8.11 | 6.76 | 7.32 | 6.50 | 5.02 | |||||||
| Total Return (%)e | 5.30 | f | 25.61 | (6.36 | ) | 16.48 | 35.35 | (34.92 | )f | ||||
| Ratios/Supplemental Data (%): | |||||||||||||
| Ratio of total expenses | |||||||||||||
| to average net assets | 2.21 | g | 2.29 | 2.50 | 2.45 | 2.91 | 2.46 | g | |||||
| Ratio of net expenses | |||||||||||||
| to average net assets | 2.09 | g | 2.19 | 2.29 | 2.35 | 2.35 | 2.35 | g | |||||
| Ratio of net investment income | |||||||||||||
| to average net assets | .57 | g | .72 | .63 | .02 | .71 | .67 | g | |||||
| Portfolio Turnover Rate | 44.80 | f | 46.17 | 80.41 | 86.02 | 97.43 | 79 | ||||||
| Net Assets, end of period | |||||||||||||
| ($ x 1,000) | 1,304 | 1,134 | 395 | 198 | 38 | 6 | |||||||
| a | The fund has changed its fiscal year end from December 31 to October 31. |
| b | From September 13, 2008 (commencement of initial offering) to December 31, 2008. |
| c | Based on average shares outstanding at each month end. |
| d | Amount represents less than $.01 per share. |
| e | Exclusive of sales charge. |
| f | Not annualized. |
| g | Annualized. |
See notes to financial statements.
| The Fund | 19 |
FINANCIAL HIGHLIGHTS (continued)
| Ten Months Ended | Year Ended December 31, | ||||||||||||
| Class I Shares† | October 31, 2013a | 2012 | 2011 | 2010 | 2009 | 2008 | |||||||
| Per Share Data ($): | |||||||||||||
| Net asset value, | |||||||||||||
| beginning of period | 8.13 | 6.75 | 7.33 | 6.49 | 5.02 | 9.04 | |||||||
| Investment Operations: | |||||||||||||
| Investment income—netb | .10 | .15 | .13 | .10 | .14 | .16 | |||||||
| Net realized and unrealized | |||||||||||||
| gain (loss) on investments | .42 | 1.66 | (.52 | ) | 1.05 | 1.70 | (4.06 | ) | |||||
| Total from Investment Operations | .52 | 1.81 | (.39 | ) | 1.15 | 1.84 | (3.90 | ) | |||||
| Distributions: | |||||||||||||
| Dividends from | |||||||||||||
| investment income—net | (.03 | ) | (.43 | ) | (.19 | ) | (.31 | ) | (.37 | ) | (.12 | ) | |
| Net asset value, end of period | 8.62 | 8.13 | 6.75 | 7.33 | 6.49 | 5.02 | |||||||
| Total Return (%) | 6.41 | c | 26.92 | (5.41 | ) | 17.91 | 36.94 | (43.38 | ) | ||||
| Ratios/Supplemental Data (%): | |||||||||||||
| Ratio of total expenses | |||||||||||||
| to average net assets | 1.04 | d | 1.07 | 1.11 | 1.17 | 1.33 | 1.24 | ||||||
| Ratio of net expenses | |||||||||||||
| to average net assets | 1.04 | d | 1.07 | 1.11 | 1.17 | 1.18 | 1.19 | ||||||
| Ratio of net investment income | |||||||||||||
| to average net assets | 1.43 | d | 1.90 | 1.81 | 1.51 | 2.55 | 2.24 | ||||||
| Portfolio Turnover Rate | 44.80 | c | 46.17 | 80.41 | 86.02 | 97.43 | 79 | ||||||
| Net Assets, end of period | |||||||||||||
| ($ x 1,000) | 662,525 | 461,583 | 234,424 | 138,618 | 84,854 | 48,255 | |||||||
| † Represents information for Institutional shares of the fund’s predecessor, Hamilton Global Real Estate Securities |
| Fund, through September 12, 2008. |
| a The fund has changed its fiscal year end from December 31 to October 31. |
| b Based on average shares outstanding at each month end. |
| c Not annualized. |
| d Annualized. |
See notes to financial statements.
20
| Period Ended | |
| Class Y Shares | October 31, 2013 a |
| Per Share Data ($): | |
| Net asset value, beginning of period | 8.16 |
| Investment Operations: | |
| Investment income—netb | .01 |
| Net realized and unrealized | |
| gain (loss) on investments | .45 |
| Total from Investment Operations | .46 |
| Net asset value, end of period | 8.62 |
| Total Return (%)c | 5.64 |
| Ratios/Supplemental Data (%): | |
| Ratio of total expenses to average net assetsd | 1.06 |
| Ratio of net expenses to average net assetsd | 1.05 |
| Ratio of net investment income | |
| to average net assetsd | .23 |
| Portfolio Turnover Ratec | 44.80 |
| Net Assets, end of period ($ x 1,000) | 1 |
| a | Effective July 1, 2013, the fund commenced offering ClassY shares. |
| b | Based on average shares outstanding at each month end. |
| c | Not annualized. |
| d | Annualized. |
See notes to financial statements.
| The Fund | 21 |
NOTES TO FINANCIAL STATEMENTS
NOTE 1—Significant Accounting Policies:
Dreyfus Global Real Estate Securities Fund (the “fund”) is a separate diversified series of Dreyfus Premier Investment Funds, Inc. (the “Company”), which is registered under the Investment Company Act of 1940, as amended (the “Act”), as an open-end management investment company and operates as a series company currently offering eight series, including the fund.The fund’s investment objective is to maximize total return consisting of capital appreciation and current income.The Dreyfus Corporation (the “Manager” or “Dreyfus”), a wholly-owned subsidiary of The Bank of NewYork Mellon Corporation (“BNY Mellon”), serves as the fund’s investment adviser. CenterSquare Investment Management, Inc. (“CenterSquare”) (formerly, Urdang Securities Management, Inc.) serves as the fund’s sub-investment adviser. CenterSquare is a wholly-owned subsidiary of BNY Mellon and an affiliate of Dreyfus.
On March 27, 2013, the Company’s Board of Directors (the “Board”) approved a change in the fund’s fiscal year end from December 31 to October 31.
At a meeting held on June 18, 2013, the Board approved, effective July 1, 2013: (a) for the fund to offer ClassY shares; and, (b) an increase in the authorized shares of the fund from 250 million to 650 million and authorized 100 million Class Y shares.
MBSC Securities Corporation (the “Distributor”), a wholly-owned subsidiary of Dreyfus, is the distributor of the fund’s shares.The fund is authorized to issue 650 million shares of $.001 par value Common Stock.The fund currently offers four classes of shares: Class A (100 million shares authorized), Class C (50 million shares authorized), Class I (400 million shares authorized) and ClassY (100 million shares authorized). Class A shares generally are subject to a sales charge imposed at the time of purchase. Class C shares are subject to a contingent deferred sales charge (“CDSC”) imposed on Class C shares redeemed within one year of purchase. Class I shares are sold at net asset value per share only to institutional investors. Class Y shares are sold at net asset value per share to certain investors, including certain institutional
22
investors. Other differences between the classes include the services offered to and the expenses borne by each class, the allocation of certain transfer agency costs and certain voting rights. Income, expenses (other than expenses attributable to a specific class), and realized and unrealized gains or losses on investments are allocated to each class of shares based on its relative net assets.
As of October 31, 2013, MBC Investments Corp., an indirect subsidiary of BNY Mellon, held all of the outstanding Class Y shares of the fund.
The Company accounts separately for the assets, liabilities and operations of each series. Expenses directly attributable to each series are charged to that series’ operations; expenses which are applicable to all series are allocated among them on a pro rata basis.
The Financial Accounting Standards Board (“FASB”) Accounting Standards Codification is the exclusive reference of authoritative U.S. generally accepted accounting principles (“GAAP”) recognized by the FASB to be applied by nongovernmental entities. Rules and interpretive releases of the Securities and Exchange Commission (“SEC”) under authority of federal laws are also sources of authoritative GAAP for SEC registrants. The fund’s financial statements are prepared in accordance with GAAP, which may require the use of management estimates and assumptions.Actual results could differ from those estimates.
The Company enters into contracts that contain a variety of indemnifications. The fund’s maximum exposure under these arrangements is unknown.The fund does not anticipate recognizing any loss related to these arrangements.
(a) Portfolio valuation: The fair value of a financial instrument is the amount that would be received to sell an asset or paid to transfer a liability in an orderly transaction between market participants at the measurement date (i.e., the exit price). GAAP establishes a fair value
| The Fund | 23 |
NOTES TO FINANCIAL STATEMENTS (continued)
hierarchy that prioritizes the inputs of valuation techniques used to measure fair value. This hierarchy gives the highest priority to unadjusted quoted prices in active markets for identical assets or liabilities (Level 1 measurements) and the lowest priority to unobservable inputs (Level 3 measurements).
Additionally, GAAP provides guidance on determining whether the volume and activity in a market has decreased significantly and whether such a decrease in activity results in transactions that are not orderly. GAAP requires enhanced disclosures around valuation inputs and techniques used during annual and interim periods.
Various inputs are used in determining the value of the fund’s investments relating to fair value measurements.These inputs are summarized in the three broad levels listed below:
Level 1—unadjusted quoted prices in active markets for identical investments.
Level 2—other significant observable inputs (including quoted prices for similar investments, interest rates, prepayment speeds, credit risk, etc.).
Level 3—significant unobservable inputs (including the fund’s own assumptions in determining the fair value of investments).
The inputs or methodology used for valuing securities are not necessarily an indication of the risk associated with investing in those securities.
Changes in valuation techniques may result in transfers in or out of an assigned level within the disclosure hierarchy. Valuation techniques used to value the fund’s investments are as follows:
Investments in securities are valued at the last sales price on the securities exchange or national securities market on which such securities are primarily traded. Securities listed on the National Market System for which market quotations are available are valued at the official closing price or, if there is no official closing price that day, at the last
24
sales price. Securities not listed on an exchange or the national securities market, or securities for which there were no transactions, are valued at the average of the most recent bid and asked prices, except for open short positions, where the asked price is used for valuation purposes. Bid price is used when no asked price is available. Registered investment companies that are not traded on an exchange are valued at their net asset value. All of the preceding securities are categorized within Level 1 of the fair value hierarchy.
Fair valuing of securities may be determined with the assistance of a pricing service using calculations based on indices of domestic securities and other appropriate indicators, such as prices of relevant American Depository Receipts and financial futures. Utilizing these techniques may result in transfers between Level 1 and Level 2 of the fair value hierarchy.
When market quotations or official closing prices are not readily available, or are determined not to reflect accurately fair value, such as when the value of a security has been significantly affected by events after the close of the exchange or market on which the security is principally traded (for example, a foreign exchange or market), but before the fund calculates its net asset value, the fund may value these investments at fair value as determined in accordance with the procedures approved by the Board. Certain factors may be considered when fair valuing investments such as: fundamental analytical data, the nature and duration of restrictions on disposition, an evaluation of the forces that influence the market in which the securities are purchased and sold, and public trading in similar securities of the issuer or comparable issuers. These securities are either categorized within Level 2 or 3 of the fair value hierarchy depending on the relevant inputs used.
For restricted securities where observable inputs are limited, assumptions about market activity and risk are used and are categorized within Level 3 of the fair value hierarchy.
| The Fund | 25 |
NOTES TO FINANCIAL STATEMENTS (continued)
Investments denominated in foreign currencies are translated to U.S. dollars at the prevailing rates of exchange.
Forward foreign currency exchange contracts (“forward contracts”) are valued at the forward rate and are generally categorized within Level 2 of the fair value hierarchy.
The following is a summary of the inputs used as of October 31, 2013 in valuing the fund’s investments:
| Level 2—Other | Level 3— | |||
| Level 1— | Significant | Significant | ||
| Unadjusted | Observable | Unobservable | ||
| Quoted Prices | Inputs | Inputs | Total | |
| Assets ($) | ||||
| Investments in Securities: | ||||
| Equity Securities— | ||||
| Domestic | ||||
| Common Stocks† | 310,885,167 | — | — | 310,885,167 |
| Equity Securities— | ||||
| Foreign | ||||
| Common Stocks† | 346,326,894 | — | — | 346,326,894 |
| Mutual Funds | 7,812,000 | — | — | 7,812,000 |
| † See Statement of Investments for additional detailed categorizations. | ||||
At December 31, 2012, $261,251,002 of exchange traded foreign equity securities were classified within Level 2 of the fair value hierarchy pursuant to the fund’s fair valuation procedures.
(b) Foreign currency transactions: The fund does not isolate that portion of the results of operations resulting from changes in foreign exchange rates on investments from the fluctuations arising from changes in the market prices of securities held. Such fluctuations are included with the net realized and unrealized gain or loss on investments.
Net realized foreign exchange gains or losses arise from sales of foreign currencies, currency gains or losses realized on securities transactions between trade and settlement date, and the difference between the amounts of dividends, interest and foreign withholding taxes recorded on the fund’s books and the U.S. dollar equivalent of the amounts actually received or paid. Net unrealized foreign exchange gains and
26
losses arise from changes in the value of assets and liabilities other than investments resulting from changes in exchange rates. Foreign currency gains and losses on foreign currency transactions are also included with net realized and unrealized gain or loss on investments.
(c) Securities transactions and investment income: Securities transactions are recorded on a trade date basis. Realized gains and losses from securities transactions are recorded on the identified cost basis. Dividend income is recognized on the ex-dividend date and interest income, including, where applicable, accretion of discount and amortization of premium on investments, is recognized on the accrual basis.
(d) Affiliated issuers: Investments in other investment companies advised by Dreyfus are defined as “affiliated” under the Act. Investments in affiliated investment companies during the period ended October 31, 2013 were as follows:
| Affiliated | |||||
| Investment | Value | Value | Net | ||
| Company | 12/31/2012 ($) | Purchases ($) | Sales($) | 10/31/2013 ($) | Assets (%) |
| Dreyfus | |||||
| Institutional | |||||
| Preferred | |||||
| Plus Money | |||||
| Market Fund | 3,274,000 | 176,059,000 | 171,521,000 | 7,812,000 | 1.2 |
(e) Risk: Investing in foreign markets may involve special risks and considerations not typically associated with investing in the U.S.These risks include revaluation of currencies, high rates of inflation, repatriation restrictions on income and capital, and adverse political and economic developments. Moreover, securities issued in these markets may be less liquid, subject to government ownership controls and delayed settlements, and their prices may be more volatile than those of comparable securities in the U.S.
(f) Dividends to shareholders: Dividends are recorded on the ex-dividend date. Dividends from investment income-net and dividends from net realized capital gains, if any, are normally declared and paid annually, but the fund may make distributions on a more frequent basis
| The Fund | 27 |
NOTES TO FINANCIAL STATEMENTS (continued)
to comply with the distribution requirements of the Internal Revenue Code of 1986, as amended (the “Code”).To the extent that net realized capital gains can be offset by capital loss carryovers, it is the policy of the fund not to distribute such gains. Income and capital gain distributions are determined in accordance with income tax regulations, which may differ from GAAP.
(g) Federal income taxes: It is the policy of the fund to continue to qualify as a regulated investment company, if such qualification is in the best interests of its shareholders, by complying with the applicable provisions of the Code, and to make distributions of taxable income sufficient to relieve it from substantially all federal income and excise taxes.
As of and during the period ended October 31, 2013, the fund did not have any liabilities for any uncertain tax positions.The fund recognizes interest and penalties, if any, related to uncertain tax positions as income tax expense in the Statement of Operations. During the period ended October 31, 2013, the fund did not incur any interest or penalties.
Each tax year in the four-year period ended October 31, 2013 remains subject to examination by the Internal Revenue Service and state taxing authorities.
At October 31, 2013, the components of accumulated earnings on a tax basis were as follows: undistributed ordinary income $14,986,074, accumulated capital losses $2,349,612 and unrealized appreciation $37,895,549.
Under the Regulated Investment Company Modernization Act of 2010 (the “2010 Act”), the fund is permitted to carry forward capital losses incurred in taxable years beginning after December 22, 2010 (“post-enactment losses”) for an unlimited period. Furthermore, post-enactment capital loss carryovers retain their character as either short-term or long-term capital losses rather than short-term as they were under previous statute.The 2010 Act requires post-enactment losses to be utilized before the utilization of losses incurred in taxable years prior to the effective date of the 2010 Act (“pre-enactment losses”).As a result of this ordering rule, pre-enactment losses may be more likely to expire unused.
28
The accumulated capital loss carryover is available for federal income tax purposes to be applied against future net realized capital gains, if any, realized subsequent to October 31, 2013. If not applied, the carryover expires in fiscal year 2017.
The tax character of distributions paid to shareholders during the fiscal periods ended October 31, 2013 and December 31, 2012 were as follows: ordinary income $2,048,055 and $24,658,502, respectively.
During the period ended October 31, 2013, as a result of permanent book to tax differences, primarily due to the tax treatment for foreign currency gains and losses and passive foreign investment companies, the fund increased accumulated undistributed investment income-net by $5,814,246 and decreased accumulated net realized gain (loss) on investments by the same amount. Net assets and net asset value per share were not affected by this reclassification.
NOTE 2—Bank Lines of Credit:
The fund participates with other Dreyfus-managed funds in a $265 million unsecured credit facility led by Citibank, N.A. and a $300 million unsecured credit facility provided by The Bank of New York Mellon, a subsidiary of BNY Mellon and an affiliate of Dreyfus (each, a “Facility”), each to be utilized primarily for temporary or emergency purposes, including the financing of redemptions. Prior to October 9, 2013, the unsecured credit facility with Citibank, N.A. was $210 million. In connection therewith, the fund has agreed to pay its pro rata portion of commitment fees for each Facility. Interest is charged to the fund based on rates determined pursuant to the terms of the respective Facility at the time of borrowing. During the period ended October 31, 2013, the fund did not borrow under the Facilities.
NOTE 3—Management Fee, Sub-Investment Advisory Fee and Other Transactions With Affiliates:
(a) Pursuant to a management agreement with Dreyfus, the management fee is computed at an annual rate of .95% of the value of the fund’s average daily net assets and is payable monthly.
| The Fund | 29 |
NOTES TO FINANCIAL STATEMENTS (continued)
Dreyfus had contractually agreed, from January 1, 2013 through April 30, 2013, to waive receipt of its fees and/or assume the expenses of the fund so that the expenses of Class A, Class C and Class I shares (excluding Rule 12b-1 Distribution Plan fees, Shareholder Services Plan fees, taxes, interest expense, brokerage commissions, commitment fees on borrowings and extraordinary expenses) did not exceed 1.15% of the value of the fund’s average daily net assets. Dreyfus has also contractually agreed, from May 1, 2013 through July 1, 2014, for Class A, Class C and Class I shares and from July 1, 2013, through July 1, 2014 for Class Y shares, to waive receipt of its fees and/or assume the expenses of the fund so that the expenses of none of the classes (excluding certain expenses as described above) exceed 1.05% of the value of the fund’s average daily net assets. The reduction in expenses, pursuant to the undertaking, amounted to $17,847 during the period ended October 31, 2013.
Pursuant to a sub-investment advisory agreement between Dreyfus and CenterSquare, Dreyfus pays CenterSquare a monthly fee at an annual rate of .46% of the value of the fund’s average daily net assets.
During the period ended October 31, 2013, the Distributor retained $4,817 from commissions earned on sales of the fund’s Class A shares and $1,779 from CDSCs on redemptions of the fund’s Class C shares.
(b) Under the Distribution Plan adopted pursuant to Rule 12b-1 under the Act, Class C shares pay the Distributor for distributing its shares at an annual rate of .75% of the value of its average daily net assets. During the period ended October 31, 2013, Class C shares were charged $9,416 pursuant to the Distribution Plan.
(c) Under the Shareholder Services Plan, Class A and Class C shares pay the Distributor at an annual rate of .25% of the value of their average daily net assets for the provision of certain services.The services provided may include personal services relating to shareholder accounts, such as answering shareholder inquiries regarding the fund and providing reports and other information, and services related to the maintenance of shareholder accounts.The Distributor may make payments to Service Agents (securities dealers, financial institutions or other industry profes-
30
sionals) with respect to these services. The Distributor determines the amounts to be paid to Service Agents. During the period ended October 31, 2013, Class A and Class C shares were charged $23,929 and $3,139, respectively, pursuant to the Shareholder Services Plan.
The fund has arrangements with the transfer agent and the custodian whereby the fund may receive earnings credits when positive cash balances are maintained, which are used to offset transfer agency and custody fees. For financial reporting purposes, the fund includes net earnings credits as an expense offset in the Statement of Operations.
The fund compensates DreyfusTransfer, Inc., a wholly-owned subsidiary of Dreyfus, under a transfer agency agreement for providing transfer agency and cash management services for the fund. The majority of transfer agency fees are comprised of amounts paid on a per account basis, while cash management fees are related to fund subscriptions and redemptions. During the period ended October 31, 2013, the fund was charged $17,085 for transfer agency services and $578 for cash management services.These fees are included in Shareholder servicing costs in the Statement of Operations. Cash management fees were partially offset by earnings credits of $97.
The fund compensates The Bank of NewYork Mellon under a custody agreement for providing custodial services for the fund.These fees are determined based on net assets, geographic region and transaction activity. During the period ended October 31, 2013, the fund was charged $169,634 pursuant to the custody agreement.
The fund compensated The Bank of New York Mellon under a cash management agreement that was in effect until September 30, 2013 for performing certain cash management services related to fund subscriptions and redemptions. During the period ended October 31, 2013, the fund was charged $318 pursuant to the cash management agreement, which is included in Shareholder servicing costs in the Statement of Operations.These fees were partially offset by earnings credits of $1.
| The Fund | 31 |
NOTES TO FINANCIAL STATEMENTS (continued)
During the period ended October 31, 2013, the fund was charged $8,887 for services performed by the Chief Compliance Officer and his staff.
The components of “Due to The Dreyfus Corporation and affiliates” in the Statement of Assets and Liabilities consist of: management fees $540,590, Distribution Plan fees $828, Shareholder Services Plan fees $2,774, custodian fees $69,989, Chief Compliance Officer fees $7,445 and transfer agency fees $3,413, which are offset against an expense reimbursement currently in effect in the amount of $261.
(d) Each Board member also serves as a Board member of other funds within the Dreyfus complex. Annual retainer fees and attendance fees are allocated to each fund based on net assets.
NOTE 4—Securities Transactions:
The aggregate amount of purchases and sales of investment securities, excluding short-term securities and forward contracts, during the period ended October 31, 2013, amounted to $426,274,981 and $260,054,369, respectively.
Derivatives: A derivative is a financial instrument whose performance is derived from the performance of another asset. Each type of derivative instrument that was held by the fund during the period ended October 31, 2013 is discussed below.
Forward Foreign Currency Exchange Contracts: The fund enters into forward contracts in order to hedge its exposure to changes in foreign currency exchange rates on its foreign portfolio holdings, to settle foreign currency transactions or as a part of its investment strategy. When executing forward contracts, the fund is obligated to buy or sell a foreign currency at a specified rate on a certain date in the future. With respect to sales of forward contracts, the fund incurs a loss if the value of the contract increases between the date the forward contract
32
is opened and the date the forward contract is closed.The fund realizes a gain if the value of the contract decreases between those dates.With respect to purchases of forward contracts, the fund incurs a loss if the value of the contract decreases between the date the forward contract is opened and the date the forward contract is closed.The fund realizes a gain if the value of the contract increases between those dates. Any realized or unrealized gains or losses which occurred during the period are reflected in the Statement of Operations. The fund is exposed to foreign currency risk as a result of changes in value of underlying financial instruments.The fund is also exposed to credit risk associated with counterparty nonperformance on these forward contracts, which is generally limited to the unrealized gain on each open contract. At October 31, 2013, there were no forward contracts outstanding.
The following summarizes the average market value of derivatives outstanding during the period ended October 31, 2013:
| Average Market Value ($) | |
| Forward Contracts | 797,678 |
At October 31, 2013, the cost of investments for federal income tax purposes was $627,095,834; accordingly, accumulated net unrealized appreciation on investments was $37,928,227, consisting of $73,974,336 gross unrealized appreciation and $36,046,109 gross unrealized depreciation.
| The Fund | 33 |
REPORT OF INDEPENDENT REGISTERED
PUBLIC ACCOUNTING FIRM
Shareholders and Board of Directors Dreyfus Global Real Estate Securities Fund
We have audited the accompanying statement of assets and liabilities, including the statement of investments, of Dreyfus Global Real Estate Securities Fund (one of the series comprising Dreyfus Premier Investment Funds, Inc.) as of October 31, 2013, and the related statements of operations and changes in net assets, and the financial highlights for each of the periods indicated therein. These financial statements and financial highlights are the responsibility of the Fund’s management. Our responsibility is to express an opinion on these financial statements and financial highlights based on our audits.
We conducted our audits in accordance with the standards of the Public Company Accounting Oversight Board (United States).Those standards require that we plan and perform the audit to obtain reasonable assurance about whether the financial statements and financial highlights are free of material misstatement.We were not engaged to perform an audit of the Fund’s internal control over financial reporting. Our audits included consideration of internal control over financial reporting as a basis for designing audit procedures that are appropriate in the circumstances, but not for the purpose of expressing an opinion on the effectiveness of the Fund’s internal control over financial reporting. Accordingly, we express no such opinion. An audit also includes examining, on a test basis, evidence supporting the amounts and disclosures in the financial statements and financial highlights, assessing the accounting principles used and significant estimates made by management, and evaluating the overall financial statement presentation. Our procedures included confirmation of securities owned as of October 31, 2013 by correspondence with the custodian and others. We believe that our audits provide a reasonable basis for our opinion.
In our opinion, the financial statements and financial highlights referred to above present fairly, in all material respects, the financial position of Dreyfus Global Real Estate Securities Fund at October 31, 2013 and the results of its operations, the changes in its net assets and the financial highlights for each of the indicated periods, in conformity with U.S. generally accepted accounting principles.

New York, New York
December 27, 2013
34
IMPORTANT TAX INFORMATION (Unaudited)
For federal tax purposes, the fund hereby reports 10.57% of the ordinary dividends paid during the fiscal year ended October 31, 2013 as qualifying for the corporate dividends received deduction. Also, certain dividends paid by the fund may be subject to a maximum tax rate of 15%, as provided for by the Jobs and Growth Tax Relief Reconciliation Act of 2003. Of the distributions paid during the fiscal year, $5,689 represents the maximum amount that may be considered qualified dividend income. Shareholders will receive notification in early 2014 of the percentage applicable to the preparation of their 2013 income tax returns.
| The Fund | 35 |
BOARD MEMBERS INFORMATION (Unaudited)
| Joseph S. DiMartino (70) |
| Chairman of the Board (1995) |
| Principal Occupation During Past 5Years: |
| • Corporate Director and Trustee |
| Other Public Company Board Memberships During Past 5Years: |
| • CBIZ (formerly, Century Business Services, Inc.), a provider of outsourcing functions for small |
| and medium size companies, Director (1997-present) |
| • The Newark Group, a provider of a national market of paper recovery facilities, paperboard |
| mills and paperboard converting plants, Director (2000-2010) |
| • Sunair Services Corporation, a provider of certain outdoor-related services to homes and |
| businesses, Director (2005-2009) |
| No. of Portfolios for which Board Member Serves: 141 |
| ——————— |
| Peggy C. Davis (70) |
| Board Member (2012) |
| Principal Occupation During Past 5Years: |
| • Shad Professor of Law, New York University School of Law (1983-present) |
| No. of Portfolios for which Board Member Serves: 56 |
| ——————— |
| David P. Feldman (73) |
| Board Member (1991) |
| Principal Occupation During Past 5Years: |
| • Corporate Director and Trustee |
| Other Public Company Board Memberships During Past 5Years: |
| • BBH Mutual Funds Group (4 registered mutual funds), Director (1992-present) |
| No. of Portfolios for which Board Member Serves: 42 |
| ——————— |
| Ehud Houminer (73) |
| Board Member (2012) |
| Principal Occupation During Past 5Years: |
| • Executive-in-Residence at the Columbia Business School, Columbia University (1992-present) |
| Other Public Company Board Memberships During Past 5Years: |
| • Avnet Inc., an electronics distributor, Director (1993-2012) |
| No. of Portfolios for which Board Member Serves: 66 |
36
| Lynn Martin (73) |
| Board Member (1994) |
| Principal Occupation During Past 5Years: |
| • President ofThe Martin Hall Group LLC, a human resources consulting firm ( January 2005-2012) |
| Other Public Company Board Memberships During Past 5Years: |
| • AT&T Inc., a telecommunications company, Director (1999-2012) |
| • Ryder System, Inc., a supply chain and transportation management company, Director (1993-2012) |
| • The Proctor & Gamble Co., a consumer products company, Director (1994-2009) |
| • Constellation Energy Group Inc., Director (2003-2009) |
| No. of Portfolios for which Board Member Serves: 42 |
| ——————— |
| Robin A. Melvin (50) |
| Board Member (2011) |
| Principal Occupation During Past 5Years: |
| • Board Member, Illinois Mentoring Partnership, non-profit organization dedicated to increasing |
| the quantity and quality of mentoring services in Illinois (2013-present) |
| • Director, Boisi Family Foundation, a private family foundation that supports youth-serving orga- |
| nizations that promote the self sufficiency of youth from disadvantaged circumstances (1995-2012) |
| No. of Portfolios for which Board Member Serves: 90 |
| ——————— |
| Dr. Martin Peretz (74) |
| Board Member (2012) |
| Principal Occupation During Past 5Years: |
| • Editor-in-Chief Emeritus of The New Republic Magazine (2010-2011) (previously, |
| Editor-in-Chief, 1974-2010) |
| • Director of TheStreet.com, a financial information service on the web (1996-2010) |
| Other Public Company Board Memberships During Past 5Years: |
| • Pershing Square Capital Management,Adviser (2009-present) |
| No. of Portfolios for which Board Member Serves: 42 |
| ——————— |
Once elected all Board Members serve for an indefinite term, but achieve Emeritus status upon reaching age 80.The address of the Board Members and Officers is c/o The Dreyfus Corporation, 200 Park Avenue, NewYork, NewYork 10166. Additional information about the Board Members is available in the fund’s Statement of Additional Information which can be obtained from Dreyfus free of charge by calling this toll free number: 1-800-DREYFUS.
Daniel Rose, Emeritus Board Member
Sander Vanocur, Emeritus Board Member
Philip L.Toia, Emeritus Board Member
| The Fund | 37 |
OFFICERS OF THE FUND (Unaudited)
BRADLEY J. SKAPYAK, President since January 2010.
Chief Operating Officer and a director of the Manager since June 2009, Chairman of Dreyfus Transfer, Inc., an affiliate of the Manager and the transfer agent of the funds, since May 2011 and Executive Vice President of the Distributor since June 2007. From April 2003 to June 2009, Mr. Skapyak was the head of the Investment Accounting and Support Department of the Manager. He is an officer of 68 investment companies (comprised of 141 portfolios) managed by the Manager. He is 55 years old and has been an employee of the Manager since February 1988.
JOHN PAK, Chief Legal Officer since March 2013.
Chief Legal Officer of the Manager and Associate General Counsel and Managing Director of BNY Mellon since August 2012; from March 2005 to July 2012, Managing Director of Deutsche Bank, Deputy Global Head of Deutsche Asset Management Legal and Regional Head of Deutsche Asset Management Americas Legal. He is an officer of 69 investment companies (comprised of 166 portfolios) managed by the Manager. He is 45 years old and has been an employee of the Manager since August 2012.
JANETTE E. FARRAGHER, Vice President and Secretary since December 2011.
Assistant General Counsel of BNY Mellon, and an officer of 69 investment companies (comprised of 166 portfolios) managed by the Manager. She is 50 years old and has been an employee of the Manager since February 1984.
KIESHA ASTWOOD, Vice President and Assistant Secretary since January 2010.
Counsel of BNY Mellon, and an officer of 69 investment companies (comprised of 166 portfolios) managed by the Manager. She is 40 years old and has been an employee of the Manager since July 1995.
JAMES BITETTO, Vice President and Assistant Secretary since August 2005.
Senior Counsel of BNY Mellon and Secretary of the Manager, and an officer of 69 investment companies (comprised of 166 portfolios) managed by the Manager. He is 47 years old and has been an employee of the Manager since December 1996.
JONI LACKS CHARATAN, Vice President and Assistant Secretary since August 2005.
Senior Counsel of BNY Mellon, and an officer of 69 investment companies (comprised of 166 portfolios) managed by the Manager. She is 58 years old and has been an employee of the Manager since October 1988.
JOSEPH M. CHIOFFI, Vice President and Assistant Secretary since August 2005.
Senior Counsel of BNY Mellon, and an officer of 69 investment companies (comprised of 166 portfolios) managed by the Manager. He is 52 years old and has been an employee of the Manager since June 2000.
JOHN B. HAMMALIAN, Vice President and Assistant Secretary since August 2005.
Senior Managing Counsel of BNY Mellon, and an officer of 69 investment companies (comprised of 166 portfolios) managed by the Manager. He is 50 years old and has been an employee of the Manager since February 1991.
ROBERT R. MULLERY, Vice President and Assistant Secretary since August 2005.
Managing Counsel of BNY Mellon, and an officer of 69 investment companies (comprised of 166 portfolios) managed by the Manager. He is 61 years old and has been an employee of the Manager since May 1986.
38
JEFF PRUSNOFSKY, Vice President and Assistant Secretary since August 2005.
Senior Managing Counsel of BNY Mellon, and an officer of 69 investment companies (comprised of 166 portfolios) managed by the Manager. He is 48 years old and has been an employee of the Manager since October 1990.
JAMES WINDELS, Treasurer since November 2001.
Director – Mutual Fund Accounting of the Manager, and an officer of 69 investment companies (comprised of 166 portfolios) managed by the Manager. He is 55 years old and has been an employee of the Manager since April 1985.
RICHARD CASSARO, Assistant Treasurer since January 2008.
Senior Accounting Manager – Money Market and Municipal Bond Funds of the Manager, and an officer of 69 investment companies (comprised of 166 portfolios) managed by the Manager. He is 54 years old and has been an employee of the Manager since September 1982.
GAVIN C. REILLY, Assistant Treasurer since December 2005.
Tax Manager of the Investment Accounting and Support Department of the Manager, and an officer of 69 investment companies (comprised of 166 portfolios) managed by the Manager. He is 45 years old and has been an employee of the Manager since April 1991.
ROBERT S. ROBOL, Assistant Treasurer since August 2005.
Senior Accounting Manager – Fixed Income Funds of the Manager, and an officer of 69 investment companies (comprised of 166 portfolios) managed by the Manager. He is 49 years old and has been an employee of the Manager since October 1988.
ROBERT SALVIOLO, Assistant Treasurer since July 2007.
Senior Accounting Manager – Equity Funds of the Manager, and an officer of 69 investment companies (comprised of 166 portfolios) managed by the Manager. He is 46 years old and has been an employee of the Manager since June 1989.
ROBERT SVAGNA, Assistant Treasurer since December 2002.
Senior Accounting Manager – Equity Funds of the Manager, and an officer of 69 investment companies (comprised of 166 portfolios) managed by the Manager. He is 46 years old and has been an employee of the Manager since November 1990.
JOSEPH W. CONNOLLY, Chief Compliance Officer since October 2004.
Chief Compliance Officer of the Manager and The Dreyfus Family of Funds (69 investment companies, comprised of 166 portfolios). He is 56 years old and has served in various capacities with the Manager since 1980, including manager of the firm’s Fund Accounting Department from 1997 through October 2001.
MATTHEW D. CONNOLLY, Anti-Money Laundering Compliance Officer since April 2012.
Anti-Money Laundering Compliance Officer of the Distributor since October 2011; from March 2010 to September 2011, Global Head, KYC Reviews and Director, UBS Investment Bank; until March 2010, AML Compliance Officer and Senior Vice President, Citi Global Wealth Management. He is an officer of 64 investment companies (comprised of 161 portfolios) managed by the Manager. He is 41 years old and has been an employee of the Distributor since October 2011.
| The Fund | 39 |
NOTES
For More Information
Telephone Call your financial representative or 1-800-DREYFUS
Mail The Dreyfus Family of Funds, 144 Glenn Curtiss Boulevard, Uniondale, NY 11556-0144
The fund files its complete schedule of portfolio holdings with the Securities and Exchange Commission (“SEC”) for the first and third quarters of each fiscal year on Form N-Q. The fund’s Forms N-Q are available on the SEC’s website at http://www.sec.gov and may be reviewed and copied at the SEC’s Public Reference Room in Washington, DC. Information on the operation of the Public Reference Room may be obtained by calling 1-800-SEC-0330.
Save time. Save paper. View your next shareholder report online as soon as it’s available. Log into www.dreyfus.com and sign up for Dreyfus eCommunications. It’s simple and only takes a few minutes.
The views expressed in this report reflect those of the portfolio manager only through the end of the period covered and do not necessarily represent the views of Dreyfus or any other person in the Dreyfus organization. Any such views are subject to change at any time based upon market or other conditions and Dreyfus disclaims any responsibility to update such views.These views may not be relied on as investment advice and, because investment decisions for a Dreyfus fund are based on numerous factors, may not be relied on as an indication of trading intent on behalf of any Dreyfus fund.
| Not FDIC-Insured • Not Bank-Guaranteed • May Lose Value |
Contents | |
THE FUND | |
| 2 | A Letter from the President |
| 3 | Discussion of Fund Performance |
| 6 | Fund Performance |
| 8 | Understanding Your Fund’s Expenses |
| 8 | Comparing Your Fund’s Expenses With Those of Other Funds |
| 9 | Statement of Investments |
| 11 | Statement of Assets and Liabilities |
| 12 | Statement of Operations |
| 13 | Statement of Changes in Net Assets |
| 14 | Financial Highlights |
| 17 | Notes to Financial Statements |
| 29 | Report of Independent Registered Public Accounting Firm |
| 30 | Board Members Information |
| 32 | Officers of the Fund |
FOR MORE INFORMATION | |
Back Cover |
Dreyfus
India Fund
The Fund
A LETTER FROM THE PRESIDENT
Dear Shareholder:
We are pleased to present this annual report for Dreyfus India Fund, covering the 12-month period from November 1, 2012, through October 31, 2013. For information about how the fund performed during the reporting period, as well as general market perspectives, we provide a Discussion of Fund Performance on the pages that follow.
Improving global economic conditions drove developed stock markets higher over much of the reporting period. Europe appeared to put the worst of its sovereign debt and banking crises behind it, and Japan embarked on a new economic course designed to reflate its long-stagnant domestic economy. However, the world’s emerging markets struggled with the effects of local economic slowdowns. As a result, equity market returns varied widely from one country to another over the past 12 months.
We currently expect global economic conditions to continue to improve in 2014, with stronger growth in many developed countries fueled by past and continuing monetary ease. The emerging markets seem poised for moderate economic expansion despite recently negative investor sentiment. In the United States, we anticipate accelerating growth supported by the fading drags of tighter federal fiscal policies and downsizing on the state and local levels. For more information on how these observations may affect your investments, we encourage you to speak with your financial advisor.
Thank you for your continued confidence and support.

J. Charles Cardona
President
The Dreyfus Corporation
November 15, 2013
2
DISCUSSION OF FUND PERFORMANCE
For the period of November 1, 2012, through October 31, 2013, as provided by Hugh Simon, Raymond Chan and Abhijit Sarkar, Portfolio Managers of Hamon Asian Advisors Limited, Sub-Investment Adviser
Fund and Market Performance Overview
For the 12-month period ended October 31, 2013, Dreyfus India Fund’s Class A shares produced a total return of –28.63%, Class C shares returned –29.18% and Class I shares returned –28.26%.1 In comparison, the fund’s benchmark, the MSCI® India Index (the “Index”), produced a total return of 0.65% for the same period.2
Indian equities encountered heightened volatility in the midst of sluggish economic growth, rising interest rates, and capital outflows to other markets.The fund produced lower returns than its benchmark, mainly due to its focus on domestically oriented small and midcap companies at a time when exporters and large-cap companies fared better.
The Fund’s Investment Approach
The fund, which seeks long-term capital appreciation, normally invests at least 80% of its net assets in equity and fixed-income securities of Indian issuers and other investments that are tied economically to India.The fund may invest in companies of any market capitalization. The fund invests in securities denominated in the Indian rupee or other local currency of issue or U.S. dollar-denominated securities.
When choosing investments, we analyze several factors, including:
Economic and political trends in India
The current financial condition and future prospects of individual companies and sectors in India
The valuation of one company or sector in India relative to that of another
We generally seek companies with accelerated earnings outlooks and reasonably valued share prices. Characteristics of such companies may include reliable corporate governance, a commitment to increasing shareholder value, strong earnings momentum with consistent free cash flow generation, sound business fundamentals, and long-term vision.
| The Fund | 3 |
DISCUSSION OF FUND PERFORMANCE (continued)
Shifting Economic Expectations Sparked Market Volatility
Indian stocks were undermined by several negative influences over the reporting period. The country’s monetary policymakers attempted to stimulate more robust economic growth earlier in 2013, but investors were disappointed when the domestic economy failed to respond to monetary easing. In addition, foreign investors reacted unfavorably to financial reforms introduced by the government. Consequently, investment capital flowed away from the Indian market and toward more developed regions of the world, such as the United States, where economic recoveries had gained traction. Indian stock market declines were especially steep in the summer, as investors grew concerned about the implications for the emerging markets of a less accommodative U.S. monetary policy.
India’s stock market began to stabilize in September when the appointment of a new central bank governor raised hopes that liquidity would improve in the banking system.The Reserve Bank of India raised short-term interest rates, which helped to shore up the struggling rupee and boosted confidence in India’s financial markets. Moreover, a relatively good monsoon season bolstered India’s agricultural sector, and upcoming elections are expected to resolve prevailing political uncertainties.
While these developments enabled the large-cap stocks that comprise most of the Index to end the reporting period with little change from where they began, small and midcap stocks did not participate as substantially in the rebound.
Midcap Focus Dampened Results
The fund’s relative performance was undermined by overweight exposure to midcap companies, which lagged their large-cap counterparts by wide margins. Shortfalls were particularly severe in the financial sector, where disappointing stock selections included banks that were hurt by rising interest rates. For example, Canara Bank lost value due to concerns regarding underperforming loans, particularly those used to finance infrastructure projects. Media companies also fared relatively poorly, as Hinduja Ventures was hurt by rising interest rates after borrowing heavily to acquire new media assets. Reliance Infrastructure was hurt by higher interest rates and worries about infrastructure development trends in a weak economy.
The fund achieved better results in other areas.Telecommunications services provider Reliance Communications nearly doubled in value after shoring up its balance sheet
4
through asset sales. Alcoholic beverages maker United Spirits benefited from the acquisition of a controlling interest in the company by global spirits purveyor Diageo. UCO Bank rallied from a depressed valuation when investors realized that their concerns may have been overblown. Carmaker Tata Motors advanced after reporting strong sales of Land Rover vehicles in China.
Finding Opportunities in Attractively Valued Stocks
While a number of significant challenges remain for India’s economy, we believe that stocks of smaller, domestically oriented companies have been punished more than is warranted by their underlying business fundamentals. Therefore, we have maintained the fund’s focus on small- and midcap companies, but we have reduced its exposure to interest-rate sensitive businesses, such as banks. Instead, we have emphasized infrastructure developers, as well as consumer discretionary companies and health care providers that we expect to encounter rising demand from an expanding middle class of consumers.We also have added to the fund’s holdings of IT service companies. In our view, these strategies position the fund appropriately for the next phase of India’s economic cycle.
November 15, 2013
Please note, the position in any security highlighted with italicized typeface was sold during the reporting period. Emerging markets, such as those of India, tend to be more volatile than the markets of more mature economies, and generally have less diverse and less mature economic structures and less stable political systems than those of developed countries.The securities of companies located in emerging markets are often subject to rapid and large changes in price. An investment in this fund should be considered only as a supplement to a complete investment program for those investors willing to accept the greater risks associated with investing in emerging market countries.
Equity funds are subject generally to market, market sector, market liquidity, issuer and investment style risks, among other factors, to varying degrees, all of which are more fully described in the fund’s prospectus.
The fund’s performance will be influenced by political, social and economic factors affecting investments in foreign companies. Special risks associated with investments in foreign companies include exposure to currency fluctuations, less liquidity, less developed or less efficient trading markets, lack of comprehensive company information, political instability and differing auditing and legal standards.These risks are enhanced in emerging market countries.
| 1 Total return includes reinvestment of dividends and any capital gains paid, and does not take into consideration the |
| maximum initial sales charge in the case of Class A shares, or the applicable contingent deferred sales charges imposed |
| on redemptions in the case of Class C shares. Had these charges been reflected, returns would have been lower. Past |
| performance is no guarantee of future results. Share price and investment return fluctuate such that upon redemption, |
| fund shares may be worth more or less than their original cost. Return figures provided reflect an undertaking for the |
| absorption of certain fund expenses by The Dreyfus Corporation through March 1, 2015, at which time it may be |
| extended, terminated or modified. Had these expenses not been absorbed, the fund’s returns would have been lower. |
| 2 SOURCE: LIPPER INC. – The MSCI India Index is designed to measure the performance of the large and mid |
| cap segments of the Indian market. |
| The Fund | 5 |
FUND PERFORMANCE
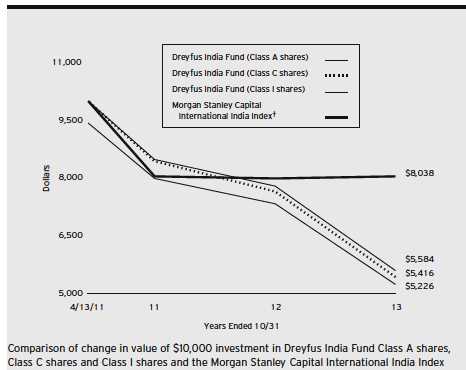
| † Source: Lipper Inc. |
| Past performance is not predictive of future performance. |
| The above graph compares a $10,000 investment made in each of the Class A, Class C and Class I shares of Dreyfus |
| India Fund on 4/13/11 (the fund’s inception date) to a $10,000 investment made in the Morgan Stanley Capital |
| International India NR Index (the “Index”) on that date.All dividends and capital gain distributions are reinvested. |
| The fund’s performance shown in the line graph above takes into account the maximum initial sales charge on Class A |
| shares and all other applicable fees and expenses on all classes.The Index is a free-float adjusted market capitalization |
| weighted index that monitors the performance of stocks from the country of India. Unlike a mutual fund, the Index is |
| not subject to charges, fees and other expenses. Investors cannot invest directly in any index.These factors can contribute |
| to the Index potentially outperforming the fund. Further information relating to fund performance, including expense |
| reimbursements, if applicable, is contained in the Financial Highlights section of the prospectus and elsewhere in this report. |
6
| Average Annual Total Returns as of 10/31/13 | |||||
| Inception | From | ||||
| Date | 1 Year | Inception | |||
| Class A shares | |||||
| with maximum sales charge (5.75%) | 4/13/11 | –32.72 | % | –22.47 | % |
| without sales charge | 4/13/11 | –28.63 | % | –20.65 | % |
| Class C shares | |||||
| with applicable redemption charge † | 4/13/11 | –29.89 | % | –21.38 | % |
| without redemption | 4/13/11 | –29.18 | % | –21.38 | % |
| Class I shares | 4/13/11 | –28.26 | % | –20.43 | % |
| Morgan Stanley Capital | |||||
| International India Index | 3/31/11 | 0.65 | % | –8.11 | %†† |
Past performance is not predictive of future performance.The fund’s performance shown in the graph and table does not reflect the deduction of taxes that a shareholder would pay on fund distributions or the redemption of fund shares.
| † | The maximum contingent deferred sales charge for Class C shares is 1% for shares redeemed within one year of the |
| date of purchase. | |
| †† | For comparative purposes, the value of the Index as of 3/31/11 is used as the beginning value on 4/13/11. |
| The Fund | 7 |
UNDERSTANDING YOUR FUND’S EXPENSES (Unaudited)
As a mutual fund investor, you pay ongoing expenses, such as management fees and other expenses. Using the information below, you can estimate how these expenses affect your investment and compare them with the expenses of other funds.You also may pay one-time transaction expenses, including sales charges (loads) and redemption fees, which are not shown in this section and would have resulted in higher total expenses. For more information, see your fund’s prospectus or talk to your financial adviser.
Review your fund’s expenses
The table below shows the expenses you would have paid on a $1,000 investment in Dreyfus India Fund from May 1, 2013 to October 31, 2013. It also shows how much a $1,000 investment would be worth at the close of the period, assuming actual returns and expenses.
Expenses and Value of a $1,000 Investment
assuming actual returns for the six months ended October 31, 2013
| Class A | Class C | Class I | |
| Expenses paid per $1,000† | $8.62 | $11.92 | $7.53 |
| Ending value (after expenses) | $754.10 | $752.20 | $756.20 |
COMPARING YOUR FUND’S EXPENSES
WITH THOSE OF OTHER FUNDS (Unaudited)
Using the SEC’s method to compare expenses
The Securities and Exchange Commission (SEC) has established guidelines to help investors assess fund expenses. Per these guidelines, the table below shows your fund’s expenses based on a $1,000 investment, assuming a hypothetical 5% annualized return. You can use this information to compare the ongoing expenses (but not transaction expenses or total cost) of investing in the fund with those of other funds.All mutual fund shareholder reports will provide this information to help you make this comparison. Please note that you cannot use this information to estimate your actual ending account balance and expenses paid during the period.
Expenses and Value of a $1,000 Investment
assuming a hypothetical 5% annualized return for the six months ended October 31, 2013
| Class A | Class C | Class I | |
| Expenses paid per $1,000† | $9.91 | $13.69 | $8.64 |
| Ending value (after expenses) | $1,015.38 | $1,011.59 | $1,016.64 |
| † Expenses are equal to the fund’s annualized expense ratio of 1.95% for Class A, 2.70% for Class C and 1.70% |
| for Class I,multiplied by the average account value over the period, multiplied by 184/365 (to reflect the one-half |
| year period). |
8
| STATEMENT OF INVESTMENTS |
| October 31, 2013 |
| Common Stocks—97.6% | Shares | Value ($) | |
| Automobiles & Components—4.5% | |||
| Tata Motors | 14,000 | 86,829 | |
| Banks—9.8% | |||
| Bank of Baroda | 5,600 | 58,583 | |
| UCO Bank | 22,000 | 25,864 | |
| Yes Bank | 17,000 | 102,019 | |
| 186,466 | |||
| Capital Goods—20.0% | |||
| Ingersoll-Rand India | 12,521 | 67,806 | |
| Jain Irrigation Systems | 88,000 | 95,797 | |
| Jaiprakash Associates | 56,000 | 43,420 | |
| Larsen & Toubro | 6,200 | 98,234 | |
| NCC | 180,000 | 75,714 | |
| 380,971 | |||
| Diversified Financials—5.2% | |||
| IFCI | 68,729 | 27,009 | |
| Manappuram Finance | 170,000 | 44,260 | |
| Reliance Capital | 4,500 | 27,100 | |
| 98,369 | |||
| Food, Beverage & Tobacco—9.4% | |||
| Dhampur Sugar Mills | 79,100 | 38,871 | |
| ITC | 13,000 | 70,865 | |
| Tilaknagar Industries | 68,526 | 69,580 | |
| 179,316 | |||
| Household & Personal Products—3.8% | |||
| Jyothy Laboratories | 24,000 | 72,365 | |
| Materials—1.7% | |||
| JK Lakshmi Cement | 30,000 | 33,073 | |
| Media—8.9% | |||
| Hinduja Ventures | 9,561 | 41,866 | |
| Network 18 Media & Investments | 111,111 | a | 57,043 |
| Prime Focus | 57,000 | a | 29,912 |
| TV18 Broadcast | 111,111 | a | 42,036 |
| 170,857 |
| The Fund | 9 |
STATEMENT OF INVESTMENTS (continued)
| Common Stocks (continued) | Shares | Value ($) | ||
| Pharmaceuticals, Biotech & Life Sciences—9.7% | ||||
| Glenmark Pharmaceuticals | 11,600 | 106,383 | ||
| Parabolic Drugs | 350,000 | a | 30,470 | |
| Ranbaxy Laboratories | 7,500 | a | 47,730 | |
| 184,583 | ||||
| Real Estate—1.9% | ||||
| Prestige Estates Projects | 16,000 | 37,244 | ||
| Software & Services—15.1% | ||||
| HCL Technologies | 4,856 | 86,551 | ||
| Hexaware Technologies | 30,000 | 64,901 | ||
| OnMobile Global | 50,000 | 21,845 | ||
| Tata Consultancy Services | 3,320 | 114,100 | ||
| 287,397 | ||||
| Telecommunication Services—.9% | ||||
| Tulip Telecom | 142,343 | a | 17,603 | |
| Transportation—3.1% | ||||
| Gateway Distriparks | 32,015 | 59,232 | ||
| Utilities—3.6% | ||||
| Indraprastha Gas | 15,000 | 68,453 | ||
| Total Investments (cost $2,370,436) | 97.6 | % | 1,862,758 | |
| Cash and Receivables (Net) | 2.4 | % | 45,715 | |
| Net Assets | 100.0 | % | 1,908,473 | |
| a | Non-income producing security. |
| Portfolio Summary (Unaudited)† | |||
| Value (%) | Value (%) | ||
| Capital Goods | 20.0 | Automobiles & Components | 4.5 |
| Software & Services | 15.1 | Household & Personal Products | 3.8 |
| Banks | 9.8 | Utilities | 3.6 |
| Pharmaceuticals, | Transportation | 3.1 | |
| Biotech & Life Sciences | 9.7 | Real Estate | 1.9 |
| Food, Beverage & Tobacco | 9.4 | Materials | 1.7 |
| Media | 8.9 | Telecommunication Services | .9 |
| Diversified Financials | 5.2 | 97.6 | |
| † Based on net assets. |
| See notes to financial statements. |
10
| STATEMENT OF ASSETS AND LIABILITIES |
| October 31, 2013 |
| Cost | Value | |||
| Assets ($): | ||||
| Investments in securities—See Statement of Investments | 2,370,436 | 1,862,758 | ||
| Cash | 105,158 | |||
| Cash denominated in foreign currencies | 333 | 579 | ||
| Dividends receivable | 3,418 | |||
| Prepaid expenses | 4,443 | |||
| 1,976,356 | ||||
| Liabilities ($): | ||||
| Due to The Dreyfus Corporation and affiliates—Note 3(c) | 4,292 | |||
| Payable for shares of Common Stock redeemed | 1,399 | |||
| Accrued expenses | 62,192 | |||
| 67,883 | ||||
| Net Assets ($) | 1,908,473 | |||
| Composition of Net Assets ($): | ||||
| Paid-in capital | 3,412,933 | |||
| Accumulated investment (loss)—net | (20,841 | ) | ||
| Accumulated net realized gain (loss) on investments | (976,185 | ) | ||
| Accumulated net unrealized appreciation (depreciation) | ||||
| on investments and foreign currency transactions | (507,434 | ) | ||
| Net Assets ($) | 1,908,473 | |||
| Net Asset Value Per Share | ||||
| Class A | Class C | Class I | ||
| Net Assets ($) | 1,160,598 | 381,160 | 366,715 | |
| Shares Outstanding | 167,440 | 56,325 | 52,535 | |
| Net Asset Value Per Share ($) | 6.93 | 6.77 | 6.98 | |
| See notes to financial statements. | ||||
| The Fund | 11 |
| STATEMENT OF OPERATIONS |
| Year Ended October 31, 2013 |
| Investment Income ($): | ||
| Income: | ||
| Cash dividends | 30,873 | |
| Expenses: | ||
| Management fee—Note 3(a) | 28,556 | |
| Professional fees | 77,750 | |
| Registration fees | 41,432 | |
| Custodian fees—Note 3(c) | 16,294 | |
| Prospectus and shareholders’ reports | 10,429 | |
| Shareholder servicing costs—Note 3(c) | 8,466 | |
| Distribution fees—Note 3(b) | 4,420 | |
| Directors’ fees and expenses—Note 3(d) | 193 | |
| Loan commitment fees—Note 2 | 22 | |
| Miscellaneous | 18,220 | |
| Total Expenses | 205,782 | |
| Less—reduction in expenses due to undertaking—Note 3(a) | (157,311 | ) |
| Less—reduction in fees due to earnings credits—Note 3(c) | (10 | ) |
| Net Expenses | 48,461 | |
| Investment (Loss)—Net | (17,588 | ) |
| Realized and Unrealized Gain (Loss) on Investments—Note 4 ($): | ||
| Net realized gain (loss) on investments and foreign currency transactions | (542,860 | ) |
| Net realized gain (loss) on forward foreign currency exchange contracts | 2,578 | |
| Net Realized Gain (Loss) | (540,282 | ) |
| Net unrealized appreciation (depreciation) on | ||
| investments and foreign currency transactions | (176,868 | ) |
| Net Realized and Unrealized Gain (Loss) on Investments | (717,150 | ) |
| Net (Decrease) in Net Assets Resulting from Operations | (734,738 | ) |
| See notes to financial statements. | ||
12
STATEMENT OF CHANGES IN NET ASSETS
| Year Ended October 31, | ||||
| 2013 | 2012 | |||
| Operations ($): | ||||
| Investment (loss)—net | (17,588 | ) | (22,118 | ) |
| Net realized gain (loss) on investments | (540,282 | ) | (323,157 | ) |
| Net unrealized appreciation | ||||
| (depreciation) on investments | (176,868 | ) | (41,318 | ) |
| Net Increase (Decrease) in Net Assets | ||||
| Resulting from Operations | (734,738 | ) | (386,593 | ) |
| Capital Stock Transactions ($): | ||||
| Net proceeds from shares sold: | ||||
| Class A | 986,644 | 1,528,331 | ||
| Class C | 70,578 | 603,249 | ||
| Class I | 131,860 | 656,261 | ||
| Cost of shares redeemed: | ||||
| Class A | (835,799 | ) | (1,504,838 | ) |
| Class C | (280,027 | ) | (328,147 | ) |
| Class I | (71,249 | ) | (587,434 | ) |
| Increase (Decrease) in Net Assets | ||||
| from Capital Stock Transactions | 2,007 | 367,422 | ||
| Total Increase (Decrease) in Net Assets | (732,731 | ) | (19,171 | ) |
| Net Assets ($): | ||||
| Beginning of Period | 2,641,204 | 2,660,375 | ||
| End of Period | 1,908,473 | 2,641,204 | ||
| Accumulated investment (loss)—net | (20,841 | ) | (41,599 | ) |
| Capital Share Transactions (Shares): | ||||
| Class Aa | ||||
| Shares sold | 118,600 | 158,060 | ||
| Shares redeemed | (99,050 | ) | (163,347 | ) |
| Net Increase (Decrease) in Shares Outstanding | 19,550 | (5,287 | ) | |
| Class Ca | ||||
| Shares sold | 8,190 | 60,472 | ||
| Shares redeemed | (32,061 | ) | (34,923 | ) |
| Net Increase (Decrease) in Shares Outstanding | (23,871 | ) | 25,549 | |
| Class I | ||||
| Shares sold | 16,632 | 69,120 | ||
| Shares redeemed | (9,404 | ) | (67,379 | ) |
| Net Increase (Decrease) in Shares Outstanding | 7,228 | 1,741 | ||
| a During the period ended October 31, 2013, 12,604 Class C shares representing $117,095 were exchanged for |
| 12,352 Class A shares. |
See notes to financial statements.
| The Fund | 13 |
FINANCIAL HIGHLIGHTS
The following tables describe the performance for each share class for the fiscal periods indicated. All information (except portfolio turnover rate) reflects financial results for a single fund share.Total return shows how much your investment in the fund would have increased (or decreased) during each period, assuming you had reinvested all dividends and distributions.These figures have been derived from the fund’s financial statements.
| Year Ended October 31, | ||||||
| Class A Shares | 2013 | 2012 | 2011 | a | ||
| Per Share Data ($): | ||||||
| Net asset value, beginning of period | 9.70 | 10.59 | 12.50 | |||
| Investment Operations: | ||||||
| Investment income (loss)—netb | (.05 | ) | (.05 | ) | .06 | |
| Net realized and unrealized | ||||||
| gain (loss) on investments | (2.73 | ) | (.87 | ) | (1.98 | ) |
| Total from Investment Operations | (2.78 | ) | (.92 | ) | (1.92 | ) |
| Proceeds from redemption feesc | .01 | .03 | .01 | |||
| Net asset value, end of period | 6.93 | 9.70 | 10.59 | |||
| Total Return (%)d | (28.63 | ) | (8.31 | ) | (15.28 | )e |
| Ratios/Supplemental Data (%): | ||||||
| Ratio of total expenses to average net assets | 8.90 | 9.60 | 12.82 | f | ||
| Ratio of net expenses to average net assets | 1.97 | 2.00 | 2.00 | f | ||
| Ratio of net investment income | ||||||
| (loss) to average net assets | (.64 | ) | (.58 | ) | .98 | f |
| Portfolio Turnover Rate | 82.84 | 119.55 | 36.45 | e | ||
| Net Assets, end of period ($ x 1,000) | 1,161 | 1,435 | 1,622 | |||
| a | From April 13, 2011 (commencement of operations) to October 31, 2011. |
| b | Based on average shares outstanding at each month end. |
| c | See Note 3(e). |
| d | Exclusive of sales charge. |
| e | Not annualized. |
| f | Annualized. |
See notes to financial statements.
14
| Year Ended October 31, | ||||||
| Class C Shares | 2013 | 2012 | 2011 | a | ||
| Per Share Data ($): | ||||||
| Net asset value, beginning of period | 9.55 | 10.54 | 12.50 | |||
| Investment Operations: | ||||||
| Investment income (loss)—netb | (.13 | ) | (.12 | ) | .01 | |
| Net realized and unrealized | ||||||
| gain (loss) on investments | (2.66 | ) | (.90 | ) | (1.98 | ) |
| Total from Investment Operations | (2.79 | ) | (1.02 | ) | (1.97 | ) |
| Proceeds from redemption feesc | .01 | .03 | .01 | |||
| Net asset value, end of period | 6.77 | 9.55 | 10.54 | |||
| Total Return (%)d | (29.18 | ) | (9.30 | ) | (15.68 | )e |
| Ratios/Supplemental Data (%): | ||||||
| Ratio of total expenses to average net assets | 9.49 | 9.87 | 13.73 | f | ||
| Ratio of net expenses to average net assets | 2.72 | 2.75 | 2.75 | f | ||
| Ratio of net investment income | ||||||
| (loss) to average net assets | (1.49 | ) | (1.24 | ) | .19 | f |
| Portfolio Turnover Rate | 82.84 | 119.55 | 36.45 | e | ||
| Net Assets, end of period ($ x 1,000) | 381 | 766 | 576 | |||
| a | From April 13, 2011 (commencement of operations) to October 31, 2011. |
| b | Based on average shares outstanding at each month end. |
| c | See Note 3(e). |
| d | Exclusive of sales charge. |
| e | Not annualized. |
| f | Annualized. |
See notes to financial statements.
| The Fund | 15 |
FINANCIAL HIGHLIGHTS (continued)
| Year Ended October 31, | ||||||
| Class I Shares | 2013 | 2012 | 2011 | a | ||
| Per Share Data ($): | ||||||
| Net asset value, beginning of period | 9.72 | 10.60 | 12.50 | |||
| Investment Operations: | ||||||
| Investment income (loss)—netb | (.01 | ) | (.06 | ) | .07 | |
| Net realized and unrealized | ||||||
| gain (loss) on investments | (2.74 | ) | (.85 | ) | (1.98 | ) |
| Total from Investment Operations | (2.75 | ) | (.91 | ) | (1.91 | ) |
| Proceeds from redemption feesc | .01 | .03 | .01 | |||
| Net asset value, end of period | 6.98 | 9.72 | 10.60 | |||
| Total Return (%) | (28.26 | ) | (8.21 | ) | (15.20 | )d |
| Ratios/Supplemental Data (%): | ||||||
| Ratio of total expenses to average net assets | 8.65 | 8.71 | 12.99 | e | ||
| Ratio of net expenses to average net assets | 1.72 | 1.75 | 1.75 | e | ||
| Ratio of net investment income | ||||||
| (loss) to average net assets | (.16 | ) | (.60 | ) | 1.10 | e |
| Portfolio Turnover Rate | 82.84 | 119.55 | 36.45 | d | ||
| Net Assets, end of period ($ x 1,000) | 367 | 441 | 462 | |||
| a | From April 13, 2011 (commencement of operations) to October 31, 2011. |
| b | Based on average shares outstanding at each month end. |
| c | See Note 3(e). |
| d | Not annualized. |
| e | Annualized. |
See notes to financial statements.
16
NOTES TO FINANCIAL STATEMENTS
NOTE 1—Significant Accounting Policies:
Dreyfus India Fund (the “fund”) is a separate non-diversified series of Dreyfus Premier Investment Funds, Inc. (the “Company”), which is registered under the Investment Company Act of 1940, as amended (the “Act”), as an open-end management investment company and operates as a series company currently offering eight series, including the fund. The fund’s investment objective is to seek long-term capital appreciation. The Dreyfus Corporation (the “Manager” or “Dreyfus”), a wholly-owned subsidiary ofThe Bank of NewYork Mellon Corporation (“BNY Mellon”), serves as the fund’s investment adviser. Hamon Asian Advisors Limited (“Hamon”), a wholly-owned subsidiary of BNY Mellon and an affiliate of Dreyfus, serves as the fund’s sub-investment adviser.
MBSC Securities Corporation (the “Distributor”), a wholly-owned subsidiary of Dreyfus, is the distributor of the fund’s shares.The fund is authorized to issue 100 million shares of $.001 par value Common Stock in each of the following classes of shares: Class A, Class C and Class I. Class A shares generally are subject to a sales charge imposed at the time of purchase. Class C shares are subject to a contingent deferred sales charge (“CDSC”) imposed on Class C shares redeemed within one year of purchase. Class I shares are sold at net asset value per share only to institutional investors. Other differences between the classes include the services offered to and the expenses borne by each class, the allocation of certain transfer agency costs and certain voting rights. Income, expenses (other than expenses attributable to a specific class) and realized and unrealized gains or losses on investments are allocated to each class of shares based on its relative net assets.
As of October 31, 2013, MBC Investments Corp., an indirect subsidiary of BNY Mellon, held 30,091 Class A, 40,000 Class C and 40,000 Class I shares of the fund.
| The Fund | 17 |
NOTES TO FINANCIAL STATEMENTS (continued)
The Company accounts separately for the assets, liabilities and operations of each series. Expenses directly attributable to each series are charged to that series’ operations; expenses which are applicable to all series are allocated among them on a pro rata basis.
The Financial Accounting Standards Board (“FASB”) Accounting Standards Codification is the exclusive reference of authoritative U.S. generally accepted accounting principles (“GAAP”) recognized by the FASB to be applied by nongovernmental entities. Rules and interpretive releases of the Securities and Exchange Commission (“SEC”) under authority of federal laws are also sources of authoritative GAAP for SEC registrants. The fund’s financial statements are prepared in accordance with GAAP, which may require the use of management estimates and assumptions.Actual results could differ from those estimates.
The Company enters into contracts that contain a variety of indemnifications. The fund’s maximum exposure under these arrangements is unknown.The fund does not anticipate recognizing any loss related to these arrangements.
(a) Portfolio valuation: The fair value of a financial instrument is the amount that would be received to sell an asset or paid to transfer a liability in an orderly transaction between market participants at the measurement date (i.e., the exit price). GAAP establishes a fair value hierarchy that prioritizes the inputs of valuation techniques used to measure fair value. This hierarchy gives the highest priority to unadjusted quoted prices in active markets for identical assets or liabilities (Level 1 measurements) and the lowest priority to unobservable inputs (Level 3 measurements).
Additionally, GAAP provides guidance on determining whether the volume and activity in a market has decreased significantly and whether such a decrease in activity results in transactions that are not orderly. GAAP requires enhanced disclosures around valuation inputs and techniques used during annual and interim periods.
18
Various inputs are used in determining the value of the fund’s investments relating to fair value measurements.These inputs are summarized in the three broad levels listed below:
Level 1—unadjusted quoted prices in active markets for identical investments.
Level 2—other significant observable inputs (including quoted prices for similar investments, interest rates, prepayment speeds, credit risk, etc.).
Level 3—significant unobservable inputs (including the fund’s own assumptions in determining the fair value of investments).
The inputs or methodology used for valuing securities are not necessarily an indication of the risk associated with investing in those securities.
Changes in valuation techniques may result in transfers in or out of an assigned level within the disclosure hierarchy. Valuation techniques used to value the fund’s investments are as follows:
Investments in securities are valued at the last sales price on the securities exchange or national securities market on which such securities are primarily traded. Securities listed on the National Market System for which market quotations are available are valued at the official closing price or, if there is no official closing price that day, at the last sales price. Securities not listed on an exchange or the national securities market, or securities for which there were no transactions, are valued at the average of the most recent bid and asked prices, except for open short positions, where the asked price is used for valuation purposes. Bid price is used when no asked price is available. Registered investment companies that are not traded on an exchange are valued at their net asset value. All of the preceding securities are categorized within Level 1 of the fair value hierarchy.
| The Fund | 19 |
NOTES TO FINANCIAL STATEMENTS (continued)
Fair valuing of securities may be determined with the assistance of a pricing service using calculations based on indices of domestic securities and other appropriate indicators, such as prices of relevant American Depository Receipts and financial futures. Utilizing these techniques may result in transfers between Level 1 and Level 2 of the fair value hierarchy.
When market quotations or official closing prices are not readily available, or are determined not to reflect accurately fair value, such as when the value of a security has been significantly affected by events after the close of the exchange or market on which the security is principally traded (for example, a foreign exchange or market), but before the fund calculates its net asset value, the fund may value these investments at fair value as determined in accordance with the procedures approved by the Company’s Board of Directors (the “Board”). Certain factors may be considered when fair valuing investments such as: fundamental analytical data, the nature and duration of restrictions on disposition, an evaluation of the forces that influence the market in which the securities are purchased and sold, and public trading in similar securities of the issuer or comparable issuers. These securities are either categorized within Level 2 or 3 of the fair value hierarchy depending on the relevant inputs used.
For restricted securities where observable inputs are limited, assumptions about market activity and risk are used and are categorized within Level 3 of the fair value hierarchy.
Investments denominated in foreign currencies are translated to U.S. dollars at the prevailing rates of exchange.
Forward foreign currency exchange contracts (“forward contracts”) are valued at the forward rate and are generally categorized within Level 2 of the fair value hierarchy.
20
The following is a summary of the inputs used as of October 31, 2013 in valuing the fund’s investments:
| Level 2—Other | Level 3— | |||
| Level 1— | Significant | Significant | ||
| Unadjusted | Observable | Unobservable | ||
| Quoted Prices | Inputs | Inputs | Total | |
| Assets ($) | ||||
| Investments in Securities: | ||||
| Equity Securities— | ||||
| Foreign | ||||
| Common Stocks† | 1,862,758 | — | — | 1,862,758 |
| † See Statement of Investments for additional detailed categorizations. | ||||
At October 31, 2013, there were no transfers between Level 1 and Level 2 of the fair value hierarchy.
(b) Foreign currency transactions: The fund does not isolate that portion of the results of operations resulting from changes in foreign exchange rates on investments from the fluctuations arising from changes in the market prices of securities held. Such fluctuations are included with the net realized and unrealized gain or loss on investments.
Net realized foreign exchange gains or losses arise from sales of foreign currencies, currency gains or losses realized on securities transactions between trade and settlement date, and the difference between the amounts of dividends, interest and foreign withholding taxes recorded on the fund’s books and the U.S. dollar equivalent of the amounts actually received or paid. Net unrealized foreign exchange gains and losses arise from changes in the value of assets and liabilities other than investments resulting from changes in exchange rates. Foreign currency gains and losses on foreign currency transactions are also included with net realized and unrealized gain or loss on investments.
| The Fund | 21 |
NOTES TO FINANCIAL STATEMENTS (continued)
(c) Securities transactions and investment income: Securities transactions are recorded on a trade date basis. Realized gains and losses from securities transactions are recorded on the identified cost basis. Dividend income is recognized on the ex-dividend date and interest income, including, where applicable, accretion of discount and amortization of premium on investments, is recognized on the accrual basis.
(d) Risk: Investing in foreign markets may involve special risks and considerations not typically associated with investing in the U.S.These risks include revaluation of currencies, high rates of inflation, repatriation restrictions on income and capital, and adverse political and economic developments. Moreover, securities issued in these markets may be less liquid, subject to government ownership controls and delayed settlements, and their prices may be more volatile than those of comparable securities in the U.S.
The fund follows an investment policy of investing primarily in the securities of Indian issuers and other investments that are tied economically to India. Because the fund’s investments are concentrated in India, the fund’s performance is expected to be closely tied to social, political and economic conditions within India and to be more volatile than the performance of more geographically diversified funds.
(e) Dividends to shareholders: Dividends are recorded on the ex-dividend date. Dividends from investment income-net and dividends from net realized capital gains, if any, are normally declared and paid annually, but the fund may make distributions on a more frequent basis to comply with the distribution requirements of the Internal Revenue Code of 1986, as amended (the “Code”).To the extent that net realized capital gains can be offset by capital loss carryovers, it is the policy of the fund not to distribute such gains. Income and capital gain distributions are determined in accordance with income tax regulations, which may differ from GAAP.
(f) Federal income taxes: It is the policy of the fund to continue to qualify as a regulated investment company, if such qualification is in the best interests of its shareholders, by complying with the applicable pro-
22
visions of the Code, and to make distributions of taxable income sufficient to relieve it from substantially all federal income and excise taxes.
As of and during the period ended October 31, 2013, the fund did not have any liabilities for any uncertain tax positions.The fund recognizes interest and penalties, if any, related to uncertain tax positions as income tax expense in the Statement of Operations. During the period ended October 31, 2013, the fund did not incur any interest or penalties.
Each tax year in the three-year period ended October 31, 2013 remains subject to examination by the Internal Revenue Service and state taxing authorities.
At October 31, 2013, the components of accumulated earnings on a tax basis were as follows: accumulated capital losses $955,477 and unrealized depreciation $540,327. In addition, the fund deferred for tax purposes late year ordinary losses of $8,656 to the first day of the following fiscal year.
Under the Regulated Investment Company Modernization Act of 2010 (the “2010 Act”), the fund is permitted to carry forward capital losses incurred in taxable years beginning after December 22, 2010 (“post-enactment losses”) for an unlimited period. Furthermore, post-enactment capital loss carryovers retain their character as either short-term or long-term capital losses rather than short-term as they were under previous statute.
The accumulated capital loss carryover is available for federal income tax purposes to be applied against future net realized capital gains, if any, realized subsequent to October 31, 2013.The fund has $484,974 of post-enactment short-term capital losses and $470,503 of post-enactment long-term capital losses which can be carried forward for an unlimited period.
During the period ended October 31, 2013, as a result of permanent book to tax differences, primarily due to the tax treatment for foreign currency gains and losses, passive foreign investment companies and net operating losses, the fund increased accumulated undistributed
| The Fund | 23 |
NOTES TO FINANCIAL STATEMENTS (continued)
investment income-net by $38,346, decreased accumulated net realized gain (loss) on investments by $6,358 and decreased paid-in capital by $31,988. Net assets and net asset value per share were not affected by this reclassification.
(g) Accounting Pronouncement: In January 2013, FASB issued Accounting Standards Update No. 2013-01 (“ASU 2013-01”), “Clarifying the Scope of Disclosures about Offsetting Assets and Liabilities”, which replaced Accounting Standards Update No. 2011-11 (“ASU 2011-11”), “Disclosures about Offsetting Assets and Liabilities”. ASU 2013-01 is effective for fiscal years beginning on or after January 1, 2013, and interim periods within those annual periods.ASU 2011-11 was intended to enhance disclosure requirements on the offsetting of financial assets and liabilities.ASU 2013-01 limits the scope of the new balance sheet offsetting disclosures to derivatives, repurchase agreements, and securities lending transactions to the extent that they are (1) offset in the financial statements or (2) subject to enforceable master netting arrangements (“MNA”) or similar agreements. Management is currently evaluating the application of ASU 2013-01 and its impact on the fund’s financial statements.
NOTE 2—Bank Lines of Credit:
The fund participates with other Dreyfus-managed funds in a $265 million unsecured credit facility led by Citibank, N.A. and a $300 million unsecured credit facility provided by The Bank of New York Mellon, a subsidiary of BNY Mellon and an affiliate of Dreyfus (each, a “Facility”), each to be utilized primarily for temporary or emergency purposes, including the financing of redemptions. Prior to October 9, 2013, the unsecured credit facility with Citibank, N.A. was $210 million. In connection therewith, the fund has agreed to pay its pro rata portion of commitment fees for each Facility. Interest is charged to the fund based on rates determined pursuant to the terms of the respective Facility at the time of borrowing. During the period ended October 31, 2013, the fund did not borrow under the Facilities.
24
NOTE 3—Management Fee, Sub-Investment Advisory Fee and Other Transactions with Affiliates:
(a) Pursuant to a management agreement with Dreyfus, the management fee is computed at the annual rate of 1.25% of the value of the fund’s average daily net assets and is payable monthly.
Dreyfus had contractually agreed, from November 1, 2012 through February 28, 2013, to waive receipt of its fees and/or assume the expenses of the fund so that the expenses of none of the classes (excluding Rule 12b-1 Distribution Plan fees, Shareholder Services Plan fees, taxes, interest expense, brokerage commissions, commitment fees on borrowings and extraordinary expenses) exceeded 1.75% of the value of the fund’s average daily net assets. Dreyfus has also contractually agreed, from March 1, 2013 through March 1, 2015, to waive receipt of its fees and/or assume the expenses of the fund so that the expenses of none of the classes (excluding certain expenses as described above) exceed 1.70% of the value of the fund’s average daily net assets. The reduction in expenses, pursuant to the undertaking, amounted to $157,311 during the period ended October 31, 2013.
Pursuant to a sub-investment advisory agreement between Dreyfus and Hamon, Dreyfus pays Hamon a fee at an annual rate of .625% of the value of the fund’s average daily net assets and is payable monthly.
During the period ended October 31, 2013, the Distributor retained $1,452 from commissions earned on sales of the fund’s Class A shares and $331 from CDSCs on redemptions of the fund’s Class C shares.
(b) Under the Distribution Plan adopted pursuant to Rule 12b-1 under the Act, Class C shares pay the Distributor for distributing its shares at an annual rate of .75% of the value of its average daily net assets. During the period ended October 31, 2013, Class C shares were charged $4,420 pursuant to the Distribution Plan.
| The Fund | 25 |
NOTES TO FINANCIAL STATEMENTS (continued)
(c) Under the Shareholder Services Plan, Class A and Class C shares pay the Distributor at an annual rate of .25% of the value of their average daily net assets for the provision of certain services.The services provided may include personal services relating to shareholder accounts, such as answering shareholder inquiries regarding the fund and providing reports and other information, and services related to the maintenance of shareholder accounts.The Distributor may make payments to Service Agents (securities dealers, financial institutions or other industry professionals) with respect to these services. The Distributor determines the amounts to be paid to Service Agents. During the period ended October 31, 2013, Class A and Class C shares were charged $3,205 and $1,473, respectively, pursuant to the Shareholder Services Plan.
The fund has arrangements with the transfer agent and the custodian whereby the fund may receive earnings credits when positive cash balances are maintained, which are used to offset transfer agency and custody fees. For financial reporting purposes, the fund includes net earnings credits as an expense offset in the Statement of Operations.
The fund compensates DreyfusTransfer, Inc., a wholly-owned subsidiary of Dreyfus, under a transfer agency agreement for providing transfer agency and cash management services for the fund. The majority of transfer agency fees are comprised of amounts paid on a per account basis, while cash management fees are related to fund subscriptions and redemptions. During the period ended October 31, 2013, the fund was charged $2,304 for transfer agency services and $81 for cash management services.These fees are included in Shareholder servicing costs in the Statement of Operations. Cash management fees were partially offset by earnings credits of $10.
The fund compensates The Bank of NewYork Mellon under a custody agreement for providing custodial services for the fund.These fees are determined based on net assets, geographic region and transaction activity. During the period ended October 31, 2013, the fund was charged $16,294 pursuant to the custody agreement.
26
The fund compensated The Bank of New York Mellon under a cash management agreement that was in effect until September 30, 2013 for performing certain cash management services related to fund subscriptions and redemptions. During the period ended October 31, 2013, the fund was charged $40 pursuant to the cash management agreement, which is included in Shareholder servicing costs in the Statement of Operations.
During the period ended October 31, 2013, the fund was charged $8,887 for services performed by the Chief Compliance Officer and his staff.
The components of “Due to The Dreyfus Corporation and affiliates” in the Statement of Assets and Liabilities consist of: management fees $1,907, Distribution Plan fees $235, Shareholder Services Plan fees $306, custodian fees $5,836, Chief Compliance Officer fees $7,445 and transfer agency fees $414, which are offset against an expense reimbursement currently in effect in the amount of $11,851.
(d) Each Board member also serves as a Board member of other funds within the Dreyfus complex. Annual retainer fees and attendance fees are allocated to each fund based on net assets.
(e) A 2% redemption fee is charged and retained by the fund on certain shares redeemed within sixty days following the date of issuance subject to certain exceptions, including redemptions made through the use of the fund’s exchange privilege. During the period ended October 31, 2013, the fund charged and retained $3,224 in redemption fees.
NOTE 4—Securities Transactions:
The aggregate amount of purchases and sales of investment securities, excluding short-term securities and forward contracts, during the period ended October 31, 2013, amounted to $1,867,124 and $1,982,381, respectively.
| The Fund | 27 |
NOTES TO FINANCIAL STATEMENTS (continued)
Derivatives: A derivative is a financial instrument whose performance is derived from the performance of another asset. Each type of derivative instrument that was held by the fund during the period ended October 31, 2013 is discussed below.
Forward Foreign Currency Exchange Contracts: The fund enters into forward contracts in order to hedge its exposure to changes in foreign currency exchange rates on its foreign portfolio holdings, to settle foreign currency transactions or as a part of its investment strategy. When executing forward contracts, the fund is obligated to buy or sell a foreign currency at a specified rate on a certain date in the future. With respect to sales of forward contracts, the fund incurs a loss if the value of the contract increases between the date the forward contract is opened and the date the forward contract is closed.The fund realizes a gain if the value of the contract decreases between those dates.With respect to purchases of forward contracts, the fund incurs a loss if the value of the contract decreases between the date the forward contract is opened and the date the forward contract is closed.The fund realizes a gain if the value of the contract increases between those dates. Any realized or unrealized gains or losses which occurred during the period are reflected in the Statement of Operations. The fund is exposed to foreign currency risk as a result of changes in value of underlying financial instruments.The fund is also exposed to credit risk associated with counterparty nonperformance on these forward contracts, which is generally limited to the unrealized gain on each open contract. At October 31, 2013, there were no forward contracts outstanding.
The following summarizes the average market value of derivatives outstanding during the period ended October 31, 2013:
| Average Market Value ($) | |
| Forward contracts | 10,514 |
At October 31, 2013, the cost of investments for federal income tax purposes was $2,403,329; accordingly, accumulated net unrealized depreciation on investments was $540,571, consisting of $130,786 gross unrealized appreciation and $671,357 gross unrealized depreciation.
28
| REPORT OF INDEPENDENT REGISTERED |
| PUBLIC ACCOUNTING FIRM |
Shareholders and Board of Directors
Dreyfus India Fund
We have audited the accompanying statement of assets and liabilities, including the statement of investments, of Dreyfus India Fund (one of the series comprising Dreyfus Premier Investment Funds, Inc.) as of October 31, 2013, and the related statement of operations for the year then ended, the statement of changes in net assets for each of the two years in the period then ended, and the financial highlights for each of the periods indicated therein.These financial statements and financial highlights are the responsibility of the Fund’s management. Our responsibility is to express an opinion on these financial statements and financial highlights based on our audits.
We conducted our audits in accordance with the standards of the Public Company Accounting Oversight Board (United States).Those standards require that we plan and perform the audit to obtain reasonable assurance about whether the financial statements and financial highlights are free of material misstatement.We were not engaged to perform an audit of the Fund’s internal control over financial reporting. Our audits included consideration of internal control over financial reporting as a basis for designing audit procedures that are appropriate in the circumstances, but not for the purpose of expressing an opinion on the effectiveness of the Fund’s internal control over financial reporting. Accordingly, we express no such opinion. An audit also includes examining, on a test basis, evidence supporting the amounts and disclosures in the financial statements and financial highlights, assessing the accounting principles used and significant estimates made by management, and evaluating the overall financial statement presentation. Our procedures included confirmation of securities owned as of October 31, 2013 by correspondence with the custodian and others. We believe that our audits provide a reasonable basis for our opinion.
In our opinion, the financial statements and financial highlights referred to above present fairly, in all material respects, the financial position of Dreyfus India Fund at October 31, 2013, the results of its operations for the year then ended, the changes in its net assets for each of the two years in the period then ended, and the financial highlights for each of the indicated periods, in conformity with U.S. generally accepted accounting principles.
New York, New York
December 27, 2013
| The Fund | 29 |
BOARD MEMBERS INFORMATION (Unaudited)
30
The Fund 31
OFFICERS OF THE FUND (Unaudited)

32
The Fund 33
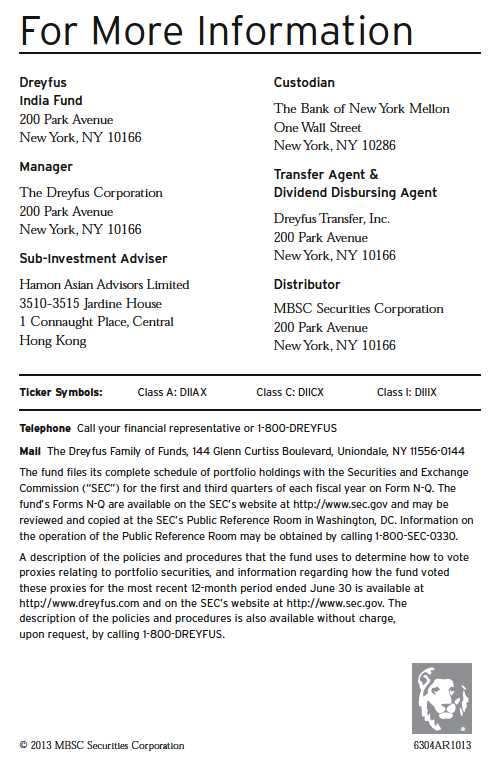
The views expressed in this report reflect those of the portfolio manager only through the end of the period covered and do not necessarily represent the views of Dreyfus or any other person in the Dreyfus organization. Any such views are subject to change at any time based upon market or other conditions and Dreyfus disclaims any responsibility to update such views.These views may not be relied on as investment advice and, because investment decisions for a Dreyfus fund are based on numerous factors, may not be relied on as an indication of trading intent on behalf of any Dreyfus fund.
Dreyfus
Satellite Alpha Fund
The Fund
A LETTER FROM THE PRESIDENT
Dear Shareholder:
We are pleased to present this annual report for Dreyfus Satellite Alpha Fund, covering the 12-month period from November 1, 2012, through October 31, 2013. For information about how the fund performed during the reporting period, as well as general market perspectives, we provide a Discussion of Fund Performance on the pages that follow.
Improving global economic conditions drove developed stock markets higher over much of the reporting period. Europe appeared to put the worst of its sovereign debt and banking crises behind it, and Japan embarked on a new economic course designed to reflate its long-stagnant domestic economy. However, the world’s emerging markets struggled with the effects of local economic slowdowns. As a result, equity market returns varied widely from one country to another over the past 12 months.
We currently expect global economic conditions to continue to improve in 2014, with stronger growth in many developed countries fueled by past and continuing monetary ease. The emerging markets seem poised for moderate economic expansion despite recently negative investor sentiment. In the United States, we anticipate accelerating growth supported by the fading drags of tighter federal fiscal policies and downsizing on the state and local levels. For more information on how these observations may affect your investments, we encourage you to speak with your financial advisor.
Thank you for your continued confidence and support.

J. Charles Cardona
President
The Dreyfus Corporation
November 15, 2013
2
DISCUSSION OF FUND PERFORMANCE
For the period of November 1, 2012, through October 31, 2013, as provided by Richard B. Hoey and Keith L. Stransky, CFA, Portfolio Managers
Fund and Market Performance Overview
For the 12-month period ended October 31, 2013, Dreyfus Satellite Alpha Fund’s Class A shares produced a total return of 4.37%, Class C shares returned 3.56%, and Class I shares returned 4.68%.1 In comparison, the fund’s benchmark, the Morgan Stanley Capital International (MSCI) World Index (the “Index”), produced a total return of 25.77% for the same period.2
Global equities generally responded positively to improved economic trends, but returns in the world’s bond markets were dampened by rising long-term interest rates. The fund lagged its benchmark, as its fixed-income and emerging-markets investments weighed on relative results. Given the fund’s flexible strategy, its returns may deviate substantially from that of its equities-only benchmark.
The Fund’s Investment Approach
The fund seeks long-term capital appreciation.To pursue its goal, the fund normally allocates its assets among other mutual funds advised by The Dreyfus Corporation, referred to as underlying funds, that provide exposure to alternative or non-traditional (i.e., satellite) asset categories or investment strategies. The underlying funds are selected by the Dreyfus Investment Committee based on their investment objectives and management policies, portfolio holdings, risk/reward profiles, historical performance and other factors.The Dreyfus Investment Committee will rebalance the fund’s investments in the underlying funds at least annually, but may do so more often in response to market conditions. As of October 31, 2013, the fund’s investments were allocated as follows:
| Underlying Funds | (%) |
| Dreyfus Natural Resources Fund | 21.42 |
| Dreyfus Emerging Markets Fund | 24.72 |
| Dreyfus Global Absolute Return Fund | 10.21 |
| Dreyfus International Bond Fund | 12.55 |
| Dreyfus Global Real Estate Securities Fund | 11.71 |
| Dreyfus Emerging Markets Debt Local Currency Fund | 9.83 |
| Dreyfus Inflation Adjusted Securities Fund | 9.55 |
| The Fund | 3 |
DISCUSSION OF FUND PERFORMANCE (continued)
Stocks Up, Bonds Down in Recovering Global Economy
Stock markets throughout the developed world rallied as global economic conditions improved over the reporting period. In the United States, employment gains, rebounding housing markets, and an aggressively accommodative monetary policy drove major stock market indices to record highs.The worst of Europe’s financial crisis seems to be over, as evidenced by stronger economic data and rebounding stock prices in previously hard hit nations. Japan’s stock market was lifted by stimulative fiscal and monetary policies from a new government seeking to reflate the domestic economy. However, most emerging economies struggled with economic slowdowns, and resulting outflows of investment capital hurt local stock markets.
While corporate- and asset-backed bonds also benefited to a degree from improving investor sentiment in the recovering global economy, sovereign debt securities lost value in many markets when long-term interest rates climbed from historically low levels. Bond market weakness was especially pronounced in the emerging markets.
Bond Funds Dampened Performance
Throughout the reporting period, we allocated the fund’s assets in a way that favored stocks over bonds.This strategy enabled the fund to participate more fully in equity market gains and cushioned the impact of bond market weakness.
However, the benefits of our allocation strategy were more than offset by weakness among some of the fund’s underlying investments. Results from Dreyfus Global Absolute Return Fund were undermined by overweighted exposure to higher quality, core European equity markets such as Germany and the Netherlands, which underperformed during the reporting period. Conversely, underweighted exposure to other European markets, such as Spain and France, detracted from returns as these markets rallied amid waning macroeconomic concerns.
The fund’s relative performance also was hurt by its underlying bond funds. The Treasury Inflation Protected Securities (“TIPS”) that primarily comprise the Dreyfus Inflation Adjusted Securities Fund lost value in a low inflation environment, and Dreyfus Emerging Markets Debt Local Currency Fund was hurt by plunging currency exchange rates in many of the world’s developing markets.
The fund achieved better results in other areas. Dreyfus Natural Resources Fund ranked as the fund’s top underlying investment over the reporting period, as it favored companies poised to benefit from increased production of U.S. oil and natural gas and shied away from producers of precious metals amid sharply falling commodity prices. The fund also received notable contributions from Dreyfus Global Real Estate Securities Fund, which participated in recovering property markets throughout the world.
4
Favoring Stocks Over Bonds
As of the reporting period’s end, we believe that global economic growth is likely to accelerate in 2014. Stronger growth could support stock prices as business conditions improve, but it also could further undermine bonds as interest rates rise. Consequently, we have maintained the fund’s emphasis on stocks over bonds.
In October 2013, we reduced the fund’s position in Dreyfus Global Absolute Return Fund and increased its exposure to Dreyfus Emerging Markets Fund. In our view, this change positions the fund for greater participation in attractively valued equities.
November 15, 2013
| Equity funds are subject generally to market, market sector, market liquidity, issuer and investment style risks, among |
| other factors, to varying degrees, all of which are more fully described in the prospectus of the fund and that of each |
| underlying fund. |
| The ability of the fund to achieve its investment goal depends, in part, on the ability of the Dreyfus Investment |
| Committee to allocate effectively the fund’s assets among the underlying funds.There can be no assurance that the |
| actual allocations will be effective in achieving the fund’s investment goal. |
| Each underlying international equity fund’s performance will be influenced by political, social and economic factors |
| affecting investments in foreign companies. Special risks associated with such companies include exposure to currency |
| fluctuations, less liquidity, less developed or less efficient trading markets, lack of comprehensive company information, |
| political instability and differing auditing and legal standards. |
| Because one of the underlying fund’s investments is concentrated in the securities of companies principally engaged in |
| the real estate sector, the value of the fund’s shares will be affected by factors particular to the real estate sector and |
| may fluctuate more widely than that of a fund which invests in a broader range of industries.The securities of issuers |
| that are principally engaged in the real estate sector may be subject to risks similar to those associated with the direct |
| ownership of real estate. |
| Because one of the underlying fund’s investments is concentrated in the natural resources and related sectors, the value |
| of its shares will be affected by factors particular to those sectors and may fluctuate more widely than that of a fund |
| which invests in a broad range of industries.The market value of these securities may be affected by numerous factors, |
| including events occurring in nature, inflationary pressures, domestic and international politics. Securities of companies |
| within specific natural resources sectors can perform differently from the overall market.This may be due to changes in |
| such things as the regulatory or competitive environment or to changes in investor perceptions regarding a sector. |
| Because the fund may allocate relatively more assets to certain natural resources sectors than others, the fund’s |
| performance may be more sensitive to developments, which affect those sectors emphasized by the fund. |
| Because the fund seeks to provide exposure to alternative or non-traditional (i.e., satellite) asset categories or |
| investment strategies, the fund’s performance will be linked to the performance of these highly volatile asset categories |
| and strategies.Accordingly, investors should consider purchasing shares of the fund only as part of an overall diversified |
| portfolio and should be willing to assume the risks of potentially significant fluctuations in the value of fund shares. |
| 1 Total return includes reinvestment of dividends and any capital gains paid, and does not take into consideration the |
| maximum initial sales charge in the case of Class A shares, or the applicable contingent deferred sales charge imposed |
| on redemptions in the case of Class C shares. Had these charges been reflected, returns would have been lower. Past |
| performance is no guarantee of future results. Share price and investment return fluctuate such that upon redemption, |
| fund shares may be worth more or less than their original cost. Return figures provided reflect the absorption of |
| certain fund expenses pursuant to an agreement by The Dreyfus Corporation in effect until March 1, 2015, at |
| which time it may be extended, terminated or modified. Had these expenses not been absorbed, the fund’s returns |
| would have been lower. |
| 2 SOURCE: LIPPER INC. – Reflects reinvestment of net dividends and, where applicable, capital gain distributions. |
| The Morgan Stanley Capital International (MSCI) World Index is an unmanaged index of global stock market |
| performance, including the United States, Canada, Europe,Australia, New Zealand and the Far East. |
| The Fund | 5 |
FUND PERFORMANCE
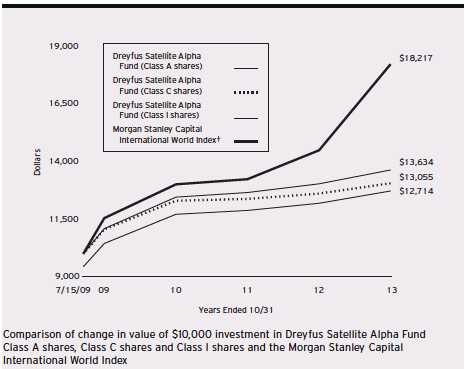
| † Source: Lipper Inc. |
| Past performance is not predictive of future performance. |
| The above graph compares a $10,000 investment made in each of the Class A, Class C and Class I shares of Dreyfus |
| Satellite Alpha Fund on 7/15/09 (the fund’s inception date) to a $10,000 investment made in the Morgan Stanley |
| Capital International World Index (the “Index”) on that date.All dividends and capital gain distributions are reinvested |
| The fund’s performance shown in the line graph above takes into account the maximum initial sales charge on Class A |
| shares and all other applicable fees and expenses on all classes.The Index is an unmanaged index of global stock market |
| performance, including the United States, Canada, Europe,Australia, New Zealand and the Far East. Unlike a mutual |
| fund, the Index is not subject to charges, fees and other expenses. Investors cannot invest directly in any index. Further |
| information relating to fund performance, including expense reimbursements, if applicable, is contained in the Financial |
| Highlights section of the prospectus and elsewhere in this report. |
6
| Average Annual Total Returns as of 10/31/13 | |||||
| Inception | From | ||||
| Date | 1 Year | Inception | |||
| Class A shares | |||||
| with maximum sales charge (5.75%) | 7/15/09 | –1.61 | % | 5.74 | % |
| without sales charge | 7/15/09 | 4.37 | % | 7.21 | % |
| Class C shares | |||||
| with applicable redemption charge † | 7/15/09 | 2.56 | % | 6.40 | % |
| without redemption | 7/15/09 | 3.56 | % | 6.40 | % |
| Class I shares | 7/15/09 | 4.68 | % | 7.48 | % |
| Morgan Stanley Capital | |||||
| International World Index | 6/30/09 | 25.77 | % | 14.84 | %†† |
Past performance is not predictive of future performance.The fund’s performance shown in the graph and table does not reflect the deduction of taxes that a shareholder would pay on fund distributions or the redemption of fund shares.
| † | The maximum contingent deferred sales charge for Class C shares is 1% for shares redeemed within one year of the |
| date of purchase. | |
| †† | For comparative purposes, the value of the Index as of 6/30/09 is used as the beginning value on 7/15/09. |
| The Fund | 7 |
UNDERSTANDING YOUR FUND’S EXPENSES (Unaudited)
As a mutual fund investor, you pay ongoing expenses, such as management fees and other expenses. Using the information below, you can estimate how these expenses affect your investment and compare them with the expenses of other funds.You also may pay one-time transaction expenses, including sales charges (loads) and redemption fees, which are not shown in this section and would have resulted in higher total expenses. For more information, see your fund’s prospectus or talk to your financial adviser.
Review your fund’s expenses
The table below shows the expenses you would have paid on a $1,000 investment in Dreyfus Satellite Alpha Fund from May 1, 2013 to October 31, 2013. It also shows how much a $1,000 investment would be worth at the close of the period, assuming actual returns and expenses.
Expenses and Value of a $1,000 Investment
assuming actual returns for the six months ended October 31, 2013
| Class A | Class C | Class I | |
| Expenses paid per $1,000† | $2.68 | $6.46 | $1.42 |
| Ending value (after expenses) | $1,005.70 | $1,001.90 | $1,007.00 |
COMPARING YOUR FUND’S EXPENSES
WITH THOSE OF OTHER FUNDS (Unaudited)
Using the SEC’s method to compare expenses
The Securities and Exchange Commission (SEC) has established guidelines to help investors assess fund expenses. Per these guidelines, the table below shows your fund’s expenses based on a $1,000 investment, assuming a hypothetical 5% annualized return. You can use this information to compare the ongoing expenses (but not transaction expenses or total cost) of investing in the fund with those of other funds.All mutual fund shareholder reports will provide this information to help you make this comparison. Please note that you cannot use this information to estimate your actual ending account balance and expenses paid during the period.
Expenses and Value of a $1,000 Investment
assuming a hypothetical 5% annualized return for the six months ended October 31, 2013
| Class A | Class C | Class I | |
| Expenses paid per $1,000† | $2.70 | $6.51 | $1.43 |
| Ending value (after expenses) | $1,022.53 | $1,018.75 | $1,023.79 |
| † Expenses are equal to the fund’s annualized expense ratio of .53% for Class A, 1.28% for Class C and .28% |
| for Class I, multiplied by the average account value over the period, multiplied by 184/365 (to reflect the one-half |
| year period). |
8
STATEMENT OF INVESTMENTS
October 31, 2013
| Registered Investment Companies—106.7% | Shares | Value ($) | |||
| Bonds and Notes—45.0% | |||||
| Dreyfus Emerging Markets Debt Local Currency Fund, Cl. I | 3,817 | a | 54,920 | ||
| Dreyfus Global Absolute Return Fund, Cl. I | 4,714 | a,b | 57,039 | ||
| Dreyfus Inflation Adjusted Securities Fund, Cl. I | 4,164 | a | 53,341 | ||
| Dreyfus International Bond Fund, Cl. I | 4,210 | a | 70,098 | ||
| 235,398 | |||||
| Domestic Common Stocks—22.8% | |||||
| Dreyfus Natural Resources Fund, Cl. I | 3,782 | a | 119,620 | ||
| Foreign Common Stocks—38.9% | |||||
| Dreyfus Emerging Markets Fund, Cl. I | 13,686 | a | 138,094 | ||
| Dreyfus Global Real Estate Securities Fund, Cl. I | 7,588 | a | 65,412 | ||
| 203,506 | |||||
| Total Investments (cost $485,020) | 106.7 | % | 558,524 | ||
| Liabilities, Less Cash and Receivables | (6.7 | % | (35,216 | ) | |
| Net Assets | 100.0 | % | 523,308 | ||
| a | Investment in affiliated mutual fund. |
| b | Non-income producing security. |
| Portfolio Summary (Unaudited)† | |||
| Value (%) | Value (%) | ||
| Mutual Funds: Foreign | 73.7 | Mutual Funds: Domestic | 33.0 |
| 106.7 | |||
| † Based on net assets. | |||
| See notes to financial statements. | |||
| The Fund | 9 |
| STATEMENT OF ASSETS AND LIABILITIES |
| October 31, 2013 |
| Cost | Value | |||
| Assets ($): | ||||
| Investments in securities of affiliated issuers— | ||||
| See Statement of Investments—Note 1(c) | 485,020 | 558,524 | ||
| Cash | 501 | |||
| Prepaid expenses | 17,031 | |||
| 576,056 | ||||
| Liabilities ($): | ||||
| Due to The Dreyfus Corporation and affiliates—Note 2(c) | 4,049 | |||
| Accrued expenses | 48,699 | |||
| 52,748 | ||||
| Net Assets ($) | 523,308 | |||
| Composition of Net Assets ($): | ||||
| Paid-in capital | 480,414 | |||
| Accumulated undistributed investment income—net | 301 | |||
| Accumulated net realized gain (loss) on investments | (30,911 | ) | ||
| Accumulated net unrealized appreciation | ||||
| (depreciation) on investments in affiliated issuers | 73,504 | |||
| Net Assets ($) | 523,308 | |||
| Net Asset Value Per Share | ||||
| Class A | Class C | Class I | ||
| Net Assets ($) | 321,285 | 73,797 | 128,226 | |
| Shares Outstanding | 20,359 | 4,723 | 8,094 | |
| Net Asset Value Per Share ($) | 15.78 | 15.63 | 15.84 | |
| See notes to financial statements. | ||||
10
STATEMENT OF OPERATIONS
Year Ended October 31, 2013
| Investment Income ($): | ||
| Income: | ||
| Cash dividends from affiliated issuers | 10,650 | |
| Expenses: | ||
| Professional fees | 41,429 | |
| Registration fees | 38,794 | |
| Prospectus and shareholders’ reports | 9,841 | |
| Shareholder servicing costs—Note 2(c) | 2,699 | |
| Custodian fees—Note 3(c) | 2,268 | |
| Distribution fees—Note 2(b) | 752 | |
| Directors’ fees and expenses—Note 2(d) | 67 | |
| Miscellaneous | 14,760 | |
| Total Expenses | 110,610 | |
| Less—reduction in expenses due to undertaking—Note 2(a) | (107,053 | ) |
| Less—reduction in fees due to earnings credits—Note 2(c) | (2 | ) |
| Net Expenses | 3,555 | |
| Investment Income—Net | 7,095 | |
| Realized and Unrealized Gain (Loss) on Investments—Note 3 ($): | ||
| Net realized gain (loss) on investments in affiliated issuers | (415 | ) |
| Capital gain distributions from affiliated issuers | 3,099 | |
| Net Realized Gain (Loss) | 2,684 | |
| Net unrealized appreciation (depreciation) on investments in affiliated issuers | 13,108 | |
| Net Realized and Unrealized Gain (Loss) on Investments | 15,792 | |
| Net Increase in Net Assets Resulting from Operations | 22,887 | |
| See notes to financial statements. | ||
| The Fund | 11 |
STATEMENT OF CHANGES IN NET ASSETS
| Year Ended October 31, | ||||
| 2013 | 2012 | |||
| Operations ($): | ||||
| Investment income—net | 7,095 | 2,889 | ||
| Net realized gain (loss) on | ||||
| investments in affiliated issuers | 2,684 | (24,521 | ) | |
| Net unrealized appreciation (depreciation) | ||||
| on investments in affiliated issuers | 13,108 | 21,534 | ||
| Net Increase (Decrease) in Net Assets | ||||
| Resulting from Operations | 22,887 | (98 | ) | |
| Dividends to Shareholders from ($): | ||||
| Investment income—net: | ||||
| Class A | (4,840 | ) | (7,284 | ) |
| Class C | (688 | ) | (695 | ) |
| Class I | (1,877 | ) | (1,232 | ) |
| Net realized gain on investments: | ||||
| Class A | — | (7,707 | ) | |
| Class C | — | (1,689 | ) | |
| Class I | — | (1,108 | ) | |
| Total Dividends | (7,405 | ) | (19,715 | ) |
| Capital Stock Transactions ($): | ||||
| Net proceeds from shares sold: | ||||
| Class A | 52,769 | 230,022 | ||
| Class C | 1,800 | 20,000 | ||
| Class I | 57,097 | 11,999 | ||
| Dividends reinvested: | ||||
| Class A | 3,215 | 11,813 | ||
| Class C | 336 | 1,231 | ||
| Class I | 872 | 613 | ||
| Cost of shares redeemed: | ||||
| Class A | (142,362 | ) | (374,444 | ) |
| Class C | (49,560 | ) | (26,947 | ) |
| Class I | (6,974 | ) | (22,173 | ) |
| Increase (Decrease) in Net Assets | ||||
| from Capital Stock Transactions | (82,807 | ) | (147,886 | ) |
| Total Increase (Decrease) in Net Assets | (67,325 | ) | (167,699 | ) |
| Net Assets ($): | ||||
| Beginning of Period | 590,633 | 758,332 | ||
| End of Period | 523,308 | 590,633 | ||
| Undistributed (distributions in excess of) | ||||
| investment income—net | 301 | (819 | ) | |
12
| Year Ended October 31, | ||||
| 2013 | 2012 | |||
| Capital Share Transactions: | ||||
| Class Aa | ||||
| Shares sold | 3,410 | 15,325 | ||
| Shares issued for dividends reinvested | 209 | 815 | ||
| Shares redeemed | (9,297 | ) | (25,958 | ) |
| Net Increase (Decrease) in Shares Outstanding | (5,678 | ) | (9,818 | ) |
| Class Ca | ||||
| Shares sold | 117 | 1,343 | ||
| Shares issued for dividends reinvested | 22 | 85 | ||
| Shares redeemed | (3,194 | ) | (1,883 | ) |
| Net Increase (Decrease) in Shares Outstanding | (3,055 | ) | (455 | ) |
| Class I | ||||
| Shares sold | 3,662 | 805 | ||
| Shares issued for dividends reinvested | 57 | 42 | ||
| Shares redeemed | (436 | ) | (1,436 | ) |
| Net Increase (Decrease) in Shares Outstanding | 3,283 | (589 | ) | |
| a During the period ended October 31, 2013, 1,122 Class C shares representing $17,634 were exchanged for 1,115 |
| Class A shares. |
See notes to financial statements.
| The Fund | 13 |
FINANCIAL HIGHLIGHTS
The following tables describe the performance for each share class for the fiscal periods indicated. All information (except portfolio turnover rate) reflects financial results for a single fund share.Total return shows how much your investment in the fund would have increased (or decreased) during each period, assuming you had reinvested all dividends and distributions.These figures have been derived from the fund’s financial statements.
| Year Ended October 31, | ||||||||||
| Class A Shares | 2013 | 2012 | 2011 | 2010 | 2009 | a | ||||
| Per Share Data ($): | ||||||||||
| Net asset value, beginning of period | 15.31 | 15.34 | 15.51 | 13.85 | 12.50 | |||||
| Investment Operations: | ||||||||||
| Investment income—netb | .20 | .08 | .20 | .18 | .00 | c | ||||
| Net realized and unrealized | ||||||||||
| gain (loss) on investments | .47 | .28 | .03 | 1.48 | 1.35 | |||||
| Total from Investment Operations | .67 | .36 | .23 | 1.66 | 1.35 | |||||
| Distributions: | ||||||||||
| Dividends from investment income—net | (.20 | ) | (.19 | ) | (.40 | ) | (.00 | )c | — | |
| Dividends from net realized | ||||||||||
| gain on investments | — | (.20 | ) | — | (.00 | )c | — | |||
| Total Distributions | (.20 | ) | (.39 | ) | (.40 | ) | (.00 | )c | — | |
| Net asset value, end of period | 15.78 | 15.31 | 15.34 | 15.51 | 13.85 | |||||
| Total Return (%)d | 4.37 | 2.61 | 1.41 | 12.09 | 10.80 | e | ||||
| Ratios/Supplemental Data (%): | ||||||||||
| Ratio of total expenses | ||||||||||
| to average net assetsf | 18.84 | 16.16 | 18.57 | 37.30 | 100.93 | g | ||||
| Ratio of net expenses | ||||||||||
| to average net assetsf | .53 | .44 | .54 | .53 | .50 | g | ||||
| Ratio of net investment income | ||||||||||
| to average net assetsf | 1.32 | .54 | 1.27 | 1.24 | .08 | g | ||||
| Portfolio Turnover Rate | 29.93 | 83.66 | 52.02 | 56.19 | 4.35 | e | ||||
| Net Assets, end of period ($ x 1,000) | 321 | 399 | 550 | 192 | 162 | |||||
| a | From July 15, 2009 (commencement of operations) to October 31, 2009. |
| b | Based on average shares outstanding at each month end. |
| c | Amount represents less than $.01 per share. |
| d | Exclusive of sales charge. |
| e | Not annualized. |
| f | Amounts do not include the expenses of the underlying funds. |
| g | Annualized. |
See notes to financial statements.
14
| Year Ended October 31, | ||||||||||
| Class C Shares | 2013 | 2012 | 2011 | 2010 | 2009 | a | ||||
| Per Share Data ($): | ||||||||||
| Net asset value, beginning of period | 15.17 | 15.19 | 15.36 | 13.82 | 12.50 | |||||
| Investment Operations: | ||||||||||
| Investment income (loss)—netb | .12 | (.04 | ) | .10 | .07 | (.03 | ) | |||
| Net realized and unrealized | ||||||||||
| gain (loss) on investments | .43 | .30 | .01 | 1.47 | 1.35 | |||||
| Total from Investment Operations | .55 | .26 | .11 | 1.54 | 1.32 | |||||
| Distributions: | ||||||||||
| Dividends from investment income—net | (.09 | ) | (.08 | ) | (.28 | ) | — | — | ||
| Dividends from net realized | ||||||||||
| gain on investments | — | (.20 | ) | — | (00 | )c | — | |||
| Total Distributions | (.09 | ) | (.28 | ) | (.28 | ) | (00 | )c | — | |
| Net asset value, end of period | 15.63 | 15.17 | 15.19 | 15.36 | 13.82 | |||||
| Total Return (%)d | 3.56 | 1.86 | .63 | 11.24 | 10.56 | e | ||||
| Ratios/Supplemental Data (%): | ||||||||||
| Ratio of total expenses | ||||||||||
| to average net assetsf | 19.72 | 17.57 | 19.48 | 37.80 | 104.02 | g | ||||
| Ratio of net expenses | ||||||||||
| to average net assetsf | 1.28 | 1.19 | 1.29 | 1.28 | 1.25 | g | ||||
| Ratio of net investment income | ||||||||||
| (loss) to average net assetsf | .80 | (.30 | ) | .63 | .48 | (.67 | )g | |||
| Portfolio Turnover Rate | 29.93 | 83.66 | 52.02 | 56.19 | 4.35 | e | ||||
| Net Assets, end of period ($ x 1,000) | 74 | 118 | 125 | 84 | 70 | |||||
| a | From July 15, 2009 (commencement of operations) to October 31, 2009. |
| b | Based on average shares outstanding at each month end. |
| c | Amount represents less than $.01 per share. |
| d | Exclusive of sales charge. |
| e | Not annualized. |
| f | Amounts do not include the expenses of the underlying funds. |
| g | Annualized. |
See notes to financial statements.
| The Fund | 15 |
FINANCIAL HIGHLIGHTS (continued)
| Year Ended October 31, | ||||||||||
| Class I Shares | 2013 | 2012 | 2011 | 2010 | 2009 | a | ||||
| Per Share Data ($): | ||||||||||
| Net asset value, beginning of period | 15.38 | 15.40 | 15.56 | 13.86 | 12.50 | |||||
| Investment Operations: | ||||||||||
| Investment income—netb | .19 | .12 | .27 | .34 | .01 | |||||
| Net realized and unrealized | ||||||||||
| gain (loss) on investments | .52 | .29 | (.01 | ) | 1.37 | 1.35 | ||||
| Total from Investment Operations | .71 | .41 | .26 | 1.71 | 1.36 | |||||
| Distributions: | ||||||||||
| Dividends from investment income—net | (.25 | ) | (.23 | ) | (.42 | ) | (.01 | ) | — | |
| Dividends from net realized | ||||||||||
| gain on investments | — | (.20 | ) | — | (.00 | )c | — | |||
| Total Distributions | (.25 | ) | (.43 | ) | (.42 | ) | (.01 | ) | — | |
| Net asset value, end of period | 15.84 | 15.38 | 15.40 | 15.56 | 13.86 | |||||
| Total Return (%) | 4.68 | 2.90 | 1.61 | 12.35 | 10.88 | d | ||||
| Ratios/Supplemental Data (%): | ||||||||||
| Ratio of total expenses | ||||||||||
| to average net assetse | 18.49 | 16.46 | 18.93 | 37.32 | 106.59 | f | ||||
| Ratio of net expenses | ||||||||||
| to average net assetse | .28 | .19 | .29 | .28 | .25 | f | ||||
| Ratio of net investment income | ||||||||||
| to average net assetse | 1.22 | .79 | 1.77 | 2.20 | .34 | f | ||||
| Portfolio Turnover Rate | 29.93 | 83.66 | 52.02 | 56.19 | 4.35 | d | ||||
| Net Assets, end of period ($ x 1,000) | 128 | 74 | 83 | 115 | 58 | |||||
| a | From July 15, 2009 (commencement of operations) to October 31, 2009. |
| b | Based on average shares outstanding at each month end. |
| c | Amount represents less than $.01 per share. |
| d | Not annualized. |
| e | Amounts do not include the expenses of the underlying funds. |
| f | Annualized. |
See notes to financial statements.
16
NOTES TO FINANCIAL STATEMENTS
NOTE 1—Significant Accounting Policies:
Dreyfus Satellite Alpha Fund (the “fund”) is a separate diversified series of Dreyfus Premier Investment Funds, Inc. (the “Company”), which is registered under the Investment Company Act of 1940, as amended (the “Act”), as an open-end management investment company and operates as a series company currently offering eight series, including the fund.The fund’s investment objective is to seek long-term capital appreciation.The Dreyfus Corporation (the “Manager” or “Dreyfus”), a wholly-owned subsidiary of The Bank of New York Mellon Corporation (“BNY Mellon”), serves as the fund’s investment adviser.
MBSC Securities Corporation (the “Distributor”), a wholly-owned subsidiary of the Manager, is the distributor of the fund’s shares. The fund is authorized to issue 50 million shares of $.001 par value Common Stock in each of the following classes of shares: Class A, Class C and Class I. Class A shares generally are subject to a sales charge imposed at the time of purchase. Class C shares are subject to a contingent deferred sales charge (“CDSC”) imposed on Class C shares redeemed within one year of purchase. Class I shares are sold at net asset value per share only to institutional investors. Other differences between the classes include the services offered to and the expenses borne by each class, the allocation of certain transfer agency costs and certain voting rights. Income, expenses (other than expenses attributable to a specific class), and realized and unrealized gains or losses on investments are allocated to each class of shares based on its relative net assets.
As of October 31, 2013, MBC Investments Corp., an indirect subsidiary of BNY Mellon, held 8,002 Class A, 4,001 Class C and 4,003 Class I shares of the fund.
| The Fund | 17 |
NOTES TO FINANCIAL STATEMENTS (continued)
The Company accounts separately for the assets, liabilities and operations of each series. Expenses directly attributable to each series are charged to that series’ operations; expenses which are applicable to all series are allocated among them on a pro rata basis. The Financial Accounting Standards Board (“FASB”) Accounting Standards Codification is the exclusive reference of authoritative U.S. generally accepted accounting principles (“GAAP”) recognized by the FASB to be applied by nongovernmental entities. Rules and interpretive releases of the Securities and Exchange Commission (“SEC”) under authority of federal laws are also sources of authoritative GAAP for SEC regis-trants.The fund’s financial statements are prepared in accordance with GAAP, which may require the use of management estimates and assumptions.Actual results could differ from those estimates.
The Company enters into contracts that contain a variety of indemnifications. The fund’s maximum exposure under these arrangements is unknown.The fund does not anticipate recognizing any loss related to these arrangements.
(a) Portfolio valuation: The fair value of a financial instrument is the amount that would be received to sell an asset or paid to transfer a liability in an orderly transaction between market participants at the measurement date (i.e., the exit price). GAAP establishes a fair value hierarchy that prioritizes the inputs of valuation techniques used to measure fair value. This hierarchy gives the highest priority to unadjusted quoted prices in active markets for identical assets or liabilities (Level 1 measurements) and the lowest priority to unobservable inputs (Level 3 measurements).
Additionally, GAAP provides guidance on determining whether the volume and activity in a market has decreased significantly and whether such a decrease in activity results in transactions that are not orderly. GAAP requires enhanced disclosures around valuation inputs and techniques used during annual and interim periods.
18
Various inputs are used in determining the value of the fund’s investments relating to fair value measurements.These inputs are summarized in the three broad levels listed below:
Level 1—unadjusted quoted prices in active markets for identical investments.
Level 2—other significant observable inputs (including quoted prices for similar investments, interest rates, prepayment speeds, credit risk, etc.).
Level 3—significant unobservable inputs (including the fund’s own assumptions in determining the fair value of investments).
The inputs or methodology used for valuing securities are not necessarily an indication of the risk associated with investing in those securities. Investments are valued at the net asset value of each underlying fund determined as of the close of the NewYork Stock Exchange (generally 4 p.m., Eastern time) on the valuation date and are generally categorized within Level 1 of the fair value hierarchy.
The following is a summary of the inputs used as of October 31, 2013 in valuing the fund’s investments:
| Level 2—Other | Level 3— | |||
| Level 1— | Significant | Significant | ||
| Unadjusted | Observable | Unobservable | ||
| Quoted Prices | Inputs | Inputs | Total | |
| Assets ($) | ||||
| Investments in Securities: | ||||
| Mutual Funds† | 558,524 | — | — | 558,524 |
| † See Statement of Investments for additional detailed categorizations. | ||||
At October 31, 2013, there were no transfers between Level 1 and Level 2 of the fair value hierarchy.
(b) Securities transactions and investment income: Securities transactions are recorded on a trade date basis. Realized gains and losses from securities transactions are recorded on the identified cost basis.
| The Fund | 19 |
NOTES TO FINANCIAL STATEMENTS (continued)
Dividend income is recognized on the ex-dividend date and interest income, including, where applicable, accretion of discount and amortization of premium on investments, is recognized on the accrual basis.
(c) Affiliated issuers: Investments in other investment companies advised by Dreyfus are defined as “affiliated” under the Act. Investments in affiliated investment companies during the period ended October 31, 2013 were as follows:
| Affiliated | |||||||
| Investment | Value | Net Realized | |||||
| Company | 10/31/2012 ($) | Purchases ($)† | Sales ($) | Gain (Loss) ($) | |||
| Dreyfus Emerging | |||||||
| Markets Debt Local | |||||||
| Currency Fund, Cl. I | 63,145 | 15,091 | 20,746 | 135 | |||
| Dreyfus Emerging | |||||||
| Markets Fund, Cl. I | 113,922 | 64,460 | 42,365 | (1,822 | ) | ||
| Dreyfus Global Absolute | |||||||
| Return Fund, Cl. I | 108,069 | 23,964 | 75,456 | 1,634 | |||
| Dreyfus Global Real Estate | |||||||
| Securities Fund, Cl. I | 66,029 | 14,816 | 19,326 | 573 | |||
| Dreyfus Inflation Adjusted | |||||||
| Securities Fund, Cl. I | 64,869 | 14,604 | 18,890 | (790 | ) | ||
| Dreyfus International | |||||||
| Bond Fund, Cl. I | 82,109 | 19,191 | 26,970 | (959 | ) | ||
| Dreyfus Natural | |||||||
| Resources Fund, Cl. I | 115,271 | 25,755 | 41,711 | 814 | |||
| TOTAL | 613,414 | 177,881 | 245,464 | (415 | ) | ||
| † Includes reinvested dividends/distributions. | |||||||
| Change in Net | |||||||
| Affiliated | Unrealized | ||||||
| Investment | Appreciation | Value | Net | Dividends/ | |||
| Company | (Depreciation) ($) | 10/31/2013 | ($) | Assets (%) Distributions ($) | |||
| Dreyfus Emerging | |||||||
| Markets Debt Local | |||||||
| Currency Fund, Cl. I | (2,705 | ) | 54,920 | 10.5 | 2,477 | ||
| Dreyfus Emerging | |||||||
| Markets Fund, Cl. I | 3,899 | 138,094 | 26.4 | 1,234 | |||
| Dreyfus Global Absolute | |||||||
| Return Fund, Cl. I | (1,172 | ) | 57,039 | 10.9 | — | ||
| Dreyfus Global Real Estate | |||||||
| Securities Fund, Cl. I | 3,320 | 65,412 | 12.5 | 3,464 | |||
| Dreyfus Inflation Adjusted | |||||||
| Securities Fund, Cl. I | (6,452 | ) | 53,341 | 10.2 | 3,251 | ||
20
| Change in Net | ||||||
| Affiliated | Unrealized | |||||
| Investment | Appreciation | Value | Net | Dividends/ | ||
| Company | (Depreciation) ($) | 10/31/2013 | ($) | Assets (%) Distributions ($) | ||
| Dreyfus International | ||||||
| Bond Fund, Cl. I | (3,273 | ) | 70,098 | 13.4 | 2,794 | |
| Dreyfus Natural | ||||||
| Resources Fund, Cl. I | 19,491 | 119,620 | 22.8 | 529 | ||
| TOTAL | 13,108 | 558,524 | 106.7 | 13,749 | ||
(d) Dividends to shareholders: Dividends are recorded on the ex-dividend date. Dividends from investment income-net and dividends from net realized capital gains, if any, are normally declared and paid annually, but the fund may make distributions on a more frequent basis to comply with the distribution requirements of the Internal Revenue Code of 1986, as amended (the “Code”).To the extent that net realized capital gains can be offset by capital loss carryovers, it is the policy of the fund not to distribute such gains. Income and capital gain distributions are determined in accordance with income tax regulations, which may differ from GAAP.
(e) Federal income taxes: It is the policy of the fund to continue to qualify as a regulated investment company, if such qualification is in the best interests of its shareholders, by complying with the applicable provisions of the Code, and to make distributions of taxable income sufficient to relieve it from substantially all federal income and excise taxes.
As of and during the period ended October 31, 2013, the fund did not have any liabilities for any uncertain tax positions.The fund recognizes interest and penalties, if any, related to uncertain tax positions as income tax expense in the Statement of Operations. During the period ended October 31, 2013, the fund did not incur any interest or penalties.
Each tax year in the four-year period ended October 31, 2013 remains subject to examination by the Internal Revenue Service and state taxing authorities.
| The Fund | 21 |
NOTES TO FINANCIAL STATEMENTS (continued)
At October 31, 2013, the components of accumulated earnings on a tax basis were as follows: undistributed ordinary income $301, accumulated capital losses $23,026 and unrealized appreciation $65,619.
Under the Regulated Investment Company Modernization Act of 2010 (the “2010 Act”), the fund is permitted to carry forward capital losses incurred in taxable years beginning after December 22, 2010 (“post-enactment losses”) for an unlimited period. Furthermore, post-enactment capital loss carryovers retain their character as either short-term or long-term capital losses rather than short-term as they were under previous statute.
The accumulated capital loss carryover is available for federal income tax purposes to be applied against future net realized capital gains, if any, realized subsequent to October 31, 2013.The fund has $17,403 of post-enactment short-term capital losses and $5,623 of post-enactment long-term capital losses which can be carried forward for an unlimited period.
The tax character of distributions paid to shareholders during the fiscal periods ended October 31, 2013 and October 31, 2012 were as follows: ordinary income $7,405 and $9,250, and long-term capital gains $0 and $10,465, respectively.
During the period ended October 31, 2013, as a result of permanent book to tax differences, primarily due to the tax treatment for short-term capital gain distributions from regulated investment company holdings and dividend reclassification, the fund increased accumulated undistributed investment income-net by $1,430 and decreased net realized gain (loss) on investments by the same amount. Net assets and net asset value per share were not affected by this reclassification.
NOTE 2—Management Fee and Other Transactions with Affiliates:
(a) Pursuant to a management agreement with the Manager, there is no management fee paid to the Manager.The fund invests in other mutual funds advised by the Manager. All fees and expenses of the underlying
22
funds are reflected in the underlying fund’s net asset value.The Manager has contractually agreed, from November 1, 2012 through March 1, 2015, to assume the expenses of the fund so that the total annual fund and underlying funds operating expenses of none of the classes (excluding Rule 12b-1 Distribution Plan fees, Shareholder Services Plan fees, taxes, brokerage commissions and extraordinary expenses) exceed 1.35% of the value of the fund’s average daily net assets. The reduction in expenses, pursuant to the undertaking amounted to $107,053 during the period ended October 31, 2013.
(b) Under the Distribution Plan adopted pursuant to Rule 12b-1 under the Act, Class C shares pay the Distributor for distributing its shares at an annual rate of .75% of the value of its average daily net assets. During the period ended October 31, 2013, Class C shares were charged $752 pursuant to the Distribution Plan.
(c) Under the Shareholder Services Plan, Class A and Class C shares pay the Distributor at an annual rate of .25% of the value of their average daily net assets for the provision of certain services.The services provided may include personal services relating to shareholder accounts, such as answering shareholder inquiries regarding the fund and providing reports and other information, and services related to the maintenance of shareholder accounts.The Distributor may make payments to Service Agents (securities dealers, financial institutions or other industry professionals) with respect to these services. The Distributor determines the amounts to be paid to Service Agents. During the period ended October 31, 2013, Class A and Class C shares were charged $925 and $251, respectively, pursuant to the Shareholder Services Plan.
The fund has arrangements with the transfer agent and the custodian whereby the fund may receive earnings credits when positive cash balances are maintained, which are used to offset transfer agency and custody fees. For financial reporting purposes, the fund includes net earnings credits as an expense offset in the Statement of Operations.
| The Fund | 23 |
NOTES TO FINANCIAL STATEMENTS (continued)
The fund compensates DreyfusTransfer, Inc., a wholly-owned subsidiary of the Manager, under a transfer agency agreement for providing transfer agency and cash management services for the fund. The majority of transfer agency fees are comprised of amounts paid on a per account basis, while cash management fees are related to fund subscriptions and redemptions. During the period ended October 31, 2013, the fund was charged $773 for transfer agency services and $21 for cash management services. These fees are included in Shareholder servicing costs in the Statement of Operations. Cash management fees were partially offset by earnings credits of $2.
The fund compensates The Bank of NewYork Mellon under a custody agreement for providing custodial services for the fund.These fees are determined based on net assets, geographic region and transaction activity. During the period ended October 31, 2013, the fund was charged $2,268 pursuant to the custody agreement.
The fund compensated The Bank of New York Mellon under a cash management agreement that was in effect until September 30, 2013 for performing certain cash management services related to fund subscriptions and redemptions. During the period ended October 31, 2013, the fund was charged $10 pursuant to the cash management agreement, which is included in Shareholder servicing costs in the Statement of Operations.
During the period ended October 31, 2013, the fund was charged $8,887 for services performed by the Chief Compliance Officer and his staff.
The components of “Due to The Dreyfus Corporation and affiliates” in the Statement of Assets and Liabilities consist of: Distribution Plan fees $47, Shareholder Services Plan fees $87, custodian fees $1,200, Chief Compliance Officer fees $7,445 and transfer agency fees $144, which are offset against an expense reimbursement currently in effect in the amount of $4,874.
24
(d) Each Board member also serves as a Board member of other funds within the Dreyfus complex. Annual retainer fees and attendance fees are allocated to each fund based on net assets.
NOTE 3—Securities Transactions:
The aggregate amount of purchases and sales of investment securities, excluding short-term securities, during the period ended October 31, 2013, amounted to $177,881 and $245,464, respectively.
At October 31, 2013, the cost of investments for federal income tax purposes was $492,905; accordingly, accumulated net unrealized appreciation on investments was $65,619, consisting of gross unrealized appreciation.
| The Fund | 25 |
| REPORT OF INDEPENDENT REGISTERED |
| PUBLIC ACCOUNTING FIRM |
Shareholders and Board of Directors
Dreyfus Satellite Alpha Fund
We have audited the accompanying statement of assets and liabilities, including the statement of investments, of Dreyfus Satellite Alpha Fund (one of the series comprising Dreyfus Premier Investment Funds, Inc.) as of October 31, 2013, and the related statement of operations for the year then ended, the statement of changes in net assets for each of the two years in the period then ended, and the financial highlights for each of the periods indicated therein.These financial statements and financial highlights are the responsibility of the Fund’s management. Our responsibility is to express an opinion on these financial statements and financial highlights based on our audits.
We conducted our audits in accordance with the standards of the Public Company Accounting Oversight Board (United States).Those standards require that we plan and perform the audit to obtain reasonable assurance about whether the financial statements and financial highlights are free of material misstatement.We were not engaged to perform an audit of the Fund’s internal control over financial reporting. Our audits included consideration of internal control over financial reporting as a basis for designing audit procedures that are appropriate in the circumstances, but not for the purpose of expressing an opinion on the effectiveness of the Fund’s internal control over financial reporting. Accordingly, we express no such opinion. An audit also includes examining, on a test basis, evidence supporting the amounts and disclosures in the financial statements and financial highlights, assessing the accounting principles used and significant estimates made by management, and evaluating the overall financial statement presentation. Our procedures included confirmation of securities owned as of October 31, 2013 by correspondence with the custodian and others. We believe that our audits provide a reasonable basis for our opinion.
In our opinion, the financial statements and financial highlights referred to above present fairly, in all material respects, the financial position of Dreyfus Satellite Alpha Fund at October 31, 2013, the results of its operations for the year then ended, the changes in its net assets for each of the two years in the period then ended, and the financial highlights for each of the indicated periods, in conformity with U.S. generally accepted accounting principles.

New York, New York
December 27, 2013
26
IMPORTANT TAX INFORMATION (Unaudited)
For federal tax purposes, the fund hereby reports 100% of the ordinary dividends paid during the fiscal year ended October 31, 2013 as qualifying for the corporate dividends received deduction. Also, certain dividends paid by the fund may be subject to a maximum tax rate of 15%, as provided for by the Jobs and Growth Tax Relief Reconciliation Act of 2003. Of the distributions paid during the fiscal year, $7,405 represents the maximum amount that may be considered qualified dividend income. Shareholders will receive notification in early 2014 of the percentage applicable to the preparation of their 2013 income tax returns.
| The Fund | 27 |
BOARD MEMBERS INFORMATION (Unaudited)
| Joseph S. DiMartino (70) |
| Chairman of the Board (1995) |
| Principal Occupation During Past 5Years: |
| • Corporate Director and Trustee |
| Other Public Company Board Memberships During Past 5Years: |
| • CBIZ (formerly, Century Business Services, Inc.), a provider of outsourcing functions for small |
| and medium size companies, Director (1997-present) |
| • The Newark Group, a provider of a national market of paper recovery facilities, paperboard |
| mills and paperboard converting plants, Director (2000-2010) |
| • Sunair Services Corporation, a provider of certain outdoor-related services to homes and |
| businesses, Director (2005-2009) |
| No. of Portfolios for which Board Member Serves: 141 |
| ——————— |
| Peggy C. Davis (70) |
| Board Member (2012) |
| Principal Occupation During Past 5Years: |
| • Shad Professor of Law, New York University School of Law (1983-present) |
| No. of Portfolios for which Board Member Serves: 56 |
| ——————— |
| David P. Feldman (73) |
| Board Member (1991) |
| Principal Occupation During Past 5Years: |
| • Corporate Director and Trustee |
| Other Public Company Board Memberships During Past 5Years: |
| • BBH Mutual Funds Group (4 registered mutual funds), Director (1992-present) |
| No. of Portfolios for which Board Member Serves: 42 |
| ——————— |
| Ehud Houminer (73) |
| Board Member (2012) |
| Principal Occupation During Past 5Years: |
| • Executive-in-Residence at the Columbia Business School, Columbia University (1992-present) |
| Other Public Company Board Memberships During Past 5Years: |
| • Avnet Inc., an electronics distributor, Director (1993-2012) |
| No. of Portfolios for which Board Member Serves: 66 |
28
| Lynn Martin (73) |
| Board Member (1993) |
| Principal Occupation During Past 5Years: |
| • President ofThe Martin Hall Group LLC, a human resources consulting firm (January 2005-2012) |
| Other Public Company Board Memberships During Past 5Years: |
| • AT&T Inc., a telecommunications company, Director (1999-2012) |
| • Ryder System, Inc., a supply chain and transportation management company, Director (1993-2012) |
| • The Proctor & Gamble Co., a consumer products company, Director (1994-2009) |
| • Constellation Energy Group Inc., Director (2003-2009) |
| No. of Portfolios for which Board Member Serves: 42 |
| ——————— |
| Robin A. Melvin (50) |
| Board Member (2011) |
| Principal Occupation During Past 5Years: |
| • Director, Boisi Family Foundation, a private family foundation that supports youth-serving orga- |
| nizations that promote the self sufficiency of youth from disadvantaged circumstances (1995-2012) |
| • Board Member, Illinois Mentoring Partnership, non-profit organization dedicated to increasing |
| the quantity and quality of mentoring services in Illinois (2013-present) |
| No. of Portfolios for which Board Member Serves: 90 |
| ——————— |
| Dr. Martin Peretz (74) |
| Board Member (2012) |
| Principal Occupation During Past 5Years: |
| • Editor-in-Chief Emeritus of The New Republic Magazine (2010-2011) (previously, |
| Editor-in-Chief, 1974-2010) |
| • Director of TheStreet.com, a financial information service on the web (1996-2010) |
| Other Public Company Board Memberships During Past 5Years: |
| • Pershing Square Capital Management,Adviser (2009-present) |
| No. of Portfolios for which Board Member Serves: 42 |
| ——————— |
Once elected all Board Members serve for an indefinite term, but achieve Emeritus status upon reaching age 80.The address of the Board Members and Officers is c/o The Dreyfus Corporation, 200 Park Avenue, NewYork, NewYork 10166. Additional information about the Board Members is available in the fund’s Statement of Additional Information which can be obtained from Dreyfus free of charge by calling this toll free number: 1-800-DREYFUS.
Daniel Rose, Emeritus Board Member
Philip L.Toia, Emeritus Board Member
Sander Vanocur, Emeritus Board Member
| The Fund | 29 |
OFFICERS OF THE FUND (Unaudited)
BRADLEY J. SKAPYAK, President since January 2010.
Chief Operating Officer and a director of the Manager since June 2009, Chairman of Dreyfus Transfer, Inc., an affiliate of the Manager and the transfer agent of the funds, since May 2011 and Executive Vice President of the Distributor since June 2007. From April 2003 to June 2009, Mr. Skapyak was the head of the Investment Accounting and Support Department of the Manager. He is an officer of 68 investment companies (comprised of 141 portfolios) managed by the Manager. He is 55 years old and has been an employee of the Manager since February 1988.
JOHN PAK, Chief Legal Officer since March 2013.
Chief Legal Officer of the Manager and Associate General Counsel and Managing Director of BNY Mellon since August 2012; from March 2005 to July 2012, Managing Director of Deutsche Bank, Deputy Global Head of Deutsche Asset Management Legal and Regional Head of Deutsche Asset Management Americas Legal. He is an officer of 69 investment companies (comprised of 166 portfolios) managed by the Manager. He is 45 years old and has been an employee of the Manager since August 2012.
JANETTE E. FARRAGHER, Vice President and Secretary since December 2011.
Assistant General Counsel of BNY Mellon, and an officer of 69 investment companies (comprised of 166 portfolios) managed by the Manager. She is 50 years old and has been an employee of the Manager since February 1984.
KIESHA ASTWOOD, Vice President and Assistant Secretary since January 2010.
Counsel of BNY Mellon, and an officer of 69 investment companies (comprised of 166 portfolios) managed by the Manager. She is 40 years old and has been an employee of the Manager since July 1995.
JAMES BITETTO, Vice President and Assistant Secretary since August 2005.
Senior Counsel of BNY Mellon and Secretary of the Manager, and an officer of 69 investment companies (comprised of 166 portfolios) managed by the Manager. He is 47 years old and has been an employee of the Manager since December 1996.
JONI LACKS CHARATAN, Vice President and Assistant Secretary since August 2005.
Senior Counsel of BNY Mellon, and an officer of 69 investment companies (comprised of 166 portfolios) managed by the Manager. She is 58 years old and has been an employee of the Manager since October 1988.
JOSEPH M. CHIOFFI, Vice President and Assistant Secretary since August 2005.
Senior Counsel of BNY Mellon, and an officer of 69 investment companies (comprised of 166 portfolios) managed by the Manager. He is 52 years old and has been an employee of the Manager since June 2000.
JOHN B. HAMMALIAN, Vice President and Assistant Secretary since August 2005.
Senior Managing Counsel of BNY Mellon, and an officer of 69 investment companies (comprised of 166 portfolios) managed by the Manager. He is 50 years old and has been an employee of the Manager since February 1991.
ROBERT R. MULLERY, Vice President and Assistant Secretary since August 2005.
Managing Counsel of BNY Mellon, and an officer of 69 investment companies (comprised of 166 portfolios) managed by the Manager. He is 61 years old and has been an employee of the Manager since May 1986.
30
JEFF PRUSNOFSKY, Vice President and Assistant Secretary since August 2005.
Senior Managing Counsel of BNY Mellon, and an officer of 69 investment companies (comprised of 166 portfolios) managed by the Manager. He is 48 years old and has been an employee of the Manager since October 1990.
JAMES WINDELS, Treasurer since November 2001.
Director – Mutual Fund Accounting of the Manager, and an officer of 69 investment companies (comprised of 166 portfolios) managed by the Manager. He is 55 years old and has been an employee of the Manager since April 1985.
RICHARD CASSARO, Assistant Treasurer since January 2008.
Senior Accounting Manager – Money Market and Municipal Bond Funds of the Manager, and an officer of 69 investment companies (comprised of 166 portfolios) managed by the Manager. He is 54 years old and has been an employee of the Manager since September 1982.
GAVIN C. REILLY, Assistant Treasurer since August 2005.
Tax Manager of the Investment Accounting and Support Department of the Manager, and an officer of 69 investment companies (comprised of 166 portfolios) managed by the Manager. He is 45 years old and has been an employee of the Manager since April 1991.
ROBERT S. ROBOL, Assistant Treasurer since August 2005.
Senior Accounting Manager – Fixed Income Funds of the Manager, and an officer of 69 investment companies (comprised of 166 portfolios) managed by the Manager. He is 49 years old and has been an employee of the Manager since October 1988.
ROBERT SALVIOLO, Assistant Treasurer since July 2007.
Senior Accounting Manager – Equity Funds of the Manager, and an officer of 69 investment companies (comprised of 166 portfolios) managed by the Manager. He is 46 years old and has been an employee of the Manager since June 1989.
ROBERT SVAGNA, Assistant Treasurer since August 2002.
Senior Accounting Manager – Equity Funds of the Manager, and an officer of 69 investment companies (comprised of 166 portfolios) managed by the Manager. He is 46 years old and has been an employee of the Manager since November 1990.
JOSEPH W. CONNOLLY, Chief Compliance Officer since October 2004.
Chief Compliance Officer of the Manager and The Dreyfus Family of Funds (69 investment companies, comprised of 166 portfolios). He is 56 years old and has served in various capacities with the Manager since 1980, including manager of the firm’s Fund Accounting Department from 1997 through October 2001.
MATTHEW D. CONNOLLY, Anti-Money Laundering Compliance Officer since April 2012.
Anti-Money Laundering Compliance Officer of the Distributor since October 2011; from March 2010 to September 2011, Global Head, KYC Reviews and Director, UBS Investment Bank; until March 2010, AML Compliance Officer and Senior Vice President, Citi Global Wealth Management. He is an officer of 64 investment companies (comprised of 161 portfolios) managed by the Manager. He is 41 years old and has been an employee of the Distributor since October 2011.
| The Fund | 31 |
NOTES
For More Information
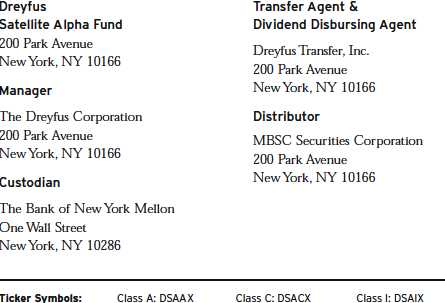
Telephone Call your financial representative or 1-800-DREYFUS
Mail The Dreyfus Family of Funds, 144 Glenn Curtiss Boulevard, Uniondale, NY 11556-0144
The fund files its complete schedule of portfolio holdings with the Securities and Exchange Commission (“SEC”) for the first and third quarters of each fiscal year on Form N-Q. The fund’s Forms N-Q are available on the SEC’s website at http://www.sec.gov and may be reviewed and copied at the SEC’s Public Reference Room in Washington, DC. Information on the operation of the Public Reference Room may be obtained by calling 1-800-SEC-0330.
A description of the policies and procedures that the fund uses to determine how to vote proxies relating to portfolio securities, and information regarding how the fund voted these proxies for the most recent 12-month period ended June 30 is available at http://www.dreyfus.com and on the SEC’s website at http://www.sec.gov. The description of the policies and procedures is also available without charge, upon request, by calling 1-800-DREYFUS.

Item 2. Code of Ethics.
The Registrant has adopted a code of ethics that applies to the Registrant's principal executive officer, principal financial officer, principal accounting officer or controller, or persons performing similar functions. There have been no amendments to, or waivers in connection with, the Code of Ethics during the period covered by this Report.
Item 3. Audit Committee Financial Expert.
The Registrant's Board has determined that David Feldman, a member of the Audit Committee of the Board, is an audit committee financial expert as defined by the Securities and Exchange Commission (the "SEC"). David Feldman is "independent" as defined by the SEC for purposes of audit committee financial expert determinations.
Item 4. Principal Accountant Fees and Services.
(a) Audit Fees. The aggregate fees billed for each of the last two fiscal years (the "Reporting Periods") for professional services rendered by the Registrant's principal accountant (the "Auditor") for the audit of the Registrant's annual financial statements or services that are normally provided by the Auditor in connection with the statutory and regulatory filings or engagements for the Reporting Periods, were $186,586 in 2012 and $233,492 in 2013.
(b) Audit-Related Fees. The aggregate fees billed in the Reporting Periods for assurance and related services by the Auditor that are reasonably related to the performance of the audit of the Registrant's financial statements and are not reported under paragraph (a) of this Item 4 were $30,000 in 2012 and $37,200 in 2013. These services consisted of one or more of the following: (i) agreed upon procedures related to compliance with Internal Revenue Code section 817(h), (ii) security counts required by Rule 17f-2 under the Investment Company Act of 1940, as amended, (iii) advisory services as to the accounting or disclosure treatment of Registrant transactions or events and (iv) advisory services to the accounting or disclosure treatment of the actual or potential impact to the Registrant of final or proposed rules, standards or interpretations by the Securities and Exchange Commission, the Financial Accounting Standards Boards or other regulatory or standard-setting bodies.
The aggregate fees billed in the Reporting Periods for non-audit assurance and related services by the Auditor to the Registrant's investment adviser (not including any sub-investment adviser whose role is primarily portfolio management and is subcontracted with or overseen by another investment adviser), and any entity controlling, controlled by or under common control with the investment adviser that provides ongoing services to the Registrant ("Service Affiliates"), that were reasonably related to the performance of the annual audit of the Service Affiliate, which required pre-approval by the Audit Committee were $0 in 2012 and $0 in 2013.
(c) Tax Fees. The aggregate fees billed in the Reporting Periods for professional services rendered by the Auditor for tax compliance, tax advice, and tax planning ("Tax Services") were $20,624 in 2012 and $28,239 in 2013. These services consisted of: (i) review or preparation of U.S. federal, state, local and excise tax returns; (ii) U.S. federal, state and local tax planning, advice and assistance regarding statutory, regulatory or administrative developments; (iii) tax advice regarding tax qualification matters and/or treatment of various financial instruments held or proposed to be acquired or held, and (iv) determination of Passive Foreign Investment Companies. The aggregate fees billed in the Reporting Periods for Tax Services by the Auditor to Service Affiliates, which required pre-approval by the Audit Committee were $0 in 2012 and $0 in 2013.
(d) All Other Fees. The aggregate fees billed in the Reporting Periods for products and services provided by the Auditor, other than the services reported in paragraphs (a) through (c) of this Item, were $1,412 in 2012 and $1,409 in 2013. These services consisted of a review of the Registrant's anti-money laundering program.
The aggregate fees billed in the Reporting Periods for Non-Audit Services by the Auditor to Service Affiliates, other than the services reported in paragraphs (b) through (c) of this Item, which required pre-approval by the Audit Committee, were $200,000 in 2012 and $0 in 2013.
(e)(1) Audit Committee Pre-Approval Policies and Procedures. The Registrant's Audit Committee has established policies and procedures (the "Policy") for pre-approval (within specified fee limits) of the Auditor's engagements for non-audit services to the Registrant and Service Affiliates without specific case-by-case consideration. The pre-approved services in the Policy can include pre-approved audit services, pre-approved audit-related services, pre-approved tax services and pre-approved all other services. Pre-approval considerations include whether the proposed services are compatible with maintaining the Auditor's independence. Pre-approvals pursuant to the Policy are considered annually.
(e)(2) Note: None of the services described in paragraphs (b) through (d) of this Item 4 were approved by the Audit Committee pursuant to paragraph (c)(7)(i)(C) of Rule 2-01 of Regulation S-X.
(f) None of the hours expended on the principal accountant's engagement to audit the registrant's financial statements for the most recent fiscal year were attributed to work performed by persons other than the principal account's full-time, permanent employees.
Non-Audit Fees. The aggregate non-audit fees billed by the Auditor for services rendered to the Registrant, and rendered to Service Affiliates, for the Reporting Periods were $47,346,640 in 2012 and $53,266,415 in 2013.
Auditor Independence. The Registrant's Audit Committee has considered whether the provision of non-audit services that were rendered to Service Affiliates, which were not pre-approved (not requiring pre-approval), is compatible with maintaining the Auditor's independence.
Item 5. Audit Committee of Listed Registrants.
Not applicable. [CLOSED-END FUNDS ONLY]
Item 6. Investments.
(a) Not applicable.
Item 7. Disclosure of Proxy Voting Policies and Procedures for Closed-End Management Investment Companies.
Not applicable. [CLOSED-END FUNDS ONLY]
Item 8. Portfolio Managers of Closed-End Management Investment Companies.
Not applicable. [CLOSED-END FUNDS ONLY, beginning with reports for periods ended on and after December 31, 2005]
Item 9. Purchases of Equity Securities by Closed-End Management Investment Companies and Affiliated Purchasers.
Not applicable. [CLOSED-END FUNDS ONLY]
Item 10. Submission of Matters to a Vote of Security Holders.
There have been no material changes to the procedures applicable to Item 10.
Item 11. Controls and Procedures.
(a) The Registrant's principal executive and principal financial officers have concluded, based on their evaluation of the Registrant's disclosure controls and procedures as of a date within 90 days of the filing date of this report, that the Registrant's disclosure controls and procedures are reasonably designed to ensure that information required to be disclosed by the Registrant on Form N-CSR is recorded, processed, summarized and reported within the required time periods and that information required to be disclosed by the Registrant in the reports that it files or submits on Form N-CSR is accumulated and communicated to the Registrant's management, including its principal executive and principal financial officers, as appropriate to allow timely decisions regarding required disclosure.
(b) There were no changes to the Registrant's internal control over financial reporting that occurred during the second fiscal quarter of the period covered by this report that have materially affected, or are reasonably likely to materially affect, the Registrant's internal control over financial reporting.
Item 12. Exhibits.
(a)(1) Code of ethics referred to in Item 2.
(a)(2) Certifications of principal executive and principal financial officers as required by Rule 30a-2(a) under the Investment Company Act of 1940.
(a)(3) Not applicable.
(b) Certification of principal executive and principal financial officers as required by Rule 30a-2(b) under the Investment Company Act of 1940.
SIGNATURES
Pursuant to the requirements of the Securities Exchange Act of 1934 and the Investment Company Act of 1940, the Registrant has duly caused this Report to be signed on its behalf by the undersigned, thereunto duly authorized.
Dreyfus Premier Investment Funds, Inc.
By: /s/ Bradley J. Skapyak | |
Bradley J. Skapyak President
| |
Date: | December 18, 2013 |
| |
Pursuant to the requirements of the Securities Exchange Act of 1934 and the Investment Company Act of 1940, this Report has been signed below by the following persons on behalf of the Registrant and in the capacities and on the dates indicated. | |
| |
By: /s/ Bradley J. Skapyak | |
Bradley J. Skapyak President
| |
Date: | December 18, 2013 |
| |
By: /s/ James Windels | |
James Windels Treasurer
| |
Date: | December 18, 2013 |
| |
EXHIBIT INDEX
(a)(1) Code of ethics referred to in Item 2.
(a)(2) Certifications of principal executive and principal financial officers as required by Rule 30a-2(a) under the Investment Company Act of 1940. (EX-99.CERT)
(b) Certification of principal executive and principal financial officers as required by Rule 30a-2(b) under the Investment Company Act of 1940. (EX-99.906CERT)