UNITED STATES
SECURITIES AND EXCHANGE COMMISSION
Washington, D.C. 20549
FORM N-CSR
CERTIFIED SHAREHOLDER REPORT OF REGISTERED MANAGEMENT
INVESTMENT COMPANIES
Investment Company Act file number | 811-6490 | |||||
|
| |||||
| Dreyfus Premier Investment Funds, Inc. |
| ||||
| (Exact name of Registrant as specified in charter) |
| ||||
|
|
| ||||
|
c/o The Dreyfus Corporation 200 Park Avenue New York, New York 10166 |
| ||||
| (Address of principal executive offices) (Zip code) |
| ||||
|
|
| ||||
| Janette E. Farragher, Esq. 200 Park Avenue New York, New York 10166 |
| ||||
| (Name and address of agent for service) |
| ||||
| ||||||
Registrant's telephone number, including area code: | (212) 922-6000 | |||||
|
| |||||
Date of fiscal year end:
| 10/31 |
| ||||
Date of reporting period: | 10/31/12 |
| ||||
The following N-CSR relates only to the Registrant’s series listed below and does not affect the other series of the Registrant, which has a different fiscal year end and, therefore, different N-CSR reporting requirements. A separate N-CSR Form will be filed for this series, as appropriate.
DREYFUS PREMIER INVESTMENT FUNDS, INC.
-Dreyfus Diversified International Fund
-Dreyfus Emerging Asia Fund
- Dreyfus Greater China Fund
-Dreyfus India Fund
-Dreyfus Satellite Alpha Fund
1
Dreyfus
Diversified
International Fund
ANNUAL REPORT October 31, 2012
Save time. Save paper. View your next shareholder report online as soon as it’s available. Log into www.dreyfus.com and sign up for Dreyfus eCommunications. It’s simple and only takes a few minutes.
The views expressed in this report reflect those of the portfolio manager only through the end of the period covered and do not necessarily represent the views of Dreyfus or any other person in the Dreyfus organization. Any such views are subject to change at any time based upon market or other conditions and Dreyfus disclaims any responsibility to update such views.These views may not be relied on as investment advice and, because investment decisions for a Dreyfus fund are based on numerous factors, may not be relied on as an indication of trading intent on behalf of any Dreyfus fund.
Contents | |
THE FUND | |
| 2 | A Letter from the Chairman and CEO |
| 3 | Discussion of Fund Performance |
| 6 | Fund Performance |
| 8 | Understanding Your Fund’s Expenses |
| 8 | Comparing Your Fund’s Expenses With Those of Other Funds |
| 9 | Statement of Investments |
| 10 | Statement of Assets and Liabilities |
| 11 | Statement of Operations |
| 12 | Statement of Changes in Net Assets |
| 14 | Financial Highlights |
| 17 | Notes to Financial Statements |
| 26 | Report of Independent Registered Public Accounting Firm |
| 27 | Important Tax Information |
| 28 | Proxy Results |
| 29 | Information About the Renewal of the Fund’s Management Agreement |
| 34 | Board Members Information |
| 36 | Officers of the Fund |
FOR MORE INFORMATION | |
Back Cover |
Dreyfus
Diversified
International Fund
The Fund
A LETTER FROM THE CHAIRMAN AND CEO

Dear Shareholder:
We are pleased to present this annual report for Dreyfus Diversified International Fund, covering the 12-month period from November 1, 2011, through October 31, 2012. For information about how the fund performed during the reporting period, as well as general market perspectives, we provide a Discussion of Fund Performance on the pages that follow.
Despite pronounced stock market weakness during the spring of 2012, stocks generally advanced over the reporting period as investors responded to encouraging macroeconomic developments throughout the world. Employment gains in the United States, credible measures to prevent a more severe banking crisis in Europe, and the likelihood of a “soft landing” for China’s economy buoyed investor sentiment, as did aggressively accommodative monetary policies from central banks in the United States, Europe, Japan and China. Consequently, U.S. stocks across all capitalization ranges posted double-digit returns, on average, for the reporting period.
In light of the easy monetary policies adopted by many countries, we expect global growth to be slightly more robust in 2013 than in 2012.The U.S. economic recovery is likely to persist at subpar levels over the first half of the new year, as growth may remain constrained by uncertainties surrounding fiscal policy and tax reforms. However, successful resolution of the current fiscal debate may prompt corporate decision-makers to increase capital spending, which could have positive implications for the U.S. economy and domestic equity markets.As always, we encourage you to stay in touch with your financial advisor as new developments unfold.
Thank you for your continued confidence and support.
Jonathan R. Baum
Chairman and Chief Executive Officer
The Dreyfus Corporation
November 15, 2012
2
DISCUSSION OF FUND PERFORMANCE
For the period of November 1, 2011, through October 31, 2012, as provided by Richard B. Hoey,A. Paul Disdier and Keith L. Stransky, CFA, Portfolio Managers
Fund and Market Performance Overview
For the 12-month period ended October 31, 2012, Dreyfus Diversified International Fund’s Class A shares produced a total return of 6.39%, Class C shares returned 5.65% and Class I shares returned 6.82%.1 This compares with a 4.61% total return for the fund’s benchmark, the Morgan Stanley Capital International Europe, Australasia, Far East Index (the “MSCI EAFE Index” or the “Index”), during the same period.2
Despite bouts of heightened market volatility, improving economic sentiment in many parts of the world enabled global stock prices to end the reporting period with modest gains.The fund produced higher returns than its benchmark, largely due to strong contributions to relative performance from Dreyfus/Newton International Equity Fund, International Stock Fund, and Dreyfus International Equity Fund.
The Fund’s Investment Approach
The fund seeks long-term capital appreciation.To pursue its goal, the fund normally allocates its assets among other mutual funds advised by The Dreyfus Corporation (Dreyfus), or its affiliates, that invest primarily in stocks issued by foreign companies. The underlying funds are selected by the Dreyfus Investment Committee based on their investment objectives and management policies, portfolio holdings, risk/reward profiles, historical performance and other factors.The Dreyfus Investment Committee will rebalance the fund’s investments in the underlying funds at least annually, but may do so more often in response to market conditions.As of October 31, 2012, the fund’s assets were allocated as follows:
| Underlying Funds | (%) |
| International Stock Fund | 29 |
| Dreyfus International Equity Fund | 25 |
| Dreyfus International Value Fund | 11 |
| Dreyfus/Newton International Equity Fund | 26 |
| Dreyfus Emerging Markets Fund | 9 |
The Fund 3
DISCUSSION OF FUND PERFORMANCE (continued)
Markets Reacted to Changing Macroeconomic Developments
The reporting period began in the wake of major declines in stock markets throughout the world, resulting in attractive valuations across a number of market sectors in November 2011. Indeed, by the beginning of 2012 many equity markets were rallying amid encouraging macroeconomic developments, including U.S. employment gains, a quantitative easing program in Europe that forestalled a more severe banking crisis in the region, and less restrictive monetary and fiscal policies in China in an environment of reduced inflationary pressures. Meanwhile, corporate earnings generally remained strong, and many companies had shored up their balance sheets. Consequently, investors grew more tolerant of risks, and were able to focus more intently on business fundamentals and less on news headlines.
These positive influences were called into question during the spring, when the U.S. labor market’s rebound slowed, measures designed to relieve fiscal pressures in Europe encountered resistance, and the Chinese economy remained sluggish.The summer saw the markets’ rally resume amid more encouraging economic data, and international stocks and bonds ended the reporting period with respectable gains, on average.
A More Constructive Investment Posture
We are pleased that the fund produced higher returns with less volatility than its benchmark over the reporting period. Among the factors supporting the fund’s performance was underweighted exposure to troubled European markets across the fund’s underlying investments.
Although the fund began the reporting period with a relatively defensive stance, we soon adopted a more constructive posture as it became clearer that signs of global economic improvement were likely to be sustainable. In addition, we adjusted the fund’s allocations in response to our analysis of potential opportunities in global equity markets.
In January 2012, we regarded the emerging markets as undervalued compared to historical norms, and we shifted 2.6% of the fund’s assets from the relatively defensive International Stock Fund to the more aggressive Dreyfus Emerging Markets Fund. In June, we reversed course after the emerging markets had rallied, moving 2% of the fund’s assets from Dreyfus Emerging Markets Fund and 3% of assets from Dreyfus InternationalValue Fund into Dreyfus/Newton International Equity Fund.That move
4
was followed in July by a more modest reallocation of 1% of the fund’s assets from Dreyfus Emerging Asia Fund to Dreyfus Emerging Markets Fund. We repeated July’s move in August, when we shifted another 1% of the fund’s assets from Dreyfus Emerging Asia Fund to Dreyfus Emerging Markets Fund. Finally, in October, we sought to increase the fund’s participation in the depressed Chinese stock market by moving 2% of assets from International Stock Fund to Dreyfus Emerging Markets Fund.
Finding Opportunities in Worldwide Markets
Although heightened stock and bond market volatility is likely to persist over the near term in the face of ongoing global challenges, we have been encouraged recently by positive U.S. and global economic developments. In our analysis, emerging-markets stocks currently appear to be attractively valued, and we may increase the fund’s allocation to one or more of its underlying emerging-markets funds should economic and market conditions in developing countries continue to improve.
November 15, 2012
Equity funds are subject generally to market, market sector, market liquidity, issuer and investment style risks, among other factors, to varying degrees, all of which are more fully described in the prospectus of the fund and that of each underlying fund.
The ability of the fund to achieve its investment goal depends, in part, on the ability of the Dreyfus Investment Committee to allocate effectively the fund’s assets among the underlying funds.There can be no assurance that the actual allocations will be effective in achieving the fund’s investment goal.
Each underlying fund’s performance will be influenced by political, social and economic factors affecting investments in foreign companies. Special risks associated with such companies include exposure to currency fluctuations, less liquidity, less developed or less efficient trading markets, lack of comprehensive company information, political instability and differing auditing and legal standards.These risks are higher in emerging market countries.
| 1 Total return includes reinvestment of dividends and any capital gains paid, and does not take into consideration the |
| maximum initial sales charge in the case of Class A shares, or the applicable contingent deferred sales charge imposed on |
| redemptions in the case of Class C shares. Had these charges been reflected, returns would have been lower. Past |
| performance is no guarantee of future results. Share price and investment return fluctuate such that upon redemption, |
| fund shares may be worth more or less than their original cost. Return figures provided reflect the absorption of certain |
| fund expenses pursuant to an agreement by The Dreyfus Corporation through March 1, 2013, at which time it may |
| be extended, terminated or modified. Had these expenses not been absorbed, the fund’s returns would have been lower. |
| 2 SOURCE: LIPPER INC. — Reflects reinvestment of net dividends and, where applicable, capital gain distributions. |
| The Morgan Stanley Capital International Europe,Australasia, Far East (MSCI EAFE) Index is an unmanaged |
| index composed of a sample of companies representative of the market structure of European and Pacific Basin countries. |
The Fund 5
FUND PERFORMANCE
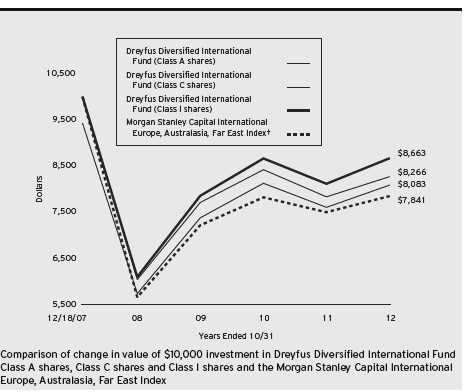
† Source: Lipper Inc.
Past performance is not predictive of future performance.
The above graph compares a $10,000 investment made in each of the Class A, Class C and Class I shares of Dreyfus Diversified International Fund on 12/18/07 (inception date) to a $10,000 investment made in the Morgan Stanley Capital International Europe,Australasia, Far East Index (the “Index”) on that date.All dividends and capital gain distributions are reinvested.
The fund’s performance shown in the line graph above takes into account the maximum initial sales charge on Class A shares and all other applicable fees and expenses on all classes.The Index is an unmanaged index composed of a sample of companies representative of the market structure of European and Pacific Basin countries. Unlike a mutual fund, the Index is not subject to charges, fees and other expenses. Investors cannot invest directly in any index. Further information relating to fund performance, including expense reimbursements, if applicable, is contained in the Financial Highlights section of the prospectus and elsewhere in this report.
6
| Average Annual Total Returns as of 10/31/12 | |||||
| Inception | From | ||||
| Date | 1 | Year | Inception | ||
| Class A shares | |||||
| with maximum sales charge (5.75%) | 12/18/07 | 0.30 | % | –4.28 | % |
| without sales charge | 12/18/07 | 6.39 | % | –3.11 | % |
| Class C shares | |||||
| with applicable redemption charge † | 12/18/07 | 4.65 | % | –3.83 | % |
| without redemption | 12/18/07 | 5.65 | % | –3.83 | % |
| Class I shares | 12/18/07 | 6.82 | % | –2.90 | % |
| Morgan Stanley Capital International | |||||
| Europe, Australasia, Far East Index | 12/31/07 | 4.61 | % | –4.91 | %†† |
Past performance is not predictive of future performance.The fund’s performance shown in the graph and table does not reflect the deduction of taxes that a shareholder would pay on fund distributions or the redemption of fund shares.
| † | The maximum contingent deferred sales charge for Class C shares is 1% for shares redeemed within one year of the |
| date of purchase. | |
| †† | For comparative purposes, the value of the Index as of 12/31/07 is used as the beginning value on 12/18/07. |
The Fund 7
UNDERSTANDING YOUR FUND’S EXPENSES (Unaudited)
As a mutual fund investor, you pay ongoing expenses, such as management fees and other expenses. Using the information below, you can estimate how these expenses affect your investment and compare them with the expenses of other funds.You also may pay one-time transaction expenses, including sales charges (loads) and redemption fees, which are not shown in this section and would have resulted in higher total expenses. For more information, see your fund’s prospectus or talk to your financial adviser.
Review your fund’s expenses
The table below shows the expenses you would have paid on a $1,000 investment in Dreyfus Diversified International Fund from May 1, 2012 to October 31, 2012. It also shows how much a $1,000 investment would be worth at the close of the period, assuming actual returns and expenses.
Expenses and Value of a $1,000 Investment
assuming actual returns for the six months ended October 31, 2012
| Class A | Class C | Class I | ||||
| Expenses paid per $1,000† | $ | 2.08 | $ | 5.77 | $ | .30 |
| Ending value (after expenses) | $ | 1,017.70 | $ | 1,013.60 | $ | 1,018.70 |
COMPARING YOUR FUND’S EXPENSES
WITH THOSE OF OTHER FUNDS (Unaudited)
Using the SEC’s method to compare expenses
The Securities and Exchange Commission (SEC) has established guidelines to help investors assess fund expenses. Per these guidelines, the table below shows your fund’s expenses based on a $1,000 investment, assuming a hypothetical 5% annualized return. You can use this information to compare the ongoing expenses (but not transaction expenses or total cost) of investing in the fund with those of other funds.All mutual fund shareholder reports will provide this information to help you make this comparison. Please note that you cannot use this information to estimate your actual ending account balance and expenses paid during the period.
Expenses and Value of a $1,000 Investment
assuming a hypothetical 5% annualized return for the six months ended October 31, 2012
| Class A | Class C | Class I | ||||
| Expenses paid per $1,000† | $ | 2.08 | $ | 5.79 | $ | .31 |
| Ending value (after expenses) | $ | 1,023.08 | $ | 1,019.41 | $ | 1,024.83 |
| † Expenses are equal to the fund’s annualized expense ratio of .41% for Class A, 1.14% for Class C and .06% |
| for Class I, multiplied by the average account value over the period, multiplied by 184/366 (to reflect the one-half |
| year period). |
8
STATEMENT OF INVESTMENTS
October 31, 2012
| Registered Investment Companies—100.1% | Shares | Value ($) | |||
| Dreyfus Emerging Markets Fund, Cl. I | 5,248,603 | a | 51,803,713 | ||
| Dreyfus International Equity Fund, Cl. I | 4,370,620 | a | 121,197,281 | ||
| Dreyfus International Value Fund, Cl. I | 5,060,229 | a | 51,310,718 | ||
| Dreyfus/Newton International Equity Fund, Cl. I | 7,129,108 | a | 119,982,886 | ||
| International Stock Fund, Cl. I | 9,124,547 | a | 127,287,436 | ||
| Total Investments (cost $423,815,050) | 100.1 | % | 471,582,034 | ||
| Liabilities, Less Cash and Receivables | (.1 | %) | (340,799 | ) | |
| Net Assets | 100.0 | % | 471,241,235 | ||
| a Investment in affiliated mutual fund. | |||||
| Portfolio Summary (Unaudited)† | |||||
| Value (%) | |||||
| Mutual Funds: Foreign | 100.1 | ||||
| † Based on net assets. | |||||
| See notes to financial statements. | |||||
The Fund 9
STATEMENT OF ASSETS AND LIABILITIES
October 31, 2012
| Cost | Value | |||
| Assets ($): | ||||
| Investments in affiliated issuers—See Statement of | ||||
| Investments—Note 1(c) | 423,815,050 | 471,582,034 | ||
| Receivable for investment securities sold | 344,488 | |||
| Receivable for shares of Common Stock subscribed | 212,799 | |||
| Prepaid expenses | 27,362 | |||
| 472,166,683 | ||||
| Liabilities ($): | ||||
| Due to The Dreyfus Corporation and affiliates—Note 3(c) | 6,965 | |||
| Cash overdraft due to Custodian | 203,969 | |||
| Payable for shares of Common Stock redeemed | 626,572 | |||
| Interest payable—Note 2 | 139 | |||
| Accrued expenses | 87,803 | |||
| 925,448 | ||||
| Net Assets ($) | 471,241,235 | |||
| Composition of Net Assets ($): | ||||
| Paid-in capital | 455,606,477 | |||
| Accumulated distributions in excess of investment income—net | (67,695 | ) | ||
| Accumulated net realized gain (loss) on investments | (32,064,531 | ) | ||
| Accumulated net unrealized appreciation | ||||
| (depreciation) on investments | 47,766,984 | |||
| Net Assets ($) | 471,241,235 | |||
| Net Asset Value Per Share | ||||
| Class A | Class C | Class I | ||
| Net Assets ($) | 8,674,538 | 116,492 | 462,450,205 | |
| Shares Outstanding | 886,883 | 12,021 | 47,122,299 | |
| Net Asset Value Per Share ($) | 9.78 | 9.69 | 9.81 | |
| See notes to financial statements. | ||||
10
| STATEMENT OF OPERATIONS | ||
| Year Ended October 31, 2012 | ||
| Investment Income ($): | ||
| Income: | ||
| Cash dividends from affiliated issuers | 9,354,045 | |
| Expenses: | ||
| Directors’ fees and expenses—Note 3(d) | 96,147 | |
| Legal fees | 45,390 | |
| Registration fees | 42,476 | |
| Auditing fees | 41,547 | |
| Shareholder servicing costs—Note 3(c) | 38,657 | |
| Prospectus and shareholders’ reports | 17,914 | |
| Custodian fees—Note 3(c) | 5,096 | |
| Loan commitment fees—Note 2 | 4,965 | |
| Interest expense—Note 2 | 3,689 | |
| Distribution fees—Note 3(b) | 1,566 | |
| Miscellaneous | 20,865 | |
| Total Expenses | 318,312 | |
| Less—reduction in expenses due to undertaking—Note 3(a) | (1,098 | ) |
| Less—reduction in fees due to earnings credits—Note 3(c) | (15 | ) |
| Net Expenses | 317,199 | |
| Investment Income—Net | 9,036,846 | |
| Realized and Unrealized Gain (Loss) on Investments—Note 4 ($): | ||
| Net realized gain (loss) on investments in affiliated issuers | (31,125,363 | ) |
| Capital gain distributions from affiliated issuers | 4,856,296 | |
| Net Realized Gain (Loss) | (26,269,067 | ) |
| Net unrealized appreciation (depreciation) | ||
| on investments in affiliated issuers | 43,344,469 | |
| Net Realized and Unrealized Gain (Loss) on Investments | 17,075,402 | |
| Net Increase in Net Assets Resulting from Operations | 26,112,248 | |
| See notes to financial statements. | ||
The Fund 11
STATEMENT OF CHANGES IN NET ASSETS
| Year Ended October 31, | ||||
| 2012 | 2011 | |||
| Operations ($): | ||||
| Investment income—net | 9,036,846 | 5,035,437 | ||
| Net realized gain (loss) on | ||||
| investments in affiliated issuers | (26,269,067 | ) | (2,491,387 | ) |
| Net unrealized appreciation (depreciation) | ||||
| on investments in affiliated issuers | 43,344,469 | (45,253,453 | ) | |
| Net Increase (Decrease) in Net Assets | ||||
| Resulting from Operations | 26,112,248 | (42,709,403 | ) | |
| Dividends to Shareholders from ($): | ||||
| Investment income—net: | ||||
| Class A Shares | (194,199 | ) | (104,433 | ) |
| Class C Shares | (5,620 | ) | (292 | ) |
| Class I Shares | (9,324,691 | ) | (5,921,143 | ) |
| Total Dividends | (9,524,510 | ) | (6,025,868 | ) |
| Capital Stock Transactions ($): | ||||
| Net proceeds from shares sold: | ||||
| Class A Shares | 1,663,492 | 4,777,705 | ||
| Class C Shares | 227,447 | 118,251 | ||
| Class I Shares | 151,019,904 | 238,791,647 | ||
| Dividends reinvested: | ||||
| Class A Shares | 189,297 | 104,360 | ||
| Class C Shares | 5,320 | 292 | ||
| Class I Shares | 1,239,699 | 973,208 | ||
| Cost of shares redeemed: | ||||
| Class A Shares | (3,939,062 | ) | (1,369,169 | ) |
| Class C Shares | (225,861 | ) | (63,143 | ) |
| Class I Shares | (180,962,996 | ) | (69,062,457 | ) |
| Increase (Decrease) in Net Assets | ||||
| from Capital Stock Transactions | (30,782,760 | ) | 174,270,694 | |
| Total Increase (Decrease) in Net Assets | (14,195,022 | ) | 125,535,423 | |
| Net Assets ($): | ||||
| Beginning of Period | 485,436,257 | 359,900,834 | ||
| End of Period | 471,241,235 | 485,436,257 | ||
| Undistributed (distributions in excess of) | ||||
| investment income–net | (67,695 | ) | — | |
12
| Year Ended October 31, | ||||
| 2012 | 2011 | |||
| Capital Share Transactions: | ||||
| Class A | ||||
| Shares sold | 180,699 | 469,196 | ||
| Shares issued for dividends reinvested | 21,808 | 10,025 | ||
| Shares redeemed | (415,349 | ) | (137,473 | ) |
| Net Increase (Decrease) in Shares Outstanding | (212,842 | ) | 341,748 | |
| Class C | ||||
| Shares sold | 25,121 | 11,177 | ||
| Shares issued for dividends reinvested | 614 | 28 | ||
| Shares redeemed | (25,351 | ) | (6,377 | ) |
| Net Increase (Decrease) in Shares Outstanding | 384 | 4,828 | ||
| Class I | ||||
| Shares sold | 16,045,955 | 22,911,074 | ||
| Shares issued for dividends reinvested | 142,658 | 93,488 | ||
| Shares redeemed | (19,633,403 | ) | (7,017,782 | ) |
| Net Increase (Decrease) in Shares Outstanding | (3,444,790 | ) | 15,986,780 | |
| See notes to financial statements. | ||||
The Fund 13
FINANCIAL HIGHLIGHTS
The following tables describe the performance for each share class for the fiscal periods indicated.All information (except portfolio turnover rate) reflects financial results for a single fund share.Total return shows how much your investment in the fund would have increased (or decreased) during each period, assuming you had reinvested all dividends and distributions.These figures have been derived from the fund’s financial statements.
| Year Ended October 31, | ||||||||||
| Class A Shares | 2012 | 2011 | 2010 | 2009 | 2008 | a | ||||
| Per Share Data ($): | ||||||||||
| Net asset value, beginning of period | 9.38 | 10.16 | 9.45 | 7.59 | 12.50 | |||||
| Investment Operations: | ||||||||||
| Investment income (loss)—netb | .16 | .09 | .09 | .16 | (.01 | ) | ||||
| Net realized and unrealized | ||||||||||
| gain (loss) on investments | .42 | (.73 | ) | .86 | 1.96 | (4.90 | ) | |||
| Total from Investment Operations | .58 | (.64 | ) | .95 | 2.12 | (4.91 | ) | |||
| Distributions: | ||||||||||
| Dividends from investment income—net | (.18 | ) | (.14 | ) | (.12 | ) | (.26 | ) | — | |
| Dividends from net realized | ||||||||||
| gain on investments | — | — | (.12 | ) | — | — | ||||
| Total Distributions | (.18 | ) | (.14 | ) | (.24 | ) | (.26 | ) | — | |
| Net asset value, end of period | 9.78 | 9.38 | 10.16 | 9.45 | 7.59 | |||||
| Total Return (%)c | 6.39 | (6.47 | ) | 10.18 | 28.80 | (39.28 | )d | |||
| Ratios/Supplemental Data (%): | ||||||||||
| Ratio of total expenses | ||||||||||
| to average net assetse | .41 | .40 | .40 | 1.89 | 14.57 | f | ||||
| Ratio of net expenses | ||||||||||
| to average net assetse | .41 | .24 | .30 | .37 | .31 | f | ||||
| Ratio of net investment income | ||||||||||
| (loss) to average net assetse | 1.70 | .90 | .92 | 2.01 | (.13 | )f | ||||
| Portfolio Turnover Rate | 30.63 | 16.15 | 20.78 | 36.68 | 25.65 | d | ||||
| Net Assets, end of period ($ x 1,000) | 8,675 | 10,310 | 7,701 | 4,578 | 1,646 | |||||
| a | From December 18, 2007 (commencement of operations) to October 31, 2008. |
| b | Based on average shares outstanding at each month end. |
| c | Exclusive of sales charge. |
| d | Not annualized. |
| e | Amounts do not include the activity of the underlying funds. |
| f | Annualized. |
See notes to financial statements.
14
| Year Ended October 31, | ||||||||||
| Class C Shares | 2012 | 2011 | 2010 | 2009 | 2008 | a | ||||
| Per Share Data ($): | ||||||||||
| Net asset value, beginning of period | 9.35 | 10.10 | 9.38 | 7.54 | 12.50 | |||||
| Investment Operations: | ||||||||||
| Investment income (loss)—netb | .17 | .01 | .08 | .14 | (.05 | ) | ||||
| Net realized and unrealized | ||||||||||
| gain (loss) on investments | .34 | (.71 | ) | .78 | 1.90 | (4.91 | ) | |||
| Total from Investment Operations | .51 | (.70 | ) | .86 | 2.04 | (4.96 | ) | |||
| Distributions: | ||||||||||
| Dividends from investment income—net | (.17 | ) | (.05 | ) | (.02 | ) | (.20 | ) | — | |
| Dividends from net realized | ||||||||||
| gain on investments | — | — | (.12 | ) | — | — | ||||
| Total Distributions | (.17 | ) | (.05 | ) | (.14 | ) | (.20 | ) | — | |
| Net asset value, end of period | 9.69 | 9.35 | 10.10 | 9.38 | 7.54 | |||||
| Total Return (%)c | 5.65 | (7.01 | ) | 9.21 | 27.73 | (39.68 | )d | |||
| Ratios/Supplemental Data (%): | ||||||||||
| Ratio of total expenses | ||||||||||
| to average net assetse | 1.47 | 1.48 | 1.63 | 3.33 | 15.79 | f | ||||
| Ratio of net expenses | ||||||||||
| to average net assetse | 1.17 | .70 | 1.07 | 1.12 | 1.06 | f | ||||
| Ratio of net investment income | ||||||||||
| (loss) to average net assetse | 1.71 | .13 | .85 | 1.76 | (.51 | )f | ||||
| Portfolio Turnover Rate | 30.63 | 16.15 | 20.78 | 36.68 | 25.65 | d | ||||
| Net Assets, end of period ($ x 1,000) | 116 | 109 | 69 | 84 | 39 | |||||
| a | From December 18, 2007 (commencement of operations) to October 31, 2008. |
| b | Based on average shares outstanding at each month end. |
| c | Exclusive of sales charge. |
| d | Not annualized. |
| e | Amounts do not include the activity of the underlying funds. |
| f | Annualized. |
See notes to financial statements.
The Fund 15
FINANCIAL HIGHLIGHTS (continued)
| Year Ended October 31, | ||||||||||
| Class I Shares | 2012 | 2011 | 2010 | 2009 | 2008 | a | ||||
| Per Share Data ($): | ||||||||||
| Net asset value, beginning of period | 9.39 | 10.18 | 9.47 | 7.61 | 12.50 | |||||
| Investment Operations: | ||||||||||
| Investment income—netb | .18 | .11 | .11 | .01 | .05 | |||||
| Net realized and unrealized | ||||||||||
| gain (loss) on investments | .44 | (.74 | ) | .86 | 2.12 | (4.94 | ) | |||
| Total from Investment Operations | .62 | (.63 | ) | .97 | 2.13 | (4.89 | ) | |||
| Distributions: | ||||||||||
| Dividends from investment income—net | (.20 | ) | (.16 | ) | (.14 | ) | (.27 | ) | — | |
| Dividends from net realized | ||||||||||
| gain on investments | — | — | (.12 | ) | — | — | ||||
| Total Distributions | (.20 | ) | (.16 | ) | (.26 | ) | (.27 | ) | — | |
| Net asset value, end of period | 9.81 | 9.39 | 10.18 | 9.47 | 7.61 | |||||
| Total Return (%) | 6.82 | (6.33 | ) | 10.34 | 28.89 | (39.12 | )c | |||
| Ratios/Supplemental Data (%): | ||||||||||
| Ratio of total expenses | ||||||||||
| to average net assetsd | .06 | .05 | .05 | .24 | 14.86 | e | ||||
| Ratio of net expenses | ||||||||||
| to average net assetsd | .06 | .04 | .04 | .08 | .06 | e | ||||
| Ratio of net investment income | ||||||||||
| to average net assetsd | 1.91 | 1.07 | 1.10 | .16 | .54 | e | ||||
| Portfolio Turnover Rate | 30.63 | 16.15 | 20.78 | 36.68 | 25.65 | c | ||||
| Net Assets, end of period ($ x 1,000) | 462,450 | 475,017 | 352,131 | 163,611 | 30 | |||||
| a | From December 18, 2007 (commencement of operations) to October 31, 2008. |
| b | Based on average shares outstanding at each month end. |
| c | Not annualized. |
| d | Amounts do not include the activity of the underlying funds. |
| e | Annualized. |
See notes to financial statements.
16
NOTES TO FINANCIAL STATEMENTS
NOTE 1—Significant Accounting Policies:
Dreyfus Diversified International Fund (the “fund”) is a separate diversified series of Dreyfus Premier Investment Funds, Inc. (the “Company”), which is registered under the Investment Company Act of 1940, as amended (the “Act”), as an open-end management investment company and operates as a series company currently offering eight series, including the fund.The fund’s investment objective is to seek long-term capital appreciation. The Dreyfus Corporation (the “Manager” or “Dreyfus”), a wholly-owned subsidiary of The Bank of NewYork Mellon Corporation (“BNY Mellon”), serves as the fund’s investment adviser.
MBSC Securities Corporation (the “Distributor”), a wholly-owned subsidiary of the Manager, is the distributor of the fund’s shares.The fund is authorized to issue 400 million shares of $.001 par value Common Stock.The fund currently offers three classes of shares: Class A (200 million shares authorized), Class C (100 million shares authorized) and Class I (100 million shares authorized). Class A shares are subject to a sales charge imposed at the time of purchase. Class C shares are subject to a contingent deferred sales charge (“CDSC”) imposed on Class C shares redeemed within one year of purchase. Class I shares are sold at net asset value per share only to institutional investors. Other differences between the classes include the services offered to and the expenses borne by each class, the allocation of certain transfer agency costs and certain voting rights. Income, expenses (other than expenses attributable to a specific class), and realized and unrealized gains or losses on investments are allocated to each class of shares based on its relative net assets.
The Fund 17
NOTES TO FINANCIAL STATEMENTS (continued)
The Company accounts separately for the assets, liabilities and operations of each series. Expenses directly attributable to each series are charged to that series’ operations; expenses which are applicable to all series are allocated among them on a pro rata basis.
The Financial Accounting Standards Board (“FASB”) Accounting Standards Codification is the exclusive reference of authoritative U.S. generally accepted accounting principles (“GAAP”) recognized by the FASB to be applied by nongovernmental entities. Rules and interpretive releases of the Securities and Exchange Commission (“SEC”) under authority of federal laws are also sources of authoritative GAAP for SEC registrants. The fund’s financial statements are prepared in accordance with GAAP, which may require the use of management estimates and assumptions.Actual results could differ from those estimates.
The Company enters into contracts that contain a variety of indemnifications.The fund’s maximum exposure under these arrangements is unknown.The fund does not anticipate recognizing any loss related to these arrangements.
(a) Portfolio valuation: The fair value of a financial instrument is the amount that would be received to sell an asset or paid to transfer a liability in an orderly transaction between market participants at the measurement date (i.e., the exit price). GAAP establishes a fair value hierarchy that prioritizes the inputs of valuation techniques used to measure fair value.This hierarchy gives the highest priority to unadjusted quoted prices in active markets for identical assets or liabilities (Level 1 measurements) and the lowest priority to unobservable inputs (Level 3 measurements).
Additionally, GAAP provides guidance on determining whether the volume and activity in a market has decreased significantly and whether such a decrease in activity results in transactions that are not orderly. GAAP requires enhanced disclosures around valuation inputs and techniques used during annual and interim periods.
18
Various inputs are used in determining the value of the fund’s investments relating to fair value measurements.These inputs are summarized in the three broad levels listed below:
Level 1—unadjusted quoted prices in active markets for identical investments.
Level 2—other significant observable inputs (including quoted prices for similar investments, interest rates, prepayment speeds, credit risk, etc.).
Level 3—significant unobservable inputs (including the fund’s own assumptions in determining the fair value of investments).
The inputs or methodology used for valuing securities are not necessarily an indication of the risk associated with investing in those securities.
Investments are valued at the net asset value of each underlying fund determined as of the close of the NewYork Stock Exchange (generally 4 p.m., Eastern time) on the valuation date and are generally categorized within Level 1 of the fair value hierarchy.
The following is a summary of the inputs used as of October 31, 2012 in valuing the fund’s investments:
| Level 2—Other | Level 3— | |||
| Level 1— | Significant | Significant | ||
| Unadjusted | Observable | Unobservable | ||
| Quoted Prices | Inputs | Inputs | Total | |
| Assets ($) | ||||
| Investments in Securities: | ||||
| Mutual Funds | 471,582,034 | — | — | 471,582,034 |
| † See Statement of Investments for additional detailed categorizations. | ||||
At October 31, 2012, there were no transfers between Level 1 and Level 2 of the fair value hierarchy.
(b) Securities transactions and investment income: Securities transactions are recorded on a trade date basis. Realized gains and losses
The Fund 19
NOTES TO FINANCIAL STATEMENTS (continued)
from securities transactions are recorded on the identified cost basis. Dividend income is recognized on the ex-dividend date and interest income, including, where applicable, accretion of discount and amortization of premium on investments, is recognized on the accrual basis.
(c) Affiliated issuers: Investments in other investment companies advised by Dreyfus are defined as “affiliated” in the Act. Investments in affiliated investment companies for the period ended October 31, 2012 were as follows:
| Affiliated | ||||||||
| Investment | Value | Net Realized | ||||||
| Company | 10/31/2011 | ($) | Purchases ($)† | Sales ($) | Gain (Loss) ($) | |||
| Dreyfus Emerging | ||||||||
| Asia Fund, Cl. I | 9,271,508 | 1,970,075 | 10,156,994 | (4,437,025 | ) | |||
| Dreyfus Emerging | ||||||||
| Markets Fund, Cl. I | 37,334,770 | 41,588,810 | 21,489,051 | (7,425,878 | ) | |||
| Dreyfus International | ||||||||
| Equity Fund, Cl. I | 121,861,408 | 21,706,556 | 28,703,745 | (4,976,086 | ) | |||
| Dreyfus International | ||||||||
| Value Fund, Cl. I | 72,430,987 | 15,006,650 | 31,777,735 | (6,045,770 | ) | |||
| Dreyfus/Newton | ||||||||
| International Equity | ||||||||
| Fund, Cl. I | 96,234,584 | 42,638,181 | 26,183,277 | (3,525,271 | ) | |||
| International Stock | ||||||||
| Fund, Cl. I | 148,758,880 | 22,628,346 | 53,757,025 | (4,715,333 | ) | |||
| Total | 485,892,137 | 145,538,618 | 172,067,827 | (31,125,363 | ) | |||
| † Includes reinvested dividends/distributions. | ||||||||
| Change in Net | ||||||||
| Affiliated | Unrealized | |||||||
| Investment | Appreciation | Value | Net | Dividends/ | ||||
| Company | (Depreciation) ($) | 10/31/2012 | ($) | Assets (%) Distributions ($) | ||||
| Dreyfus Emerging | ||||||||
| Asia Fund, Cl. I | 3,352,436 | — | — | — | ||||
| Dreyfus Emerging | ||||||||
| Markets Fund, Cl. I | 1,795,062 | 51,803,713 | 11.0 | 3,875,288 | ||||
| Dreyfus International | ||||||||
| Equity Fund, Cl. I | 11,309,148 | 121,197,281 | 25.7 | 2,780,543 | ||||
| Dreyfus International | ||||||||
| Value Fund, Cl. I | 1,696,586 | 51,310,718 | 10.9 | 2,401,689 | ||||
| Dreyfus/Newton | ||||||||
| International Equity | ||||||||
| Fund, Cl. I | 10,818,669 | 119,982,886 | 25.5 | 3,445,867 | ||||
| International Stock | ||||||||
| Fund, Cl. I | 14,372,568 | 127,287,436 | 27.0 | 1,706,954 | ||||
| Total | 43,344,469 | 471,582,034 | 100.1 | 14,210,341 | ||||
20
(d) Dividends to shareholders: Dividends are recorded on the ex-dividend date. Dividends from investment income-net and dividends from net realized capital gains, if any, are normally declared and paid annually, but the fund may make distributions on a more frequent basis to comply with the distribution requirements of the Internal Revenue Code of 1986, as amended (the “Code”).To the extent that net realized capital gains can be offset by capital loss carryovers, it is the policy of the fund not to distribute such gains. Income and capital gain distributions are determined in accordance with income tax regulations, which may differ from GAAP.
(e) Federal income taxes: It is the policy of the fund to continue to qualify as a regulated investment company, if such qualification is in the best interests of its shareholders, by complying with the applicable provisions of the Code, and to make distributions of taxable income sufficient to relieve it from substantially all federal income and excise taxes.
As of and during the period ended October 31, 2012, the fund did not have any liabilities for any uncertain tax positions.The fund recognizes interest and penalties, if any, related to uncertain tax positions as income tax expense in the Statement of Operations. During the period, the fund did not incur any interest or penalties.
Each of the tax years in the four-year period ended October 31, 2012 remains subject to examination by the Internal Revenue Service and state taxing authorities.
At October 31, 2012, the components of accumulated earnings on a tax basis were as follows: accumulated capital losses $19,174,282 and unrealized appreciation $34,876,735. In addition, the fund deferred for tax purposes late year ordinary losses of $67,695 to the first day of the following fiscal year.
Under the Regulated Investment Company Modernization Act of 2010 (the “2010 Act”), the fund is permitted to carry forward capital losses incurred in taxable years beginning after December 22, 2010 (“post-enactment losses”) for an unlimited period. Furthermore, post-
The Fund 21
NOTES TO FINANCIAL STATEMENTS (continued)
enactment capital loss carryovers retain their character as either short-term or long-term capital losses rather than short-term as they were under previous statute.The 2010 Act requires post-enactment losses to be utilized before the utilization of losses incurred in taxable years prior to the effective date of the 2010 Act (“pre-enactment losses”).As a result of this ordering rule, pre-enactment losses may be more likely to expire unused.
The accumulated capital loss carryover is available for federal income tax purposes to be applied against future net realized capital gains, if any, realized subsequent to October 31, 2012. If not applied, $415,833 of the carryover expires in fiscal year 2018 and $943,756 expires in fiscal year 2019. The fund has $5,222,723 of post-enactment short-term capital losses and $12,591,970 of post-enactment long-term capital losses which can be carried forward for an unlimited period.
The tax character of distributions paid to shareholders during the fiscal periods ended October 31, 2012 and October 31, 2011 were as follows: ordinary income $9,524,510 and $6,025,868, respectively.
During the period ended October 31, 2012, as a result of permanent book to tax differences, primarily due to the tax treatment for short-term capital gain distributions from regulated investment company holdings, the fund increased accumulated undistributed investment income-net by $419,969 and decreased accumulated net realized gain (loss) on investments by the same amount. Net assets and net asset value per share were not affected by this reclassification.
NOTE 2—Bank Lines of Credit:
The fund participates with other Dreyfus-managed funds in a $225 million unsecured credit facility led by Citibank, N.A. and a $300 million unsecured credit facility provided by The Bank of New York Mellon, a subsidiary of BNY Mellon and an affiliate of Dreyfus, (each, a “Facility”), each to be utilized primarily for temporary or emergency purposes, including the financing of redemptions. Effective October 10,
22
2012, the $225 million unsecured credit facility with Citibank, N.A., was decreased to $210 million. In connection therewith, the fund has agreed to pay its pro rata portion of commitment fees for each Facility. Interest is charged to the fund based on rates determined pursuant to the terms of the respective Facility at the time of borrowing.
The average amount of borrowings outstanding under the Facilities during the period ended October 31, 2012, was approximately $311,200 with a related weighted average annualized interest rate of 1.19%.
NOTE 3—Management Fee and Other Transactions with Affiliates:
(a) Pursuant to a management agreement with the Manager, there is no management fee paid to the Manager. The fund invests in other mutual funds advised by the Manager. All fees and expenses of the underlying funds are reflected in the underlying funds’ net asset value.
The Dreyfus Corporation has contractually agreed, until March 1, 2013, to assume the expenses of the fund so that the total annual fund and underlying funds operating expenses of none of the classes (excluding Rule 12b-1 Distribution Plan fees, Shareholder Services Plan fees, taxes, interest expense, brokerage commissions, commitment fees on borrowings and extraordinary expenses) exceed 1.20% of the value of the fund’s average daily net assets.The reduction in expenses, pursuant to the undertaking, amounted to $1,098 during the period ended October 31, 2012.
During the period ended October 31, 2012, the Distributor retained $83 from commissions earned on sales of the fund’s Class A shares.
(b) Under the Distribution Plan adopted pursuant to Rule 12b-1 under the Act, Class C shares pay the Distributor for distributing its shares at an annual rate of .75% of the value of the average daily net assets of Class C shares. During the period ended October 31, 2012, Class C shares were charged $1,566, pursuant to the Distribution Plan.
The Fund 23
NOTES TO FINANCIAL STATEMENTS (continued)
(c) Under the Shareholder Services Plan, Class A and Class C shares pay the Distributor at an annual rate of .25% of the value of their average daily net assets for the provision of certain services.The services provided may include personal services relating to shareholder accounts, such as answering shareholder inquiries regarding the fund and providing reports and other information, and services related to the maintenance of shareholder accounts.The Distributor may make payments to Service Agents (securities dealers, financial institutions or other industry professionals) in respect of these services. The Distributor determines the amounts to be paid to Service Agents. During the period ended October 31, 2012, Class A and Class C shares were charged $24,204 and $522 respectively, pursuant to the Shareholder Services Plan.
The fund has arrangements with the transfer agent and the custodian whereby the fund may receive earnings credits when positive cash balances are maintained, which are used to offset transfer agency and custody fees. For financial reporting purposes, the fund includes net earnings credits as an expense offset in the Statement of Operations.
The fund compensates DreyfusTransfer, Inc. (“DTI”), a wholly-owned subsidiary of the Manager, under a transfer agency agreement for providing transfer agency services for the fund and, since May 29, 2012, cash management services related to fund subscriptions and redemptions. During the period ended October 31, 2012, the fund was charged $4,069 for transfer agency services and $61 for cash management services. Cash management fees were partially offset by earnings credits of $7.These fees are included in Shareholder servicing costs in the Statement of Operations.
The fund compensatesThe Bank of NewYork Mellon under a custody agreement for providing custodial services for the fund. During the period ended October 31, 2012, the fund was charged $5,096 pursuant to the custody agreement.
Prior to May 29, 2012, the fund compensated The Bank of NewYork Mellon under a cash management agreement for performing cash management services related to fund subscriptions and redemptions.
24
During the period ended October 31, 2012, the fund was charged $227 pursuant to the cash management agreement, which is included in Shareholder servicing costs in the Statement of Operations. These fees were partially offset by earnings credits of $8.
During the period ended October 31, 2012, the fund was charged $8,517 for services performed by the Chief Compliance Officer and his staff.
The components of “Due to The Dreyfus Corporation and affiliates” in the Statement of Assets and Liabilities consist of: Distribution Plan fees $75, Shareholder Services Plan fees $1,887, custodian fees $1,679, Chief Compliance Officer fees $2,654 and transfer agency fees $670.
(d) Each Board member also serves as a Board member of other funds within the Dreyfus complex. Annual retainer fees and attendance fees are allocated to each fund based on net assets.
(e) A 2% redemption fee is charged and retained by the fund on certain shares redeemed within sixty days following the date of issuance, subject to exceptions, including redemptions made through the use of the fund’s exchange privilege. During the period ended October 31, 2012, redemption fees charged and retained by the fund amounted to $187.
NOTE 4—Securities Transactions:
The aggregate amount of purchases and sales of investment securities, excluding short-term securities, during the period ended October 31, 2012, amounted to $145,538,618 and $172,067,827, respectively.
At October 31, 2012, the cost of investments for federal income tax purposes was $436,705,299; accordingly, accumulated net unrealized appreciation on investments was $34,876,735, consisting of $49,229,624 gross unrealized appreciation and $14,352,889 gross unrealized depreciation.
The Fund 25
REPORT OF INDEPENDENT REGISTERED
PUBLIC ACCOUNTING FIRM
Shareholders and Board of Directors
Dreyfus Diversified International Fund
We have audited the accompanying statement of assets and liabilities, including the statement of investments, of Dreyfus Diversified International Fund (one of the series comprising Dreyfus Premier Investment Funds, Inc.) as of October 31, 2012, and the related statement of operations for the year then ended, the statement of changes in net assets for each of the two years in the period then ended, and the financial highlights for each of the periods indicated therein. These financial statements and financial highlights are the responsibility of the Fund’s management. Our responsibility is to express an opinion on these financial statements and financial highlights based on our audits.
We conducted our audits in accordance with the standards of the Public Company Accounting Oversight Board (United States).Those standards require that we plan and perform the audit to obtain reasonable assurance about whether the financial statements and financial highlights are free of material misstatement.We were not engaged to perform an audit of the Fund’s internal control over financial reporting. Our audits included consideration of internal control over financial reporting as a basis for designing audit procedures that are appropriate in the circumstances, but not for the purpose of expressing an opinion on the effectiveness of the Fund’s internal control over financial reporting. Accordingly, we express no such opinion.An audit also includes examining, on a test basis, evidence supporting the amounts and disclosures in the financial statements and financial highlights, assessing the accounting principles used and significant estimates made by management, and evaluating the overall financial statement presentation. Our procedures included confirmation of securities owned as of October 31, 2012 by correspondence with the custodian and others.We believe that our audits provide a reasonable basis for our opinion.
In our opinion, the financial statements and financial highlights referred to above present fairly, in all material respects, the financial position of Dreyfus Diversified International Fund at October 31, 2012, the results of its operations for the year then ended, the changes in its net assets for each of the two years in the period then ended, and the financial highlights for each of the indicated periods, in conformity with U. S. generally accepted accounting principles.

New York, New York
December 27, 2012
26
IMPORTANT TAX INFORMATION (Unaudited)
In accordance with federal tax law, the fund elects to provide each shareholder with their portion of the fund’s foreign taxes paid and the income sourced from foreign countries. Accordingly, the fund hereby reports the following information regarding its fiscal year ended October 31, 2012:
—the total amount of taxes paid to foreign countries was $1,287,547.
—the total amount of income sourced from foreign countries was $9,355,230.
For federal tax purposes, the fund hereby reports 98.22% of the ordinary dividends paid during the fiscal year ended October 31, 2012 as qualifying for the corporate dividends received deduction. Also certain dividends paid by the fund may be subject to a maximum tax rate of 15%, as provided for by the Jobs and Growth Tax Relief Reconciliation Act of 2003. Of the distributions paid during the fiscal year, $9,355,230 represents the maximum amount that may be considered qualified dividend income. Shareholders will receive notification in early 2013 of the percentage applicable to the preparation of their 2012 income tax returns.
The Fund 27
PROXY RESULTS (Unaudited)
The Company held a special meeting of shareholders on August 3, 2012.The proposal considered at the meeting, and the results, are as follows:
| Shares | |||
| Votes For | Authority Withheld | ||
| To elect additional Board Members: | |||
| Peggy C. Davis† | 125,042,328 | 610,092 | |
| Ehud Houminer† | 125,002,253 | 650,167 | |
| Martin Peretz† | 125,018,821 | 633,599 |
† Each new Board Member’s term commenced on September 1, 2012.
In addition, Joseph S. DiMartino, David P. Feldman, Lynn Martin, Robin A. Melvin and Philip L.Toia continue as Board Members of the Company.
28
INFORMATION ABOUT THE RENEWAL OF THE
FUND’S MANAGEMENT AGREEMENT (Unaudited)
At a meeting of the fund’s Board of Directors held on June 28, 2012, the Board considered the renewal of the fund’s Management Agreement pursuant to which Dreyfus provides the fund with investment advisory and administrative services (the “Agreement”). The Board members, none of whom are “interested persons” (as defined in the Investment Company Act of 1940, as amended) of the fund, were assisted in their review by independent legal counsel and met with counsel in executive session separate from Dreyfus representatives. In considering the renewal of the Agreement, the Board considered all factors that it believed to be relevant, including those discussed below.The Board did not identify any one factor as dispositive, and each Board member may have attributed different weights to the factors considered.
Analysis of Nature, Extent, and Quality of Services Provided to the Fund.The Board considered information previously provided to them in presentations from Dreyfus representatives regarding the nature, extent, and quality of the services provided to funds in the Dreyfus fund complex, and Dreyfus representatives confirmed that there had been no material changes in this information. Dreyfus provided the number of open accounts in the fund, the fund’s asset size and the allocation of fund assets among distribution channels. Dreyfus also had previously provided information regarding the diverse intermediary relationships and distribution channels of funds in the Dreyfus fund complex (such as retail direct or intermediary, in which intermediaries typically are paid by the fund and/or Dreyfus) and Dreyfus’ corresponding need for broad, deep, and diverse resources to be able to provide ongoing shareholder services to each intermediary or distribution channel, as applicable to the fund.
The Board also considered research support available to, and portfolio management capabilities of, the fund’s portfolio management personnel and that Dreyfus also provides oversight of day-to-day fund operations, including fund accounting and administration and assistance in meeting legal and regulatory requirements.The Board also considered Dreyfus’ extensive administrative, accounting, and compliance infrastructures.
The Fund 29
INFORMATION ABOUT THE RENEWAL OF THE FUND’S
MANAGEMENT AGREEMENT (Unaudited) (continued)
The Board also considered portfolio management’s brokerage policies and practices (including policies and practices regarding soft dollars) and the standards applied in seeking best execution.
Comparative Analysis of the Fund’s Performance and Management Fee and Expense Ratio.The Board reviewed reports prepared by Lipper, Inc. (“Lipper”), an independent provider of investment company data, which included information comparing (1) the fund’s performance with the performance of a group of comparable funds (the “Performance Group”) and with a broader group of funds (the “Performance Universe”), all for various periods ended May 31, 2012, and (2) the fund’s actual and contractual management fees and total expenses with those of a group of comparable funds (the “Expense Group”) and with a broader group of funds (the “Expense Universe”), the information for which was derived in part from fund financial statements available to Lipper as of the date of its analysis. Dreyfus previously had furnished the Board with a description of the methodology Lipper used to select the Performance Group and Performance Universe and the Expense Group and Expense Universe.
Dreyfus representatives stated that the usefulness of performance comparisons may be affected by a number of factors, including different investment limitations that may be applicable to the fund and comparison funds. The Board discussed the results of the comparisons and noted that the fund’s total return performance was below the Performance Group medians and variously above and below the Performance Universe medians.The Board noted that the fund ranked in the fourth quartile of the Performance Group for all periods. Dreyfus also provided a comparison of the fund’s calendar year total returns to the returns of the fund’s benchmark index, and it was noted that the fund’s return was above the return of the benchmark index in three of the four calendar years.
The Board also reviewed the range of actual and contractual management fees and total expenses of the Expense Group and Expense Universe funds and discussed the results of the comparisons. The
30
Board noted that, like the other funds in the Expense Group, the fund’s advisory fees are paid only at the underlying funds’ level.They further noted that the fund’s total expense ratio was below the Expense Group and Expense Universe medians.
Dreyfus representatives noted that Dreyfus has contractually agreed, until March 1, 2013, to assume the expenses of the fund so that the total annual fund and underlying funds operating expenses of none of the classes (excluding Rule 12b-1 Distribution Plan fees, Shareholder Services Plan fees, taxes, interest expense, brokerage commissions, commitment fees on borrowings and extraordinary expenses) exceed 1.20% of the fund’s average daily net assets.
Dreyfus representatives reviewed with the Board the management or investment advisory fees (1) paid by funds advised or administered by Dreyfus that are in the same Lipper category as the fund and (2) paid to Dreyfus or the Dreyfus-affiliated primary employer of the fund’s primary portfolio manager(s) for advising any separate accounts and/or other types of client portfolios that are considered to have similar investment strategies and policies as the fund (the “Similar Clients”), and explained the nature of the Similar Clients.They discussed differences in fees paid and the relationship of the fees paid in light of any differences in the services provided and other relevant factors. The Board considered the relevance of the fee information provided for the Similar Clients to evaluate the appropriateness and reasonableness of the fund’s management fee.
Analysis of Profitability and Economies of Scale. Dreyfus does not receive direct profits from the fund’s management fee, as the fund pays no direct management fee. As such, the Board did not consider an evaluation of profitability or economies of scale to be relevant. The Board also considered potential benefits to Dreyfus from acting as investment adviser and noted that there were no soft dollar arrangements in effect for trading the fund’s investments.
The Fund 31
INFORMATION ABOUT THE RENEWAL OF THE FUND’S
MANAGEMENT AGREEMENT (Unaudited) (continued)
At a special Board meeting held on April 23, 2012, the Board approved consolidating the fund’s Board with the boards of certain other funds in The Dreyfus Family of Funds, effective September 1, 2012, subject to the election of the new Board members by shareholders of the fund (the “Board Consolidation”). It was noted that, to align the renewal dates of the Management Agreements of the funds involved in the Board Consolidation, management recommended changing the fund’s Management Agreement renewal date to March 30th, subject to shareholder election of the new Board members for the fund.
At the conclusion of these discussions, the Board agreed that it had been furnished with sufficient information to make an informed business decision with respect to the renewal of the Agreement. Based on the discussions and considerations as described above, the Board concluded and determined as follows.
The Board concluded that the nature, extent and quality of the services provided by Dreyfus are adequate and appropriate.
The Board noted Dreyfus’ efforts to improve, and agreed to closely monitor, performance.
As described above, the Board did not consider profitability or economies of scale to be relevant since the fund does not pay a direct management fee.
In evaluating the Agreement, the Board considered these conclusions and determinations and also relied on its previous knowledge, gained through meetings and other interactions with Dreyfus and its affiliates, of the fund and the services provided to the fund by Dreyfus.The Board also relied on information received on a routine and regular basis
32
throughout the year relating to the operations of the fund and the investment management and other services provided under the Agreement, including information on the investment performance of the fund in comparison to similar mutual funds and benchmark performance indices; general market outlook as applicable to the fund; and compliance reports. In addition, it should be noted that the Board’s consideration of the contractual fee arrangements for this fund had the benefit of a number of years of reviews of prior or similar agreements during which lengthy discussions took place between the Board and Dreyfus representatives. Certain aspects of the arrangements may receive greater scrutiny in some years than in others, and the Board’s conclusions may be based, in part, on their consideration of the same or similar arrangements in prior years.The Board determined that renewal of the Agreement through March 30, 2013, subject to shareholder approval of the Board Consolidation as described above, was in the best interests of the fund and its shareholders.
The Fund 33
BOARD MEMBERS INFORMATION (Unaudited)
| Joseph S. DiMartino (69) |
| Chairman of the Board (1995) |
| Principal Occupation During Past 5Years: |
| • Corporate Director and Trustee |
| Other Public Company Board Memberships During Past 5Years: |
| • CBIZ (formerly, Century Business Services, Inc.), a provider of outsourcing functions for small |
| and medium size companies, Director (1997-present) |
| • Sunair Services Corporation, a provider of certain outdoor-related services to homes and |
| businesses, Director (2005-2009) |
| • The Newark Group, a provider of a national market of paper recovery facilities, paperboard |
| mills and paperboard converting plants, Director (2000-2010) |
| No. of Portfolios for which Board Member Serves: 157 |
| ——————— |
| Peggy C. Davis (69) |
| Board Member (2012) |
| Principal Occupation During Past 5Years: |
| • Shad Professor of Law, New York University School of Law (1983-present) |
| No. of Portfolios for which Board Member Serves: 63 |
| ——————— |
| David P. Feldman (72) |
| Board Member (1991) |
| Principal Occupation During Past 5Years: |
| • Corporate Director and Trustee |
| Other Public Company Board Memberships During Past 5Years: |
| • BBH Mutual Funds Group (4 registered mutual funds), Director (1992-present) |
| • QMed, Inc. a healthcare company, Director (1999-2007) |
| No. of Portfolios for which Board Member Serves: 46 |
| ——————— |
| Ehud Houminer (72) |
| Board Member (2012) |
| Principal Occupation During Past 5Years: |
| • Executive-in-Residence at the Columbia Business School, Columbia University (1992-present) |
| Other Public Company Board Memberships During Past 5Years: |
| • Avnet Inc., an electronics distributor, Director (1993-2012) |
| No. of Portfolios for which Board Member Serves: 73 |
34
| Lynn Martin (72) |
| Board Member (1993) |
| Principal Occupation During Past 5Years: |
| • President of The Martin Hall Group LLC, a human resources consulting firm, from January |
| 2005-present |
| Other Public Company Board Memberships During Past 5Years: |
| • AT&T Inc., a telecommunications company, Director (1999-2012) |
| • Ryder System, Inc., a supply chain and transportation management company, Director (1993-2012) |
| • The Proctor & Gamble Co., a consumer products company, Director (1994-2009) |
| • Constellation Energy Group Inc., Director (2003-2009) |
| No. of Portfolios for which Board Member Serves: 46 |
| ——————— |
| Robin A. Melvin (49) |
| Board Member (2011) |
| Principal Occupation During Past 5Years: |
| • Director, Boisi Family Foundation, a private family foundation that supports youth-serving orga- |
| nizations that promote the self sufficiency of youth from disadvantaged circumstances (1995-2012) |
| No. of Portfolios for which Board Member Serves: 83 |
| ——————— |
| Dr. Martin Peretz (73) |
| Board Member (2012) |
| Principal Occupation During Past 5Years: |
| • Editor-in-Chief Emeritus of The New Republic Magazine (2010-present) (previously, |
| Editor-in-Chief, 1974-2010) |
| • Director of TheStreet.com, a financial information service on the web (1996-present) |
| No. of Portfolios for which Board Member Serves: 46 |
| ——————— |
| Philip L. Toia (79) |
| Board Member (1997) |
| Principal Occupation During Past 5Years: |
| • Private Investor |
| No. of Portfolios for which Board Member Serves: 56 |
| ——————— |
| Once elected all Board Members serve for an indefinite term, but achieve Emeritus status upon reaching age 80.The |
| address of the Board Members and Officers is c/o The Dreyfus Corporation, 200 Park Avenue, NewYork, NewYork |
| 10166.Additional information about the Board Members is available in the fund’s Statement of Additional Information |
| which can be obtained from Dreyfus free of charge by calling this toll free number: 1-800-DREYFUS. |
| Daniel Rose, Emeritus Board Member |
| Sander Vanocur, Emeritus Board Member |
The Fund 35
OFFICERS OF THE FUND (Unaudited)

36

The Fund 37
Dreyfus
Emerging Asia Fund
ANNUAL REPORT October 31, 2012
Save time. Save paper. View your next shareholder report online as soon as it’s available. Log into www.dreyfus.com and sign up for Dreyfus eCommunications. It’s simple and only takes a few minutes.
The views expressed in this report reflect those of the portfolio manager only through the end of the period covered and do not necessarily represent the views of Dreyfus or any other person in the Dreyfus organization. Any such views are subject to change at any time based upon market or other conditions and Dreyfus disclaims any responsibility to update such views.These views may not be relied on as investment advice and, because investment decisions for a Dreyfus fund are based on numerous factors, may not be relied on as an indication of trading intent on behalf of any Dreyfus fund.

Contents | |
THE FUND | |
| 2 | A Letter from the Chairman and CEO |
| 3 | Discussion of Fund Performance |
| 6 | Fund Performance |
| 8 | Understanding Your Fund’s Expenses |
| 8 | Comparing Your Fund’s Expenses With Those of Other Funds |
| 9 | Statement of Investments |
| 12 | Statement of Assets and Liabilities |
| 13 | Statement of Operations |
| 14 | Statement of Changes in Net Assets |
| 15 | Financial Highlights |
| 18 | Notes to Financial Statements |
| 31 | Report of Independent Registered Public Accounting Firm |
| 32 | Important Tax Information |
| 33 | Proxy Results |
| 34 | Information About the Renewal of the Fund’s Management and Sub-Investment Advisory Agreements |
| 39 | Board Members Information |
| 41 | Officers of the Fund |
FOR MORE INFORMATION | |
Back Cover |
Dreyfus
Emerging Asia Fund
The Fund
A LETTER FROM THE CHAIRMAN AND CEO

Dear Shareholder:
We are pleased to present this annual report for Dreyfus Emerging Asia Fund, covering the 12-month period from November 1, 2011, through October 31, 2012. For information about how the fund performed during the reporting period, as well as general market perspectives, we provide a Discussion of Fund Performance on the pages that follow.
Despite pronounced stock market weakness during the spring of 2012, stocks generally advanced over the reporting period as investors responded to encouraging macroeconomic developments throughout the world. Employment gains in the United States, credible measures to prevent a more severe banking crisis in Europe, and the likelihood of a “soft landing” for China’s economy buoyed investor sentiment, as did aggressively accommodative monetary policies from central banks in the United States, Europe, Japan and China. Consequently, U.S. stocks across all capitalization ranges posted double-digit returns, on average, for the reporting period.
In light of the easy monetary policies adopted by many countries, we expect global growth to be slightly more robust in 2013 than in 2012.The U.S. economic recovery is likely to persist at subpar levels over the first half of the new year, as growth may remain constrained by uncertainties surrounding fiscal policy and tax reforms. However, successful resolution of the current fiscal debate may prompt corporate decision-makers to increase capital spending, which could have positive implications for the U.S. economy and domestic equity markets.As always, we encourage you to stay in touch with your financial advisor as new developments unfold.
Thank you for your continued confidence and support.

Jonathan R. Baum
Chairman and Chief Executive Officer
The Dreyfus Corporation
November 15, 2012
2
DISCUSSION OF FUND PERFORMANCE
For the period of November 1, 2011, through October 31, 2012, as provided by Hugh Simon, Raymond Chan and Abhijit Sarkar, Portfolio Managers of Hamon Asian Advisors LTD, Sub-Investment Adviser
Fund and Market Performance Overview
For the 12-month period ended October 31, 2012, Dreyfus Emerging Asia Fund’s Class A shares produced a total return of –1.90%, Class C shares returned –2.69% and Class I shares returned –2.12%.1 In comparison, the fund’s benchmark, the MSCI Emerging Markets Asia Index (the “Index”), produced a total return of 4.68% for the same period.2
Improving economic sentiment in the midst of accommodative policy initiatives in China and other Asian countries sent stocks higher over the reporting period.The fund produced lower returns than its benchmark, largely due to its overweighted exposure to small- and midcap stocks at a time when large-cap stocks fared better, as well as the weighting in the Chinese and Indian markets.
The Fund’s Investment Approach
The fund, which seeks long-term capital appreciation, normally invests at least 80% of its net assets in stocks of companies that are located or principally traded in Asian emerging market countries or other investments that are tied economically to Asian emerging markets. The fund may invest in the stocks of companies of any market capitalization. To determine where the fund will invest, we analyze several factors, including economic, demographic and political trends in Asian emerging market countries, the current financial condition and future prospects of individual companies and sectors in the Asian emerging markets, and the valuation of one market or company relative to that of another.
Accommodative Policies Drove Asian Equities Higher
The reporting period began in the wake of major stock market declines in Asia stemming from global economic weakness and inflation-fighting measures in China that threatened to derail the region’s economic growth.
Macroeconomic conditions appeared to improve in 2012, as Chinese policymakers felt more comfortable reducing short-term interest rates and injecting liquidity into the
The Fund 3
DISCUSSION OF FUND PERFORMANCE (continued)
local banking system. Although these stimulative measures took some time to have a significant impact on economic data, China began to post evidence of sustainable improvement during the third quarter of the year. In response, investment capital flowed back into emerging Asian equity markets, sparking rallies that erased previous losses and enabled the Index to produce a positive absolute return for the reporting period overall. However, the rebound was concentrated primarily among certain individual markets and large-cap stocks that comprise most of the benchmark, while small- and midcap stocks ended the reporting period with lower returns.
Small- and Midcap Focus Affected Relative Performance
An emphasis on smaller stocks helped the fund produce impressive results in previous reporting periods, but it proved counterproductive over the past year when cautious investors mainly focused on large, dividend-paying stocks. Consequently, some of the fund’s holdings remained out of favor. For example, Korean chemicals producer LG Chem lost value during the economic slowdown, but we believe the company is poised to advance as the regional economy improves. In India, industrial and building service consultancy SREI Infrastructure and financial services provider IFCI lost value early in the reporting period, when interest rates rose in response to central banks’ inflation-fighting policies. From an industry group perspective, the fund’s relative performance was hampered by disappointments in the information technology, materials and consumer discretionary sectors.
The fund achieved better results compared to its benchmark in the industrials sector, where China State Construction International Holdings advanced when the Chinese government made affordable housing a policy priority. Among consumer staples stocks, Indian beverages producer United Spirits received an acquisition offer from global giant Diageo at a premium to its stock price at the time. In other areas, Security Bank in the Philippines responded positively to its focus on a growing middle class of consumers, and luxury carmaker Brilliance China Automotive Holdings, a joint venture with Germany’s Bayerische Motoren Werke, gained value as higher end Chinese consumers flocked to the iconic BMW brand.
Emerging Asia Appears Poised for Growth
As of the reporting period’s end, we are optimistic regarding the region’s economic prospects.The recent adoption of policies designed to stimulate growth and promote
4
market liquidity in China are expected to produce encouraging results over the months ahead, and India has launched a number of tax and regulatory reforms that seem likely to boost foreign investment and drive its stock market higher. What’s more, equity valuations generally have declined to attractive levels and could rise as economic uncertainty wanes.
Therefore, we have retained the fund’s relatively constructive investment posture, including overweighted exposure to China and India. As of the reporting period’s end, we have favored interest rate-sensitive stocks that we believe will respond positively to lower rates, as well as consumer discretionary companies that are positioned to serve an expanding middle class. In contrast, we have identified relatively few stocks meeting our investment criteria in the utilities, telecommunications services and energy sectors.
November 15, 2012
Please note, the position in any security highlighted with italicized typeface was sold during the reporting period. Emerging markets tend to be more volatile than the markets of more mature economies, and generally have less diverse and less mature economic structures and less stable political systems than those of developed countries.The securities of companies located in emerging markets are often subject to rapid and large changes in price.An investment in this fund should be considered only as a supplement to a complete investment program for those investors willing to accept the greater risks associated with investing in emerging market countries.
Equity funds are subject generally to market, market sector, market liquidity, issuer and investment style risks, among other factors, to varying degrees, all of which are more fully described in the fund’s prospectus.
The fund’s performance will be influenced by political, social and economic factors affecting investments in foreign companies. Special risks associated with investments in foreign companies include exposure to currency fluctuations, less liquidity, less developed or less efficient trading markets, lack of comprehensive company information, political instability and differing auditing and legal standards.These risks are enhanced in emerging market countries.
| 1 Total return includes reinvestment of dividends and any capital gains paid, and does not take into consideration the |
| maximum initial sales charge in the case of Class A shares, or the applicable contingent deferred sales charge imposed |
| on redemptions in the case of Class C shares. Had these charges been reflected, returns would have been lower. Past |
| performance is no guarantee of future results. Share price and investment return fluctuate such that upon redemption, |
| fund shares may be worth more or less than their original cost. Return figures provided reflect an undertaking for the |
| absorption of certain fund expenses by The Dreyfus Corporation through July 31, 2013, at which time it may be |
| extended, terminated or modified. Had these expenses not been absorbed, the fund’s returns would have been lower. |
| 2 SOURCE: FACTSET – Reflects reinvestment of dividends and, where applicable, capital gain distributions.The |
| MSCI Emerging Markets Asia Index is a free-float adjusted market capitalization-weighted index designed to measure |
| equity market performance in the emerging market countries of Asia. Investors cannot invest directly in any index. |
The Fund 5
FUND PERFORMANCE
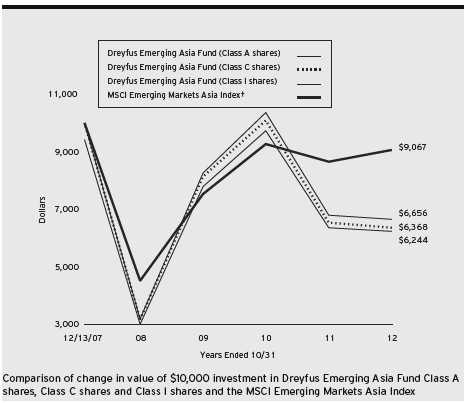
† Source: FactSet
Past performance is not predictive of future performance.
The above graph compares a $10,000 investment made in each of the Class A, Class C and Class I shares of Dreyfus Emerging Asia Fund on 12/13/07 (inception date) to a $10,000 investment made in the MSCI Emerging Markets Asia Index (the “Index”) on that date.All dividends and capital gain distributions are reinvested.
The fund’s performance shown in the line graph above takes into account the maximum initial sales charge on Class A shares and all other applicable fees and expenses on all classes.The Index is a free-float adjusted market capitalization weighted index designed to measure equity market performance in the emerging market countries of Asia. Unlike a mutual fund, the Index is not subject to charges, fees and other expenses. Investors cannot invest directly in any index. Further information relating to fund performance, including expense reimbursements, if applicable, is contained in the Financial Highlights section of the prospectus and elsewhere in this report.
6
| Average Annual Total Returns as of 10/31/12 | |||||
| Inception | From | ||||
| Date | 1 | Year | Inception | ||
| Class A shares | |||||
| with maximum sales charge (5.75%) | 12/13/07 | –7.49 | % | –9.20 | % |
| without sales charge | 12/13/07 | –1.90 | % | –8.09 | % |
| Class C shares | |||||
| with applicable redemption charge † | 12/13/07 | –3.66 | % | –8.83 | % |
| without redemption | 12/13/07 | –2.69 | % | –8.83 | % |
| Class I shares | 12/13/07 | –2.12 | % | –8.00 | % |
| MSCI Emerging Markets Asia Index | 11/30/07 | 4.68 | % | –1.97 | %†† |
Past performance is not predictive of future performance.The fund’s performance shown in the graph and table does not reflect the deduction of taxes that a shareholder would pay on fund distributions or the redemption of fund shares.
| † | The maximum contingent deferred sales charge for Class C shares is 1% for shares redeemed within one year of the |
| date of purchase. | |
| †† | For comparative purposes, the value of the Index as of 11/30/07 is used as the beginning value on 12/13/07. |
The Fund 7
UNDERSTANDING YOUR FUND’S EXPENSES (Unaudited)
As a mutual fund investor, you pay ongoing expenses, such as management fees and other expenses. Using the information below, you can estimate how these expenses affect your investment and compare them with the expenses of other funds.You also may pay one-time transaction expenses, including sales charges (loads) and redemption fees, which are not shown in this section and would have resulted in higher total expenses. For more information, see your fund’s prospectus or talk to your financial adviser.
Review your fund’s expenses
The table below shows the expenses you would have paid on a $1,000 investment in Dreyfus Emerging Asia Fund from May 1, 2012 to October 31, 2012. It also shows how much a $1,000 investment would be worth at the close of the period, assuming actual returns and expenses.
Expenses and Value of a $1,000 Investment
assuming actual returns for the six months ended October 31, 2012
| Class A | Class C | Class I | ||||
| Expenses paid per $1,000† | $ | 9.50 | $ | 13.22 | $ | 8.26 |
| Ending value (after expenses) | $ | 989.20 | $ | 985.10 | $ | 990.50 |
COMPARING YOUR FUND’S EXPENSES
WITH THOSE OF OTHER FUNDS (Unaudited)
Using the SEC’s method to compare expenses
The Securities and Exchange Commission (SEC) has established guidelines to help investors assess fund expenses. Per these guidelines, the table below shows your fund’s expenses based on a $1,000 investment, assuming a hypothetical 5% annualized return. You can use this information to compare the ongoing expenses (but not transaction expenses or total cost) of investing in the fund with those of other funds.All mutual fund shareholder reports will provide this information to help you make this comparison. Please note that you cannot use this information to estimate your actual ending account balance and expenses paid during the period.
Expenses and Value of a $1,000 Investment
assuming a hypothetical 5% annualized return for the six months ended October 31, 2012
| Class A | Class C | Class I | ||||
| Expenses paid per $1,000† | $ | 9.63 | $ | 13.40 | $ | 8.36 |
| Ending value (after expenses) | $ | 1,015.58 | $ | 1,011.81 | $ | 1,016.84 |
| † Expenses are equal to the fund’s annualized expense ratio of 1.90% for Class A, 2.65% for Class C and 1.65% |
| for Class I, multiplied by the average account value over the period, multiplied by 184/366 (to reflect the one-half |
| year period). |
8
STATEMENT OF INVESTMENTS
October 31, 2012
| Common Stocks—94.8% | Shares | Value ($) | |
| China—23.2% | |||
| Anhui Conch Cement, Cl. H | 220,000 | 760,769 | |
| China Medical System Holdings | 1,871,500 | 1,079,426 | |
| China ZhengTong Auto Services Holdings | 1,183,500 | a | 801,721 |
| CITIC Securities, Cl. H | 607,000 | 1,138,803 | |
| Dongyue Group | 1,632,000 | 932,866 | |
| Evergrande Real Estate Group | 2,189,000 | 957,505 | |
| Haitong Securities, Cl. H | 310,000 | a | 397,597 |
| Intime Department Store Group | 522,000 | 618,313 | |
| New China Life Insurance, Cl. H | 106,000 | 351,507 | |
| Spreadtrum Communications, ADR | 37,000 | 852,850 | |
| Zhuzhou CSR Times Electric, Cl. H | 204,000 | 600,151 | |
| 8,491,508 | |||
| Hong Kong—11.8% | |||
| Belle International Holdings | 211,000 | 393,138 | |
| Brilliance China Automotive Holdings | 964,000 | a | 1,204,059 |
| China Resources Land | 176,000 | 401,959 | |
| China State Construction International Holdings | 936,000 | 1,114,739 | |
| Nine Dragons Paper Holdings | 1,036,000 | 729,874 | |
| Noble Group | 432,000 | 463,945 | |
| 4,307,714 | |||
| India—23.0% | |||
| Canara Bank | 103,000 | 767,594 | |
| Hexaware Technologies | 160,000 | 333,116 | |
| Hinduja Ventures | 148,126 | 1,297,187 | |
| Jain Irrigation Systems | 770,000 | 936,109 | |
| Manappuram Finance | 1,286,360 | 881,167 | |
| Reliance Capital | 76,000 | 539,608 | |
| Reliance Infrastructure | 81,000 | 706,934 | |
| Tata Motors | 205,000 | 970,792 | |
| Tulip Telecom | 957,447 | a | 664,758 |
| United Spirits | 41,000 | 896,101 | |
| Yes Bank | 52,631 | 402,694 | |
| 8,396,060 | |||
| Indonesia—1.5% | |||
| Bumi Serpong Damai | 4,240,000 | 547,382 |
The Fund 9
STATEMENT OF INVESTMENTS (continued)
| Common Stocks (continued) | Shares | Value ($) | |
| Philippines—6.1% | |||
| East West Banking | 456,000 | 263,449 | |
| Philippine Long Distance Telephone | 5,730 | 368,601 | |
| Puregold Price Club | 735,700 | 534,876 | |
| Security Bank | 108,400 | 426,022 | |
| Universal Robina | 369,920 | 645,643 | |
| 2,238,591 | |||
| Singapore—1.2% | |||
| Golden Agri-Resources | 833,000 | 426,812 | |
| South Korea—13.5% | |||
| Daum Communications | 3,400 | 292,114 | |
| GS Retail | 13,000 | 380,249 | |
| Himart | 11,000 | 755,456 | |
| Honam Petrochemical | 3,400 | 695,214 | |
| Hyundai Engineering & Construction | 6,720 | 404,827 | |
| Kia Motors | 6,500 | 361,177 | |
| Samsung Electronics | 1,250 | 1,501,467 | |
| SK Hynix | 24,000 | a | 546,855 |
| 4,937,359 | |||
| Taiwan—7.3% | |||
| Foxconn Technology | 175,300 | 609,087 | |
| Hon Hai Precision Industry | 335,600 | 1,019,006 | |
| MediaTek | 36,000 | 399,897 | |
| Pegatron | 515,000 | a | 650,526 |
| 2,678,516 | |||
| Thailand—7.2% | |||
| Advanced Info Service, NVDR | 54,000 | 347,961 | |
| Asian Property Development, NVDR | 2,550,000 | 723,817 | |
| Kasikornbank, NVDR | 65,400 | 381,944 | |
| Krung Thai Bank, NVDR | 620,000 | 366,134 | |
| Robinson Department Store, NVDR | 211,200 | 418,610 | |
| Supalai, NVDR | 599,300 | 375,418 | |
| 2,613,884 | |||
| Total Common Stocks | |||
| (cost $33,461,469) | 34,637,826 |
10
| Participation Notes—5.5% | Warrants | Value ($) | ||
| India | ||||
| Microsec Financial Services (5/5/14) | 800,000 | a | 566,480 | |
| Prime Focus (2/28/13) | 1,598,250 a,b,c | 1,427,704 | ||
| Total Participation Notes | ||||
| (cost $4,486,946) | 1,994,184 | |||
| Total Investments (cost $37,948,415) | 100.3 | % | 36,632,010 | |
| Liabilities, Less Cash and Receivables | (.3 | %) | (122,445 | ) |
| Net Assets | 100.0 | % | 36,509,565 | |
ADR—American Depository Receipts
NVDR—Non-Voting Depository Receipts
| a Non-income producing security. |
| b The valuation of this security has been determined in good faith by management under the direction of the Board of |
| Directors.At October 31, 2012, the value of this security amounted to $1,427,704 or 3.9% of net assets. |
| c Security exempt from registration pursuant to Rule 144A under the Securities Act of 1933.This security may be |
| resold in transactions exempt from registration, normally to qualified institutional buyers.At October 31, 2012, this |
| security was valued at $1,427,704 or 3.9% of net assets. |
| Portfolio Summary (Unaudited)† | |||
| Value (%) | Value (%) | ||
| Financial | 26.0 | Materials | 6.0 |
| Consumer Discretionary | 22.6 | Telecommunications | 3.8 |
| Information Technology | 19.5 | Health Care | 3.0 |
| Industrial | 9.6 | Utilities | 1.9 |
| Consumer Staples | 7.9 | 100.3 | |
| † Based on net assets. | |||
| See notes to financial statements. | |||
The Fund 11
STATEMENT OF ASSETS AND LIABILITIES
October 31, 2012
| Cost | Value | |||
| Assets ($): | ||||
| Investments in securities—See Statement of Investments | 37,948,415 | 36,632,010 | ||
| Cash denominated in foreign currencies | 77,789 | 78,120 | ||
| Receivable for investment securities sold | 936,878 | |||
| Dividends receivable | 8,175 | |||
| Receivable for shares of Common Stock subscribed | 1,906 | |||
| Prepaid expenses | 29,554 | |||
| 37,686,643 | ||||
| Liabilities ($): | ||||
| Due to The Dreyfus Corporation and affiliates—Note 3(c) | 31,632 | |||
| Cash overdraft due to Custodian | 95,457 | |||
| Payable for investment securities purchased | 886,528 | |||
| Payable for shares of Common Stock redeemed | 82,048 | |||
| Unrealized depreciation on forward foreign | ||||
| currency exchange contracts—Note 4 | 309 | |||
| Accrued expenses | 81,104 | |||
| 1,177,078 | ||||
| Net Assets ($) | 36,509,565 | |||
| Composition of Net Assets ($): | ||||
| Paid-in capital | 54,914,034 | |||
| Accumulated investment (loss)—net | (200,005 | ) | ||
| Accumulated net realized gain (loss) on investments | (16,886,219 | ) | ||
| Accumulated net unrealized appreciation (depreciation) | ||||
| on investments and foreign currency transactions | (1,318,245 | ) | ||
| Net Assets ($) | 36,509,565 | |||
| Net Asset Value Per Share | ||||
| Class A | Class C | Class I | ||
| Net Assets ($) | 20,869,615 | 8,524,908 | 7,115,042 | |
| Shares Outstanding | 2,520,452 | 1,070,534 | 854,726 | |
| Net Asset Value Per Share ($) | 8.28 | 7.96 | 8.32 | |
| See notes to financial statements. | ||||
12
| STATEMENT OF OPERATIONS | ||
| Year Ended October 31, 2012 | ||
| Investment Income ($): | ||
| Income: | ||
| Cash dividends (net of $88,278 foreign taxes withheld at source): | ||
| Unaffiliated issuers | 850,892 | |
| Affiliated issuers | 274 | |
| Total Income | 851,166 | |
| Expenses: | ||
| Management fee—Note 3(a) | 628,921 | |
| Shareholder servicing costs—Note 3(c) | 218,742 | |
| Custodian fees—Note 3(c) | 107,932 | |
| Distribution fees—Note 3(b) | 74,784 | |
| Auditing fees | 72,304 | |
| Prospectus and shareholders’ reports | 53,648 | |
| Registration fees | 42,569 | |
| Directors’ fees and expenses—Note 3(d) | 10,550 | |
| Legal fees | 5,700 | |
| Interest expense—Note 2 | 2,397 | |
| Loan commitment fees—Note 2 | 163 | |
| Miscellaneous | 18,997 | |
| Total Expenses | 1,236,707 | |
| Less—reduction in expenses due to undertaking—Note 3(a) | (235,663 | ) |
| Less—reduction in fees due to earnings credits—Note 3(c) | (83 | ) |
| Net Expenses | 1,000,961 | |
| Investment (Loss)—Net | (149,795 | ) |
| Realized and Unrealized Gain (Loss) on Investments—Note 4 ($): | ||
| Net realized gain (loss) on investments and foreign currency transactions | (12,129,285 | ) |
| Net realized gain (loss) on forward foreign currency exchange contracts | (179,819 | ) |
| Net Realized Gain (Loss) | (12,309,104 | ) |
| Net unrealized appreciation (depreciation) on | ||
| investments and foreign currency transactions | 9,727,664 | |
| Net unrealized appreciation (depreciation) on | ||
| forward foreign currency exchange contracts | 1,358 | |
| Net Unrealized Appreciation (Depreciation) | 9,729,022 | |
| Net Realized and Unrealized Gain (Loss) on Investments | (2,580,082 | ) |
| Net (Decrease) in Net Assets Resulting from Operations | (2,729,877 | ) |
| See notes to financial statements. | ||
The Fund 13
STATEMENT OF CHANGES IN NET ASSETS
| Year Ended October 31, | ||||
| 2012 | 2011 | |||
| Operations ($): | ||||
| Investment (loss)—net | (149,795 | ) | (904,858 | ) |
| Net realized gain (loss) on investments | (12,309,104 | ) | (4,243,454 | ) |
| Net unrealized appreciation | ||||
| (depreciation) on investments | 9,729,022 | (36,209,978 | ) | |
| Net Increase (Decrease) in Net Assets | ||||
| Resulting from Operations | (2,729,877 | ) | (41,358,290 | ) |
| Capital Stock Transactions ($): | ||||
| Net proceeds from shares sold: | ||||
| Class A Shares | 6,651,031 | 19,323,900 | ||
| Class C Shares | 917,692 | 4,601,691 | ||
| Class I Shares | 7,671,096 | 15,439,575 | ||
| Cost of shares redeemed: | ||||
| Class A Shares | (16,835,029 | ) | (47,585,139 | ) |
| Class C Shares | (4,634,784 | ) | (15,266,710 | ) |
| Class I Shares | (16,666,744 | ) | (25,248,631 | ) |
| Increase (Decrease) in Net Assets | ||||
| from Capital Stock Transactions | (22,896,738 | ) | (48,735,314 | ) |
| Total Increase (Decrease) in Net Assets | (25,626,615 | ) | (90,093,604 | ) |
| Net Assets ($): | ||||
| Beginning of Period | 62,136,180 | 152,229,784 | ||
| End of Period | 36,509,565 | 62,136,180 | ||
| Accumulated investment (loss)—net | (200,005 | ) | (143,842 | ) |
| Capital Share Transactions (Shares): | ||||
| Class A | ||||
| Shares sold | 840,371 | 1,645,828 | ||
| Shares redeemed | (2,112,104 | ) | (4,185,595 | ) |
| Net Increase (Decrease) in Shares Outstanding | (1,271,733 | ) | (2,539,767 | ) |
| Class C | ||||
| Shares sold | 121,721 | 386,837 | ||
| Shares redeemed | (599,289 | ) | (1,389,835 | ) |
| Net Increase (Decrease) in Shares Outstanding | (477,568 | ) | (1,002,998 | ) |
| Class I | ||||
| Shares sold | 940,521 | 1,346,404 | ||
| Shares redeemed | (2,141,531 | ) | (2,250,712 | ) |
| Net Increase (Decrease) in Shares Outstanding | (1,201,010 | ) | (904,308 | ) |
| See notes to financial statements. | ||||
14
FINANCIAL HIGHLIGHTS
The following tables describe the performance for each share class for the fiscal periods indicated.All information (except portfolio turnover rate) reflects financial results for a single fund share.Total return shows how much your investment in the fund would have increased (or decreased) during each period, assuming you had reinvested all dividends and distributions.These figures have been derived from the fund’s financial statements.
| Year Ended October 31, | ||||||||||
| Class A Shares | 2012 | 2011 | 2010 | 2009 | 2008 | a | ||||
| Per Share Data ($): | ||||||||||
| Net asset value, beginning of period | 8.44 | 12.90 | 10.34 | 4.01 | 12.50 | |||||
| Investment Operations: | ||||||||||
| Investment income (loss)—netb | (.02 | ) | (.09 | ) | (.02 | ) | (.02 | ) | .08 | |
| Net realized and unrealized | ||||||||||
| gain (loss) on investments | (.14 | ) | (4.38 | ) | 2.57 | 6.33 | (8.57 | ) | ||
| Total from Investment Operations | (.16 | ) | (4.47 | ) | 2.55 | 6.31 | (8.49 | ) | ||
| Proceeds from redemption fees | .00 | c | .01 | .01 | .02 | — | ||||
| Net asset value, end of period | 8.28 | 8.44 | 12.90 | 10.34 | 4.01 | |||||
| Total Return (%)d | (1.90 | ) | (34.63 | ) | 24.86 | 158.50 | (68.00 | )e | ||
| Ratios/Supplemental Data (%): | ||||||||||
| Ratio of total expenses | �� | |||||||||
| to average net assets | 2.30 | 1.99 | 2.05 | 2.80 | 3.31 | f | ||||
| Ratio of net expenses | ||||||||||
| to average net assets | 1.92 | 1.99 | 1.95 | 2.00 | 2.00 | f | ||||
| Ratio of net investment income | ||||||||||
| (loss) to average net assets | (.28 | ) | (.77 | ) | (.17 | ) | (.29 | ) | 1.03 | f |
| Portfolio Turnover Rate | 187.30 | 131.78 | 75.72 | 100.74 | 217.53 | e | ||||
| Net Assets, end of period ($ x 1,000) | 20,870 | 32,000 | 81,709 | 58,548 | 5,528 | |||||
| a | From December 13, 2007 (commencement of operations) to October 31, 2008. |
| b | Based on average shares outstanding at each month end. |
| c | Amount represents less than $.01 per share. |
| d | Exclusive of sales charge. |
| e | Not annualized. |
| f | Annualized. |
See notes to financial statements.
The Fund 15
FINANCIAL HIGHLIGHTS (continued)
| Year Ended October 31, | ||||||||||
| Class C Shares | 2012 | 2011 | 2010 | 2009 | 2008 | a | ||||
| Per Share Data ($): | ||||||||||
| Net asset value, beginning of period | 8.18 | 12.61 | 10.18 | 3.98 | 12.50 | |||||
| Investment Operations: | ||||||||||
| Investment income (loss)—netb | (.08 | ) | (.17 | ) | (.09 | ) | (.08 | ) | .02 | |
| Net realized and unrealized | ||||||||||
| gain (loss) on investments | (.14 | ) | (4.27 | ) | 2.51 | 6.27 | (8.54 | ) | ||
| Total from Investment Operations | (.22 | ) | (4.44 | ) | 2.42 | 6.19 | (8.52 | ) | ||
| Proceeds from redemption fees | .00 | c | .01 | .01 | .01 | — | ||||
| Net asset value, end of period | 7.96 | 8.18 | 12.61 | 10.18 | 3.98 | |||||
| Total Return (%)d | (2.69 | ) | (35.13 | ) | 23.87 | 155.78 | (68.16 | )e | ||
| Ratios/Supplemental Data (%): | ||||||||||
| Ratio of total expenses | ||||||||||
| to average net assets | 3.12 | 2.75 | 2.77 | 3.71 | 4.08 | f | ||||
| Ratio of net expenses | ||||||||||
| to average net assets | 2.66 | 2.75 | 2.70 | 2.75 | 2.75 | f | ||||
| Ratio of net investment income | ||||||||||
| (loss) to average net assets | (1.00 | ) | (1.51 | ) | (.83 | ) | (.98 | ) | .31 | f |
| Portfolio Turnover Rate | 187.30 | 131.78 | 75.72 | 100.74 | 217.53 | e | ||||
| Net Assets, end of period ($ x 1,000) | 8,525 | 12,663 | 32,166 | 15,090 | 2,233 | |||||
| a | From December 13, 2007 (commencement of operations) to October 31, 2008. |
| b | Based on average shares outstanding at each month end. |
| c | Amount represents less than $.01 per share. |
| d | Exclusive of sales charge. |
| e | Not annualized. |
| f | Annualized. |
See notes to financial statements.
16
| Year Ended October 31, | |||||||||
| Class I Shares | 2012 | 2011 | 2010 | 2009 | 2008 | a | |||
| Per Share Data ($): | |||||||||
| Net asset value, beginning of period | 8.50 | 12.96 | 10.34 | 4.00 | 12.50 | ||||
| Investment Operations: | �� | ||||||||
| Investment income (loss)—netb | .01 | (.05 | ) | .01 | (.03 | ) | .02 | ||
| Net realized and unrealized | |||||||||
| gain (loss) on investments | (.19 | ) | (4.42 | ) | 2.60 | 6.35 | (8.52 | ) | |
| Total from Investment Operations | (.18 | ) | (4.47 | ) | 2.61 | 6.32 | (8.50 | ) | |
| Proceeds from redemption fees | .00 | c | .01 | .01 | .02 | — | |||
| Net asset value, end of period | 8.32 | 8.50 | 12.96 | 10.34 | 4.00 | ||||
| Total Return (%) | (2.12 | ) | (34.41 | ) | 25.34 | 158.50 | (68.00 | )d | |
| Ratios/Supplemental Data (%): | |||||||||
| Ratio of total expenses | |||||||||
| to average net assets | 2.28 | 1.72 | 1.74 | 2.05 | 2.86 | e | |||
| Ratio of net expenses | |||||||||
| to average net assets | 1.67 | 1.72 | 1.69 | 1.75 | 1.75 | e | |||
| Ratio of net investment income | |||||||||
| (loss) to average net assets | .14 | (.43 | ) | .13 | (.31 | ) | .29 | e | |
| Portfolio Turnover Rate | 187.30 | 131.78 | 75.72 | 100.74 | 217.53 | d | |||
| Net Assets, end of period ($ x 1,000) | 7,115 | 17,473 | 38,356 | 17,558 | 100 | ||||
| a | From December 13, 2007 (commencement of operations) to October 31, 2008. |
| b | Based on average shares outstanding at each month end. |
| c | Amount represents less than $.01 per share. |
| d | Not annualized. |
| e | Annualized. |
See notes to financial statements.
The Fund 17
NOTES TO FINANCIAL STATEMENTS
NOTE 1—Significant Accounting Policies:
Dreyfus Emerging Asia Fund (the “fund”) is a separate non-diversified series of Dreyfus Premier Investment Funds, Inc. (the “Company”), which is registered under the Investment Company Act of 1940, as amended (the “Act”), as an open-end management investment company and operates as a series company currently offering eight series, including the fund. The fund’s investment objective is to seek long-term capital appreciation. The Dreyfus Corporation (the “Manager” or “Dreyfus”), a wholly-owned subsidiary of The Bank of New York Mellon Corporation (“BNY Mellon”), serves as the fund’s investment adviser. Hamon Asian Advisors Ltd. (“Hamon”) serves as the fund’s sub-investment adviser. Effective November 4, 2011, Hamon U.S. Investment Advisors Ltd. changed the company’s name to Hamon Asian Advisors Ltd. Hamon is an affiliate of Dreyfus.
MBSC Securities Corporation (the “Distributor”), a wholly-owned subsidiary of Dreyfus, is the distributor of the fund’s shares.The fund is authorized to issue 800 million shares of $.001 par value Common Stock.The fund currently offers three classes of shares: Class A (300 million shares authorized), Class C (250 million shares authorized), and Class I (250 million shares authorized). Class A shares are subject to a sales charge imposed at the time of purchase. Class C shares are subject to a contingent deferred sales charge (“CDSC”) imposed on Class C shares redeemed within one year of purchase. Class I shares are sold at net asset value per share only to institutional investors. Other differences between the classes include the services offered to and the expenses borne by each class, the allocation of certain transfer agency costs and certain voting rights. Income, expenses (other than expenses attributable to a specific class) and realized and unrealized gains or losses on investments are allocated to each class of shares based on its relative net assets.
The Company accounts separately for the assets, liabilities and operations of each series. Expenses directly attributable to each series are
18
charged to that series’ operations; expenses which are applicable to all series are allocated among them on a pro rata basis.
The Financial Accounting Standards Board (“FASB”) Accounting Standards Codification is the exclusive reference of authoritative U.S. generally accepted accounting principles (“GAAP”) recognized by the FASB to be applied by nongovernmental entities. Rules and interpretive releases of the Securities and Exchange Commission (“SEC”) under authority of federal laws are also sources of authoritative GAAP for SEC registrants. The fund’s financial statements are prepared in accordance with GAAP, which may require the use of management estimates and assumptions.Actual results could differ from those estimates.
The Company enters into contracts that contain a variety of indemnifications.The fund’s maximum exposure under these arrangements is unknown.The fund does not anticipate recognizing any loss related to these arrangements.
(a) Portfolio valuation: The fair value of a financial instrument is the amount that would be received to sell an asset or paid to transfer a liability in an orderly transaction between market participants at the measurement date (i.e., the exit price). GAAP establishes a fair value hierarchy that prioritizes the inputs of valuation techniques used to measure fair value.This hierarchy gives the highest priority to unadjusted quoted prices in active markets for identical assets or liabilities (Level 1 measurements) and the lowest priority to unobservable inputs (Level 3 measurements).
Additionally, GAAP provides guidance on determining whether the volume and activity in a market has decreased significantly and whether such a decrease in activity results in transactions that are not orderly. GAAP requires enhanced disclosures around valuation inputs and techniques used during annual and interim periods.
The Fund 19
NOTES TO FINANCIAL STATEMENTS (continued)
Various inputs are used in determining the value of the fund’s investments relating to fair value measurements.These inputs are summarized in the three broad levels listed below:
Level 1—unadjusted quoted prices in active markets for identical investments.
Level 2—other significant observable inputs (including quoted prices for similar investments, interest rates, prepayment speeds, credit risk, etc.).
Level 3—significant unobservable inputs (including the fund’s own assumptions in determining the fair value of investments).
The inputs or methodology used for valuing securities are not necessarily an indication of the risk associated with investing in those securities.
Changes in valuation techniques may result in transfers in or out of an assigned level within the disclosure hierarchy. Valuation techniques used to value the fund’s investments are as follows:
Investments in securities are valued at the last sales price on the securities exchange or national securities market on which such securities are primarily traded. Securities listed on the National Market System for which market quotations are available are valued at the official closing price or, if there is no official closing price that day, at the last sales price. Securities not listed on an exchange or the national securities market, or securities for which there were no transactions, are valued at the average of the most recent bid and asked prices, except for open short positions, where the asked price is used for valuation purposes. Bid price is used when no asked price is available. Registered investment companies that are not traded on an exchange are valued at their net asset value.All of the preceding securities are categorized within Level 1 of the fair value hierarchy.
20
Fair valuing of securities may be determined with the assistance of a pricing service using calculations based on indices of domestic securities and other appropriate indicators, such as prices of relevant ADRs and financial futures. Utilizing these techniques may result in transfers between Level 1 and Level 2 of the fair value hierarchy.
When market quotations or official closing prices are not readily available, or are determined not to reflect accurately fair value, such as when the value of a security has been significantly affected by events after the close of the exchange or market on which the security is principally traded (for example, a foreign exchange or market), but before the fund calculates its net asset value, the fund may value these investments at fair value as determined in accordance with the procedures approved by the Company’s Board of Directors (the “Board”). Certain factors may be considered when fair valuing investments such as: fundamental analytical data, the nature and duration of restrictions on disposition, an evaluation of the forces that influence the market in which the securities are purchased and sold, and public trading in similar securities of the issuer or comparable issuers.These securities are either categorized as Level 2 or 3 depending on the relevant inputs used.
For restricted securities where observable inputs are limited, assumptions about market activity and risk are used and are categorized within Level 3 of the fair value hierarchy.
Investments denominated in foreign currencies are translated to U.S. dollars at the prevailing rates of exchange.
Forward foreign currency exchange contracts (“forward contracts”) are valued at the forward rate. These securities are generally categorized within Level 2 of the fair value hierarchy.
The Fund 21
NOTES TO FINANCIAL STATEMENTS (continued)
The following is a summary of the inputs used as of October 31, 2012 in valuing the fund’s investments:
| Level 2—Other | Level 3— | |||||
| Level 1— | Significant | Significant | ||||
| Unadjusted | Observable | Unobservable | ||||
| Quoted Prices | Inputs | Inputs | Total | |||
| Assets ($) | ||||||
| Investments in Securities: | ||||||
| Equity Securities— | ||||||
| Foreign Common | ||||||
| Stocks† | 34,637,826 | — | — | 34,637,826 | ||
| Participation Notes† | 566,480 | 1,427,704 | — | 1,994,184 | ||
| Liabilities ($) | ||||||
| Other Financial | ||||||
| Instruments: | ||||||
| Forward Foreign | ||||||
| Currency Exchange | ||||||
| Contracts†† | — | (309 | ) | — | (309 | ) |
| † | See Statement of Investments for additional detailed categorizations. |
| †† | Amount shown represents unrealized (depreciation) at period end. |
At October 31, 2011, $57,665,040 of exchange traded foreign equity securities were classified within Level 2 of the fair value hierarchy pursuant to the fund’s fair valuation procedures.
(b) Foreign currency transactions: The fund does not isolate that portion of the results of operations resulting from changes in foreign exchange rates on investments from the fluctuations arising from changes in the market prices of securities held. Such fluctuations are included with the net realized and unrealized gain or loss on investments.
Net realized foreign exchange gains or losses arise from sales of foreign currencies, currency gains or losses realized on securities transactions between trade and settlement date, and the difference between the amounts of dividends, interest and foreign withholding taxes recorded on the fund’s books and the U.S. dollar equivalent of the amounts actually received or paid. Net unrealized foreign exchange gains and losses arise from changes in the value of assets and liabilities other than investments resulting from changes in exchange rates. Foreign currency gains and losses on investments are also included with net realized and unrealized gain or loss on investments.
22
(c) Securities transactions and investment income: Securities transactions are recorded on a trade date basis. Realized gains and losses from securities transactions are recorded on the identified cost basis. Dividend income is recognized on the ex-dividend date and interest income, including, where applicable, accretion of discount and amortization of premium on investments, is recognized on the accrual basis.
(d) Affiliated issuers: Investments in other investment companies advised by Dreyfus are defined as “affiliated” in the Act. Investments in affiliated investment companies for the period ended October 31, 2012 were as follows:
| Affiliated | |||||||
| Investment | Value | Value | Net | ||||
| Company | 10/31/2011 | ($) | Purchases ($) | Sales ($) | 10/31/2012 | ($) | Assets (%) |
| Dreyfus | |||||||
| Institutional | |||||||
| Preferred | |||||||
| Plus Money | |||||||
| Market Fund | 1,104,000 | 30,007,000 | 31,111,000 | — | — |
(e) Risk: Investing in foreign markets may involve special risks and considerations not typically associated with investing in the U.S.These risks include revaluation of currencies, high rates of inflation, repatriation restrictions on income and capital, and adverse political and economic developments. Moreover, securities issued in these markets may be less liquid, subject to government ownership controls and delayed settlements, and their prices may be more volatile than those of comparable securities in the U.S.
The fund follows an investment policy of investing primarily in Asian emerging market countries. Because the fund’s investments are concentrated in Asian emerging market countries, the fund’s performance is expected to be closely tied to social, political and economic conditions within Asia and to be more volatile than the performance of more geographically diversified funds.
(f) Dividends to shareholders: Dividends are recorded on the ex-dividend date. Dividends from investment income-net and dividends from net realized capital gains, if any, are normally declared and paid annually,
The Fund 23
NOTES TO FINANCIAL STATEMENTS (continued)
but the fund may make distributions on a more frequent basis to comply with the distribution requirements of the Internal Revenue Code of 1986, as amended (the “Code”).To the extent that net realized capital gains can be offset by capital loss carryovers, it is the policy of the fund not to distribute such gains. Income and capital gain distributions are determined in accordance with income tax regulations, which may differ from GAAP.
(g) Federal income taxes: It is the policy of the fund to continue to qualify as a regulated investment company, if such qualification is in the best interests of its shareholders, by complying with the applicable provisions of the Code, and to make distributions of taxable income sufficient to relieve it from substantially all federal income and excise taxes.
As of and during the period ended October 31, 2012, the fund did not have any liabilities for any uncertain tax positions.The fund recognizes interest and penalties, if any, related to uncertain tax positions as income tax expense in the Statement of Operations. During the period, the fund did not incur any interest or penalties.
Each of the tax years in the four-year period ended October 31, 2012 remains subject to examination by the Internal Revenue Service and state taxing authorities.
At October 31, 2012, the components of accumulated earnings on a tax basis were as follows: accumulated capital losses $16,717,590 and unrealized depreciation $1,623,375. In addition, the fund deferred for tax purposes late year ordinary losses of $63,504 to the first day of the following fiscal year.
Under the Regulated Investment Company Modernization Act of 2010 (the “2010 Act”), the fund is permitted to carry forward capital losses incurred in taxable years beginning after December 22, 2010 (“post-enactment losses”) for an unlimited period. Furthermore, post-enactment capital loss carryovers retain their character as either short-term or long-term capital losses rather than short-term as they were under previous statute.The 2010 Act requires post-enactment losses to be utilized before the utilization of losses incurred in taxable years prior to the effective date
24
of the 2010 Act (“pre-enactment losses”).As a result of this ordering rule, pre-enactment losses may be more likely to expire unused.
The accumulated capital loss carryover is available for federal income tax purposes to be applied against future net realized capital gains, if any, realized subsequent to October 31, 2012. If not applied, $938,643 of the carryover expires in fiscal year 2016 and $3,614,006 expires in fiscal year 2019.The fund has $5,968,264 of post-enactment short-term capital losses and $6,196,677 of post-enactment long-term capital losses which can be carried forward for an unlimited period.
The fund has analyzed its tax positions with respect to applicable income tax issues for open tax years (in each respective jurisdiction) and determined no material tax liabilities existed.The fund operates in certain jurisdictions where the tax laws are evolving and, therefore, the application and interpretation of these laws and regulations is uncertain. In the future, the fund’s tax position in these jurisdictions may be subject to review from time to time which could result in tax liabilities.
During the period ended October 31, 2012, as a result of permanent book to tax differences, primarily due to the tax treatment for foreign currency gains and losses, passive foreign investment companies and net operating losses, the fund increased accumulated undistributed investment income-net by $93,632, increased accumulated net realized gain (loss) on investments by $132,789 and decreased paid-in capital by $226,421. Net assets and net asset value per share were not affected by this reclassification.
(h) New Accounting Pronouncement: In December 2011, FASB issued Accounting Standards Update No. 2011-11 “Disclosures about Offsetting Assets and Liabilities” (“ASU 2011-11”). These disclosure requirements are intended to help investors and other financial statement users to better assess the effect or potential effect of offsetting arrangements on a company’s financial position. They also improve transparency in the reporting of how companies mitigate credit risk, including disclosure of related collateral pledged or received. In addition, ASU 2011-11 facilitates comparison between those entities that
The Fund 25
NOTES TO FINANCIAL STATEMENTS (continued)
prepare their financial statements on the basis of GAAP and those entities that prepare their financial statements on the basis of International Financial Reporting Standards (“IFRS”).ASU 2011-11 requires entities to: disclose both gross and net information about both instruments and transactions eligible for offset in the financial statements; and disclose instruments and transactions subject to an agreement similar to a master netting agreement. ASU 2011-11 is effective for fiscal years beginning on or after January 1, 2013, and interim periods within those annual periods. At this time, management is evaluating the implications of ASU 2011-11 and its impact on the fund’s financial statement disclosures.
NOTE 2—Bank Lines of Credit:
The fund participates with other Dreyfus-managed funds in a $225 million unsecured credit facility led by Citibank, N.A. and a $300 million unsecured credit facility provided by The Bank of New York Mellon (each, a “Facility”), each to be utilized primarily for temporary or emergency purposes, including the financing of redemptions. Effective October 10, 2012, the $225 million unsecured credit facility with Citibank, N.A., was decreased to $210 million. In connection therewith, the fund has agreed to pay its pro rata portion of commitment fees for each Facility. Interest is charged to the fund based on rates determined pursuant to the terms of the respective Facility at the time of borrowing.
The average amount of borrowings outstanding under the Facilities during the period ended October 31, 2012, was approximately $201,900, with a related weighted average annualized interest rate of 1.19%.
NOTE 3—Management Fee, Sub-Investment Advisory Fee and Other Transactions with Affiliates:
(a) Pursuant to a management agreement with Dreyfus, the management fee is computed at the annual rate of 1.25% of the value of the fund’s average daily net assets and is payable monthly.
Dreyfus has contractually agreed, from December 9, 2011 through July 31, 2013, to waive receipt of its fees and/or assume the expenses of the fund so that the direct expenses of none of the classes (excluding Rule
26
12b-1 Distribution Plan fees, Shareholder Services Plan fees, taxes, interest expense, brokerage commissions, commitment fees on borrowings and extraordinary expenses) exceed 1.65% of the value of the fund’s average daily net assets. Dreyfus had contractually agreed, from November 1, 2011 through December 8, 2011, to waive receipt of its fees and/or assume the expenses of the fund so that the direct expenses of none of the classes (excluding certain expenses as described above) exceeded 1.75% of the value of the fund’s average daily net assets.The reduction in expenses, pursuant to the undertaking, amounted to $235,663 during the period ended October 31, 2012.
Pursuant to a sub-investment advisory agreement between Dreyfus and Hamon, Dreyfus pays Hamon a fee at the annual rate of .625% of the value of the fund’s average daily net assets and is payable monthly.
During the period ended October 31, 2012, the Distributor retained $6,111 from commissions earned on sales of the fund’s Class A shares and $3,657 from CDSCs on redemptions of the fund’s Class C shares.
(b) Under the Distribution Plan adopted pursuant to Rule 12b-1 under the Act, Class C shares pay the Distributor for distributing its shares at an annual rate of .75% of the value of the average daily net assets of Class C shares. During the period ended October 31, 2012, Class C shares were charged $74,784 pursuant to the Distribution Plan.
(c) Under the Shareholder Services Plan, Class A and Class C shares pay the Distributor at an annual rate of .25% of the value of their average daily net assets for the provision of certain services.The services provided may include personal services relating to shareholder accounts, such as answering shareholder inquiries regarding the fund and providing reports and other information, and services related to the maintenance of shareholder accounts.The Distributor may make payments to Service Agents (securities dealers, financial institutions or other industry professionals) in respect of these services. The Distributor determines the amounts to be paid to Service Agents. During the period ended October 31, 2012, Class A and Class C shares were charged $63,443 and $24,928, respectively, pursuant to the Shareholder Services Plan.
The Fund 27
NOTES TO FINANCIAL STATEMENTS (continued)
The fund has arrangements with the transfer agent and the custodian whereby the fund may receive earnings credits when positive cash balances are maintained, which are used to offset transfer agency and custody fees. For financial reporting purposes, the fund includes net earnings credits as an expense offset in the Statement of Operations.
The fund compensates DreyfusTransfer, Inc. (“DTI”), a wholly-owned subsidiary of Dreyfus, under a transfer agency agreement for providing transfer agency services for the fund and, since May 29, 2012, cash management services related to fund subscriptions and redemptions. During the period ended October 31, 2012, the fund was charged $23,641 for transfer agency services and $314 for cash management services. Cash management fees were partially offset by earnings credits of $36. These fees are included in Shareholder servicing costs in the Statement of Operations.
The fund compensates The Bank of New York Mellon under a custody agreement for providing custodial services for the fund. During the period ended October 31, 2012, the fund was charged $107,932 pursuant to the custody agreement.
Prior to May 29, 2012, the fund compensated The Bank of New York Mellon under a cash management agreement for performing cash management services related to fund subscriptions and redemptions. During the period ended October 31, 2012, the fund was charged $1,464 pursuant to the cash management agreement, which is included in Shareholder servicing costs in the Statement of Operations.These fees were partially offset by earnings credits of $47.
During the period ended October 31, 2012, the fund was charged $8,517 for services performed by the Chief Compliance Officer and his staff.
The components of “Due to The Dreyfus Corporation and affiliates” in the Statement of Assets and Liabilities consist of: management fees $39,670, Distribution Plan fees $5,505, Shareholder Services Plan fees $6,361, custodian fees $21,551, Chief Compliance Officer fees $2,654 and transfer agency fees $2,748, which are offset against an expense reimbursement currently in effect in the amount of $46,857.
28
(d) Each Board member also serves as a Board member of other funds within the Dreyfus complex. Annual retainer fees and attendance fees are allocated to each fund based on net assets.
(e) A 2% redemption fee is charged and retained by the fund on certain shares redeemed within sixty days following the date of issuance, subject to exceptions, including redemptions made through use of the fund’s exchange privilege. During the period ended October 31, 2012, redemption fees charged and retained by the fund amounted to $30,405.
NOTE 4—Securities Transactions:
The aggregate amount of purchases and sales of investment securities, excluding short-term securities and forward contracts, during the period ended October 31, 2012, amounted to $92,809,422 and $116,167,601, respectively.
Derivatives: A derivative is a financial instrument whose performance is derived from the performance of another asset. Each type of derivative instrument that was held by the fund during the period ended October 31, 2012 is discussed below.
Forward Foreign Currency Exchange Contracts: The fund enters into forward contracts in order to hedge its exposure to changes in foreign currency exchange rates on its foreign portfolio holdings, to settle foreign currency transactions or as a part of its investment strategy. When executing forward contracts, the fund is obligated to buy or sell a foreign currency at a specified rate on a certain date in the future. With respect to sales of forward contracts, the fund incurs a loss if the value of the contract increases between the date the forward contract is opened and the date the forward contract is closed.The fund realizes a gain if the value of the contract decreases between those dates.With respect to purchases of forward contracts, the fund incurs a loss if the value of the contract decreases between the date the forward contract is opened and the date the forward contract is closed.The fund realizes a gain if the value of the contract increases between those dates. Any realized or unrealized gains or losses which occurred during the period
The Fund 29
NOTES TO FINANCIAL STATEMENTS (continued)
are reflected in the Statement of Operations. The fund is exposed to foreign currency risk as a result of changes in value of underlying financial instruments.The fund is also exposed to credit risk associated with counterparty nonperformance on these forward contracts, which is typically limited to the unrealized gain on each open contract.The following summarizes open forward contracts at October 31, 2012:
| Foreign | ||||||
| Forward Foreign Currency | Currency | Unrealized | ||||
| Exchange Contracts | Amounts | Cost ($) | Value ($) (Depreciation) ($) | |||
| Purchases: | ||||||
| Thai Baht, | ||||||
| Expiring | ||||||
| 11/2/2012a | 347,000 | 11,388 | 11,321 | (67 | ) | |
| Sales: | Proceeds ($) | |||||
| Hong Kong Dollar, | ||||||
| Expiring | ||||||
| 11/1/2011a | 1,400,000 | 180,601 | 180,644 | (43 | ) | |
| Singapore Dollar, | ||||||
| Expiring | ||||||
| 11/2/2012a | 109,858 | 89,863 | 90,062 | (199 | ) | |
| (309 | ) | |||||
| Counterparty: | ||||||
| a Standard Chartered Bank | ||||||
The following summarizes the average market value of derivatives outstanding during the period ended October 31, 2012:
| Average Market Value ($) | |
| Forward contracts | 795,439 |
At October 31, 2012, the cost of investments for federal income tax purposes was $38,253,545; accordingly, accumulated net unrealized depreciation on investments was $1,621,535, consisting of $3,473,651 gross unrealized appreciation and $5,095,186 gross unrealized depreciation.
30
REPORT OF INDEPENDENT REGISTERED
PUBLIC ACCOUNTING FIRM
Shareholders and Board of Directors
Dreyfus Emerging Asia Fund
We have audited the accompanying statement of assets and liabilities, including the statement of investments, of Dreyfus Emerging Asia Fund (one of the series comprising Dreyfus Premier Investment Funds, Inc.) as of October 31, 2012, and the related statement of operations for the year then ended, the statement of changes in net assets for each of the two years in the period then ended, and the financial highlights for each of the periods indicated therein.These financial statements and financial highlights are the responsibility of the Fund’s management. Our responsibility is to express an opinion on these financial statements and financial highlights based on our audits.
We conducted our audits in accordance with the standards of the Public Company Accounting Oversight Board (United States).Those standards require that we plan and perform the audit to obtain reasonable assurance about whether the financial statements and financial highlights are free of material misstatement.We were not engaged to perform an audit of the Fund’s internal control over financial reporting. Our audits included consideration of internal control over financial reporting as a basis for designing audit procedures that are appropriate in the circumstances, but not for the purpose of expressing an opinion on the effectiveness of the Fund’s internal control over financial reporting.Accordingly, we express no such opinion. An audit also includes examining, on a test basis, evidence supporting the amounts and disclosures in the financial statements and financial highlights, assessing the accounting principles used and significant estimates made by management, and evaluating the overall financial statement presentation. Our procedures included confirmation of securities owned as of October 31, 2012 by correspondence with the custodian and others. We believe that our audits provide a reasonable basis for our opinion.
In our opinion, the financial statements and financial highlights referred to above present fairly, in all material respects, the financial position of Dreyfus Emerging Asia Fund at October 31, 2012, the results of its operations for the year then ended, the changes in its net assets for each of the two years in the period then ended, and the financial highlights for each of the indicated periods, in conformity with U.S. generally accepted accounting principles.

New York, New York
December 27, 2012
The Fund 31
IMPORTANT TAX INFORMATION (Unaudited)
In accordance with federal tax law, the fund elects to provide each shareholder with their portion of the fund’s foreign taxes paid and the income sourced from foreign countries. Accordingly, the fund hereby reports the following information regarding its fiscal year ended October 31, 2012:
—the total amount of taxes paid to foreign countries was $88,278
—the total amount of income sourced from foreign countries was $944,956.
Where required by federal tax law rules, shareholders will receive notification of their proportionate share of foreign taxes paid and foreign sourced income for the 2012 calendar year with Form 1099-DIV which will be mailed in early 2013.
32
PROXY RESULTS (Unaudited)
The Company held a special meeting of shareholders on August 3, 2012.The proposal considered at the meeting, and the results, are as follows:
| Shares | |||
| Votes For | Authority Withheld | ||
| To elect Board Members: | |||
| Peggy Davis† | 125,042,328 | 610,092 | |
| Ehud Houminer† | 125,002,253 | 650,167 | |
| Martin Peretz† | 125,018,821 | 633,599 |
† Each new Board Member’s term commenced on September 1, 2012.
In addition Joseph S. DiMartino, David P. Feldman, Lynn Martin, Robin A. Melvin, and Philip L.Toia continue as Board Members of the Company.
The Fund 33
INFORMATION ABOUT THE RENEWAL OF THE
FUND’S MANAGEMENT AND SUB-INVESTMENT
ADVISORY AGREEMENTS (Unaudited)
At a meeting of the fund’s Board of Directors held on June 28, 2012, the Board considered the renewal of the fund’s Management Agreement, pursuant to which Dreyfus provides the fund with investment advisory and administrative services (the “Agreement”), and the Sub-Investment Advisory Agreement (together, the “Agreements”), pursuant to which Hamon Asian Advisors Ltd. (the “Sub-Adviser”) provides day-to-day management of the fund’s investments.The Board members, none of whom are “interested persons” (as defined in the Investment Company Act of 1940, as amended) of the fund, were assisted in their review by independent legal counsel and met with counsel in executive session separate from representatives of Dreyfus and the Sub-Adviser. In considering the renewal of the Agreements, the Board considered all factors that it believed to be relevant, including those discussed below. The Board did not identify any one factor as dispositive, and each Board member may have attributed different weights to the factors considered.
Analysis of Nature, Extent, and Quality of Services Provided to the Fund.The Board considered information previously provided to them in presentations from Dreyfus representatives regarding the nature, extent, and quality of the services provided to funds in the Dreyfus fund complex, and Dreyfus representatives confirmed that there had been no material changes in this information. Dreyfus provided the number of open accounts in the fund, the fund’s asset size and the allocation of fund assets among distribution channels. Dreyfus also had previously provided information regarding the diverse intermediary relationships and distribution channels of funds in the Dreyfus fund complex (such as retail direct or intermediary, in which intermediaries typically are paid by the fund and/or Dreyfus) and Dreyfus’ corresponding need for broad, deep, and diverse resources to be able to provide ongoing shareholder services to each intermediary or distribution channel, as applicable to the fund.
The Board also considered research support available to, and portfolio management capabilities of, the fund’s portfolio management personnel and that Dreyfus also provides oversight of day-to-day fund operations,
34
including fund accounting and administration and assistance in meeting legal and regulatory requirements.The Board also considered Dreyfus’ extensive administrative, accounting, and compliance infrastructures, as well as Dreyfus’ supervisory activities over the Sub-Adviser.The Board also considered portfolio management’s brokerage policies and practices (including policies and practices regarding soft dollars) and the standards applied in seeking best execution.
Comparative Analysis of the Fund’s Performance and Management Fee and Expense Ratio.The Board reviewed reports prepared by Lipper, Inc. (“Lipper”), an independent provider of investment company data, which included information comparing (1) the fund’s performance with the performance of a group of comparable funds (the “Performance Group”) and with a broader group of funds (the “Performance Universe”), all for various periods ended May 31, 2012, and (2) the fund’s actual and contractual management fees and total expenses with those of a group of comparable funds (the “Expense Group”) and with a broader group of funds (the “Expense Universe”), the information for which was derived in part from fund financial statements available to Lipper as of the date of its analysis. Dreyfus previously had furnished the Board with a description of the methodology Lipper used to select the Performance Group and Performance Universe and the Expense Group and Expense Universe.
Dreyfus representatives stated that the usefulness of performance comparisons may be affected by a number of factors, including different investment limitations that may be applicable to the fund and comparison funds.The Board discussed the results of the comparisons and noted that the fund’s total return performance was below the Performance Group and Performance Universe medians, ranking in the fourth quartile of the Performance Group and Performance Universe for each of the periods ended May 31st. Dreyfus also provided a comparison of the fund’s calendar year total returns to the returns of the fund’s benchmark index. Dreyfus representatives advised the Board that Dreyfus is working closely with the Sub-Adviser to seek to improve the fund’s performance.
The Fund 35
INFORMATION ABOUT THE RENEWAL OF THE FUND’S MANAGEMENT AND
SUB-INVESTMENT ADVISORY AGREEMENTS (Unaudited) (continued)
The Board also reviewed the range of actual and contractual management fees and total expenses of the Expense Group and Expense Universe funds and discussed the results of the comparisons.The Board noted that the fund’s contractual management fee was above the Expense Group median and the fund’s actual management fee and total expenses were above the Expense Group and Expense Universe medians.
Dreyfus representatives noted that Dreyfus has contractually agreed, until July 31, 2013, to waive receipt of its fees and/or assume the expenses of the fund so that the direct expenses of none of the classes (excluding Rule 12b-1 Distribution Plan fees, Shareholder Services Plan fees, taxes, interest expense, brokerage commissions, commitment fees on borrowings, and extraordinary expenses) exceed 1.65% of the fund’s average daily net assets.
Dreyfus representatives reviewed with the Board the management or investment advisory fees (1) paid by funds advised or administered by Dreyfus that are in the same Lipper category as the fund and (2) paid to Dreyfus or the Sub-Adviser or its affiliates for advising any separate accounts and/or other types of client portfolios that are considered to have similar investment strategies and policies as the fund (the “Similar Clients”), and explained the nature of the Similar Clients.They discussed differences in fees paid and the relationship of the fees paid in light of any differences in the services provided and other relevant factors.The Board considered the relevance of the fee information provided for the Similar Clients to evaluate the appropriateness and reasonableness of the fund’s management fee.
The Board considered the fee to the Sub-Adviser in relation to the fee paid to Dreyfus by the fund and the respective services provided by the Sub-Adviser and Dreyfus.The Board also noted the Sub-Adviser’s fee is paid by Dreyfus (out of its fee from the fund) and not the fund.
Analysis of Profitability and Economies of Scale. Dreyfus representatives reviewed the expenses allocated and profit received by Dreyfus and the resulting profitability percentage for managing the fund, and the method used to determine the expenses and profit. The Board concluded that
36
the profitability results were not unreasonable, given the services rendered and service levels provided by Dreyfus.The Board also noted the fee waiver and expense reimbursement arrangement and its effect on Dreyfus’ profitability. The Board previously had been provided with information prepared by an independent consulting firm regarding Dreyfus’ approach to allocating costs to, and determining the profitability of, individual funds and the entire Dreyfus fund complex.The consulting firm also had analyzed where any economies of scale might emerge in connection with the management of a fund. Since Dreyfus is managing the fund at a loss, the Board did not consider an evaluation of current economies of scale to be relevant. The Board also considered potential benefits to Dreyfus and the Sub-Adviser from acting as investment adviser and sub-investment adviser, respectively, and noted the soft dollar arrangements in effect for trading the fund’s investments.
At a special Board meeting held on April 23, 2012, the Board approved consolidating the fund’s Board with the boards of certain other funds inThe Dreyfus Family of Funds, effective September 1, 2012, subject to the election of the new Board members by shareholders of the fund (the “Board Consolidation”). It was noted that, to align the renewal dates of the Management Agreements and Sub-Investment Advisory Agreements of the funds involved in the Board Consolidation, management recommended changing the fund’s Management Agreement and Sub-Investment Advisory Agreement renewal date to March 30th, subject to shareholder election of the new Board members for the fund.
At the conclusion of these discussions, the Board agreed that it had been furnished with sufficient information to make an informed business decision with respect to the renewal of the Agreements. Based on the discussions and considerations as described above, the Board concluded and determined as follows.
The Board concluded that the nature, extent and quality of the services provided by Dreyfus and the Sub-Adviser are adequate and appropriate.
The Fund 37
INFORMATION ABOUT THE RENEWAL OF THE FUND’S MANAGEMENT AND
SUB-INVESTMENT ADVISORY AGREEMENTS (Unaudited) (continued)
The Board noted Dreyfus’ efforts to improve, and agreed to closely monitor, performance.
The Board concluded that the fees paid to Dreyfus and the Sub- Adviser were reasonable in light of the considerations described above.
As described above, the Board did not evaluate current economies of scale, but noted that, to the extent in the future it were deter- mined that material economies of scale had not been shared with the fund, the Board would seek to have those economies of scale shared with the fund.
In evaluating the Agreements, the Board considered these conclusions and determinations and also relied on its previous knowledge, gained through meetings and other interactions with Dreyfus and its affiliates and the Sub-Adviser, of the fund and the services provided to the fund by Dreyfus and the Sub-Adviser.The Board also relied on information received on a routine and regular basis throughout the year relating to the operations of the fund and the investment management and other services provided under the Agreements, including information on the investment performance of the fund in comparison to similar mutual funds and benchmark performance indices; general market outlook as applicable to the fund; and compliance reports. In addition, it should be noted that the Board’s consideration of the contractual fee arrangements for this fund had the benefit of a number of years of reviews of prior or similar agreements during which lengthy discussions took place between the Board and Dreyfus representatives. Certain aspects of the arrangements may receive greater scrutiny in some years than in others, and the Board’s conclusions may be based, in part, on their consideration of the same or similar arrangements in prior years.The Board determined that renewal of the Agreements through March 30, 2013, subject to shareholder approval of the Board Consolidation as described above, was in the best interests of the fund and its shareholders.
38
BOARD MEMBERS INFORMATION (Unaudited)
| Joseph S. DiMartino (69) |
| Chairman of the Board (1995) |
| Principal Occupation During Past 5Years: |
| • Corporate Director and Trustee |
| Other Public Company Board Memberships During Past 5Years: |
| • CBIZ (formerly, Century Business Services, Inc.), a provider of outsourcing functions for small |
| and medium size companies, Director (1997-present) |
| • Sunair Services Corporation, a provider of certain outdoor-related services to homes and |
| businesses, Director (2005-2009) |
| • The Newark Group, a provider of a national market of paper recovery facilities, paperboard |
| mills and paperboard converting plants, Director (2000-2010) |
| No. of Portfolios for which Board Member Serves: 157 |
| ——————— |
| Peggy C. Davis (69) |
| Board Member (2012) |
| Principal Occupation During Past 5Years: |
| • Shad Professor of Law, New York University School of Law (1983-present) |
| No. of Portfolios for which Board Member Serves: 63 |
| ——————— |
| David P. Feldman (72) |
| Board Member (1991) |
| Principal Occupation During Past 5Years: |
| • Corporate Director and Trustee |
| Other Public Company Board Memberships During Past 5Years: |
| • BBH Mutual Funds Group (4 registered mutual funds), Director (1992-present) |
| • QMed, Inc. a healthcare company, Director (1999-2007) |
| No. of Portfolios for which Board Member Serves: 46 |
| ——————— |
| Ehud Houminer (72) |
| Board Member (2012) |
| Principal Occupation During Past 5Years: |
| • Executive-in-Residence at the Columbia Business School, Columbia University (1992-present) |
| Other Public Company Board Memberships During Past 5Years: |
| • Avnet Inc., an electronics distributor, Director (1993-2012) |
| No. of Portfolios for which Board Member Serves: 73 |
The Fund 39
BOARD MEMBERS INFORMATION (Unaudited) (continued)
| Lynn Martin (72) |
| Board Member (1993) |
| Principal Occupation During Past 5Years: |
| • President of The Martin Hall Group LLC, a human resources consulting firm, from January |
| 2005-present |
| Other Public Company Board Memberships During Past 5Years: |
| • AT&T Inc., a telecommunications company, Director (1999-2012) |
| • Ryder System, Inc., a supply chain and transportation management company, Director (1993-2012) |
| • The Proctor & Gamble Co., a consumer products company, Director (1994-2009) |
| • Constellation Energy Group Inc., Director (2003-2009) |
| No. of Portfolios for which Board Member Serves: 46 |
| ——————— |
| Robin A. Melvin (49) |
| Board Member (2011) |
| Principal Occupation During Past 5Years: |
| • Director, Boisi Family Foundation, a private family foundation that supports youth-serving organi- |
| zations that promote the self sufficiency of youth from disadvantaged circumstances (1995-2012) |
| No. of Portfolios for which Board Member Serves: 83 |
| ——————— |
| Dr. Martin Peretz (73) |
| Board Member (2012) |
| Principal Occupation During Past 5Years: |
| • Editor-in-Chief Emeritus of The New Republic Magazine (2010-present) (previously, |
| Editor-in-Chief, 1974-2010) |
| • Director of TheStreet.com, a financial information service on the web (1996-present) |
| No. of Portfolios for which Board Member Serves: 46 |
| ——————— |
| Philip L. Toia (79) |
| Board Member (1997) |
| Principal Occupation During Past 5Years: |
| • Private Investor |
| No. of Portfolios for which Board Member Serves: 56 |
| ——————— |
| Once elected all Board Members serve for an indefinite term, but achieve Emeritus status upon reaching age 80.The |
| address of the Board Members and Officers is c/o The Dreyfus Corporation, 200 Park Avenue, NewYork, NewYork |
| 10166.Additional information about the Board Members is available in the fund’s Statement of Additional Information |
| which can be obtained from Dreyfus free of charge by calling this toll free number: 1-800-DREYFUS. |
| Daniel Rose, Emeritus Board Member |
| Sandra Vanocur, Emeritus Board Member |
40
OFFICERS OF THE FUND (Unaudited)
The Fund 41
OFFICERS OF THE FUND (Unaudited) (continued)

42
NOTES
Dreyfus
Greater China Fund
ANNUAL REPORT October 31, 2012
Save time. Save paper. View your next shareholder report online as soon as it’s available. Log into www.dreyfus.com and sign up for Dreyfus eCommunications. It’s simple and only takes a few minutes.
The views expressed in this report reflect those of the portfolio manager only through the end of the period covered and do not necessarily represent the views of Dreyfus or any other person in the Dreyfus organization. Any such views are subject to change at any time based upon market or other conditions and Dreyfus disclaims any responsibility to update such views.These views may not be relied on as investment advice and, because investment decisions for a Dreyfus fund are based on numerous factors, may not be relied on as an indication of trading intent on behalf of any Dreyfus fund.

Contents | |
THE FUND | |
| 2 | A Letter from the Chairman and CEO |
| 3 | Discussion of Fund Performance |
| 6 | Fund Performance |
| 8 | Understanding Your Fund’s Expenses |
| 8 | Comparing Your Fund’s Expenses With Those of Other Funds |
| 9 | Statement of Investments |
| 13 | Statement of Assets and Liabilities |
| 14 | Statement of Operations |
| 15 | Statement of Changes in Net Assets |
| 17 | Financial Highlights |
| 20 | Notes to Financial Statements |
| 33 | Report of Independent Registered Public Accounting Firm |
| 34 | Important Tax Information |
| 35 | Proxy Results |
| 36 | Information About the Renewal of the Fund’s Management and Sub-Investment Advisory Agreements |
| 42 | Board Members Information |
| 44 | Officers of the Fund |
FOR MORE INFORMATION | |
Back Cover |
Dreyfus
Greater China Fund
The Fund
A LETTER FROM THE CHAIRMAN AND CEO

Dear Shareholder:
We are pleased to present this annual report for Dreyfus Greater China Fund, covering the 12-month period from November 1, 2011, through October 31, 2012. For information about how the fund performed during the reporting period, as well as general market perspectives, we provide a Discussion of Fund Performance on the pages that follow.
Despite pronounced stock market weakness during the spring of 2012, stocks generally advanced over the reporting period as investors responded to encouraging macroeconomic developments throughout the world. Employment gains in the United States, credible measures to prevent a more severe banking crisis in Europe, and the likelihood of a “soft landing” for China’s economy buoyed investor sentiment, as did aggressively accommodative monetary policies from central banks in the United States, Europe, Japan and China. Consequently, U.S. stocks across all capitalization ranges posted double-digit returns, on average, for the reporting period.
In light of the easy monetary policies adopted by many countries, we expect global growth to be slightly more robust in 2013 than in 2012.The U.S. economic recovery is likely to persist at subpar levels over the first half of the new year, as growth may remain constrained by uncertainties surrounding fiscal policy and tax reforms. However, successful resolution of the current fiscal debate may prompt corporate decision-makers to increase capital spending, which could have positive implications for the U.S. economy and domestic equity markets.As always, we encourage you to stay in touch with your financial advisor as new developments unfold.
Thank you for your continued confidence and support.

Jonathan R. Baum
Chairman and Chief Executive Officer
The Dreyfus Corporation
November 15, 2012
2
DISCUSSION OF FUND PERFORMANCE
For the period of November 1, 2011, through October 31, 2012, as provided by Hugh Simon, Raymond Chan and William Liu, Portfolio Managers of Hamon Asian Advisors LTD, Sub-Investment Adviser
Fund and Market Performance Overview
For the 12-month period ended October 31, 2012, Dreyfus Greater China Fund’s Class A shares produced a total return of –1.37%, Class C shares returned –2.13% and Class I shares returned –1.10%.1 In comparison, the fund’s benchmark, the Hang Seng Index, produced a total return of 13.23% (USD terms) for the same period.2
Improving economic sentiment amid accommodative policy initiatives in China sent the country’s stock market higher over the reporting period. The fund produced lower returns than its benchmark, largely due to its focus on small- and mid-cap stocks at a time when large-cap stocks fared better and the benchmark is mainly composed of large-cap stocks in the region, such as HSBC and China Mobile.
The Fund’s Investment Approach
The fund, which seeks long-term capital appreciation, normally invests at least 80% of its net assets in stocks of companies that (i) are principally traded in China, Hong Kong or Taiwan (Greater China), (ii) derive at least 50% of their revenues from Greater China, or (iii) have at least 50% of their assets in Greater China.To determine where the fund will invest, we analyze several factors, including economic and political trends in Greater China, the current financial condition and future prospects of individual companies and sectors in the region, and the valuation of one market or company relative to that of another.
Accommodative Policies Drove Chinese Equities Higher
The reporting period began in the wake of major stock market declines in China stemming from inflation-fighting measures that threatened to derail domestic economic growth. In addition, investors reacted negatively to weaker exports in a sluggish global economy as well as uncertainty surrounding an upcoming change in government leadership.
The Fund 3
DISCUSSION OF FUND PERFORMANCE (continued)
Macroeconomic conditions appeared to improve in 2012, as property markets stabilized and policymakers felt more comfortable reducing short-term interest rates and injecting liquidity into the local banking system.Although these stimulative measures took some time to have a significant impact on economic data, China began to post evidence of sustainable improvement during the third quarter of the year. In response, investment capital flowed back into China’s equity markets, sparking rallies that erased previous losses and enabled the Hang Seng Index to produced double-digit returns for the reporting period overall. However, the rebound was concentrated primarily among the large-cap stocks that comprise most of the benchmark, and small- and midcap stocks ended the reporting period with relatively flat returns.
Small- and Midcap Focus Dampened Relative Performance
While an emphasis on smaller stocks helped the fund produce impressive results in previous reporting periods, it proved counterproductive over the past year when cautious investors mainly focused on large, dividend-paying stocks. Consequently, some of the fund’s holdings remained out of favor. For example, machinery producer LK Technology Holdings lost value during the economic slowdown, but we believe the company is poised to advance as the economy improves. Likewise, luxury car dealer China ZhengTong Auto Services Holdings suffered over the reporting period’s first half when consumers became more cautious and markets reacted skeptically to a recent acquisition, but the stock rebounded to a degree over the second half. In the materials sector, Xinjiang Xinxin Mining Industry, Cl. H, declined along with commodity prices, prompting us to sell the fund’s position in the company. Results from the consumer staples sector were hampered by retailer Shanghai Friendship Group.
The fund achieved better results in the financials sector, where real estate companies, banks, insurers and brokers rallied as China’s monetary policy eased.As a result, Bank of China, China Resources Land, and China Overseas Land & Investment ranked among the fund’s top performers for the reporting period. China State Construction International Holdings fared relatively well when the Chinese government made affordable housing a policy priority. Luxury carmaker Brilliance China Automotive Holdings, a joint venture with Germany’s Bayerische Motoren Werke, gained value as higher end consumers flocked to the iconic BMW brand.
We made a number of changes to the fund’s composition over the reporting period. Most notably, we eliminated its holdings of “B shares,” which have traded at a substantial discount to corresponding “A shares.” In addition, due to corporate
4
governance concerns, we reduced the fund’s exposure to Chinese companies listed on U.S. exchanges through American Depositary Receipts (ADRs).
China Appears Poised for Growth
As of the reporting period’s end, we are optimistic regarding China’s economic prospects.The recent adoption of policies designed to stimulate growth and promote market liquidity are expected to produce encouraging results over the months ahead.What’s more, stock valuations have declined to attractive levels and could rise as economic uncertainty wanes and investors became more familiar with China’s new government. Therefore, we have retained the fund’s relatively constructive investment posture, including a focus on companies with market capitalizations of $5 billion or less. Such small- and midcap companies currently comprise approximately 60% of the fund’s assets.We continue to overweight diversified financials, consumption, selective technology, as well as sectors benefiting from long-term policies, such as social housing, aviation and railway equipment.
November 15, 2012
Please note, the position in any security highlighted with italicized typeface was sold during the reporting period. Emerging markets, such as those of China and Taiwan, tend to be more volatile than the markets of more mature economies, and generally have less diverse and less mature economic structures and less stable political systems than those of developed countries.The securities of companies located in emerging markets are often subject to rapid and large changes in price.An investment in this fund should be considered only as a supplement to a complete investment program for those investors willing to accept the greater risks associated with investments in emerging markets. Equity funds are subject generally to market, market sector, market liquidity, issuer and investment style risks, among other factors, to varying degrees, all of which are more fully described in the fund’s prospectus.
The fund’s performance will be influenced by political, social and economic factors affecting investments in foreign companies. Special risks associated with investments in foreign companies include exposure to currency fluctuations, less liquidity, less developed or less efficient trading markets, lack of comprehensive company information, political instability and differing auditing and legal standards.These risks are enhanced in emerging market countries.
| 1 Total return includes reinvestment of dividends and any capital gains paid, and does not take into consideration the |
| maximum initial sales charge in the case of Class A shares, or the applicable contingent deferred sales charge imposed on |
| redemptions in the case of Class C shares. Had these charges been reflected, returns would have been lower. Past |
| performance is no guarantee of future results. Share price and investment return fluctuate such that upon redemption, fund |
| shares may be worth more or less than their original cost. Return figures provided reflect the absorption of certain fund |
| expenses by The Dreyfus Corporation pursuant to an agreement in effect until March 30, 2013, at which time it may |
| be extended, terminated or modified. Had these expenses not been absorbed, the fund’s returns would have been lower. |
| 2 SOURCE: BLOOMBERG L.P. – Reflects reinvestment of dividends and, where applicable, capital gain |
| distributions.The Hang Seng Index is a free-float capitalization-weighted index of 36 companies that represents |
| approximately 66% of the total market cap of the Stock Exchange of Hong Kong. Index components are capped at |
| 25% and divided into four sub-indexes. Return quoted is in U.S. dollars. Investors cannot invest directly in any index. |
The Fund 5
FUND PERFORMANCE
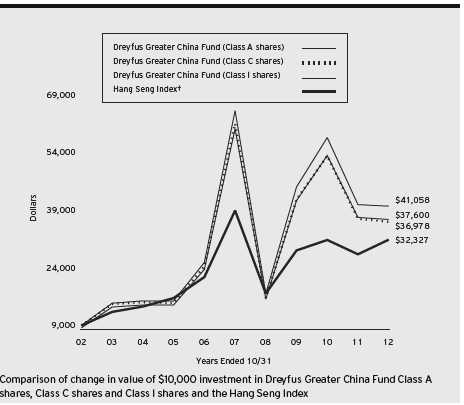
† Source: Bloomberg L.P.
Past performance is not predictive of future performance.
The above graph compares a $10,000 investment made in each of the Class A, Class C and Class I shares of Dreyfus Greater China Fund on 10/31/02 to a $10,000 investment made in the Hang Seng Index (the “Index”) on that date.All dividends and capital gain distributions are reinvested.
The fund’s performance shown in the line graph above takes into account the maximum initial sales charge on Class A shares and all other applicable fees and expenses on all classes.The Index is a capitalization-weighted index of approximately 33 companies that represent 70 percent of the total market capitalization of the Stock Exchange of Hong Kong.The components of the Index are divided into four subindices: Commerce, Finance, Utilities and Properties.The Index reflects reinvestment of net dividends and where applicable, capital gain distributions. Unlike a mutual fund, the Index is not subject to charges, fees and other expenses. Investors cannot invest directly in any index. Further information relating to fund performance, including expense reimbursements, if applicable, is contained in the Financial Highlights section of the prospectus and elsewhere in this report.
6
| Average Annual Total Returns as of 10/31/12 | ||||||
| 1 | Year | 5 Years | 10 Years | |||
| Class A shares | ||||||
| with maximum sales charge (5.75%) | –7.04 | % | –10.36 | % | 14.16 | % |
| without sales charge | –1.37 | % | –9.29 | % | 14.84 | % |
| Class C shares | ||||||
| with applicable redemption charge † | –3.05 | % | –9.98 | % | 13.97 | % |
| without redemption | –2.13 | % | –9.98 | % | 13.97 | % |
| Class I shares | –1.10 | % | –9.05 | % | 15.17 | % |
| Hang Seng Index | 13.23 | % | –4.15 | % | 12.44 | % |
Past performance is not predictive of future performance.The fund’s performance shown in the graph and table does not reflect the deduction of taxes that a shareholder would pay on fund distributions or the redemption of fund shares.
| † The maximum contingent deferred sales charge for Class C shares is 1% for shares redeemed within one year of the |
| date of purchase. |
The Fund 7
UNDERSTANDING YOUR FUND’S EXPENSES (Unaudited)
As a mutual fund investor, you pay ongoing expenses, such as management fees and other expenses. Using the information below, you can estimate how these expenses affect your investment and compare them with the expenses of other funds.You also may pay one-time transaction expenses, including sales charges (loads) and redemption fees, which are not shown in this section and would have resulted in higher total expenses. For more information, see your fund’s prospectus or talk to your financial adviser.
Review your fund’s expenses
The table below shows the expenses you would have paid on a $1,000 investment in Dreyfus Greater China Fund from May 1, 2012 to October 31, 2012. It also shows how much a $1,000 investment would be worth at the close of the period, assuming actual returns and expenses.
Expenses and Value of a $1,000 Investment
assuming actual returns for the six months ended October 31, 2012
| Class A | Class C | Class I | ||||
| Expenses paid per $1,000† | $ | 9.39 | $ | 13.17 | $ | 8.05 |
| Ending value (after expenses) | $ | 987.80 | $ | 984.30 | $ | 989.40 |
COMPARING YOUR FUND’S EXPENSES
WITH THOSE OF OTHER FUNDS (Unaudited)
Using the SEC’s method to compare expenses
The Securities and Exchange Commission (SEC) has established guidelines to help investors assess fund expenses. Per these guidelines, the table below shows your fund’s expenses based on a $1,000 investment, assuming a hypothetical 5% annualized return. You can use this information to compare the ongoing expenses (but not transaction expenses or total cost) of investing in the fund with those of other funds.All mutual fund shareholder reports will provide this information to help you make this comparison. Please note that you cannot use this information to estimate your actual ending account balance and expenses paid during the period.
Expenses and Value of a $1,000 Investment
assuming a hypothetical 5% annualized return for the six months ended October 31, 2012
| Class A | Class C | Class I | ||||
| Expenses paid per $1,000† | $ | 9.53 | $ | 13.35 | $ | 8.16 |
| Ending value (after expenses) | $ | 1,015.69 | $ | 1,011.86 | $ | 1,017.04 |
| † Expenses are equal to the fund’s annualized expense ratio of 1.88% for Class A, 2.64% for Class C and 1.61% |
| for Class I, multiplied by the average account value over the period, multiplied by 184/366 (to reflect the one-half |
| year period). |
8
STATEMENT OF INVESTMENTS
October 31, 2012
| Common Stocks—92.6% | Shares | Value ($) | |
| Automobiles & Components—5.1% | |||
| Brilliance China Automotive Holdings | 15,268,000 | a | 19,070,101 |
| Capital Goods—15.8% | |||
| AviChina Industry & Technology, Cl. H | 33,000,000 | 13,540,558 | |
| China State Construction | |||
| International Holdings | 15,964,000 | 19,012,486 | |
| CSR, Cl. H | 5,193,000 | 4,033,762 | |
| LK Technology Holdings | 46,017,500 | 7,956,523 | |
| Zhuzhou CSR Times Electric, Cl. H | 4,795,000 | 14,106,490 | |
| 58,649,819 | |||
| Consumer Durables & Apparel—1.3% | |||
| Prada | 574,300 | 4,683,294 | |
| Sunny Optical Technology Group | 49,000 | 28,831 | |
| 4,712,125 | |||
| Diversified Financials—11.0% | |||
| CITIC Securities, Cl. H | 8,851,500 | 16,606,449 | |
| Far East Horizon | 17,922,000 | 12,672,507 | |
| Haitong Securities, Cl. H | 9,045,200 | a | 11,601,124 |
| 40,880,080 | |||
| Energy—2.7% | |||
| Hilong Holding | 32,610,000 | 8,920,355 | |
| SPT Energy Group | 4,058,000 | 1,141,469 | |
| 10,061,824 | |||
| Food, Beverage & Tobacco—1.8% | |||
| China Foods | 3,088,000 | 3,123,840 | |
| China Mengniu Dairy | 1,211,000 | 3,672,041 | |
| 6,795,881 | |||
| Household & Personal Products—1.5% | |||
| Vinda International Holdings | 4,099,000 | 5,722,696 |
The Fund 9
STATEMENT OF INVESTMENTS (continued)
| Common Stocks (continued) | Shares | Value ($) | |
| Insurance—5.7% | |||
| China Life Insurance, Cl. H | 3,394,000 | 10,028,658 | |
| New China Life Insurance | 2,250,000 | 7,461,242 | |
| Ping An Insurance Group, Cl. H | 469,000 | 3,715,666 | |
| 21,205,566 | |||
| Materials—11.2% | |||
| Anhui Conch Cement, Cl. H | 3,352,500 | 11,593,086 | |
| China Resources Cement Holdings | 10,316,000 | 7,014,835 | |
| CPMC Holdings | 5,200,000 | 3,676,880 | |
| Dongyue Group | 18,581,000 | 10,621,071 | |
| Hunan Non-Ferrous Metal, Cl. H | 25,000,000 | a | 7,419,307 |
| Xingda International Holdings | 3,811,000 | 1,347,364 | |
| 41,672,543 | |||
| Pharmaceuticals, Biotech & | |||
| Life Sciences—4.5% | |||
| China Medical System Holdings | 29,030,000 | 16,743,647 | |
| Real Estate—6.5% | |||
| China Overseas Land & Investment | 1,466,000 | 3,839,949 | |
| China Resources Land | 2,632,000 | 6,011,110 | |
| Evergrande Real Estate Group | 32,991,000 | 14,430,809 | |
| 24,281,868 | |||
| Retailing—12.2% | |||
| Baoxin Auto Group | 7,799,500 | 5,605,540 | |
| Belle International Holdings | 6,200,000 | 11,551,925 | |
| China ZhengTong Auto Services Holdings | 13,501,500 | a | 9,146,118 |
| Hengdeli Holdings | 24,000,000 | 7,556,080 | |
| Intime Department Store Group | 9,897,000 | 11,723,081 | |
| 45,582,744 |
10
| Common Stocks (continued) | Shares | Value ($) | |
| Semiconductors & | |||
| Semiconductor Equipment—3.3% | |||
| Spreadtrum Communications, ADR | 526,263 | 12,130,362 | |
| Software & Services—2.8% | |||
| Qihoo 360 Technology, ADR | 504,754 | a | 10,382,790 |
| Technology Hardware & | |||
| Equipment—6.8% | |||
| Foxconn Technology | 2,636,000 | 9,158,887 | |
| Hon Hai Precision Industry | 3,371,000 | 10,235,608 | |
| Pegatron | 4,539,000 | a | 5,733,474 |
| 25,127,969 | |||
| Telecommunication Services—.4% | |||
| HKT Trust | 1,740,000 | 1,614,261 | |
| Total Common Stocks | |||
| (cost $317,281,573) | 344,634,276 | ||
| Number of | |||
| Participation Notes—6.3% | Participation Notes | Value ($) | |
| Food, Beverage & Tobacco—2.9% | |||
| Yuan Longping High-tech | |||
| Agriculture, Cl. A (2/6/13) | 3,547,950 | a,b | 10,750,998 |
| Insurance—1.8% | |||
| Ping An Insurance Group, Cl. A | |||
| (10/29/13) | 1,069,619 | a,b | 6,653,779 |
| Real Estate—1.6% | |||
| China Merchants Property | |||
| Development, Cl. A (2/28/13) | 1,683,000 | a,b | 6,125,110 |
| Total Participation Notes | |||
| (cost $22,356,866) | 23,529,887 |
The Fund 11
STATEMENT OF INVESTMENTS (continued)
| Other Investment—.8% | Shares | Value ($) | |
| Registered Investment Company; | |||
| Dreyfus Institutional Preferred | |||
| Plus Money Market Fund | |||
| (cost $3,102,000) | 3,102,000 | c | 3,102,000 |
| Total Investments (cost $342,740,439) | 99.7 | % | 371,266,163 |
| Cash and Receivables (Net) | .3 | % | 1,054,793 |
| Net Assets | 100.0 | % | 372,320,956 |
ADR—American Depository Receipts
| a Non-income producing security. |
| b Securities exempt from registration pursuant to Rule 144A under the Securities Act of 1933.These securities may be |
| resold in transactions exempt from registration, normally to qualified institutional buyers.At October 31, 2012, these |
| securities were valued at $23,529,887 or 6.3% of net assets. |
| c Investment in affiliated money market mutual fund. |
| Portfolio Summary (Unaudited)† | |||
| Value (%) | Value (%) | ||
| Capital Goods | 15.8 | Semiconductors & | |
| Retailing | 12.2 | Semiconductor Equipment | 3.3 |
| Materials | 11.2 | Software & Services | 2.8 |
| Diversified Financials | 11.0 | Energy | 2.7 |
| Real Estate | 8.1 | Household & Personal Products | 1.5 |
| Insurance | 7.5 | Consumer Durables & Apparel | 1.3 |
| Technology Hardware & Equipment | 6.8 | Money Market Investment | .8 |
| Automobiles & Components | 5.1 | Telecommunication Services | .4 |
| Food, Beverage & Tobacco | 4.7 | ||
| Pharmaceuticals, Biotech & Life Sciences | 4.5 | 99.7 | |
| † Based on net assets. | |||
| See notes to financial statements. | |||
12
STATEMENT OF ASSETS AND LIABILITIES
October 31, 2012
| Cost | Value | |||
| Assets ($): | ||||
| Investments in securities—See Statement of Investments: | ||||
| Unaffiliated issuers | 339,638,439 | 368,164,163 | ||
| Affiliated issuers | 3,102,000 | 3,102,000 | ||
| Cash denominated in foreign currencies | 280,589 | 282,585 | ||
| Receivable for investment securities sold | 12,390,227 | |||
| Dividends receivable | 154,349 | |||
| Receivable for shares of Common Stock subscribed | 114,852 | |||
| Prepaid expenses | 55,641 | |||
| 384,263,817 | ||||
| Liabilities ($): | ||||
| Due to The Dreyfus Corporation and affiliates—Note 3(c) | 620,782 | |||
| Cash overdraft due to Custodian | 527,638 | |||
| Payable for investment securities purchased | 8,957,938 | |||
| Payable for shares of Common Stock redeemed | 1,547,181 | |||
| Interest payable—Note 2 | 500 | |||
| Unrealized depreciation on forward foreign | ||||
| currency exchange contracts—Note 4 | 302 | |||
| Accrued expenses | 288,520 | |||
| 11,942,861 | ||||
| Net Assets ($) | 372,320,956 | |||
| Composition of Net Assets ($): | ||||
| Paid-in capital | 429,725,538 | |||
| Accumulated investment (loss)—net | (517,873 | ) | ||
| Accumulated net realized gain (loss) on investments | (85,414,244 | ) | ||
| Accumulated net unrealized appreciation (depreciation) | ||||
| on investments and foreign currency transactions | 28,527,535 | |||
| Net Assets ($) | 372,320,956 | |||
| Net Asset Value Per Share | ||||
| Class A | Class C | Class I | ||
| Net Assets ($) | 207,964,772 | 106,457,442 | 57,898,742 | |
| Shares Outstanding | 6,396,418 | 3,676,490 | 1,720,343 | |
| Net Asset Value Per Share ($) | 32.51 | 28.96 | 33.66 | |
| See notes to financial statements. | ||||
The Fund 13
| STATEMENT OF OPERATIONS | ||
| Year Ended October 31, 2012 | ||
| Investment Income ($): | ||
| Income: | ||
| Cash dividends (net of $350,720 foreign taxes withheld at source): | ||
| Unaffiliated issuers | 6,876,651 | |
| Affiliated issuers | 3,104 | |
| Total Income | 6,879,755 | |
| Expenses: | ||
| Management fee—Note 3(a) | 5,487,499 | |
| Shareholder servicing costs—Note 3(c) | 1,842,571 | |
| Distribution fees—Note 3(b) | 929,912 | |
| Custodian fees—Note 3(c) | 350,941 | |
| Prospectus and shareholders’ reports | 277,010 | |
| Professional fees | 104,724 | |
| Directors’ fees and expenses—Note 3(d) | 92,387 | |
| Registration fees | 61,784 | |
| Interest expense—Note 2 | 8,619 | |
| Loan commitment fees—Note 2 | 4,152 | |
| Miscellaneous | 34,503 | |
| Total Expenses | 9,194,102 | |
| Less—reduction in expenses due to undertaking—Note 3(a) | (190,303 | ) |
| Less—reduction in fees due to earnings credits—Note 3(c) | (1,020 | ) |
| Net Expenses | 9,002,779 | |
| Investment (Loss)—Net | (2,123,024 | ) |
| Realized and Unrealized Gain (Loss) on Investments—Note 4 ($): | ||
| Net realized gain (loss) on investments and foreign currency transactions | (80,582,517 | ) |
| Net realized gain (loss) on forward foreign currency exchange contracts | (183,031 | ) |
| Net Realized Gain (Loss) | (80,765,548 | ) |
| Net unrealized appreciation (depreciation) on | ||
| investments and foreign currency transactions | 66,359,543 | |
| Net unrealized appreciation (depreciation) on | ||
| forward foreign currency exchange contracts | (604 | ) |
| Net Unrealized Appreciation (Depreciation) | 66,358,939 | |
| Net Realized and Unrealized Gain (Loss) on Investments | (14,406,609 | ) |
| Net (Decrease) in Net Assets Resulting from Operations | (16,529,633 | ) |
| See notes to financial statements. | ||
14
STATEMENT OF CHANGES IN NET ASSETS
| Year Ended October 31, | ||||
| 2012 | a | 2011 | ||
| Operations ($): | ||||
| Investment (loss)—net | (2,123,024 | ) | (3,836,735 | ) |
| Net realized gain (loss) on investments | (80,765,548 | ) | 31,493,937 | |
| Net unrealized appreciation | ||||
| (depreciation) on investments | 66,358,939 | (285,337,904 | ) | |
| Net Increase (Decrease) in Net Assets | ||||
| Resulting from Operations | (16,529,633 | ) | (257,680,702 | ) |
| Dividends to Shareholders from ($): | ||||
| Net realized gain on investments: | ||||
| Class A Shares | (14,953,486 | ) | (15,851,583 | ) |
| Class B Shares | (204,333 | ) | (303,557 | ) |
| Class C Shares | (8,394,746 | ) | (8,244,961 | ) |
| Class I Shares | (4,147,846 | ) | (4,289,908 | ) |
| Total Dividends | (27,700,411 | ) | (28,690,009 | ) |
| Capital Stock Transactions ($): | ||||
| Net proceeds from shares sold: | ||||
| Class A Shares | 37,990,641 | 104,085,805 | ||
| Class B Shares | 31,633 | 102,776 | ||
| Class C Shares | 7,848,943 | 28,774,813 | ||
| Class I Shares | 24,347,409 | 57,598,937 | ||
| Dividends reinvested: | ||||
| Class A Shares | 13,088,516 | 14,184,782 | ||
| Class B Shares | 166,227 | 241,887 | ||
| Class C Shares | 5,521,449 | 5,297,097 | ||
| Class I Shares | 2,537,328 | 2,303,863 | ||
| Cost of shares redeemed: | ||||
| Class A Shares | (122,160,289 | ) | (267,324,135 | ) |
| Class B Shares | (4,074,040 | ) | (5,904,878 | ) |
| Class C Shares | (46,635,460 | ) | (82,816,215 | ) |
| Class I Shares | (49,011,034 | ) | (95,169,090 | ) |
| Increase (Decrease) in Net Assets | ||||
| from Capital Stock Transactions | (130,348,677 | ) | (238,624,358 | ) |
| Total Increase (Decrease) in Net Assets | (174,578,721 | ) | (524,995,069 | ) |
| Net Assets ($): | ||||
| Beginning of Period | 546,899,677 | 1,071,894,746 | ||
| End of Period | 372,320,956 | 546,899,677 | ||
| Accumulated investment (loss)—net | (517,873 | ) | — | |
The Fund 15
STATEMENT OF CHANGES IN NET ASSETS (continued)
| Year Ended October 31, | ||||
| 2012 | a | 2011 | ||
| Capital Share Transactions: | ||||
| Class Ab | ||||
| Shares sold | 1,178,701 | 2,189,146 | ||
| Shares issued for dividends reinvested | 439,507 | 280,903 | ||
| Shares redeemed | (3,883,864 | ) | (5,756,520 | ) |
| Net Increase (Decrease) in Shares Outstanding | (2,265,656 | ) | (3,286,471 | ) |
| Class Bb | ||||
| Shares sold | 1,183 | 2,210 | ||
| Shares issued for dividends reinvested | 6,233 | 5,271 | ||
| Shares redeemed | (135,407 | ) | (134,653 | ) |
| Net Increase (Decrease) in Shares Outstanding | (127,991 | ) | (127,172 | ) |
| Class C | ||||
| Shares sold | 280,952 | 648,693 | ||
| Shares issued for dividends reinvested | 206,796 | 115,330 | ||
| Shares redeemed | (1,655,291 | ) | (2,005,614 | ) |
| Net Increase (Decrease) in Shares Outstanding | (1,167,543 | ) | (1,241,591 | ) |
| Class I | ||||
| Shares sold | 730,275 | 1,168,784 | ||
| Shares issued for dividends reinvested | 82,488 | 44,347 | ||
| Shares redeemed | (1,502,704 | ) | (1,957,066 | ) |
| Net Increase (Decrease) in Shares Outstanding | (689,941 | ) | (743,935 | ) |
| a Effective as of the close of business on March 13, 2012, the fund no longer offers Class B shares. |
| b During the period ended October 31, 2012, 34,313 Class B shares representing $1,050,013 were automatically |
| converted to 30,865 Class A shares and during the period ended October 31, 2011, 44,704 Class B shares |
| representing $2,015,933 were automatically converted to 40,588 Class A shares. |
See notes to financial statements.
16
FINANCIAL HIGHLIGHTS
The following tables describe the performance for each share class for the fiscal periods indicated.All information (except portfolio turnover rate) reflects financial results for a single fund share.Total return shows how much your investment in the fund would have increased (or decreased) during each period, assuming you had reinvested all dividends and distributions.These figures have been derived from the fund’s financial statements.
| Year Ended October 31, | ||||||||||
| Class A Shares | 2012 | 2011 | 2010 | 2009 | 2008 | |||||
| Per Share Data ($): | ||||||||||
| Net asset value, beginning of period | 34.97 | 51.10 | 40.09 | 15.93 | 67.93 | |||||
| Investment Operations: | ||||||||||
| Investment (loss)—neta | (.10 | ) | (.13 | ) | (.27 | ) | (.10 | ) | (.00 | )b |
| Net realized and unrealized | ||||||||||
| gain (loss) on investments | (.55 | ) | (14.65 | ) | 11.26 | 24.22 | (43.59 | ) | ||
| Total from Investment Operations | (.65 | ) | (14.78 | ) | 10.99 | 24.12 | (43.59 | ) | ||
| Distributions: | ||||||||||
| Dividends from net realized | ||||||||||
| gain on investments | (1.81 | ) | (1.36 | ) | — | — | (8.41 | ) | ||
| Proceeds from redemptions fees | .00 | b | .01 | .02 | .04 | — | ||||
| Net asset value, end of period | 32.51 | 34.97 | 51.10 | 40.09 | 15.93 | |||||
| Total Return (%)c | (1.37 | ) | (29.73 | ) | 27.43 | 151.88 | (72.40 | ) | ||
| Ratios/Supplemental Data (%): | ||||||||||
| Ratio of total expenses | ||||||||||
| to average net assets | 1.92 | 1.84 | 1.89 | 1.95 | 1.95 | |||||
| Ratio of net expenses | ||||||||||
| to average net assets | 1.88 | 1.84 | 1.89 | 1.94 | 1.94 | |||||
| Ratio of net investment (loss) | ||||||||||
| to average net assets | (.30 | ) | (.27 | ) | (.60 | ) | (.33 | ) | (.01 | ) |
| Portfolio Turnover Rate | 141.37 | 91.44 | 71.53 | 75.14 | 66.07 | |||||
| Net Assets, end of period ($ x 1,000) | 207,965 | 302,932 | 610,538 | 630,399 | 157,682 | |||||
| a | Based on average shares outstanding at each month end. |
| b | Amount represents less than $.01 per share. |
| c | Exclusive of sales charge. |
See notes to financial statements.
The Fund 17
FINANCIAL HIGHLIGHTS (continued)
| Year Ended October 31, | ||||||||||
| Class C Shares | 2012 | 2011 | 2010 | 2009 | 2008 | |||||
| Per Share Data ($): | ||||||||||
| Net asset value, beginning of period | 31.60 | 46.64 | 36.86 | 14.76 | 64.13 | |||||
| Investment Operations: | ||||||||||
| Investment (loss)—neta | (.30 | ) | (.41 | ) | (.53 | ) | (.31 | ) | (.27 | ) |
| Net realized and unrealized | ||||||||||
| gain (loss) on investments | (.53 | ) | (13.28 | ) | 10.29 | 22.40 | (40.69 | ) | ||
| Total from Investment Operations | (.83 | ) | (13.69 | ) | 9.76 | 22.09 | (40.96 | ) | ||
| Distributions: | ||||||||||
| Dividends from net realized | ||||||||||
| gain on investments | (1.81 | ) | (1.36 | ) | — | — | (8.41 | ) | ||
| Proceeds from redemption fees | .00 | b | .01 | .02 | .01 | — | ||||
| Net asset value, end of period | 28.96 | 31.60 | 46.64 | 36.86 | 14.76 | |||||
| Total Return (%)c | (2.13 | ) | (30.26 | ) | 26.56 | 149.73 | (72.60 | ) | ||
| Ratios/Supplemental Data (%): | ||||||||||
| Ratio of total expenses | ||||||||||
| to average net assets | 2.68 | 2.58 | 2.60 | 2.69 | 2.71 | |||||
| Ratio of net expenses | ||||||||||
| to average net assets | 2.64 | 2.58 | 2.60 | 2.68 | 2.70 | |||||
| Ratio of net investment (loss) | ||||||||||
| to average net assets | (1.07 | ) | (.98 | ) | (1.31 | ) | (1.13 | ) | (.74 | ) |
| Portfolio Turnover Rate | 141.37 | 91.44 | 71.53 | 75.14 | 66.07 | |||||
| Net Assets, end of period ($ x 1,000) | 106,457 | 153,058 | 283,842 | 258,190 | 86,643 | |||||
| a | Based on average shares outstanding at each month end. |
| b | Amount represents less than $.01 per share. |
| c | Exclusive of sales charge. |
See notes to financial statements.
18
| Year Ended October 31, | ||||||||||
| Class I Shares | 2012 | 2011 | 2010 | 2009 | 2008 | |||||
| Per Share Data ($): | ||||||||||
| Net asset value, beginning of period | 36.04 | 52.51 | 41.06 | 16.27 | 69.02 | |||||
| Investment Operations: | ||||||||||
| Investment income (loss)—neta | (.02 | ) | (.03 | ) | (.10 | ) | (.03 | ) | .03 | |
| Net realized and unrealized | ||||||||||
| gain (loss) on investments | (.55 | ) | (15.09 | ) | 11.53 | 24.81 | (44.37 | ) | ||
| Total from Investment Operations | (.57 | ) | (15.12 | ) | 11.43 | 24.78 | (44.34 | ) | ||
| Distributions: | ||||||||||
| Dividends from net realized | ||||||||||
| gain on investments | (1.81 | ) | (1.36 | ) | — | — | (8.41 | ) | ||
| Proceeds from redemption fees | .00 | b | .01 | .02 | .01 | — | ||||
| Net asset value, end of period | 33.66 | 36.04 | 52.51 | 41.06 | 16.27 | |||||
| Total Return (%) | (1.10 | ) | (29.57 | ) | 27.86 | 152.43 | (72.31 | ) | ||
| Ratios/Supplemental Data (%): | ||||||||||
| Ratio of total expenses | ||||||||||
| to average net assets | 1.64 | 1.60 | 1.56 | 1.63 | 1.66 | |||||
| Ratio of net expenses | ||||||||||
| to average net assets | 1.60 | 1.60 | 1.56 | 1.62 | 1.65 | |||||
| Ratio of net investment income | ||||||||||
| (loss) to average net assets | (.05 | ) | (.07 | ) | (.22 | ) | (.09 | ) | .07 | |
| Portfolio Turnover Rate | 141.37 | 91.44 | 71.53 | 75.14 | 66.07 | |||||
| Net Assets, end of period ($ x 1,000) | 57,899 | 86,871 | 165,622 | 80,875 | 24,147 | |||||
| a | Based on average shares outstanding at each month end. |
| b | Amount represents less than $.01 per share. |
See notes to financial statements.
The Fund 19
NOTES TO FINANCIAL STATEMENTS
NOTE 1—Significant Accounting Policies:
Dreyfus Greater China Fund (the “fund”) is a separate non-diversified series of Dreyfus Premier Investment Funds, Inc. (the “Company”), which is registered under the Investment Company Act of 1940, as amended (the “Act”), as an open-end management investment company and operates as a series company currently offering eight series, including the fund. The fund’s investment objective is to seek long-term capital appreciation. The Dreyfus Corporation (the “Manager” or “Dreyfus”), a wholly-owned subsidiary of The Bank of New York Mellon Corporation (“BNY Mellon”), serves as the fund’s investment adviser. Hamon Asian Advisors Ltd. (“Hamon”) serves as the fund’s sub-investment adviser. Effective November 4, 2011, Hamon U.S. Investment Advisors Ltd. changed the company’s name to Hamon Asian Advisors Ltd. Hamon is an affiliate of Dreyfus.
MBSC Securities Corporation (the “Distributor”), a wholly-owned subsidiary of Dreyfus, is the distributor of the fund’s shares.The fund is authorized to issue 1 billion shares of $.001 par value Common Stock. The fund currently offers three classes of shares: Class A (600 million shares authorized), Class C (200 million shares authorized), and Class I (200 million shares authorized). Class A shares are subject to a sales charge imposed at the time of purchase. Class C shares are subject to a contingent deferred sales charge (“CDSC”) imposed on Class C shares redeemed within one year of purchase. Class I shares are sold at net asset value per share only to institutional investors.The Company’s Board of Directors (the “Board”) approved, effective as of the close of business on March 13, 2012, the transfer of shares authorized from Class B to Class A. Class B shares were subject to a CDSC imposed on Class B share redemptions made within six years of purchase and automatically converted to Class A shares after six years. The fund no longer offers Class B shares. Effective March 13, 2012, all outstanding Class B shares were automatically converted to Class A shares. Other differences between the classes include the services offered to and the expenses borne by each class, the allocation of certain transfer agency costs and certain voting rights. Income, expenses (other than expenses
20
attributable to a specific class), and realized and unrealized gains or losses on investments are allocated to each class of shares based on its relative net assets.
The Company accounts separately for the assets, liabilities and operations of each series. Expenses directly attributable to each series are charged to that series’ operations; expenses which are applicable to all series are allocated among them on a pro rata basis.
The Financial Accounting Standards Board (“FASB”) Accounting Standards Codification is the exclusive reference of authoritative U.S. generally accepted accounting principles (“GAAP”) recognized by the FASB to be applied by nongovernmental entities. Rules and interpretive releases of the Securities and Exchange Commission (“SEC”) under authority of federal laws are also sources of authoritative GAAP for SEC registrants. The fund’s financial statements are prepared in accordance with GAAP, which may require the use of management estimates and assumptions.Actual results could differ from those estimates.
The Company enters into contracts that contain a variety of indemnifications.The fund’s maximum exposure under these arrangements is unknown.The fund does not anticipate recognizing any loss related to these arrangements.
(a) Portfolio valuation: The fair value of a financial instrument is the amount that would be received to sell an asset or paid to transfer a liability in an orderly transaction between market participants at the measurement date (i.e., the exit price). GAAP establishes a fair value hierarchy that prioritizes the inputs of valuation techniques used to measure fair value.This hierarchy gives the highest priority to unadjusted quoted prices in active markets for identical assets or liabilities (Level 1 measurements) and the lowest priority to unobservable inputs (Level 3 measurements).
Additionally, GAAP provides guidance on determining whether the volume and activity in a market has decreased significantly and whether such a decrease in activity results in transactions that are not
The Fund 21
NOTES TO FINANCIAL STATEMENTS (continued)
orderly. GAAP requires enhanced disclosures around valuation inputs and techniques used during annual and interim periods.
Various inputs are used in determining the value of the fund’s investments relating to fair value measurements.These inputs are summarized in the three broad levels listed below:
Level 1—unadjusted quoted prices in active markets for identical investments.
Level 2—other significant observable inputs (including quoted prices for similar investments, interest rates, prepayment speeds, credit risk, etc.).
Level 3—significant unobservable inputs (including the fund’s own assumptions in determining the fair value of investments).
The inputs or methodology used for valuing securities are not necessarily an indication of the risk associated with investing in those securities.
Changes in valuation techniques may result in transfers in or out of an assigned level within the disclosure hierarchy. Valuation techniques used to value the fund’s investments are as follows:
Investments in securities are valued at the last sales price on the securities exchange or national securities market on which such securities are primarily traded. Securities listed on the National Market System for which market quotations are available are valued at the official closing price or, if there is no official closing price that day, at the last sales price. Securities not listed on an exchange or the national securities market, or securities for which there were no transactions, are valued at the average of the most recent bid and asked prices, except for open short positions, where the asked price is used for valuation purposes. Bid price is used when no asked price is available. Registered investment companies that are not traded on an exchange are valued at their net asset value. All of the preceding securities are categorized within Level 1 of the fair value hierarchy.
22
Fair valuing of securities may be determined with the assistance of a pricing service using calculations based on indices of domestic securities and other appropriate indicators, such as prices of relevant ADRs and financial futures. Utilizing these techniques may result in transfers between Level 1 and Level 2 of the fair value hierarchy.
When market quotations or official closing prices are not readily available, or are determined not to reflect accurately fair value, such as when the value of a security has been significantly affected by events after the close of the exchange or market on which the security is principally traded (for example, a foreign exchange or market), but before the fund calculates its net asset value, the fund may value these investments at fair value as determined in accordance with the procedures approved by the Board. Certain factors may be considered when fair valuing investments such as: fundamental analytical data, the nature and duration of restrictions on disposition, an evaluation of the forces that influence the market in which the securities are purchased and sold, and public trading in similar securities of the issuer or comparable issuers.These securities are either categorized as Level 2 or 3 depending on the relevant inputs used.
For restricted securities where observable inputs are limited, assumptions about market activity and risk are used and are categorized within Level 3 of the fair value hierarchy.
Investments denominated in foreign currencies are translated to U.S. dollars at the prevailing rates of exchange.
Forward foreign currency exchange contracts (“forward contracts”) are valued at the forward rate. These securities are generally categorized within Level 2 of the fair value hierarchy.
The Fund 23
NOTES TO FINANCIAL STATEMENTS (continued)
The following is a summary of the inputs used as of October 31, 2012 in valuing the fund’s investments:
| Level 2—Other | Level 3— | |||||
| Level 1— | Significant | Significant | ||||
| Unadjusted | Observable | Unobservable | ||||
| Quoted Prices | Inputs | Inputs | Total | |||
| Assets ($) | ||||||
| Investments in Securities: | ||||||
| Equity Securities— | ||||||
| Foreign Common | ||||||
| Stocks† | 344,634,276 | — | — | 344,634,276 | ||
| Mutual Funds | 3,102,000 | — | — | 3,102,000 | ||
| Participation Notes† | 23,529,887 | — | — | 23,529,887 | ||
| Other Financial | ||||||
| Instruments: | ||||||
| Forward Foreign | ||||||
| Currency Exchange | ||||||
| Contracts†† | — | (302 | ) | — | (302 | ) |
| † | See Statement of Investments for additional detailed categorizations. |
| †† | Amount shown represents unrealized (depreciation) at period end. |
At October 31, 2011, $501,034,803 of exchange traded foreign equity securities were classified within Level 2 of the fair value hierarchy pursuant to the fund’s fair valuation procedures.
(b) Foreign currency transactions: The fund does not isolate that portion of the results of operations resulting from changes in foreign exchange rates on investments from the fluctuations arising from changes in the market prices of securities held. Such fluctuations are included with the net realized and unrealized gain or loss on investments.
Net realized foreign exchange gains or losses arise from sales of foreign currencies, currency gains or losses realized on securities transactions between trade and settlement date, and the difference between the amounts of dividends, interest and foreign withholding taxes recorded on the fund’s books and the U.S. dollar equivalent of the amounts actually received or paid. Net unrealized foreign exchange gains and losses arise from changes in the value of assets and liabilities other than investments resulting from changes in exchange rates. Foreign currency
24
gains and losses on investments are also included with net realized and unrealized gain or loss on investments.
(c) Securities transactions and investment income: Securities transactions are recorded on a trade date basis. Realized gains and losses from securities transactions are recorded on the identified cost basis. Dividend income is recognized on the ex-dividend date and interest income, including, where applicable, accretion of discount and amortization of premium on investments, is recognized on the accrual basis.
(d) Affiliated issuers: Investments in other investment companies advised by Dreyfus are defined as “affiliated” in the Act. Investments in affiliated investment companies for the period ended October 31, 2012 were as follows:
| Affiliated | |||||||
| Investment | Value | Value | Net | ||||
| Company | 10/31/2011 | ($) | Purchases ($) | Sales ($) | 10/31/2012 | ($) | Assets (%) |
| Dreyfus | |||||||
| Institutional | |||||||
| Preferred | |||||||
| Plus Money | |||||||
| Market Fund | 886,000 | 224,360,000 | 222,144,000 | 3,102,000 | .8 |
(e) Risk: Investing in foreign markets may involve special risks and considerations not typically associated with investing in the U.S. These risks include revaluation of currencies, high rates of inflation, repatriation restrictions on income and capital, and adverse political and economic developments. Moreover, securities issued in these markets may be less liquid, subject to government ownership controls and delayed settlements, and their prices may be more volatile than those of comparable securities in the U.S.
The fund follows an investment policy of investing primarily in the securities of Chinese issuers and other investments that are tied economically to China. Because the fund’s investments are concentrated in China, the fund’s performance is expected to be closely tied to social, political and economic conditions within China and to be more volatile than the performance of more geographically diversified funds.
The Fund 25
NOTES TO FINANCIAL STATEMENTS (continued)
(f) Dividends to shareholders: Dividends are recorded on the ex-dividend date. Dividends from investment income-net and dividends from net realized capital gains, if any, are normally declared and paid annually, but the fund may make distributions on a more frequent basis to comply with the distribution requirements of the Internal Revenue Code of 1986, as amended (the “Code”).To the extent that net realized capital gains can be offset by capital loss carryovers, it is the policy of the fund not to distribute such gains. Income and capital gain distributions are determined in accordance with income tax regulations, which may differ from GAAP.
(g) Federal income taxes: It is the policy of the fund to continue to qualify as a regulated investment company, if such qualification is in the best interests of its shareholders, by complying with the applicable provisions of the Code, and to make distributions of taxable income sufficient to relieve it from substantially all federal income and excise taxes.
As of and during the period ended October 31, 2012, the fund did not have any liabilities for any uncertain tax positions.The fund recognizes interest and penalties, if any, related to uncertain tax positions as income tax expense in the Statement of Operations. During the period, the fund did not incur any interest or penalties.
Each of the tax years in the four-year period ended October 31, 2012 remains subject to examination by the Internal Revenue Service and state taxing authorities.
At October 31, 2012, the components of accumulated earnings on a tax basis were as follows: accumulated capital losses $82,033,519 and unrealized appreciation $25,146,810. In addition, the fund deferred for tax purposes late year ordinary losses of $517,873 to the first day of the following fiscal year.
Under the Regulated Investment Company Modernization Act of 2010 (the “2010 Act”), the fund is permitted to carry forward capital losses incurred in taxable years beginning after December 22, 2010 (“post-enactment losses”) for an unlimited period. Furthermore, post-
26
enactment capital loss carryovers retain their character as either short-term or long-term capital losses rather than short-term as they were under previous statute.
The accumulated capital loss carryover is available for federal income tax purposes to be applied against future net realized capital gains, if any, realized subsequent to October 31, 2012.The fund has $27,394,773 of post-enactment short-term capital losses and $54,638,746 of post-enactment long-term capital losses which can be carried forward for an unlimited period.
The tax character of distributions paid to shareholders during the fiscal periods ended October 31, 2012 and October 31, 2011 were as follows: long-term capital gains $27,700,411 and $28,690,009, respectively.
The fund has analyzed its tax positions with respect to applicable income tax issues for open tax years (in each respective jurisdiction) and determined no material tax liabilities existed.The fund operates in certain jurisdictions where the tax laws are evolving and, therefore, the application and interpretation of these laws and regulations is uncertain. In the future, the fund’s tax position in these jurisdictions may be subject to review from time to time which could result in tax liabilities.
During the period ended October 31, 2012, as a result of permanent book to tax differences, primarily due to the tax treatment for foreign currency gains and losses and net operating losses, the fund increased accumulated undistributed investment income-net by $1,605,151, increased accumulated net realized gain (loss) on investments by $293,006 and decreased paid-in capital by $1,898,157. Net assets and net asset value per share were not affected by this reclassification.
(h) New Accounting Pronouncement: In December 2011, FASB issued Accounting Standards Update No. 2011-11 “Disclosures about Offsetting Assets and Liabilities” (“ASU 2011-11”). These disclosure requirements are intended to help investors and other financial statement users to better assess the effect or potential effect of offsetting arrangements on a company’s financial position.They also improve transparency
The Fund 27
NOTES TO FINANCIAL STATEMENTS (continued)
in the reporting of how companies mitigate credit risk, including disclosure of related collateral pledged or received. In addition,ASU 2011-11 facilitates comparison between those entities that prepare their financial statements on the basis of GAAP and those entities that prepare their financial statements on the basis of International Financial Reporting Standards (“IFRS”). ASU 2011-11 requires entities to: disclose both gross and net information about both instruments and transactions eligible for offset in the financial statements; and disclose instruments and transactions subject to an agreement similar to a master netting agreement. ASU 2011-11 is effective for fiscal years beginning on or after January 1, 2013, and interim periods within those annual periods.At this time, management is evaluating the implications of ASU 2011-11 and its impact on the fund’s financial statement disclosures.
NOTE 2—Bank Lines of Credit:
The fund participates with other Dreyfus-managed funds in a $225 million unsecured credit facility led by Citibank, N.A. and a $300 million unsecured credit facility provided by The Bank of New York Mellon, a subsidiary of BNY Mellon and an affiliate of Dreyfus, (each, a “Facility”) each to be utilized primarily for temporary or emergency purposes, including the financing of redemptions. Effective October 10, 2012, the $225 million unsecured credit facility with Citibank, N.A., was decreased to $210 million. In connection therewith, the fund has agreed to pay its pro rata portion of commitment fees for each Facility. Interest is charged to the fund based on rates determined pursuant to the terms of the respective Facility at the time of borrowing.
The average amount of borrowings outstanding under the Facilities during the period ended October 31, 2012, was approximately $417,500, with a related weighted average annualized interest rate of 2.06%.
NOTE 3—Management Fee, Sub-Investment Advisory Fee and Other Transactions with Affiliates:
(a) Pursuant to a management agreement with Dreyfus, the management fee is computed at the annual rate of 1.25% of the value of the fund’s average daily net assets and is payable monthly.
28
Dreyfus has agreed to waive receipt of a portion of the fund’s management fee, in the amount of .15% of the value of the fund’s average daily net assets, until March 30, 2013.The reduction in expenses, pursuant to the undertaking, amounted to $190,303 during the period ended October 31, 2012.
Pursuant to a sub-investment advisory agreement between Dreyfus and Hamon, Dreyfus pays Hamon a fee at the annual rate of .625% of the value of the fund’s average daily net assets and is payable monthly.
During the period ended October 31, 2012, the Distributor retained $73,382 from commissions earned on sales of the fund’s Class A shares and $325 and $30,324 from CDSCs on redemptions of the fund’s Class B and Class C shares, respectively.
(b) Under the Distribution Plan adopted pursuant to Rule 12b-1 under the Act, Class B shares paid and Class C shares pay the Distributor for distributing their shares at an annual rate of .75% of the value of the average daily net assets of Class B and Class C shares. During the period ended October 31, 2012, Class B and Class C shares were charged $8,271 and $921,641, respectively, pursuant to the Distribution Plan.
(c) Under the Shareholder Services Plan, Class A and Class C shares pay and Class B shares paid the Distributor at an annual rate of .25% of the value of their average daily net assets for the provision of certain services.The services provided may include personal services relating to shareholder accounts, such as answering shareholder inquiries regarding the fund and providing reports and other information, and services related to the maintenance of shareholder accounts. The Distributor may make payments to Service Agents (securities dealers, financial institutions or other industry professionals) in respect of these services.The Distributor determines the amounts to be paid to Service Agents. During the period ended October 31, 2012, Class A, Class B and Class C shares were charged $614,577, $2,757 and $307,214, respectively, pursuant to the Shareholder Services Plan.
The Fund 29
NOTES TO FINANCIAL STATEMENTS (continued)
The fund has arrangements with the transfer agent and the custodian whereby the fund may receive earnings credits when positive cash balances are maintained, which are used to offset transfer agency and custody fees. For financial reporting purposes, the fund includes net earnings credits as an expense offset in the Statement of Operations.
The fund compensates DreyfusTransfer, Inc. (“DTI”), a wholly-owned subsidiary of Dreyfus, under a transfer agency agreement for providing transfer agency services for the fund and, since May 29, 2012, cash management services related to fund subscriptions and redemptions. During the period ended October 31, 2012, the fund was charged $209,383 for transfer agency services and $3,889 for cash management services. Cash management fees were partially offset by earnings credits of $452.These fees are included in Shareholder servicing costs in the Statement of Operations.
The fund compensates The Bank of New York Mellon under a custody agreement for providing custodial services for the fund. During the period ended October 31, 2012, the fund was charged $350,941 pursuant to the custody agreement.
Prior to May 29, 2012, the fund compensated The Bank of New York Mellon under a cash management agreement for performing cash management services related to fund subscriptions and redemptions. During the period ended October 31, 2012, the fund was charged $17,617 pursuant to the cash management agreement, which is included in Shareholder servicing costs in the Statement of Operations.These fees were partially offset by earnings credits of $568.
During the period ended October 31, 2012, the fund was charged $8,517 for services performed by the Chief Compliance Officer and his staff.
The components of “Due toThe Dreyfus Corporation and affiliates” in the Statement of Assets and Liabilities consist of: management fees $392,332, Distribution Plan fees $66,585, Shareholder Services Plan fees
30
$66,283, custodian fees $110,037, Chief Compliance Officer fees $2,654 and transfer agency fees $29,841, which are offset against an expense reimbursement currently in effect in the amount of $46,950.
(d) Each Board member also serves as a Board member of other funds within the Dreyfus complex. Annual retainer fees and attendance fees are allocated to each fund based on net assets.
(e) A 2% redemption fee is charged and retained by the fund on certain shares redeemed within sixty days following the date of issuance subject to exceptions, including redemptions made through use of the fund’s exchange privilege. During the period ended October 31, 2012, redemption fees charged and retained by the fund amounted to $66,353.
NOTE 4—Securities Transactions:
The aggregate amount of purchases and sales of investment securities, excluding short-term securities and forward contracts, during the period ended October 31, 2012, amounted to $614,249,466 and $764,467,885, respectively.
Derivatives: A derivative is a financial instrument whose performance is derived from the performance of another asset. Each type of derivative instrument that was held by the fund during the period ended October 31, 2012 is discussed below.
Forward Foreign Currency Exchange Contracts: The fund enters into forward contracts in order to hedge its exposure to changes in foreign currency exchange rates on its foreign portfolio holdings, to settle foreign currency transactions or as a part of its investment strategy. When executing forward contracts, the fund is obligated to buy or sell a foreign currency at a specified rate on a certain date in the future. With respect to sales of forward contracts, the fund incurs a loss if the value of the contract increases between the date the forward contract is opened and the date the forward contract is closed.The fund realizes a gain if the value of the contract decreases between those dates.With
The Fund 31
NOTES TO FINANCIAL STATEMENTS (continued)
respect to purchases of forward contracts, the fund incurs a loss if the value of the contract decreases between the date the forward contract is opened and the date the forward contract is closed.The fund realizes a gain if the value of the contract increases between those dates. Any realized or unrealized gains or losses which occurred during the period are reflected in the Statement of Operations. The fund is exposed to foreign currency risk as a result of changes in value of underlying financial instruments.The fund is also exposed to credit risk associated with counterparty nonperformance on these forward contracts, which is typically limited to the unrealized gain on each open contract.The following summarizes open forward contracts at October 31, 2012:
| Foreign | |||||
| Forward Foreign Currency | Currency | Unrealized | |||
| Exchange Contracts | Amounts | Proceeds ($) | Value ($) (Depreciation) ($) | ||
| Sales; | |||||
| Hong Kong Dollar, | |||||
| Expiring 11/1/2012a | 9,800,000 | 1,264,206 | 1,264,508 | (302 | ) |
| Counterparty: | |||||
| a Standard Chartered Bank | |||||
The following summarizes the average market value of derivatives outstanding during the period ended October 31, 2012:
| Average Market Value ($) | |
| Forward contracts | 1,734,246 |
At October 31, 2012, the cost of investments for federal income tax purposes was $346,121,164; accordingly, accumulated net unrealized appreciation on investments was $25,144,999, consisting of $49,934,568 gross unrealized appreciation and $24,789,569 gross unrealized depreciation.
32
REPORT OF INDEPENDENT REGISTERED
PUBLIC ACCOUNTING FIRM
Shareholders and Board of Directors
Dreyfus Greater China Fund
We have audited the accompanying statement of assets and liabilities, including the statement of investments, of Dreyfus Greater China Fund (one of the series comprising Dreyfus Premier Investment Funds, Inc.) as of October 31, 2012, and the related statement of operations for the year then ended, the statement of changes in net assets for each of the two years in the period then ended, and the financial highlights for each of the five years in the period then ended. These financial statements and financial highlights are the responsibility of the Fund’s management. Our responsibility is to express an opinion on these financial statements and financial highlights based on our audits.
We conducted our audits in accordance with the standards of the Public Company Accounting Oversight Board (United States).Those standards require that we plan and perform the audit to obtain reasonable assurance about whether the financial statements and financial highlights are free of material misstatement.We were not engaged to perform an audit of the Fund’s internal control over financial reporting. Our audits included consideration of internal control over financial reporting as a basis for designing audit procedures that are appropriate in the circumstances, but not for the purpose of expressing an opinion on the effectiveness of the Fund’s internal control over financial reporting. Accordingly, we express no such opinion. An audit also includes examining, on a test basis, evidence supporting the amounts and disclosures in the financial statements and financial highlights, assessing the accounting principles used and significant estimates made by management, and evaluating the overall financial statement presentation. Our procedures included confirmation of securities owned as of October 31, 2012 by correspondence with the custodian and others.We believe that our audits provide a reasonable basis for our opinion.
In our opinion, the financial statements and financial highlights referred to above present fairly, in all material respects, the financial position of Dreyfus Greater China Fund at October 31, 2012, the results of its operations for the year then ended, the changes in its net assets for each of the two years in the period then ended, and the financial highlights for each of the five years in the period then ended, in conformity with U.S. generally accepted accounting principles.

New York, New York
December 27, 2012
The Fund 33
IMPORTANT TAX INFORMATION (Unaudited)
In accordance with federal tax law, the fund elects to provide each shareholder with their portion of the fund’s foreign taxes paid and the income sourced from foreign countries. Accordingly, the fund hereby reports the following information regarding its fiscal year ended October 31, 2012:
—the total amount of taxes paid to foreign countries was $350,720
—the total amount of income sourced from foreign countries was $7,235,853.
Where required by federal tax law rules, shareholders will receive notification of their proportionate share of foreign taxes paid and foreign sourced income for the 2012 calendar year with Form 1099-DIV which will be mailed in early 2013. Also, the fund hereby reports $1.8127 per share as a long-term capital gain distribution paid on December 20, 2011.
34
PROXY RESULTS (Unaudited)
The Company held a special meeting of shareholders on August 3, 2012.The proposal considered at the meeting, and the results, are as follows:
| Shares | |||
| Votes For | Authority Withheld | ||
| To elect additional Board members: | |||
| Peggy Davis† | 125,042,328 | 610,092 | |
| Ehud Houminer† | 125,002,253 | 650,167 | |
| Martin Peretz† | 125,018,821 | 633,599 |
† Each new Board Member’s term commenced on September 1, 2012.
In addition Joseph S. DiMartino, David P. Feldman, Lynn Martin, Robin A. Melvin, and Philip L.Toia continue as Board Members of the Company.
The Fund 35
INFORMATION ABOUT THE RENEWAL OF THE
FUND’S MANAGEMENT AND SUB-INVESTMENT
ADVISORY AGREEMENTS (Unaudited)
At a meeting of the fund’s Board of Directors held on June 28, 2012, the Board considered the renewal of the fund’s Management Agreement, pursuant to which Dreyfus provides the fund with investment advisory and administrative services (the “Agreement”), and the Sub-Investment Advisory Agreement (together, the “Agreements”), pursuant to which Hamon Asian Advisors Ltd. (the “Sub-Adviser”) provides day-to-day management of the fund’s investments.The Board members, none of whom are “interested persons” (as defined in the Investment Company Act of 1940, as amended) of the fund, were assisted in their review by independent legal counsel and met with counsel in executive session separate from representatives of Dreyfus and the Sub-Adviser. In considering the renewal of the Agreements, the Board considered all factors that it believed to be relevant, including those discussed below.The Board did not identify any one factor as dispositive, and each Board member may have attributed different weights to the factors considered.
Analysis of Nature, Extent, and Quality of Services Provided to the Fund.The Board considered information previously provided to them in presentations from Dreyfus representatives regarding the nature, extent, and quality of the services provided to funds in the Dreyfus fund complex, and Dreyfus representatives confirmed that there had been no material changes in this information. Dreyfus provided the number of open accounts in the fund, the fund’s asset size and the allocation of fund assets among distribution channels. Dreyfus also had previously provided information regarding the diverse intermediary relationships and distribution channels of funds in the Dreyfus fund complex (such as retail direct or intermediary, in which intermediaries typically are paid by the fund and/or Dreyfus) and Dreyfus’ corresponding need for broad, deep, and diverse resources to be able to provide ongoing shareholder services to each intermediary or distribution channel, as applicable to the fund.
The Board also considered research support available to, and portfolio management capabilities of, the fund’s portfolio management personnel and that Dreyfus also provides oversight of day-to-day fund operations,
36
including fund accounting and administration and assistance in meeting legal and regulatory requirements.The Board also considered Dreyfus’ extensive administrative, accounting, and compliance infrastructures, as well as Dreyfus’ supervisory activities over the Sub-Adviser.The Board also considered portfolio management’s brokerage policies and practices (including policies and practices regarding soft dollars) and the standards applied in seeking best execution.
Comparative Analysis of the Fund’s Performance and Management Fee and Expense Ratio.The Board reviewed reports prepared by Lipper, Inc. (“Lipper”), an independent provider of investment company data, which included information comparing (1) the fund’s performance with the performance of a group of comparable funds (the “Performance Group”) and with a broader group of funds (the “Performance Universe”), all for various periods ended May 31, 2012, and (2) the fund’s actual and contractual management fees and total expenses with those of a group of comparable funds (the “Expense Group”) and with a broader group of funds (the “Expense Universe”), the information for which was derived in part from fund financial statements available to Lipper as of the date of its analysis. Dreyfus previously had furnished the Board with a description of the methodology Lipper used to select the Performance Group and Performance Universe and the Expense Group and Expense Universe.
Dreyfus representatives stated that the usefulness of performance comparisons may be affected by a number of factors, including different investment limitations that may be applicable to the fund and comparison funds.They also noted that performance generally should be considered over longer periods of time, although it is possible that long-term performance can be adversely affected by even one period of significant underperformance so that a single investment decision or theme has the ability to affect disproportionately long-term performance. The Board discussed the results of the comparisons and noted that the fund’s total return performance was below the Performance Group and Performance
The Fund 37
INFORMATION ABOUT THE RENEWAL OF THE FUND’S MANAGEMENT AND
SUB-INVESTMENT ADVISORY AGREEMENTS (Unaudited) (continued)
Universe medians for the various periods, except for the ten-year period when the fund’s performance was at the Performance Group median and above the Performance Universe median.The Board noted that the fund ranked in the fourth quartile of the Performance Group for each of the periods ended May 31st. Dreyfus also provided a comparison of the fund’s calendar year total returns to the returns of the fund’s benchmark index, and it was noted that the fund’s return was above the return of the benchmark index in six of the ten calendar years. Dreyfus representatives advised the Board that Dreyfus is working closely with the Sub-Adviser to seek to improve the fund’s performance.
The Board also reviewed the range of actual and contractual management fees and total expenses of the Expense Group and Expense Universe funds and discussed the results of the comparisons.The Board noted that the fund’s contractual management fee was above the Expense Group median and the fund’s actual management fee and total expenses were above the Expense Group and Expense Universe medians.
Dreyfus representatives noted that Dreyfus has agreed to waive receipt of a portion of the fund’s management fee in the amount of .15% of the value of the fund’s average daily net assets until March 30, 2013.
Dreyfus representatives reviewed with the Board the management or investment advisory fees (1) paid by funds advised or administered by Dreyfus that are in the same Lipper category as the fund and (2) paid to Dreyfus or the Sub-Adviser or its affiliates for advising any separate accounts and/or other types of client portfolios that are considered to have similar investment strategies and policies as the fund (the “Similar Clients”), and explained the nature of the Similar Clients.They discussed differences in fees paid and the relationship of the fees paid in light of any differences in the services provided and other relevant factors.The Board considered the relevance of the fee information provided for the Similar Clients to evaluate the appropriateness and reasonableness of the fund’s management fee.
38
The Board considered the fee to the Sub-Adviser in relation to the fee paid to Dreyfus by the fund and the respective services provided by the Sub-Adviser and Dreyfus.The Board also noted the Sub-Adviser’s fee is paid by Dreyfus (out of its fee from the fund) and not the fund.
Analysis of Profitability and Economies of Scale. Dreyfus representatives reviewed the expenses allocated and profit received by Dreyfus and the resulting profitability percentage for managing the fund, and the method used to determine the expenses and profit.The Board concluded that the profitability results were not unreasonable, given the services rendered and service levels provided by Dreyfus. The Board also noted the fee waiver and expense reimbursement arrangement and its effect on Dreyfus’ profitability. The Board previously had been provided with information prepared by an independent consulting firm regarding Dreyfus’ approach to allocating costs to, and determining the profitability of, individual funds and the entire Dreyfus fund complex.The consulting firm also had analyzed where any economies of scale might emerge in connection with the management of a fund.
The Board’s counsel stated that the Board should consider the profitability analysis (1) as part of their evaluation of whether the fees under the Agreements bear a reasonable relationship to the mix of services provided by Dreyfus and the Sub-Adviser, including the nature, extent and quality of such services, and (2) in light of the relevant circumstances for the fund and the extent to which economies of scale would be realized if the fund grows and whether fee levels reflect these economies of scale for the benefit of fund shareholders. Since Dreyfus, and not the fund, pays the Sub-Adviser pursuant to the Sub-Investment Advisory Agreement, the Board did not consider the Sub-Adviser’s profitability to be relevant to its deliberations. Dreyfus representatives noted that a discussion of economies of scale is predicated on a fund having achieved a substantial size with increasing assets and that, if a fund’s assets had been
The Fund 39
INFORMATION ABOUT THE RENEWAL OF THE FUND’S MANAGEMENT AND
SUB-INVESTMENT ADVISORY AGREEMENTS (Unaudited) (continued)
stable or decreasing, the possibility that Dreyfus may have realized any economies of scale would be less. Dreyfus representatives also noted that, as a result of shared and allocated costs among funds in the Dreyfus fund complex, the extent of economies of scale could depend substantially on the level of assets in the complex as a whole, so that increases and decreases in complex-wide assets can affect potential economies of scale in a manner that is disproportionate to, or even in the opposite direction from, changes in the fund’s asset level.The Board also considered potential benefits to Dreyfus and the Sub-Adviser from acting as investment adviser and sub-investment adviser, respectively, and noted the soft dollar arrangements in effect for trading the fund’s investments.
At a special Board meeting held on April 23, 2012, the Board approved consolidating the fund’s Board with the boards of certain other funds in The Dreyfus Family of Funds, effective September 1, 2012, subject to the election of the new Board members by shareholders of the fund (the “Board Consolidation”). It was noted that, to align the renewal dates of the Management Agreements and Sub-Investment Advisory Agreements of the funds involved in the Board Consolidation, management recommended changing the fund’s ManagementAgreement and Sub-Investment Advisory Agreement renewal date to March 30th, subject to shareholder election of the new Board members for the fund.
At the conclusion of these discussions, the Board agreed that it had been furnished with sufficient information to make an informed business decision with respect to the renewal of the Agreements. Based on the discussions and considerations as described above, the Board concluded and determined as follows.
The Board concluded that the nature, extent and quality of the services provided by Dreyfus and the Sub-Adviser are adequate and appropriate.
The Board noted Dreyfus’ efforts to improve, and agreed to closely monitor, performance.
40
The Board concluded that the fees paid to Dreyfus and the Sub- Adviser were reasonable in light of the considerations described above.
The Board determined that the economies of scale which may accrue to Dreyfus and its affiliates in connection with the management of the fund had been adequately considered by Dreyfus in connection with the fee rate charged to the fund pursuant to the Agreement and that, to the extent in the future it were determined that material economies of scale had not been shared with the fund, the Board would seek to have those economies of scale shared with the fund.
In evaluating the Agreements, the Board considered these conclusions and determinations and also relied on its previous knowledge, gained through meetings and other interactions with Dreyfus and its affiliates and the Sub-Adviser, of the fund and the services provided to the fund by Dreyfus and the Sub-Adviser.The Board also relied on information received on a routine and regular basis throughout the year relating to the operations of the fund and the investment management and other services provided under the Agreements, including information on the investment performance of the fund in comparison to similar mutual funds and benchmark performance indices; general market outlook as applicable to the fund; and compliance reports. In addition, it should be noted that the Board’s consideration of the contractual fee arrangements for this fund had the benefit of a number of years of reviews of prior or similar agreements during which lengthy discussions took place between the Board and Dreyfus representatives. Certain aspects of the arrangements may receive greater scrutiny in some years than in others, and the Board’s conclusions may be based, in part, on their consideration of the same or similar arrangements in prior years.The Board determined that renewal of the Agreements through March 30, 2013, subject to shareholder approval of the Board Consolidation as described above, was in the best interests of the fund and its shareholders.
The Fund 41
BOARD MEMBERS INFORMATION (Unaudited)
| Joseph S. DiMartino (69) |
| Chairman of the Board (1995) |
| Principal Occupation During Past 5Years: |
| • Corporate Director and Trustee |
| Other Public Company Board Memberships During Past 5Years: |
| • CBIZ (formerly, Century Business Services, Inc.), a provider of outsourcing functions for small |
| and medium size companies, Director (1997-present) |
| • Sunair Services Corporation, a provider of certain outdoor-related services to homes and |
| businesses, Director (2005-2009) |
| • The Newark Group, a provider of a national market of paper recovery facilities, paperboard mills |
| and paperboard converting plants, Director (2000-2010) |
| No. of Portfolios for which Board Member Serves: 157 |
| ——————— |
| Peggy C. Davis (69) |
| Board Member (2012) |
| Principal Occupation During Past 5Years: |
| • Shad Professor of Law, New York University School of Law (1983-present) |
| No. of Portfolios for which Board Member Serves: 63 |
| ——————— |
| David P. Feldman (72) |
| Board Member (1991) |
| Principal Occupation During Past 5Years: |
| • Corporate Director and Trustee |
| Other Public Company Board Memberships During Past 5Years: |
| • BBH Mutual Funds Group (4 registered mutual funds), Director (1992-present) |
| • QMed, Inc. a healthcare company, Director (1999-2007) |
| No. of Portfolios for which Board Member Serves: 46 |
| ——————— |
| Ehud Houminer (72) |
| Board Member (2012) |
| Principal Occupation During Past 5Years: |
| • Executive-in-Residence at the Columbia Business School, Columbia University (1992-present) |
| Other Public Company Board Memberships During Past 5Years: |
| • Avnet Inc., an electronics distributor, Director (1993-2012) |
| No. of Portfolios for which Board Member Serves: 73 |
42
| Lynn Martin (72) |
| Board Member (1993) |
| Principal Occupation During Past 5Years: |
| • President of The Martin Hall Group LLC, a human resources consulting firm, from |
| January 2005-present |
| Other Public Company Board Memberships During Past 5Years: |
| • AT&T Inc., a telecommunications company, Director (1999-2012) |
| • Ryder System, Inc., a supply chain and transportation management company, Director (1993-2012) |
| • The Proctor & Gamble Co., a consumer products company, Director (1994-2009) |
| • Constellation Energy Group Inc., Director (2003-2009) |
| No. of Portfolios for which Board Member Serves: 46 |
| ——————— |
| Robin A. Melvin (49) |
| Board Member (2011) |
| Principal Occupation During Past 5Years: |
| • Director, Boisi Family Foundation, a private family foundation that supports youth-serving orga- |
| nizations that promote the self sufficiency of youth from disadvantaged circumstances (1995-2012) |
| No. of Portfolios for which Board Member Serves: 83 |
| ——————— |
| Dr. Martin Peretz (73) |
| Board Member (2012) |
| Principal Occupation During Past 5Years: |
| • Editor-in-Chief Emeritus of The New Republic Magazine (2010-present) (previously, |
| Editor-in-Chief, 1974-2010) |
| • Director of TheStreet.com, a financial information service on the web (1996-present) |
| No. of Portfolios for which Board Member Serves: 46 |
| ——————— |
| Philip L. Toia (79) |
| Board Member (1997) |
| Principal Occupation During Past 5Years: |
| • Private Investor |
| No. of Portfolios for which Board Member Serves: 56 |
| ——————— |
| Once elected all Board Members serve for an indefinite term, but achieve Emeritus status upon reaching age 80.The |
| address of the Board Members and Officers is c/o The Dreyfus Corporation, 200 Park Avenue, NewYork, NewYork |
| 10166.Additional information about the Board Members is available in the fund’s Statement of Additional Information |
| which can be obtained from Dreyfus free of charge by calling this toll free number: 1-800-DREYFUS. |
| Daniel Rose, Emeritus Board Member |
| Sandra Vanocur, Emeritus Board Member |
The Fund 43
OFFICERS OF THE FUND (Unaudited)
44
The Fund 45
Dreyfus
India Fund
ANNUAL REPORT October 31, 2012
Save time. Save paper. View your next shareholder report online as soon as it’s available. Log into www.dreyfus.com and sign up for Dreyfus eCommunications. It’s simple and only takes a few minutes.
The views expressed in this report reflect those of the portfolio manager only through the end of the period covered and do not necessarily represent the views of Dreyfus or any other person in the Dreyfus organization. Any such views are subject to change at any time based upon market or other conditions and Dreyfus disclaims any responsibility to update such views.These views may not be relied on as investment advice and, because investment decisions for a Dreyfus fund are based on numerous factors, may not be relied on as an indication of trading intent on behalf of any Dreyfus fund.
Contents | |
THE FUND | |
| 2 | A Letter from the Chairman and CEO |
| 3 | Discussion of Fund Performance |
| 6 | Fund Performance |
| 8 | Understanding Your Fund’s Expenses |
| 8 | Comparing Your Fund’s Expenses With Those of Other Funds |
| 9 | Statement of Investments |
| 11 | Statement of Assets and Liabilities |
| 12 | Statement of Operations |
| 13 | Statement of Changes in Net Assets |
| 14 | Financial Highlights |
| 17 | Notes to Financial Statements |
| 30 | Report of Independent Registered Public Accounting Firm |
| 31 | Proxy Results |
| 32 | Information About the Renewal of the Fund’s Management and Sub-Investment Advisory Agreements |
| 38 | Board Members Information |
| 40 | Officers of the Fund |
FOR MORE INFORMATION | |
Back Cover |
Dreyfus
India Fund
The Fund
A LETTER FROM THE CHAIRMAN AND CEO

Dear Shareholder:
We are pleased to present this annual report for Dreyfus India Fund, covering the 12-month period from November 1, 2011, through October 31, 2012. For information about how the fund performed during the reporting period, as well as general market perspectives, we provide a Discussion of Fund Performance on the pages that follow.
Despite pronounced stock market weakness during the spring of 2012, stocks generally advanced over the reporting period as investors responded to encouraging macroeconomic developments throughout the world. Employment gains in the United States, credible measures to prevent a more severe banking crisis in Europe, and the likelihood of a “soft landing” for China’s economy buoyed investor sentiment, as did aggressively accommodative monetary policies from central banks in the United States, Europe, Japan and China. Consequently, U.S. stocks across all capitalization ranges posted double-digit returns, on average, for the reporting period.
In light of the easy monetary policies adopted by many countries, we expect global growth to be slightly more robust in 2013 than in 2012.The U.S. economic recovery is likely to persist at subpar levels over the first half of the new year, as growth may remain constrained by uncertainties surrounding fiscal policy and tax reforms. However, successful resolution of the current fiscal debate may prompt corporate decision-makers to increase capital spending, which could have positive implications for the U.S. economy and domestic equity markets.As always, we encourage you to stay in touch with your financial advisor as new developments unfold.
Thank you for your continued confidence and support.

Jonathan R. Baum
Chairman and Chief Executive Officer
The Dreyfus Corporation
November 15, 2012
2
DISCUSSION OF FUND PERFORMANCE
For the period of November 1, 2011, through October 31, 2012, as provided by Hugh Simon, Raymond Chan and Abhijit Sarkar, Portfolio Managers of Hamon Asian Advisors LTD, Sub-Investment Adviser
Fund and Market Performance Overview
For the 12-month period ended October 31, 2012, Dreyfus India Fund’s Class A shares produced a total return of –8.31%, Class C shares returned –9.30% and Class I shares returned –8.21%.1 In comparison, the fund’s benchmark, the MSCI India NR Index (the “Index”), produced a total return of –4.73% for the same period.2
Improving investor sentiment in the midst of tax and regulatory reforms sent stocks higher in India late in the reporting period, partly offsetting earlier weakness.The fund produced lower returns than its benchmark, largely due to its emphasis on small- and midcap stocks at a time when large-cap stocks fared better. Shortfalls were particularly apparent in the telecommunications services, financials and health care sectors.
The Fund’s Investment Approach
The fund, which seeks long-term capital appreciation, normally invests at least 80% of its net assets in equity and fixed-income securities of Indian issuers and other investments that are tied economically to India.The fund may invest in companies of any market capitalization. The fund invests in securities denominated in the Indian rupee or other local currency of issue or U.S. dollar-denominated securities.
When choosing investments, we analyze several factors, including:
Economic and political trends in India
The current financial condition and future prospects of individual companies and sectors in India
The valuation of one company or sector in India relative to that of another
We generally seek companies with accelerated earnings outlooks and reasonably valued share prices. Characteristics of such companies may include reliable corporate governance, a commitment to increasing shareholder value, strong earnings momentum with consistent free cash flow generation, sound business fundamentals and long-term vision.
The Fund 3
DISCUSSION OF FUND PERFORMANCE (continued)
Government Reforms Sparked a Late Market Rally
The reporting period began in the midst of a major stock market decline in India stemming from global economic weakness, corruption scandals in the government, and high short-term interest rates and other measures designed to forestall an unwanted acceleration of inflation.These developments drove foreign investment capital out of India and into traditional safe havens in the developed markets, reducing local market liquidity and caused the selling of perceived higher risk, smaller capitalized companies.
Fortunately, macroeconomic conditions seemed to improve in 2012, as the Reserve Bank of India appeared effective in its efforts to tame mounting inflationary pressures, and policymakers grew more comfortable reducing short-term interest rates and easing banking restrictions in order to stimulate greater economic growth.As a result, despite heightened market volatility stemming from global economic uncertainty, the overall decline in India’s stock market was largely arrested by the end of May.
Better global macroeconomic news triggered a market rally during the summer, and Indian stocks gained momentum over the final two months of the reporting period, when the government announced tax and regulatory reforms designed to open certain sectors of the nation’s economy to greater foreign ownership and investment. The ensuing upturn erased most, but not all, of the market’s previous losses.
Small- and Midcap Stocks Affected Relative Performance
While the fund participated to a degree in the market’s gains late in the reporting period, overweighted exposure to small- and midcap stocks prevented it from participating more fully in the rally. In addition, relatively heavy exposure to the telecommunications services, financials and health care sectors undermined results compared to the benchmark, and the fund encountered disappointments among some individual holdings. Reliance Communications lost value due to intensifying competitive pressures in the mobile phone market, and pharmaceutical developer Novartis India failed to meet its earnings projections. Steelmaker Jai Balaji Industries suffered amid slack demand for construction materials.
The fund achieved better results compared to its benchmark through underweighted exposure to the industrials sector and overweighted positions in the consumer staples and energy sectors. Strong performers among individual stocks included beverages producer United Spirits, which received an acquisition offer from global giant Diageo at a premium to its stock price at the time. Sugarcane processer Dhampur
4
Sugar Mills gained value when the government implemented supportive initiatives in its industry. Carmaker Tata Motors achieved higher sales volumes in domestic and international markets.
India Appears Poised for Growth
As of the reporting period’s end, we are optimistic regarding India’s economic prospects.The recent adoption of policies designed to stimulate growth and promote foreign investment are expected to continue, potentially representing significant catalysts for higher corporate earnings and rising stock prices on the subcontinent. What’s more, equity valuations generally have declined to more attractive levels and could rise as economic uncertainty wanes. Therefore, we have retained the fund’s relatively constructive investment posture, including overweighted exposure to small- and midcap stocks that have not yet responded to improved market conditions to the degree that large-cap stocks have.
November 15, 2012
Please note, the position in any security highlighted with italicized typeface was sold during the reporting period. Emerging markets, such as those of India, tend to be more volatile than the markets of more mature economies, and generally have less diverse and less mature economic structures and less stable political systems than those of developed countries.The securities of companies located in emerging markets are often subject to rapid and large changes in price. An investment in this fund should be considered only as a supplement to a complete investment program for those investors willing to accept the greater risks associated with investing in emerging market countries.
Equity funds are subject generally to market, market sector, market liquidity, issuer and investment style risks, among other factors, to varying degrees, all of which are more fully described in the fund’s prospectus.
The fund’s performance will be influenced by political, social and economic factors affecting investments in foreign companies. Special risks associated with investments in foreign companies include exposure to currency fluctuations, less liquidity, less developed or less efficient trading markets, lack of comprehensive company information, political instability and differing auditing and legal standards.These risks are enhanced in emerging market countries.
| 1 Total return includes reinvestment of dividends and any capital gains paid, and does not take into consideration the |
| maximum initial sales charge in the case of Class A shares, or the applicable contingent deferred sales charges imposed |
| on redemptions in the case of Class C shares. Had these charges been reflected, returns would have been lower. Past |
| performance is no guarantee of future results. Share price and investment return fluctuate such that upon redemption, |
| fund shares may be worth more or less than their original cost. Return figures provided reflect an undertaking for the |
| absorption of certain fund expenses by The Dreyfus Corporation through March 1, 2013, at which time it may be |
| extended, terminated or modified. Had these expenses not been absorbed, the fund’s returns would have been lower. |
| 2 SOURCE: LIPPER INC. – The MSCI India NR Index is a free float-adjusted market capitalization index |
| designed to measure the market performance, including price performance and income from dividend payments, of |
| Indian equity securities.The Index is currently composed of 7 of the top 68 companies by market capitalization listed |
| on the National Stock Exchange of India. |
The Fund 5
FUND PERFORMANCE
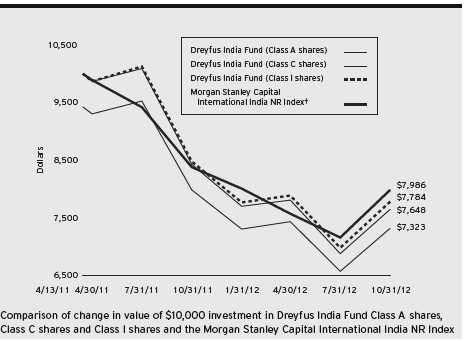
† Source: Lipper Inc.
Past performance is not predictive of future performance.
The above graph compares a $10,000 investment made in each of the Class A, Class C and Class I shares of Dreyfus India Fund on 4/13/11 (inception date) to a $10,000 investment made in the Morgan Stanley Capital International India NR Index (the “Index”) on that date.All dividends and capital gain distributions are reinvested.
The fund’s performance shown in the line graph above takes into account the maximum initial sales charge on Class A shares and all other applicable fees and expenses on all classes.The Index is a free-float adjusted market capitalization weighted index that monitors the performance of stocks from the country of India. Unlike a mutual fund, the Index is not subject to charges, fees and other expenses. Investors cannot invest directly in any index.These factors can contribute to the Index potentially outperforming the fund. Further information relating to fund expenses, including expense reimbursements, if applicable, is contained in the Financial Highlights section of the prospectus and elsewhere in this report.
6
| Average Annual Total Returns as of 10/31/12 | |||||
| Inception | From | ||||
| Date | 1 | Year | Inception | ||
| Class A shares | |||||
| with maximum sales charge (5.75%) | 4/13/11 | –13.61 | % | –18.21 | % |
| without sales charge | 4/13/11 | –8.31 | % | –15.04 | % |
| Class C shares | |||||
| with applicable redemption charge † | 4/13/11 | –10.21 | % | –15.89 | % |
| without redemption | 4/13/11 | –9.30 | % | –15.89 | % |
| Class I shares | 4/13/11 | –8.21 | % | –14.92 | % |
| Morgan Stanley Capital | |||||
| International India NR Index | 3/31/11 | –4.73 | % | –13.24 | %†† |
Past performance is not predictive of future performance.The fund’s performance shown in the graph and table does not reflect the deduction of taxes that a shareholder would pay on fund distributions or the redemption of fund shares.
| † | The maximum contingent deferred sales charge for Class C shares is 1% for shares redeemed within one year of the |
| date of purchase. | |
| †† | For comparative purposes, the value of the Index as of 3/31/11 is used as the beginning value on 4/13/11. |
The Fund 7
UNDERSTANDING YOUR FUND’S EXPENSES (Unaudited)
As a mutual fund investor, you pay ongoing expenses, such as management fees and other expenses. Using the information below, you can estimate how these expenses affect your investment and compare them with the expenses of other funds.You also may pay one-time transaction expenses, including sales charges (loads) and redemption fees, which are not shown in this section and would have resulted in higher total expenses. For more information, see your fund’s prospectus or talk to your financial adviser.
Review your fund’s expenses
The table below shows the expenses you would have paid on a $1,000 investment in Dreyfus India Fund from May 1, 2012 to October 31, 2012. It also shows how much a $1,000 investment would be worth at the close of the period, assuming actual returns and expenses.
Expenses and Value of a $1,000 Investment
assuming actual returns for the six months ended October 31, 2012
| Class A | Class C | Class I | ||||
| Expenses paid per $1,000† | $ | 9.98 | $ | 13.68 | $ | 8.74 |
| Ending value (after expenses) | $ | 984.80 | $ | 979.50 | $ | 986.80 |
COMPARING YOUR FUND’S EXPENSES
WITH THOSE OF OTHER FUNDS (Unaudited)
Using the SEC’s method to compare expenses
The Securities and Exchange Commission (SEC) has established guidelines to help investors assess fund expenses. Per these guidelines, the table below shows your fund’s expenses based on a $1,000 investment, assuming a hypothetical 5% annualized return. You can use this information to compare the ongoing expenses (but not transaction expenses or total cost) of investing in the fund with those of other funds.All mutual fund shareholder reports will provide this information to help you make this comparison. Please note that you cannot use this information to estimate your actual ending account balance and expenses paid during the period.
Expenses and Value of a $1,000 Investment
assuming a hypothetical 5% annualized return for the six months ended October 31, 2012
| Class A | Class C | Class I | ||||
| Expenses paid per $1,000† | $ | 10.13 | $ | 13.90 | $ | 8.87 |
| Ending value (after expenses) | $ | 1,015.08 | $ | 1,011.31 | $ | 1,016.34 |
| † Expenses are equal to the fund’s annualized expense ratio of 2.00% for Class A, 2.75% for Class C and 1.75% |
| for Class I,multiplied by the average account value over the period, multiplied by 184/366 (to reflect the one-half |
| year period). |
8
STATEMENT OF INVESTMENTS
October 31, 2012
| Common Stocks—101.9% | Shares | Value ($) | ||
| Automobiles & Components—5.6% | ||||
| Tata Motors | 31,500 | 149,171 | ||
| Banks—13.7% | ||||
| Canara Bank | 16,000 | 119,238 | ||
| Punjab & Sind Bank | 70,000 | 84,320 | ||
| State Bank of India | 1,100 | 43,150 | ||
| UCO Bank | 85,000 | 115,108 | ||
| 361,816 | ||||
| Capital Goods—14.2% | ||||
| Hindustan Construction | 140,000 | a | 44,242 | |
| Ingersoll-Rand India | 15,000 | 135,375 | ||
| Larsen & Toubro | 2,000 | 60,483 | ||
| Schneider Electric Infrastructure | 40,000 | 67,962 | ||
| Sintex Industries | 57,000 | 68,396 | ||
| 376,458 | ||||
| Diversified Financials—3.9% | ||||
| IFCI | 200,000 | 103,169 | ||
| Food, Beverage & Tobacco—13.9% | ||||
| Balrampur Chini Mills | 25,000 | a | 31,718 | |
| Dhampur Sugar Mills | 50,000 | 63,389 | ||
| Nestle India | 1,550 | 135,424 | ||
| United Spirits | 6,200 | 135,508 | ||
| 366,039 | ||||
| Insurance—5.0% | ||||
| Reliance Capital | 18,500 | 131,352 | ||
| Materials—1.0% | ||||
| Ess Dee Aluminium | 5,000 | 25,579 | ||
| Media—10.6% | ||||
| DEN Networks | 13,512 | a | 44,822 | |
| Hinduja Ventures | 13,861 | 121,385 | ||
| Prime Focus | 100,000 a | 89,878 | ||
| Reliance Broadcast Network | 30,000 | a | 23,757 | |
| 279,842 | ||||
| Pharmaceuticals, Biotech & | ||||
| Life Sciences—9.8% | ||||
| Novartis India | 10,000 | 124,473 | ||
| Parabolic Drugs | 180,000 | 80,305 | ||
The Fund 9
STATEMENT OF INVESTMENTS (continued)
| Common Stocks (continued) | Shares | Value ($) | |||||
| Pharmaceuticals, Biotech & | |||||||
| Life Sciences (continued) | |||||||
| Pfizer | 2,500 | 52,937 | |||||
| 257,715 | |||||||
| Telecommunication Services—10.4% | |||||||
| OnMobile Global | 50,000 | 36,202 | |||||
| Reliance Communications | 130,000 | 130,495 | |||||
| SITI Cable Network | 99,052 | a | 38,299 | ||||
| Tulip Telecom | 100,000 | a | 69,430 | ||||
| 274,426 | |||||||
| Utilities—13.8% | |||||||
| Indiabulls Infrastructure and Power | 132,750 | a | 15,670 | ||||
| Jaiprakash Associates | 37,223 | 60,441 | |||||
| NCC | 90,000 | 72,776 | |||||
| Reliance Infrastructure | 13,000 | 113,459 | |||||
| Reliance Power | 60,000 | a | 103,114 | ||||
| 365,460 | |||||||
| Total Investments (cost $3,021,892) | 101.9 | % | 2,691,027 | ||||
| Liabilities, Less Cash and Receivables | (1.9 | %) | (49,823 | ) | |||
| Net Assets | 100.0 | % | 2,641,204 | ||||
| a Non-income producing security. | |||||||
| Portfolio Summary (Unaudited)† | |||||||
| Value (%) | Value (%) | ||||||
| Capital Goods | 14.2 | Pharmaceuticals, Biotech & Life Sciences 9.8 | |||||
| Food, Beverage & Tobacco | 13.9 | Automobiles & Components | 5.6 | ||||
| Utilities | 13.8 | Insurance | 5.0 | ||||
| Banks | 13.7 | Diversified Financials | 3.9 | ||||
| Media | 10.6 | Materials | 1.0 | ||||
| Telecommunication Services | 10.4 | 101.9 | |||||
| † Based on net assets. | |||||||
| See notes to financial statements. | |||||||
10
STATEMENT OF ASSETS AND LIABILITIES
October 31, 2012
| Cost | Value | |||
| Assets ($): | ||||
| Investments in securities—See Statement of Investments | 3,021,892 | 2,691,027 | ||
| Cash | 36,648 | |||
| Cash denominated in foreign currencies | 15,420 | 15,615 | ||
| Prepaid expenses | 8,120 | |||
| 2,751,410 | ||||
| Liabilities ($): | ||||
| Due to The Dreyfus Corporation and affiliates—Note 3(c) | 1,940 | |||
| Payable for investment securities purchased | 46,843 | |||
| Accrued expenses | 61,423 | |||
| 110,206 | ||||
| Net Assets ($) | 2,641,204 | |||
| Composition of Net Assets ($): | ||||
| Paid-in capital | 3,442,914 | |||
| Accumulated investment (loss)—net | (41,599 | ) | ||
| Accumulated net realized gain (loss) on investments | (429,545 | ) | ||
| Accumulated net unrealized appreciation (depreciation) | ||||
| on investments and foreign currency transactions | (330,566 | ) | ||
| Net Assets ($) | 2,641,204 | |||
| Net Asset Value Per Share | ||||
| Class A | Class C | Class I | ||
| Net Assets ($) | 1,434,627 | 766,029 | 440,548 | |
| Shares Outstanding | 147,890 | 80,196 | 45,307 | |
| Net Asset Value Per Share ($) | 9.70 | 9.55 | 9.72 | |
| See notes to financial statements. | ||||
The Fund 11
| STATEMENT OF OPERATIONS | ||
| Year Ended October 31, 2012 | ||
| Investment Income ($): | ||
| Income: | ||
| Cash dividends: | ||
| Unaffiliated issuers | 41,232 | |
| Affiliated issuers | 24 | |
| Total Income | 41,256 | |
| Expenses: | ||
| Management fee—Note 3(a) | 37,308 | |
| Auditing fees | 66,099 | |
| Registration fees | 57,202 | |
| Legal fees | 40,557 | |
| Custodian fees—Note 3(c) | 32,496 | |
| Prospectus and shareholders’ reports | 16,330 | |
| Shareholder servicing costs—Note 3(c) | 11,958 | |
| Distribution fees—Note 3(b) | 5,287 | |
| Directors’ fees and expenses—Note 3(d) | 472 | |
| Loan commitment fees—Note 2 | 6 | |
| Miscellaneous | 15,331 | |
| Total Expenses | 283,046 | |
| Less—reduction in expenses due to undertaking—Note 3(a) | (219,664 | ) |
| Less—reduction in fees due to earnings credits—Note 3(c) | (8 | ) |
| Net Expenses | 63,374 | |
| Investment (Loss)—Net | (22,118 | ) |
| Realized and Unrealized Gain (Loss) on Investments—Note 4 ($): | ||
| Net realized gain (loss) on investments and foreign currency transactions | (319,327 | ) |
| Net realized gain (loss) on forward foreign currency exchange contracts | (3,830 | ) |
| Net Realized Gain (Loss) | (323,157 | ) |
| Net unrealized appreciation (depreciation) on | ||
| investments and foreign currency transactions | (41,318 | ) |
| Net Realized and Unrealized Gain (Loss) on Investments | (364,475 | ) |
| Net (Decrease) in Net Assets Resulting from Operations | (386,593 | ) |
| See notes to financial statements. | ||
12
STATEMENT OF CHANGES IN NET ASSETS
| Year Ended October 31, | ||||
| 2012 | 2011 | a | ||
| Operations ($): | ||||
| Investment income (loss)—net | (22,118 | ) | 11,841 | |
| Net realized gain (loss) on investments | (323,157 | ) | (147,694 | ) |
| Net unrealized appreciation | ||||
| (depreciation) on investments | (41,318 | ) | (289,248 | ) |
| Net Increase (Decrease) in Net Assets | ||||
| Resulting from Operations | (386,593 | ) | (425,101 | ) |
| Capital Stock Transactions ($): | ||||
| Net proceeds from shares sold: | ||||
| Class A Shares | 1,528,331 | 2,639,113 | ||
| Class C Shares | 603,249 | 672,916 | ||
| Class I Shares | 656,261 | 544,100 | ||
| Cost of shares redeemed: | ||||
| Class A Shares | (1,504,838 | ) | (770,653 | ) |
| Class C Shares | (328,147 | ) | — | |
| Class I Shares | (587,434 | ) | — | |
| Increase (Decrease) in Net Assets | ||||
| from Capital Stock Transactions | 367,422 | 3,085,476 | ||
| Total Increase (Decrease) in Net Assets | (19,171 | ) | 2,660,375 | |
| Net Assets ($): | ||||
| Beginning of Period | 2,660,375 | — | ||
| End of Period | 2,641,204 | 2,660,375 | ||
| Accumulated investment (loss)—net | (41,599 | ) | (3,199 | ) |
| Capital Share Transactions (Shares): | ||||
| Class A | ||||
| Shares sold | 158,060 | 222,073 | ||
| Shares redeemed | (163,347 | ) | (68,896 | ) |
| Net Increase (Decrease) in Shares Outstanding | (5,287 | ) | 153,177 | |
| Class C | ||||
| Shares sold | 60,472 | 54,647 | ||
| Shares redeemed | (34,923 | ) | — | |
| Net Increase (Decrease) in Shares Outstanding | 25,549 | 54,647 | ||
| Class I | ||||
| Shares sold | 69,120 | 43,566 | ||
| Shares redeemed | (67,379 | ) | — | |
| Net Increase (Decrease) in Shares Outstanding | 1,741 | 43,566 | ||
| a From April 13, 2011 (commencement of operations) to October 31, 2011. | ||||
| See notes to financial statements. | ||||
The Fund 13
FINANCIAL HIGHLIGHTS
The following tables describe the performance for each share class for the fiscal periods indicated.All information (except portfolio turnover rate) reflects financial results for a single fund share.Total return shows how much your investment in the fund would have increased (or decreased) during each period, assuming you had reinvested all dividends and distributions.These figures have been derived from the fund’s financial statements.
| Year Ended October 31, | ||||
| Class A Shares | 2012 | 2011 | a | |
| Per Share Data ($): | ||||
| Net asset value, beginning of period | 10.59 | 12.50 | ||
| Investment Operations: | ||||
| Investment income (loss)—netb | (.05 | ) | .06 | |
| Net realized and unrealized | ||||
| gain (loss) on investments | (.87 | ) | (1.98 | ) |
| Total from Investment Operations | (.92 | ) | (1.92 | ) |
| Proceeds from redemption feesc | .03 | .01 | ||
| Net asset value, end of period | 9.70 | 10.59 | ||
| Total Return (%)d | (8.31 | ) | (15.28 | )e |
| Ratios/Supplemental Data (%): | ||||
| Ratio of total expenses to average net assets | 9.60 | 12.82 | f | |
| Ratio of net expenses to average net assets | 2.00 | 2.00 | f | |
| Ratio of net investment income | ||||
| (loss) to average net assets | (.58 | ) | .98 | f |
| Portfolio Turnover Rate | 119.55 | 36.45 | e | |
| Net Assets, end of period ($ x 1,000) | 1,435 | 1,622 | ||
| a | From April 13, 2011 (commencement of operations) to October 31, 2011. |
| b | Based on average shares outstanding at each month end. |
| c | See Note 3(e). |
| d | Exclusive of sales charge. |
| e | Not annualized. |
| f | Annualized. |
See notes to financial statements.
14
| Year Ended October 31, | ||||
| Class C Shares | 2012 | 2011 | a | |
| Per Share Data ($): | ||||
| Net asset value, beginning of period | 10.54 | 12.50 | ||
| Investment Operations: | ||||
| Investment income (loss)—netb | (.12 | ) | .01 | |
| Net realized and unrealized | ||||
| gain (loss) on investments | (.90 | ) | (1.98 | ) |
| Total from Investment Operations | (1.02 | ) | (1.97 | ) |
| Proceeds from redemption feesc | .03 | .01 | ||
| Net asset value, end of period | 9.55 | 10.54 | ||
| Total Return (%)d | (9.30 | ) | (15.68 | )e |
| Ratios/Supplemental Data (%): | ||||
| Ratio of total expenses to average net assets | 9.87 | 13.73 | f | |
| Ratio of net expenses to average net assets | 2.75 | 2.75 | f | |
| Ratio of net investment income | ||||
| (loss) to average net assets | (1.24 | ) | .19 | f |
| Portfolio Turnover Rate | 119.55 | 36.45 | e | |
| Net Assets, end of period ($ x 1,000) | 766 | 576 | ||
| a | From April 13, 2011 (commencement of operations) to October 31, 2011. |
| b | Based on average shares outstanding at each month end. |
| c | See Note 3(e). |
| d | Exclusive of sales charge. |
| e | Not annualized. |
| f | Annualized. |
See notes to financial statements.
The Fund 15
FINANCIAL HIGHLIGHTS (continued)
| Year Ended October 31, | ||||
| Class I Shares | 2012 | 2011 | a | |
| Per Share Data ($): | ||||
| Net asset value, beginning of period | 10.60 | 12.50 | ||
| Investment Operations: | ||||
| Investment income (loss)—netb | (.06 | ) | .07 | |
| Net realized and unrealized | ||||
| gain (loss) on investments | (.85 | ) | (1.98 | ) |
| Total from Investment Operations | (.91 | ) | (1.91 | ) |
| Proceeds from redemption feesc | .03 | .01 | ||
| Net asset value, end of period | 9.72 | 10.60 | ||
| Total Return (%) | (8.21 | ) | (15.20 | )d |
| Ratios/Supplemental Data (%): | ||||
| Ratio of total expenses to average net assets | 8.71 | 12.99 | e | |
| Ratio of net expenses to average net assets | 1.75 | 1.75 | e | |
| Ratio of net investment income | ||||
| (loss) to average net assets | (.60 | ) | 1.10 | e |
| Portfolio Turnover Rate | 119.55 | 36.45 | d | |
| Net Assets, end of period ($ x 1,000) | 441 | 462 | ||
| a | From April 13, 2011 (commencement of operations) to October 31, 2011. |
| b | Based on average shares outstanding at each month end. |
| c | See Note 3(e). |
| d | Not annualized. |
| e | Annualized. |
See notes to financial statements.
16
NOTES TO FINANCIAL STATEMENTS
NOTE 1—Significant Accounting Policies:
Dreyfus India Fund (the “fund”) is a separate non-diversified series of Dreyfus Premier Investment Funds, Inc. (the “Company”), which is registered under the Investment Company Act of 1940, as amended (the “Act”), as an open-end management investment company and operates as a series company currently offering eight series, including the fund. The fund’s investment objective is to seek long-term capital apprecia-tion.The Dreyfus Corporation (the “Manager” or “Dreyfus”), a wholly-owned subsidiary of The Bank of New York Mellon Corporation (“BNY Mellon”), serves as the fund’s investment adviser. Hamon Asian Advisors Ltd. (“Hamon”), a wholly-owned subsidiary of BNY Mellon, serves as the fund’s sub-investment adviser. Effective November 4, 2011, Hamon U.S. Investment Advisors Ltd. changed the company’s name to Hamon Asian Advisors Ltd. Hamon is an affiliate of Dreyfus.
MBSC Securities Corporation (the “Distributor”), a wholly-owned subsidiary of Dreyfus, is the distributor of the fund’s shares.The fund is authorized to issue 100 million shares of $.001 par value Common Stock in each of the following classes of shares: Class A, Class C and Class I. Class A shares are subject to a sales charge imposed at the time of purchase. Class C shares are subject to a contingent deferred sales charge (“CDSC”) imposed on Class C shares redeemed within one year of purchase. Class I shares are sold at net asset value per share only to institutional investors. Other differences between the classes include the services offered to and the expenses borne by each class, the allocation of certain transfer agency costs and certain voting rights. Income, expenses (other than expenses attributable to a specific class) and realized and unrealized gains or losses on investments are allocated to each class of shares based on its relative net assets.
As of October 31, 2012, MBC Investments Corp., an indirect subsidiary of BNY Mellon, held 30,091 Class A, 40,000 Class C and 40,000 Class I shares of the fund.
The Fund 17
NOTES TO FINANCIAL STATEMENTS (continued)
The Company accounts separately for the assets, liabilities and operations of each series. Expenses directly attributable to each series are charged to that series’ operations; expenses which are applicable to all series are allocated among them on a pro rata basis.
The Financial Accounting Standards Board (“FASB”) Accounting Standards Codification is the exclusive reference of authoritative U.S. generally accepted accounting principles (“GAAP”) recognized by the FASB to be applied by nongovernmental entities. Rules and interpretive releases of the Securities and Exchange Commission (“SEC”) under authority of federal laws are also sources of authoritative GAAP for SEC registrants. The fund’s financial statements are prepared in accordance with GAAP, which may require the use of management estimates and assumptions.Actual results could differ from those estimates.
The Company enters into contracts that contain a variety of indemnifications.The fund’s maximum exposure under these arrangements is unknown.The fund does not anticipate recognizing any loss related to these arrangements.
(a) Portfolio valuation: The fair value of a financial instrument is the amount that would be received to sell an asset or paid to transfer a liability in an orderly transaction between market participants at the measurement date (i.e., the exit price). GAAP establishes a fair value hierarchy that prioritizes the inputs of valuation techniques used to measure fair value.This hierarchy gives the highest priority to unadjusted quoted prices in active markets for identical assets or liabilities (Level 1 measurements) and the lowest priority to unobservable inputs (Level 3 measurements).
Additionally, GAAP provides guidance on determining whether the volume and activity in a market has decreased significantly and whether such a decrease in activity results in transactions that are not orderly. GAAP requires enhanced disclosures around valuation inputs and techniques used during annual and interim periods.
18
Various inputs are used in determining the value of the fund’s investments relating to fair value measurements.These inputs are summarized in the three broad levels listed below:
Level 1—unadjusted quoted prices in active markets for identical investments.
Level 2—other significant observable inputs (including quoted prices for similar investments, interest rates, prepayment speeds, credit risk, etc.).
Level 3—significant unobservable inputs (including the fund’s own assumptions in determining the fair value of investments).
The inputs or methodology used for valuing securities are not necessarily an indication of the risk associated with investing in those securities.
Changes in valuation techniques may result in transfers in or out of an assigned level within the disclosure hierarchy. Valuation techniques used to value the fund’s investments are as follows:
Investments in securities are valued at the last sales price on the securities exchange or national securities market on which such securities are primarily traded. Securities listed on the National Market System for which market quotations are available are valued at the official closing price or, if there is no official closing price that day, at the last sales price. Securities not listed on an exchange or the national securities market, or securities for which there were no transactions, are valued at the average of the most recent bid and asked prices, except for open short positions, where the asked price is used for valuation purposes. Bid price is used when no asked price is available. Registered investment companies that are not traded on an exchange are valued at their net asset value. All of the preceding securities are categorized within Level 1 of the fair value hierarchy.
The Fund 19
NOTES TO FINANCIAL STATEMENTS (continued)
Fair valuing of securities may be determined with the assistance of a pricing service using calculations based on indices of domestic securities and other appropriate indicators, such as prices of relevant American Depository Receipts and financial futures. Utilizing these techniques may result in transfers between Level 1 and Level 2 of the fair value hierarchy.
When market quotations or official closing prices are not readily available, or are determined not to reflect accurately fair value, such as when the value of a security has been significantly affected by events after the close of the exchange or market on which the security is principally traded (for example, a foreign exchange or market), but before the fund calculates its net asset value, the fund may value these investments at fair value as determined in accordance with the procedures approved by the Company’s Board of Directors (the “Board”). Certain factors may be considered when fair valuing investments such as: fundamental analytical data, the nature and duration of restrictions on disposition, an evaluation of the forces that influence the market in which the securities are purchased and sold, and public trading in similar securities of the issuer or comparable issuers. These securities are either categorized as Level 2 or 3 depending on the relevant inputs used.
For restricted securities where observable inputs are limited, assumptions about market activity and risk are used and are categorized within Level 3 of the fair value hierarchy.
Investments denominated in foreign currencies are translated to U.S. dollars at the prevailing rates of exchange.
Forward foreign currency exchange contracts (“forward contracts”) are valued at the forward rate. These securities are generally categorized within Level 2 of the fair value hierarchy.
20
The following is a summary of the inputs used as of October 31, 2012 in valuing the fund’s investments:
| Level 2—Other | Level 3— | |||
| Level 1— | Significant | Significant | ||
| Unadjusted | Observable | Unobservable | ||
| Quoted Prices | Inputs | Inputs | Total | |
| Assets ($) | ||||
| Investments in Securities: | ||||
| Equity Securities—Foreign | ||||
| Common Stocks† | 2,691,027 | — | — | 2,691,027 |
| † See Statement of Investments for additional detailed categorizations. | ||||
At October 31, 2011, $2,580,227 of exchange traded foreign equity securities were classified within Level 2 of the fair value hierarchy pursuant to the fund’s fair valuation procedures.
(b) Foreign currency transactions: The fund does not isolate that portion of the results of operations resulting from changes in foreign exchange rates on investments from the fluctuations arising from changes in market prices of securities held. Such fluctuations are included with the net realized and unrealized gain or loss on investments.
Net realized foreign exchange gains or losses arise from sales of foreign currencies, currency gains or losses realized on securities transactions between trade and settlement date and the difference between the amounts of dividends, interest and foreign withholding taxes recorded on the fund’s books and the U.S. dollar equivalent of the amounts actually received or paid. Net unrealized foreign exchange gains and losses arise from changes in the value of assets and liabilities other than investments resulting from changes in exchange rates. Foreign currency gains and losses on investments are also included with net realized and unrealized gain or loss on investments.
The Fund 21
NOTES TO FINANCIAL STATEMENTS (continued)
(c) Securities transactions and investment income: Securities transactions are recorded on a trade date basis. Realized gains and losses from securities transactions are recorded on the identified cost basis. Dividend income is recognized on the ex-dividend date and interest income, including, where applicable, accretion of discount and amortization of premium on investments, is recognized on the accrual basis.
(d) Affiliated issuers: Investments in other investment companies advised by Dreyfus are defined as “affiliated” in the Act. Investments in affiliated investment companies for the period ended October 31, 2012 were as follows:
| Affiliated | |||||||
| Investment | Value | Value | Net | ||||
| Company | 10/31/2011 | ($) | Purchases ($) | Sales ($) | 10/31/2012 | ($) | Assets (%) |
| Dreyfus | |||||||
| Institutional | |||||||
| Preferred | |||||||
| Plus Money | |||||||
| Market Fund | — | 1,830,000 | 1,830,000 | — | — |
(e) Risk: Investing in foreign markets may involve special risks and considerations not typically associated with investing in the U.S.These risks include revaluation of currencies, high rates of inflation, repatriation restrictions on income and capital, and adverse political and economic developments. Moreover, securities issued in these markets may be less liquid, subject to government ownership controls and delayed settlements, and their prices may be more volatile than those of comparable securities in the U.S.
The fund follows an investment policy of investing primarily in the securities of Indian issuers and other investments that are tied economically to India. Because the fund’s investments are concentrated in India, the fund’s performance is expected to be closely tied to social, political and economic conditions within India and to be more volatile than the performance of more geographically diversified funds.
(f) Dividends to shareholders: Dividends are recorded on the ex-dividend date. Dividends from investment income-net and dividends from net realized capital gains, if any, are normally declared and paid
22
annually, but the fund may make distributions on a more frequent basis to comply with the distribution requirements of the Internal Revenue Code of 1986, as amended (the “Code”).To the extent that net realized capital gains can be offset by capital loss carryovers, it is the policy of the fund not to distribute such gains. Income and capital gain distributions are determined in accordance with income tax regulations, which may differ from GAAP.
(g) Federal income taxes: It is the policy of the fund to continue to qualify as a regulated investment company, if such qualification is in the best interests of its shareholders, by complying with the applicable provisions of the Code, and to make distributions of taxable income sufficient to relieve it from substantially all federal income and excise taxes.
As of and during the period ended October 31, 2012, the fund did not have any liabilities for any uncertain tax positions.The fund recognizes interest and penalties, if any, related to uncertain tax positions as income tax expense in the Statement of Operations. During the period, the fund did not incur any interest or penalties.
Each of the tax years in the two-year period ended October 31, 2012 remains subject to examination by the Internal Revenue Service and state taxing authorities.
At October 31, 2012, the components of accumulated earnings on a tax basis were as follows: accumulated capital losses $387,926 and unrealized depreciation $400,771. In addition, the fund deferred for tax purposes late year ordinary losses of $13,013 to the first day of the following fiscal year.
Under the Regulated Investment Company Modernization Act of 2010 (the “2010 Act”), the fund is permitted to carry forward capital losses incurred in taxable years beginning after December 22, 2010 (“post-enactment losses”) for an unlimited period. Furthermore, post-enactment capital loss carryovers retain their character as either short-term or long-term capital losses rather than short-term as they were under previous statute.
The Fund 23
NOTES TO FINANCIAL STATEMENTS (continued)
The accumulated capital loss carryover is available for federal income tax purposes to be applied against future net realized capital gains, if any, realized subsequent to October 31, 2012.The fund has $336,812 of post-enactment short-term capital losses and $51,114 of post-enactment long-term capital losses which can be carried forward for an unlimited period.
During the period ended October 31, 2012, as a result of permanent book to tax differences, primarily due to the tax treatment for foreign currency gains and losses and net operating losses, the fund decreased accumulated undistributed investment income-net by $16,282, increased accumulated net realized gain (loss) on investments by $21,688 and decreased paid-in capital by $5,406. Net assets and net asset value per share were not affected by this reclassification.
(h) New Accounting Pronouncement: In December 2011, FASB issued Accounting Standards Update No. 2011-11 “Disclosures about Offsetting Assets and Liabilities” (“ASU 2011-11”). These disclosure requirements are intended to help investors and other financial statement users to better assess the effect or potential effect of offsetting arrangements on a company’s financial position.They also improve transparency in the reporting of how companies mitigate credit risk, including disclosure of related collateral pledged or received. In addition,ASU 2011-11 facilitates comparison between those entities that prepare their financial statements on the basis of GAAP and those entities that prepare their financial statements on the basis of International Financial Reporting Standards (“IFRS”). ASU 2011-11 requires entities to: disclose both gross and net information about both instruments and transactions eligible for offset in the financial statements; and disclose instruments and transactions subject to an agreement similar to a master netting agreement. ASU 2011-11 is effective for fiscal years beginning on or after January 1, 2013, and interim periods within those annual periods. At this time, management is evaluating the implications of ASU 2011-11 and its impact on the fund’s financial statement disclosures.
24
NOTE 2—Bank Lines of Credit:
The fund participates with other Dreyfus-managed funds in a $225 million unsecured credit facility led by Citibank, N.A. and a $300 million unsecured credit facility provided by The Bank of New York Mellon, a subsidiary of BNY Mellon and an affiliate of Dreyfus (each, a “Facility”), each to be utilized primarily for temporary or emergency purposes, including the financing of redemptions. Effective October 10, 2012, the $225 million unsecured credit facility with Citibank, N.A., was decreased to $210 million. In connection therewith, the fund has agreed to pay its pro rata portion of commitment fees for each Facility. Interest is charged to the fund based on rates determined pursuant to the terms of the respective Facility at the time of borrowing. During the period ended October 31, 2012, the fund did not borrow under the Facilities.
NOTE 3—Management Fee, Sub-Investment Advisory Fee and Other Transactions with Affiliates:
(a) Pursuant to a management agreement with Dreyfus, the management fee is computed at the annual rate of 1.25% of the value of the fund’s average daily net assets and is payable monthly.
Dreyfus has contractually agreed until March 1, 2013, to waive receipt of its fees and/or assume the expenses of the fund so that the expenses of none of the classes (excluding Rule 12b-1 Distribution Plan fees, Shareholder Services Plan fees, taxes, interest expense, brokerage commissions, commitment fees on borrowings and extraordinary expenses) exceed 1.75% of the value of the fund’s average daily net assets.The reduction in expenses, pursuant to the undertaking, amounted to $219,664 during the period ended October 31, 2012.
Pursuant to a sub-investment advisory agreement between Dreyfus and Hamon, Dreyfus pays Hamon a fee at the annual rate of .625% of the value of the fund’s average daily net assets and is payable monthly.
The Fund 25
NOTES TO FINANCIAL STATEMENTS (continued)
During the period ended October 31, 2012, the Distributor retained $364 from commissions earned on sales of the fund’s Class A shares and $1,291 from CDSCs on redemptions of the fund’s Class C shares.
(b) Under the Distribution Plan adopted pursuant to Rule 12b-1 under the Act, Class C shares pay the Distributor for distributing its shares at an annual rate of .75% of the value of the average daily net assets of Class C shares. During the period ended October 31, 2012, Class C shares were charged $5,287 pursuant to the Distribution Plan.
(c) Under the Shareholder Services Plan, Class A and Class C shares pay the Distributor at an annual rate of .25% of the value of their average daily net assets for the provision of certain services.The services provided may include personal services relating to shareholder accounts, such as answering shareholder inquiries regarding the fund and providing reports and other information, and services related to the maintenance of shareholder accounts.The Distributor may make payments to Service Agents (securities dealers, financial institutions or other industry professionals) in respect of these services. The Distributor determines the amounts to be paid to Service Agents. During the period ended October 31, 2012, Class A and Class C shares were charged $4,174 and $1,762, respectively, pursuant to the Shareholder Services Plan.
The fund has arrangements with the transfer agent and the custodian whereby the fund may receive earnings credits when positive cash balances are maintained, which are used to offset transfer agency and custody fees. For financial reporting purposes, the fund includes net earnings credits as an expense offset in the Statement of Operations.
The fund compensates DreyfusTransfer, Inc. (“DTI”), a wholly-owned subsidiary of Dreyfus, under a transfer agency agreement for providing transfer agency services for the fund and, since May 29, 2012, cash management services related to fund subscriptions and redemptions. During the period ended October 31, 2012, the fund was charged $2,246 for transfer agency services and $31 for cash management services. Cash management fees were partially offset by earnings credits
26
of $4. These fees are included in Shareholder servicing costs in the Statement of Operations.
The fund compensatesThe Bank of NewYork Mellon under a custody agreement for providing custodial services for the fund. During the period ended October 31, 2012, the fund was charged $32,496 pursuant to the custody agreement.
Prior to May 29, 2012, the fund compensated The Bank of NewYork Mellon under a cash management agreement for performing cash management services related to fund subscriptions and redemptions. During the period ended October 31, 2012, the fund was charged $112 pursuant to the cash management agreement, which is included in Shareholder servicing costs in the Statement of Operations. These fees were partially offset by earnings credits of $4.
During the period ended October 31, 2012, the fund was charged $8,517 for services performed by the Chief Compliance Officer and his staff.
The components of “Due to The Dreyfus Corporation and affiliates” in the Statement of Assets and Liabilities consist of: management fees $2,992, Distribution Plan fees $523, Shareholder Services Plan fees $496, custodian fees $6,963, Chief Compliance Officer fees $2,654 and transfer agency fees $314, which are offset against an expense reimbursement currently in effect in the amount of $12,002.
(d) Each Board member also serves as a Board member of other funds within the Dreyfus complex. Annual retainer fees and attendance fees are allocated to each fund based on net assets.
(e) A 2% redemption fee is charged and retained by the fund on certain shares redeemed within sixty days following the date of issuance subject to exceptions, including redemptions made through the use of the fund’s exchange privilege. During the period ended October 31, 2012, the fund charged and retained $8,115 in redemption fees.
The Fund 27
NOTES TO FINANCIAL STATEMENTS (continued)
NOTE 4—Securities Transactions:
The aggregate amount of purchases and sales of investment securities, excluding short-term securities and forward contracts, during the period ended October 31, 2012, amounted to $3,898,895 and $3,488,914, respectively.
Derivatives: A derivative is a financial instrument whose performance is derived from the performance of another asset. Each type of derivative instrument that was held by the fund during the period ended October 31, 2012 is discussed below.
Forward Foreign Currency Exchange Contracts: The fund enters into forward contracts in order to hedge its exposure to changes in foreign currency exchange rates on its foreign portfolio holdings, to settle foreign currency transactions or as a part of its investment strategy. When executing forward contracts, the fund is obligated to buy or sell a foreign currency at a specified rate on a certain date in the future. With respect to sales of forward contracts, the fund incurs a loss if the value of the contract increases between the date the forward contract is opened and the date the forward contract is closed.The fund realizes a gain if the value of the contract decreases between those dates.With respect to purchases of forward contracts, the fund incurs a loss if the value of the contract decreases between the date the forward contract is opened and the date the forward contract is closed.The fund realizes a gain if the value of the contract increases between those dates. Any realized or unrealized gains or losses which occurred during the period are reflected in the Statement of Operations. The fund is exposed to
28
foreign currency risk as a result of changes in value of underlying financial instruments.The fund is also exposed to credit risk associated with counterparty nonperformance on these forward contracts, which is typically limited to the unrealized gain on each open contract. At October 31, 2012, there were no forward contracts outstanding.
At October 31, 2012, the cost of investments for federal income tax purposes was $3,092,097; accordingly, accumulated net unrealized depreciation on investments was $401,070, consisting of $121,713 gross unrealized appreciation and $522,783 gross unrealized depreciation.
The Fund 29
REPORT OF INDEPENDENT REGISTERED
PUBLIC ACCOUNTING FIRM
Shareholders and Board of Directors
Dreyfus India Fund
We have audited the accompanying statement of assets and liabilities, including the statement of investments, of Dreyfus India Fund (one of the series comprising Dreyfus Premier Investment Funds, Inc.) as of October 31, 2012, and the related statement of operations for the year then ended and the statement of changes in net assets and financial highlights for the year then ended and for the period from April 13, 2011 (commencement of operations) to October 31, 2011. These financial statements and financial highlights are the responsibility of the Fund’s management. Our responsibility is to express an opinion on these financial statements and financial highlights based on our audits.
We conducted our audits in accordance with the standards of the Public Company Accounting Oversight Board (United States).Those standards require that we plan and perform the audit to obtain reasonable assurance about whether the financial statements and financial highlights are free of material misstatement.We were not engaged to perform an audit of the Fund’s internal control over financial reporting. Our audits included consideration of internal control over financial reporting as a basis for designing audit procedures that are appropriate in the circumstances, but not for the purpose of expressing an opinion on the effectiveness of the Fund’s internal control over financial reporting. Accordingly, we express no such opinion.An audit also includes examining, on a test basis, evidence supporting the amounts and disclosures in the financial statements and financial highlights, assessing the accounting principles used and significant estimates made by management, and evaluating the overall financial statement presentation. Our procedures included confirmation of securities owned as of October 31, 2012 by correspondence with the custodian and others.We believe that our audits provide a reasonable basis for our opinion.
In our opinion, the financial statements and financial highlights referred to above present fairly, in all material respects, the financial position of Dreyfus India Fund at October 31, 2012, the results of its operations for the year then ended and the changes in its net assets and the financial highlights for the year then ended and for the period from April 13, 2011 to October 31, 2011, in conformity with U.S. generally accepted accounting principles.

New York, New York
December 27, 2012
30
PROXY RESULTS (Unaudited)
The Company held a special meeting of shareholders on August 3, 2012. The proposal considered at the meeting, and the results, are as follows:
| Shares | |||
| Votes For | Authority Withheld | ||
| To elect Board Members: | |||
| Peggy Davis† | 125,042,328 | 610,092 | |
| Ehud Houminer† | 125,002,253 | 650,167 | |
| Martin Peretz† | 125,018,821 | 635,599 |
† Each new Board Member’s term commenced on September 1, 2012.
In addition Joseph S. DiMartino, David P. Feldman, Lynn Martin, Robin A. Melvin, and Philip L.Toia continue as Board Members of the Company.
The Fund 31
INFORMATION ABOUT THE RENEWAL OF THE
FUND’S MANAGEMENT AND SUB-INVESTMENT
ADVISORY AGREEMENTS (Unaudited)
At a meeting of the fund’s Board of Directors held on June 28, 2012, the Board considered the renewal of the fund’s Management Agreement, pursuant to which Dreyfus provides the fund with investment advisory and administrative services (the “Agreement”), and the Sub-Investment Advisory Agreement (together, the “Agreements”), pursuant to which Hamon Asian Advisors Ltd. (the “Sub-Adviser”) provides day-to-day management of the fund’s investments. The Board members, none of whom are “interested persons” (as defined in the Investment Company Act of 1940, as amended) of the fund, were assisted in their review by independent legal counsel and met with counsel in executive session separate from representatives of Dreyfus and the Sub-Adviser. In considering the renewal of the Agreements, the Board considered all factors that it believed to be relevant, including those discussed below. The Board did not identify any one factor as dispositive, and each Board member may have attributed different weights to the factors considered.
Analysis of Nature, Extent, and Quality of Services Provided to the Fund.The Board considered information previously provided to them in presentations from Dreyfus representatives regarding the nature, extent, and quality of the services provided to funds in the Dreyfus fund complex, and Dreyfus representatives confirmed that there had been no material changes in this information. Dreyfus provided the number of open accounts in the fund, the fund’s asset size and the allocation of fund assets among distribution channels. Dreyfus also had previously provided information regarding the diverse intermediary relationships and distribution channels of funds in the Dreyfus fund complex (such as retail direct or intermediary, in which intermediaries typically are paid by the fund and/or Dreyfus) and Dreyfus’ corresponding need for broad, deep, and diverse resources to be able to provide ongoing shareholder services to each intermediary or distribution channel, as applicable to the fund.
The Board also considered research support available to, and portfolio management capabilities of, the fund’s portfolio management personnel and that Dreyfus also provides oversight of day-to-day fund operations,
32
including fund accounting and administration and assistance in meeting legal and regulatory requirements.The Board also considered Dreyfus’ extensive administrative, accounting, and compliance infrastructures, as well as Dreyfus’ supervisory activities over the Sub-Adviser.The Board also considered portfolio management’s brokerage policies and practices (including policies and practices regarding soft dollars) and the standards applied in seeking best execution.
Comparative Analysis of the Fund’s Performance and Management Fee and Expense Ratio.The Board reviewed reports prepared by Lipper, Inc. (“Lipper”), an independent provider of investment company data, which included information comparing (1) the fund’s performance with the performance of a group of comparable funds (the “Performance Group”) and with a broader group of funds (the “Performance Universe”), all for various periods ended May 31, 2012, and (2) the fund’s actual and contractual management fees and total expenses with those of a group of comparable funds (the “Expense Group”) and with a broader group of funds (the “Expense Universe”), the information for which was derived in part from fund financial statements available to Lipper as of the date of its analysis. Dreyfus previously had furnished the Board with a description of the methodology Lipper used to select the Performance Group and Performance Universe and the Expense Group and Expense Universe.
Dreyfus representatives stated that the usefulness of performance comparisons may be affected by a number of factors, including different investment limitations that may be applicable to the fund and comparison funds. The Board discussed the results of the comparisons and noted that the fund’s total return performance was at the Performance Group median and slightly below the Performance Universe median for the one-year period ended May 31st. Dreyfus also provided a comparison of the fund’s calendar year total return to the return of the fund’s benchmark index.
The Fund 33
INFORMATION ABOUT THE RENEWAL OF THE FUND’S MANAGEMENT AND
SUB-INVESTMENT ADVISORY AGREEMENTS (Unaudited) (continued)
The Board also reviewed the range of actual and contractual management fees and total expenses of the Expense Group and Expense Universe funds and discussed the results of the comparisons.The Board noted that the fund’s contractual management fee was below the Expense Group median, the fund’s actual management fee was zero and Expense Universe medians and the fund’s total expenses were above the Expense Group and Expense Universe medians
Dreyfus representatives noted that Dreyfus has contractually agreed, until March 1, 2013, to waive receipt of its fee and/or assume the expenses of the fund so that the expenses of none of the classes (excluding Rule 12b-1 Distribution Plan fees, Shareholder Services Plan fees, taxes, interest expense, brokerage commissions, commitment fees on borrowings, and extraordinary expenses) exceed 1.75% of the fund’s average daily net assets.
Dreyfus representatives reviewed with the Board the management or investment advisory fees (1) paid by funds advised or administered by Dreyfus that are in the same Lipper category as the fund and (2) paid to Dreyfus or the Sub-Adviser or its affiliates for advising any separate accounts and/or other types of client portfolios that are considered to have similar investment strategies and policies as the fund (the “Similar Clients”), and explained the nature of the Similar Clients.They discussed differences in fees paid and the relationship of the fees paid in light of any differences in the services provided and other relevant factors.The Board considered the relevance of the fee information provided for the Similar Clients to evaluate the appropriateness and reasonableness of the fund’s management fee.
The Board considered the fee to the Sub-Adviser in relation to the fee paid to Dreyfus by the fund and the respective services provided by the Sub-Adviser and Dreyfus.The Board also noted the Sub-Adviser’s fee is paid by Dreyfus (out of its fee from the fund) and not the fund.
Analysis of Profitability and Economies of Scale. Dreyfus representatives reviewed the expenses allocated and profit received by Dreyfus and the resulting profitability percentage for managing the fund, and the method
34
used to determine the expenses and profit. The Board concluded that the profitability results were not unreasonable, given the services rendered and service levels provided by Dreyfus.The Board also noted the fee waiver and expense reimbursement arrangement and its effect on Dreyfus’ profitability. The Board previously had been provided with information prepared by an independent consulting firm regarding Dreyfus’ approach to allocating costs to, and determining the profitability of, individual funds and the entire Dreyfus fund complex.The consulting firm also had analyzed where any economies of scale might emerge in connection with the management of a fund.
The Board’s counsel stated that the Board should consider the profitability analysis (1) as part of the evaluation of whether the fees under the Agreements bear a reasonable relationship to the mix of services provided by Dreyfus and the Sub-Adviser, including the nature, extent and quality of such services, and (2) in light of the relevant circumstances for the fund and the extent to which economies of scale would be realized if the fund grows and whether fee levels reflect these economies of scale for the benefit of fund shareholders. Since Dreyfus, and not the fund, pays the Sub-Adviser pursuant to the Sub-Investment Advisory Agreement, the Board did not consider the Sub-Adviser’s profitability to be relevant to its deliberations. Dreyfus representatives noted that a discussion of economies of scale is predicated on a fund having achieved a substantial size with increasing assets and that, if a fund’s assets had been stable or decreasing, the possibility that Dreyfus may have realized any economies of scale would be less. Dreyfus representatives also noted that, as a result of shared and allocated costs among funds in the Dreyfus fund complex, the extent of economies of scale could depend substantially on the level of assets in the complex as a whole, so that increases and decreases in complex-wide assets can affect potential economies of scale in a manner that is disproportionate to, or even in the opposite direction from, changes in the fund’s asset level.The Board also considered potential benefits to Dreyfus and the Sub-Adviser from acting as investment adviser and sub-investment adviser, respectively, and noted the soft dollar arrangements in effect for trading the fund’s investments.
The Fund 35
INFORMATION ABOUT THE RENEWAL OF THE FUND’S MANAGEMENT AND
SUB-INVESTMENT ADVISORY AGREEMENTS (Unaudited) (continued)
At a special Board meeting held on April 23, 2012, the Board approved consolidating the fund’s Board with the boards of certain other funds in The Dreyfus Family of Funds, effective September 1, 2012, subject to the election of the new Board members by shareholders of the fund (the “Board Consolidation”). It was noted that, to align the renewal dates of the Management Agreements and Sub-Investment Advisory Agreements of the funds involved in the Board Consolidation, management recommended changing the fund’s Management Agreement and Sub-Investment Advisory Agreement renewal date to March 30th, subject to shareholder election of the new Board members for the fund.
At the conclusion of these discussions, the Board agreed that it had been furnished with sufficient information to make an informed business decision with respect to the renewal of the Agreements. Based on the discussions and considerations as described above, the Board concluded and determined as follows.
The Board concluded that the nature, extent and quality of the services provided by Dreyfus and the Sub-Adviser are adequate and appropriate.
The Board generally was satisfied with the fund’s relative performance.
The Board concluded that the fees paid to Dreyfus and the Sub- Adviser were reasonable in light of the considerations described above.
The Board determined that the economies of scale which may accrue to Dreyfus and its affiliates in connection with the management of the fund had been adequately considered by Dreyfus in connection with the fee rate charged to the fund pursuant to the Agreement and that, to the extent in the future it were determined that material economies of scale had not been shared with the fund, the Board would seek to have those economies of scale shared with the fund.
36
In evaluating the Agreements, the Board considered these conclusions and determinations and also relied on its previous knowledge, gained through meetings and other interactions with Dreyfus and its affiliates and the Sub-Adviser, of the fund and the services provided to the fund by Dreyfus and the Sub-Adviser.The Board also relied on information received on a routine and regular basis throughout the year relating to the operations of the fund and the investment management and other services provided under the Agreements, including information on the investment performance of the fund in comparison to similar mutual funds and benchmark performance indices; general market outlook as applicable to the fund; and compliance reports. In addition, it should be noted that the Board’s consideration of the contractual fee arrangements for this fund had the benefit of a number of years of reviews of prior or similar agreements during which lengthy discussions took place between the Board and Dreyfus representatives. Certain aspects of the arrangements may receive greater scrutiny in some years than in others, and the Board’s conclusions may be based, in part, on their consideration of the same or similar arrangements in prior years.The Board determined that renewal of the Agreements through March 30, 2013, subject to shareholder approval of the Board Consolidation as described above, was in the best interests of the fund and its shareholders.
The Fund 37
BOARD MEMBERS INFORMATION (Unaudited)
| Joseph S. DiMartino (69) |
| Chairman of the Board (1995) |
| Principal Occupation During Past 5Years: |
| • Corporate Director and Trustee |
| Other Public Company Board Memberships During Past 5Years: |
| • CBIZ (formerly, Century Business Services, Inc.), a provider of outsourcing functions for small |
| and medium size companies, Director (1997-present) |
| • Sunair Services Corporation, a provider of certain outdoor-related services to homes and |
| businesses, Director (2005-2009) |
| • The Newark Group, a provider of a national market of paper recovery facilities, paperboard |
| mills and paperboard converting plants, Director (2000-2010) |
| No. of Portfolios for which Board Member Serves: 157 |
| ——————— |
| Peggy C. Davis (69) |
| Board Member (2012) |
| Principal Occupation During Past 5Years: |
| • Shad Professor of Law, New York University School of Law (1983-present) |
| No. of Portfolios for which Board Member Serves: 63 |
| ——————— |
| David P. Feldman (72) |
| Board Member (1991) |
| Principal Occupation During Past 5Years: |
| • Corporate Director and Trustee |
| Other Public Company Board Memberships During Past 5Years: |
| • BBH Mutual Funds Group (4 registered mutual funds), Director (1992-present) |
| • QMed, Inc. a healthcare company, Director (1999-2007) |
| No. of Portfolios for which Board Member Serves: 46 |
| ——————— |
| Ehud Houminer (72) |
| Board Member (2012) |
| Principal Occupation During Past 5Years: |
| • Executive-in-Residence at the Columbia Business School, Columbia University (1992-present) |
| Other Public Company Board Memberships During Past 5Years: |
| • Avnet Inc., an electronics distributor, Director (1993-2012) |
| No. of Portfolios for which Board Member Serves: 73 |
38
| Lynn Martin (72) |
| Board Member (1993) |
| Principal Occupation During Past 5Years: |
| • President of The Martin Hall Group LLC, a human resources consulting firm, from January |
| 2005-present |
| Other Public Company Board Memberships During Past 5Years: |
| • AT&T Inc., a telecommunications company, Director (1999-2012) |
| • Ryder System, Inc., a supply chain and transportation management company, Director (1993-2012) |
| • The Proctor & Gamble Co., a consumer products company, Director (1994-2009) |
| • Constellation Energy Group Inc., Director (2003-2009) |
| No. of Portfolios for which Board Member Serves: 46 |
| ——————— |
| Robin A. Melvin (49) |
| Board Member (2011) |
| Principal Occupation During Past 5Years: |
| • Director, Boisi Family Foundation, a private family foundation that supports youth-serving orga- |
| nizations that promote the self sufficiency of youth from disadvantaged circumstances (1995-2012) |
| No. of Portfolios for which Board Member Serves: 83 |
| ——————— |
| Dr. Martin Peretz (73) |
| Board Member (2012) |
| Principal Occupation During Past 5Years: |
| • Editor-in-Chief Emeritus of The New Republic Magazine (2010-present) (previously, |
| Editor-in-Chief, 1974-2010) |
| • Director of TheStreet.com, a financial information service on the web (1996-present) |
| No. of Portfolios for which Board Member Serves: 46 |
| ——————— |
| Philip L. Toia (79) |
| Board Member (1997) |
| Principal Occupation During Past 5Years: |
| • Private Investor |
| No. of Portfolios for which Board Member Serves: 56 |
| ——————— |
| Once elected all Board Members serve for an indefinite term, but achieve Emeritus status upon reaching age 80.The |
| address of the Board Members and Officers is c/o The Dreyfus Corporation, 200 Park Avenue, NewYork, NewYork |
| 10166.Additional information about the Board Members is available in the fund’s Statement of Additional Information |
| which can be obtained from Dreyfus free of charge by calling this toll free number: 1-800-DREYFUS. |
| Daniel Rose, Emeritus Board Member |
| Sander Vanocur, Emeritus Board Member |
The Fund 39
OFFICERS OF THE FUND (Unaudited)
40
The Fund 41
Dreyfus
Satellite Alpha Fund
ANNUAL REPORT October 31, 2012
Save time. Save paper. View your next shareholder report online as soon as it’s available. Log into www.dreyfus.com and sign up for Dreyfus eCommunications. It’s simple and only takes a few minutes.
The views expressed in this report reflect those of the portfolio manager only through the end of the period covered and do not necessarily represent the views of Dreyfus or any other person in the Dreyfus organization. Any such views are subject to change at any time based upon market or other conditions and Dreyfus disclaims any responsibility to update such views.These views may not be relied on as investment advice and, because investment decisions for a Dreyfus fund are based on numerous factors, may not be relied on as an indication of trading intent on behalf of any Dreyfus fund.
Contents | |
THE FUND | |
| 2 | A Letter from the Chairman and CEO |
| 3 | Discussion of Fund Performance |
| 6 | Fund Performance |
| 8 | Understanding Your Fund’s Expenses |
| 8 | Comparing Your Fund’s Expenses With Those of Other Funds |
| 9 | Statement of Investments |
| 10 | Statement of Assets and Liabilities |
| 11 | Statement of Operations |
| 12 | Statement of Changes in Net Assets |
| 14 | Financial Highlights |
| 17 | Notes to Financial Statements |
| 26 | Report of Independent Registered Public Accounting Firm |
| 27 | Important Tax Information |
| 27 | Proxy Results |
| 28 | Information About the Renewal of the Fund’s Management Agreement |
| 32 | Board Members Information |
| 34 | Officers of the Fund |
FOR MORE INFORMATION | |
Back Cover |
Dreyfus
Satellite Alpha Fund
The Fund
A LETTER FROM THE CHAIRMAN AND CEO

Dear Shareholder:
We are pleased to present this annual report for Dreyfus Satellite Alpha Fund, covering the 12-month period from November 1, 2011, through October 31, 2012. For information about how the fund performed during the reporting period, as well as general market perspectives, we provide a Discussion of Fund Performance on the pages that follow.
Despite pronounced stock market weakness during the spring of 2012, stocks generally advanced over the reporting period as investors responded to encouraging macroeconomic developments throughout the world. Employment gains in the United States, credible measures to prevent a more severe banking crisis in Europe, and the likelihood of a “soft landing” for China’s economy buoyed investor sentiment, as did aggressively accommodative monetary policies from central banks in the United States, Europe, Japan and China. Consequently, U.S. stocks across all capitalization ranges posted double-digit returns, on average, for the reporting period.
In light of the easy monetary policies adopted by many countries, we expect global growth to be slightly more robust in 2013 than in 2012.The U.S. economic recovery is likely to persist at subpar levels over the first half of the new year, as growth may remain constrained by uncertainties surrounding fiscal policy and tax reforms. However, successful resolution of the current fiscal debate may prompt corporate decision-makers to increase capital spending, which could have positive implications for the U.S. economy and domestic equity markets.As always, we encourage you to stay in touch with your financial advisor as new developments unfold.
Thank you for your continued confidence and support.

Jonathan R. Baum
Chairman and Chief Executive Officer
The Dreyfus Corporation
November 15, 2012
2
DISCUSSION OF FUND PERFORMANCE
For the period of November 1, 2011, through October 31, 2012, as provided by Richard B. Hoey,A. Paul Disdier and Keith L. Stransky, CFA, Portfolio Managers
Fund and Market Performance Overview
For the 12-month period ended October 31, 2012, Dreyfus Satellite Alpha Fund’s Class A shares produced a total return of 2.61%, Class C shares returned 1.86% and Class I shares returned 2.90%.1 In comparison, the fund’s benchmark, the Morgan Stanley Capital International (MSCI) World Index (the “Index”), produced a total return of 9.45% for the same period.2
Despite bouts of heightened market volatility, improving economic sentiment in many parts of the world sent global stock prices broadly higher over the reporting period.The fund produced lower returns than its benchmark due to lagging returns from its underlying mutual funds. Shortfalls were particularly severe for Dreyfus Global Absolute Return Fund, Dreyfus/The Boston Company Emerging Markets Core Equity Fund, and Dreyfus Natural Resources Fund.
The Fund’s Investment Approach
The fund seeks long-term capital appreciation.To pursue its goal, the fund normally allocates its assets among other mutual funds advised by The Dreyfus Corporation (Dreyfus) that provide exposure to alternative or non-traditional (i.e., satellite) asset categories or investment strategies.The underlying funds are selected by the Dreyfus Investment Committee based on their investment objectives and management policies, portfolio holdings, risk/reward profiles, historical performance and other factors.The Dreyfus Investment Committee will rebalance the fund’s investments in the underlying funds at least annually, but may do so more often in response to market conditions.As of October 31, 2012, the fund’s assets were allocated as follows:
| Underlying Funds | (%) |
| Dreyfus Global Absolute Return Fund | 18 |
| Dreyfus Emerging Markets Debt Local Currency Fund | 10 |
| Dreyfus Global Real Estate Securities Fund | 11 |
| Dreyfus Natural Resources Fund | 19 |
| Dreyfus Inflation Adjusted Securities Fund | 11 |
| Dreyfus International Bond Fund | 13 |
| Dreyfus Emerging Markets Fund | 18 |
The Fund 3
DISCUSSION OF FUND PERFORMANCE (continued)
Markets Reacted to Changing Macroeconomic Developments
The reporting period began in the wake of major declines among stocks and higher yielding bonds throughout the world, resulting in attractive valuations across a number of markets in November 2011. Indeed, by the beginning of 2012 many financial markets were rallying amid encouraging macroeconomic developments, including U.S. employment gains, a quantitative easing program in Europe that forestalled a more severe banking crisis in the region, and less restrictive monetary and fiscal policies in China in an environment of reduced inflationary pressures. Meanwhile, corporate earnings generally remained strong, and default rates stayed low in fixed-income markets. Consequently, investors grew more tolerant of risks, and were able to focus more intently on business and credit fundamentals, and less on macroeconomic developments.
These positive influences were called into question during the spring, when the U.S. labor market’s rebound slowed, measures designed to relieve fiscal pressures in Europe encountered resistance, and the Chinese economy remained sluggish. The summer saw the markets’ rally resume amid more encouraging economic news, and global stocks and bonds ended the reporting period with solid gains, on average.
A More Constructive Investment Posture
Although the fund began the reporting period with a relatively defensive stance, we soon adopted a more constructive posture as it became clearer that signs of global economic improvement were likely to be sustainable. In November 2011, we shifted 5% of the fund’s assets from Dreyfus Inflation Adjusted Securities Fund to Dreyfus/The Boston Company Emerging Markets Core Equity Fund.That move was followed in December by shifting another 5% of assets from Dreyfus Global Real Estate Securities Fund to Dreyfus/The Boston Company Emerging Markets Core Equity Fund.
As stocks continued to rally in January 2012, we moved 5% of the fund’s assets from the relatively defensive Dreyfus Global Absolute Return Fund to the more aggressive Dreyfus Emerging Markets Fund. In February, we sought greater equity exposure by moving 2% of assets from Dreyfus Emerging Markets Debt Local Currency Fund to Dreyfus Natural Resources Fund.
We left the fund’s allocations unchanged from February until September, when we adjusted the fund’s emerging-markets exposure by shifting 7% of assets from Dreyfus/The Boston Company Emerging Markets Core Equity Fund to Dreyfus Emerging Markets Fund, the latter of which employs a fundamentals-based approach that we believed would fare well in an oversold market.At the same time, we responded to evidence of improvement in Europe by shifting 3% of assets from Dreyfus Emerging Markets Debt Local Currency Fund to Dreyfus International Bond Fund.
4
Finding Opportunities in Worldwide Markets
Although heightened stock and bond market volatility is likely to persist over the near term in the face of ongoing global challenges, we have been encouraged recently by positive U.S. and global economic developments. In our analysis, emerging-markets stocks currently appear to be particularly attractively valued, and we may increase the fund’s allocation to one or more of its underlying emerging-markets funds should economic and market conditions in developing countries continue to improve.
November 15, 2012
Equity funds are subject generally to market, market sector, market liquidity, issuer and investment style risks, among other factors, to varying degrees, all of which are more fully described in the prospectus of the fund and that of each underlying fund.
The ability of the fund to achieve its investment goal depends, in part, on the ability of the Dreyfus Investment Committee to allocate effectively the fund’s assets among the underlying funds.There can be no assurance that the actual allocations will be effective in achieving the fund’s investment goal.
Each underlying international equity fund’s performance will be influenced by political, social and economic factors affecting investments in foreign companies. Special risks associated with such companies include exposure to currency fluctuations, less liquidity, less developed or less efficient trading markets, lack of comprehensive company information, political instability and differing auditing and legal standards.
Because one of the underlying fund’s investments is concentrated in the securities of companies principally engaged in the real estate sector, the value of the fund’s shares will be affected by factors particular to the real estate sector and may fluctuate more widely than that of a fund which invests in a broader range of industries.The securities of issuers that are principally engaged in the real estate sector may be subject to risks similar to those associated with the direct ownership of real estate.
Because one of the underlying fund’s investments is concentrated in the natural resources and related sectors, the value of its shares will be affected by factors particular to those sectors and may fluctuate more widely than that of a fund which invests in a broad range of industries.The market value of these securities may be affected by numerous factors, including events occurring in nature, inflationary pressures, domestic and international politics. Securities of companies within specific natural resources sectors can perform differently from the overall market.This may be due to changes in such things as the regulatory or competitive environment or to changes in investor perceptions regarding a sector. Because the fund may allocate relatively more assets to certain natural resources sectors than others, the fund’s performance may be more sensitive to developments, which affect those sectors emphasized by the fund.
Because the fund seeks to provide exposure to alternative or non-traditional (i.e., satellite) asset categories or investment strategies, the fund’s performance will be linked to the performance of these highly volatile asset categories and strategies.Accordingly, investors should consider purchasing shares of the fund only as part of an overall diversified portfolio and should be willing to assume the risks of potentially significant fluctuations in the value of fund shares.
| 1 Total return includes reinvestment of dividends and any capital gains paid, and does not take into consideration the |
| maximum initial sales charge in the case of Class A shares, or the applicable contingent deferred sales charge imposed on |
| redemptions in the case of Class C shares. Had these charges been reflected, returns would have been lower. Past |
| performance is no guarantee of future results. Share price and investment return fluctuate such that upon redemption, fund |
| shares may be worth more or less than their original cost. Return figures provided reflect the absorption of certain fund |
| expenses pursuant to an agreement by The Dreyfus Corporation in effect until March 1, 2013, at which time it may be |
| extended, terminated or modified. Had these expenses not been absorbed, the fund’s returns would have been lower. |
| 2 SOURCE: LIPPER INC. – Reflects reinvestment of net dividends and, where applicable, capital gain distributions. |
| The Morgan Stanley Capital International (MSCI) World Index is an unmanaged index of global stock market |
| performance, including the United States, Canada, Europe,Australia, New Zealand and the Far East. |
The Fund 5
FUND PERFORMANCE
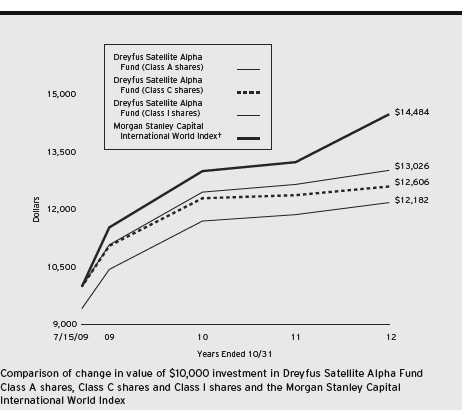
† Source: Lipper Inc.
Past performance is not predictive of future performance.
The above graph compares a $10,000 investment made in each of the Class A, Class C and Class I shares of Dreyfus Satellite Alpha Fund on 7/15/09 (inception date) to a $10,000 investment made in the Morgan Stanley Capital International World Index (the “Index”) on that date.All dividends and capital gain distributions are reinvested.
The fund’s performance shown in the line graph above takes into account the maximum initial sales charge on Class A shares and all other applicable fees and expenses on all classes.The Index is an unmanaged index of global stock market performance, including the United States, Canada, Europe,Australia, New Zealand and the Far East. Unlike a mutual fund, the Index is not subject to charges, fees and other expenses. Investors cannot invest directly in any index. Further information relating to fund performance, including expense reimbursements, if applicable, is contained in the Financial Highlights section of the prospectus and elsewhere in this report.
6
| Average Annual Total Returns as of 10/31/12 | |||||
| Inception | From | ||||
| Date | 1 | Year | Inception | ||
| Class A shares | |||||
| with maximum sales charge (5.75%) | 7/15/09 | –3.32 | % | 6.16 | % |
| without sales charge | 7/15/09 | 2.61 | % | 8.08 | % |
| Class C shares | |||||
| with applicable redemption charge † | 7/15/09 | 0.86 | % | 7.27 | % |
| without redemption | 7/15/09 | 1.86 | % | 7.27 | % |
| Class I shares | 7/15/09 | 2.90 | % | 8.34 | % |
| Morgan Stanley Capital | |||||
| International World Index | 6/30/09 | 9.45 | % | 11.76 | %†† |
Past performance is not predictive of future performance.The fund’s performance shown in the graph and table does not reflect the deduction of taxes that a shareholder would pay on fund distributions or the redemption of fund shares.
| † | The maximum contingent deferred sales charge for Class C shares is 1% for shares redeemed within one year of the |
| date of purchase. | |
| †† | For comparative purposes, the value of the Index as of 6/30/09 is used as the beginning value on 7/15/09. |
The Fund 7
UNDERSTANDING YOUR FUND’S EXPENSES (Unaudited)
As a mutual fund investor, you pay ongoing expenses, such as management fees and other expenses. Using the information below, you can estimate how these expenses affect your investment and compare them with the expenses of other funds.You also may pay one-time transaction expenses, including sales charges (loads) and redemption fees, which are not shown in this section and would have resulted in higher total expenses. For more information, see your fund’s prospectus or talk to your financial adviser.
Review your fund’s expenses
The table below shows the expenses you would have paid on a $1,000 investment in Dreyfus Satellite Alpha Fund from May 1, 2012 to October 31, 2012. It also shows how much a $1,000 investment would be worth at the close of the period, assuming actual returns and expenses.
Expenses and Value of a $1,000 Investment
assuming actual returns for the six months ended October 31, 2012
| Class A | Class C | Class I | ||||
| Expenses paid per $1,000† | $ | 2.22 | $ | 6.00 | $ | .96 |
| Ending value (after expenses) | $ | 1,009.90 | $ | 1,006.00 | $ | 1,011.20 |
COMPARING YOUR FUND’S EXPENSES
WITH THOSE OF OTHER FUNDS (Unaudited)
Using the SEC’s method to compare expenses
The Securities and Exchange Commission (SEC) has established guidelines to help investors assess fund expenses. Per these guidelines, the table below shows your fund’s expenses based on a $1,000 investment, assuming a hypothetical 5% annualized return. You can use this information to compare the ongoing expenses (but not transaction expenses or total cost) of investing in the fund with those of other funds.All mutual fund shareholder reports will provide this information to help you make this comparison. Please note that you cannot use this information to estimate your actual ending account balance and expenses paid during the period.
Expenses and Value of a $1,000 Investment
assuming a hypothetical 5% annualized return for the six months ended October 31, 2012
| Class A | Class C | Class I | ||||
| Expenses paid per $1,000† | $ | 2.24 | $ | 6.04 | $ | .97 |
| Ending value (after expenses) | $ | 1,022.92 | $ | 1,019.15 | $ | 1,024.18 |
| † Expenses are equal to the fund’s annualized expense ratio of .44% for Class A, 1.19% for Class C and .19% |
| for Class I, multiplied by the average account value over the period, multiplied by 184/366 (to reflect the one-half |
| year period). |
8
STATEMENT OF INVESTMENTS
October 31, 2012
| Registered Investment Companies—103.9% | Shares | Value ($) | ||
| Dreyfus Emerging Markets Debt Local Currency Fund, Cl. I | 4,207 | a | 63,145 | |
| Dreyfus Emerging Markets Fund, Cl. I | 11,542 | a | 113,922 | |
| Dreyfus Global Absolute Return Fund, Cl. I | 8,946 | a,b | 108,069 | |
| Dreyfus Global Real Estate Securities Fund, Cl. I | 8,072 | a | 66,029 | |
| Dreyfus Inflation Adjusted | ||||
| Securities Fund, Institutional Shares | 4,482 | a | 64,869 | |
| Dreyfus International Bond Fund, Cl. I | 4,671 | a | 82,109 | |
| Dreyfus Natural Resources Fund, Cl. I | 4,325 | a,b | 115,271 | |
| Total Investments (cost $553,018) | 103.9 | % | 613,414 | |
| Liabilities, Less Cash and Receivables | (3.9 | %) | (22,781 | ) |
| Net Assets | 100.0 | % | 590,633 | |
| a | Investment in affiliated mutual fund. |
| b | Non-income producing security. |
| Portfolio Summary (Unaudited)† | |||
| Value (%) | Value (%) | ||
| Mutual Funds: Foreign | 73.4 | Mutual Funds: Domestic | 30.5 |
| 103.9 | |||
| † Based on net assets. | |||
| See notes to financial statements. | |||
The Fund 9
STATEMENT OF ASSETS AND LIABILITIES
October 31, 2012
| Cost | Value | |||
| Assets ($): | ||||
| Investments in affiliated issuers—See Statement of Investments | 553,018 | 613,414 | ||
| Cash | 2,616 | |||
| Prepaid expenses | 17,001 | |||
| Due from The Dreyfus Corporation and affiliates—Note 2(c) | 6,986 | |||
| 640,017 | ||||
| Liabilities ($): | ||||
| Accrued expenses | 49,384 | |||
| Net Assets ($) | 590,633 | |||
| Composition of Net Assets ($): | ||||
| Paid-in capital | 563,221 | |||
| Accumulated distributions in excess of investment income—net | (819 | ) | ||
| Accumulated net realized gain (loss) on investments | (32,165 | ) | ||
| Accumulated net unrealized appreciation | ||||
| (depreciation) on investments in affiliated issuers | 60,396 | |||
| Net Assets ($) | 590,633 | |||
| Net Asset Value Per Share | ||||
| Class A | Class C | Class I | ||
| Net Assets ($) | 398,676 | 117,964 | 73,993 | |
| Shares Outstanding | 26,037 | 7,778 | 4,811 | |
| Net Asset Value Per Share ($) | 15.31 | 15.17 | 15.38 | |
| See notes to financial statements. | ||||
10
STATEMENT OF OPERATIONS
Year Ended October 31, 2012
| Investment Income ($): | ||
| Income: | ||
| Cash dividends from affiliated issuers | 6,718 | |
| Expenses: | ||
| Auditing fees | 41,472 | |
| Registration fees | 36,893 | |
| Prospectus and shareholders’ reports | 10,691 | |
| Custodian fees—Note 2(c) | 3,447 | |
| Shareholder servicing costs—Note 2(c) | 3,263 | |
| Distribution fees—Note 2(b) | 961 | |
| Directors’ fees and expenses—Note 2(d) | 159 | |
| Legal fees | 90 | |
| Miscellaneous | 17,738 | |
| Total Expenses | 114,714 | |
| Less—reduction in expenses due to undertaking—Note 2(a) | (110,883 | ) |
| Less—reduction in fees due to earnings credits—Note 2(c) | (2 | ) |
| Net Expenses | 3,829 | |
| Investment Income—Net | 2,889 | |
| Realized and Unrealized Gain (Loss) on Investments—Note 3 ($): | ||
| Net realized gain (loss) on investments in affiliated issuers | (38,492 | ) |
| Capital gain distributions from affiliated issuers | 13,971 | |
| Net Realized Gain (Loss) | (24,521 | ) |
| Net unrealized appreciation (depreciation) | ||
| on investments in affiliated issuers | 21,534 | |
| Net Realized and Unrealized Gain (Loss) on Investments | (2,987 | ) |
| Net (Decrease) in Net Assets Resulting from Operations | (98 | ) |
| See notes to financial statements. | ||
The Fund 11
STATEMENT OF CHANGES IN NET ASSETS
| Year Ended October 31, | ||||
| 2012 | 2011 | |||
| Operations ($): | ||||
| Investment income—net | 2,889 | 8,146 | ||
| Net realized gain (loss) on investments | (24,521 | ) | 10,717 | |
| Net unrealized appreciation (depreciation) | ||||
| on investments in affiliated issuers | 21,534 | (17,027 | ) | |
| Net Increase (Decrease) in Net Assets | ||||
| Resulting from Operations | (98 | ) | 1,836 | |
| Dividends to Shareholders from ($): | ||||
| Investment income—net: | ||||
| Class A Shares | (7,284 | ) | (8,624 | ) |
| Class C Shares | (695 | ) | (1,516 | ) |
| Class I Shares | (1,232 | ) | (2,189 | ) |
| Net realized gain on investments: | ||||
| Class A Shares | (7,707 | ) | — | |
| Class C Shares | (1,689 | ) | — | |
| Class I Shares | (1,108 | ) | — | |
| Total Dividends | (19,715 | ) | (12,329 | ) |
| Capital Stock Transactions ($): | ||||
| Net proceeds from shares sold: | ||||
| Class A Shares | 230,022 | 462,039 | ||
| Class C Shares | 20,000 | 42,738 | ||
| Class I Shares | 11,999 | 61,255 | ||
| Dividends reinvested: | ||||
| Class A Shares | 11,813 | 5,437 | ||
| Class C Shares | 1,231 | 404 | ||
| Class I Shares | 613 | 511 | ||
| Cost of shares redeemed: | ||||
| Class A Shares | (374,444 | ) | (101,386 | ) |
| Class C Shares | (26,947 | ) | (15 | ) |
| Class I Shares | (22,173 | ) | (93,348 | ) |
| Increase (Decrease) in Net Assets | ||||
| from Capital Stock Transactions | (147,886 | ) | 377,635 | |
| Total Increase (Decrease) in Net Assets | (167,699 | ) | 367,142 | |
| Net Assets ($): | ||||
| Beginning of Period | 758,332 | 391,190 | ||
| End of Period | 590,633 | 758,332 | ||
| Undistributed (distributions in excess of) | ||||
| investment income—net | (819 | ) | 4,085 | |
12
| Year Ended October 31, | ||||
| 2012 | 2011 | |||
| Capital Share Transactions: | ||||
| Class A | ||||
| Shares sold | 15,325 | 29,785 | ||
| Shares issued for dividends reinvested | 815 | 355 | ||
| Shares redeemed | (25,958 | ) | (6,661 | ) |
| Net Increase (Decrease) in Shares Outstanding | (9,818 | ) | 23,479 | |
| Class C | ||||
| Shares sold | 1,343 | �� | 2,755 | |
| Shares issued for dividends reinvested | 85 | 26 | ||
| Shares redeemed | (1,883 | ) | (1 | ) |
| Net Increase (Decrease) in Shares Outstanding | (455 | ) | 2,780 | |
| Class I | ||||
| Shares sold | 805 | 3,901 | ||
| Shares issued for dividends reinvested | 42 | 33 | ||
| Shares redeemed | (1,436 | ) | (5,953 | ) |
| Net Increase (Decrease) in Shares Outstanding | (589 | ) | (2,019 | ) |
| See notes to financial statements. | ||||
The Fund 13
FINANCIAL HIGHLIGHTS
The following tables describe the performance for each share class for the fiscal periods indicated.All information (except portfolio turnover rate) reflects financial results for a single fund share.Total return shows how much your investment in the fund would have increased (or decreased) during each period, assuming you had reinvested all dividends and distributions.These figures have been derived from the fund’s financial statements.
| Year Ended October 31, | ||||||||
| Class A Shares | 2012 | 2011 | 2010 | 2009 | a | |||
| Per Share Data ($): | ||||||||
| Net asset value, beginning of period | 15.34 | 15.51 | 13.85 | 12.50 | ||||
| Investment Operations: | ||||||||
| Investment income—netb | .08 | .20 | .18 | .00 | c | |||
| Net realized and unrealized | ||||||||
| gain (loss) on investments | .28 | .03 | 1.48 | 1.35 | ||||
| Total from Investment Operations | .36 | .23 | 1.66 | 1.35 | ||||
| Distributions: | ||||||||
| Dividends from investment income—net | (.19 | ) | (.40 | ) | (.00 | )c | — | |
| Dividends from net realized | ||||||||
| gain on investments | (.20 | ) | — | (.00 | )c | — | ||
| Total Distributions | (.39 | ) | (.40 | ) | (.00 | )c | — | |
| Net asset value, end of period | 15.31 | 15.34 | 15.51 | 13.85 | ||||
| Total Return (%)d | 2.61 | 1.41 | 12.09 | 10.80 | e | |||
| Ratios/Supplemental Data (%): | ||||||||
| Ratio of total expenses | ||||||||
| to average net assetsf | 16.16 | 18.57 | 37.30 | 100.93 | g | |||
| Ratio of net expenses | ||||||||
| to average net assetsf | .44 | .54 | .53 | .50 | g | |||
| Ratio of net investment income | ||||||||
| to average net assetsf | .54 | 1.27 | 1.24 | .08 | g | |||
| Portfolio Turnover Rate | 83.66 | 52.02 | 56.19 | 4.35 | e | |||
| Net Assets, end of period ($ x 1,000) | 399 | 550 | 192 | 162 | ||||
| a | From July 15, 2009 (commencement of operations) to October 31, 2009. |
| b | Based on average shares outstanding at each month end. |
| c | Amount represents less than $.01 per share. |
| d | Exclusive of sales charge. |
| e | Not annualized. |
| f | Amounts do not include the activity of the underlying funds. |
| g | Annualized. |
See notes to financial statements.
14
| Year Ended October 31, | ||||||||
| Class C Shares | 2012 | 2011 | 2010 | 2009 | a | |||
| Per Share Data ($): | ||||||||
| Net asset value, beginning of period | 15.19 | 15.36 | 13.82 | 12.50 | ||||
| Investment Operations: | ||||||||
| Investment income (loss)—netb | (.04 | ) | .10 | .07 | (.03 | ) | ||
| Net realized and unrealized | ||||||||
| gain (loss) on investments | .30 | .01 | 1.47 | 1.35 | ||||
| Total from Investment Operations | .26 | .11 | 1.54 | 1.32 | ||||
| Distributions: | ||||||||
| Dividends from investment income—net | (.08 | ) | (.28 | ) | — | — | ||
| Dividends from net realized | ||||||||
| gain on investments | (.20 | ) | — | (00 | )c | — | ||
| Total Distributions | (.28 | ) | (.28 | ) | (00 | )c | — | |
| Net asset value, end of period | 15.17 | 15.19 | 15.36 | 13.82 | ||||
| Total Return (%)d | 1.86 | .63 | 11.24 | 10.56 | e | |||
| Ratios/Supplemental Data (%): | ||||||||
| Ratio of total expenses | ||||||||
| to average net assetsf | 17.57 | 19.48 | 37.80 | 104.02 | g | |||
| Ratio of net expenses | ||||||||
| to average net assetsf | 1.19 | 1.29 | 1.28 | 1.25 | g | |||
| Ratio of net investment income | ||||||||
| (loss) to average net assetsf | (.30 | ) | .63 | .48 | (.67 | )g | ||
| Portfolio Turnover Rate | 83.66 | 52.02 | 56.19 | 4.35 | e | |||
| Net Assets, end of period ($ x 1,000) | 118 | 125 | 84 | 70 | ||||
| a | From July 15, 2009 (commencement of operations) to October 31, 2009. |
| b | Based on average shares outstanding at each month end. |
| c | Amount represents less than $.01 per share. |
| d | Exclusive of sales charge. |
| e | Not annualized. |
| f | Amounts do not include the activity of the underlying funds. |
| g | Annualized. |
See notes to financial statements.
The Fund 15
FINANCIAL HIGHLIGHTS (continued)
| Year Ended October 31, | ||||||||
| Class I Shares | 2012 | 2011 | 2010 | 2009 | a | |||
| Per Share Data ($): | ||||||||
| Net asset value, beginning of period | 15.40 | 15.56 | 13.86 | 12.50 | ||||
| Investment Operations: | ||||||||
| Investment income—netb | .12 | .27 | .34 | .01 | ||||
| Net realized and unrealized | ||||||||
| gain (loss) on investments | .29 | (.01 | ) | 1.37 | 1.35 | |||
| Total from Investment Operations | .41 | .26 | 1.71 | 1.36 | ||||
| Distributions: | ||||||||
| Dividends from investment income—net | (.23 | ) | (.42 | ) | (.01 | ) | — | |
| Dividends from net realized | ||||||||
| gain on investments | (.20 | ) | — | (.00 | )c | — | ||
| Total Distributions | (.43 | ) | (.42 | ) | (.01 | ) | — | |
| Net asset value, end of period | 15.38 | 15.40 | 15.56 | 13.86 | ||||
| Total Return (%) | 2.90 | 1.61 | 12.35 | 10.88 | d | |||
| Ratios/Supplemental Data (%): | ||||||||
| Ratio of total expenses | ||||||||
| to average net assetse | 16.46 | 18.93 | 37.32 | 106.59 | f | |||
| Ratio of net expenses | ||||||||
| to average net assetse | .19 | .29 | .28 | .25 | f | |||
| Ratio of net investment income | ||||||||
| to average net assetse | .79 | 1.77 | 2.20 | .34 | f | |||
| Portfolio Turnover Rate | 83.66 | 52.02 | 56.19 | 4.35 | d | |||
| Net Assets, end of period ($ x 1,000) | 74 | 83 | 115 | 58 | ||||
| a | From July 15, 2009 (commencement of operations) to October 31, 2009. |
| b | Based on average shares outstanding at each month end. |
| c | Amount represents less than $.01 per share. |
| d | Not annualized. |
| e | Amounts do not include the activity of the underlying funds. |
| f | Annualized. |
See notes to financial statements.
16
NOTES TO FINANCIAL STATEMENTS
NOTE 1—Significant Accounting Policies:
Dreyfus Satellite Alpha Fund (the “fund”) is a separate diversified series of Dreyfus Premier Investment Funds, Inc. (the “Company”), which is registered under the Investment Company Act of 1940, as amended (the “Act”), as an open-end management investment company and operates as a series company currently offering eight series, including the fund.The fund’s investment objective is to seek long-term capital appreciation.The Dreyfus Corporation (the “Manager” or “Dreyfus”), a wholly-owned subsidiary of The Bank of New York Mellon Corporation (“BNY Mellon”), serves as the fund’s investment adviser.
MBSC Securities Corporation (the “Distributor”), a wholly-owned subsidiary of the Manager, is the distributor of the fund’s shares.The fund is authorized to issue 50 million shares of $.001 par value Common Stock in each of the following classes of shares: Class A, Class C and Class I. Class A shares are subject to a sales charge imposed at the time of purchase. Class C shares are subject to a contingent deferred sales charge (“CDSC”) imposed on Class C shares redeemed within one year of purchase. Class I shares are sold at net asset value per share only to institutional investors. Other differences between the classes include the services offered to and the expenses borne by each class, the allocation of certain transfer agency costs and certain voting rights. Income, expenses (other than expenses attributable to a specific class), and realized and unrealized gains or losses on investments are allocated to each class of shares based on its relative net assets.
As of October 31, 2012, MBC Investments Corp., an indirect subsidiary of BNY Mellon, held 8,002 Class A, 4,001 Class C and 4,003 Class I shares of the fund.
The Fund 17
NOTES TO FINANCIAL STATEMENTS (continued)
The Company accounts separately for the assets, liabilities and operations of each series. Expenses directly attributable to each series are charged to that series’ operations; expenses which are applicable to all series are allocated among them on a pro rata basis.
The Financial Accounting Standards Board (“FASB”) Accounting Standards Codification is the exclusive reference of authoritative U.S. generally accepted accounting principles (“GAAP”) recognized by the FASB to be applied by nongovernmental entities. Rules and interpretive releases of the Securities and Exchange Commission (“SEC”) under authority of federal laws are also sources of authoritative GAAP for SEC registrants. The fund’s financial statements are prepared in accordance with GAAP, which may require the use of management estimates and assumptions.Actual results could differ from those estimates.
The Company enters into contracts that contain a variety of indemnifications.The fund’s maximum exposure under these arrangements is unknown.The fund does not anticipate recognizing any loss related to these arrangements.
(a) Portfolio valuation: The fair value of a financial instrument is the amount that would be received to sell an asset or paid to transfer a liability in an orderly transaction between market participants at the measurement date (i.e., the exit price). GAAP establishes a fair value hierarchy that prioritizes the inputs of valuation techniques used to measure fair value.This hierarchy gives the highest priority to unadjusted quoted prices in active markets for identical assets or liabilities (Level 1 measurements) and the lowest priority to unobservable inputs (Level 3 measurements).
Additionally, GAAP provides guidance on determining whether the volume and activity in a market has decreased significantly and whether such a decrease in activity results in transactions that are not orderly. GAAP requires enhanced disclosures around valuation inputs and techniques used during annual and interim periods.
18
Various inputs are used in determining the value of the fund’s investments relating to fair value measurements.These inputs are summarized in the three broad levels listed below:
Level 1—unadjusted quoted prices in active markets for identical investments.
Level 2—other significant observable inputs (including quoted prices for similar investments, interest rates, prepayment speeds, credit risk, etc.).
Level 3—significant unobservable inputs (including the fund’s own assumptions in determining the fair value of investments).
The inputs or methodology used for valuing securities are not necessarily an indication of the risk associated with investing in those securities.
Investments are valued at the net asset value of each underlying fund determined as of the close of the NewYork Stock Exchange (generally 4 p.m., Eastern time) on the valuation date and are generally categorized within Level 1 of the fair value hierarchy.
The following is a summary of the inputs used as of October 31, 2012 in valuing the fund’s investments:
| Level 2—Other | Level 3— | |||
| Level 1— | Significant | Significant | ||
| Unadjusted | Observable | Unobservable | ||
| Quoted Prices | Inputs | Inputs | Total | |
| Assets ($) | ||||
| Investments in Securities: | ||||
| Mutual Funds | 613,414 | — | — | 613,414 |
At October 31, 2012, there were no transfers between Level 1 and Level 2 of the fair value hierarchy.
(b) Securities transactions and investment income: Securities transactions are recorded on a trade date basis. Realized gains and losses from securities transactions are recorded on the identified cost basis.
The Fund 19
NOTES TO FINANCIAL STATEMENTS (continued)
Dividend income is recognized on the ex-dividend date and interest income, including, where applicable, accretion of discount and amortization of premium on investments, is recognized on the accrual basis.
(c) Affiliated issuers: Investments in other investment companies advised by Dreyfus are defined as “affiliated” in the Act. Investments in affiliated investment companies for the period ended October 31, 2012 were as follows:
| Affiliated | |||||||
| Investment | Value | Net Realized | |||||
| Company | 10/31/2011 | ($) | Purchases ($)† | Sales ($) | Gain (Loss) ($) | ||
| Dreyfus Emerging | |||||||
| Markets Debt Local | |||||||
| Currency Fund, Cl. I | 112,451 | 49,840 | 101,714 | (3,789 | ) | ||
| Dreyfus Emerging | |||||||
| Markets Fund, Cl. I | 16,839 | 136,396 | 33,346 | (7,668 | ) | ||
| Dreyfus Global | |||||||
| Absolute Return | |||||||
| Fund, Cl. I | 256,440 | 105,128 | 249,062 | (3,471 | ) | ||
| Dreyfus Global Real | |||||||
| Estate Securities | |||||||
| Fund, Cl. I | 110,134 | 35,363 | 84,583 | (2,569 | ) | ||
| Dreyfus | |||||||
| Inflation Adjusted | |||||||
| Securities Fund, | |||||||
| Institutional Shares | 72,992 | 33,295 | 44,583 | 2,453 | |||
| Dreyfus International | |||||||
| Bond Fund Cl. I | 74,864 | 55,168 | 49,537 | (271 | ) | ||
| Dreyfus Natural | |||||||
| Resources Fund, Cl. I | 99,275 | 97,278 | 72,488 | (10,850 | ) | ||
| Dreyfus/The Boston | |||||||
| Company Emerging | |||||||
| Markets Core Equity | |||||||
| Fund, Cl. I | 16,972 | 73,771 | 80,521 | (12,327 | ) | ||
| Total | 759,967 | 586,239 | 715,834 | (38,492 | ) | ||
| † Includes reinvested dividends/distributions. | |||||||
| Change in Net | |||||||
| Affiliated | Unrealized | ||||||
| Investment | Appreciation | Value | Net | Dividends/ | |||
| Company | (Depreciation) ($) | 10/31/2012 | ($) | Assets (%) Distributions ($) | |||
| Dreyfus Emerging | |||||||
| Markets Debt Local | |||||||
| Currency Fund, Cl. I | 6,357 | 63,145 | 10.7 | 2,715 | |||
| Dreyfus Emerging | |||||||
| Markets Fund, Cl. I | 1,701 | 113,922 | 19.3 | 1,866 | |||
20
| Change in Net | |||||||
| Affiliated | Unrealized | ||||||
| Investment | Appreciation | Value | Net | Dividends/ | |||
| Company | (Depreciation) ($) | 10/31/2012 | ($) | Assets (%) Distributions ($) | |||
| Dreyfus Global Absolute | |||||||
| Return Fund, Cl. I | (966 | ) | 108,069 | 18.3 | — | ||
| Dreyfus Global Real Estate | |||||||
| Securities Fund, Cl. I | 7,684 | 66,029 | 11.2 | 1,439 | |||
| Dreyfus Inflation Adjusted | |||||||
| Securities Fund, | |||||||
| Institutional Shares | 712 | 64,869 | 11.0 | 2,239 | |||
| Dreyfus International | |||||||
| Bond Fund Cl. I | 1,885 | 82,109 | 13.9 | 1,646 | |||
| Dreyfus Natural | |||||||
| Resources Fund, Cl. I | 2,056 | 115,271 | 19.5 | — | |||
| Dreyfus/The Boston | |||||||
| Company Emerging | |||||||
| Markets Core Equity | |||||||
| Fund, Cl. I | 2,105 | — | — | 10,784 | |||
| Total | 21,534 | 613,414 | 103.9 | % | 20,689 | ||
| † | Includes reinvested dividends/distributions. |
(d) Dividends to shareholders: Dividends are recorded on the ex-dividend date. Dividends from investment income-net and dividends from net realized capital gains, if any, are normally declared and paid annually, but the fund may make distributions on a more frequent basis to comply with the distribution requirements of the Internal Revenue Code of 1986, as amended (the “Code”).To the extent that net realized capital gains can be offset by capital loss carryovers, it is the policy of the fund not to distribute such gains. Income and capital gain distributions are determined in accordance with income tax regulations, which may differ from GAAP.
(e) Federal income taxes: It is the policy of the fund to continue to qualify as a regulated investment company, if such qualification is in the best interests of its shareholders, by complying with the applicable provisions of the Code, and to make distributions of taxable income sufficient to relieve it from substantially all federal income and excise taxes.
As of and during the period ended October 31, 2012, the fund did not have any liabilities for any uncertain tax positions.The fund recognizes interest and penalties, if any, related to uncertain tax positions as income
The Fund 21
NOTES TO FINANCIAL STATEMENTS (continued)
tax expense in the Statement of Operations. During the period, the fund did not incur any interest or penalties.
Each of the tax years in the four-year period ended October 31, 2012 remains subject to examination by the Internal Revenue Service and state taxing authorities.
At October 31, 2012, the components of accumulated earnings on a tax basis were as follows: accumulated capital losses $25,486 and unrealized appreciation $53,717. In addition, the fund deferred for tax purposes late year ordinary losses of $819 to the first day of the following fiscal year.
Under the Regulated Investment Company Modernization Act of 2010 (the “2010 Act”), the fund is permitted to carry forward capital losses incurred in taxable years beginning after December 22, 2010 (“post-enactment losses”) for an unlimited period. Furthermore, post-enactment capital loss carryovers retain their character as either short-term or long-term capital losses rather than short-term as they were under previous statute.
The accumulated capital loss carryover is available for federal income tax purposes to be applied against future net realized capital gains, if any, realized subsequent to October 31, 2012.The fund has $17,975 of post-enactment short-term capital losses and $7,511 of post-enactment long-term capital losses which can be carried forward for an unlimited period.
The tax character of distributions paid to shareholders during the fiscal periods ended October 31, 2012 and October 31, 2011 were as follows: ordinary income $9,250 and $12,329 and long-term capital gains $10,465 and $0, respectively.
During the period ended October 31, 2012, as a result of permanent book to tax differences, primarily due to the tax treatment for short-term capital gain distributions from regulated investment company holdings and dividend reclassification, the fund increased accumulated undistributed investment income-net by $1,418, decreased net
22
realized gain (loss) on investments by $1,123 and decreased paid-in capital by $295. Net assets and net asset value per share were not affected by this reclassification.
NOTE 2—Management Fee and Other Transactions with Affiliates:
(a) Pursuant to a management agreement with the Manager, there is no management fee paid to the Manager. The fund invests in other mutual funds advised by the Manager. All fees and expenses of the underlying funds are reflected in the underlying fund’s net asset value. The Manager has contractually agreed, until March 1, 2013, to assume the expenses of the fund so that the total annual fund’s and underlying funds’ operating expenses of none of the classes (excluding Rule 12b-1 Distribution Plan fees, Shareholder Services Plan fees, taxes, brokerage commissions, underlying fund expenses and extraordinary expenses) exceed 1.35% of the value of the fund’s average daily net assets.The reduction in expenses, pursuant to the undertaking, amounted to $110,883 during the period ended October 31, 2012.
(b) Under the Distribution Plan adopted pursuant to Rule 12b-1 under the Act, Class C shares pay the Distributor for distributing its shares at an annual rate of .75% of the value of the average daily net assets of Class C shares. During the period ended October 31, 2012, Class C shares were charged $961 pursuant to the Distribution Plan.
(c) Under the Shareholder Services Plan, Class A and Class C shares pay the Distributor at an annual rate of .25% of the value of their average daily net assets for the provision of certain services.The services provided may include personal services relating to shareholder accounts, such as answering shareholder inquiries regarding the fund and providing reports and other information, and services related to the maintenance of shareholder accounts.The Distributor may make payments to Service Agents (securities dealers, financial institutions or other industry professionals) in respect of these services. The Distributor determines the
The Fund 23
NOTES TO FINANCIAL STATEMENTS (continued)
amounts to be paid to Service Agents. During the period ended October 31, 2012, Class A and Class C shares were charged $1,240 and $321, respectively, pursuant to the Shareholder Services Plan.
The fund has arrangements with the transfer agent and the custodian whereby the fund may receive earnings credits when positive cash balances are maintained, which are used to offset transfer agency and custody fees. For financial reporting purposes, the fund includes net earnings credits as an expense offset in the Statement of Operations.
The fund compensates DreyfusTransfer, Inc. (“DTI”), a wholly-owned subsidiary of the Manager, under a transfer agency agreement for providing transfer agency services for the fund and, since May 29, 2012, cash management services related to fund subscriptions and redemptions. During the period ended October 31, 2012, the fund was charged $774 for transfer agency services and $7 for cash management services. Cash management fees were partially offset by earnings credits of $1. These fees are included in Shareholder servicing costs in the Statement of Operations.
The fund compensatesThe Bank of NewYork Mellon under a custody agreement for providing custodial services for the fund. During the period ended October 31, 2012, the fund was charged $3,447 pursuant to the custody agreement.
Prior to May 29, 2012, the fund compensated The Bank of NewYork Mellon under a cash management agreement for performing cash management services related to fund subscriptions and redemptions. During the period ended October 31, 2012, the fund was charged $30 pursuant to the cash management agreement, which is included in Shareholder servicing costs in the Statement of Operations.These fees were partially offset by earnings credits of $1.
24
During the period ended October 31, 2012, the fund was charged $8,517 for services performed by the Chief Compliance Officer and his staff.
The components of “Due from The Dreyfus Corporation and affiliates” in the Statement of Assets and Liabilities consist of: Distribution Plan fees $75, Shareholder Services Plan fees $110, custodian fees $905, Chief Compliance Officer fees $2,654 and transfer agency fees $130, which are offset against an expense reimbursement currently in effect in the amount of $10,860.
(d) Each Board member also serves as a Board member of other funds within the Dreyfus complex. Annual retainer fees and attendance fees are allocated to each fund based on net assets.
NOTE 3—Securities Transactions:
The aggregate amount of purchases and sales of investment securities, excluding short-term securities, during the period ended October 31, 2012, amounted to $586,239 and $715,834, respectively.
At October 31, 2012, the cost of investments for federal income tax purposes was $559,697; accordingly, accumulated net unrealized appreciation on investments was $53,717, consisting of $61,232 gross unrealized appreciation and $7,515 gross unrealized depreciation.
The Fund 25
REPORT OF INDEPENDENT REGISTERED
PUBLIC ACCOUNTING FIRM
Shareholders and Board of Directors
Dreyfus Satellite Alpha Fund
We have audited the accompanying statement of assets and liabilities, including the statement of investments, of Dreyfus Satellite Alpha Fund (one of the series comprising Dreyfus Premier Investment Funds, Inc.) as of October 31, 2012, and the related statement of operations for the year then ended, the statement of changes in net assets for each of the two years in the period then ended, and the financial highlights for each of the periods indicated therein. These financial statements and financial highlights are the responsibility of the Fund’s management. Our responsibility is to express an opinion on these financial statements and financial highlights based on our audits.
We conducted our audits in accordance with the standards of the Public Company Accounting Oversight Board (United States).Those standards require that we plan and perform the audit to obtain reasonable assurance about whether the financial statements and financial highlights are free of material misstatement.We were not engaged to perform an audit of the Fund’s internal control over financial reporting. Our audits included consideration of internal control over financial reporting as a basis for designing audit procedures that are appropriate in the circumstances, but not for the purpose of expressing an opinion on the effectiveness of the Fund’s internal control over financial reporting. Accordingly, we express no such opinion.An audit also includes examining, on a test basis, evidence supporting the amounts and disclosures in the financial statements and financial highlights, assessing the accounting principles used and significant estimates made by management, and evaluating the overall financial statement presentation. Our procedures included confirmation of securities owned as of October 31, 2012 by correspondence with the custodian and others.We believe that our audits provide a reasonable basis for our opinion.
In our opinion, the financial statements and financial highlights referred to above present fairly, in all material respects, the financial position of Dreyfus Satellite Alpha Fund at October 31, 2012, the results of its operations for the year then ended, the changes in its net assets for each of the two years in the period then ended, and the financial highlights for each of the indicated periods, in conformity with U.S. generally accepted accounting principles.

New York, New York
December 27, 2012
26
IMPORTANT TAX INFORMATION (Unaudited)
For federal tax purposes, the fund hereby reports 100% of the ordinary dividends paid during the fiscal year ended October 31, 2012 as qualifying for the corporate dividends received deduction. Also, certain dividends paid by the fund may be subject to a maximum tax rate of 15%, as provided for by the Jobs and GrowthTax Relief Reconciliation Act of 2003. Of the distributions paid during the fiscal year, $9,250 represents the maximum amount that may be considered qualified dividend income. The fund also hereby reports $.2042 per share as a long-term capital gain distribution paid on December 29, 2011. Shareholders will receive notification in early 2013 of the percentage applicable to the preparation of their 2012 income tax returns.
PROXY RESULTS (Unaudited)
The Company held a special meeting of shareholders on August 3, 2012.The proposal considered at the meeting, and the results, are as follows:
| Shares | |||
| Votes For | Authority Withheld | ||
| To elect Board Members: | |||
| Peggy Davis† | 125,042,328 | 610,092 | |
| Ehud Houminer† | 125,002,253 | 650,167 | |
| Martin Peretz† | 125,018,821 | 633,599 |
† Each new Board Member’s term commenced on September 1, 2012.
In addition Joseph S. DiMartino, David P. Feldman, Lynn Martin, Robin A. Melvin, and Philip L.Toia continue as Board Members of the Company.
The Fund 27
INFORMATION ABOUT THE RENEWAL OF THE
FUND’S MANAGEMENT AGREEMENT (Unaudited)
At a meeting of the fund’s Board of Directors held on June 28, 2012, the Board considered the renewal of the fund’s Management Agreement pursuant to which Dreyfus provides the fund with investment advisory and administrative services (the “Agreement”). The Board members, none of whom are “interested persons” (as defined in the Investment Company Act of 1940, as amended) of the fund, were assisted in their review by independent legal counsel and met with counsel in executive session separate from Dreyfus representatives. In considering the renewal of the Agreement, the Board considered all factors that it believed to be relevant, including those discussed below.The Board did not identify any one factor as dispositive, and each Board member may have attributed different weights to the factors considered.
Analysis of Nature, Extent, and Quality of Services Provided to the Fund.The Board considered information previously provided to them in presentations from Dreyfus representatives regarding the nature, extent, and quality of the services provided to funds in the Dreyfus fund complex, and Dreyfus representatives confirmed that there had been no material changes in this information. Dreyfus provided the number of open accounts in the fund, the fund’s asset size and the allocation of fund assets among distribution channels. Dreyfus also had previously provided information regarding the diverse intermediary relationships and distribution channels of funds in the Dreyfus fund complex (such as retail direct or intermediary, in which intermediaries typically are paid by the fund and/or Dreyfus) and Dreyfus’ corresponding need for broad, deep, and diverse resources to be able to provide ongoing shareholder services to each intermediary or distribution channel, as applicable to the fund.
The Board also considered research support available to, and portfolio management capabilities of, the fund’s portfolio management personnel and that Dreyfus also provides oversight of day-to-day fund operations, including fund accounting and administration and assistance in meeting legal and regulatory requirements.The Board also considered Dreyfus’ extensive administrative, accounting, and compliance infrastructures. The Board also considered portfolio management’s brokerage policies and practices (including policies and practices regarding soft dollars) and the standards applied in seeking best execution.
28
Comparative Analysis of the Fund’s Performance and Management Fee and Expense Ratio.The Board reviewed reports prepared by Lipper, Inc. (“Lipper”), an independent provider of investment company data, which included information comparing (1) the fund’s performance with the performance of a group of comparable funds (the “Performance Group”) and with a broader group of funds (the “Performance Universe”), all for various periods ended May 31, 2012, and (2) the fund’s actual and contractual management fees and total expenses with those of a group of comparable funds (the “Expense Group”) and with a broader group of funds (the “Expense Universe”), the information for which was derived in part from fund financial statements available to Lipper as of the date of its analysis. Dreyfus previously had furnished the Board with a description of the methodology Lipper used to select the Performance Group and Performance Universe and the Expense Group and Expense Universe.
Dreyfus representatives stated that the usefulness of performance comparisons may be affected by a number of factors, including different investment limitations that may be applicable to the fund and comparison funds. The Board discussed the results of the comparisons and noted that the fund’s total return performance ranked third and fourth of the four funds in the Performance Group, and was above and below the Performance Universe medians, for the one- and two-year periods, respectively. Dreyfus also provided a comparison of the fund’s calendar year total returns to the returns of the fund’s benchmark index.
The Board also reviewed the range of actual and contractual management fees and total expenses of the Expense Group and Expense Universe funds and discussed the results of the comparisons.The Board noted that the fund’s management fee is paid only at the underlying funds’ level.They further noted that the fund’s total expense ratio was below the Expense Group and Expense Universe medians.
Dreyfus representatives noted that Dreyfus has contractually agreed, until March 1, 2013, to assume the expenses of the fund so that the total annual fund and underlying funds operating expenses of none
The Fund 29
INFORMATION ABOUT THE RENEWAL OF THE FUND’S
MANAGEMENT AGREEMENT (Unaudited) (continued)
of the classes (excluding the fund’s Rule 12b-1 fees, shareholder services fees, taxes, interest, brokerage commissions, commitment fees on borrowings and extraordinary expenses) exceed 1.35% of the fund’s average daily net assets.
Dreyfus representatives reviewed with the Board the management or investment advisory fees (1) paid by funds advised or administered by Dreyfus that are in the same Lipper category as the fund and (2) paid to Dreyfus or the Dreyfus-affiliated primary employer of the fund’s primary portfolio manager(s) for advising any separate accounts and/or other types of client portfolios that are considered to have similar investment strategies and policies as the fund (the “Similar Clients”), and explained the nature of the Similar Clients. They discussed differences in fees paid and the relationship of the fees paid in light of any differences in the services provided and other relevant factors. The Board considered the relevance of the fee information provided for the Similar Clients to evaluate the appropriateness and reasonableness of the fund’s management fee.
Analysis of Profitability and Economies of Scale. Dreyfus does not receive direct profits from the fund’s management fee, as the fund pays no direct management fee.As such, the Board did not consider an evaluation of profitability or economies of scale to be relevant.The Board also considered potential benefits to Dreyfus from acting as investment adviser and noted that there were no soft dollar arrangements in effect for trading the fund’s investments.
At a special Board meeting held on April 23, 2012, the Board approved consolidating the fund’s Board with the boards of certain other funds in The Dreyfus Family of Funds, effective September 1, 2012, subject to the election of the new Board members by shareholders of the fund (the “Board Consolidation”). It was noted that, to align the renewal dates of the Management Agreements of the funds involved in the Board Consolidation, management recommended changing the fund’s Management Agreement renewal date to March 30th, subject to shareholder election of the new Board members for the fund.
30
At the conclusion of these discussions, the Board agreed that it had been furnished with sufficient information to make an informed business decision with respect to the renewal of the Agreement. Based on the discussions and considerations as described above, the Board concluded and determined as follows.
The Board concluded that the nature, extent and quality of the services provided by Dreyfus are adequate and appropriate.
The Board generally was satisfied with the fund’s relative performance.
As described above, the Board did not consider profitability or economies of scale to be relevant since the fund does not pay a direct management fee.
In evaluating the Agreement, the Board considered these conclusions and determinations and also relied on its previous knowledge, gained through meetings and other interactions with Dreyfus and its affiliates, of the fund and the services provided to the fund by Dreyfus. The Board also relied on information received on a routine and regular basis throughout the year relating to the operations of the fund and the investment management and other services provided under the Agreement, including information on the investment performance of the fund in comparison to similar mutual funds and benchmark performance indices; general market outlook as applicable to the fund; and compliance reports. In addition, it should be noted that the Board’s consideration of the contractual fee arrangements for this fund had the benefit of a number of years of reviews of prior or similar agreements during which lengthy discussions took place between the Board and Dreyfus representatives. Certain aspects of the arrangements may receive greater scrutiny in some years than in others, and the Board’s conclusions may be based, in part, on their consideration of the same or similar arrangements in prior years.The Board determined that renewal of the Agreement through March 30, 2013, subject to shareholder approval of the Board Consolidation as described above, was in the best interests of the fund and its shareholders.
The Fund 31
BOARD MEMBERS INFORMATION (Unaudited)
| Joseph S. DiMartino (69) |
| Chairman of the Board (1995) |
| Principal Occupation During Past 5Years: |
| • Corporate Director and Trustee |
| Other Public Company Board Memberships During Past 5Years: |
| • CBIZ (formerly, Century Business Services, Inc.), a provider of outsourcing functions for small |
| and medium size companies, Director (1997-present) |
| • Sunair Services Corporation, a provider of certain outdoor-related services to homes and |
| businesses, Director (2005-2009) |
| • The Newark Group, a provider of a national market of paper recovery facilities, paperboard |
| mills and paperboard converting plants, Director (2000-2010) |
| No. of Portfolios for which Board Member Serves: 157 |
| ——————— |
| Peggy C. Davis (69) |
| Board Member (2012) |
| Principal Occupation During Past 5Years: |
| • Shad Professor of Law, New York University School of Law (1983-present) |
| No. of Portfolios for which Board Member Serves: 63 |
| ——————— |
| David P. Feldman (72) |
| Board Member (1991) |
| Principal Occupation During Past 5Years: |
| • Corporate Director and Trustee |
| Other Public Company Board Memberships During Past 5Years: |
| • BBH Mutual Funds Group (4 registered mutual funds), Director (1992-present) |
| • QMed, Inc. a healthcare company, Director (1999-2007) |
| No. of Portfolios for which Board Member Serves: 46 |
| ——————— |
| Ehud Houminer (72) |
| Board Member (2012) |
| Principal Occupation During Past 5Years: |
| • Executive-in-Residence at the Columbia Business School, Columbia University (1992-present) |
| Other Public Company Board Memberships During Past 5Years: |
| • Avnet Inc., an electronics distributor, Director (1993-2012) |
| No. of Portfolios for which Board Member Serves: 73 |
32
| Lynn Martin (72) |
| Board Member (1993) |
| Principal Occupation During Past 5Years: |
| • President of The Martin Hall Group LLC, a human resources consulting firm, from |
| January 2005-present |
| Other Public Company Board Memberships During Past 5Years: |
| • AT&T Inc., a telecommunications company, Director (1999-2012) |
| • Ryder System, Inc., a supply chain and transportation management company, Director (1993-2012) |
| • The Proctor & Gamble Co., a consumer products company, Director (1994-2009) |
| • Constellation Energy Group Inc., Director (2003-2009) |
| No. of Portfolios for which Board Member Serves: 46 |
| ——————— |
| Robin A. Melvin (49) |
| Board Member (2011) |
| Principal Occupation During Past 5Years: |
| • Director, Boisi Family Foundation, a private family foundation that supports youth-serving orga- |
| nizations that promote the self sufficiency of youth from disadvantaged circumstances (1995-2012) |
| No. of Portfolios for which Board Member Serves: 83 |
| ——————— |
| Dr. Martin Peretz (73) |
| Board Member (2012) |
| Principal Occupation During Past 5Years: |
| • Editor-in-Chief Emeritus of The New Republic Magazine (2010-present) (previously, |
| Editor-in-Chief, 1974-2010) |
| • Director of TheStreet.com, a financial information service on the web (1996-present) |
| No. of Portfolios for which Board Member Serves: 46 |
| ——————— |
| Philip L. Toia (79) |
| Board Member (1997) |
| Principal Occupation During Past 5Years: |
| • Private Investor |
| No. of Portfolios for which Board Member Serves: 56 |
| ——————— |
| Once elected all Board Members serve for an indefinite term, but achieve Emeritus status upon reaching age 80.The |
| address of the Board Members and Officers is c/o The Dreyfus Corporation, 200 Park Avenue, NewYork, NewYork |
| 10166.Additional information about the Board Members is available in the fund’s Statement of Additional Information |
| which can be obtained from Dreyfus free of charge by calling this toll free number: 1-800-DREYFUS. |
| Daniel Rose, Emeritus Board Member |
| Sander Vanocur, Emeritus Board Member |
The Fund 33
OFFICERS OF THE FUND (Unaudited)
34
The Fund 35
NOTES
Item 2. Code of Ethics.
The Registrant has adopted a code of ethics that applies to the Registrant's principal executive officer, principal financial officer, principal accounting officer or controller, or persons performing similar functions. There have been no amendments to, or waivers in connection with, the Code of Ethics during the period covered by this Report.
Item 3. Audit Committee Financial Expert.
The Registrant's Board has determined that David P. Feldman, a member of the Audit Committee of the Board, is an audit committee financial expert as defined by the Securities and Exchange Commission (the "SEC"). David P. Feldman is "independent" as defined by the SEC for purposes of audit committee financial expert determinations.
Item 4. Principal Accountant Fees and Services.
(a) Audit Fees. The aggregate fees billed for each of the last two fiscal years (the "Reporting Periods") for professional services rendered by the Registrant's principal accountant (the "Auditor") for the audit of the Registrant's annual financial statements or services that are normally provided by the Auditor in connection with the statutory and regulatory filings or engagements for the Reporting Periods, were $213,696 in 2011 and $186,586 in 2012.
(b) Audit-Related Fees. The aggregate fees billed in the Reporting Periods for assurance and related services by the Auditor that are reasonably related to the performance of the audit of the Registrant's financial statements and are not reported under paragraph (a) of this Item 4 were $30,000 in 2011 and $30,000 in 2012. These services consisted of one or more of the following: (i) agreed upon procedures related to compliance with Internal Revenue Code section 817(h), (ii) security counts required by Rule 17f-2 under the Investment Company Act of 1940, as amended, (iii) advisory services as to the accounting or disclosure treatment of Registrant transactions or events and (iv) advisory services to the accounting or disclosure treatment of the actual or potential impact to the Registrant of final or proposed rules, standards or interpretations by the Securities and Exchange Commission, the Financial Accounting Standards Boards or other regulatory or standard-setting bodies.
The aggregate fees billed in the Reporting Periods for non-audit assurance and related services by the Auditor to the Registrant's investment adviser (not including any sub-investment adviser whose role is primarily portfolio management and is subcontracted with or overseen by another investment adviser), and any entity controlling, controlled by or under common control with the investment adviser that provides ongoing services to the Registrant ("Service Affiliates"), that were reasonably related to the performance of the annual audit of the Service Affiliate, which required pre-approval by the Audit Committee were $0 in 2011 and $0 in 2012.
(c) Tax Fees. The aggregate fees billed in the Reporting Periods for professional services rendered by the Auditor for tax compliance, tax advice, and tax planning ("Tax Services") were $13,805 in 2011 and $20,624 in 2012. These services consisted of: (i) review or preparation of U.S. federal, state, local and excise tax returns; (ii) U.S. federal, state and local tax planning, advice and assistance regarding statutory, regulatory or administrative developments; (iii) tax advice regarding tax qualification matters and/or treatment of various financial instruments held or proposed to be acquired or held, and (iv) determination of Passive Foreign Investment Companies. The aggregate fees billed in the Reporting Periods for Tax Services by the Auditor to Service Affiliates, which required pre-approval by the Audit Committee were $0 in $2011 and $0 in 2012.
3
(d) All Other Fees. The aggregate fees billed in the Reporting Periods for products and services provided by the Auditor, other than the services reported in paragraphs (a) through (c) of this Item, were $511 in 2011 and $1,412 in 2012. These services consisted of a review of the Registrant's anti-money laundering program.
The aggregate fees billed in the Reporting Periods for Non-Audit Services by the Auditor to Service Affiliates, other than the services reported in paragraphs (b) through (c) of this Item, which required pre-approval by the Audit Committee, were $0 in 2011 and $200,000 in 2012.
(e)(1) Audit Committee Pre-Approval Policies and Procedures. The Registrant's Audit Committee has established policies and procedures (the "Policy") for pre-approval (within specified fee limits) of the Auditor's engagements for non-audit services to the Registrant and Service Affiliates without specific case-by-case consideration. The pre-approved services in the Policy can include pre-approved audit services, pre-approved audit-related services, pre-approved tax services and pre-approved all other services. Pre-approval considerations include whether the proposed services are compatible with maintaining the Auditor's independence. Pre-approvals pursuant to the Policy are considered annually.
(e)(2) Note: None of the services described in paragraphs (b) through (d) of this Item 4 were approved by the Audit Committee pursuant to paragraph (c)(7)(i)(C) of Rule 2-01 of Regulation S-X.
(f) None of the hours expended on the principal accountant's engagement to audit the registrant's financial statements for the most recent fiscal year were attributed to work performed by persons other than the principal account's full-time, permanent employees.
Non-Audit Fees. The aggregate non-audit fees billed by the Auditor for services rendered to the Registrant, and rendered to Service Affiliates, for the Reporting Periods were $18,299,198 in 2011 and $47,346,640 in 2012.
Auditor Independence. The Registrant's Audit Committee has considered whether the provision of non-audit services that were rendered to Service Affiliates, which were not pre-approved (not requiring pre-approval), is compatible with maintaining the Auditor's independence.
Item 5. Audit Committee of Listed Registrants.
Not applicable. [CLOSED-END FUNDS ONLY]
Item 6. Investments.
(a) Not applicable.
Item 7. Disclosure of Proxy Voting Policies and Procedures for Closed-End Management Investment Companies.
Not applicable. [CLOSED-END FUNDS ONLY]
Item 8. Portfolio Managers of Closed-End Management Investment Companies.
Not applicable. [CLOSED-END FUNDS ONLY, beginning with reports for periods ended on and after December 31, 2005]
Item 9. Purchases of Equity Securities by Closed-End Management Investment Companies and Affiliated Purchasers.
4
Not applicable. [CLOSED-END FUNDS ONLY]
Item 10. Submission of Matters to a Vote of Security Holders.
There have been no material changes to the procedures applicable to Item 10.
Item 11. Controls and Procedures.
(a) The Registrant's principal executive and principal financial officers have concluded, based on their evaluation of the Registrant's disclosure controls and procedures as of a date within 90 days of the filing date of this report, that the Registrant's disclosure controls and procedures are reasonably designed to ensure that information required to be disclosed by the Registrant on Form N-CSR is recorded, processed, summarized and reported within the required time periods and that information required to be disclosed by the Registrant in the reports that it files or submits on Form N-CSR is accumulated and communicated to the Registrant's management, including its principal executive and principal financial officers, as appropriate to allow timely decisions regarding required disclosure.
(b) There were no changes to the Registrant's internal control over financial reporting that occurred during the second fiscal quarter of the period covered by this report that have materially affected, or are reasonably likely to materially affect, the Registrant's internal control over financial reporting.
Item 12. Exhibits.
(a)(1) Code of ethics referred to in Item 2.
(a)(2) Certifications of principal executive and principal financial officers as required by Rule 30a-2(a) under the Investment Company Act of 1940.
(a)(3) Not applicable.
(b) Certification of principal executive and principal financial officers as required by Rule 30a-2(b) under the Investment Company Act of 1940.
5
SIGNATURES
Pursuant to the requirements of the Securities Exchange Act of 1934 and the Investment Company Act of 1940, the Registrant has duly caused this Report to be signed on its behalf by the undersigned, thereunto duly authorized.
Dreyfus Premier Investment Funds, Inc.
By: /s/ Bradley J. Skapyak | |
Bradley J. Skapyak, President
| |
Date: | December 19, 2012 |
| |
Pursuant to the requirements of the Securities Exchange Act of 1934 and the Investment Company Act of 1940, this Report has been signed below by the following persons on behalf of the Registrant and in the capacities and on the dates indicated. | |
| |
By: /s/ Bradley J. Skapyak | |
Bradley J. Skapyak, President
| |
Date: | December 19, 2012 |
| |
By: /s/ James Windels | |
James Windels, Treasurer
| |
Date: | December 19, 2012 |
| |
EXHIBIT INDEX
(a)(1) Code of ethics referred to in Item 2.
(a)(2) Certifications of principal executive and principal financial officers as required by Rule 30a-2(a) under the Investment Company Act of 1940. (EX-99.CERT)
(b) Certification of principal executive and principal financial officers as required by Rule 30a-2(b) under the Investment Company Act of 1940. (EX-99.906CERT)