UNITED STATES
SECURITIES AND EXCHANGE COMMISSION
Washington, D.C. 20549
FORM N-CSR
CERTIFIED SHAREHOLDER REPORT OF REGISTERED MANAGEMENT
INVESTMENT COMPANIES
Investment Company Act file number | 811- 6490 | |||||
|
| |||||
| Dreyfus Premier Investment Funds, Inc. |
| ||||
| (Exact name of Registrant as specified in charter) |
| ||||
|
|
| ||||
|
c/o The Dreyfus Corporation 200 Park Avenue New York, New York 10166 |
| ||||
| (Address of principal executive offices) (Zip code) |
| ||||
|
|
| ||||
| Janette Farrager, Esq. 200 Park Avenue New York, New York 10166 |
| ||||
| (Name and address of agent for service) |
| ||||
| ||||||
Registrant's telephone number, including area code: | (212) 922-6000 | |||||
|
| |||||
Date of fiscal year end:
| 10/31 |
| ||||
Date of reporting period: | 10/31/11 |
| ||||
The following N-CSR relates only to the Registrant’s series listed below and does not affect the other series of the Registrant, which has a different fiscal year end and, therefore, different N-CSR reporting requirements. A separate N-CSR Form will be filed for this series, as appropriate.
DREYFUS PREMIER INVESTMENT FUNDS, INC.
- Dreyfus Diversified International Fund
- Dreyfus Diversified Large Cap Fund
- Dreyfus Emerging Asia Fund
- Dreyfus Greater China Fund
- Dreyfus India Fund
- Dreyfus Satellite Alpha Fund
| Dreyfus |
| Diversified |
| International Fund |
ANNUAL REPORT October 31, 2011
Save time. Save paper. View your next shareholder report online as soon as it’s available. Log into www.dreyfus.com and sign up for Dreyfus eCommunications. It’s simple and only takes a few minutes.
The views expressed in this report reflect those of the portfolio manager only through the end of the period covered and do not necessarily represent the views of Dreyfus or any other person in the Dreyfus organization. Any such views are subject to change at any time based upon market or other conditions and Dreyfus disclaims any responsibility to update such views.These views may not be relied on as investment advice and, because investment decisions for a Dreyfus fund are based on numerous factors, may not be relied on as an indication of trading intent on behalf of any Dreyfus fund.
| Not FDIC-Insured • Not Bank-Guaranteed • May Lose Value |
Contents | |
THE FUND | |
| 2 | A Letter from the Chairman and CEO |
| 3 | Discussion of Fund Performance |
| 6 | Fund Performance |
| 8 | Understanding Your Fund’s Expenses |
| 8 | Comparing Your Fund’s Expenses With Those of Other Funds |
| 9 | Statement of Investments |
| 10 | Statement of Assets and Liabilities |
| 11 | Statement of Operations |
| 12 | Statement of Changes in Net Assets |
| 14 | Financial Highlights |
| 17 | Notes to Financial Statements |
| 26 | Report of Independent Registered Public Accounting Firm |
| 27 | Important Tax Information |
| 28 | Proxy Results |
| 29 | Information About the Renewal of the Fund’s Management Agreement |
| 33 | Board Members Information |
| 35 | Officers of the Fund |
FOR MORE INFORMATION | |
Back Cover |
Dreyfus
Diversified
International Fund
The Fund

A LETTER FROM THE CHAIRMAN AND CEO
Dear Shareholder:
We present to you this annual report for Dreyfus Diversified International Fund, covering the 12-month period from November 1, 2010, through October 31, 2011. For information about how the fund performed during the reporting period, as well as general market perspectives, we provide a Discussion of Fund Performance on the pages that follow.
Investors were encouraged by expectations of a more robust economic recovery during the final months of 2010, but sentiment deteriorated in 2011 due to disappointing global economic data, rising commodity prices, an escalating sovereign debt crisis in Europe and a contentious debate regarding taxes, spending and borrowing in the United States. International stocks proved sensitive to these macroeconomic developments, often regardless of underlying company fundamentals, and most international equity market indices ended the reporting period with mildly negative absolute returns.
The global economic outlook currently remains clouded by market turbulence and political infighting, but we believe that a continued subpar global expansion is more likely than a return to recession. Although Europe continues to struggle with a debt crisis, inflationary pressures appear to be waning in most countries as energy prices recently have retreated from their highs. In Asia, China seems to have averted an economic contraction after implementing measures to dampen inflationary pressures. In the United States, moderately low core inflation and an accommodative monetary policy could help support near-trend growth despite ongoing deleveraging activity in the private sector.To assess the potential impact of these and other developments on your investments, we encourage you, as always, to speak with your financial advisor.
Thank you for your continued confidence and support.

Jonathan R. Baum
Chairman and Chief Executive Officer
The Dreyfus Corporation
November 15, 2011
2

DISCUSSION OF FUND PERFORMANCE
For the period of November 1, 2010, through October 31, 2011, as provided by Richard B. Hoey, A. Paul Disdier, Christopher E. Sheldon, CFA, and Keith L. Stransky, CFA, Portfolio Managers
Fund and Market Performance Overview
For the 12-month period ended October 31, 2011, Dreyfus Diversified International Fund’s Class A shares produced a total return of –6.47%, Class C shares returned –7.01% and Class I shares returned –6.33%.1This compares with a –4.08% total return for the fund’s benchmark, the Morgan Stanley Capital International Europe,Australasia, Far East Index (the “MSCI EAFE Index” or the “Index”), during the same period.2
Strong corporate earnings drove international stocks higher over the reporting period’s first half, but macroeconomic challenges later drove the MSCI EAFE Index into negative territory. The fund produced lower returns than its benchmark, primarily due to the constructive investment posture maintained by some underlying mutual funds during the market downturn.
The Fund’s Investment Approach
The fund seeks long-term capital appreciation. To pursue its goal, the fund normally allocates its assets among other mutual funds advised by The Dreyfus Corporation (Dreyfus), or its affiliates, that invest primarily in stocks issued by foreign companies.The underlying funds are selected by the Dreyfus Investment Committee based on their investment objectives and management policies, portfolio holdings, risk/reward profiles, historical performance and other factors. The Dreyfus Investment Committee will rebalance the fund’s investments in the underlying funds at least annually, but may do so more often in response to market condi-tions.As of October 31, 2011, the fund’s assets were allocated as follows:
| Underlying Funds | (%) |
| International Stock Fund | 30 |
| Dreyfus International Equity Fund | 25 |
| Dreyfus International Value Fund | 15 |
| Dreyfus/Newton International Equity Fund | 20 |
| Dreyfus Emerging Markets Fund | 8 |
| Dreyfus Emerging Asia Fund | 2 |
| The Fund | 3 |
DISCUSSION OF FUND PERFORMANCE (continued)
Macroeconomic Developments Challenged Global Growth
Positive market sentiment generally prevailed through the first quarter of 2011 amid expectations of continued global economic recovery. In addition, a weaker U.S. dollar supported exports from the United States, fueling corporate earnings growth for companies deriving a percentage of their revenues from overseas.
While global markets continued to advance over the first few months of 2011, investors grew increasingly concerned about a sovereign debt crisis in Europe, inflationary pressures in China and rising energy prices stemming from political unrest in the Middle East. In March, catastrophic natural and nuclear disasters struck Japan, disrupting the global industrial supply chain. However, most equity markets rebounded quickly, and the MSCI EAFE Index hit new highs for the reporting period in April.
By May, investor sentiment began to deteriorate in earnest. U.S. economic growth proved more sluggish than expected, and investors worried about a contentious debate regarding U.S. government spending, borrowing and taxes. In Europe, the debt problems facing Ireland, Portugal, Spain and Italy intensified, and Greece faced the possibility of default. Consequently, international markets lost all of the ground they had gained earlier, ending the reporting period with a mild loss. In a reversal of the trend over the past several years, developed markets represented in the MSCI EAFE Index generally fared better than emerging markets.
Constructive Positions Dampened Relative Performance
The fund’s allocation strategy positioned it relatively well for the reporting period’s macroeconomic developments, as an emphasis on large-cap stocks over their mid- and small-cap counterparts seemed likely to cushion the brunt of market declines when economic sentiment deteriorated. However, the benefits of our allocation strategy were more than offset by the more constructive investment postures maintained by certain underlying mutual funds, including Dreyfus International Value Fund and Dreyfus International Equity Fund. An emphasis on some of the market’s more economically sensitive industry groups and individual companies undermined these funds’ relative performance during the market downturn over the summer of 2011.
We responded to deteriorating market conditions with several allocation shifts over the second half of the reporting period.The portfolio managers reduced the fund’s exposure to Dreyfus International Value
4
Fund in June, shifting assets to Dreyfus/Newton International Equity Fund, which had constructed a more defensive portfolio. In July, we redeployed assets from Dreyfus International Value Fund into Dreyfus International Equity Fund.
Maintaining a Cautious Approach
As of the reporting period’s end, we have maintained a generally cautious outlook. Although a return to global recession looks unlikely at this point, inflation-fighting efforts in the emerging markets have dampened a major engine of global growth and Europe has continued to struggle with its sovereign debt crisis.Therefore, we have maintained the fund’s exposure to the emerging markets at approximately 10% of total assets, a position we consider neutral. We have focused primarily on developed markets through overweighted positions in International Stock Fund and Dreyfus/Newton International Equity Fund, both of which currently maintain relatively defensive investment postures. In our judgment, these are prudent strategies until the European debt crisis moves closer to a resolution and the direction of the global economy becomes clearer.
November 15, 2011
| Equity funds are subject generally to market, market sector, market liquidity, issuer and investment | |
| style risks, among other factors, to varying degrees, all of which are more fully described in the | |
| prospectus of the fund and that of each underlying fund. | |
| The ability of the fund to achieve its investment goal depends, in part, on the ability of the | |
| Dreyfus Investment Committee to allocate effectively the fund’s assets among the underlying | |
| funds.There can be no assurance that the actual allocations will be effective in achieving the fund’s | |
| investment goal. | |
| Each underlying fund’s performance will be influenced by political, social and economic factors | |
| affecting investments in foreign companies. Special risks associated with such companies include | |
| exposure to currency fluctuations, less liquidity, less developed or less efficient trading markets, lack | |
| of comprehensive company information, political instability and differing auditing and legal | |
| standards.These risks are higher in emerging market countries. | |
| 1 | Total return includes reinvestment of dividends and any capital gains paid, and does not take into |
| consideration the maximum initial sales charge in the case of Class A shares, or the applicable | |
| contingent deferred sales charge imposed on redemptions in the case of Class C shares. Had these | |
| charges been reflected, returns would have been lower. Past performance is no guarantee of future | |
| results. Share price and investment return fluctuate such that upon redemption, fund shares may be | |
| worth more or less than their original cost. Return figures provided reflect the absorption of certain | |
| fund expenses pursuant to an agreement by The Dreyfus Corporation through March 1, 2013, at | |
| which time it may be extended, terminated or modified. Had these expenses not been absorbed, | |
| the fund’s returns would have been lower. | |
| 2 | SOURCE: LIPPER INC. — Reflects reinvestment of net dividends and, where applicable, |
| capital gain distributions.The Morgan Stanley Capital International Europe,Australasia, Far | |
| East (MSCI EAFE) Index is an unmanaged index composed of a sample of companies | |
| representative of the market structure of European and Pacific Basin countries. |
| The Fund | 5 |
FUND PERFORMANCE
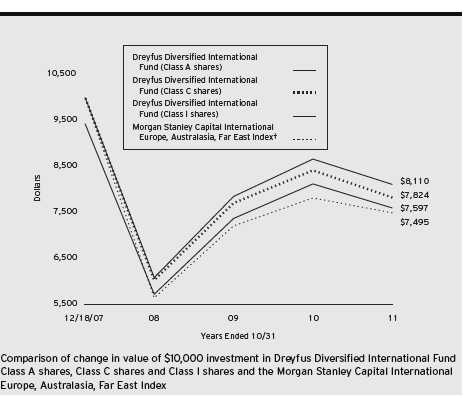
| † Source: Lipper Inc. |
| Past performance is not predictive of future performance. |
| The above graph compares a $10,000 investment made in Class A, Class C and Class I shares of Dreyfus Diversified |
| International Fund on 12/18/07 (inception date) to a $10,000 investment made in the Morgan Stanley Capital |
| International Europe,Australasia, Far East Index (the “Index”) on that date.All dividends and capital gain |
| distributions are reinvested. |
| The fund’s performance shown in the line graph above takes into account the maximum initial sales charge on Class A |
| shares and all other applicable fees and expenses on all classes.The Index is an unmanaged index composed of a sample |
| of companies representative of the market structure of European and Pacific Basin countries. Unlike a mutual fund, the |
| Index is not subject to charges, fees and other expenses. Investors cannot invest directly in any index. Further information |
| relating to fund performance, including expense reimbursements, if applicable, is contained in the Financial Highlights |
| section of the prospectus and elsewhere in this report. |
6
| Average Annual Total Returns as of 10/31/11 | |||||
| Inception | From | ||||
| Date | 1Year | Inception | |||
| Class A shares | |||||
| with maximum sales charge (5.75%) | 12/18/07 | –11.85% | –6.86% | ||
| without sales charge | 12/18/07 | –6.47% | –5.42% | ||
| Class C shares | |||||
| with applicable redemption charge † | 12/18/07 | –7.93% | –6.14% | ||
| without redemption | 12/18/07 | –7.01% | –6.14% | ||
| Class I shares | 12/18/07 | –6.33% | –5.27% | ||
| Morgan Stanley Capital International | |||||
| Europe, Australasia, Far East Index | 12/31/07 | –4.08% | –7.25%†† | ||
Past performance is not predictive of future performance.The fund’s performance shown in the graph and table does not reflect the deduction of taxes that a shareholder would pay on fund distributions or the redemption of fund shares.
| † | The maximum contingent deferred sales charge for Class C shares is 1% for shares redeemed within one year of the |
| date of purchase. | |
| †† | For comparative purposes, the value of the Index as of 12/31/07 is used as the beginning value on 12/18/07. |
| The Fund | 7 |
UNDERSTANDING YOUR FUND’S EXPENSES (Unaudited)
As a mutual fund investor, you pay ongoing expenses, such as management fees and other expenses. Using the information below, you can estimate how these expenses affect your investment and compare them with the expenses of other funds.You also may pay one-time transaction expenses, including sales charges (loads) and redemption fees, which are not shown in this section and would have resulted in higher total expenses. For more information, see your fund’s prospectus or talk to your financial adviser.
Review your fund’s expenses
The table below shows the expenses you would have paid on a $1,000 investment in Dreyfus Diversified International Fund from May 1, 2011 to October 31, 2011. It also shows how much a $1,000 investment would be worth at the close of the period, assuming actual returns and expenses.
Expenses and Value of a $1,000 Investment
assuming actual returns for the six months ended October 31, 2011
| Class A | Class C | Class I | ||||
| Expenses paid per $1,000† | $ | .97 | $ | 2.92 | $ | .19 |
| Ending value (after expenses) | $ | 839.00 | $ | 837.10 | $ | 839.10 |
| COMPARING YOUR FUND’S EXPENSES |
| WITH THOSE OF OTHER FUNDS (Unaudited) |
Using the SEC’s method to compare expenses
The Securities and Exchange Commission (SEC) has established guidelines to help investors assess fund expenses. Per these guidelines, the table below shows your fund’s expenses based on a $1,000 investment, assuming a hypothetical 5% annualized return. You can use this information to compare the ongoing expenses (but not transaction expenses or total cost) of investing in the fund with those of other funds.All mutual fund shareholder reports will provide this information to help you make this comparison. Please note that you cannot use this information to estimate your actual ending account balance and expenses paid during the period.
Expenses and Value of a $1,000 Investment
assuming a hypothetical 5% annualized return for the six months ended October 31, 2011
| Class A | Class C | Class I | |||
| Expenses paid per $1,000† | $1.07 | $3.21 | $.20 | ||
| Ending value (after expenses) | $1,024.15 | $1,022.03 | $1,025.00 |
| † Expenses are equal to the fund’s annualized expense ratio of .21% for Class A, .63% for Class C and .04% for |
| Class I, multiplied by the average account value over the period, multiplied by 184/365 (to reflect the one-half |
| year period). |
8
| STATEMENT OF INVESTMENTS |
| October 31, 2011 |
| Registered Investment Companies—100.1% | Shares | Value ($) | ||
| Dreyfus Emerging Asia Fund, Cl. I | 1,090,766a,b | 9,271,508 | ||
| Dreyfus Emerging Markets Fund, Cl. I | 3,324,557a | 37,334,770 | ||
| Dreyfus International Equity Fund, Cl. I | 4,669,019a | 121,861,408 | ||
| Dreyfus International Value Fund, Cl. I | 6,971,221a | 72,430,987 | ||
| Dreyfus/Newton International Equity Fund, Cl. I | 6,041,091a | 96,234,584 | ||
| International Stock Fund, Cl. I | 11,531,696a | 148,758,880 | ||
| Total Investments (cost $481,469,622) | 100.1% | 485,892,137 | ||
| Liabilities, Less Cash and Receivables | (.1%) | (455,880) | ||
| Net Assets | 100.0% | 485,436,257 | ||
| a | Investment in affiliated mutual fund. |
| b | Non-income producing security. |
| Portfolio Summary (Unaudited)† | |
| Value (%) | |
| Mutual Funds: Foreign | 100.1 |
| † Based on net assets. | |
| See notes to financial statements. |
| The Fund | 9 |
| STATEMENT OF ASSETS AND LIABILITIES |
| October 31, 2011 |
| Cost | Value | |||
| Assets ($): | ||||
| Investments in affiliated issuers—See Statement of | ||||
| Investments—Note 1(c) | 481,469,622 | 485,892,137 | ||
| Cash | 109,114 | |||
| Receivable for shares of Common Stock subscribed | 38 | |||
| Prepaid expenses | 30,590 | |||
| Due from The Dreyfus Corporation and affiliates—Note 3(c) | 944 | |||
| 486,032,823 | ||||
| Liabilities ($): | ||||
| Payable for shares of Common Stock redeemed | 500,591 | |||
| Interest payable—Note 2 | 50 | |||
| Accrued expenses | 95,925 | |||
| 596,566 | ||||
| Net Assets ($) | 485,436,257 | |||
| Composition of Net Assets ($): | ||||
| Paid-in capital | 486,389,237 | |||
| Accumulated net realized gain (loss) on investments | (5,375,495) | |||
| Accumulated net unrealized appreciation | ||||
| (depreciation) on investments | 4,422,515 | |||
| Net Assets ($) | 485,436,257 | |||
| Net Asset Value Per Share | ||||
| Class A | Class C | Class I | ||
| Net Assets ($) | 10,310,430 | 108,827 | 475,017,000 | |
| Shares Outstanding | 1,099,725 | 11,637 | 50,567,089 | |
| Net Asset Value Per Share ($) | 9.38 | 9.35 | 9.39 | |
| See notes to financial statements. | ||||
10
| STATEMENT OF OPERATIONS |
| Year Ended October 31, 2011 |
| Investment Income ($): | ||
| Income: | ||
| Cash dividends from affiliated issuers | 5,240,698 | |
| Expenses: | ||
| Directors’ fees and expenses—Note 3(d) | 61,689 | |
| Registration fees | 59,875 | |
| Auditing fees | 39,613 | |
| Shareholder servicing costs—Note 3(c) | 38,636 | |
| Legal fees | 18,894 | |
| Prospectus and shareholders’ reports | 7,440 | |
| Loan commitment fees—Note 2 | 5,146 | |
| Custodian fees—Note 3(c) | 4,050 | |
| Distribution fees—Note 3(b) | 792 | |
| Interest expense—Note 2 | 93 | |
| Miscellaneous | 12,888 | |
| Total Expenses | 249,116 | |
| Less—reduction in expenses due to undertaking—Note 3(a) | (43,841) | |
| Less—reduction in fees due to earnings credits—Note 3(c) | (14) | |
| Net Expenses | 205,261 | |
| Investment Income—Net | 5,035,437 | |
| Realized and Unrealized Gain (Loss) on Investments—Note 4 ($): | ||
| Net realized gain (loss) on investments in affiliated issuers | (3,596,273) | |
| Capital gain distributions from affiliated issuers | 1,104,886 | |
| Net Realized Gain (Loss) | (2,491,387) | |
| Net unrealized appreciation (depreciation) on investments in affiliated issuers | (45,253,453) | |
| Net Realized and Unrealized Gain (Loss) on Investments | (47,744,840) | |
| Net (Decrease) in Net Assets Resulting from Operations | (42,709,403) | |
| See notes to financial statements. | ||
| The Fund | 11 |
STATEMENT OF CHANGES IN NET ASSETS
| Year Ended October 31, | ||||
| 2011 | 2010 | |||
| Operations ($): | ||||
| Investment income—net | 5,035,437 | 2,960,831 | ||
| Net realized gain (loss) on | ||||
| investments in affiliated issuers | (2,491,387) | (1,644,695) | ||
| Net unrealized appreciation (depreciation) | ||||
| on investments in affiliated issuers | (45,253,453) | 28,289,798 | ||
| Net Increase (Decrease) in Net Assets | ||||
| Resulting from Operations | (42,709,403) | 29,605,934 | ||
| Dividends to Shareholders from ($): | ||||
| Investment income—net: | ||||
| Class A Shares | (104,433) | (72,453) | ||
| Class C Shares | (292) | (131) | ||
| Class I Shares | (5,921,143) | (2,978,422) | ||
| Net realized gain on investments: | ||||
| Class A Shares | — | (68,683) | ||
| Class C Shares | — | (729) | ||
| Class I Shares | — | (2,489,492) | ||
| Total Dividends | (6,025,868) | (5,609,910) | ||
| Capital Stock Transactions ($): | ||||
| Net proceeds from shares sold: | ||||
| Class A Shares | 4,777,705 | 4,769,147 | ||
| Class C Shares | 118,251 | 47,254 | ||
| Class I Shares | 238,791,647 | 198,182,248 | ||
| Dividends reinvested: | ||||
| Class A Shares | 104,360 | 140,848 | ||
| Class C Shares | 292 | 860 | ||
| Class I Shares | 973,208 | 1,815,986 | ||
| Cost of shares redeemed: | ||||
| Class A Shares | (1,369,169) | (2,224,129) | ||
| Class C Shares | (63,143) | (68,338) | ||
| Class I Shares | (69,062,457) | (35,031,521) | ||
| Increase (Decrease) in Net Assets | ||||
| from Capital Stock Transactions | 174,270,694 | 167,632,355 | ||
| Total Increase (Decrease) in Net Assets | 125,535,423 | 191,628,379 | ||
| Net Assets ($): | ||||
| Beginning of Period | 359,900,834 | 168,272,455 | ||
| End of Period | 485,436,257 | 359,900,834 | ||
| Undistributed investment income—net | — | 1,620 | ||
12
| Year Ended October 31, | ||||
| 2011 | 2010 | |||
| Capital Share Transactions: | ||||
| Class A | ||||
| Shares sold | 469,196 | 496,078 | ||
| Shares issued for dividends reinvested | 10,025 | 14,566 | ||
| Shares redeemed | (137,473) | (237,236) | ||
| Net Increase (Decrease) in Shares Outstanding | 341,748 | 273,408 | ||
| Class C | ||||
| Shares sold | 11,177 | 4,907 | ||
| Shares issued for dividends reinvested | 28 | 89 | ||
| Shares redeemed | (6,377) | (7,123) | ||
| Net Increase (Decrease) in Shares Outstanding | 4,828 | (2,127) | ||
| Class I | ||||
| Shares sold | 22,911,074 | 20,789,401 | ||
| Shares issued for dividends reinvested | 93,488 | 187,602 | ||
| Shares redeemed | (7,017,782) | (3,671,030) | ||
| Net Increase (Decrease) in Shares Outstanding | 15,986,780 | 17,305,973 | ||
| See notes to financial statements. | ||||
| The Fund | 13 |
FINANCIAL HIGHLIGHTS
The following tables describe the performance for each share class for the fiscal periods indicated.All information (except portfolio turnover rate) reflects financial results for a single fund share.Total return shows how much your investment in the fund would have increased (or decreased) during each period, assuming you had reinvested all dividends and distributions.These figures have been derived from the fund’s financial statements.
| Year Ended October 31, | ||||||||
| Class A Shares | 2011 | 2010 | 2009 | 2008a | ||||
| Per Share Data ($): | ||||||||
| Net asset value, beginning of period | 10.16 | 9.45 | 7.59 | 12.50 | ||||
| Investment Operations: | ||||||||
| Investment income (loss)—netb | .09 | .09 | .16 | (.01) | ||||
| Net realized and unrealized | ||||||||
| gain (loss) on investments | (.73) | .86 | 1.96 | (4.90) | ||||
| Total from Investment Operations | (.64) | .95 | 2.12 | (4.91) | ||||
| Distributions: | ||||||||
| Dividends from investment income—net | (.14) | (.12) | (.26) | — | ||||
| Dividends from net realized | ||||||||
| gain on investments | — | (.12) | — | — | ||||
| Total Distributions | (.14) | (.24) | (.26) | — | ||||
| Net asset value, end of period | 9.38 | 10.16 | 9.45 | 7.59 | ||||
| Total Return (%)c | (6.47) | 10.18 | 28.80 | (39.28)d | ||||
| Ratios/Supplemental Data (%): | ||||||||
| Ratio of total expenses | ||||||||
| to average net assetse | .40 | .40 | 1.89 | 14.57f | ||||
| Ratio of net expenses | ||||||||
| to average net assetse | .24 | .30 | .37 | .31f | ||||
| Ratio of net investment income | ||||||||
| (loss) to average net assetse | .90 | .92 | 2.01 | (.13)f | ||||
| Portfolio Turnover Rate | 16.15 | 20.78 | 36.68 | 25.65d | ||||
| Net Assets, end of period ($ x 1,000) | 10,310 | 7,701 | 4,578 | 1,646 | ||||
| a | From December 18, 2007 (commencement of operations) to October 31, 2008. |
| b | Based on average shares outstanding at each month end. |
| c | Exclusive of sales charge. |
| d | Not annualized. |
| e | Amounts do not include the activity of the underlying funds. |
| f | Annualized. |
See notes to financial statements.
14
| Year Ended October 31, | ||||||||
| Class C Shares | 2011 | 2010 | 2009 | 2008a | ||||
| Per Share Data ($): | ||||||||
| Net asset value, beginning of period | 10.10 | 9.38 | 7.54 | 12.50 | ||||
| Investment Operations: | ||||||||
| Investment income (loss)—netb | .01 | .08 | .14 | (.05) | ||||
| Net realized and unrealized | ||||||||
| gain (loss) on investments | (.71) | .78 | 1.90 | (4.91) | ||||
| Total from Investment Operations | (.70) | .86 | 2.04 | (4.96) | ||||
| Distributions: | ||||||||
| Dividends from investment income—net | (.05) | (.02) | (.20) | — | ||||
| Dividends from net realized | ||||||||
| gain on investments | — | (.12) | — | — | ||||
| Total Distributions | (.05) | (.14) | (.20) | — | ||||
| Net asset value, end of period | 9.35 | 10.10 | 9.38 | 7.54 | ||||
| Total Return (%)c | (7.01) | 9.21 | 27.73 | (39.68)d | ||||
| Ratios/Supplemental Data (%): | ||||||||
| Ratio of total expenses | ||||||||
| to average net assetse | 1.48 | 1.63 | 3.33 | 15.79f | ||||
| Ratio of net expenses | ||||||||
| to average net assetse | .70 | 1.07 | 1.12 | 1.06f | ||||
| Ratio of net investment income | ||||||||
| (loss) to average net assetse | .13 | .85 | 1.76 | (.51)f | ||||
| Portfolio Turnover Rate | 16.15 | 20.78 | 36.68 | 25.65d | ||||
| Net Assets, end of period ($ x 1,000) | 109 | 69 | 84 | 39 | ||||
| a | From December 18, 2007 (commencement of operations) to October 31, 2008. |
| b | Based on average shares outstanding at each month end. |
| c | Exclusive of sales charge. |
| d | Not annualized. |
| e | Amounts do not include the activity of the underlying funds. |
| f | Annualized. |
See notes to financial statements.
| The Fund | 15 |
FINANCIAL HIGHLIGHTS (continued)
| Year Ended October 31, | ||||||||
| Class I Shares | 2011 | 2010 | 2009 | 2008a | ||||
| Per Share Data ($): | ||||||||
| Net asset value, beginning of period | 10.18 | 9.47 | 7.61 | 12.50 | ||||
| Investment Operations: | ||||||||
| Investment income—netb | .11 | .11 | .01 | .05 | ||||
| Net realized and unrealized | ||||||||
| gain (loss) on investments | (.74) | .86 | 2.12 | (4.94) | ||||
| Total from Investment Operations | (.63) | .97 | 2.13 | (4.89) | ||||
| Distributions: | ||||||||
| Dividends from investment income—net | (.16) | (.14) | (.27) | — | ||||
| Dividends from net realized | ||||||||
| gain on investments | — | (.12) | — | — | ||||
| Total Distributions | (.16) | (.26) | (.27) | — | ||||
| Net asset value, end of period | 9.39 | 10.18 | 9.47 | 7.61 | ||||
| Total Return (%) | (6.33) | 10.34 | 28.89 | (39.12)c | ||||
| Ratios/Supplemental Data (%): | ||||||||
| Ratio of total expenses | ||||||||
| to average net assetsd | .05 | .05 | .24 | 14.86e | ||||
| Ratio of net expenses | ||||||||
| to average net assetsd | .04 | .04 | .08 | .06e | ||||
| Ratio of net investment income | ||||||||
| to average net assetsd | 1.07 | 1.10 | .16 | .54e | ||||
| Portfolio Turnover Rate | 16.15 | 20.78 | 36.68 | 25.65c | ||||
| Net Assets, end of period ($ x 1,000) | 475,017 | 352,131 | 163,611 | 30 | ||||
| a | From December 18, 2007 (commencement of operations) to October 31, 2008. |
| b | Based on average shares outstanding at each month end. |
| c | Not annualized. |
| d | Amounts do not include the activity of the underlying funds. |
| e | Annualized. |
See notes to financial statements.
16
NOTES TO FINANCIAL STATEMENTS
NOTE 1—Significant Accounting Policies:
Dreyfus Diversified International Fund (the “fund”) is a separate diversified series of Dreyfus Premier Investment Funds, Inc. (the “Company”), which is registered under the Investment Company Act of 1940, as amended (the “Act”), as an open-end management investment company and operates as a series company currently offering nine series, including the fund. The fund’s investment objective is to seek long-term capital appreciation.The Dreyfus Corporation (the “Manager” or “Dreyfus”), a wholly-owned subsidiary ofThe Bank of NewYork Mellon Corporation (“BNY Mellon”), serves as the fund’s investment adviser.
MBSC Securities Corporation (the “Distributor”), a wholly-owned subsidiary of the Manager, is the distributor of the fund’s shares.The fund is authorized to issue 400 million shares of $.001 par value Common Stock.The fund currently offers three classes of shares: Class A (200 million shares authorized), Class C (100 million shares authorized) and Class I (100 million shares authorized). Class A shares are subject to a sales charge imposed at the time of purchase. Class C shares are subject to a contingent deferred sales charge (“CDSC”) imposed on Class C shares redeemed within one year of purchase. Class I shares are sold at net asset value per share only to institutional investors. Other differences between the classes include the services offered to and the expenses borne by each class, the allocation of certain transfer agency costs and certain voting rights. Income, expenses (other than expenses attributable to a specific class), and realized and unrealized gains or losses on investments are allocated to each class of shares based on its relative net assets.
The Company accounts separately for the assets, liabilities and operations of each series. Expenses directly attributable to each series are charged to that series’ operations; expenses which are applicable to all series are allocated among them on a pro rata basis.
The Financial Accounting Standards Board (“FASB”) Accounting Standards Codification (“ASC”) is the exclusive reference of authorita-
| The Fund | 17 |
NOTES TO FINANCIAL STATEMENTS (continued)
tive U.S. generally accepted accounting principles (“GAAP”) recognized by the FASB to be applied by nongovernmental entities. Rules and interpretive releases of the Securities and Exchange Commission (“SEC”) under authority of federal laws are also sources of authoritative GAAP for SEC registrants. The fund’s financial statements are prepared in accordance with GAAP, which may require the use of management estimates and assumptions.Actual results could differ from those estimates.
The Company enters into contracts that contain a variety of indemnifications.The fund’s maximum exposure under these arrangements is unknown.The fund does not anticipate recognizing any loss related to these arrangements.
(a) Portfolio valuation: The fair value of a financial instrument is the amount that would be received to sell an asset or paid to transfer a liability in an orderly transaction between market participants at the measurement date (i.e. the exit price). GAAP establishes a fair value hierarchy that prioritizes the inputs of valuation techniques used to measure fair value.This hierarchy gives the highest priority to unadjusted quoted prices in active markets for identical assets or liabilities (Level 1 measurements) and the lowest priority to unobservable inputs (Level 3 measurements).
Additionally, GAAP provides guidance on determining whether the volume and activity in a market has decreased significantly and whether such a decrease in activity results in transactions that are not orderly. GAAP requires enhanced disclosures around valuation inputs and techniques used during annual and interim periods.
Various inputs are used in determining the value of the fund’s investments relating to fair value measurements.These inputs are summarized in the three broad levels listed below:
Level 1—unadjusted quoted prices in active markets for identical investments.
Level 2—other significant observable inputs (including quoted prices for similar investments, interest rates, prepayment speeds, credit risk, etc.).
Level 3—significant unobservable inputs (including the fund’s own assumptions in determining the fair value of investments).
18
The inputs or methodology used for valuing securities are not necessarily an indication of the risk associated with investing in those securities.
Investments are valued at the net asset value of each underlying fund determined as of the close of the NewYork Stock Exchange (generally 4 p.m., Eastern time) on the valuation date and are generally categorized within Level 1 of the fair value hierarchy.
The following is a summary of the inputs used as of October 31, 2011 in valuing the fund’s investments:
| Level 2—Other | Level 3— | |||
| Level 1— | Significant | Significant | ||
| Unadjusted | Observable | Unobservable | ||
| Quoted Prices | Inputs | Inputs | Total | |
| Assets ($) | ||||
| Investments in Securities: | ||||
| Mutual Funds | 485,892,137 | — | — | 485,892,137 |
In May 2011, FASB issued Accounting Standards Update (“ASU”) No. 2011-04 “Amendments to Achieve Common Fair Value Measurement and Disclosure Requirements in GAAP and International Financial Reporting Standards (“IFRS”)” (“ASU 2011-04”). ASU 2011-04 includes common requirements for measurement of and disclosure about fair value between GAAP and IFRS.ASU 2011-04 will require reporting entities to disclose the following information for fair value measurements categorized within Level 3 of the fair value hierarchy: quantitative information about the unobservable inputs used in the fair value measurement, the valuation processes used by the reporting entity and a narrative description of the sensitivity of the fair value measurement to changes in unobservable inputs and the interrelationships between those unobservable inputs. In addition, ASU 2011-04 will require reporting entities to make disclosures about amounts and reasons for all transfers in and out of Level 1 and Level 2 fair value measurements. The new and revised disclosures are effective for interim and annual reporting periods beginning after December 15, 2011.At this time, management is evaluating the implications of ASU 2011-04 and its impact on the financial statements.
| The Fund | 19 |
NOTES TO FINANCIAL STATEMENTS (continued)
(b) Securities transactions and investment income: Securities transactions are recorded on a trade date basis. Realized gains and losses from securities transactions are recorded on the identified cost basis. Dividend income is recognized on the ex-dividend date and interest income, including, where applicable, accretion of discount and amortization of premium on investments, is recognized on the accrual basis.
(c) Affiliated issuers: Investments in other investment companies advised by Dreyfus are defined as “affiliated” in the Act.
The fund may invest in shares of certain affiliated investment companies also advised or managed by Dreyfus. Investments in affiliated investment companies for the period ended October 31, 2011 were as follows:
| Affiliated | ||||||||
| Investment | Value | Net Realized | ||||||
| Company | 10/31/2010 | ($) | Purchases ($)† | Sales ($) | Gain/(Loss) ($) | |||
| Dreyfus Emerging | ||||||||
| Asia Fund, Cl. I | 9,514,187 | 4,738,103 | 515,571 | (175,975 | ) | |||
| Dreyfus Emerging | ||||||||
| Markets Fund, Cl. I | 28,886,826 | 16,312,055 | 1,752,942 | (304,019 | ) | |||
| Dreyfus International | ||||||||
| Equity Fund, Cl. I | 81,590,207 | 55,244,599 | 4,824,045 | (704,561 | ) | |||
| Dreyfus International | ||||||||
| Value Fund, Cl. I | 84,625,520 | 45,635,042 | 47,784,166 | (1,498,712 | ) | |||
| Dreyfus/Newton | ||||||||
| International | ||||||||
| Equity Fund, Cl. I | 70,565,026 | 50,608,202 | 15,400,305 | (308,433 | ) | |||
| International | ||||||||
| Stock Fund, Cl. I | 84,312,923 | 78,595,034 | 5,608,832 | (604,573 | ) | |||
| Total | 359,494,689 | 251,133,035 | 75,885,861 | (3,596,273 | ) | |||
| † Includes reinvested dividends/distributions. | ||||||||
| Change in Net | ||||||||
| Affiliated | Unrealized | |||||||
| Investment | Appreciation | Value | Net | Dividends/ | ||||
| Company | (Depreciation) ($) | 10/31/2011 | ($) | Assets (%) Distributions ($) | ||||
| Dreyfus Emerging | ||||||||
| Asia Fund, Cl. I | (4,289,236 | ) | 9,271,508 | 1.9 | — | |||
| Dreyfus Emerging | ||||||||
| Markets Fund, Cl. I | (5,807,150 | ) | 37,334,770 | 7.7 | 202,503 | |||
| Dreyfus International | ||||||||
| Equity Fund, Cl. I | (9,444,792 | ) | 121,861,408 | 25.1 | 2,029,590 | |||
20
| Change in Net | ||||||
| Affiliated | Unrealized | |||||
| Investment | Appreciation | Value | Net | Dividends/ | ||
| Company | (Depreciation) ($) | 10/31/2011($) | Assets (%) Distributions ($) | |||
| Dreyfus International | ||||||
| Value Fund, Cl. I | (8,546,697) | 72,430,987 | 14.9 | 1,388,191 | ||
| Dreyfus/Newton | ||||||
| International Equity | ||||||
| Fund, Cl. I | (9,229,906) | 96,234,584 | 19.8 | 1,998,234 | ||
| International | ||||||
| Stock Fund, Cl. I | (7,935,672) | 148,758,880 | 30.7 | 727,066 | ||
| Total | (45,253,453) | 485,892,137 | 100.1 | 6,345,584 | ||
(d) Dividends to shareholders: Dividends are recorded on the ex-dividend date. Dividends from investment income-net and dividends from net realized capital gains, if any, are normally declared and paid annually, but the fund may make distributions on a more frequent basis to comply with the distribution requirements of the Internal Revenue Code of 1986, as amended (the “Code”).To the extent that net realized capital gains can be offset by capital loss carryovers, it is the policy of the fund not to distribute such gains. Income and capital gain distributions are determined in accordance with income tax regulations, which may differ from GAAP.
(e) Federal income taxes: It is the policy of the fund to continue to qualify as a regulated investment company, if such qualification is in the best interests of its shareholders, by complying with the applicable provisions of the Code, and to make distributions of taxable income sufficient to relieve it from substantially all federal income and excise taxes.
As of and during the period ended October 31, 2011, the fund did not have any liabilities for any uncertain tax positions.The fund recognizes interest and penalties, if any, related to uncertain tax positions as income tax expense in the Statement of Operations. During the period, the fund did not incur any interest or penalties.
Each of the tax years in the four-year period ended October 31, 2011 remains subject to examination by the Internal Revenue Service and state taxing authorities.
| The Fund | 21 |
NOTES TO FINANCIAL STATEMENTS (continued)
At October 31, 2011, the components of accumulated earnings on a tax basis were as follows: accumulated capital losses $1,359,589 and unrealized appreciation $406,609.
The accumulated capital loss carryover is available for federal income tax purposes to be applied against future net securities profits, if any, realized subsequent to October 31, 2011. If not applied, $415,833 of the carryover expires in fiscal 2018 and $943,756 expires in fiscal 2019.
Under the recently enacted Regulated Investment Company Modernization Act of 2010 (the “2010 Act”), the fund will be permitted to carry forward capital losses incurred in taxable years beginning after December 22, 2010 (“post-enactment losses”) for an unlimited period. However, the 2010 Act requires post-enactment losses to be utilized before the utilization of losses incurred in taxable years prior to the effective date of the 2010 Act. As a result of this ordering rule, capital loss carryovers related to taxable years beginning prior to the effective date of the 2010 Act may be more likely to expire unused.
The tax character of distributions paid to shareholders during the fiscal periods ended October 31, 2011 and October 31, 2010 were as follows: ordinary income $6,025,868 and $5,609,910, respectively.
During the period ended October 31, 2011, as a result of permanent book to tax differences, primarily due to the tax treatment for short-term capital gain distributions from regulated investment company holdings, the fund increased accumulated undistributed investment income-net by $988,811, decreased accumulated net realized gain (loss) on investments by $922,003 and decreased paid-in capital by $66,808. Net assets and net asset value per share were not affected by this reclassification.
NOTE 2—Bank Lines of Credit:
The fund participates with other Dreyfus-managed funds in a $225 million unsecured credit facility led by Citibank, N.A. and a $300 million unsecured credit facility provided by The Bank of New York Mellon, a subsidiary of BNY Mellon and an affiliate of Dreyfus (each, a “Facility”), each to be utilized primarily for temporary or emergency
22
purposes, including the financing of redemptions. In connection therewith, the fund has agreed to pay its pro rata portion of commitment fees for each Facility. Interest is charged to the fund based on rates determined pursuant to the terms of the respective Facility at the time of borrowing.
The average amount of borrowings outstanding under the Facilities during the period ended October 31, 2011, was $6,575 with a related weighted average annualized interest rate of 1.41%.
NOTE 3—Management Fee and Other Transactions with Affiliates:
(a) Pursuant to a management agreement with the Manager, there is no management fee paid to the Manager. The fund invests in other mutual funds advised by the Manager. All fees and expenses of the underlying funds are reflected in the underlying funds’ net asset value.
The Manager has contractually agreed, until March 1, 2013, to assume the expenses of the fund so that the total annual fund’s and underlying funds’ operating expenses of none of the classes (excluding Rule 12b-1 fees, shareholder services fees, taxes, interest expense, brokerage commissions, commitment fees on borrowings, underlying fund expenses and extraordinary expenses) exceed 1.20% of the value of the fund’s average daily net assets.The reduction in expenses, pursuant to the undertaking, amounted to $43,841 during the period ended October 31, 2011.
During the period ended October 31, 2011, the Distributor retained $365 from commissions earned on sales of the fund’s Class A shares.
(b) Under the Distribution Plan (the “Plan”) adopted pursuant to Rule 12b-1 under the Act, Class C shares pay the Distributor for distributing its shares at an annual rate of .75% of the value of the average daily net assets of Class C shares. During the period ended October 31, 2011, Class C shares were charged $792 pursuant to the Plan.
(c) Under the Shareholder Services Plan, Class A and Class C shares pay the Distributor at an annual rate of .25% of the value of their aver-
| The Fund | 23 |
NOTES TO FINANCIAL STATEMENTS (continued)
age daily net assets for the provision of certain services. The services provided may include personal services relating to shareholder accounts, such as answering shareholder inquiries regarding the fund and providing reports and other information, and services related to the maintenance of shareholder accounts. The Distributor may make payments to Service Agents (a securities dealer, financial institution or other industry professional) in respect of these services. The Distributor determines the amounts to be paid to Service Agents. During the period ended October 31, 2011, Class A and Class C shares were charged $24,046 and $263, respectively, pursuant to the Shareholder Services Plan.
The fund compensates DreyfusTransfer, Inc., a wholly-owned subsidiary of the Manager, under a transfer agency agreement for providing personnel and facilities to perform transfer agency services for the fund. During the period ended October 31, 2011, the fund was charged $4,040 pursuant to the transfer agency agreement, which is included in Shareholder servicing costs in the Statement of Operations.
The fund has arrangements with the custodian and cash management bank whereby the fund may receive earnings credits when positive cash balances are maintained, which are used to offset custody and cash management fees. For financial reporting purposes, the fund includes net earnings credits as an expense offset in the Statement of Operations.
The fund compensates The Bank of New York Mellon under cash management agreements for performing cash management services related to fund subscriptions and redemptions. During the period ended October 31, 2011, the fund was charged $347 pursuant to the cash management agreements, which is included in Shareholder servicing costs in the Statement of Operations.These fees were partially offset by earnings credits of $14.
The fund also compensates The Bank of New York Mellon under a custody agreement for providing custodial services for the fund. During the period ended October 31, 2011, the fund was charged $4,050 pursuant to the custody agreement.
24
During the period ended October 31, 2011, the fund was charged $6,751 for services performed by the Chief Compliance Officer.
The components of “Due from The Dreyfus Corporation and affiliates” in the Statement of Assets and Liabilities consist of: Rule 12b-1 distribution plan fees $70, shareholder services plan fees $2,153, custodian fees $1,292, chief compliance officer fees $4,246 and transfer agency per account fees $810, which are offset against an expense reimbursement currently in effect in the amount of $9,515.
(d) Each Board member also serves as a Board member of other funds within the Dreyfus complex. Annual retainer fees and attendance fees are allocated to each fund based on net assets.
(e) A 2% redemption fee is charged and retained by the fund on certain shares redeemed within sixty days following the date of issuance, subject to exceptions, including redemptions made through the use of the fund’s exchange privilege. During the period ended October 31, 2011, there were no redemption fees charged and retained by the fund.
NOTE 4—Securities Transactions:
The aggregate amount of purchases and sales of investment securities, excluding short-term securities, during the period ended October 31, 2011, amounted to $251,133,035 and $75,885,861, respectively.
At October 31, 2011, the cost of investments for federal income tax purposes was $485,485,528; accordingly, accumulated net unrealized appreciation on investments was $406,609, consisting of $11,032,654 gross unrealized appreciation and $10,626,045 gross unrealized depreciation.
| The Fund | 25 |
| REPORT OF INDEPENDENT REGISTERED |
| PUBLIC ACCOUNTING FIRM |
Shareholders and Board of Directors Dreyfus Diversified International Fund
We have audited the accompanying statement of assets and liabilities, including the statement of investments, of Dreyfus Diversified International Fund (one of the series comprising Dreyfus Premier Investment Funds, Inc.) as of October 31, 2011, and the related statement of operations for the year then ended, the statement of changes in net assets for each of the two years in the period then ended and financial highlights for each of the periods indicated therein. These financial statements and financial highlights are the responsibility of the Fund’s management. Our responsibility is to express an opinion on these financial statements and financial highlights based on our audits.
We conducted our audits in accordance with the standards of the Public Company Accounting Oversight Board (United States).Those standards require that we plan and perform the audit to obtain reasonable assurance about whether the financial statements and financial highlights are free of material misstatement.We were not engaged to perform an audit of the Fund’s internal control over financial reporting. Our audits included consideration of internal control over financial reporting as a basis for designing audit procedures that are appropriate in the circumstances, but not for the purpose of expressing an opinion on the effectiveness of the Fund’s internal control over financial reporting. Accordingly, we express no such opinion.An audit also includes examining, on a test basis, evidence supporting the amounts and disclosures in the financial statements and financial highlights, assessing the accounting principles used and significant estimates made by management, and evaluating the overall financial statement presentation. Our procedures included confirmation of securities owned as of October 31, 2011 by correspondence with the custodian and others.We believe that our audits provide a reasonable basis for our opinion.
In our opinion, the financial statements and financial highlights referred to above present fairly, in all material respects, the financial position of Dreyfus Diversified International Fund at October 31, 2011, the results of its operations for the year then ended, the changes in its net assets for each of the two years in the period then ended and the financial highlights for each of the indicated periods, in conformity with U. S. generally accepted accounting principles.

New York, New York
December 29, 2011
26
IMPORTANT TAX INFORMATION (Unaudited)
In accordance with federal tax law, the fund hereby designates 87.64% of the ordinary dividends paid during the fiscal year ended October 31, 2011 as qualifying for the corporate dividends received deduction. For the fiscal year ended October 31, 2011, certain dividends paid by the fund may be subject to a maximum tax rate of 15%, as provided for by the Jobs and Growth Tax Relief Reconciliation Act of 2003. Of the distributions paid during the fiscal year, $5,193,980 represents the maximum amount that may be considered qualified dividend income. Shareholders will receive notification in early 2012 of the percentage applicable to the preparation of their 2011 income tax returns.
| The Fund | 27 |
PROXY RESULTS (Unaudited)
The Company held a special meeting of shareholders on May 31, 2011. The proposal considered at the meeting, and the results, are as follows:
| Shares | |||
| Votes For | Authority Withheld | ||
| To elect Board Members: | |||
| Joseph S. DiMartino† | 119,515,411 | 644,860 | |
| Phillip L. Toia† | 119,502,800 | 657,471 | |
| Robin A. Melvin† | 119,566,042 | 594,229 |
† Each new Board member’s term commenced on May 31, 2011.
In addition Gordon J. Davis, Esq., David P. Feldman and Lynn Martin continue as Board members of the Company.
28
| INFORMATION ABOUT THE RENEWAL OF THE |
| FUND’S MANAGEMENT AGREEMENT (Unaudited) |
At a meeting of the fund’s Board of Directors held on July 12, 2011, the Board considered the renewal of the fund’s Management Agreement pursuant to which Dreyfus provides the fund with investment advisory and administrative services (the “Agreement”). The Board members, none of whom are “interested persons” (as defined in the Investment Company Act of 1940, as amended) of the fund, were assisted in their review by independent legal counsel and met with counsel in executive session separate from Dreyfus representatives. In considering the renewal of the Agreement, the Board considered all factors that it believed to be relevant, including those discussed below.The Board did not identify any one factor as dispositive, and each Board member may have attributed different weights to the factors considered.
Analysis of Nature, Extent, and Quality of Services Provided to the Fund.The Board considered information previously provided to them in presentations from Dreyfus representatives regarding the nature, extent, and quality of the services provided to funds in the Dreyfus fund complex, and Dreyfus representatives confirmed that there had been no material changes in this information. Dreyfus provided the number of open accounts in the fund, the fund’s asset size and the allocation of fund assets among distribution channels. Dreyfus also had previously provided information regarding the diverse intermediary relationships and distribution channels of funds in the Dreyfus fund complex and Dreyfus’ corresponding need for broad, deep, and diverse resources to be able to provide ongoing shareholder services to each distribution channel, including the distribution channel(s) for the fund.
The Board also considered research support available to, and portfolio management capabilities of, the fund’s portfolio management personnel and that Dreyfus also provides oversight of day-to-day fund operations, including fund accounting and administration and assistance in meeting legal and regulatory requirements.The Board also considered Dreyfus’ extensive administrative, accounting, and compliance infrastructures. The Board also considered portfolio management’s brokerage policies and practices (including policies and practices regarding soft dollars) and the standards applied in seeking best execution.
| The Fund | 29 |
| INFORMATION ABOUT THE RENEWAL OF THE FUND’S |
| MANAGEMENT AGREEMENT (Unaudited) (continued) |
Comparative Analysis of the Fund’s Performance and Management Fee and Expense Ratio. The Board reviewed reports prepared by Lipper, Inc. (“Lipper”), an independent provider of investment company data, which included information comparing (1) the fund’s performance with the performance of a group of comparable funds (the “Performance Group”) and with a broader group of funds (the “Performance Universe”), all for various periods ended May 31, 2011, and (2) the fund’s actual and contractual management fees and total expenses with those of a group of comparable funds (the “Expense Group”) and with a broader group of funds (the “Expense Universe”), the information for which was derived in part from fund financial statements available to Lipper as of May 31, 2011. Dreyfus previously had furnished the Board with a description of the methodology Lipper used to select the Performance Group and Performance Universe and the Expense Group and Expense Universe.
Dreyfus representatives stated that the usefulness of performance comparisons may be affected by a number of factors, including different investment limitations that may be applicable to the fund and comparison funds.They also noted that performance generally should be considered over longer periods of time, although it is possible that long-term performance can be adversely affected by even one period of significant underperformance so that a single investment decision or theme has the ability to affect disproportionately long-term performance. The Board discussed the results of the comparisons and noted that the fund’s total return performance was below the Performance Group and Performance Universe medians for the one- and two-year periods and at and slightly below the Performance Group and Performance Universe medians, respectively, for the three-year period. Dreyfus also provided a comparison of the fund’s calendar year total returns to the returns of the fund’s benchmark index, and it was noted that the fund outperformed the benchmark in each of the past three calendar years.
The Board also reviewed the range of actual and contractual management fees and total expenses of the Expense Group and Expense
30
Universe funds and discussed the results of the comparisons.The Board noted that, like other funds in the Expense Group, the fund’s management fees are paid only at the underlying funds’ level. They further noted that the fund’s total expense ratio was below the Expense Group and Expense Universe medians.
Dreyfus representatives noted that Dreyfus has contractually agreed until March 1, 2013, to assume the expenses of the fund so that the total annual fund’s and underlying funds’ operating expenses of none of the classes (excluding Rule 12b-1 fees, shareholder services fees, taxes, interest expense, brokerage commissions, commitment fees on borrowings, underlying fund expenses and extraordinary expenses) exceed 1.20% of the fund’s average daily net assets.
Dreyfus representatives reviewed with the Board the management or investment advisory fees (1) paid by funds advised or administered by Dreyfus that are in the same Lipper category as the fund and (2) paid to Dreyfus or the Dreyfus-affiliated primary employer of the fund’s primary portfolio manager for advising any separate accounts and/or other types of client portfolios that are considered to have similar investment strategies and policies as the fund (the “Similar Clients”), and explained the nature of the Similar Clients.They discussed differences in fees paid and the relationship of the fees paid in light of any differences in the services provided and other relevant factors. The Board considered the relevance of the fee information provided for the Similar Clients to evaluate the appropriateness and reasonableness of the fund’s management fee.
Analysis of Profitability and Economies of Scale. Dreyfus does not have direct profits from the fund’s management fee, since the fund pays no direct management fee. Similarly, economies of scale were not relevant. The Board considered potential benefits to Dreyfus from acting as investment adviser and noted that there were no soft dollar arrangements in effect for trading the fund’s investments.
| The Fund | 31 |
| INFORMATION ABOUT THE RENEWAL OF THE FUND’S |
| MANAGEMENT AGREEMENT (Unaudited) (continued) |
At the conclusion of these discussions, the Board agreed that it had been furnished with sufficient information to make an informed business decision with respect to the renewal of the Agreement. Based on the discussions and considerations as described above, the Board concluded and determined as follows.
The Board concluded that the nature, extent and quality of the services provided by Dreyfus are adequate and appropriate.
The Board generally was satisfied with the fund’s performance.
Since the fund does not pay a direct management fee, profitability and economies of scale are not relevant.
The Board considered these conclusions and determinations, along with information received on a routine and regular basis throughout the year. In addition, it should be noted that the Board’s consideration of the contractual fee arrangements for this fund had the benefit of a number of years of reviews of prior or similar agreements during which lengthy discussions took place between the Board and Dreyfus representatives. Certain aspects of the arrangements may receive greater scrutiny in some years than in others, and the Board’s conclusions may be based, in part, on their consideration of the same or similar arrangements in prior years. The Board determined that renewal of the Agreement was in the best interests of the fund and its shareholders.
32
BOARD MEMBERS INFORMATION (Unaudited)
| Joseph S. DiMartino (68) |
| Chairman of the Board (1995) |
| Principal Occupation During Past 5Years: |
| • Corporate Director and Trustee |
| Other Public Company Board Memberships During Past 5Years: |
| • CBIZ (formerly, Century Business Services, Inc.), a provider of outsourcing functions for small |
| and medium size companies, Director (1997-present) |
| • Sunair Services Corporation, a provider of certain outdoor-related services to homes and |
| businesses, Director (2005-2009) |
| • The Newark Group, a provider of a national market of paper recovery facilities, paperboard |
| mills and paperboard converting plants, Director (2000-2010) |
| No. of Portfolios for which Board Member Serves: 167 |
| ——————— |
| Gordon J. Davis (70) |
| Board Member (1993) |
| Principal Occupation During Past 5Years: |
| • Partner in the law firm of Dewey & LeBoeuf LLP |
| Other Public Company Board Memberships During Past 5Years: |
| • Consolidated Edison, Inc., a utility company, Director (1997-present) |
| • The Phoenix Companies Inc., a life insurance company, Director (2000-present) |
| No. of Portfolios for which Board Member Serves: 44 |
| ——————— |
| David P. Feldman (71) |
| Board Member (1991) |
| Principal Occupation During Past 5Years: |
| • Corporate Director and Trustee |
| Other Public Company Board Memberships During Past 5Years: |
| • BBH Mutual Funds Group (4 registered mutual funds), Director (1992-present) |
| • QMed Inc., a healthcare company, Director (1999-2007) |
| No. of Portfolios for which Board Member Serves: 50 |
| The Fund | 33 |
BOARD MEMBERS INFORMATION (Unaudited) (continued)
| Lynn Martin (71) |
| Board Member (1993) |
| Principal Occupation During Past 5Years: |
| • President of The Martin Hall Group LLC, a human resources consulting firm, from January |
| 2005-present |
| • Advisor to the international accounting firm of Deloitte &Touche, LLP and Chair to its Council |
| for the Advancement of Women from March 1993-September 2005 |
| Other Public Company Board Memberships During Past 5Years: |
| • AT&T Inc., a telecommunications company, Director (1999-present) |
| • Ryder System, Inc., a supply chain and transportation management company, Director (1993-present) |
| • The Proctor & Gamble Co., a consumer products company, Director (1994-present) |
| • Constellation Energy Group Inc., Director (2003-present) |
| No. of Portfolios for which Board Member Serves: 15 |
| ——————— |
| Robin A. Melvin (48) |
| Board Member (2011) |
| Principal Occupation During Past 5Years: |
| • Director, Boisi Family Foundation, a private family foundation that supports youth-serving |
| organizations that promote the self sufficiency of youth from disadvantaged circumstances |
| (1995-present) |
| • SeniorVice President, Mentor, a national non-profit youth mentoring organization (1992-2005) |
| No. of Portfolios for which Board Member Serves: 54 |
| ——————— |
| Philip L. Toia (78) |
| Board Member (1997) |
| Principal Occupation During Past 5Years: |
| • Private Investor |
| No. of Portfolios for which Board Member Serves: 25 |
| ——————— |
Once elected all Board Members serve for an indefinite term, but achieve Emeritus status upon reaching age 80.The address of the Board Members and Officers is in c/o The Dreyfus Corporation, 200 Park Avenue, NewYork, NewYork 10166.Additional information about the Board Members is available in the fund’s Statement of Additional Information which can be obtained from Dreyfus free of charge by calling this toll free number: 1-800-DREYFUS.
Daniel Rose, Emeritus Board Member
Sander Vanocur, Emeritus Board Member
34
OFFICERS OF THE FUND (Unaudited)
BRADLEY J. SKAPYAK, President since January 2010.
Chief Operating Officer and a director of the Manager since June 2009. From April 2003 to June 2009, Mr. Skapyak was the head of the Investment Accounting and Support Department of the Manager. He is an officer of 75 investment companies (comprised of 167 portfolios) managed by the Manager. He is 52 years old and has been an employee of the Manager since February 1988.
MICHAEL A. ROSENBERG, Vice President and Secretary since August 2005.
Assistant General Counsel of BNY Mellon, and an officer of 76 investment companies (comprised of 192 portfolios) managed by the Manager. He is 51 years old and has been an employee of the Manager since October 1991.
KIESHA ASTWOOD, Vice President and Assistant Secretary since January 2010.
Counsel of BNY Mellon, and an officer of 76 investment companies (comprised of 192 portfolios) managed by the Manager. She is 38 years old and has been an employee of the Manager since July 1995.
JAMES BITETTO, Vice President and Assistant Secretary since August 2005.
Senior Counsel of BNY Mellon and Secretary of the Manager, and an officer of 76 investment companies (comprised of 192 portfolios) managed by the Manager. He is 45 years old and has been an employee of the Manager since December 1996.
JONI LACKS CHARATAN, Vice President and Assistant Secretary since August 2005.
Senior Counsel of BNY Mellon, and an officer of 76 investment companies (comprised of 192 portfolios) managed by the Manager. She is 55 years old and has been an employee of the Manager since October 1988.
JOSEPH M. CHIOFFI, Vice President and Assistant Secretary since August 2005.
Senior Counsel of BNY Mellon, and an officer of 76 investment companies (comprised of 192 portfolios) managed by the Manager. He is 49 years old and has been an employee of the Manager since June 2000.
KATHLEEN DENICHOLAS, Vice President and Assistant Secretary since January 2010.
Managing Counsel of BNY Mellon, and an officer of 76 investment companies (comprised of 192 portfolios) managed by the Manager. She is 37 years old and has been an employee of the Manager since February 2001.
JANETTE E. FARRAGHER, Vice President and Assistant Secretary since August 2005.
Assistant General Counsel of BNY Mellon, and an officer of 76 investment companies (comprised of 192 portfolios) managed by the Manager. She is 48 years old and has been an employee of the Manager since February 1984.
JOHN B. HAMMALIAN, Vice President and Assistant Secretary since August 2005.
Senior Managing Counsel of BNY Mellon, and an officer of 76 investment companies (comprised of 192 portfolios) managed by the Manager. He is 48 years old and has been an employee of the Manager since February 1991.
M. CRISTINA MEISER, Vice President and Assistant Secretary since January 2010.
Senior Counsel of BNY Mellon, and an officer of 76 investment companies (comprised of 192 portfolios) managed by the Manager. She is 41 years old and has been an employee of the Manager since August 2001.
| The Fund | 35 |
OFFICERS OF THE FUND (Unaudited) (continued)
ROBERT R. MULLERY, Vice President and Assistant Secretary since August 2005.
Managing Counsel of BNY Mellon, and an officer of 76 investment companies (comprised of 192 portfolios) managed by the Manager. He is 59 years old and has been an employee of the Manager since May 1986.
JEFF PRUSNOFSKY, Vice President and Assistant Secretary since August 2005.
Senior Managing Counsel of BNY Mellon, and an officer of 76 investment companies (comprised of 192 portfolios) managed by the Manager. He is 46 years old and has been an employee of the Manager since October 1990.
JAMES WINDELS, Treasurer since November 2001.
Director – Mutual Fund Accounting of the Manager, and an officer of 76 investment companies (comprised of 192 portfolios) managed by the Manager. He is 53 years old and has been an employee of the Manager since April 1985.
RICHARD CASSARO, Assistant Treasurer since January 2008.
Senior Accounting Manager – Money Market and Municipal Bond Funds of the Manager, and an officer of 76 investment companies (comprised of 192 portfolios) managed by the Manager. He is 52 years old and has been an employee of the Manager since September 1982.
GAVIN C. REILLY, Assistant Treasurer since December 2005.
Tax Manager of the Investment Accounting and Support Department of the Manager, and an officer of 76 investment companies (comprised of 192 portfolios) managed by the Manager. He is 43 years old and has been an employee of the Manager since April 1991.
ROBERT ROBOL, Assistant Treasurer since December 2002.
Senior Accounting Manager – Fixed Income Funds of the Manager, and an officer of 76 investment companies (comprised of 192 portfolios) managed by the Manager. He is 47 years old and has been an employee of the Manager since October 1988.
ROBERT SALVIOLO, Assistant Treasurer since July 2007.
Senior Accounting Manager – Equity Funds of the Manager, and an officer of 76 investment companies (comprised of 192 portfolios) managed by the Manager. He is 44 years old and has been an employee of the Manager since June 1989.
ROBERT SVAGNA, Assistant Treasurer since December 2002.
Senior Accounting Manager – Equity Funds of the Manager, and an officer of 76 investment companies (comprised of 192 portfolios) managed by the Manager. He is 44 years old and has been an employee of the Manager since November 1990.
36
JOSEPH W. CONNOLLY, Chief Compliance Officer since October 2004.
Chief Compliance Officer of the Manager and The Dreyfus Family of Funds (76 investment companies, comprised of 192 portfolios). From November 2001 through March 2004, Mr. Connolly was first Vice-President, Mutual Fund Servicing for Mellon Global Securities Services. In that capacity, Mr. Connolly was responsible for managing Mellon’s Custody, Fund Accounting and Fund Administration services to third-party mutual fund clients.
He is 54 years old and has served in various capacities with the Manager since 1980, including manager of the firm’s Fund Accounting Department from 1997 through October 2001.
STEPHEN J. STOREN, Anti-Money Laundering Compliance Officer since May 2011.
Chief Compliance Officer of the Distributor, and the Anti-Money Laundering Compliance Officer of 72 investment companies (comprised of 188 portfolios) managed by the Manager. He is 57 years old and has been an employee of the Distributor since October 1999.
| The Fund | 37 |
For More Information
Telephone Call your financial representative or 1-800-DREYFUS
Mail The Dreyfus Family of Funds, 144 Glenn Curtiss Boulevard, Uniondale, NY 11556-0144
The fund files its complete schedule of portfolio holdings with the Securities and Exchange Commission (“SEC”) for the first and third quarters of each fiscal year on Form N-Q. The fund’s Forms N-Q are available on the SEC’s website at http://www.sec.gov and may be reviewed and copied at the SEC’s Public Reference Room in Washington, DC. Information on the operation of the Public Reference Room may be obtained by calling 1-800-SEC-0330.
A description of the policies and procedures that the fund uses to determine how to vote proxies relating to portfolio securities, and information regarding how the fund voted these proxies for the most recent 12-month period ended June 30 is available at http://www.dreyfus.com and on the SEC’s website at http://www.sec.gov. The description of the policies and procedures is also available without charge, upon request, by calling 1-800-DREYFUS.

| Dreyfus |
| Diversified Large Cap Fund |
ANNUAL REPORT October 31, 2011
Save time. Save paper. View your next shareholder report online as soon as it’s available. Log into www.dreyfus.com and sign up for Dreyfus eCommunications. It’s simple and only takes a few minutes.
The views expressed in this report reflect those of the portfolio manager only through the end of the period covered and do not necessarily represent the views of Dreyfus or any other person in the Dreyfus organization. Any such views are subject to change at any time based upon market or other conditions and Dreyfus disclaims any responsibility to update such views.These views may not be relied on as investment advice and, because investment decisions for a Dreyfus fund are based on numerous factors, may not be relied on as an indication of trading intent on behalf of any Dreyfus fund.
| Not FDIC-Insured • Not Bank-Guaranteed • May Lose Value |
Contents | |
THE FUND | |
| 2 | A Letter from the Chairman and CEO |
| 3 | Discussion of Fund Performance |
| 6 | Fund Performance |
| 8 | Understanding Your Fund’s Expenses |
| 8 | Comparing Your Fund’s Expenses With Those of Other Funds |
| 9 | Statement of Investments |
| 10 | Statement of Assets and Liabilities |
| 11 | Statement of Operations |
| 12 | Statement of Changes in Net Assets |
| 14 | Financial Highlights |
| 17 | Notes to Financial Statements |
| 26 | Report of Independent Registered Public Accounting Firm |
| 27 | Important Tax Information |
| 28 | Proxy Results |
| 29 | Information About the Renewal of the Fund’s Management Agreement |
| 33 | Board Members Information |
| 35 | Officers of the Fund |
FOR MORE INFORMATION | |
Back Cover |
Dreyfus
Diversified Large Cap Fund
The Fund

A LETTER FROM THE CHAIRMAN AND CEO
Dear Shareholder:
We present to you this annual report for Dreyfus Diversified Large Cap Fund, covering the 12-month period from November 1, 2010, through October 31, 2011. For information about how the fund performed during the reporting period, as well as general market perspectives, we provide a Discussion of Fund Performance on the pages that follow.
Investors were encouraged by expectations of a more robust economic recovery into the first quarter of 2011, but sentiment subsequently deteriorated due to disappointing economic data, rising commodity prices, an escalating sovereign debt crisis in Europe and a contentious debate regarding taxes, spending and borrowing in the United States. Stocks have been sensitive to these macroeconomic developments, often regardless of underlying company fundamentals. Indeed, market declines were particularly severe during August and September after a major credit rating agency downgraded U.S. long-term debt, while October ranked as one of the best months of the past decade.
The economic outlook currently remains clouded by market turbulence and political infighting, but we believe that a continued subpar global expansion is more likely than a return to recession. Although Europe continues to struggle with a debt crisis, inflationary pressures appear to be waning in most countries as energy prices recently have retreated from their highs. In the United States, moderately low core inflation and an accommodative monetary policy could help support near-trend growth despite ongoing deleveraging activity in the private sector.To assess the potential impact of these and other developments on your investments, we encourage you, as always, to speak with your financial advisor.
Thank you for your continued confidence and support.

Jonathan R. Baum
Chairman and Chief Executive Officer
The Dreyfus Corporation
November 15, 2011
2

DISCUSSION OF FUND PERFORMANCE
For the period of November 1, 2010, through October 31, 2011, as provided by Richard B. Hoey, A. Paul Disdier, Christopher E. Sheldon, CFA, and Keith L. Stransky, CFA, Portfolio Managers
Fund and Market Performance Overview
For the 12-month period ended October 31, 2011, Dreyfus Diversified Large Cap Fund’s Class A shares produced a total return of 6.26%, Class C shares returned 5.44% and Class I shares returned 6.25%.1 In comparison, the total return of the Standard & Poor’s 500 Composite Stock Price Index (“S&P 500 Index”), the fund’s benchmark, was 8.07% for the same period.2
Although U.S. stocks rallied through the first quarter of 2011 as an economic recovery appeared to gain traction, renewed macroeconomic concerns later caused the market to give back many of its previous gains. The fund produced lower returns than its benchmark, primarily due to the constructive investment posture maintained by some underlying mutual funds during the market downturn over the reporting period’s second half.
The Fund’s Investment Approach
The fund seeks long-term capital appreciation.To pursue its goal, the fund normally allocates its assets among other mutual funds advised by The Dreyfus Corporation (Dreyfus), or its affiliates, that invest primarily in stocks issued by large-cap companies.The underlying funds are selected by the Dreyfus Investment Committee based on their investment objectives and management policies, portfolio holdings, risk/reward profiles, historical performance and other factors. The Dreyfus Investment Committee will rebalance the fund’s investments in the underlying funds at least annually, but may do so more often in response to market conditions.As of October 31, 2011, the fund’s assets were allocated as follows:
| Underlying Funds | (%) |
| Dreyfus Strategic Value Fund | 31 |
| Dreyfus Research Growth Fund | 23 |
| Dreyfus U.S. Equity Fund | 18 |
| Dreyfus/The Boston Company Large Cap Core Fund | 16 |
| Dreyfus Appreciation Fund | 12 |
| The Fund | 3 |
DISCUSSION OF FUND PERFORMANCE (continued)
Global Economic Concerns Weighed on Equities
Gains in employment, consumer spending and corporate earnings supported a U.S. stock market rally over the first several months of the reporting period as investors looked forward to better business conditions. However, the market rally was interrupted in February 2011 when political unrest in the Middle East led to sharply rising crude oil prices, and again in March when catastrophic natural and nuclear disasters in Japan disrupted the global industrial supply chain and derailed one of the world’s larger economies. Nonetheless, investors proved resilient, and stocks rebounded quickly from these unexpected shocks.
Investor sentiment began to deteriorate in earnest in May when Greece appeared headed for default on its sovereign debt and pressures mounted on the banking systems of other members of the European Union. In addition, U.S. economic data proved more disappointing than expected, and investors reacted cautiously to a contentious political debate regarding U.S. government spending, borrowing and taxes. Stocks suffered bouts of heightened volatility when newly risk-averse investors shifted their focus from relatively speculative market sectors to industry groups that historically have held up well under uncertain economic conditions. Volatility was particularly severe in August and September, after a major credit-rating agency downgraded its assessment of long-term U.S. government debt. In contrast, the market rebounded strongly in October when some macroeconomic worries seemed to ease.
Constructive Positions Dampened Relative Performance
The fund’s allocation strategy positioned it relatively well for the reporting period’s macroeconomic developments, as an emphasis on large-cap stocks over their mid- and small-cap counterparts seemed likely to cushion the brunt of market volatility when economic sentiment deteriorated. However, the benefits of our allocation strategy were more than offset by the more constructive investment postures maintained by certain underlying mutual funds, including Dreyfus Strategic Value Fund, Dreyfus Research Growth Fund and Dreyfus/The Boston Company Large Cap Core Fund. An emphasis on some of the market’s more economically sensitive industry groups and individual companies undermined these funds’ relative performance during the market downturn over the summer of 2011.
4
We anticipated deteriorating market conditions with allocation shifts early in the reporting period.The portfolio managers reduced the fund’s exposure to Dreyfus Research Growth Fund in January 2011, shifting assets to Dreyfus Appreciation Fund, which placed greater emphasis on large, dividend-paying multinational companies. Although this change bolstered the fund’s relative performance to a degree, it was not enough to fully offset weakness in other underlying funds.
Maintaining a Cautious Approach
As of the reporting period’s end, we have adopted a generally cautious outlook.Although a return to recession seems unlikely at this point in time, U.S. unemployment remains elevated, inflation-fighting efforts in the emerging markets have dampened a major engine of global growth and Europe continues to struggle with its sovereign debt crisis. Therefore, we have attempted to mitigate heightened market volatility through a focus on underlying funds that favor well-established, fundamentally strong companies with dominant brands and a global presence. In our judgment, these are prudent strategies until the direction of the U.S. and global economies becomes clearer.
November 15, 2011
| Equity funds are subject generally to market, market sector, market liquidity, issuer and investment | |
| style risks, among other factors, to varying degrees, all of which are more fully described in the | |
| prospectus of the fund and that of each underlying fund. | |
| The ability of the fund to achieve its investment goal depends, in part, on the ability of the | |
| Dreyfus Investment Committee to allocate effectively the fund’s assets among the underlying | |
| funds.There can be no assurance that the actual allocations will be effective in achieving the fund’s | |
| investment goal. | |
| 1 | Total return includes reinvestment of dividends and any capital gains paid, and does not take into |
| consideration the maximum initial sales charge in the case of Class A shares, or the applicable | |
| contingent deferred sales charge imposed on redemptions in the case of Class C shares. Had these | |
| charges been reflected, returns would have been lower. Past performance is no guarantee of future | |
| results. Share price and investment return fluctuate such that upon redemption, fund shares may be | |
| worth more or less than their original cost. Return figures provided reflect the absorption of certain fund | |
| expenses pursuant to an agreement byThe Dreyfus Corporation in effect until March 1, 2013, at | |
| which time it may be extended, terminated or modified. Had these expenses not been absorbed, the | |
| fund’s returns would have been lower. | |
| 2 | SOURCE: LIPPER INC. — Reflects the monthly reinvestment of dividends and, where |
| applicable, capital gain distributions.The Standard & Poor’s 500 Composite Stock Price Index is | |
| a widely accepted, unmanaged index of U.S. stock market performance. Investors cannot invest | |
| directly in any index. |
| The Fund | 5 |
FUND PERFORMANCE
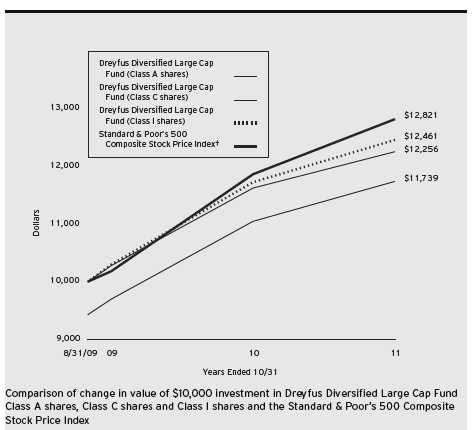
| † Source: Lipper Inc. |
| Past performance is not predictive of future performance. |
| The above graph compares a $10,000 investment made in Class A, Class C and Class I shares of Dreyfus Diversified |
| Large Cap Fund on 8/31/09 (inception date) to a $10,000 investment made in the Standard & Poor’s 500 |
| Composite Stock Price Index (the “Index”) on that date.All dividends and capital gain distributions are reinvested. |
| The fund’s performance shown in the line graph above takes into account the maximum initial sales charge on Class A |
| shares and all other applicable fees and expenses on all classes.The Index is a widely accepted, unmanaged index of U.S. |
| stock market performance. Unlike a mutual fund, the Index is not subject to charges, fees and other expenses. Investors |
| cannot invest directly in any index. Further information relating to fund performance, including expense reimbursements, |
| if applicable, is contained in the Financial Highlights section of the prospectus and elsewhere in this report. |
6
| Average Annual Total Returns as of 10/31/11 | |||||
| Inception | From | ||||
| Date | 1Year | Inception | |||
| Class A shares | |||||
| with maximum sales charge (5.75%) | 8/31/09 | 0.17% | 7.67% | ||
| without sales charge | 8/31/09 | 6.26% | 10.64% | ||
| Class C shares | |||||
| with applicable redemption charge † | 8/31/09 | 4.44% | 9.83% | ||
| without redemption | 8/31/09 | 5.44% | 9.83% | ||
| Class I shares | 8/31/09 | 6.25% | 10.67% | ||
| Standard & Poor’s 500 | |||||
| Composite Stock Price Index | 8/31/09 | 8.07% | 12.15% | ||
Past performance is not predictive of future performance.The fund’s performance shown in the graph and table does not reflect the deduction of taxes that a shareholder would pay on fund distributions or the redemption of fund shares.
| † The maximum contingent deferred sales charge for Class C shares is 1% for shares redeemed within one year of the |
| date of purchase. |
| The Fund | 7 |
UNDERSTANDING YOUR FUND’S EXPENSES (Unaudited)
As a mutual fund investor, you pay ongoing expenses, such as management fees and other expenses. Using the information below, you can estimate how these expenses affect your investment and compare them with the expenses of other funds.You also may pay one-time transaction expenses, including sales charges (loads) and redemption fees, which are not shown in this section and would have resulted in higher total expenses. For more information, see your fund’s prospectus or talk to your financial adviser.
Review your fund’s expenses
The table below shows the expenses you would have paid on a $1,000 investment in Dreyfus Diversified Large Cap Fund from May 1, 2011 to October 31, 2011. It also shows how much a $1,000 investment would be worth at the close of the period, assuming actual returns and expenses.
Expenses and Value of a $1,000 Investment
assuming actual returns for the six months ended October 31, 2011
| Class A | Class C | Class I | ||||
| Expenses paid per $1,000† | $1.77 | $5.31 | $1.72 | |||
| Ending value (after expenses) | $900.30 | $897.00 | $900.30 |
COMPARING YOUR FUND’S EXPENSES
WITH THOSE OF OTHER FUNDS (Unaudited)
Using the SEC’s method to compare expenses
The Securities and Exchange Commission (SEC) has established guidelines to help investors assess fund expenses. Per these guidelines, the table below shows your fund’s expenses based on a $1,000 investment, assuming a hypothetical 5% annualized return. You can use this information to compare the ongoing expenses (but not transaction expenses or total cost) of investing in the fund with those of other funds.All mutual fund shareholder reports will provide this information to help you make this comparison. Please note that you cannot use this information to estimate your actual ending account balance and expenses paid during the period.
Expenses and Value of a $1,000 Investment
assuming a hypothetical 5% annualized return for the six months ended October 31, 2011
| Class A | Class C | Class I | ||||
| Expenses paid per $1,000† | $1.89 | $5.65 | $1.84 | |||
| Ending value (after expenses) | $1,023.34 | $1,019.61 | $1,023.39 |
| † Expenses are equal to the fund’s annualized expense ratio of .37% for Class A, 1.11% for Class C and .36% |
| for Class I, multiplied by the average account value over the period, multiplied by 184/365 (to reflect the one-half |
| year period). |
8
| STATEMENT OF INVESTMENTS |
| October 31, 2011 |
| Registered Investment Companies—100.0% | Shares | Value ($) | |
| Dreyfus Appreciation Fund | 13,611a | 547,167 | |
| Dreyfus Research Growth Fund, Cl. Z | 118,293a | 1,084,744 | |
| Dreyfus Strategic Value Fund, Cl. I | 54,533a | 1,451,676 | |
| Dreyfus U.S. Equity Fund, Cl. I | 59,317a | 834,590 | |
| Dreyfus/The Boston Company Large Cap Core Fund, Cl. I | 23,197a | 767,575 | |
| Total Investments (cost $4,449,061) | 100.0% | 4,685,752 | |
| Cash and Receivables (Net) | .0% | 186 | |
| Net Assets | 100.0% | 4,685,938 | |
| a Investment in affiliated mutual fund. | |||
| Portfolio Summary (Unaudited)† | |||
| Value (%) | |||
| Mutual Funds: Domestic | 100.0 | ||
| † Based on net assets. | |||
| See notes to financial statements. | |||
| The Fund | 9 |
| STATEMENT OF ASSETS AND LIABILITIES |
| October 31, 2011 |
| Cost | Value | |||
| Assets ($): | ||||
| Investments in affiliated issuers—See Statement | ||||
| of Investments—Note 1(c) | 4,449,061 | 4,685,752 | ||
| Cash | 27,918 | |||
| Prepaid expenses | 17,883 | |||
| Due from The Dreyfus Corporation and affiliates—Note 3(c) | 3,517 | |||
| 4,735,070 | ||||
| Liabilities ($): | ||||
| Accrued expenses | 49,132 | |||
| Net Assets ($) | 4,685,938 | |||
| Composition of Net Assets ($): | ||||
| Paid-in capital | 4,480,227 | |||
| Accumulated undistributed investment income—net | 4,940 | |||
| Accumulated net realized gain (loss) on investments | (35,920) | |||
| Accumulated net unrealized appreciation | ||||
| (depreciation) on investments | 236,691 | |||
| Net Assets ($) | 4,685,938 | |||
| Net Asset Value Per Share | ||||
| Class A | Class C | Class I | ||
| Net Assets ($) | 328,999 | 37,340 | 4,319,599 | |
| Shares Outstanding | 21,189 | 2,438.32 | 277,990 | |
| Net Asset Value Per Share ($) | 15.53 | 15.31 | 15.54 | |
| See notes to financial statements. | ||||
10
| STATEMENT OF OPERATIONS |
| Year Ended October 31, 2011 |
| Investment Income ($): | ||
| Income: | ||
| Cash dividends from affiliated issuers | 16,698 | |
| Expenses: | ||
| Registration fees | 48,315 | |
| Auditing fees | 39,235 | |
| Prospectus and shareholders’ reports | 10,199 | |
| Legal fees | 9,521 | |
| Shareholder servicing costs—Note 3(c) | 2,132 | |
| Custodian fees—Note 3(c) | 1,982 | |
| Directors’ fees and expenses—Note 3(d) | 858 | |
| Loan commitment fees—Note 2 | 310 | |
| Distribution fees—Note 3(b) | 284 | |
| Miscellaneous | 13,331 | |
| Total Expenses | 126,167 | |
| Less—reduction in expenses due to undertaking—Note 3(a) | (111,323) | |
| Less—waiver of shareholder servicing fees—Note 3(c) | (624) | |
| Less—reduction in fees due to earnings credits—Note 3(c) | (2) | |
| Net Expenses | 14,218 | |
| Investment Income—Net | 2,480 | |
| Realized and Unrealized Gain (Loss) on Investments—Note 4 ($): | ||
| Net realized gain (loss) on investments in affiliated issuers | 1,764 | |
| Capital gain distributions from affiliated issuers | 2,230 | |
| Net Realized Gain (Loss) | 3,994 | |
| Net unrealized appreciation (depreciation) on investments in affiliated issuers | 10,427 | |
| Net Realized and Unrealized Gain (Loss) on Investments | 14,421 | |
| Net Increase in Net Assets Resulting from Operations | 16,901 | |
| See notes to financial statements. | ||
| The Fund | 11 |
STATEMENT OF CHANGES IN NET ASSETS
| Year Ended October 31, | ||||
| 2011 | 2010 | |||
| Operations ($): | ||||
| Investment income—net | 2,480 | 5,856 | ||
| Net realized gain (loss) on | ||||
| investments in affiliated issuers | 3,994 | (37,683) | ||
| Net unrealized appreciation (depreciation) | ||||
| on investments in affiliated issuers | 10,427 | 223,287 | ||
| Net Increase (Decrease) in Net Assets | ||||
| Resulting from Operations | 16,901 | 191,460 | ||
| Dividends to Shareholders from ($): | ||||
| Investment income—net: | ||||
| Class A Shares | (295) | — | ||
| Class I Shares | (6,711) | — | ||
| Total Dividends | (7,006) | — | ||
| Capital Stock Transactions ($): | ||||
| Net proceeds from shares sold: | ||||
| Class A Shares | 255,987 | 53,980 | ||
| Class C Shares | 17,098 | — | ||
| Class I Shares | 3,191,119 | 3,447,648 | ||
| Dividends reinvested: | ||||
| Class A Shares | 147 | — | ||
| Class I Shares | 1,647 | — | ||
| Cost of shares redeemed: | ||||
| Class A Shares | (42,157) | (8,184) | ||
| Class C Shares | (9,798) | — | ||
| Class I Shares | (975,078) | (1,550,717) | ||
| Increase (Decrease) in Net Assets | ||||
| from Capital Stock Transactions | 2,438,965 | 1,942,727 | ||
| Total Increase (Decrease) in Net Assets | 2,448,860 | 2,134,187 | ||
| Net Assets ($): | ||||
| Beginning of Period | 2,237,078 | 102,891 | ||
| End of Period | 4,685,938 | 2,237,078 | ||
| Undistributed investment income—net | 4,940 | 6,713 | ||
12
| Year Ended October 31, | ||||
| 2011 | 2010 | |||
| Capital Share Transactions: | ||||
| Class A | ||||
| Shares sold | 16,408 | 3,996 | ||
| Shares issued for dividends reinvested | 9 | — | ||
| Shares redeemed | (2,571) | (653) | ||
| Net Increase (Decrease) in Shares Outstanding | 13,846 | 3,343 | ||
| Class C | ||||
| Shares sold | 1,112 | — | ||
| Shares redeemed | (674) | — | ||
| Net Increase (Decrease) in Shares Outstanding | 438 | — | ||
| Class I | ||||
| Shares sold | 194,385 | 254,951 | ||
| Shares issued for dividends reinvested | 104 | — | ||
| Shares redeemed | (59,741) | (113,709) | ||
| Net Increase (Decrease) in Shares Outstanding | 134,748 | 141,242 | ||
| See notes to financial statements. | ||||
| The Fund | 13 |
FINANCIAL HIGHLIGHTS
The following tables describe the performance for each share class for the fiscal periods indicated.All information (except portfolio turnover rate) reflects financial results for a single fund share.Total return shows how much your investment in the fund would have increased (or decreased) during each period, assuming you had reinvested all dividends and distributions.These figures have been derived from the fund’s financial statements.
| Year Ended October 31, | |||||
| Class A Shares | 2011 | 2010 | 2009a | ||
| Per Share Data ($): | |||||
| Net asset value, beginning of period | 14.65 | 12.86 | 12.50 | ||
| Investment Operations: | |||||
| Investment income (loss)—netb | (.00)c | .02 | (.01) | ||
| Net realized and unrealized gain | |||||
| (loss) on investments | .92 | 1.77 | .37 | ||
| Total from Investment Operations | .92 | 1.79 | .36 | ||
| Distributions: | |||||
| Dividends from investment income—net | (.04) | — | — | ||
| Net asset value, end of period | 15.53 | 14.65 | 12.86 | ||
| Total Return (%)d | 6.26 | 13.92 | 2.88e | ||
| Ratios/Supplemental Data (%): | |||||
| Ratio of total expenses | |||||
| to average net assetsf | 3.82 | 9.75 | 226.76g | ||
| Ratio of net expenses | |||||
| to average net assetsf | .36 | .33 | .36g | ||
| Ratio of net investment income | |||||
| (loss) to average net assetsf | (.03) | .12 | (.36)g | ||
| Portfolio Turnover Rate | 29.48 | 97.93 | —e | ||
| Net Assets, end of period ($ x 1,000) | 329 | 108 | 51 | ||
| a | From August 31, 2009 (commencement of operations) to October 31, 2009. |
| b | Based on average shares outstanding at each month end. |
| c | Amounts represents less than $.01 per share. |
| d | Exclusive of sales charge. |
| e | Not annualized. |
| f | Amounts do not include the activity of the underlying funds. |
| g | Annualized. |
See notes to financial statements.
14
| Year Ended October 31, | ||||||
| Class C Shares | 2011 | 2010 | 2009a | |||
| Per Share Data ($): | ||||||
| Net asset value, beginning of period | 14.53 | 12.85 | 12.50 | |||
| Investment Operations: | ||||||
| Investment (loss)—netb | (.10) | (.06) | (.02) | |||
| Net realized and unrealized | ||||||
| gain (loss) on investments | .88 | 1.74 | .37 | |||
| Total from Investment Operations | .78 | 1.68 | .35 | |||
| Net asset value, end of period | 15.31 | 14.53 | 12.85 | |||
| Total Return (%)c | 5.44 | 13.07 | 2.80d | |||
| Ratios/Supplemental Data (%): | ||||||
| Ratio of total expenses | ||||||
| to average net assetse | 4.46 | 10.61 | 227.92f | |||
| Ratio of net expenses | ||||||
| to average net assetse | 1.11 | 1.08 | 1.11f | |||
| Ratio of net investment (loss) | ||||||
| to average net assetse | (.67) | (.44) | (1.11)f | |||
| Portfolio Turnover Rate | 29.48 | 97.93 | —d | |||
| Net Assets, end of period ($ x 1,000) | 37 | 29 | 26 | |||
| a | From August 31, 2009 (commencement of operations) to October 31, 2009. |
| b | Based on average shares outstanding at each month end. |
| c | Exclusive of sales charge. |
| d | Not annualized. |
| e | Amounts do not include the activity of the underlying funds. |
| f | Annualized. |
See notes to financial statements.
| The Fund | 15 |
FINANCIAL HIGHLIGHTS (continued)
| Year Ended October 31, | |||||
| Class I Shares | 2011 | 2010 | 2009a | ||
| Per Share Data ($): | |||||
| Net asset value, beginning of period | 14.66 | 12.87 | 12.50 | ||
| Investment Operations: | |||||
| Investment income (loss)—netb | .01 | .05 | (.00)c | ||
| Net realized and unrealized | |||||
| gain (loss) on investments | .91 | 1.74 | .37 | ||
| Total from Investment Operations | .92 | 1.79 | .37 | ||
| Distributions: | |||||
| Dividends from investment income—net | (.04) | — | — | ||
| Net asset value, end of period | 15.54 | 14.66 | 12.87 | ||
| Total Return (%) | 6.25 | 13.91 | 2.96d | ||
| Ratios/Supplemental Data (%): | |||||
| Ratio of total expenses | |||||
| to average net assetse | 3.20 | 9.80 | 227.09f | ||
| Ratio of net expenses | |||||
| to average net assetse | .36 | .32 | .11f | ||
| Ratio of net investment income | |||||
| (loss) to average net assetse | .08 | .35 | (.11)f | ||
| Portfolio Turnover Rate | 29.48 | 97.93 | —d | ||
| Net Assets, end of period ($ x 1,000) | 4,320 | 2,100 | 26 | ||
| a | From August 31, 2009 (commencement of operations) to October 31, 2009. |
| b | Based on average shares outstanding at each month end. |
| c | Amount represents less than $.01 per share. |
| d | Not annualized. |
| e | Amounts do not include the activity of the underlying funds. |
| f | Annualized. |
See notes to financial statements.
16
NOTES TO FINANCIAL STATEMENTS
NOTE 1—Significant Accounting Policies:
Dreyfus Diversified Large Cap Fund (the “fund”) is a separate diversified series of Dreyfus Premier Investment Funds, Inc. (the “Company”), which is registered under the Investment Company Act of 1940, as amended (the “Act”), as an open-end management investment company and operates as a series company currently offering nine series, including the fund. The fund’s investment objective is to seek long-term capital appreciation. The Dreyfus Corporation (the “Manager” or “Dreyfus”), a wholly-owned subsidiary of The Bank of New York Mellon Corporation (“BNY Mellon”), serves as the fund’s investment adviser.
MBSC Securities Corporation (the “Distributor”), a wholly-owned subsidiary of the Manager, is the distributor of the fund’s shares.The fund is authorized to issue 50 million shares of $.001 par value Common Stock in each of the following classes of shares: Class A, Class C and Class I. Class A shares are subject to a sales charge imposed at the time of purchase. Class C shares are subject to a contingent deferred sales charge (“CDSC”) imposed on Class C shares redeemed within one year of purchase. Class I shares are sold at net asset value per share only to institutional investors. Other differences between the classes include the services offered to and the expenses borne by each class, the allocation of certain transfer agency costs and certain voting rights. Income, expenses (other than expenses attributable to a specific class), and realized and unrealized gains or losses on investments are allocated to each class of shares based on its relative net assets.
As of October 31, 2011, MBC Investments Corp., an indirect subsidiary of BNY Mellon, held 2,000 Class A and 2,000 Class C shares of the fund.
| The Fund | 17 |
NOTES TO FINANCIAL STATEMENTS (continued)
The Company accounts separately for the assets, liabilities and operations of each series. Expenses directly attributable to each series are charged to that series’ operations; expenses which are applicable to all series are allocated among them on a pro rata basis.
The Financial Accounting Standards Board (“FASB”) Accounting Standards Codification (“ASC”) is the exclusive reference of authoritative U.S. generally accepted accounting principles (“GAAP”) recognized by the FASB to be applied by nongovernmental entities. Rules and interpretive releases of the Securities and Exchange Commission (“SEC”) under authority of federal laws are also sources of authoritative GAAP for SEC registrants.The fund’s financial statements are prepared in accordance with GAAP, which may require the use of management estimates and assumptions. Actual results could differ from those estimates.
The Company enters into contracts that contain a variety of indemnifications. The fund’s maximum exposure under these arrangements is unknown.The fund does not anticipate recognizing any loss related to these arrangements.
(a) Portfolio valuation: The fair value of a financial instrument is the amount that would be received to sell an asset or paid to transfer a liability in an orderly transaction between market participants at the measurement date (i.e. the exit price). GAAP establishes a fair value hierarchy that prioritizes the inputs of valuation techniques used to measure fair value.This hierarchy gives the highest priority to unadjusted quoted prices in active markets for identical assets or liabilities (Level 1 measurements) and the lowest priority to unobservable inputs (Level 3 measurements).
Additionally, GAAP provides guidance on determining whether the volume and activity in a market has decreased significantly and whether such a decrease in activity results in transactions that are not orderly. GAAP requires enhanced disclosures around valuation inputs and techniques used during annual and interim periods.
18
Various inputs are used in determining the value of the fund’s investments relating to fair value measurements.These inputs are summarized in the three broad levels listed below:
Level 1—unadjusted quoted prices in active markets for identical investments.
Level 2—other significant observable inputs (including quoted prices for similar investments, interest rates, prepayment speeds, credit risk, etc.).
Level 3—significant unobservable inputs (including the fund’s own assumptions in determining the fair value of investments).
The inputs or methodology used for valuing securities are not necessarily an indication of the risk associated with investing in those securities.
Investments are valued at the net asset value of each underlying fund determined as of the close of the NewYork Stock Exchange (generally 4 p.m., Eastern time) on the valuation date and are generally categorized within Level 1 of the fair value hierarchy.
The following is a summary of the inputs used as of October 31, 2011 in valuing the fund’s investments:
| Level 2—Other | Level 3— | |||
| Level 1— | Significant | Significant | ||
| Unadjusted | Observable | Unobservable | ||
| Quoted Prices | Inputs | Inputs | Total | |
| Assets ($) | ||||
| Investments in Securities: | ||||
| Mutual Funds | 4,685,752 | — | — | 4,685,752 |
In May 2011, FASB issued Accounting Standards Update (“ASU”) No. 2011-04 “Amendments to Achieve Common Fair Value Measurement and Disclosure Requirements in GAAP and International Financial Reporting Standards (“IFRS”)” (“ASU 2011-04”). ASU 2011-04 includes common requirements for measurement of and disclosure about fair value between GAAP and IFRS. ASU 2011-04 will require reporting entities to disclose the following information for fair value
| The Fund | 19 |
NOTES TO FINANCIAL STATEMENTS (continued)
measurements categorized within Level 3 of the fair value hierarchy: quantitative information about the unobservable inputs used in the fair value measurement, the valuation processes used by the reporting entity and a narrative description of the sensitivity of the fair value measurement to changes in unobservable inputs and the interrelationships between those unobservable inputs. In addition, ASU 2011-04 will require reporting entities to make disclosures about amounts and reasons for all transfers in and out of Level 1 and Level 2 fair value measurements. The new and revised disclosures are effective for interim and annual reporting periods beginning after December 15, 2011.At this time, management is evaluating the implications of ASU 2011-04 and its impact on the financial statements.
(b) Securities transactions and investment income: Securities transactions are recorded on a trade date basis. Realized gains and losses from securities transactions are recorded on the identified cost basis. Dividend income is recognized on the ex-dividend date and interest income, including, where applicable, accretion of discount and amortization of premium on investments, is recognized on the accrual basis.
(c) Affiliated issuers: Investments in other investment companies advised by Dreyfus are defined as “affiliated” in the Act.
The fund may invest in shares of certain affiliated investment companies also advised or managed by Dreyfus. Investments in affiliated investment companies for the period ended October 31, 2011 were as follows:
| Affiliated | ||||||
| Investment | Value | Net Realized | ||||
| Company | 10/31/2010($) | Purchases ($)† | Sales ($) | Gain/(Loss) ($) | ||
| Dreyfus | ||||||
| Appreciation Fund | — | 619,645 | 78,634 | (2,117) | ||
| Dreyfus Research | ||||||
| Growth Fund, Cl. Z | 781,518 | 790,513 | 531,929 | 29,760 | ||
| Dreyfus Strategic | ||||||
| Value Fund, Cl. I | 709,537 | 1,071,355 | 267,571 | (14,800) | ||
| Dreyfus U.S. Equity | ||||||
| Fund, Cl. I | 381,479 | 550,840 | 137,840 | (3,739) | ||
| Dreyfus/The Boston | ||||||
| Company Large Cap | ||||||
| Core Fund, Cl. I | 370,585 | 551,902 | 137,839 | (7,340) | ||
| Total | 2,243,119 | 3,584,255 | 1,153,813 | 1,764 | ||
| † | Includes reinvested dividends/distributions. |
20
| Change in Net | |||||||
| Affiliated | Unrealized | ||||||
| Investment | Appreciation | Value | Net | Dividends/ | |||
| Company | (Depreciation) ($) | 10/31/2011($) | Assets (%) Distributions ($) | ||||
| Dreyfus | |||||||
| Appreciation Fund | 8,273 | 547,167 | 11.7 | 59 | |||
| Dreyfus Research | |||||||
| Growth Fund, Cl. Z | 14,882 | 1,084,744 | 23.1 | 3,740 | |||
| Dreyfus Strategic | |||||||
| Value Fund, Cl. I | (46,845) | 1,451,676 | 31.0 | 7,977 | |||
| Dreyfus U.S. Equity | |||||||
| Fund, Cl. I | 43,850 | 834,590 | 17.8 | 3,044 | |||
| Dreyfus/The Boston | |||||||
| Company Large Cap | |||||||
| Core Fund, Cl. I | (9,733) | 767,575 | 16.4 | 4,108 | |||
| Total | 10,427 | 4,685,752 | 100.0 | 18,928 | |||
(d) Dividends to shareholders: Dividends are recorded on the ex-dividend date. Dividends from investment income-net and dividends from net realized capital gains, if any, are normally declared and paid annually, but the fund may make distributions on a more frequent basis to comply with the distribution requirements of the Internal Revenue Code of 1986, as amended (the “Code”).To the extent that net realized capital gains can be offset by capital loss carryovers, it is the policy of the fund not to distribute such gains. Income and capital gain distributions are determined in accordance with income tax regulations, which may differ from GAAP.
(e) Federal income taxes: It is the policy of the fund to continue to qualify as a regulated investment company, if such qualification is in the best interests of its shareholders, by complying with the applicable provisions of the Code, and to make distributions of taxable income sufficient to relieve it from substantially all federal income and excise taxes.
As of and during the period ended October 31, 2011, the fund did not have any liabilities for any uncertain tax positions.The fund recognizes interest and penalties, if any, related to uncertain tax positions as income tax expense in the Statement of Operations. During the period, the fund did not incur any interest or penalties.
| The Fund | 21 |
NOTES TO FINANCIAL STATEMENTS (continued)
Each of the tax years in the three-year period ended October 31, 2011 remains subject to examination by the Internal Revenue Service and state taxing authorities.
At October 31, 2011, the components of accumulated earnings on a tax basis were as follows: undistributed ordinary income $23,133, undistributed capital gains $2,053 and unrealized appreciation $180,525.
The tax character of distributions paid to shareholders during the fiscal periods ended October 31, 2011 and October 31, 2010 were as follows: ordinary income $7,006 and $0, respectively.
During the period ended October 31, 2011, as a result of permanent book to tax differences, primarily due to short-term capital gain distributions from regulated investment company holdings and excise tax paid, the fund increased accumulated undistributed investment income-net by $2,753, decreased accumulated gain (loss) on investments by $2,231 and decreased paid-in capital by $522. Net assets and net asset value per share were not affected by this reclassification.
NOTE 2—Bank Lines of Credit:
The fund participates with other Dreyfus-managed funds in a $225 million unsecured credit facility led by Citibank, N.A. and a $300 million unsecured credit facility provided by The Bank of New York Mellon, a subsidiary of BNY Mellon and an affiliate of Dreyfus (each, a “Facility”), each to be utilized primarily for temporary or emergency purposes, including the financing of redemptions. In connection therewith, the fund has agreed to pay its pro rata portion of commitment fees for each Facility. Interest is charged to the fund based on rates determined pursuant to the terms of the respective Facility at the time of borrowing. During the period ended on October 31, 2011, the fund did not borrow under the Facilities.
NOTE 3—Management Fee and Other Transactions with Affiliates:
(a) Pursuant to a management agreement with the Manager, there is no management fee paid to the Manager. The fund invests in other
22
mutual funds advised by the Manager. All fees and expenses of the underlying funds are reflected in the underlying funds’ net asset value.
The Manager has contractually agreed, until March 1, 2013, to assume the expenses of the fund so that the total annual fund’s and underlying funds’ operating expenses of none of the classes (excluding Rule 12b-1 fees, shareholder services fees, taxes, interest expense, brokerage commissions, commitment fees on borrowings, underlying fund expenses and extraordinary expenses) exceed 1.20% of the value of the fund’s average daily net assets.The reduction in expenses, pursuant to the undertaking, amounted to $111,323 during the period ended October 31, 2011.
During the period ended October 31, 2011, the Distributor retained $7 from commissions earned on sales of the fund’s Class A shares.
(b) Under the Distribution Plan (the “Plan”) adopted pursuant to Rule 12b-1 under the Act, Class C shares pay the Distributor for distributing its shares at an annual rate of .75% of the value of the average daily net assets of Class C shares. During the period ended October 31, 2011, Class C shares were charged $284 pursuant to the Plan.
(c) Under the Shareholder Services Plan, Class A and Class C shares pay the Distributor at an annual rate of .25% of the value of their average daily net assets for the provision of certain services. The services provided may include personal services relating to shareholder accounts, such as answering shareholder inquiries regarding the fund and providing reports and other information, and services related to the maintenance of shareholder accounts. The Distributor may make payments to Service Agents (a securities dealer, financial institution or other industry professional) in respect of these services. The Distributor determines the amounts to be paid to Service Agents. Fees paid to the Distributor will be waived to the extent that the fund invests in an underlying affiliated fund with a Shareholder Services Plan. During the period ended October 31, 2011, Class A and Class C shares were charged $530 and $94, respectively, pursuant to the Shareholder Services Plan, all of which was waived due to the fund’s investment in certain of the underlying funds.
| The Fund | 23 |
NOTES TO FINANCIAL STATEMENTS (continued)
The fund compensates Dreyfus Transfer, Inc., a wholly-owned subsidiary of the Manager, under a transfer agency agreement for providing personnel and facilities to perform transfer agency services for the fund. During the period ended October 31, 2011, the fund was charged $776 pursuant to the transfer agency agreement, which is included in Shareholder servicing costs in the Statement of Operations.
The fund has arrangements with the custodian and cash management bank whereby the fund may receive earnings credits when positive cash balances are maintained, which are used to offset custody and cash management fees. For financial reporting purposes, the fund includes net earnings credits as an expense offset in the Statement of Operations.
The fund compensates The Bank of New York Mellon under a cash management agreement for performing cash management services related to fund subscriptions and redemptions. During the period ended October 31, 2011, the fund was charged $59 pursuant to the cash management agreement, which is included in Shareholder servicing costs in the Statement of Operations.These fees were partially offset by earnings credits of $2.
The fund also compensates The Bank of New York Mellon under a custody agreement for providing custodial services for the fund. During the period ended October 31, 2011, the fund was charged $1,982 pursuant to the custody agreement.
During the period ended October 31, 2011, the fund was charged $6,751 for services performed by the Chief Compliance Officer.
The components of “Due from The Dreyfus Corporation and affiliates” in the Statement of Assets and Liabilities consist of: Rule 12b-1 distribution plan fees $25, shareholder services plan fees $74, custodian fees $300, chief compliance officer fees $4,246 and transfer agency per account fees $144, which are offset against an expense reimbursement currently in effect in the amount of $8,306.
24
(d) Each Board member also serves as a Board member of other funds within the Dreyfus complex. Annual retainer fees and attendance fees are allocated to each fund based on net assets.
NOTE 4—Securities Transactions:
The aggregate amount of purchases and sales of investment securities, excluding short-term securities, during the period ended October 31, 2011, amounted to $3,584,255 and $1,153,813, respectively.
At October 31, 2011, the cost of investments for federal income tax purposes was $4,505,227; accordingly, accumulated net unrealized appreciation on investments was $180,525, consisting of $239,147 gross unrealized appreciation and $58,622 gross unrealized depreciation.
| The Fund | 25 |
| REPORT OF INDEPENDENT REGISTERED |
| PUBLIC ACCOUNTING FIRM |
Shareholders and Board of Directors
Dreyfus Diversified Large Cap Fund
We have audited the accompanying statement of assets and liabilities, including the statement of investments, of Dreyfus Diversified Large Cap Fund (one of the series comprising Dreyfus Premier Investment Funds, Inc.) as of October 31, 2011, and the related statement of operations for the year then ended, the statement of changes in net assets for each of the two years in the period then ended and financial highlights for each of the periods indicated therein.These financial statements and financial highlights are the responsibility of the Fund’s management. Our responsibility is to express an opinion on these financial statements and financial highlights based on our audits.
We conducted our audits in accordance with the standards of the Public Company Accounting Oversight Board (United States).Those standards require that we plan and perform the audit to obtain reasonable assurance about whether the financial statements and financial highlights are free of material misstatement.We were not engaged to perform an audit of the Fund’s internal control over financial reporting. Our audits included consideration of internal control over financial reporting as a basis for designing audit procedures that are appropriate in the circumstances, but not for the purpose of expressing an opinion on the effectiveness of the Fund’s internal control over financial reporting. Accordingly, we express no such opinion.An audit also includes examining, on a test basis, evidence supporting the amounts and disclosures in the financial statements and financial highlights, assessing the accounting principles used and significant estimates made by management, and evaluating the overall financial statement presentation. Our procedures included confirmation of securities owned as of October 31, 2011 by correspondence with the custodian and others. We believe that our audits provide a reasonable basis for our opinion.
In our opinion, the financial statements and financial highlights referred to above present fairly, in all material respects, the financial position of Dreyfus Diversified Large Cap Fund at October 31, 2011, the results of its operations for the year then ended, the changes in its net assets for each of the two years in the period then ended and the financial highlights for the each of the indicated periods, in conformity with U.S. generally accepted accounting principles.

New York, New York
December 29, 2011
26
IMPORTANT TAX INFORMATION (Unaudited)
In accordance with federal tax law, the fund hereby designates 98.82% of the ordinary dividends paid during the fiscal year ended October 31, 2011 as qualifying for the corporate dividends received deduction. For the fiscal year ended October 31, 2011, certain dividends paid by the fund may be subject to a maximum tax rate of 15%, as provided for by the Jobs and Growth Tax Relief Reconciliation Act of 2003. Of the distributions paid during the fiscal year, $7,006 represents the maximum amount that may be considered qualified dividend income. Shareholders will receive notification in early 2012 of the percentage applicable to the preparation of their 2011 income tax returns.
| The Fund | 27 |
PROXY RESULTS (Unaudited)
The Company held a special meeting of shareholders on May 31, 2011.The proposal considered at the meeting, and the results, are as follows:
| Shares | |||
| Votes For | Authority Withheld | ||
| To elect Board Members: | |||
| Joseph S. DiMartino† | 119,515,411 | 644,860 | |
| Phillip L. Toia† | 119,502,800 | 657,471 | |
| Robin A. Melvin† | 119,566,042 | 594,229 |
† Each new Board member’s term commenced on May 31, 2011.
In addition Gordon J. Davis, Esq., David P. Feldman and Lynn Martin continue as Board members of the Company.
28
| INFORMATION ABOUT THE RENEWAL OF THE |
| FUND’S MANAGEMENT AGREEMENT (Unaudited) |
At a meeting of the fund’s Board of Directors held on July 12, 2011, the Board considered the renewal of the fund’s Management Agreement pursuant to which Dreyfus provides the fund with investment advisory and administrative services (the “Agreement”). The Board members, none of whom are “interested persons” (as defined in the Investment Company Act of 1940, as amended) of the fund, were assisted in their review by independent legal counsel and met with counsel in executive session separate from Dreyfus representatives. In considering the renewal of the Agreement, the Board considered all factors that it believed to be relevant, including those discussed below.The Board did not identify any one factor as dispositive, and each Board member may have attributed different weights to the factors considered.
Analysis of Nature, Extent, and Quality of Services Provided to the Fund. The Board considered information previously provided to them in presentations from Dreyfus representatives regarding the nature, extent, and quality of the services provided to funds in the Dreyfus fund complex, and Dreyfus representatives confirmed that there had been no material changes in this information. Dreyfus provided the number of open accounts in the fund, the fund’s asset size and the allocation of fund assets among distribution channels. Dreyfus also had previously provided information regarding the diverse intermediary relationships and distribution channels of funds in the Dreyfus fund complex and Dreyfus’ corresponding need for broad, deep, and diverse resources to be able to provide ongoing shareholder services to each distribution channel, including the distribution channel(s) for the fund.
The Board also considered research support available to, and portfolio management capabilities of, the fund’s portfolio management personnel and that Dreyfus also provides oversight of day-to-day fund operations, including fund accounting and administration and assistance in meeting legal and regulatory requirements.The Board also considered Dreyfus’ extensive administrative, accounting, and compliance infrastructures.The Board also considered portfolio management’s brokerage policies and practices (including policies and practices regarding soft dollars) and the standards applied in seeking best execution.
| The Fund | 29 |
| INFORMATION ABOUT THE RENEWAL OF THE FUND’S |
| MANAGEMENT AGREEMENT (Unaudited) (continued) |
Comparative Analysis of the Fund’s Performance and Management Fee and Expense Ratio. The Board reviewed reports prepared by Lipper, Inc. (“Lipper”), an independent provider of investment company data, which included information comparing (1) the fund’s performance with the performance of a group of comparable funds (the “Performance Group”) and with a broader group of funds (the “Performance Universe”), for the one-year period ended May 31, 2011, and (2) the fund’s actual and contractual management fees and total expenses with those of a group of comparable funds (the “Expense Group”) and with a broader group of funds (the “Expense Universe”), the information for which was derived in part from fund financial statements available to Lipper as of May 31, 2011. Dreyfus previously had furnished the Board with a description of the methodology Lipper used to select the Performance Group and Performance Universe and the Expense Group and Expense Universe.
Dreyfus representatives stated that the usefulness of performance comparisons may be affected by a number of factors, including different investment limitations that may be applicable to the fund and comparison funds. The Board discussed the results of the comparisons and noted that the fund’s total return performance was above the Performance Group and Performance Universe medians for the one-year period ended May 31, 2011. Dreyfus also provided a comparison of the fund’s calendar year total return to the return of the fund’s benchmark index.
The Board also reviewed the range of actual and contractual management fees and total expenses of the Expense Group and Expense Universe funds and discussed the results of the comparisons. The Board noted that, like other funds in the Expense Group, the fund’s management fees are paid only at the underlying funds’ level.They further noted that the fund’s total expense ratio was below the Expense Group and Expense Universe medians.
Dreyfus representatives noted that Dreyfus has contractually agreed until March 31, 2013, assume the expenses of the fund so that the total
30
annual fund’s and underlying funds’ operating expenses of none of the classes (excluding Rule 12b-1 fees, shareholder services fees, taxes, interest expense, brokerage commissions, commitment fees on borrowings, underlying fund expenses and extraordinary expenses) exceed 1.20% of the fund’s average daily net assets.
Dreyfus representatives reviewed with the Board the management or investment advisory fees (1) paid by funds advised or administered by Dreyfus that are in the same Lipper category as the fund and (2) paid to Dreyfus or the Dreyfus-affiliated primary employer of the fund’s primary portfolio manager for advising any separate accounts and/or other types of client portfolios that are considered to have similar investment strategies and policies as the fund (the “Similar Clients”), and explained the nature of the Similar Clients.They discussed differences in fees paid and the relationship of the fees paid in light of any differences in the services provided and other relevant factors. The Board considered the relevance of the fee information provided for the Similar Clients to evaluate the appropriateness and reasonableness of the fund’s management fee.
Analysis of Profitability and Economies of Scale. Dreyfus does not have direct profits from the fund’s management fee, since the fund pays no direct management fee. Similarly, economies of scale were not relevant. The Board considered potential benefits to Dreyfus from acting as investment adviser and noted that there were no soft dollar arrangements in effect for trading the fund’s investments.
At the conclusion of these discussions, the Board agreed that it had been furnished with sufficient information to make an informed business decision with respect to the renewal of the Agreement. Based on the discussions and considerations as described above, the Board concluded and determined as follows.
The Board concluded that the nature, extent and quality of the services provided by Dreyfus are adequate and appropriate.
| The Fund | 31 |
| INFORMATION ABOUT THE RENEWAL OF THE FUND’S |
| MANAGEMENT AGREEMENT (Unaudited) (continued) |
The Board was satisfied with the fund’s performance.
Since the fund does not pay a direct management fee, profitability and economies of scale are not relevant.
The Board considered these conclusions and determinations, along with information received on a routine and regular basis throughout the year. In addition, it should be noted that the Board’s consideration of the contractual fee arrangements for this fund had the benefit of a number of years of reviews of prior or similar agreements during which lengthy discussions took place between the Board and Dreyfus representatives. Certain aspects of the arrangements may receive greater scrutiny in some years than in others, and the Board’s conclusions may be based, in part, on their consideration of the same or similar arrangements in prior years. The Board determined that renewal of the Agreement was in the best interests of the fund and its shareholders.
32
BOARD MEMBERS INFORMATION (Unaudited)
| Joseph S. DiMartino (68) |
| Chairman of the Board (1995) |
| Principal Occupation During Past 5Years: |
| • Corporate Director and Trustee |
| Other Public Company Board Memberships During Past 5Years: |
| • CBIZ (formerly, Century Business Services, Inc.), a provider of outsourcing functions for small |
| and medium size companies, Director (1997-present) |
| • Sunair Services Corporation, a provider of certain outdoor-related services to homes and busi- |
| nesses, Director (2005-2009) |
| • The Newark Group, a provider of a national market of paper recovery facilities, paperboard mills |
| and paperboard converting plants, Director (2000-2010) |
| No. of Portfolios for which Board Member Serves: 167 |
| ——————— |
| Gordon J. Davis (70) |
| Board Member (1993) |
| Principal Occupation During Past 5Years: |
| • Partner in the law firm of Dewey & LeBoeuf LLP |
| Other Public Company Board Memberships During Past 5Years: |
| • Consolidated Edison, Inc., a utility company, Director (1997-present) |
| • The Phoenix Companies Inc., a life insurance company, Director (2000-present) |
| No. of Portfolios for which Board Member Serves: 44 |
| ——————— |
| David P. Feldman (71) |
| Board Member (1991) |
| Principal Occupation During Past 5Years: |
| • Corporate Director and Trustee |
| Other Public Company Board Memberships During Past 5Years: |
| • BBH Mutual Funds Group (4 registered mutual funds), Director (1992-present) |
| • QMed Inc., a healthcare company, Director (1999-2007) |
| No. of Portfolios for which Board Member Serves: 50 |
| The Fund | 33 |
BOARD MEMBERS INFORMATION (Unaudited) (continued)
| Lynn Martin (71) |
| Board Member (1993) |
| Principal Occupation During Past 5Years: |
| • President of The Martin Hall Group LLC, a human resources consulting firm, from |
| January 2005-present |
| • Advisor to the international accounting firm of Deloitte & Touche, LLP and Chair to its |
| Council for the Advancement of Women from March 1993-September 2005 |
| Other Public Company Board Memberships During Past 5Years: |
| • AT&T Inc., a telecommunications company, Director (1999-present) |
| • Ryder System, Inc., a supply chain and transportation management company, Director |
| (1993-present) |
| • The Proctor & Gamble Co., a consumer products company, Director (1994-present) |
| • Constellation Energy Group Inc., Director (2003-present) |
| No. of Portfolios for which Board Member Serves: 15 |
| ——————— |
| Robin A. Melvin (48) |
| Board Member (2011) |
| Principal Occupation During Past 5Years: |
| • Director, Boisi Family Foundation, a private family foundation that supports youth-serving |
| organizations that promote the self sufficiency of youth from disadvantaged circumstances |
| (1995-present) |
| • SeniorVice President, Mentor, a national non-profit youth mentoring organization (1992-2005) |
| No. of Portfolios for which Board Member Serves: 54 |
| ——————— |
| Philip L. Toia (78) |
| Board Member (1997) |
| Principal Occupation During Past 5Years: |
| • Private Investor |
| No. of Portfolios for which Board Member Serves: 25 |
| ——————— |
Once elected all Board Members serve for an indefinite term, but achieve Emeritus status upon reaching age 80.The address of the Board Members and Officers is in c/o The Dreyfus Corporation, 200 Park Avenue, NewYork, NewYork 10166.Additional information about the Board Members is available in the fund’s Statement of Additional Information which can be obtained from Dreyfus free of charge by calling this toll free number: 1-800-DREYFUS.
Daniel Rose, Emeritus Board Member
Sander Vanocur, Emeritus Board Member
34
OFFICERS OF THE FUND (Unaudited)
BRADLEY J. SKAPYAK, President since January 2010.
Chief Operating Officer and a director of the Manager since June 2009. From April 2003 to June 2009, Mr. Skapyak was the head of the Investment Accounting and Support Department of the Manager. He is an officer of 75 investment companies (comprised of 167 portfolios) managed by the Manager. He is 52 years old and has been an employee of the Manager since February 1988.
MICHAEL A. ROSENBERG, Vice President and Secretary since August 2005.
Assistant General Counsel of BNY Mellon, and an officer of 76 investment companies (comprised of 192 portfolios) managed by the Manager. He is 51 years old and has been an employee of the Manager since October 1991.
KIESHA ASTWOOD, Vice President and Assistant Secretary since January 2010.
Counsel of BNY Mellon, and an officer of 76 investment companies (comprised of 192 portfolios) managed by the Manager. She is 38 years old and has been an employee of the Manager since July 1995.
JAMES BITETTO, Vice President and Assistant Secretary since August 2005.
Senior Counsel of BNY Mellon and Secretary of the Manager, and an officer of 76 investment companies (comprised of 192 portfolios) managed by the Manager. He is 45 years old and has been an employee of the Manager since December 1996.
JONI LACKS CHARATAN, Vice President and Assistant Secretary since August 2005.
Senior Counsel of BNY Mellon, and an officer of 76 investment companies (comprised of 192 portfolios) managed by the Manager. She is 55 years old and has been an employee of the Manager since October 1988.
JOSEPH M. CHIOFFI, Vice President and Assistant Secretary since August 2005.
Senior Counsel of BNY Mellon, and an officer of 76 investment companies (comprised of 192 portfolios) managed by the Manager. He is 49 years old and has been an employee of the Manager since June 2000.
KATHLEEN DENICHOLAS, Vice President and Assistant Secretary since January 2010.
Managing Counsel of BNY Mellon, and an officer of 76 investment companies (comprised of 192 portfolios) managed by the Manager. She is 37 years old and has been an employee of the Manager since February 2001.
JANETTE E. FARRAGHER, Vice President and Assistant Secretary since August 2005.
Assistant General Counsel of BNY Mellon, and an officer of 76 investment companies (comprised of 192 portfolios) managed by the Manager. She is 48 years old and has been an employee of the Manager since February 1984.
JOHN B. HAMMALIAN, Vice President and Assistant Secretary since August 2005.
Senior Managing Counsel of BNY Mellon, and an officer of 76 investment companies (comprised of 192 portfolios) managed by the Manager. He is 48 years old and has been an employee of the Manager since February 1991.
M. CRISTINA MEISER, Vice President and Assistant Secretary since January 2010.
Senior Counsel of BNY Mellon, and an officer of 76 investment companies (comprised of 192 portfolios) managed by the Manager. She is 41 years old and has been an employee of the Manager since August 2001.
| The Fund | 35 |
OFFICERS OF THE FUND (Unaudited) (continued)
ROBERT R. MULLERY, Vice President and Assistant Secretary since August 2005.
Managing Counsel of BNY Mellon, and an officer of 76 investment companies (comprised of 192 portfolios) managed by the Manager. He is 59 years old and has been an employee of the Manager since May 1986.
JEFF PRUSNOFSKY, Vice President and Assistant Secretary since August 2005.
Senior Managing Counsel of BNY Mellon, and an officer of 76 investment companies (comprised of 192 portfolios) managed by the Manager. He is 46 years old and has been an employee of the Manager since October 1990.
JAMES WINDELS, Treasurer since November 2001.
Director – Mutual Fund Accounting of the Manager, and an officer of 76 investment companies (comprised of 192 portfolios) managed by the Manager. He is 53 years old and has been an employee of the Manager since April 1985.
RICHARD CASSARO, Assistant Treasurer since January 2008.
Senior Accounting Manager – Money Market and Municipal Bond Funds of the Manager, and an officer of 76 investment companies (comprised of 192 portfolios) managed by the Manager. He is 52 years old and has been an employee of the Manager since September 1982.
GAVIN C. REILLY, Assistant Treasurer since December 2005.
Tax Manager of the Investment Accounting and Support Department of the Manager, and an officer of 76 investment companies (comprised of 192 portfolios) managed by the Manager. He is 43 years old and has been an employee of the Manager since April 1991.
ROBERT ROBOL, Assistant Treasurer since December 2002.
Senior Accounting Manager – Fixed Income Funds of the Manager, and an officer of 76 investment companies (comprised of 192 portfolios) managed by the Manager. He is 47 years old and has been an employee of the Manager since October 1988.
ROBERT SALVIOLO, Assistant Treasurer since July 2007.
Senior Accounting Manager – Equity Funds of the Manager, and an officer of 76 investment companies (comprised of 192 portfolios) managed by the Manager. He is 44 years old and has been an employee of the Manager since June 1989.
ROBERT SVAGNA, Assistant Treasurer since December 2002.
Senior Accounting Manager – Equity Funds of the Manager, and an officer of 76 investment companies (comprised of 192 portfolios) managed by the Manager. He is 44 years old and has been an employee of the Manager since November 1990.
36
JOSEPH W. CONNOLLY, Chief Compliance Officer since October 2004.
Chief Compliance Officer of the Manager and The Dreyfus Family of Funds (76 investment companies, comprised of 192 portfolios). From November 2001 through March 2004, Mr. Connolly was first Vice-President, Mutual Fund Servicing for Mellon Global Securities Services. In that capacity, Mr. Connolly was responsible for managing Mellon’s Custody, Fund Accounting and Fund Administration services to third-party mutual fund clients.
He is 54 years old and has served in various capacities with the Manager since 1980, including manager of the firm’s Fund Accounting Department from 1997 through October 2001.
STEPHEN J. STOREN, Anti-Money Laundering Compliance Officer since May 2011.
Chief Compliance Officer of the Distributor, and the Anti-Money Laundering Compliance Officer of 72 investment companies (comprised of 188 portfolios) managed by the Manager. He is 57 years old and has been an employee of the Distributor since October 1999.
| The Fund | 37 |
For More Information
Telephone Call your financial representative or 1-800-DREYFUS
Mail The Dreyfus Family of Funds, 144 Glenn Curtiss Boulevard, Uniondale, NY 11556-0144
The fund files its complete schedule of portfolio holdings with the Securities and Exchange Commission (“SEC”) for the first and third quarters of each fiscal year on Form N-Q. The fund’s Forms N-Q are available on the SEC’s website at http://www.sec.gov and may be reviewed and copied at the SEC’s Public Reference Room in Washington, DC. Information on the operation of the Public Reference Room may be obtained by calling 1-800-SEC-0330.
A description of the policies and procedures that the fund uses to determine how to vote proxies relating to portfolio securities, and information regarding how the fund voted these proxies for the most recent 12-month period ended June 30 is available at http://www.dreyfus.com and on the SEC’s website at http://www.sec.gov. The description of the policies and procedures is also available without charge, upon request, by calling 1-800-DREYFUS.

| Dreyfus |
| Emerging Asia Fund |
ANNUAL REPORT October 31, 2011
Save time. Save paper. View your next shareholder report online as soon as it’s available. Log into www.dreyfus.com and sign up for Dreyfus eCommunications. It’s simple and only takes a few minutes.
The views expressed in this report reflect those of the portfolio manager only through the end of the period covered and do not necessarily represent the views of Dreyfus or any other person in the Dreyfus organization. Any such views are subject to change at any time based upon market or other conditions and Dreyfus disclaims any responsibility to update such views.These views may not be relied on as investment advice and, because investment decisions for a Dreyfus fund are based on numerous factors, may not be relied on as an indication of trading intent on behalf of any Dreyfus fund.
| Not FDIC-Insured • Not Bank-Guaranteed • May Lose Value |
Contents | |
THE FUND | |
| 2 | A Letter from the Chairman and CEO |
| 3 | Discussion of Fund Performance |
| 6 | Fund Performance |
| 8 | Understanding Your Fund’s Expenses |
| 8 | Comparing Your Fund’s Expenses With Those of Other Funds |
| 9 | Statement of Investments |
| 12 | Statement of Assets and Liabilities |
| 13 | Statement of Operations |
| 14 | Statement of Changes in Net Assets |
| 15 | Financial Highlights |
| 18 | Notes to Financial Statements |
| 31 | Report of Independent Registered Public Accounting Firm |
| 32 | Important Tax Information |
| 33 | Proxy Results |
| 34 | Information About the Renewal of the Fund’s Management and Sub-Investment Advisory Agreements |
| 39 | Board Members Information |
| 41 | Officers of the Fund |
FOR MORE INFORMATION | |
Back Cover |
Dreyfus
Emerging Asia Fund
The Fund

A LETTER FROM THE CHAIRMAN AND CEO
Dear Shareholder:
We present to you this annual report for Dreyfus Emerging Asia Fund, covering the 12-month period from November 1, 2010, through October 31, 2011. For information about how the fund performed during the reporting period, as well as general market perspectives, we provide a Discussion of Fund Performance on the pages that follow.
Investors were encouraged by expectations of a more robust economic recovery during the final months of 2010, but sentiment deteriorated in 2011 due to disappointing global economic data, rising commodity prices, an escalating sovereign debt crisis in Europe and a contentious debate regarding taxes, spending and borrowing in the United States. International stocks proved sensitive to these macroeconomic developments, often regardless of underlying company fundamentals, and most international equity market indices ended the reporting period with mildly negative absolute returns.
The global economic outlook currently remains clouded by market turbulence and political infighting, but we believe that a continued subpar global expansion is more likely than a return to recession. Although Europe continues to struggle with a debt crisis, inflationary pressures appear to be waning in most countries as energy prices recently have retreated from their highs. In Asia, China seems to have averted an economic contraction after implementing measures to dampen inflationary pressures. In the United States, moderately low core inflation and an accommodative monetary policy could help support near-trend growth despite ongoing deleveraging activity in the private sector.To assess the potential impact of these and other developments on your investments, we encourage you, as always, to speak with your financial advisor.
Thank you for your continued confidence and support.

Jonathan R. Baum
Chairman and Chief Executive Officer
The Dreyfus Corporation
November 15, 2011
2

DISCUSSION OF FUND PERFORMANCE
For the period of November 1, 2010, through October 31, 2011, as provided by Hugh Simon, Raymond Chan, and Abhijit Sarkar, Portfolio Managers
Fund and Market Performance Overview
For the 12-month period ended October 31, 2011, Dreyfus Emerging Asia Fund’s Class A shares produced a total return of –34.63%, Class C shares returned –35.13% and Class I shares returned –34.41%.1 In comparison, the fund’s benchmark, the MSCI Emerging Markets Asia Index (the “Index”), produced a total return of –6.60% for the same period.2
Stocks in Asian emerging markets stumbled as investors responded negatively to concerns that inflation-fighting measures in China and India would weigh on regional growth. The fund produced lower returns than its benchmark, mainly due to overweighted exposure to domestically oriented companies in China and India.
The Fund’s Investment Approach
The fund, which seeks long-term capital appreciation, normally invests at least 80% of its net assets in stocks of companies that are located or principally traded in Asian emerging markets countries or other investments that are tied economically to Asian emerging markets.The fund may invest in the stocks of companies of any market capitalization.To determine where the fund will invest, we analyze several factors, including economic, demographic and political trends in Asian emerging market countries, the current financial condition and future prospects of individual companies and sectors in the Asian emerging markets, and the valuation of one market or company relative to that of another.
Macroeconomic Developments Challenged Chinese Stocks
The reporting period proved challenging as inflation fighting efforts—including rising interest rates, stricter lending standards and higher banking reserve ratio requirements—threatened high economic growth rates in China and India.At the same time, investors worried that deteriorating global economic conditions might hurt export activity to other parts of the world, mainly due to a sovereign debt crisis in Europe, rising energy prices stemming from political unrest in the Middle East, and stubbornly high unemployment in the United States.
Faced with these headwinds, risk-averse global investors shifted assets from the emerging markets to traditional safe havens in the developed
| The Fund | 3 |
DISCUSSION OF FUND PERFORMANCE (continued)
world. Capital outflows caused equity valuations to contract significantly across a wide range of markets and industry groups.Although emerging Asian stocks rallied strongly in October 2011 when some macroeconomic concerns eased, it was not enough to offset earlier weakness.
Stocks in Korea,Thailand,Taiwan and other Asian markets with lower inflation rates generally fared better than their counterparts in China and India during the reporting period. Korea fared especially well due to rising demand for industrial and consumer products when manufacturing in Japan was disrupted by natural disasters.
Domestic Emphasis Weighed on Performance
The fund’s relative performance was undermined by overweighted exposure to companies serving domestic businesses and consumers in China and India.Although we had identified companies in these areas that we believe are poised to benefit over the long term from a growing middle class of consumers, skittish investors adopted a short-term perspective and punished many stocks more severely than we believe was warranted by underlying fundamentals. In addition, the fund held less exposure than the benchmark to better performing markets in Korea and Taiwan.
The fund’s greater laggards for the reporting period included the consumer discretionary and financials sectors, as well as infrastructure companies in India. Among individual stocks, Indian financial consultancy IFCI struggled with rising interest rates and concerns regarding non-performing loans. In China, leasing company Far East Horizon was hurt by limited market liquidity, and software developer Inspur International declined sharply after reporting disappointing financial results.
The fund achieved better results from other individual holdings. Wireless handset casing maker CatcherTechnology captured greater market share and boosted earnings. Hong Kong retailer Lifestyle International Holdings advanced amid a trend in tourism in which travelers focus on shopping opportunities. We purchased shares of Agricultural Bank of China late in the reporting period at distressed prices, and the stock already began to rebound by the end of October.
Adopting a More Constructive Investment Posture
In our view, the worst of the market downturn in Emerging Asia is behind us. It appears that inflationary pressures are receding, and a sharp market rally in October seemed to reflect evidence that authorities in China and India may remove some of the liquidity restrictions imposed in their inflation-fighting efforts.
4
As of the reporting period’s end, we have maintained the fund’s emphasis on China and India, where we have identified opportunities among stocks that we believe are selling at attractive valuations in the wake of the market correction. Particularly attractive are the hard-hit financials, consumer discretionary and materials sector, where we have increased the fund’s exposure. Conversely, we have maintained underweighted positions in traditionally defensive market sectors, including the telecommunications services, utilities and health care sectors. However, we would like to remind our shareholders, particularly newer investors, that this fund has a high risk/return profile and is appropriate only for shareholders willing to accept greater risks. Because of its narrow geographic focus and relatively limited number of holdings, this fund can be extremely volatile and should only represent a small portion of a long-term investor’s well-diversified portfolio.
November 15, 2011
| Please note, the position in any security highlighted with italicized typeface was sold during the | |
| reporting period. | |
| Emerging markets, such as those of China and Taiwan, tend to be more volatile than the markets | |
| of more mature economies, and generally have less diverse and less mature economic structures and | |
| less stable political systems than those of developed countries.The securities of companies located in | |
| emerging markets are often subject to rapid and large changes in price.An investment in this fund | |
| should be considered only as a supplement to a complete investment program for those investors | |
| willing to accept the greater risks associated with investing in emerging market countries. | |
| Equity funds are subject generally to market, market sector, market liquidity, issuer and investment | |
| style risks, among other factors, to varying degrees, all of which are more fully described in the | |
| fund’s prospectus. | |
| The fund’s performance will be influenced by political, social and economic factors affecting | |
| investments in foreign companies. Special risks associated with investments in foreign companies | |
| include exposure to currency fluctuations, less liquidity, less developed or less efficient trading | |
| markets, lack of comprehensive company information, political instability and differing auditing | |
| and legal standards.These risks are enhanced in emerging market countries. | |
| 1 | Total return includes reinvestment of dividends and any capital gains paid, and does not take into |
| consideration the maximum initial sales charge in the case of Class A shares, or the applicable | |
| contingent deferred sales charges imposed on redemptions in the case of Class C shares. Had these | |
| charges been reflected, returns would have been lower. Past performance is no guarantee of future | |
| results. Share price and investment return fluctuate such that upon redemption, fund shares may be | |
| worth more or less than their original cost. Return figures provided reflect an undertaking for the | |
| absorption of certain fund expenses by The Dreyfus Corporation through July 31, 2012, at which | |
| time it may be extended, terminated or modified. Had these expenses not been absorbed, the | |
| fund’s returns would have been lower. | |
| 2 | SOURCE: BLOOMBERG L.P. – Reflects reinvestment of dividends and, where applicable, |
| capital gain distributions.The MSCI Emerging Markets Asia Index is a free-float adjusted | |
| market capitalization-weighted index designed to measure equity market performance in the | |
| emerging market countries of Asia. Investors cannot invest directly in any index. |
| The Fund | 5 |
FUND PERFORMANCE
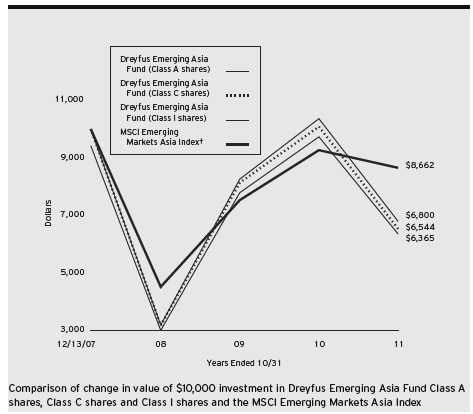
| † Source: Bloomberg L.P. |
| Past performance is not predictive of future performance. |
| The above graph compares a $10,000 investment made in Class A, Class C and Class I shares of Dreyfus Emerging |
| Asia Fund on 12/13/07 (inception date) to a $10,000 investment made in the MSCI Emerging Markets Asia Index |
| (the “Index”) on that date.All dividends and capital gain distributions are reinvested. |
| The fund’s performance shown in the line graph above takes into account the maximum initial sales charge on Class A |
| shares and all other applicable fees and expenses on all classes.The Index is a free-float adjusted market capitalization |
| weighted index designed to measure equity market performance in the emerging market countries of Asia. Unlike a |
| mutual fund, the Index is not subject to charges, fees and other expenses. Investors cannot invest directly in any index. |
| Further information relating to fund performance, including expense reimbursements, if applicable, is contained in the |
| Financial Highlights section of the prospectus and elsewhere in this report. |
6
| Average Annual Total Returns as of 10/31/11 | |||||
| Inception | From | ||||
| Date | 1Year | Inception | |||
| Class A shares | |||||
| with maximum sales charge (5.75%) | 12/13/07 | –38.39% | –10.99% | ||
| without sales charge | 12/13/07 | –34.63% | –9.63% | ||
| Class C shares | |||||
| with applicable redemption charge † | 12/13/07 | –35.78% | –10.35% | ||
| without redemption | 12/13/07 | –35.13% | –10.35% | ||
| Class I shares | 12/13/07 | –34.41% | –9.46% | ||
| MSCI Emerging Markets Asia Index | 11/30/07 | –6.60% | –3.60%†† | ||
Past performance is not predictive of future performance.The fund’s performance shown in the graph and table does not reflect the deduction of taxes that a shareholder would pay on fund distributions or the redemption of fund shares.
| † | The maximum contingent deferred sales charge for Class C shares is 1% for shares redeemed within one year of the |
| date of purchase. | |
| †† | For comparative purposes, the value of the Index as of 11/30/07 is used as the beginning value on 12/13/07. |
| The Fund | 7 |
UNDERSTANDING YOUR FUND’S EXPENSES (Unaudited)
As a mutual fund investor, you pay ongoing expenses, such as management fees and other expenses. Using the information below, you can estimate how these expenses affect your investment and compare them with the expenses of other funds.You also may pay one-time transaction expenses, including sales charges (loads) and redemption fees, which are not shown in this section and would have resulted in higher total expenses. For more information, see your fund’s prospectus or talk to your financial adviser.
Review your fund’s expenses
The table below shows the expenses you would have paid on a $1,000 investment in Dreyfus Emerging Asia Fund from May 1, 2011 to October 31, 2011. It also shows how much a $1,000 investment would be worth at the close of the period, assuming actual returns and expenses.
Expenses and Value of a $1,000 Investment
assuming actual returns for the six months ended October 31, 2011
| Class A | Class C | Class I | ||||
| Expenses paid per $1,000† | $8.53 | $11.71 | $7.47 | |||
| Ending value (after expenses) | $692.90 | $689.70 | $693.30 |
COMPARING YOUR FUND’S EXPENSES
WITH THOSE OF OTHER FUNDS (Unaudited)
Using the SEC’s method to compare expenses
The Securities and Exchange Commission (SEC) has established guidelines to help investors assess fund expenses. Per these guidelines, the table below shows your fund’s expenses based on a $1,000 investment, assuming a hypothetical 5% annualized return. You can use this information to compare the ongoing expenses (but not transaction expenses or total cost) of investing in the fund with those of other funds.All mutual fund shareholder reports will provide this information to help you make this comparison. Please note that you cannot use this information to estimate your actual ending account balance and expenses paid during the period.
Expenses and Value of a $1,000 Investment
assuming a hypothetical 5% annualized return for the six months ended October 31, 2011
| Class A | Class C | Class I | ||||
| Expenses paid per $1,000† | $10.16 | $13.94 | $8.89 | |||
| Ending value (after expenses) | $1,015.12 | $1,011.34 | $1,016.38 |
| † Expenses are equal to the fund’s annualized expense ratio of 2.00% for Class A, 2.75% for Class C and 1.75% |
| for Class I, multiplied by the average account value over the period, multiplied by 184/365 (to reflect the one-half |
| year period). |
8
| STATEMENT OF INVESTMENTS |
| October 31, 2011 |
| Common Stocks—94.4% | Shares | Value ($) | ||
| China—31.7% | ||||
| Agricultural Bank of China, Cl. H | 3,550,000 | 1,563,947 | ||
| Anhui Conch Cement, Cl. H | 180,000 | 654,308 | ||
| Bank of China, Cl. H | 4,100,000 | 1,446,119 | ||
| Beijing Capital Land, Cl. H | 4,428,000 | 1,126,165 | ||
| China Shenhua Energy, Cl. H | 300,000 | 1,373,412 | ||
| China ZhengTong Auto Services Holdings | 900,000 | a | 952,895 | |
| CITIC Securities | 826,000b | 1,645,876 | ||
| Far East Horizon | 911,000 | 659,907 | ||
| Hilong Holding | 3,741,000 | 743,183 | ||
| Hunan Non-Ferrous Metal, Cl. H | 6,764,000 | a | 1,863,921 | |
| Maoye International Holdings | 4,021,000 | a | 1,102,529 | |
| Ping An Insurance Group, Cl. H | 179,000 | 1,297,114 | ||
| Sany Heavy Equipment International Holdings | 1,027,000 | 884,720 | ||
| Shanghai Friendship Group, Cl. B | 804,865 | a | 1,211,987 | |
| Sunny Optical Technology Group | 3,142,000 | 726,932 | ||
| Visionchina Media, ADR | 548,700 | a | 987,660 | |
| Zijin Mining Group, Cl. H | 3,468,000 | 1,439,349 | ||
| 19,680,024 | ||||
| Hong Kong—11.1% | ||||
| Belle International Holdings | 641,000 | 1,236,801 | ||
| China Foods | 750,000 | 589,681 | ||
| China Resources Cement Holdings | 846,000 | 670,849 | ||
| China State Construction International Holdings | 3,108,000 | 2,340,139 | ||
| CIMC Enric Holdings | 4,460,000 | a | 1,476,209 | |
| Lifestyle International Holdings | 221,000 | 591,416 | ||
| 6,905,095 | ||||
| India—18.8% | ||||
| Brushman India, GDR | 300,000 | a | 18,600 | |
| Country Club India | 2,516,353 | 450,121 | ||
| Hinduja Ventures | 200,000 | 1,368,417 | ||
| IDBI Bank | 410,000 | 981,130 | ||
| IFCI | 1,800,000 | 1,209,276 | ||
| Jai Balaji Industries | 425,000 | 772,587 | ||
| Larsen & Toubro | 22,000 | 635,621 | ||
| Reliance Infrastructure | 140,000 | 1,323,687 | ||
| SREI Infrastructure Finance | 2,429,480 | 1,772,671 | ||
| The Fund | 9 |
STATEMENT OF INVESTMENTS (continued)
| Common Stocks (continued) | Shares | Value ($) | ||
| India (continued) | ||||
| Tata Motors | 625,000 | 2,528,238 | ||
| Yes Bank | 100,000 | 640,823 | ||
| 11,701,171 | ||||
| Indonesia—5.3% | ||||
| Alam Sutera Realty | 28,863,500 | 1,388,213 | ||
| Indomobil Sukses Internasional | 890,000 | a | 1,218,123 | |
| Mitra Adiperkasa | 1,251,000 | 685,231 | ||
| 3,291,567 | ||||
| Philippines—2.6% | ||||
| Security Bank | 502,550 | 1,022,102 | ||
| Semirara Mining | 123,550 | 612,478 | ||
| 1,634,580 | ||||
| South Korea—10.6% | ||||
| Daum Communications | 4,593 | �� | 557,237 | |
| Hynix Semiconductor | 56,000 | 1,143,431 | ||
| Hyundai Mobis | 3,988 | 1,150,680 | ||
| NHN | 2,800a | 584,565 | ||
| S-Oil | 12,400 | 1,272,601 | ||
| Seegene | 11,000a | 708,016 | ||
| SFA Engineering | 25,000 | 1,153,934 | ||
| 6,570,464 | ||||
| Taiwan—13.2% | ||||
| AU Optronics | 1,400,000 | 603,724 | ||
| Cheng Uei Precision Industry | 262,000 | 590,229 | ||
| China Petrochemical Development | 1,482,000 | 1,717,024 | ||
| Hon Hai Precision Industry | 563,000 | 1,549,523 | ||
| Largan Precision | 35,000 | 776,843 | ||
| Lumax International | 486,000 | 1,114,717 | ||
| PChome Online | 176,000 | 1,153,454 | ||
| St. Shine Optical | 56,000 | 700,551 | ||
| 8,206,065 | ||||
| Thailand—1.1% | ||||
| Total Access Communication, NVDR | 276,800 | 663,734 | ||
| Total Common Stocks | ||||
| (cost $66,419,903) | 58,652,700 | |||
10
| Warrants—6.0% | Shares | Value ($) | ||||
| India | ||||||
| Microsec Financial Services (5/5/14) | 800,000 | a | 506,160 | |||
| Prime Focus (10/24/12) | 2,036,000 | a,c | 2,336,204 | |||
| PTC India Financial Services (10/24/12) | 2,940,000 | a,c | 910,213 | |||
| Total Warrants | ||||||
| (cost $7,031,201) | 3,752,577 | |||||
| Other Investment—1.8% | ||||||
| Registered Investment Company; | ||||||
| Dreyfus Institutional Preferred | ||||||
| Plus Money Market Fund | ||||||
| (cost $1,104,000) | 1,104,000 | d | 1,104,000 | |||
| Total Investments (cost $74,555,104) | 102.2 | % | 63,509,277 | |||
| Liabilities, Less Cash and Receivables | (2.2 | %) | (1,373,097) | |||
| Net Assets | 100.0 | % | 62,136,180 | |||
| ADR—American Depository Receipts |
| GDR—Global Depository Receipts |
| NVDR—Non Voting Depository Receipts |
| a Non-income producing security. |
| b Security exempt from registration under Rule 144A of the Securities Act of 1933.This security may be resold in |
| transactions exempt from registration, normally to qualified institutional buyers.At October 31, 2011, this security |
| was valued at $1,645,876 or 2.6% of net assets. |
| c The valuation of these securities has been determined in good faith by management under the direction of the Board |
| of Directors.At October 31, 2011, the value of these securities amounted to $3,246,417 or 5.2% of net assets. |
| d Investment in affiliated money market mutual fund. |
| Portfolio Summary (Unaudited)† | |||
| Value (%) | Value (%) | ||
| Financial | 26.0 | Consumer Staples | 2.9 |
| Industrial | 20.6 | Utilities | 2.1 |
| Consumer Discretionary | 16.4 | Telecommunication Services | 2.0 |
| Information Technology | 12.5 | Money Market Investment | 1.8 |
| Materials | 8.6 | Health Care | 1.1 |
| Energy | 8.2 | 102.2 | |
| † Based on net assets. | |||
| See notes to financial statements. | |||
| The Fund | 11 |
| STATEMENT OF ASSETS AND LIABILITIES |
| October 31, 2011 |
| Cost | Value | |||
| Assets ($): | ||||
| Investments in securities—See Statement of Investments: | ||||
| Unaffiliated issuers | 73,451,104 | 62,405,277 | ||
| Affiliated issuers | 1,104,000 | 1,104,000 | ||
| Cash denominated in foreign currencies | 2,557,866 | 2,561,008 | ||
| Receivable for investment securities sold | 2,127,012 | |||
| Receivable for shares of Common Stock subscribed | 173,618 | |||
| Unrealized appreciation on forward foreign | ||||
| currency exchange contracts—Note 4 | 16 | |||
| Dividends receivable | 12 | |||
| Prepaid expenses | 40,607 | |||
| 68,411,550 | ||||
| Liabilities ($): | ||||
| Due to The Dreyfus Corporation and affiliates—Note 3(c) | 131,176 | |||
| Cash overdraft due to Custodian | 2,445,861 | |||
| Payable for investment securities purchased | 3,018,332 | |||
| Payable for shares of Common Stock redeemed | 595,846 | |||
| Unrealized depreciation on forward foreign | ||||
| currency exchange contracts—Note 4 | 1,683 | |||
| Accrued expenses | 82,472 | |||
| 6,275,370 | ||||
| Net Assets ($) | 62,136,180 | |||
| Composition of Net Assets ($): | ||||
| Paid-in capital | 78,037,193 | |||
| Accumulated investment (loss)—net | (143,842) | |||
| Accumulated net realized gain (loss) on investments | (4,709,904) | |||
| Accumulated net unrealized appreciation (depreciation) | ||||
| on investments and foreign currency transactions | (11,047,267) | |||
| Net Assets ($) | 62,136,180 | |||
| Net Asset Value Per Share | ||||
| Class A | Class C | Class I | ||
| Net Assets ($) | 32,000,141 | 12,663,311 | 17,472,728 | |
| Shares Outstanding | 3,792,185 | 1,548,102 | 2,055,736 | |
| Net Asset Value Per Share ($) | 8.44 | 8.18 | 8.50 | |
| See notes to financial statements. | ||||
12
| STATEMENT OF OPERATIONS |
| Year Ended October 31, 2011 |
| Investment Income ($): | ||
| Income: | ||
| Cash dividends (net of $104,186 foreign taxes withheld at source): | ||
| Unaffiliated issuers | 1,341,295 | |
| Affiliated issuers | 1,257 | |
| Total Income | 1,342,552 | |
| Expenses: | ||
| Management fee—Note 3(a) | 1,351,598 | |
| Shareholder servicing costs—Note 3(c) | 358,811 | |
| Custodian fees—Note 3(c) | 176,371 | |
| Distribution fees—Note 3(b) | 170,807 | |
| Professional fees | 73,374 | |
| Registration fees | 43,449 | |
| Prospectus and shareholders’ reports | 24,505 | |
| Directors’ fees and expenses—Note 3(d) | 14,693 | |
| Interest expense—Note 2 | 7,186 | |
| Loan commitment fees—Note 2 | 3,112 | |
| Miscellaneous | 23,685 | |
| Total Expenses | 2,247,591 | |
| Less—reduction in fees due to earnings credits—Note 3(c) | (181) | |
| Net Expenses | 2,247,410 | |
| Investment (Loss)—Net | (904,858) | |
| Realized and Unrealized Gain (Loss) on Investments—Note 4 ($): | ||
| Net realized gain (loss) on investments and foreign currency transactions | (3,715,711) | |
| Net realized gain (loss) on forward foreign currency exchange contracts | (527,743) | |
| Net Realized Gain (Loss) | (4,243,454) | |
| Net unrealized appreciation (depreciation) on | ||
| investments and foreign currency transactions | (36,208,085) | |
| Net unrealized appreciation (depreciation) on | ||
| forward foreign currency exchange contracts | (1,893) | |
| Net Unrealized Appreciation (Depreciation) | (36,209,978) | |
| Net Realized and Unrealized Gain (Loss) on Investments | (40,453,432) | |
| Net (Decrease) in Net Assets Resulting from Operations | (41,358,290) | |
| See notes to financial statements. | ||
| The Fund | 13 |
STATEMENT OF CHANGES IN NET ASSETS
| Year Ended October 31, | ||||
| 2011 | 2010 | |||
| Operations ($): | ||||
| Investment (loss)—net | (904,858) | (279,812) | ||
| Net realized gain (loss) on investments | (4,243,454) | 5,082,706 | ||
| Net unrealized appreciation | ||||
| (depreciation) on investments | (36,209,978) | 20,223,100 | ||
| Net Increase (Decrease) in Net Assets | ||||
| Resulting from Operations | (41,358,290) | 25,025,994 | ||
| Capital Stock Transactions ($): | ||||
| Net proceeds from shares sold: | ||||
| Class A Shares | 19,323,900 | 59,099,369 | ||
| Class C Shares | 4,601,691 | 21,383,548 | ||
| Class I Shares | 15,439,575 | 47,012,937 | ||
| Cost of shares redeemed: | ||||
| Class A Shares | (47,585,139) | (49,892,436) | ||
| Class C Shares | (15,266,710) | (9,366,948) | ||
| Class I Shares | (25,248,631) | (32,228,061) | ||
| Increase (Decrease) in Net Assets | ||||
| from Capital Stock Transactions | (48,735,314) | 36,008,409 | ||
| Total Increase (Decrease) in Net Assets | (90,093,604) | 61,034,403 | ||
| Net Assets ($): | ||||
| Beginning of Period | 152,229,784 | 91,195,381 | ||
| End of Period | 62,136,180 | 152,229,784 | ||
| Accumulated investment (loss)—net | (143,842) | (632,544) | ||
| Capital Share Transactions (Shares): | ||||
| Class A | ||||
| Shares sold | 1,645,828 | 5,194,238 | ||
| Shares redeemed | (4,185,595) | (4,525,022) | ||
| Net Increase (Decrease) in Shares Outstanding | (2,539,767) | 669,216 | ||
| Class C | ||||
| Shares sold | 386,837 | 1,926,771 | ||
| Shares redeemed | (1,389,835) | (857,793) | ||
| Net Increase (Decrease) in Shares Outstanding | (1,002,998) | 1,068,978 | ||
| Class I | ||||
| Shares sold | 1,346,404 | 4,128,721 | ||
| Shares redeemed | (2,250,712) | (2,866,275) | ||
| Net Increase (Decrease) in Shares Outstanding | (904,308) | 1,262,446 | ||
| See notes to financial statements. | ||||
14
FINANCIAL HIGHLIGHTS
The following tables describe the performance for each share class for the fiscal periods indicated.All information (except portfolio turnover rate) reflects financial results for a single fund share.Total return shows how much your investment in the fund would have increased (or decreased) during each period, assuming you had reinvested all dividends and distributions.These figures have been derived from the fund’s financial statements.
| Year Ended October 31, | ||||||||
| Class A Shares | 2011 | 2010 | 2009 | 2008a | ||||
| Per Share Data ($): | ||||||||
| Net asset value, beginning of period | 12.90 | 10.34 | 4.01 | 12.50 | ||||
| Investment Operations: | ||||||||
| Investment income (loss)—netb | (.09) | (.02) | (.02) | .08 | ||||
| Net realized and unrealized | ||||||||
| gain (loss) on investments | (4.38) | 2.57 | 6.33 | (8.57) | ||||
| Total from Investment Operations | (4.47) | 2.55 | 6.31 | (8.49) | ||||
| Proceeds from redemption fees | .01 | .01 | .02 | — | ||||
| Net asset value, end of period | 8.44 | 12.90 | 10.34 | 4.01 | ||||
| Total Return (%)c | (34.63) | 24.86 | 158.50 | (68.00)d | ||||
| Ratios/Supplemental Data (%): | ||||||||
| Ratio of total expenses to average net assets | 1.99 | 2.05 | 2.80 | 3.31e | ||||
| Ratio of net expenses to average net assets | 1.99 | 1.95 | 2.00 | 2.00e | ||||
| Ratio of net investment income | ||||||||
| (loss) to average net assets | (.77) | (.17) | (.29) | 1.03e | ||||
| Portfolio Turnover Rate | 131.78 | 75.72 | 100.74 | 217.53d | ||||
| Net Assets, end of period ($ x 1,000) | 32,000 | 81,709 | 58,548 | 5,528 | ||||
| a | From December 13, 2007 (commencement of operations) to October 31, 2008. |
| b | Based on average shares outstanding at each month end. |
| c | Exclusive of sales charge. |
| d | Annualized. |
| e | Not annualized. |
See notes to financial statements.
| The Fund | 15 |
FINANCIAL HIGHLIGHTS (continued)
| Year Ended October 31, | ||||||||
| Class C Shares | 2011 | 2010 | 2009 | 2008a | ||||
| Per Share Data ($): | ||||||||
| Net asset value, beginning of period | 12.61 | 10.18 | 3.98 | 12.50 | ||||
| Investment Operations: | ||||||||
| Investment income (loss)—netb | (.17) | (.09) | (.08) | .02 | ||||
| Net realized and unrealized | ||||||||
| gain (loss) on investments | (4.27) | 2.51 | 6.27 | (8.54) | ||||
| Total from Investment Operations | (4.44) | 2.42 | 6.19 | (8.52) | ||||
| Proceeds from redemption fees | .01 | .01 | .01 | — | ||||
| Net asset value, end of period | 8.18 | 12.61 | 10.18 | 3.98 | ||||
| Total Return (%)c | (35.13) | 23.87 | 155.78 | (68.16)d | ||||
| Ratios/Supplemental Data (%): | ||||||||
| Ratio of total expenses to average net assets | 2.75 | 2.77 | 3.71 | 4.08e | ||||
| Ratio of net expenses to average net assets | 2.75 | 2.70 | 2.75 | 2.75e | ||||
| Ratio of net investment income | ||||||||
| (loss) to average net assets | (1.51) | (.83) | (.98) | .31e | ||||
| Portfolio Turnover Rate | 131.78 | 75.72 | 100.74 | 217.53d | ||||
| Net Assets, end of period ($ x 1,000) | 12,663 | 32,166 | 15,090 | 2,233 | ||||
| a | From December 13, 2007 (commencement of operations) to October 31, 2008. |
| b | Based on average shares outstanding at each month end. |
| c | Exclusive of sales charge. |
| d | Annualized. |
| e | Not annualized. |
See notes to financial statements.
16
| Year Ended October 31, | |||||||
| Class I Shares | 2011 | 2010 | 2009 | 2008a | |||
| Per Share Data ($): | |||||||
| Net asset value, beginning of period | 12.96 | 10.34 | 4.00 | 12.50 | |||
| Investment Operations: | |||||||
| Investment income (loss)—netb | (.05) | .01 | (.03) | .02 | |||
| Net realized and unrealized | |||||||
| gain (loss) on investments | (4.42) | 2.60 | 6.35 | (8.52) | |||
| Total from Investment Operations | (4.47) | 2.61 | 6.32 | (8.50) | |||
| Proceeds from redemption fees | .01 | .01 | .02 | — | |||
| Net asset value, end of period | 8.50 | 12.96 | 10.34 | 4.00 | |||
| Total Return (%) | (34.41) | 25.34 | 158.50 | (68.00)c | |||
| Ratios/Supplemental Data (%): | |||||||
| Ratio of total expenses to average net assets | 1.72 | 1.74 | 2.05 | 2.86d | |||
| Ratio of net expenses to average net assets | 1.72 | 1.69 | 1.75 | 1.75d | |||
| Ratio of net investment income | |||||||
| (loss) to average net assets | (.43) | .13 | (.31) | .29d | |||
| Portfolio Turnover Rate | 131.78 | 75.72 | 100.74 | 217.53c | |||
| Net Assets, end of period ($ x 1,000) | 17,473 | 38,356 | 17,558 | 100 | |||
| a | From December 13, 2007 (commencement of operations) to October 31, 2008. |
| b | Based on average shares outstanding at each month end. |
| c | Annualized. |
| d | Not annualized. |
See notes to financial statements.
| The Fund | 17 |
NOTES TO FINANCIAL STATEMENTS
NOTE 1—Significant Accounting Policies:
Dreyfus Emerging Asia Fund (the “fund”) is a separate non-diversified series of Dreyfus Premier Investment Funds, Inc. (the “Company”), which is registered under the Investment Company Act of 1940, as amended (the “Act”), as an open-end management investment company and operates as a series company currently offering nine series, including the fund. The fund’s investment objective is to seek long-term capital appreciation.The Dreyfus Corporation (the “Manager” or “Dreyfus”), a wholly-owned subsidiary of The Bank of New York Mellon Corporation (“BNY Mellon”), serves as the fund’s investment adviser. Hamon Asian Advisors Ltd. (“Hamon”) serves as the fund’s sub-investment adviser. Effective November 4, 2011, Hamon U.S. Investment Advisors Ltd. changed the company’s name to Hamon Asian Advisors Ltd. Hamon is an affiliate of Dreyfus.
MBSC Securities Corporation (the “Distributor”), a wholly-owned subsidiary of Dreyfus, is the distributor of the fund’s shares.The fund is authorized to issue 800 million shares of $.001 par value Common Stock. The fund currently offers three classes of shares: Class A (300 million shares authorized), Class C (250 million shares authorized), and Class I (250 million shares authorized). Class A shares are subject to a sales charge imposed at the time of purchase. Class C shares are subject to a contingent deferred sales charge (“CDSC”) imposed on Class C shares redeemed within one year of purchase. Class I shares are sold at net asset value per share only to institutional investors. Other differences between the classes include the services offered to and the expenses borne by each class, the allocation of certain transfer agency costs and certain voting rights. Income, expenses (other than expenses attributable to a specific class) and realized and unrealized gains or losses on investments are allocated to each class of shares based on its relative net assets.
The Company accounts separately for the assets, liabilities and operations of each series. Expenses directly attributable to each series are
18
charged to that series’ operations; expenses which are applicable to all series are allocated among them on a pro rata basis.
The Financial Accounting Standards Board (“FASB”) Accounting Standards Codification (“ASC”) is the exclusive reference of authoritative U.S. generally accepted accounting principles (“GAAP”) recognized by the FASB to be applied by nongovernmental entities. Rules and interpretive releases of the Securities and Exchange Commission (“SEC”) under authority of federal laws are also sources of authoritative GAAP for SEC registrants. The fund’s financial statements are prepared in accordance with GAAP, which may require the use of management estimates and assumptions.Actual results could differ from those estimates.
The Company enters into contracts that contain a variety of indemnifications.The fund’s maximum exposure under these arrangements is unknown.The fund does not anticipate recognizing any loss related to these arrangements.
(a) Portfolio valuation: The fair value of a financial instrument is the amount that would be received to sell an asset or paid to transfer a liability in an orderly transaction between market participants at the measurement date (i.e. the exit price). GAAP establishes a fair value hierarchy that prioritizes the inputs of valuation techniques used to measure fair value.This hierarchy gives the highest priority to unadjusted quoted prices in active markets for identical assets or liabilities (Level 1 measurements) and the lowest priority to unobservable inputs (Level 3 measurements).
Additionally, GAAP provides guidance on determining whether the volume and activity in a market has decreased significantly and whether such a decrease in activity results in transactions that are not orderly. GAAP requires enhanced disclosures around valuation inputs and techniques used during annual and interim periods.
| The Fund | 19 |
NOTES TO FINANCIAL STATEMENTS (continued)
Various inputs are used in determining the value of the fund’s investments relating to fair value measurements.These inputs are summarized in the three broad levels listed below:
Level 1—unadjusted quoted prices in active markets for identical investments.
Level 2—other significant observable inputs (including quoted prices for similar investments, interest rates, prepayment speeds, credit risk, etc.).
Level 3—significant unobservable inputs (including the fund’s own assumptions in determining the fair value of investments).
The inputs or methodology used for valuing securities are not necessarily an indication of the risk associated with investing in those securities.
Changes in valuation techniques may result in transfers in or out of an assigned level within the disclosure hierarchy. Valuation techniques used to value the fund’s investments are as follows:
Investments in securities are valued at the last sales price on the securities exchange or national securities market on which such securities are primarily traded. Securities listed on the National Market System for which market quotations are available are valued at the official closing price or, if there is no official closing price that day, at the last sales price. Securities not listed on an exchange or the national securities market, or securities for which there were no transactions, are valued at the average of the most recent bid and asked prices, except for open short positions, where the asked price is used for valuation purposes. Bid price is used when no asked price is available. Registered investment companies that are not traded on an exchange are valued at their net asset value.All preceding securities are categorized within Level 1 of the fair value hierarchy.
20
Fair valuing of securities may be determined with the assistance of a pricing service using calculations based on indices of domestic securities and other appropriate indicators, such as prices of relevant ADRs and futures contracts. Utilizing these techniques may result in transfers between Level 1 and Level 2 of the fair value hierarchy.
When market quotations or official closing prices are not readily available, or are determined not to reflect accurately fair value, such as when the value of a security has been significantly affected by events after the close of the exchange or market on which the security is principally traded (for example, a foreign exchange or market), but before the fund calculates its net asset value, the fund may value these investments at fair value as determined in accordance with the procedures approved by the Board of Directors. Certain factors may be considered when fair valuing investments such as: fundamental analytical data, the nature and duration of restrictions on disposition, an evaluation of the forces that influence the market in which the securities are purchased and sold, and public trading in similar securities of the issuer or comparable issuers. These securities are either categorized as Level 2 or 3 depending on the relevant inputs used.
For restricted securities where observable inputs are limited, assumptions about market activity and risk are used and are categorized within Level 3 of the fair value hierarchy.
Investments denominated in foreign currencies are translated to U.S. dollars at the prevailing rates of exchange. Forward foreign currency exchange contracts (“forward contracts”) are valued at the forward rate. These securities are generally categorized within Level 2 of the fair value hierarchy.
| The Fund | 21 |
NOTES TO FINANCIAL STATEMENTS (continued)
The following is a summary of the inputs used as of October 31, 2011 in valuing the fund’s investments:
| Level 2—Other | Level 3— | |||||
| Level 1— | Significant | Significant | ||||
| Unadjusted | Observable | Unobservable | ||||
| Quoted Prices | Inputs | Inputs | Total | |||
| Assets ($) | ||||||
| Investments in Securities: | ||||||
| Equity Securities— | ||||||
| Foreign† | 987,660 | 57,665,040 | †† | — | 58,652,700 | |
| Mutual Funds | 1,104,000 | — | — | 1,104,000 | ||
| Other Financial | ||||||
| Instruments: | ||||||
| Forward Foreign | ||||||
| Currency Exchange | ||||||
| Contracts††† | — | 16 | — | 16 | ||
| Warrants† | 506,160 | 3,246,417 | — | 3,752,577 | ||
| Liabilities ($) | ||||||
| Other Financial | ||||||
| Instruments: | ||||||
| Forward Foreign | ||||||
| Currency Exchange | ||||||
| Contracts††† | — | (1,683 | ) | — | (1,683 | ) |
| † | See Statement of Investments for additional detailed categorizations. |
| †† | Securities classified as Level 2 at period end as the values were determined pursuant to the fund’s |
| fair valuation procedures. | |
| ††† Amount shown represents unrealized appreciation (depreciation) at period end. | |
The following is a reconciliation of Level 3 assets for which significant unobservable inputs were used to determine fair value
| Investments in | ||
| Equity Securities—Foreign ($) | ||
| Balance as of 10/31/2010 | 3,179,328 | |
| Realized gain (loss) | — | |
| Change in unrealized appreciation (depreciation) | — | |
| Purchases | — | |
| Sales | — | |
| Transfers into Level 3 | — | |
| Transfers out of Level 3†††† | (3,179,328) | |
| Balance as of 10/31/2011 | — | |
| The amount of total gains (losses) for the | ||
| period included in earnings attributable to | ||
| the change in unrealized gains (losses) relating | ||
| to investments still held at 10/31/2011 | — | |
| †††† | Transfers out of Level 3 represent the value at the date of transfer.The transfer out of Level 3 |
| for the current period was due to the resumption of trading of a security. |
22
In May 2011, FASB issued Accounting Standards Update (“ASU”) No. 2011-04 “Amendments to Achieve Common FairValue Measurement and Disclosure Requirements in GAAP and International Financial Reporting Standards (“IFRS”)” (“ASU 2011-04”). ASU 2011-04 includes common requirements for measurement of and disclosure about fair value between GAAP and IFRS. ASU 2011-04 will require reporting entities to disclose the following information for fair value measurements categorized within Level 3 of the fair value hierarchy: quantitative information about the unobservable inputs used in the fair value measurement, the valuation processes used by the reporting entity and a narrative description of the sensitivity of the fair value measurement to changes in unobservable inputs and the interrelationships between those unobservable inputs. In addition, ASU 2011-04 will require reporting entities to make disclosures about amounts and reasons for all transfers in and out of Level 1 and Level 2 fair value mea-surements.The new and revised disclosures are effective for interim and annual reporting periods beginning after December 15, 2011. At this time, management is evaluating the implications of ASU 2011-04 and its impact on the financial statements.
(b) Foreign currency transactions: The fund does not isolate that portion of the results of operations resulting from changes in foreign exchange rates on investments from the fluctuations arising from changes in market prices of securities held. Such fluctuations are included with the net realized and unrealized gain or loss on investments.
Net realized foreign exchange gains or losses arise from sales of foreign currencies, currency gains or losses realized on securities transactions between trade and settlement date and the difference between the amounts of dividends, interest and foreign withholding taxes recorded on the fund’s books and the U.S. dollar equivalent of the amounts actually received or paid. Net unrealized foreign exchange gains and losses arise from changes in the value of assets and liabilities other than investments resulting from changes in exchange rates. Foreign currency gains and losses on investments are included with net realized and unrealized gain or loss on investments.
| The Fund | 23 |
NOTES TO FINANCIAL STATEMENTS (continued)
(c) Securities transactions and investment income: Securities transactions are recorded on a trade date basis. Realized gains and losses from securities transactions are recorded on the identified cost basis. Dividend income is recognized on the ex-dividend date and interest income, including, where applicable, accretion of discount and amortization of premium on investments, is recognized on the accrual basis.
The fund follows an investment policy of investing primarily in Asian emerging market countries. Because the fund’s investments are concentrated in Asian emerging market countries, the fund’s performance is expected to be closely tied to social, political and economic conditions within Asia and to be more volatile than the performance of more geographically diversified funds.
Investing in foreign markets may involve special risks and considerations not typically associated with investing in the U.S. These risks include revaluation of currencies, high rates of inflation, repatriation restrictions on income and capital, and adverse political and economic developments. Moreover, securities issued in these markets may be less liquid, subject to government ownership controls and delayed settlements, and their prices may be more volatile than those of comparable securities in the U.S.
(d) Affiliated issuers: Investments in other investment companies advised by Dreyfus are defined as “affiliated” in the Act.
The fund may invest in shares of certain affiliated investment companies also advised or managed by Dreyfus. Investments in affiliated investment companies for the period ended October 31, 2011 were as follows:
| Affiliated | |||||||
| Investment | Value | Value | Net | ||||
| Company | 10/31/2010 ($) | Purchases ($) | Sales ($) | 10/31/2011 ($) | Assets (%) | ||
| Dreyfus | |||||||
| Institutional | |||||||
| Preferred | |||||||
| Plus Money | |||||||
| Market Fund | 1,900,000 | 74,857,000 | 75,653,000 | 1,104,000 | 1.8 |
(e) Dividends to shareholders: Dividends are recorded on the ex-dividend date. Dividends from investment income-net and dividends from
24
net realized capital gains, if any, are normally declared and paid annually, but the fund may make distributions on a more frequent basis to comply with the distribution requirements of the Internal Revenue Code of 1986, as amended (the “Code”).To the extent that net realized capital gains can be offset by capital loss carryovers, it is the policy of the fund not to distribute such gains. Income and capital gain distributions are determined in accordance with income tax regulations, which may differ from GAAP.
(f) Federal income taxes: It is the policy of the fund to continue to qualify as a regulated investment company, if such qualification is in the best interests of its shareholders, by complying with the applicable provisions of the Code, and to make distributions of taxable income sufficient to relieve it from substantially all federal income and excise taxes.
As of and during the period ended October 31, 2011, the fund did not have any liabilities for any uncertain tax positions.The fund recognizes interest and penalties, if any, related to uncertain tax positions as income tax expense in the Statement of Operations. During the period, the fund did not incur any interest or penalties.
Each of the tax years in the four-year period ended October 31, 2011 remains subject to examination by the Internal Revenue Service and state taxing authorities.
At October 31, 2011, the components of accumulated earnings on a tax basis were as follows: accumulated capital losses $4,552,649 and unrealized depreciation $11,348,364.
The accumulated capital loss carryover is available for federal income tax purposes to be applied against future net securities profits, if any, realized subsequent to October 31, 2011. If not applied, $938,643 of the carryover expires in fiscal 2016 and $3,614,006 expires in fiscal 2019.
Under the recently enacted Regulated Investment Company Modernization Act of 2010 (the “2010 Act”), the fund will be permitted to carry forward capital losses incurred in taxable years beginning after December 22, 2010 (“post-enactment losses”) for an unlimited
| The Fund | 25 |
NOTES TO FINANCIAL STATEMENTS (continued)
period. However, the 2010 Act requires post-enactment losses to be utilized before the utilization of losses incurred in taxable years prior to the effective date of the 2010 Act. As a result of this ordering rule, capital loss carryovers related to taxable years beginning prior to the effective date of the 2010 Act may be more likely to expire unused.
During the period ended October 31, 2011, as a result of permanent book to tax differences, primarily due to the tax treatment for foreign currency gains and losses and net operating losses, the fund increased accumulated undistributed investment income-net by $1,393,560, increased accumulated net realized gain (loss) on investments by $648,018 and decreased paid-in capital by $2,041,578. Net assets and net asset value per share were not affected by this reclassification.
NOTE 2—Bank Lines of Credit:
The fund participates with other Dreyfus-managed funds in a $225 million unsecured credit facility led by Citibank, N.A. and a $300 million unsecured credit facility provided by The Bank of NewYork Mellon, a subsidiary of BNY Mellon and an affiliate of Dreyfus (each, a “Facility”), each to be utilized primarily for temporary or emergency purposes, including the financing of redemptions. In connection therewith, the fund has agreed to pay its pro rata portion of commitment fees for each Facility. Interest is charged to the fund based on rates determined pursuant to the terms of the respective Facility at the time of borrowing.
The average amount of borrowings outstanding under the Facilities during the period ended October 31, 2011, was approximately $500,000, with a related weighted average annualized interest rate of 1.44%.
NOTE 3—Management Fee, Sub-Investment Advisory Fee and Other Transactions with Affiliates:
(a) Pursuant to a management agreement with Dreyfus, the management fee is computed at the annual rate of 1.25% of the value of the fund’s average daily net assets and is payable monthly.
26
Dreyfus had contractually agreed, until December 8, 2011, to waive receipt of its fees and/or assume the expenses of the fund so that the direct expenses of none of the classes (excluding Rule 12b-1 distribution plan fees, shareholder services fees, taxes, interest expense, brokerage commissions, commitment fees on borrowings and extraordinary expenses) exceed 1.75% of the value of the fund’s average daily net assets. Dreyfus has contractually agreed, from December 9, 2011 through July 31, 2012, to waive receipt of its fees and/or assume the expenses of the fund so that the direct expenses of none of the classes (excluding certain expenses as shown above) exceed 1.65% of the value of the fund’s average daily net assets. At October 31, 2011, there was no reduction in management fee, pursuant to the undertaking.
Pursuant to a sub-investment advisory agreement between Dreyfus and Hamon, Dreyfus pays Hamon a fee at the annual rate of .625% of the value of the fund’s average daily net assets and is payable monthly.
During the period ended October 31, 2011, the Distributor retained $27,298 from commissions earned on sales of the fund’s Class A shares and $49,006 from CDSCs on redemptions of the fund’s Class C shares.
(b) Under the Distribution Plan (the “Plan”) adopted pursuant to Rule 12b-1 under the Act, Class C shares pay the Distributor for distributing its shares at an annual rate of .75% of the value of the average daily net assets of Class C shares. During the period ended October 31, 2011, Class C shares were charged $170,807 pursuant to the Plan.
(c) Under the Shareholder Services Plan, Class A and Class C shares pay the Distributor at an annual rate of .25% of the value of their average daily net assets for the provision of certain services.The services provided may include personal services relating to shareholder accounts, such as answering shareholder inquiries regarding the fund and providing reports and other information, and services related to
| The Fund | 27 |
NOTES TO FINANCIAL STATEMENTS (continued)
the maintenance of shareholder accounts. The Distributor may make payments to Service Agents (a securities dealer, financial institution or other industry professional) in respect of these services. The Distributor determines the amounts to be paid to Service Agents. During the period ended October 31, 2011, Class A and Class C shares were charged $142,888 and $56,936, respectively, pursuant to the Shareholder Services Plan.
The fund compensates Dreyfus Transfer, Inc., a wholly-owned subsidiary of Dreyfus, under a transfer agency agreement for providing personnel and facilities to perform transfer agency services for the fund. During the period ended October 31, 2011, the fund was charged $29,380 pursuant to the transfer agency agreement, which is included in Shareholder servicing costs in the Statement of Operations.
The fund has arrangements with the custodian and cash management bank whereby the fund may receive earnings credits when positive cash balances are maintained, which are used to offset custody and cash management fees. For financial reporting purposes, the fund includes net earnings credits as an expense offset in the Statement of Operations.
The fund compensates The Bank of New York Mellon under a cash management agreement for performing cash management services related to fund subscriptions and redemptions. During the period ended October 31, 2011, the fund was charged $4,076 pursuant to the cash management agreement, which is included in Shareholder servicing costs in the Statement of Operations.These fees were partially offset by earnings credits of $181.
The fund also compensates The Bank of New York Mellon under a custody agreement for providing custodial services for the fund. During the period ended October 31, 2011, the fund was charged $176,371 pursuant to the custody agreement.
During the period ended October 31, 2011, the fund was charged $6,751 for services performed by the Chief Compliance Officer.
28
The components of “Due to The Dreyfus Corporation and affiliates” in the Statement of Assets and Liabilities consist of: management fees $62,704, Rule 12b-1 distribution plan fees $7,660, shareholder services plan fees $9,005, custodian fees $44,456, chief compliance officer fees $4,246 and transfer agency per account fees $3,105.
(d) Each Board member also serves as a Board member of other funds within the Dreyfus complex. Annual retainer fees and attendance fees are allocated to each fund based on net assets.
(e) A 2% redemption fee is charged and retained by the fund on certain shares redeemed within sixty days following the date of issuance, subject to exceptions, including redemptions made through use of the fund’s exchange privilege. During the period ended October 31, 2011, redemption fees charged and retained by the fund amounted to $63,141.
NOTE 4—Securities Transactions:
The aggregate amount of purchases and sales of investment securities, excluding short-term securities and forward contracts, during the period ended October 31, 2011, amounted to $140,548,510 and $189,758,622, respectively.
Forward Foreign Currency Exchange Contracts: The fund enters into forward contracts in order to hedge its exposure to changes in foreign currency exchange rates on its foreign portfolio holdings, to settle foreign currency transactions or as a part of its investment strategy. When executing forward contracts, the fund is obligated to buy or sell a foreign currency at a specified rate on a certain date in the future. With respect to sales of forward contracts, the fund incurs a loss if the value of the contract increases between the date the forward contract is opened and the date the forward contract is closed.The fund realizes a gain if the value of the contract decreases between those dates. With respect to purchases of forward contracts, the fund incurs a loss if the
| The Fund | 29 |
NOTES TO FINANCIAL STATEMENTS (continued)
value of the contract decreases between the date the forward contract is opened and the date the forward contract is closed.The fund realizes a gain if the value of the contract increases between those dates. Any realized gain or loss which occurred during the period is reflected in the Statement of Operations.The fund is exposed to foreign currency risk as a result of changes in value of underlying financial instruments. The fund is also exposed to credit risk associated with counterparty nonperformance on these forward contracts, which is typically limited to the unrealized gain on each open contract.The following summarizes open forward contracts at October 31, 2011:
| Foreign | Unrealized | ||||
| Forward Foreign Currency | Currency | Appreciation | |||
| Exchange Contracts | Amounts | Proceeds ($) | Value ($) | (Depreciation) ($) | |
| Sales: | |||||
| Hong Kong Dollar, | |||||
| Expiring 11/1/2011 | 750,000 | 96,556 | 96,540 | 16 | |
| Malaysian Ringgit, | |||||
| Expiring 11/1/2011 | 629,328 | 204,460 | 205,127 | (667) | |
| Malaysian Ringgit, | |||||
| Expiring 11/2/2011 | 1,916,541 | 623,671 | 624,687 | (1,016) | |
| Gross Unrealized | |||||
| Appreciation | 16 | ||||
| Gross Unrealized | |||||
| Depreciation | (1,683) | ||||
The following summarizes the average market value of derivatives outstanding during the period ended October 31, 2011:
| Average Market Value ($) | |
| Forward contracts | 1,223,304 |
At October 31, 2011, the cost of investments for federal income tax purposes was $74,856,200; accordingly, accumulated net unrealized depreciation on investments was $11,346,923, consisting of $4,292,641 gross unrealized appreciation and $15,639,564 gross unrealized depreciation.
30
| REPORT OF INDEPENDENT REGISTERED |
| PUBLIC ACCOUNTING FIRM |
Shareholders and Board of Directors
Dreyfus Emerging Asia Fund
We have audited the accompanying statement of assets and liabilities, including the statement of investments, of Dreyfus Emerging Asia Fund (one of the series comprising Dreyfus Premier Investment Funds, Inc.) as of October 31, 2011, and the related statement of operations for the year then ended, the statement of changes in net assets for each of the two years in the period then ended and financial highlights for each of the periods indicated therein. These financial statements and financial highlights are the responsibility of the Fund’s management. Our responsibility is to express an opinion on these financial statements and financial highlights based on our audits.
We conducted our audits in accordance with the standards of the Public Company Accounting Oversight Board (United States).Those standards require that we plan and perform the audit to obtain reasonable assurance about whether the financial statements and financial highlights are free of material misstatement.We were not engaged to perform an audit of the Fund’s internal control over financial reporting. Our audits included consideration of internal control over financial reporting as a basis for designing audit procedures that are appropriate in the circumstances, but not for the purpose of expressing an opinion on the effectiveness of the Fund’s internal control over financial reporting. Accordingly, we express no such opinion.An audit also includes examining, on a test basis, evidence supporting the amounts and disclosures in the financial statements and financial highlights, assessing the accounting principles used and significant estimates made by management, and evaluating the overall financial statement presentation. Our procedures included confirmation of securities owned as of October 31, 2011 by correspondence with the custodian and others.We believe that our audits provide a reasonable basis for our opinion.
In our opinion, the financial statements and financial highlights referred to above present fairly, in all material respects, the financial position of Dreyfus Emerging Asia Fund at October 31, 2011, the results of its operations for the year then ended, the changes in its net assets for each of the two years in the period then ended and the financial highlights for each of the indicated periods, in conformity with U. S. generally accepted accounting principles.

| New York, New York |
| December 29, 2011 |
| The Fund | 31 |
IMPORTANT TAX INFORMATION (Unaudited)
In accordance with federal tax law, the fund elects to provide each shareholder with their portion of the fund’s foreign taxes paid and the income sourced from foreign countries. Accordingly, the fund hereby makes the following designations regarding its fiscal year ended October 31, 2011:
—the total amount of taxes paid to foreign countries was $104,186
—the total amount of income sourced from foreign countries was $1,453,598.
Where required by federal tax law rules, shareholders will receive notification of their proportionate share of foreign taxes paid and foreign sourced income for the 2011 calendar year with Form 1099-DIV which will be mailed in early 2012.
32
PROXY RESULTS (Unaudited)
The Company held a special meeting of shareholders on May 31, 2011.The proposal considered at the meeting, and the results, are as follows:
| Shares | |||
| Votes For | Authority Withheld | ||
| To elect Board Members: | |||
| Joseph S. DiMartino† | 119,515,411 | 644,860 | |
| Phillip L. Toia† | 119,502,800 | 657,471 | |
| Robin A. Melvin† | 119,566,042 | 594,229 |
† Each new Board member’s term commenced on May 31, 2011.
In addition Gordon J. Davis, Esq., David P. Feldman and Lynn Martin continue as Board members of the Company.
| The Fund | 33 |
| INFORMATION ABOUT THE RENEWAL OF THE |
| FUND’S MANAGEMENT AND SUB-INVESTMENT |
| ADVISORY AGREEMENTS (Unaudited) |
At a meeting of the fund’s Board of Directors held on July 12, 2011, the Board considered the renewal of the fund’s Management Agreement, pursuant to which Dreyfus provides the fund with investment advisory and administrative services (the “Agreement”), and the Sub-Investment Advisory Agreement (together, the “Agreements”), pursuant to which Hamon U.S. Investment Advisors Ltd. (the “Sub-Adviser”) provides day-to-day management of the fund’s investments.The Board members, none of whom are “interested persons” (as defined in the Investment Company Act of 1940, as amended) of the fund, were assisted in their review by independent legal counsel and met with counsel in executive session separate from Dreyfus representatives and the Sub-Adviser. In considering the renewal of the Agreements, the Board considered all factors that it believed to be relevant, including those discussed below.The Board did not identify any one factor as dispositive, and each Board member may have attributed different weights to the factors considered.
Analysis of Nature, Extent, and Quality of Services Provided to the Fund.The Board considered information previously provided to them in presentations from Dreyfus representatives regarding the nature, extent, and quality of the services provided to funds in the Dreyfus fund complex, and Dreyfus representatives confirmed that there had been no material changes in this information. Dreyfus provided the number of open accounts in the fund, the fund’s asset size and the allocation of fund assets among distribution channels. Dreyfus also had previously provided information regarding the diverse intermediary relationships and distribution channels of funds in the Dreyfus fund complex and Dreyfus’ corresponding need for broad, deep, and diverse resources to be able to provide ongoing shareholder services to each distribution channel, including the distribution channel(s) for the fund.
The Board also considered research support available to, and portfolio management capabilities of, the fund’s portfolio management personnel and that Dreyfus also provides oversight of day-to-day fund operations, including fund accounting and administration and assistance in meeting legal and regulatory requirements.The Board also considered Dreyfus’ extensive administrative, accounting, and compliance infrastructures, as
34
well as Dreyfus’ supervisory activities over the Sub-Adviser.The Board also considered portfolio management’s brokerage policies and practices (including policies and practices regarding soft dollars) and the standards applied in seeking best execution.
Comparative Analysis of the Fund’s Performance and Management Fee and Expense Ratio.The Board reviewed reports prepared by Lipper, Inc. (“Lipper”), an independent provider of investment company data, which included information comparing (1) the fund’s performance with the performance of a group of comparable funds (the “Performance Group”) and with a broader group of funds (the “Performance Universe”), all for various periods ended May 31, 2011, and (2) the fund’s actual and contractual management fees and total expenses with those of a group of comparable funds (the “Expense Group”) and with a broader group of funds (the “Expense Universe”), the information for which was derived in part from fund financial statements available to Lipper as of May 31, 2011. Dreyfus previously had furnished the Board with a description of the methodology Lipper used to select the Performance Group and Performance Universe and the Expense Group and Expense Universe.
Dreyfus representatives stated that the usefulness of performance comparisons may be affected by a number of factors, including different investment limitations that may be applicable to the fund and comparison funds. They also noted that performance generally should be considered over longer periods of time, although it is possible that long-term performance can be adversely affected by even one period of significant underperformance so that a single investment decision or theme has the ability to affect disproportionately long-term perfor-mance.The Board discussed the results of the comparisons and noted that the fund’s total return performance was below the Performance Group and Performance Universe medians for the various periods, except for the three-year period when the fund’s performance was above the Performance Group and Performance Universe medians. Dreyfus also provided a comparison of the fund’s calendar year total returns to the returns of the fund’s benchmark index.
| The Fund | 35 |
| INFORMATION ABOUT THE RENEWAL OF THE FUND’S MANAGEMENT AND |
| SUB-INVESTMENT ADVISORY AGREEMENTS (Unaudited) (continued) |
The Board also reviewed the range of actual and contractual management fees and total expenses of the Expense Group and Expense Universe funds and discussed the results of the comparisons.The Board noted that the fund’s contractual management fee was above the Expense Group median and the fund’s actual management fee and total expense ratio were above the Expense Group and Expense Universe medians.
Dreyfus representatives noted that Dreyfus has contractually agreed until July 31, 2012, to waive receipt of its fees and/or assume the expenses of the fund so that the direct expenses of none of the classes (excluding Rule 12b-1 fees, shareholder services fees, taxes, interest expense, brokerage commissions, commitment fees on borrowings and extraordinary expenses) exceed 1.65% of the fund’s average daily net assets.
Dreyfus representatives reviewed with the Board the management or investment advisory fees (1) paid by funds advised or administered by Dreyfus that are in the same Lipper category as the fund and (2) paid to Dreyfus or the Sub-Adviser or its affiliates for advising any separate accounts and/or other types of client portfolios that are considered to have similar investment strategies and policies as the fund (the “Similar Clients”), and explained the nature of the Similar Clients.They discussed differences in fees paid and the relationship of the fees paid in light of any differences in the services provided and other relevant factors.The Board considered the relevance of the fee information provided for the Similar Clients to evaluate the appropriateness and reasonableness of the fund’s management fee.
The Board considered the fee to the Sub-Adviser in relation to the fee paid to Dreyfus by the fund and the respective services provided by the Sub-Adviser and Dreyfus.The Board also noted the Sub-Adviser’s fee is paid by Dreyfus (out of its fee from the fund) and not the fund.
Analysis of Profitability and Economies of Scale. Dreyfus’ representatives reviewed the expenses allocated and profit received by Dreyfus and the resulting profitability percentage for managing the fund, and the method used to determine the expenses and profit. The Board concluded that the profitability results were not unreasonable, given
36
the services rendered and service levels provided by Dreyfus. The Board also noted the expense limitation arrangement and its effect on Dreyfus’ profitability. The Board previously had been provided with information prepared by an independent consulting firm regarding Dreyfus’ approach to allocating costs to, and determining the profitability of, individual funds and the entire Dreyfus fund complex.The consulting firm also had analyzed where any economies of scale might emerge in connection with the management of a fund.
The Board’s counsel stated that the Board should consider the profitability analysis (1) as part of their evaluation of whether the fees under the Agreements bear a reasonable relationship to the mix of services provided by Dreyfus and the Sub-Adviser, including the nature, extent and quality of such services, and (2) in light of the relevant circumstances for the fund and the extent to which economies of scale would be realized if the fund grows and whether fee levels reflect these economies of scale for the benefit of fund shareholders. Since Dreyfus, and not the fund, pays the Sub-Adviser pursuant to the Sub-Investment Advisory Agreement, the Board did not consider the Sub-Adviser’s profitability to be relevant to its deliberations. Dreyfus representatives noted that a discussion of economies of scale is predicated on a fund having achieved a substantial size with increasing assets and that, if a fund’s assets had been stable or decreasing, the possibility that Dreyfus may have realized any economies of scale would be less. Dreyfus representatives also noted that, as a result of shared and allocated costs among funds in the Dreyfus fund complex, the extent of economies of scale could depend substantially on the level of assets in the complex as a whole, so that increases and decreases in complex-wide assets can affect potential economies of scale in a manner that is disproportionate to, or even in the opposite direction from, changes in the fund’s asset level.The Board also considered potential benefits to Dreyfus and the Sub-Adviser from acting as investment adviser and sub-investment adviser, respectively, and noted the soft dollar arrangements in effect for trading the fund’s investments.
| The Fund | 37 |
| INFORMATION ABOUT THE RENEWAL OF THE FUND’S MANAGEMENT AND |
| SUB-INVESTMENT ADVISORY AGREEMENTS (Unaudited) (continued) |
At the conclusion of these discussions, the Board agreed that it had been furnished with sufficient information to make an informed business decision with respect to the renewal of the Agreements. Based on the discussions and considerations as described above, the Board concluded and determined as follows.
The Board concluded that the nature, extent and quality of the services provided by Dreyfus and the Sub-Adviser are adequate and appropriate.
The Board agreed to closely monitor performance and determined to approve renewal of the Agreement only through January 31, 2012.
The Board concluded that the fees paid to Dreyfus and the Sub- Adviser were reasonable in light of the considerations described above.
The Board determined that the economies of scale which may accrue to Dreyfus and its affiliates in connection with the management of the fund had been adequately considered by Dreyfus in connection with the fee rate charged to the fund pursuant to the Agreement and that, to the extent in the future it were determined that material economies of scale had not been shared with the fund, the Board would seek to have those economies of scale shared with the fund.
The Board considered these conclusions and determinations, along with information received on a routine and regular basis throughout the year. In addition, it should be noted that the Board’s consideration of the contractual fee arrangements for this fund had the benefit of a number of years of reviews of prior or similar agreements during which lengthy discussions took place between the Board and Dreyfus representatives. Certain aspects of the arrangements may receive greater scrutiny in some years than in others, and the Board’s conclusions may be based, in part, on their consideration of the same or similar arrangements in prior years. The Board determined that renewal of the Agreements through January 31, 2012 was in the best interests of the fund and its shareholders.
38
BOARD MEMBERS INFORMATION (Unaudited)
| Joseph S. DiMartino (68) |
| Chairman of the Board (1995) |
| Principal Occupation During Past 5Years: |
| • Corporate Director and Trustee |
| Other Public Company Board Memberships During Past 5Years: |
| • CBIZ (formerly, Century Business Services, Inc.), a provider of outsourcing functions for small |
| and medium size companies, Director (1997-present) |
| • Sunair Services Corporation, a provider of certain outdoor-related services to homes and busi- |
| nesses, Director (2005-2009) |
| • The Newark Group, a provider of a national market of paper recovery facilities, paperboard |
| mills and paperboard converting plants, Director (2000-2010) |
| No. of Portfolios for which Board Member Serves: 167 |
| ——————— |
| Gordon J. Davis (70) |
| Board Member (1994) |
| Principal Occupation During Past 5Years: |
| • Partner in the law firm of Dewey & LeBoeuf LLP |
| Other Public Company Board Memberships During Past 5Years: |
| • Consolidated Edison, Inc., a utility company, Director (1997-present) |
| • The Phoenix Companies Inc., a life insurance company, Director (2000-present) |
| No. of Portfolios for which Board Member Serves: 44 |
| ——————— |
| David P. Feldman (71) |
| Board Member (1991) |
| Principal Occupation During Past 5Years: |
| • Corporate Director and Trustee |
| Other Public Company Board Memberships During Past 5Years: |
| • BBH Mutual Funds Group (4 registered mutual funds), Director (1992-present) |
| • QMed Inc., a healthcare company, Director (1999-2007) |
| No. of Portfolios for which Board Member Serves: 50 |
| The Fund | 39 |
BOARD MEMBERS INFORMATION (Unaudited) (continued)
| Lynn Martin (71) |
| Board Member (1993) |
| Principal Occupation During Past 5Years: |
| • President of The Martin Hall Group LLC, a human resources consulting firm, from |
| January 2005-present |
| • Advisor to the international accounting firm of Deloitte & Touche, LLP and Chair to its |
| Council for the Advancement of Women from March 1993-September 2005 |
| Other Public Company Board Memberships During Past 5Years: |
| • AT&T Inc., a telecommunications company, Director (1999-present) |
| • Ryder System, Inc., a supply chain and transportation management company, Director (1993-present) |
| • The Proctor & Gamble Co., a consumer products company, Director (1994-present) |
| • Constellation Energy Group Inc., Director (2003-present) |
| No. of Portfolios for which Board Member Serves: 15 |
| ——————— |
| Robin A. Melvin (48) |
| Board Member (2011) |
| Principal Occupation During Past 5Years: |
| • Director, Boisi Family Foundation, a private family foundation that supports youth-serving |
| organizations that promote the self sufficiency of youth from disadvantaged circumstances |
| (1995-present) |
| • SeniorVice President, Mentor, a national non-profit youth mentoring organization (1992-2005) |
| No. of Portfolios for which Board Member Serves: 54 |
| ——————— |
| Philip L. Toia (78) |
| Board Member (1997) |
| Principal Occupation During Past 5Years: |
| • Private Investor |
| No. of Portfolios for which Board Member Serves: 25 |
| ——————— |
Once elected all Board Members serve for an indefinite term, but achieve Emeritus status upon reaching age 80.The address of the Board Members and Officers is in c/o The Dreyfus Corporation, 200 Park Avenue, NewYork, NewYork 10166.Additional information about the Board Members is available in the fund’s Statement of Additional Information which can be obtained from Dreyfus free of charge by calling this toll free number: 1-800-DREYFUS.
Daniel Rose, Emeritus Board Member
Sander Vanocur, Emeritus Board Member
40
OFFICERS OF THE FUND (Unaudited)
BRADLEY J. SKAPYAK, President since January 2010.
Chief Operating Officer and a director of the Manager since June 2009. From April 2003 to June 2009, Mr. Skapyak was the head of the Investment Accounting and Support Department of the Manager. He is an officer of 75 investment companies (comprised of 167 portfolios) managed by the Manager. He is 52 years old and has been an employee of the Manager since February 1988.
MICHAEL A. ROSENBERG, Vice President and Secretary since August 2005.
Assistant General Counsel of BNY Mellon, and an officer of 76 investment companies (comprised of 192 portfolios) managed by the Manager. He is 51 years old and has been an employee of the Manager since October 1991.
KIESHA ASTWOOD, Vice President and Assistant Secretary since January 2010.
Counsel of BNY Mellon, and an officer of 76 investment companies (comprised of 192 portfolios) managed by the Manager. She is 38 years old and has been an employee of the Manager since July 1995.
JAMES BITETTO, Vice President and Assistant Secretary since August 2005.
Senior Counsel of BNY Mellon and Secretary of the Manager, and an officer of 76 investment companies (comprised of 192 portfolios) managed by the Manager. He is 45 years old and has been an employee of the Manager since December 1996.
JONI LACKS CHARATAN, Vice President and Assistant Secretary since August 2005.
Senior Counsel of BNY Mellon, and an officer of 76 investment companies (comprised of 192 portfolios) managed by the Manager. She is 55 years old and has been an employee of the Manager since October 1988.
JOSEPH M. CHIOFFI, Vice President and Assistant Secretary since August 2005.
Senior Counsel of BNY Mellon, and an officer of 76 investment companies (comprised of 192 portfolios) managed by the Manager. He is 49 years old and has been an employee of the Manager since June 2000.
KATHLEEN DENICHOLAS, Vice President and Assistant Secretary since January 2010.
Managing Counsel of BNY Mellon, and an officer of 76 investment companies (comprised of 192 portfolios) managed by the Manager. She is 37 years old and has been an employee of the Manager since February 2001.
JANETTE E. FARRAGHER, Vice President and Assistant Secretary since August 2005.
Assistant General Counsel of BNY Mellon, and an officer of 76 investment companies (comprised of 192 portfolios) managed by the Manager. She is 48 years old and has been an employee of the Manager since February 1984.
JOHN B. HAMMALIAN, Vice President and Assistant Secretary since August 2005.
Senior Managing Counsel of BNY Mellon, and an officer of 76 investment companies (comprised of 192 portfolios) managed by the Manager. He is 48 years old and has been an employee of the Manager since February 1991.
M. CRISTINA MEISER, Vice President and Assistant Secretary since January 2010.
Senior Counsel of BNY Mellon, and an officer of 76 investment companies (comprised of 192 portfolios) managed by the Manager. She is 41 years old and has been an employee of the Manager since August 2001.
| The Fund | 41 |
OFFICERS OF THE FUND (Unaudited) (continued)
ROBERT R. MULLERY, Vice President and Assistant Secretary since August 2005.
Managing Counsel of BNY Mellon, and an officer of 76 investment companies (comprised of 192 portfolios) managed by the Manager. He is 59 years old and has been an employee of the Manager since May 1986.
JEFF PRUSNOFSKY, Vice President and Assistant Secretary since August 2005.
Senior Managing Counsel of BNY Mellon, and an officer of 76 investment companies (comprised of 192 portfolios) managed by the Manager. He is 46 years old and has been an employee of the Manager since October 1990.
JAMES WINDELS, Treasurer since November 2001.
Director – Mutual Fund Accounting of the Manager, and an officer of 76 investment companies (comprised of 192 portfolios) managed by the Manager. He is 53 years old and has been an employee of the Manager since April 1985.
RICHARD CASSARO, Assistant Treasurer since January 2008.
Senior Accounting Manager – Money Market and Municipal Bond Funds of the Manager, and an officer of 76 investment companies (comprised of 192 portfolios) managed by the Manager. He is 52 years old and has been an employee of the Manager since September 1982.
GAVIN C. REILLY, Assistant Treasurer since August 2005.
Tax Manager of the Investment Accounting and Support Department of the Manager, and an officer of 76 investment companies (comprised of 192 portfolios) managed by the Manager. He is 43 years old and has been an employee of the Manager since April 1991.
ROBERT ROBOL, Assistant Treasurer since August 2005.
Senior Accounting Manager – Fixed Income Funds of the Manager, and an officer of 76 investment companies (comprised of 192 portfolios) managed by the Manager. He is 47 years old and has been an employee of the Manager since October 1988.
ROBERT SALVIOLO, Assistant Treasurer since July 2007.
Senior Accounting Manager – Equity Funds of the Manager, and an officer of 76 investment companies (comprised of 192 portfolios) managed by the Manager. He is 44 years old and has been an employee of the Manager since June 1989.
ROBERT SVAGNA, Assistant Treasurer since August 2002.
Senior Accounting Manager – Equity Funds of the Manager, and an officer of 76 investment companies (comprised of 192 portfolios) managed by the Manager. He is 44 years old and has been an employee of the Manager since November 1990.
42
JOSEPH W. CONNOLLY, Chief Compliance Officer since October 2004.
Chief Compliance Officer of the Manager and The Dreyfus Family of Funds (76 investment companies, comprised of 192 portfolios). From November 2001 through March 2004, Mr. Connolly was first Vice-President, Mutual Fund Servicing for Mellon Global Securities Services. In that capacity, Mr. Connolly was responsible for managing Mellon’s Custody, Fund Accounting and Fund Administration services to third-party mutual fund clients. He is 54 years old and has served in various capacities with the Manager since 1980, including manager of the firm’s Fund Accounting Department from 1997 through October 2001.
STEPHEN J. STOREN, Anti-Money Laundering Compliance Officer since May 2011.
Chief Compliance Officer of the Distributor, and the Anti-Money Laundering Compliance Officer of 72 investment companies (comprised of 188 portfolios) managed by the Manager. He is 57 years old and has been an employee of the Distributor since October 1999.
NOTES
For More Information
Telephone Call your financial representative or 1-800-DREYFUS
Mail The Dreyfus Family of Funds, 144 Glenn Curtiss Boulevard, Uniondale, NY 11556-0144
The fund files its complete schedule of portfolio holdings with the Securities and Exchange Commission (“SEC”) for the first and third quarters of each fiscal year on Form N-Q. The fund’s Forms N-Q are available on the SEC’s website at http://www.sec.gov and may be reviewed and copied at the SEC’s Public Reference Room in Washington, DC. Information on the operation of the Public Reference Room may be obtained by calling 1-800-SEC-0330.
A description of the policies and procedures that the fund uses to determine how to vote proxies relating to portfolio securities, and information regarding how the fund voted these proxies for the most recent 12-month period ended June 30 is available at http://www.dreyfus.com and on the SEC’s website at http://www.sec.gov. The description of the policies and procedures is also available without charge, upon request, by calling 1-800-DREYFUS.

| Dreyfus |
| Greater China Fund |
ANNUAL REPORT October 31, 2011
Save time. Save paper. View your next shareholder report online as soon as it’s available. Log into www.dreyfus.com and sign up for Dreyfus eCommunications. It’s simple and only takes a few minutes.
The views expressed in this report reflect those of the portfolio manager only through the end of the period covered and do not necessarily represent the views of Dreyfus or any other person in the Dreyfus organization. Any such views are subject to change at any time based upon market or other conditions and Dreyfus disclaims any responsibility to update such views.These views may not be relied on as investment advice and, because investment decisions for a Dreyfus fund are based on numerous factors, may not be relied on as an indication of trading intent on behalf of any Dreyfus fund.
| Not FDIC-Insured • Not Bank-Guaranteed • May Lose Value |
Contents | |
THE FUND | |
| 2 | A Letter from the Chairman and CEO |
| 3 | Discussion of Fund Performance |
| 6 | Fund Performance |
| 8 | Understanding Your Fund’s Expenses |
| 8 | Comparing Your Fund’s Expenses With Those of Other Funds |
| 9 | Statement of Investments |
| 12 | Statement of Assets and Liabilities |
| 13 | Statement of Operations |
| 14 | Statement of Changes in Net Assets |
| 16 | Financial Highlights |
| 20 | Notes to Financial Statements |
| 33 | Report of Independent Registered Public Accounting Firm |
| 34 | Important Tax Information |
| 35 | Proxy Results |
| 36 | Information About the Renewal of the Fund’s Management and Sub-Investment Advisory Agreements |
| 41 | Board Members Information |
| 43 | Officers of the Fund |
FOR MORE INFORMATION | |
Back Cover |
Dreyfus
Greater China Fund
The Fund

A LETTER FROM THE CHAIRMAN AND CEO
Dear Shareholder:
We present to you this annual report for Dreyfus Greater China Fund, covering the 12-month period from November 1, 2010, through October 31, 2011. For information about how the fund performed during the reporting period, as well as general market perspectives, we provide a Discussion of Fund Performance on the pages that follow.
Investors were encouraged by expectations of a more robust economic recovery during the final months of 2010, but sentiment deteriorated in 2011 due to disappointing global economic data, rising commodity prices, an escalating sovereign debt crisis in Europe and a contentious debate regarding taxes, spending and borrowing in the United States. International stocks proved sensitive to these macroeconomic developments, often regardless of underlying company fundamentals, and most international equity market indices ended the reporting period with mildly negative absolute returns.
The global economic outlook currently remains clouded by market turbulence and political infighting, but we believe that a continued subpar global expansion is more likely than a return to recession. Although Europe continues to struggle with a debt crisis, inflationary pressures appear to be waning in most countries as energy prices recently have retreated from their highs. In Asia, China seems to have averted an economic contraction after implementing measures to dampen inflationary pressures. In the United States, moderately low core inflation and an accommodative monetary policy could help support near-trend growth despite ongoing deleveraging activity in the private sector.To assess the potential impact of these and other developments on your investments, we encourage you, as always, to speak with your financial advisor.
Thank you for your continued confidence and support.

Jonathan R. Baum
Chairman and Chief Executive Officer
The Dreyfus Corporation
November 15, 2011
2

DISCUSSION OF FUND PERFORMANCE
For the period of November 1, 2010, through October 31, 2011, as provided by Hugh Simon, Raymond Chan and William Liu, Portfolio Managers
Fund and Market Performance Overview
For the 12-month period ended October 31, 2011, Dreyfus Greater China Fund’s Class A shares produced a total return of –29.73%, Class B shares returned –30.31%, Class C shares returned –30.26% and Class I shares returned –29.57%.1 In comparison, the fund’s benchmark, the Hang Seng Index, produced a total return of –11.58% for the same period.2
Stocks in China stumbled as investors responded negatively to concerns that domestic inflation-fighting measures and a sluggish global economy would weigh on local growth. The fund produced lower returns than its benchmark, mainly due to its holdings of mid- to small-cap stocks and overweight positions in the industrials, information technology and materials sectors.
The Fund’s Investment Approach
The fund, which seeks long-term capital appreciation, normally invests at least 80% of its net assets in stocks of companies that (i) are principally traded in China, Hong Kong or Taiwan (Greater China), (ii) derive at least 50% of their revenues from Greater China, or (iii) have at least 50% of their assets in Greater China.To determine where the fund will invest, we analyze several factors, including economic and political trends in Greater China, the current financial condition and future prospects of individual companies and sectors in the region, and the valuation of one market or company relative to that of another.
Macroeconomic Developments Challenged Chinese Stocks
The reporting period proved challenging as inflation fighting efforts—including rising interest rates, stricter lending standards and higher banking reserve ratio requirements—threatened to reduce China’s high economic growth rate. At the same time, investors worried that deteriorating global economic conditions might hurt export activity, mainly due to a sovereign debt crisis in Europe, rising energy prices stemming from political unrest in the Middle East, and stubbornly high unemployment in the United States.
Faced with these developments, newly risk-averse global investors shifted assets from the emerging markets to traditional safe havens in the devel-
| The Fund | 3 |
DISCUSSION OF FUND PERFORMANCE (continued)
oped world. Capital outflows sparked a broad-based derating of equity valuations, causing market capitalizations to contract significantly across a wide range of industry groups.Although Chinese stocks rallied strongly in October 2011 as some macroeconomic concerns eased, it was not enough to offset earlier weakness. Small- and midcap stocks were punished more severely than large-cap stocks during the reporting period.
Economically Sensitive Sectors Weighed on Performance
The fund’s relative performance was undermined by overweighted exposure to some of the market’s more economically sensitive industry groups, including the industrials, information technology and materials sectors.Although we had identified companies in these areas that we believe are poised for long-term growth, skittish investors adopted a short-term perspective and punished many stocks more severely than we believe was warranted. In addition, the fund’s relative results were constrained by its exposure to small- and midcap stocks that are not represented in the Hang Seng Index.
Among the fund’s greater laggards for the reporting period were China National Materials, a cement producer that was hurt by weaker demand for construction materials. Also in the materials sector, Xinjiang Xinxin Mining Industry declined when production of copper and nickel was temporarily disrupted. In the industrials sector, China Automation Group struggled through a temporary interruption of financing for railroad construction projects after the train accident.
The fund achieved better results from other individual holdings.Wireless handset casing maker CatcherTechnology captured greater market share and boosted earnings. Software developer Kingsoft gained value after receiving a substantial investment from Tencent Holdings, prompting its sale from the portfolio. Hong Kong retailer Lifestyle International Holdings advanced amid a trend in tourism in which Mainland Chinese travelers focus on shopping opportunities. We purchased shares of Agricultural Bank of China late in the reporting period at distressed prices, and the stock already began to rebound by the end of October.
Adopting a More Constructive Investment Posture
In our view, the worst of the market downturn in China is behind us. Indeed, it appears that inflationary pressures are receding, and a sharp market rally in October seemed to reflect evidence that Chinese authorities may remove some of the liquidity restrictions imposed in their inflation-fighting efforts.
4
As of the reporting period’s end, we have identified opportunities among stocks that we believe are selling at attractive valuations in the wake of the market correction. Particularly attractive are banks, insurers, securities brokers and leasing companies in the hard-hit financials sector, where we have increased the fund’s exposure. Meanwhile, we have maintained the fund’s emphasis on machinery and automation companies in the industrials sector, which we believe will benefit from efforts to improve productivity and efficiency as China competes more vigorously in the global economy. Conversely, we have reduced the fund’s positions in traditionally defensive market sectors, including little exposure to the telecommunications services and utilities sectors. However, we would like to remind our shareholders, particularly newer investors, that this fund has a high risk/return profile and is appropriate only for shareholders willing to accept greater risks. Because of its narrow geographic focus and relatively limited number of holdings, this fund can be extremely volatile and should only represent a small portion of a long-term investor’s well-diversified portfolio.
November 15, 2011
| Please note, the position in any security highlighted with italicized typeface was sold during the | |
| reporting period. | |
| Emerging markets, such as those of China and Taiwan, tend to be more volatile than the markets | |
| of more mature economies, and generally have less diverse and less mature economic structures and | |
| less stable political systems than those of developed countries.The securities of companies located in | |
| emerging markets are often subject to rapid and large changes in price.An investment in this fund | |
| should be considered only as a supplement to a complete investment program for those investors | |
| willing to accept the greater risks associated with investments in emerging markets. | |
| Equity funds are subject generally to market, market sector, market liquidity, issuer and investment | |
| style risks, among other factors, to varying degrees, all of which are more fully described in the | |
| fund’s prospectus. | |
| The fund’s performance will be influenced by political, social and economic factors affecting | |
| investments in foreign companies. Special risks associated with investments in foreign companies | |
| include exposure to currency fluctuations, less liquidity, less developed or less efficient trading | |
| markets, lack of comprehensive company information, political instability and differing auditing | |
| and legal standards.These risks are enhanced in emerging market countries. | |
| 1 | Total return includes reinvestment of dividends and any capital gains paid, and does not take into |
| consideration the maximum initial sales charge in the case of Class A shares, or the applicable | |
| contingent deferred sales charges imposed on redemptions in the case of Class B and Class C | |
| shares. Had these charges been reflected, returns would have been lower. Past performance is no | |
| guarantee of future results. Share price and investment return fluctuate such that upon redemption, | |
| fund shares may be worth more or less than their original cost. | |
| 2 | SOURCE: BLOOMBERG L.P. – Reflects reinvestment of dividends and, where applicable, |
| capital gain distributions.The Hang Seng Index is a free-float capitalization-weighted index of 36 | |
| companies that represents approximately 66% of the total market cap of the Stock Exchange of | |
| Hong Kong. Index components are capped at 25% and divided into four sub-indexes. Return | |
| quoted is in U.S. dollars. Investors cannot invest directly in any index. |
| The Fund | 5 |
FUND PERFORMANCE
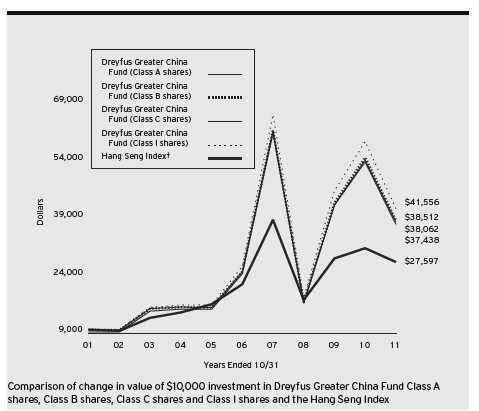
| † Source: Bloomberg L.P. |
| Past performance is not predictive of future performance. |
| The above graph compares a $10,000 investment made in each of the Class A, Class B, Class C and Class I shares of |
| Dreyfus Greater China Fund on 10/31/01 to a $10,000 investment made in the Hang Seng Index (the “Index”) on |
| that date.All dividends and capital gain distributions are reinvested. |
| The fund’s performance shown in the line graph above takes into account the maximum initial sales charge on Class A |
| shares and all other applicable fees and expenses on all classes. Performance for Class B shares assumes the conversion |
| of Class B shares to Class A shares at the end of the sixth year following the date of purchase.The Index is a |
| capitalization-weighted index of approximately 33 companies that represent 70 percent of the total market capitalization |
| of the Stock Exchange of Hong Kong.The components of the Index are divided into four subindices: Commerce, Finance, |
| Utilities and Properties.The Index reflects reinvestment of net dividends and where applicable, capital gain distributions. |
| Unlike a mutual fund, the Index is not subject to charges, fees and other expenses. Investors cannot invest directly in any |
| index. Further information relating to fund performance, including expense reimbursements, if applicable, is contained in |
| the Financial Highlights section of the prospectus and elsewhere in this report. |
6
| Average Annual Total Returns as of 10/31/11 | ||||||
| 1Year | 5 Years | 10 Years | ||||
| Class A shares | ||||||
| with maximum sales charge (5.75%) | –33.77% | 7.86% | 14.30% | |||
| without sales charge | –29.73% | 9.15% | 14.98% | |||
| Class B shares | ||||||
| with applicable redemption charge † | –33.02% | 7.97% | 14.44% | |||
| without redemption | –30.31% | 8.26% | 14.44% | |||
| Class C shares | ||||||
| with applicable redemption charge †† | –30.94% | 8.32% | 14.11% | |||
| without redemption | –30.26% | 8.32% | 14.11% | |||
| Class I shares | –29.57% | 9.44% | 15.31% | |||
| Hang Seng Index | –11.58% | 4.78% | 10.68% | |||
Past performance is not predictive of future performance.The fund’s performance shown in the graph and table does not reflect the deduction of taxes that a shareholder would pay on fund distributions or the redemption of fund shares.
| † | The maximum contingent deferred sales charge for Class B shares is 4%.After six years Class B shares convert to |
| Class A shares. | |
| †† | The maximum contingent deferred sales charge for Class C shares is 1% for shares redeemed within one year of the |
| date of purchase. |
| The Fund | 7 |
UNDERSTANDING YOUR FUND’S EXPENSES (Unaudited)
As a mutual fund investor, you pay ongoing expenses, such as management fees and other expenses. Using the information below, you can estimate how these expenses affect your investment and compare them with the expenses of other funds.You also may pay one-time transaction expenses, including sales charges (loads) and redemption fees, which are not shown in this section and would have resulted in higher total expenses. For more information, see your fund’s prospectus or talk to your financial adviser.
Review your fund’s expenses
The table below shows the expenses you would have paid on a $1,000 investment in Dreyfus Greater China Fund from May 1, 2011 to October 31, 2011. It also shows how much a $1,000 investment would be worth at the close of the period, assuming actual returns and expenses.
Expenses and Value of a $1,000 Investment
assuming actual returns for the six months ended October 31, 2011
| Class A | Class B | Class C | Class I | |||||
| Expenses paid per $1,000† | $ | 8.04 | $ | 11.37 | $ | 11.16 | $ | 7.28 |
| Ending value (after expenses) | $ | 679.00 | $ | 676.20 | $ | 676.50 | $ | 679.60 |
COMPARING YOUR FUND’S EXPENSES
WITH THOSE OF OTHER FUNDS (Unaudited)
Using the SEC’s method to compare expenses
The Securities and Exchange Commission (SEC) has established guidelines to help investors assess fund expenses. Per these guidelines, the table below shows your fund’s expenses based on a $1,000 investment, assuming a hypothetical 5% annualized return. You can use this information to compare the ongoing expenses (but not transaction expenses or total cost) of investing in the fund with those of other funds.All mutual fund shareholder reports will provide this information to help you make this comparison. Please note that you cannot use this information to estimate your actual ending account balance and expenses paid during the period.
Expenses and Value of a $1,000 Investment
assuming a hypothetical 5% annualized return for the six months ended October 31, 2011
| Class A | Class B | Class C | Class I | |||||
| Expenses paid per $1,000† | $ | 9.65 | $ | 13.64 | $ | 13.39 | $ | 8.74 |
| Ending value (after expenses) | $ | 1,015.63 | $ | 1,011.64 | $ | 1,011.90 | $ | 1,016.53 |
| † Expenses are equal to the fund’s annualized expense ratio of 1.90% for Class A, 2.69% for Class B, 2.64% for |
| Class C and 1.72% for Class I, multiplied by the average account value over the period, multiplied by 184/365 (to |
| reflect the one-half year period). |
8
| STATEMENT OF INVESTMENTS |
| October 31, 2011 |
| Common Stocks—96.1% | Shares | Value ($) | |
| China—65.7% | |||
| Agricultural Bank of China, Cl. H | 55,200,000 | 24,318,281 | |
| Airtac International Group | 1,439,000 | 7,983,896 | |
| Anhui Conch Cement, Cl. H | 3,690,000 | 13,413,323 | |
| Baidu, ADR | 61,200a | 8,579,016 | |
| Bank of China, Cl. H | 62,700,000 | 22,115,042 | |
| Beijing Capital Land, Cl. H | 55,464,000 | 14,106,053 | |
| Bengang Steel Plates, Cl. B | 39,074,913 | 13,624,622 | |
| China Automation Group | 25,168,000 | 8,659,727 | |
| China National Materials, Cl. H | 877,000 | 431,467 | |
| China Shenhua Energy, Cl. H | 5,700,000 | 26,094,833 | |
| China ZhengTong Auto Services Holdings | 13,501,500 | 14,295,015 | |
| Chongqing Machinery & Electric, Cl. H | 41,716,000 | 7,802,624 | |
| CITIC Securities, Cl. H | 12,815,500a | 25,535,982 | |
| Dalian Refrigeration, Cl. B | 16,238,818 | 11,530,333 | |
| Far East Horizon | 10,662,000 | 7,723,305 | |
| Feihe International | 640,160a | 3,437,659 | |
| Focus Media Holding, ADR | 197,953a | 5,380,363 | |
| Hangzhou Steam Turbine, Cl. B | 2,686,647 | 3,153,156 | |
| Hengan International Group | 1,173,500 | 10,161,155 | |
| Hilong Holding | 32,610,000 | 6,478,268 | |
| Hunan Non-Ferrous Metal, Cl. H | 50,492,000a | 13,913,827 | |
| Maoye International Holdings | 17,731,000a | 4,861,710 | |
| Ping An Insurance Group, Cl. H | 1,300,000 | 9,420,378 | |
| Sany Heavy Equipment International Holdings | 3,104,000 | 2,673,973 | |
| Shanghai Baosight Software, Cl. B | 6,474,813 | 7,315,904 | |
| Shanghai Friendship Group, Cl. B | 15,180,796a | 22,859,648 | |
| Sinopharm Group, Cl. H | 4,642,400 | 12,617,222 | |
| Travelsky Technology, Cl. H | 17,003,500 | 8,382,640 | |
| Visionchina Media, ADR | 3,968,956a | 7,144,121 | |
| Xinjiang Xinxin Mining Industry, Cl. H | 38,053,000 | 12,641,494 | |
| Zijin Mining Group, Cl. H | 55,500,000 | 23,034,571 | |
| 359,689,608 | |||
| The Fund | 9 |
STATEMENT OF INVESTMENTS (continued)
| Common Stocks (continued) | Shares | Value ($) | |
| Hong Kong—20.9% | |||
| AviChina Industry & Technology, Cl. H | 36,866,000 | 16,140,309 | |
| Belle International Holdings | 5,790,000 | 11,171,731 | |
| China Agri-Industries Holdings | 10,599,000 | 8,266,855 | |
| China Foods | 15,682,000 | 12,329,845 | |
| China Resources Cement Holdings | 7,064,000 | 5,601,510 | |
| China State Construction International Holdings | 33,132,000 | 24,946,429 | |
| CIMC Enric Holdings | 29,396,000a | 9,729,737 | |
| Lifestyle International Holdings | 4,469,000 | 11,959,441 | |
| LK Technology Holdings | 46,017,500a | 13,925,425 | |
| 114,071,282 | |||
| Taiwan—9.5% | |||
| China Petrochemical Development | 13,750,000 | 15,930,553 | |
| Compal Communications | 10,100,000 | 14,317,321 | |
| Hon Hai Precision Industry | 3,600,000 | 9,908,138 | |
| PChome Online | 1,779,000 | 11,659,060 | |
| 51,815,072 | |||
| Total Common Stocks | |||
| (cost $563,648,802) | 525,575,962 | ||
| Number of | |||
| Warrants—1.2% | Warrants | Value ($) | |
| China | |||
| Jiangsu Hengrui Medicine (10/24/12) | 340,000a | 1,544,008 | |
| Ping An Insurance Group (5/5/14) | 880,000a | 5,356,032 | |
| Total Warrants | |||
| (cost $6,656,428) | 6,900,040 | ||
10
| Other Investment—.2% | Shares | Value ($) | |
| Registered Investment Company; | |||
| Dreyfus Institutional Preferred | |||
| Plus Money Market Fund | |||
| (cost $886,000) | 886,000b | 886,000 | |
| Total Investments (cost $571,191,230) | 97.5% | 533,362,002 | |
| Cash and Receivables (Net) | 2.5% | 13,537,675 | |
| Net Assets | 100.0% | 546,899,677 | |
| ADR—American Depository Receipts | |
| a | Non-income producing security. |
| b | Investment in affiliated money market mutual fund. |
| Portfolio Summary (Unaudited)† | |||
| Value (%) | Value (%) | ||
| Financial | 19.8 | Consumer Staples | 10.4 |
| Materials | 17.9 | Energy | 6.0 |
| Industrial | 16.6 | Health Care | 2.6 |
| Consumer Discretionary | 13.0 | Money Market Investment | .2 |
| Information Technology | 11.0 | 97.5 | |
| † Based on net assets. |
| See notes to financial statements. |
| The Fund | 11 |
| STATEMENT OF ASSETS AND LIABILITIES |
| October 31, 2011 |
| Cost | Value | ||||
| Assets ($): | |||||
| Investments in securities—See Statement of Investments: | |||||
| Unaffiliated issuers | 570,305,230 | 532,476,002 | |||
| Affiliated issuers | 886,000 | 886,000 | |||
| Cash | 3,081,678 | ||||
| Cash denominated in foreign currencies | 1,726,834 | 1,728,237 | |||
| Receivable for investment securities sold | 27,100,824 | ||||
| Receivable for shares of Common Stock subscribed | 2,123,287 | ||||
| Dividends receivable | 63 | ||||
| Unrealized appreciation on forward foreign | |||||
| currency exchange contracts—Note 4 | 302 | ||||
| Prepaid expenses | 143,087 | ||||
| 567,539,480 | |||||
| Liabilities ($): | |||||
| Due to The Dreyfus Corporation and affiliates—Note 3(c) | 1,019,201 | ||||
| Payable for investment securities purchased | 18,576,940 | ||||
| Payable for shares of Common Stock redeemed | 705,320 | ||||
| Interest payable—Note 2 | 2,236 | ||||
| Accrued expenses | 336,106 | ||||
| 20,639,803 | |||||
| Net Assets ($) | 546,899,677 | ||||
| Composition of Net Assets ($): | |||||
| Paid-in capital | 561,972,372 | ||||
| Accumulated net realized gain (loss) on investments | 22,758,709 | ||||
| Accumulated net unrealized appreciation (depreciation) | |||||
| on investments and foreign currency transactions | (37,831,404) | ||||
| Net Assets ($) | 546,899,677 | ||||
| Net Asset Value Per Share | |||||
| Class A | Class B | Class C | Class I | ||
| Net Assets ($) | 302,931,606 | 4,039,170 | 153,058,008 | 86,870,893 | |
| Shares Outstanding | 8,662,074 | 127,991 | 4,844,033 | 2,410,284 | |
| Net Asset Value Per Share ($) | 34.97 | 31.56 | 31.60 | 36.04 | |
| See notes to financial statements. | |||||
12
| STATEMENT OF OPERATIONS |
| Year Ended October 31, 2011 |
| Investment Income ($): | ||
| Income: | ||
| Cash dividends (net of $1,172,491 foreign taxes withheld at source): | ||
| Unaffiliated issuers | 13,649,891 | |
| Affiliated issuers | 4,579 | |
| Total Income | 13,654,470 | |
| Expenses: | ||
| Management fee—Note 3(a) | 10,883,496 | |
| Shareholder servicing costs—Note 3(c) | 3,294,876 | |
| Distribution fees—Note 3(b) | 1,845,367 | |
| Custodian fees—Note 3(c) | 849,755 | |
| Professional fees | 147,302 | |
| Prospectus and shareholders’ reports | 142,125 | |
| Directors’ fees and expenses—Note 3(d) | 120,801 | |
| Registration fees | 76,673 | |
| Interest expense—Note 2 | 34,945 | |
| Loan commitment fees—Note 2 | 21,608 | |
| Miscellaneous | 76,372 | |
| Total Expenses | 17,493,320 | |
| Less—reduction in fees due to earnings credits—Note 3(c) | (2,115) | |
| Net Expenses | 17,491,205 | |
| Investment (Loss)—Net | (3,836,735) | |
| Realized and Unrealized Gain (Loss) on Investments—Note 4 ($): | ||
| Net realized gain (loss) on investments and foreign currency transactions: | ||
| Unaffiliated issuers | 32,258,821 | |
| Affiliated issuers | (424,736) | |
| Net realized gain (loss) on forward foreign | ||
| currency exchange contracts | (340,148) | |
| Net Realized Gain (Loss) | 31,493,937 | |
| Net unrealized appreciation (depreciation) on | ||
| investments and foreign currency transactions: | ||
| Unaffiliated issuers | (279,433,129) | |
| Affiliated issuers | (5,905,077) | |
| Net unrealized appreciation (depreciation) on | ||
| forward foreign currency exchange contracts | 302 | |
| Net Unrealized Appreciation (Depreciation) | (285,337,904) | |
| Net Realized and Unrealized Gain (Loss) on Investments | (253,843,967) | |
| Net (Decrease) in Net Assets Resulting from Operations | (257,680,702) | |
See notes to financial statements.
| The Fund | 13 |
STATEMENT OF CHANGES IN NET ASSETS
| Year Ended October 31, | ||||
| 2011 | 2010 | |||
| Operations ($): | ||||
| Investment (loss)—net | (3,836,735) | (7,787,424) | ||
| Net realized gain (loss) on investments | 31,493,937 | 84,511,595 | ||
| Net unrealized appreciation | ||||
| (depreciation) on investments | (285,337,904) | 152,682,426 | ||
| Net Increase (Decrease) in Net Assets | ||||
| Resulting from Operations | (257,680,702) | 229,406,597 | ||
| Dividends to Shareholders from ($): | ||||
| Net realized gain on investments: | ||||
| Class A Shares | (15,851,583) | — | ||
| Class B Shares | (303,557) | — | ||
| Class C Shares | (8,244,961) | — | ||
| Class I Shares | (4,289,908) | — | ||
| Total Dividends | (28,690,009) | — | ||
| Capital Stock Transactions ($): | ||||
| Net proceeds from shares sold: | ||||
| Class A Shares | 104,085,805 | 228,929,922 | ||
| Class B Shares | 102,776 | 449,262 | ||
| Class C Shares | 28,774,813 | 64,020,792 | ||
| Class I Shares | 57,598,937 | 126,866,545 | ||
| Dividends reinvested: | ||||
| Class A Shares | 14,184,782 | — | ||
| Class B Shares | 241,887 | — | ||
| Class C Shares | 5,297,097 | — | ||
| Class I Shares | 2,303,863 | — | ||
| Cost of shares redeemed: | ||||
| Class A Shares | (267,324,135) | (382,993,296) | ||
| Class B Shares | (5,904,878) | (14,020,524) | ||
| Class C Shares | (82,816,215) | (98,037,702) | ||
| Class I Shares | (95,169,090) | (73,887,504) | ||
| Increase (Decrease) in Net Assets | ||||
| from Capital Stock Transactions | (238,624,358) | (148,672,505) | ||
| Total Increase (Decrease) in Net Assets | (524,995,069) | 80,734,092 | ||
| Net Assets ($): | ||||
| Beginning of Period | 1,071,894,746 | 991,160,654 | ||
| End of Period | 546,899,677 | 1,071,894,746 | ||
14
| Year Ended October 31, | ||||
| 2011 | 2010 | |||
| Capital Share Transactions: | ||||
| Class Aa | ||||
| Shares sold | 2,189,146 | 5,128,168 | ||
| Shares issued for dividends reinvested | 280,903 | — | ||
| Shares redeemed | (5,756,520) | (8,903,329) | ||
| Net Increase (Decrease) in Shares Outstanding | (3,286,471) | (3,775,161) | ||
| Class Ba | ||||
| Shares sold | 2,210 | 11,247 | ||
| Shares issued for dividends reinvested | 5,271 | — | ||
| Shares redeemed | (134,653) | (344,754) | ||
| Net Increase (Decrease) in Shares Outstanding | (127,172) | (333,507) | ||
| Class C | ||||
| Shares sold | 648,693 | 1,546,833 | ||
| Shares issued for dividends reinvested | 115,330 | — | ||
| Shares redeemed | (2,005,614) | (2,465,655) | ||
| Net Increase (Decrease) in Shares Outstanding | (1,241,591) | (918,822) | ||
| Class I | ||||
| Shares sold | 1,168,784 | 2,849,360 | ||
| Shares issued for dividends reinvested | 44,347 | — | ||
| Shares redeemed | (1,957,066) | (1,664,621) | ||
| Net Increase (Decrease) in Shares Outstanding | (743,935) | 1,184,739 | ||
| a During the period ended October 31, 2011, 44,704 Class B shares representing $2,015,933 were automatically |
| converted to 40,588 Class A shares and during the period ended October 31, 2010, 128,039 Class B shares |
| representing $5,229,059 were automatically converted to 117,403 Class A shares. |
See notes to financial statements.
| The Fund | 15 |
FINANCIAL HIGHLIGHTS
The following tables describe the performance for each share class for the fiscal periods indicated.All information (except portfolio turnover rate) reflects financial results for a single fund share.Total return shows how much your investment in the fund would have increased (or decreased) during each period, assuming you had reinvested all dividends and distributions.These figures have been derived from the fund’s financial statements.
| Year Ended October 31, | ||||||||||
| Class A Shares | 2011 | 2010 | 2009 | 2008 | 2007 | |||||
| Per Share Data ($): | ||||||||||
| Net asset value, beginning of period | 51.10 | 40.09 | 15.93 | 67.93 | 31.02 | |||||
| Investment Operations: | ||||||||||
| Investment (loss)—neta | (.13) | (.27) | (.10) | (.00)b | (.12) | |||||
| Net realized and unrealized | ||||||||||
| gain (loss) on investments | (14.65) | 11.26 | 24.22 | (43.59) | 41.61 | |||||
| Total from Investment Operations | (14.78) | 10.99 | 24.12 | (43.59) | 41.49 | |||||
| Distributions: | ||||||||||
| Dividends from investment income—net | — | — | — | — | (.45) | |||||
| Dividends from net realized | ||||||||||
| gain on investments | (1.36) | — | — | (8.41) | (4.13) | |||||
| Total Distributions | (1.36) | — | — | (8.41) | (4.58) | |||||
| Proceeds from redemption fees | .01 | .02 | .04 | — | — | |||||
| Net asset value, end of period | 34.97 | 51.10 | 40.09 | 15.93 | 67.93 | |||||
| Total Return (%)c | (29.73) | 27.43 | 151.88 | (72.40) | 148.75 | |||||
| Ratios/Supplemental Data (%): | ||||||||||
| Ratio of total expenses | ||||||||||
| to average net assets | 1.84 | 1.89 | 1.95 | 1.95 | 1.77 | |||||
| Ratio of net expenses | ||||||||||
| to average net assets | 1.84 | 1.89 | 1.94 | 1.94 | 1.75 | |||||
| Ratio of net investment (loss) | ||||||||||
| to average net assets | (.27) | (.60) | (.33) | (.01) | (.26) | |||||
| Portfolio Turnover Rate | 91.44 | 71.53 | 75.14 | 66.07 | 106.59 | |||||
| Net Assets, end of period ($ x 1,000) | 302,932 | 610,538 | 630,399 | 157,682 | 1,008,291 | |||||
| a | Based on average shares outstanding at each month end. |
| b | Amount represents less than $.01 per share. |
| c | Exclusive of sales charge. |
See notes to financial statements.
16
| Year Ended October 31, | ||||||||||
| Class B Shares | 2011 | 2010 | 2009 | 2008 | 2007 | |||||
| Per Share Data ($): | ||||||||||
| Net asset value, beginning of period | 46.61 | 36.86 | 14.77 | 64.18 | 29.53 | |||||
| Investment Operations: | ||||||||||
| Investment (loss)—neta | (.48) | (.59) | (.30) | (.24) | (.50) | |||||
| Net realized and unrealized | ||||||||||
| gain (loss) on investments | (13.22) | 10.32 | 22.39 | (40.76) | 39.50 | |||||
| Total from Investment Operations | (13.70) | 9.73 | 22.09 | (41.00) | 39.00 | |||||
| Distributions: | ||||||||||
| Dividends from investment income—net | — | — | — | — | (.22) | |||||
| Dividends from net realized | ||||||||||
| gain on investments | (1.36) | — | — | (8.41) | (4.13) | |||||
| Total Distributions | (1.36) | — | — | (8.41) | (4.35) | |||||
| Proceeds from redemption fees | .01 | .02 | — | — | — | |||||
| Net asset value, end of period | 31.56 | 46.61 | 36.86 | 14.77 | 64.18 | |||||
| Total Return (%)b | (30.31) | 26.45 | 149.56 | (72.60) | 146.79 | |||||
| Ratios/Supplemental Data (%): | ||||||||||
| Ratio of total expenses | ||||||||||
| to average net assets | 2.61 | 2.60 | 2.69 | 2.68 | 2.58 | |||||
| Ratio of net expenses | ||||||||||
| to average net assets | 2.61 | 2.60 | 2.68 | 2.67 | 2.56 | |||||
| Ratio of net investment (loss) | ||||||||||
| to average net assets | (1.14) | (1.51) | (1.14) | (.68) | (1.19) | |||||
| Portfolio Turnover Rate | 91.44 | 71.53 | 75.14 | 66.07 | 106.59 | |||||
| Net Assets, end of period ($ x 1,000) | 4,039 | 11,892 | 21,696 | 11,021 | 60,319 | |||||
| a | Based on average shares outstanding at each month end. |
| b | Exclusive of sales charge. |
See notes to financial statements.
| The Fund | 17 |
FINANCIAL HIGHLIGHTS (continued)
| Year Ended October 31, | ||||||||||
| Class C Shares | 2011 | 2010 | 2009 | 2008 | 2007 | |||||
| Per Share Data ($): | ||||||||||
| Net asset value, beginning of period | 46.64 | 36.86 | 14.76 | 64.13 | 29.56 | |||||
| Investment Operations: | ||||||||||
| Investment (loss)—neta | (.41) | (.53) | (.31) | (.27) | (.46) | |||||
| Net realized and unrealized | ||||||||||
| gain (loss) on investments | (13.28) | 10.29 | 22.40 | (40.69) | 39.46 | |||||
| Total from Investment Operations | (13.69) | 9.76 | 22.09 | (40.96) | 39.00 | |||||
| Distributions: | ||||||||||
| Dividends from investment income—net | — | — | — | — | (.30) | |||||
| Dividends from net realized | ||||||||||
| gain on investments | (1.36) | — | — | (8.41) | (4.13) | |||||
| Total Distributions | (1.36) | — | — | (8.41) | (4.43) | |||||
| Proceeds from redemption fees | .01 | 0.02 | .01 | — | — | |||||
| Net asset value, end of period | 31.60 | 46.64 | 36.86 | 14.76 | 64.13 | |||||
| Total Return (%)b | (30.26) | 26.56 | 149.73 | (72.60) | 146.90 | |||||
| Ratios/Supplemental Data (%): | ||||||||||
| Ratio of total expenses | ||||||||||
| to average net assets | 2.58 | 2.60 | 2.69 | 2.71 | 2.53 | |||||
| Ratio of net expenses | ||||||||||
| to average net assets | 2.58 | 2.60 | 2.68 | 2.70 | 2.51 | |||||
| Ratio of net investment (loss) | ||||||||||
| to average net assets | (.98) | (1.31) | (1.13) | (.74) | (1.03) | |||||
| Portfolio Turnover Rate | 91.44 | 71.53 | 75.14 | 66.07 | 106.59 | |||||
| Net Assets, end of period ($ x 1,000) | 153,058 | 283,842 | 258,190 | 86,643 | 513,012 | |||||
| a | Based on average shares outstanding at each month end. |
| b | Exclusive of sales charge. |
See notes to financial statements.
18
| Year Ended October 31, | ||||||||||
| Class I Shares | 2011 | 2010 | 2009 | 2008 | 2007a | |||||
| Per Share Data ($): | ||||||||||
| Net asset value, beginning of period | 52.51 | 41.06 | 16.27 | 69.02 | 31.43 | |||||
| Investment Operations: | ||||||||||
| Investment income (loss)—netb | (.03) | (.10) | (.03) | .03 | .08 | |||||
| Net realized and unrealized | ||||||||||
| gain (loss) on investments | (15.09) | 11.53 | 24.81 | (44.37) | 42.16 | |||||
| Total from Investment Operations | (15.12) | 11.43 | 24.78 | (44.34) | 42.24 | |||||
| Distributions: | ||||||||||
| Dividends from investment income—net | — | — | — | — | (.52) | |||||
| Dividends from net realized | ||||||||||
| gain on investments | (1.36) | — | — | (8.41) | (4.13) | |||||
| Total Distributions | (1.36) | — | — | (8.41) | (4.65) | |||||
| Proceeds from redemption fees | .01 | .02 | .01 | — | — | |||||
| Net asset value, end of period | 36.04 | 52.51 | 41.06 | 16.27 | 69.02 | |||||
| Total Return (%) | (29.57) | 27.86 | 152.43 | (72.31) | 149.45 | |||||
| Ratios/Supplemental Data (%): | ||||||||||
| Ratio of total expenses | ||||||||||
| to average net assets | 1.60 | 1.56 | 1.63 | 1.66 | 1.49 | |||||
| Ratio of net expenses | ||||||||||
| to average net assets | 1.60 | 1.56 | 1.62 | 1.65 | 1.47 | |||||
| Ratio of net investment income | ||||||||||
| (loss) to average net assets | (.07) | (.22) | (.09) | .07 | .16 | |||||
| Portfolio Turnover Rate | 91.44 | 71.53 | 75.14 | 66.07 | 106.59 | |||||
| Net Assets, end of period ($ x 1,000) | 86,871 | 165,622 | 80,875 | 24,147 | 233,751 | |||||
| a | Effective June 1, 2007, Class R shares were redesignated as Class I shares. |
| b | Based on average shares outstanding at each month end. |
See notes to financial statements.
| The Fund | 19 |
NOTES TO FINANCIAL STATEMENTS
NOTE 1—Significant Accounting Policies:
Dreyfus Greater China Fund (the “fund”) is a separate non-diversified series of Dreyfus Premier Investment Funds, Inc. (the “Company”), which is registered under the Investment Company Act of 1940, as amended (the “Act”), as an open-end management investment company and operates as a series company currently offering nine series, including the fund.The fund’s investment objective is to seek long-term capital appreciation. The Dreyfus Corporation (the “Manager” or “Dreyfus”), a wholly-owned subsidiary of The Bank of New York Mellon Corporation (“BNY Mellon”), serves as the fund’s investment adviser. Hamon Asian Advisors Ltd. (“Hamon”) serves as the fund’s sub-investment adviser. Effective November 4, 2011, Hamon U.S. Investment Advisors Ltd. changed the company’s name to Hamon Asian Advisors Ltd. Hamon is an affiliate of Dreyfus.
MBSC Securities Corporation (the “Distributor”), a wholly-owned subsidiary of Dreyfus, is the distributor of the fund’s shares.The fund is authorized to issue 1 billion shares of $.001 par value Common Stock.The fund currently offers four classes of shares: Class A (400 million shares authorized), Class B (200 million shares authorized), Class C (200 million shares authorized), and Class I (200 million shares authorized). Class A shares are subject to a sales charge imposed at the time of purchase. Class B shares are subject to a contingent deferred sales charge (“CDSC”) imposed on Class B share redemptions made within six years of purchase and automatically convert to Class A shares after six years.The fund no longer offers Class B shares, except in connection with dividend reinvestment and permitted exchanges of Class B shares and, effective on or about March 13, 2012, all outstanding Class B shares will automatically convert to Class A shares. Class C shares are subject to a CDSC imposed on Class C shares redeemed within one year of purchase. Class I shares are sold at net asset value per share only to institutional investors. Other differences between the classes include the services offered to and the expenses borne by each class, the allocation of certain transfer agency costs and certain voting
20
rights. Income, expenses (other than expenses attributable to a specific class), and realized and unrealized gains or losses on investments are allocated to each class of shares based on its relative net assets.
The Company accounts separately for the assets, liabilities and operations of each series. Expenses directly attributable to each series are charged to that series’ operations; expenses which are applicable to all series are allocated among them on a pro rata basis.
The Financial Accounting Standards Board (“FASB”) Accounting Standards Codification (“ASC”) is the exclusive reference of authoritative U.S. generally accepted accounting principles (“GAAP”) recognized by the FASB to be applied by nongovernmental entities. Rules and interpretive releases of the Securities and Exchange Commission (“SEC”) under authority of federal laws are also sources of authoritative GAAP for SEC registrants. The fund’s financial statements are prepared in accordance with GAAP, which may require the use of management estimates and assumptions.Actual results could differ from those estimates.
The Company enters into contracts that contain a variety of indemnifications. The fund’s maximum exposure under these arrangements is unknown.The fund does not anticipate recognizing any loss related to these arrangements.
(a) Portfolio valuation: The fair value of a financial instrument is the amount that would be received to sell an asset or paid to transfer a liability in an orderly transaction between market participants at the measurement date (i.e. the exit price). GAAP establishes a fair value hierarchy that prioritizes the inputs of valuation techniques used to measure fair value.This hierarchy gives the highest priority to unadjusted quoted prices in active markets for identical assets or liabilities (Level 1 measurements) and the lowest priority to unobservable inputs (Level 3 measurements).
| The Fund | 21 |
NOTES TO FINANCIAL STATEMENTS (continued)
Additionally, GAAP provides guidance on determining whether the volume and activity in a market has decreased significantly and whether such a decrease in activity results in transactions that are not orderly. GAAP requires enhanced disclosures around valuation inputs and techniques used during annual and interim periods.
Various inputs are used in determining the value of the fund’s investments relating to fair value measurements.These inputs are summarized in the three broad levels listed below:
Level 1—unadjusted quoted prices in active markets for identical investments.
Level 2—other significant observable inputs (including quoted prices for similar investments, interest rates, prepayment speeds, credit risk, etc.).
Level 3—significant unobservable inputs (including the fund’s own assumptions in determining the fair value of investments).
The inputs or methodology used for valuing securities are not necessarily an indication of the risk associated with investing in those securities.
Changes in valuation techniques may result in transfers in or out of an assigned level within the disclosure hierarchy. Valuation techniques used to value the fund’s investments are as follows:
Investments in securities are valued at the last sales price on the securities exchange or national securities market on which such securities are primarily traded. Securities listed on the National Market System for which market quotations are available are valued at the official closing price or, if there is no official closing price that day, at the last sales price. Securities not listed on an exchange or the national securities market, or securities for which there were no transactions, are valued at the average of the most recent bid and asked prices, except for open short positions, where the asked price is used for valuation purposes. Bid price is used when no asked price is available. Registered investment
22
companies that are not traded on an exchange are valued at their net asset value. All preceding securities are categorized within Level 1 of the fair value hierarchy.
Fair valuing of securities may be determined with the assistance of a pricing service using calculations based on indices of domestic securities and other appropriate indicators, such as prices of relevant ADRs and futures contracts. Utilizing these techniques may result in transfers between Level 1 and Level 2 of the fair value hierarchy.
When market quotations or official closing prices are not readily available, or are determined not to reflect accurately fair value, such as when the value of a security has been significantly affected by events after the close of the exchange or market on which the security is principally traded (for example, a foreign exchange or market), but before the fund calculates its net asset value, the fund may value these investments at fair value as determined in accordance with the procedures approved by the Board of Directors. Certain factors may be considered when fair valuing investments such as: fundamental analytical data, the nature and duration of restrictions on disposition, an evaluation of the forces that influence the market in which the securities are purchased and sold, and public trading in similar securities of the issuer or comparable issuers. These securities are either categorized as Level 2 or 3 depending on the relevant inputs used.
For restricted securities where observable inputs are limited, assumptions about market activity and risk are used and are categorized within Level 3 of the fair value hierarchy.
Investments denominated in foreign currencies are translated to U.S. dollars at the prevailing rates of exchange. Forward foreign currency exchange contracts (“forward contracts”) are valued at the forward rate. These securities are generally categorized within Level 2 of the fair value hierarchy.
| The Fund | 23 |
NOTES TO FINANCIAL STATEMENTS (continued)
The following is a summary of the inputs used as of October 31, 2011 in valuing the fund’s investments:
| Level 2—Other | Level 3— | ||||
| Level 1— | Significant | Significant | |||
| Unadjusted | Observable | Unobservable | |||
| Quoted Prices | Inputs | Inputs | Total | ||
| Assets ($) | |||||
| Investments in Securities: | |||||
| Equity Securities— | |||||
| Foreign† | 24,541,159 | 501,034,803 | †† | — | 525,575,962 |
| Mutual Funds | 886,000 | — | — | 886,000 | |
| Warrants† | 6,900,040 | — | — | 6,900,040 | |
| Other Financial | |||||
| Instruments: | |||||
| Forward Foreign | |||||
| Currency Exchange | |||||
| Contracts††† | — | 302 | — | 302 | |
| † | See Statement of Investments for additional detailed categorizations. |
| †† | Securities classified as Level 2 at period end as the values were determined pursuant to the fund’s |
| fair valuation procedures. | |
| ††† Amount shown represents unrealized appreciation at period end. | |
The following is a reconciliation of Level 3 assets for which significant unobservable inputs were used to determine fair value:
| Investments in | ||
| Equity Securities—Foreign ($) | ||
| Balance as of 10/31/2010 | 32,666,453 | |
| Realized gain (loss) | — | |
| Change in unrealized appreciation (depreciation) | — | |
| Net purchases (sales) | — | |
| Transfers into Level 3 | — | |
| Transfers out of Level 3†††† | (32,666,453) | |
| Balance as of 10/31/2011 | — | |
| The amount of total gains (losses) for the | ||
| period included in earnings attributable to | ||
| the change in unrealized gains (losses) relating | ||
| to investments still held at 10/31/2011 | — | |
| †††† | Transfers out of Level 3 represent the value at the date of transfer.The transfer out of Level 3 |
| for the current period was due to the resumption of trading of a security. |
In May 2011, FASB issued Accounting Standards Update (“ASU”) No. 2011-04 “Amendments to Achieve Common Fair Value Measurement
24
and Disclosure Requirements in GAAP and International Financial Reporting Standards (“IFRS”)” (“ASU 2011-04”). ASU 2011-04 includes common requirements for measurement of and disclosure about fair value between GAAP and IFRS. ASU 2011-04 will require reporting entities to disclose the following information for fair value measurements categorized within Level 3 of the fair value hierarchy: quantitative information about the unobservable inputs used in the fair value measurement, the valuation processes used by the reporting entity and a narrative description of the sensitivity of the fair value measurement to changes in unobservable inputs and the interrelationships between those unobservable inputs. In addition, ASU 2011-04 will require reporting entities to make disclosures about amounts and reasons for all transfers in and out of Level 1 and Level 2 fair value measurements.The new and revised disclosures are effective for interim and annual reporting periods beginning after December 15, 2011. At this time, management is evaluating the implications of ASU 2011-04 and its impact on the financial statements.
(b) Foreign currency transactions: The fund does not isolate that portion of the results of operations resulting from changes in foreign exchange rates on investments from the fluctuations arising from changes in the market prices of securities held. Such fluctuations are included with the net realized and unrealized gain or loss on investments.
Net realized foreign exchange gains or losses arise from sales of foreign currencies, currency gains or losses realized on securities transactions between trade and settlement date and the difference between the amounts of dividends, interest and foreign withholding taxes recorded on the fund’s books and the U.S. dollar equivalent of the amounts actually received or paid. Net unrealized foreign exchange gains and losses arise from changes in the value of assets and liabilities other than investments resulting from changes in exchange rates. Foreign currency gains and losses on investments are included with net realized and unrealized gain or loss on investments.
| The Fund | 25 |
NOTES TO FINANCIAL STATEMENTS (continued)
(c) Securities transactions and investment income: Securities transactions are recorded on a trade date basis. Realized gains and losses from securities transactions are recorded on the identified cost basis. Dividend income is recognized on the ex-dividend date and interest income, including, where applicable, accretion of discount and amortization of premium on investments, is recognized on the accrual basis.
The fund follows an investment policy of investing primarily in Asian emerging market countries. Because the fund’s investments are concentrated in Asian emerging market countries, the fund’s performance is expected to be closely tied to social, political and economic conditions within Asia and to be more volatile than the performance of more geographically diversified funds.
Investing in foreign markets may involve special risks and considerations not typically associated with investing in the U.S. These risks include revaluation of currencies, high rates of inflation, repatriation restrictions on income and capital, and adverse political and economic developments. Moreover, securities issued in these markets may be less liquid, subject to government ownership controls and delayed settlements, and their prices may be more volatile than those of comparable securities in the U.S.
(d) Affiliated issuers: Investments in other investment companies advised by Dreyfus are defined as “affiliated” in the Act.
The fund may invest in shares of certain affiliated investment companies also advised or managed by Dreyfus. Investments in affiliated investment companies for the period ended October 31, 2011 were as follows:
| Affiliated | |||||||
| Investment | Value | Value | Net | ||||
| Company | 10/31/2010 | ($) | Purchases ($) | Sales ($) | 10/31/2011 | ($) | Assets (%) |
| Dreyfus | |||||||
| Institutional | |||||||
| Preferred | |||||||
| Plus Money | |||||||
| Market Fund | — | 204,352,000 | 203,466,000 | 886,000 | .2 |
26
Issuers in which the fund held 5% or more of the outstanding voting shares are also defined as “affiliated” in the Act. The following summarizes affiliated issuers, excluding investments in other investment companies, during the period ended October 31, 2011:
| Shares | ||||||
| Dividend | Market | |||||
| Name of issuer | 10/31/2010 | Purchases | Sales | 10/31/2011 Income ($) | Value ($) | |
| CIMC Enric | ||||||
| Holdings† | 37,892,000 | 8,654,000 | 17,150,000 | 29,396,000 | — | 9,729,737 |
| Inspur | ||||||
| International† | 180,055,000 | 14,900,000 | 194,955,000 | — | — | — |
| LK Technology | ||||||
| Holdings† | 59,187,500 | — | 13,170,000 | 46,017,500 | — | 13,925,425 |
| Spreadtrum | ||||||
| Communications, | ||||||
| ADR† | 2,463,415 | — | 2,463,415 | — | — | — |
| Visionchina | ||||||
| Media, ADR† | 4,187,182 | — | 218,226 | 3,968,956 | — | 7,144,121 |
| † | No longer an affiliated issuer as of October 31, 2011. |
(e) Dividends to shareholders: Dividends are recorded on the ex-dividend date. Dividends from investment income-net and dividends from net realized capital gains, if any, are normally declared and paid annually, but the fund may make distributions on a more frequent basis to comply with the distribution requirements of the Internal Revenue Code of 1986, as amended (the “Code”).To the extent that net realized capital gains can be offset by capital loss carryovers, it is the policy of the fund not to distribute such gains. Income and capital gain distributions are determined in accordance with income tax regulations, which may differ from GAAP.
(f) Federal income taxes: It is the policy of the fund to continue to qualify as a regulated investment company, if such qualification is in the best interests of its shareholders, by complying with the applicable provisions of the Code, and to make distributions of taxable income sufficient to relieve it from substantially all federal income and excise taxes.
| The Fund | 27 |
NOTES TO FINANCIAL STATEMENTS (continued)
As of and during the period ended October 31, 2011, the fund did not have any liabilities for any uncertain tax positions.The fund recognizes interest and penalties, if any, related to uncertain tax positions as income tax expense in the Statement of Operations. During the period, the fund did not incur any interest or penalties.
Each of the tax years in the four-year period ended October 31, 2011 remains subject to examination by the Internal Revenue Service and state taxing authorities.
At October 31, 2011, the components of accumulated earnings on a tax basis were as follows: undistributed capital gains $27,697,647 and unrealized depreciation $42,770,342.
The tax character of distributions paid to shareholders during the fiscal periods ended October 31, 2011 and October 31, 2010 were as follows: long-term capital gains $28,690,009 and $0, respectively.
During the period ended October 31, 2011, as a result of permanent book to tax differences, primarily due to the tax treatment for foreign currency gains and losses and net operating losses, the fund increased accumulated undistributed investment income-net by $3,836,735, increased accumulated net realized gain (loss) on investments by $784,463 and decreased paid-in capital by $4,621,198. Net assets and net asset value per share were not affected by this reclassification.
NOTE 2—Bank Lines of Credit:
The fund participates with other Dreyfus-managed funds in a $225 million unsecured credit facility led by Citibank, N.A. and a $300 million unsecured credit facility provided by The Bank of New York Mellon, a subsidiary of BNY Mellon and an affiliate of Dreyfus (each, a “Facility”), each to be utilized primarily for temporary or emergency purposes, including the financing of redemptions. In connection therewith, the fund has agreed to pay its pro rata portion of commitment fees for each Facility. Interest is charged to the fund based on rates determined pursuant to the terms of the respective Facility at the time of borrowing.
28
The average amount of borrowings outstanding under the Facilities during the period ended October 31, 2011, was approximately $2,519,300, with a related weighted average annualized interest rate of 1.39%.
NOTE 3—Management Fee, Sub-Investment Advisory Fee and Other Transactions with Affiliates:
(a) Pursuant to a management agreement with Dreyfus, the management fee is computed at the annual rate of 1.25% of the value of the fund’s average daily net assets and is payable monthly.
Pursuant to a sub-investment advisory agreement between Dreyfus and Hamon, Dreyfus pays Hamon a fee at the annual rate of .625% of the value of the fund’s average daily net assets and is payable monthly.
During the period ended October 31, 2011, the Distributor retained $178,042 from commissions earned on sales of the fund’s Class A shares and $6,893 and $91,766 from CDSCs on redemptions of the fund’s Class B and Class C shares, respectively.
(b) Under the Distribution Plan (the “Plan”) adopted pursuant to Rule 12b-1 under the Act, Class B and Class C shares pay the Distributor for distributing their shares at an annual rate of .75% of the value of the average daily net assets of Class B and Class C shares. During the period ended October 31, 2011, Class B and Class C shares were charged $57,378 and $1,787,989, respectively, pursuant to the Plan.
(c) Under the Shareholder Services Plan, Class A, Class B and Class C shares pay the Distributor at an annual rate of .25% of the value of their average daily net assets for the provision of certain services.The services provided may include personal services relating to shareholder accounts, such as answering shareholder inquiries regarding the fund and providing reports and other information, and services related to the maintenance of shareholder accounts.The Distributor may make payments to Service Agents (a securities dealer, financial institution or other industry professional) in respect of these services.The Distributor determines the amounts to be paid to Service Agents. During the
| The Fund | 29 |
NOTES TO FINANCIAL STATEMENTS (continued)
period ended October 31, 2011, Class A, Class B and Class C shares were charged $1,219,577, $19,126 and $595,996, respectively, pursuant to the Shareholder Services Plan.
The fund compensates Dreyfus Transfer, Inc., a wholly-owned subsidiary of Dreyfus, under a transfer agency agreement for providing personnel and facilities to perform transfer agency services for the fund. During the period ended October 31, 2011, the fund was charged $386,210 pursuant to the transfer agency agreement, which is included in Shareholder servicing costs in the Statement of Operations.
The fund has arrangements with the custodian and cash management bank whereby the fund may receive earnings credits when positive cash balances are maintained, which are used to offset custody and cash management fees. For financial reporting purposes, the fund includes net earnings credits as an expense offset in the Statement of Operations.
The fund compensates The Bank of New York Mellon under a cash management agreement for performing cash management services related to fund subscriptions and redemptions. During the period ended October 31, 2011, the fund was charged $47,195 pursuant to the cash management agreement, which is included in Shareholder servicing costs in the Statement of Operations. These fees were partially offset by earnings credits of $2,115.
The fund also compensates The Bank of New York Mellon under a custody agreement for providing custodial services for the fund. During the period ended October 31, 2011, the fund was charged $849,755 pursuant to the custody agreement.
During the period ended October 31, 2011, the fund was charged $6,751 for services performed by the Chief Compliance Officer.
The components of “Due to The Dreyfus Corporation and affiliates” in the Statement of Assets and Liabilities consist of: management fees $535,691, Rule 12b-1 distribution plan fees $93,512, shareholder services plan fees $90,459, custodian fees $220,805, chief compliance officer fees $4,246 and transfer agency per account fees $74,488.
30
(d) Each Board member also serves as a Board member of other funds within the Dreyfus complex. Annual retainer fees and attendance fees are allocated to each fund based on net assets.
(e) A 2% redemption fee is charged and retained by the fund on certain shares redeemed within sixty days following the date of issuance subject to exceptions, including redemptions made through use of the fund’s exchange privilege. During the period ended October 31, 2011, redemption fees charged and retained by the fund amounted to $164,753.
NOTE 4—Securities Transactions:
The aggregate amount of purchases and sales of investment securities, excluding short-term securities and forward contracts, during the period ended October 31, 2011, amounted to $784,841,596 and $1,067,782,412, respectively.
Forward Foreign Currency Exchange Contracts: The fund enters into forward contracts in order to hedge its exposure to changes in foreign currency exchange rates on its foreign portfolio holdings, to settle foreign currency transactions or as a part of its investment strategy. When executing forward contracts, the fund is obligated to buy or sell a foreign currency at a specified rate on a certain date in the future. With respect to sales of forward contracts, the fund incurs a loss if the value of the contract increases between the date the forward contract is opened and the date the forward contract is closed.The fund realizes a gain if the value of the contract decreases between those dates. With respect to purchases of forward contracts, the fund incurs a loss if the value of the contract decreases between the date the forward contract is opened and the date the forward contract is closed.The fund realizes a gain if the value of the contract increases between those dates. Any realized gain or loss which occurred during the period is reflected in the Statement of Operations.The fund is exposed to foreign currency risk as a result of changes in value of underlying financial instruments.
| The Fund | 31 |
NOTES TO FINANCIAL STATEMENTS (continued)
The fund is also exposed to credit risk associated with counterparty nonperformance on these forward contracts, which is typically limited to the unrealized gain on each open contract.
The following summarizes open forward contracts at October 31, 2011:
| Foreign | ||||
| Forward Foreign Currency | Currency | Unrealized | ||
| Exchange Contracts | Amount | Proceeds ($) | Value ($) | Appreciation ($) |
| Sales; | ||||
| Hong Kong Dollar, | ||||
| Expiring 11/1/2011 | 14,000,000 | 1,802,382 | 1,802,080 | 302 |
The following summarizes the average market value of derivatives outstanding during the period ended October 31, 2011:
| Average Market Value ($) | |
| Forward contracts | 2,115,467 |
At October 31, 2011, the cost of investments for federal income tax purposes was $576,130,168; accordingly, accumulated net unrealized depreciation on investments was $42,768,166, consisting of $56,277,971 gross unrealized appreciation and $99,046,137 gross unrealized depreciation.
32
| REPORT OF INDEPENDENT REGISTERED |
| PUBLIC ACCOUNTING FIRM |
Shareholders and Board of Directors
Dreyfus Greater China Fund
We have audited the accompanying statement of assets and liabilities, including the statement of investments, of Dreyfus Greater China Fund (one of the series comprising Dreyfus Premier Investment Funds, Inc.) as of October 31, 2011, and the related statement of operations for the year then ended, the statement of changes in net assets for each of the two years in the period then ended, and financial highlights for each of the years indicated therein. These financial statements and financial highlights are the responsibility of the Fund’s management. Our responsibility is to express an opinion on these financial statements and financial highlights based on our audits.
We conducted our audits in accordance with the standards of the Public Company Accounting Oversight Board (United States).Those standards require that we plan and perform the audit to obtain reasonable assurance about whether the financial statements and financial highlights are free of material misstatement.We were not engaged to perform an audit of the Fund’s internal control over financial reporting. Our audits included consideration of internal control over financial reporting as a basis for designing audit procedures that are appropriate in the circumstances, but not for the purpose of expressing an opinion on the effectiveness of the Fund’s internal control over financial reporting. Accordingly, we express no such opinion.An audit also includes examining, on a test basis, evidence supporting the amounts and disclosures in the financial statements and financial highlights, assessing the accounting principles used and significant estimates made by management, and evaluating the overall financial statement presentation. Our procedures included confirmation of securities owned as of October 31, 2011 by correspondence with the custodian and others. We believe that our audits provide a reasonable basis for our opinion.
In our opinion, the financial statements and financial highlights referred to above present fairly, in all material respects, the financial position of Dreyfus Greater China Fund at October 31, 2011, the results of its operations for the year then ended, the changes in its net assets for each of the two years in the period then ended, and the financial highlights for each of the indicated years, in conformity with U.S. generally accepted accounting principles.

| New York, New York |
| December 29, 2011 |
| The Fund | 33 |
IMPORTANT TAX INFORMATION (Unaudited)
In accordance with federal tax law, the fund elects to provide each shareholder with their portion of the fund’s foreign taxes paid and the income sourced from foreign countries. Accordingly, the fund hereby makes the following designations regarding its fiscal year ended October 31, 2011:
—the total amount of taxes paid to foreign countries was $1,172,491
—the total amount of income sourced from foreign countries was $14,835,297.
Where required by federal tax law rules, shareholders will receive notification of their proportionate share of foreign taxes paid and foreign sourced income for the 2011 calendar year with Form 1099-DIV which will be mailed in early 2012. Also, the fund hereby designates $1.3567 per share as a long-term capital gain distribution paid on December 21, 2010.
34
PROXY RESULTS (Unaudited)
The Company held a special meeting of shareholders on May 31, 2011.The proposal considered at the meeting, and the results, are as follows:
| Shares | |||
| Votes For | Authority Withheld | ||
| To elect Board Members: | |||
| Joseph S. DiMartino† | 119,515,411 | 644,860 | |
| Phillip L. Toia† | 119,502,800 | 657,471 | |
| Robin A. Melvin† | 119,566,042 | 594,229 |
| † Each new Board member’s term commenced on May 31, 2011. |
| In addition Gordon J. Davis, Esq., David P. Feldman and Lynn Martin continue as Board members of the Company. |
| The Fund | 35 |
| INFORMATION ABOUT THE RENEWAL OF THE |
| FUND’S MANAGEMENT AND SUB-INVESTMENT |
| ADVISORY AGREEMENTS (Unaudited) |
At a meeting of the fund’s Board of Directors held on July 12, 2011, the Board considered the renewal of the fund’s Management Agreement, pursuant to which Dreyfus provides the fund with investment advisory and administrative services (the “Agreement”), and the Sub-Investment Advisory Agreement (together, the “Agreements”), pursuant to which Hamon U.S. Investment Advisors Ltd. (the“Sub-Adviser”) provides day-to-day management of the fund’s investments. The Board members, none of whom are “interested persons” (as defined in the Investment Company Act of 1940, as amended) of the fund, were assisted in their review by independent legal counsel and met with counsel in executive session separate from representatives of Dreyfus and the Sub-Adviser. In considering the renewal of the Agreements, the Board considered all factors that it believed to be relevant, including those discussed below.The Board did not identify any one factor as dispositive, and each Board member may have attributed different weights to the factors considered.
Analysis of Nature, Extent, and Quality of Services Provided to the Fund. The Board considered information previously provided to them in presentations from Dreyfus representatives regarding the nature, extent, and quality of the services provided to funds in the Dreyfus fund complex, and Dreyfus representatives confirmed that there had been no material changes in this information. Dreyfus provided the number of open accounts in the fund, the fund’s asset size and the allocation of fund assets among distribution channels. Dreyfus also had previously provided information regarding the diverse intermediary relationships and distribution channels of funds in the Dreyfus fund complex and Dreyfus’ corresponding need for broad, deep, and diverse resources to be able to provide ongoing shareholder services to each distribution channel, including the distribution channel(s) for the fund.
The Board also considered research support available to, and portfolio management capabilities of, the fund’s portfolio management personnel and that Dreyfus also provides oversight of day-to-day fund operations, including fund accounting and administration and assistance in meeting legal and regulatory requirements.The Board also considered Dreyfus’ extensive administrative, accounting, and compliance infrastructures, as
36
well as Dreyfus’ supervisory activities over the Sub-Adviser.The Board also considered portfolio management’s brokerage policies and practices (including policies and practices regarding soft dollars) and the standards applied in seeking best execution.
Comparative Analysis of the Fund’s Performance and Management Fee and Expense Ratio. The Board reviewed reports prepared by Lipper, Inc. (“Lipper”), an independent provider of investment company data, which included information comparing (1) the fund’s performance with the performance of a group of comparable funds (the “Performance Group”) and with a broader group of funds (the “Performance Universe”), all for various periods ended May 31, 2011, and (2) the fund’s actual and contractual management fees and total expenses with those of a group of comparable funds (the “Expense Group”) and with a broader group of funds (the “Expense Universe”), the information for which was derived in part from fund financial statements available to Lipper as of May 31, 2011. Dreyfus previously had furnished the Board with a description of the methodology Lipper used to select the Performance Group and Performance Universe and the Expense Group and Expense Universe.
Dreyfus representatives stated that the usefulness of performance comparisons may be affected by a number of factors, including different investment limitations that may be applicable to the fund and comparison funds.They also noted that performance generally should be considered over longer periods of time, although it is possible that long-term performance can be adversely affected by even one period of significant underperformance so that a single investment decision or theme has the ability to affect disproportionately long term performance. The Board discussed the results of the comparisons and noted that the fund’s total return performance was variously above and below the Performance Group and Performance Universe medians. Dreyfus also provided a comparison of the fund’s calendar year total returns to the returns of the fund’s benchmark index.
| The Fund | 37 |
| INFORMATION ABOUT THE RENEWAL OF THE FUND’S MANAGEMENT AND |
| SUB-INVESTMENT ADVISORY AGREEMENTS (Unaudited) (continued) |
The Board also reviewed the range of actual and contractual management fees and total expenses of the Expense Group and Expense Universe funds and discussed the results of the comparisons.The Board noted that the fund’s contractual management fee was above the Expense Group median and the fund’s actual management fee and total expense ratio were above the Expense Group and Expense Universe medians.
Dreyfus representatives reviewed with the Board the management or investment advisory fees (1) paid by funds advised or administered by Dreyfus that are in the same Lipper category as the fund and (2) paid to Dreyfus or the Sub-Adviser or its affiliates for advising any separate accounts and/or other types of client portfolios that are considered to have similar investment strategies and policies as the fund (the “Similar Clients”), and explained the nature of the Similar Clients.They discussed differences in fees paid and the relationship of the fees paid in light of any differences in the services provided and other relevant factors.The Board considered the relevance of the fee information provided for the Similar Clients to evaluate the appropriateness and reasonableness of the fund’s management fee.
The Board considered the fee to the Sub-Adviser in relation to the fee paid to Dreyfus by the fund and the respective services provided by the Sub-Adviser and Dreyfus.The Board also noted the Sub-Adviser’s fee is paid by Dreyfus (out of its fee from the fund) and not the fund.
Analysis of Profitability and Economies of Scale. Dreyfus representatives reviewed the expenses allocated and profit received by Dreyfus and the resulting profitability percentage for managing the fund, and the method used to determine the expenses and profit. The Board concluded that the profitability results were not unreasonable, given the services rendered and service levels provided by Dreyfus. The Board previously had been provided with information prepared by an independent consulting firm regarding Dreyfus’ approach to allocating
38
costs to, and determining the profitability of, individual funds and the entire Dreyfus fund complex. The consulting firm also had analyzed where any economies of scale might emerge in connection with the management of a fund.
The Board’s counsel stated that the Board should consider the profitability analysis (1) as part of their evaluation of whether the fees under the Agreements bear a reasonable relationship to the mix of services provided by Dreyfus and the Sub-Adviser, including the nature, extent and quality of such services, and (2) in light of the relevant circumstances for the fund and the extent to which economies of scale would be realized if the fund grows and whether fee levels reflect these economies of scale for the benefit of fund shareholders. Since Dreyfus, and not the fund, pays the Sub-Adviser pursuant to the Sub-Investment Advisory Agreement, the Board did not consider the Sub-Adviser’s profitability to be relevant to its deliberations. Dreyfus representatives noted that a discussion of economies of scale is predicated on a fund having achieved a substantial size with increasing assets and that, if a fund’s assets had been stable or decreasing, the possibility that Dreyfus may have realized any economies of scale would be less. Dreyfus representatives also noted that, as a result of shared and allocated costs among funds in the Dreyfus fund complex, the extent of economies of scale could depend substantially on the level of assets in the complex as a whole, so that increases and decreases in complex-wide assets can affect potential economies of scale in a manner that is disproportionate to, or even in the opposite direction from, changes in the fund’s asset level. The Board also considered potential benefits to Dreyfus and the Sub-Adviser from acting as investment adviser and sub-investment adviser, respectively, and noted the soft dollar arrangements in effect for trading the fund’s investments.
| The Fund | 39 |
| INFORMATION ABOUT THE RENEWAL OF THE FUND’S MANAGEMENT AND |
| SUB-INVESTMENT ADVISORY AGREEMENTS (Unaudited) (continued) |
At the conclusion of these discussions, the Board agreed that it had been furnished with sufficient information to make an informed business decision with respect to the renewal of the Agreements. Based on the discussions and considerations as described above, the Board concluded and determined as follows.
The Board concluded that the nature, extent and quality of the services provided by Dreyfus and the Sub-Adviser are adequate and appropriate.
The Board generally was satisfied with the fund’s overall performance, in light of the considerations described above.
The Board concluded that the fees paid to Dreyfus and the Sub- Adviser were reasonable in light of the considerations described above.
The Board determined that the economies of scale which may accrue to Dreyfus and its affiliates in connection with the management of the fund had been adequately considered by Dreyfus in connection with the fee rate charged to the fund pursuant to the Agreement and that, to the extent in the future it were determined that material economies of scale had not been shared with the fund, the Board would seek to have those economies of scale shared with the fund.
The Board considered these conclusions and determinations, along with information received on a routine and regular basis throughout the year. In addition, it should be noted that the Board’s consideration of the contractual fee arrangements for this fund had the benefit of a number of years of reviews of prior or similar agreements during which lengthy discussions took place between the Board and Dreyfus representatives. Certain aspects of the arrangements may receive greater scrutiny in some years than in others, and the Board’s conclusions may be based, in part, on their consideration of the same or similar arrangements in prior years.The Board determined that renewal of the Agreements was in the best interests of the fund and its shareholders.
40
BOARD MEMBERS INFORMATION (Unaudited)
| Joseph S. DiMartino (68) |
| Chairman of the Board (1995) |
| Principal Occupation During Past 5Years: |
| • Corporate Director and Trustee |
| Other Public Company Board Memberships During Past 5Years: |
| • CBIZ (formerly, Century Business Services, Inc.), a provider of outsourcing functions for small |
| and medium size companies, Director (1997-present) |
| • Sunair Services Corporation, a provider of certain outdoor-related services to homes and |
| businesses, Director (2005-2009) |
| • The Newark Group, a provider of a national market of paper recovery facilities, paperboard |
| mills and paperboard converting plants, Director (2000-2010) |
| No. of Portfolios for which Board Member Serves: 167 |
| ——————— |
| Gordon J. Davis (70) |
| Board Member (1994) |
| Principal Occupation During Past 5Years: |
| • Partner in the law firm of Dewey & LeBoeuf LLP |
| Other Public Company Board Memberships During Past 5Years: |
| • Consolidated Edison, Inc., a utility company, Director (1997-present) |
| • The Phoenix Companies Inc., a life insurance company, Director (2000-present) |
| No. of Portfolios for which Board Member Serves: 44 |
| ——————— |
| David P. Feldman (71) |
| Board Member (1991) |
| Principal Occupation During Past 5Years: |
| • Corporate Director and Trustee |
| Other Public Company Board Memberships During Past 5Years: |
| • BBH Mutual Funds Group (4 registered mutual funds), Director (1992-present) |
| • QMed Inc., a healthcare company, Director (1999-2007) |
| No. of Portfolios for which Board Member Serves: 50 |
| The Fund | 41 |
BOARD MEMBERS INFORMATION (Unaudited) (continued)
| Lynn Martin (71) |
| Board Member (1993) |
| Principal Occupation During Past 5Years: |
| • President of The Martin Hall Group LLC, a human resources consulting firm, from |
| January 2005-present |
| • Advisor to the international accounting firm of Deloitte & Touche, LLP and Chair to its |
| Council for the Advancement of Women from March 1993-September 2005 |
| Other Public Company Board Memberships During Past 5Years: |
| • AT&T Inc., a telecommunications company, Director (1999-present) |
| • Ryder System, Inc., a supply chain and transportation management company, Director (1993-present) |
| • The Proctor & Gamble Co., a consumer products company, Director (1994-present) |
| • Constellation Energy Group Inc., Director (2003-present) |
| No. of Portfolios for which Board Member Serves: 15 |
| ——————— |
| Robin A. Melvin (48) |
| Board Member (2011) |
| Principal Occupation During Past 5Years: |
| • Director, Boisi Family Foundation, a private family foundation that supports youth-serving |
| organizations that promote the self sufficiency of youth from disadvantaged circumstances |
| (1995-present) |
| • SeniorVice President, Mentor, a national non-profit youth mentoring organization (1992-2005) |
| No. of Portfolios for which Board Member Serves: 54 |
| ——————— |
| Philip L. Toia (78) |
| Board Member (1997) |
| Principal Occupation During Past 5Years: |
| • Private Investor |
| No. of Portfolios for which Board Member Serves: 25 |
| ——————— |
Once elected all Board Members serve for an indefinite term, but achieve Emeritus status upon reaching age 80.The address of the Board Members and Officers is in c/o The Dreyfus Corporation, 200 Park Avenue, NewYork, NewYork 10166.Additional information about the Board Members is available in the fund’s Statement of Additional Information which can be obtained from Dreyfus free of charge by calling this toll free number: 1-800-DREYFUS.
Daniel Rose, Emeritus Board Member
Sander Vanocur, Emeritus Board Member
42
OFFICERS OF THE FUND (Unaudited)
BRADLEY J. SKAPYAK, President since January 2010.
Chief Operating Officer and a director of the Manager since June 2009. From April 2003 to June 2009, Mr. Skapyak was the head of the Investment Accounting and Support Department of the Manager. He is an officer of 75 investment companies (comprised of 167 portfolios) managed by the Manager. He is 52 years old and has been an employee of the Manager since February 1988.
MICHAEL A. ROSENBERG, Vice President and Secretary since August 2005.
Assistant General Counsel of BNY Mellon, and an officer of 76 investment companies (comprised of 192 portfolios) managed by the Manager. He is 51 years old and has been an employee of the Manager since October 1991.
KIESHA ASTWOOD, Vice President and Assistant Secretary since January 2010.
Counsel of BNY Mellon, and an officer of 76 investment companies (comprised of 192 portfolios) managed by the Manager. She is 38 years old and has been an employee of the Manager since July 1995.
JAMES BITETTO, Vice President and Assistant Secretary since August 2005.
Senior Counsel of BNY Mellon and Secretary of the Manager, and an officer of 76 investment companies (comprised of 192 portfolios) managed by the Manager. He is 45 years old and has been an employee of the Manager since December 1996.
JONI LACKS CHARATAN, Vice President and Assistant Secretary since August 2005.
Senior Counsel of BNY Mellon, and an officer of 76 investment companies (comprised of 192 portfolios) managed by the Manager. She is 55 years old and has been an employee of the Manager since October 1988.
JOSEPH M. CHIOFFI, Vice President and Assistant Secretary since August 2005.
Senior Counsel of BNY Mellon, and an officer of 76 investment companies (comprised of 192 portfolios) managed by the Manager. He is 49 years old and has been an employee of the Manager since June 2000.
KATHLEEN DENICHOLAS, Vice President and Assistant Secretary since January 2010.
Managing Counsel of BNY Mellon, and an officer of 76 investment companies (comprised of 192 portfolios) managed by the Manager. She is 37 years old and has been an employee of the Manager since February 2001.
JANETTE E. FARRAGHER, Vice President and Assistant Secretary since August 2005.
Assistant General Counsel of BNY Mellon, and an officer of 76 investment companies (comprised of 192 portfolios) managed by the Manager. She is 48 years old and has been an employee of the Manager since February 1984.
JOHN B. HAMMALIAN, Vice President and Assistant Secretary since August 2005.
Senior Managing Counsel of BNY Mellon, and an officer of 76 investment companies (comprised of 192 portfolios) managed by the Manager. He is 48 years old and has been an employee of the Manager since February 1991.
M. CRISTINA MEISER, Vice President and Assistant Secretary since January 2010.
Senior Counsel of BNY Mellon, and an officer of 76 investment companies (comprised of 192 portfolios) managed by the Manager. She is 41 years old and has been an employee of the Manager since August 2001.
| The Fund | 43 |
OFFICERS OF THE FUND (Unaudited) (continued)
ROBERT R. MULLERY, Vice President and Assistant Secretary since August 2005.
Managing Counsel of BNY Mellon, and an officer of 76 investment companies (comprised of 192 portfolios) managed by the Manager. He is 59 years old and has been an employee of the Manager since May 1986.
JEFF PRUSNOFSKY, Vice President and Assistant Secretary since August 2005.
Senior Managing Counsel of BNY Mellon, and an officer of 76 investment companies (comprised of 192 portfolios) managed by the Manager. He is 46 years old and has been an employee of the Manager since October 1990.
JAMES WINDELS, Treasurer since November 2001.
Director – Mutual Fund Accounting of the Manager, and an officer of 76 investment companies (comprised of 192 portfolios) managed by the Manager. He is 53 years old and has been an employee of the Manager since April 1985.
RICHARD CASSARO, Assistant Treasurer since January 2008.
Senior Accounting Manager – Money Market and Municipal Bond Funds of the Manager, and an officer of 76 investment companies (comprised of 192 portfolios) managed by the Manager. He is 52 years old and has been an employee of the Manager since September 1982.
GAVIN C. REILLY, Assistant Treasurer since August 2005.
Tax Manager of the Investment Accounting and Support Department of the Manager, and an officer of 76 investment companies (comprised of 192 portfolios) managed by the Manager. He is 43 years old and has been an employee of the Manager since April 1991.
ROBERT ROBOL, Assistant Treasurer since August 2005.
Senior Accounting Manager – Fixed Income Funds of the Manager, and an officer of 76 investment companies (comprised of 192 portfolios) managed by the Manager. He is 47 years old and has been an employee of the Manager since October 1988.
ROBERT SALVIOLO, Assistant Treasurer since July 2007.
Senior Accounting Manager – Equity Funds of the Manager, and an officer of 76 investment companies (comprised of 192 portfolios) managed by the Manager. He is 44 years old and has been an employee of the Manager since June 1989.
ROBERT SVAGNA, Assistant Treasurer since August 2002.
Senior Accounting Manager – Equity Funds of the Manager, and an officer of 76 investment companies (comprised of 192 portfolios) managed by the Manager. He is 44 years old and has been an employee of the Manager since November 1990.
44
JOSEPH W. CONNOLLY, Chief Compliance Officer since October 2004.
Chief Compliance Officer of the Manager and The Dreyfus Family of Funds (76 investment companies, comprised of 192 portfolios). From November 2001 through March 2004, Mr. Connolly was first Vice-President, Mutual Fund Servicing for Mellon Global Securities Services. In that capacity, Mr. Connolly was responsible for managing Mellon’s Custody, Fund Accounting and Fund Administration services to third-party mutual fund clients. He is 54 years old and has served in various capacities with the Manager since 1980, including manager of the firm’s Fund Accounting Department from 1997 through October 2001.
STEPHEN J. STOREN, Anti-Money Laundering Compliance Officer since May 2011.
Chief Compliance Officer of the Distributor, and the Anti-Money Laundering Compliance Officer of 72 investment companies (comprised of 188 portfolios) managed by the Manager. He is 57 years old and has been an employee of the Distributor since October 1999.
| The Fund | 45 |
For More Information
Telephone Call your financial representative or 1-800-DREYFUS
Mail The Dreyfus Family of Funds, 144 Glenn Curtiss Boulevard, Uniondale, NY 11556-0144
The fund files its complete schedule of portfolio holdings with the Securities and Exchange Commission (“SEC”) for the first and third quarters of each fiscal year on Form N-Q. The fund’s Forms N-Q are available on the SEC’s website at http://www.sec.gov and may be reviewed and copied at the SEC’s Public Reference Room in Washington, DC. Information on the operation of the Public Reference Room may be obtained by calling 1-800-SEC-0330.
A description of the policies and procedures that the fund uses to determine how to vote proxies relating to portfolio securities, and information regarding how the fund voted these proxies for the most recent 12-month period ended June 30 is available at http://www.dreyfus.com and on the SEC’s website at http://www.sec.gov. The description of the policies and procedures is also available without charge, upon request, by calling 1-800-DREYFUS.

| Dreyfus |
| India Fund |
ANNUAL REPORT October 31, 2011
Save time. Save paper. View your next shareholder report online as soon as it’s available. Log into www.dreyfus.com and sign up for Dreyfus eCommunications. It’s simple and only takes a few minutes.
The views expressed in this report reflect those of the portfolio manager only through the end of the period covered and do not necessarily represent the views of Dreyfus or any other person in the Dreyfus organization. Any such views are subject to change at any time based upon market or other conditions and Dreyfus disclaims any responsibility to update such views.These views may not be relied on as investment advice and, because investment decisions for a Dreyfus fund are based on numerous factors, may not be relied on as an indication of trading intent on behalf of any Dreyfus fund.
| Not FDIC-Insured • Not Bank-Guaranteed • May Lose Value |
Contents | |
THE FUND | |
| 2 | A Letter from the Chairman and CEO |
| 3 | Discussion of Fund Performance |
| 6 | Fund Performance |
| 8 | Understanding Your Fund’s Expenses |
| 8 | Comparing Your Fund’s Expenses With Those of Other Funds |
| 9 | Statement of Investments |
| 11 | Statement of Assets and Liabilities |
| 12 | Statement of Operations |
| 13 | Statement of Changes in Net Assets |
| 14 | Financial Highlights |
| 15 | Notes to Financial Statements |
| 26 | Report of Independent Registered Public Accounting Firm |
| 27 | Proxy Results |
| 28 | Information About the Review and Approval of the Fund’s Management and Sub-Investment Advisory Agreements |
| 32 | Board Members Information |
| 34 | Officers of the Fund |
FOR MORE INFORMATION | |
Back Cover |
Dreyfus
India Fund
TheFund

A LETTER FROM THE CHAIRMAN AND CEO
Dear Shareholder:
We present to you this annual report for Dreyfus India Fund, covering the period from its inception on April 13, 2011, through October 31, 2011. For information about how the fund performed during the reporting period, as well as general market perspectives, we provide a Discussion of Fund Performance on the pages that follow.
Investors were encouraged by expectations of a more robust economic recovery during the final months of 2010, but sentiment deteriorated in 2011 due to disappointing global economic data, rising commodity prices, an escalating sovereign debt crisis in Europe and a contentious debate regarding taxes, spending and borrowing in the United States. International stocks proved sensitive to these macroeconomic developments, often regardless of underlying company fundamentals, and most international equity market indices ended the reporting period with mildly negative absolute returns.
The global economic outlook currently remains clouded by market turbulence and political infighting, but we believe that a continued subpar global expansion is more likely than a return to recession. Although Europe continues to struggle with a debt crisis, inflationary pressures appear to be waning in most countries as energy prices recently have retreated from their highs. In Asia, China seems to have averted an economic contraction after implementing measures to dampen inflationary pressures. In the United States, moderately low core inflation and an accommodative monetary policy could help support near-trend growth despite ongoing deleveraging activity in the private sector.To assess the potential impact of these and other developments on your investments, we encourage you, as always, to speak with your financial advisor.
Thank you for your continued confidence and support.

Jonathan R. Baum
Chairman and Chief Executive Officer
The Dreyfus Corporation
November 15, 2011
2

DISCUSSION OF FUND PERFORMANCE
For the period of April 13, 2011, through October 31, 2011, as provided by Hugh Simon and Abhijit Sarkar, Portfolio Managers
Fund and Market Performance Overview
Between its inception on April 13, 2011, and the end of its fiscal year on October 31, 2011, Dreyfus India Fund’s Class A shares produced a total return of –15.28%, Class C shares returned –15.68% and Class I shares returned –15.20%.1 In comparison, the fund’s benchmark, the Morgan Stanley Capital International India NR Index (the “Index”), produced a total return of –16.17% for the period of April 1, 2011, through October 31, 2011.2
Stocks in India stumbled as investors responded negatively to concerns that inflation-fighting measures would weigh on regional growth.The fund produced returns slightly better than its benchmark mainly due to selective consumption names which performed relatively well, while the fund’s holdings of midcap stocks fared as poorly as the large-cap stocks that comprise the Index.
The Fund’s Investment Approach
The fund, which seeks long-term capital appreciation, normally invests at least 80% of its net assets in equity and fixed-income securities of Indian issuers and other investments that are tied economically to India.The fund may invest in companies of any market capitalization. The fund invests in securities denominated in the Indian rupee or other local currency of issue or U.S. dollar-denominated securities.
When choosing investments, we analyze several factors, including:
Economic and political trends in India.
The current financial condition and future prospects of individual companies and sectors in India.
The valuation of one company or sector in India relative to that of another.
We generally seek companies with accelerated earnings outlooks and reasonably valued share prices. Characteristics of such companies may include high-quality corporate governance, a commitment to increasing shareholder value, strong earnings momentum with consistent free cash flow generation, sound business fundamentals and long-term vision.
| The Fund | 3 |
DISCUSSION OF FUND PERFORMANCE (continued)
Macroeconomic Developments Challenged Indian Stocks
The reporting period proved challenging as inflation fighting efforts—including rising interest rates, stricter lending standards and higher banking reserve requirements—threatened the high economic growth rate in India. At the same time, investors worried that deteriorating global economic conditions might hurt export activity to other parts of the world, mainly due to a sovereign debt crisis in Europe, rising energy prices stemming from political unrest in the Middle East, and stubbornly high unemployment in the United States.
Faced with these headwinds, newly risk-averse global investors shifted assets from the emerging markets to traditional safe havens in the developed world. Capital outflows caused equity valuations to contract significantly across a wide range of markets and industry groups. Although Indian stocks rallied strongly in October 2011 when some macroeconomic concerns eased, it was not enough to offset earlier weakness.
Domestic Emphasis Weighed on Performance
The fund’s relative performance was undermined by overweighted exposure to midsize companies, particularly in the infrastructure sector, which suffered bouts of limited liquidity during the reporting period. Declines also were notable in the financials sector, where infrastructure bank IFCI and commercial lender UCO Bank were hurt by rising interest rates stemming from inflation-fighting measures. In the materials sector, magnesium producer MOIL and steelmaker Jai Balaji Industries generated lower earnings due to falling commodity prices amid weaker global demand.
The fund achieved better results in traditionally defensive market sectors, including a number of companies that we regarded as poised to benefit from the growth of a new middle class of Indian consumers. Shoe manufacturer and retailer Bata India saw sales rise as a result of this long-term trend toward greater consumption. In fact, the fund has established positions in a number of Indian subsidiaries of multinational companies with well-known brands, including Gillette India, Nestle India, Novartis India and Pfizer.
Adopting a More Constructive Investment Posture
In our view, the worst of the market downturn in India is likely behind us. Indeed, it appears that inflationary pressures are receding, and authorities at India’s central bank may ease some of the monetary tightening measures imposed in their inflation-fighting efforts. In addition, we expect improved investor confidence and sustained corporate
4
earnings growth to potentially support a market rebound. Of course, as an emerging market, the Indian market will continue to be subject to higher volatility than more developed economies.
As of the reporting period’s end, we have identified a number of investment opportunities among India’s financial institutions, including public sector banks that were punished by higher interest rates and in our opinion have reached more attractive valuations.We also have found growth opportunities in the health care sector, which we expect to capture larger shares of India’s gross domestic product over time.Among industrial companies, automakers such as Tata Motors seem likely to prosper as more of the Indian population purchases cars and trucks, and certain media companies appear to us poised to benefit from rising demand for filmed entertainment. In our judgment, these strategies position the fund to benefit from long-term secular trends that we believe remain intact despite recent economic uncertainty and market volatility. However, we would like to remind our shareholders, particularly newer investors, that this fund has a high risk/return profile and is appropriate only for shareholders willing to accept greater risks. Because of its narrow geographic focus and relatively limited number of holdings, this fund can be extremely volatile and should only represent a small portion of a long-term investor’s well-diversified portfolio.
November 15, 2011
| Emerging markets, such as those of India, tend to be more volatile than the markets of more | |
| mature economies, and generally have less diverse and less mature economic structures and less | |
| stable political systems than those of developed countries.The securities of companies located in | |
| emerging markets are often subject to rapid and large changes in price.An investment in this fund | |
| should be considered only as a supplement to a complete investment program for those investors | |
| willing to accept the greater risks associated with investing in emerging market countries. | |
| Equity funds are subject generally to market, market sector, market liquidity, issuer and investment | |
| style risks, among other factors, to varying degrees, all of which are more fully described in the | |
| fund’s prospectus. | |
| The fund’s performance will be influenced by political, social and economic factors affecting | |
| investments in foreign companies. Special risks associated with investments in foreign companies | |
| include exposure to currency fluctuations, less liquidity, less developed or less efficient trading | |
| markets, lack of comprehensive company information, political instability and differing auditing | |
| and legal standards.These risks are enhanced in emerging market countries. | |
| 1 | Total return includes reinvestment of dividends and any capital gains paid, and does not take into |
| consideration the maximum initial sales charge in the case of Class A shares, or the applicable | |
| contingent deferred sales charges imposed on redemptions in the case of Class C shares. Had these | |
| charges been reflected, returns would have been lower. Past performance is no guarantee of future | |
| results. Share price and investment return fluctuate such that upon redemption, fund shares may be | |
| worth more or less than their original cost. Return figures provided reflect an undertaking for the | |
| absorption of certain fund expenses by The Dreyfus Corporation through March 1, 2013, at | |
| which time it may be extended, terminated or modified. Had these expenses not been absorbed, | |
| the fund’s returns would have been lower. | |
| 2 | SOURCE: LIPPER.The MSCI India NR Index is a free float-adjusted market capitalization |
| index designed to measure the market performance, including price performance and income from | |
| dividend payments, of Indian equity securities.The Index is currently composed of the top 68 | |
| companies by market capitalization listed on the National Stock Exchange of India. |
| The Fund | 5 |
FUND PERFORMANCE
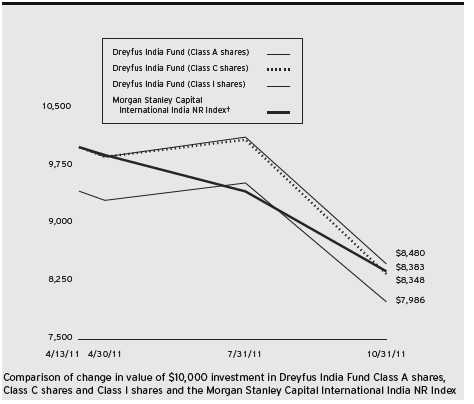
| † Source: Lipper Inc. |
| Past performance is not predictive of future performance. |
| The above graph compares a $10,000 investment made in each of the Class A, Class C and Class I shares of Dreyfus |
| India Fund on 4/13/11 (inception date) to a $10,000 investment made in the Morgan Stanley Capital International |
| India NR Index (the “Index”) on that date.All dividends and capital gain distributions are reinvested. |
| The fund’s performance shown in the line graph above takes into account the maximum initial sales charge on Class A |
| shares, the applicable contingent deferred sales charge on Class C shares and all other applicable fees and expenses on all |
| classes.The Index is a free-float adjusted market capitalization weighted index that monitors the performance of stocks |
| from the country of India. Unlike a mutual fund, the Index is not subject to charges, fees and other expenses. Investors |
| cannot invest directly in any index.These factors can contribute to the Index potentially outperforming the fund. Further |
| information relating to fund expenses, including expense reimbursements, if applicable, is contained in the Expense section |
| of the prospectus and elsewhere in this report. |
6
| Actual Aggregate Total Returns as of 10/31/11 | |||
| Inception | From | ||
| Date | Inception | ||
| Class A shares | |||
| with maximum sales charge (5.75%) | 4/13/11 | –20.14% | |
| without sales charge | 4/13/11 | –15.28% | |
| Class C shares | |||
| with applicable redemption charge † | 4/13/11 | –16.52% | |
| without redemption | 4/13/11 | –15.68% | |
| Class I shares | 4/13/11 | –15.20% | |
| Morgan Stanley Capital | |||
| International India NR Index | 3/31/11 | –16.17%†† | |
Past performance is not predictive of future performance.The fund’s performance shown in the graph and table does not reflect the deduction of taxes that a shareholder would pay on fund distributions or the redemption of fund shares.
| † | The maximum contingent deferred sales charge for Class C shares is 1% for shares redeemed within one year of the |
| date of purchase. | |
| †† | For comparative purposes, the value of the Index as of 3/31/11 is used as the beginning value on 4/13/11. |
| The Fund | 7 |
UNDERSTANDING YOUR FUND’S EXPENSES (Unaudited)
As a mutual fund investor, you pay ongoing expenses, such as management fees and other expenses. Using the information below, you can estimate how these expenses affect your investment and compare them with the expenses of other funds.You also may pay one-time transaction expenses, including sales charges (loads) and redemption fees, which are not shown in this section and would have resulted in higher total expenses. For more information, see your fund’s prospectus or talk to your financial adviser.
Review your fund’s expenses
The table below shows the expenses you would have paid on a $1,000 investment in Dreyfus India Fund from May 1, 2011 to October 31, 2011. It also shows how much a $1,000 investment would be worth at the close of the period, assuming actual returns and expenses.
Expenses and Value of a $1,000 Investment
assuming actual returns for the six months ended October 31, 2011
| Class A | Class C | Class I | ||||
| Expenses paid per $1,000† | $ | 9.37 | $ | 12.85 | $ | 8.20 |
| Ending value (after expenses) | $ | 858.20 | $ | 854.10 | $ | 859.00 |
COMPARING YOUR FUND’S EXPENSES
WITH THOSE OF OTHER FUNDS (Unaudited)
Using the SEC’s method to compare expenses
The Securities and Exchange Commission (SEC) has established guidelines to help investors assess fund expenses. Per these guidelines, the table below shows your fund’s expenses based on a $1,000 investment, assuming a hypothetical 5% annualized return. You can use this information to compare the ongoing expenses (but not transaction expenses or total cost) of investing in the fund with those of other funds.All mutual fund shareholder reports will provide this information to help you make this comparison. Please note that you cannot use this information to estimate your actual ending account balance and expenses paid during the period.
Expenses and Value of a $1,000 Investment
assuming a hypothetical 5% annualized return for the six months ended October 31, 2011
| Class A | Class C | Class I | ||||
| Expenses paid per $1,000† | $ | 10.16 | $ | 13.94 | $ | 8.89 |
| Ending value (after expenses) | $ | 1,015.12 | $ | 1,011.34 | $ | 1,016.38 |
| † Expenses are equal to the fund’s annualized expense ratio of 2.00% for Class A, 2.75% for Class C and 1.75% |
| for Class I,multiplied by the average account value over the period, multiplied by 184/365 (to reflect the one-half |
| year period). |
8
| STATEMENT OF INVESTMENTS |
| October 31, 2011 |
| Common Stocks—98.6% | Shares | Value ($) | ||
| Consumer Discretionary—15.3% | ||||
| Bata India | 8,481 | 125,533 | ||
| EIH | 33,922 | 65,248 | ||
| Hinduja Ventures | 8,905 | 60,929 | ||
| Prime Focus | 54,000a | 61,849 | ||
| Whirlpool of India | 21,201 a | 94,188 | ||
| 407,747 | ||||
| Consumer Staples—18.2% | ||||
| Balrampur Chini Mills | 60,000 | 65,446 | ||
| Dhampur Sugar Mills | 89,000 | 72,569 | ||
| Gillette India | 1,697 | 77,196 | ||
| Godfrey Phillips India | 1,442 | 102,808 | ||
| Nestle India | 1,018 | 88,671 | ||
| VST Industries | 2,969 | 77,620 | ||
| 484,310 | ||||
| Financial—25.7% | ||||
| Canara Bank | 7,633 | 72,677 | ||
| Future Capital Holdings | 14,417 | 41,998 | ||
| IDBI Bank | 38,162 | 91,322 | ||
| IFCI | 115,000 | 77,259 | ||
| Indiabulls Real Estate | 45,000 | 68,725 | ||
| PTC India Financial Services | 135,686 | 41,978 | ||
| Punjab & Sind Bank | 51,000 | 77,944 | ||
| SREI Infrastructure Finance | 80,000 | 58,372 | ||
| State Bank of India | 1,900 | 73,708 | ||
| UCO Bank | 52,767 | 80,985 | ||
| 684,968 | ||||
| Health Care—13.1% | ||||
| Merck | 4,241a | 57,291 | ||
| Novartis India | 5,937 | 101,805 | ||
| Parabolic Drugs | 106,005 | 86,072 | ||
| Pfizer | 3,800 | 103,871 | ||
| 349,039 | ||||
| The Fund | 9 |
STATEMENT OF INVESTMENTS (continued)
| Common Stocks (continued) | Shares | Value ($) | ||
| Industrial—10.2% | ||||
| Escorts | 25,000 | 43,767 | ||
| Larsen & Toubro | 2,250 | 65,007 | ||
| MARG | 27,000 | 46,947 | ||
| Tata Motors | 28,410 | 114,924 | ||
| 270,645 | ||||
| Information Technology—5.5% | ||||
| NIIT Technologies | 15,265 | 72,207 | ||
| Oracle Financial Services Software | 1,697 | a | 73,411 | |
| 145,618 | ||||
| Materials—7.5% | ||||
| Coal India | 7,600 | 51,456 | ||
| Jai Balaji Industries | 24,000 | 43,628 | ||
| MOIL | 20,000 | 105,271 | ||
| 200,355 | ||||
| Utilities—3.1% | ||||
| Reliance Infrastructure | 8,600 | 81,312 | ||
| Total Investments (cost $2,913,380) | 98.6% | 2,623,994 | ||
| Cash and Receivables (Net) | 1.4% | 36,381 | ||
| Net Assets | 100.0% | 2,660,375 | ||
| a Non-income producing security. | ||||
| Portfolio Summary (Unaudited)† | |||
| Value (%) | Value (%) | ||
| Financial | 25.7 | Materials | 7.5 |
| Consumer Staples | 18.2 | Information Technology | 5.5 |
| Consumer Discretionary | 15.3 | Utilities | 3.1 |
| Health Care | 13.1 | ||
| Industrial | 10.2 | 98.6 | |
| † Based on net assets. | |||
| See notes to financial statements. | |||
10
| STATEMENT OF ASSETS AND LIABILITIES |
| October 31, 2011 |
| Cost | Value | |||
| Assets ($): | ||||
| Investments in securities—See Statement of Investments | 2,913,380 | 2,623,994 | ||
| Cash denominated in foreign currencies | 60,971 | 61,705 | ||
| Receivable for investment securities sold | 79,832 | |||
| Receivable for shares of Common Stock subscribed | 1,403 | |||
| Dividends receivable | 523 | |||
| Prepaid expenses | 62,708 | |||
| Due from The Dreyfus Corporation and affiliates—Note 3(c) | 15,546 | |||
| 2,845,711 | ||||
| Liabilities ($): | ||||
| Cash overdraft due to Custodian | 17,409 | |||
| Payable for investment securities purchased | 116,485 | |||
| Accrued expenses | 51,442 | |||
| 185,336 | ||||
| Net Assets ($) | 2,660,375 | |||
| Composition of Net Assets ($): | ||||
| Paid-in capital | 3,080,898 | |||
| Accumulated investment (loss)—net | (3,199) | |||
| Accumulated net realized gain (loss) on investments | (128,076) | |||
| Accumulated net unrealized appreciation (depreciation) | ||||
| on investments and foreign currency transactions | (289,248) | |||
| Net Assets ($) | 2,660,375 | |||
| Net Asset Value Per Share | ||||
| Class A | Class C | Class I | ||
| Net Assets ($) | 1,622,437 | 576,090 | 461,848 | |
| Shares Outstanding | 153,177 | 54,647 | 43,566 | |
| Net Asset Value Per Share ($) | 10.59 | 10.54 | 10.60 | |
| See notes to financial statements. | ||||
| The Fund | 11 |
| STATEMENT OF OPERATIONS |
| From April 13, 2011 (commencement of operations) to |
| October 31, 2011 |
| Investment Income ($): | ||
| Income: | ||
| Cash dividends: | ||
| Unaffiliated issuers | 42,186 | |
| Affiliated issuers | 49 | |
| Total Income | 42,235 | |
| Expenses: | ||
| Management fee—Note 3(a) | 17,934 | |
| Legal fees | 59,159 | |
| Auditing fees | 50,464 | |
| Registration fees | 29,685 | |
| Custodian fees—Note 3(c) | 10,250 | |
| Shareholder servicing costs—Note 3(c) | 4,223 | |
| Distribution fees—Note 3(b) | 2,368 | |
| Prospectus and shareholders’ reports | 1,821 | |
| Directors’ fees and expenses—Note 3(d) | 464 | |
| Loan commitment fees—Note 2 | 30 | |
| Miscellaneous | 10,878 | |
| Total Expenses | 187,276 | |
| Less—expense reimbursement from The Dreyfus Corporation due to | ||
| undertaking—Note 3(a) | (156,881) | |
| Less—reduction in fees due to earnings credits—Note 3(c) | (1) | |
| Net Expenses | 30,394 | |
| Investment Income—Net | 11,841 | |
| Realized and Unrealized Gain (Loss) on Investments—Note 4 ($): | ||
| Net realized gain (loss) on investments and foreign currency transactions | (148,629) | |
| Net realized gain (loss) on forward foreign currency exchange contracts | 935 | |
| Net Realized Gain (Loss) | (147,694) | |
| Net unrealized appreciation (depreciation) on investments and | ||
| foreign currency transactions | (289,248) | |
| Net Realized and Unrealized Gain (Loss) on Investments | (436,942) | |
| Net (Decrease) in Net Assets Resulting from Operations | (425,101) | |
| See notes to financial statements. | ||
12
| STATEMENT OF CHANGES IN NET ASSETS |
| From April 13, 2011 (commencement of operations) to |
| October 31, 2011 |
| Operations ($): | ||
| Investment income—net | 11,841 | |
| Net realized gain (loss) on investments | (147,694) | |
| Net unrealized appreciation (depreciation) on investments | (289,248) | |
| Net Increase (Decrease) in Net Assets | ||
| Resulting from Operations | (425,101) | |
| Capital Stock Transactions ($): | ||
| Net proceeds from shares sold: | ||
| Class A Shares | 2,639,113 | |
| Class C Shares | 672,916 | |
| Class I Shares | 544,100 | |
| Cost of shares redeemed: | ||
| Class A Shares | (770,653) | |
| Increase (Decrease) in Net Assets | ||
| from Capital Stock Transactions | 3,085,476 | |
| Total Increase (Decrease) in Net Assets | 2,660,375 | |
| Net Assets ($): | ||
| Beginning of Period | — | |
| End of Period | 2,660,375 | |
| Accumulated investment (loss)—net | (3,199) | |
| Capital Share Transactions (Shares): | ||
| Class A | ||
| Shares sold | 222,073 | |
| Shares redeemed | (68,896) | |
| Net Increase (Decrease) in Shares Outstanding | 153,177 | |
| Class C | ||
| Shares sold | 54,647 | |
| Class I | ||
| Shares sold | 43,566 | |
| See notes to financial statements. | ||
| The Fund | 13 |
FINANCIAL HIGHLIGHTS
The following table describes the performance for each share class for the period from April 13, 2011 (commencement of operations) to October 31, 2011.All information (except portfolio turnover rate) reflects financial results for a single fund share.Total return shows how much your investment in the fund would have increased (or decreased) during the period, assuming you had reinvested all dividends and distrib-utions.These figures have been derived from the fund’s financial statements.
| Class A | Class C | Class I | ||||
| Shares | Shares | Shares | ||||
| Per Share Data ($): | ||||||
| Net asset value, beginning of period | 12.50 | 12.50 | 12.50 | |||
| Investment Operations: | ||||||
| Investment income—neta | .06 | .01 | .07 | |||
| Net realized and unrealized | ||||||
| gain (loss) on investments | (1.98) | (1.98) | (1.98) | |||
| Total from Investment Operations | (1.92) | (1.97) | (1.91) | |||
| Proceeds from redemption fees | .01 | .01 | .01 | |||
| Net asset value, end of period | 10.59 | 10.54 | 10.60 | |||
| Total Return (%)b | (15.28)c | (15.68)c | (15.20) | |||
| Ratios/Supplemental Data (%): | ||||||
| Ratio of total expenses to average net assetsd | 12.82 | 13.73 | 12.99 | |||
| Ratio of net expenses to average net assetsd | 2.00 | 2.75 | 1.75 | |||
| Ratio of net investment income | ||||||
| to average net assetsd | .98 | .19 | 1.10 | |||
| Portfolio Turnover Rateb | 36.45 | 36.45 | 36.45 | |||
| Net Assets, end of period ($ x 1,000) | 1,622 | 576 | 462 | |||
| a | Based on average shares outstanding at each month end. |
| b | Not annualized. |
| c | Exclusive of sales charge. |
| d | Annualized. |
See notes to financial statements.
14
NOTES TO FINANCIAL STATEMENTS
NOTE 1—Significant Accounting Policies:
Dreyfus India Fund (the “fund”) is a separate non-diversified series of Dreyfus Premier Investment Funds, Inc. (the “Company”), which is registered under the Investment Company Act of 1940, as amended (the “Act”), as an open-end management investment company and operates as a series company currently offering nine series, including the fund, which commenced operations on April 13, 2011.The fund’s investment objective is to seek long-term capital appreciation. The Dreyfus Corporation (the “Manager” or “Dreyfus”), a wholly-owned subsidiary of The Bank of New York Mellon Corporation (“BNY Mellon”), serves as the fund’s investment adviser. Hamon Asian Advisors Ltd. (“Hamon”) serves as the fund’s sub-investment adviser. Effective November 4, 2011, Hamon U.S. Investment Advisors Ltd. changed the company’s name to Hamon Asian Advisors Ltd. Hamon is an affiliate of Dreyfus.
MBSC Securities Corporation (the “Distributor”), a wholly-owned subsidiary of Dreyfus, is the distributor of the fund’s shares.The fund is authorized to issue 100 million shares of $.001 par value Common Stock in each of the following classes of shares: Class A, Class C and Class I. Class A shares are subject to a sales charge imposed at the time of purchase. Class C shares are subject to a contingent deferred sales charge (“CDSC”) imposed on Class C shares redeemed within one year of purchase. Class I shares are sold at net asset value per share only to institutional investors. Other differences between the classes include the services offered to and the expenses borne by each class, the allocation of certain transfer agency costs and certain voting rights. Income, expenses (other than expenses attributable to a specific class) and realized and unrealized gains or losses on investments are allocated to each class of shares based on its relative net assets.
As of October 31, 2011, MBC Investments Corp., an indirect subsidiary of BNY Mellon, held 30,000 Class A, 40,000 Class C and 40,000 Class I shares of the fund.
| The Fund | 15 |
NOTES TO FINANCIAL STATEMENTS (continued)
The Company accounts separately for the assets, liabilities and operations of each series. Expenses directly attributable to each series are charged to that series’ operations; expenses which are applicable to all series are allocated among them on a pro rata basis.
The Financial Accounting Standards Board (“FASB”) Accounting Standards Codification (“ASC”) is the exclusive reference of authoritative U.S. generally accepted accounting principles (“GAAP”) recognized by the FASB to be applied by nongovernmental entities. Rules and interpretive releases of the Securities and Exchange Commission (“SEC”) under authority of federal laws are also sources of authoritative GAAP for SEC registrants.The fund’s financial statements are prepared in accordance with GAAP, which may require the use of management estimates and assumptions. Actual results could differ from those estimates.
The Company enters into contracts that contain a variety of indemnifications.The fund’s maximum exposure under these arrangements is unknown.The fund does not anticipate recognizing any loss related to these arrangements.
(a) Portfolio valuation: The fair value of a financial instrument is the amount that would be received to sell an asset or paid to transfer a liability in an orderly transaction between market participants at the measurement date (i.e. the exit price). GAAP establishes a fair value hierarchy that prioritizes the inputs of valuation techniques used to measure fair value.This hierarchy gives the highest priority to unadjusted quoted prices in active markets for identical assets or liabilities (Level 1 measurements) and the lowest priority to unobservable inputs (Level 3 measurements).
Additionally, GAAP provides guidance on determining whether the volume and activity in a market has decreased significantly and whether such a decrease in activity results in transactions that are not orderly. GAAP requires enhanced disclosures around valuation inputs and techniques used during annual and interim periods.
16
Various inputs are used in determining the value of the fund’s investments relating to fair value measurements.These inputs are summarized in the three broad levels listed below:
Level 1—unadjusted quoted prices in active markets for identical investments.
Level 2—other significant observable inputs (including quoted prices for similar investments, interest rates, prepayment speeds, credit risk, etc.).
Level 3—significant unobservable inputs (including the fund’s own assumptions in determining the fair value of investments).
The inputs or methodology used for valuing securities are not necessarily an indication of the risk associated with investing in those securities.
Changes in valuation techniques may result in transfers in or out of an assigned level within the disclosure hierarchy. Valuation techniques used to value the fund’s investments are as follows:
Investments in securities are valued at the last sales price on the securities exchange or national securities market on which such securities are primarily traded. Securities listed on the National Market System for which market quotations are available are valued at the official closing price or, if there is no official closing price that day, at the last sales price. Securities not listed on an exchange or the national securities market, or securities for which there were no transactions, are valued at the average of the most recent bid and asked prices, except for open short positions, where the asked price is used for valuation purposes. Bid price is used when no asked price is available. Registered investment companies that are not traded on an exchange are valued at their net asset value.All preceding securities are categorized within Level 1 of the fair value hierarchy.
Fair valuing of securities may be determined with the assistance of a pricing service using calculations based on indices of domestic securities and other appropriate indicators, such as prices of relevant American Depository Receipts and futures contracts. Utilizing these
| The Fund | 17 |
NOTES TO FINANCIAL STATEMENTS (continued)
techniques may result in transfers between Level 1 and Level 2 of the fair value hierarchy.
When market quotations or official closing prices are not readily available, or are determined not to reflect accurately fair value, such as when the value of a security has been significantly affected by events after the close of the exchange or market on which the security is principally traded (for example, a foreign exchange or market), but before the fund calculates its net asset value, the fund may value these investments at fair value as determined in accordance with the procedures approved by the Board of Directors. Certain factors may be considered when fair valuing investments such as: fundamental analytical data, the nature and duration of restrictions on disposition, an evaluation of the forces that influence the market in which the securities are purchased and sold, and public trading in similar securities of the issuer or comparable issuers. These securities are either categorized as Level 2 or 3 depending on the relevant inputs used.
For restricted securities where observable inputs are limited, assumptions about market activity and risk are used and are categorized within Level 3 of the fair value hierarchy.
Investments denominated in foreign currencies are translated to U.S. dollars at the prevailing rates of exchange. Forward foreign currency exchange contracts (“forward contracts”) are valued at the forward rate. These securities are generally categorized within Level 2 of the fair value hierarchy.
The following is a summary of the inputs used as of October 31, 2011 in valuing the fund’s investments:
| Level 2—Other | Level 3— | ||||
| Level 1— | Significant | Significant | |||
| Unadjusted | Observable | Unobservable | |||
| Quoted Prices | Inputs | Inputs | Total | ||
| Assets ($) | |||||
| Investments in Securities: | |||||
| Equity Securities— | |||||
| Foreign† | 43,767 | 2,580,227 | †† | — | 2,623,994 |
| † | See Statement of Investments for additional detailed categorizations. |
| †† | Securities classified as Level 2 at period end as the values were determined pursuant to the fund’s |
| fair valuation procedures. |
18
In May 2011, FASB issued Accounting Standards Update (“ASU”) No. 2011-04 “Amendments to Achieve Common Fair Value Measurement and Disclosure Requirements in GAAP and International Financial Reporting Standards (“IFRS”)” (“ASU 2011-04”). ASU 2011-04 includes common requirements for measurement of and disclosure about fair value between GAAP and IFRS. ASU 2011-04 will require reporting entities to disclose the following information for fair value measurements categorized within Level 3 of the fair value hierarchy: quantitative information about the unobservable inputs used in the fair value measurement, the valuation processes used by the reporting entity and a narrative description of the sensitivity of the fair value measurement to changes in unobservable inputs and the interrelationships between those unobservable inputs. In addition, ASU 2011-04 will require reporting entities to make disclosures about amounts and reasons for all transfers in and out of Level 1 and Level 2 fair value measurements.The new and revised disclosures are effective for interim and annual reporting periods beginning after December 15, 2011. At this time, management is evaluating the implications of ASU 2011-04 and its impact on the financial statements.
(b) Foreign currency transactions: The fund does not isolate that portion of the results of operations resulting from changes in foreign exchange rates on investments from the fluctuations arising from changes in market prices of securities held. Such fluctuations are included with the net realized and unrealized gain or loss on investments.
Net realized foreign exchange gains or losses arise from sales of foreign currencies, currency gains or losses realized on securities transactions between trade and settlement date and the difference between the amounts of dividends, interest and foreign withholding taxes recorded on the fund’s books and the U.S. dollar equivalent of the amounts actually received or paid. Net unrealized foreign exchange gains and losses arise from changes in the value of assets and liabilities other than investments resulting from changes in exchange rates. Foreign currency gains and losses on investments are included with net realized and unrealized gain or loss on investments.
| The Fund | 19 |
NOTES TO FINANCIAL STATEMENTS (continued)
(c) Securities transactions and investment income: Securities transactions are recorded on a trade date basis. Realized gains and losses from securities transactions are recorded on the identified cost basis. Dividend income is recognized on the ex-dividend date and interest income, including, where applicable, accretion of discount and amortization of premium on investments, is recognized on the accrual basis.
The fund follows an investment policy of investing primarily in the securities of Indian issuers and other investments that are tied economically to India. Because the fund’s investments are concentrated in India, the fund’s performance is expected to be closely tied to social, political and economic conditions within India and to be more volatile than the performance of more geographically diversified funds.
Investing in foreign markets may involve special risks and considerations not typically associated with investing in the U.S. These risks include revaluation of currencies, high rates of inflation, repatriation restrictions on income and capital, and adverse political and economic developments. Moreover, securities issued in these markets may be less liquid, subject to government ownership controls and delayed settlements, and their prices may be more volatile than those of comparable securities in the U.S.
(d) Affiliated issuers: Investments in other investment companies advised by Dreyfus are defined as “affiliated” in the Act.
(e) Dividends to shareholders: Dividends are recorded on the ex-dividend date. Dividends from investment income-net and dividends from net realized capital gains, if any, are normally declared and paid annually, but the fund may make distributions on a more frequent basis to comply with the distribution requirements of the Internal Revenue Code of 1986, as amended (the “Code”).To the extent that net realized capital gains can be offset by capital loss carryovers, it is the policy of the fund not to distribute such gains. Income and capital gain distributions are determined in accordance with income tax regulations, which may differ from GAAP.
(f) Federal income taxes: It is the policy of the fund to continue to qualify as a regulated investment company, if such qualification is in the
20
best interests of its shareholders, by complying with the applicable provisions of the Code, and to make distributions of taxable income sufficient to relieve it from substantially all federal income and excise taxes.
As of and during the period ended October 31, 2011, the fund did not have any liabilities for any uncertain tax positions.The fund recognizes interest and penalties, if any, related to uncertain tax positions as income tax expense in the Statement of Operations. During the period, the fund did not incur any interest or penalties.
The tax period ended October 31, 2011 remains subject to examination by the Internal Revenue Service and state taxing authorities.
At October 31, 2011, the components of accumulated earnings on a tax basis were as follows: accumulated capital losses $37,594 and unrealized depreciation $382,929.
Under the recently enacted Regulated Investment Company Modernization Act of 2010 (the “2010 Act”), the fund will be permitted to carry forward capital losses incurred in taxable years beginning after December 22, 2010 for an unlimited period.
The accumulated capital loss carryover is available for federal income tax purposes to be applied against future net securities profits, if any, realized subsequent to October 31, 2011.
During the period ended October 31, 2011, as a result of permanent book to tax differences, primarily due to the tax treatment for passive foreign investment companies, foreign currency gains and losses, net operating losses and fund start-up costs, the fund decreased accumulated undistributed investment income-net by $15,040, increased accumulated net realized gain (loss) on investments by $19,618 and decreased paid-in capital by $4,578. Net assets and net asset value per share were not affected by this reclassification.
NOTE 2—Bank Lines of Credit:
The fund participates with other Dreyfus-managed funds in a $225 million unsecured credit facility led by Citibank, N.A. and a $300 million unsecured credit facility provided by The Bank of New York
| The Fund | 21 |
NOTES TO FINANCIAL STATEMENTS (continued)
Mellon, a subsidiary of BNY Mellon and an affiliate of Dreyfus (each, a “Facility”), each to be utilized primarily for temporary or emergency purposes, including the financing of redemptions. In connection therewith, the fund has agreed to pay its pro rata portion of commitment fees for each Facility. Interest is charged to the fund based on rates determined pursuant to the terms of the respective Facility at the time of borrowing. During the period ended October 31, 2011, the fund did not borrow under the Facilities.
NOTE 3—Management Fee, Sub-Investment Advisory Fee and Other Transactions with Affiliates:
(a) Pursuant to a management agreement with Dreyfus, the management fee is computed at the annual rate of 1.25% of the value of the fund’s average daily net assets and is payable monthly.
Dreyfus has contractually agreed until March 1, 2013, to waive receipt of its fees and/or assume the expenses of the fund so that the direct expenses of none of the classes (excluding Rule 12b-1 distribution plan fees, shareholder services fees, taxes, interest expense, brokerage commissions, commitment fees on borrowings and extraordinary expenses) exceed 1.75% of the value of the fund’s average daily net assets. The expense reimbursement, pursuant to the undertaking, amounted to $156,881 during the period ended October 31, 2011.
Pursuant to a sub-investment advisory agreement between Dreyfus and Hamon, Dreyfus pays Hamon a fee at the annual rate of .625% of the value of the fund’s average daily net assets and is payable monthly.
During the period ended October 31, 2011, the Distributor retained $50 from commissions earned on sales of the fund’s Class A shares and $20 from CDSCs on redemptions of the fund’s Class C shares.
(b) Under the Distribution Plan (the “Plan”) adopted pursuant to Rule 12b-1 under the Act, Class C shares pay the Distributor for distributing its shares at an annual rate of .75% of the value of the average daily net assets of Class C shares. During the period ended October 31, 2011, Class C shares were charged $2,368 pursuant to the Plan.
22
(c) Under the Shareholder Services Plan, Class A and Class C shares pay the Distributor at an annual rate of .25% of the value of their average daily net assets for the provision of certain services.The services provided may include personal services relating to shareholder accounts, such as answering shareholder inquiries regarding the fund and providing reports and other information, and services related to the maintenance of shareholder accounts.The Distributor may make payments to Service Agents (a securities dealer, financial institution or other industry professional) in respect of these services.The Distributor determines the amounts to be paid to Service Agents. During the period ended October 31, 2011, Class A and Class C shares were charged $2,130 and $789, respectively, pursuant to the Shareholder Services Plan.
The fund compensates DreyfusTransfer, Inc., a wholly-owned subsidiary of Dreyfus, under a transfer agency agreement for providing personnel and facilities to perform transfer agency services for the fund. During the period ended October 31, 2011, the fund was charged $329 pursuant to the transfer agency agreement, which is included in Shareholder servicing costs in the Statement of Operations.
The fund has arrangements with the custodian and cash management bank whereby the fund may receive earnings credits when positive cash balances are maintained, which are used to offset custody and cash management fees. For financial reporting purposes, the fund includes net earnings credits as an expense offset in the Statement of Operations.
The fund compensates The Bank of New York Mellon under a cash management agreement for performing cash management services related to fund subscriptions and redemptions. During the period ended October 31, 2011, the fund was charged $45 pursuant to the cash management agreement, which is included in Shareholder servicing costs in the Statement of Operations.These fees were partially offset by earnings credits of $1.
The fund also compensates The Bank of New York Mellon under a custody agreement for providing custodial services for the fund.
| The Fund | 23 |
NOTES TO FINANCIAL STATEMENTS (continued)
During the period ended October 31, 2011, the fund was charged $10,250 pursuant to the custody agreement.
During the period ended October 31, 2011, the fund was charged $6,751 for services performed by the Chief Compliance Officer.
The components of “Due fromThe Dreyfus Corporation and affiliates” in the Statement of Assets and Liabilities consist of: management fees $2,623, Rule 12b-1 distribution plan fees $349, shareholder services plan fees $431, custodian fees $4,945, chief compliance officer fees $4,246 and transfer agency per account fees $80, which are offset against an expense reimbursement currently in effect in the amount of $28,220.
(d) Each Board member also serves as a Board member of other funds within the Dreyfus complex. Annual retainer fees and attendance fees are allocated to each fund based on net assets.
(e) A 2% redemption fee is charged and retained by the fund on certain shares redeemed within sixty days following the date of issuance subject to exceptions, including redemptions made through the use of the fund’s exchange privilege. During the period ended October 31, 2011, the fund charged and retained $1,482 in redemption fees.
NOTE 4—Securities Transactions:
The aggregate amount of purchases and sales of investment securities, excluding short-term securities and forward contracts, during the period ended October 31, 2011, amounted to $4,007,888 and $967,209, respectively.
Forward Foreign Currency Exchange Contracts: The fund enters into forward contracts in order to hedge its exposure to changes in foreign currency exchange rates on its foreign portfolio holdings, to settle foreign currency transactions or as a part of its investment strategy. When executing forward contracts, the fund is obligated to buy or sell a foreign currency at a specified rate on a certain date in the future. With respect to sales of forward contracts, the fund incurs a loss if the
24
value of the contract increases between the date the forward contract is opened and the date the forward contract is closed.The fund realizes a gain if the value of the contract decreases between those dates. With respect to purchases of forward contracts, the fund incurs a loss if the value of the contract decreases between the date the forward contract is opened and the date the forward contract is closed.The fund realizes a gain if the value of the contract increases between those dates. Any realized gain or loss which occurred during the period is reflected in the Statement of Operations.The fund is exposed to foreign currency risk as a result of changes in value of underlying financial instruments. The fund is also exposed to credit risk associated with counterparty nonperformance on these forward contracts, which is typically limited to the unrealized gain on each open contract. At October 31, 2011, there were no forward contracts outstanding.
At October 31, 2011, the cost of investments for federal income tax purposes was $3,007,061; accordingly, accumulated net unrealized depreciation on investments was $383,067, consisting of $135,447 gross unrealized appreciation and $518,514 gross unrealized depreciation.
| The Fund | 25 |
| REPORT OF INDEPENDENT REGISTERED |
| PUBLIC ACCOUNTING FIRM |
Shareholders and Board of Directors
Dreyfus India Fund
We have audited the accompanying statement of assets and liabilities, including the statement of investments, of Dreyfus India Fund (one of the series comprising Dreyfus Premier Investment Funds, Inc.) as of October 31, 2011, and the related statements of operations and changes in net assets and financial highlights for the period from April 13, 2011 (commencement of operations) to October 31, 2011.These financial statements and financial highlights are the responsibility of the Fund’s management. Our responsibility is to express an opinion on these financial statements and financial highlights based on our audit.
We conducted our audit in accordance with the standards of the Public Company Accounting Oversight Board (United States).Those standards require that we plan and perform the audit to obtain reasonable assurance about whether the financial statements and financial highlights are free of material misstatement.We were not engaged to perform an audit of the Fund’s internal control over financial reporting. Our audit included consideration of internal control over financial reporting as a basis for designing audit procedures that are appropriate in the circumstances, but not for the purpose of expressing an opinion on the effectiveness of the Fund’s internal control over financial reporting.Accordingly, we express no such opinion. An audit also includes examining, on a test basis, evidence supporting the amounts and disclosures in the financial statements and financial highlights, assessing the accounting principles used and significant estimates made by management, and evaluating the overall financial statement presentation. Our procedures included confirmation of securities owned as of October 31, 2011 by correspondence with the custodian and others. We believe that our audit provides a reasonable basis for our opinion.
In our opinion, the financial statements and financial highlights referred to above present fairly, in all material respects, the financial position of Dreyfus India Fund as of October 31, 2011, and the results of its operations, the changes in its net assets and the financial highlights for the period from April 13, 2011 to October 31, 2011, in conformity with U.S. generally accepted accounting principles.

New York, New York
December 29, 2011
26
PROXY RESULTS (Unaudited)
The Company held a special meeting of shareholders on May 31, 2011.The proposal considered at the meeting, and the results, are as follows:
| Shares | |||
| Votes For | Authority Withheld | ||
| To elect Board Members: | |||
| Joseph S. DiMartino† | 119,515,411 | 644,860 | |
| Phillip L. Toia† | 119,502,800 | 657,471 | |
| Robin A. Melvin† | 119,566,042 | 594,229 |
| † Each new Board member’s term commenced on May 31, 2011. |
| In addition Gordon J. Davis, Esq., David P. Feldman and Lynn Martin continue as Board members of the Company. |
| The Fund | 27 |
| INFORMATION ABOUT THE REVIEW AND APPROVAL |
| OF THE FUND’S MANAGEMENT AND |
| SUB-INVESTMENT ADVISORY AGREEMENTS (Unaudited) |
At a meeting of the fund’s Board held on December 9, 2010, the Board unanimously approved the fund’s Management Agreement, pursuant to which the Manager will provide the fund with investment management services, and the Sub-Investment Advisory Agreement between the Manager and Hamon U.S. Investment Advisors Ltd., (“Hamon”) (the “Sub-Adviser”) (together, the “Agreements”), pursuant to which the Sub-Adviser will provide day-to-day management of the Fund’s port-folio.The Board members, none of whom are “interested persons” (as defined in the Investment Company Act of 1940, as amended) of the fund, were assisted in their review by independent legal counsel and met with counsel in executive session separate from representatives of the Manager. In approving the Agreements, the Board members considered all factors that they believed to be relevant, including, among other things, the factors discussed below.
Analysis of Nature, Extent and Quality of Services Provided to the Fund. The Board members considered information previously provided to them in a presentation from representatives of the Manager regarding services provided to other funds in the Dreyfus fund complex, and representatives of the Manager confirmed that there had been no material changes in this information.The Board also discussed the nature, extent and quality of the services to be provided to the fund pursuant to the Agreements. The Board members also referenced information provided and discussions at previous meetings regarding the relationships the Manager has with various intermediaries and the different needs of each, the diversity of distribution among the funds in the Dreyfus fund complex, and the Manager’s corresponding need for broad, deep, and diverse resources to be able to provide ongoing shareholder services to the different distribution channels.
The Board members also considered the Manager’s and Sub-Adviser’s research and portfolio management capabilities and the Manager’s oversight of day-to-day fund operations, including fund accounting and administration and assistance in meeting legal and regulatory requirements. The Board members also considered the Manager’s extensive administrative, accounting and compliance infrastructure, as
28
well as the Manager’s supervisory activities over the Sub-Adviser.The Board also considered the Manager’s and the Sub-Adviser’s brokerage policies and practices, the standards applied in seeking best execution and the Manager’s and the Sub-Adviser’s policies and practices regarding soft dollars.
Comparative Analysis of the Fund’s Performance and Management Fee and Expense Ratio.As the fund had not yet commenced operations, the Board members were not able to review the fund’s performance. However, the Board reviewed the performance of another fund managed by the fund’s portfolio managers in a similar investment strategy. The Board discussed with representatives of the Manager the investment strategies to be employed in the management of the fund’s assets. The Board members noted the Manager’s and Sub-Adviser’s reputation and experience with respect to similar funds.
Management provided comparisons of the fund’s proposed advisory fee to those of funds in the Lipper Emerging Markets Funds category, and separately, to funds that invest primarily in India.The Board members noted that the fund’s proposed contractual management fee, while higher than the average management fee in the Lipper Emerging Markets Funds category, was within the range of the contractual management fees of funds that invest primarily in India. Management has contractually agreed, until March 31, 2013, to waive receipt of its fees and/or assume the expenses of the Fund so that the direct expenses of the none of the classes (excluding Rule 12b-1 fees, shareholder services fees taxes, interest expense, brokerage commissions, commitment fees on borrowings and extraordinary expenses) exceed 1.75% of the fund’s average daily net assets.
Representatives of the Manager reviewed with the Board members the fees paid by other funds and accounts managed by the Manager or the Sub-Adviser or their affiliates with similar investment objectives, policies and strategies as the fund (the “Similar Accounts”), and explained the nature of the Similar Accounts and the differences, from the Manager’s and Sub-Adviser’s perspective, as applicable, in providing
| The Fund | 29 |
| INFORMATION ABOUT THE REVIEW AND APPROVAL OF THE |
| FUND’S MANAGEMENT AND SUB-INVESTMENT |
| ADVISORY AGREEMENTS (Unaudited) (continued) |
services to the Similar Accounts as compared to the fund.The Board members considered the relevance of the fee information provided for the Similar Accounts managed by the Manager or Sub-Adviser, as applicable, to evaluate the appropriateness and reasonableness of the fund’s management fees.
Analysis of Profitability and Economies of Scale. As the fund had not yet commenced operations, the Manager’s representatives were not able to review the dollar amount of expenses allocated and profit received by the Manager.The Board members also considered potential benefits to the Manager and Sub-Adviser from acting as investment adviser and sub-investment adviser, respectively, and noted the possibility of future soft dollar arrangements with respect to trading the fund’s portfolio. The Board also considered whether the fund would be able to participate in any economies of scale that the Manager may experience in the event that the fund attracts a large amount of assets. The Board members noted the uncertainty of the estimated asset levels and discussed the renewal requirements for advisory agreements and their ability to review the management fee annually after an initial term of the Agreements.
At the conclusion of these discussions, the Board agreed that it had been furnished with sufficient information to make an informed business decision with respect to approving the Agreements. Based on the discussions and considerations as described above, the Board made the following conclusions and determinations.
The Board concluded that the nature, extent and quality of the ser- vices to be provided by the Manager and Sub-Adviser are adequate and appropriate, especially considering the Manager’s and Sub- Adviser’s experience and reputation with respect to its investment approach and its experience and reputation with respect to investing in similar funds.
30
The Board concluded that, since the fund had not yet commenced operations, its performance could not be measured and was not a factor. The Board considered the Manager’s and Sub-Adviser’s experience and reputation.
The Board concluded that the fee to be paid by the fund to the Manager was reasonable, in light of the services to be provided, comparative expense and advisory fee information, and benefits anticipated to be derived by the Manager and the Sub-Adviser from their relationship with the fund, and that the fee to be paid by the Manager to the Sub-Adviser is reasonable and appropriate.
The Board determined that because the fund had not commenced operations, economies of scale were not a factor, but, to the extent that material economies of scale are not shared with the fund in the future, the Board would seek to do so in connection with future renewals.
The Board members considered these conclusions and determinations, and, without any one factor being dispositive, the Board determined that approval of the Agreements was in the best interests of the fund and its shareholders.
| The Fund | 31 |
BOARD MEMBERS INFORMATION (Unaudited)
| Joseph S. DiMartino (68) |
| Chairman of the Board (1995) |
| Principal Occupation During Past 5Years: |
| • Corporate Director and Trustee |
| Other Public Company Board Memberships During Past 5Years: |
| • CBIZ (formerly, Century Business Services, Inc.), a provider of outsourcing functions for small |
| and medium size companies, Director (1997-present) |
| • Sunair Services Corporation, a provider of certain outdoor-related services to homes and |
| businesses, Director (2005-2009) |
| • The Newark Group, a provider of a national market of paper recovery facilities, paperboard |
| mills and paperboard converting plants, Director (2000-2010) |
| No. of Portfolios for which Board Member Serves: 167 |
| ——————— |
| Gordon J. Davis (70) |
| Board Member (1994) |
| Principal Occupation During Past 5Years: |
| • Partner in the law firm of Dewey & LeBoeuf LLP |
| Other Public Company Board Memberships During Past 5Years: |
| • Consolidated Edison, Inc., a utility company, Director (1997-present) |
| • The Phoenix Companies Inc., a life insurance company, Director (2000-present) |
| No. of Portfolios for which Board Member Serves: 44 |
| ——————— |
| David P. Feldman (71) |
| Board Member (1991) |
| Principal Occupation During Past 5Years: |
| • Corporate Director and Trustee |
| Other Public Company Board Memberships During Past 5Years: |
| • BBH Mutual Funds Group (4 registered mutual funds), Director (1992-present) |
| • QMed Inc., a healthcare company, Director (1999-2007) |
| No. of Portfolios for which Board Member Serves: 50 |
32
| Lynn Martin (71) |
| Board Member (1993) |
| Principal Occupation During Past 5Years: |
| • President of The Martin Hall Group LLC, a human resources consulting firm, from January |
| 2005-present |
| • Advisor to the international accounting firm of Deloitte & Touche, LLP and Chair to its |
| Council for the Advancement of Women from March 1993-September 2005 |
| Other Public Company Board Memberships During Past 5Years: |
| • AT&T Inc., a telecommunications company, Director (1999-present) |
| • Ryder System, Inc., a supply chain and transportation management company, Director |
| (1993-present) |
| • The Proctor & Gamble Co., a consumer products company, Director (1994-present) |
| • Constellation Energy Group Inc., Director (2003-present) |
| No. of Portfolios for which Board Member Serves: 15 |
| ——————— |
| Robin A. Melvin (48) |
| Board Member (2011) |
| Principal Occupation During Past 5Years: |
| • Director, Boisi Family Foundation, a private family foundation that supports youth-serving |
| organizations that promote the self sufficiency of youth from disadvantaged circumstances |
| (1995-present) |
| • SeniorVice President, Mentor, a national non-profit youth mentoring organization (1992-2005) |
| No. of Portfolios for which Board Member Serves: 54 |
| ——————— |
| Philip L. Toia (78) |
| Board Member (1997) |
| Principal Occupation During Past 5Years: |
| • Private Investor |
| No. of Portfolios for which Board Member Serves: 25 |
| ——————— |
Once elected all Board Members serve for an indefinite term, but achieve Emeritus status upon reaching age 80.The address of the Board Members and Officers is in c/o The Dreyfus Corporation, 200 Park Avenue, NewYork, NewYork 10166.Additional information about the Board Members is available in the fund’s Statement of Additional Information which can be obtained from Dreyfus free of charge by calling this toll free number: 1-800-DREYFUS.
Daniel Rose, Emeritus Board Member
Sander Vanocur, Emeritus Board Member
| The Fund | 33 |
OFFICERS OF THE FUND (Unaudited)
BRADLEY J. SKAPYAK, President since January 2010.
Chief Operating Officer and a director of the Manager since June 2009. From April 2003 to June 2009, Mr. Skapyak was the head of the Investment Accounting and Support Department of the Manager. He is an officer of 75 investment companies (comprised of 167 portfolios) managed by the Manager. He is 52 years old and has been an employee of the Manager since February 1988.
MICHAEL A. ROSENBERG, Vice President and Secretary since August 2005.
Assistant General Counsel of BNY Mellon, and an officer of 76 investment companies (comprised of 192 portfolios) managed by the Manager. He is 51 years old and has been an employee of the Manager since October 1991.
KIESHA ASTWOOD, Vice President and Assistant Secretary since January 2010.
Counsel of BNY Mellon, and an officer of 76 investment companies (comprised of 192 portfolios) managed by the Manager. She is 38 years old and has been an employee of the Manager since July 1995.
JAMES BITETTO, Vice President and Assistant Secretary since August 2005.
Senior Counsel of BNY Mellon and Secretary of the Manager, and an officer of 76 investment companies (comprised of 192 portfolios) managed by the Manager. He is 45 years old and has been an employee of the Manager since December 1996.
JONI LACKS CHARATAN, Vice President and Assistant Secretary since August 2005.
Senior Counsel of BNY Mellon, and an officer of 76 investment companies (comprised of 192 portfolios) managed by the Manager. She is 55 years old and has been an employee of the Manager since October 1988.
JOSEPH M. CHIOFFI, Vice President and Assistant Secretary since August 2005.
Senior Counsel of BNY Mellon, and an officer of 76 investment companies (comprised of 192 portfolios) managed by the Manager. He is 49 years old and has been an employee of the Manager since June 2000.
KATHLEEN DENICHOLAS, Vice President and Assistant Secretary since January 2010.
Managing Counsel of BNY Mellon, and an officer of 76 investment companies (comprised of 192 portfolios) managed by the Manager. She is 37 years old and has been an employee of the Manager since February 2001.
JANETTE E. FARRAGHER, Vice President and Assistant Secretary since August 2005.
Assistant General Counsel of BNY Mellon, and an officer of 76 investment companies (comprised of 192 portfolios) managed by the Manager. She is 48 years old and has been an employee of the Manager since February 1984.
JOHN B. HAMMALIAN, Vice President and Assistant Secretary since August 2005.
Senior Managing Counsel of BNY Mellon, and an officer of 76 investment companies (comprised of 192 portfolios) managed by the Manager. He is 48 years old and has been an employee of the Manager since February 1991.
M. CRISTINA MEISER, Vice President and Assistant Secretary since January 2010.
Senior Counsel of BNY Mellon, and an officer of 76 investment companies (comprised of 192 portfolios) managed by the Manager. She is 41 years old and has been an employee of the Manager since August 2001.
34
ROBERT R. MULLERY, Vice President and Assistant Secretary since August 2005.
Managing Counsel of BNY Mellon, and an officer of 76 investment companies (comprised of 192 portfolios) managed by the Manager. He is 59 years old and has been an employee of the Manager since May 1986.
JEFF PRUSNOFSKY, Vice President and Assistant Secretary since August 2005.
Senior Managing Counsel of BNY Mellon, and an officer of 76 investment companies (comprised of 192 portfolios) managed by the Manager. He is 46 years old and has been an employee of the Manager since October 1990.
JAMES WINDELS, Treasurer since November 2001.
Director – Mutual Fund Accounting of the Manager, and an officer of 76 investment companies (comprised of 192 portfolios) managed by the Manager. He is 53 years old and has been an employee of the Manager since April 1985.
RICHARD CASSARO, Assistant Treasurer since January 2008.
Senior Accounting Manager – Money Market and Municipal Bond Funds of the Manager, and an officer of 76 investment companies (comprised of 192 portfolios) managed by the Manager. He is 52 years old and has been an employee of the Manager since September 1982.
GAVIN C. REILLY, Assistant Treasurer since December 2005.
Tax Manager of the Investment Accounting and Support Department of the Manager, and an officer of 76 investment companies (comprised of 192 portfolios) managed by the Manager. He is 43 years old and has been an employee of the Manager since April 1991.
ROBERT ROBOL, Assistant Treasurer since December 2002.
Senior Accounting Manager – Fixed Income Funds of the Manager, and an officer of 76 investment companies (comprised of 192 portfolios) managed by the Manager. He is 47 years old and has been an employee of the Manager since October 1988.
ROBERT SALVIOLO, Assistant Treasurer since July 2007.
Senior Accounting Manager – Equity Funds of the Manager, and an officer of 76 investment companies (comprised of 192 portfolios) managed by the Manager. He is 44 years old and has been an employee of the Manager since June 1989.
ROBERT SVAGNA, Assistant Treasurer since December 2002.
Senior Accounting Manager – Equity Funds of the Manager, and an officer of 76 investment companies (comprised of 192 portfolios) managed by the Manager. He is 44 years old and has been an employee of the Manager since November 1990.
| The Fund | 35 |
OFFICERS OF THE FUND (Unaudited) (continued)
JOSEPH W. CONNOLLY, Chief Compliance Officer since October 2004.
Chief Compliance Officer of the Manager and The Dreyfus Family of Funds (76 investment companies, comprised of 192 portfolios). From November 2001 through March 2004, Mr. Connolly was first Vice-President, Mutual Fund Servicing for Mellon Global Securities Services. In that capacity, Mr. Connolly was responsible for managing Mellon’s Custody, Fund Accounting and Fund Administration services to third-party mutual fund clients.
He is 54 years old and has served in various capacities with the Manager since 1980, including manager of the firm’s Fund Accounting Department from 1997 through October 2001.
STEPHEN J. STOREN, Anti-Money Laundering Compliance Officer since May 2011.
Chief Compliance Officer of the Distributor, and the Anti-Money Laundering Compliance Officer of 72 investment companies (comprised of 188 portfolios) managed by the Manager. He is 57 years old and has been an employee of the Distributor since October 1999.
36
For More Information
Telephone Call your financial representative or 1-800-DREYFUS
Mail The Dreyfus Family of Funds, 144 Glenn Curtiss Boulevard, Uniondale, NY 11556-0144
The fund files its complete schedule of portfolio holdings with the Securities and Exchange Commission (“SEC”) for the first and third quarters of each fiscal year on Form N-Q. The fund’s Forms N-Q are available on the SEC’s website at http://www.sec.gov and may be reviewed and copied at the SEC’s Public Reference Room in Washington, DC. Information on the operation of the Public Reference Room may be obtained by calling 1-800-SEC-0330.
A description of the policies and procedures that the fund uses to determine how to vote proxies relating to portfolio securities, and information regarding how the fund voted these proxies for the most recent 12-month period ended June 30 is available at http://www.dreyfus.com and on the SEC’s website at http://www.sec.gov. The description of the policies and procedures is also available without charge, upon request, by calling 1-800-DREYFUS.

| Dreyfus |
| Satellite Alpha Fund |
ANNUAL REPORT October 31, 2011
Save time. Save paper. View your next shareholder report online as soon as it’s available. Log into www.dreyfus.com and sign up for Dreyfus eCommunications. It’s simple and only takes a few minutes.
The views expressed in this report reflect those of the portfolio manager only through the end of the period covered and do not necessarily represent the views of Dreyfus or any other person in the Dreyfus organization. Any such views are subject to change at any time based upon market or other conditions and Dreyfus disclaims any responsibility to update such views.These views may not be relied on as investment advice and, because investment decisions for a Dreyfus fund are based on numerous factors, may not be relied on as an indication of trading intent on behalf of any Dreyfus fund.
| Not FDIC-Insured • Not Bank-Guaranteed • May Lose Value |
Contents | |
THE FUND | |
| 2 | A Letter from the Chairman and CEO |
| 3 | Discussion of Fund Performance |
| 6 | Fund Performance |
| 8 | Understanding Your Fund’s Expenses |
| 8 | Comparing Your Fund’s Expenses With Those of Other Funds |
| 9 | Statement of Investments |
| 10 | Statement of Assets and Liabilities |
| 11 | Statement of Operations |
| 12 | Statement of Changes in Net Assets |
| 14 | Financial Highlights |
| 17 | Notes to Financial Statements |
| 26 | Report of Independent Registered Public Accounting Firm |
| 27 | Important Tax Information |
| 28 | Proxy Results |
| 29 | Information About the Renewal of the Fund’s Management Agreement |
| 33 | Board Members Information |
| 35 | Officers of the Fund |
FOR MORE INFORMATION | |
Back Cover |
Dreyfus
Satellite Alpha Fund
The Fund

A LETTER FROM THE CHAIRMAN AND CEO
Dear Shareholder:
We present to you this annual report for Dreyfus Satellite Alpha Fund, covering the 12-month period from November 1, 2010, through October 31, 2011. For information about how the fund performed during the reporting period, as well as general market perspectives, we provide a Discussion of Fund Performance on the pages that follow.
Investors were encouraged by expectations of a more robust economic recovery during the final months of 2010, but sentiment deteriorated in 2011 due to disappointing global economic data, rising commodity prices, an escalating sovereign debt crisis in Europe and a contentious debate regarding taxes, spending and borrowing in the United States. International stocks proved sensitive to these macroeconomic developments, often regardless of underlying company fundamentals, and most international equity market indices ended the reporting period with mildly negative absolute returns.
The global economic outlook currently remains clouded by market turbulence and political infighting, but we believe that a continued subpar global expansion is more likely than a return to recession. Although Europe continues to struggle with a debt crisis, inflationary pressures appear to be waning in most countries as energy prices recently have retreated from their highs. In Asia, China seems to have averted an economic contraction after implementing measures to dampen inflationary pressures. In the United States, moderately low core inflation and an accommodative monetary policy could help support near-trend growth despite ongoing deleveraging activity in the private sector.To assess the potential impact of these and other developments on your investments, we encourage you, as always, to speak with your financial advisor.
Thank you for your continued confidence and support.

Jonathan R. Baum
Chairman and Chief Executive Officer
The Dreyfus Corporation
November 15, 2011
2

DISCUSSION OF FUND PERFORMANCE
For the period of November 1, 2010, through October 31, 2011, as provided by Richard B. Hoey,A. Paul Disdier, Christopher E. Sheldon, CFA, and Keith L. Stransky, CFA, Portfolio Managers
Fund and Market Performance Overview
For the 12-month period ended October 31, 2011, Dreyfus Satellite Alpha Fund’s Class A shares produced a total return of 1.41%, Class C shares returned 0.63% and Class I shares returned 1.61%.1 In comparison, the fund’s benchmark, the Morgan Stanley Capital International (MSCI)World Index (the “Index”), produced a total return of 1.76% for the same period.2
Most financial markets rallied through the first quarter of 2011 as a global economic recovery gained traction, but renewed macroeconomic concerns later caused the markets to give back many of those gains. The fund’s Class I shares produced returns that were roughly in line with the benchmark, primarily due to allocation changes designed to achieve a more defensive investment posture.
The Fund’s Investment Approach
The fund seeks long-term capital appreciation. To pursue its goal, the fund normally allocates its assets among other mutual funds advised by The Dreyfus Corporation (Dreyfus) that provide exposure to alternative or non-traditional (i.e., satellite) asset categories or investment strategies. The underlying funds are selected by the Dreyfus Investment Committee based on their investment objectives and management policies, portfolio holdings, risk/reward profiles, historical performance and other factors. The Dreyfus Investment Committee will rebalance the fund’s investments in the underlying funds at least annually, but may do so more often in response to market conditions.As of October 31, 2011, the fund’s assets were allocated as follows:
| Underlying Funds | (%) |
| Dreyfus Global Absolute Return Fund | 34 |
| Dreyfus Emerging Markets Debt Local Currency Fund | 15 |
| Dreyfus Global Real Estate Securities Fund | 14 |
| Dreyfus Natural Resources Fund | 13 |
| Dreyfus Inflation Adjusted Securities Fund | 10 |
| Dreyfus International Bond Fund | 10 |
| Dreyfus Emerging Markets Fund | 2 |
| Dreyfus/The Boston Company Emerging | |
| Markets Core Equity Fund | 2 |
| The Fund | 3 |
DISCUSSION OF FUND PERFORMANCE (continued)
Macroeconomic Developments Challenged Global Growth
Positive market sentiment generally prevailed over the final months of 2010 amid expectations of continued global economic recovery. However, in February 2011 investors grew concerned about inflationary pressures in China and rising energy prices stemming from political unrest in the Middle East. In March, catastrophic natural and nuclear disasters struck Japan, disrupting the global industrial supply chain. Nonetheless, most equity markets rebounded quickly from these unexpected shocks.
In May, investor sentiment began to deteriorate in earnest. U.S. economic growth proved more sluggish than expected, and investors worried about a contentious debate regarding U.S. government spending, borrowing and taxes. In Europe, the debt problems facing Ireland, Portugal, Spain and Italy intensified, and Greece faced the possibility of default. Consequently, global markets lost much of the ground they had gained earlier. In a reversal of the trend over the past several years, developed markets represented in the MSCI EAFEWorld Index generally fared better than emerging markets.
Allocation Shifts Buoyed Relative Performance
The fund’s allocation strategy positioned it relatively well for the reporting period’s macroeconomic developments. During a generally constructive market environment in January 2011, we moved some assets from Dreyfus Emerging Markets Debt Local Currency Fund and Dreyfus Global Absolute Return Fund to Dreyfus/The Boston Company Emerging Markets Core Equity Fund, effectively increasing its participation in rising equity and currency markets.
When evidence of renewed economic uncertainty began to mount in March, we reversed direction, shifting assets toward investments that we believed would hold up well during bouts of heightened market volatility. Accordingly, we reduced the fund’s exposure to Dreyfus Emerging Markets Debt Local Currency Fund and to Dreyfus/The Boston Company Emerging Markets Core Equity Fund in favor of Dreyfus Inflation Adjusted Securities Fund and Dreyfus Global Absolute Return Fund.This change proved well timed when a “flight to quality” ensued over the spring and summer of 2011.
By August, global inflation concerns had moderated and currencies in the emerging markets had reached more attractive valuations, prompting us to shift a portion of the assets in Dreyfus Inflation Adjusted Securities Fund to Dreyfus Emerging Markets Debt Local Currency Fund.
Maintaining a Cautious Approach
As of the reporting period’s end, we have adopted a generally cautious outlook.Although a return to global recession looks unlikely at this point
4
in time, inflation-fighting efforts in the emerging markets have dampened a major engine of global growth, Europe has continued to struggle with its sovereign debt crisis, and unemployment remains elevated in the United States.Therefore, we have retained the fund’s emphasis on global bond markets in developed and emerging markets through Dreyfus Global Absolute Return Fund.We also have maintained significant positions in global real estate markets and commodities through Dreyfus Global Real Estate Securities Fund and Dreyfus Natural Resources Fund, respectively. In contrast, we have allocated a relatively small percentage of the fund’s assets to global stock markets. In our judgment, these are prudent strategies until the direction of the global economy becomes clearer.
November 15, 2011
| Equity funds are subject generally to market, market sector, market liquidity, issuer and investment | |
| style risks, among other factors, to varying degrees, all of which are more fully described in the | |
| prospectus of the fund and that of each underlying fund. | |
| The ability of the fund to achieve its investment goal depends, in part, on the ability of the Dreyfus | |
| Investment Committee to allocate effectively the fund’s assets among the underlying funds.There can | |
| be no assurance that the actual allocations will be effective in achieving the fund’s investment goal. | |
| Each underlying international equity fund’s performance will be influenced by political, social and | |
| economic factors affecting investments in foreign companies. Special risks associated with such | |
| companies include exposure to currency fluctuations, less liquidity, less developed or less efficient | |
| trading markets, lack of comprehensive company information, political instability and differing | |
| auditing and legal standards. | |
| Because one of the underlying fund’s investments is concentrated in the securities of companies | |
| principally engaged in the real estate sector, the value of the fund’s shares will be affected by factors | |
| particular to the real estate sector and may fluctuate more widely than that of a fund which invests in | |
| a broader range of industries.The securities of issuers that are principally engaged in the real estate | |
| sector may be subject to risks similar to those associated with the direct ownership of real estate. | |
| Because the fund seeks to provide exposure to alternative or non-traditional (i.e., satellite) asset | |
| categories or investment strategies, the fund’s performance will be linked to the performance of these | |
| highly volatile asset categories and strategies.Accordingly, investors should consider purchasing | |
| shares of the fund only as part of an overall diversified portfolio and should be willing to assume | |
| the risks of potentially significant fluctuations in the value of fund shares. | |
| 1 | Total return includes reinvestment of dividends and any capital gains paid, and does not take into |
| consideration the maximum initial sales charge in the case of Class A shares, or the applicable | |
| contingent deferred sales charge imposed on redemptions in the case of Class C shares. Had these | |
| charges been reflected, returns would have been lower. Past performance is no guarantee of future | |
| results. Share price and investment return fluctuate such that upon redemption, fund shares may be | |
| worth more or less than their original cost. Return figures provided reflect the absorption of certain | |
| fund expenses pursuant to an agreement by The Dreyfus Corporation in effect until March 1, | |
| 2013, at which time it may be extended, terminated or modified. Had these expenses not been | |
| absorbed, the fund’s returns would have been lower. | |
| 2 | SOURCE: LIPPER INC. – Reflects reinvestment of net dividends and, where applicable, |
| capital gain distributions.The Morgan Stanley Capital International (MSCI) World Index is an | |
| unmanaged index of global stock market performance, including the United States, Canada, | |
| Europe,Australia, New Zealand and the Far East. |
| The Fund | 5 |
FUND PERFORMANCE
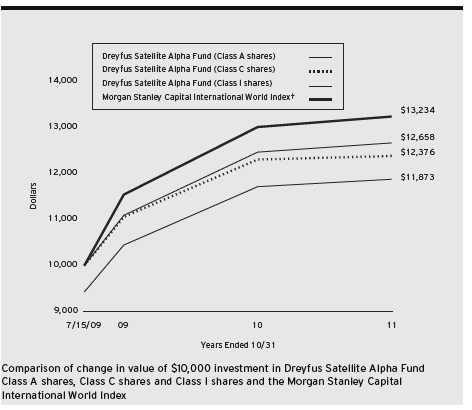
| † Source: Lipper Inc. |
| Past performance is not predictive of future performance. |
| The above graph compares a $10,000 investment made in Class A, Class C and Class I shares of Dreyfus Satellite |
| Alpha Fund on 7/15/09 (inception date) to a $10,000 investment made in the Morgan Stanley Capital International |
| World Index (the “Index”) on that date.All dividends and capital gain distributions are reinvested. |
| The fund’s performance shown in the line graph above takes into account the maximum initial sales charge on Class A |
| shares and all other applicable fees and expenses on all classes.The Index is an unmanaged index of global stock market |
| performance, including the United States, Canada, Europe,Australia, New Zealand and the Far East. Unlike a mutual |
| fund, the Index is not subject to charges, fees and other expenses. Investors cannot invest directly in any index. Further |
| information relating to fund performance, including expense reimbursements, if applicable, is contained in the Financial |
| Highlights section of the prospectus and elsewhere in this report. |
6
| Average Annual Total Returns as of 10/31/11 | |||||
| Inception | From | ||||
| Date | 1Year | Inception | |||
| Class A shares | |||||
| with maximum sales charge (5.75%) | 7/15/09 | –4.44% | 7.75% | ||
| without sales charge | 7/15/09 | 1.41% | 10.55% | ||
| Class C shares | |||||
| with applicable redemption charge † | 7/15/09 | –0.36% | 9.71% | ||
| without redemption | 7/15/09 | 0.63% | 9.71% | ||
| Class I shares | 7/15/09 | 1.61% | 10.79% | ||
| Morgan Stanley Capital | |||||
| International World Index | 6/30/09 | 1.76% | 12.76%†† | ||
Past performance is not predictive of future performance.The fund’s performance shown in the graph and table does not reflect the deduction of taxes that a shareholder would pay on fund distributions or the redemption of fund shares.
| † | The maximum contingent deferred sales charge for Class C shares is 1% for shares redeemed within one year of the |
| date of purchase. | |
| †† | For comparative purposes, the value of the Index as of 6/30/09 is used as the beginning value on 7/15/09. |
| The Fund | 7 |
UNDERSTANDING YOUR FUND’S EXPENSES (Unaudited)
As a mutual fund investor, you pay ongoing expenses, such as management fees and other expenses. Using the information below, you can estimate how these expenses affect your investment and compare them with the expenses of other funds.You also may pay one-time transaction expenses, including sales charges (loads) and redemption fees, which are not shown in this section and would have resulted in higher total expenses. For more information, see your fund’s prospectus or talk to your financial adviser.
Review your fund’s expenses
The table below shows the expenses you would have paid on a $1,000 investment in Dreyfus Satellite Alpha Fund from May 1, 2011 to October 31, 2011. It also shows how much a $1,000 investment would be worth at the close of the period, assuming actual returns and expenses.
Expenses and Value of a $1,000 Investment
assuming actual returns for the six months ended October 31, 2011
| Class A | Class C | Class I | ||||
| Expenses paid per $1,000† | $ | 2.56 | $ | 6.19 | $ | 1.28 |
| Ending value (after expenses) | $ | 954.00 | $ | 950.00 | $ | 954.70 |
COMPARING YOUR FUND’S EXPENSES
WITH THOSE OF OTHER FUNDS (Unaudited)
Using the SEC’s method to compare expenses
The Securities and Exchange Commission (SEC) has established guidelines to help investors assess fund expenses. Per these guidelines, the table below shows your fund’s expenses based on a $1,000 investment, assuming a hypothetical 5% annualized return. You can use this information to compare the ongoing expenses (but not transaction expenses or total cost) of investing in the fund with those of other funds.All mutual fund shareholder reports will provide this information to help you make this comparison. Please note that you cannot use this information to estimate your actual ending account balance and expenses paid during the period.
Expenses and Value of a $1,000 Investment
assuming a hypothetical 5% annualized return for the six months ended October 31, 2011
| Class A | Class C | Class I | ||||
| Expenses paid per $1,000† | $ | 2.65 | $ | 6.41 | $ | 1.33 |
| Ending value (after expenses) | $ | 1,022.58 | $ | 1,018.85 | $ | 1,023.89 |
| † Expenses are equal to the fund’s annualized expense ratio of .52% for Class A, 1.26% for Class C and .26% |
| for Class I, multiplied by the average account value over the period, multiplied by 184/365 (to reflect the |
| one-half year period). |
8
| STATEMENT OF INVESTMENTS |
| October 31, 2011 |
| Registered Investment Companies—100.2% | Shares | Value ($) | ||
| Dreyfus Emerging Markets Debt Local Currency Fund, Cl. I | 7,930a | 112,451 | ||
| Dreyfus Emerging Markets Fund, Cl. I | 1,500a | 16,839 | ||
| Dreyfus Global Absolute Return Fund, Cl. I | 21,037a | 256,440 | ||
| Dreyfus Global Real Estate Securities Fund, Cl. I | 15,425a | 110,134 | ||
| Dreyfus Inflation Adjusted | ||||
| Securities Fund, Institutional Shares | 5,255a | 72,992 | ||
| Dreyfus International Bond Fund, Cl. I | 4,419a | 74,864 | ||
| Dreyfus Natural Resources Fund, Cl. I | 3,724a,b | 99,275 | ||
| Dreyfus/The Boston Company Emerging | ||||
| Markets Core Equity Fund, Cl. I | 693a,b | 16,972 | ||
| Total Investments (cost $721,105) | 100.2% | 759,967 | ||
| Liabilities, Less Cash and Receivables | (.2%) | (1,635) | ||
| Net Assets | 100.0% | 758,332 | ||
| a | Investment in affiliated mutual fund. |
| b | Non-income producing security. |
| Portfolio Summary (Unaudited)† | |||
| Value (%) | Value (%) | ||
| Mutual Funds: Foreign | 77.5 | Mutual Funds: Domestic | 22.7 |
| 100.2 | |||
| † Based on net assets. | |||
| See notes to financial statements. | |||
| The Fund | 9 |
| STATEMENT OF ASSETS AND LIABILITIES |
| October 31, 2011 |
| Cost | Value | ||
| Assets ($): | |||
| Investments in affiliated issuers—See Statement of Investments | 721,105 | 759,967 | |
| Cash | 23,126 | ||
| Receivable for shares of Common Stock subscribed | 3,000 | ||
| Prepaid expenses | 12,755 | ||
| Due from The Dreyfus Corporation and affiliates—Note 2(c) | 3,603 | ||
| 802,451 | |||
| Liabilities ($): | |||
| Accrued expenses | 44,119 | ||
| Net Assets ($) | 758,332 | ||
| Composition of Net Assets ($): | |||
| Paid-in capital | 711,402 | ||
| Accumulated undistributed investment income—net | 4,085 | ||
| Accumulated net realized gain (loss) on investments | 3,983 | ||
| Accumulated net unrealized appreciation | |||
| (depreciation) on investments in affiliated issuers | 38,862 | ||
| Net Assets ($) | 758,332 | ||
| Net Asset Value Per Share | |||
| Class A | Class C | Class I | |
| Net Assets ($) | 550,081 | 125,088 | 83,163 |
| Shares Outstanding | 35,855 | 8,233 | 5,400 |
| Net Asset Value Per Share ($) | 15.34 | 15.19 | 15.40 |
| See notes to financial statements. | |||
10
| STATEMENT OF OPERATIONS |
| Year Ended October 31, 2011 |
| Investment Income ($): | ||
| Income: | ||
| Cash dividends from affiliated issuers | 12,326 | |
| Expenses: | ||
| Registration fees | 55,132 | |
| Auditing fees | 38,879 | |
| Prospectus and shareholders’ reports | 12,347 | |
| Shareholder servicing costs—Note 2(c) | 2,879 | |
| Custodian fees—Note 2(c) | 1,785 | |
| Distribution fees—Note 2(b) | 835 | |
| Directors’ fees and expenses—Note 2(d) | 323 | |
| Legal fees | 51 | |
| Miscellaneous | 12,219 | |
| Total Expenses | 124,450 | |
| Less—reduction in expenses due to undertaking—Note 2(a) | (120,269) | |
| Less—reduction in fees due to earnings credits—Note 2(c) | (1) | |
| Net Expenses | 4,180 | |
| Investment Income—Net | 8,146 | |
| Realized and Unrealized Gain (Loss) on Investments—Note 3 ($): | ||
| Net realized gain (loss) on investments in affiliated issuers | 1,254 | |
| Capital gain distributions from affiliated issuers | 9,463 | |
| Net Realized Gain (Loss) | 10,717 | |
| Net unrealized appreciation (depreciation) | ||
| on investments in affiliated issuers | (17,027) | |
| Net Realized and Unrealized Gain (Loss) on Investments | (6,310) | |
| Net Increase in Net Assets Resulting from Operations | 1,836 | |
| See notes to financial statements. | ||
| The Fund | 11 |
STATEMENT OF CHANGES IN NET ASSETS
| Year Ended October 31, | ||||
| 2011 | 2010 | |||
| Operations ($): | ||||
| Investment income—net | 8,146 | 5,262 | ||
| Net realized gain (loss) on investments | 10,717 | (3,937) | ||
| Net unrealized appreciation (depreciation) | ||||
| on investments in affiliated issuers | (17,027) | 36,155 | ||
| Net Increase (Decrease) in Net Assets | ||||
| Resulting from Operations | 1,836 | 37,480 | ||
| Dividends to Shareholders from ($): | ||||
| Investment income—net: | ||||
| Class A Shares | (8,624) | (12) | ||
| Class C Shares | (1,516) | — | ||
| Class I Shares | (2,189) | (122) | ||
| Net realized gain on investments: | ||||
| Class A Shares | — | (35) | ||
| Class C Shares | — | (15) | ||
| Class I Shares | — | (46) | ||
| Total Dividends | (12,329) | (230) | ||
| Capital Stock Transactions ($): | ||||
| Net proceeds from shares sold: | ||||
| Class A Shares | 462,039 | 10,015 | ||
| Class C Shares | 42,738 | 5,250 | ||
| Class I Shares | 61,255 | 178,433 | ||
| Dividends reinvested: | ||||
| Class A Shares | 5,437 | 47 | ||
| Class C Shares | 404 | 15 | ||
| Class I Shares | 511 | 56 | ||
| Cost of shares redeemed: | ||||
| Class A Shares | (101,386) | (14) | ||
| Class C Shares | (15) | — | ||
| Class I Shares | (93,348) | (129,753) | ||
| Increase (Decrease) in Net Assets | ||||
| from Capital Stock Transactions | 377,635 | 64,049 | ||
| Total Increase (Decrease) in Net Assets | 367,142 | 101,299 | ||
| Net Assets ($): | ||||
| Beginning of Period | 391,190 | 289,891 | ||
| End of Period | 758,332 | 391,190 | ||
| Undistributed investment income—net | 4,085 | 6,109 | ||
12
| Year Ended October 31, | ||||
| 2011 | 2010 | |||
| Capital Share Transactions: | ||||
| Class A | ||||
| Shares sold | 29,785 | 690 | ||
| Shares issued for dividends reinvested | 355 | 3 | ||
| Shares redeemed | (6,661) | (1) | ||
| Net Increase (Decrease) in Shares Outstanding | 23,479 | 692 | ||
| Class C | ||||
| Shares sold | 2,755 | 378 | ||
| Shares issued for dividends reinvested | 26 | 1 | ||
| Shares redeemed | (1) | — | ||
| Net Increase (Decrease) in Shares Outstanding | 2,780 | 379 | ||
| Class I | ||||
| Shares sold | 3,901 | 12,361 | ||
| Shares issued for dividends reinvested | 33 | 4 | ||
| Shares redeemed | (5,953) | (9,125) | ||
| Net Increase (Decrease) in Shares Outstanding | (2,019) | 3,240 | ||
| See notes to financial statements. | ||||
| The Fund | 13 |
FINANCIAL HIGHLIGHTS
The following tables describe the performance for each share class for the fiscal periods indicated.All information (except portfolio turnover rate) reflects financial results for a single fund share.Total return shows how much your investment in the fund would have increased (or decreased) during each period, assuming you had reinvested all dividends and distributions.These figures have been derived from the fund’s financial statements.
| Year Ended October 31, | ||||||
| Class A Shares | 2011 | 2010 | 2009a | |||
| Per Share Data ($): | ||||||
| Net asset value, beginning of period | 15.51 | 13.85 | 12.50 | |||
| Investment Operations: | ||||||
| Investment income—netb | .20 | .18 | .00c | |||
| Net realized and unrealized | ||||||
| gain (loss) on investments | .03 | 1.48 | 1.35 | |||
| Total from Investment Operations | .23 | 1.66 | 1.35 | |||
| Distributions: | ||||||
| Dividends from investment income—net | (.40) | (.00)c | — | |||
| Dividends from net realized gain on investments | — | (.00)c | — | |||
| Total Distributions | (.40) | (.00)c | — | |||
| Net asset value, end of period | 15.34 | 15.51 | 13.85 | |||
| Total Return (%)d | 1.41 | 12.09 | 10.80e | |||
| Ratios/Supplemental Data (%): | ||||||
| Ratio of total expenses to average net assetsf | 18.57 | 37.30 | 100.93g | |||
| Ratio of net expenses to average net assetsf | .54 | .53 | .50g | |||
| Ratio of net investment income | ||||||
| to average net assetsf | 1.27 | 1.24 | .08g | |||
| Portfolio Turnover Rate | 52.02 | 56.19 | 4.35e | |||
| Net Assets, end of period ($ x 1,000) | 550 | 192 | 162 | |||
| a | From July 15, 2009 (commencement of operations) to October 31, 2009. |
| b | Based on average shares outstanding at each month end. |
| c | Amount represents less than $.01 per share. |
| d | Exclusive of sales charge. |
| e | Not annualized. |
| f | Amounts do not include the activity of the underlying funds. |
| g | Annualized. |
See notes to financial statements.
14
| Year Ended October 31, | ||||||
| Class C Shares | 2011 | 2010 | 2009a | |||
| Per Share Data ($): | ||||||
| Net asset value, beginning of period | 15.36 | 13.82 | 12.50 | |||
| Investment Operations: | ||||||
| Investment income (loss)—netb | .10 | .07 | (.03) | |||
| Net realized and unrealized | ||||||
| gain (loss) on investments | .01 | 1.47 | 1.35 | |||
| Total from Investment Operations | .11 | 1.54 | 1.32 | |||
| Distributions: | ||||||
| Dividends from investment income—net | (.28) | — | — | |||
| Dividends from net realized gain on investments | — | (.00)c | — | |||
| Total Distributions | (.28) | (.00)c | — | |||
| Net asset value, end of period | 15.19 | 15.36 | 13.82 | |||
| Total Return (%)d | .63 | 11.24 | 10.56e | |||
| Ratios/Supplemental Data (%): | ||||||
| Ratio of total expenses to average net assetsf | 19.48 | 37.80 | 104.02g | |||
| Ratio of net expenses to average net assetsf | 1.29 | 1.28 | 1.25g | |||
| Ratio of net investment income | ||||||
| (loss) to average net assetsf | .63 | .48 | (.67)g | |||
| Portfolio Turnover Rate | 52.02 | 56.19 | 4.35e | |||
| Net Assets, end of period ($ x 1,000) | 125 | 84 | 70 | |||
| a | From July 15, 2009 (commencement of operations) to October 31, 2009. |
| b | Based on average shares outstanding at each month end. |
| c | Amount represents less than $.01 per share. |
| d | Exclusive of sales charge. |
| e | Not annualized. |
| f | Amounts do not include the activity of the underlying funds. |
| g | Annualized. |
See notes to financial statements.
| The Fund | 15 |
FINANCIAL HIGHLIGHTS (continued)
| Year Ended October 31, | ||||||
| Class I Shares | 2011 | 2010 | 2009a | |||
| Per Share Data ($): | ||||||
| Net asset value, beginning of period | 15.56 | 13.86 | 12.50 | |||
| Investment Operations: | ||||||
| Investment income—netb | .27 | .34 | .01 | |||
| Net realized and unrealized | ||||||
| gain (loss) on investments | (.01) | 1.37 | 1.35 | |||
| Total from Investment Operations | .26 | 1.71 | 1.36 | |||
| Distributions: | ||||||
| Dividends from investment income—net | (.42) | (.01) | — | |||
| Dividends from net realized gain on investments | — | (.00)c | — | |||
| Total Distributions | (.42) | (.01) | — | |||
| Net asset value, end of period | 15.40 | 15.56 | 13.86 | |||
| Total Return (%) | 1.61 | 12.35 | 10.88d | |||
| Ratios/Supplemental Data (%): | ||||||
| Ratio of total expenses to average net assetse | 18.93 | 37.32 | 106.59f | |||
| Ratio of net expenses to average net assetse | .29 | .28 | .25f | |||
| Ratio of net investment income | ||||||
| to average net assetse | 1.77 | 2.20 | .34f | |||
| Portfolio Turnover Rate | 52.02 | 56.19 | 4.35d | |||
| Net Assets, end of period ($ x 1,000) | 83 | 115 | 58 | |||
| a | From July 15, 2009 (commencement of operations) to October 31, 2009. |
| b | Based on average shares outstanding at each month end. |
| c | Amount represents less than $.01 per share. |
| d | Not annualized. |
| e | Amounts do not include the acitivity of the underlying funds. |
| f | Annualized. |
See notes to financial statements.
16
NOTES TO FINANCIAL STATEMENTS
NOTE 1—Significant Accounting Policies:
Dreyfus Satellite Alpha Fund (the “fund”) is a separate diversified series of Dreyfus Premier Investment Funds, Inc. (the “Company”), which is registered under the Investment Company Act of 1940, as amended (the “Act”), as an open-end management investment company and operates as a series company currently offering nine series, including the fund. The fund’s investment objective is to seek long-term capital appreciation. The Dreyfus Corporation (the “Manager” or “Dreyfus”), a wholly-owned subsidiary of The Bank of New York Mellon Corporation (“BNY Mellon”), serves as the fund’s investment adviser.
MBSC Securities Corporation (the “Distributor”), a wholly-owned subsidiary of the Manager, is the distributor of the fund’s shares.The fund is authorized to issue 50 million shares of $.001 par value Common Stock in each of the following classes of shares: Class A, Class C, and Class I. Class A shares are subject to a sales charge imposed at the time of purchase. Class C shares are subject to a contingent deferred sales charge (“CDSC”) imposed on Class C shares redeemed within one year of purchase. Class I shares are sold at net asset value per share only to institutional investors. Other differences between the classes include the services offered to and the expenses borne by each class, the allocation of certain transfer agency costs and certain voting rights. Income, expenses (other than expenses attributable to a specific class), and realized and unrealized gains or losses on investments are allocated to each class of shares based on its relative net assets.
As of October 31, 2011, MBC Investments Corp., an indirect subsidiary of BNY Mellon, held 8,002 Class A, 4,001 Class C and 4,003 Class I shares of the fund.
| The Fund | 17 |
NOTES TO FINANCIAL STATEMENTS (continued)
The Company accounts separately for the assets, liabilities and operations of each series. Expenses directly attributable to each series are charged to that series’ operations; expenses which are applicable to all series are allocated among them on a pro rata basis.
The Financial Accounting Standards Board (“FASB”) Accounting Standards Codification (“ASC”) is the exclusive reference of authoritative U.S. generally accepted accounting principles (“GAAP”) recognized by the FASB to be applied by nongovernmental entities. Rules and interpretive releases of the Securities and Exchange Commission (“SEC”) under authority of federal laws are also sources of authoritative GAAP for SEC registrants. The fund’s financial statements are prepared in accordance with GAAP, which may require the use of management estimates and assumptions.Actual results could differ from those estimates.
The Company enters into contracts that contain a variety of indemnifications. The fund’s maximum exposure under these arrangements is unknown.The fund does not anticipate recognizing any loss related to these arrangements.
(a) Portfolio valuation: The fair value of a financial instrument is the amount that would be received to sell an asset or paid to transfer a liability in an orderly transaction between market participants at the measurement date (i.e. the exit price). GAAP establishes a fair value hierarchy that prioritizes the inputs of valuation techniques used to measure fair value.This hierarchy gives the highest priority to unadjusted quoted prices in active markets for identical assets or liabilities (Level 1 measurements) and the lowest priority to unobservable inputs (Level 3 measurements).
Additionally, GAAP provides guidance on determining whether the volume and activity in a market has decreased significantly and whether such a decrease in activity results in transactions that are not orderly. GAAP requires enhanced disclosures around valuation inputs and techniques used during annual and interim periods.
18
Various inputs are used in determining the value of the fund’s investments relating to fair value measurements.These inputs are summarized in the three broad levels listed below:
Level 1—unadjusted quoted prices in active markets for identical investments.
Level 2—other significant observable inputs (including quoted prices for similar investments, interest rates, prepayment speeds, credit risk, etc.).
Level 3—significant unobservable inputs (including the fund’s own assumptions in determining the fair value of investments).
The inputs or methodology used for valuing securities are not necessarily an indication of the risk associated with investing in those securities.
Investments are valued at the net asset value of each underlying fund determined as of the close of the NewYork Stock Exchange (generally 4 p.m., Eastern time) on the valuation date and are generally categorized within Level 1 of the fair value hierarchy.
The following is a summary of the inputs used as of October 31, 2011 in valuing the fund’s investments:
| Level 2—Other | Level 3— | |||
| Level 1— | Significant | Significant | ||
| Unadjusted | Observable | Unobservable | ||
| Quoted Prices | Inputs | Inputs | Total | |
| Assets ($) | ||||
| Investments in Securities: | ||||
| Mutual Funds | 759,967 | — | — | 759,967 |
In May 2011, FASB issued Accounting Standards Update (“ASU”) No. 2011-04 “Amendments to Achieve Common Fair Value Measurement and Disclosure Requirements in GAAP and International Financial Reporting Standards (“IFRS”)” (“ASU 2011-04”). ASU 2011-04 includes common requirements for measurement of and disclosure about fair value between GAAP and IFRS. ASU 2011-04 will require
| The Fund | 19 |
NOTES TO FINANCIAL STATEMENTS (continued)
reporting entities to disclose the following information for fair value measurements categorized within Level 3 of the fair value hierarchy: quantitative information about the unobservable inputs used in the fair value measurement, the valuation processes used by the reporting entity and a narrative description of the sensitivity of the fair value measurement to changes in unobservable inputs and the interrelationships between those unobservable inputs. In addition, ASU 2011-04 will require reporting entities to make disclosures about amounts and reasons for all transfers in and out of Level 1 and Level 2 fair value measurements. The new and revised disclosures are effective for interim and annual reporting periods beginning after December 15, 2011. At this time, management is evaluating the implications of ASU 2011-04 and its impact on the financial statements.
(b) Securities transactions and investment income: Securities transactions are recorded on a trade date basis. Realized gains and losses from securities transactions are recorded on the identified cost basis. Dividend income is recognized on the ex-dividend date and interest income, including, where applicable, accretion of discount and amortization of premium on investments, is recognized on the accrual basis.
(c) Affiliated issuers: Investments in other investment companies advised by Dreyfus are defined as “affiliated” in the Act.
The fund may invest in shares of certain affiliated investment companies also advised or managed by Dreyfus. Investments in affiliated investment companies for the period ended October 31, 2011 were as follows:
| Affiliated | ||||||
| Investment | Value | Net Realized | ||||
| Company | 10/31/2010 | ($) | Purchases ($)† | Sales ($) | Gain (Loss) ($) | |
| Dreyfus Emerging | ||||||
| Markets Debt Local | ||||||
| Currency Fund, Cl. I | 47,106 | 122,475 | 52,458 | 155 | ||
| Dreyfus Emerging | ||||||
| Markets Fund, Cl. I | — | 24,071 | 4,179 | (517 | ) | |
| Dreyfus Global | ||||||
| Absolute Return | ||||||
| Fund, Cl. I | 117,020 | 207,749 | 61,393 | (1,914 | ) | |
| Dreyfus Global Real | ||||||
| Estate Securities | ||||||
| Fund, Cl I | 65,855 | 78,351 | 28,543 | (1,340 | ) |
20
| Affiliated | ||||||||
| Investment | Value | Net Realized | ||||||
| Company | 10/31/2010 | ($) | Purchases ($)† | Sales ($) | Gain (Loss) ($) | |||
| Dreyfus | ||||||||
| Inflation Adjusted | ||||||||
| Securities Fund, | ||||||||
| Institutional Shares | 54,812 | 115,900 | 105,057 | 3,935 | ||||
| Dreyfus International | ||||||||
| Bond Fund Cl. I | 36,588 | 55,688 | 16,715 | (226 | ) | |||
| Dreyfus Natural | ||||||||
| Resources Fund, Cl. I | 50,763 | 68,560 | 21,730 | (1,946 | ) | |||
| Dreyfus/The Boston | ||||||||
| Company Emerging | ||||||||
| Markets Core Equity | ||||||||
| Fund, Cl. I | — | 50,302 | 29,369 | (1,856 | ) | |||
| Emerging Markets | ||||||||
| Opportunity | ||||||||
| Fund, Cl. I | 21,564 | 1,084 | 22,704 | 4,963 | ||||
| Total | 393,708 | 724,180 | 342,148 | 1,254 | ||||
| † Includes reinvested dividends/distributions. | ||||||||
| Change in Net | ||||||||
| Affiliated | Unrealized | |||||||
| Investment | Appreciation | Value | Net | Dividends/ | ||||
| Company | (Depreciation) ($) | 10/31/2011 | ($) | Assets (%) Distributions ($) | ||||
| Dreyfus Emerging | ||||||||
| Markets Debt Local | ||||||||
| Currency Fund, Cl. I | (4,827 | ) | 112,451 | 14.8 | 2,676 | |||
| Dreyfus Emerging | ||||||||
| Markets Fund, Cl. I | (2,536 | ) | 16,839 | 2.2 | 75 | |||
| Dreyfus Global Absolute | ||||||||
| Return Fund, Cl. I | (5,022 | ) | 256,440 | 33.8 | 7,588 | |||
| Dreyfus Global Real Estate | ||||||||
| Securities Fund, Cl I | (4,189 | ) | 110,134 | 14.5 | 3,381 | |||
| Dreyfus Inflation Adjusted | ||||||||
| Securities Fund, | ||||||||
| Institutional Shares | 3,402 | 72,992 | 9.6 | 5,120 | ||||
| Dreyfus International | ||||||||
| Bond Fund Cl. I | (471 | ) | 74,864 | 9.9 | 2,949 | |||
| Dreyfus Natural | ||||||||
| Resources Fund, Cl. I | 3,628 | 99,275 | 13.1 | — | ||||
| Dreyfus/The Boston | ||||||||
| Company Emerging | ||||||||
| Markets Core Equity | ||||||||
| Fund, Cl. I | (2,105 | ) | 16,972 | 2.3 | — | |||
| Emerging Markets | ||||||||
| Opportunity Fund, Cl. I | (4,907 | ) | — | — | — | |||
| Total | (17,027 | ) | 759,967 | 100.2 | 21,789 | |||
| The Fund | 21 |
NOTES TO FINANCIAL STATEMENTS (continued)
(d) Dividends to shareholders: Dividends are recorded on the ex-dividend date. Dividends from investment income-net and dividends from net realized capital gains, if any, are normally declared and paid annually, but the fund may make distributions on a more frequent basis to comply with the distribution requirements of the Internal Revenue Code of 1986, as amended (the “Code”).To the extent that net realized capital gains can be offset by capital loss carryovers, it is the policy of the fund not to distribute such gains. Income and capital gain distributions are determined in accordance with income tax regulations, which may differ from GAAP.
(e) Federal income taxes: It is the policy of the fund to continue to qualify as a regulated investment company, if such qualification is in the best interests of its shareholders, by complying with the applicable provisions of the Code, and to make distributions of taxable income sufficient to relieve it from substantially all federal income and excise taxes.
As of and during the period ended October 31, 2011, the fund did not have any liabilities for any uncertain tax positions.The fund recognizes interest and penalties, if any, related to uncertain tax positions as income tax expense in the Statement of Operations. During the period, the fund did not incur any interest or penalties.
Each of the tax years in the three-year period ended October 31, 2011 remains subject to examination by the Internal Revenue Service and state taxing authorities.
At October 31, 2011, the components of accumulated earnings on a tax basis were as follows: undistributed ordinary income $4,085, undistributed capital gains $10,465 and unrealized appreciation $32,380.
The tax character of distributions paid to shareholders during the fiscal periods ended October 31, 2011 and October 31, 2010 were as follows: ordinary income $12,329 and $230, respectively.
22
During the period ended October 31, 2011, as a result of permanent book to tax differences, primarily due to the tax treatment for short-term capital gain distributions from regulated investment company holdings, the fund increased accumulated undistributed investment income-net by $2,159 and decreased net realized gain (loss) on investments by the same amount. Net assets and net asset value per share were not affected by this reclassification.
NOTE 2—Management Fee and Other Transactions with Affiliates:
(a) Pursuant to a management agreement with the Manager, there is no management fee paid to the Manager. The fund invests in other mutual funds advised by the Manager. All fees and expenses of the underlying funds are reflected in the underlying fund’s net asset value.
The Manager has contractually agreed, until March 1, 2013, to assume the expenses of the fund so that the total annual fund’s and underlying funds’ operating expenses of none of the classes (excluding Rule 12b-1 fees, shareholder services fees, taxes, brokerage commissions, underlying fund expenses and extraordinary expenses) exceed 1.35% of the value of the fund’s average daily net assets. The reduction in expenses, pursuant to the undertaking, amounted to $120,269 during the period ended October 31, 2011.
During the period ended October 31, 2011, the Distributor retained $742 from commissions earned on sales of the fund’s Class A shares.
(b) Under the Distribution Plan (the “Plan”) adopted pursuant to Rule 12b-1 under the Act, Class C shares pay the Distributor for distributing its shares at an annual rate of .75% of the value of the average daily net assets of Class C shares. During the period ended October 31, 2011, Class C shares were charged $835 pursuant to the Plan.
| The Fund | 23 |
NOTES TO FINANCIAL STATEMENTS (continued)
(c) Under the Shareholder Services Plan, Class A and Class C shares pay the Distributor at an annual rate of .25% of the value of their average daily net assets for the provision of certain services.The services provided may include personal services relating to shareholder accounts, such as answering shareholder inquiries regarding the fund and providing reports and other information, and services related to the maintenance of shareholder accounts. The Distributor may make payments to Service Agents (a securities dealer, financial institution or other industry professional) in respect of these services.The Distributor determines the amounts to be paid to Service Agents. During the period ended October 31, 2011, Class A and Class C shares were charged $1,148 and $278, respectively, pursuant to the Shareholder Services Plan.
The fund compensates Dreyfus Transfer, Inc., a wholly-owned subsidiary of the Manager, under a transfer agency agreement for providing personnel and facilities to perform transfer agency services for the fund. During the period ended October 31, 2011, the fund was charged $857 pursuant to the transfer agency agreement, which is included in Shareholder servicing costs in the Statement of Operations.
The fund has arrangements with the custodian and cash management bank whereby the fund may receive earnings credits when positive cash balances are maintained, which are used to offset custody and cash management fees. For financial reporting purposes, the fund includes net earnings credits as an expense offset in the Statement of Operations.
The fund compensates The Bank of New York Mellon, a subsidiary of BNY Mellon and an affiliate of Dreyfus, under a cash management agreement for performing cash management services related to fund subscriptions and redemptions. During the period ended October 31, 2011, the fund was charged $38 pursuant to the cash management agreement, which is included in Shareholder servicing costs in the Statement of Operations.These fees were partially offset by earnings credits of $1.
24
The fund also compensates The Bank of New York Mellon under a custody agreement for providing custodial services for the fund. During the period ended October 31, 2011, the fund was charged $1,785 pursuant to the custody agreement.
During the period ended October 31, 2011, the fund was charged $6,751 for services performed by the Chief Compliance Officer.
The components of“Due fromThe Dreyfus Corporation and affiliates” in the Statement of Assets and Liabilities consist of: Rule 12b-1 distribution plan fees $76, shareholder services plan fees $137, custodian fees $300, chief compliance officer fees $4,246 and transfer agency per account fees $153, which are offset against an expense reimbursement currently in effect in the amount of $8,515.
(d) Each Board member also serves as a Board member of other funds within the Dreyfus complex. Annual retainer fees and attendance fees are allocated to each fund based on net assets.
NOTE 3—Securities Transactions:
The aggregate amount of purchases and sales of investment securities, excluding short-term securities, during the period ended October 31, 2011, amounted to $724,180 and $342,148, respectively.
At October 31, 2011, the cost of investments for federal income tax purposes was $727,587; accordingly, accumulated net unrealized appreciation on investments was $32,380, consisting of $43,504 gross unrealized appreciation and $11,124 gross unrealized depreciation.
| The Fund | 25 |
| REPORT OF INDEPENDENT REGISTERED |
| PUBLIC ACCOUNTING FIRM |
Shareholders and Board of Directors
Dreyfus Satellite Alpha Fund
We have audited the accompanying statement of assets and liabilities, including the statement of investments, of Dreyfus Satellite Alpha Fund (one of the series comprising Dreyfus Premier Investment Funds, Inc.) as of October 31, 2011, and the related statement of operations for the year then ended, the statement of changes in net assets for each of the two years in the period then ended and financial highlights for each of periods indicated therein.These financial statements and financial highlights are the responsibility of the Fund’s management. Our responsibility is to express an opinion on these financial statements and financial highlights based on our audits.
We conducted our audits in accordance with the standards of the Public Company Accounting Oversight Board (United States).Those standards require that we plan and perform the audit to obtain reasonable assurance about whether the financial statements and financial highlights are free of material misstatement.We were not engaged to perform an audit of the Fund’s internal control over financial reporting. Our audits included consideration of internal control over financial reporting as a basis for designing audit procedures that are appropriate in the circumstances, but not for the purpose of expressing an opinion on the effectiveness of the Fund’s internal control over financial reporting. Accordingly, we express no such opinion. An audit also includes examining, on a test basis, evidence supporting the amounts and disclosures in the financial statements and financial highlights, assessing the accounting principles used and significant estimates made by management, and evaluating the overall financial statement presentation. Our procedures included confirmation of securities owned as of October 31, 2011 by correspondence with the custodian and others.We believe that our audits provide a reasonable basis for our opinion.
In our opinion, the financial statements and financial highlights referred to above present fairly, in all material respects, the financial position of Dreyfus Satellite Alpha Fund at October 31, 2011, the results of its operations for the year then ended, the changes in its net assets for each of the two years in the period then ended and the financial highlights for each of the indicated periods, in conformity with U.S. generally accepted accounting principles.

New York, New York
December 29, 2011
26
IMPORTANT TAX INFORMATION (Unaudited)
In accordance with federal tax law, the fund hereby designates 100% of the ordinary dividends paid during the fiscal year ended October 31, 2011 as qualifying for the corporate dividends received deduction. For the fiscal year ended October 31, 2011, certain dividends paid by the fund may be subject to a maximum tax rate of 15%, as provided for by the Jobs and Growth Tax Relief Reconciliation Act of 2003. Of the distributions paid during the fiscal year, $12,329 represents the maximum amount that may be considered qualified dividend income. Shareholders will receive notification in early 2012 of the percentage applicable to the preparation of their 2011 income tax returns.
| The Fund | 27 |
PROXY RESULTS (Unaudited)
The Company held a special meeting of shareholders on May 31, 2011.The proposal considered at the meeting, and the results, are as follows:
| Shares | |||
| Votes For | Authority Withheld | ||
| To elect Board Members: | |||
| Joseph S. DiMartino† | 119,515,411 | 644,860 | |
| Phillip L. Toia† | 119,502,800 | 657,471 | |
| Robin A. Melvin† | 119,566,042 | 594,229 |
† Each new Board member’s term commenced on May 31, 2011.
In addition Gordon J. Davis, Esq., David P. Feldman and Lynn Martin continue as Board members of the Company.
28
| INFORMATION ABOUT THE RENEWAL OF THE |
| FUND’S MANAGEMENT AGREEMENT (Unaudited) |
At a meeting of the fund’s Board of Directors held on July 12, 2011, the Board considered the renewal of the fund’s Management Agreement pursuant to which Dreyfus provides the fund with investment advisory and administrative services (the “Agreement”). The Board members, none of whom are “interested persons” (as defined in the Investment Company Act of 1940, as amended) of the fund, were assisted in their review by independent legal counsel and met with counsel in executive session separate from Dreyfus representatives. In considering the renewal of the Agreement, the Board considered all factors that it believed to be relevant, including those discussed below.The Board did not identify any one factor as dispositive, and each Board member may have attributed different weights to the factors considered.
Analysis of Nature, Extent, and Quality of Services Provided to the Fund. The Board considered information previously provided to them in presentations from Dreyfus representatives regarding the nature, extent, and quality of the services provided to funds in the Dreyfus fund complex, and Dreyfus representatives confirmed that there had been no material changes in this information. Dreyfus provided the number of open accounts in the fund, the fund’s asset size and the allocation of fund assets among distribution channels. Dreyfus also had previously provided information regarding the diverse intermediary relationships and distribution channels of funds in the Dreyfus fund complex and Dreyfus’ corresponding need for broad, deep, and diverse resources to be able to provide ongoing shareholder services to each distribution channel, including the distribution channel(s) for the fund.
The Board also considered research support available to, and portfolio management capabilities of, the fund’s portfolio management personnel and that Dreyfus also provides oversight of day-to-day fund operations, including fund accounting and administration and assistance in meeting legal and regulatory requirements.The Board also considered Dreyfus’ extensive administrative, accounting, and compliance infrastructures.The
| The Fund | 29 |
| INFORMATION ABOUT THE RENEWAL OF THE FUND’S |
| MANAGEMENT AGREEMENT (Unaudited) (continued) |
Board also considered portfolio management’s brokerage policies and practices (including policies and practices regarding soft dollars) and the standards applied in seeking best execution.
Comparative Analysis of the Fund’s Performance and Management Fee and Expense Ratio.The Board reviewed reports prepared by Lipper, Inc. (“Lipper”), an independent provider of investment company data, which included information comparing (1) the fund’s performance with the performance of a group of comparable funds (the “Performance Group”) and with a broader group of funds (the “Performance Universe”), for the one-year period ended May 31, 2011, and (2) the fund’s actual and contractual management fees and total expenses with those of a group of comparable funds (the “Expense Group”) and with a broader group of funds (the “Expense Universe”), the information for which was derived in part from fund financial statements available to Lipper as of May 31, 2011. Dreyfus previously had furnished the Board with a description of the methodology Lipper used to select the Performance Group and Performance Universe and the Expense Group and Expense Universe.
Dreyfus representatives stated that the usefulness of performance comparisons may be affected by a number of factors, including different investment limitations that may be applicable to the fund and comparison funds. The Board discussed the results of the comparisons and noted that the fund’s total return performance was below the Performance Group and Performance Universe medians, but that the fund only had a short performance history. Dreyfus also provided a comparison of the fund’s calendar year total return to the return of the fund’s benchmark index.
The Board also reviewed the range of actual and contractual management fees and total expenses of the Expense Group and Expense Universe funds and discussed the results of the comparisons. The Board noted that, like other funds in the Expense Group, the fund’s
30
management fees are paid only at the underlying funds’ level. They further noted that the fund’s total expense ratio was at the Expense Group and Expense Universe medians.
Dreyfus representatives noted that Dreyfus has contractually agreed to assume the expenses of the fund until March 1, 2013, so that the total annual fund’s and underlying funds’ operating expenses of none of the classes (excluding Rule 12b-1 fees, shareholder services fees, taxes, brokerage commissions, underlying fund expenses and extraordinary expenses) exceed 1.35% of the fund’s average daily net assets.
Dreyfus representatives reviewed with the Board the management or investment advisory fees (1) paid by funds advised or administered by Dreyfus that are in the same Lipper category as the fund and (2) paid to Dreyfus or the Dreyfus-affiliated primary employer of the fund’s primary portfolio manager for advising any separate accounts and/or other types of client portfolios that are considered to have similar investment strategies and policies as the fund (the “Similar Clients”), and explained the nature of the Similar Clients.They discussed differences in fees paid and the relationship of the fees paid in light of any differences in the services provided and other relevant factors. The Board considered the relevance of the fee information provided for the Similar Clients to evaluate the appropriateness and reasonableness of the fund’s management fee.
Analysis of Profitability and Economies of Scale. Dreyfus does not have direct profits from the fund’s management fee, since the fund pays no direct management fee. Similarly, economies of scale were not relevant.The Board considered potential benefits to Dreyfus from acting as investment adviser and noted that there were no soft dollar arrangements in effect for trading the fund’s investments.
| The Fund | 31 |
| INFORMATION ABOUT THE RENEWAL OF THE FUND’S |
| MANAGEMENT AGREEMENT (Unaudited) (continued) |
At the conclusion of these discussions, the Board agreed that it had been furnished with sufficient information to make an informed business decision with respect to the renewal of the Agreement. Based on the discussions and considerations as described above, the Board concluded and determined as follows.
The Board concluded that the nature, extent and quality of the services provided by Dreyfus are adequate and appropriate.
The Board was satisfied with the fund’s performance, in light of the short period of the fund’s operations.
Since the fund does not pay a direct management fee, profitability and economies of scale are not relevant.
The Board considered these conclusions and determinations, along with information received on a routine and regular basis throughout the year. In addition, it should be noted that the Board’s consideration of the contractual fee arrangements for this fund had the benefit of a number of years of reviews of prior or similar agreements during which lengthy discussions took place between the Board and Dreyfus representatives. Certain aspects of the arrangements may receive greater scrutiny in some years than in others, and the Board’s conclusions may be based, in part, on their consideration of the same or similar arrangements in prior years.The Board determined that renewal of the Agreement was in the best interests of the fund and its shareholders.
32
BOARD MEMBERS INFORMATION (Unaudited)
| Joseph S. DiMartino (68) |
| Chairman of the Board (1995) |
| Principal Occupation During Past 5Years: |
| • Corporate Director and Trustee |
| Other Public Company Board Memberships During Past 5Years: |
| • CBIZ (formerly, Century Business Services, Inc.), a provider of outsourcing functions for small |
| and medium size companies, Director (1997-present) |
| • Sunair Services Corporation, a provider of certain outdoor-related services to homes and |
| businesses, Director (2005-2009) |
| • The Newark Group, a provider of a national market of paper recovery facilities, paperboard |
| mills and paperboard converting plants, Director (2000-2010) |
| No. of Portfolios for which Board Member Serves: 167 |
| ——————— |
| Gordon J. Davis (70) |
| Board Member (1993) |
| Principal Occupation During Past 5Years: |
| • Partner in the law firm of Dewey & LeBoeuf LLP |
| Other Public Company Board Memberships During Past 5Years: |
| • Consolidated Edison, Inc., a utility company, Director (1997-present) |
| • The Phoenix Companies Inc., a life insurance company, Director (2000-present) |
| No. of Portfolios for which Board Member Serves: 44 |
| ——————— |
| David P. Feldman (71) |
| Board Member (1991) |
| Principal Occupation During Past 5Years: |
| • Corporate Director and Trustee |
| Other Public Company Board Memberships During Past 5Years: |
| • BBH Mutual Funds Group (4 registered mutual funds), Director (1992-present) |
| • QMed Inc., a healthcare company, Director (1999-2007) |
| No. of Portfolios for which Board Member Serves: 50 |
| The Fund | 33 |
BOARD MEMBERS INFORMATION (Unaudited) (continued)
| Lynn Martin (71) |
| Board Member (1993) |
| Principal Occupation During Past 5Years: |
| • President of The Martin Hall Group LLC, a human resources consulting firm, from |
| January 2005-present |
| • Advisor to the international accounting firm of Deloitte & Touche, LLP and Chair to its |
| Council for the Advancement of Women from March 1993-September 2005 |
| Other Public Company Board Memberships During Past 5Years: |
| • AT&T Inc., a telecommunications company, Director (1999-present) |
| • Ryder System, Inc., a supply chain and transportation management company, Director (1993-present) |
| • The Proctor & Gamble Co., a consumer products company, Director (1994-present) |
| • Constellation Energy Group Inc., Director (2003-present) |
| No. of Portfolios for which Board Member Serves: 15 |
| ——————— |
| Robin A. Melvin (48) |
| Board Member (2011) |
| Principal Occupation During Past 5Years: |
| • Director, Boisi Family Foundation, a private family foundation that supports youth-serving organi- |
| zations that promote the self sufficiency of youth from disadvantaged circumstances (1995-present) |
| • SeniorVice President, Mentor, a national non-profit youth mentoring organization (1992-2005) |
| No. of Portfolios for which Board Member Serves: 54 |
| ——————— |
| Philip L. Toia (78) |
| Board Member (1997) |
| Principal Occupation During Past 5Years: |
| • Private Investor |
| No. of Portfolios for which Board Member Serves: 25 |
| ——————— |
Once elected all Board Members serve for an indefinite term, but achieve Emeritus status upon reaching age 80.The address of the Board Members and Officers is in c/o The Dreyfus Corporation, 200 Park Avenue, NewYork, NewYork 10166.Additional information about the Board Members is available in the fund’s Statement of Additional Information which can be obtained from Dreyfus free of charge by calling this toll free number: 1-800-DREYFUS.
Daniel Rose, Emeritus Board Member
Sander Vanocur, Emeritus Board Member
34
OFFICERS OF THE FUND (Unaudited)
BRADLEY J. SKAPYAK, President since January 2010.
Chief Operating Officer and a director of the Manager since June 2009. From April 2003 to June 2009, Mr. Skapyak was the head of the Investment Accounting and Support Department of the Manager. He is an officer of 75 investment companies (comprised of 167 portfolios) managed by the Manager. He is 52 years old and has been an employee of the Manager since February 1988.
MICHAEL A. ROSENBERG, Vice President and Secretary since August 2005.
Assistant General Counsel of BNY Mellon, and an officer of 76 investment companies (comprised of 192 portfolios) managed by the Manager. He is 51 years old and has been an employee of the Manager since October 1991.
KIESHA ASTWOOD, Vice President and Assistant Secretary since January 2010.
Counsel of BNY Mellon, and an officer of 76 investment companies (comprised of 192 portfolios) managed by the Manager. She is 38 years old and has been an employee of the Manager since July 1995.
JAMES BITETTO, Vice President and Assistant Secretary since August 2005.
Senior Counsel of BNY Mellon and Secretary of the Manager, and an officer of 76 investment companies (comprised of 192 portfolios) managed by the Manager. He is 45 years old and has been an employee of the Manager since December 1996.
JONI LACKS CHARATAN, Vice President and Assistant Secretary since August 2005.
Senior Counsel of BNY Mellon, and an officer of 76 investment companies (comprised of 192 portfolios) managed by the Manager. She is 55 years old and has been an employee of the Manager since October 1988.
JOSEPH M. CHIOFFI, Vice President and Assistant Secretary since August 2005.
Senior Counsel of BNY Mellon, and an officer of 76 investment companies (comprised of 192 portfolios) managed by the Manager. He is 49 years old and has been an employee of the Manager since June 2000.
KATHLEEN DENICHOLAS, Vice President and Assistant Secretary since January 2010.
Managing Counsel of BNY Mellon, and an officer of 76 investment companies (comprised of 192 portfolios) managed by the Manager. She is 37 years old and has been an employee of the Manager since February 2001.
JANETTE E. FARRAGHER, Vice President and Assistant Secretary since August 2005.
Assistant General Counsel of BNY Mellon, and an officer of 76 investment companies (comprised of 192 portfolios) managed by the Manager. She is 48 years old and has been an employee of the Manager since February 1984.
JOHN B. HAMMALIAN, Vice President and Assistant Secretary since August 2005.
Senior Managing Counsel of BNY Mellon, and an officer of 76 investment companies (comprised of 192 portfolios) managed by the Manager. He is 48 years old and has been an employee of the Manager since February 1991.
M. CRISTINA MEISER, Vice President and Assistant Secretary since January 2010.
Senior Counsel of BNY Mellon, and an officer of 76 investment companies (comprised of 192 portfolios) managed by the Manager. She is 41 years old and has been an employee of the Manager since August 2001.
| The Fund | 35 |
OFFICERS OF THE FUND (Unaudited) (continued)
ROBERT R. MULLERY, Vice President and Assistant Secretary since August 2005.
Managing Counsel of BNY Mellon, and an officer of 76 investment companies (comprised of 192 portfolios) managed by the Manager. He is 59 years old and has been an employee of the Manager since May 1986.
JEFF PRUSNOFSKY, Vice President and Assistant Secretary since August 2005.
Senior Managing Counsel of BNY Mellon, and an officer of 76 investment companies (comprised of 192 portfolios) managed by the Manager. He is 46 years old and has been an employee of the Manager since October 1990.
JAMES WINDELS, Treasurer since November 2001.
Director – Mutual Fund Accounting of the Manager, and an officer of 76 investment companies (comprised of 192 portfolios) managed by the Manager. He is 53 years old and has been an employee of the Manager since April 1985.
RICHARD CASSARO, Assistant Treasurer since January 2008.
Senior Accounting Manager – Money Market and Municipal Bond Funds of the Manager, and an officer of 76 investment companies (comprised of 192 portfolios) managed by the Manager. He is 52 years old and has been an employee of the Manager since September 1982.
GAVIN C. REILLY, Assistant Treasurer since August 2005.
Tax Manager of the Investment Accounting and Support Department of the Manager, and an officer of 76 investment companies (comprised of 192 portfolios) managed by the Manager. He is 43 years old and has been an employee of the Manager since April 1991.
ROBERT ROBOL, Assistant Treasurer since August 2005.
Senior Accounting Manager – Fixed Income Funds of the Manager, and an officer of 76 investment companies (comprised of 192 portfolios) managed by the Manager. He is 47 years old and has been an employee of the Manager since October 1988.
ROBERT SALVIOLO, Assistant Treasurer since July 2007.
Senior Accounting Manager – Equity Funds of the Manager, and an officer of 76 investment companies (comprised of 192 portfolios) managed by the Manager. He is 44 years old and has been an employee of the Manager since June 1989.
ROBERT SVAGNA, Assistant Treasurer since August 2002.
Senior Accounting Manager – Equity Funds of the Manager, and an officer of 76 investment companies (comprised of 192 portfolios) managed by the Manager. He is 44 years old and has been an employee of the Manager since November 1990.
36
JOSEPH W. CONNOLLY, Chief Compliance Officer since October 2004.
Chief Compliance Officer of the Manager and The Dreyfus Family of Funds (76 investment companies, comprised of 192 portfolios). From November 2001 through March 2004, Mr. Connolly was first Vice-President, Mutual Fund Servicing for Mellon Global Securities Services. In that capacity, Mr. Connolly was responsible for managing Mellon’s Custody, Fund Accounting and Fund Administration services to third-party mutual fund clients. He is 54 years old and has served in various capacities with the Manager since 1980, including manager of the firm’s Fund Accounting Department from 1997 through October 2001.
STEPHEN J. STOREN, Anti-Money Laundering Compliance Officer since May 2011.
Chief Compliance Officer of the Distributor, and the Anti-Money Laundering Compliance Officer of 72 investment companies (comprised of 188 portfolios) managed by the Manager. He is 57 years old and has been an employee of the Distributor since October 1999.
| The Fund | 37 |
For More Information
Telephone Call your financial representative or 1-800-DREYFUS
Mail The Dreyfus Family of Funds, 144 Glenn Curtiss Boulevard, Uniondale, NY 11556-0144
The fund files its complete schedule of portfolio holdings with the Securities and Exchange Commission (“SEC”) for the first and third quarters of each fiscal year on Form N-Q. The fund’s Forms N-Q are available on the SEC’s website at http://www.sec.gov and may be reviewed and copied at the SEC’s Public Reference Room in Washington, DC. Information on the operation of the Public Reference Room may be obtained by calling 1-800-SEC-0330.
A description of the policies and procedures that the fund uses to determine how to vote proxies relating to portfolio securities, and information regarding how the fund voted these proxies for the most recent 12-month period ended June 30 is available at http://www.dreyfus.com and on the SEC’s website at http://www.sec.gov. The description of the policies and procedures is also available without charge, upon request, by calling 1-800-DREYFUS.

Item 2. Code of Ethics.
The Registrant has adopted a code of ethics that applies to the Registrant's principal executive officer, principal financial officer, principal accounting officer or controller, or persons performing similar functions. There have been no amendments to, or waivers in connection with, the Code of Ethics during the period covered by this Report.
Item 3. Audit Committee Financial Expert.
The Registrant's Board has determined that David P. Feldman, a member of the Audit Committee of the Board, is an audit committee financial expert as defined by the Securities and Exchange Commission (the "SEC"). David P. Feldman is "independent" as defined by the SEC for purposes of audit committee financial expert determinations.
Item 4. Principal Accountant Fees and Services.
(a) Audit Fees. The aggregate fees billed for each of the last two fiscal years (the "Reporting Periods") for professional services rendered by the Registrant's principal accountant (the "Auditor") for the audit of the Registrant's annual financial statements or services that are normally provided by the Auditor in connection with the statutory and regulatory filings or engagements for the Reporting Periods, were $158,580 in 2010 and $213,696 in 2011.
(b) Audit-Related Fees. The aggregate fees billed in the Reporting Periods for assurance and related services by the Auditor that are reasonably related to the performance of the audit of the Registrant's financial statements and are not reported under paragraph (a) of this Item 4 were $39,292 in 2010 and $30,000 in 2011. These services consisted of one or more of the following: (i) agreed upon procedures related to compliance with Internal Revenue Code section 817(h), (ii) security counts required by Rule 17f-2 under the Investment Company Act of 1940, as amended, (iii) advisory services as to the accounting or disclosure treatment of Registrant transactions or events and (iv) advisory services to the accounting or disclosure treatment of the actual or potential impact to the Registrant of final or proposed rules, standards or interpretations by the Securities and Exchange Commission, the Financial Accounting Standards Boards or other regulatory or standard-setting bodies.
The aggregate fees billed in the Reporting Periods for non-audit assurance and related services by the Auditor to the Registrant's investment adviser (not including any sub-investment adviser whose role is primarily portfolio management and is subcontracted with or overseen by another investment adviser), and any entity controlling, controlled by or under common control with the investment adviser that provides ongoing services to the Registrant ("Service Affiliates"), that were reasonably related to the performance of the annual audit of the Service Affiliate, which required pre-approval by the Audit Committee were $0 in 2010 and $0 in 2011.
(c) Tax Fees. The aggregate fees billed in the Reporting Periods for professional services rendered by the Auditor for tax compliance, tax advice, and tax planning ("Tax Services") were $13,345 in 2010 and $13,805 in 2011. These services consisted of: (i) review or preparation of U.S. federal, state, local and excise tax returns; (ii) U.S. federal, state and local tax planning, advice and assistance regarding statutory, regulatory or administrative developments; (iii) tax advice regarding tax qualification matters and/or treatment of various financial instruments held or proposed to be acquired or held, and (iv) determination of Passive Foreign Investment Companies. The aggregate fees billed in the Reporting Periods for Tax Services by the Auditor to Service Affiliates, which required pre-approval by the Audit Committee were $0 in 2010 and $0 in 2011.
(d) All Other Fees. The aggregate fees billed in the Reporting Periods for products and services provided by the Auditor, other than the services reported in paragraphs (a) through (c) of this Item, were $506 in 2010 and $511 in 2011. [These services consisted of a review of the Registrant's anti-money laundering program].
The aggregate fees billed in the Reporting Periods for Non-Audit Services by the Auditor to Service Affiliates, other than the services reported in paragraphs (b) through (c) of this Item, which required pre-approval by the Audit Committee, were $0 in 2010 and $0 in 2011.
(e)(1) Audit Committee Pre-Approval Policies and Procedures. The Registrant's Audit Committee has established policies and procedures (the "Policy") for pre-approval (within specified fee limits) of the Auditor's engagements for non-audit services to the Registrant and Service Affiliates without specific case-by-case consideration. The pre-approved services in the Policy can include pre-approved audit services, pre-approved audit-related services, pre-approved tax services and pre-approved all other services. Pre-approval considerations include whether the proposed services are compatible with maintaining the Auditor's independence. Pre-approvals pursuant to the Policy are considered annually.
(e)(2) Note: None of the services described in paragraphs (b) through (d) of this Item 4 were approved by the Audit Committee pursuant to paragraph (c)(7)(i)(C) of Rule 2-01 of Regulation S-X.
(f) None of the hours expended on the principal accountant's engagement to audit the registrant's financial statements for the most recent fiscal year were attributed to work performed by persons other than the principal account's full-time, permanent employees.
Non-Audit Fees. The aggregate non-audit fees billed by the Auditor for services rendered to the Registrant, and rendered to Service Affiliates, for the Reporting Periods were $31,544,905 in 2010 and $16,139,606 in 2011.
Auditor Independence. The Registrant's Audit Committee has considered whether the provision of non-audit services that were rendered to Service Affiliates, which were not pre-approved (not requiring pre-approval), is compatible with maintaining the Auditor's independence.
Item 5. Audit Committee of Listed Registrants.
Not applicable. [CLOSED-END FUNDS ONLY]
Item 6. Investments.
(a) Not applicable.
Item 7. Disclosure of Proxy Voting Policies and Procedures for Closed-End Management Investment Companies.
Not applicable. [CLOSED-END FUNDS ONLY]
Item 8. Portfolio Managers of Closed-End Management Investment Companies.
Not applicable. [CLOSED-END FUNDS ONLY, beginning with reports for periods ended on and after December 31, 2005]
Item 9. Purchases of Equity Securities by Closed-End Management Investment Companies and Affiliated Purchasers.
Not applicable. [CLOSED-END FUNDS ONLY]
Item 10. Submission of Matters to a Vote of Security Holders.
There have been no material changes to the procedures applicable to Item 10.
Item 11. Controls and Procedures.
(a) The Registrant's principal executive and principal financial officers have concluded, based on their evaluation of the Registrant's disclosure controls and procedures as of a date within 90 days of the filing date of this report, that the Registrant's disclosure controls and procedures are reasonably designed to ensure that information required to be disclosed by the Registrant on Form N-CSR is recorded, processed, summarized and reported within the required time periods and that information required to be disclosed by the Registrant in the reports that it files or submits on Form N-CSR is accumulated and communicated to the Registrant's management, including its principal executive and principal financial officers, as appropriate to allow timely decisions regarding required disclosure.
(b) There were no changes to the Registrant's internal control over financial reporting that occurred during the second fiscal quarter of the period covered by this report that have materially affected, or are reasonably likely to materially affect, the Registrant's internal control over financial reporting.
Item 12. Exhibits.
(a)(1) Code of ethics referred to in Item 2.
(a)(2) Certifications of principal executive and principal financial officers as required by Rule 30a-2(a) under the Investment Company Act of 1940.
(a)(3) Not applicable.
(b) Certification of principal executive and principal financial officers as required by Rule 30a-2(b) under the Investment Company Act of 1940.
SIGNATURES
Pursuant to the requirements of the Securities Exchange Act of 1934 and the Investment Company Act of 1940, the Registrant has duly caused this Report to be signed on its behalf by the undersigned, thereunto duly authorized.
Dreyfus Premier Investment Funds, Inc.
By: /s/Bradley J. Skapyak | |
Bradley J. Skapyak, President
| |
Date: | December 19, 2011 |
| |
Pursuant to the requirements of the Securities Exchange Act of 1934 and the Investment Company Act of 1940, this Report has been signed below by the following persons on behalf of the Registrant and in the capacities and on the dates indicated. | |
| |
By: /s/Bradley J. Skapyak | |
Bradley J. Skapyak, President
| |
Date: | December 19, 2011 |
| |
By: /s/James Windels | |
James Windels, Treasurer
| |
Date: | December 19, 2011 |
| |
EXHIBIT INDEX
(a)(1) Code of ethics referred to in Item 2.
(a)(2) Certifications of principal executive and principal financial officers as required by Rule 30a-2(a) under the Investment Company Act of 1940. (EX-99.CERT)
(b) Certification of principal executive and principal financial officers as required by Rule 30a-2(b) under the Investment Company Act of 1940. (EX-99.906CERT)