UNITED STATES
SECURITIES AND EXCHANGE COMMISSION
Washington, D.C. 20549
FORM N-CSR
CERTIFIED SHAREHOLDER REPORT OF REGISTERED MANAGEMENT
INVESTMENT COMPANIES
| Investment Company Act file number | 811- 6490 |
Dreyfus Premier Investment Funds, Inc.
(Exact name of Registrant as specified in charter)
c/o The Dreyfus Corporation
200 Park Avenue
New York, New York 10166
(Address of principal executive offices) (Zip code)
Michael A. Rosenberg, Esq.
200 Park Avenue
New York, New York 10166
(Name and address of agent for service)
| Registrant's telephone number, including area code: | (212) 922-6000 | |
| Date of fiscal year end: | 12/31 | |
| Date of reporting period: | 12/31/09 | |
The following N-CSR relates only to the Registrant’s series listed below and does not affect the other series of the Registrant, which has a different fiscal year end and, therefore, different N-CSR reporting requirements. A separate N-CSR Form will be filed for this series, as appropriate.
| DREYFUS PREMIER INVESTMENT FUNDS, INC. | |
| - | Dreyfus Global Real Estate Securities Fund |
| - | Dreyfus Large Cap Equity Fund |
| - | Dreyfus Large Cap Growth Fund |
| - | Dreyfus Large Cap Value Fund |
FORM N-CSR
| Item 1. | Reports to Stockholders. |
| Dreyfus |
| Global Real Estate |
| Securities Fund |
ANNUAL REPORT December 31, 2009
Save time. Save paper. View your next shareholder report online as soon as it’s available. Log into www.dreyfus.com and sign up for Dreyfus eCommunications. It’s simple and only takes a few minutes.
The views expressed in this report reflect those of the portfolio manager only through the end of the period covered and do not necessarily represent the views of Dreyfus or any other person in the Dreyfus organization. Any such views are subject to change at any time based upon market or other conditions and Dreyfus disclaims any responsibility to update such views.These views may not be relied on as investment advice and, because investment decisions for a Dreyfus fund are based on numerous factors, may not be relied on as an indication of trading intent on behalf of any Dreyfus fund.

Contents | |
THE FUND | |
| 2 | A Letter from the Chairman and CEO |
| 3 | Discussion of Fund Performance |
| 6 | Fund Performance |
| 8 | Understanding Your Fund’s Expenses |
| 8 | Comparing Your Fund’s Expenses With Those of Other Funds |
| 9 | Statement of Investments |
| 13 | Statement of Assets and Liabilities |
| 14 | Statement of Operations |
| 15 | Statement of Changes in Net Assets |
| 17 | Financial Highlights |
| 20 | Notes to Financial Statements |
| 31 | Report of Independent Registered Public Accounting Firm |
| 32 | Important Tax Information |
| 33 | Information About the Review and Approval of the Fund’s Management Agreement |
| 38 | Board Members Information |
| 40 | Officers of the Fund |
FOR MORE INFORMATION | |
Back Cover |
| Dreyfus |
| Global Real Estate |
| Securities Fund |
The Fund

A LETTER FROM THE CHAIRMAN AND CEO
Dear Shareholder:
We are pleased to present this annual report for Dreyfus Global Real Estate Securities Fund, covering the 12-month period from January 1, 2009, through December 31, 2009.
Global stock markets ended 2009 with healthy annual gains, but market indices across most regions, capitalization ranges and investment styles remained well below the peaks reached in the fall of 2007.The equity markets’ advance was driven by improving investor sentiment as the global economy staged a gradual, but sustained, recovery from the recession and banking crisis that had depressed stock prices at the beginning of the year. Growth was particularly robust in some emerging markets, supporting worldwide manufacturing activity to satisfy industrial demand.In many regions,slumping housing markets also showed signs of renewed life as home sales and prices rebounded modestly.However,eco-nomic headwinds remain, including high unemployment rates and the prospect of anemic consumer spending in Europe and the United States.
As 2010 begins, our Chief Economist, securities analysts and portfolio managers have continued to find opportunities and survey potential challenges throughout the world equity markets. While no one can predict the future, we believe that the 2010 investment environment will likely require a broader range of investment considerations relative to last year.As always, your financial adviser can help you determine the mix of investments that may be best suited to helping you achieve your goals at a level of risk that is comfortable for you.
For information about how the fund performed during the reporting period, as well as market perspectives, we have provided a Discussion of Fund Performance.
Thank you for your continued confidence and support.

Jonathan R. Baum
Chairman and Chief Executive Officer
The Dreyfus Corporation
January 15, 2010
2

DISCUSSION OF FUND PERFORMANCE
For the period of January 1, 2009, through December 31, 2009, as provided by Peter Zabierek and Dean Frankel, Portfolio Managers, Urdang Securities Management, Inc., Sub-Investment Adviser
Fund and Market Performance Overview
For the 12-month period ended December 31, 2009, Dreyfus Global Real Estate Securities Fund’s Class A shares produced a total return of 36.38%, Class C shares returned 35.35% and Class I shares returned 36.94%.1 In comparison, the FTSE EPRA/NAREIT Developed Index, the fund’s benchmark, achieved a total return of 38.25% for the same period.2
Global real estate securities rebounded strongly in 2009 as an international banking crisis waned and the global economy began to recover. Although the fund achieved above-average returns from its U.S. investments, it produced lower overall returns than its benchmark, primarily due to underweighted exposure to high-flying emerging markets in Asia.The fund also was affected by the dampening effects of a modest cash position. In addition, the fund’s benchmark does not reflect certain withholding taxes, management fees and expenses.
The Fund’s Investment Approach
The fund seeks to maximize total return consisting of capital appreciation and current income by investing at least 80% of its assets in companies principally engaged in the real estate sector. The fund normally invests at least 40% of its assets in companies located outside the United States, and invests in at least 10 different countries. The fund also may invest in companies located in emerging markets and in companies of any market capitalization. Our proprietary approach quantifies investment opportunity both from a real estate and stock perspective and combines “bottom-up” real estate research with a RelativeValue Model that includes direct contact with the companies in the fund’s investable universe.
The Fund 3
DISCUSSION OF FUND PERFORMANCE (continued)
Real Estate Stocks Rallied as Global Economy Recovered
2009 began in the midst of a severe recession that had been exacerbated by a global banking crisis.The roots of the crisis could be found in the U.S. real estate market, where freezing credit markets sent shockwaves throughout the world, driving stock prices sharply lower. In addition, when credit markets closed, commercial real estate owners turned to the equity markets for the capital they needed to maintain operations, effectively diluting the value of their shares.
Fortunately, global equity markets bottomed in March, when it became apparent that remedial efforts by central banks and government officials were gaining traction. Investors sought bargains among beaten-down stocks as they looked forward to better economic times. In the real estate sector, many banks chose to extend loan maturities rather than accept defaults, providing a lifeline to financially stressed property developers. These factors sparked a sustained sector rally through the reporting period’s end.
Quality Bias Dampened Fund Performance
The rally proved to be especially robust in Asian emerging markets. Singapore was one of the harder hit markets during the downturn, and its rebound was commensurate with its previous decline.Hong Kong and China benefited from a massive economic stimulus program enacted by the Chinese government to keep the regional economy growing. The developed markets of Europe and the United States also showed good economic progress,but their economic recoveries so far have been milder than historical averages.Australia has continued to struggle.
The fund’s relatively light holdings in volatile Asian emerging markets, where valuations were high and transparency is low, dampened its results compared to its benchmark during 2009. The fund’s relative performance also was adversely affected by a modest cash position as we sought to keep funds available for potential redemptions and new investment opportunities.
The fund achieved better results in the United States, where our security selection strategy produced above-average results. For example, our research analysts determined that although the stock of Brandywine Realty Trust had been punished too severely in the downturn, the
4
company’s debt levels and cash flows made the stock a strong candidate for gains during an economic recovery.
Maintaining Cautious Approach at Year-End
Although the worst of the downturn appears to be over, we have remained somewhat cautious, especially with regard to the impending end of certain government programs that have supported some areas of the credit markets. Potentially tight credit conditions and deleveraging activity by banks appear likely to weigh heavily on weaker real estate companies. Indeed, in 2010, we expect the market to differentiate more sharply between companies with “prime” real estate assets and those with less attractive properties.
Therefore,we have shifted some assets to Asian emerging markets,where we expect economic growth to remain relatively robust. We have reduced the fund’s exposure to Europe, where a persistently sluggish economy is likely to constrain occupancy rates and prices seem high compared to other regions of the world. Although unemployment and occupancy rates may remain troublesome in the United States, we have maintained a generally market-neutral position due to attractive pricing in some domestic commercial markets. In all regions of the world, we have intensified our focus on real estate companies with ample equity, manageable debt and access to capital. In our judgment, these strategies position the fund to participate in areas of strength while limiting exposure to weaker market segments.
January 15, 2010
| 1 | Total returns include reinvestment of dividends and any capital gains paid, and does not take into |
| consideration the maximum initial sales charges in the case of Class A shares, or the applicable | |
| contingent deferred sales charges imposed on redemptions in the case of Class C shares. Had these | |
| charges been reflected, returns would have been lower. Past performance is no guarantee of future | |
| results. Share price and investment return fluctuate such that upon redemption, fund shares may be | |
| worth more or less than their original cost. Return figures provided reflect the absorption of certain | |
| fund expenses by The Dreyfus Corporation pursuant to an undertaking in effect for Classes A | |
| and C through May 1, 2010, and in effect for Class I through September 30, 2010, at which | |
| time it may be extended, terminated or modified. Had these expenses not been absorbed, the | |
| fund’s returns would have been lower. | |
| 2 | SOURCE: LIPPER INC. — Reflects reinvestment of net dividends and, where applicable, |
| capital gain distributions. The FTSE European Public Real Estate Association (EPRA) | |
| National Association of Real Estate Investment Trusts (NAREIT) Global Real Estate | |
| Securities Index is an unmanaged index designed to track the performance of listed real estate | |
| companies and REITs worldwide. |
The Fund 5
FUND PERFORMANCE
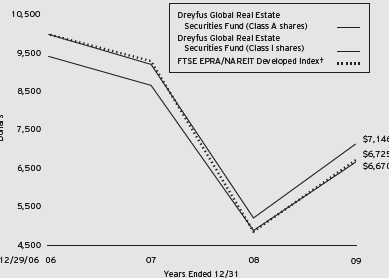
| Comparison of change in value of $10,000 investment in Dreyfus Global Real Estate Securities |
| Fund Class A shares and Class I shares and the FTSE EPRA/NAREIT Developed Index |
| † Source: Lipper Inc. |
| Past performance is not predictive of future performance. |
| The above graph compares a $10,000 investment made in Class A and Class I shares of Dreyfus Global Real Estate |
| Securities Fund on 12/29/06 (inception date) to a $10,000 investment made in the FTSE EPRA/NAREIT |
| Developed Index (the “Index”) on that date. For comparative purposes, the value of the Index on 12/31/06 is used as |
| the beginning value on 12/29/06. All dividends and capital gain distributions are reinvested. |
| Effective March 23, 2009, the fund’s benchmark changed its name from the FTSE EPRA/NAREIT Global Real |
| Estate Index to the FTSE EPRA/NAREIT Developed Index. |
| The fund’s performance shown in the line graph takes into account the maximum initial sales charge on Class A shares |
| and all other applicable fees and expenses. Performance for Class C shares will vary from the performance of Class A |
| shares and Class I shares shown above due to differences in charges and expenses.The Index is an unmanaged market- |
| capitalization weighted index designed to measure the performance of exchange-listed real estate companies and REITs |
| worldwide. Unlike a mutual fund, the Index is not subject to charges, fees and other expenses. Investors cannot invest |
| directly in any index. Further information relating to fund performance, including expense reimbursements, if applicable, is |
| contained in the Financial Highlights section of the prospectus and elsewhere in this report. |
6
| Average Annual Total Returns as of 12/31/09 | |||
| Inception | From | ||
| Date | 1 Year | Inception | |
| Class A shares | |||
| with maximum sales charge (5.75%) | 12/29/06 | 28.45% | –12.59% |
| without sales charge | 12/29/06 | 36.38% | –10.85% |
| Class C shares | |||
| with applicable redemption charge † | 9/13/08 | 34.35% | –11.08%†† |
| without redemption | 9/13/08 | 35.35% | –11.08%†† |
| Class I shares | 12/29/06 | 36.94% | –10.56% |
| Past performance is not predictive of future performance.The fund’s performance shown in the graph and table does not | |
| reflect the deduction of taxes that a shareholder would pay on fund distributions or the redemption of fund shares. | |
| † | The maximum contingent deferred sales charge for Class C shares is 1% for shares redeemed within one year of the |
| date of purchase. | |
| †† | The total return performance figures presented for Class C shares of the fund reflect the performance of the fund’s |
| Class A shares for periods prior to 09/13/08 (the inception date for Class C shares), adjusted to reflect the | |
| applicable sales load for that class. | |
The Fund 7
UNDERSTANDING YOUR FUND’S EXPENSES (Unaudited)
As a mutual fund investor, you pay ongoing expenses, such as management fees and other expenses. Using the information below, you can estimate how these expenses affect your investment and compare them with the expenses of other funds.You also may pay one-time transaction expenses, including sales charges (loads) and redemption fees, which are not shown in this section and would have resulted in higher total expenses. For more information, see your fund’s prospectus or talk to your financial adviser.
Review your fund’s expenses
The table below shows the expenses you would have paid on a $1,000 investment in Dreyfus Global Real Estate Securities Fund from July 1, 2009 to December 31, 2009. It also shows how much a $1,000 investment would be worth at the close of the period, assuming actual returns and expenses.
Expenses and Value of a $1,000 Investment
assuming actual returns for the six months ended December 31, 2009
| Class A | Class C | Class I | |
| Expenses paid per $1,000† | $ 9.25 | $ 13.65 | $ 6.94 |
| Ending value (after expenses) | $1,292.50 | $1,285.70 | $1,293.30 |
COMPARING YOUR FUND’S EXPENSES
WITH THOSE OF OTHER FUNDS (Unaudited)
Using the SEC’s method to compare expenses
The Securities and Exchange Commission (SEC) has established guidelines to help investors assess fund expenses. Per these guidelines, the table below shows your fund’s expenses based on a $1,000 investment, assuming a hypothetical 5% annualized return. You can use this information to compare the ongoing expenses (but not transaction expenses or total cost) of investing in the fund with those of other funds.All mutual fund shareholder reports will provide this information to help you make this comparison. Please note that you cannot use this information to estimate your actual ending account balance and expenses paid during the period.
Expenses and Value of a $1,000 Investment
assuming a hypothetical 5% annualized return for the six months ended December 31, 2009
| Class A | Class C | Class I | |
| Expenses paid per $1,000† | $ 8.13 | $ 12.03 | $ 6.11 |
| Ending value (after expenses) | $1,017.14 | $1,013.26 | $1,019.16 |
| † Expenses are equal to the fund’s annualized expense ratio of 1.60% for Class A, 2.37% for Class C and 1.20% |
| for Class I, multiplied by the average account value over the period, multiplied by 184/365 (to reflect the one-half |
| year period). |
8
| STATEMENT OF INVESTMENTS |
| December 31, 2009 |
| Common Stocks—98.1% | Shares | Value ($) |
| Australia—10.3% | ||
| Commonwealth Property Office Fund | 738,990 | 639,048 |
| Goodman Group | 1,558,110 | 876,842 |
| Macquarie Office Trust | 4,554,640 | 1,252,584 |
| Mirvac Group | 971,580 | 1,351,641 |
| Stockland | 155,850 | 547,683 |
| Westfield Group | 364,520 | 4,065,214 |
| 8,733,012 | ||
| Austria—.6% | ||
| Conwert Immobilien Invest | 42,820 a | 524,224 |
| Canada—3.4% | ||
| Boardwalk Real Estate Investment Trust | 7,810 | 276,675 |
| Brookfield Properties | 80,340 | 983,269 |
| Calloway Real Estate Investment Trust | 39,130 | 729,958 |
| Chartwell Seniors Housing | ||
| Real Estate Investment Trust | 135,390 | 910,065 |
| 2,899,967 | ||
| Finland—1.1% | ||
| Citycon | 213,860 | 901,341 |
| France—6.6% | ||
| Klepierre | 31,790 | 1,293,803 |
| Mercialys | 26,910 | 947,060 |
| Unibail-Rodamco | 15,150 | 3,338,095 |
| 5,578,958 | ||
| Hong Kong—16.4% | ||
| China Overseas Land & Investment | 610,600 | 1,278,514 |
| China Resources Land | 432,000 | 972,453 |
| Hang Lung Properties | 294,000 | 1,148,647 |
| Henderson Land Development | 262,000 | 1,952,181 |
| Hongkong Land Holdings | 345,000 | 1,697,831 |
| Hysan Development | 197,000 | 557,817 |
| New World Development | 220,000 | 449,010 |
| Shimao Property Holdings | 192,500 | 361,038 |
| Shui On Land | 409,000 | 240,220 |
| Sino Land | 250,000 | 482,640 |
| Sun Hung Kai Properties | 326,000 | 4,837,332 |
| 13,977,683 |
The Fund 9
STATEMENT OF INVESTMENTS (continued)
| Common Stocks (continued) | Shares | Value ($) |
| Japan—9.7% | ||
| Goldcrest | 21,480 | 596,822 |
| Kenedix Realty Investment | 222 | 605,256 |
| Mitsubishi Estate | 160,000 | 2,537,835 |
| Mitsui Fudosan | 118,000 | 1,981,552 |
| Nippon Building Fund | 40 | 303,044 |
| NTT Urban Development | 376 | 249,305 |
| Sumitomo Realty & Development | 63,000 | 1,181,596 |
| United Urban Investment | 159 | 836,347 |
| 8,291,757 | ||
| Singapore—4.3% | ||
| Allgreen Properties | 202,000 | 175,180 |
| Ascendas Real Estate Investment Trust | 290,000 | 454,152 |
| Ascott Residence Trust | 437,000 | 370,891 |
| CapitaLand | 695,000 | 2,058,572 |
| Capitamalls Asia | 106,000 | 191,650 |
| Suntec Real Estate Investment Trust | 397,000 | 379,729 |
| 3,630,174 | ||
| Sweden—.7% | ||
| Castellum | 59,785 | 605,818 |
| Switzerland—.8% | ||
| PSP Swiss Property | 12,730 | 719,904 |
| United Kingdom—6.3% | ||
| Big Yellow Group | 110,060 a | 629,300 |
| British Land | 95,550 | 740,793 |
| Great Portland Estates | 151,250 | 701,381 |
| Hammerson | 200,310 | 1,371,809 |
| Land Securities Group | 120,800 | 1,336,542 |
| Segro | 101,400 | 564,389 |
| 5,344,214 | ||
| United States—37.9% | ||
| AMB Property | 38,210 | 976,266 |
10
| Common Stocks (continued) | Shares | Value ($) |
| United States (continued) | ||
| American Tower, Cl. A | 18,370 a | 793,768 |
| Boston Properties | 27,110 | 1,818,268 |
| Brandywine Realty Trust | 100,340 | 1,143,876 |
| Camden Property Trust | 27,090 | 1,147,803 |
| Cogdell Spencer | 65,440 | 370,390 |
| DiamondRock Hospitality | 50,710 | 429,514 |
| Digital Realty Trust | 8,630 | 433,916 |
| Duke Realty | 97,320 | 1,184,384 |
| Education Realty Trust | 76,260 | 369,098 |
| Equity Residential | 53,960 | 1,822,769 |
| Essex Property Trust | 15,730 | 1,315,815 |
| Federal Realty Investment Trust | 6,780 | 459,142 |
| HCP | 26,820 | 819,083 |
| Home Properties | 9,110 | 434,638 |
| Host Hotels & Resorts | 86,920 a | 1,014,356 |
| Kilroy Realty | 30,710 | 941,876 |
| Kimco Realty | 82,730 | 1,119,337 |
| Macerich | 27,840 | 1,000,848 |
| Nationwide Health Properties | 16,800 | 591,024 |
| ProLogis | 98,460 | 1,347,917 |
| Public Storage | 38,020 | 3,096,729 |
| Regency Centers | 21,540 | 755,192 |
| Simon Property Group | 52,108 | 4,158,219 |
| SL Green Realty | 16,960 | 852,071 |
| Sunstone Hotel Investors | 55,380 a | 491,774 |
| Taubman Centers | 11,200 | 402,192 |
| Ventas | 29,990 | 1,311,763 |
| Vornado Realty Trust | 24,040 | 1,681,358 |
| 32,283,386 | ||
| Total Common Stocks | ||
| (cost $78,378,276) | 83,490,438 |
The Fund 11
STATEMENT OF INVESTMENTS (continued)
| Other Investment—.3% | Shares | Value ($) |
| Registered Investment Company; | ||
| Dreyfus Institutional Preferred | ||
| Plus Money Market Fund | ||
| (cost $240,000) | 240,000 b | 240,000 |
| Total Investments (cost $78,618,276) | 98.4% | 83,730,438 |
| Cash and Receivables (Net) | 1.6% | 1,322,791 |
| Net Assets | 100.0% | 85,053,229 |
| a | Non-income producing security. |
| b | Investment in affiliated money market mutual fund. |
| Portfolio Summary (Unaudited)† | |||
| Value (%) | Value (%) | ||
| Diversified REITs | 33.6 | Health Care | 3.2 |
| Retail | 12.9 | Industrial | 2.7 |
| Office | 10.2 | Hotels | 2.3 |
| Real Estate | 9.0 | Shopping Centers | 1.9 |
| Regional Malls | 6.5 | Specialty | 1.4 |
| Multifamily | 5.0 | Residential | .7 |
| Self Storage | 4.4 | Money Market Investment | .3 |
| Real Estate Services | 4.3 | 98.4 | |
| † Based on net assets. |
| See notes to financial statements. |
12
| STATEMENT OF ASSETS AND LIABILITIES |
| December 31, 2009 |
| Cost | Value | |
| Assets ($): | ||
| Investments in securities—See Statement of Investments: | ||
| Unaffiliated issuers | 78,378,276 | 83,490,438 |
| Affiliated issuers | 240,000 | 240,000 |
| Cash | 105,348 | |
| Cash denominated in foreign currencies | 569,097 | 557,778 |
| Dividends and interest receivable | 334,642 | |
| Receivable for shares of Common Stock subscribed | 237,029 | |
| Receivable for investment securities sold | 206,726 | |
| Prepaid expenses | 20,662 | |
| 85,192,623 | ||
| Liabilities ($): | ||
| Due to The Dreyfus Corporation and affiliates—Note 3(c) | 85,882 | |
| Payable for shares of Common Stock redeemed | 6,894 | |
| Accrued expenses | 46,618 | |
| 139,394 | ||
| Net Assets ($) | 85,053,229 | |
| Composition of Net Assets ($): | ||
| Paid-in capital | 115,249,589 | |
| Accumulated distributions in excess of investment income—net | (2,107,286) | |
| Accumulated net realized gain (loss) on investments | (33,192,702) | |
| Accumulated net unrealized appreciation (depreciation) | ||
| on investments and foreign currency transactions | 5,103,628 | |
| Net Assets ($) | 85,053,229 |
| Net Asset Value Per Share | |||
| Class A | Class C | Class I | |
| Net Assets ($) | 161,730 | 37,993 | 84,853,506 |
| Shares Outstanding | 24,655 | 5,848 | 13,079,098 |
| Net Asset Value Per Share ($) | 6.56 | 6.50 | 6.49 |
See notes to financial statements.
The Fund 13
| STATEMENT OF OPERATIONS |
| Year Ended December 31, 2009 |
| Investment Income ($): | |
| Income: | |
| Cash dividends (net of $107,059 foreign taxes withheld at source): | |
| Unaffiliated issuers | 2,189,303 |
| Affiliated issuers | 1,452 |
| Interest | 941 |
| Total Income | 2,191,696 |
| Expenses: | |
| Management fee—Note 3(a) | 557,762 |
| Custodian fees—Note 3(c) | 89,616 |
| Auditing fees | 54,579 |
| Registration fees | 42,860 |
| Prospectus and shareholders’ reports | 12,533 |
| Directors’ fees and expenses—Note 3(d) | 2,356 |
| Loan commitment fees—Note 2 | 822 |
| Shareholder servicing costs—Note 3(c) | 606 |
| Distribution fees—Note 3(b) | 119 |
| Interest expense—Note 2 | 22 |
| Miscellaneous | 22,313 |
| Total Expenses | 783,588 |
| Less—reduction in expenses due to undertaking—Note 3(a) | (89,308) |
| Less—reduction in fees due to earnings credits—Note 1(c) | (67) |
| Net Expenses | 694,213 |
| Investment Income—Net | 1,497,483 |
| Realized and Unrealized Gain (Loss) on Investments—Note 4 ($): | |
| Net realized gain (loss) on investments and foreign currency transactions | (13,740,430) |
| Net realized gain (loss) on forward foreign currency exchange contracts | (21,825) |
| Net Realized Gain (Loss) | (13,762,255) |
| Net unrealized appreciation (depreciation) on | |
| investments and foreign currency transactions | 31,879,246 |
| Net Realized and Unrealized Gain (Loss) on Investments | 18,116,991 |
| Net Increase in Net Assets Resulting from Operations | 19,614,474 |
| See notes to financial statements. | |
14
STATEMENT OF CHANGES IN NET ASSETS
| Year Ended December 31, | ||
| 2009a | 2008b,c | |
| Operations ($): | ||
| Investment income—net | 1,497,483 | 1,307,146 |
| Net realized gain (loss) on investments | (13,762,255) | (16,432,723) |
| Net unrealized appreciation | ||
| (depreciation) on investments | 31,879,246 | (20,323,628) |
| Net Increase (Decrease) in Net Assets | ||
| Resulting from Operations | 19,614,474 | (35,449,205) |
| Dividends to Shareholders from ($): | ||
| Investment income—net: | ||
| Class A Shares | (6,356) | (426) |
| Class C Shares | (1,525) | (41) |
| Class I Shares | (4,724,942) | (1,032,336) |
| Class T Shares | — | (51) |
| Total Dividends | (4,732,823) | (1,032,854) |
| Capital Stock Transactions ($): | ||
| Net proceeds from shares sold: | ||
| Class A Shares | 310,436 | 17,982 |
| Class C Shares | 29,412 | 10,000 |
| Class I Shares | 32,835,308 | 111,346,944 |
| Class T Shares | — | 10,000 |
| Dividends reinvested: | ||
| Class A Shares | 5,601 | 371 |
| Class C Shares | 1,132 | — |
| Class I Shares | 1,387,663 | 242,508 |
| Cost of shares redeemed: | ||
| Class A Shares | (188,323) | (42,657) |
| Class C Shares | (2,031) | — |
| Class I Shares | (12,481,434) | (78,015,421) |
| Class T Shares | (5,553) | — |
| Increase (Decrease) in Net Assets | ||
| from Capital Stock Transactions | 21,892,211 | 33,569,727 |
| Total Increase (Decrease) in Net Assets | 36,773,862 | (2,912,332) |
| Net Assets ($): | ||
| Beginning of Period | 48,279,367 | 51,191,699 |
| End of Period | 85,053,229 | 48,279,367 |
| Undistributed (distributions in excess of) | ||
| investment income—net | (2,107,286) | 13,934 |
The Fund 15
STATEMENT OF CHANGES IN NET ASSETS (continued)
| Year Ended December 31, | ||
| 2009a | 2008b,c | |
| Capital Share Transactions: | ||
| Class Ad | ||
| Shares sold | 52,973 | 2,352 |
| Shares issued for dividends reinvested | 853 | 50 |
| Shares redeemed | (31,531) | (5,757) |
| Net Increase (Decrease) in Shares Outstanding | 22,295 | (3,355) |
| Class C | ||
| Shares sold | 4,731 | 1,285 |
| Shares issued for dividends reinvested | 174 | — |
| Shares redeemed | (342) | — |
| Net Increase (Decrease) in Shares Outstanding | 4,563 | 1,285 |
| Class I | ||
| Shares sold | 5,600,709 | 14,329,983 |
| Shares issued for dividends reinvested | 217,545 | 40,251 |
| Shares redeemed | (2,347,093) | (10,418,141) |
| Net Increase (Decrease) in Shares Outstanding | 3,471,161 | 3,952,093 |
| Class Td | ||
| Shares sold | — | 1,285 |
| Shares redeemed | (1,285) | — |
| Net Increase (Decrease) in Shares Outstanding | (1,285) | 1,285 |
| a Effective as of the close of business on February 4, 2009, the fund no longer offers Class T shares. |
| b The fund commenced offering four classes of shares on the close of business September 12, 2008.The existing shares |
| were redesignated and the fund added Class C and Class T shares. |
| c Represents information for the fund’s predecessor, BNY Hamilton Global Real Estate Securities Fund, through |
| September 12, 2008. |
| d On the close of business on February 4, 2009, 1,285 Class T shares representing $5,553 were converted to 1,285 |
| Class A shares. |
See notes to financial statements.
16
FINANCIAL HIGHLIGHTS
Please note that the financial highlights information in the following tables for the fund’s Class A and Class I shares represents the financial highlights of the Class A and Institutional shares, respectively, of the fund’s predecessor, BNY Hamilton Global Real Estate Securities Fund (“Hamilton Global Real Estate Securities Fund”), before the fund commenced operations as of the close of business on September 12, 2008, and represents the performance of the fund’s Class A and Class I shares thereafter. Before the fund commenced operations, all of the assets of the Hamilton Global Real Estate Securities Fund were transferred to the fund in exchange for Class A and Class I shares of the fund in a tax-free reorganization.Total return shows how much your investment in the fund would have increased (or decreased) during each period, assuming you had reinvested all dividends and distributions.These figures hav e been derived from the fund’s and the fund’s predecessor’s financial statements.
| Year Ended December 31, | ||||
| Class A Shares† | 2009 | 2008 | 2007 | 2006a |
| Per Share Data ($): | ||||
| Net asset value, beginning of period | 5.02 | 9.04 | 10.00 | 10.00 |
| Investment Operations: | ||||
| Investment income—netb | .08 | .16 | .18 | — |
| Net realized and unrealized | ||||
| gain (loss) on investments | 1.74 | (4.08) | (.97) | — |
| Total from Investment Operations | 1.82 | (3.92) | (.79) | — |
| Distributions: | ||||
| Dividends from investment income—net | (.28) | (.10) | (.17) | — |
| Net asset value, end of period | 6.56 | 5.02 | 9.04 | 10.00 |
| Total Return (%)c | 36.38 | (43.60) | (8.00) | — |
| Ratios/Supplemental Data (%): | ||||
| Ratio of total expenses to average net assets | 4.36 | 1.62 | 1.58 | — |
| Ratio of net expenses to average net assets | 1.60 | 1.41 | 1.50 | — |
| Ratio of net investment income | ||||
| to average net assets | 1.44 | 1.83 | 1.87 | — |
| Portfolio Turnover Rate | 97.43 | 79 | 73 | — |
| Net Assets, end of period ($ x 1,000) | 162 | 12 | 52 | —d |
| † Represents information for Class A shares of the fund’s predecessor, Hamilton Global Real Estate Securities Fund, |
| through September 12, 2008. |
| a From December 29, 2006 (commencement of operations) to December 31, 2006. |
| b Based on average shares outstanding at each month end. |
| c Exclusive of sales charge. |
| d Amount represents less than $1,000. |
See notes to financial statements.
The Fund 17
FINANCIAL HIGHLIGHTS (continued)
| Year Ended December 31, | ||
| Class C Shares | 2009 | 2008a |
| Per Share Data ($): | ||
| Net asset value, beginning of period | 5.02 | 7.78 |
| Investment Operations: | ||
| Investment income—netb | .04 | .01 |
| Net realized and unrealized | ||
| gain (loss) on investments | 1.75 | (2.74) |
| Total from Investment Operations | 1.79 | (2.73) |
| Distributions: | ||
| Dividends from investment income—net | (.31) | (.03) |
| Net asset value, end of period | 6.50 | 5.02 |
| Total Return (%)c | 35.35 | (34.92)d |
| Ratios/Supplemental Data (%): | ||
| Ratio of total expenses to average net assets | 2.91 | 2.46e |
| Ratio of net expenses to average net assets | 2.35 | 2.35e |
| Ratio of net investment income to average net assets | .71 | .67e |
| Portfolio Turnover Rate | 97.43 | 79 |
| Net Assets, end of period ($ x 1,000) | 38 | 6 |
| a | From September 13, 2008 (commencement of initial offering) to December 31, 2008. |
| b | Based on average shares outstanding at each month end. |
| c | Exclusive of sales charge. |
| d | Not annualized. |
| e | Annualized. |
See notes to financial statements.
18
| Year Ended December 31, | ||||
| Class I Shares† | 2009 | 2008 | 2007 | 2006a |
| Per Share Data ($): | ||||
| Net asset value, beginning of period | 5.02 | 9.04 | 10.00 | 10.00 |
| Investment Operations: | ||||
| Investment income—netb | .14 | .16 | .20 | — |
| Net realized and unrealized | ||||
| gain (loss) on investments | 1.70 | (4.06) | (.98) | — |
| Total from Investment Operations | 1.84 | (3.90) | (.78) | — |
| Distributions: | ||||
| Dividends from investment income—net | (.37) | (.12) | (.18) | — |
| Net asset value, end of period | 6.49 | 5.02 | 9.04 | 10.00 |
| Total Return (%) | 36.94 | (43.38) | (7.83) | — |
| Ratios/Supplemental Data (%): | ||||
| Ratio of total expenses to average net assets | 1.33 | 1.24 | 1.34 | — |
| Ratio of net expenses to average net assets | 1.18 | 1.19 | 1.25 | — |
| Ratio of net investment income | ||||
| to average net assets | 2.55 | 2.24 | 1.97 | — |
| Portfolio Turnover Rate | 97.43 | 79 | 73 | — |
| Net Assets, end of period ($ x 1,000) | 84,854 | 48,255 | 51,140 | —c |
| † Represents information for Institutional shares of the fund’s predecessor, Hamilton Global Real Estate Securities |
| Fund, through September 12, 2008. |
| a From December 29, 2006 (commencement of operations) to December 31, 2006. |
| b Based on average shares outstanding at each month end. |
| c Amount represents less than $1,000. |
See notes to financial statements.
The Fund 19
NOTES TO FINANCIAL STATEMENTS
NOTE 1—Significant Accounting Policies:
Dreyfus Global Real Estate Securities Fund (the “fund”) is a separate diversified series of Dreyfus Premier Investment Funds, Inc. (the “Company”), which is registered under the Investment Company Act of 1940, as amended (the “Act”), as an open-end management investment company and operates as a series company currently offering ten series, including the fund.The fund’s investment objective is to maximize total return consisting of capital appreciation and current income. The Dreyfus Corporation (the “Manager” or “Dreyfus”), a wholly-owned subsidiary of The Bank of New York Mellon Corporation (“BNY Mellon”), serves as the fund’s investment adviser. Urdang Securities Management, Inc. (“Urdang”) serves as the fund’s sub-investment advisor. Urdang is a wholly-owned subsidiary of BNY Mellon.
MBSC Securities Corporation (the “Distributor”), a wholly-owned subsidiary of Dreyfus, is the distributor of the fund’s shares.The fund is authorized to issue 250 million shares of $.001 par value Common Stock. The fund currently offers three classes of shares: Class A (100 million shares authorized), Class C (50 million shares authorized) and Class I (100 million shares authorized). Class A shares are subject to a sales charge imposed at the time of purchase. Class C shares are subject to a contingent deferred sales charge (“CDSC”) imposed on Class C shares redeemed within one year of purchase. Class I shares are sold at net asset value per share only to institutional investors. Other differences between the classes include the services offered to and the expenses borne by each class, the allocation of certain transfer agency costs and certain voting rights. Income, expenses (other than expenses attrib utable to a specific class), and realized and unrealized gains or losses on investments are allocated to each class of shares based on its relative net assets.
Effective December 3, 2008, investments for new accounts were no longer permitted in Class T shares of the fund, except that participants in certain group retirement plans were able to open a new account in
20
Class T shares of the fund, provided that the fund was established as an investment option under the plans before December 3, 2008. On February 4, 2009, the fund issued to each holder of its Class T shares, in exchange for said shares, Class A shares of the fund having an aggregate net asset value equal to the aggregate net asset value of the shareholder’s Class T shares. Subsequent investments in the fund’s Class A shares made by prior holders of the fund’s Class T shares who received Class A shares of the fund in exchange for their Class T shares are subject to the front-end sales load schedule that was in effect for Class T shares at the time of the exchange. Otherwise, all other Class A share attributes will be in effect. Effective as of the close of business on February 4, 2009, the fund no longer offers Class T shares.
The Company accounts separately for the assets, liabilities and operations of each series. Expenses directly attributable to each series are charged to that series’ operations; expenses which are applicable to all series are allocated among them on a pro rata basis.
The Financial Accounting Standards Board (“FASB”) Accounting Standards Codification (“ASC”) has become the exclusive reference of authoritative U.S. generally accepted accounting principles (“GAAP”) recognized by the FASB to be applied by nongovernmental entities. Rules and interpretive releases of the Securities and Exchange Commission (“SEC”) under authority of federal laws are also sources of authoritative GAAP for SEC registrants. The ASC has superseded all existing non-SEC accounting and reporting standards. The fund’s financial statements are prepared in accordance with GAAP, which may require the use of management estimates and assumptions.Actual results could differ from those estimates.
The fund enters into contracts that contain a variety of indemnifications. The fund’s maximum exposure under these arrangements is unknown.The fund does not anticipate recognizing any loss related to these arrangements.
The Fund 21
NOTES TO FINANCIAL STATEMENTS (continued)
(a) Portfolio valuation: Investments in securities are valued at the last sales price on the securities exchange or national securities market on which such securities are primarily traded. Securities listed on the National Market System for which market quotations are available are valued at the official closing price or, if there is no official closing price that day, at the last sales price. Securities not listed on an exchange or the national securities market, or securities for which there were no transactions, are valued at the average of the most recent bid and asked prices, except for open short positions, where the asked price is used for valuation purposes. Bid price is used when no asked price is available. Registered investment companies that are not traded on an exchange are valued at their net asset value. When market quotations or offici al closing prices are not readily available, or are determined not to reflect accurately fair value, such as when the value of a security has been significantly affected by events after the close of the exchange or market on which the security is principally traded (for example, a foreign exchange or market),but before the fund calculates its net asset value,the fund may value these investments at fair value as determined in accordance with the procedures approved by the Board of Directors. Fair valuing of securities may be determined with the assistance of a pricing service using calculations based on indices of domestic securities and other appropriate indicators, such as prices of relevant American Depository Receipts and futures contracts. For other securities that are fair valued by the Board of Directors, certain factors may be considered such as: fundamental analytical data, the nature and duration of restrictions on disposition, an evaluation of the forces that influence the market in which the secur ities are purchased and sold, and public trading in similar securities of the issuer or comparable issuers. Investments denominated in foreign currencies are translated to U.S. dollars at the prevailing rates of exchange. Forward foreign currency exchange contracts (“forward contracts”) are valued at the forward rate.
The fair value of a financial instrument is the amount that would be received to sell an asset or paid to transfer a liability in an orderly transaction between market participants at the measurement date (i.e. the exit price). GAAP establishes a fair value hierarchy that prioritizes the
22
inputs of valuation techniques used to measure fair value.This hierarchy gives the highest priority to unadjusted quoted prices in active markets for identical assets or liabilities (Level 1 measurements) and the lowest priority to unobservable inputs (Level 3 measurements).
Additionally, GAAP provides guidance on determining whether the volume and activity in a market has decreased significantly and whether such a decrease in activity results in transactions that are not orderly. GAAP requires enhanced disclosures around valuation inputs and techniques used during annual and interim periods.
Various inputs are used in determining the value of the fund’s investments relating to fair value measurements. These inputs are summarized in the three broad levels listed below:
Level 1—unadjusted quoted prices in active markets for
identical investments.
Level 2—other significant observable inputs (including quoted
prices for similar investments, interest rates, prepayment speeds,
credit risk, etc.).
Level 3—significant unobservable inputs (including the fund’s own
assumptions in determining the fair value of investments).
The inputs or methodology used for valuing securities are not necessarily an indication of the risk associated with investing in those securities.
The following is a summary of the inputs used as of December 31, 2009 in valuing the fund’s investments:
| Level 2—Other | Level 3— | |||
| Level 1— | Significant | Significant | ||
| Unadjusted | Observable | Unobservable | ||
| Quoted Prices | Inputs | Inputs | Total | |
| Assets ($) | ||||
| Investments in Securities: | ||||
| Equity Securities— | ||||
| Domestic† | 32,283,386 | — | — | 32,283,386 |
| Equity Securities— | ||||
| Foreign† | 16,574,426 | 34,632,626 | — | 51,207,052 |
| Mutual Funds | 240,000 | — | — | 240,000 |
| † | See Statement of Investments for country classification. |
The Fund 23
NOTES TO FINANCIAL STATEMENTS (continued)
(b) Foreign currency transactions: The fund does not isolate that portion of the results of operations resulting from changes in foreign exchange rates on investments from the fluctuations arising from changes in market prices of securities held. Such fluctuations are included with the net realized and unrealized gain or loss on investments.
Net realized foreign exchange gains or losses arise from sales of foreign currencies,currency gains or losses realized on securities transactions and the difference between the amounts of dividends, interest, and foreign withholding taxes recorded on the fund’s books and the U.S. dollar equivalent of the amounts actually received or paid. Net unrealized foreign exchange gains and losses arise from changes in the value of assets and liabilities other than investments resulting from changes in exchange rates. Foreign currency gains and losses on investments are included with net realized and unrealized gain or loss on investments.
(c) Securities transactions and investment income: Securities transactions are recorded on a trade date basis. Realized gains and losses from securities transactions are recorded on the identified cost basis. Dividend income is recognized on the ex-dividend date and interest income, including, where applicable, accretion of discount and amortization of premium on investments, is recognized on the accrual basis.
The fund has arrangements with the custodian and cash management bank whereby the fund may receive earnings credits when positive cash balances are maintained, which are used to offset custody and cash management fees. For financial reporting purposes, the fund includes net earnings credits as an expense offset in the Statement of Operations.
Investing in foreign markets may involve special risks and considerations not typically associated with investing in the U.S. These risks include revaluation of currencies, high rates of inflation, repatriation restrictions on income and capital, and adverse political and economic developments. Moreover, securities issued in these markets may be less liquid, subject to government ownership controls and delayed settlements, and their prices may be more volatile than those of comparable securities in the U.S.
24
(d) Affiliated issuers: Investments in other investment companies advised by Dreyfus are defined as “affiliated” in the Act.
(e) Dividends to shareholders: Dividends are recorded on the ex-dividend date. Dividends from investment income-net and dividends from net realized capital gains, if any, are normally declared and paid annually, but the fund may make distributions on a more frequent basis to comply with the distribution requirements of the Internal Revenue Code of 1986, as amended (the “Code”).To the extent that net realized capital gains can be offset by capital loss carryovers, it is the policy of the fund not to distribute such gains. Income and capital gain distributions are determined in accordance with income tax regulations, which may differ from GAAP.
(f) Federal income taxes: It is the policy of the fund to continue to qualify as a regulated investment company, if such qualification is in the best interests of its shareholders, by complying with the applicable provisions of the Code, and to make distributions of taxable income sufficient to relieve it from substantially all federal income and excise taxes.
As of and during the period ended December 31, 2009, the fund did not have any liabilities for any uncertain tax positions.The fund recognizes interest and penalties, if any, related to uncertain tax positions as income tax expense in the Statement of Operations. During the period, the fund did not incur any interest or penalties.
Each of the tax years in the four-year period ended December 31, 2009 remains subject to examination by the Internal Revenue Service and state taxing authorities.
At December 31, 2009, the components of accumulated earnings on a tax basis were as follows: undistributed ordinary income $480,778, accumulated capital losses $26,947,170 and unrealized depreciation $3,133,152. In addition, the fund had $494,300 of capital losses and $129,318 of passive foreign investment company losses realized after October 31, 2009, which were deferred for tax purposes to the first day of the following fiscal year.
The Fund 25
NOTES TO FINANCIAL STATEMENTS (continued)
The accumulated capital loss carryover is available for federal income tax purposes to be applied against future net securities profits, if any, realized subsequent to December 31, 2009. If not applied, $561,698 of the carryover expires in fiscal 2015, $8,901,391 expires in fiscal 2016 and $17,484,081 expires in fiscal 2017.
The tax character of distributions paid to shareholders during the fiscal periods ended December 31, 2009 and December 31, 2008 were as follows: ordinary income $4,732,823 and $1,032,854, respectively.
During the period ended December 31, 2009, as a result of permanent book to tax differences, primarily due to the tax treatment for foreign currency gains and losses and passive foreign investment companies, the fund increased accumulated undistributed investment income-net by $1,114,120 and decreased accumulated net realized gain (loss) on investments by the same amount. Net assets and net asset value per share were not affected by this classification.
NOTE 2—Bank Lines of Credit:
The fund participates with other Dreyfus-managed funds in a $225 million unsecured credit facility led by Citibank, N.A. and a $300 million unsecured credit facility provided by The Bank of New York Mellon, a subsidiary of BNY Mellon and an affiliate of Dreyfus, (each, a “Facility”), each to be utilized primarily for temporary or emergency purposes, including the financing of redemptions. In connection therewith, the fund has agreed to pay its pro rata portion of commitment fees for each Facility. Interest is charged to the fund based on rates determined pursuant to the terms of the respective Facility at the time of borrowing.
The average amount of borrowings outstanding under the Facilities during the period ended December 31, 2009, was approximately $1,400, with a related weighted average annualized interest rate of 1.62%.
NOTE 3—Management Fee and Other Transactions With Affiliates:
(a) Pursuant to a management agreement (“Agreement”) with Dreyfus, the management fee is computed at an annual rate of .95% of the value of the fund’s average daily net assets and is payable monthly.
26
Dreyfus has contractually agreed, until September 30, 2010, to waive receipt of its fees and/or assume the expenses of the fund so that the direct expenses of Class I shares (excluding taxes, interest, brokerage commissions, commitment fees on borrowings and extraordinary expenses) do not exceed 1.20%.
Dreyfus has also agreed, until May 1, 2010, to waive receipt of its fees and/or assume the expenses of the fund so that the direct expenses of Class A and Class C shares (excluding taxes, interest, brokerage commissions, commitment fees on borrowings, shareholder services fees, Rule 12b-1 fees and extraordinary expenses) do not exceed 1.35%.
The reduction in expenses, pursuant to the undertakings, amounted to $89,308 during the period ended December 31, 2009.
Pursuant to a sub-investment advisory agreement between Dreyfus and Urdang, Dreyfus pays Urdang a monthly fee at an annual rate of .46% of the value of the fund’s average daily net assets.
During the period ended December 31, 2009, the Distributor retained $252 from commissions earned on sales of the fund’s Class A shares.
(b) Under the Distribution Plan (the “Plan”) adopted pursuant to Rule 12b-1 under the Act, Class C shares pay and Class T shares paid the Distributor for distributing their shares at an annual rate of .75% and .25%, respectively, of the value of their average daily net assets. During the period ended December 31, 2009, Class C and Class T shares were charged $118 and $1, respectively, pursuant to the Plan.
(c) Under the Shareholder Services Plan, Class A and Class C shares pay and Class T shares paid the Distributor at an annual rate of .25% of the value of their average daily net assets for the provision of certain services. The services provided may include personal services relating to shareholder accounts, such as answering shareholder inquiries regarding the fund and providing reports and other information, and services related to the maintenance of shareholder accounts. The Distributor may make payments to Service Agents (a securities dealer, financial institution or other industry professional) in respect of
The Fund 27
NOTES TO FINANCIAL STATEMENTS (continued)
these services.The Distributor determines the amounts to be paid to Service Agents. During the period ended December 31, 2009, Class A, Class C and ClassT shares were charged $212, $40, and $1, respectively, pursuant to the Shareholder Services Plan.
The fund compensates Dreyfus Transfer, Inc., a wholly-owned subsidiary of Dreyfus, under a transfer agency agreement for providing personnel and facilities to perform transfer agency services for the fund.
The fund compensates The Bank of New York Mellon under a cash management agreement for performing cash management services related to fund subscriptions and redemptions. During the period ended December 31, 2009, the fund was charged $67 pursuant to the cash management agreement, which is included in Shareholder servicing costs in the Statement of Operations. These fees were offset by earnings credits pursuant to the cash management agreement.
The fund also compensates The Bank of New York Mellon under a custody agreement for providing custodial services for the fund. During the period ended December 31, 2009, the fund was charged $89,616 pursuant to the custody agreement.
During the period ended December 31, 2009, the fund was charged $6,681 for services performed by the Chief Compliance Officer.
The components of “Due to The Dreyfus Corporation and affiliates” in the Statement of Assets and Liabilities consist of: management fees $69,803,Rule 12b-1 distribution plan fees $22,shareholder services plan fees $41, custodian fees $19,543, chief compliance officer fees $5,011 and transfer agency per account fees $134, which are offset against an expense reimbursement currently in effect in the amount of $8,672.
(d) Each Board member also serves as a Board member of other funds within the Dreyfus complex. Annual retainer fees and attendance fees are allocated to each fund based on net assets.
NOTE 4—Securities Transactions:
The aggregate amount of purchases and sales of investment securities, excluding short-term securities and forward contracts, during the
28
period ended December 31, 2009, amounted to $74,655,302 and $55,397,195, respectively.
The fund adopted the provisions of ASC Topic 815 “Derivatives and Hedging” which requires qualitative disclosures about objectives and strategies for using derivatives, quantitative disclosures about fair value amounts of gains and losses on derivative instruments and disclosures about credit-risk-related contingent features in derivative agreements. The disclosure requirements distinguish between derivatives, which are accounted for as “hedges” and those that do not qualify for hedge accounting. Because investment companies value their derivatives at fair value and recognize changes in fair value through the Statement of Operations, they do not qualify for such accounting. Accordingly, even though a fund’s investments in derivatives may represent economic hedges, they are considered to be non-hedge transactions for purposes of this disclosure.
Forward Foreign Currency Exchange Contracts: The fund may enter into forward contracts in order to hedge its exposure to changes in foreign currency exchange rates on its foreign portfolio holdings, to settle foreign currency transactions or as a part of an investment strat-egy.When executing forward contracts, the fund is obligated to buy or sell a foreign currency at a specified rate on a certain date in the future. With respect to sales of forward contracts, the fund would incur a loss if the value of the contract increases between the date the forward contract is opened and the date the forward contract is closed. The fund realizes a gain if the value of the contract decreases between those dates.With respect to purchases of forward contracts, the fund would incur a loss if the value of the contract decreases between the date the forward contract i s opened and the date the forward contract is closed. The fund realizes a gain if the value of the contract increases between those dates.The fund is exposed to foreign currency risk as a result of changes in value of underlying financial instruments.The fund is also exposed to credit risk associated with counterparty nonperformance on these forward contracts, which is typically limited to the unrealized
The Fund 29
NOTES TO FINANCIAL STATEMENTS (continued)
gain on each open contract. At December 31, 2009, there were no open forward contracts outstanding.
At December 31, 2009, the cost of investments for federal income tax purposes was $86,855,056; accordingly, accumulated net unrealized depreciation on investments was $3,124,618, consisting of $8,680,012 gross unrealized appreciation and $11,804,630 gross unrealized depreciation.
NOTE 5—New Accounting Pronouncement:
In January 2010, FASB issued Accounting Standards Update (“ASU”) No. 2010-06 “Improving Disclosures about Fair Value Measurements”. ASU 2010-06 will require reporting entities to make new disclosures about amounts and reasons for significant transfers in and out of Level 1 and Level 2 fair value measurements as well as inputs and valuation techniques used to measure fair value for both recurring and nonrecur-ring fair value measurements that fall in either Level 2 or Level 3, and information on purchases, sales, issuances and settlements on a gross basis in the reconciliation of activity in Level 3 fair value measurements.The new and revised disclosures are required to be implemented for fiscal years beginning after December 15, 2009 except for the disclosures surrounding purchases, sales, issuances and settlements on a gross basis in the reconciliation of Level 3 fair value measurements, which are effective for fiscal years beginning after December 15, 2010. Management is currently evaluating the impact the adoption of ASU No. 2010-06 may have on the fund’s financial statement disclosures.
NOTE 6—Subsequent Events Evaluation:
Dreyfus has evaluated the need for disclosures and/or adjustments resulting from subsequent events through February 25, 2010, the date the financial statements were issued. This evaluation did not result in any subsequent events that necessitated disclosures and/or adjustments.
30
REPORT OF INDEPENDENT REGISTERED
PUBLIC ACCOUNTING FIRM
Shareholders and Board of Directors
Dreyfus Global Real Estate Securities Fund
We have audited the accompanying statement of assets and liabilities, including the statement of investments, of Dreyfus Global Real Estate Securities Fund (one of the series comprising Dreyfus Premier Investment Funds, Inc.) as of December 31, 2009, and the related statement of operations for the year then ended and the statement of changes in net assets and financial highlights for each of the two years in the period then ended. These financial statements and financial highlights are the responsibility of the Fund’s management. Our responsibility is to express an opinion on these financial statements and financial highlights based on our audits. The financial highlights for the periods ended December 31, 2007 and 2006 were audited by other auditors whose report dated February 28, 2008, expressed an unqualified opinion on such financial highlights.
We conducted our audits in accordance with the standards of the Public Company Accounting Oversight Board (United States).Those standards require that we plan and perform the audit to obtain reasonable assurance about whether the financial statements and financial highlights are free of material misstatement.We were not engaged to perform an audit of the Fund’s internal control over financial reporting. Our audits included consideration of internal control over financial reporting as a basis for designing audit procedures that are appropriate in the circumstances, but not for the purpose of expressing an opinion on the effectiveness of the Fund’s internal control over financial reporting. Accordingly, we express no such opinion.An audit also includes examining,on a test basis, evidence supporting the amounts and disclosures in the financial statements and financial highlights, assessing the accounting principles used and significant estimates made by management, and evaluating the overall financial statement presentation. Our procedures included confirmation of securities owned as of December 31, 2009 by correspondence with the custodian and others.We believe that our audits provide a reasonable basis for our opinion.
In our opinion, the 2009 and 2008 financial statements and financial highlights referred to above present fairly, in all material respects, the financial position of Dreyfus Global Real Estate Securities Fund at December 31, 2009, the results of its operations for the year then ended and the changes in its net assets and the financial highlights for each of the two years in the period then ended, in conformity with U.S. generally accepted accounting principles.

| New York, New York |
| February 25, 2010 |
The Fund 31
IMPORTANT TAX INFORMATION (Unaudited)
For federal tax purposes, certain dividends paid by the fund may be subject to a maximum tax rate of 15%, as provided for by the Jobs and GrowthTax Relief Reconciliation Act of 2003. Of the distributions paid during the fiscal year, $297,769 represents the maximum amount that may be considered qualified dividend income. Shareholders will receive notification in early 2010 of the percentage applicable to the preparation of their 2009 income tax returns.
32
| INFORMATION ABOUT THE REVIEW AND APPROVAL |
| OF THE FUND’S MANAGEMENT AGREEMENT (Unaudited) |
At a meeting of the fund’s Board held on July 9, 2009, the Board considered the re-approval of the fund’s Management Agreement with Dreyfus and the Sub-Investment Advisory Agreement between Dreyfus and Urdang Securities Management, Inc. (“Urdang”) (together, the “Agreements”) for a one-year term ending July 31, 2010. The Board members, none of whom are “interested persons” (as defined in the Investment Company Act of 1940, as amended) of the fund, were assisted in their review by independent legal counsel and met with counsel in executive session separate from representatives of Dreyfus. In considering the re-approval of the Agreements, the Board considered all factors that it believed to be relevant, including, among other things, the factors discussed below.
Analysis of Nature, Extent and Quality of Services Provided to the Fund. The Board members received a presentation from representatives of Dreyfus regarding services provided to the fund and other funds in the Dreyfus fund complex, and discussed the nature, extent and quality of the services provided to the fund pursuant to the Agreements. Dreyfus’ representatives reviewed the fund’s distribution of accounts and the relationships Dreyfus has with various intermediaries and the different needs of each. Dreyfus’ representatives noted the various distribution channels for the fund as well as the diverse methods of distribution among other funds in the Dreyfus fund complex, and Dreyfus’ corresponding need for broad, deep, and diverse resources to be able to provide ongoing shareholder services to each distribution channel, including those of the fund. Dreyfus also provided the number of accounts investing in the fund, as well as the fund’s asset size.
The Board members also considered Dreyfus’ and Urdang’s research and portfolio management capabilities, the division of responsibilities between Dreyfus and Urdang, and Dreyfus’ oversight of day-to-day fund operations, including fund accounting, administration and assistance in meeting legal and regulatory requirements. The Board members also considered Dreyfus’ extensive administrative, accounting and compliance infrastructure,as well as Dreyfus’supervisory activities over Urdang. The Board also considered Dreyfus’ and Urdang’s brokerage policies and
The Fund 33
| INFORMATION ABOUT THE REVIEW AND APPROVAL OF THE |
| FUND’S MANAGEMENT AGREEMENT (Unaudited) (continued) |
practices, the standards applied in seeking best execution and Dreyfus’ and Urdang’s policies and practices regarding soft dollars.
Comparative Analysis of the Fund’s Performance and Management Fee and Expense Ratio. The Board members reviewed the fund’s performance for the one- and two-year periods ended May 31, 2009, and compared the fund’s performance to the performance of a group of comparable retail front-end load global real estate funds (the “Performance Group”) and to a larger universe of funds consisting of all retail and institutional global real estate funds (the “Performance Universe”), selected and provided by Lipper, Inc. (“Lipper”), an independent provider of investment company data.The Board was provided with a description of the methodology Lipper used to select the Performance Group and Performance Universe, as well as the Expense Group and Expense Universe (discussed below).The Board members discussed the results of the compari sons and noted that the fund’s total return performance for the one- and two-year periods ended May 31, 2009 was above the Performance Group and Performance Universe medians (in the first quartiles). Dreyfus also provided a comparison of the fund’s total returns to the returns of its benchmark index for each calendar year since inception.
The Board members also discussed the fund’s actual and contractual management fees and total expense ratio compared to a group of comparable retail front-end load global real estate funds (the “Expense Group”) and a broader group of funds consisting of all retail front-end load global real estate funds (the “Expense Universe”), each selected and provided by Lipper. The Board noted that Dreyfus has contractually agreed, until September 30, 2010, to waive receipt of its fees and/or assume the expenses of the fund so that the direct expenses of Class I shares (excluding taxes, interest, brokerage commissions, commitment fees on borrowings and extraordinary expenses) do not exceed 1.20%. In addition, the Board noted that Dreyfus has agreed, until May 30, 2010, to waive receipt of its fees and/or assume the expenses of the fund so that the direct expenses of Class A and C (excluding taxes, interest, brokerag e commissions, commitment fees on borrowings, extraordinary
34
expenses,shareholder services fees and 12b-1 fees) do not exceed 1.35%. The Board members noted that the fund’s actual management fee (after waivers) was below the Expense Group and Expense Universe medians, the fund’s contractual management fee was above the Expense Group median and the fund’s total expense ratio was at the Expense Group and Expense Universe medians.
Representatives of Dreyfus noted that there were no other mutual funds managed by Dreyfus or its affiliates with similar investment objectives, policies and strategies, and reviewed with the Board other accounts managed by Dreyfus or its affiliates with similar investment objectives, policies and strategies as the fund (the “Similar Accounts”). Dreyfus’ representatives explained the nature of the Similar Accounts and the differences, from Dreyfus’ perspective, in providing services to such Similar Accounts as compared to managing and providing services to the fund. Dreyfus’ representatives also reviewed the costs associated with distribution through intermediaries.The Board members considered the relevance of the fee information provided for the Similar Accounts to evaluate the appropriateness and reasonableness of the fund’s management fee.
The Board considered the fee to Urdang in relation to the fee paid to Dreyfus by the fund and the respective services provided by Urdang and Dreyfus.The Board also noted that Urdang’s fee is paid by Dreyfus (out of its fee from the fund) and not the fund.
Analysis of Profitability and Economies of Scale. Dreyfus’ representatives reviewed the dollar amount of expenses allocated and profit received by Dreyfus and the method used to determine such expenses and profit.The Board previously had been provided with information prepared by an independent consulting firm regarding Dreyfus’ approach to allocating costs to, and determining the profitability of, individual funds and the entire Dreyfus mutual fund complex. The Board members also had been informed that the methodology had been reviewed by an independent registered public accounting firm which, like the consultant, found the methodology to be reasonable.
The Fund 35
| INFORMATION ABOUT THE REVIEW AND APPROVAL OF THE |
| FUND’S MANAGEMENT AGREEMENT (Unaudited) (continued) |
The consulting firm also analyzed where any economies of scale might emerge in connection with the management of the fund.The Board members evaluated the profitability analysis in light of the relevant circumstances for the fund and the extent to which economies of scale would be realized if the fund grows and whether fee levels reflect these economies of scale for the benefit of fund investors.The Board members also considered potential benefits to Dreyfus from acting as investment adviser and to Urdang from acting as sub-adviser and noted the soft dollar arrangements with respect to trading the fund’s investments.
It was noted that the Board members should consider Dreyfus’ profitability with respect to the fund as part of their evaluation of whether the fees under the Agreements bear a reasonable relationship to the mix of services provided by Dreyfus, including the nature, extent and quality of such services and that a discussion of economies of scale is predicated on a fund having achieved a substantial size with increasing assets and that, if a fund’s assets had been static or decreasing, the possibility that Dreyfus may have realized any economies of scale would be less. Since Dreyfus, and not the fund, pays Urdang pursuant to the Sub-Investment Advisory Agreement, the Board did not consider Urdang’s profitability to be relevant to its deliberations. It also was noted that the profitability percentage for managing the fund was within ranges determined by appropriate court cases to be reasonable given the services rend ered and generally superior service levels provided.
At the conclusion of these discussions, the Board agreed that it had been furnished with sufficient information to make an informed business decision with respect to re-approving the Agreements. Based on the discussions and considerations as described above, the Board made the following conclusions and determinations.
The Board concluded that the nature, extent and quality of the ser- vices provided by Dreyfus and Urdang are adequate and appropriate.
The Board was satisfied with the fund’s relative performance.
The Board concluded that the fee payable to Dreyfus and Urdang were reasonable in light of the considerations described above.
36
The Board determined that the economies of scale which may accrue to Dreyfus and its affiliates in connection with the manage- ment of the fund had been adequately considered by Dreyfus in connection with the management fee rate charged to the fund and that, to the extent in the future it were determined that material economies of scale had not been shared with the fund, the Board would seek to have those economies of scale shared with the fund.
The Board members considered these conclusions and determinations, along with information received on a routine and regular basis throughout the year, and, without any one factor being dispositive, the Board determined that re-approval of the Management Agreement and Sub-Investment Advisory Agreement was in the best interests of the fund and its shareholders.
The Fund 37
BOARD MEMBERS INFORMATION (Unaudited)
38
Once elected all Board Members serve for an indefinite term, but achieve Emeritus status upon reaching age 80.The address of the Board Members and Officers is in c/o The Dreyfus Corporation, 200 Park Avenue, NewYork, NewYork 10166. Additional information about the Board Members is available in the fund’s Statement of Additional Information which can be obtained from Dreyfus free of charge by calling this toll free number: 1-800-554-4611.
Daniel Rose, Emeritus Board Member
Sander Vanocur, Emeritus Board Member
The Fund 39
OFFICERS OF THE FUND (Unaudited)
40

The Fund 41
OFFICERS OF THE FUND (Unaudited) (continued)
42
NOTES
For More Information
Telephone Call your financial representative or 1-800-554-4611
Mail The Dreyfus Family of Funds, 144 Glenn Curtiss Boulevard, Uniondale, NY 11556-0144
The fund files its complete schedule of portfolio holdings with the Securities and Exchange Commission (“SEC”) for the first and third quarters of each fiscal year on Form N-Q. The fund’s Forms N-Q are available on the SEC’s website at http://www.sec.gov and may be reviewed and copied at the SEC’s Public Reference Room in Washington, DC. Information on the operation of the Public Reference Room may be obtained by calling 1-800-SEC-0330.
A description of the policies and procedures that the fund uses to determine how to vote proxies relating to portfolio securities, and information regarding how the fund voted these proxies for the most recent 12-month period ended June 30 is available at http://www.dreyfus.com and on the SEC’s website at http://www.sec.gov. The description of the policies and procedures is also available without charge, upon request, by calling 1-800-645-6561.

| Dreyfus |
| Large Cap Equity Fund |
ANNUAL REPORT December 31, 2009
Save time. Save paper. View your next shareholder report online as soon as it’s available. Log into www.dreyfus.com and sign up for Dreyfus eCommunications. It’s simple and only takes a few minutes.
The views expressed in this report reflect those of the portfolio manager only through the end of the period covered and do not necessarily represent the views of Dreyfus or any other person in the Dreyfus organization. Any such views are subject to change at any time based upon market or other conditions and Dreyfus disclaims any responsibility to update such views.These views may not be relied on as investment advice and, because investment decisions for a Dreyfus fund are based on numerous factors, may not be relied on as an indication of trading intent on behalf of any Dreyfus fund.

Contents | |
THE FUND | |
| 2 | A Letter from the Chairman and CEO |
| 3 | Discussion of Fund Performance |
| 6 | Fund Performance |
| 8 | Understanding Your Fund’s Expenses |
| 8 | Comparing Your Fund’s Expenses With Those of Other Funds |
| 9 | Statement of Investments |
| 13 | Statement of Assets and Liabilities |
| 14 | Statement of Operations |
| 15 | Statement of Changes in Net Assets |
| 17 | Financial Highlights |
| 20 | Notes to Financial Statements |
| 32 | Report of Independent Registered Public Accounting Firm |
| 33 | Information About the Review and Approval of the Fund’s Management Agreement |
| 37 | Board Members Information |
| 39 | Officers of the Fund |
FOR MORE INFORMATION | |
Back Cover |
| Dreyfus |
| Large Cap Equity Fund |
The Fund

A LETTER FROM THE CHAIRMAN AND CEO
Dear Shareholder:
We are pleased to present this annual report for Dreyfus Large Cap Equity Fund, covering the 12-month period from January 1, 2009, through December 31, 2009.
The U.S. stock market ended 2009 with a healthy annual gain, but market indices across all capitalization ranges and investment styles remained well below the peaks reached in the fall of 2007. The equity market’s advance was driven by improving investor sentiment as the U.S. economy staged a gradual, but sustained, recovery from the recession and banking crisis that had depressed stock prices at the beginning of the year. After four consecutive quarters of contraction, the U.S. economy returned to growth during the third quarter of 2009, buoyed by greater manufacturing activity to replenish depleted inventories and satisfy export demand. The slumping housing market also showed signs of renewed life later in the year when home sales and prices rebounded modestly. However, economic headwinds remain, including a high unemployment rate and the prospect of anemic consumer spending.
As 2010 begins, our Chief Economist, as well as many securities analysts and portfolio managers have continued to find opportunities and survey potential challenges across a variety of asset classes, including equities. While no one can predict the future, we believe that the 2010 investment environment will likely require a broader range of investment considerations relative to last year. As always, your financial adviser can help you determine the mix of investments that may be best suited to helping you achieve your goals at a level of risk that is comfortable for you.
For information about how the fund performed during the reporting period, as well as market perspectives, we have provided a Discussion of Fund Performance.
Thank you for your continued confidence and support.

Jonathan R. Baum
Chairman and Chief Executive Officer
The Dreyfus Corporation
January 15, 2010
2

DISCUSSION OF FUND PERFORMANCE
For the reporting period of January 1, 2009, through December 31, 2009, as provided by Irene O’Neill, Portfolio Manager
Fund and Market Performance Overview
For the 12-month period ended December 31,2009,Dreyfus Large Cap Equity Fund’s Class A shares produced a total return of 27.62%, Class C shares returned 27.37% and Class I shares returned 29.05%.1 In comparison, the Standard and Poor’s 500 Composite Stock Price Index (“S&P 500 Index”), the fund’s benchmark, achieved a total return of 26.47%.2
In the wake of a severe recession and banking crisis, stocks rallied over much of 2009 as investors looked forward to better economic times.The fund produced higher returns than its benchmark, due primarily to our shift to a more cyclically-oriented investment posture early in the year.
The Fund’s Investment Approach
The fund seeks long-term capital appreciation.To pursue this goal, the fund normally invests at least 80% of its assets in equity securities of large-capitalization companies with market capitalizations of $5 billion or more at the time of purchase.
The fund invests primarily in large, established companies that we believe have proven track records and the potential for superior relative earnings growth. The investment process begins with a “top-down” assessment of broad economic, political and social trends and their implications for different market and industry sectors. Fundamental research is used to identify companies with the potential for above-average earnings and revenue growth; sustainable competitive advantage; strong or improving financial condition; and/or earnings power that is either unrecognized or underestimated by the market.
U.S. Stock Market Rebounded Sharply
During the early part of 2009, securities markets were still reeling from a global financial crisis and the most severe recession since the 1930s. These influences fueled a bear market that drove stocks to multi-year lows during the first quarter of the year.The decline affected a wide variety of industry groups seemingly regardless of their underlying business fundamentals.
The Fund 3
DISCUSSION OF FUND PERFORMANCE (continued)
Market sentiment began to improve in early March, as aggressive measures adopted by government and monetary authorities to repair the credit markets seemed to gain traction.Additional evidence of economic stabilization later appeared, sparking a sustained market rally through year-end. Lower-quality companies generally led the rally as investors turned to stocks that had been severely punished in the downturn. In addition, growth stocks generally outperformed their more value-oriented counterparts.
Stock Selection Strategy Drove Fund Performance
Although stocks remained depressed early in the year due to the recession and financial crisis, we began to shift from a relatively defensive investment posture to one designed to capture the potential benefits of a massive economic stimulus program and historically low short-term interest rates. We increased the fund’s exposure to more economically sensitive industry groups, including the energy and information technology sectors, which historically have fared well during global economic recoveries. We also moved the hard-hit financials sector from an underweighted position to overweighted exposure in anticipation of healthier credit markets.This change in strategy enabled the fund to participate fully in the ensuing market rebound.
Among financial companies, the fund scored successes with charge card issuer American Express, investment manager Invesco and investment bank firm Morgan Stanley, all of which benefited from recovering capital markets. Underweighted exposure to regional banks also supported the fund’s relative performance. In the energy sector, we moved the fund’s focus from integrated oil companies to independent producers and oil services providers, including Nabors Industries, Southwestern Energy, Williams Cos. and Schlumberger. We maintained relatively light exposure to industry giant Exxon Mobil and did not own ConocoPhillips, both of which underperformed sector averages.
The technology sector represented the benchmark’s top-performing segment in 2009, and the fund outperformed on the strength of secular growth investments such as electronics innovator Apple and Internet media leader Google. Both stocks more than doubled in value during the year. The fund also participated in early-cycle gains among semiconductor manufacturers Marvell Technology Group, Taiwan Semiconductor
4
Manufacturing and Broadcom. Finally, in the materials sector, mining giant Freeport McMoRan Copper & Gold was bolstered by recovering commodity prices, and industrial gasses producer Air Products & Chemicals encountered improved industrial demand.
The fund received disappointing results from consumer-related stocks. Consumer discretionary companies Yum! Brands and International Game Technology lagged due to the slowdown in consumer spending in overseas and domestic markets, respectively. Returns from the consumer staples sector were constrained by relative weakness in grocery chain Safeway and food producer Kraft Foods.
Sluggish Recovery Expected
As of the reporting period’s end, the economy appears to be gaining strength, and investors seem to be refocusing on companies with healthy finances and strong business fundamentals. However, we expect the recovery to remain relatively sluggish, suggesting that investors may favor companies with strong secular growth over those that are more leveraged to economic conditions. Indeed, we have continued to seek attractive opportunities among large-cap stocks with catalysts for secular growth, especially in the information technology sector. We have found fewer opportunities in the traditionally defensive consumer staples, telecommunications services and utilities sectors.
January 15, 2010
| Please note, the position in any security highlighted with italicized typeface was sold during the | |
| reporting period. | |
| 1 | Total return includes reinvestment of dividends and any capital gains paid, and does not take into |
| consideration the maximum initial sales charge in the case of Class A shares, or the applicable | |
| contingent deferred sales charge imposed on the redemption of Class C shares. Had these charges | |
| been reflected, returns would have been lower. Past performance is no guarantee of future results. | |
| Share price and investment return fluctuate such that upon redemption, fund shares may be worth | |
| more or less than their original cost. Return figures provided reflect the absorption of certain fund | |
| expenses by The Dreyfus Corporation pursuant to an undertaking in effect for Classes A and C | |
| through May 1, 2010, and in effect for Class I through September 30, 2010, at which time it | |
| may be extended, terminated or modified. Had these expenses not been absorbed, the fund’s | |
| returns would have been lower. | |
| 2 | SOURCE: LIPPER INC. — Reflects reinvestment of dividends and, where applicable, capital |
| gain distributions.The Standard & Poor’s 500 Composite Stock Price Index is a widely accepted, | |
| unmanaged index of U.S. stock market performance. |
The Fund 5
FUND PERFORMANCE
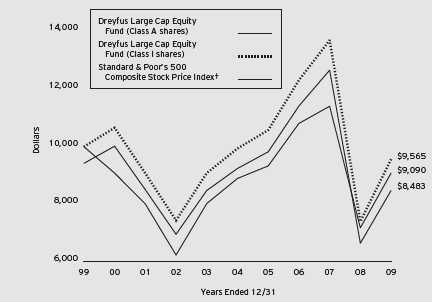
| Comparison of change in value of $10,000 investment in Dreyfus Large Cap Equity Fund Class A |
| shares and Class I shares and the Standard & Poor’s 500 Composite Stock Price Index |
| † Source: Lipper Inc. |
| Past performance is not predictive of future performance. |
| The above graph compares a $10,000 investment made in Class A and Class I shares of Dreyfus Large Cap Equity |
| Fund on 12/31/99 to a $10,000 investment made in the Standard & Poor’s 500 Composite Stock Price Index (the |
| “Index”) on that date. All dividends and capital gain distributions are reinvested. |
| The fund’s performance shown in the line graph takes into account the maximum initial sales charge on Class A |
| shares and all other applicable fees and expenses. Performance for Class C shares will vary from the performance of |
| Class A shares and Class I shares shown above due to differences in charges and expenses. The Index is a widely |
| accepted, unmanaged index of U.S. stock market performance. Unlike a mutual fund, the Index is not subject to |
| charges, fees and other expenses. Investors cannot invest directly in any index. Further information relating to fund |
| performance, including expense reimbursements, if applicable, is contained in the Financial Highlights section of the |
| prospectus and elsewhere in this report. |
6
| Average Annual Total Returns as of 12/31/09 | ||||
| Inception | ||||
| Date | 1 Year | 5 Years | 10 Years | |
| Class A shares | ||||
| with maximum sales charge (5.75%) | 8/10/92 | 20.24% | –2.88% | –1.63% |
| without sales charge | 8/10/92 | 27.62% | –1.72% | –1.05% |
| Class C shares | ||||
| with applicable redemption charge † | 9/13/08 | 26.37% | –1.19%†† | –0.78%†† |
| without redemption | 9/13/08 | 27.37% | –1.19%†† | –0.78%†† |
| Class I shares | 8/10/92 | 29.05% | –0.76% | –0.44% |
| Past performance is not predictive of future performance.The fund’s performance shown in the graph and table does not | |
| reflect the deduction of taxes that a shareholder would pay on fund distributions or the redemption of fund shares. | |
| † | The maximum contingent deferred sales charge for Class C shares is 1% for shares redeemed within one year of the |
| date of purchase. | |
| †† | The total return performance figures presented for Class C shares of the fund reflect the performance of the fund’s |
| Class A shares for periods prior to 9/13/08 (the inception date for Class C shares), adjusted to reflect the applicable | |
| sales load for that class. | |
The Fund 7
UNDERSTANDING YOUR FUND’S EXPENSES (Unaudited)
As a mutual fund investor, you pay ongoing expenses, such as management fees and other expenses. Using the information below, you can estimate how these expenses affect your investment and compare them with the expenses of other funds.You also may pay one-time transaction expenses, including sales charges (loads) and redemption fees, which are not shown in this section and would have resulted in higher total expenses. For more information, see your fund’s prospectus or talk to your financial adviser.
Review your fund’s expenses
The table below shows the expenses you would have paid on a $1,000 investment in Dreyfus Large Cap Equity Fund from July 1, 2009 to December 31, 2009. It also shows how much a $1,000 investment would be worth at the close of the period, assuming actual returns and expenses.
Expenses and Value of a $1,000 Investment
assuming actual returns for the six months ended December 31, 2009
| Class A | Class C | Class I | |
| Expenses paid per $1,000† | $ 8.41 | $ 11.30 | $ 4.32 |
| Ending value (after expenses) | $1,223.30 | $1,219.20 | $1,227.50 |
COMPARING YOUR FUND’S EXPENSES
WITH THOSE OF OTHER FUNDS (Unaudited)
Using the SEC’s method to compare expenses
The Securities and Exchange Commission (SEC) has established guidelines to help investors assess fund expenses. Per these guidelines, the table below shows your fund’s expenses based on a $1,000 investment, assuming a hypothetical 5% annualized return. You can use this information to compare the ongoing expenses (but not transaction expenses or total cost) of investing in the fund with those of other funds.All mutual fund shareholder reports will provide this information to help you make this comparison. Please note that you cannot use this information to estimate your actual ending account balance and expenses paid during the period.
Expenses and Value of a $1,000 Investment
assuming a hypothetical 5% annualized return for the six months ended December 31, 2009
| Class A | Class C | Class I | |
| Expenses paid per $1,000† | $ 7.63 | $ 10.26 | $ 3.92 |
| Ending value (after expenses) | $1,017.64 | $1,015.02 | $1,021.32 |
| † Expenses are equal to the fund’s annualized expense ratio of 1.50% for Class A, 2.02% for Class C and .77% |
| for Class I, multiplied by the average account value over the period, multiplied by 184/365 (to reflect the one-half |
| year period). |
8
| STATEMENT OF INVESTMENTS |
| December 31, 2009 |
| Common Stocks—98.8% | Shares | Value ($) |
| Consumer Discretionary—8.8% | ||
| Comcast, Cl. A | 98,470 | 1,660,204 |
| International Game Technology | 117,650 | 2,208,291 |
| Johnson Controls | 97,850 | 2,665,434 |
| Lowe’s Cos. | 103,910 | 2,430,455 |
| Target | 45,600 | 2,205,672 |
| Walt Disney | 100,450 | 3,239,512 |
| Yum! Brands | 51,670 | 1,806,900 |
| 16,216,468 | ||
| Consumer Staples—11.2% | ||
| Avon Products | 75,990 | 2,393,685 |
| Colgate-Palmolive | 27,320 | 2,244,338 |
| Costco Wholesale | 37,500 | 2,218,875 |
| Kellogg | 33,900 | 1,803,480 |
| Kraft Foods, Cl. A | 67,340 | 1,830,301 |
| PepsiCo | 50,650 | 3,079,520 |
| Philip Morris International | 47,230 | 2,276,014 |
| Procter & Gamble | 45,195 | 2,740,173 |
| Wal-Mart Stores | 41,250 | 2,204,813 |
| 20,791,199 | ||
| Energy—13.1% | ||
| Chevron | 51,200 | 3,941,888 |
| Exxon Mobil | 62,390 | 4,254,374 |
| Occidental Petroleum | 23,460 | 1,908,471 |
| Plains Exploration & Production | 98,090 a | 2,713,169 |
| Schlumberger | 54,030 | 3,516,813 |
| Southwestern Energy | 60,290 a | 2,905,978 |
| Valero Energy | 94,200 | 1,577,850 |
| Williams Cos. | 161,280 | 3,399,782 |
| 24,218,325 | ||
| Financial—14.2% | ||
| ACE | 36,330 a | 1,831,032 |
| Aflac | 53,910 | 2,493,337 |
| American Express | 62,045 | 2,514,063 |
| Citigroup | 690,400 | 2,285,224 |
The Fund 9
STATEMENT OF INVESTMENTS (continued)
| Common Stocks (continued) | Shares | Value ($) |
| Financial (continued) | ||
| Hudson City Bancorp | 123,460 | 1,695,106 |
| Invesco | 115,346 | 2,709,478 |
| JPMorgan Chase & Co. | 89,410 | 3,725,715 |
| Morgan Stanley | 64,940 | 1,922,224 |
| PNC Financial Services Group | 52,610 | 2,777,282 |
| State Street | 52,270 | 2,275,836 |
| U.S. Bancorp | 87,950 | 1,979,755 |
| 26,209,052 | ||
| Health Care—13.0% | ||
| Abbott Laboratories | 44,580 | 2,406,874 |
| Allergan | 37,300 | 2,350,273 |
| Cardinal Health | 62,280 | 2,007,907 |
| Covidien | 41,830 | 2,003,239 |
| Gilead Sciences | 48,280 a | 2,089,558 |
| Johnson & Johnson | 36,900 | 2,376,729 |
| Medtronic | 40,120 | 1,764,478 |
| Merck & Co. | 72,533 | 2,650,356 |
| Pfizer | 114,200 | 2,077,298 |
| Teva Pharmaceutical Industries, ADR | 44,530 | 2,501,695 |
| Thermo Fisher Scientific | 36,240 a | 1,728,286 |
| 23,956,693 | ||
| Industrial—10.4% | ||
| Caterpillar | 39,040 | 2,224,889 |
| Eaton | 46,950 | 2,986,959 |
| Emerson Electric | 73,450 | 3,128,970 |
| General Electric | 178,530 | 2,701,159 |
| Honeywell International | 51,870 | 2,033,304 |
| Union Pacific | 47,400 | 3,028,860 |
| United Technologies | 46,070 | 3,197,719 |
| 19,301,860 |
10
| Common Stocks (continued) | Shares | Value ($) |
| Information Technology—21.5% | ||
| Accenture, Cl. A | 52,650 | 2,184,975 |
| Apple | 27,720 a | 5,845,039 |
| Brocade Communications Systems | 198,680 a | 1,515,928 |
| Cisco Systems | 54,040 a | 1,293,717 |
| Google, Cl. A | 7,210 a | 4,470,056 |
| Hewlett-Packard | 67,230 | 3,463,017 |
| Intel | 167,980 | 3,426,792 |
| International Business Machines | 40,660 | 5,322,394 |
| Marvell Technology Group | 137,770 a | 2,858,728 |
| MasterCard, Cl. A | 9,730 | 2,490,685 |
| Microsoft | 93,270 | 2,843,802 |
| Research In Motion | 23,270 a | 1,571,656 |
| Texas Instruments | 90,730 | 2,364,424 |
| 39,651,213 | ||
| Materials—3.0% | ||
| Air Products & Chemicals | 25,000 | 2,026,500 |
| Freeport-McMoRan | ||
| Copper & Gold | 24,740 | 1,986,375 |
| Monsanto | 18,400 | 1,504,200 |
| 5,517,075 | ||
| Telecommunication Services—1.4% | ||
| AT & T | 49,880 | 1,398,136 |
| Verizon Communications | 35,900 | 1,189,367 |
| 2,587,503 | ||
| Utilities—2.2% | ||
| Questar | 42,910 | 1,783,769 |
| Sempra Energy | 41,750 | 2,337,165 |
| 4,120,934 | ||
| Total Common Stocks | ||
| (cost $175,969,806) | 182,570,322 |
The Fund 11
STATEMENT OF INVESTMENTS (continued)
| Other Investment—.5% | Shares | Value ($) |
| Registered Investment Company; | ||
| Dreyfus Institutional Preferred | ||
| Plus Money Market Fund | ||
| (cost $847,000) | 847,000 b | 847,000 |
| Total Investments (cost $176,816,806) | 99.3% | 183,417,322 |
| Cash and Receivables (Net) | .7% | 1,336,759 |
| Net Assets | 100.0% | 184,754,081 |
ADR—American Depository Receipts
| a | Non-income producing security. |
| b | Investment in affiliated money market mutual fund. |
| Portfolio Summary (Unaudited)† | |||
| Value (%) | Value (%) | ||
| Information Technology | 21.5 | Consumer Discretionary | 8.8 |
| Financial | 14.2 | Materials | 3.0 |
| Energy | 13.1 | Utilities | 2.2 |
| Health Care | 13.0 | Telecommunication Services | 1.4 |
| Consumer Staples | 11.2 | Money Market Investment | .5 |
| Industrial | 10.4 | 99.3 | |
| † Based on net assets. |
| See notes to financial statements. |
12
| STATEMENT OF ASSETS AND LIABILITIES |
| December 31, 2009 |
| Cost | Value | |
| Assets ($): | ||
| Investments in securities—See Statement of Investments: | ||
| Unaffiliated issuers | 175,969,806 | 182,570,322 |
| Affiliated issuers | 847,000 | 847,000 |
| Cash | 124,483 | |
| Receivable for investment securities sold | 1,107,395 | |
| Receivable for shares of Common Stock subscribed | 436,627 | |
| Dividends and interest receivable | 269,902 | |
| Prepaid expenses | 43,166 | |
| 185,398,895 | ||
| Liabilities ($): | ||
| Due to The Dreyfus Corporation and affiliates—Note 3(c) | 120,207 | |
| Payable for shares of Common Stock redeemed | 456,556 | |
| Accrued expenses | 68,051 | |
| 644,814 | ||
| Net Assets ($) | 184,754,081 | |
| Composition of Net Assets ($): | ||
| Paid-in capital | 253,885,169 | |
| Accumulated undistributed investment income—net | 2,335,006 | |
| Accumulated net realized gain (loss) on investments | (78,066,610) | |
| Accumulated net unrealized appreciation | ||
| (depreciation) on investments | 6,600,516 | |
| Net Assets ($) | 184,754,081 |
| Net Asset Value Per Share | |||
| Class A | Class C | Class I | |
| Net Assets ($) | 261,841 | 36,560 | 184,455,680 |
| Shares Outstanding | 28,635 | 3,889 | 19,320,603 |
| Net Asset Value Per Share ($) | 9.14 | 9.40 | 9.55 |
See notes to financial statements.
The Fund 13
| STATEMENT OF OPERATIONS |
| Year Ended December 31, 2009 |
| Investment Income ($): | |
| Income: | |
| Cash dividends (net of $6,348 foreign taxes withheld at source): | |
| Unaffiliated issuers | 3,663,820 |
| Affiliated issuers | 3,867 |
| Total Income | 3,667,687 |
| Expenses: | |
| Management fee—Note 3(a) | 1,193,304 |
| Registration fees | 91,763 |
| Professional fees | 54,284 |
| Shareholder servicing costs—Note 3(c) | 47,361 |
| Prospectus and shareholders’ reports | 24,404 |
| Custodian fees—Note 3(c) | 17,445 |
| Directors’ fees and expenses—Note 3(d) | 12,826 |
| Loan commitment fees—Note 2 | 2,092 |
| Distribution fees—Note 3(b) | 102 |
| Interest expense—Note 2 | 93 |
| Miscellaneous | 23,083 |
| Total Expenses | 1,466,757 |
| Less—reduction in expenses due to undertaking—Note 3(a) | (131,717) |
| Less—reduction in fees due to earnings credits—Note 1(b) | (2,359) |
| Net Expenses | 1,332,681 |
| Investment Income—Net | 2,335,006 |
| Realized and Unrealized Gain (Loss) on Investments—Note 4 ($): | |
| Net realized gain (loss) on investments | (32,097,353) |
| Net realized gain (loss) on options transactions | 12,599 |
| Net realized gain (loss) on financial futures | (764,210) |
| Net Realized Gain (Loss) | (32,848,964) |
| Net unrealized appreciation (depreciation) on investments | 68,408,414 |
| Net Realized and Unrealized Gain (Loss) on Investments | 35,559,450 |
| Net Increase in Net Assets Resulting from Operations | 37,894,456 |
See notes to financial statements.
14
STATEMENT OF CHANGES IN NET ASSETS
| Year Ended December 31, | ||
| 2009a | 2008b,c | |
| Operations ($): | ||
| Investment income—net | 2,335,006 | 4,583,440 |
| Net realized gain (loss) on investments | (32,848,964) | (45,098,196) |
| Net unrealized appreciation | ||
| (depreciation) on investments | 68,408,414 | (148,473,373) |
| Net Increase (Decrease) in Net Assets | ||
| Resulting from Operations | 37,894,456 | (188,988,129) |
| Dividends to Shareholders from ($): | ||
| Investment income—net: | ||
| Class A Shares | — | (165,423) |
| Class I Shares | — | (3,036,281) |
| Net realized gain on investments: | ||
| Class A Shares | — | (1,010,825) |
| Class I Shares | — | (14,820,734) |
| Return of Capital: | ||
| Class A Shares | — | (211,405) |
| Class I Shares | — | (3,099,625) |
| Total Dividends | — | (22,344,293) |
| Capital Stock Transactions ($): | ||
| Net proceeds from shares sold: | ||
| Class A Shares | 43,662 | 760,408 |
| Class C Shares | 26,470 | 10,000 |
| Class I Shares | 31,165,090 | 274,286,932 |
| Class T Shares | — | 10,000 |
| Dividends reinvested: | ||
| Class A Shares | — | 1,310,915 |
| Class I Shares | — | 18,400,380 |
| Cost of shares redeemed: | ||
| Class A Shares | (5,891) | (21,373,546) |
| Class I Shares | (88,597,716) | (286,231,457) |
| Class T Shares | (6,163) | — |
| Increase (Decrease) in Net Assets | ||
| from Capital Stock Transactions | (57,374,548) | (12,826,368) |
| Total Increase (Decrease) in Net Assets | (19,480,092) | (224,158,790) |
| Net Assets ($): | ||
| Beginning of Period | 204,234,173 | 428,392,963 |
| End of Period | 184,754,081 | 204,234,173 |
| Undistributed investment income—net | 2,335,006 | — |
The Fund 15
STATEMENT OF CHANGES IN NET ASSETS (continued)
| Year Ended December 31, | ||
| 2009a | 2008b,c | |
| Capital Share Transactions: | ||
| Class Ad | ||
| Shares sold | 5,669 | 70,535 |
| Shares issued for dividends reinvested | — | 118,080 |
| Shares redeemed | (724) | (2,039,111) |
| Net Increase (Decrease) in Shares Outstanding | 4,945 | (1,850,496) |
| Class C | ||
| Shares sold | 2,984 | 905 |
| Class I | ||
| Shares sold | 3,984,033 | 22,840,412 |
| Shares issued for dividends reinvested | — | 1,662,506 |
| Shares redeemed | (12,243,969) | (24,274,378) |
| Net Increase (Decrease) in Shares Outstanding | (8,259,936) | 228,540 |
| Class Td | ||
| Shares sold | — | 905 |
| Shares redeemed | (905) | — |
| Net Increase (Decrease) in Shares Outstanding | (905) | 905 |
| a Effective as of the close of business on February 4, 2009, the fund no longer offers Class T shares. |
| b The fund commenced offering four classes of shares on the close of business September 12, 2008.The existing shares |
| were redesignated and the fund added Class C and Class T shares. |
| c Represents information for the fund’s predecessor, BNY Hamilton Large Cap Equity Fund, through |
| September 12, 2008. |
| d On the close of business on February 4, 2009, 905 Class T shares representing $6,163 were |
| converted to 912 Class A shares. |
See notes to financial statements.
16
FINANCIAL HIGHLIGHTS
Please note that the financial highlights information in the following tables for the fund’s Class A and Class I shares represents the financial highlights of the Class A and Institutional shares, respectively of the fund’s predecessor, BNY Hamilton Large Cap Equity Fund (“Hamilton Large Cap Equity Fund”), before the fund commenced operations as of the close of business on September 12, 2008, and represents the performance of the fund’s Class A and Class I shares thereafter. Before the fund commenced operations, all of the assets of the Hamilton Large Cap Equity Fund were transferred to the fund in exchange for Class A and Class I shares of the fund in a tax-free reorganization.Total return shows how much your investment in the fund would have increased (or decreased) during each period, assuming you had reinvested all dividends and distributions.These figures have been derived from the fund’s and the fund’s predecessor’s financial statements.
| Year Ended December 31, | |||||
| Class A Shares† | 2009 | 2008 | 2007 | 2006 | 2005 |
| Per Share Data ($): | |||||
| Net asset value, beginning of period | 7.16 | 14.61 | 14.42 | 13.35 | 13.22 |
| Investment Operations: | |||||
| Investment income—neta | .05 | .12 | .10 | .10 | .10 |
| Net realized and unrealized | |||||
| gain (loss) on investments | 1.93 | (6.80) | 1.48 | 2.03 | .73 |
| Total from Investment Operations | 1.98 | (6.68) | 1.58 | 2.13 | .83 |
| Distributions: | |||||
| Dividends from investment income—net | — | (.09) | (.10) | (.08) | (.15) |
| Dividends from net realized | |||||
| gain on investments | — | (.56) | (1.29) | (.98) | (.55) |
| Return of capital | — | (.12) | — | — | — |
| Total Distributions | — | (.77) | (1.39) | (1.06) | (.70) |
| Net asset value, end of period | 9.14 | 7.16 | 14.61 | 14.42 | 13.35 |
| Total Return (%)b | 27.62 | (47.50) | 10.94 | 16.11 | 6.25 |
| Ratios/Supplemental Data (%): | |||||
| Ratio of total expenses | |||||
| to average net assets | 3.75 | 1.11 | 1.04 | 1.03 | 1.04 |
| Ratio of net expenses | |||||
| to average net assets | 1.50 | 1.03 | 1.04 | 1.03 | 1.04 |
| Ratio of net investment income | |||||
| to average net assets | .61 | .99 | .69 | .69 | .75 |
| Portfolio Turnover Rate | 59.68 | 77 | 66 | 53 | 52 |
| Net Assets, end of period ($ x 1,000) | 262 | 170 | 27,391 | 28,389 | 28,980 |
| † Represents information for Class A shares of the fund’s predecessor, BNY Hamilton Large Cap Equity Fund, |
| through September 12, 2008. |
| a Based on average shares outstanding at each month end. |
| b Exclusive of sales charge. |
See notes to financial statements.
The Fund 17
FINANCIAL HIGHLIGHTS (continued)
| Year Ended December 31, | ||
| Class C Shares | 2009 | 2008a |
| Per Share Data ($): | ||
| Net asset value, beginning of period | 7.38 | 11.05 |
| Investment Operations: | ||
| Investment income (loss)—netb | (.00)c | .02 |
| Net realized and unrealized | ||
| gain (loss) on investments | 2.02 | (3.69) |
| Total from Investment Operations | 2.02 | (3.67) |
| Net asset value, end of period | 9.40 | 7.38 |
| Total Return (%)d | 27.37 | (33.21)e |
| Ratios/Supplemental Data (%): | ||
| Ratio of total expenses to average net assets | 2.26 | 1.88f |
| Ratio of net expenses to average net assets | 2.02 | 1.86f |
| Ratio of net investment income | ||
| (loss) to average net assets | (.02) | .85f |
| Portfolio Turnover Rate | 59.68 | 77 |
| Net Assets, end of period ($ x 1,000) | 37 | 7 |
| a | From September 13, 2008 (commencement of initial offering) to December 31, 2008. |
| b | Based on average shares outstanding at each month end. |
| c | Amount represents less than $.01 per share. |
| d | Exclusive of sales charge. |
| e | Not annualized. |
| f | Annualized. |
See notes to financial statements.
18
| Year Ended December 31, | |||||
| Class I Shares† | 2009 | 2008 | 2007 | 2006 | 2005 |
| Per Share Data ($): | |||||
| Net asset value, beginning of period | 7.40 | 14.66 | 14.46 | 13.38 | 13.26 |
| Investment Operations: | |||||
| Investment income—neta | .11 | .16 | .14 | .13 | .13 |
| Net realized and unrealized | |||||
| gain (loss) on investments | 2.04 | (6.63) | 1.49 | 2.05 | .72 |
| Total from Investment Operations | 2.15 | (6.47) | 1.63 | 2.18 | .85 |
| Distributions: | |||||
| Dividends from investment income—net | — | (.11) | (.14) | (.12) | (.18) |
| Dividends from net realized | |||||
| gain on investments | — | (.56) | (1.29) | (.98) | (.55) |
| Return of capital | — | (.12) | — | — | — |
| Total Distributions | — | (.79) | (1.43) | (1.10) | (.73) |
| Net asset value, end of period | 9.55 | 7.40 | 14.66 | 14.46 | 13.38 |
| Total Return (%) | 29.05 | (45.91) | 11.27 | 16.43 | 6.42 |
| Ratios/Supplemental Data (%): | |||||
| Ratio of total expenses | |||||
| to average net assets | .86 | .80 | .79 | .78 | .79 |
| Ratio of net expenses | |||||
| to average net assets | .78 | .79 | .79 | .78 | .79 |
| Ratio of net investment income | |||||
| to average net assets | 1.37 | 1.41 | .94 | .93 | .99 |
| Portfolio Turnover Rate | 59.68 | 77 | 66 | 53 | 52 |
| Net Assets, end of period ($ x 1,000) | 184,456 | 204,051 | 401,002 | 385,132 | 360,168 |
| † Represents information for Institutional shares of the fund’s predecessor, BNY Hamilton Large Cap Equity Fund, |
| through September 12, 2008. |
| a Based on average shares outstanding at each month end. |
See notes to financial statements.
The Fund 19
NOTES TO FINANCIAL STATEMENTS
NOTE 1—Significant Accounting Policies:
Dreyfus Large Cap Equity Fund (the “fund”) is a separate diversified series of Dreyfus Premier Investment Funds, Inc. (the “Company”), which is registered under the Investment Company Act of 1940, as amended (the “Act”), as an open-end management investment company and operates as a series company currently offering ten series, including the fund.The fund’s investment objective is long-term capital apprecia-tion.The Dreyfus Corporation (the “Manager” or “Dreyfus”), a wholly-owned subsidiary of The Bank of New York Mellon Corporation (“BNY Mellon”), serves as the fund’s investment adviser.
MBSC Securities Corporation (the “Distributor”), a wholly-owned subsidiary of the Manager, is the distributor of the fund’s shares. The fund is authorized to issue 250 million shares of $.001 par value Common Stock.The fund currently offers three classes of shares: Class A (100 million shares authorized), Class C (50 million shares authorized) and Class I (100 million shares authorized). Class A shares are subject to a sales charge imposed at the time of purchase. Class C shares are subject to a contingent deferred sales charge (“CDSC”) imposed on Class C shares redeemed within one year of purchase and Class I shares are sold at net asset value per share only to institutional investors. Other differences between the classes include the services offered to and the expenses borne by each class, the allocation of certain transfer agency costs and certain voting rights. Income, expenses (other than expenses attributable to a specific class), and realized and unrealized gains or losses on investments are allocated to each class of shares based on its relative net assets.
Effective December 3, 2008, investments for new accounts were no longer permitted in ClassT shares of the fund, except that participants in certain group retirement plans were able to open a new account in Class T shares of the fund, provided that the fund was established as an investment option under the plans before December 3, 2008. On February 4, 2009, the fund issued to each holder of its Class T shares, in exchange for said shares, Class A shares of the fund having an aggregate net asset value equal to the aggregate net asset value of the
20
shareholder’s Class T shares. Subsequent investments in the fund’s Class A shares made by prior holders of the fund’s Class T shares who received Class A shares of the fund in exchange for their ClassT shares are subject to the front-end sales load schedule that was in effect for Class T shares at the time of the exchange. Otherwise, all other Class A share attributes will be in effect. Effective as of the close of business on February 4, 2009, the fund no longer offers Class T shares.
As of December 31, 2009, MBC Investments Corp., an indirect subsidiary of BNY Mellon, held 1,842 Class A and 905 Class C shares of the fund.
The Company accounts separately for the assets, liabilities and operations of each series. Expenses directly attributable to each series are charged to that series’ operations; expenses which are applicable to all series are allocated among them on a pro rata basis.
The Financial Accounting Standards Board (“FASB”) Accounting Standards Codification (“ASC”) has become the exclusive reference of authoritative U.S. generally accepted accounting principles (“GAAP”) recognized by the FASB to be applied by nongovernmental entities. Rules and interpretive releases of the Securities and Exchange Commission (“SEC”) under authority of federal laws are also sources of authoritative GAAP for SEC registrants. The ASC has superseded all existing non-SEC accounting and reporting standards. The fund’s financial statements are prepared in accordance with GAAP, which may require the use of management estimates and assumptions.Actual results could differ from those estimates.
The Company enters into contracts that contain a variety of indemnifications. The fund’s maximum exposure under these arrangements is unknown.The fund does not anticipate recognizing any loss related to these arrangements.
(a) Portfolio valuation: Investments in securities are valued at the last sales price on the securities exchange or national securities market on which such securities are primarily traded. Securities listed on the
The Fund 21
NOTES TO FINANCIAL STATEMENTS (continued)
National Market System for which market quotations are available are valued at the official closing price or, if there is no official closing price that day, at the last sales price. Securities not listed on an exchange or the national securities market, or securities for which there were no transactions, are valued at the average of the most recent bid and asked prices, except for open short positions, where the asked price is used for valuation purposes. Bid price is used when no asked price is available. Registered investment companies that are not traded on an exchange are valued at their net asset value.When market quotations or official closing prices are not readily available, or are determined not to reflect accurately fair value, such as when the value of a security has been significantly affected by events after the close of the exchange or market on which the security is principally traded (for example, a foreign exc hange or market), but before the fund calculates its net asset value, the fund may value these investments at fair value as determined in accordance with the procedures approved by the Board of Directors. Fair valuing of securities may be determined with the assistance of a pricing service using calculations based on indices of domestic securities and other appropriate indicators, such as prices of relevant ADRs and futures contracts. For other securities that are fair valued by the Board of Directors, certain factors may be considered such as: fundamental analytical data, the nature and duration of restrictions on disposition, an evaluation of the forces that influence the market in which the securities are purchased and sold, and public trading in similar securities of the issuer or comparable issuers. Financial futures and options, which are traded on an exchange, are valued at the last sales price on the securities exchange on which such securities are primarily traded or at the last sales price on the n ational securities market on each business day. Options traded over-the-counter are valued at the mean between the bid and asked price.
The fair value of a financial instrument is the amount that would be received to sell an asset or paid to transfer a liability in an orderly transaction between market participants at the measurement date (i.e. the exit price). GAAP establishes a fair value hierarchy that prioritizes the inputs of valuation techniques used to measure fair value.This hierar-
22
chy gives the highest priority to unadjusted quoted prices in active markets for identical assets or liabilities (Level 1 measurements) and the lowest priority to unobservable inputs (Level 3 measurements).
Additionally, GAAP provides guidance on determining whether the volume and activity in a market has decreased significantly and whether such a decrease in activity results in transactions that are not orderly. GAAP requires enhanced disclosures around valuation inputs and techniques used during annual and interim periods.
Various inputs are used in determining the value of the fund’s investments relating to fair value measurements.These inputs are summarized in the three broad levels listed below:
Level 1—unadjusted quoted prices in active markets for
identical investments.
Level 2—other significant observable inputs (including quoted
prices for similar investments, interest rates, prepayment speeds,
credit risk, etc.).
Level 3—significant unobservable inputs (including the fund’s own
assumptions in determining the fair value of investments).
The inputs or methodology used for valuing securities are not necessarily an indication of the risk associated with investing in those securities.
The following is a summary of the inputs used as of December 31, 2009 in valuing the fund’s investments:
| Level 2—Other | Level 3— | |||
| Level 1— | Significant | Significant | ||
| Unadjusted | Observable | Unobservable | ||
| Quoted Prices | Inputs | Inputs | Total | |
| Assets ($) | ||||
| Investments in Securities: | ||||
| Equity Securities— | ||||
| Domestic† | 178,496,971 | — | — | 178,496,971 |
| Equity Securities— | ||||
| Foreign† | 4,073,351 | — | — | 4,073,351 |
| Mutual Funds | 847,000 | — | — | 847,000 |
| † | See Statement of Investments for industry classification. |
The Fund 23
NOTES TO FINANCIAL STATEMENTS (continued)
(b) Securities transactions and investment income: Securities transactions are recorded on a trade date basis. Realized gains and losses from securities transactions are recorded on the identified cost basis. Dividend income is recognized on the ex-dividend date and interest income, including, where applicable, accretion of discount and amortization of premium on investments, is recognized on the accrual basis.
The fund has arrangements with the custodian and cash management bank whereby the fund may receive earnings credits when positive cash balances are maintained, which are used to offset custody and cash management fees. For financial reporting purposes, the fund includes net earnings credits as an expense offset in the Statement of Operations.
(c) Affiliated issuers: Investments in other investment companies advised by the Manager are defined as “affiliated” in the Act.
(d) Dividends to shareholders: Dividends are recorded on the ex-dividend date. Dividends from investment income-net and dividends from net realized capital gains, if any, are normally declared and paid annually, but the fund may make distributions on a more frequent basis to comply with the distribution requirements of the Internal Revenue Code of 1986, as amended (the “Code”).To the extent that net realized capital gains can be offset by capital loss carryovers, it is the policy of the fund not to distribute such gains. Income and capital gain distributions are determined in accordance with income tax regulations, which may differ from GAAP.
(e) Federal income taxes: It is the policy of the fund to continue to qualify as a regulated investment company, if such qualification is in the best interests of its shareholders, by complying with the applicable provisions of the Code, and to make distributions of taxable income sufficient to relieve it from substantially all federal income and excise taxes.
As of and during the period ended December 31, 2009, the fund did not have any liabilities for any uncertain tax positions.The fund recognizes interest and penalties, if any, related to uncertain tax positions as income tax expense in the Statement of Operations. During the period, the fund did not incur any interest or penalties.
24
Each of the tax years in the four-year period ended December 31, 2009 remains subject to examination by the Internal Revenue Service and state taxing authorities.
At December 31, 2009, the components of accumulated earnings on a tax basis were as follows: undistributed ordinary income $2,335,006, accumulated capital losses $76,774,141 and unrealized appreciation $6,226,881. In addition, the fund had $918,834 of capital losses realized after October 31, 2009, which were deferred for tax purposes to the first day of the following fiscal year.
The accumulated capital loss carryover is available for federal income tax purposes to be applied against future net securities profits, if any, realized subsequent to December 31, 2009. If not applied, $6,041,050 of the carryover expires in fiscal 2016 and $70,733,091 expires in fiscal 2017.
The tax character of distributions paid to shareholders during the fiscal periods ended December 31, 2009 and December 31, 2008 were as follows: ordinary income $0 and $4,819,925, long-term capital gains $0 and $14,213,338 and return of capital $0 and $3,311,030, respectively.
NOTE 2—Bank Lines of Credit:
The fund participates with other Dreyfus-managed funds in a $225 million unsecured credit facility led by Citibank, N.A. and a $300 million unsecured credit facility provided by The Bank of New York Mellon, a subsidiary of BNY Mellon and an affiliate of Dreyfus (each, a “Facility”), each to be utilized primarily for temporary or emergency purposes, including the financing of redemptions. In connection therewith, the fund has agreed to pay its pro rata portion of commitment fees for each Facility. Interest is charged to the fund based on rates determined pursuant to the terms of the respective Facility at the time of borrowing.
The average amount of borrowings outstanding under the Facilities during the period ended December 31, 2009, was approximately $6,300 with a related weighted average annualized interest rate of 1.49%.
The Fund 25
NOTES TO FINANCIAL STATEMENTS (continued)
NOTE 3—Management Fee and Other Transactions With Affiliates:
(a) Pursuant to a management agreement with the Manager, the management fee is computed at an annual rate of .70% of the value of the fund’s average daily net assets and is payable monthly.
The Manager has contractually agreed, until September 30, 2010, to waive receipt of its fees and/or assume the expenses of the fund so that the direct expenses of Class I shares (excluding taxes, interest, brokerage commissions, commitment fees on borrowings and extraordinary expenses) do not exceed .79%.
In addition, the Manager has agreed, until May 1, 2010, to waive receipt of its fees and/or assume the expenses of the fund so that the direct expenses of Class A and Class C shares (excluding taxes, interest, brokerage commissions, commitment fees on borrowings, extraordinary expenses, shareholder services fees and Rule 12b-1 fees) do not exceed 1.25%.
The reduction in expenses, pursuant to the undertakings, amounted to $131,717 during the period ended December 31, 2009.
During the period ended December 31, 2009, the Distributor retained $113 from commissions earned on sales of the fund’s Class A shares and $5 from CDSCs on redemptions of the fund’s Class C shares, respectively.
(b) Under the Distribution Plan (the “Plan”) adopted pursuant to Rule 12b-1 under the Act, Class C shares pay and Class T shares paid the Distributor for distributing their shares at an annual rate of .75% and .25% of the value of their respective average daily net assets. During the period ended December 31, 2009, Class C and Class T shares were charged $100 and $2, respectively, pursuant to the Plan.
(c) Under the Shareholder Services Plan, Class A and Class C shares pay and Class T shares paid the Distributor at an annual rate of .25% of the value of their average daily net assets for the provision of certain ser-
26
vices. The services provided may include personal services relating to shareholder accounts, such as answering shareholder inquiries regarding the fund and providing reports and other information, and services related to the maintenance of shareholder accounts. The Distributor may make payments to Service Agents (a securities dealer, financial institution or other industry professional) in respect of these services. The Distributor determines the amounts to be paid to Service Agents. During the period ended December 31, 2009, Class A, Class C and Class T shares were charged $509, $33, and $2, respectively, pursuant to the Shareholder Services Plan.
The fund compensates DreyfusTransfer, Inc., a wholly-owned subsidiary of the Manager, under a transfer agency agreement for providing personnel and facilities to perform transfer agency services for the fund. During the period ended December 31, 2009, the fund was charged $12,710 pursuant to the transfer agency agreement, which is included in Shareholder servicing costs in the Statement of Operations.
The fund compensates The Bank of New York Mellon under a cash management agreement for performing cash management services related to fund subscriptions and redemptions. During the period ended December 31, 2009, the fund was charged $2,359 pursuant to the cash management agreement, which is included in Shareholder servicing costs in the Statement of Operations.These fees were offset by earnings credits pursuant to the cash management agreement.
The fund also compensates The Bank of New York Mellon under a custody agreement for providing custodial services for the fund. During the period ended December 31, 2009, the fund was charged $17,445 pursuant to the custody agreement.
During the period ended December 31, 2009, the fund was charged $6,681 for services performed by the Chief Compliance Officer.
The Fund 27
NOTES TO FINANCIAL STATEMENTS (continued)
The components of “Due to The Dreyfus Corporation and affiliates” in the Statement of Assets and Liabilities consist of: management fees $109,230, Rule 12b-1 distribution plan fees $23, shareholder services plan fees $62, custodian fees $3,521, chief compliance officer fees $5,011 and transfer agency per account fees $2,497, which are offset against an expense reimbursement currently in effect in the amount of $137.
(d) Each Board member also serves as a Board member of other funds within the Dreyfus complex. Annual retainer fees and attendance fees are allocated to each fund based on net assets.
NOTE 4—Securities Transactions:
The aggregate amount of purchases and sales of investment securities, excluding short-term securities, options transactions and financial futures, during the period ended December 31, 2009, amounted to $98,997,544 and $152,107,155, respectively.
The fund adopted the provisions of ASC Topic 815 “Derivatives and Hedging” which requires qualitative disclosures about objectives and strategies for using derivatives, quantitative disclosures about fair value amounts of gains and losses on derivative instruments and disclosures about credit-risk-related contingent features in derivative agreements. The disclosure requirements distinguish between derivatives, which are accounted for as “hedges” and those that do not qualify for hedge accounting. Because investment companies value their derivatives at fair value and recognize changes in fair value through the Statement of Operations, they do not qualify for such accounting. Accordingly, even though a fund’s investments in derivatives may represent economic hedges, they are considered to be non-hedge transactions for purposes of this disclosure.
Futures Contracts: In the normal course of pursuing its investment objective, the fund is exposed to market risk, including equity price risk, as a result of changes in value of underlying financial instruments.The fund may invest in financial futures contracts in order to manage its
28
exposure to or protect against changes in the market.A futures contract represents a commitment for the future purchase or a sale of an asset at a specified date. Upon entering into such contracts, these investments require initial margin deposits with a broker, which consist of cash or cash equivalents. The amount of these deposits is determined by the exchange or Board of Trade on which the contract is traded and is subject to change. Accordingly, variation margin payments are received or made to reflect daily unrealized gains or losses which are recorded in the Statement of Operations. Futures contracts are valued daily at the last sales price established by the Board of Trade or exchange upon which they are traded. When the contracts are closed, the fund recognizes a realized gain or loss. There is minimal counterparty credit risk to the fund with futures, since futures are exchange traded and the exchange’s clearingho use, as counterparty to all exchange traded futures, guarantees the futures against default.At December 31, 2009, there were no financial futures contracts outstanding.
Options: A call option gives the purchaser of the option the right (but not the obligation) to buy, and obligates the writer to sell, the underlying security or securities at the exercise price at any time during the option period, or at a specified date. Conversely, a put option gives the purchaser of the option the right (but not the obligation) to sell, and obligates the writer to buy the underlying security or securities at the exercise price at any time during the option period, or at a specified date.The fund may purchase and write (sell) put and call options primarily to hedge against changes in security prices, securities that the fund intends to purchase, or against fluctuations in value caused by changes in prevailing market interest rates or other market conditions.
As a writer of call options, the fund receives a premium at the outset and then bears the market risk of unfavorable changes in the price of the financial instrument underlying the option. Generally, the fund would realize a gain, to the extent of the premium, if the price of the underlying financial instrument decreases between the date the option
The Fund 29
NOTES TO FINANCIAL STATEMENTS (continued)
is written and the date on which the option is terminated. Generally, the fund would incur a loss, if the price of the financial instrument increases between those dates.
As a writer of put options, the fund receives a premium at the outset and then bears the market risk of unfavorable changes in the price of the financial instrument underlying the option. Generally, the fund would realize a gain, to the extent of the premium, if the price of the underlying financial instrument increases between the date the option is written and the date on which the option is terminated. Generally, the fund would incur a loss, if the price of the financial instrument decreases between those dates. As a writer of an option, the fund may have no control over whether the underlying securities may be sold (call) or purchased (put) and as a result bears the market risk of an unfavorable change in the price of the security underlying the written option. One risk of holding a put or a call option is that if the option is not sold or exercised prior to its expiration, it becomes worthless. However, this risk is limite d to the premium paid by the fund. Upon the expiration or closing of the option transaction, a gain or loss is reported in the Statement of Operations.
The following summarizes the fund’s call/put options written for the period ended December 31, 2009:
| Options Terminated | ||||
| Number of | Premiums | Net Realized | ||
| Options Written: | Contracts | Received ($) | Cost ($) Gain (Loss) ($) | |
| Contracts outstanding | ||||
| 12/31/2008 | — | — | ||
| Contracts written | 150 | 18,899 | ||
| Contracts terminated: | ||||
| Closed | 150 | 18,899 | 6,300 | 12,599 |
| Contracts Outstanding | ||||
| 12/31/2009 | — | — | ||
30
At December 31, 2009, the cost of investments for federal income tax purposes was $177,190,441; accordingly, accumulated net unrealized appreciation on investments was $6,226,881, consisting of $20,470,901 gross unrealized appreciation and $14,244,020 gross unrealized depreciation.
NOTE 5—New Accounting Pronouncement:
In January 2010, FASB issued Accounting Standards Update (“ASU”) No. 2010-06 “Improving Disclosures about Fair Value Measurements”. ASU 2010-06 will require reporting entities to make new disclosures about amounts and reasons for significant transfers in and out of Level 1 and Level 2 fair value measurements as well as inputs and valuation techniques used to measure fair value for both recurring and nonrecur-ring fair value measurements that fall in either Level 2 or Level 3, and information on purchases, sales, issuances and settlements on a gross basis in the reconciliation of activity in Level 3 fair value measurements.The new and revised disclosures are required to be implemented for fiscal years beginning after December 15, 2009 except for the disclosures surrounding purchases, sales, issuances and settlements on a gross basis in the reconciliation of Level 3 fair value measurements, which are effective for fiscal years beginning after December 15, 2010. Management is currently evaluating the impact the adoption of ASU No. 2010-06 may have on the fund’s financial statement disclosures.
NOTE 6—Subsequent Events Evaluation:
Dreyfus has evaluated the need for disclosures and/or adjustments resulting from subsequent events through February 25, 2010, the date the financial statements were issued. This evaluation did not result in any subsequent events that necessitated disclosures and/or adjustments.
The Fund 31
REPORT OF INDEPENDENT REGISTERED
PUBLIC ACCOUNTING FIRM
Shareholders and Board of Directors
Dreyfus Large Cap Equity Fund
We have audited the accompanying statement of assets and liabilities, including the statement of investments, of Dreyfus Large Cap Equity Fund (one of the series comprising Dreyfus Premier Investment Funds, Inc.) as of December 31, 2009, and the related statement of operations for the year then ended and the statement of changes in net assets and financial highlights for each of the two years in the period then ended. These financial statements and financial highlights are the responsibility of the Fund’s management. Our responsibility is to express an opinion on these financial statements and financial highlights based on our audits.The financial highlights for each of the years ended December 31, 2007, 2006 and 2005 were audited by other auditors whose report dated February 28, 2008, expressed an unqualified opinion on such financial highlights.
We conducted our audits in accordance with the standards of the Public Company Accounting Oversight Board (United States).Those standards require that we plan and perform the audit to obtain reasonable assurance about whether the financial statements and financial highlights are free of material misstatement.We were not engaged to perform an audit of the Fund’s internal control over financial reporting. Our audits included consideration of internal control over financial reporting as a basis for designing audit procedures that are appropriate in the circumstances, but not for the purpose of expressing an opinion on the effectiveness of the Fund’s internal control over financial reporting. Accordingly, we express no such opinion. An audit also includes examining, on a test basis, evidence supporting the amounts and disclosures in the financial statements and financial highlights, assessing the accounting principles use d and significant estimates made by management, and evaluating the overall financial statement presentation. Our procedures included confirmation of securities owned as of December 31, 2009 by correspondence with the custodian and others.We believe that our audits provide a reasonable basis for our opinion.
In our opinion, the 2009 and 2008 financial statements and financial highlights referred to above present fairly, in all material respects, the financial position of Dreyfus Large Cap Equity Fund at December 31, 2009, the results of its operations for the year then ended and the changes in its net assets and the financial highlights for each of the two years in the period then ended, in conformity with U.S. generally accepted accounting principles.

New York, New York
February 25, 2010
32
| INFORMATION ABOUT THE REVIEW AND APPROVAL |
| OF THE FUND’S MANAGEMENT AGREEMENT (Unaudited) |
At a meeting of the fund’s Board held on December 10, 2009, the Board approved the fund’s Management Agreement with Dreyfus for a six-month term ending July 31, 2010. At a previous meeting of the fund’s Board held on July 9, 2009, the Board approved the fund’s Management Agreement with Dreyfus for a six-month term ending January 31, 2010.The Board members, none of whom are “interested persons” (as defined in the Investment Company Act of 1940, as amended) of the fund, were assisted in their review by independent legal counsel and met with counsel in executive session separate from representatives of Dreyfus. In approving the Management Agreement, the Board considered all factors that it believed to be relevant, including, among other things, the factors discussed below.
Analysis of Nature, Extent and Quality of Services Provided to the Fund. The Board members received a presentation from representatives of Dreyfus regarding services provided to the fund and other funds in the Dreyfus fund complex, and discussed the nature, extent and quality of the services provided to the fund pursuant to its Management Agreement. Dreyfus’ representatives reviewed the fund’s distribution of accounts and the relationships Dreyfus has with various intermediaries and the different needs of each. Dreyfus’ representatives noted the various distribution channels for the fund as well as the diverse methods of distribution among other funds in the Dreyfus fund complex, and Dreyfus’ corresponding need for broad, deep, and diverse resources to be able to provide ongoing shareholder services to each distribution channel, including th ose of the fund. Dreyfus also provided the number of accounts investing in the fund, as well as the fund’s asset size.
The Board members also considered Dreyfus’ research and portfolio management capabilities and Dreyfus’ oversight of day-to-day fund operations, including fund accounting, administration and assistance in meeting legal and regulatory requirements. The Board members also considered Dreyfus’ extensive administrative, accounting and compliance infrastructure.The Board also considered Dreyfus’ brokerage policies and practices, the standards applied in seeking best execution and Dreyfus’ policies and practices regarding soft dollars.
Comparative Analysis of the Fund’s Performance and Management Fee and Expense Ratio. The Board members reviewed the fund’s performance for various periods and compared the fund’s performance to the
The Fund 33
| INFORMATION ABOUT THE REVIEW AND APPROVAL OF THE |
| FUND’S MANAGEMENT AGREEMENT (Unaudited) (continued) |
performance of a group of comparable retail front-end load large-cap core funds (the “Performance Group”) and to a larger universe of funds consisting of all retail and institutional large-cap core funds (the “Performance Universe”), selected and provided by Lipper, Inc. (“Lipper”), an independent provider of investment company data.The Board was provided with a description of the methodology Lipper used to select the Performance Group and Performance Universe, as well as the Expense Group and Expense Universe (discussed below). The Board members discussed the results of the comparisons and noted that the fund’s total return was below the Performance Group and Performance Universe medians for all periods.The Board noted, however, that the Fund outperformed the S&P 500 Index for three out of the last four calendar years, and that the fund’s performance was in the second quartile among its Lipper category and its Morningstar category for the one-year and three-month periods ended October 31, 2009.
The Board members discussed with representatives of Dreyfus the reasons for the fund’s underperformance compared to the Performance Group and Performance Universe medians during the applicable periods, citing in particular a period of underperformance during the fourth quarter of 2008. The Board noted Dreyfus’ continuing efforts to improve fund performance.
The Board members also discussed the fund’s actual and contractual management fees and total expense ratio compared to a group of comparable retail front-end load large-cap core funds (the “Expense Group”) and a broader group of funds consisting of all retail front-end load large-cap core funds (the “Expense Universe”), each selected and provided by Lipper. The Board noted that Dreyfus has contractually agreed, until September 30, 2010, to waive receipt of its fees and/or assume the expenses of the fund so that the direct expenses of Class I shares (excluding taxes, interest, brokerage commissions, commitment fees on borrowings and extraordinary expenses) do not exceed .79%. In addition, the Board noted that Dreyfus has agreed, until May 1, 2010, to waive receipt of its fee and/or assume the expenses of the fund so that the direct expenses of Class A and C (excluding taxes, interest, brokerage commissio ns, commitment fees on borrowings, extraordinary fees, shareholder services fees and Rule 12b-1 fees) do not exceed 1.25%. The Board members noted that the fund’s actual and contractual management fees were lower than the Expense Group
34
medians (in the second quartile), the actual management fee was higher than the Expense Universe median (in the third quartile) and the total expense ratio was lower than the Expense Group and Expense Universe medians (in the fourth quartile).
Representatives of Dreyfus reviewed with the Board members the fees paid to Dreyfus or its affiliates by mutual funds managed by Dreyfus with similar investment objectives, policies and strategies, and included in the same Lipper category as the fund (the “Similar Funds”), and by other accounts managed by Dreyfus or its affiliates with similar investment objectives, policies and strategies as the fund (the “Similar Accounts”). Dreyfus’ representatives explained the nature of the Similar Accounts and the differences, from Dreyfus’ perspective, in providing services to such Similar Accounts as compared to managing and providing services to the fund. Dreyfus’ representatives also reviewed the costs associated with distribution through intermediaries. The Board members considered the relevance of the fee information provided for the Similar Funds and the Similar Accounts to evaluate the appropriat eness and reasonableness of the fund’s management fee.
Analysis of Profitability and Economies of Scale. Dreyfus’ representatives reviewed the dollar amount of expenses allocated and profit received by Dreyfus and the method used to determine such expenses and profit.The Board previously had been provided with information prepared by an independent consulting firm regarding Dreyfus’ approach to allocating costs to, and determining the profitability of, individual funds and the entire Dreyfus mutual fund complex. The Board members also had been informed that the methodology had been reviewed by an independent registered public accounting firm which, like the consultant, found the methodology to be reasonable. The consulting firm also analyzed where any economies of scale might emerge in connection with the management of the fund.The Board members evaluated the profitability analysis in light of the relevan t circumstances for the fund and the extent to which economies of scale would be realized if the fund grows and whether fee levels reflect these economies of scale for the benefit of fund investors.The Board members also considered potential benefits to Dreyfus from acting as investment adviser and noted the soft dollar arrangements with respect to trading the fund’s investments.
The Fund 35
| INFORMATION ABOUT THE REVIEW AND APPROVAL OF THE |
| FUND’S MANAGEMENT AGREEMENT (Unaudited) (continued) |
It was noted that the Board members should consider Dreyfus’ profitability with respect to the fund as part of their evaluation of whether the fees under the Management Agreement bear a reasonable relationship to the mix of services provided by Dreyfus, including the nature, extent and quality of such services and that a discussion of economies of scale is predicated on a fund having achieved a substantial size with increasing assets and that, if a fund’s assets had been static or decreasing, the possibility that Dreyfus may have realized any economies of scale would be less. It also was noted that the profitability percentage for managing the fund was within ranges determined by appropriate court cases to be reasonable given the services rendered and generally superior service levels provided.
At the conclusion of these discussions, the Board agreed that it had been furnished with sufficient information to make an informed business decision with respect to re-approving the Management Agreement. Based on the discussions and considerations as described above, the Board made the following conclusions and determinations.
The Board concluded that the nature, extent and quality of the services provided by Dreyfus are adequate and appropriate.
The Board recognized the improvement in the fund’s relative perfor- mance and concluded it would continue to monitor the performance of the fund and its portfolio management team.
The Board concluded that the fee payable by the fund to Dreyfus was reasonable in light of the considerations described above.
The Board determined that the economies of scale which may accrue to Dreyfus and its affiliates in connection with the manage- ment of the fund had been adequately considered by Dreyfus in connection with the management fee rate charged to the fund and that, to the extent in the future it were determined that material economies of scale had not been shared with the fund, the Board would seek to have those economies of scale shared with the fund.
The Board members considered these conclusions and determinations, along with information received on a routine and regular basis throughout the year, and, without any one factor being dispositive, the Board determined that re-approval of the Management Agreement, through July 31, 2010 was in the best interests of the fund and its shareholders.
36
BOARD MEMBERS INFORMATION (Unaudited)
The Fund 37
BOARD MEMBERS INFORMATION (Unaudited) (continued)
Once elected all Board Members serve for an indefinite term, but achieve Emeritus status upon reaching age 80.The address of the Board Members and Officers is in c/o The Dreyfus Corporation, 200 Park Avenue, NewYork, NewYork 10166. Additional information about the Board Members is available in the fund’s Statement of Additional Information which can be obtained from Dreyfus free of charge by calling this toll free number: 1-800-554-4611.
Daniel Rose, Emeritus Board Member
Sander Vanocur, Emeritus Board Member
38
OFFICERS OF THE FUND (Unaudited)
The Fund 39
OFFICERS OF THE FUND (Unaudited) (continued)

40

The Fund 41
For More Information
Telephone Call your financial representative or 1-800-554-4611
Mail The Dreyfus Family of Funds, 144 Glenn Curtiss Boulevard, Uniondale, NY 11556-0144
The fund files its complete schedule of portfolio holdings with the Securities and Exchange Commission (“SEC”) for the first and third quarters of each fiscal year on Form N-Q. The fund’s Forms N-Q are available on the SEC’s website at http://www.sec.gov and may be reviewed and copied at the SEC’s Public Reference Room in Washington, DC. Information on the operation of the Public Reference Room may be obtained by calling 1-800-SEC-0330.
A description of the policies and procedures that the fund uses to determine how to vote proxies relating to portfolio securities, and information regarding how the fund voted these proxies for the most recent 12-month period ended June 30 is available at http://www.dreyfus.com and on the SEC’s website at http://www.sec.gov. The description of the policies and procedures is also available without charge, upon request, by calling 1-800-645-6561.

| Dreyfus |
| Large Cap Growth Fund |
ANNUAL REPORT December 31, 2009
Save time. Save paper. View your next shareholder report online as soon as it’s available. Log into www.dreyfus.com and sign up for Dreyfus eCommunications. It’s simple and only takes a few minutes.
The views expressed in this report reflect those of the portfolio manager only through the end of the period covered and do not necessarily represent the views of Dreyfus or any other person in the Dreyfus organization. Any such views are subject to change at any time based upon market or other conditions and Dreyfus disclaims any responsibility to update such views.These views may not be relied on as investment advice and, because investment decisions for a Dreyfus fund are based on numerous factors, may not be relied on as an indication of trading intent on behalf of any Dreyfus fund.

Contents | |
THE FUND | |
| 2 | A Letter from the Chairman and CEO |
| 3 | Discussion of Fund Performance |
| 6 | Fund Performance |
| 8 | Understanding Your Fund’s Expenses |
| 8 | Comparing Your Fund’s Expenses With Those of Other Funds |
| 9 | Statement of Investments |
| 12 | Statement of Assets and Liabilities |
| 13 | Statement of Operations |
| 14 | Statement of Changes in Net Assets |
| 16 | Financial Highlights |
| 19 | Notes to Financial Statements |
| 30 | Report of Independent Registered Public Accounting Firm |
| 31 | Information About the Review and Approval of the Fund’s Management Agreement |
| 36 | Board Members Information |
| 38 | Officers of the Fund |
FOR MORE INFORMATION | |
Back Cover |
| Dreyfus |
| Large Cap Growth Fund |
The Fund

A LETTER FROM THE CHAIRMAN AND CEO
Dear Shareholder:
We are pleased to present this annual report for Dreyfus Large Cap Growth Fund, covering the 12-month period from January 1, 2009, through December 31, 2009.
The U.S. stock market ended 2009 with a healthy annual gain, but market indices across all capitalization ranges and investment styles remained well below the peaks reached in the fall of 2007.The equity market’s advance was driven by improving investor sentiment as the U.S. economy staged a gradual, but sustained, recovery from the recession and banking crisis that had depressed stock prices at the beginning of the year. After four consecutive quarters of contraction, the U.S. economy returned to growth during the third quarter of 2009, buoyed by greater manufacturing activity to replenish depleted inventories and satisfy export demand. The slumping housing market also showed signs of renewed life later in the year when home sales and prices rebounded modestly. However, economic headwinds remain, including a high unemployment rate and the prospect of anemic consumer spending.
As 2010 begins, our Chief Economist, as well as many securities analysts and portfolio managers have continued to find opportunities and survey potential challenges across a variety of asset classes, including equities. While no one can predict the future, we believe that the 2010 investment environment will likely require a broader range of investment considerations relative to last year. As always, your financial adviser can help you determine the mix of investments that may be best suited to helping you achieve your goals at a level of risk that is comfortable for you.
For information about how the fund performed during the reporting period, as well as market perspectives, we have provided a Discussion of Fund Performance.
Thank you for your continued confidence and support.

Jonathan R. Baum
Chairman and Chief Executive Officer
The Dreyfus Corporation
January 15, 2010
2

DISCUSSION OF FUND PERFORMANCE
For the reporting period of January 1, 2009, through December 31, 2009, as provided by Irene O’Neill, Portfolio Manager
Fund and Market Performance Overview
For the 12-month period ended December 31, 2009, Dreyfus Large Cap Growth Fund’s Class A shares produced a total return of 35.00%, Class C shares returned 34.09% and Class I shares returned 35.81%.1 In comparison, the Russell 1000 Growth Index (the “Index”), the fund’s benchmark, achieved a total return of 37.21%.2
In the wake of a severe recession and banking crisis, stocks rallied over much of 2009 as investors looked forward to better economic times.The fund produced modestly lower returns than its benchmark, due primarily to relative strength among midcap stocks that are in the benchmark but do not meet the fund’s market-capitalization requirements.
The Fund’s Investment Approach
The fund seeks long-term capital appreciation.To pursue this goal, the fund normally invests at least 80% of its assets in equity securities of large-capitalization companies with market capitalizations of $5 billion or more at the time of purchase.
The fund invests primarily in large, established companies that we believe have proven track records and the potential for superior relative earnings growth. The investment process begins with a “top-down” assessment of broad economic, political and social trends and their implications for different market and industry sectors. Fundamental research is used to identify companies with the potential for accelerating earnings and revenue growth, favorable market positions, improving operating efficiencies, and/or increasing earnings per share.
U.S. Stock Market Rebounded Sharply
During the early part of 2009, securities markets were still reeling from a global financial crisis and the most severe recession since the 1930s.These influences drove stocks to multi-year lows during the first quarter of the year. The decline affected a wide variety of industry groups seemingly regardless of their underlying business fundamentals.
The Fund 3
DISCUSSION OF FUND PERFORMANCE (continued)
Market sentiment began to improve in early March, as aggressive measures adopted by government and monetary authorities to repair the credit markets seemed to gain traction.Additional evidence of economic stabilization later appeared, sparking a sustained market rally through year-end. Lower-quality companies generally led the rally as investors turned to stocks that had been severely punished in the downturn. In addition, growth stocks generally outperformed their more value-oriented counterparts.
Stock Selection Strategy Drove Fund Performance
Although stocks remained depressed early in the year, we began to shift from a relatively defensive investment posture to one designed to capture the benefits of a massive economic stimulus program and historically low short-term interest rates.We increased the fund’s exposure to more economically sensitive industry groups, including the energy and information technology sectors, that historically have fared well early in economic recoveries.We also established overweighted exposure to the hard-hit financials sector in anticipation of healthier credit markets. These changes enabled the fund to participate more fully in the ensuing market rebound.
Among financial companies, the fund scored successes with charge card issuer American Express, investment manager Invesco and investment bank Goldman Sachs, all of which benefited from recovering capital markets.In the technology sector,the fund outperformed on the strength of secular growth investments such as electronics innovator Apple and Internet media leader Google. Both stocks more than doubled in value during the year.The fund also participated in early-cycle gains among semiconductor manufacturers, such as Marvell Technology Group. Software developer Salesforce.com benefited as customers sought to boost employee productivity, and outsourcing services provider Cognizant Technology Solutions recovered from depressed levels when it became clear that its customers in the financia ls sector had averted bankruptcy.
In the energy sector, we moved the fund’s focus from integrated oil companies to independent producers and oil services providers, including Weatherford International, Southwestern Energy and Smith International.We maintained relatively light exposure to the integrated oil industry, which underperformed the sector average. In the materi-
4
als sector, iron ore miner Cliffs Natural Resources was bolstered by recovering commodity prices, and industrial gasses producer Praxair encountered improved industrial demand.
The fund received more disappointing results in the consumer discretionary sector, whereYum! Brands and International Game Technology lagged due to the slowdown in consumer spending in overseas and domestic markets, respectively. Retailer GameStop suffered amid slower sales. Our focus on biotechnology firms such as Celgene, Gilead Sciences and Cephalon, which were all hurt by product-development concerns, undermined results in the health care sector.
Sluggish Recovery Expected
As of the reporting period’s end, the economy appears to be gaining strength, and investors seem to be refocusing on companies with healthy finances and strong business fundamentals. However, we expect the recovery to remain relatively sluggish, suggesting that investors may favor companies with strong secular growth over those that are more leveraged to economic conditions. Indeed, we have continued to seek attractive opportunities among large-cap stocks with catalysts for secular growth, especially in the information technology sector. We have found fewer opportunities in the traditionally defensive consumer staples, health care, telecommunications services and utilities sectors.
January 15, 2010
| Please note, the position in any security highlighted with italicized typeface was sold during the | |
| reporting period. | |
| 1 | Total return includes reinvestment of dividends and any capital gains paid, and does not take into |
| consideration the maximum initial sales charge in the case of Class A shares, or the applicable | |
| contingent deferred sales charge imposed on the redemption of Class C shares. Had these charges | |
| been reflected, returns would have been lower. Past performance is no guarantee of future results. | |
| Share price and investment return fluctuate such that upon redemption, fund shares may be worth | |
| more or less than their original cost. Return figures provided reflect the absorption of certain fund | |
| expenses by The Dreyfus Corporation pursuant to an undertaking in effect for Classes A and C | |
| through May 1, 2010, and in effect for Class I through September 30, 2010, at which time it | |
| may be extended, terminated or modified. Had these expenses not been absorbed, the fund’s | |
| returns would have been lower. | |
| 2 | SOURCE: LIPPER INC. — Reflects reinvestment of net dividends and, where applicable, |
| capital gain distributions. The Russell 1000 Growth Index is an unmanaged index that | |
| measures the performance of those Russell 1000 companies with higher price-to-book ratios and | |
| higher forecasted growth values. Index return does not reflect fees and expenses associated with | |
| operating a mutual fund. |
The Fund 5
FUND PERFORMANCE
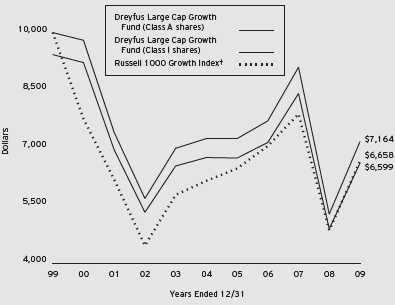
| Comparison of change in value of $10,000 investment in Dreyfus Large Cap Growth Fund Class A |
| shares and Class I shares and the Russell 1000 Growth Index |
| † Source: Lipper Inc. |
| Past performance is not predictive of future performance. |
| The above graph compares a $10,000 investment made in Class A and Class I shares of Dreyfus Large Cap Growth |
| Fund on 12/31/99 to a $10,000 investment made in the Russell 1000 Growth Index (the “Index”) on that date. |
| All dividends and capital gain distributions are reinvested. |
| The fund’s performance shown in the line graph takes into account the maximum initial sales charge on Class A shares |
| and all other applicable fees and expenses. Performance for Class C shares will vary from the performance of Class A |
| shares and Class I shares shown above due to differences in charges and expenses.The Index is an unmanaged index |
| which measures the performance of those Russell 1000 companies with higher price-to-book ratios and higher forecasted |
| growth values. Unlike a mutual fund, the Index is not subject to charges, fees and other expenses. Investors cannot invest |
| directly in any index. Further information relating to fund performance, including expense reimbursements, if applicable, is |
| contained in the Financial Highlights section of the prospectus and elsewhere in this report. |
6
| Average Annual Total Returns as of 12/31/09 | ||||
| Inception | ||||
| Date | 1 Year | 5 Years | 10 Years | |
| Class A shares | ||||
| with maximum sales charge (5.75%) | 12/31/86 | 27.20% | –1.61% | –4.07% |
| without sales charge | 12/31/86 | 35.00% | –0.44% | –3.50% |
| Class C shares | ||||
| with applicable redemption charge † | 9/13/08 | 33.09% | –0.44%†† | –3.50%†† |
| without redemption | 9/13/08 | 34.09% | –0.44%†† | –3.50%†† |
| Class I shares | 4/1/97 | 35.81% | –0.21% | –3.28% |
| Past performance is not predictive of future performance.The fund’s performance shown in the graph and table does not | |
| reflect the deduction of taxes that a shareholder would pay on fund distributions or the redemption of fund shares. | |
| † | The maximum contingent deferred sales charge for Class C shares is 1% for shares redeemed within one year of the |
| date of purchase. | |
| †† | The total return performance figures presented for Class C shares of the fund reflect the performance of the fund’s |
| Class A shares for periods prior to 9/13/08 (the inception date for Class C shares), adjusted to reflect the applicable | |
| sales load for that class. | |
The Fund 7
UNDERSTANDING YOUR FUND’S EXPENSES (Unaudited)
As a mutual fund investor, you pay ongoing expenses, such as management fees and other expenses. Using the information below, you can estimate how these expenses affect your investment and compare them with the expenses of other funds.You also may pay one-time transaction expenses, including sales charges (loads) and redemption fees, which are not shown in this section and would have resulted in higher total expenses. For more information, see your fund’s prospectus or talk to your financial adviser.
Review your fund’s expenses
The table below shows the expenses you would have paid on a $1,000 investment in Dreyfus Large Cap Growth Fund from July 1, 2009 to December 31, 2009. It also shows how much a $1,000 investment would be worth at the close of the period, assuming actual returns and expenses.
Expenses and Value of a $1,000 Investment
assuming actual returns for the six months ended December 31, 2009
| Class A | Class C | Class I | |
| Expenses paid per $1,000† | $ 8.51 | $ 11.60 | $ 4.94 |
| Ending value (after expenses) | $1,250.50 | $1,245.30 | $1,253.60 |
COMPARING YOUR FUND’S EXPENSES
WITH THOSE OF OTHER FUNDS (Unaudited)
Using the SEC’s method to compare expenses
The Securities and Exchange Commission (SEC) has established guidelines to help investors assess fund expenses. Per these guidelines, the table below shows your fund’s expenses based on a $1,000 investment, assuming a hypothetical 5% annualized return. You can use this information to compare the ongoing expenses (but not transaction expenses or total cost) of investing in the fund with those of other funds.All mutual fund shareholder reports will provide this information to help you make this comparison. Please note that you cannot use this information to estimate your actual ending account balance and expenses paid during the period.
Expenses and Value of a $1,000 Investment
assuming a hypothetical 5% annualized return for the six months ended December 31, 2009
| Class A | Class C | Class I | |
| Expenses paid per $1,000† | $ 7.63 | $ 10.41 | $ 4.43 |
| Ending value (after expenses) | $1,017.64 | $1,014.87 | $1,020.82 |
| † Expenses are equal to the fund’s annualized expense ratio of 1.50% for Class A, 2.05% for Class C and .87% |
| for Class I, multiplied by the average account value over the period, multiplied by 184/365 (to reflect the one-half |
| year period). |
8
| STATEMENT OF INVESTMENTS |
| December 31, 2009 |
| Common Stocks—99.0% | Shares | Value ($) |
| Consumer Discretionary—9.9% | ||
| Amazon.com | 13,820 a | 1,859,066 |
| International Game Technology | 75,910 | 1,424,831 |
| Lowe’s Cos. | 63,450 | 1,484,095 |
| McDonald’s | 11,760 | 734,294 |
| Target | 26,980 | 1,305,023 |
| Walt Disney | 43,200 | 1,393,200 |
| Yum! Brands | 26,850 | 938,945 |
| 9,139,454 | ||
| Consumer Staples—14.0% | ||
| Avon Products | 40,070 | 1,262,205 |
| Coca-Cola | 15,260 | 869,820 |
| Colgate-Palmolive | 17,560 | 1,442,554 |
| Costco Wholesale | 22,100 | 1,307,657 |
| Kellogg | 25,070 | 1,333,724 |
| PepsiCo | 34,690 | 2,109,152 |
| Philip Morris International | 42,090 | 2,028,317 |
| Procter & Gamble | 19,620 | 1,189,561 |
| Wal-Mart Stores | 25,040 | 1,338,388 |
| 12,881,378 | ||
| Energy—6.0% | ||
| Halliburton | 27,200 | 818,448 |
| Occidental Petroleum | 11,050 | 898,917 |
| Plains Exploration & Production | 33,820 a | 935,461 |
| Schlumberger | 14,310 | 931,438 |
| Southwestern Energy | 20,610 a | 993,402 |
| Williams Cos. | 45,000 | 948,600 |
| 5,526,266 | ||
| Financial—4.7% | ||
| American Express | 24,105 | 976,735 |
| Axis Capital Holdings | 37,280 | 1,059,125 |
| IntercontinentalExchange | 8,400 a | 943,320 |
| Invesco | 57,228 | 1,344,286 |
| 4,323,466 |
The Fund 9
STATEMENT OF INVESTMENTS (continued)
| Common Stocks (continued) | Shares | Value ($) |
| Health Care—14.6% | ||
| Abbott Laboratories | 22,000 | 1,187,780 |
| Amgen | 25,170 a | 1,423,867 |
| C.R. Bard | 11,760 | 916,104 |
| Cardinal Health | 42,680 | 1,376,003 |
| Celgene | 14,880 a | 828,518 |
| Gilead Sciences | 26,680 a | 1,154,710 |
| Johnson & Johnson | 26,160 | 1,684,966 |
| Medco Health Solutions | 15,480 a | 989,327 |
| Medtronic | 17,810 | 783,284 |
| Merck & Co. | 25,230 | 921,904 |
| Teva Pharmaceutical Industries, ADR | 20,270 | 1,138,769 |
| Thermo Fisher Scientific | 21,970 a | 1,047,749 |
| 13,452,981 | ||
| Industrial—10.5% | ||
| Caterpillar | 29,110 | 1,658,979 |
| Danaher | 14,530 | 1,092,656 |
| Honeywell International | 40,570 | 1,590,344 |
| Ingersoll-Rand | 30,670 | 1,096,146 |
| Parker Hannifin | 23,390 | 1,260,253 |
| Union Pacific | 23,380 | 1,493,982 |
| United Technologies | 21,290 | 1,477,739 |
| 9,670,099 | ||
| Information Technology—34.7% | ||
| Accenture, Cl. A | 24,140 | 1,001,810 |
| Apple | 20,990 a | 4,425,951 |
| Brocade Communications Systems | 82,230 a | 627,415 |
| Cisco Systems | 90,660 a | 2,170,400 |
| Cognizant Technology Solutions, Cl. A | 29,970 a | 1,357,641 |
| Google, Cl. A | 5,620 a | 3,484,288 |
| Hewlett-Packard | 39,450 | 2,032,069 |
| Intel | 54,850 | 1,118,940 |
| International Business Machines | 29,290 | 3,834,061 |
| Marvell Technology Group | 85,070 a | 1,765,202 |
| MasterCard, Cl. A | 6,000 | 1,535,880 |
| Microsoft | 96,350 | 2,937,712 |
| QUALCOMM | 18,460 | 853,960 |
| Research In Motion | 16,560 a | 1,118,462 |
10
| Common Stocks (continued) | Shares | Value ($) |
| Information Technology (continued) | ||
| Salesforce.com | 22,160 a | 1,634,743 |
| Teradata | 33,990 a | 1,068,306 |
| Western Digital | 23,360 a | 1,031,344 |
| 31,998,184 | ||
| Materials—3.4% | ||
| Cliffs Natural Resources | 40,120 | 1,849,131 |
| Praxair | 16,160 | 1,297,810 |
| 3,146,941 | ||
| Utilities—1.2% | ||
| Questar | 27,300 | 1,134,861 |
| Total Common Stocks | ||
| (cost $79,541,035) | 91,273,630 | |
| Other Investment—.4% | ||
| Registered Investment Company; | ||
| Dreyfus Institutional Preferred | ||
| Plus Money Market Fund | ||
| (cost $353,000) | 353,000 b | 353,000 |
| Total Investments (cost $79,894,035) | 99.4% | 91,626,630 |
| Cash and Receivables (Net) | .6% | 537,701 |
| Net Assets | 100.0% | 92,164,331 |
ADR—American Depository Receipts
| a | Non-income producing security. |
| b | Investment in affiliated money market mutual fund. |
| Portfolio Summary (Unaudited)† | |||
| Value (%) | Value (%) | ||
| Information Technology | 34.7 | Financial | 4.7 |
| Health Care | 14.6 | Materials | 3.4 |
| Consumer Staples | 14.0 | Utilities | 1.2 |
| Industrial | 10.5 | Money Market Investment | .4 |
| Consumer Discretionary | 9.9 | ||
| Energy | 6.0 | 99.4 | |
| † Based on net assets. |
| See notes to financial statements. |
The Fund 11
| STATEMENT OF ASSETS AND LIABILITIES |
| December 31, 2009 |
| Cost | Value | |
| Assets ($): | ||
| Investments in securities—See Statement of Investments: | ||
| Unaffiliated issuers | 79,541,035 | 91,273,630 |
| Affiliated issuers | 353,000 | 353,000 |
| Cash | 6,942 | |
| Receivable for investment securities sold | 620,838 | |
| Dividends and interest receivable | 109,665 | |
| Prepaid expenses | 18,048 | |
| 92,382,123 | ||
| Liabilities ($): | ||
| Due to The Dreyfus Corporation and affiliates—Note 3(c) | 72,794 | |
| Payable for shares of Common Stock redeemed | 93,653 | |
| Accrued expenses | 51,345 | |
| 217,792 | ||
| Net Assets ($) | 92,164,331 | |
| Composition of Net Assets ($): | ||
| Paid-in capital | 100,738,389 | |
| Accumulated undistributed investment income—net | 599,691 | |
| Accumulated net realized gain (loss) on investments | (20,906,344) | |
| Accumulated net unrealized appreciation | ||
| (depreciation) on investments | 11,732,595 | |
| Net Assets ($) | 92,164,331 |
| Net Asset Value Per Share | |||
| Class A | Class C | Class I | |
| Net Assets ($) | 278,568 | 82,750 | 91,803,013 |
| Shares Outstanding | 46,911 | 13,909 | 15,218,322 |
| Net Asset Value Per Share ($) | 5.94 | 5.95 | 6.03 |
See notes to financial statements.
12
| STATEMENT OF OPERATIONS |
| Year Ended December 31, 2009 |
| Investment Income ($): | |
| Income: | |
| Cash dividends (net of $2,631 foreign taxes withheld at source): | |
| Unaffiliated issuers | 1,298,644 |
| Affiliated issuers | 1,834 |
| Total Income | 1,300,478 |
| Expenses: | |
| Management fee—Note 3(a) | 562,939 |
| Registration fees | 39,218 |
| Auditing fees | 36,878 |
| Custodian fees—Note 3(c) | 12,898 |
| Shareholder servicing costs—Note 3(c) | 10,582 |
| Prospectus and shareholders’ reports | 9,839 |
| Directors’ fees and expenses—Note 3(d) | 6,685 |
| Legal fees | 5,658 |
| Loan commitment fees—Note 2 | 830 |
| Interest expense—Note 2 | 662 |
| Distribution fees—Note 3(b) | 306 |
| Miscellaneous | 22,279 |
| Total Expenses | 708,774 |
| Less—reduction in expenses due to undertaking—Note 3(a) | (6,321) |
| Less—reduction in fees due to earnings credits—Note 1(b) | (1,666) |
| Net Expenses | 700,787 |
| Investment Income—Net | 599,691 |
| Realized and Unrealized Gain (Loss) on Investments—Note 4 ($): | |
| Net realized gain (loss) on investments | (9,132,494) |
| Net realized gain (loss) on options transactions | 4,200 |
| Net Realized Gain (Loss) | (9,128,294) |
| Net unrealized appreciation (depreciation) on investments | 33,824,576 |
| Net Realized and Unrealized Gain (Loss) on Investments | 24,696,282 |
| Net Increase in Net Assets Resulting from Operations | 25,295,973 |
See notes to financial statements.
The Fund 13
STATEMENT OF CHANGES IN NET ASSETS
| Year Ended December 31, | ||
| 2009a | 2008b,c | |
| Operations ($): | ||
| Investment income—net | 599,691 | 706,814 |
| Net realized gain (loss) on investments | (9,128,294) | (11,630,739) |
| Net unrealized appreciation | ||
| (depreciation) on investments | 33,824,576 | (48,045,034) |
| Net Increase (Decrease) in Net Assets | ||
| Resulting from Operations | 25,295,973 | (58,968,959) |
| Dividends to Shareholders from ($): | ||
| Investment income—net: | ||
| Class A Shares | — | (6,011) |
| Class I Shares | — | (416,756) |
| Net realized gain on investments: | ||
| Class A Shares | — | (166,865) |
| Class I Shares | — | (5,656,873) |
| Return of capital: | ||
| Class A Shares | — | (40,721) |
| Class I Shares | — | (1,382,054) |
| Total Dividends | — | (7,669,280) |
| Capital Stock Transactions ($): | ||
| Net proceeds from shares sold: | ||
| Class A Shares | 216,832 | 272,273 |
| Class C Shares | 56,685 | 15,000 |
| Class I Shares | 15,595,998 | 120,594,149 |
| Class T Shares | — | 10,000 |
| Dividends reinvested: | ||
| Class A Shares | — | 205,312 |
| Class I Shares | — | 6,753,059 |
| Cost of shares redeemed: | ||
| Class A Shares | (20) | (3,512,087) |
| Class C Shares | (261) | — |
| Class I Shares | (24,312,390) | (125,236,889) |
| Class T Shares | (6,620) | — |
| Increase (Decrease) in Net Assets | ||
| from Capital Stock Transactions | (8,449,776) | (899,183) |
| Total Increase (Decrease) in Net Assets | 16,846,197 | (67,537,422) |
| Net Assets ($): | ||
| Beginning of Period | 75,318,134 | 142,855,556 |
| End of Period | 92,164,331 | 75,318,134 |
| Undistributed investment income—net | 599,691 | — |
14
| Year Ended December 31, | ||
| 2009a | 2008b,c | |
| Capital Share Transactions: | ||
| Class Ad | ||
| Shares sold | 45,337 | 34,544 |
| Shares issued for dividends reinvested | — | 32,538 |
| Shares redeemed | (3) | (574,751) |
| Net Increase (Decrease) in Shares Outstanding | 45,334 | (507,669) |
| Class C | ||
| Shares sold | 11,199 | 2,712 |
| Shares redeemed | (2) | — |
| Net Increase (Decrease) in Shares Outstanding | 11,197 | 2,712 |
| Class I | ||
| Shares sold | 3,256,598 | 17,019,698 |
| Shares issued for dividends reinvested | — | 1,056,817 |
| Shares redeemed | (4,978,911) | (18,061,289) |
| Net Increase (Decrease) in Shares Outstanding | (1,722,313) | 15,226 |
| Class Td | ||
| Shares sold | — | 1,558 |
| Shares redeemed | (1,558) | — |
| Net Increase (Decrease) in Shares Outstanding | (1,558) | 1,558 |
| a Effective as of the close of business on February 4, 2009, the fund no longer offers Class T shares. |
| b The fund commenced offering four classes of shares on the close of business September 12, 2008.The existing shares |
| were redesignated and the fund added Class C and Class T shares. |
| c Represents information for the fund’s predecessor, BNY Hamilton Large Cap Growth Fund, through |
| September 12, 2008. |
| d On the close of business on February 4, 2009, 1,558 Class T shares representing $6,620 were converted to 1,572 |
| Class A shares. |
See notes to financial statements.
The Fund 15
FINANCIAL HIGHLIGHTS
Please note that the financial highlights information in the following tables for the fund’s Class A and Class I shares represents the financial highlights of the Class A and Institutional shares, repectively, of the fund’s predecessor, BNY Hamilton Large Cap Growth Fund (“Hamilton Large Cap Growth Fund”), before the fund commenced operations as of the close of business on September 12, 2008, and represents the performance of the fund’s Class A and Class I shares thereafter. Before the fund commenced operations, all of the assets of the Hamilton Large Cap Growth Fund were transferred to the fund in exchange for Class A and Class I shares of the fund in a tax-free reorganization.Total return shows how much your investment in the fund would have increased (or decreased) during each period, assuming you had reinvested all dividends and distributions. These figures have been derived from the fund’s and the fund’s predecessor’s financial statements.
| Year Ended December 31, | |||||
| Class A Shares† | 2009 | 2008 | 2007 | 2006 | 2005 |
| Per Share Data ($): | |||||
| Net asset value, beginning of period | 4.40 | 8.10 | 7.64 | 7.65 | 9.52 |
| Investment Operations: | |||||
| Investment income (loss)—neta | .01 | .02 | .01 | .00b | (.01) |
| Net realized and unrealized | |||||
| gain (loss) on investments | 1.53 | (3.28) | 1.35 | .44 | (.01) |
| Total from Investment Operations | 1.54 | (3.26) | 1.36 | .44 | (.02) |
| Distributions: | |||||
| Dividends from investment income—net | — | (.01) | (.01) | (.00)b | — |
| Dividends from net realized | |||||
| gain on investments | — | (.35) | (.89) | (.45) | (1.85) |
| Return of Capital | — | (.08) | — | — | — |
| Total Distributions | — | (.44) | (.90) | (.45) | (1.85) |
| Net asset value, end of period | 5.94 | 4.40 | 8.10 | 7.64 | 7.65 |
| Total Return (%)c | 35.00 | (41.90) | 17.79 | 6.04 | (.13) |
| Ratios/Supplemental Data (%): | |||||
| Ratio of total expenses | |||||
| to average net assets | 2.37 | 1.10 | 1.10 | 1.09 | 1.08 |
| Ratio of net expenses | |||||
| to average net assets | 1.47 | 1.10d | 1.10 | 1.09 | 1.08 |
| Ratio of net investment income | |||||
| (loss) to average net assets | .12 | .20 | .10 | .06 | (.06) |
| Portfolio Turnover Rate | 82.53 | 78 | 52 | 51 | 101 |
| Net Assets, end of period ($ x 1,000) | 279 | 7 | 4,127 | 5,487 | 8,126 |
| † Represents information for Class A shares of the fund’s predecessor, Hamilton Large Cap Growth Fund, through |
| September 12, 2008. |
| a Based on average shares outstanding at each month end. |
| b Amount represents less than $.01 per share. |
| c Exclusive of sales charge. |
| d Expense waivers and/or reimbursements amounted to less than .01%. |
See notes to financial statements.
16
| Year Ended December 31, | ||
| Class C Shares | 2009 | 2008a |
| Per Share Data ($): | ||
| Net asset value, beginning of period | 4.43 | 6.42 |
| Investment Operations: | ||
| Investment income (loss)—netb | (.03) | .00c |
| Net realized and unrealized | ||
| gain (loss) on investments | 1.55 | (1.99) |
| Total from Investment Operations | 1.52 | (1.99) |
| Net asset value, end of period | 5.95 | 4.43 |
| Total Return (%)d | 34.09 | (31.00)e |
| Ratios/Supplemental Data (%): | ||
| Ratio of total expenses to average net assets | 2.06 | 2.01f |
| Ratio of net expenses to average net assets | 2.06 | 1.91f |
| Ratio of net investment income | ||
| (loss) to average net assets | (.48) | .04f |
| Portfolio Turnover Rate | 82.53 | 78 |
| Net Assets, end of period ($ x 1,000) | 83 | 12 |
| a | From September 13, 2008 (commencement of initial offering) to December 31, 2008. |
| b | Based on average shares outstanding at each month end. |
| c | Amount represents less than $.01 per share. |
| d | Exclusive of sales charge. |
| e | Not annualized. |
| f | Annualized. |
See notes to financial statements.
The Fund 17
FINANCIAL HIGHLIGHTS (continued)
| Year Ended December 31, | |||||
| Class I Shares† | 2009 | 2008 | 2007 | 2006 | 2005 |
| Per Share Data ($): | |||||
| Net asset value, beginning of period | 4.44 | 8.20 | 7.72 | 7.73 | 9.60 |
| Investment Operations: | |||||
| Investment income—neta | .04 | .04 | .03 | .02 | .02 |
| Net realized and unrealized | |||||
| gain (loss) on investments | 1.55 | (3.34) | 1.37 | .45 | (.02) |
| Total from Investment Operations | 1.59 | (3.30) | 1.40 | .47 | — |
| Distributions: | |||||
| Dividends from investment income—net | — | (.03) | (.03) | (.03) | (.02) |
| Dividends from net realized | |||||
| gain on investments | — | (.35) | (.89) | (.45) | (1.85) |
| Return of Capital | — | (.08) | — | — | — |
| Total Distributions | — | (.46) | (.92) | (.48) | (1.87) |
| Net asset value, end of period | 6.03 | 4.44 | 8.20 | 7.72 | 7.73 |
| Total Return (%) | 35.81 | (42.03) | 18.18 | 6.29 | .07 |
| Ratios/Supplemental Data (%): | |||||
| Ratio of total expenses | |||||
| to average net assets | .88 | .86 | .85 | .84 | .82 |
| Ratio of net expenses | |||||
| to average net assets | .87 | .84 | .85 | .84 | .82 |
| Ratio of net investment income | |||||
| to average net assets | .75 | .61 | .34 | .30 | .19 |
| Portfolio Turnover Rate | 82.53 | 78 | 52 | 51 | 101 |
| Net Assets, end of period ($ x 1,000) | 91,803 | 75,292 | 138,729 | 143,479 | 205,786 |
| † Represents information for Institutional shares of the fund’s predecessor, Hamilton Large Cap Growth Fund through |
| September 12, 2008. |
| a Based on average shares outstanding at each month end. |
See notes to financial statements.
18
NOTES TO FINANCIAL STATEMENTS
NOTE 1—Significant Accounting Policies:
Dreyfus Large Cap Growth Fund (the “fund”) is a separate diversified series of Dreyfus Premier Investment Funds, Inc. (the “Company”), which is registered under the Investment Company Act of 1940, as amended (the “Act”), as an open-end management investment company and operates as a series company currently offering ten series, including the fund. The fund’s investment objective is long-term capital appreciation.The Dreyfus Corporation (the “Manager” or “Dreyfus”), a wholly-owned subsidiary of The Bank of New York Mellon Corporation (“BNY Mellon”), serves as the fund’s investment adviser.
MBSC Securities Corporation (the “Distributor”), a wholly-owned subsidiary of the Manager, is the distributor of the fund’s shares. The fund is authorized to issue 250 million shares of $.001 par value Common Stock. The fund currently offers three Classes of shares: Class A (100 million shares authorized), Class C (50 million shares authorized) and Class I (100 million shares authorized). Class A shares are subject to a sales charge imposed at the time of purchase. Class C shares are subject to a contingent deferred sales charge (“CDSC”) imposed on Class C shares redeemed within one year of purchase. Class I shares are sold at net asset value per share only to institutional investors. Other differences between the classes include the services offered to and the expenses borne by each class, the allocation of certain transfer agency costs and certain voting rights. Income, expenses (other than expenses a ttributable to a specific class), and realized and unrealized gains or losses on investments are allocated to each class of shares based on its relative net assets.
Effective December 3, 2008, investments for new accounts were no longer permitted in ClassT of the fund, except that participants in certain group retirement plans were able to open a new account in Class T of the fund, provided that the fund was established as an investment option under the plans before December 3, 2008. On February 4, 2009, the fund issued to each holder of its Class T shares, in exchange for said shares, Class A shares of the fund having an aggregate net asset
The Fund 19
NOTES TO FINANCIAL STATEMENTS (continued)
value equal to the aggregate net asset value of the shareholder’s Class T shares. Subsequent investments in the fund’s Class A shares made by prior holders of the fund’s Class T shares who received Class A shares of the fund in exchange for their Class T shares are subject to the front-end sales load schedule that was in effect for Class T shares at the time of the exchange. Otherwise, all other Class A share attributes will be in effect. Effective as of the close of business on February 4, 2009, the fund no longer offers Class T shares.
The Company accounts separately for the assets, liabilities and operations of each series. Expenses directly attributable to each series are charged to that series’ operations; expenses which are applicable to all series are allocated among them on a pro rata basis.
The Financial Accounting Standards Board (“FASB”) Accounting Standards Codification (“ASC”) has become the exclusive reference of authoritative U.S. generally accepted accounting principles (“GAAP”) recognized by the FASB to be applied by nongovernmental entities. Rules and interpretive releases of the Securities and Exchange Commission (“SEC”) under authority of federal laws are also sources of authoritative GAAP for SEC registrants. The ASC has superseded all existing non-SEC accounting and reporting standards. The fund’s financial statements are prepared in accordance with GAAP, which may require the use of management estimates and assumptions.Actual results could differ from those estimates.
The Company enters into contracts that contain a variety of indemnifications. The fund’s maximum exposure under these arrangements is unknown.The fund does not anticipate recognizing any loss related to these arrangements.
(a) Portfolio valuation: Investments in securities are valued at the last sales price on the securities exchange or national securities market on which such securities are primarily traded. Securities listed on the National Market System for which market quotations are available are valued at the official closing price or, if there is no official closing price that day, at the last sales price. Securities not listed on an exchange or the
20
national securities market, or securities for which there were no transactions, are valued at the average of the most recent bid and asked prices, except for open short positions, where the asked price is used for valuation purposes. Bid price is used when no asked price is available. Registered investment companies that are not traded on an exchange are valued at their net asset value.When market quotations or official closing prices are not readily available, or are determined not to reflect accurately fair value, such as when the value of a security has been significantly affected by events after the close of the exchange or market on which the security is principally traded (for example, a foreign exchange or market), but before the fund calculates its net asset value, the fund may value these investments at fair value as determined in accordance with the procedures approved by the Board of Directors. Fair valuing of securi ties may be determined with the assistance of a pricing service using calculations based on indices of domestic securities and other appropriate indicators, such as prices of relevant ADRs and futures contracts. For other securities that are fair valued by the Board of Directors, certain factors may be considered such as: fundamental analytical data, the nature and duration of restrictions on disposition, an evaluation of the forces that influence the market in which the securities are purchased and sold, and public trading in similar securities of the issuer or comparable issuers. Financial futures and options, which are traded on an exchange, are valued at the last sales price on the securities exchange on which such securities are primarily traded or at the last sales price on the national securities market on each business day. Options traded over-the-counter are valued at the mean between the bid and asked price.
The fair value of a financial instrument is the amount that would be received to sell an asset or paid to transfer a liability in an orderly transaction between market participants at the measurement date (i.e. the exit price). GAAP establishes a fair value hierarchy that prioritizes the inputs of valuation techniques used to measure fair value.This hierarchy gives the highest priority to unadjusted quoted prices in active
The Fund 21
NOTES TO FINANCIAL STATEMENTS (continued)
markets for identical assets or liabilities (Level 1 measurements) and the lowest priority to unobservable inputs (Level 3 measurements).
Additionally, GAAP provides guidance on determining whether the volume and activity in a market has decreased significantly and whether such a decrease in activity results in transactions that are not orderly. GAAP requires enhanced disclosures around valuation inputs and techniques used during annual and interim periods.
Various inputs are used in determining the value of the fund’s investments relating to fair value measurements. These inputs are summarized in the three broad levels listed below:
Level 1—unadjusted quoted prices in active markets for
identical investments.
Level 2—other significant observable inputs (including quoted
prices for similar investments, interest rates, prepayment speeds,
credit risk, etc.).
Level 3—significant unobservable inputs (including the fund’s own
assumptions in determining the fair value of investments).
The inputs or methodology used for valuing securities are not necessarily an indication of the risk associated with investing in those securities.
The following is a summary of the inputs used as of December 31, 2009 in valuing the fund’s investments:
| Level 2—Other | Level 3— | |||
| Level 1— | Significant | Significant | ||
| Unadjusted | Observable | Unobservable | ||
| Quoted Prices | Inputs | Inputs | Total | |
| Assets ($) | ||||
| Investments in Securities: | ||||
| Equity Securities— | ||||
| Domestic† | 89,016,399 | — | — | 89,016,399 |
| Equity Securities— | ||||
| Foreign† | 2,257,231 | — | — | 2,257,231 |
| Mutual Funds | 353,000 | — | — | 353,000 |
| † | See Statement of Investments for industry classification. |
22
(b) Securities transactions and investment income: Securities transactions are recorded on a trade date basis. Realized gains and losses from securities transactions are recorded on the identified cost basis. Dividend income is recognized on the ex-dividend date and interest income, including, where applicable, accretion of discount and amortization of premium on investments, is recognized on the accrual basis.
The fund has arrangements with the custodian and cash management bank whereby the fund may receive earnings credits when positive cash balances are maintained, which are used to offset custody and cash management fees. For financial reporting purposes, the fund includes net earnings credits as an expense offset in the Statement of Operations.
(c) Affiliated issuers: Investments in other investment companies advised by the Manager are defined as “affiliated” in the Act.
(d) Dividends to shareholders: Dividends are recorded on the ex-dividend date. Dividends from investment income-net and dividends from net realized capital gains, if any, are normally declared and paid annually, but the fund may make distributions on a more frequent basis to comply with the distribution requirements of the Internal Revenue Code of 1986, as amended (the “Code”).To the extent that net realized capital gains can be offset by capital loss carryovers, it is the policy of the fund not to distribute such gains. Income and capital gain distributions are determined in accordance with income tax regulations, which may differ from GAAP.
(e) Federal income taxes: It is the policy of the fund to continue to qualify as a regulated investment company, if such qualification is in the best interests of its shareholders, by complying with the applicable provisions of the Code, and to make distributions of taxable income sufficient to relieve it from substantially all federal income and excise taxes.
As of and during the period ended December 31, 2009, the fund did not have any liabilities for any uncertain tax positions.The fund recognizes interest and penalties, if any, related to uncertain tax positions
The Fund 23
NOTES TO FINANCIAL STATEMENTS (continued)
as income tax expense in the Statement of Operations. During the period, the fund did not incur any interest or penalties.
Each of the tax years in the four-year period ended December 31, 2009 remains subject to examination by the Internal Revenue Service and state taxing authorities.
At December 31, 2009, the components of accumulated earnings on a tax basis were as follows: undistributed ordinary income $599,691, accumulated capital losses $20,562,363 and unrealized appreciation $11,388,614.
The accumulated capital loss carryover is available for federal income tax purposes to be applied against future net securities profits, if any, realized subsequent to December 31, 2009. If not applied, $5,003,788 of the carryover expires in fiscal 2016 and $15,558,575 expires in fiscal 2017.
The tax character of distributions paid to shareholders during the fiscal periods ended December 31, 2009 and December 31, 2008 were as follows: ordinary income $0 and $693,564, long-term capital gains $0 and $5,552,941 and return of capital $0 and $1,422,775, respectively.
NOTE 2—Bank Lines of Credit:
The fund participates with other Dreyfus-managed funds in a $225 million unsecured credit facility led by Citibank, N.A. and a $300 million unsecured credit facility provided by The Bank of New York Mellon, a subsidiary of BNY Mellon and an affiliate of Dreyfus (each, a “Facility”), each to be utilized primarily for temporary or emergency purposes, including the financing of redemptions. In connection therewith, the fund has agreed to pay its pro rata portion of commitment fees for each Facility. Interest is charged to the fund based on rates determined pursuant to the terms of the respective Facility at the time of borrowing.
The average amount of borrowings outstanding under the Facilities during the period ended December 31, 2009, was approximately $43,500, with a related weighted average annualized interest rate of 1.52%.
24
NOTE 3—Management Fee and Other Transactions With Affiliates:
(a) Pursuant to a management agreement with the Manager, the management fee is computed at an annual rate of .70% of the value of the fund’s average daily net assets and is payable monthly.
The Manager has contractually agreed, until September 30, 2010, to waive receipt of its fees and/or assume the expenses of the fund so that the direct expenses of Class I shares (excluding taxes, interest, brokerage commissions, commitment fees on borrowings and extraordinary expenses) do not exceed .87%.
In addition, the Manager has agreed, until May 1, 2010, to waive receipt of its fees and/or assume the expenses of the fund so that the direct expenses of Class A and Class C shares (excluding taxes, interest, brokerage commissions, commitment fees on borrowings, extraordinary expenses, shareholder services fees and Rule 12b-1 fees) do not exceed 1.25%.
The reduction in expenses, pursuant to the undertakings, amounted to $6,321 during the period ended December 31, 2009.
During the period ended December 31, 2009, the Distributor retained $466 from commissions earned on sales of the fund’s Class A shares.
(b) Under the Distribution Plan (the “Plan”) adopted pursuant to Rule 12b-1 under the Act, Class C shares pay and Class T shares paid the Distributor for distributing their shares at an annual rate of .75% and .25% of the value of their respective average daily net assets. During the period ended December 31, 2009, Class C and Class T shares were charged $304 and $2, respectively, pursuant to the Plan.
(c) Under the Shareholder Services Plan, Class A and Class C shares pay and Class T shares paid the Distributor at an annual rate of .25% of the value of their average daily net assets for the provision of certain services. The services provided may include personal services relating to shareholder accounts, such as answering shareholder inquiries regarding
The Fund 25
NOTES TO FINANCIAL STATEMENTS (continued)
the fund and providing reports and other information, and services related to the maintenance of shareholder accounts. The Distributor may make payments to Service Agents (a securities dealer, financial institution or other industry professional) in respect of these services. The Distributor determines the amounts to be paid to Service Agents. During the period ended December 31, 2009, Class A, Class C and Class T shares were charged $343, $101, and $2, respectively, pursuant to the Shareholder Services Plan.
The fund compensates Dreyfus Transfer, Inc., a wholly-owned subsidiary of the Manager, under a transfer agency agreement for providing personnel and facilities to perform transfer agency services for the fund. During the period ended December 31, 2009, the fund was charged $12,114 pursuant to the transfer agency agreement, which is included in Shareholder servicing costs in the Statement of Operations.
The fund compensates The Bank of New York Mellon under a cash management agreement for performing cash management services related to fund subscriptions and redemptions. During the period ended December 31, 2009, the fund was charged $1,075 pursuant to the cash management agreement, which is included in Shareholder servicing costs in the Statement of Operations.These fees were offset by earnings credits pursuant to the cash management agreement.
The fund also compensates The Bank of New York Mellon under a custody agreement for providing custodial services for the fund. During the period ended December 31, 2009, the fund was charged $12,898 pursuant to the custody agreement.
During the period ended December 31, 2009, the fund was charged $6,681 for services performed by the Chief Compliance Officer.
The components of “Due to The Dreyfus Corporation and affiliates” in the Statement of Assets and Liabilities consist of: management fees $62,738, Rule 12b-1 distribution plan fees $52, shareholder services plan fees $74, custodian fees $3,153, chief compliance officer fees $5,011 and transfer agency per account fees $1,766.
26
(d) Each Board member also serves as a Board member of other funds within the Dreyfus complex. Annual retainer fees and attendance fees are allocated to each fund based on net assets.
NOTE 4—Securities Transactions:
The aggregate amount of purchases and sales of investment securities, excluding short-term securities and options transactions, during the period ended December 31, 2009, amounted to $65,054,955 and $72,906,975, respectively.
The fund adopted the provisions of ASC Topic 815 “Derivatives and Hedging” which requires qualitative disclosures about objectives and strategies for using derivatives, quantitative disclosures about fair value amounts of gains and losses on derivative instruments and disclosures about credit-risk-related contingent features in derivative agreements. The disclosure requirements distinguish between derivatives, which are accounted for as “hedges” and those that do not qualify for hedge accounting. Because investment companies value their derivatives at fair value and recognize changes in fair value through the Statement of Operations, they do not qualify for such accounting. Accordingly, even though a fund’s investments in derivatives may represent economic hedges, they are considered to be non-hedge transactions for purposes of this disclosure.
Options: A call option gives the purchaser of the option the right (but not the obligation) to buy, and obligates the writer to sell, the underlying security or securities at the exercise price at any time during the option period, or at a specified date. Conversely, a put option gives the purchaser of the option the right (but not the obligation) to sell, and obligates the writer to buy the underlying security or securities at the exercise price at any time during the option period, or at a specified date.The fund may purchase and write (sell) put and call options primarily to hedge against changes in security prices, or securities that the fund intends to purchase, or against fluctuations in value caused by changes in prevailing market interest rates or other market conditions.
The Fund 27
NOTES TO FINANCIAL STATEMENTS (continued)
As a writer of call options, the fund receives a premium at the outset and then bears the market risk of unfavorable changes in the price of the financial instrument underlying the option. Generally, the fund would realize a gain, to the extent of the premium, if the price of the underlying financial instrument decreases between the date the option is written and the date on which the option is terminated. Generally, the fund would incur a loss, if the price of the financial instrument increases between those dates.
As a writer of put options, the fund receives a premium at the outset and then bears the market risk of unfavorable changes in the price of the financial instrument underlying the option. Generally, the fund would realize a gain, to the extent of the premium, if the price of the underlying financial instrument increases between the date the option is written and the date on which the option is terminated. Generally, the fund would incur a loss, if the price of the financial instrument decreases between those dates. As a writer of an option, the fund may have no control over whether the underlying securities may be sold (call) or purchased (put) and as a result bears the market risk of an unfavorable change in the price of the security underlying the written option. One risk of holding a put or a call option is that if the option is not sold or exercised prior to its expiration, it becomes worthless. However, this risk is limite d to the premium paid by the fund. Upon the expiration or closing of the option transaction, a gain or loss is reported in the Statement of Operations.
The following summarizes the fund’s call/put options written for the period ended December 31, 2009:
| Options Terminated | ||||
| Number of | Premiums | Net Realized | ||
| Options Written: | Contracts | Received ($) | Cost ($) | Gain ($) |
| Contracts outstanding | ||||
| December 31, 2008 | — | — | ||
| Contracts written | 500 | 6,300 | ||
| Contracts terminated: | ||||
| Contracts closed | 500 | 6,300 | 2,100 | 4,200 |
| Contracts outstanding | ||||
| December 31, 2009 | — | — | ||
28
At December 31, 2009, the cost of investments for federal income tax purposes was $80,238,016; accordingly, accumulated net unrealized appreciation on investments was $11,388,614, consisting of $14,053,878 gross unrealized appreciation and $2,665,264 gross unrealized depreciation.
NOTE 5—New Accounting Pronouncement:
In January 2010, FASB issued Accounting Standards Update (“ASU”) No. 2010-06 “Improving Disclosures about Fair Value Measurements”. ASU 2010-06 will require reporting entities to make new disclosures about amounts and reasons for significant transfers in and out of Level 1 and Level 2 fair value measurements as well as inputs and valuation techniques used to measure fair value for both recurring and nonrecur-ring fair value measurements that fall in either Level 2 or Level 3, and information on purchases, sales, issuances and settlements on a gross basis in the reconciliation of activity in Level 3 fair value measurements.The new and revised disclosures are required to be implemented for fiscal years beginning after December 15, 2009 except for the disclosures surrounding purchases, sales, issuances and settlements on a gross basis in the reconciliation of Level 3 fair value measurements, which are effective for fiscal years beginning after December 15, 2010. Management is currently evaluating the impact the adoption of ASU No. 2010-06 may have on the fund’s financial statement disclosures.
NOTE 6—Subsequent Events Evaluation:
Dreyfus has evaluated the need for disclosures and/or adjustments resulting from subsequent events through February 25, 2010, the date the financial statements were issued. This evaluation did not result in any subsequent events that necessitated disclosures and/or adjustments.
The Fund 29
REPORT OF INDEPENDENT REGISTERED
PUBLIC ACCOUNTING FIRM
Shareholders and Board of Directors
Dreyfus Large Cap Growth Fund
We have audited the accompanying statement of assets and liabilities, including the statement of investments, of Dreyfus Large Cap Growth Fund (one of the series comprising Dreyfus Premier Investment Funds, Inc.) as of December 31, 2009, and the related statement of operations for the year then ended and the statement of changes in net assets and financial highlights for each of the two years in the period then ended.These financial statements and financial highlights are the responsibility of the Fund’s management. Our responsibility is to express an opinion on these financial statements and financial highlights based on our audits.The financial highlights for the years ended December 31, 2007, 2006 and 2005 were audited by other auditors whose report dated February 28, 2008, expressed an unqualified opinion on such financial highlights.
We conducted our audits in accordance with the standards of the Public Company Accounting Oversight Board (United States).Those standards require that we plan and perform the audit to obtain reasonable assurance about whether the financial statements and financial highlights are free of material misstatement.We were not engaged to perform an audit of the Fund’s internal control over financial reporting. Our audits included consideration of internal control over financial reporting as a basis for designing audit procedures that are appropriate in the circumstances, but not for the purpose of expressing an opinion on the effectiveness of the Fund’s internal control over financial reporting.Accordingly, we express no such opinion. An audit also includes examining, on a test basis, evidence supporting the amounts and disclosures in the financial statements and financial highlights, assessing the accounting principles used and significant estimates made by management, and evaluating the overall financial statement presentation. Our procedures included confirmation of securities owned as of December 31, 2009 by correspondence with the custodian and others.We believe that our audits provide a reasonable basis for our opinion.
In our opinion, the 2009 and 2008 financial statements and financial highlights referred to above present fairly, in all material respects, the financial position of Dreyfus Large Cap Growth Fund at December 31, 2009, the results of its operations for the year then ended and the changes in its net assets and the financial highlights for each of the two years in the period then ended, in conformity with U.S. generally accepted accounting principles.

New York, New York
February 25, 2010
30
| INFORMATION ABOUT THE REVIEW AND APPROVAL |
| OF THE FUND’S MANAGEMENT AGREEMENT (Unaudited) |
At a meeting of the fund’s Board held on December 10, 2009, the Board approved the fund’s Management Agreement with Dreyfus for a six-month term ending July 31, 2010. At a previous meeting of the fund’s Board held on July 9, 2009, the Board approved the fund’s Management Agreement with Dreyfus for a six-month term ending January 31, 2010.The Board members, none of whom are “interested persons” (as defined in the Investment Company Act of 1940, as amended) of the fund, were assisted in their review by independent legal counsel and met with counsel in executive session separate from representatives of Dreyfus. In approving the Management Agreement, the Board considered all factors that it believed to be relevant, including, among other things, the factors discussed below.
Analysis of Nature, Extent and Quality of Services Provided to the Fund. The Board members received a presentation from representatives of Dreyfus regarding services provided to the fund and other funds in the Dreyfus fund complex, and discussed the nature, extent and quality of the services provided to the fund pursuant to its Management Agreement. Dreyfus’ representatives reviewed the fund’s distribution of accounts and the relationships Dreyfus has with various intermediaries and the different needs of each. Dreyfus’ representatives noted the various distribution channels for the fund as well as the diverse methods of distribution among other funds in the Dreyfus fund complex, and Dreyfus’ corresponding need for broad, deep, and diverse resources to be able to provide ongoing shareholder services to each distribution channel, including th ose of the fund. Dreyfus also provided the number of accounts investing in the fund, as well as the fund’s asset size.
The Board members also considered Dreyfus’ research and portfolio management capabilities and Dreyfus’ oversight of day-to-day fund operations, including fund accounting, administration and assistance in meeting legal and regulatory requirements. The Board members also considered Dreyfus’ extensive administrative, accounting and compliance infrastructure.The Board also considered Dreyfus’ brokerage policies and practices, the standards applied in seeking best execution and Dreyfus’ policies and practices regarding soft dollars.
The Fund 31
| INFORMATION ABOUT THE REVIEW AND APPROVAL OF THE |
| FUND’S MANAGEMENT AGREEMENT (Unaudited) (continued) |
Comparative Analysis of the Fund’s Performance and Management Fee and Expense Ratio. The Board members reviewed the fund’s performance for various periods and compared the fund’s performance to the performance of a group of comparable retail front-end load large-cap growth funds (the “Performance Group”) and to a larger universe of funds consisting of all retail and institutional large-cap growth funds (the “Performance Universe”), selected and provided by Lipper, Inc. (“Lipper”), an independent provider of investment company data.The Board was provided with a description of the methodology Lipper used to select the Performance Group and Performance Universe, as well as the Expense Group and Expense Universe (discussed below). The Board members discussed the results of the comparisons and noted that the fund’s t otal return performance was below the Performance Group and Performance Universe medians for all periods except that it was in the second quartile of the Performance Group for the 10-year period, and the second quartile of the Performance Universe for the three-year period, ended October 31, 2009.The Board then noted that the fund’s performance ranked in the first quartile of its Morningstar and Lipper categories for the three-month period ended October 31, 2009 although it was in the third quartile for the one-year ended October 31, 2009.
The Board members discussed with representatives of Dreyfus the reasons for the fund’s underperformance compared to the Performance Group and Performance Universe medians during the applicable periods, citing in particular a period of underperformance during the fourth quarter of 2008. The Board noted Dreyfus’ continuing efforts to improve fund performance.
The Board members also discussed the fund’s actual and contractual management fees and total expense ratio compared to a group of comparable retail front-end load large-cap growth funds (the “Expense Group”) and a broader group of funds consisting of all retail front-end
32
load large-cap growth funds (the“Expense Universe”),each selected and provided by Lipper. The Board noted that Dreyfus has contractually agreed, until September 30, 2010, to waive receipt of its fees and/or assume the expenses of the fund so that the direct expenses of Class I shares (excluding taxes, interest, brokerage commissions, commitment fees on borrowings and extraordinary expenses) do not exceed .87%. In addition, the Board noted that Dreyfus has agreed, until May 1, 2010, to waive receipt of its fee and/or assume the expenses of the fund so that the direct expenses of Class A and C (excluding taxes, interest, brokerage commissions, commitment fees on borrowings, extraordinary fees, shareholder services fees and 12b-1 fees) do not exceed 1.25%. The Board members noted that the fund’s contractual management fee was lower than the Expense Group median, the actual management fee was higher than the Expense Group median (in the third quartile) and lower than the Expense Universe median (in the second quartile) and the total expense ratio was higher than the Expense Group and Expense Universe medians (in the third quartiles).
Representatives of Dreyfus reviewed with the Board members the fees paid to Dreyfus or its affiliates by mutual funds managed by Dreyfus with similar investment objectives, policies and strategies, and included in the same Lipper category as the fund (the “Similar Funds”), and by other accounts managed by Dreyfus or its affiliates with similar investment objectives, policies and strategies as the fund (the “Similar Accounts”). Dreyfus’ representatives explained the nature of the Similar Accounts and the differences, from Dreyfus’ perspective, in providing services to such Similar Accounts as compared to managing and providing services to the fund. Dreyfus’ representatives also reviewed the costs associated with distribution through intermediaries. The Board members considered the relevance of the fee information provided for the Similar Funds and the Similar Accounts to evaluate the appropriat eness and reasonableness of the fund’s management fee.
The Fund 33
| INFORMATION ABOUT THE REVIEW AND APPROVAL OF THE |
| FUND’S MANAGEMENT AGREEMENT (Unaudited) (continued) |
Analysis of Profitability and Economies of Scale. Dreyfus’ representatives reviewed the dollar amount of expenses allocated and profit received by Dreyfus and the method used to determine such expenses and profit. The Board previously had been provided with information prepared by an independent consulting firm regarding Dreyfus’ approach to allocating costs to, and determining the profitability of, individual funds and the entire Dreyfus mutual fund complex.The Board members also had been informed that the methodology had been reviewed by an independent registered public accounting firm which, like the consultant, found the methodology to be reasonable. The consulting firm also analyzed where any economies of scale might emerge in connection with the management of the fund.The Board members evaluated the profitability analysis in light of the relevan t circumstances for the fund and the extent to which economies of scale would be realized if the fund grows and whether fee levels reflect these economies of scale for the benefit of fund investors.The Board members also considered potential benefits to Dreyfus from acting as investment adviser and noted the soft dollar arrangements with respect to trading the fund’s investments.
It was noted that the Board members should consider Dreyfus’ profitability with respect to the fund as part of their evaluation of whether the fees under the Management Agreement bear a reasonable relationship to the mix of services provided by Dreyfus, including the nature, extent and quality of such services and that a discussion of economies of scale is predicated on a fund having achieved a substantial size with increasing assets and that, if a fund’s assets had been static or decreasing, the possibility that Dreyfus may have realized any economies of scale would be less. It also was noted that the profitability percentage for managing the fund was within ranges determined by appropriate court cases to be reasonable given the services rendered and generally superior service levels provided.
34
At the conclusion of these discussions, the Board agreed that it had been furnished with sufficient information to make an informed business decision with respect to re-approving the Management Agreement. Based on the discussions and considerations as described above, the Board made the following conclusions and determinations.
The Board concluded that the nature, extent and quality of the services provided by Dreyfus are adequate and appropriate.
The Board was generally satisfied with the fund’s long-term rela- tive performance.
The Board concluded that the fee payable by the fund to Dreyfus was reasonable in light of the considerations described above.
The Board determined that the economies of scale which may accrue to Dreyfus and its affiliates in connection with the management of the fund had been adequately considered by Dreyfus in connection with the management fee rate charged to the fund and that, to the extent in the future it were determined that material economies of scale had not been shared with the fund, the Board would seek to have those economies of scale shared with the fund.
The Board members considered these conclusions and determinations, along with information received on a routine and regular basis throughout the year, and, without any one factor being dispositive, the Board determined that re-approval of the Management Agreement through July 31, 2010 was in the best interests of the fund and its shareholders.
The Fund 35
BOARD MEMBERS INFORMATION (Unaudited)
36
Once elected all Board Members serve for an indefinite term, but achieve Emeritus status upon reaching age 80.The address of the Board Members and Officers is in c/o The Dreyfus Corporation, 200 Park Avenue, NewYork, NewYork 10166.Additional information about the Board Members is available in the fund’s Statement of Additional Information which can be obtained from Dreyfus free of charge by calling this toll free number: 1-800-554-4611.
Daniel Rose, Emeritus Board Member
Sander Vanocur, Emeritus Board Member
The Fund 37
OFFICERS OF THE FUND (Unaudited)
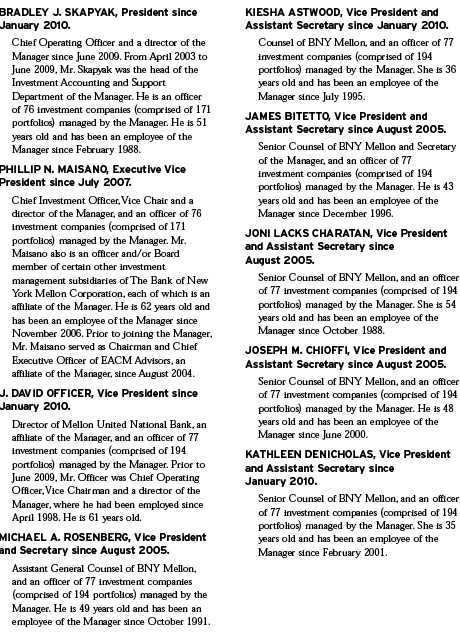
38
The Fund 39
OFFICERS OF THE FUND (Unaudited) (continued)
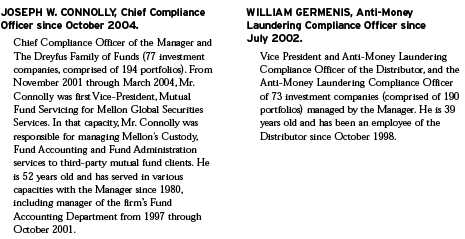
40
For More Information
Telephone Call your financial representative or 1-800-554-4611
Mail The Dreyfus Family of Funds, 144 Glenn Curtiss Boulevard, Uniondale, NY 11556-0144
The fund files its complete schedule of portfolio holdings with the Securities and Exchange Commission (“SEC”) for the first and third quarters of each fiscal year on Form N-Q. The fund’s Forms N-Q are available on the SEC’s website at http://www.sec.gov and may be reviewed and copied at the SEC’s Public Reference Room in Washington, DC. Information on the operation of the Public Reference Room may be obtained by calling 1-800-SEC-0330.
A description of the policies and procedures that the fund uses to determine how to vote proxies relating to portfolio securities, and information regarding how the fund voted these proxies for the most recent 12-month period ended June 30 is available at http://www.dreyfus.com and on the SEC’s website at http://www.sec.gov. The description of the policies and procedures is also available without charge, upon request, by calling 1-800-645-6561.

| Dreyfus |
| Large Cap Value Fund |
ANNUAL REPORT December 31, 2009
Save time. Save paper. View your next shareholder report online as soon as it’s available. Log into www.dreyfus.com and sign up for Dreyfus eCommunications. It’s simple and only takes a few minutes.
The views expressed in this report reflect those of the portfolio manager only through the end of the period covered and do not necessarily represent the views of Dreyfus or any other person in the Dreyfus organization. Any such views are subject to change at any time based upon market or other conditions and Dreyfus disclaims any responsibility to update such views.These views may not be relied on as investment advice and, because investment decisions for a Dreyfus fund are based on numerous factors, may not be relied on as an indication of trading intent on behalf of any Dreyfus fund.

Contents | |
THE FUND | |
| 2 | A Letter from the Chairman and CEO |
| 3 | Discussion of Fund Performance |
| 6 | Fund Performance |
| 8 | Understanding Your Fund’s Expenses |
| 8 | Comparing Your Fund’s Expenses With Those of Other Funds |
| 9 | Statement of Investments |
| 13 | Statement of Assets and Liabilities |
| 14 | Statement of Operations |
| 15 | Statement of Changes in Net Assets |
| 17 | Financial Highlights |
| 20 | Notes to Financial Statements |
| 30 | Report of Independent Registered Public Accounting Firm |
| 31 | Important Tax Information |
| 32 | Information About the Review and Approval of the Fund’s Management Agreement |
| 37 | Board Members Information |
| 39 | Officers of the Fund |
FOR MORE INFORMATION | |
Back Cover |
| Dreyfus |
| Large Cap Value Fund |
The Fund

A LETTER FROM THE CHAIRMAN AND CEO
Dear Shareholder:
We are pleased to present this annual report for Dreyfus Large Cap Value Fund, covering the 12-month period from January 1, 2009, through December 31, 2009.
The U.S. stock market ended 2009 with a healthy annual gain, but market indices across all capitalization ranges and investment styles remained well below the peaks reached in the fall of 2007.The equity market’s advance was driven by improving investor sentiment as the U.S. economy staged a gradual, but sustained, recovery from the recession and banking crisis that had depressed stock prices at the beginning of the year. After four consecutive quarters of contraction, the U.S. economy returned to growth during the third quarter of 2009, buoyed by greater manufacturing activity to replenish depleted inventories and satisfy export demand. The slumping housing market also showed signs of renewed life later in the year when home sales and prices rebounded modestly. However, economic headwinds remain, including a high unemployment rate and the prospect of anemic consumer spending.
As 2010 begins, our Chief Economist, as well as many securities analysts and portfolio managers have continued to find opportunities and survey potential challenges across a variety of asset classes, including equities. While no one can predict the future, we believe that the 2010 investment environment will likely require a broader range of investment considerations relative to last year. As always, your financial adviser can help you determine the mix of investments that may be best suited to helping you achieve your goals at a level of risk that is comfortable for you.
For information about how the fund performed during the reporting period, as well as market perspectives, we have provided a Discussion of Fund Performance.
Thank you for your continued confidence and support.
Jonathan R. Baum
Chairman and Chief Executive Officer
The Dreyfus Corporation
January 15, 2010
2

DISCUSSION OF FUND PERFORMANCE
For the reporting period of January 1, 2009, through December 31, 2009, as provided by Julianne McHugh and Brian Ferguson, Portfolio Managers
Fund and Market Performance Overview
For the 12-month period ended December 31, 2009, Dreyfus Large Cap Value Fund’s Class A shares, produced a total return of 17.10%, Class C shares returned 16.43% and Class I shares returned 17.99%.1 In comparison, the fund’s benchmark, the Russell 1000 Value Index (the “Index”), produced a total return of 19.69% for the same period.2
Stocks rallied over much of 2009 as credit markets thawed and investors looked forward to better economic times. However, large-cap value stocks generally advanced less robustly than their smaller and more growth-oriented counterparts.The fund produced lower returns than its benchmark, due primarily to shortfalls in the consumer discretionary sector.
The Fund’s Investment Approach
The fund seeks to provide long-term capital appreciation; its secondary goal is current income.To pursue these goals, the fund normally invests at least 80% of its assets in equity securities of large capitalization companies with market capitalizations of $5 billion or more at the time of purchase.The fund invests primarily in equity securities of U.S. issuers, but may invest up to 20% of its assets in equity securities of foreign issuers, including those in emerging markets.
When choosing stocks,we focus on individual stock selection (a“bottom up” approach) rather than forecasting stock market trends.We employ a three-step value screening process that seeks to identify the stocks of companies that are underpriced relative to their intrinsic worth or business prospects, and that exhibit sound business fundamentals, positive business momentum or a catalyst that may trigger an improving stock price.
U.S. Stock Market Rebounded Sharply
As 2009 began, securities markets were reeling from a global financial crisis that nearly led to the collapse of the worldwide banking system.
The Fund 3
DISCUSSION OF FUND PERFORMANCE (continued)
In addition, rising unemployment and declining housing markets had produced the most severe recession since the 1930s.These influences fueled a bear market that drove stocks to multi-year lows during the first quarter of the year.
Market sentiment began to improve in early March, as aggressive measures adopted by government and monetary authorities to repair the credit markets gained traction. Additional evidence of economic stabilization later appeared, sparking a sustained market rally through year-end. Smaller, lower-quality companies generally led the rally as investors sought bargains among stocks that had been severely punished in the downturn.
Stock Selection Strategy Drove Fund Performance
Although investor behavior during the downturn was motivated more by fear of losses than the strengths and weaknesses of individual companies, our stock selection strategy proved relatively effective, helping to cushion market declines. Our process continued to find value-oriented opportunities during the rally over the remainder of 2009, but returns were particularly strong among benchmark components that did not meet our investment criteria, causing the fund to lag the Russell 1000Value Index.
Disappointments were particularly pronounced in the economically sensitive consumer discretionary sector, where poor timing in the purchase and sale of used car chain AutoZone weighed on the fund’s relative performance.The fund did not own Ford Motor Company as the recession-stressed company did not meet our investment criteria, but Ford rallied strongly when it became clearer that bankruptcy was unlikely. Instead, we preferred automobile-related investments such as Johnson Controls, which does business with a variety of automakers but lagged sector averages. In the relatively small utilities sector, the fund encountered difficulties with several regulated electricity producers when proposed regulatory reforms were delayed.
On a more positive note, the fund’s relative performance was especially strong in the energy sector, where a more constructive investment posture helped bolster the fund’s results as rising commodity prices drove stock prices higher.An underweighted position in industry bellwether Exxon Mobil boosted relative returns when investors turned toward
4
less defensive investments in the rally. Instead, we focused on smaller oil producers such as Occidental Petroleum, which advanced due to an attractive valuation and strong growth prospects.
In the health care sector, the fund benefited from favorable timing in trades involving pharmaceutical developer Wyeth Pharmaceuticals, which was acquired by a former rival at a substantial premium to its prevailing stock price.We sold the stock soon after the acquisition was announced, avoiding subsequent declines stemming from arbitrage activity among institutional investors.
Positioned for a Global Economic Recovery
As of the reporting period’s end, the economy appears to be gaining strength, and we have seen signs that investors have been refocusing on companies with healthy finances and strong business fundamentals.In our judgment, these developments could lead to an investment environment that is especially well suited to our stock selection process. Indeed, we have continued to find attractive opportunities among multinational companies, especially in the information technology and consumer discretionary sectors, that appear poised to prosper during an economic rebound that may be more robust overseas than in the United States.We have found fewer opportunities in the industrials and utilities sectors.
January 15, 2010
| 1 | Total return includes reinvestment of dividends and any capital gains paid, and does not take into |
| consideration the maximum initial sales charge in the case of Class A shares, or the applicable | |
| contingent deferred sales charge imposed on redemptions in the case of Class C shares. Had these | |
| charges been reflected, returns would have been lower. Past performance is no guarantee of future | |
| results. Share price and investment return fluctuate such that upon redemption, fund shares may be | |
| worth more or less than their original cost. Return figures provided reflect the absorption of certain | |
| fund expenses by The Dreyfus Corporation pursuant to an undertaking in effect for Classes A | |
| and C through May 1, 2010, and in effect for Class I through September 30, 2010, at which | |
| time it may be extended, terminated or modified. Had these expenses not been absorbed, the | |
| fund’s returns would have been lower. | |
| 2 | SOURCE: LIPPER INC. — Reflects the reinvestment of dividends and, where applicable, |
| capital gain distributions.The Russell 1000 Value Index is an unmanaged index, which measures | |
| the performance of those Russell 1000 companies with lower price-to-book ratios and lower | |
| forecasted growth values. |
The Fund 5
FUND PERFORMANCE
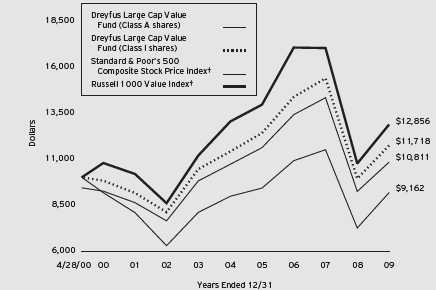
| Comparison of change in value of $10,000 investment in Dreyfus Large Cap Value Fund Class A |
| shares and Class I shares with the Standard and Poor’s 500 Composite Stock Price Index and the |
| Russell 1000 Value Index |
| † Source: Lipper Inc. |
| Past performance is not predictive of future performance. |
| The above graph compares a $10,000 investment made in Class A and Class I shares of Dreyfus Large Cap Value |
| Fund on 4/28/00 (inception date) to a $10,000 investment made in the Standard & Poor’s 500 Composite Stock |
| Price Index (the “S&P 500 Index”) and the Russell 1000 Value Index on that date. For comparative purposes, the |
| value of the Index on 4/30/00 is used as the beginning value on 4/28/00. All dividends and capital gain |
| distributions are reinvested. |
| Effective March 5, 2009, Dreyfus Large Cap Value Fund changed its benchmark from the S&P 500 Index to the |
| Russell 1000 Value Index. In future reports, the fund’s performance will no longer be compared to the S&P 500 Index |
| because the Russell 1000 Value Index is more reflective of the fund’s portfolio investment profile. |
| The fund’s performance shown in the line graph takes into account the maximum initial sales charge on Class A shares |
| and all other applicable fees and expenses. Performance for Class C shares will vary from the performance of Class A |
| shares and Class I shares shown above due to differences in charges and expenses.The S&P 500 Index is a widely |
| accepted, unmanaged index of U.S. stock market performance.The Russell 1000 Value Index is an unmanaged index, |
| which measures the performance of those Russell 1000 companies with lower price-to-book ratios and lower forecasted |
| growth values. Unlike a mutual fund, the indices are not subject to charges, fees and other expenses. Investors cannot |
| invest directly in any index. Further information relating to fund performance, including expense reimbursements, if |
| applicable, is contained in the Financial Highlights section of the prospectus and elsewhere in this report. |
6
| Average Annual Total Returns as of 12/31/09 | ||||
| Inception | From | |||
| Date | 1 Year | 5 Years | Inception | |
| Class A shares | ||||
| with maximum sales charge (5.75%) | 5/21/02 | 10.37% | –0.99% | 0.81%†† |
| without sales charge | 5/21/02 | 17.10% | 0.19% | 1.43%†† |
| Class C shares | ||||
| with applicable redemption charge † | 9/13/08 | 15.43% | –0.08%†† | 1.29%†† |
| without redemption | 9/13/08 | 16.43% | –0.08%†† | 1.29%†† |
| Class I shares | 4/28/00 | 17.99% | 0.56% | 1.65% |
| Past performance is not predictive of future performance.The fund’s performance shown in the graph and table does not | |
| reflect the deduction of taxes that a shareholder would pay on fund distributions or the redemption of fund shares. | |
| † | The maximum contingent deferred sales charge for Class C shares is 1% for shares redeemed within one year of the |
| date of purchase. | |
| †† | The total return performance figures presented for Class A and Class C shares of the fund reflect the performance of |
| the fund’s Class I shares for periods prior to 5/21/02 and 9/13/08 (the inception dates for Class A and Class C | |
| shares, respectively), adjusted to reflect the applicable sales load for that class. | |
The Fund 7
UNDERSTANDING YOUR FUND’S EXPENSES (Unaudited)
As a mutual fund investor, you pay ongoing expenses, such as management fees and other expenses. Using the information below, you can estimate how these expenses affect your investment and compare them with the expenses of other funds.You also may pay one-time transaction expenses, including sales charges (loads) and redemption fees, which are not shown in this section and would have resulted in higher total expenses. For more information, see your fund’s prospectus or talk to your financial adviser.
Review your fund’s expenses
The table below shows the expenses you would have paid on a $1,000 investment in Dreyfus Large CapValue Fund from July 1, 2009 to December 31, 2009. It also shows how much a $1,000 investment would be worth at the close of the period, assuming actual returns and expenses.
Expenses and Value of a $1,000 Investment
assuming actual returns for the six months ended December 31, 2009
| Class A | Class C | Class I | |
| Expenses paid per $1,000† | $ 8.29 | $ 12.08 | $ 4.43 |
| Ending value (after expenses) | $1,192.80 | $1,188.10 | $1,196.40 |
COMPARING YOUR FUND’S EXPENSES
WITH THOSE OF OTHER FUNDS (Unaudited)
Using the SEC’s method to compare expenses
The Securities and Exchange Commission (SEC) has established guidelines to help investors assess fund expenses. Per these guidelines, the table below shows your fund’s expenses based on a $1,000 investment, assuming a hypothetical 5% annualized return. You can use this information to compare the ongoing expenses (but not transaction expenses or total cost) of investing in the fund with those of other funds.All mutual fund shareholder reports will provide this information to help you make this comparison. Please note that you cannot use this information to estimate your actual ending account balance and expenses paid during the period.
Expenses and Value of a $1,000 Investment
assuming a hypothetical 5% annualized return for the six months ended December 31, 2009
| Class A | Class C | Class I | |
| Expenses paid per $1,000† | $ 7.63 | $ 11.12 | $ 4.08 |
| Ending value (after expenses) | $1,017.64 | $1,014.17 | $1,021.17 |
| † Expenses are equal to the fund’s annualized expense ratio of 1.50% for Class A, 2.19% for Class C and .80% |
| for Class I, multiplied by the average account value over the period, multiplied by 184/365 (to reflect the one-half |
| year period). |
8
| STATEMENT OF INVESTMENTS |
| December 31, 2009 |
| Common Stocks—99.8% | Shares | Value ($) |
| Consumer Discretionary—11.3% | ||
| Best Buy | 18,020 | 711,069 |
| Carnival | 33,660 a | 1,066,685 |
| Dollar General | 26,770 | 600,451 |
| Home Depot | 66,640 | 1,927,895 |
| Johnson Controls | 41,410 | 1,128,008 |
| Limited Brands | 30,150 | 580,086 |
| News, Cl. A | 91,230 | 1,248,939 |
| Omnicom Group | 29,740 | 1,164,321 |
| Staples | 22,810 | 560,898 |
| Target | 11,270 | 545,130 |
| Time Warner | 72,520 | 2,113,233 |
| Toll Brothers | 18,880 a | 355,133 |
| Walt Disney | 17,620 | 568,245 |
| 12,570,093 | ||
| Consumer Staples—7.0% | ||
| Coca-Cola Enterprises | 25,330 | 536,996 |
| CVS Caremark | 57,130 | 1,840,157 |
| Kellogg | 21,420 | 1,139,544 |
| PepsiCo | 36,140 | 2,197,312 |
| Philip Morris International | 21,580 | 1,039,940 |
| Procter & Gamble | 17,600 | 1,067,088 |
| 7,821,037 | ||
| Energy—18.8% | ||
| Chevron | 55,500 | 4,272,945 |
| ConocoPhillips | 46,200 | 2,359,434 |
| Devon Energy | 9,720 | 714,420 |
| EOG Resources | 22,350 | 2,174,655 |
| Exxon Mobil | 44,540 | 3,037,183 |
| Hess | 20,600 | 1,246,300 |
| Marathon Oil | 25,720 | 802,978 |
| Occidental Petroleum | 63,250 | 5,145,388 |
| Peabody Energy | 12,980 | 586,826 |
| Schlumberger | 9,140 | 594,923 |
| 20,935,052 |
The Fund 9
STATEMENT OF INVESTMENTS (continued)
| Common Stocks (continued) | Shares | Value ($) |
| Financial—24.1% | ||
| ACE | 10,530 a | 530,712 |
| Aflac | 12,830 | 593,388 |
| American Express | 15,920 | 645,078 |
| Ameriprise Financial | 27,590 | 1,071,044 |
| AON | 20,780 | 796,705 |
| Bank of America | 190,250 | 2,865,165 |
| Capital One Financial | 9,160 | 351,194 |
| Citigroup | 354,330 | 1,172,832 |
| Goldman Sachs Group | 12,950 | 2,186,478 |
| JPMorgan Chase & Co. | 115,440 | 4,810,385 |
| Marsh & McLennan Cos. | 33,110 | 731,069 |
| MetLife | 44,230 | 1,563,530 |
| Morgan Stanley | 47,340 | 1,401,264 |
| Prudential Financial | 18,730 | 932,005 |
| State Street | 22,340 | 972,684 |
| SunTrust Banks | 26,630 | 540,323 |
| Travelers Cos. | 32,050 | 1,598,013 |
| U.S. Bancorp | 47,640 | 1,072,376 |
| Wells Fargo & Co. | 112,550 | 3,037,725 |
| 26,871,970 | ||
| Health Care—10.4% | ||
| AmerisourceBergen | 25,860 | 674,170 |
| Amgen | 19,100 a | 1,080,487 |
| Covidien | 25,840 | 1,237,478 |
| Johnson & Johnson | 12,660 | 815,431 |
| McKesson | 9,310 | 581,875 |
| Merck & Co. | 40,180 | 1,468,177 |
| Pfizer | 193,960 | 3,528,132 |
| Thermo Fisher Scientific | 12,120 a | 578,003 |
| UnitedHealth Group | 16,350 | 498,348 |
| Warner Chilcott, Cl. A | 21,463 a | 611,052 |
| WellPoint | 9,120 a | 531,605 |
| 11,604,758 |
10
| Common Stocks (continued) | Shares | Value ($) |
| Industrial—6.9% | ||
| Dover | 14,070 | 585,453 |
| Eaton | 15,500 | 986,110 |
| General Electric | 125,400 | 1,897,302 |
| Honeywell International | 13,660 | 535,472 |
| Raytheon | 15,970 | 822,774 |
| Republic Services | 21,010 | 594,793 |
| Tyco International | 17,620 | 628,682 |
| Union Pacific | 25,970 | 1,659,483 |
| 7,710,069 | ||
| Information Technology—8.6% | ||
| AOL | 6,936 a | 161,479 |
| Cisco Systems | 96,170 a | 2,302,310 |
| EMC | 35,360 a | 617,739 |
| Hewlett-Packard | 39,300 | 2,024,343 |
| Microsoft | 88,060 | 2,684,949 |
| Tyco Electronics | 50,070 | 1,229,218 |
| Western Union | 27,080 | 510,458 |
| 9,530,496 | ||
| Materials—3.9% | ||
| Air Products & Chemicals | 10,330 | 837,350 |
| Dow Chemical | 45,280 | 1,251,086 |
| Freeport-McMoRan Copper & Gold | 14,020 | 1,125,666 |
| International Paper | 43,540 | 1,166,001 |
| 4,380,103 | ||
| Telecommunication Services—2.9% | ||
| AT & T | 94,970 | 2,662,009 |
| Vodafone Group, ADR | 25,170 | 581,175 |
| 3,243,184 | ||
| Utilities—5.9% | ||
| Entergy | 21,180 | 1,733,371 |
| Exelon | 14,060 | 687,112 |
| FPL Group | 15,620 | 825,048 |
| NRG Energy | 23,890 a | 564,043 |
The Fund 11
STATEMENT OF INVESTMENTS (continued)
| Common Stocks (continued) | Shares | Value ($) |
| Utilities (continued) | ||
| PG & E | 13,210 | 589,827 |
| Questar | 33,370 | 1,387,191 |
| Southern | 24,860 | 828,335 |
| 6,614,927 | ||
| Total Common Stocks | ||
| (cost $122,868,746) | 111,281,689 | |
| Preferred Stocks—.4% | ||
| Financial | ||
| Bank of America (Convertible) | ||
| (cost $432,750) | 28,850 a | 430,442 |
| Total Investments (cost $123,301,496) | 100.2% | 111,712,131 |
| Liabilities, Less Cash and Receivables | (.2%) | (263,402) |
| Net Assets | 100.0% | 111,448,729 |
| ADR—American Depository Receipts |
| a Non-income producing security. |
| Portfolio Summary (Unaudited)† | |||
| Value (%) | Value (%) | ||
| Financial | 24.5 | Industrial | 6.9 |
| Energy | 18.8 | Utilities | 5.9 |
| Consumer Discretionary | 11.3 | Materials | 3.9 |
| Health Care | 10.4 | Telecommunication Services | 2.9 |
| Information Technology | 8.6 | ||
| Consumer Staples | 7.0 | 100.2 | |
| † Based on net assets. |
| See notes to financial statements. |
12
| STATEMENT OF ASSETS AND LIABILITIES |
| December 31, 2009 |
| Cost | Value | |
| Assets ($): | ||
| Investments in securities—See Statement of Investments: | 123,301,496 | 111,712,131 |
| Cash | 46,678 | |
| Receivable for investment securities sold | 1,905,047 | |
| Dividends receivable | 145,005 | |
| 113,808,861 | ||
| Liabilities ($): | ||
| Due to The Dreyfus Corporation and affiliates—Note 3(c) | 87,375 | |
| Bank loan payable | 1,200,000 | |
| Payable for investment securities purchased | 570,837 | |
| Payable for shares of Common Stock redeemed | 420,505 | |
| Interest payable—Note 2 | 702 | |
| Accrued expenses | 80,713 | |
| 2,360,132 | ||
| Net Assets ($) | 111,448,729 | |
| Composition of Net Assets ($): | ||
| Paid-in capital | 160,318,936 | |
| Accumulated undistributed investment income—net | 30,927 | |
| Accumulated net realized gain (loss) on investments | (37,311,769) | |
| Accumulated net unrealized appreciation | ||
| (depreciation) on investments | (11,589,365) | |
| Net Assets ($) | 111,448,729 |
| Net Asset Value Per Share | |||
| Class A | Class C | Class I | |
| Net Assets ($) | 308,710 | 18,453 | 111,121,566 |
| Shares Outstanding | 40,815 | 2,455 | 14,696,808 |
| Net Asset Value Per Share ($) | 7.56 | 7.52 | 7.56 |
See notes to financial statements.
The Fund 13
| STATEMENT OF OPERATIONS |
| Year Ended December 31, 2009 |
| Investment Income ($): | |
| Income: | |
| Cash dividends (net of $23,974 foreign taxes withheld at source): | |
| Unaffiliated issuers | 3,252,682 |
| Affiliated issuers | 482 |
| Income from securities lending—Note 1(b) | 1,199 |
| Total Income | 3,254,363 |
| Expenses: | |
| Management fee—Note 3(a) | 890,080 |
| Registration fees | 54,089 |
| Professional fees | 46,645 |
| Prospectus and shareholders’ reports | 19,691 |
| Directors’ fees and expenses—Note 3(d) | 12,792 |
| Custodian fees—Note 3(c) | 6,209 |
| Interest expense—Note 2 | 3,362 |
| Loan commitment fees—Note 2 | 1,577 |
| Shareholder servicing costs—Note 3(c) | 443 |
| Distribution fees—Note 3(b) | 59 |
| Miscellaneous | 48 |
| Total Expenses | 1,034,995 |
| Less—reduction in expenses due to undertaking—Note 3(a) | (10,769) |
| Less—reduction in fees due to earnings credits—Note 1(b) | (443) |
| Net Expenses | 1,023,783 |
| Investment Income—Net | 2,230,580 |
| Realized and Unrealized Gain (Loss) on Investments—Note 4 ($): | |
| Net realized gain (loss) on investments | (29,181,005) |
| Net unrealized appreciation (depreciation) on investments | 41,580,400 |
| Net Realized and Unrealized Gain (Loss) on Investments | 12,399,395 |
| Net Increase in Net Assets Resulting from Operations | 14,629,975 |
See notes to financial statements.
14
STATEMENT OF CHANGES IN NET ASSETS
| Year Ended December 31, | ||
| 2009a | 2008b,c | |
| Operations ($): | ||
| Investment income—net | 2,230,580 | 4,700,586 |
| Net realized gain (loss) on investments | (29,181,005) | (10,798,000) |
| Net unrealized appreciation | ||
| (depreciation) on investments | 41,580,400 | (96,659,901) |
| Net Increase (Decrease) in Net Assets | ||
| Resulting from Operations | 14,629,975 | (102,757,315) |
| Dividends to Shareholders from ($): | ||
| Investment income—net: | ||
| Class A Shares | (4,915) | (10,966) |
| Class C Shares | (68) | — |
| Class I Shares | (2,194,670) | (3,308,880) |
| Net realized gain on investments: | ||
| Class A Shares | — | (54,754) |
| Class I Shares | — | (14,549,522) |
| Return of capital: | ||
| Class A Shares | — | (48,122) |
| Class I Shares | — | (12,787,316) |
| Total Dividends | (2,199,653) | (30,759,560) |
| Capital Stock Transactions ($): | ||
| Net proceeds from shares sold: | ||
| Class A Shares | 193,228 | 101,767 |
| Class C Shares | 10,000 | 10,000 |
| Class I Shares | 5,458,263 | 227,580,332 |
| Class T Shares | — | 10,000 |
| Dividends reinvested: | ||
| Class A Shares | 4,640 | 113,806 |
| Class I Shares | 142,701 | 25,204,314 |
| Cost of shares redeemed: | ||
| Class A Shares | (2,761) | (1,024,375) |
| Class I Shares | (74,032,212)d | (281,722,399) |
| Class T Shares | (6,565) | — |
| Increase (Decrease) in Net Assets | ||
| from Capital Stock Transactions | (68,232,706) | (29,726,555) |
| Total Increase (Decrease) in Net Assets | (55,802,384) | (163,243,430) |
| Net Assets ($): | ||
| Beginning of Period | 167,251,113 | 330,494,543 |
| End of Period | 111,448,729 | 167,251,113 |
| Undistributed investment income—net | 30,927 | — |
The Fund 15
STATEMENT OF CHANGES IN NET ASSETS (continued)
| Year Ended December 31, | ||
| 2009a | 2008b,c | |
| Capital Share Transactions: | ||
| Class Ae | ||
| Shares sold | 27,668 | 14,326 |
| Shares issued for dividends reinvested | 612 | 12,702 |
| Shares redeemed | (409) | (119,219) |
| Net Increase (Decrease) in Shares Outstanding | 27,871 | (92,191) |
| Class C | ||
| Shares sold | 1,321 | 1,134 |
| Class I | ||
| Shares sold | 911,459 | 22,647,022 |
| Shares issued for dividends reinvested | 18,826 | 2,852,909 |
| Shares redeemed | (11,816,423) | (28,535,382) |
| Net Increase (Decrease) in Shares Outstanding | (10,886,138) | (3,035,451) |
| Class Te | ||
| Shares sold | — | 1,134 |
| Shares redeemed | (1,134) | — |
| Net Increase (Decrease) in Shares Outstanding | (1,134) | 1,134 |
| a Effective as of the close of business on February 4, 2009, the fund no longer offers Class T shares. |
| b The fund commenced offering four classes of shares on the close of business September 12, 2008.The existing shares |
| were redesignated and the fund added Class C and Class T shares. |
| c Represents information for the fund’s predecessor, BNY Hamilton Large Cap Value Fund, through September 12, 2008. |
| d Includes redemption-in-kind amounting to $19,314,039. |
| e On the close of business on February 4, 2009, 1,134 Class T shares representing $6,565 were converted to 1,126 |
| Class A shares. |
See notes to financial statements.
16
FINANCIAL HIGHLIGHTS
Please note that the financial highlights information in the following tables for the fund’s Class A and Class I shares represents the financial highlights of the Class A and Institutional Shares, respectively, of the fund’s predecessor, BNY Hamilton Large Cap Value Fund (“Hamilton Large Cap Value Fund”), before the fund commenced operations as of the close of business on September 12, 2008, and represents the performance of the fund’s Class A and Class I shares thereafter. Before the fund commenced operations, all of the assets of the Hamilton Large Cap Value Fund were transferred to the fund in exchange for Class A and Class I shares of the fund in a tax-free reorganization.Total return shows how much your investment in the fund would have increased (or decreased) during each period, assuming you had reinvested all dividends and distributions. These figures have been derived from the fund’s and t he fund’s predecessor’s financial statements.
| Year Ended December 31, | |||||
| Class A Shares† | 2009 | 2008 | 2007 | 2006 | 2005 |
| Per Share Data ($): | |||||
| Net asset value, beginning of period | 6.56 | 11.55 | 11.85 | 11.24 | 10.81 |
| Investment Operations: | |||||
| Investment income—neta | .05 | .15 | .25 | .18 | .15 |
| Net realized and unrealized gain | |||||
| (loss) on investments | 1.07 | (3.93) | .56 | 1.53 | .76 |
| Total from Investment Operations | 1.12 | (3.78) | .81 | 1.71 | .91 |
| Distributions: | |||||
| Dividends from investment income—net | (.12) | (.11) | (.26) | (.18) | (.14) |
| Dividends from net realized | |||||
| gain on investments | — | (.59) | (.85) | (.92) | (.34) |
| Return of capital | — | (.51) | — | — | — |
| Total Distributions | (.12) | (1.21) | (1.11) | (1.10) | (.48) |
| Net asset value, end of period | 7.56 | 6.56 | 11.55 | 11.85 | 11.24 |
| Total Return (%)b | 17.10 | (35.49) | 6.78 | 15.41 | 8.45 |
| Ratios/Supplemental Data (%): | |||||
| Ratio of total expenses | |||||
| to average net assets | 2.11 | 1.07 | 1.04 | 1.03 | 1.06 |
| Ratio of net expenses | |||||
| to average net assets | 1.46 | 1.05 | 1.04 | 1.03 | 1.05 |
| Ratio of net investment income | |||||
| to average net assets | .78 | 1.38 | 2.04 | 1.50 | 1.33 |
| Portfolio Turnover Rate | 76.38 | 133 | 34 | 59 | 43 |
| Net Assets, end of period ($ x 1,000) | 309 | 85 | 1,214 | 1,371 | 1,015 |
| † Represents information for Class A shares of the fund’s predecessor, BNY Hamilton Large Cap Value Fund, through |
| September 12, 2008. |
| a Based on average shares outstanding at each month end. |
| b Exclusive of sales charge. |
See notes to financial statements.
The Fund 17
FINANCIAL HIGHLIGHTS (continued)
| Year Ended December 31, | ||
| Class C Shares | 2009 | 2008a |
| Per Share Data ($): | ||
| Net asset value, beginning of period | 6.51 | 8.82 |
| Investment Operations: | ||
| Investment income—netb | .02 | .03 |
| Net realized and unrealized gain (loss) on investments | 1.05 | (2.34) |
| Total from Investment Operations | 1.07 | (2.31) |
| Distributions: | ||
| Dividends from investment income—net | (.06) | — |
| Net asset value, end of period | 7.52 | 6.51 |
| Total Return (%)c | 16.43 | (26.19)d |
| Ratios/Supplemental Data (%): | ||
| Ratio of total expenses to average net assets | 2.44 | 2.09e |
| Ratio of net expenses to average net assets | 2.15 | 1.98e |
| Ratio of net investment income to average net assets | .27 | 1.39e |
| Portfolio Turnover Rate | 76.38 | 133 |
| Net Assets, end of period ($ x 1,000) | 18 | 7 |
| a | From September 13, 2008 (commencement of initial offering) to December 31, 2008. |
| b | Based on average shares outstanding at each month end. |
| c | Exclusive of sales charge. |
| d | Not annualized. |
| e | Annualized. |
See notes to financial statements.
18
| Year Ended December 31, | |||||
| Class I Shares† | 2009 | 2008 | 2007 | 2006 | 2005 |
| Per Share Data ($): | |||||
| Net asset value, beginning of period | 6.53 | 11.51 | 11.81 | 11.19 | 10.76 |
| Investment Operations: | |||||
| Investment income—neta | .11 | .18 | .28 | .21 | .18 |
| Net realized and unrealized gain | |||||
| (loss) on investments | 1.07 | (3.93) | .56 | 1.54 | .76 |
| Total from Investment Operations | 1.18 | (3.75) | .84 | 1.75 | .94 |
| Distributions: | |||||
| Dividends from investment income—net | (.15) | (.13) | (.29) | (.21) | (.17) |
| Dividends from net realized | |||||
| gain on investments | — | (.59) | (.85) | (.92) | (.34) |
| Return of capital | — | (.51) | — | — | — |
| Total Distributions | (.15) | (1.23) | (1.14) | (1.13) | (.51) |
| Net asset value, end of period | 7.56 | 6.53 | 11.51 | 11.81 | 11.19 |
| Total Return (%) | 17.99 | (35.40) | 7.07 | 15.84 | 8.74 |
| Ratios/Supplemental Data (%): | |||||
| Ratio of total expenses | |||||
| to average net assets | .81 | .83 | .79 | .78 | .81 |
| Ratio of net expenses | |||||
| to average net assets | .80 | .80 | .79 | .78 | .80 |
| Ratio of net investment income | |||||
| to average net assets | 1.76 | 1.85 | 2.31 | 1.76 | 1.59 |
| Portfolio Turnover Rate | 76.38 | 133 | 34 | 59 | 43 |
| Net Assets, end of period ($ x 1,000) | 111,122 | 167,151 | 329,281 | 361,395 | 310,927 |
| † Represents information for Institutional shares of the fund’s predecessor, BNY Hamilton Large Cap Value Fund, |
| through September 12, 2008. |
| a Based on average shares outstanding at each month end. |
See notes to financial statements.
The Fund 19
NOTES TO FINANCIAL STATEMENTS
NOTE 1—Significant Accounting Policies:
Dreyfus Large CapValue Fund (the “fund”) is a separate diversified series of Dreyfus Premier Investment Funds, Inc. (the “Company”), which is registered under the Investment Company Act of 1940, as amended (the “Act”), as an open-end management investment company and operates as a series company currently offering ten series, including the fund.The fund’s investment objective is long-term capital appreciation. The Dreyfus Corporation (the “Manager” or “Dreyfus”), a wholly-owned subsidiary of The Bank of New York Mellon Corporation (“BNY Mellon”), serves as the fund’s investment adviser.
MBSC Securities Corporation (the “Distributor”), a wholly-owned subsidiary of the Manager, is the distributor of the fund’s shares.The fund is authorized to issue 250 million shares of $.001 par value Common Stock. The fund currently offers three classes of shares: Class A (100 million shares authorized), Class C (50 million shares authorized) and Class I (100 million shares authorized).Class A shares are subject to a sales charge imposed at the time of purchase. Class C shares are subject to a contingent deferred sales charge (“CDSC”) imposed on Class C shares redeemed within one year of purchase and Class I shares are sold at net asset value per share only to institutional investors. Other differences between the classes include the services offered to and the expenses borne by each class, the allocation of certain transfer agency costs and certain voting rights. Income, expenses (other than expenses attributable to a specific class), and realized and unrealized gains or losses on investments are allocated to each class of shares based on its relative net assets.
Effective December 3, 2008, investments for new accounts were no longer permitted in Class T shares of the fund, except that participants in certain group retirement plans were able to open a new account in Class T shares of the fund, provided that the fund was established as an investment option under the plans before December 3, 2008. On February 4, 2009, the fund issued to each holder of its Class T shares, in exchange for said shares, Class A shares of the fund having an aggregate net asset value equal to the aggregate net asset value of the shareholder’s Class T shares. Subsequent investments in the fund’s Class A
20
shares made by prior holders of the fund’s Class T shares who received Class A shares of the fund in exchange for their Class T shares are subject to the front-end sales load schedule that was in effect for Class T shares at the time of the exchange. Otherwise, all other Class A share attributes will be in effect. Effective as of the close of business on February 4, 2009, the fund no longer offers Class T shares.
As of December 31, 2009, MBC Investments Corp., an indirect subsidiary of BNY Mellon, held 2,253 Class A and 1,134 Class C shares of the fund.
The Company accounts separately for the assets, liabilities and operations of each series. Expenses directly attributable to each series are charged to that series’ operations; expenses which are applicable to all series are allocated among them on a pro rata basis.
The Financial Accounting Standards Board (“FASB”) Accounting Standards Codification (“ASC”) has become the exclusive reference of authoritative U.S. generally accepted accounting principles (“GAAP”) recognized by the FASB to be applied by nongovernmental entities. Rules and interpretive releases of the Securities and Exchange Commission (“SEC”) under authority of federal laws are also sources of authoritative GAAP for SEC registrants. The ASC has superseded all existing non-SEC accounting and reporting standards. The fund’s financial statements are prepared in accordance with GAAP, which may require the use of management estimates and assumptions.Actual results could differ from those estimates.
The Company enters into contracts that contain a variety of indemnifications. The fund’s maximum exposure under these arrangements is unknown.The fund does not anticipate recognizing any loss related to these arrangements.
(a) Portfolio valuation: Investments in securities are valued at the last sales price on the securities exchange or national securities market on which such securities are primarily traded. Securities listed on the National Market System for which market quotations are available are valued at the official closing price or, if there is no official closing price
The Fund 21
NOTES TO FINANCIAL STATEMENTS (continued)
that day, at the last sales price. Securities not listed on an exchange or the national securities market, or securities for which there were no transactions, are valued at the average of the most recent bid and asked prices, except for open short positions, where the asked price is used for valuation purposes. Bid price is used when no asked price is available. Registered investment companies that are not traded on an exchange are valued at their net asset value.When market quotations or official closing prices are not readily available, or are determined not to reflect accurately fair value, such as when the value of a security has been significantly affected by events after the close of the exchange or market on which the security is principally traded (for example, a foreign exchange or market), but before the fund calculates its net asset value, the fund may value these investments at fair value as determined in accordance with the procedures approved by the Board of Directors. Fair valuing of securities may be determined with the assistance of a pricing service using calculations based on indices of domestic securities and other appropriate indicators, such as prices of relevant ADRs and futures contracts. For other securities that are fair valued by the Board of Directors, certain factors may be considered such as: fundamental analytical data, the nature and duration of restrictions on disposition, an evaluation of the forces that influence the market in which the securities are purchased and sold, and public trading in similar securities of the issuer or comparable issuers. Financial futures are valued at the last sales price.
The fair value of a financial instrument is the amount that would be received to sell an asset or paid to transfer a liability in an orderly transaction between market participants at the measurement date (i.e. the exit price). GAAP establishes a fair value hierarchy that prioritizes the inputs of valuation techniques used to measure fair value.This hierarchy gives the highest priority to unadjusted quoted prices in active markets for identical assets or liabilities (Level 1 measurements) and the lowest priority to unobservable inputs (Level 3 measurements).
Additionally, GAAP provides guidance on determining whether the volume and activity in a market has decreased significantly and whether
22
such a decrease in activity results in transactions that are not orderly. GAAP requires enhanced disclosures around valuation inputs and techniques used during annual and interim periods.
Various inputs are used in determining the value of the fund’s investments relating to fair value measurements. These inputs are summarized in the three broad levels listed below:
Level 1—unadjusted quoted prices in active markets for
identical investments.
Level 2—other significant observable inputs (including quoted
prices for similar investments, interest rates, prepayment speeds,
credit risk, etc.).
Level 3—significant unobservable inputs (including the fund’s own
assumptions in determining the fair value of investments).
The inputs or methodology used for valuing securities are not necessarily an indication of the risk associated with investing in those securities.
The following is a summary of the inputs used as of December 31, 2009 in valuing the fund’s investments:
| Level 2—Other | Level 3— | |||
| Level 1— | Significant | Significant | ||
| Unadjusted | Observable | Unobservable | ||
| Quoted Prices | Inputs | Inputs | Total | |
| Assets ($) | ||||
| Investments in Securities: | ||||
| Equity Securities— | ||||
| Domestic† | 111,130,956 | — | — | 111,130,956 |
| Equity Securities— | ||||
| Foreign† | 581,175 | — | — | 581,175 |
| † | See Statement of Investments for industry classification. |
(b) Securities transactions and investment income: Securities transactions are recorded on a trade date basis. Realized gains and losses from securities transactions are recorded on the identified cost basis. Dividend income is recognized on the ex-dividend date and interest income, including, where applicable, accretion of discount and amortization of premium on investments, is recognized on the accrual basis.
The Fund 23
NOTES TO FINANCIAL STATEMENTS (continued)
The fund has arrangements with the custodian and cash management bank whereby the fund may receive earnings credits when positive cash balances are maintained, which are used to offset custody and cash management fees. For financial reporting purposes, the fund includes net earnings credits as an expense offset in the Statement of Operations.
Pursuant to a securities lending agreement with The Bank of New York Mellon, a subsidiary of BNY Mellon and an affiliate of Dreyfus, the fund may lend securities to qualified institutions. It is the fund’s policy that, at origination, all loans are secured by collateral of at least 102% of the value of U.S. securities loaned and 105% of the value of foreign securities loaned. Collateral equivalent to at least 100% of the market value of securities on loan is maintained at all times. Collateral is either in the form of cash, which can be invested in certain money market mutual funds managed by the Manager, U.S. Government and Agency securities or letters of credit.The fund is entitled to receive all income on securities loaned, in addition to income earned as a result of the lending transaction. Although each security loaned is fully collateralized, the fund bears the risk of delay in recovery of, or loss of rights in, the securities loaned should a borrower fail to return the securities in a timely manner. During the period ended December 31, 2009,The Bank of NewYork Mellon earned $514 from lending portfolio securities, pursuant to the securities lending agreement.
(c) Affiliated issuers: Investments in other investment companies advised by the Manager are defined as “affiliated” in the Act.
(d) Dividends to shareholders: Dividends are recorded on the ex-dividend date. Dividends from investment income-net and dividends from net realized capital gains, if any, are normally declared and paid annually, but the fund may make distributions on a more frequent basis to comply with the distribution requirements of the Internal Revenue Code of 1986, as amended (the “Code”).To the extent that net realized capital gains can be offset by capital loss carryovers, it is the policy of the fund not to distribute such gains. Income and capital gain distributions are determined in accordance with income tax regulations, which may differ from GAAP.
24
(e) Federal income taxes: It is the policy of the fund to continue to qualify as a regulated investment company, if such qualification is in the best interests of its shareholders, by complying with the applicable provisions of the Code, and to make distributions of taxable income sufficient to relieve it from substantially all federal income and excise taxes.
As of and during the period ended December 31, 2009, the fund did not have any liabilities for any uncertain tax positions.The fund recognizes interest and penalties, if any, related to uncertain tax positions as income tax expense in the Statement of Operations. During the period, the fund did not incur any interest or penalties.
Each of the tax years in the four-year period ended December 31, 2009 remains subject to examination by the Internal Revenue Service and state taxing authorities.
At December 31, 2009, the components of accumulated earnings on a tax basis were as follows: undistributed ordinary income $30,927, accumulated capital losses $36,072,624 and unrealized depreciation $12,324,834. In addition, the fund had $503,676 of capital losses realized after October 31, 2009, which were deferred for tax purposes to the first day of the following fiscal year.
The accumulated capital loss carryover is available for federal income tax purposes to be applied against future net securities profits, if any, realized subsequent to December 31, 2009. If not applied, the carryover expires in fiscal 2017.
The tax character of distributions paid to shareholders during the fiscal periods ended December 31, 2009 and December 31, 2008 were as follows: ordinary income $2,199,653 and $4,754,214, long-term capital gains $0 and $13,169,908 and return of capital $0 and $12,835,438, respectively.
During the period ended December 31, 2009, as a result of permanent book to tax differences, primarily due to the tax treatment for net realized losses from redemptions-in-kind, the fund increased accumulated
The Fund 25
NOTES TO FINANCIAL STATEMENTS (continued)
net realized gain (loss) on investments by $9,192,201 and decreased paid-in capital by the same amount. Net assets and net asset value per share were not affected by this reclassification.
NOTE 2—Bank Lines of Credit:
The fund participates with other Dreyfus-managed funds in a $225 million unsecured credit facility led by Citibank, N.A. and a $300 million unsecured credit facility provided by The Bank of New York Mellon (each, a “Facility”), each to be utilized primarily for temporary or emergency purposes, including the financing of redemptions. In connection therewith, the fund has agreed to pay its pro rata portion of commitment fees for each Facility. Interest is charged to the fund based on rates determined pursuant to the terms of the respective Facility at the time of borrowing.
The average amount of borrowings outstanding under the Facilities during the period ended December 31, 2009, was approximately $221,700 with a related weighted average annualized interest rate of 1.52%.
NOTE 3—Management Fee and Other Transactions With Affiliates:
(a) Pursuant to a management agreement with the Manager, the management fee is computed at an annual rate of .70% of the value of the fund’s average daily net assets and is payable monthly.
The Manager has contractually agreed, until September 30, 2010, to waive receipt of its fees and/or assume the expenses of the fund so that the direct expenses of Class I shares (excluding taxes, interest, brokerage commissions, commitment fees on borrowings and extraordinary expenses) do not exceed .80%.
In addition, the Manager has agreed, until May 1, 2010, to waive receipt of its fees and/or assume the expenses of the fund so that the direct expenses of Class A and Class C shares (excluding taxes, interest, brokerage commissions, commitment fees on borrowings, extraordinary expenses, shareholder services fees and Rule 12b-1 fees) do not exceed 1.25%.
26
The reduction in expenses, pursuant to the undertakings, amounted to $10,769 during the period ended December 31, 2009.
(b) Under the Distribution Plan (the “Plan”) adopted pursuant to Rule 12b-1 under the Act, Class C shares pay and Class T shares paid the Distributor for distributing their shares at an annual rate of .75% and .25% of the value of their respective average daily net assets. During the period ended December 31, 2009, Class C and Class T shares were charged $57 and $2, respectively, pursuant to the Plan.
(c) Under the Shareholder Services Plan, Class A and Class C shares pay and Class T shares paid the Distributor at an annual rate of .25% of the value of their average daily net assets for the provision of certain services. The services provided may include personal services relating to shareholder accounts, such as answering shareholder inquiries regarding the fund and providing reports and other information, and services related to the maintenance of shareholder accounts. The Distributor may make payments to Service Agents (a securities dealer, financial institution or other industry professional) in respect of these services.The Distributor determines the amounts to be paid to Service Agents. During the period ended December 31, 2009, Class A, Class C and ClassT shares were charged $398, $19, and $2, respectively, pursuant to the Shareholder Service s Plan.
The fund compensates DreyfusTransfer, Inc., a wholly-owned subsidiary of the Manager, under a transfer agency agreement for providing personnel and facilities to perform transfer agency services for the fund. During the period ended December 31, 2009, the fund was charged $6,497 pursuant to the transfer agency agreement.
The fund compensates The Bank of New York Mellon under a cash management agreement for performing cash management services related to fund subscriptions and redemptions. During the period ended December 31, 2009, the fund was charged $443 pursuant to the cash management agreement, which is included in Shareholder servicing costs in the Statement of Operations. These fees were offset by earnings credits pursuant to the cash management agreement.
The Fund 27
NOTES TO FINANCIAL STATEMENTS (continued)
The fund also compensates The Bank of New York Mellon under a custody agreement for providing custodial services for the fund. During the period ended December 31, 2009, the fund was charged $6,209 pursuant to the custody agreement.
During the period ended December 31, 2009, the fund was charged $6,681 for services performed by the Chief Compliance Officer.
The components of “Due to The Dreyfus Corporation and affiliates” in the Statement of Assets and Liabilities consist of: management fees $72,753, Rule 12b-1 distribution plan fees $7, shareholder services plan fees $63, custodian fees $9,038, chief compliance officer fees $5,011 and transfer agency per account fees $503.
(d) Each Board member also serves as a Board member of other funds within the Dreyfus complex. Annual retainer fees and attendance fees are allocated to each fund based on net assets.
NOTE 4—Securities Transactions:
The aggregate amount of purchases and sales of investment securities, excluding short-term securities, during the period ended December 31, 2009, amounted to $96,179,981 and $173,093,472, respectively. Sales of investment securities include securities amounting to $19,314,039 delivered pursuant to a redemption-in-kind. The net realized loss of $9,192,201 on the redemption-in-kind will not be realized for tax purposes.
The fund adopted the provisions of ASC Topic 815 “Derivatives and Hedging” which requires qualitative disclosures about objectives and strategies for using derivatives, quantitative disclosures about fair value amounts of gains and losses on derivative instruments and disclosures about credit-risk-related contingent features in derivative agreements. The fund held no derivatives during the period ended December 31, 2009. These disclosures did not impact the notes to the financial statements.
28
At December 31, 2009, the cost of investments for federal income tax purposes was $124,036,965; accordingly, accumulated net unrealized depreciation on investments was $12,324,834, consisting of $5,352,759 gross unrealized appreciation and $17,677,593 gross unrealized depreciation.
NOTE 5—New Accounting Pronouncement:
In January 2010, FASB issued Accounting Standards Update (“ASU”) No. 2010-06 “Improving Disclosures about Fair Value Measurements”. ASU 2010-06 will require reporting entities to make new disclosures about amounts and reasons for significant transfers in and out of Level 1 and Level 2 fair value measurements as well as inputs and valuation techniques used to measure fair value for both recurring and nonrecur-ring fair value measurements that fall in either Level 2 or Level 3, and information on purchases, sales, issuances and settlements on a gross basis in the reconciliation of activity in Level 3 fair value measurements.The new and revised disclosures are required to be implemented for fiscal years beginning after December 15, 2009 except for the disclosures surrounding purchases, sales, issuances and settlements on a gross basis in the reconciliation of Level 3 fair value measurements, which are effective for fiscal years beginning after December 15, 2010. Management is currently evaluating the impact the adoption of ASU No. 2010-06 may have on the fund’s financial statement disclosures.
NOTE 6—Subsequent Events Evaluation:
Dreyfus has evaluated the need for disclosures and/or adjustments resulting from subsequent events through February 25, 2009, the date the financial statements were issued. This evaluation did not result in any subsequent events that necessitated disclosures and/or adjustments.
The Fund 29
REPORT OF INDEPENDENT REGISTERED
PUBLIC ACCOUNTING FIRM
Shareholders and Board of Directors
Dreyfus Large Cap Value Fund
We have audited the accompanying statement of assets and liabilities, including the statement of investments, of Dreyfus Large CapValue Fund (one of the series comprising Dreyfus Premier Investment Funds, Inc.) as of December 31, 2009, and the related statement of operations for the year then ended and the statement of changes in net assets and financial highlights for each of the two years in the period then ended. These financial statements and financial highlights are the responsibility of the Fund’s management. Our responsibility is to express an opinion on these financial statements and financial highlights based on our audits. The financial highlights for each of the years ended December 31, 2007, 2006 and 2005 were audited by other auditors whose report dated February 28, 2008, expressed an unqualified opinion on such financial highlights.
We conducted our audits in accordance with the standards of the Public Company Accounting Oversight Board (United States).Those standards require that we plan and perform the audit to obtain reasonable assurance about whether the financial statements and financial highlights are free of material misstatement.We were not engaged to perform an audit of the Fund’s internal control over financial reporting. Our audits included consideration of internal control over financial reporting as a basis for designing audit procedures that are appropriate in the circumstances, but not for the purpose of expressing an opinion on the effectiveness of the Fund’s internal control over financial reporting. Accordingly, we express no such opinion.An audit also includes examining, on a test basis, evidence supporting the amounts and disclosures in the financial statements and financial highlights, assessing the accounting principles used and significant estimates made by management, and evaluating the overall financial statement presentation. Our procedures included confirmation of securities owned as of December 31, 2009 by correspondence with the custodian and others. We believe that our audits provide a reasonable basis for our opinion.
In our opinion, the 2009 and 2008 financial statements and financial highlights referred to above present fairly, in all material respects, the financial position of Dreyfus Large Cap Value Fund at December 31, 2009, the results of its operations for the year then ended and the changes in its net assets and the financial highlights for each of the two years in the period then ended, in conformity with U.S. generally accepted accounting principles.
30
New York, New York
February 25, 2010
IMPORTANT TAX INFORMATION (Unaudited)
In accordance with federal tax law, the fund hereby designates 100% of the ordinary dividends paid during the fiscal year ended December 31, 2009 as qualifying for the corporate dividends received deduction. For the fiscal year ended December 31, 2009, certain dividends paid by the fund may be subject to a maximum tax rate of 15%, as provided for by the Jobs and Growth Tax Relief Reconciliation Act of 2003. Of the distributions paid during the fiscal year, $2,199,653 represents the maximum amount that may be considered qualified dividend income. Shareholders will receive notification in early 2010 of the percentage applicable to the preparation of their 2009 income tax returns.
The Fund 31
| INFORMATION ABOUT THE REVIEW AND APPROVAL |
| OF THE FUND’S MANAGEMENT AGREEMENT (Unaudited) |
At a meeting of the fund’s Board held on December 10, 2009, the Board approved the fund’s Management Agreement with Dreyfus for a six-month term ending July 31, 2010. At a previous meeting of the fund’s Board held on July 9, 2009, the Board approved the fund’s Management Agreement with Dreyfus for a six-month term ending January 31, 2010.The Board members, none of whom are “interested persons” (as defined in the Investment Company Act of 1940, as amended) of the fund, were assisted in their review by independent legal counsel and met with counsel in executive session separate from representatives of Dreyfus. In approving the Management Agreement, the Board considered all factors that it believed to be relevant, including, among other things, the factors discussed below.
Analysis of Nature, Extent and Quality of Services Provided to the Fund. The Board members received a presentation from representatives of Dreyfus regarding services provided to the fund and other funds in the Dreyfus fund complex, and discussed the nature, extent and quality of the services provided to the fund pursuant to its Management Agreement. Dreyfus’ representatives reviewed the fund’s distribution of accounts and the relationships Dreyfus has with various intermediaries and the different needs of each. Dreyfus’ representatives noted the various distribution channels for the fund as well as the diverse methods of distribution among other funds in the Dreyfus fund complex, and Dreyfus’ corresponding need for broad, deep, and diverse resources to be able to provide ongoing shareholder services to each distribution channel, including th ose of the fund. Dreyfus also provided the number of accounts investing in the fund, as well as the fund’s asset size.
The Board members also considered Dreyfus’ research and portfolio management capabilities and Dreyfus’ oversight of day-to-day fund operations, including fund accounting, administration and assistance in meeting legal and regulatory requirements. The Board members also considered Dreyfus’ extensive administrative, accounting and compliance infrastructure. The Board also considered Dreyfus’ brokerage policies and practices, the standards applied in seeking best execution and Dreyfus’ policies and practices regarding soft dollars.
32
Comparative Analysis of the Fund’s Performance and Management Fee and Expense Ratio. The Board members reviewed the fund’s performance for various periods and compared the fund’s performance to the performance of a group of comparable retail front-end load large-cap core funds (the “Performance Group”) and to a larger universe of funds consisting of all retail and institutional large-cap core funds (the “Performance Universe”), selected and provided by Lipper, Inc. (“Lipper”), an independent provider of investment company data.The Board was provided with a description of the methodology Lipper used to select the Performance Group and Performance Universe, as well as the Expense Group and Expense Universe (discussed below). The Board members discussed the results of the comparisons and noted that the fund’s perfo rmance was above the Performance Group and Performance Universe medians for all periods except the one-year period ended October 31, 2009, when it was in the third and fourth quartiles, respectively.The Board noted Dreyfus’ effort to improve the Fund’s performance, including the appointment of a new portfolio manager with a successful track record in September 2008. Dreyfus also provided a comparison of the fund’s total returns to the returns of its benchmark index for each calendar year since inception.
The Board members discussed with representatives of Dreyfus the reasons for the fund’s underperformance compared to the Performance Group and Performance Universe medians during the one-year ended October 31, 2009. The Board noted Dreyfus’ continuing efforts to improve fund performance.
The Board members also discussed the fund’s actual and contractual management fees and total expense ratio compared to a group of comparable retail front-end load large-cap core funds (the “Expense Group”) and a broader group of funds consisting of all retail front-end load large-cap core funds (the “Expense Universe”), each selected and provided by Lipper. The Board noted that Dreyfus has contractually agreed, until September 30, 2010, to waive receipt of its fees and/or assume the expenses of the fund so that the direct expenses of Class I shares (excluding taxes, interest, brokerage commissions, commitment
The Fund 33
| INFORMATION ABOUT THE REVIEW AND APPROVAL OF THE |
| FUND’S MANAGEMENT AGREEMENT (Unaudited) (continued) |
fees on borrowings and extraordinary expenses) do not exceed .80%. In addition, the Board noted that Dreyfus has agreed, until May 1, 2010, to waive receipt of its fee and/or assume the expenses of the fund so that the direct expenses of Class A and C (excluding taxes, interest, brokerage commissions, commitment fees on borrowings, extraordinary fees, shareholder services fees and Rule 12b-1 fees) do not exceed 1.25%. The Board members noted that the fund’s actual and contractual management fees were lower than the Expense Group medians (in the first quartiles), the actual management fee was higher than the Expense Universe median (in the third quartile) and the total expense ratio was higher than the Expense Group and Expense Universe medians (in the third and fourth quartiles, respectively).
Representatives of Dreyfus reviewed with the Board members the fees paid to Dreyfus or its affiliates by mutual funds managed by Dreyfus with similar investment objectives, policies and strategies, and included in the same Lipper category as the fund (the “Similar Funds”), and by other accounts managed by Dreyfus or its affiliates with similar investment objectives, policies and strategies as the fund (the “Similar Accounts”). Dreyfus’ representatives explained the nature of the Similar Accounts and the differences, from Dreyfus’ perspective, in providing services to such Similar Accounts as compared to managing and providing services to the fund. Dreyfus’ representatives also reviewed the costs associated with distribution through intermediaries. The Board members considered the relevance of the fee information provided for the Similar Funds and the Similar Accounts to evaluate the appropriat eness and reasonableness of the fund’s management fee.
Analysis of Profitability and Economies of Scale. Dreyfus’ representatives reviewed the dollar amount of expenses allocated and profit received by Dreyfus and the method used to determine such expenses and profit. The Board previously had been provided with information prepared by an independent consulting firm regarding Dreyfus’ approach to allocating costs to, and determining the profitability of, individual funds and the entire Dreyfus mutual fund complex.The Board members also had been informed that the methodology had been reviewed by an indepen-
34
dent registered public accounting firm which, like the consultant, found the methodology to be reasonable. The consulting firm also analyzed where any economies of scale might emerge in connection with the management of the fund.The Board members evaluated the profitability analysis in light of the relevant circumstances for the fund and the extent to which economies of scale would be realized if the fund grows and whether fee levels reflect these economies of scale for the benefit of fund investors.The Board members also considered potential benefits to Dreyfus from acting as investment adviser and noted the soft dollar arrangements with respect to trading the fund’s investments.
It was noted that the Board members should consider Dreyfus’ profitability with respect to the fund as part of their evaluation of whether the fees under the Management Agreement bear a reasonable relationship to the mix of services provided by Dreyfus, including the nature, extent and quality of such services and that a discussion of economies of scale is predicated on a fund having achieved a substantial size with increasing assets and that, if a fund’s assets had been static or decreasing, the possibility that Dreyfus may have realized any economies of scale would be less. It also was noted that the profitability percentage for managing the fund was within ranges determined by appropriate court cases to be reasonable given the services rendered and generally superior service levels provided.
At the conclusion of these discussions, the Board agreed that it had been furnished with sufficient information to make an informed business decision with respect to re-approving the Management Agreement. Based on the discussions and considerations as described above, the Board made the following conclusions and determinations.
The Board concluded that the nature, extent and quality of the services provided by Dreyfus are adequate and appropriate.
The Board was generally satisfied with the fund’s long-term rela- tive performance.
The Board concluded that the fee payable by the fund to Dreyfus was reasonable in light of the considerations described above.
The Fund 35
| INFORMATION ABOUT THE REVIEW AND APPROVAL OF THE |
| FUND’S MANAGEMENT AGREEMENT (Unaudited) (continued) |
The Board determined that the economies of scale which may accrue to Dreyfus and its affiliates in connection with the management of the fund had been adequately considered by Dreyfus in connection with the management fee rate charged to the fund and that, to the extent in the future it were determined that material economies of scale had not been shared with the fund, the Board would seek to have those economies of scale shared with the fund.
The Board members considered these conclusions and determinations, along with information received on a routine and regular basis throughout the year, and, without any one factor being dispositive, the Board determined that re-approval of the Management Agreement through July 31, 2010 was in the best interests of the fund and its shareholders.
36
BOARD MEMBERS INFORMATION (Unaudited)

The Fund 37
BOARD MEMBERS INFORMATION (Unaudited) (continued)
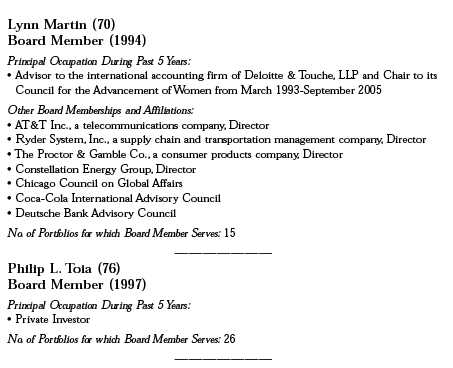
Once elected all Board Members serve for an indefinite term, but achieve Emeritus status upon reaching age 80.The address of the Board Members and Officers is in c/o The Dreyfus Corporation, 200 Park Avenue, NewYork, NewYork 10166. Additional information about the Board Members is available in the fund’s Statement of Additional Information which can be obtained from Dreyfus free of charge by calling this toll free number: 1-800-554-4611.
Daniel Rose, Emeritus Board Member
Sander Vanocur, Emeritus Board Member
38
OFFICERS OF THE FUND (Unaudited)
The Fund 39
OFFICERS OF THE FUND (Unaudited) (continued)

40
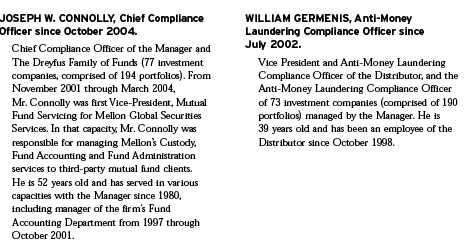
The Fund 41
For More Information
Telephone Call your financial representative or 1-800-554-4611
Mail The Dreyfus Family of Funds, 144 Glenn Curtiss Boulevard, Uniondale, NY 11556-0144
The fund files its complete schedule of portfolio holdings with the Securities and Exchange Commission (“SEC”) for the first and third quarters of each fiscal year on Form N-Q. The fund’s Forms N-Q are available on the SEC’s website at http://www.sec.gov and may be reviewed and copied at the SEC’s Public Reference Room in Washington, DC. Information on the operation of the Public Reference Room may be obtained by calling 1-800-SEC-0330.
A description of the policies and procedures that the fund uses to determine how to vote proxies relating to portfolio securities, and information regarding how the fund voted these proxies for the most recent 12-month period ended June 30 is available at http://www.dreyfus.com and on the SEC’s website at http://www.sec.gov. The description of the policies and procedures is also available without charge, upon request, by calling 1-800-645-6561.

| Item 2. | Code of Ethics. |
The Registrant has adopted a code of ethics that applies to the Registrant's principal executive officer, principal financial officer, principal accounting officer or controller, or persons performing similar functions. There have been no amendments to, or waivers in connection with, the Code of Ethics during the period covered by this Report.
| Item 3. | Audit Committee Financial Expert. |
The Registrant's Board has determined that David P. Feldman, a member of the Audit Committee of the Board, is an audit committee financial expert as defined by the Securities and Exchange Commission (the "SEC"). David P. Feldman is "independent" as defined by the SEC for purposes of audit committee financial expert determinations.
| Item 4. | Principal Accountant Fees and Services. |
(a) Audit Fees. The aggregate fees billed for each of the last two fiscal years (the "Reporting Periods") for professional services rendered by the Registrant's principal accountant (the "Auditor") for the audit of the Registrant's annual financial statements or services that are normally provided by the Auditor in connection with the statutory and regulatory filings or engagements for the Reporting Periods, were $141,000 in 2008 and $111,384 in 2009.
(b) Audit-Related Fees. The aggregate fees billed in the Reporting Periods for assurance and related services by the Auditor that are reasonably related to the performance of the audit of the Registrant's financial statements and are not reported under paragraph (a) of this Item 4 were $26,380 in 2008 and $21,104 in 2009. These services consisted of security counts required by Rule 17f-2 under the Investment Company Act of 1940, as amended.
The aggregate fees billed in the Reporting Periods for non-audit assurance and related services by the Auditor to the Registrant's investment adviser (not including any sub-investment adviser whose role is primarily portfolio management and is subcontracted with or overseen by another investment adviser), and any entity controlling, controlled by or under common control with the investment adviser that provides ongoing services to the Registrant ("Service Affiliates"), that were reasonably related to the performance of the annual audit of the Service Affiliate, which required pre-approval by the Audit Committee were $ 0 in 2008 and $0 in 2009.
(c) Tax Fees. The aggregate fees billed in the Reporting Periods for professional services rendered by the Auditor for tax compliance, tax advice, and tax planning ("Tax Services") were $ 15,000 in 2008 and $15,480 in 2009. These services consisted of: (i) review or preparation of U.S. federal, state, local and excise tax returns; (ii) U.S. federal, state and local tax planning, advice and assistance regarding statutory, regulatory or administrative developments; (iii) tax advice regarding tax qualification matters and/or treatment of various financial instruments held or proposed to be acquired or held. The aggregate fees billed in the Reporting Periods for Tax Services by the Auditor to Service Affiliates, which required pre-approval by the Audit Committee were $0 in 2008 and $0 in 2009.
(d) All Other Fees. The aggregate fees billed in the Reporting Periods for products and services provided by the Auditor, other than the services reported in paragraphs (a) through (c) of this Item, were $0 in 2008 and $149 in 2009. [These services consisted of a review of the Registrant's anti-money laundering program].
The aggregate fees billed in the Reporting Periods for Non-Audit Services by the Auditor to Service Affiliates, other than the services reported in paragraphs (b) through (c) of this Item, which required pre-approval by the Audit Committee, were $0 in 2008 and $0 in 2009.
Note: None of the services described in paragraphs (b) through (d) of this Item 4 were approved by the Audit Committee pursuant to paragraph (c)(7)(i)(C) of Rule 2-01 of Regulation S-X.
Audit Committee Pre-Approval Policies and Procedures. The Registrant's Audit Committee has established policies and procedures (the "Policy") for pre-approval (within specified fee limits) of the Auditor's engagements for non-audit services to the Registrant and Service Affiliates without specific case-by-case consideration. Pre-approval considerations include whether the proposed services are compatible with maintaining the Auditor's independence. Pre-approvals pursuant to the Policy are considered annually.
Non-Audit Fees. The aggregate non-audit fees billed by the Auditor for services rendered to the Registrant, and rendered to Service Affiliates, for the Reporting Periods were $12,561,320 in 2008 and $24,975,296 in 2009.
Auditor Independence. The Registrant's Audit Committee has considered whether the provision of non-audit services that were rendered to Service Affiliates, which were not pre-approved (not requiring pre-approval), is compatible with maintaining the Auditor's independence.
| Item 5. | Audit Committee of Listed Registrants. |
| Not applicable. [CLOSED-END FUNDS ONLY] | |
| Item 6. | Investments. |
| (a) | Not applicable. |
| Item 7. | Disclosure of Proxy Voting Policies and Procedures for Closed-End Management |
| Investment Companies. | |
| Not applicable. [CLOSED-END FUNDS ONLY] | |
| Item 8. | Portfolio Managers of Closed-End Management Investment Companies. |
| Not applicable. [CLOSED-END FUNDS ONLY, beginning with reports for periods ended | |
| on and after December 31, 2005] | |
| Item 9. | Purchases of Equity Securities by Closed-End Management Investment Companies and |
| Affiliated Purchasers. | |
| Not applicable. [CLOSED-END FUNDS ONLY] | |
| Item 10. | Submission of Matters to a Vote of Security Holders. |
| There have been no material changes to the procedures applicable to Item 10. | |
| Item 11. | Controls and Procedures. |
(a) The Registrant's principal executive and principal financial officers have concluded, based on their evaluation of the Registrant's disclosure controls and procedures as of a date within 90 days of the filing date of this report, that the Registrant's disclosure controls and procedures are reasonably designed to ensure that information required to be disclosed by the Registrant on Form N-CSR is recorded, processed, summarized and reported within the required time periods and that information required to be disclosed by the Registrant in the reports that it files or submits on Form N-CSR is accumulated and communicated to the Registrant's management, including its principal executive and principal financial officers, as appropriate to allow timely decisions regarding required disclosure.
(b) There were no changes to the Registrant's internal control over financial reporting that occurred during the second fiscal quarter of the period covered by this report that have materially affected, or are reasonably likely to materially affect, the Registrant's internal control over financial reporting.
| Item 12. | Exhibits. |
(a)(1) Code of ethics referred to in Item 2.
(a)(2) Certifications of principal executive and principal financial officers as required by Rule 30a-2(a) under the Investment Company Act of 1940.
(a)(3) Not applicable.
(b) Certification of principal executive and principal financial officers as required by Rule 30a-2(b) under the Investment Company Act of 1940.
SIGNATURES
Pursuant to the requirements of the Securities Exchange Act of 1934 and the Investment Company Act of 1940, the Registrant has duly caused this Report to be signed on its behalf by the undersigned, thereunto duly authorized.
[Insert Name of Fund]
| By: | /s/ Bradley J. Skapyak |
| Bradley J. Skapyak, | |
| President | |
| Date: | February 19, 2010 |
Pursuant to the requirements of the Securities Exchange Act of 1934 and the Investment Company Act of 1940, this Report has been signed below by the following persons on behalf of the Registrant and in the capacities and on the dates indicated.
| By: | /s/ Bradley J. Skapyak |
| Bradley J. Skapyak, | |
| President | |
| Date: | February 19, 2010 |
| By: | /s/ James Windels |
| James Windels, | |
| Treasurer | |
| Date: | February 19, 2010 |
EXHIBIT INDEX
(a)(1) Code of ethics referred to in Item 2.
(a)(2) Certifications of principal executive and principal financial officers as required by Rule 30a-2(a) under the Investment Company Act of 1940. (EX-99.CERT)
(b) Certification of principal executive and principal financial officers as required by Rule 30a-2(b) under the Investment Company Act of 1940. (EX-99.906CERT)