UNITED STATES
SECURITIES AND EXCHANGE COMMISSION
Washington, D.C. 20549
FORM N-CSR
CERTIFIED SHAREHOLDER REPORT OF REGISTERED MANAGEMENT
INVESTMENT COMPANIES
Investment Company Act file number | 811- 6490 | |||||
|
| |||||
| Dreyfus Premier Investment Funds, Inc. |
| ||||
| (Exact name of Registrant as specified in charter) |
| ||||
|
|
| ||||
|
c/o The Dreyfus Corporation 200 Park Avenue New York, New York 10166 |
| ||||
| (Address of principal executive offices) (Zip code) |
| ||||
|
|
| ||||
| Michael A. Rosenberg, Esq. 200 Park Avenue New York, New York 10166 |
| ||||
| (Name and address of agent for service) |
| ||||
| ||||||
Registrant's telephone number, including area code: | (212) 922-6000 | |||||
|
| |||||
Date of fiscal year end:
| 10/31 |
| ||||
Date of reporting period: | 10/31/10 |
| ||||
The following N-CSR relates only to the Registrant’s series listed below and does not affect the other series of the Registrant, which has a different fiscal year end and, therefore, different N-CSR reporting requirements. A separate N-CSR Form will be filed for this series, as appropriate.
DREYFUS PREMIER INVESTMENT FUNDS, INC.
- Dreyfus Diversified Global Fund
- Dreyfus Diversified International Fund
- Dreyfus Diversified Large Cap Fund
- Dreyfus Emerging Asia Fund
- Dreyfus Greater China Fund
- Dreyfus Satellite Alpha Fund
Save time. Save paper. View your next shareholder report online as soon as it’s available. Log into www.dreyfus.com and sign up for Dreyfus eCommunications. It’s simple and only takes a few minutes.
The views expressed in this report reflect those of the portfolio manager only through the end of the period covered and do not necessarily represent the views of Dreyfus or any other person in the Dreyfus organization. Any such views are subject to change at any time based upon market or other conditions and Dreyfus disclaims any responsibility to update such views.These views may not be relied on as investment advice and, because investment decisions for a Dreyfus fund are based on numerous factors, may not be relied on as an indication of trading intent on behalf of any Dreyfus fund.
Not FDIC-Insured • Not Bank-Guaranteed • May Lose Value
Contents | |
THE FUND | |
| 2 | A Letter from the Chairman and CEO |
| 3 | Discussion of Fund Performance |
| 6 | Fund Performance |
| 8 | Understanding Your Fund’s Expenses |
| 8 | Comparing Your Fund’s Expenses With Those of Other Funds |
| 9 | Statement of Investments |
| 10 | Statement of Assets and Liabilities |
| 11 | Statement of Operations |
| 12 | Statement of Changes in Net Assets |
| 14 | Financial Highlights |
| 17 | Notes to Financial Statements |
| 25 | Report of Independent Registered Public Accounting Firm |
| 26 | Important Tax Information |
| 27 | Information About the Review and Approval of the Fund’s Management Agreement |
| 30 | Board Members Information |
| 32 | Officers of the Fund |
FOR MORE INFORMATION | |
Back Cover |
Dreyfus
Diversified Global Fund
The Fund

A LETTER FROM THE CHAIRMAN AND CEO
Dear Shareholder:
We are pleased to present this annual report for Dreyfus Diversified Global Fund, covering the 12-month period from November 1, 2009, through October 31, 2010.
Although a double-dip recession has recently become an increasingly unlikely scenario in our view, persistent uncertainty regarding the breadth and strength of the U.S. and global economic recoveries led to bouts of heightened volatility for U.S. stocks during most of 2010.The spending power of the U.S. consumer, long an important catalyst for economic growth, has been diminished by concerns over job security and an inability to generate cash from home equity.The second major driver of sustainable growth, corporate investment, has been stunted to a similar extent by tight credit conditions. However, the recent announcement of additional quantitative easing (QE2) measures by the Federal Reserve Board, as well as improved fundamentals across many developing nations, have helped support moderate global economic growth.
Uncertainty will probably remain in the broader financial markets until we see more evidence of robust economic growth, but we remain optimistic regarding the prospects for equities. Many stocks of quality companies with healthy balance sheets, higher credit ratings and strong cash flows appear to be currently priced at a discount.With that, we strongly suggest that you meet with your financial advisor to discuss the potential opportunities which may exist in the global markets, as well as to evaluate your portfolio to help meet your individual investment needs and your future goals relative to your risk-tolerance level.
For information about how the fund performed during the reporting period, as well as general market perspectives, we provide a Discussion of Fund Performance on the pages that follow.
Thank you for your continued confidence and support.

Jonathan R. Baum
Chairman and Chief Executive Officer
The Dreyfus Corporation
November 15, 2010
2

DISCUSSION OF FUND PERFORMANCE
For the period of November 1, 2009, through October 31, 2010, as provided by Richard B. Hoey, A. Paul Disdier, Christopher E. Sheldon, CFA, and Keith L. Stransky, CFA, Portfolio Managers
Market and Fund Performance Overview
For the 12-month period ended October 31, 2010, Dreyfus Diversified Global Fund’s Class A shares produced a total return of 12.46%, Class C shares returned 11.69% and Class I shares returned 12.71%.1 In comparison, the fund’s benchmark, the Morgan Stanley Capital International (MSCI) World Index (the “Index”), produced a total return of 12.74% for the same period.2
After rallying over the first half of the reporting period, global stock markets encountered heightened volatility over the second half, mainly due to intensifying economic concerns in Europe and the United States.The fund’s Class I shares produced returns that were roughly in line with its benchmark, as strong results from overweighted exposure to France and global consumer staples stocks were offset by weakness stemming from underweighted positions in U.S. stocks and the global materials sector.
The Fund’s Investment Approach
The fund seeks long-term capital appreciation.To pursue its goal, the fund normally allocates its assets among other mutual funds advised by The Dreyfus Corporation (Dreyfus), or its affiliates, that invest primarily in stocks issued by U.S. and foreign companies.The underlying funds are selected by the Dreyfus Investment Committee based on their investment objectives and management policies, portfolio holdings, risk/reward profiles, historical performance and other factors. The Dreyfus Investment Committee will rebalance the fund’s investments in the underlying funds at least annually, but may do so more often in response to market conditions. As of October 31, 2010, the fund’s assets were allocated as follows:
| Underlying Funds | (%) |
| Global Stock Fund | 34 |
| Dreyfus Worldwide Growth Fund | 31 |
| Dreyfus Global Equity Income Fund | 21 |
| Dreyfus Global Sustainability Fund | 15 |
TheFund 3
DISCUSSION OF FUND PERFORMANCE (continued)
Economic Concerns Sparked Heightened Market Volatility
From the beginning of the reporting period through April 2010, the U.S. and global economies continued to recover from recession, propelling stock prices higher throughout the world. However, in May 2010 investors faced new economic uncertainties when Europe was roiled by a sovereign debt crisis and inflation-fighting measures in China threatened to dampen a major engine of global growth. In the United States, mixed data regarding unemployment and housing markets suggested that stubborn economic headwinds might constrain already mild growth. As a result, the global stock market rally was derailed over the spring and summer, with some markets falling sharply. The effects of those losses generally proved temporary, however, as anticipation of reduced political uncertainty in the United States and new monetary stimulus from central banks, including the Federal Reserve Board, sparked a broad-based market rally in Sept ember and October.
Underlying Investments Produced Mixed Results
Although the fund participated to a substantial degree in the global equity markets’ gains over the reporting period, some of its underlying investments prevented it from outpacing the MSCI World Index. Most notably, while Dreyfus Global Sustainability Fund outperformed its own benchmark, it lagged broader global market averages due to shortfalls in the consumer staples and information technology sectors.
The fund achieved better relative performance from several of its other underlying investments, most notably Dreyfus Global Equity Income Fund and DreyfusWorldwide Growth Fund. In the aggregate, the fund benefited from overweighted exposure to France and the consumer staples sector. Generally underweighted exposure to the United States, Canada and the materials sector hampered the fund’s results compared to its benchmark.
We made several allocation changes during the reporting period. To reduce industry-specific risks, in December 2009 we eliminated the fund’s position in Dreyfus Global Real Estate Securities Fund, and we redeployed those assets to the more broadly invested Dreyfus Global Equity Income Fund. In March 2010, we shifted assets from Dreyfus Worldwide Growth Fund to Dreyfus Global Sustainability Fund to more closely approximate the benchmark’s sector allocation and volatility characteristics. In May, we reduced the fund’s exposure to Western Europe through a shift from Dreyfus Global Sustainability Fund to Global Stock Fund.We followed up in August by increasing the fund’s focus on high-
4
quality, multinational companies through a shift from Dreyfus Global Sustainability Fund to Dreyfus Worldwide Growth Fund. This move continued to reduce the fund’s exposure to Western Europe as well.
Positioned for Further Global Recovery
Although we remain concerned regarding several economic headwinds, we are optimistic about the prospects for global equities. In our judgment, rising corporate earnings could lead to an increase in mergers-and-acquisitions activity, potentially benefiting stocks as companies begin to deploy some of their massive cash reserves. In addition, persistently low yields from sovereign bonds and money market funds could motivate income-oriented investors to increase their participation in high-quality, dividend-paying stocks. Finally, we believe that the fund’s broadly diversified exposure to global stocks positions it to participate in areas of opportunity in today’s slow-growth environment.
November 15, 2010
| Equity funds are subject generally to market, market sector, market liquidity, issuer and investment | |
| style risks, among other factors, to varying degrees, all of which are more fully described in the | |
| prospectus of the fund and that of each underlying fund. | |
| The ability of the fund to achieve its investment goal depends, in part, on the ability of the | |
| Dreyfus Investment Committee to allocate effectively the fund’s assets among the underlying | |
| funds.There can be no assurance that the actual allocations will be effective in achieving the fund’s | |
| investment goal. | |
| The fund’s international investments will be influenced by political, social and economic factors | |
| affecting investments in foreign companies, including exposure to currency fluctuations, less | |
| liquidity, less developed or less efficient trading markets, lack of comprehensive company | |
| information, political instability and differing auditing and legal standards. | |
| Because one of the fund’s investments is concentrated in the securities of companies principally | |
| engaged in the real estate sector, the value of the fund’s shares will be affected by factors particular | |
| to the real estate sector and may fluctuate more widely than that of a fund which invests in a | |
| broader range of industries.The securities of issuers that are principally engaged in the real estate | |
| sector may be subject to risks similar to those associated with the direct ownership of real estate. | |
| 1 | Total return includes reinvestment of dividends and any capital gains paid, and does not take into |
| consideration the maximum initial sales charge in the case of Class A shares, or the applicable | |
| contingent deferred sales charge imposed on redemptions in the case of Class C shares. Had these | |
| charges been reflected, returns would have been lower. Past performance is no guarantee of future | |
| results. Share price and investment return fluctuate such that upon redemption, fund shares may be | |
| worth more or less than their original cost. Return figures provided reflect the absorption of certain | |
| fund expenses by The Dreyfus Corporation pursuant to an agreement in effect until March 1, | |
| 2012. Had these expenses not been absorbed, the fund’s returns would have been lower. | |
| 2 | SOURCE: LIPPER INC. — Reflects reinvestment of net dividends and, where applicable, |
| capital gain distributions.The Morgan Stanley Capital International (MSCI) World Index is an | |
| unmanaged index of global stock market performance, including the United States, Canada, | |
| Europe,Australia, New Zealand and the Far East. |
TheFund 5
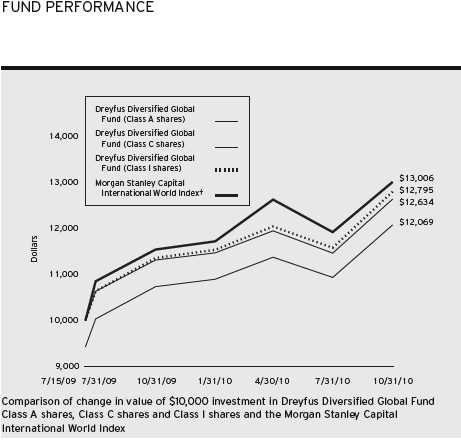
† Source: Lipper Inc.
Past performance is not predictive of future performance.
The above graph compares a $10,000 investment made in Class A, Class C and Class I shares of Dreyfus Diversified Global Fund on 7/15/09 (inception date) to a $10,000 investment made in the Morgan Stanley Capital International World Index (the “Index”) on that date. For comparative purposes, the value of the Index on 6/30/09 is used as the beginning value on 7/15/09.All dividends and capital gain distributions are reinvested.
The fund’s performance shown in the line graph takes into account the maximum initial sales charge on Class A shares and all other applicable fees and expenses on all classes.The Index is an unmanaged index of global stock market performance, including the United States, Canada, Europe,Australia, New Zealand and the Far East. Unlike a mutual fund, the Index is not subject to charges, fees and other expenses. Investors cannot invest directly in any index. Further information relating to fund performance, including expense reimbursements, if applicable, is contained in the Financial Highlights section of the prospectus and elsewhere in this report.
6
| Average Annual Total Returns as of 10/31/10 | |||
| Inception | From | ||
| Date | 1 Year | Inception | |
| Class A shares | |||
| with maximum sales charge (5.75%) | 7/15/09 | 5.98% | 15.56% |
| without sales charge | 7/15/09 | 12.46% | 20.93% |
| Class C shares | |||
| with applicable redemption charge † | 7/15/09 | 10.69% | 19.71% |
| without redemption | 7/15/09 | 11.69% | 19.71% |
| Class I shares | 7/15/09 | 12.71% | 20.87% |
| Morgan Stanley Capital | |||
| International World Index†† | 6/30/09 | 12.74% | 21.79% |
| Past performance is not predictive of future performance.The fund’s performance shown in the graph and table does not | |
| reflect the deduction of taxes that a shareholder would pay on fund distributions or the redemption of fund shares. | |
| † | The maximum contingent deferred sales charge for Class C shares is 1% for shares redeemed within one year of the |
| date of purchase. | |
| †† | For comparative purposes, the value of the Index as of 6/30/09 is used as the beginning value on 7/15/09. |
TheFund 7
UNDERSTANDING YOUR FUND’S EXPENSES (Unaudited)
As a mutual fund investor, you pay ongoing expenses, such as management fees and other expenses. Using the information below, you can estimate how these expenses affect your investment and compare them with the expenses of other funds.You also may pay one-time transaction expenses, including sales charges (loads) and redemption fees, which are not shown in this section and would have resulted in higher total expenses. For more information, see your fund’s prospectus or talk to your financial adviser.
Review your fund’s expenses
The table below shows the expenses you would have paid on a $1,000 investment in Dreyfus Diversified Global Fund from May 1, 2010 to October 31, 2010. It also shows how much a $1,000 investment would be worth at the close of the period, assuming actual returns and expenses.
| Expenses and Value of a $1,000 Investment | |||
| assuming actual returns for the six months ended October 31, 2010 | |||
| Class A | Class C | Class I | |
| Expenses paid per $1,000† | $ 3.95 | $ 7.83 | $ 2.65 |
| Ending value (after expenses) | $1,061.40 | $1,058.00 | $1,062.90 |
| COMPARING YOUR FUND’S EXPENSES |
| WITH THOSE OF OTHER FUNDS (Unaudited) |
Using the SEC’s method to compare expenses
The Securities and Exchange Commission (SEC) has established guidelines to help investors assess fund expenses. Per these guidelines, the table below shows your fund’s expenses based on a $1,000 investment, assuming a hypothetical 5% annualized return. You can use this information to compare the ongoing expenses (but not transaction expenses or total cost) of investing in the fund with those of other funds.All mutual fund shareholder reports will provide this information to help you make this comparison. Please note that you cannot use this information to estimate your actual ending account balance and expenses paid during the period.
| Expenses and Value of a $1,000 Investment | |||
| assuming a hypothetical 5% annualized return for the six months ended October 31, 2010 | |||
| Class A | Class C | Class I | |
| Expenses paid per $1,000† | $ 3.87 | $ 7.68 | $ 2.60 |
| Ending value (after expenses) | $1,021.37 | $1,017.59 | $1,022.63 |
† Expenses are equal to the fund’s annualized expense ratio of .76% for Class A, 1.51% for Class C and .51% for Class I, multiplied by the average account value over the period, multiplied by 184/365 (to reflect the one-half year period).
8
| STATEMENT OF INVESTMENTS |
| October 31, 2010 |
| Registered Investment Companies—100.3% | Shares | Value ($) |
| Dreyfus Global Equity Income Fund, Cl. I | 11,186 a | 108,955 |
| Dreyfus Global Sustainability Fund, Cl. I | 4,959 a | 78,989 |
| Dreyfus Worldwide Growth Fund, Cl. I | 4,031 a | 164,118 |
| Global Stock Fund, Cl. I | 13,525 a | 181,510 |
| Total Investments (cost $459,551) | 100.3% | 533,572 |
| Liabilities, Less Cash and Receivables | (.3%) | (1,584) |
| Net Assets | 100.0% | 531,988 |
| a Investment in affiliated mutual fund. | ||
| Portfolio Summary (Unaudited)† | ||
| Value (%) | ||
| Mutual Fund: Foreign Equity | 100.3 | |
| † Based on net assets. | ||
| See notes to financial statements. | ||
TheFund 9
| STATEMENT OF ASSETS AND LIABILITIES |
| October 31, 2010 |
| Cost | Value | ||
| Assets ($): | |||
| Investments in affiliated issuers—See Statement of | |||
| Investments—Note 1(c) | 459,551 | 533,572 | |
| Cash | 39,625 | ||
| Deferred assets | 24,767 | ||
| 597,964 | |||
| Liabilities ($): | |||
| Due to The Dreyfus Corporation and affiliates—Note 2(c) | 25,710 | ||
| Deferred assets | 40,266 | ||
| 65,976 | |||
| Net Assets ($) | 531,988 | ||
| Composition of Net Assets ($): | |||
| Paid-in capital | 455,593 | ||
| Accumulated undistributed investment income—net | 7,757 | ||
| Accumulated net realized gain (loss) on investments | (5,383) | ||
| Accumulated net unrealized appreciation | |||
| (depreciation) on investments | 74,021 | ||
| Net Assets ($) | 531,988 | ||
| Net Asset Value Per Share | |||
| Class A | Class C | Class I | |
| Net Assets ($) | 396,209 | 63,152 | 72,627 |
| Shares Outstanding | 24,920 | 4,026 | 4,570 |
| Net Asset Value Per Share ($) | 15.90 | 15.69 | 15.89 |
| See notes to financial statements. | |||
10
| STATEMENT OF OPERATIONS |
| Year Ended October 31, 2010 |
| Investment Income ($): | |
| Income: | |
| Cash dividends from affiliated issuers | 8,793 |
| Expenses: | |
| Registration fees | 47,242 |
| Auditing fees | 44,102 |
| Legal fees | 40,366 |
| Prospectus and shareholders’ reports | 6,732 |
| Shareholder servicing costs—Note 2(c) | 2,019 |
| Custodian fees—Note 2(c) | 1,788 |
| Distribution fees—Note 2(b) | 453 |
| Directors’ fees and expenses—Note 2(d) | 306 |
| Miscellaneous | 9,785 |
| Total Expenses | 152,793 |
| Less—reduction in expenses due to undertaking—Note 2(a) | (148,731) |
| Less—reduction in fees due to earnings credits—Note 2(c) | (5) |
| Net Expenses | 4,057 |
| Investment Income—Net | 4,736 |
| Realized and Unrealized Gain (Loss) on Investments—Note 3 ($): | |
| Net realized gain (loss) on investments in affiliated issuers | (8,160) |
| Capital gain distributions from affiliated issuers | 5,432 |
| Net Realized Gain (Loss) | (2,728) |
| Net unrealized appreciation (depreciation) on investments in affiliated issuers | 53,294 |
| Net Realized and Unrealized Gain (Loss) on Investments | 50,566 |
| Net Increase in Net Assets Resulting from Operations | 55,302 |
| See notes to financial statements. |
TheFund 11
STATEMENT OF CHANGES IN NET ASSETS
| Year Ended October 31, | ||
| 2010 | 2009a | |
| Operations ($): | ||
| Investment income (loss)—net | 4,736 | (401) |
| Net realized gain (loss) on | ||
| investments in affiliated issuers | (2,728) | 3,336 |
| Net unrealized appreciation (depreciation) | ||
| on investments in affiliated issuers | 53,294 | 20,727 |
| Net Increase (Decrease) in Net Assets | ||
| Resulting from Operations | 55,302 | 23,662 |
| Dividends to Shareholders from ($): | ||
| Net realized gain on investments: | ||
| Class A Shares | (2,219) | — |
| Class C Shares | (505) | — |
| Class I Shares | (388) | — |
| Total Dividends | (3,112) | — |
| Capital Stock Transactions ($): | ||
| Net proceeds from shares sold: | ||
| Class A Shares | 166,705 | 280,234 |
| Class C Shares | 18,018 | 50,000 |
| Class I Shares | 8,282 | 50,000 |
| Dividends reinvested: | ||
| Class A Shares | 2,219 | — |
| Class C Shares | 505 | — |
| Class I Shares | 388 | — |
| Cost of shares redeemed: | ||
| Class A Shares | (101,727) | — |
| Class C Shares | (18,488) | — |
| Increase (Decrease) in Net Assets | ||
| from Capital Stock Transactions | 75,902 | 380,234 |
| Total Increase (Decrease) in Net Assets | 128,092 | 403,896 |
| Net Assets ($): | ||
| Beginning of Period | 403,896 | — |
| End of Period | 531,988 | 403,896 |
| Undistributed investment income—net | 7,757 | — |
12
| Year Ended October 31, | ||
| 2010 | 2009a | |
| Capital Share Transactions: | ||
| Class A | ||
| Shares sold | 11,411 | 20,419 |
| Shares issued for dividends reinvested | 149 | — |
| Shares redeemed | (7,059) | — |
| Net Increase (Decrease) in Shares Outstanding | 4,501 | 20,419 |
| Class C | ||
| Shares sold | 1,208 | 4,000 |
| Shares issued for dividends reinvested | 34 | — |
| Shares redeemed | (1,216) | — |
| Net Increase (Decrease) in Shares Outstanding | 26 | 4,000 |
| Class I | ||
| Shares sold | 544 | 4,000 |
| Shares issued for dividends reinvested | 26 | — |
| Net Increase (Decrease) in Shares Outstanding | 570 | 4,000 |
| a From July 15, 2009 (commencement of operations) to October 31, 2009. | ||
| See notes to financial statements. | ||
TheFund 13
FINANCIAL HIGHLIGHTS
The following tables describe the performance for each share class for the fiscal periods indicated.All information (except portfolio turnover rate) reflects financial results for a single fund share.Total return shows how much your investment in the fund would have increased (or decreased) during each period, assuming you had reinvested all dividends and distributions.These figures have been derived from the fund’s financial statements.
| Year Ended October 31, | ||
| Class A Shares | 2010 | 2009a |
| Per Share Data ($): | ||
| Net asset value, beginning of period | 14.23 | 12.50 |
| Investment Operations: | ||
| Investment income (loss)—netb | .14 | (.02) |
| Net realized and unrealized gain (loss) on investments | 1.63 | 1.75 |
| Total from Investment Operations | 1.77 | 1.73 |
| Distributions: | ||
| Dividends from net realized gain on investments | (.10) | — |
| Net asset value, end of period | 15.90 | 14.23 |
| Total Return (%)c | 12.46 | 13.84d |
| Ratios/Supplemental Data (%): | ||
| Ratio of total expenses to average net assetse | 30.87 | 89.42f |
| Ratio of net expenses to average net assetse | .76 | .74f |
| Ratio of net investment income (loss) to average net assetse | .95 | (.45)f |
| Portfolio Turnover Rate | 43.81 | 28.98d |
| Net Assets, end of period ($ x 1,000) | 396 | 291 |
| a | From July 15, 2009 (commencement of operations) to October 31, 2009. |
| b | Based on average shares outstanding at each month end. |
| c | Exclusive of sales charge. |
| d | Not annualized. |
| e | Amounts do not include the activity of the underlying funds. |
| f | Annualized. |
| See notes to financial statements. | |
14
| Year Ended October 31, | ||
| Class C Shares | 2010 | 2009a |
| Per Share Data ($): | ||
| Net asset value, beginning of period | 14.14 | 12.50 |
| Investment Operations: | ||
| Investment income (loss)—netb | .11 | (.05) |
| Net realized and unrealized gain (loss) on investments | 1.54 | 1.69 |
| Total from Investment Operations | 1.65 | 1.64 |
| Distributions: | ||
| Dividends from net realized gain on investments | (.10) | — |
| Net asset value, end of period | 15.69 | 14.14 |
| Total Return (%)c | 11.69 | 13.12d |
| Ratios/Supplemental Data (%): | ||
| Ratio of total expenses to average net assetse | 31.49 | 95.60f |
| Ratio of net expenses to average net assetse | 1.51 | 1.49f |
| Ratio of net investment income (loss) to average net assetse | .76 | (1.17)f |
| Portfolio Turnover Rate | 43.81 | 28.98d |
| Net Assets, end of period ($ x 1,000) | 63 | 57 |
| a | From July 15, 2009 (commencement of operations) to October 31, 2009. |
| b | Based on average shares outstanding at each month end. |
| c | Exclusive of sales charge. |
| d | Not annualized. |
| e | Amounts do not include the activity of the underlying funds. |
| f | Annualized. |
| See notes to financial statements. | |
TheFund 15
FINANCIAL HIGHLIGHTS (continued)
| Year Ended October 31, | ||
| Class I Shares | 2010 | 2009a |
| Per Share Data ($): | ||
| Net asset value, beginning of period | 14.19 | 12.50 |
| Investment Operations: | ||
| Investment income (loss)—netb | .17 | (.01) |
| Net realized and unrealized gain (loss) on investments | 1.63 | 1.70 |
| Total from Investment Operations | 1.80 | 1.69 |
| Distributions: | ||
| Dividends from net realized gain on investments | (.10) | — |
| Net asset value, end of period | 15.89 | 14.19 |
| Total Return (%) | 12.71 | 13.52c |
| Ratios/Supplemental Data (%): | ||
| Ratio of total expenses to average net assetsd | 29.92 | 94.61e |
| Ratio of net expenses to average net assetsd | .51 | .49e |
| Ratio of net investment income (loss) to average net assetsd | 1.18 | (.17)e |
| Portfolio Turnover Rate | 43.81 | 28.98c |
| Net Assets, end of period ($ x 1,000) | 73 | 57 |
| a | From July 15, 2009 (commencement of operations) to October 31, 2009. |
| b | Based on average shares outstanding at each month end. |
| c | Not annualized. |
| d | Amounts do not include the activity of the underlying funds. |
| e | Annualized. |
| See notes to financial statements. | |
16
NOTES TO FINANCIAL STATEMENTS
NOTE 1—Significant Accounting Policies:
Dreyfus Diversified Global Fund (the “fund”) is a separate diversified series of Dreyfus Premier Investment Funds, Inc. (the “Company”), which is registered under the Investment Company Act of 1940, as amended (the “Act”), as an open-end management investment company and operates as a series company currently offering ten series, including the fund. The fund’s investment objective is to seek long-term capital appreciation.The Dreyfus Corporation (the “Manager” or “Dreyfus”), a wholly-owned subsidiary of The Bank of New York Mellon Corporation (“BNY Mellon”), serves as the fund’s investment adviser.
MBSC Securities Corporation (the “Distributor”), a wholly-owned subsidiary of the Manager, is the distributor of the fund’s shares.The fund is authorized to issue 50 million shares of $.001 par value Common Stock in each of the following classes of shares: Class A, Class C, and Class I. Class A shares are subject to a sales charge imposed at the time of purchase. Class C shares are subject to a contingent deferred sales charge (“CDSC”) imposed on Class C shares redeemed within one year of purchase. Class I shares are sold at net asset value per share only to institutional investors. Other differences between the classes include the services offered to and the expenses borne by each class, the allocation of certain transfer agency costs and certain voting rights. Income, expenses (other than expenses attributable to a specific class), and realized and unrealized gains or losses on investmen ts are allocated to each class of shares based on its relative net assets.
As of October 31, 2010, MBC Investments Corp., an indirect subsidiary of BNY Mellon, held 8,052 Class A, 4,026 Class C and 4,026 Class I shares of the fund.
The Company accounts separately for the assets, liabilities and operations of each series. Expenses directly attributable to each series are charged to that series’ operations; expenses which are applicable to all series are allocated among them on a pro rata basis.
TheFund 17
NOTES TO FINANCIAL STATEMENTS (continued)
The Financial Accounting Standards Board (“FASB”) Accounting Standards Codification (“ASC”) is the exclusive reference of authoritative U.S. generally accepted accounting principles (“GAAP”) recognized by the FASB to be applied by nongovernmental entities. Rules and interpretive releases of the Securities and Exchange Commission (“SEC”) under authority of federal laws are also sources of authoritative GAAP for SEC registrants. The fund’s financial statements are prepared in accordance with GAAP, which may require the use of management estimates and assumptions.Actual results could differ from those estimates.
The Company enters into contracts that contain a variety of indemnifications.The fund’s maximum exposure under these arrangements is unknown.The fund does not anticipate recognizing any loss related to these arrangements.
(a) Portfolio valuation: Investments are valued at the net asset value of each underlying fund determined as of the close of the New York Stock Exchange (generally 4 p.m., Eastern time) on the valuation date.
The fair value of a financial instrument is the amount that would be received to sell an asset or paid to transfer a liability in an orderly transaction between market participants at the measurement date (i.e. the exit price). GAAP establishes a fair value hierarchy that prioritizes the inputs of valuation techniques used to measure fair value.This hierarchy gives the highest priority to unadjusted quoted prices in active markets for identical assets or liabilities (Level 1 measurements) and the lowest priority to unobservable inputs (Level 3 measurements).
Additionally, GAAP provides guidance on determining whether the volume and activity in a market has decreased significantly and whether such a decrease in activity results in transactions that are not orderly. GAAP requires enhanced disclosures around valuation inputs and techniques used during annual and interim periods.
18
Various inputs are used in determining the value of the fund’s investments relating to fair value measurements.These inputs are summarized in the three broad levels listed below:
Level 1—unadjusted quoted prices in active markets for identical investments.
Level 2—other significant observable inputs (including quoted prices for similar investments, interest rates, prepayment speeds, credit risk, etc.).
Level 3—significant unobservable inputs (including the fund’s own assumptions in determining the fair value of investments).
The inputs or methodology used for valuing securities are not necessarily an indication of the risk associated with investing in those securities.
The following is a summary of the inputs used as of October 31, 2010 in valuing the fund’s investments:
| Level 2—Other | Level 3— | |||
| Level 1— | Significant | Significant | ||
| Unadjusted | Observable | Unobservable | ||
| Quoted Prices | Inputs | Inputs | Total | |
| Assets ($) | ||||
| Investments in Securities: | ||||
| Mutual Funds | 533,572 | — | — | 533,572 |
In January 2010, FASB issued Accounting Standards Update (“ASU”) No. 2010-06 “Improving Disclosures about FairValue Measurements”. The portions of ASU No. 2010-06 which require reporting entities to prepare new disclosures surrounding amounts and reasons for significant transfers in and out of Level 1 and Level 2 fair value measurements as well as inputs and valuation techniques used to measure fair value for both recurring and nonrecurring fair value measurements that fall in either Level 2 or Level 3 have been adopted by the fund.
TheFund 19
NOTES TO FINANCIAL STATEMENTS (continued)
No significant transfers between Level 1 or Level 2 fair value measurements occurred at October 31, 2010.The remaining portion of ASU No. 2010-06 requires reporting entities to make new disclosures about information on purchases, sales, issuances and settlements on a gross basis in the reconciliation of activity in Level 3 fair value measurements. These new and revised disclosures are required to be implemented for fiscal years beginning after December 15, 2010. Management is currently evaluating the impact that the adoption of this remaining portion of ASU No. 2010-06 may have on the fund’s financial statement disclosures.
(b) Securities transactions and investment income: Securities transactions are recorded on a trade date basis. Realized gains and losses from securities transactions are recorded on the identified cost basis. Dividend income is recognized on the ex-dividend date and interest income, including, where applicable, accretion of discount and amortization of premium on investments, is recognized on the accrual basis.
(c) Affiliated issuers: Investments in other investment companies advised by Dreyfus are defined as “affiliated” in the Act.
The fund may invest in shares of certain affiliated investment companies also advised or managed by Dreyfus. Investments in affiliated investment companies for the period ended October 31, 2010 were as follows:
| Affiliated Investment | Value | Dividends/ | ||
| Company | 10/31/2009 ($) | Purchases ($) | Sales ($) | Distributions ($) |
| Dreyfus Global Equity | ||||
| Income Fund, Cl. I | 60,950 | 63,542 | 24,201 | 3,561 |
| Dreyfus Global | ||||
| Real Estate | ||||
| Securities Fund, Cl. I | 20,872 | 1,656 | 23,500 | — |
| Dreyfus Global | ||||
| Sustainability Fund, Cl. I 80,442 | 67,586 | 68,469 | 3,832 | |
| Dreyfus Worldwide | ||||
| Growth Fund, Cl. I | 122,512 | 82,645 | 57,285 | 5,860 |
| Global Stock Fund, Cl. I | 119,745 | 81,864 | 39,921 | 972 |
| Total | 404,521 | 297,293 | 213,376 | 14,225 |
20
| Change in Net | ||||
| Unrealized | ||||
| Affiliated Investment | Net Realized | Appreciation | Value | Net |
| Company | Gain/(Loss) ($) | (Depreciation) ($) | 10/31/2010 ($) Assets (%) | |
| Dreyfus Global Equity | ||||
| Income Fund, Cl. I | (851) | 9,515 | 108,955 | 20.5 |
| Dreyfus Global Real | ||||
| Estate Securities | ||||
| Fund, Cl. I | 2,867 | (1,895) | — | — |
| Dreyfus Global | ||||
| Sustainability Fund, Cl. I | (7,668) | 7,098 | 78,989 | 14.8 |
| Dreyfus Worldwide | ||||
| Growth Fund, Cl. I | (1,393) | 17,639 | 164,118 | 30.9 |
| Global Stock Fund, Cl. I | (1,115) | 20,937 | 181,510 | 34.1 |
| Total | (8,160) | 53,294 | 533,572 | 100.3 |
(d) Dividends to shareholders: Dividends are recorded on the ex-dividend date. Dividends from investment income-net and dividends from net realized capital gains, if any, are normally declared and paid annually, but the fund may make distributions on a more frequent basis to comply with the distribution requirements of the Internal Revenue Code of 1986, as amended (the “Code”).To the extent that net realized capital gains can be offset by capital loss carryovers, it is the policy of the fund not to distribute such gains. Income and capital gain distributions are determined in accordance with income tax regulations, which may differ from GAAP.
(e) Federal income taxes: It is the policy of the fund to continue to qualify as a regulated investment company, if such qualification is in the best interests of its shareholders, by complying with the applicable provisions of the Code, and to make distributions of taxable income sufficient to relieve it from substantially all federal income and excise taxes.
As of and during the period ended October 31, 2010, the fund did not have any liabilities for any uncertain tax positions.The fund recognizes interest and penalties, if any, related to uncertain tax positions as income tax expense in the Statement of Operations. During the period, the fund did not incur any interest or penalties.
TheFund 21
NOTES TO FINANCIAL STATEMENTS (continued)
Each of the tax years in two-year period ended October 31, 2010 remains subject to examination by the Internal Revenue Service and state taxing authorities.
At October 31, 2010, the components of accumulated earnings on a tax basis were as follows: undistributed ordinary income $7,757, undistributed capital losses $2,013 and unrealized appreciation $70,651.
The accumulated capital loss carryover is available for federal income tax purposes to be applied against future net securities profits, if any, realized subsequent to October 31, 2010. If not applied, the carryover expires in fiscal 2018.
The tax character of distributions paid to shareholders during the fiscal periods ended October 31, 2010 and October 31, 2009 were as follows: ordinary income $3,112 and $0, respectively.
During the period ended October 31, 2010, as a result of permanent book to tax differences, primarily due to the tax treatment for short-term capital gain distributions from regulated investment company holdings, the fund increased accumulated undistributed investment income-net by $3,021, decreased net realized gain (loss) on investments by $2,646 and decreased paid-in capital by $375. Net assets and net asset value per share were not affected by this reclassification.
NOTE 2—Management Fee and Other Transactions with Affiliates:
(a) Pursuant to a management agreement with the Manager, there is no management fee paid to the Manager. The fund invests in other mutual funds advised by the Manager. All fees and expenses of the underlying funds are reflected in the underlying funds’ net asset value.
The Manager has contractually agreed, until March 1, 2012, to assume the expenses of the fund so that the total annual fund and underlying funds operating expenses of none of the classes (excluding Rule 12b-1 fees, shareholder services fees, taxes, interest, brokerage commissions and extraordinary expenses) exceed 1.50% of the value of the fund’s average daily net assets.The reduction in expenses, pursuant to the undertaking, amounted to $148,731 during the period ended October 31, 2010.
22
(b) Under the Distribution Plan (the “Plan”) adopted pursuant to Rule 12b-1 under the Act, Class C shares pay the Distributor for distributing its shares at an annual rate of .75% of the value of the average daily net assets of Class C shares. During the period ended October 31, 2010, Class C shares were charged $453 pursuant to the Plan.
(c) Under the Shareholder Services Plan, Class A and Class C shares pay the Distributor at an annual rate of .25% of the value of their average daily net assets for the provision of certain services. The services provided may include personal services relating to shareholder accounts, such as answering shareholder inquiries regarding Class A and Class C shares and providing reports and other information, and services related to the maintenance of shareholder accounts. The Distributor may make payments to Service Agents (a securities dealer, financial institution or other industry professional) in respect of these services.The Distributor determines the amounts to be paid to Service Agents. During the period ended October 31, 2010, Class A and Class C shares were charged $925 and $151, respectively, pursuant to the Shareholde r Services Plan.
The fund compensates DreyfusTransfer, Inc., a wholly-owned subsidiary of the Manager, under a transfer agency agreement for providing personnel and facilities to perform transfer agency services for the fund. During the period ended October 31, 2010, the fund was charged $589 pursuant to the transfer agency agreement, which is included in Shareholder servicing costs in the Statement of Operations.
The fund has arrangements with the custodian and cash management bank whereby the fund may receive earnings credits when positive cash balances are maintained, which are used to offset custody and cash management fees. For financial reporting purposes, the fund includes net earnings credits as an expense offset in the Statement of Operations.
The fund compensates The Bank of New York Mellon, a subsidiary of BNY Mellon and an affiliate of Dreyfus, under a cash management agreement for performing cash management services related to fund subscriptions and redemptions. During the period ended October 31, 2010,
TheFund 23
NOTES TO FINANCIAL STATEMENTS (continued)
the fund was charged $75 pursuant to the cash management agreement, which is included in Shareholder servicing costs in the Statement of Operations.These fees were partially offset by earnings credits of $5.
The fund also compensates The Bank of New York Mellon under a custody agreement for providing custodial services for the fund. During the period ended October 31, 2010, the fund was charged $1,788 pursuant to the custody agreement.
During the period ended October 31, 2010, the fund was charged $4,798 for services performed by the Chief Compliance Officer.
The components of “Due to The Dreyfus Corporation and affiliates” in the Statement of Assets and Liabilities consist of: Rule 12b-1 distribution plan fees $40, shareholder services plan fees $97, custodian fees $665, chief compliance officer fees $2,248, transfer agency per account fees $85 and other expenses $22,575.
(d) Each Board member also serves as a Board member of other funds within the Dreyfus complex. Annual retainer fees and attendance fees are allocated to each fund based on net assets.
NOTE 3—Securities Transactions:
The aggregate amount of purchases and sales of investment securities, excluding short-term securities, during the period ended October 31, 2010, amounted to $297,293 and $213,376, respectively.
The provisions of ASC Topic 815 “Derivatives and Hedging” require qualitative disclosures about objectives and strategies for using derivatives, quantitative disclosures about fair value amounts of gains and losses on derivative instruments and disclosures about credit-risk related contingent features in derivative agreements.The fund held no derivatives during the period ended October 31, 2010.
At October 31, 2010, the cost of investments for federal income tax purposes was $462,921; accordingly, accumulated net unrealized appreciation on investments was $70,651, consisting of gross unrealized appreciation.
24
| REPORT OF INDEPENDENT REGISTERED |
| PUBLIC ACCOUNTING FIRM |
Shareholders and Board of Directors
Dreyfus Diversified Global Fund
We have audited the accompanying statement of assets and liabilities, including the statement of investments, of Dreyfus Diversified Global Fund (one of the series comprising Dreyfus Premier Investment Funds, Inc.) as of October 31, 2010, and the related statement of operations for the year then ended and the statement of changes in net assets and financial highlights for the year then ended and for the period from July 15, 2009 (commencement of operations) to October 31, 2009.These financial statements and financial highlights are the responsibility of the Fund’s management. Our responsibility is to express an opinion on these financial statements and financial highlights based on our audits.
We conducted our audits in accordance with the standards of the Public Company Accounting Oversight Board (United States).Those standards require that we plan and perform the audit to obtain reasonable assurance about whether the financial statements and financial highlights are free of material misstatement. We were not engaged to perform an audit of the Fund’s internal control over financial reporting. Our audits included consideration of internal control over financial reporting as a basis for designing audit procedures that are appropriate in the circumstances, but not for the purpose of expressing an opinion on the effectiveness of the Fund’s internal control over financial reporting. Accordingly, we express no such opinion. An audit also includes examining, on a test basis, evidence supporting the amounts and disclosures in the financial statements and financial highlights, assessing the accounting principles used and significant estimates made by management, and evaluating the overall financial statement presentation. Our procedures included confirmation of securities owned as of October 31, 2010 by correspondence with the custodian and others.We believe that our audits provide a reasonable basis for our opinion.
In our opinion, the financial statements and financial highlights referred to above present fairly, in all material respects, the financial position of Dreyfus Diversified Global Fund at October 31, 2010, the results of its operations for the year then ended and the changes in its net assets and the financial highlights for the year then ended and for the period from July 15, 2009 to October 31, 2009, in conformity with U.S. generally accepted accounting principles.

New York, New York
December 28, 2010
TheFund 25
IMPORTANT TAX INFORMATION (Unaudited)
In accordance with federal tax law, the fund hereby designates 7.49% of the ordinary dividends paid during the fiscal year ended October 31, 2010 as qualifying for the corporate dividends received deduction. For the fiscal year ended October 31, 2010, certain dividends paid by the fund may be subject to a maximum tax rate of 15%, as provided for by the Jobs and Growth Tax Relief Reconciliation Act of 2003. Of the distributions paid during the fiscal year, $232 represents the maximum amount that may be considered qualified dividend income. Shareholders will receive notification in early 2011 of the percentage applicable to the preparation of their 2010 income tax returns. Also, the fund hereby designates $.0970 per share as a short-term capital gain distribution paid on December 31, 2009.
26
| INFORMATION ABOUT THE REVIEW AND APPROVAL |
| OF THE FUND’S MANAGEMENT AGREEMENT (Unaudited) |
At a meeting of the fund’s Board held on July 13, 2010, the Board considered the re-approval of the fund’s Management Agreement with Dreyfus for a one-year term ending July 31, 2011. The Board members, none of whom are “interested persons” (as defined in the Investment Company Act of 1940, as amended) of the fund, were assisted in their review by independent legal counsel and met with counsel in executive session separate from representatives of Dreyfus. In considering the re-approval of the Management Agreement, the Board considered all factors that it believed to be relevant, including, among other things, the factors discussed below.
Analysis of Nature, Extent and Quality of Services Provided to the Fund.The Board members received a presentation from representatives of Dreyfus regarding services provided to the fund and other funds in the Dreyfus fund complex, and discussed the nature, extent and quality of the services provided to the fund pursuant to its Management Agreement. Dreyfus’ representatives reviewed the fund’s distribution of accounts and the relationships Dreyfus has with various intermediaries and the different needs of each. Dreyfus’ representatives noted the various distribution channels for the fund as well as the diverse methods of distribution among other funds in the Dreyfus fund complex, and Dreyfus’ corresponding need for broad, deep, and diverse resources to be able to provide ongoing shareholder services to each distrib ution channel, including those of the fund. Dreyfus also provided the number of accounts investing in the fund, as well as the fund’s asset size.
The Board members also considered Dreyfus’ research and portfolio management capabilities and Dreyfus’ oversight of day-to-day fund operations, including fund accounting, administration and assistance in meeting legal and regulatory requirements. The Board members also considered Dreyfus’ extensive administrative, accounting and compliance infrastructure.
TheFund 27
| INFORMATION ABOUT THE REVIEW AND APPROVAL OF THE |
| FUND’S MANAGEMENT AGREEMENT (Unaudited) (continued) |
Comparative Analysis of the Fund’s Performance and Management Fee and Expense Ratio.The Board members reviewed the fund’s performance for the ten-month period ended May 31, 2010, and compared the fund’s performance to the performance of a group of three other comparable retail front-end load global multi-cap growth funds that are passively managed affiliated funds of funds (the “Performance Group”) and to a larger universe of funds consisting of all retail and institutional global multi-cap growth funds (the “Performance Universe”), selected and provided by Lipper, Inc., an independent provider of investment company data. The Board was provided with a description of the methodology Lipper used to select the Performance Group and Performance Universe, as well as the Expense Group and Expense Universe (discussed below).The Board members discussed the results of the comparisons and noted that the fund’s total return performance for the ten-month period ended May 31, 2010 was the lowest of the Performance Group and below the Performance Universe median (in the fourth quartile). Dreyfus also provided a comparison of the fund’s calendar year total returns to the returns of the fund’s benchmark index.
The Board members also discussed the fund’s management fee and expense ratio and reviewed the range of actual and contractual management fees and total expense ratios of three comparable funds (the “Expense Group”) and a broader group of funds (the “Expense Universe”), each selected and provided by Lipper.The Board members noted that, like two of the other funds in the Expense Group, the fund’s management fees are paid only at the underlying funds level and the fund’s total expense ratio was higher than the Expense Group and Expense Universe medians. In addition, the Board noted Dreyfus has contractually agreed, until March 1, 2011, to assume the expenses of the fund so that the total annual fund and underlying funds operating expenses of none of the classes (excluding Rule 12b-1 fees, shareholder services fees, taxes, interest, brokerage commissions, commitment fees on borrowing s and extraordinary expenses) exceed 1.50% of the value of the fund’s average daily net assets.
28
Representatives of Dreyfus noted that Dreyfus or its affiliates do not manage other mutual funds or accounts with similar investment objectives, policies and strategies as the fund. It also was noted that there were no other accounts managed by Dreyfus or its affiliates with similar investment objectives, policies and strategies as the fund.
Analysis of Profitability and Economies of Scale. Dreyfus would not have direct profits from the fund’s management fee, since the fund would pay no direct management fee. Similarly, economies of scale were not relevant.The Board members considered potential benefits to Dreyfus from acting as investment adviser.
At the conclusion of these discussions, the Board agreed that it had been furnished with sufficient information to make an informed business decision with respect to re-approving the Management Agreement. Based on the discussions and considerations as described above, the Board made the following conclusions and determinations.
The Board concluded that the nature, extent and quality of the services provided by Dreyfus are adequate and appropriate.
The Board was generally satisfied with the fund’s relative perfor- mance, noting the short period of the fund’s operations.
Since the fund would not pay a direct management fee, profitability and economies of scale were not relevant.
The Board members considered these conclusions and determinations, along with information received on a routine and regular basis throughout the year, and, without any one factor being dispositive, the Board determined that re-approval of the Management Agreement through July 31, 2011 was in the best interests of the fund and its shareholders.
TheFund 29
OFFICERS OF THE FUND (Unaudited)
BRADLEY J. SKAPYAK, President since January 2010.
Chief Operating Officer and a director of the Manager since June 2009. From April 2003 to June 2009, Mr. Skapyak was the head of the Investment Accounting and Support Department of the Manager. He is an officer of 76 investment companies (comprised of 170 portfolios) managed by the Manager. He is 51 years old and has been an employee of the Manager since February 1988.
PHILLIP N. MAISANO, Executive Vice President since July 2007.
Chief Investment Officer,Vice Chair and a director of the Manager, and an officer of 76 investment companies (comprised of 170 portfolios) managed by the Manager.
Mr. Maisano also is an officer and/or Board member of certain other investment management subsidiaries of The Bank of New York Mellon Corporation, each of which is an affiliate of the Manager. He is 63 years old and has been an employee of the Manager since November 2006. Prior to joining the Manager, Mr. Maisano served as Chairman and Chief Executive Officer of EACM Advisors, an affiliate of the Manager, since August 2004.
MICHAEL A. ROSENBERG, Vice President and Secretary since August 2005.
Assistant General Counsel of BNY Mellon, and an officer of 77 investment companies (comprised of 195 portfolios) managed by the Manager. He is 50 years old and has been an employee of the Manager since October 1991.
KIESHA ASTWOOD, Vice President and Assistant Secretary since January 2010.
Counsel of BNY Mellon, and an officer of 77 investment companies (comprised of 195 portfolios) managed by the Manager. She is 37 years old and has been an employee of the Manager since July 1995.
JAMES BITETTO, Vice President and Assistant Secretary since August 2005.
Senior Counsel of BNY Mellon and Secretary of the Manager, and an officer of 77 investment companies (comprised of 195 portfolios) managed by the Manager. He is 44 years old and has been an employee of the Manager since December 1996.
JONI LACKS CHARATAN, Vice President and Assistant Secretary since August 2005.
Senior Counsel of BNY Mellon, and an officer of 77 investment companies (comprised of 195 portfolios) managed by the Manager. She is 54 years old and has been an employee of the Manager since October 1988.
JOSEPH M. CHIOFFI, Vice President and Assistant Secretary since August 2005.
Senior Counsel of BNY Mellon, and an officer of 77 investment companies (comprised of 195 portfolios) managed by the Manager. He is 48 years old and has been an employee of the Manager since June 2000.
KATHLEEN DENICHOLAS, Vice President and Assistant Secretary since January 2010.
Senior Counsel of BNY Mellon, and an officer of 77 investment companies (comprised of 195 portfolios) managed by the Manager. She is 36 years old and has been an employee of the Manager since February 2001.
JANETTE E. FARRAGHER, Vice President and Assistant Secretary since August 2005.
Assistant General Counsel of BNY Mellon, and an officer of 77 investment companies (comprised of 195 portfolios) managed by the Manager. She is 47 years old and has been an employee of the Manager since February 1984.
32
JOHN B. HAMMALIAN, Vice President and Assistant Secretary since August 2005.
Managing Counsel of BNY Mellon, and an officer of 77 investment companies (comprised of 195 portfolios) managed by the Manager. He is 47 years old and has been an employee of the Manager since February 1991.
M. CRISTINA MEISER, Vice President and Assistant Secretary since January 2010.
Senior Counsel of BNY Mellon, and an officer of 77 investment companies (comprised of 195 portfolios) managed by the Manager. She is 40 years old and has been an employee of the Manager since August 2001.
ROBERT R. MULLERY, Vice President and Assistant Secretary since August 2005.
Managing Counsel of BNY Mellon, and an officer of 77 investment companies (comprised of 195 portfolios) managed by the Manager. He is 58 years old and has been an employee of the Manager since May 1986.
JEFF PRUSNOFSKY, Vice President and Assistant Secretary since August 2005.
Managing Counsel of BNY Mellon, and an officer of 77 investment companies (comprised of 195 portfolios) managed by the Manager. He is 45 years old and has been an employee of the Manager since October 1990.
JAMES WINDELS, Treasurer since November 2001.
Director – Mutual Fund Accounting of the Manager, and an officer of 77 investment companies (comprised of 195 portfolios) managed by the Manager. He is 52 years old and has been an employee of the Manager since April 1985.
RICHARD CASSARO, Assistant Treasurer since January 2008.
Senior Accounting Manager – Money Market and Municipal Bond Funds of the Manager, and an officer of 77 investment companies (comprised of 195 portfolios) managed by the Manager. He is 51 years old and has been an employee of the Manager since September 1982.
GAVIN C. REILLY, Assistant Treasurer since December 2005.
Tax Manager of the Investment Accounting and Support Department of the Manager, and an officer of 77 investment companies (comprised of 195 portfolios) managed by the Manager. He is 42 years old and has been an employee of the Manager since April 1991.
ROBERT ROBOL, Assistant Treasurer since August 2005.
Senior Accounting Manager – Fixed Income Funds of the Manager, and an officer of 77 investment companies (comprised of 195 portfolios) managed by the Manager. He is 46 years old and has been an employee of the Manager since October 1988.
ROBERT SALVIOLO, Assistant Treasurer since July 2007.
Senior Accounting Manager – Equity Funds of the Manager, and an officer of 77 investment companies (comprised of 195 portfolios) managed by the Manager. He is 43 years old and has been an employee of the Manager since June 1989.
TheFund 33
OFFICERS OF THE FUND (Unaudited) (continued)
ROBERT SVAGNA, Assistant Treasurer since December 2002.
Senior Accounting Manager – Equity Funds of the Manager, and an officer of 77 investment companies (comprised of 195 portfolios) managed by the Manager. He is 43 years old and has been an employee of the Manager since November 1990.
JOSEPH W. CONNOLLY, Chief Compliance Officer since October 2004.
Chief Compliance Officer of the Manager and The Dreyfus Family of Funds (77 investment companies, comprised of 195 portfolios). From November 2001 through March 2004, Mr. Connolly was first Vice-President, Mutual Fund Servicing for Mellon Global Securities Services. In that capacity, Mr. Connolly was responsible for managing Mellon’s Custody, Fund Accounting and Fund Administration services to third-party mutual fund clients.
He is 53 years old and has served in various capacities with the Manager since 1980, including manager of the firm’s Fund Accounting Department from 1997 through October 2001.
NATALIA GRIBAS, Anti-Money Laundering Compliance Officer since July 2010.
Anti-Money Laundering Compliance Officer of the Distributor, and the Anti-Money Laundering Compliance Officer of 73 investment companies (comprised of 191 portfolios) managed by the Manager. She is 40 years old and has been an employee of the Distributor since September 2008.
34
NOTES
Save time. Save paper. View your next shareholder report online as soon as it’s available. Log into www.dreyfus.com and sign up for Dreyfus eCommunications. It’s simple and only takes a few minutes.
The views expressed in this report reflect those of the portfolio manager only through the end of the period covered and do not necessarily represent the views of Dreyfus or any other person in the Dreyfus organization. Any such views are subject to change at any time based upon market or other conditions and Dreyfus disclaims any responsibility to update such views.These views may not be relied on as investment advice and, because investment decisions for a Dreyfus fund are based on numerous factors, may not be relied on as an indication of trading intent on behalf of any Dreyfus fund.
Not FDIC-Insured • Not Bank-Guaranteed • May Lose Value
Contents | |
THE FUND | |
| 2 | A Letter from the Chairman and CEO |
| 3 | Discussion of Fund Performance |
| 6 | Fund Performance |
| 8 | Understanding Your Fund’s Expenses |
| 8 | Comparing Your Fund’s Expenses With Those of Other Funds |
| 9 | Statement of Investments |
| 10 | Statement of Assets and Liabilities |
| 11 | Statement of Operations |
| 12 | Statement of Changes in Net Assets |
| 14 | Financial Highlights |
| 17 | Notes to Financial Statements |
| 26 | Report of Independent Registered Public Accounting Firm |
| 27 | Important Tax Information |
| 28 | Information About the Review and Approval of the Fund’s Management Agreement |
| 32 | Board Members Information |
| 34 | Officers of the Fund |
FOR MORE INFORMATION | |
Back Cover |
Dreyfus
Diversified
International Fund
The Fund

A LETTER FROM THE CHAIRMAN AND CEO
Dear Shareholder:
We are pleased to present this annual report for Dreyfus Diversified International Fund, covering the 12-month period from November 1, 2009, through October 31, 2010.
Although a double-dip recession has recently become an increasingly unlikely scenario in our view, persistent uncertainty regarding the breadth and strength of the U.S. and global economic recoveries led to bouts of heightened volatility for U.S. stocks during most of 2010.The spending power of the U.S. consumer, long an important catalyst for economic growth, has been diminished by concerns over job security and an inability to generate cash from home equity.The second major driver of sustainable growth, corporate investment, has been stunted to a similar extent by tight credit conditions. However, the recent announcement of additional quantitative easing (QE2) measures by the Federal Reserve Board, as well as improved fundamentals across many developing nations, have helped support moderate global economic growth.
Uncertainty will probably remain in the broader financial markets until we see more evidence of robust economic growth, but we remain optimistic regarding the prospects for equities. Many stocks of quality companies with healthy balance sheets, higher credit ratings and strong cash flows appear to be currently priced at a discount.With that, we strongly suggest that you meet with your financial advisor to discuss the potential opportunities which may exist in the global markets, as well as to evaluate your portfolio to help meet your individual investment needs and your future goals relative to your risk-tolerance level.
For information about how the fund performed during the reporting period, as well as general market perspectives, we provide a Discussion of Fund Performance on the pages that follow.
Thank you for your continued confidence and support.

Jonathan R. Baum
Chairman and Chief Executive Officer
The Dreyfus Corporation
November 15, 2010
2

DISCUSSION OF FUND PERFORMANCE
For the period of November 1, 2009, through October 31, 2010, as provided by Richard B. Hoey, A. Paul Disdier, Christopher E. Sheldon, CFA, and Keith L. Stransky, CFA, Portfolio Managers
Market and Fund Performance Overview
For the 12-month period ended October 31, 2010, Dreyfus Diversified International Fund’s Class A shares produced a total return of 10.18%, Class C shares returned 9.21% and Class I shares returned 10.34%.1 In comparison, the fund’s benchmark, the Morgan Stanley Capital International Europe, Australasia, Far East (MSCI EAFE) Index (the “Index”), produced a total return of 8.36% for the same period.2
After rallying over the first half of the reporting period, international stock markets encountered heightened volatility over the second half, mainly due to intensifying economic concerns in Europe. The fund produced returns that were higher than its benchmark, as six of the fund’s seven underlying investments produced above-average returns.
The Fund’s Investment Approach
The fund seeks long-term capital appreciation.To pursue its goal, the fund normally allocates its assets among other mutual funds advised by The Dreyfus Corporation (Dreyfus), or its affiliates, that invest primarily in stocks issued by foreign companies. The underlying funds are selected by the Dreyfus Investment Committee based on their investment objectives and management policies, portfolio holdings, risk/reward profiles, historical performance and other factors. The Dreyfus Investment Committee will rebalance the fund’s investments in the underlying funds at least annually, but may do so more often in response to market conditions. As of October 31, 2010, the fund’s assets were allocated as follows:
| Underlying Funds | (%) |
| International Stock Fund | 23 |
| Dreyfus International Equity Fund | 23 |
| Dreyfus International Value Fund | 23 |
| Dreyfus/Newton International Equity Fund | 20 |
| Dreyfus Emerging Markets Fund | 8 |
| Dreyfus Emerging Asia Fund | 3 |
TheFund 3
DISCUSSION OF FUND PERFORMANCE (continued)
Economic Concerns Sparked Heightened Market Volatility
From the beginning of the reporting period through April 2010, economies throughout the world continued to recover from recession, propelling stock prices higher. However, in May 2010 investors faced new economic uncertainties when Europe was roiled by a sovereign debt crisis and inflation-fighting measures in China threatened to dampen a major engine of global growth.As a result, the international stock market rally was derailed over the spring and summer, with some markets falling sharply.Those losses generally proved temporary, however, as economic worries eased and robust demand from the emerging markets helped drive market rallies in September and October.
Underlying Investments Produced Mixed Results
The fund benefited during the reporting period from overweighted exposure to the emerging markets of Asia and Latin America, which outperformed developed markets in Western Europe and Japan. Indeed, the fund derived some of its stronger returns from Dreyfus Emerging Asia Fund, Emerging Markets Opportunity Fund and Dreyfus Emerging Markets Fund. Also adding value to the fund’s relative performance were International Stock Fund, Dreyfus/Newton International Equity Fund and Dreyfus International Equity Fund. In the aggregate, the fund benefited from underweighted exposure to the struggling financials sector and favorable security selections in the telecommunications and utilities sectors. From a country allocation standpoint, the fund achieved especially robust results in China, which is not represented in the MSCI EAFE Index. Underweighted exposure to Spain and good stock picking in Japan and Denmark also bolst ered the fund’s relative results.
Only Dreyfus International Value Fund lagged market averages during the reporting period. Generally, the fund’s performance was undermined by relatively light exposure to the materials sector and unfortunate stock selections in Italy and the health care sector.
We made several allocation changes during the reporting period. In November 2009, we shifted some assets from Dreyfus/Newton International Equity Fund to Dreyfus International Equity Fund. Throughout the fiscal year, we reduced and eventually eliminated the allocation to Emerging Markets Opportunity Fund in favor of Dreyfus Emerging Markets Fund, Dreyfus Emerging Asia Fund and
4
Dreyfus International Equity Fund. Our positive view of the markets was reflected in August, when we shifted our allocation from Dreyfus International Equity Fund to International Stock Fund and Dreyfus Emerging Markets Fund. Finally, in September we shifted additional assets from Dreyfus International Value Fund to Dreyfus Emerging Markets Fund.
Positioned for Further Global Recovery
Although we remain concerned regarding economic headwinds, we are optimistic about the prospects for international equities. In our judgment, rising corporate earnings could lead to an increase in mergers-and-acquisitions activity, potentially benefiting stocks as companies deploy some of their massive cash reserves. In addition, low yields from sovereign bonds could motivate income-oriented investors to increase their participation in high-quality, dividend-paying stocks. Finally, we believe that the fund’s broadly diversified exposure to international stocks through some of our company’s portfolio managers positions it to participate in areas of opportunity in today’s slow-growth environment.
November 15, 2010
| Equity funds are subject generally to market, market sector, market liquidity, issuer and investment | |
| style risks, among other factors, to varying degrees, all of which are more fully described in the | |
| prospectus of the fund and that of each underlying fund. | |
| The ability of the fund to achieve its investment goal depends, in part, on the ability of the | |
| Dreyfus Investment Committee to allocate effectively the fund’s assets among the underlying | |
| funds.There can be no assurance that the actual allocations will be effective in achieving the fund’s | |
| investment goal. | |
| Each underlying fund’s performance will be influenced by political, social and economic factors | |
| affecting investments in foreign companies. Special risks associated with such companies include | |
| exposure to currency fluctuations, less liquidity, less developed or less efficient trading markets, lack | |
| of comprehensive company information, political instability and differing auditing and legal | |
| standards.These risks are higher in emerging market countries. | |
| 1 | Total return includes reinvestment of dividends and any capital gains paid, and does not take into |
| consideration the maximum initial sales charge in the case of Class A shares, or the applicable | |
| contingent deferred sales charge imposed on redemptions in the case of Class C shares. Had these | |
| charges been reflected, returns would have been lower. Past performance is no guarantee of future | |
| results. Share price and investment return fluctuate such that upon redemption, fund shares may be | |
| worth more or less than their original cost. Return figures provided reflect the absorption of certain | |
| fund expenses by The Dreyfus Corporation through March 1, 2012, at which time it may be | |
| extended, terminated or modified. Had these expenses not been absorbed, the fund’s returns would | |
| have been lower. | |
| 2 | SOURCE: LIPPER INC. — Reflects reinvestment of net dividends and, where applicable, |
| capital gain distributions.The Morgan Stanley Capital International Europe,Australasia, Far | |
| East (MSCI EAFE) Index is an unmanaged index composed of a sample of companies | |
| representative of the market structure of European and Pacific Basin countries. |
TheFund 5
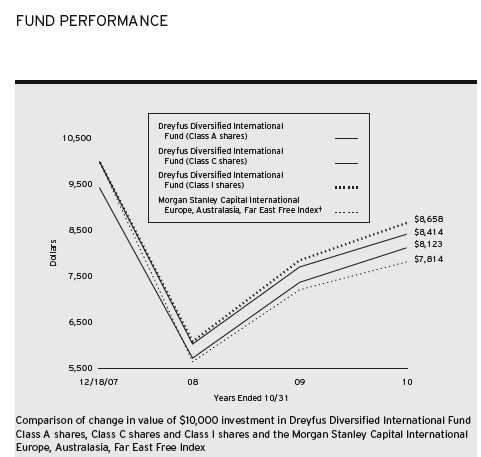
| † Source: Lipper Inc. |
| Past performance is not predictive of future performance. |
| The above graph compares a $10,000 investment made in Class A, Class C and Class I shares of Dreyfus Diversified |
| International Fund on 12/18/07 (inception date) to a $10,000 investment made in the Morgan Stanley Capital |
| International Europe,Australasia, Far East Index (the “Index”) on that date.All dividends and capital gain |
| distributions are reinvested. For comparative purposes, the value of the Index on 12/31/07 is used as the beginning |
| value on 12/18/07. |
| The fund’s performance shown in the line graph takes into account the maximum initial sales charge on Class A shares |
| and all other applicable fees and expenses on all classes.The Index is an unmanaged index composed of a sample of |
| companies representative of the market structure of European and Pacific Basin countries. Unlike a mutual fund, the |
| Index is not subject to charges, fees and other expenses. Investors cannot invest directly in any index. Further information |
| relating to fund performance, including expense reimbursements, if applicable, is contained in the Financial Highlights |
| section of the prospectus and elsewhere in this report. |
6
| Average Annual Total Returns as of 10/31/10 | |||
| Inception | From | ||
| Date | 1 Year | Inception | |
| Class A shares | |||
| with maximum sales charge (5.75%) | 12/18/07 | 3.81% | –6.99% |
| without sales charge | 12/18/07 | 10.18% | –5.06% |
| Class C shares | |||
| with applicable redemption charge † | 12/18/07 | 8.21% | –5.84% |
| without redemption | 12/18/07 | 9.21% | –5.84% |
| Class I shares | 12/18/07 | 10.34% | –4.90% |
| Morgan Stanley Capital International Europe, | |||
| Australasia, Far East Free Index†† | 12/31/07 | 8.36% | –8.34% |
| Past performance is not predictive of future performance.The fund’s performance shown in the graph and table does not | |
| reflect the deduction of taxes that a shareholder would pay on fund distributions or the redemption of fund shares. | |
| † | The maximum contingent deferred sales charge for Class C shares is 1% for shares redeemed within one year of the |
| date of purchase. | |
| †† | For comparative purposes, the value of the Index as of 12/31/07 is used as the beginning value on 12/18/07. |
TheFund 7
UNDERSTANDING YOUR FUND’S EXPENSES (Unaudited)
As a mutual fund investor, you pay ongoing expenses, such as management fees and other expenses. Using the information below, you can estimate how these expenses affect your investment and compare them with the expenses of other funds.You also may pay one-time transaction expenses, including sales charges (loads) and redemption fees, which are not shown in this section and would have resulted in higher total expenses. For more information, see your fund’s prospectus or talk to your financial adviser.
Review your fund’s expenses
The table below shows the expenses you would have paid on a $1,000 investment in Dreyfus Diversified International Fund from May 1, 2010 to October 31, 2010. It also shows how much a $1,000 investment would be worth at the close of the period, assuming actual returns and expenses.
| Expenses and Value of a $1,000 Investment | |||
| assuming actual returns for the six months ended October 31, 2010 | |||
| Class A | Class C | Class I | |
| Expenses paid per $1,000† | $ 1.55 | $ 5.62 | $ 0.16 |
| Ending value (after expenses) | $1,050.70 | $1,044.50 | $1,050.60 |
| COMPARING YOUR FUND’S EXPENSES |
| WITH THOSE OF OTHER FUNDS (Unaudited) |
Using the SEC’s method to compare expenses
The Securities and Exchange Commission (SEC) has established guidelines to help investors assess fund expenses. Per these guidelines, the table below shows your fund’s expenses based on a $1,000 investment, assuming a hypothetical 5% annualized return. You can use this information to compare the ongoing expenses (but not transaction expenses or total cost) of investing in the fund with those of other funds.All mutual fund shareholder reports will provide this information to help you make this comparison. Please note that you cannot use this information to estimate your actual ending account balance and expenses paid during the period.
| Expenses and Value of a $1,000 Investment | |||
| assuming a hypothetical 5% annualized return for the six months ended October 31, 2010 | |||
| Class A | Class C | Class I | |
| Expenses paid per $1,000† | $ 1.53 | $ 5.55 | $ 0.15 |
| Ending value (after expenses) | $1,023.69 | $1,019.71 | $1,025.05 |
† Expenses are equal to the fund’s annualized expense ratio of .30% for Class A, 1.09% for Class C and .03% for Class I, multiplied by the average account value over the period, multiplied by 184/365 (to reflect the one-half year period).
8
| STATEMENT OF INVESTMENTS |
| October 31, 2010 |
| Registered Investment Companies—99.9% | Shares | Value ($) | |
| Dreyfus Emerging Asia Fund, Cl. I | 734,119 | a,b | 9,514,187 |
| Dreyfus Emerging Markets Fund, Cl. I | 2,228,922 | b | 28,886,826 |
| Dreyfus International Equity Fund, Cl. I | 2,955,096 | b | 81,590,207 |
| Dreyfus International Value Fund, Cl. I | 7,251,544 | b | 84,625,520 |
| Dreyfus/Newton International Equity Fund, Cl. I | 4,043,841 | b | 70,565,026 |
| International Stock Fund, Cl. I | 6,382,507 | b | 84,312,923 |
| Total Investments (cost $309,818,721) | 99.9% | 359,494,689 | |
| Cash and Receivables (Net) | .1% | 406,145 | |
| Net Assets | 100.0% | 359,900,834 | |
| a | Non-income producing security. |
| b | Investment in affiliated mutual fund. |
| Portfolio Summary (Unaudited)† | |
| Value (%) | |
| Mutual Funds: International Equity | 99.9 |
| † Based on net assets. |
| See notes to financial statements. |
TheFund 9
| STATEMENT OF ASSETS AND LIABILITIES |
| October 31, 2010 |
| Cost | Value | ||
| Assets ($): | |||
| Investments in affiliated issuers— | |||
| See Statement of Investments—Note 1(c) | 309,818,721 | 359,494,689 | |
| Cash | 610,296 | ||
| Prepaid expenses | 9,602 | ||
| 360,114,587 | |||
| Liabilities ($): | |||
| Due to The Dreyfus Corporation and affiliates—Note 3(c) | 5,281 | ||
| Payable for shares of Common Stock redeemed | 122,696 | ||
| Accrued expenses | 85,776 | ||
| 213,753 | |||
| Net Assets ($) | 359,900,834 | ||
| Composition of Net Assets ($): | |||
| Paid-in capital | 312,185,351 | ||
| Accumulated undistributed investment income—net | 1,620 | ||
| Accumulated net realized gain (loss) on investments | (1,962,105) | ||
| Accumulated net unrealized appreciation | |||
| (depreciation) on investments | 49,675,968 | ||
| Net Assets ($) | 359,900,834 | ||
| Net Asset Value Per Share | |||
| Class A | Class C | Class I | |
| Net Assets ($) | 7,700,756 | 68,770 | 352,131,308 |
| Shares Outstanding | 757,977 | 6,809 | 34,580,309 |
| Net Asset Value Per Share ($) | 10.16 | 10.10 | 10.18 |
| See notes to financial statements. | |||
10
| STATEMENT OF OPERATIONS |
| Year Ended October 31, 2010 |
| Investment Income ($): | |
| Income: | |
| Cash dividends from affiliated issuers | 3,087,411 |
| Expenses: | |
| Registration fees | 47,647 |
| Audit fees | 36,772 |
| Shareholder servicing costs—Note 3(c) | 25,386 |
| Directors’ fees and expenses—Note 3(d) | 9,250 |
| Loan commitment fees—Note 2 | 3,830 |
| Custodian fees—Note 3(c) | 2,836 |
| Prospectus and shareholders’ reports | 2,386 |
| Legal fees | 1,100 |
| Distribution fees—Note 3(b) | 543 |
| Interest expense—Note 2 | 45 |
| Miscellaneous | 16,977 |
| Total Expenses | 146,772 |
| Less—reduction in expenses fee due to undertaking—Note 3(a) | (20,172) |
| Less—reduction in fees due to earnings credits—Note 3(c) | (20) |
| Net Expenses | 126,580 |
| Investment Income—Net | 2,960,831 |
| Realized and Unrealized Gain (Loss) on Investments—Note 4 ($): | |
| Net realized gain (loss) on investments in affiliated issuers | (1,644,695) |
| Net unrealized appreciation (depreciation) on investments in affiliated issuers | 28,289,798 |
| Net Realized and Unrealized Gain (Loss) on Investments | 26,645,103 |
| Net Increase in Net Assets Resulting from Operations | 29,605,934 |
| See notes to financial statements. | |
TheFund 11
STATEMENT OF CHANGES IN NET ASSETS
| Year Ended October 31, | ||
| 2010 | 2009a | |
| Operations ($): | ||
| Investment income—net | 2,960,831 | 154,048 |
| Net realized gain (loss) on | ||
| investments in affiliated issuers | (1,644,695) | 2,358,144 |
| Net unrealized appreciation (depreciation) | ||
| on investments in affiliated issuers | 28,289,798 | 22,231,206 |
| Net Increase (Decrease) in Net Assets | ||
| Resulting from Operations | 29,605,934 | 24,743,398 |
| Dividends to Shareholders from ($): | ||
| Investment income—net: | ||
| Class A Shares | (72,453) | (61,678) |
| Class C Shares | (131) | (1,416) |
| Class I Shares | (2,978,422) | (1,060) |
| Class T Shares | — | (846) |
| Net realized gain on investments: | ||
| Class A Shares | (68,683) | — |
| Class C Shares | (729) | — |
| Class I Shares | (2,489,492) | — |
| Total Dividends | (5,609,910) | (65,000) |
| Capital Stock Transactions ($): | ||
| Net proceeds from shares sold: | ||
| Class A Shares | 4,769,147 | 2,874,267 |
| Class C Shares | 47,254 | 27,700 |
| Class I Shares | 198,182,248 | 145,448,054 |
| Dividends reinvested: | ||
| Class A Shares | 140,848 | 60,263 |
| Class C Shares | 860 | 624 |
| Class I Shares | 1,815,986 | — |
| Cost of shares redeemed: | ||
| Class A Shares | (2,224,129) | (761,609) |
| Class C Shares | (68,338) | (41) |
| Class I Shares | (35,031,521) | (5,773,572) |
| Class T Shares | — | (27,600) |
| Increase (Decrease) in Net Assets | ||
| from Capital Stock Transactions | 167,632,355 | 141,848,086 |
| Total Increase (Decrease) in Net Assets | 191,628,379 | 166,526,484 |
| Net Assets ($): | ||
| Beginning of Period | 168,272,455 | 1,745,971 |
| End of Period | 359,900,834 | 168,272,455 |
| Undistributed investment income—net | 1,620 | 92,809 |
12
| Year Ended October 31, | ||
| 2010 | 2009a | |
| Capital Share Transactions: | ||
| Class Ab | ||
| Shares sold | 496,078 | 355,715 |
| Shares issued for dividends reinvested | 14,566 | 8,144 |
| Shares redeemed | (237,236) | (96,143) |
| Net Increase (Decrease) in Shares Outstanding | 273,408 | 267,716 |
| Class C | ||
| Shares sold | 4,907 | 3,702 |
| Shares issued for dividends reinvested | 89 | 85 |
| Shares redeemed | (7,123) | (3) |
| Net Increase (Decrease) in Shares Outstanding | (2,127) | 3,784 |
| Class I | ||
| Shares sold | 20,789,401 | 17,954,860 |
| Shares issued for dividends reinvested | 187,602 | — |
| Shares redeemed | (3,671,030) | (684,524) |
| Net Increase (Decrease) in Shares Outstanding | 17,305,973 | 17,270,336 |
| Class Tb | ||
| Shares redeemed | — | (4,000) |
| a | Effective as of the close of business on February 4, 2009, the fund no longer offers Class T shares. |
| b | On the close of business on February 4, 2009, 4,000 Class T shares representing $27,600 were converted to 4,012 |
| Class A shares. | |
| See notes to financial statements. | |
TheFund 13
FINANCIAL HIGHLIGHTS
The following tables describe the performance for each share class for the fiscal periods indicated.All information (except portfolio turnover rate) reflects financial results for a single fund share.Total return shows how much your investment in the fund would have increased (or decreased) during each period, assuming you had reinvested all dividends and distributions.These figures have been derived from the fund’s financial statements.
| Year Ended October 31, | |||
| Class A Shares | 2010 | 2009 | 2008a |
| Per Share Data ($): | |||
| Net asset value, beginning of period | 9.45 | 7.59 | 12.50 |
| Investment Operations: | |||
| Investment income (loss)—netb | .09 | .16 | (.01) |
| Net realized and unrealized | |||
| gain (loss) on investments | .86 | 1.96 | (4.90) |
| Total from Investment Operations | .95 | 2.12 | (4.91) |
| Distributions: | |||
| Dividends from investment income—net | (.12) | (.26) | — |
| Dividends from net realized gain on investments | (.12) | — | — |
| Total Distributions | (.24) | (.26) | — |
| Net asset value, end of period | 10.16 | 9.45 | 7.59 |
| Total Return (%)c | 10.18 | 28.80 | (39.28)d |
| Ratios/Supplemental Data (%): | |||
| Ratio of total expenses to average net assetse | .40 | 1.89 | 14.57f |
| Ratio of net expenses to average net assetse | .30 | .37 | .31f |
| Ratio of net investment income | |||
| (loss) to average net assetse | .92 | 2.01 | (.13)f |
| Portfolio Turnover Rate | 20.78 | 36.68 | 25.65d |
| Net Assets, end of period ($ x 1,000) | 7,701 | 4,578 | 1,646 |
| a | From December 18, 2007 (commencement of operations) to October 31, 2008. |
| b | Based on average shares outstanding at each month end. |
| c | Exclusive of sales charge. |
| d | Not annualized. |
| e | Amounts do not include the activity of the underlying funds. |
| f | Annualized. |
| See notes to financial statements. | |
14
| Year Ended October 31, | |||
| Class C Shares | 2010 | 2009 | 2008a |
| Per Share Data ($): | |||
| Net asset value, beginning of period | 9.38 | 7.54 | 12.50 |
| Investment Operations: | |||
| Investment income (loss)—netb | .08 | .14 | (.05) |
| Net realized and unrealized | |||
| gain (loss) on investments | .78 | 1.90 | (4.91) |
| Total from Investment Operations | .86 | 2.04 | (4.96) |
| Distributions: | |||
| Dividends from investment income—net | (.02) | (.20) | — |
| Dividends from net realized gain on investments | (.12) | — | — |
| Total Distributions | (.14) | (.20) | — |
| Net asset value, end of period | 10.10 | 9.38 | 7.54 |
| Total Return (%)c | 9.21 | 27.73 | (39.68)d |
| Ratios/Supplemental Data (%): | |||
| Ratio of total expenses to average net assetse | 1.63 | 3.33 | 15.79f |
| Ratio of net expenses to average net assetse | 1.07 | 1.12 | 1.06f |
| Ratio of net investment income | |||
| (loss) to average net assetse | .85 | 1.76 | (.51)f |
| Portfolio Turnover Rate | 20.78 | 36.68 | 25.65d |
| Net Assets, end of period ($ x 1,000) | 69 | 84 | 39 |
| a | From December 18, 2007 (commencement of operations) to October 31, 2008. |
| b | Based on average shares outstanding at each month end. |
| c | Exclusive of sales charge. |
| d | Not annualized. |
| e | Amounts do not include the activity of the underlying funds. |
| f | Annualized. |
| See notes to financial statements. | |
TheFund 15
FINANCIAL HIGHLIGHTS (continued)
| Year Ended October 31, | |||
| Class I Shares | 2010 | 2009 | 2008a |
| Per Share Data ($): | |||
| Net asset value, beginning of period | 9.47 | 7.61 | 12.50 |
| Investment Operations: | |||
| Investment income—netb | .11 | .01 | .05 |
| Net realized and unrealized | |||
| gain (loss) on investments | .86 | 2.12 | (4.94) |
| Total from Investment Operations | .97 | 2.13 | (4.89) |
| Distributions: | |||
| Dividends from investment income—net | (.14) | (.27) | — |
| Dividends from net realized gain on investments | (.12) | — | — |
| Total Distributions | (.26) | (.27) | — |
| Net asset value, end of period | 10.18 | 9.47 | 7.61 |
| Total Return (%) | 10.34 | 28.89 | (39.12)c |
| Ratios/Supplemental Data (%): | |||
| Ratio of total expenses to average net assetsd | .05 | .24 | 14.86e |
| Ratio of net expenses to average net assetsd | .04 | .08 | .06e |
| Ratio of net investment income | |||
| to average net assetsd | 1.10 | .16 | .54e |
| Portfolio Turnover Rate | 20.78 | 36.68 | 25.65c |
| Net Assets, end of period ($ x 1,000) | 352,131 | 163,611 | 30 |
| a | From December 18, 2007 (commencement of operations) to October 31, 2008. |
| b | Based on average shares outstanding at each month end. |
| c | Not annualized. |
| d | Amounts do not include the activity of the underlying funds. |
| e | Annualized. |
| See notes to financial statements. | |
16
NOTES TO FINANCIAL STATEMENTS
NOTE 1—Significant Accounting Policies:
Dreyfus Diversified International Fund (the “fund”) is a separate diversified series of Dreyfus Premier Investment Funds, Inc. (the “Company”), which is registered under the Investment Company Act of 1940, as amended (the “Act”), as an open-end management investment company and operates as a series company currently offering ten series, including the fund. The fund’s investment objective is to seek long-term capital appreciation.The Dreyfus Corporation (the “Manager” or “Dreyfus”), a wholly-owned subsidiary ofThe Bank of NewYork Mellon Corporation (“BNY Mellon”), serves as the fund’s investment adviser.
MBSC Securities Corporation (the “Distributor”), a wholly-owned subsidiary of the Manager, is the distributor of the fund’s shares.The fund is authorized to issue 400 million shares of $.001 par value Common Stock. The fund currently offers three classes of shares: Class A (200 million shares authorized), Class C (100 million shares authorized) and Class I (100 million shares authorized). Class A shares are subject to a sales charge imposed at the time of purchase. Class C shares are subject to a contingent deferred sales charge (“CDSC”) imposed on Class C shares redeemed within one year of purchase. Class I shares are sold at net asset value per share only to institutional investors. Other differences between the classes include the services offered to and the expenses borne by each class, the allocation of certain transfer agency costs and certain voting rights. Income, expenses (other t han expenses attributable to a specific class), and realized and unrealized gains or losses on investments are allocated to each class of shares based on its relative net assets.
The Company accounts separately for the assets, liabilities and operations of each series. Expenses directly attributable to each series are charged to that series’ operations; expenses which are applicable to all series are allocated among them on a pro rata basis.
TheFund 17
NOTES TO FINANCIAL STATEMENTS (continued)
The Financial Accounting Standards Board (“FASB”) Accounting Standards Codification (“ASC”) is the exclusive reference of authoritative U.S. generally accepted accounting principles (“GAAP”) recognized by the FASB to be applied by nongovernmental entities. Rules and interpretive releases of the Securities and Exchange Commission (“SEC”) under authority of federal laws are also sources of authoritative GAAP for SEC registrants. The fund’s financial statements are prepared in accordance with GAAP, which may require the use of management estimates and assumptions.Actual results could differ from those estimates.
The Company enters into contracts that contain a variety of indemnifications.The fund’s maximum exposure under these arrangements is unknown.The fund does not anticipate recognizing any loss related to these arrangements.
(a) Portfolio valuation: Investments are valued at the net asset value of each underlying fund determined as of the close of the New York Stock Exchange (generally 4 p.m., Eastern time) on the valuation date.
The fair value of a financial instrument is the amount that would be received to sell an asset or paid to transfer a liability in an orderly transaction between market participants at the measurement date (i.e. the exit price). GAAP establishes a fair value hierarchy that prioritizes the inputs of valuation techniques used to measure fair value.This hierarchy gives the highest priority to unadjusted quoted prices in active markets for identical assets or liabilities (Level 1 measurements) and the lowest priority to unobservable inputs (Level 3 measurements).
Additionally, GAAP provides guidance on determining whether the volume and activity in a market has decreased significantly and whether such a decrease in activity results in transactions that are not orderly. GAAP requires enhanced disclosures around valuation inputs and techniques used during annual and interim periods.
18
Various inputs are used in determining the value of the fund’s investments relating to fair value measurements.These inputs are summarized in the three broad levels listed below:
Level 1—unadjusted quoted prices in active markets for identical investments.
Level 2—other significant observable inputs (including quoted prices for similar investments, interest rates, prepayment speeds, credit risk, etc.).
Level 3—significant unobservable inputs (including the fund’s own assumptions in determining the fair value of investments).
The inputs or methodology used for valuing securities are not necessarily an indication of the risk associated with investing in those securities.
The following is a summary of the inputs used as of October 31, 2010 in valuing the fund’s investments:
| Level 2—Other | Level 3— | |||
| Level 1— | Significant | Significant | ||
| Unadjusted | Observable | Unobservable | ||
| Quoted Prices | Inputs | Inputs | Total | |
| Assets ($) | ||||
| Investments in Securities: | ||||
| Mutual Funds | 359,494,689 | — | — | 359,494,689 |
In January 2010, FASB issued Accounting Standards Update (“ASU”) No. 2010-06 “Improving Disclosures about FairValue Measurements”. The portions of ASU No. 2010-06 which require reporting entities to prepare new disclosures surrounding amounts and reasons for significant transfers in and out of Level 1 and Level 2 fair value measurements as well as inputs and valuation techniques used to measure fair value for both recurring and nonrecurring fair value measurements that fall in either Level 2 or Level 3 have been adopted by the fund. No significant transfers between Level 1 or Level 2 fair value measurements occurred
TheFund 19
NOTES TO FINANCIAL STATEMENTS (continued)
at October 31, 2010. The remaining portion of ASU No. 2010-06 requires reporting entities to make new disclosures about information on purchases, sales, issuances and settlements on a gross basis in the reconciliation of activity in Level 3 fair value measurements. These new and revised disclosures are required to be implemented for fiscal years beginning after December 15, 2010. Management is currently evaluating the impact that the adoption of this remaining portion of ASU No. 2010-06 may have on the fund’s financial statement disclosures.
(b) Securities transactions and investment income: Securities transactions are recorded on a trade date basis. Realized gains and losses from securities transactions are recorded on the identified cost basis. Dividend income is recognized on the ex-dividend date and interest income, including, where applicable, accretion of discount and amortization of premium on investments, is recognized on the accrual basis.
(c) Affiliated issuers: Investments in other investment companies advised by Dreyfus are defined as “affiliated” in the Act.
The fund may invest in shares of certain affiliated investment companies also advised or managed by Dreyfus. Investments in affiliated investment companies for the period ended October 31, 2010 were as follows:
| Affiliated | ||||
| Investment | Value | Dividends/ | ||
| Company | 10/31/2009 ($) | Purchases ($) | Sales ($) | Distributions ($) |
| Dreyfus Emerging | ||||
| Asia Fund, Cl. I | — | 8,696,959 | 111,862 | — |
| Dreyfus Emerging | ||||
| Markets Fund, Cl. I | — | 26,918,703 | 567,089 | 122,194 |
| Dreyfus International | ||||
| Equity Fund, Cl. I | 33,169,041 | 58,280,250 | 14,358,540 | 1,269,677 |
| Dreyfus International | ||||
| Value Fund, Cl. I | 42,402,666 | 44,226,169 | 5,623,813 | 883,176 |
| Dreyfus/Newton | ||||
| International | ||||
| Equity Fund, Cl. I | 39,853,498 | 35,946,647 | 11,306,042 | 311,270 |
| Emerging Markets | ||||
| Opportunity | ||||
| Fund, Cl. I | 16,793,477 | 4,198,820 | 21,477,610 | 108,865 |
| International | ||||
| Stock Fund, Cl. I | 32,760,767 | 44,864,265 | 1,816,720 | 392,229 |
| Total | 164,979,449 | 223,131,813 | 55,261,676 | 3,087,411 |
20
| Affiliated | Net Unrealized | |||
| Investment | Net Realized | Appreciation | Value | Net |
| Company | Gain (Loss) ($) | (Depreciation) ($) | 10/31/2010 ($) | Assets (%) |
| Dreyfus Emerging | ||||
| Asia Fund, Cl. I | (7,710) | 936,800 | 9,514,187 | 2.7 |
| Dreyfus Emerging | ||||
| Markets Fund, Cl. I | (14,236) | 2,549,448 | 28,886,826 | 8.0 |
| Dreyfus International | ||||
| Equity Fund, Cl. I | (2,118,686) | 6,618,142 | 81,590,207 | 22.7 |
| Dreyfus International | ||||
| Value Fund, Cl. I | (250,490) | 3,870,988 | 84,625,520 | 23.5 |
| Dreyfus/Newton | ||||
| International Equity | ||||
| Fund, Cl. I | (50,986) | 6,121,909 | 70,565,026 | 19.6 |
| Emerging Markets | ||||
| Opportunity | ||||
| Fund, Cl. I | 836,612 | (351,299) | — | — |
| International | ||||
| Stock Fund, Cl. I | (39,199) | 8,543,810 | 84,312,923 | 23.4 |
| Total | (1,644,695) | 28,289,798 | 359,494,689 | 99.9 |
(d) Dividends to shareholders: Dividends are recorded on the ex-dividend date. Dividends from investment income-net and dividends from net realized capital, if any, gains are normally declared and paid annually, but the fund may make distributions on a more frequent basis to comply with the distribution requirements of the Internal Revenue Code of 1986, as amended (the “Code”).To the extent that net realized capital gains can be offset by capital loss carryovers, it is the policy of the fund not to distribute such gains. Income and capital gain distributions are determined in accordance with income tax regulations, which may differ from GAAP.
(e) Federal income taxes: It is the policy of the fund to continue to qualify as a regulated investment company, if such qualification is in the best interests of its shareholders, by complying with the applicable provisions of the Code, and to make distributions of taxable income sufficient to relieve it from substantially all federal income and excise taxes.
As of and during the period ended October 31, 2010, the fund did not have any liabilities for any uncertain tax positions.The fund recognizes interest and penalties, if any, related to uncertain tax positions as
TheFund 21
NOTES TO FINANCIAL STATEMENTS (continued)
income tax expense in the Statement of Operations. During the period, the fund did not incur any interest or penalties.
Each of the tax years in the three-year period ended October 31, 2010 remains subject to examination by the Internal Revenue Service and state taxing authorities.
At October 31, 2010, the components of accumulated earnings on a tax basis were as follows: undistributed ordinary income $1,620, accumulated capital losses $415,833 and unrealized appreciation $48,129,696.
The accumulated capital loss carryover is available for federal income tax purposes to be applied against future net securities profits, if any, realized subsequent to October 31, 2010. If not applied, the carryover expires in fiscal 2018.
The tax character of distributions paid to shareholders during the fiscal periods ended October 31, 2010 and October 31, 2009, was as follows: ordinary income $5,609,910 and $65,000, respectively.
During the period ended October 31, 2010, as a result of permanent book to tax differences, primarily due to the tax treatment for dividend reclassification, the fund decreased accumulated undistributed investment income-net by $1,014 and increased accumulated net realized gain (loss) on investments by the same amount. Net assets and net asset value per share were not affected by this reclassification.
NOTE 2—Bank Lines of Credit:
The fund participates with other Dreyfus-managed funds in a $225 million unsecured credit facility led by Citibank, N.A. and a $300 million unsecured credit facility provided by The Bank of NewYork Mellon, a subsidiary of BNY Mellon and an affiliate of Dreyfus (each, a “Facility”), each to be utilized primarily for temporary or emergency purposes, including the financing of redemptions. In connection therewith, the fund has agreed to pay its pro rata portion of commitment fees for each Facility. Interest is charged to the fund based on rates determined pursuant to the terms of the respective Facility at the time of borrowing.
22
The average amount of borrowings outstanding under the Facilities during the period ended October 31, 2010, was approximately $3,000 with a related weighted average annualized interest rate of 1.49%.
NOTE 3—Management Fee and Other Transactions with Affiliates:
(a) Pursuant to a management agreement with the Manager, there is no management fee paid to the Manager. The fund invests in other mutual funds advised by the Manager. All fees and expenses of the underlying funds are reflected in the underlying funds’ net asset value.
The Manager has contractually agreed, until March 1, 2012, to assume the expenses of the fund so that the total annual fund and underlying funds operating expenses of none of the classes (excluding Rule 12b-1 fees, shareholder services fees, taxes, interest, brokerage commissions, commitment fees on borrowings and extraordinary expenses) exceed 1.20% of the value of the fund’s average daily net assets.The reduction in expenses, pursuant to the undertaking, amounted to $20,172 during the period ended October 31, 2010.
During the period ended October 31, 2010, the Distributor retained $967 from commissions earned on sales of the fund’s Class A shares.
(b) Under the Distribution Plan (the “Plan”) adopted pursuant to Rule 12b-1 under the Act, Class C shares pay the Distributor for distributing its shares at an annual rate of .75% of the value of the average daily net assets of Class C shares. During the period ended October 31, 2010, Class C shares were charged $543 pursuant to the Plan.
(c) Under the Shareholder Services Plan, Class A and Class C shares pay the Distributor at an annual rate of .25% of the value of their average daily net assets for the provision of certain services.The services provided may include personal services relating to shareholder accounts, such as answering shareholder inquiries regarding the fund and providing reports and other information, and services related to the maintenance of shareholder accounts.The Distributor may make payments to Service
TheFund 23
NOTES TO FINANCIAL STATEMENTS (continued)
Agents (a securities dealer, financial institution or other industry professional) in respect of these services. The Distributor determines the amounts to be paid to Service Agents. During the period ended October 31, 2010, Class A and Class C shares were charged $16,681 and $181, respectively, pursuant to the Shareholder Services Plan.
The fund compensates Dreyfus Transfer, Inc., a wholly-owned subsidiary of the Manager, under a transfer agency agreement for providing personnel and facilities to perform transfer agency services for the fund. During the period ended October 31, 2010, the fund was charged $2,790 pursuant to the transfer agency agreement, which is included in Shareholder servicing costs in the Statement of Operations.
The fund has arrangements with the custodian and cash management bank whereby the fund may receive earnings credits when positive cash balances are maintained, which are used to offset custody and cash management fees. For financial reporting purposes, the fund includes net earnings credits as an expense offset in the Statement of Operations.
The fund compensates The Bank of New York Mellon under a cash management agreement for performing cash management services related to fund subscriptions and redemptions. During the period ended October 31, 2010, the fund was charged $330 pursuant to the cash management agreement, which is included in Shareholder servicing costs in the Statement of Operations.These fees were partially offset by earnings credits of $20.
The fund also compensates The Bank of New York Mellon under a custody agreement for providing custodial services for the fund. During the period ended October 31, 2010, the fund was charged $2,836 pursuant to the custody agreement.
During the period ended October 31, 2010, the fund was charged $6,114 for services performed by the Chief Compliance Officer.
24
The components of “Due to The Dreyfus Corporation and affiliates” in the Statement of Assets and Liabilities consist of: Rule 12b-1 distribution plan fees $46, shareholder services plan fees $1,642, custodian fees $999, chief compliance officer fees $2,248 and transfer agency per account fees $346.
(d) Each Board member also serves as a Board member of other funds within the Dreyfus complex. Annual retainer fees and attendance fees are allocated to each fund based on net assets.
(e) A 2% redemption fee is charged and retained by the fund on certain shares redeemed within sixty days following the date of issuance, subject to exceptions, including redemptions made through the use of the fund’s exchange privilege. During the period ended October 31, 2010, there were no redemption fees charged and retained by the fund.
NOTE 4—Securities Transactions:
The aggregate amount of purchases and sales of investment securities, excluding short-term securities, during the period ended October 31, 2010, amounted to $223,131,813 and $55,261,676, respectively.
The provisions of ASC Topic 815 “Derivatives and Hedging” require qualitative disclosures about objectives and strategies for using derivatives, quantitative disclosures about fair value amounts of gains and losses on derivative instruments and disclosures about credit-risk related contingent features in derivative agreements.The fund held no derivatives during the period ended October 31, 2010.
At October 31, 2010, the cost of investments for federal income tax purposes was $311,364,993; accordingly, accumulated net unrealized appreciation on investments was $48,129,696, consisting of gross unrealized appreciation.
TheFund 25
| REPORT OF INDEPENDENT REGISTERED |
| PUBLIC ACCOUNTING FIRM |
Shareholders and Board of Directors Dreyfus Diversified International Fund
We have audited the accompanying statement of assets and liabilities, including the statement of investments, of Dreyfus Diversified International Fund (one of the series comprising Dreyfus Premier Investment Funds, Inc.) as of October 31, 2010, and the related statement of operations for the year then ended, the statement of changes in net assets for each of the two years in the period then ended and financial highlights for each of the periods indicated therein. These financial statements and financial highlights are the responsibility of the Fund’s management. Our responsibility is to express an opinion on these financial statements and financial highlights based on our audits.
We conducted our audits in accordance with the standards of the Public Company Accounting Oversight Board (United States).Those standards require that we plan and perform the audit to obtain reasonable assurance about whether the financial statements and financial highlights are free of material misstatement.We were not engaged to perform an audit of the Fund’s internal control over financial reporting. Our audits included consideration of internal control over financial reporting as a basis for designing audit procedures that are appropriate in the circumstances, but not for the purpose of expressing an opinion on the effectiveness of the Fund’s internal control over financial reporting. Accordingly, we express no such opinion.An audit also includes examining, on a test basis, evidence supporting the amounts and disclosures in the financial statements and financial highlights, assessing the accounting p rinciples used and significant estimates made by management, and evaluating the overall financial statement presentation. Our procedures included confirmation of securities owned as of October 31, 2010 by correspondence with the custodian and others. We believe that our audits provide a reasonable basis for our opinion.
In our opinion, the financial statements and financial highlights referred to above present fairly, in all material respects, the financial position of Dreyfus Diversified International Fund at October 31, 2010, the results of its operations for the year then ended, the changes in its net assets for each of the two years in the period then ended and the financial highlights for each of the indicated periods, in conformity with U. S. generally accepted accounting principles.

New York, New York
December 28, 2010
26
IMPORTANT TAX INFORMATION (Unaudited)
In accordance with federal tax law, the fund hereby designates 56.55% of the ordinary dividends paid during the fiscal year ended October 31, 2010 as qualifying for the corporate dividends received deduction. For the fiscal year ended October 31, 2010, certain dividends paid by the fund may be subject to a maximum tax rate of 15%, as provided for by the Jobs and Growth Tax Relief Reconciliation Act of 2003. Of the distributions paid during the fiscal year, $3,113,577 represents the maximum amount that may be considered qualified dividend income. Shareholders will receive notification in early 2011 of the percentage applicable to the preparation of their 2010 income tax returns.Also, the fund hereby designates $.1166 per share as a short-term capital gain distribution paid on December 31, 2009.
TheFund 27
| INFORMATION ABOUT THE REVIEW AND APPROVAL |
| OF THE FUND’S MANAGEMENT AGREEMENT (UNAUDITED) |
At a meeting of the fund’s Board held on July 13, 2010, the Board considered the re-approval of the fund’s Management Agreement with Dreyfus for a one-year term ending July 31, 2011. The Board members, none of whom are “interested persons” (as defined in the Investment Company Act of 1940, as amended) of the fund, were assisted in their review by independent legal counsel and met with counsel in executive session separate from representatives of Dreyfus. In considering the re-approval of the Management Agreement, the Board considered all factors that it believed to be relevant, including, among other things, the factors discussed below.
Analysis of Nature, Extent and Quality of Services Provided to the Fund.The Board members received a presentation from representatives of Dreyfus regarding services provided to the fund and other funds in the Dreyfus fund complex, and discussed the nature, extent and quality of the services provided to the fund pursuant to its Management Agreement. Dreyfus’ representatives reviewed the fund’s distribution of accounts and the relationships Dreyfus has with various intermediaries and the different needs of each. Dreyfus’ representatives noted the various distribution channels for the fund as well as the diverse methods of distribution among other funds in the Dreyfus fund complex, and Dreyfus’ corresponding need for broad, deep, and diverse resources to be able to provide ongoing shareholder services to each distrib ution channel, including those of the fund. Dreyfus also provided the number of accounts investing in the fund, as well as the fund’s asset size.
The Board members also considered Dreyfus’ research and portfolio management capabilities and Dreyfus’ oversight of day-to-day fund operations, including fund accounting, administration and assistance in meeting legal and regulatory requirements. The Board members also considered Dreyfus’ extensive administrative, accounting and compliance infrastructure.
28
Comparative Analysis of the Fund’s Performance and Management Fee and Expense Ratio. The Board members reviewed the fund’s performance for the one- and two-year period ended May 31, 2010, and compared the fund’s performance to the performance of four other retail front-end load international multi-cap core funds that are passively managed affiliated funds of funds (the “Performance Group”) and to a larger universe of funds consisting of all retail and institutional international multi-cap core funds (the “Performance Universe”), selected and provided by Lipper, Inc., an independent provider of investment company data.The Board was provided with a description of the methodology Lipper used to select the Performance Group and Performance Universe, as well as the Expense Group and Expense Universe (dis cussed below).The Board members discussed the results of the comparisons and noted that the fund’s total return performance for the one-year period ended May 31, 2010 was below the Performance Group and Performance Universe medians and the fund’s total return performance for the two-year period ended May 31, 2010 was at the Performance Group median and above the Performance Universe median. Dreyfus also provided a comparison of the fund’s calendar year total returns to the returns of the fund’s benchmark index.
The Board members also discussed the fund’s management fee and expense ratio and reviewed the range of actual and contractual management fees and total expense ratios of four comparable funds (the “Expense Group”) and a broader group of funds (the “Expense Universe”), each selected and provided by Lipper.The Board members noted that, like three of the other funds in the Expense Group, the fund’s management fees are paid only at the underlying funds level and the fund’s total expense ratio was slightly higher than the Expense Group median, but lower than the Expense Universe median. In addi-
TheFund 29
| INFORMATION ABOUT THE REVIEW AND APPROVAL OF THE |
| FUND’S MANAGEMENT AGREEMENT (Unaudited) (continued) |
tion, the Board noted Dreyfus has contractually agreed, until March 1, 2011, to assume the expenses of the fund so that the total annual fund and underlying funds operating expenses of none of the classes (excluding Rule 12b-1 fees, shareholder services fees, taxes, interest, brokerage commissions, commitment fees on borrowings and extraordinary expenses) exceed 1.20% of the value of the fund’s average daily net assets.
Representatives of Dreyfus noted that Dreyfus or its affiliates do not manage other mutual funds or accounts with similar investment objectives, policies and strategies as the fund. It also was noted that there were no other accounts managed by Dreyfus or its affiliates with similar investment objectives, policies and strategies as the fund.
Analysis of Profitability and Economies of Scale. Dreyfus would not have direct profits from the fund’s management fee, since the fund would pay no direct management fee. Similarly, economies of scale were not relevant.The Board members considered potential benefits to Dreyfus from acting as investment adviser.
At the conclusion of these discussions, the Board agreed that it had been furnished with sufficient information to make an informed business decision with respect to re-approving the Management Agreement. Based on the discussions and considerations as described above, the Board made the following conclusions and determinations.
The Board concluded that the nature, extent and quality of the services provided by Dreyfus are adequate and appropriate.
The Board was generally satisfied with the fund’s relative performance.
Since the fund would not pay a direct management fee, profitability and economies of scale were not relevant.
30
The Board members considered these conclusions and determinations, along with information received on a routine and regular basis throughout the year, and, without any one factor being dispositive, the Board determined that re-approval of the Management Agreement through July 31, 2011 was in the best interests of the fund and its shareholders.
TheFund 31

OFFICERS OF THE FUND (Unaudited)
BRADLEY J. SKAPYAK, President since January 2010.
Chief Operating Officer and a director of the Manager since June 2009. From April 2003 to June 2009, Mr. Skapyak was the head of the Investment Accounting and Support Department of the Manager. He is an officer of 76 investment companies (comprised of 170 portfolios) managed by the Manager. He is 51 years old and has been an employee of the Manager since February 1988.
PHILLIP N. MAISANO, Executive Vice President since July 2007.
Chief Investment Officer,Vice Chair and a director of the Manager, and an officer of 76 investment companies (comprised of 170 portfolios) managed by the Manager. Mr. Maisano also is an officer and/or Board member of certain other investment management subsidiaries of The Bank of New York Mellon Corporation, each of which is an affiliate of the Manager. He is 63 years old and has been an employee of the Manager since November 2006. Prior to joining the Manager, Mr. Maisano served as Chairman and Chief Executive Officer of EACM Advisors, an affiliate of the Manager, since August 2004.
MICHAEL A. ROSENBERG, Vice President and Secretary since August 2005.
Assistant General Counsel of BNY Mellon, and an officer of 77 investment companies (comprised of 195 portfolios) managed by the Manager. He is 50 years old and has been an employee of the Manager since October 1991.
KIESHA ASTWOOD, Vice President and Assistant Secretary since January 2010.
Counsel of BNY Mellon, and an officer of 77 investment companies (comprised of 195 portfolios) managed by the Manager. She is 37 years old and has been an employee of the Manager since July 1995.
JAMES BITETTO, Vice President and Assistant Secretary since August 2005.
Senior Counsel of BNY Mellon and Secretary of the Manager, and an officer of 77 investment companies (comprised of 195 portfolios) managed by the Manager. He is 44 years old and has been an employee of the Manager since December 1996.
JONI LACKS CHARATAN, Vice President and Assistant Secretary since August 2005.
Senior Counsel of BNY Mellon, and an officer of 77 investment companies (comprised of 195 portfolios) managed by the Manager. She is 54 years old and has been an employee of the Manager since October 1988.
JOSEPH M. CHIOFFI, Vice President and Assistant Secretary since August 2005.
Senior Counsel of BNY Mellon, and an officer of 77 investment companies (comprised of 195 portfolios) managed by the Manager. He is 48 years old and has been an employee of the Manager since June 2000.
KATHLEEN DENICHOLAS, Vice President and Assistant Secretary since January 2010.
Senior Counsel of BNY Mellon, and an officer of 77 investment companies (comprised of 195 portfolios) managed by the Manager. She is 36 years old and has been an employee of the Manager since February 2001.
JANETTE E. FARRAGHER, Vice President and Assistant Secretary since August 2005.
Assistant General Counsel of BNY Mellon, and an officer of 77 investment companies (comprised of 195 portfolios) managed by the Manager. She is 47 years old and has been an employee of the Manager since February 1984.
34
JOHN B. HAMMALIAN, Vice President and Assistant Secretary since August 2005.
Managing Counsel of BNY Mellon, and an officer of 77 investment companies (comprised of 195 portfolios) managed by the Manager. He is 47 years old and has been an employee of the Manager since February 1991.
M. CRISTINA MEISER, Vice President and Assistant Secretary since January 2010.
Senior Counsel of BNY Mellon, and an officer of 77 investment companies (comprised of 195 portfolios) managed by the Manager. She is 40 years old and has been an employee of the Manager since August 2001.
ROBERT R. MULLERY, Vice President and Assistant Secretary since August 2005.
Managing Counsel of BNY Mellon, and an officer of 77 investment companies (comprised of 195 portfolios) managed by the Manager. He is 58 years old and has been an employee of the Manager since May 1986.
JEFF PRUSNOFSKY, Vice President and Assistant Secretary since August 2005.
Managing Counsel of BNY Mellon, and an officer of 77 investment companies (comprised of 195 portfolios) managed by the Manager. He is 45 years old and has been an employee of the Manager since October 1990.
JAMES WINDELS, Treasurer since November 2001.
Director – Mutual Fund Accounting of the Manager, and an officer of 77 investment companies (comprised of 195 portfolios) managed by the Manager. He is 52 years old and has been an employee of the Manager since April 1985.
RICHARD CASSARO, Assistant Treasurer since January 2008.
Senior Accounting Manager – Money Market and Municipal Bond Funds of the Manager, and an officer of 77 investment companies (comprised of 195 portfolios) managed by the Manager. He is 51 years old and has been an employee of the Manager since September 1982.
GAVIN C. REILLY, Assistant Treasurer since August 2005.
Tax Manager of the Investment Accounting and Support Department of the Manager, and an officer of 77 investment companies (comprised of 195 portfolios) managed by the Manager. He is 42 years old and has been an employee of the Manager since April 1991.
ROBERT ROBOL, Assistant Treasurer since August 2005.
Senior Accounting Manager – Fixed Income Funds of the Manager, and an officer of 77 investment companies (comprised of 195 portfolios) managed by the Manager. He is 46 years old and has been an employee of the Manager since October 1988.
ROBERT SALVIOLO, Assistant Treasurer since July 2007.
Senior Accounting Manager – Equity Funds of the Manager, and an officer of 77 investment companies (comprised of 195 portfolios) managed by the Manager. He is 43 years old and has been an employee of the Manager since June 1989.
TheFund 35
OFFICERS OF THE FUND (Unaudited) (continued)
ROBERT SVAGNA, Assistant Treasurer since August 2002.
Senior Accounting Manager – Equity Funds of the Manager, and an officer of 77 investment companies (comprised of 195 portfolios) managed by the Manager. He is 43 years old and has been an employee of the Manager since November 1990.
JOSEPH W. CONNOLLY, Chief Compliance Officer since October 2004.
Chief Compliance Officer of the Manager and The Dreyfus Family of Funds (77 investment companies, comprised of 195 portfolios). From November 2001 through March 2004, Mr. Connolly was first Vice-President, Mutual Fund Servicing for Mellon Global Securities Services. In that capacity, Mr. Connolly was responsible for managing Mellon’s Custody, Fund Accounting and Fund Administration services to third-party mutual fund clients. He is 53 years old and has served in various capacities with the Manager since 1980, including manager of the firm’s Fund Accounting Department from 1997 through October 2001.
NATALIA GRIBAS, Anti-Money Laundering Compliance Officer since July 2010.
Anti-Money Laundering Compliance Officer of the Distributor, and the Anti-Money Laundering Compliance Officer of 73 investment companies (comprised of 191 portfolios) managed by the Manager. She is 40 years old and has been an employee of the Distributor since September 2008.
36
Save time. Save paper. View your next shareholder report online as soon as it’s available. Log into www.dreyfus.com and sign up for Dreyfus eCommunications. It’s simple and only takes a few minutes.
The views expressed in this report reflect those of the portfolio manager only through the end of the period covered and do not necessarily represent the views of Dreyfus or any other person in the Dreyfus organization. Any such views are subject to change at any time based upon market or other conditions and Dreyfus disclaims any responsibility to update such views.These views may not be relied on as investment advice and, because investment decisions for a Dreyfus fund are based on numerous factors, may not be relied on as an indication of trading intent on behalf of any Dreyfus fund.
Not FDIC-Insured • Not Bank-Guaranteed • May Lose Value
Contents | |
THE FUND | |
| 2 | A Letter from the Chairman and CEO |
| 3 | Discussion of Fund Performance |
| 6 | Fund Performance |
| 8 | Understanding Your Fund’s Expenses |
| 8 | Comparing Your Fund’s Expenses With Those of Other Funds |
| 9 | Statement of Investments |
| 10 | Statement of Assets and Liabilities |
| 11 | Statement of Operations |
| 12 | Statement of Changes in Net Assets |
| 13 | Financial Highlights |
| 16 | Notes to Financial Statements |
| 25 | Report of Independent Registered Public Accounting Firm |
| 26 | Information About the Review and Approval of the Fund’s Management Agreement |
| 29 | Board Members Information |
| 31 | Officers of the Fund |
FOR MORE INFORMATION | |
Back Cover |
Dreyfus
Diversified Large Cap Fund
The Fund

A LETTER FROM THE CHAIRMAN AND CEO
Dear Shareholder:
We are pleased to present this annual report for Dreyfus Diversified Large Cap Fund, covering the 12-month period from November 1, 2009, through October 31, 2010.
Although a double-dip recession has recently become an increasingly unlikely scenario in our view, persistent uncertainty regarding the breadth and strength of the U.S. and global economic recoveries led to bouts of heightened volatility for U.S. stocks during most of 2010.The spending power of the U.S. consumer, long an important catalyst for economic growth, has been diminished by concerns over job security and an inability to generate cash from home equity.The second major driver of sustainable growth, corporate investment, has been stunted to a similar extent by tight credit conditions. However, the recent announcement of additional quantitative easing (QE2) measures by the Federal Reserve Board, as well as improved fundamentals across many developing nations, have helped support moderate global economic growth.
Uncertainty will probably remain in the broader financial markets until we see more evidence of robust economic growth, but we remain optimistic regarding the prospects for equities. Many stocks of quality companies with healthy balance sheets, higher credit ratings and strong cash flows appear to be currently priced at a discount.With that, we strongly suggest that you meet with your financial advisor to discuss the potential opportunities which may exist in the global markets, as well as to evaluate your portfolio to help meet your individual investment needs and your future goals relative to your risk-tolerance level.
For information about how the fund performed during the reporting period, as well as general market perspectives, we provide a Discussion of Fund Performance on the pages that follow.
Thank you for your continued confidence and support.

Jonathan R. Baum
Chairman and Chief Executive Officer
The Dreyfus Corporation
November 15, 2010
2

DISCUSSION OF FUND PERFORMANCE
For the period of November 1, 2009, through October 31, 2010, as provided by Richard B. Hoey, A. Paul Disdier, Christopher E. Sheldon, CFA, and Keith L. Stransky, CFA, Portfolio Managers
Market and Fund Performance Overview
For the 12-month period ended October 31, 2010, Dreyfus Diversified Large Cap Fund’s Class A shares produced a total return of 13.92%, Class C shares returned 13.07% and Class I shares returned 13.91%.1 In comparison, the total return of the Standard & Poor’s 500 Composite Stock Price Index (“S&P 500 Index”), the fund’s benchmark, was 16.54% for the same period.2
After rallying over the first half of the reporting period, U.S. stocks encountered heightened volatility over the second half due to intensifying global and domestic economic concerns. The fund produced returns that were lower than its benchmark, due mainly to the fund’s focus on companies at the higher end of the large-cap range during a time when smaller companies fared better.
The Fund’s Investment Approach
The fund seeks long-term capital appreciation.To pursue its goal, the fund normally allocates its assets among other mutual funds advised by The Dreyfus Corporation (Dreyfus), or its affiliates, that invest primarily in stocks issued by large-cap companies. The underlying funds are selected by the Dreyfus Investment Committee based on their investment objectives and management policies, portfolio holdings, risk/reward profiles, historical performance and other factors. The Dreyfus Investment Committee will rebalance the fund’s investments in the underlying funds at least annually, but may do so more often in response to market conditions.As of October 31, 2010, the fund’s assets were allocated as follows:
| Underlying Funds | (%) |
| Dreyfus Research Growth Fund | 35 |
| Dreyfus Strategic Value Fund | 32 |
| Dreyfus U.S. Equity Fund | 17 |
| Dreyfus/The Boston Company Large Cap Core Fund | 17 |
TheFund 3
DISCUSSION OF FUND PERFORMANCE (continued)
Economic Concerns Sparked Heightened Market Volatility
From the beginning of the reporting period through April 2010, the U.S. and global economies continued to recover from recession, propelling most stock prices higher. However, in May 2010 investors faced greater economic uncertainty when Europe was roiled by a sovereign debt crisis and inflation-fighting measures in China threatened to dampen a major engine of global growth. In the United States, mixed data regarding unemployment and housing markets suggested that stubborn economic headwinds might constrain already mild growth. As a result, the stock market rally was derailed over the spring and sum-mer.Those losses generally proved temporary, however, as anticipation of reduced political uncertainty and new monetary stimulus from the Federal Reserve Board sparked a broad-based market rally in September and October, enabling the S&P 500 Index to end the reporting period just short of the peak it had reached in April 2010.
Underlying Investments Produced Mixed Results
Although the fund participated to a substantial degree in the U.S. stock market’s gains over the reporting period, its emphasis on “mega-cap” companies dampened its relative performance when stocks at the smaller end of the large-cap spectrum posted higher returns. In addition, the fund was undermined by the lagging performance of one of its underlying investments, Dreyfus Strategic Value Fund, which was hindered by investors’ general preference for growth-oriented companies over their more value-oriented counterparts. Dreyfus Strategic Value Fund also suffered, in part, from underweighted exposure to consumer staples stocks.
On a more positive note, a number of the fund’s underlying investments produced above-average returns. Strong individual stock selections across a variety of market sectors supported the performance of Dreyfus Research Growth Fund. Dreyfus/The Boston Company Large Cap Core Fund benefited from its overweighted position in the consumer discretionary sector as well as its emphasis on stocks exhibiting strong growth and price momentum characteristics. Dreyfus U.S. Equity Fund also fared relatively well, largely due to its focus on companies with sound business fundamentals that proved relatively resistant to economic headwinds.
4
The fund made only one allocation change during the reporting period. In June, we eliminated the fund’s position in Dreyfus Appreciation Fund and moved its assets to Dreyfus/The Boston Company Large Cap Core Fund.This shift was designed to reduce the fund’s overall exposure to mega-cap stocks and manage risks by more closely approximating the composition of the S&P 500 Index.
Positioned for Further Recovery
Although we remain concerned regarding economic headwinds, we continue to be optimistic about the prospects of large-cap stocks. In our judgment, rising corporate earnings could lead to an increase in mergers-and-acquisitions activity, potentially benefiting stocks as companies begin to deploy some of their massive cash reserves. In addition, income-oriented investors may turn in greater numbers to large-cap, dividend-paying stocks in an environment of low interest rates and meager bond yields.We believe that these factors—as well as the fund’s broadly diversified exposure to some of our company’s portfolio managers—make the fund an attractive investment vehicle in today’s slow-growth economic environment.
November 15, 2010
| Equity funds are subject generally to market, market sector, market liquidity, issuer and investment | |
| style risks, among other factors, to varying degrees, all of which are more fully described in the | |
| prospectus of the fund and that of each underlying fund. | |
| The ability of the fund to achieve its investment goal depends, in part, on the ability of the | |
| Dreyfus Investment Committee to allocate effectively the fund’s assets among the underlying | |
| funds.There can be no assurance that the actual allocations will be effective in achieving the fund’s | |
| investment goal. | |
| 1 | Total return includes reinvestment of dividends and any capital gains paid, and does not take into |
| consideration the maximum initial sales charge in the case of Class A shares, or the applicable | |
| contingent deferred sales charge imposed on redemptions in the case of Class C shares. Had these | |
| charges been reflected, returns would have been lower. Past performance is no guarantee of future | |
| results. Share price and investment return fluctuate such that upon redemption, fund shares may be | |
| worth more or less than their original cost. Return figures provided reflect the absorption of certain | |
| fund expenses by The Dreyfus Corporation pursuant to an agreement in effect until March 1, | |
| 2012. Had these expenses not been absorbed, the fund’s returns would have been lower. | |
| 2 | SOURCE: LIPPER INC. — Reflects the monthly reinvestment of dividends and, where |
| applicable, capital gain distributions.The Standard & Poor’s 500 Composite Stock Price Index is | |
| a widely accepted, unmanaged index of U.S. stock market performance. Investors cannot invest | |
| directly in any index. |
TheFund 5
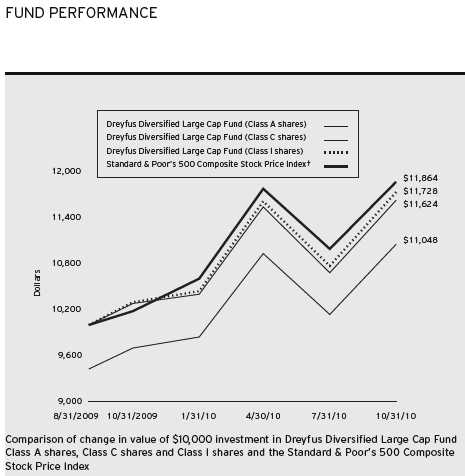
| † Source: Lipper Inc. |
| Past performance is not predictive of future performance. |
| The above graph compares a $10,000 investment made in Class A, Class C and Class I shares of Dreyfus Diversified |
| Large Cap Fund on 8/31/09 (inception date) to a $10,000 investment made in the Standard & Poor’s 500 |
| Composite Stock Price Index (the “Index”) on that date.All dividends and capital gain distributions are reinvested. |
| The fund’s performance shown in the line graph takes into account the maximum initial sales charge on Class A shares |
| and all other applicable fees and expenses on all classes.The Index is a widely accepted, unmanaged index of U.S. stock |
| market performance. Unlike a mutual fund, the Index is not subject to charges, fees and other expenses. Investors cannot |
| invest directly in any index. Further information relating to fund performance, including expense reimbursements, if |
| applicable, is contained in the Financial Highlights section of the prospectus and elsewhere in this report. |
6
| Average Annual Total Returns as of 10/31/10 | |||
| Inception | From | ||
| Date | 1 Year | Inception | |
| Class A shares | |||
| with maximum sales charge (5.75%) | 8/31/09 | 7.41% | 8.89% |
| without sales charge | 8/31/09 | 13.92% | 14.53% |
| Class C shares | |||
| with applicable redemption charge † | 8/31/09 | 12.07% | 13.73% |
| without redemption | 8/31/09 | 13.07% | 13.73% |
| Class I shares | 8/31/09 | 13.91% | 14.60% |
| Standard & Poor’s 500 | |||
| Composite Stock Price Index | 8/31/09 | 16.54% | 15.78% |
| Past performance is not predictive of future performance.The fund’s performance shown in the graph and table does not |
| reflect the deduction of taxes that a shareholder would pay on fund distributions or the redemption of fund shares. |
| † The maximum contingent deferred sales charge for Class C shares is 1% for shares redeemed within one year of the |
| date of purchase. |
TheFund 7
UNDERSTANDING YOUR FUND’S EXPENSES (Unaudited)
As a mutual fund investor, you pay ongoing expenses, such as management fees and other expenses. Using the information below, you can estimate how these expenses affect your investment and compare them with the expenses of other funds.You also may pay one-time transaction expenses, including sales charges (loads) and redemption fees, which are not shown in this section and would have resulted in higher total expenses. For more information, see your fund’s prospectus or talk to your financial adviser.
Review your fund’s expenses
The table below shows the expenses you would have paid on a $1,000 investment in Dreyfus Diversified Large Cap Fund from May 1, 2010 to October 31, 2010. It also shows how much a $1,000 investment would be worth at the close of the period, assuming actual returns and expenses.
| Expenses and Value of a $1,000 Investment | |||
| assuming actual returns for the six months ended October 31, 2010 | |||
| Class A | Class C | Class I | |
| Expenses paid per $1,000† | $ 1.98 | $ 5.72 | $ 2.13 |
| Ending value (after expenses) | $1,011.00 | $1,007.60 | $1,010.30 |
| COMPARING YOUR FUND’S EXPENSES |
| WITH THOSE OF OTHER FUNDS (Unaudited) |
Using the SEC’s method to compare expenses
The Securities and Exchange Commission (SEC) has established guidelines to help investors assess fund expenses. Per these guidelines, the table below shows your fund’s expenses based on a $1,000 investment, assuming a hypothetical 5% annualized return. You can use this information to compare the ongoing expenses (but not transaction expenses or total cost) of investing in the fund with those of other funds.All mutual fund shareholder reports will provide this information to help you make this comparison. Please note that you cannot use this information to estimate your actual ending account balance and expenses paid during the period.
| Expenses and Value of a $1,000 Investment | |||
| assuming a hypothetical 5% annualized return for the six months ended October 31, 2010 | |||
| Class A | Class C | Class I | |
| Expenses paid per $1,000† | $ 1.99 | $ 5.75 | $ 2.14 |
| Ending value (after expenses) | $1,023.24 | $1,019.51 | $1,023.09 |
† Expenses are equal to the fund’s annualized expense ratio of .39% for Class A, 1.13% for Class C and .42% for Class I, multiplied by the average account value over the period, multiplied by 184/365 (to reflect the one-half year period).
8
| STATEMENT OF INVESTMENTS |
| October 31, 2010 |
| Registered Investment Companies—100.3% | Shares | Value ($) | |
| Dreyfus Research Growth Fund, Cl. Z | 91,192 | a | 781,518 |
| Dreyfus Strategic Value Fund, Cl. I | 27,051 | a | 709,537 |
| Dreyfus U.S. Equity Fund, Cl. I | 29,826 | a | 381,479 |
| Dreyfus/The Boston Company | |||
| Large Cap Core Fund, Cl. I | 11,559 | a | 370,585 |
| Total Investments (cost $2,016,855) | 100.3% | 2,243,119 | |
| Liabilities, Less Cash and Receivables | (.3%) | (6,041) | |
| Net Assets | 100.0% | 2,237,078 | |
| a Investment in affiliated mutual fund. |
| Portfolio Summary (Unaudited)† | |
| Value (%) | |
| Mutual Funds: Domestic Equity | 100.3 |
| † Based on net assets. | |
| See notes to financial statements. |
TheFund 9
| STATEMENT OF ASSETS AND LIABILITIES |
| October 31, 2010 |
| Cost | Value | ||
| Assets ($): | |||
| Investments in affiliated issuers—See Statement | |||
| of Investments—Note 1(c) | 2,016,855 | 2,243,119 | |
| Cash | 53,150 | ||
| Deferred assets | 19,328 | ||
| Due from The Dreyfus Corporation and affiliates—Note 3(c) | 12,600 | ||
| 2,328,197 | |||
| Liabilities ($): | |||
| Accrued expenses | 91,119 | ||
| Net Assets ($) | 2,237,078 | ||
| Composition of Net Assets ($): | |||
| Paid-in capital | 2,041,784 | ||
| Accumulated undistributed investment income—net | 6,713 | ||
| Accumulated net realized gain (loss) on investments | (37,683) | ||
| Accumulated net unrealized appreciation | |||
| (depreciation) on investments | 226,264 | ||
| Net Assets ($) | 2,237,078 | ||
| Net Asset Value Per Share | |||
| Class A | Class C | Class I | |
| Net Assets ($) | 107,594 | 29,062 | 2,100,422 |
| Shares Outstanding | 7,343 | 2,000 | 143,242 |
| Net Asset Value Per Share ($) | 14.65 | 14.53 | 14.66 |
| See notes to financial statements. | |||
10
| STATEMENT OF OPERATIONS |
| Year Ended October 31, 2010 |
| Investment Income ($): | |
| Income: | |
| Cash dividends from affiliated issuers | 11,824 |
| Expenses: | |
| Registration fees | 60,283 |
| Legal fees | 48,455 |
| Auditing fees | 42,417 |
| Prospectus and shareholders’ reports | 7,418 |
| Directors’ fees and expenses—Note 3(d) | 2,924 |
| Custodian fees—Note 3(c) | 1,370 |
| Shareholder servicing costs—Note 3(c) | 567 |
| Distribution fees—Note 3(b) | 204 |
| Loan commitment fees—Note 2 | 149 |
| Miscellaneous | 10,292 |
| Total Expenses | 174,079 |
| Less—reduction in expenses due to undertaking—Note 3(a) | (167,836) |
| Less—reduction in fees due to earnings credits—Note 3(c) | (2) |
| Less—waiver of shareholder servicing fees—Note 3(c) | (273) |
| Net Expenses | 5,968 |
| Investment Income—Net | 5,856 |
| Realized and Unrealized Gain (Loss) on Investments—Note 4 ($): | |
| Net realized gain (loss) on investments in affiliated issuers | (37,683) |
| Net unrealized appreciation (depreciation) on investments in affiliated issuers | 223,287 |
| Net Realized and Unrealized Gain (Loss) on Investments | 185,604 |
| Net Increase in Net Assets Resulting from Operations | 191,460 |
| See notes to financial statements. | |
TheFund 11
STATEMENT OF CHANGES IN NET ASSETS
| Year Ended October 31, | ||
| 2010 | 2009a | |
| Operations ($): | ||
| Investment income (loss)—net | 5,856 | (86) |
| Net realized gain (loss) on | ||
| investments in affiliated issuers | (37,683) | — |
| Net unrealized appreciation (depreciation) | ||
| on investments in affiliated issuers | 223,287 | 2,977 |
| Net Increase (Decrease) in Net Assets | ||
| Resulting from Operations | 191,460 | 2,891 |
| Capital Stock Transactions ($): | ||
| Net proceeds from shares sold: | ||
| Class A Shares | 53,980 | 50,000 |
| Class C Shares | — | 25,000 |
| Class I Shares | 3,447,648 | 25,000 |
| Cost of shares redeemed: | ||
| Class A Shares | (8,184) | — |
| Class I Shares | (1,550,717) | — |
| Increase (Decrease) in Net Assets | ||
| from Capital Stock Transactions | 1,942,727 | 100,000 |
| Total Increase (Decrease) in Net Assets | 2,134,187 | 102,891 |
| Net Assets ($): | ||
| Beginning of Period | 102,891 | — |
| End of Period | 2,237,078 | 102,891 |
| Undistributed investment income—net | 6,713 | — |
| Capital Share Transactions (Shares): | ||
| Class A | ||
| Shares sold | 3,996 | 4,000 |
| Shares redeemed | (653) | — |
| Net Increase (Decrease) in Shares Outstanding | 3,343 | 4,000 |
| Class C | ||
| Shares sold | — | 2,000 |
| Class I | ||
| Shares sold | 254,951 | 2,000 |
| Shares redeemed | (113,709) | — |
| Net Increase (Decrease) in Shares Outstanding | 141,242 | 2,000 |
| a From August 31, 2009 (commencement of operations) to October 31, 2009. | ||
| See notes to financial statements. | ||
12
FINANCIAL HIGHLIGHTS
The following tables describe the performance for each share class for the fiscal periods indicated.All information (except portfolio turnover rate) reflects financial results for a single fund share.Total return shows how much your investment in the fund would have increased (or decreased) during each period, assuming you had reinvested all dividends and distributions.These figures have been derived from the fund’s financial statements.
| Year Ended October 31, | ||
| Class A Shares | 2010 | 2009a |
| Per Share Data ($): | ||
| Net asset value, beginning of period | 12.86 | 12.50 |
| Investment Operations: | ||
| Investment income (loss)—netb | .02 | (.01) |
| Net realized and unrealized | ||
| gain (loss) on investments | 1.77 | .37 |
| Total from Investment Operations | 1.79 | .36 |
| Net asset value, end of period | 14.65 | 12.86 |
| Total Return (%)c | 13.92 | 2.88d |
| Ratios/Supplemental Data (%): | ||
| Ratio of total expenses to average net assetse | 9.75 | 226.76f |
| Ratio of net expenses to average net assetse | .33 | .36f |
| Ratio of net investment income | ||
| (loss) to average net assetse | .12 | (.36)f |
| Portfolio Turnover Rate | 97.93 | —d |
| Net Assets, end of period ($ x 1,000) | 108 | 51 |
| a | From August 31, 2009 (commencement of operations) to October 31, 2009. |
| b | Based on average shares outstanding at each month end. |
| c | Exclusive of sales charge. |
| d | Not annualized. |
| e | Amounts do not include the activity of the underlying funds. |
| f | Annualized. |
| See notes to financial statements. | |
TheFund 13
FINANCIAL HIGHLIGHTS (continued)
| Year Ended October 31, | ||
| Class C Shares | 2010 | 2009a |
| Per Share Data ($): | ||
| Net asset value, beginning of period | 12.85 | 12.50 |
| Investment Operations: | ||
| Investment (loss)—netb | (.06) | (.02) |
| Net realized and unrealized | ||
| gain (loss) on investments | 1.74 | .37 |
| Total from Investment Operations | 1.68 | .35 |
| Net asset value, end of period | 14.53 | 12.85 |
| Total Return (%)c | 13.07 | 2.80d |
| Ratios/Supplemental Data (%): | ||
| Ratio of total expenses to average net assetse | 10.61 | 227.92f |
| Ratio of net expenses to average net assetse | 1.08 | 1.11f |
| Ratio of net investment (loss) | ||
| to average net assetse | (.44) | (1.11)f |
| Portfolio Turnover Rate | 97.93 | —d |
| Net Assets, end of period ($ x 1,000) | 29 | 26 |
| a | From August 31, 2009 (commencement of operations) to October 31, 2009. |
| b | Based on average shares outstanding at each month end. |
| c | Exclusive of sales charge. |
| d | Not annualized. |
| e | Amounts do not include the activity of the underlying funds. |
| f | Annualized. |
| See notes to financial statements. | |
14
| Year Ended October 31, | ||
| Class I Shares | 2010 | 2009a |
| Per Share Data ($): | ||
| Net asset value, beginning of period | 12.87 | 12.50 |
| Investment Operations: | ||
| Investment income (loss)—netb | .05 | (.00)c |
| Net realized and unrealized | ||
| gain (loss) on investments | 1.74 | .37 |
| Total from Investment Operations | 1.79 | .37 |
| Net asset value, end of period | 14.66 | 12.87 |
| Total Return (%) | 13.91 | 2.96d |
| Ratios/Supplemental Data (%): | ||
| Ratio of total expenses to average net assetse | 9.80 | 227.09f |
| Ratio of net expenses to average net assetse | .32 | .11f |
| Ratio of net investment income | ||
| (loss) to average net assetse | .35 | (.11)f |
| Portfolio Turnover Rate | 97.93 | —d |
| Net Assets, end of period ($ x 1,000) | 2,100 | 26 |
| a | From August 31, 2009 (commencement of operations) to October 31, 2009. |
| b | Based on average shares outstanding at each month end. |
| c | Amount represents less than $.01 per share. |
| d | Not annualized. |
| e | Amounts do not include the activity of the underlying funds. |
| f | Annualized. |
| See notes to financial statements. | |
TheFund 15
NOTES TO FINANCIAL STATEMENTS
NOTE 1—Significant Accounting Policies:
Dreyfus Diversified Large Cap Fund (the ‘fund’) is a separate diversified series of Dreyfus Premier Investment Funds, Inc. (the ‘Company’), which is registered under the Investment Company Act of 1940, as amended (the ‘Act’), as an open-end management investment company and operates as a series company currently offering ten series, including the fund. The fund’s investment objective is to seek long-term capital appreciation.The Dreyfus Corporation (the ‘Manager’ or ‘Dreyfus’), a wholly-owned subsidiary of The Bank of New York Mellon Corporation (‘BNY Mellon’), serves as the fund’s investment adviser.
MBSC Securities Corporation (the ‘Distributor’), a wholly-owned subsidiary of the Manager, is the distributor of the fund’s shares.The fund is authorized to issue 50 million shares of $.001 par value Common Stock in each of the following classes of shares: Class A, Class C, and Class I. Class A shares are subject to a sales charge imposed at the time of purchase. Class C shares are subject to a contingent deferred sales charge (‘CDSC’) imposed on Class C shares redeemed within one year of purchase. Class I shares are sold at net asset value per share only to institutional investors. Other differences between the classes include the services offered to and the expenses borne by each class, the allocation of certain transfer agency costs and certain voting rights. Income, expenses (other than expenses attributable to a specific class), and realized and unrealized gains or losses on investmen ts are allocated to each class of shares based on its relative net assets.
As of October 31, 2010, MBC Investments Corp., an indirect subsidiary of BNY Mellon, held 4,000 Class A and 2,000 Class C shares of the fund.
The Company accounts separately for the assets, liabilities and operations of each series. Expenses directly attributable to each series are charged to that series’ operations; expenses which are applicable to all series are allocated among them on a pro rata basis.
16
The Financial Accounting Standards Board (‘FASB’) Accounting Standards Codification (‘ASC’) is the exclusive reference of authoritative U.S. generally accepted accounting principles (‘GAAP’) recognized by the FASB to be applied by nongovernmental entities. Rules and interpretive releases of the Securities and Exchange Commission (‘SEC’) under authority of federal laws are also sources of authoritative GAAP for SEC registrants. The fund’s financial statements are prepared in accordance with GAAP, which may require the use of management estimates and assumptions.Actual results could differ from those estimates.
The Company enters into contracts that contain a variety of indemnifications.The fund’s maximum exposure under these arrangements is unknown.The fund does not anticipate recognizing any loss related to these arrangements.
(a) Portfolio valuation: Investments are valued at the net asset value of each underlying fund determined as of the close of the New York Stock Exchange (generally 4 p.m., Eastern time) on the valuation date.
The fair value of a financial instrument is the amount that would be received to sell an asset or paid to transfer a liability in an orderly transaction between market participants at the measurement date (i.e. the exit price). GAAP establishes a fair value hierarchy that prioritizes the inputs of valuation techniques used to measure fair value.This hierarchy gives the highest priority to unadjusted quoted prices in active markets for identical assets or liabilities (Level 1 measurements) and the lowest priority to unobservable inputs (Level 3 measurements).
Additionally, GAAP provides guidance on determining whether the volume and activity in a market has decreased significantly and whether such a decrease in activity results in transactions that are not orderly. GAAP requires enhanced disclosures around valuation inputs and techniques used during annual and interim periods.
TheFund 17
NOTES TO FINANCIAL STATEMENTS (continued)
Various inputs are used in determining the value of the fund’s investments relating to fair value measurements.These inputs are summarized in the three broad levels listed below:
Level 1—unadjusted quoted prices in active markets for identical investments.
Level 2—other significant observable inputs (including quoted prices for similar investments, interest rates, prepayment speeds, credit risk, etc.).
Level 3—significant unobservable inputs (including the fund’s own assumptions in determining the fair value of investments).
The inputs or methodology used for valuing securities are not necessarily an indication of the risk associated with investing in those securities.
The following is a summary of the inputs used as of October 31, 2010 in valuing the fund’s investments:
| Level 2—Other | Level 3— | |||
| Level 1— | Significant | Significant | ||
| Unadjusted | Observable | Unobservable | ||
| Quoted Prices | Inputs | Inputs | Total | |
| Assets ($) | ||||
| Investments in Securities: | ||||
| Mutual Funds | 2,243,119 | — | — | 2,243,119 |
In January 2010, FASB issued Accounting Standards Update (‘ASU’) No. 2010-06 ‘Improving Disclosures about Fair Value Measurements’. The portions of ASU No. 2010-06 which require reporting entities to prepare new disclosures surrounding amounts and reasons for significant transfers in and out of Level 1 and Level 2 fair value measurements as well as inputs and valuation techniques used to measure fair value for both recurring and nonrecurring fair value measurements that fall in either Level 2 or Level 3 have been adopted by the fund. No significant transfers between Level 1 or Level 2 fair value measurements occurred at October 31, 2010. The remaining portion of ASU No. 2010-06
18
requires reporting entities to make new disclosures about information on purchases, sales, issuances and settlements on a gross basis in the reconciliation of activity in Level 3 fair value measurements.These new and revised disclosures are required to be implemented for fiscal years beginning after December 15, 2010. Management is currently evaluating the impact that the adoption of this remaining portion of ASU No. 2010-06 may have on the fund’s financial statement disclosures.
(b) Securities transactions and investment income: Securities transactions are recorded on a trade date basis. Realized gains and losses from securities transactions are recorded on the identified cost basis. Dividend income is recognized on the ex-dividend date and interest income, including, where applicable, accretion of discount and amortization of premium on investments, is recognized on the accrual basis.
(c) Affiliated issuers: Investments in other investment companies advised by Dreyfus are defined as ‘affiliated’ in the Act.
The fund may invest in shares of certain affiliated investment companies also advised or managed by Dreyfus. Investments in affiliated investment companies for the period ended October 31, 2010 were as follows:
| Affiliated | ||||
| Investment | Value | Dividends/ | ||
| Company | 10/31/2009 ($) | Purchases ($) | Sales ($) | Distributions ($) |
| Dreyfus | ||||
| Appreciation Fund | 17,807 | 433,339 | 432,284 | 5,845 |
| Dreyfus Research | ||||
| Growth Fund, Cl. Z | 34,280 | 1,114,997 | 473,168 | 746 |
| Dreyfus Strategic | ||||
| Value Fund, Cl. I | 33,183 | 1,118,337 | 473,168 | 4,088 |
| Dreyfus U.S. Equity | ||||
| Fund, Cl. I | 17,707 | 575,152 | 243,753 | 1,145 |
| Dreyfus/The Boston | ||||
| Company Large Cap | ||||
| Core Fund, Cl. I | — | 403,420 | 68,334 | — |
| Total | 102,977 | 3,645,245 | 1,690,707 | 11,824 |
TheFund 19
NOTES TO FINANCIAL STATEMENTS (continued)
| Affiliated | Net Unrealized | |||
| Investment | Net Realized | Appreciation | Value | Net |
| Company | Gain (Loss) ($) | (Depreciation) ($) | 10/31/2010 ($) | Assets (%) |
| Dreyfus | ||||
| Appreciation Fund | (18,055) | (807) | — | — |
| Dreyfus Research | ||||
| Growth Fund, Cl. Z | (5,794) | 111,203 | 781,518 | 34.9 |
| Dreyfus Strategic | ||||
| Value Fund, Cl. I | (13,022) | 44,207 | 709,537 | 31.7 |
| Dreyfus U.S. Equity | ||||
| Fund, Cl. I | (2,011) | 34,384 | 381,479 | 17.1 |
| Dreyfus/The Boston | ||||
| Company Large Cap | ||||
| Core Fund, Cl. I | 1,199 | 34,300 | 370,585 | 16.6 |
| Total | (37,683) | 223,287 | 2,243,119 | 100.3 |
(d) Dividends to shareholders: Dividends are recorded on the ex-dividend date. Dividends from investment income-net and dividends from net realized capital gains, if any, are normally declared and paid annually, but the fund may make distributions on a more frequent basis to comply with the distribution requirements of the Internal Revenue Code of 1986, as amended (the “Code”).To the extent that net realized capital gains can be offset by capital loss carryovers, it is the policy of the fund not to distribute such gains. Income and capital gain distributions are determined in accordance with income tax regulations, which may differ from GAAP.
(e) Federal income taxes: It is the policy of the fund to continue to qualify as a regulated investment company, if such qualification is in the best interests of its shareholders, by complying with the applicable provisions of the Code, and to make distributions of taxable income sufficient to relieve it from substantially all federal income and excise taxes.
As of and during the period ended October 31, 2010, the fund did not have any liabilities for any uncertain tax positions.The fund recognizes interest and penalties, if any, related to uncertain tax positions as income tax expense in the Statement of Operations. During the period, the fund did not incur any interest or penalties.
Each of the tax years in the two-year period ended October 31, 2010 remains subject to examination by the Internal Revenue Service and state taxing authorities.
20
At October 31, 2010, the components of accumulated earnings on a tax basis were as follows: undistributed ordinary income $6,713, accumulated capital losses $17,637 and unrealized appreciation $206,218.
The accumulated capital loss carryover is available for federal income tax purposes to be applied against future net securities profits, if any, realized subsequent to October 31, 2010. If not applied, the carryover expires in fiscal 2018.
During the period ended October 31, 2010, as a result of permanent book to tax differences, primarily due to fund start-up costs, the fund increased accumulated undistributed investment income-net by $857 and decreased paid-in capital by the same amount. Net assets and net asset value per share were not affected by this reclassification.
NOTE 2—Bank Lines of Credit:
The fund participates with other Dreyfus-managed funds in a $225 million unsecured credit facility led by Citibank, N.A. and a $300 million unsecured credit facility provided by The Bank of New York Mellon, a subsidiary of BNY Mellon and an affiliate of Dreyfus (each, a ‘Facility’), each to be utilized primarily for temporary or emergency purposes, including the financing of redemptions. In connection therewith, the fund has agreed to pay its pro rata portion of commitment fees for each Facility. Interest is charged to the fund based on rates determined pursuant to the terms of the respective Facility at the time of borrowing. During the period ended on October 31, 2010, the fund did not borrow under the Facilities.
NOTE 3—Management Fee and Other Transactions with Affiliates:
(a) Pursuant to a management agreement with the Manager, there is no management fee paid to the Manager. The fund invests in other mutual funds advised by the Manager. All fees and expenses of the underlying funds are reflected in the underlying funds’ net asset value.
TheFund 21
NOTES TO FINANCIAL STATEMENTS (continued)
The Manager has contractually agreed, until March 1, 2012, to assume the expenses of the fund so that the total annual fund and underlying funds operating expenses of none of the classes (excluding Rule 12b-1 fees, shareholder services fees, taxes, interest, brokerage commissions and extraordinary expenses) exceed 1.20% of the value of the fund’s average daily net assets.The reduction in expenses, pursuant to the undertaking, amounted to $167,836 during the period ended October 31, 2010.
(b) Under the Distribution Plan (the ‘Plan’) adopted pursuant to Rule 12b-1 under the Act, Class C shares pay the Distributor for distributing their shares at an annual rate of .75% of the value of the average daily net assets of Class C shares. During the period ended October 31, 2010, Class C shares were charged $204 pursuant to the Plan.
(c) Under the Shareholder Services Plan, Class A and Class C shares pay the Distributor at an annual rate of .25% of the value of their average daily net assets for the provision of certain services.The services provided may include personal services relating to shareholder accounts, such as answering shareholder inquiries regarding the fund and providing reports and other information, and services related to the maintenance of shareholder accounts.The Distributor may make payments to Service Agents (a securities dealer, financial institution or other industry professional) in respect of these services.The Distributor determines the amounts to be paid to Service Agents. Fees paid to the Distributor will be waived to the extent that the fund invests in an underlying affiliated fund with a Shareholder Services Plan. During the period ended October 31, 2010, Class A and Class C shares were charged $205 and $68, respectively, pursuant to the Shareholder Services Plan, all of which was waived due to the fund’s investment in certain of the underlying funds.
The fund compensates Dreyfus Transfer, Inc., a wholly-owned subsidiary of the Manager, under a transfer agency agreement for providing personnel and facilities to perform transfer agency services for the fund. During the period ended October 31, 2010, the fund was charged $149 pursuant to the transfer agency agreement, which is included in Shareholder servicing costs in the Statement of Operations.
22
The fund has arrangements with the custodian and cash management bank whereby the fund may receive earnings credits when positive cash balances are maintained, which are used to offset custody and cash management fees. For financial reporting purposes, the fund includes net earnings credits as an expense offset in the Statement of Operations.
The fund compensates The Bank of New York Mellon under a cash management agreement for performing cash management services related to fund subscriptions and redemptions. During the period ended October 31, 2010, the fund was charged $24 pursuant to the cash management agreement, which is included in Shareholder servicing costs in the Statement of Operations.These fees were partially offset by earnings credits of $2.
The fund also compensates The Bank of New York Mellon under a custody agreement for providing custodial services for the fund. During the period ended October 31, 2010, the fund was charged $1,370 pursuant to the custody agreement.
During the period ended October 31, 2010, the fund was charged $3,400 for services performed by the Chief Compliance Officer.
The components of ‘Due fromThe Dreyfus Corporation and affiliates’ in the Statement of Assets and Liabilities consist of: Rule 12b-1 distribution plan fees $18, shareholder services plan fees $29, custodian fees $462, chief compliance officer fees $2,248 and transfer agency per account fees $31, which are offset against an expense reimbursement currently in effect in the amount of $15,388.
(d) Each Board member also serves as a Board member of other funds within the Dreyfus complex. Annual retainer fees and attendance fees are allocated to each fund based on net assets.
NOTE 4—Securities Transactions:
The aggregate amount of purchases and sales of investment securities, excluding short-term securities, during the period ended October 31, 2010, amounted to $3,645,245 and $1,690,707, respectively.
TheFund 23
NOTES TO FINANCIAL STATEMENTS (continued)
The provisions of ASC Topic 815 ‘Derivatives and Hedging’ require qualitative disclosures about objectives and strategies for using derivatives, quantitative disclosures about fair value amounts of gains and losses on derivative instruments and disclosures about credit-risk related contingent features in derivative agreements.The fund held no derivatives during the period ended October 31, 2010.
At October 31, 2010, the cost of investments for federal income tax purposes was $2,036,901; accordingly, accumulated net unrealized appreciation on investments was $206,218, consisting of gross unrealized appreciation.
24
| REPORT OF INDEPENDENT REGISTERED |
| PUBLIC ACCOUNTING FIRM |
Shareholders and Board of Directors
Dreyfus Diversified Large Cap Fund
We have audited the accompanying statement of assets and liabilities, including the statement of investments, of Dreyfus Diversified Large Cap Fund (one of the series comprising Dreyfus Premier Investment Funds, Inc.) as of October 31, 2010, and the related statement of operations for the year then ended and the statement of changes in net assets and financial highlights for the year then ended and for the period from August 31, 2009 (commencement of operations) to October 31, 2009. These financial statements and financial highlights are the responsibility of the Fund’s management. Our responsibility is to express an opinion on these financial statements and financial highlights based on our audits.
We conducted our audits in accordance with the standards of the Public Company Accounting Oversight Board (United States).Those standards require that we plan and perform the audit to obtain reasonable assurance about whether the financial statements and financial highlights are free of material misstatement.We were not engaged to perform an audit of the Fund’s internal control over financial reporting. Our audits included consideration of internal control over financial reporting as a basis for designing audit procedures that are appropriate in the circumstances, but not for the purpose of expressing an opinion on the effectiveness of the Fund’s internal control over financial reporting. Accordingly, we express no such opinion.An audit also includes examining, on a test basis, evidence supporting the amounts and disclosures in the financial statements and financial highlights, assessing the accounting p rinciples used and significant estimates made by management, and evaluating the overall financial statement presentation. Our procedures included confirmation of securities owned as of October 31, 2010 by correspondence with the custodian and others. We believe that our audits provide a reasonable basis for our opinion.
In our opinion, the financial statements and financial highlights referred to above present fairly, in all material respects, the financial position of Dreyfus Diversified Large Cap Fund at October 31, 2010, the results of its operations for the year then ended and the changes in its net assets and the financial highlights for the year then ended and for the period from August 31, 2009 to October 31, 2009, in conformity with U.S. generally accepted accounting principles.

New York, New York
December 28, 2010
TheFund 25
| INFORMATION ABOUT THE REVIEW AND APPROVAL |
| OF THE FUND’S MANAGEMENT AGREEMENT (UNAUDITED) |
At a meeting of the fund’s Board held on July 13, 2010, the Board considered the re-approval of the fund’s Management Agreement with Dreyfus for a one-year term ending July 31, 2011.The Board members, none of whom are “interested persons” (as defined in the Investment Company Act of 1940, as amended) of the fund, were assisted in their review by independent legal counsel and met with counsel in executive session separate from representatives of Dreyfus. In considering the re-approval of the Management Agreement, the Board considered all factors that it believed to be relevant, including, among other things, the factors discussed below.
Analysis of Nature, Extent and Quality of Services Provided to the Fund.The Board members received a presentation from representatives of Dreyfus regarding services provided to the fund and other funds in the Dreyfus fund complex, and discussed the nature, extent and quality of the services provided to the fund pursuant to its Management Agreement. Dreyfus’ representatives reviewed the fund’s distribution of accounts and the relationships Dreyfus has with various intermediaries and the different needs of each. Dreyfus’ representatives noted the various distribution channels for the fund as well as the diverse methods of distribution among other funds in the Dreyfus fund complex, and Dreyfus’ corresponding need for broad, deep, and diverse resources to be able to provide ongoing shareholder services to each distrib ution channel, including those of the fund. Dreyfus also provided the number of accounts investing in the fund, as well as the fund’s asset size.
The Board members also considered Dreyfus’ research and portfolio management capabilities and Dreyfus’ oversight of day-to-day fund operations, including fund accounting, administration and assistance in meeting legal and regulatory requirements. The Board members also considered Dreyfus’ extensive administrative, accounting and compliance infrastructure.
26
Comparative Analysis of the Fund’s Performance and Management Fee and Expense Ratio. The Board members reviewed the fund’s performance for the nine-month period ended May 31, 2010, and compared the fund’s performance to the performance of two retail front-end load large-cap core funds that are passively managed affiliated funds of funds (the “Performance Group”) and to a larger universe of funds consisting of all retail and institutional large-cap growth funds (the “Performance Universe”), selected and provided by Lipper, Inc., an independent provider of investment company data. The Board was provided with a description of the methodology Lipper used to select the Performance Group and Performance Universe, as well as the Expense Group (discussed below). The Board members discussed the results of th e comparisons and noted that the fund’s total return performance for the nine-month period ended May 31, 2010 was the highest in the Performance Group but below the Performance Universe median. Dreyfus also provided a comparison of the fund’s calendar year total returns to the returns of the fund’s benchmark index.
The Board members also discussed the fund’s management fee and expense ratio and reviewed the range of actual and contractual management fees and expense ratios of two comparable funds (the “Expense Group”), selected and provided by Lipper.The Board members noted that, like one of the other funds in the Expense Group, the fund’s management fees are paid only at the underlying funds level and the total expense ratio was in the middle of the Expense Group. The Board members noted that Dreyfus has contractually agreed, until March 1, 2011, to assume the expenses of the fund so that the total annual fund and underlying funds operating expenses of none of the classes (excluding Rule 12b-1 fees, shareholder services fees, taxes, interest, brokerage commissions, commitment fees on borrowings and extraordinary expenses) exceed 1.20% of the value of the fund’s average daily net assets.
TheFund 27
| INFORMATION ABOUT THE REVIEW AND APPROVAL OF THE |
| FUND’S MANAGEMENT AGREEMENT (Unaudited) (continued) |
Representatives of Dreyfus reviewed with the Board members the fees paid to Dreyfus or its affiliates by the mutual funds managed by Dreyfus or its affiliates with similar investment objectives, policies and strategies, and included in the same Lipper category as the fund (the “Similar Funds”). It was noted that there were no other accounts managed by Dreyfus or its affiliates with similar investment objectives, policies and strategies as the fund.The Board members considered the relevance of the fee information provided for the Similar Funds managed to evaluate the appropriateness and reasonableness of the fund’s management fee.
Analysis of Profitability and Economies of Scale. Dreyfus would not have direct profits from the fund’s management fee, since the fund would pay no direct management fee. Similarly, economies of scale were not relevant.The Board members considered potential benefits to Dreyfus from acting as investment adviser.
At the conclusion of these discussions, the Board agreed that it had been furnished with sufficient information to make an informed business decision with respect to re-approving the Management Agreement. Based on the discussions and considerations as described above, the Board made the following conclusions and determinations.
The Board concluded that the nature, extent and quality of the services provided by Dreyfus are adequate and appropriate.
The Board was satisfied with the fund’s relative performance.
Since the fund would not pay a direct management fee, profitability and economies of scale were not relevant.
The Board members considered these conclusions and determinations, along with information received on a routine and regular basis throughout the year, and, without any one factor being dispositive, the Board determined that re-approval of the Management Agreement through July 31, 2011 was in the best interests of the fund and its shareholders.
28
OFFICERS OF THE FUND (Unaudited)
BRADLEY J. SKAPYAK, President since January 2010.
Chief Operating Officer and a director of the Manager since June 2009. From April 2003 to June 2009, Mr. Skapyak was the head of the Investment Accounting and Support Department of the Manager. He is an officer of 76 investment companies (comprised of 170 portfolios) managed by the Manager. He is 51 years old and has been an employee of the Manager since February 1988.
PHILLIP N. MAISANO, Executive Vice President since July 2007.
Chief Investment Officer,Vice Chair and a director of the Manager, and an officer of 76 investment companies (comprised of 170 portfolios) managed by the Manager. Mr. Maisano also is an officer and/or Board member of certain other investment management subsidiaries of The Bank of New York Mellon Corporation, each of which is an affiliate of the Manager. He is 63 years old and has been an employee of the Manager since November 2006. Prior to joining the Manager, Mr. Maisano served as Chairman and Chief Executive Officer of EACM Advisors, an affiliate of the Manager, since August 2004.
MICHAEL A. ROSENBERG, Vice President and Secretary since August 2005.
Assistant General Counsel of BNY Mellon, and an officer of 77 investment companies (comprised of 195 portfolios) managed by the Manager. He is 50 years old and has been an employee of the Manager since October 1991.
KIESHA ASTWOOD, Vice President and Assistant Secretary since January 2010.
Counsel of BNY Mellon, and an officer of 77 investment companies (comprised of 195 portfolios) managed by the Manager. She is 37 years old and has been an employee of the Manager since July 1995.
JAMES BITETTO, Vice President and Assistant Secretary since August 2005.
Senior Counsel of BNY Mellon and Secretary of the Manager, and an officer of 77 investment companies (comprised of 195 portfolios) managed by the Manager. He is 44 years old and has been an employee of the Manager since December 1996.
JONI LACKS CHARATAN, Vice President and Assistant Secretary since August 2005.
Senior Counsel of BNY Mellon, and an officer of 77 investment companies (comprised of 195 portfolios) managed by the Manager. She is 54 years old and has been an employee of the Manager since October 1988.
JOSEPH M. CHIOFFI, Vice President and Assistant Secretary since August 2005.
Senior Counsel of BNY Mellon, and an officer of 77 investment companies (comprised of 195 portfolios) managed by the Manager. He is 48 years old and has been an employee of the Manager since June 2000.
KATHLEEN DENICHOLAS, Vice President and Assistant Secretary since January 2010.
Senior Counsel of BNY Mellon, and an officer of 77 investment companies (comprised of 195 portfolios) managed by the Manager. She is 36 years old and has been an employee of the Manager since February 2001.
JANETTE E. FARRAGHER, Vice President and Assistant Secretary since August 2005.
Assistant General Counsel of BNY Mellon, and an officer of 77 investment companies (comprised of 195 portfolios) managed by the Manager. She is 47 years old and has been an employee of the Manager since February 1984.
TheFund 31
OFFICERS OF THE FUND (Unaudited) (continued)
JOHN B. HAMMALIAN, Vice President and Assistant Secretary since August 2005.
Managing Counsel of BNY Mellon, and an officer of 77 investment companies (comprised of 195 portfolios) managed by the Manager. He is 47 years old and has been an employee of the Manager since February 1991.
M. CRISTINA MEISER, Vice President and Assistant Secretary since January 2010.
Senior Counsel of BNY Mellon, and an officer of 77 investment companies (comprised of 195 portfolios) managed by the Manager. She is 40 years old and has been an employee of the Manager since August 2001.
ROBERT R. MULLERY, Vice President and Assistant Secretary since August 2005.
Managing Counsel of BNY Mellon, and an officer of 77 investment companies (comprised of 195 portfolios) managed by the Manager. He is 58 years old and has been an employee of the Manager since May 1986.
JEFF PRUSNOFSKY, Vice President and Assistant Secretary since August 2005.
Managing Counsel of BNY Mellon, and an officer of 77 investment companies (comprised of 195 portfolios) managed by the Manager. He is 45 years old and has been an employee of the Manager since October 1990.
JAMES WINDELS, Treasurer since November 2001.
Director – Mutual Fund Accounting of the Manager, and an officer of 77 investment companies (comprised of 195 portfolios) managed by the Manager. He is 52 years old and has been an employee of the Manager since April 1985.
RICHARD CASSARO, Assistant Treasurer since January 2008.
Senior Accounting Manager – Money Market and Municipal Bond Funds of the Manager, and an officer of 77 investment companies (comprised of 195 portfolios) managed by the Manager. He is 51 years old and has been an employee of the Manager since September 1982.
GAVIN C. REILLY, Assistant Treasurer since August 2005.
Tax Manager of the Investment Accounting and Support Department of the Manager, and an officer of 77 investment companies (comprised of 195 portfolios) managed by the Manager. He is 42 years old and has been an employee of the Manager since April 1991.
ROBERT ROBOL, Assistant Treasurer since August 2005.
Senior Accounting Manager – Fixed Income Funds of the Manager, and an officer of 77 investment companies (comprised of 195 portfolios) managed by the Manager. He is 46 years old and has been an employee of the Manager since October 1988.
ROBERT SALVIOLO, Assistant Treasurer since July 2007.
Senior Accounting Manager – Equity Funds of the Manager, and an officer of 77 investment companies (comprised of 195 portfolios) managed by the Manager. He is 43 years old and has been an employee of the Manager since June 1989.
32
ROBERT SVAGNA, Assistant Treasurer since August 2002.
Senior Accounting Manager – Equity Funds of the Manager, and an officer of 77 investment companies (comprised of 195 portfolios) managed by the Manager. He is 43 years old and has been an employee of the Manager since November 1990.
JOSEPH W. CONNOLLY, Chief Compliance Officer since October 2004.
Chief Compliance Officer of the Manager and The Dreyfus Family of Funds (77 investment companies, comprised of 195 portfolios). From November 2001 through March 2004, Mr. Connolly was first Vice-President, Mutual Fund Servicing for Mellon Global Securities Services. In that capacity, Mr. Connolly was responsible for managing Mellon’s Custody, Fund Accounting and Fund Administration services to third-party mutual fund clients. He is 53 years old and has served in various capacities with the Manager since 1980, including manager of the firm’s Fund Accounting Department from 1997 through October 2001.
NATALIA GRIBAS, Anti-Money Laundering Compliance Officer since July 2010.
Anti-Money Laundering Compliance Officer of the Distributor, and the Anti-Money Laundering Compliance Officer of 73 investment companies (comprised of 191 portfolios) managed by the Manager. She is 40 years old and has been an employee of the Distributor since September 2008.
TheFund 33
Save time. Save paper. View your next shareholder report online as soon as it’s available. Log into www.dreyfus.com and sign up for Dreyfus eCommunications. It’s simple and only takes a few minutes.
The views expressed in this report reflect those of the portfolio manager only through the end of the period covered and do not necessarily represent the views of Dreyfus or any other person in the Dreyfus organization. Any such views are subject to change at any time based upon market or other conditions and Dreyfus disclaims any responsibility to update such views.These views may not be relied on as investment advice and, because investment decisions for a Dreyfus fund are based on numerous factors, may not be relied on as an indication of trading intent on behalf of any Dreyfus fund.
Not FDIC-Insured • Not Bank-Guaranteed • May Lose Value
Contents | |
THE FUND | |
| 2 | A Letter from the Chairman and CEO |
| 3 | Discussion of Fund Performance |
| 6 | Fund Performance |
| 8 | Understanding Your Fund’s Expenses |
| 8 | Comparing Your Fund’s Expenses With Those of Other Funds |
| 9 | Statement of Investments |
| 12 | Statement of Assets and Liabilities |
| 13 | Statement of Operations |
| 14 | Statement of Changes in Net Assets |
| 16 | Financial Highlights |
| 19 | Notes to Financial Statements |
| 31 | Report of Independent Registered Public Accounting Firm |
| 32 | Important Tax Information |
| 33 | Information About the Review and Approval of the Fund’s Management Agreement |
| 38 | Board Members Information |
| 40 | Officers of the Fund |
FOR MORE INFORMATION | |
Back Cover |
Dreyfus
Emerging Asia Fund
The Fund

A LETTER FROM THE CHAIRMAN AND CEO
Dear Shareholder:
We are pleased to present this annual report for Dreyfus Emerging Asia Fund, covering the 12-month period from November 1, 2009, through October 31, 2010.
Although a double-dip recession has recently become an increasingly unlikely scenario in our view, persistent uncertainty regarding the breadth and strength of the U.S. and global economic recoveries led to bouts of heightened volatility for U.S. stocks during most of 2010.The spending power of the U.S. consumer, long an important catalyst for economic growth, has been diminished by concerns over job security and an inability to generate cash from home equity.The second major driver of sustainable growth, corporate investment, has been stunted to a similar extent by tight credit conditions. However, the recent announcement of additional quantitative easing (QE2) measures by the Federal Reserve Board, as well as improved fundamentals across many developing nations, have helped support moderate global economic growth.
Uncertainty will probably remain in the broader financial markets until we see more evidence of robust economic growth, but we remain optimistic regarding the prospects for equities. Many stocks of quality companies with healthy balance sheets, higher credit ratings and strong cash flows appear to be currently priced at a discount.With that, we strongly suggest that you meet with your financial advisor to discuss the potential opportunities which may exist in the global markets, as well as to evaluate your portfolio to help meet your individual investment needs and your future goals relative to your risk-tolerance level.
For information about how the fund performed during the reporting period, as well as general market perspectives, we provide a Discussion of Fund Performance on the pages that follow.
Thank you for your continued confidence and support.

Jonathan R. Baum
Chairman and Chief Executive Officer
The Dreyfus Corporation
November 15, 2010
2

DISCUSSION OF FUND PERFORMANCE
For the period of November 1, 2009, through October 31, 2010, as provided by Hugh Simon and Nina Wu, Portfolio Managers
Fund and Market Performance Overview
For the 12-month period ended on October 31, 2010, Dreyfus Emerging Asia Fund’s Class A shares produced a total return of 24.86%, Class C shares returned 23.87% and Class I shares returned 25.34%.1 In comparison, the fund’s benchmark, the MSCI Emerging Markets Asia Index (the “Index”), produced a total return of 23.00% for the same period.2 Unlike much of the developed world,Asian emerging markets enjoyed robust economic growth during the reporting period, driving stock prices higher.The fund produced higher returns than its benchmark, which we attribute primarily to the success of our security selection strategies in China, India,Thailand and Indonesia.The strength of the emerging markets, especially the Asean countries, has also been assisted by liquidity returning into the region.
The Fund’s Investment Approach
The fund, which seeks long-term capital appreciation, normally invests at least 80% of its assets in stocks of companies that are located or principally traded in China, Hong Kong, India, Indonesia, Malaysia, Pakistan, the Philippines, Singapore, South Korea,Taiwan,Thailand and Vietnam.The fund may invest in the stocks of companies of any market capitalization.To determine where the fund will invest, we analyze several factors, including economic and political trends in Asian emerging market countries, the current financial condition and future prospects of individual companies and sectors in the Asian emerging markets, and the valuation of one market or company relative to that of another.
Emerging Markets Led the World Out of Recession
Even as most developed nations continued to struggle in a subpar global economic recovery, the emerging markets of Asia experienced strong and sustained levels of GDP growth. China, India, Indonesia, Thailand, Malaysia and other Asian nations have grown on the back of foreign direct investment into a variety of industries from manufacturing in China to software services in India.This economic development is now focusing on domestic driven growth and their recovery from the global financial crisis has been substantially stronger than other regions of the world. In addition, a growing middle class has sup-
TheFund 3
DISCUSSION OF FUND PERFORMANCE (continued)
ported domestic consumption in many Asian countries, adding depth to their economic growth.
Asia’s ascendancy on the world economic stage also has been aided by a number of other factors, including trade and budget surpluses, stable or strengthening currencies relative to the euro and U.S. dollar, and robust capital inflows from global investors seeking higher-growth and higher-yield opportunities. These characteristics helped improve the resiliency of Asian markets when faced with the reporting period’s global economic headwinds, including the near insolvency of Dubai, a sovereign debt crisis in Europe and a catastrophic oil spill in the Gulf of Mexico.While Asian markets were adversely affected by these developments, stock prices generally bounced back quickly as investors realized that local economic growth remained on track.
Stock Selections Bolstered Relative Performance
In this difficult market environment, the fund achieved especially strong results from its investments in China and India.The top contributors to fund performance this reporting period included automaker Tata Motors, which more than doubled in value amid rising household income levels in India. An improved product mix and lower leverage also benefited the company. Engineers India, the nation’s leading hydrocarbon engineering consultancy, gained value due to robust order inflows and good earnings visibility. In China, industrial components and equipment producer Chongqing Machinery & Electric benefited from industrialization in the west of China, which helped boost the company’s earnings growth. Hong Kong-based footwear manufacturer Daphne International Holdings fared well as Chinese consumers earned higher levels of discretionary income and spent in these stores.
Although the impact of underperforming companies during the reporting period was relatively mild overall, the fund’s relative performance was pulled down by weakness in the mining and energy sectors and NASDAQ-listed Chinese companies. For example, Malaysian oil and gas equipment producer KNM Group declined due to a management buyout which failed because of concerns regarding high leverage and borrowing costs and difficulty in improving its order book. In addition, Hong Kong battery producer CoslightTechnology International fell when its new energy battery business growth could not offse t the decline of its traditional battery business, prompting us to sell. A number of real estate-related companies in Indonesia, Thailand and India also lagged market averages, but we have maintained those positions on housing demand for the long term and have hedged against an unexpected acceleration of inflation in these fast-growing markets.
4
Seeking New Opportunities throughout Asia
We are optimistic regarding the long-term prospects for future economic growth in Asia’s emerging markets. Expansions of the region’s manufacturing capacity and domestic consumption, as well as infrastructure development, seem to be long-term trends that, in our analysis, have plenty of room for further improvement, especially as Asian companies are selected to manufacture components for technological innovations in other parts of the world.While global economic setbacks could spark bouts of heightened volatility in equity markets, we believe that the longer-term outlook for Asian emerging markets remains compelling. The additional catalyst for Asian markets to move higher is liquidity coming into the region.
While China and India have been the primary engines of growth in Asia thus far, we continue to seek companies in other nations in the region such as Indonesia, Thailand and South Korea that appear to offer attractively valued investment opportunities.
November 15, 2010
| Emerging Asia markets tend to be more volatile than the markets of more mature economies, and | |
| generally have less diverse and less mature economic structures and less stable political systems than | |
| those of developed countries.The securities of companies located in emerging markets are often | |
| subject to rapid and large changes in price.An investment in this fund should be considered only | |
| as a supplement to a complete investment program. | |
| Please note, the position in any security highlighted with italicized typeface was sold during the | |
| reporting period. | |
| Equity funds are subject generally to market, market sector, market liquidity, issuer and investment | |
| style risks, among other factors, to varying degrees, all of which are more fully described in the | |
| fund’s prospectus. | |
| The fund’s performance will be influenced by political, social and economic factors affecting | |
| investments in foreign companies. Special risks associated with investments in foreign companies | |
| include exposure to currency fluctuations, less liquidity, less developed or less efficient trading | |
| markets, lack of comprehensive company information, political instability and differing auditing | |
| and legal standards.These risks are enhanced in emerging market countries. | |
| 1 | Total return includes reinvestment of dividends and any capital gains paid, and does not take into |
| consideration the maximum initial sales charge in the case of Class A shares, or the applicable | |
| contingent deferred sales charge imposed on redemptions in the case of Class C shares. Had these | |
| charges been reflected, returns would have been lower. Past performance is no guarantee of future | |
| results. Share price and investment return fluctuate such that upon redemption, fund shares may be | |
| worth more or less than their original cost. Return figures provided reflect the absorption of certain | |
| fund expenses by The Dreyfus Corporation pursuant to an agreement in effect through March 1, | |
| 2012, at which time it may be extended, terminated or modified. Had these expenses not been | |
| absorbed, the fund’s returns would have been lower. | |
| 2 | SOURCE: BLOOMBERG, L.P. – Reflects reinvestment of dividends and, where applicable, |
| capital gain distributions.The MSCI Emerging Markets Asia Index is a free-float adjusted | |
| market capitalization-weighted index designed to measure equity market performance in the | |
| emerging market countries of Asia. Investors cannot invest directly in any index. |
TheFund 5
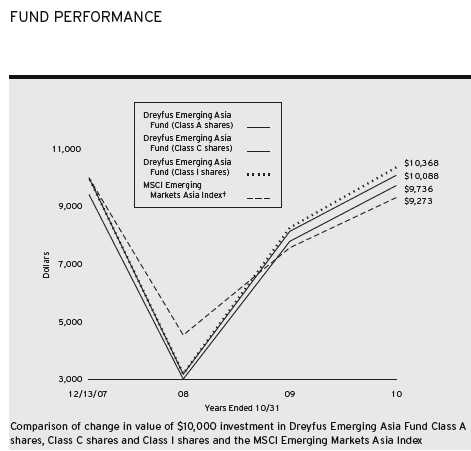
| † Source: Bloomberg L.P. |
| Past performance is not predictive of future performance. |
| The above graph compares a $10,000 investment made in Class A, Class C and Class I shares of Dreyfus Emerging |
| Asia Fund on 12/13/07 (inception date) to a $10,000 investment made in the MSCI Emerging Markets Asia Index |
| (the “Index”) on that date.All dividends and capital gain distributions are reinvested. For comparative purposes, the |
| value of the Index on 11/30/07 is used as the beginning value on 12/13/07. |
| The fund’s performance shown in the line graph takes into account the maximum initial sales charge on Class A shares |
| and all other applicable fees and expenses on all classes.The Index is a free-float adjusted market capitalization weighted |
| index designed to measure equity market performance in the emerging market countries of Asia. Unlike a mutual fund, |
| the Index is not subject to charges, fees and other expenses. Investors cannot invest directly in any index. Further |
| information relating to fund performance, including expense reimbursements, if applicable, is contained in the Financial |
| Highlights section of the prospectus and elsewhere in this report. |
6
| Average Annual Total Returns as of 10/31/10 | |||
| Inception | From | ||
| Date | 1 Year | Inception | |
| Class A shares | |||
| with maximum sales charge (5.75%) | 12/13/07 | 17.69% | –0.92% |
| without sales charge | 12/13/07 | 24.86% | 1.13% |
| Class C shares | |||
| with applicable redemption charge † | 12/13/07 | 22.87% | 0.31% |
| without redemption | 12/13/07 | 23.87% | 0.31% |
| Class I shares | 12/13/07 | 25.34% | 1.26% |
| MSCI Emerging Markets Asia Index†† | 11/30/07 | 23.00% | –2.55% |
| Past performance is not predictive of future performance.The fund’s performance shown in the graph and table does not | |
| reflect the deduction of taxes that a shareholder would pay on fund distributions or the redemption of fund shares. | |
| † | The maximum contingent deferred sales charge for Class C shares is 1% for shares redeemed within one year of the |
| date of purchase. | |
| †† | For comparative purposes, the value of the Index as of 11/30/07 is used as the beginning value on 12/13/07. |
TheFund 7
UNDERSTANDING YOUR FUND’S EXPENSES (Unaudited)
As a mutual fund investor, you pay ongoing expenses, such as management fees and other expenses. Using the information below, you can estimate how these expenses affect your investment and compare them with the expenses of other funds.You also may pay one-time transaction expenses, including sales charges (loads) and redemption fees, which are not shown in this section and would have resulted in higher total expenses. For more information, see your fund’s prospectus or talk to your financial adviser.
Review your fund’s expenses
The table below shows the expenses you would have paid on a $1,000 investment in Dreyfus Emerging Asia Fund from May 1, 2010 to October 31, 2010. It also shows how much a $1,000 investment would be worth at the close of the period, assuming actual returns and expenses.
| Expenses and Value of a $1,000 Investment | |||
| assuming actual returns for the six months ended October 31, 2010 | |||
| Class A | Class C | Class I | |
| Expenses paid per $1,000† | $ 10.11 | $ 14.00 | $ 8.58 |
| Ending value (after expenses) | $1,100.60 | $1,095.60 | $1,102.00 |
| COMPARING YOUR FUND’S EXPENSES |
| WITH THOSE OF OTHER FUNDS (Unaudited) |
Using the SEC’s method to compare expenses
The Securities and Exchange Commission (SEC) has established guidelines to help investors assess fund expenses. Per these guidelines, the table below shows your fund’s expenses based on a $1,000 investment, assuming a hypothetical 5% annualized return. You can use this information to compare the ongoing expenses (but not transaction expenses or total cost) of investing in the fund with those of other funds.All mutual fund shareholder reports will provide this information to help you make this comparison. Please note that you cannot use this information to estimate your actual ending account balance and expenses paid during the period.
| Expenses and Value of a $1,000 Investment | |||
| assuming a hypothetical 5% annualized return for the six months ended October 31, 2010 | |||
| Class A | Class C | Class I | |
| Expenses paid per $1,000† | $ 9.70 | $ 13.44 | $ 8.24 |
| Ending value (after expenses) | $1,015.58 | $1,011.85 | $1,017.04 |
† Expenses are equal to the fund’s annualized expense ratio of 1.91% for Class A, 2.65% for Class C and 1.62% for Class I, multiplied by the average account value over the period, multiplied by 184/365 (to reflect the one-half year period).
8
| STATEMENT OF INVESTMENTS |
| October 31, 2010 |
| Common Stocks—91.4% | Shares | Value ($) | |
| China—25.4% | |||
| AsiaInfo-Linkage | 159,300 | a | 3,539,646 |
| AviChina Industry & Technology, Cl. H | 3,300,000 | a | 1,783,841 |
| Beijing Capital Land, Cl. H | 4,428,000 | 1,616,673 | |
| Bengang Steel Plates, Cl. B | 5,018,024 | 2,835,536 | |
| Chongqing Machinery & Electric, Cl. H | 10,856,000 | 3,697,448 | |
| Hollysys Automation Technologies | 348,000 | a | 4,398,720 |
| Hunan Non-Ferrous Metal, Cl. H | 12,406,000 | 5,537,786 | |
| Inspur International | 54,905,000 | 4,887,528 | |
| Shanghai Friendship Group, Cl. B | 2,209,401 | b | 3,179,328 |
| Shenji Group Kunming Machine Tool, Cl. H | 3,036,000 | 1,958,394 | |
| Travelsky Technology, Cl. H | 2,893,000 | 2,788,029 | |
| Visionchina Media, ADR | 587,400 | a | 2,449,458 |
| 38,672,387 | |||
| Hong Kong—15.3% | |||
| AIA Group | 884,000 | 2,628,763 | |
| China Foods | 1,008,000 | 837,480 | |
| CIMC Enric Holdings | 6,198,000 | a | 2,838,626 |
| CST Mining Group | 40,000,000 | a | 1,186,905 |
| Intime Department Store Group | 57,000 | 87,361 | |
| Lifestyle International Holdings | 2,025,000 | 4,697,242 | |
| Samling Global | 19,006,000 | 1,520,235 | |
| Shui On Construction and Materials | 1,300,000 | 1,593,291 | |
| Sunny Optical Technology Group | 12,085,000 | 2,868,750 | |
| Zhuzhou CSR Times Electric, Cl. H | 1,650,000 | 5,034,349 | |
| 23,293,002 | |||
| India—32.2% | |||
| Balrampur Chini Mills | 2,100,000 | 3,989,645 | |
| Brushman India, GDR | 300,000 | a | 50,700 |
| Country Club India | 2,516,353 | 1,022,401 | |
| Engineers India | 570,000 | 4,425,920 | |
| Hero Honda Motors | 90,000 | 3,779,899 | |
| Hinduja Ventures | 200,000 | 2,006,078 | |
| IFCI | 3,800,000 | 5,914,913 | |
| Ispat Industries | 9,320,000 | a | 4,111,919 |
| Jai Balaji Industries | 415,000 | 2,914,108 | |
| PVP Ventures | 1,500,000 a | 401,463 | |
TheFund 9
STATEMENT OF INVESTMENTS (continued)
| Common Stocks (continued) | Shares | Value ($) | |
| India (continued) | |||
| Reliance Infrastructure | 153,418 | 3,577,048 | |
| Srei Infrastructure Finance | 2,033,190 | 6,052,659 | |
| Tata Motors | 263,000 | 6,864,049 | |
| Unitech | 1,920,000 | 3,742,758 | |
| XL Telecom & Energy | 322,700 | a | 219,371 |
| 49,072,931 | |||
| Indonesia—8.5% | |||
| Berlian Laju Tanker | 62,001,000 | a | 2,670,812 |
| Bumi Resources | 13,439,500 | 3,345,778 | |
| Lippo Karawaci | 32,000,000 a | 2,219,860 | |
| Timah | 14,826,500 | 4,727,891 | |
| 12,964,341 | |||
| Malaysia—.7% | |||
| Media Prima | 1,579,571 | 1,126,996 | |
| Singapore—2.2% | |||
| Golden Agri-Resources | 6,600,000 | 3,314,533 | |
| South Korea—2.9% | |||
| ELK | 97,800 a | 1,481,884 | |
| Iljin Display | 339,380 | a | 2,976,832 |
| 4,458,716 | |||
| Thailand—4.0% | |||
| Land & Houses, NVDR | 4,000,000 | 933,956 | |
| Land & Houses | 13,300,000 | 3,105,404 | |
| Thai Union Frozen Products | 1,100,000 | 2,109,740 | |
| 6,149,100 | |||
| Total Common Stocks | |||
| (cost $113,109,317) | 139,052,006 | ||
| Warrants—8.1% | |||
| India—4.0% | |||
| Dewan Housing Finance (10/24/12) | 304,165 | a,b,c | 2,129,100 |
| Magma Fincorp (10/24/12) | 1,650,000 | a,b,c | 2,791,363 |
| Microsec Financial Services (5/5/14) | 650,000 a | 1,192,750 | |
| 6,113,213 | |||
| Singapore—.0% | |||
| Golden Agri-Resources (7/23/12) | 81,654 | a | 8,201 |
10
| Warrants (continued) | Shares | Value ($) | |
| Sri Lanka—1.1% | |||
| John Keells Holdings (1/20/15) | 650,000 | b | 1,737,105 |
| Vietnam—3.0% | |||
| Kinh Bac City Development Share Holding (5/5/14) | 750,000 | a,b | 1,211,768 |
| Petrovietnam Drilling and Well Services (1/11/17) | 466,333 | a,b | 1,076,124 |
| Petrovietnam Fertilizer & Chemical (6/18/18) | 360,000 | a,b | 641,020 |
| Petrovietnam General Services (5/5/14) | 130,000 a,b | 116,030 | |
| Pha Lai Thermal Power (1/17/12) | 927,580 | a,b,c | 534,970 |
| Saigon Securities (1/17/12) | 514,860 | b,c | 649,062 |
| Vietnam Dairy Products (1/20/15) | 60,000 b | 266,422 | |
| 4,495,396 | |||
| Total Warrants | |||
| (cost $13,133,821) | 12,353,915 | ||
| Other Investment—1.2% | |||
| Registered Investment Company; | |||
| Dreyfus Institutional Preferred Plus Money Market Fund | |||
| (cost $1,900,000) | 1,900,000 d | 1,900,000 | |
| Total Investments (cost $128,143,138) | 100.7% | 153,305,921 | |
| Liabilities, Less Cash and Receivables | (.7%) | (1,076,137) | |
| Net Assets | 100.0% | 152,229,784 | |
| ADR—American Depository Receipts |
| GDR—Global Depository Receipts |
| NVDR—Non Voting Depository Receipts |
| a Non-income producing security. |
| b The valuation of these securities has been determined in good faith by management under the direction of the Board |
| of Directors.At October 31, 2010, the value of these securities amounted to $14,332,292 or 9.4% of net assets. |
| c Securities exempt from registration under Rule 144A of the Securities Act of 1933.These securities may be resold in |
| transactions exempt from registration, normally to qualified institutional buyers.At October 31, 2010, these securities |
| had a market value of $6,104,495 or 4.0% of net assets. |
| d Investment in affiliated money market mutual fund. |
| Portfolio Summary (Unaudited)† | |||
| Value (%) | Value (%) | ||
| Financial | 26.9 | Consumer Staples | 9.0 |
| Industrial | 20.3 | Energy | 2.9 |
| Materials | 14.6 | Utilities | 2.7 |
| Consumer Discretionary | 13.0 | Money Market Investment | 1.2 |
| Information Technology | 10.1 | 100.7 | |
| † Based on net assets. | |||
| See notes to financial statements. | |||
TheFund 11
| STATEMENT OF ASSETS AND LIABILITIES |
| October 31, 2010 |
| Cost | Value | ||
| Assets ($): | |||
| Investments in securities—See Statement of Investments: | |||
| Unaffiliated issuers | 126,243,138 | 151,405,921 | |
| Affiliated issuers | 1,900,000 | 1,900,000 | |
| Cash denominated in foreign currencies | 217,113 | 216,959 | |
| Receivable for investment securities sold | 2,183,250 | ||
| Receivable for shares of Common Stock subscribed | 481,675 | ||
| Dividends and interest receivable | 53,928 | ||
| Unrealized appreciation on forward foreign | |||
| currency exchange contracts—Note 4 | 226 | ||
| Prepaid expenses | 23,233 | ||
| 156,265,192 | |||
| Liabilities ($): | |||
| Due to The Dreyfus Corporation and affiliates—Note 3(c) | 268,117 | ||
| Cash overdraft due to Custodian | 1,775,699 | ||
| Payable for investment securities purchased | 1,820,748 | ||
| Payable for shares of Common Stock redeemed | 96,923 | ||
| Interest payable—Note 2 | 301 | ||
| Accrued expenses | 73,620 | ||
| 4,035,408 | |||
| Net Assets ($) | 152,229,784 | ||
| Composition of Net Assets ($): | |||
| Paid-in capital | 128,814,085 | ||
| Accumulated investment (loss)—net | (632,544) | ||
| Accumulated net realized gain (loss) on investments | (1,114,468) | ||
| Accumulated net unrealized appreciation (depreciation) | |||
| on investments and foreign currency transactions | 25,162,711 | ||
| Net Assets ($) | 152,229,784 | ||
| Net Asset Value Per Share | |||
| Class A | Class C | Class I | |
| Net Assets ($) | 81,708,621 | 32,165,529 | 38,355,634 |
| Shares Outstanding | 6,331,952 | 2,551,100 | 2,960,044 |
| Net Asset Value Per Share ($) | 12.90 | 12.61 | 12.96 |
| See notes to financial statements. | |||
12
| STATEMENT OF OPERATIONS |
| Year Ended October 31, 2010 |
| Investment Income ($): | |
| Income: | |
| Cash dividends (net of $63,720 foreign taxes withheld at source): | |
| Unaffiliated issuers | 2,264,239 |
| Affiliated issuers | 1,707 |
| Total Income | 2,265,946 |
| Expenses: | |
| Management fee—Note 3(a) | 1,568,392 |
| Shareholder servicing costs—Note 3(c) | 410,396 |
| Custodian fees—Note 3(c) | 331,084 |
| Distribution fees—Note 3(b) | 186,654 |
| Registration fees | 49,257 |
| Professional fees | 47,611 |
| Prospectus and shareholders’ reports | 22,691 |
| Directors’ fees and expenses—Note 3(d) | 12,638 |
| Interest expense—Note 2 | 2,941 |
| Loan commitment fees—Note 2 | 24 |
| Miscellaneous | 17,969 |
| Total Expenses | 2,649,657 |
| Less—reduction in management fee due to undertaking—Note 3(a) | (103,528) |
| Less—reduction in fees due to earnings credits—Note 3(c) | (371) |
| Net Expenses | 2,545,758 |
| Investment (Loss)—Net | (279,812) |
| Realized and Unrealized Gain (Loss) on Investments—Note 4 ($): | |
| Net realized gain (loss) on investments and foreign currency transactions | 5,746,825 |
| Net realized gain (loss) on forward foreign currency exchange contracts | (664,119) |
| Net Realized Gain (Loss) | 5,082,706 |
| Net unrealized appreciation (depreciation) on | |
| investments and foreign currency transactions | 20,222,827 |
| Net unrealized appreciation (depreciation) on | |
| forward foreign currency exchange contracts | 273 |
| Net Unrealized Appreciation (Depreciation) | 20,223,100 |
| Net Realized and Unrealized Gain (Loss) on Investments | 25,305,806 |
| Net Increase in Net Assets Resulting from Operations | 25,025,994 |
| See notes to financial statements. | |
TheFund 13
STATEMENT OF CHANGES IN NET ASSETS
| Year Ended October 31, | ||
| 2010 | 2009a | |
| Operations ($): | ||
| Investment (loss)—net | (279,812) | (129,867) |
| Net realized gain (loss) on investments | 5,082,706 | 82,614 |
| Net unrealized appreciation | ||
| (depreciation) on investments | 20,223,100 | 14,943,796 |
| Net Increase (Decrease) in Net Assets | ||
| Resulting from Operations | 25,025,994 | 14,896,543 |
| Capital Stock Transactions ($): | ||
| Net proceeds from shares sold: | ||
| Class A Shares | 59,099,369 | 54,272,347 |
| Class C Shares | 21,383,548 | 11,744,108 |
| Class I Shares | 47,012,937 | 19,128,160 |
| Cost of shares redeemed: | ||
| Class A Shares | (49,892,436) | (11,564,659) |
| Class C Shares | (9,366,948) | (2,785,046) |
| Class I Shares | (32,228,061) | (2,355,869) |
| Class T Shares | — | (20,240) |
| Increase (Decrease) in Net Assets | ||
| from Capital Stock Transactions | 36,008,409 | 68,418,801 |
| Total Increase (Decrease) in Net Assets | 61,034,403 | 83,315,344 |
| Net Assets ($): | ||
| Beginning of Period | 91,195,381 | 7,880,037 |
| End of Period | 152,229,784 | 91,195,381 |
| Accumulated investment (loss)—net | (632,544) | (121,969) |
14
| Year Ended October 31, | ||
| 2010 | 2009a | |
| Capital Share Transactions: | ||
| Class Ab | ||
| Shares sold | 5,194,238 | 5,714,210 |
| Shares redeemed | (4,525,022) | (1,431,148) |
| Net Increase (Decrease) in Shares Outstanding | 669,216 | 4,283,062 |
| Class C | ||
| Shares sold | 1,926,771 | 1,282,490 |
| Shares redeemed | (857,793) | (361,850) |
| Net Increase (Decrease) in Shares Outstanding | 1,068,978 | 920,640 |
| Class I | ||
| Shares sold | 4,128,721 | 1,903,826 |
| Shares redeemed | (2,866,275) | (231,303) |
| Net Increase (Decrease) in Shares Outstanding | 1,262,446 | 1,672,523 |
| Class Tb | ||
| Shares redeemed | — | (4,600) |
| a | Effective as of the close of business on February 4, 2009, the fund no longer offers Class T shares. |
| b | On the close of business on February 4, 2009, 4,598 Class T shares representing $20,230 were converted to 4,526 |
| Class A shares. | |
| See notes to financial statements. | |
TheFund 15
FINANCIAL HIGHLIGHTS
The following tables describe the performance for each share class for the fiscal periods indicated.All information (except portfolio turnover rate) reflects financial results for a single fund share.Total return shows how much your investment in the fund would have increased (or decreased) during each period, assuming you had reinvested all dividends and distributions.These figures have been derived from the fund’s financial statements.
| Year Ended October 31, | |||
| Class A Shares | 2010 | 2009 | 2008a |
| Per Share Data ($): | |||
| Net asset value, beginning of period | 10.34 | 4.01 | 12.50 |
| Investment Operations: | |||
| Investment income (loss)—netb | (.02) | (.02) | .08 |
| Net realized and unrealized | |||
| gain (loss) on investments | 2.57 | 6.33 | (8.57) |
| Total from Investment Operations | 2.55 | 6.31 | (8.49) |
| Proceeds from redemption fees | .01 | .02 | — |
| Net asset value, end of period | 12.90 | 10.34 | 4.01 |
| Total Return (%)c | 24.86 | 158.50 | (68.00)d |
| Ratios/Supplemental Data (%): | |||
| Ratio of total expenses to average net assets | 2.05 | 2.80 | 3.31e |
| Ratio of net expenses to average net assets | 1.95 | 2.00 | 2.00e |
| Ratio of net investment income | |||
| (loss) to average net assets | (.17) | (.29) | 1.03e |
| Portfolio Turnover Rate | 75.72 | 100.74 | 217.53d |
| Net Assets, end of period ($ x 1,000) | 81,709 | 58,548 | 5,528 |
| a | From December 13, 2007 (commencement of operations) to October 31, 2008. |
| b | Based on average shares outstanding at each month end. |
| c | Exclusive of sales charge. |
| d | Not annualized. |
| e | Annualized. |
| See notes to financial statements. | |
16
| Year Ended October 31, | |||
| Class C Shares | 2010 | 2009 | 2008a |
| Per Share Data ($): | |||
| Net asset value, beginning of period | 10.18 | 3.98 | 12.50 |
| Investment Operations: | |||
| Investment income (loss)—netb | (.09) | (.08) | .02 |
| Net realized and unrealized | |||
| gain (loss) on investments | 2.51 | 6.27 | (8.54) |
| Total from Investment Operations | 2.42 | 6.19 | (8.52) |
| Proceeds from redemption fees | .01 | .01 | — |
| Net asset value, end of period | 12.61 | 10.18 | 3.98 |
| Total Return (%)c | 23.87 | 155.78 | (68.16)d |
| Ratios/Supplemental Data (%): | |||
| Ratio of total expenses to average net assets | 2.77 | 3.71 | 4.08e |
| Ratio of net expenses to average net assets | 2.70 | 2.75 | 2.75e |
| Ratio of net investment income | |||
| (loss) to average net assets | (.83) | (.98) | .31e |
| Portfolio Turnover Rate | 75.72 | 100.74 | 217.53d |
| Net Assets, end of period ($ x 1,000) | 32,166 | 15,090 | 2,233 |
| a | From December 13, 2007 (commencement of operations) to October 31, 2008. |
| b | Based on average shares outstanding at each month end. |
| c | Exclusive of sales charge. |
| d | Not annualized. |
| e | Annualized. |
| See notes to financial statements. | |
TheFund 17
FINANCIAL HIGHLIGHTS (continued)
| Year Ended October 31, | |||
| Class I Shares | 2010 | 2009 | 2008a |
| Per Share Data ($): | |||
| Net asset value, beginning of period | 10.34 | 4.00 | 12.50 |
| Investment Operations: | |||
| Investment income (loss)—netb | .01 | (.03) | .02 |
| Net realized and unrealized | |||
| gain (loss) on investments | 2.60 | 6.35 | (8.52) |
| Total from Investment Operations | 2.61 | 6.32 | (8.50) |
| Proceeds from redemption fees | .01 | .02 | — |
| Net asset value, end of period | 12.96 | 10.34 | 4.00 |
| Total Return (%) | 25.34 | 158.50 | (68.00)c |
| Ratios/Supplemental Data (%): | |||
| Ratio of total expenses to average net assets | 1.74 | 2.05 | 2.86d |
| Ratio of net expenses to average net assets | 1.69 | 1.75 | 1.75d |
| Ratio of net investment income | |||
| (loss) to average net assets | .13 | (.31) | .29d |
| Portfolio Turnover Rate | 75.72 | 100.74 | 217.53c |
| Net Assets, end of period ($ x 1,000) | 38,356 | 17,558 | 100 |
| a | From December 13, 2007 (commencement of operations) to October 31, 2008. |
| b | Based on average shares outstanding at each month end. |
| c | Not annualized. |
| d | Annualized. |
| See notes to financial statements. | |
18
NOTES TO FINANCIAL STATEMENTS
NOTE 1—Significant Accounting Policies:
Dreyfus Emerging Asia Fund (the “fund”) is a separate non-diversified series of Dreyfus Premier Investment Funds, Inc. (the “Company”), which is registered under the Investment Company Act of 1940, as amended (the “Act”), as an open-end management investment company and operates as a series company currently offering ten series, including the fund. The fund’s investment objective is to seek long-term capital appreciation. The Dreyfus Corporation (the “Manager” or “Dreyfus”), a wholly-owned subsidiary of The Bank of New York Mellon Corporation (“BNY Mellon”), serves as the fund’s investment adviser. Hamon U.S. Investment Advisors Limited (“Hamon”) serves as the fund’s sub-investment adviser. Hamon is an affiliate of Dreyfus.
MBSC Securities Corporation (the “Distributor”), a wholly-owned subsidiary of Dreyfus, is the distributor of the fund’s shares.The fund is authorized to issue 800 million shares of $.001 par value Common Stock.The fund currently offers three classes of shares: Class A (300 million shares authorized), Class C (250 million shares authorized), and Class I (250 million shares authorized). Class A shares are subject to a sales charge imposed at the time of purchase. Class C shares are subject to a contingent deferred sales charge (“CDSC”) imposed on Class C shares redeemed within one year of purchase. Class I shares are sold at net asset value per share only to institutional investors. Other differences between the classes include the services offered to and the expenses borne by each class, the allocation of certain transfer agency costs and certain voting rights. Income, expenses (other than expenses attributable to a specific class) and realized and unrealized gains or losses on investments are allocated to each class of shares based on its relative net assets.
The Company accounts separately for the assets, liabilities and operations of each series. Expenses directly attributable to each series are charged to that series’ operations; expenses which are applicable to all series are allocated among them on a pro rata basis.
The Financial Accounting Standards Board (“FASB”) Accounting Standards Codification (“ASC”) is the exclusive reference of authorita-
TheFund 19
NOTES TO FINANCIAL STATEMENTS (continued)
tive U.S. generally accepted accounting principles (“GAAP”) recognized by the FASB to be applied by nongovernmental entities. Rules and interpretive releases of the Securities and Exchange Commission (“SEC”) under authority of federal laws are also sources of authoritative GAAP for SEC registrants. The fund’s financial statements are prepared in accordance with GAAP, which may require the use of management estimates and assumptions.Actual results could differ from those estimates.
The Company enters into contracts that contain a variety of indemnifications.The fund’s maximum exposure under these arrangements is unknown.The fund does not anticipate recognizing any loss related to these arrangements.
(a) Portfolio valuation: Investments in securities are valued at the last sales price on the securities exchange or national securities market on which such securities are primarily traded. Securities listed on the National Market System for which market quotations are available, are valued at the official closing price or, if there is no official closing price that day, at the last sales price. Securities not listed on an exchange or the national securities market, or securities for which there were no transactions, are valued at the average of the most recent bid and asked prices, except for open short positions, where the asked price is used for valuation purposes. Bid price is used when no asked price is available. U.S. Treasury Bills are valued by an independent pricing service approved by the Board of Directors. Regist ered investment companies that are not traded on an exchange are valued at their net asset value.When market quotations or official closing prices are not readily available, or are determined not to reflect accurately fair value, such as when the value of a security has been significantly affected by events after the close of the exchange or market on which the security is principally traded (for example, a foreign exchange or market),but before the fund calculates its net asset value, the fund may value these investments at fair value as determined in accordance with the procedures approved by the Board of Directors. Fair valuing of securities may be determined with the assistance of a pricing service using calculations based on indices of domestic securities and other appropriate indicators, such as prices of relevant
20
ADR’s and futures contracts. For other securities that are fair valued by the Board of Directors, certain factors may be considered such as: fundamental analytical data, the nature and duration of restrictions on disposition, an evaluation of the forces that influence the market in which the securities are purchased and sold, and public trading in similar securities of the issuer or comparable issuers. Investments denominated in foreign currencies are translated to U.S. dollars at the prevailing rates of exchange. Forward foreign currency exchange contracts (“forward contracts”) are valued at the forward rate.
The fair value of a financial instrument is the amount that would be received to sell an asset or paid to transfer a liability in an orderly transaction between market participants at the measurement date (i.e. the exit price). GAAP establishes a fair value hierarchy that prioritizes the inputs of valuation techniques used to measure fair value.This hierarchy gives the highest priority to unadjusted quoted prices in active markets for identical assets or liabilities (Level 1 measurements) and the lowest priority to unobservable inputs (Level 3 measurements).
Additionally, GAAP provides guidance on determining whether the volume and activity in a market has decreased significantly and whether such a decrease in activity results in transactions that are not orderly. GAAP requires enhanced disclosures around valuation inputs and techniques used during annual and interim periods.
Various inputs are used in determining the value of the fund’s investments relating to fair value measurements.These inputs are summarized in the three broad levels listed below:
Level 1—unadjusted quoted prices in active markets for identical investments.
Level 2—other significant observable inputs (including quoted prices for similar investments, interest rates, prepayment speeds, credit risk, etc.).
Level 3—significant unobservable inputs (including the fund’s own assumptions in determining the fair value of investments).
TheFund 21
NOTES TO FINANCIAL STATEMENTS (continued)
The inputs or methodology used for valuing securities are not necessarily an indication of the risk associated with investing in those securities.
The following is a summary of the inputs used as of October 31, 2010 in valuing the fund’s investments:
| Level 2—Other | Level 3— | |||
| Level 1— | Significant | Significant | ||
| Unadjusted | Observable | Unobservable | ||
| Quoted Prices | Inputs | Inputs | Total | |
| Assets ($) | ||||
| Investments in Securities: | ||||
| Equity Securities— | ||||
| Foreign† | 135,872,678 | — | 3,179,328 | 139,052,006 |
| Mutual Funds | 1,900,000 | — | — | 1,900,000 |
| Warrants† | 1,200,951 | 11,152,964 | — | 12,353,915 |
| Other Financial | ||||
| Instruments: | ||||
| Forward Foreign | ||||
| Currency Exchange | ||||
| Contracts†† | — | 226 | — | 226 |
| † | See Statement of Investments for country and industry classification. |
| †† | Amount shown represents unrealized appreciation at period end. |
The following is a reconciliation of Level 3 assets for which significant unobservable inputs were used to determine fair value:
| Equity Securities—Foreign ($) | |
| Balance as of 10/31/2009 | — |
| Realized gain (loss) | — |
| Change in unrealized appreciation (depreciation) | — |
| Net purchases (sales) | — |
| Transfers in and/or out of Level 3 | 3,179,328 |
| Balance as of 10/31/2010 | 3,179,328 |
| The amount of total gains (losses) for the | |
| period included in earnings attributable | |
| to the change in unrealized gains (losses) | |
| related to investments still held at 10/31/2010 | 747,239 |
In January 2010, FASB issued Accounting Standards Update (“ASU”) No. 2010-06 “Improving Disclosures about FairValue Measurements”. The portions of ASU No. 2010-06 which require reporting entities to
22
prepare new disclosures surrounding amounts and reasons for significant transfers in and out of Level 1 and Level 2 fair value measurements as well as inputs and valuation techniques used to measure fair value for both recurring and nonrecurring fair value measurements that fall in either Level 2 or Level 3 have been adopted by the fund. No significant transfers between Level 1 or Level 2 fair value measurements occurred at October 31, 2010. The remaining portion of ASU No. 2010-06 requires reporting entities to make new disclosures about information on purchases, sales, issuances and settlements on a gross basis in the reconciliation of activity in Level 3 fair value measurements. These new and revised disclosures are required to be implemented for fiscal years beginning after December 15, 2010. Management is currently evaluating the impact that the adoption of this remaining portion of ASU No. 2010-06 may have o n the fund’s financial statement disclosures.
(b) Foreign currency transactions: The fund does not isolate that portion of the results of operations resulting from changes in foreign exchange rates on investments from the fluctuations arising from changes in market prices of securities held. Such fluctuations are included with the net realized and unrealized gain or loss on investments.
Net realized foreign exchange gains or losses arise from sales of foreign currencies, currency gains or losses realized on securities transactions between trade and settlement date and the difference between the amounts of dividends, interest and foreign withholding taxes recorded on the fund’s books and the U.S. dollar equivalent of the amounts actually received or paid. Net unrealized foreign exchange gains and losses arise from changes in the value of assets and liabilities other than investments resulting from changes in exchange rates. Foreign currency gains and losses on investments are included with net realized and unrealized gain or loss on investments.
(c) Securities transactions and investment income: Securities transactions are recorded on a trade date basis. Realized gains and losses from securities transactions are recorded on the identified cost basis.
TheFund 23
NOTES TO FINANCIAL STATEMENTS (continued)
Dividend income is recognized on the ex-dividend date and interest income, including, where applicable, accretion of discount and amortization of premium on investments, is recognized on the accrual basis.
The fund follows an investment policy of investing primarily in emerging markets of Asia. Economic changes in the continent of Asia or other aspects that effect valuation of securities may have a greater effect on the fund’s net asset value than other funds that do not have similar investment objectives.
Investing in foreign markets may involve special risks and considerations not typically associated with investing in the U.S. These risks include revaluation of currencies, high rates of inflation, repatriation restrictions on income and capital, and adverse political and economic developments. Moreover, securities issued in these markets may be less liquid, subject to government ownership controls and delayed settlements, and their prices may be more volatile than those of comparable securities in the U.S.
(d) Affiliated issuers: Investments in other investment companies advised by Dreyfus are defined as “affiliated” in the Act.
The fund may invest in shares of certain affiliated investment companies also advised or managed by Dreyfus. Investments in affiliated investment companies for the period ended October 31, 2010 were as follows:
| Affiliated | |||||
| Investment | Value | Value | Net | ||
| Company | 10/31/2009 ($) | Purchases ($) | Sales ($) | 10/31/2010 ($) | Assets (%) |
| Dreyfus | |||||
| Institutional | |||||
| Preferred | |||||
| Plus Money | |||||
| Market Fund | — | 74,972,000 | 73,072,000 | 1,900,000 | 1.2 |
(e) Dividends to shareholders: Dividends are recorded on the ex-dividend date. Dividends from investment income-net and dividends from net realized capital gains, if any, are normally declared and paid annually, but the fund may make distributions on a more frequent basis to comply with the distribution requirements of the Internal Revenue Code of 1986, as amended (the “Code”).To the extent that net realized capital
24
gains can be offset by capital loss carryovers, it is the policy of the fund not to distribute such gains. Income and capital gain distributions are determined in accordance with income tax regulations, which may differ from GAAP.
(f) Federal income taxes: It is the policy of the fund to continue to qualify as a regulated investment company, if such qualification is in the best interests of its shareholders, by complying with the applicable provisions of the Code, and to make distributions of taxable income sufficient to relieve it from substantially all federal income and excise taxes.
As of and during the period ended October 31, 2010, the fund did not have any liabilities for any uncertain tax positions.The fund recognizes interest and penalties, if any, related to uncertain tax positions as income tax expense in the Statement of Operations. During the period, the fund did not incur any interest or penalties.
Each of the tax years in the three-year period ended October 31, 2010 remains subject to examination by the Internal Revenue Service and state taxing authorities.
At October 31, 2010, the components of accumulated earnings on a tax basis were as follows: accumulated capital losses $938,643 and unrealized appreciation $24,354,342.
The accumulated capital loss carryover is available for federal income tax purposes to be applied against future net securities profits, if any, realized subsequent to October 31, 2010. If not applied, the carryover expires in fiscal 2016.
During the period ended October 31, 2010, as a result of permanent book to tax differences, primarily due to the tax treatment for foreign currency gains and losses and net operating losses, the fund decreased accumulated undistributed investment income-net by $230,763, increased accumulated net realized gain (loss) on investments by $710,794 and decreased paid-in capital by $480,031. Net assets and net asset value per share were not affected by this reclassification.
TheFund 25
NOTES TO FINANCIAL STATEMENTS (continued)
NOTE 2—Bank Lines of Credit:
The fund participates with other Dreyfus-managed funds in a $225 million unsecured credit facility led by Citibank, N.A. and a $300 million unsecured credit facility provided by The Bank of NewYork Mellon, a subsidiary of BNY Mellon and an affiliate of Dreyfus (each, a “Facility”), each to be utilized primarily for temporary or emergency purposes, including the financing of redemptions. In connection therewith, the fund has agreed to pay its pro rata portion of commitment fees for each Facility. Interest is charged to the fund based on rates determined pursuant to the terms of the respective Facility at the time of borrowing.
The average amount of borrowings outstanding under the Facilities during the period ended October 31, 2010, was approximately $205,800, with a related weighted average annualized interest rate of 1.43%.
NOTE 3—Management Fee, Sub-Investment Advisory Fee and Other Transactions with Affiliates:
(a) Pursuant to a management agreement with Dreyfus, the management fee is computed at the annual rate of 1.25% of the value of the fund’s average daily net assets and is payable monthly.
Dreyfus has contractually agreed to waive receipt of its fees and/or assume the expenses of the fund, until March 1, 2012, so that the direct expenses of none of the classes (excluding Rule 12b-1 distribution plan fees, shareholder services fees, taxes, interest, brokerage commissions, commitment fees on borrowings and extraordinary expenses) exceed 1.75% of the value of the fund’s average daily net assets.The reduction in management fee, pursuant to the undertaking, amounted to $103,528 during the period ended October 31 2010.
Pursuant to a sub-investment advisory agreement between Dreyfus and Hamon, Dreyfus pays Hamon a fee at the annual rate of .625% of the value of the fund’s average daily net assets and is payable monthly.
During the period ended October 31, 2010, the Distributor retained $90,604 from commissions earned on sales of the fund’s Class A shares and $36,573 from CDSCs on redemptions of the fund’s Class C shares.
26
(b) Under the Distribution Plan (the “Plan”) adopted pursuant to Rule 12b-1 under the Act, Class C shares pay the Distributor for distributing its shares at an annual rate of .75% of the value of the average daily net assets of Class C shares. During the period ended October 31, 2010, Class C shares were charged $186,654 pursuant to the Plan.
(c) Under the Shareholder Services Plan, Class A and Class C shares pay the Distributor at an annual rate of .25% of the value of their average daily net assets for the provision of certain services.The services provided may include personal services relating to shareholder accounts, such as answering shareholder inquiries regarding the fund and providing reports and other information, and services related to the maintenance of shareholder accounts.The Distributor may make payments to Service Agents (a securities dealer, financial institution or other industry professional) in respect of these services.The Distributor determines the amounts to be paid to Service Agents. During the period ended October 31, 2010, Class A and Class C shares were charged $167,326 and $62,218, respectively, pursuant to the Shareholder Services Pl an.
The fund compensates Dreyfus Transfer, Inc., a wholly-owned subsidiary of Dreyfus, under a transfer agency agreement for providing personnel and facilities to perform transfer agency services for the fund. During the period ended October 31, 2010, the fund was charged $49,449 pursuant to the transfer agency agreement, which is included in Shareholder servicing costs in the Statement of Operations.
The fund has arrangements with the custodian and cash management bank whereby the fund may receive earnings credits when positive cash balances are maintained, which are used to offset custody and cash management fees. For financial reporting purposes, the fund includes net earnings credits as an expense offset in the Statement of Operations.
The fund compensates The Bank of New York Mellon under a cash management agreement for performing cash management services related to fund subscriptions and redemptions. During the period ended October 31, 2010, the fund was charged $6,187 pursuant to the
TheFund 27
NOTES TO FINANCIAL STATEMENTS (continued)
cash management agreement, which is included in Shareholder servicing costs in the Statement of Operations.These fees were partially offset by earnings credits of $371.
The fund also compensates The Bank of New York Mellon under a custody agreement for providing custodial services for the fund. During the period ended October 31, 2010, the fund was charged $331,084 pursuant to the custody agreement.
During the period ended October 31, 2010, the fund was charged $6,114 for services performed by the Chief Compliance Officer.
The components of “Due to The Dreyfus Corporation and affiliates” in the Statement of Assets and Liabilities consist of: management fees $160,175, Rule 12b-1 distribution plan fees $20,240, shareholder services plan fees $23,855, custodian fees $84,024, chief compliance officer fees $2,248 and transfer agency per account fees $6,850, which are offset against an expense reimbursement currently in effect in the amount of $29,275.
(d) Each Board member also serves as a Board member of other funds within the Dreyfus complex. Annual retainer fees and attendance fees are allocated to each fund based on net assets.
(e) A 2% redemption fee is charged and retained by the fund on certain shares redeemed within sixty days following the date of issuance subject to exceptions, including redemptions made through use of the fund’s exchange privilege. During the period ended October 31, 2010, redemption fees charged and retained by the fund amounted to $118,846.
NOTE 4—Securities Transactions:
The aggregate amount of purchases and sales of investment securities, excluding short-term securities and forward contracts, during the period ended October 31, 2010, amounted to $128,077,185 and $92,545,069, respectively.
28
The provisions of ASC Topic 815 “Derivatives and Hedging” require qualitative disclosures about objectives and strategies for using derivatives, quantitative disclosures about fair value amounts of gains and losses on derivative instruments and disclosures about credit-risk-related contingent features in derivative agreements. The disclosure requirements distinguish between derivatives, which are accounted for as “hedges” and those that do not qualify for hedge accounting. Because investment companies value their derivatives at fair value and recognize changes in fair value through the Statement of Operations, they do not qualify for such accounting. Accordingly, even though a fund’s investments in derivatives may represent economic hedges, they are considered to be non-hedge transactions for purposes of this disclosure.
Forward Foreign Currency Exchange Contracts: The fund enters into forward contracts in order to hedge its exposure to changes in foreign currency exchange rates on its foreign portfolio holdings, to settle foreign currency transactions or as a part of its investment strategy. When executing forward contracts, the fund is obligated to buy or sell a foreign currency at a specified rate on a certain date in the future. With respect to sales of forward contracts, the fund incurs a loss if the value of the contract increases between the date the forward contract is opened and the date the forward contract is closed.The fund realizes a gain if the value of the contract decreases between those dates.With respect to purchases of forward contracts, the fund incurs a loss if the value of the contract decreases between the date the for ward contract is opened and the date the forward contract is closed.The fund realizes a gain if the value of the contract increases between those dates. Any realized gain or loss which occurred during the period is reflected in the Statement of Operations.The fund is exposed to foreign currency risk as a result of changes in value of underlying financial instruments. The fund is also exposed to credit risk associated with counterparty
TheFund 29
NOTES TO FINANCIAL STATEMENTS (continued)
nonperformance on these forward contracts, which is typically limited to the unrealized gain on each open contract.The following summarizes open forward contracts at October 31, 2010:
| Foreign | ||||
| Forward Foreign Currency | Currency | Unrealized | ||
| Exchange Contracts | Amounts | Cost ($) | Value ($) | Appreciation ($) |
| Purchases; | ||||
| Hong Kong Dollar, | ||||
| Expiring 11/1/2010 | 3,200,000 | 412,610 | 412,836 | 226 |
At October 31, 2010, the cost of investments for federal income tax purposes was $128,951,507; accordingly, accumulated net unrealized appreciation on investments was $24,354,414, consisting of $35,243,610 gross unrealized appreciation and $10,889,196 gross unrealized depreciation.
30
| REPORT OF INDEPENDENT REGISTERED |
| PUBLIC ACCOUNTING FIRM |
Shareholders and Board of Directors
Dreyfus Emerging Asia Fund
We have audited the accompanying statement of assets and liabilities, including the statement of investments, of Dreyfus Emerging Asia Fund (one of the series comprising Dreyfus Premier Investment Funds, Inc.) as of October 31, 2010, and the related statement of operations for the year then ended, the statement of changes in net assets for each of the two years in the period then ended and financial highlights for each of the periods indicated therein. These financial statements and financial highlights are the responsibility of the Fund’s management. Our responsibility is to express an opinion on these financial statements and financial highlights based on our audits.
We conducted our audits in accordance with the standards of the Public Company Accounting Oversight Board (United States).Those standards require that we plan and perform the audit to obtain reasonable assurance about whether the financial statements and financial highlights are free of material misstatement.We were not engaged to perform an audit of the Fund’s internal control over financial reporting. Our audits included consideration of internal control over financial reporting as a basis for designing audit procedures that are appropriate in the circumstances, but not for the purpose of expressing an opinion on the effectiveness of the Fund’s internal control over financial reporting. Accordingly, we express no such opinion. An audit also includes examining, on a test basis, evidence supporting the amounts and disclosures in the financial statements and financial highlights, assessing the accounting principles used and significant estimates made by management, and evaluating the overall financial statement presentation. Our procedures included confirmation of securities owned as of October 31, 2010 by correspondence with the custodian and others.We believe that our audits provide a reasonable basis for our opinion.
In our opinion, the financial statements and financial highlights referred to above present fairly, in all material respects, the financial position of Dreyfus Emerging Asia Fund at October 31, 2010, the results of its operations for the year then ended, the changes in its net assets for each of the two years in the period then ended and the financial highlights for each of the indicated periods, in conformity with U.S. generally accepted accounting principles.

New York, New York
December 28, 2010
TheFund 31
IMPORTANT TAX INFORMATION (Unaudited)
In accordance with federal tax law, the fund elects to provide each shareholder with their portion of the fund’s foreign taxes paid and the income sourced from foreign countries. Accordingly, the fund hereby makes the following designations regarding its fiscal year ended October 31, 2010:
—the total amount of taxes paid to foreign countries was $63,720
—the total amount of income sourced from foreign countries was $2,338,160.
Where required by federal tax law rules, shareholders will receive notification of their proportionate share of foreign taxes paid and foreign sourced income for the 2010 calendar year with Form 1099-DIV which will be mailed in early 2011.
32
| INFORMATION ABOUT THE REVIEW AND APPROVAL |
| OF THE FUND’S MANAGEMENT AGREEMENT (Unaudited) |
At a meeting of the fund’s Board held on July 13, 2010, the Board considered the re-approval of the fund’s Management Agreement with Dreyfus and the Sub-Investment Advisory Agreement between Dreyfus and Hamon U.S. Investment Advisors Limited (“Hamon”) (together, the “Agreements”) for a one-year term ending July 31, 2011.The Board members, none of whom are “interested persons” (as defined in the Investment Company Act of 1940, as amended) of the fund, were assisted in their review by independent legal counsel and met with counsel in executive session separate from representatives of Dreyfus. In considering the re-approval of the Agreements, the Board considered all factors that it believed to be relevant, including, among other things, the factors discussed below.
Analysis of Nature, Extent and Quality of Services Provided to the Fund.The Board members received a presentation from representatives of Dreyfus regarding services provided to the fund and other funds in the Dreyfus fund complex, and discussed the nature, extent and quality of the services provided to the fund pursuant to the Agreements. Dreyfus’ representatives reviewed the fund’s distribution of accounts and the relationships Dreyfus has with various intermediaries and the different needs of each. Dreyfus’ representatives noted the various distribution channels for the fund as well as the diverse methods of distribution among other funds in the Dreyfus fund complex, and Dreyfus’ corresponding need for broad, deep, and diverse resources to be able to provide ongoing shareholder services to each distribution chan nel, including those of the fund. Dreyfus also provided the number of accounts investing in the fund, as well as the fund’s asset size.
The Board members considered Dreyfus’ and Hamon’s research and portfolio management capabilities. The Board members also considered that Dreyfus provides oversight of day-to-day fund operations, including fund accounting, administration and assistance in meeting legal and regulatory requirements.The Board members also considered Dreyfus’ extensive administrative, accounting and compliance infrastructure, as well as Dreyfus’ supervisory activities over Hamon. The
TheFund 33
| INFORMATION ABOUT THE REVIEW AND APPROVAL OF THE |
| FUND’S MANAGEMENT AGREEMENT (Unaudited) (continued) |
Board also considered Hamon’s brokerage policies and practices, the standards applied in seeking best execution and Hamon’s policies and practices regarding soft dollars.
Comparative Analysis of the Fund’s Performance and Management Fee and Expense Ratio. The Board members reviewed the fund’s performance for the one-year period ended May 31, 2010, and compared the fund’s performance to the performance of a group of comparable retail front-end load Pacific ex-Japan funds (the “Performance Group”) and to a larger universe of funds consisting of all retail and institutional Pacific ex-Japan funds (the “Performance Universe”), selected and provided by Lipper, Inc., an independent provider of investment company data. The Board was provided with a description of the methodology Lipper used to select the Performance Group and Performance Universe, as well as the Expense Group and Expense Universe (discussed below).The Board members discussed the results of the comparisons a nd noted that the fund’s total return performance for the one-year period ended May 31, 2010 was below the Performance Group and Performance Universe medians (in the fourth quartile) and the fund’s total return performance for the two-year period ended May 31, 2010 was above the Performance Group and Performance Universe medians (in the first quartile). Dreyfus also provided a comparison of the fund’s calendar year total returns to the returns of the fund’s benchmark index.
The Board members also discussed the fund’s management fee and expense ratio and reviewed the range of actual and contractual management fees and total expense ratios of a group of comparable funds (the “Expense Group”) and a broader group of funds (the “Expense Universe”), each selected and provided by Lipper. The Board noted that Dreyfus has contractually agreed, until March 1, 2011, to waive receipt of its fees and/or assume the expenses of the fund so that the direct expenses of none of the classes (excluding Rule 12b-1 fees, shareholder services fees, taxes, interest, brokerage commissions, commitment fees on borrowings and extraordinary expenses) exceed 1.75% of the value of the fund’s average daily net assets. The Board
34
members noted that the fund’s actual management fee (after waivers) was lower than the Expense Group and Expense Universe medians, the fund’s contractual management fee was higher than the Expense Group median and the fund’s total expense ratio was higher than the Expense Group and Expense Universe medians.
Representatives of Dreyfus noted that there were no other mutual funds managed by Dreyfus, Hamon or their affiliates with similar investment objectives, policies and strategies, and reviewed with the Board other accounts managed by Dreyfus, Hamon or their affiliates with similar investment objectives, policies and strategies as the fund (the “Similar Accounts”). Dreyfus’ representatives explained the nature of the Similar Accounts and the differences, from Dreyfus’ and Hamon’s perspective, as applicable, in providing services to such Similar Accounts as compared to managing and providing services to the fund. The Board members considered the relevance of the fee information provided for the Similar Accounts to evaluate the appropriateness and reasonableness of the fund’s management fee.
The Board considered the fee to Hamon in relation to the fee paid to Dreyfus by the fund and the respective services provided by Hamon and Dreyfus.The Board also noted that Hamon’s fee is paid by Dreyfus (out of its fee from the fund) and not the fund.
Analysis of Profitability and Economies of Scale. Dreyfus’ representatives reviewed the dollar amount of expenses allocated and profit received by Dreyfus and the method used to determine such expenses and profit. The Board previously had been provided with information prepared by an independent consulting firm regarding Dreyfus’ approach to allocating costs to, and determining the profitability of, individual funds and the entire Dreyfus mutual fund complex.The Board members also had been informed that the methodology had been reviewed by an independent registered public accounting firm which, like the consultant, found the methodology to be reasonable. The consulting firm also analyzed where any economies of scale might emerge in connection with the
TheFund 35
| INFORMATION ABOUT THE REVIEW AND APPROVAL OF THE |
| FUND’S MANAGEMENT AGREEMENT (Unaudited) (continued) |
management of the fund.The Board members evaluated the profitability analysis in light of the relevant circumstances for the fund and the extent to which economies of scale would be realized if the fund grows and whether fee levels reflect these economies of scale for the benefit of fund investors. The Board members also considered potential benefits to Dreyfus from acting as investment adviser and to Hamon from acting as sub-adviser and noted the soft dollar arrangements with respect to trading the fund’s investments.
It was noted that the Board members should consider Dreyfus’ profitability with respect to the fund as part of their evaluation of whether the fees under the Agreements bear a reasonable relationship to the mix of services provided by Dreyfus, including the nature, extent and quality of such services and that a discussion of economies of scale is predicated on a fund having achieved a substantial size with increasing assets and that, if a fund’s assets had been static or decreasing, the possibility that Dreyfus may have realized any economies of scale would be less. Since Dreyfus, and not the fund, pays Hamon pursuant to the Sub-Investment Advisory Agreement, the Board did not consider Hamon’s profitability to be relevant to its deliberations. It also was noted that the profitability percentage for managing the fund was within the range determined by appropriate court cases to be reasonable given th e services rendered. The Board also noted the fee waiver and expense reimbursement arrangement and the effect on Dreyfus’ profitability.
At the conclusion of these discussions, the Board agreed that it had been furnished with sufficient information to make an informed business decision with respect to re-approving the Agreements. Based on the discussions and considerations as described above, the Board made the following conclusions and determinations.
The Board concluded that the nature, extent and quality of the ser- vices provided by Dreyfus and Hamon are adequate and appropriate.
36
The Board was generally satisfied with the fund’s performance.
The Board concluded that the fees payable to Dreyfus and Hamon were reasonable in light of the considerations described above.
The Board determined that the economies of scale which may accrue to Dreyfus and its affiliates in connection with the management of the fund had been adequately considered by Dreyfus in connection with the management fee rate charged to the fund and that, to the extent in the future it were determined that material economies of scale had not been shared with the fund, the Board would seek to have those economies of scale shared with the fund.
The Board members considered these conclusions and determinations, along with information received on a routine and regular basis throughout the year, and, without any one factor being dispositive, the Board determined that re-approval of the Management Agreement and Sub-Investment Advisory Agreement was in the best interests of the fund and its shareholders.
TheFund 37
OFFICERS OF THE FUND (Unaudited)
BRADLEY J. SKAPYAK, President since January 2010.
Chief Operating Officer and a director of the Manager since June 2009. From April 2003 to June 2009, Mr. Skapyak was the head of the Investment Accounting and Support Department of the Manager. He is an officer of 76 investment companies (comprised of 170 portfolios) managed by the Manager. He is 51 years old and has been an employee of the Manager since February 1988.
PHILLIP N. MAISANO, Executive Vice President since July 2007.
Chief Investment Officer,Vice Chair and a director of the Manager, and an officer of 76 investment companies (comprised of 170 portfolios) managed by the Manager. Mr. Maisano also is an officer and/or Board member of certain other investment management subsidiaries of The Bank of New York Mellon Corporation, each of which is an affiliate of the Manager. He is 63 years old and has been an employee of the Manager since November 2006. Prior to joining the Manager, Mr. Maisano served as Chairman and Chief Executive Officer of EACM Advisors, an affiliate of the Manager, since August 2004.
MICHAEL A. ROSENBERG, Vice President and Secretary since August 2005.
Assistant General Counsel of BNY Mellon, and an officer of 77 investment companies (comprised of 195 portfolios) managed by the Manager. He is 50 years old and has been an employee of the Manager since October 1991.
KIESHA ASTWOOD, Vice President and Assistant Secretary since January 2010.
Counsel of BNY Mellon, and an officer of 77 investment companies (comprised of 195 portfolios) managed by the Manager. She is 37 years old and has been an employee of the Manager since July 1995.
JAMES BITETTO, Vice President and Assistant Secretary since August 2005.
Senior Counsel of BNY Mellon and Secretary of the Manager, and an officer of 77 investment companies (comprised of 195 portfolios) managed by the Manager. He is 44 years old and has been an employee of the Manager since December 1996.
JONI LACKS CHARATAN, Vice President and Assistant Secretary since August 2005.
Senior Counsel of BNY Mellon, and an officer of 77 investment companies (comprised of 195 portfolios) managed by the Manager. She is 54 years old and has been an employee of the Manager since October 1988.
JOSEPH M. CHIOFFI, Vice President and Assistant Secretary since August 2005.
Senior Counsel of BNY Mellon, and an officer of 77 investment companies (comprised of 195 portfolios) managed by the Manager. He is 48 years old and has been an employee of the Manager since June 2000.
KATHLEEN DENICHOLAS, Vice President and Assistant Secretary since January 2010.
Senior Counsel of BNY Mellon, and an officer of 77 investment companies (comprised of 195 portfolios) managed by the Manager. She is 36 years old and has been an employee of the Manager since February 2001.
JANETTE E. FARRAGHER, Vice President and Assistant Secretary since August 2005.
Assistant General Counsel of BNY Mellon, and an officer of 77 investment companies (comprised of 195 portfolios) managed by the Manager. She is 47 years old and has been an employee of the Manager since February 1984.
40
JOHN B. HAMMALIAN, Vice President and Assistant Secretary since August 2005.
Managing Counsel of BNY Mellon, and an officer of 77 investment companies (comprised of 195 portfolios) managed by the Manager. He is 47 years old and has been an employee of the Manager since February 1991.
M. CRISTINA MEISER, Vice President and Assistant Secretary since January 2010.
Senior Counsel of BNY Mellon, and an officer of 77 investment companies (comprised of 195 portfolios) managed by the Manager. She is 40 years old and has been an employee of the Manager since August 2001.
ROBERT R. MULLERY, Vice President and Assistant Secretary since August 2005.
Managing Counsel of BNY Mellon, and an officer of 77 investment companies (comprised of 195 portfolios) managed by the Manager. He is 58 years old and has been an employee of the Manager since May 1986.
JEFF PRUSNOFSKY, Vice President and Assistant Secretary since August 2005.
Managing Counsel of BNY Mellon, and an officer of 77 investment companies (comprised of 195 portfolios) managed by the Manager. He is 45 years old and has been an employee of the Manager since October 1990.
JAMES WINDELS, Treasurer since November 2001.
Director – Mutual Fund Accounting of the Manager, and an officer of 77 investment companies (comprised of 195 portfolios) managed by the Manager. He is 52 years old and has been an employee of the Manager since April 1985.
RICHARD CASSARO, Assistant Treasurer since January 2008.
Senior Accounting Manager – Money Market and Municipal Bond Funds of the Manager, and an officer of 77 investment companies (comprised of 195 portfolios) managed by the Manager. He is 51 years old and has been an employee of the Manager since September 1982.
GAVIN C. REILLY, Assistant Treasurer since August 2005.
Tax Manager of the Investment Accounting and Support Department of the Manager, and an officer of 77 investment companies (comprised of 195 portfolios) managed by the Manager. He is 42 years old and has been an employee of the Manager since April 1991.
ROBERT ROBOL, Assistant Treasurer since August 2005.
Senior Accounting Manager – Fixed Income Funds of the Manager, and an officer of 77 investment companies (comprised of 195 portfolios) managed by the Manager. He is 46 years old and has been an employee of the Manager since October 1988.
ROBERT SALVIOLO, Assistant Treasurer since July 2007.
Senior Accounting Manager – Equity Funds of the Manager, and an officer of 77 investment companies (comprised of 195 portfolios) managed by the Manager. He is 43 years old and has been an employee of the Manager since June 1989.
TheFund 41
OFFICERS OF THE FUND (Unaudited) (continued)
ROBERT SVAGNA, Assistant Treasurer since August 2002.
Senior Accounting Manager – Equity Funds of the Manager, and an officer of 77 investment companies (comprised of 195 portfolios) managed by the Manager. He is 43 years old and has been an employee of the Manager since November 1990.
JOSEPH W. CONNOLLY, Chief Compliance Officer since October 2004.
Chief Compliance Officer of the Manager and The Dreyfus Family of Funds (77 investment companies, comprised of 195 portfolios). From November 2001 through March 2004, Mr. Connolly was first Vice-President, Mutual Fund Servicing for Mellon Global Securities Services. In that capacity, Mr. Connolly was responsible for managing Mellon’s Custody, Fund Accounting and Fund Administration services to third-party mutual fund clients. He is 53 years old and has served in various capacities with the Manager since 1980, including manager of the firm’s Fund Accounting Department from 1997 through October 2001.
NATALIA GRIBAS, Anti-Money Laundering Compliance Officer since July 2010.
Anti-Money Laundering Compliance Officer of the Distributor, and the Anti-Money Laundering Compliance Officer of 73 investment companies (comprised of 191 portfolios) managed by the Manager. She is 40 years old and has been an employee of the Distributor since September 2008.
42
NOTES
Save time. Save paper. View your next shareholder report online as soon as it’s available. Log into www.dreyfus.com and sign up for Dreyfus eCommunications. It’s simple and only takes a few minutes.
The views expressed in this report reflect those of the portfolio manager only through the end of the period covered and do not necessarily represent the views of Dreyfus or any other person in the Dreyfus organization. Any such views are subject to change at any time based upon market or other conditions and Dreyfus disclaims any responsibility to update such views.These views may not be relied on as investment advice and, because investment decisions for a Dreyfus fund are based on numerous factors, may not be relied on as an indication of trading intent on behalf of any Dreyfus fund.
Not FDIC-Insured • Not Bank-Guaranteed • May Lose Value
Contents | |
THE FUND | |
| 2 | A Letter from the Chairman and CEO |
| 3 | Discussion of Fund Performance |
| 6 | Fund Performance |
| 8 | Understanding Your Fund’s Expenses |
| 8 | Comparing Your Fund’s Expenses With Those of Other Funds |
| 9 | Statement of Investments |
| 12 | Statement of Assets and Liabilities |
| 13 | Statement of Operations |
| 14 | Statement of Changes in Net Assets |
| 16 | Financial Highlights |
| 20 | Notes to Financial Statements |
| 32 | Report of Independent Registered Public Accounting Firm |
| 33 | Important Tax Information |
| 34 | Information About the Review and Approval of the Fund’s Management Agreement |
| 39 | Board Members Information |
| 41 | Officers of the Fund |
FOR MORE INFORMATION | |
Back Cover |
Dreyfus
Greater China Fund
The Fund

A LETTER FROM THE CHAIRMAN AND CEO
Dear Shareholder:
We are pleased to present this annual report for Dreyfus Greater China Fund, covering the 12-month period from November 1, 2009, through October 31, 2010.
Although a double-dip recession has recently become an increasingly unlikely scenario in our view, persistent uncertainty regarding the breadth and strength of the U.S. and global economic recoveries led to bouts of heightened volatility for U.S. stocks during most of 2010.The spending power of the U.S. consumer, long an important catalyst for economic growth, has been diminished by concerns over job security and an inability to generate cash from home equity.The second major driver of sustainable growth, corporate investment, has been stunted to a similar extent by tight credit conditions. However, the recent announcement of additional quantitative easing (QE2) measures by the Federal Reserve Board, as well as improved fundamentals across many developing nations, have helped support moderate global economic growth.
Uncertainty will probably remain in the broader financial markets until we see more evidence of robust economic growth, but we remain optimistic regarding the prospects for equities. Many stocks of quality companies with healthy balance sheets, higher credit ratings and strong cash flows appear to be currently priced at a discount.With that, we strongly suggest that you meet with your financial advisor to discuss the potential opportunities which may exist in the global markets, as well as to evaluate your portfolio to help meet your individual investment needs and your future goals relative to your risk-tolerance level.
For information about how the fund performed during the reporting period, as well as general market perspectives, we provide a Discussion of Fund Performance on the pages that follow.
Thank you for your continued confidence and support.

Jonathan R. Baum
Chairman and Chief Executive Officer
The Dreyfus Corporation
November 15, 2010
2

DISCUSSION OF FUND PERFORMANCE
For the period of November 1, 2009, through October 31, 2010, as provided by Hugh Simon and Nina Wu, Portfolio Managers
Fund and Market Performance Overview
For the 12-month period ended on October 31, 2010, Dreyfus Greater China Fund’s Class A shares produced a total return of 27.43%, Class B shares returned 26.45%, Class C shares returned 26.56% and Class I shares returned 27.86%.1 In comparison, the fund’s benchmark, the Hang Seng Index, produced a total return of 9.28% for the same period.2 Unlike much of the developed world, China enjoyed robust economic growth, driving stock prices higher over the reporting period’s second half.The fund produced considerably higher returns than its benchmark, which we attribute to strong stock sele ctions among consumer, industrial and technology companies, as well as Chinese B shares.
The Fund’s Investment Approach
The fund, which seeks long-term capital appreciation, normally invests at least 80% of its assets in stocks of companies that (i) are principally traded in China, Hong Kong or Taiwan (Greater China), (ii) derive at least 50% of their revenues from Greater China, or (iii) have at least 50% of their assets in Greater China.To determine where the fund will invest, we analyze several factors, including economic and political trends in Greater China, the current financial condition and future prospects of individual companies and sectors in the region, and the valuation of one market or company relative to that of another.
China Served as Major Driver of Global Recovery
Even as most developed nations continued to struggle in a subpar global economic recovery, China experienced strong and sustained growth. China has been driven by foreign direct investments and export-led growth over the last decade, which is now being augmented by domestic infrastructure spending, housing demand, and domestic consumption. Additionally, rising household income and efficacious social welfare programs are also supporting strengthening domestic consumption among a growing middle class, adding fuel to China’s continued economic growth.
China’s entry onto the world economic stage grew during the global financial crisis and has also been aided by several other factors, including
TheFund 3
DISCUSSION OF FUND PERFORMANCE (continued)
ample economic planning, stability, infrastructure spending, foreign reserves and continued capital inflows from global investors.The domestic stock market in China fell over 65% from its 2007 highs and is still over 50% below these all-time levels.This is despite strong earnings growth.The lack of price recovery is mainly due to tighter monetary conditions in China and restricted bank lending, as well as some risk aversion due to the near insolvency of Dubai, a sovereign debt crisis in Europe and a catastrophic oil spill in the Gulf of Mexico, each which potentially threatened the nation’s exports.
Stock Selections Bolstered Relative Performance
Despite the uncertain market environment, fluctuating export demand, tighter domestic liquidity and risk aversion by global investors, the fund achieved especially strong results from its investments in the industrial, technology and consumer sectors of the Chinese economy. Among manufacturers, AviChina Industry & Technology was bolstered by improved profits stemming from restructuring efforts and participation in domestic aviation manufacturing.Winners in the technology industry included Spreadtrum Communications, a leading producer of microchips for wireless handsets, which benefited from market share gains amid stronger-than-expected demand for lower-cost devices.Top performing consumer stocks included Dynasty Fine Wines Group, one of China’s largest wine producers, which successfully restructured its distribution channels and gained market share.
Low investor risk appetite along with global economic uncertainty, which hindered improvements in select sector fundamentals, undermined the fund’s performance during the first half of 2010. For example, solar panels manufacturer Suntech Power Holdings fell when the company lost the competitive edge in its cost structure, prompting us to sell the fund’s position.The fund also suffered shortfalls from American Dairy, one of China’s leading baby milk powder producers, when earnings were undermined by a restructuring of its distribution channel.
Solidifying China’s Economic Leadership
Global economic setbacks could spark bouts of heightened volatility in China’s stock market over the near term along with inflationary fears and tightening by the Central Bank. We remain confident about the depth of the opportunities in the Chinese economy and the length of the growth cycle. The advancement of the country’s manufacturing capacity and industrial infrastructure seems to be a long-term trend
4
that, in our analysis, has plenty of room for further improvement. For example, we have found several opportunities among companies that produce metals, such as tungsten, whose supply is dominated by China. Rising income levels, new social welfare programs and greater consumer spending are expected by us to support the long-term growth potential of domestic companies, and we have continued to search for growing consumer-oriented businesses with attractive valuations.
Meanwhile, we believe the internationalization and appreciation of China’s currency, the renminbi, is likely to help solidify China’s position as the world’s second largest national economy.Additionally, the signing of the Economic Cooperation Framework Agreement between China and Taiwan, which took effect during the reporting period, signals a warming of relations between the former political adversaries, and could serve as a multi-year catalyst for both economies. Indeed, we are considering increasing the fund’s Taiwanese holdings, as value-oriented opportunities arise among technology and financial companies poised to benefit from greater exposure to the Mainland.
November 15, 2010
| Emerging markets, such as those of China and Taiwan, tend to be more volatile than the markets | |
| of more mature economies, and generally have less diverse and less mature economic structures and | |
| less stable political systems than those of developed countries.The securities of companies located in | |
| emerging markets are often subject to rapid and large changes in price.An investment in this fund | |
| should be considered only as a supplement to a complete investment program. | |
| Please note, the position in any security highlighted with italicized typeface was sold during the | |
| reporting period. | |
| Equity funds are subject generally to market, market sector, market liquidity, issuer and investment | |
| style risks, among other factors, to varying degrees, all of which are more fully described in the | |
| fund’s prospectus. | |
| The fund’s performance will be influenced by political, social and economic factors affecting | |
| investments in foreign companies. Special risks associated with investments in foreign companies | |
| include exposure to currency fluctuations, less liquidity, less developed or less efficient trading | |
| markets, lack of comprehensive company information, political instability and differing auditing | |
| and legal standards.These risks are enhanced in emerging market countries. | |
| 1 | Total return includes reinvestment of dividends and any capital gains paid, and does not take into |
| consideration the maximum initial sales charge in the case of Class A shares, or the applicable | |
| contingent deferred sales charges imposed on redemptions in the case of Class B and Class C | |
| shares. Had these charges been reflected, returns would have been lower. Past performance is no | |
| guarantee of future results. Share price and investment return fluctuate such that upon redemption, | |
| fund shares may be worth more or less than their original cost. | |
| 2 | SOURCE: BLOOMBERG L.P. – Reflects reinvestment of dividends and, where applicable, |
| capital gain distributions.The Hang Seng Index is a free-float capitalization-weighted index of 36 | |
| companies that represents approximately 66% of the total market cap of the Stock Exchange of | |
| Hong Kong. Index components are capped at 25% and divided into four sub-indexes. Return | |
| quoted is in U.S. dollars. Investors cannot invest directly in any index. |
TheFund 5
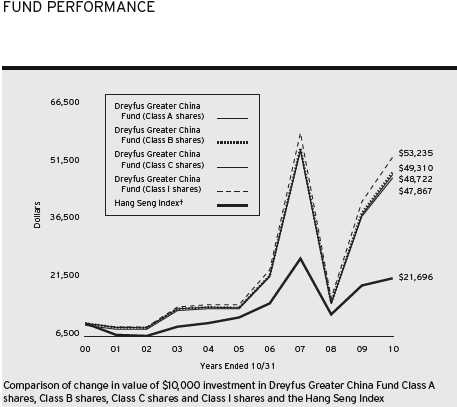
† Source: Bloomberg L.P.
Past performance is not predictive of future performance.
The above graph compares a $10,000 investment made in each of the Class A, Class B, Class C and Class I shares of Dreyfus Greater China Fund on 10/31/00 to a $10,000 investment made in the Hang Seng Index (the “Index”) on that date.All dividends and capital gain distributions are reinvested.
The fund’s performance shown in the line graph takes into account the maximum initial sales charge on Class A shares and all other applicable fees and expenses on all classes. Performance for Class B shares assumes the conversion of Class B shares to Class A shares at the end of the sixth year following the date of purchase.The Index is a capitalization-weighted index of approximately 33 companies that represent 70 percent of the total market capitalization of the Stock Exchange of Hong Kong.The components of the Index are divided into four subindices: Commerce, Finance, Utilities and Properties.The Index reflects reinvestment of net dividends and where applicable, capital gain distributions. Unlike a mutual fund, the Index is not subject to charges, fees and other expenses. Investors cannot invest directly in any index. Further information relating to fund performance, including expense reimburseme nts, if applicable, is contained in the Financial Highlights section of the prospectus and elsewhere in this report.
6
| Average Annual Total Returns as of 10/31/10 | |||
| 1 Year | 5 Years | 10 Years | |
| Class A shares | |||
| with maximum sales charge (5.75%) | 20.10% | 27.25% | 17.16% |
| without sales charge | 27.43% | 28.77% | 17.85% |
| Class B shares | |||
| with applicable redemption charge † | 22.45% | 27.58% | 17.30% |
| without redemption | 26.45% | 27.73% | 17.30% |
| Class C shares | |||
| with applicable redemption charge †† | 25.56% | 27.80% | 16.95% |
| without redemption | 26.56% | 27.80% | 16.95% |
| Class I shares | 27.86% | 29.14% | 18.20% |
| Hang Seng Index | 9.28% | 13.47% | 8.05% |
| Past performance is not predictive of future performance.The fund’s performance shown in the graph and table does not | |
| reflect the deduction of taxes that a shareholder would pay on fund distributions or the redemption of fund shares. | |
| † | The maximum contingent deferred sales charge for Class B shares is 4%.After six years Class B shares convert to |
| Class A shares. | |
| †† | The maximum contingent deferred sales charge for Class C shares is 1% for shares redeemed within one year of the |
| date of purchase. | |
TheFund 7
UNDERSTANDING YOUR FUND’S EXPENSES (Unaudited)
As a mutual fund investor, you pay ongoing expenses, such as management fees and other expenses. Using the information below, you can estimate how these expenses affect your investment and compare them with the expenses of other funds.You also may pay one-time transaction expenses, including sales charges (loads) and redemption fees, which are not shown in this section and would have resulted in higher total expenses. For more information, see your fund’s prospectus or talk to your financial adviser.
Review your fund’s expenses
The table below shows the expenses you would have paid on a $1,000 investment in Dreyfus Greater China Fund from May 1, 2010 to October 31, 2010. It also shows how much a $1,000 investment would be worth at the close of the period, assuming actual returns and expenses.
| Expenses and Value of a $1,000 Investment | ||||
| assuming actual returns for the six months ended October 31, 2010 | ||||
| Class A | Class B | Class C | Class I | |
| Expenses paid per $1,000† | $ 10.43 | $ 14.42 | $ 14.26 | $ 8.48 |
| Ending value (after expenses) | $1,155.30 | $1,150.90 | $1,151.30 | $1,157.40 |
| COMPARING YOUR FUND’S EXPENSES |
| WITH THOSE OF OTHER FUNDS (Unaudited) |
Using the SEC’s method to compare expenses
The Securities and Exchange Commission (SEC) has established guidelines to help investors assess fund expenses. Per these guidelines, the table below shows your fund’s expenses based on a $1,000 investment, assuming a hypothetical 5% annualized return. You can use this information to compare the ongoing expenses (but not transaction expenses or total cost) of investing in the fund with those of other funds.All mutual fund shareholder reports will provide this information to help you make this comparison. Please note that you cannot use this information to estimate your actual ending account balance and expenses paid during the period.
| Expenses and Value of a $1,000 Investment | ||||
| assuming a hypothetical 5% annualized return for the six months ended October 31, 2010 | ||||
| Class A | Class B | Class C | Class I | |
| Expenses paid per $1,000† | $ 9.75 | $ 13.49 | $ 13.34 | $ 7.93 |
| Ending value (after expenses) | $1,015.53 | $1,011.80 | $1,011.95 | $1,017.34 |
† Expenses are equal to the fund’s annualized expense ratio of 1.92% for Class A, 2.66% for Class B, 2.63% for Class C and 1.56% for Class I, multiplied by the average account value over the period, multiplied by 184/365 (to reflect the one-half year period).
8
| STATEMENT OF INVESTMENTS |
| October 31, 2010 |
| Common Stocks—95.2% | Shares | Value ($) | |
| China—68.7% | |||
| American Dairy | 381,646 | a | 3,881,340 |
| AsiaInfo-Linkage | 1,012,710 | a | 22,502,416 |
| AviChina Industry & Technology, Cl. H | 104,026,000 | a | 56,232,084 |
| Beijing Capital Land, Cl. H | 68,334,000 | 24,948,908 | |
| Bengang Steel Plates, Cl. B | 52,237,245 | 29,517,708 | |
| Boer Power Holdings | 4,731,000 | 4,583,752 | |
| Changfeng Axle China | 7,619,000 | 4,462,540 | |
| China Automation Group | 41,952,000 | 32,798,467 | |
| China Communications Services, Cl. H | 11,788,000 | 6,873,957 | |
| China International Marine Containers Group, Cl. B | 8,000,178 | 16,204,199 | |
| China Merchants Property Development, Cl. B | 8,678,901 | 17,758,087 | |
| China National Materials, Cl. H | 54,746,000 | 48,804,368 | |
| China Shipping Container Lines, Cl. H | 24,014,000 | a | 9,758,955 |
| ChinaSoft International | 34,270,000 | a | 9,638,265 |
| Chongqing Changan Automobile, Cl. B | 26,292,615 | 27,339,910 | |
| Chongqing Machinery & Electric, Cl. H | 56,142,000 | 19,121,416 | |
| CSG Holding, Cl. B | 15,494,681 | 21,609,095 | |
| Dalian Refrigeration, Cl. B | 16,238,818 | 16,152,399 | |
| Hangzhou Steam Turbine, Cl. B | 1,819,394 | 3,729,743 | |
| Hollysys Automation Technologies | 740,676 | a | 9,362,145 |
| Hunan Non-Ferrous Metal, Cl. H | 88,612,000 | a | 39,554,591 |
| Inspur International | 180,055,000 | 16,028,118 | |
| Intime Department Store Group | 9,996,000 | 15,320,430 | |
| Kingsoft | 30,456,000 | 15,402,357 | |
| LDK Solar, ADR | 2,552,000 a | 29,016,240 | |
| Lianhua Supermarket Holdings, Cl. H | 4,134,000 | 17,600,000 | |
| Shanghai Baosight Software, Cl. B | 4,140,577 | 8,310,138 | |
| Shanghai Forte Land, Cl. H | 16,372,000 | 4,879,125 | |
| Shanghai Friendship Group, Cl. B | 22,700,801 | b | 32,666,453 |
| Shimao Property Holdings | 17,098,500 | 28,279,667 | |
| Spreadtrum Communications, ADR | 2,463,415 | a,c | 35,103,664 |
TheFund 9
STATEMENT OF INVESTMENTS (continued)
| Common Stocks (continued) | Shares | Value ($) | |
| China (continued) | |||
| Travelsky Technology, Cl. H | 21,891,000 | 21,096,697 | |
| Visionchina Media, ADR | 4,187,182 | a,c | 17,460,549 |
| Xinjiang Xinxin Mining Industry, Cl. H | 40,621,000 | 27,460,608 | |
| Zhuzhou CSR Times Electric, Cl. H | 14,304,000 | 43,643,232 | |
| 737,101,623 | |||
| Hong Kong—18.6% | |||
| China Agri-Industries Holdings | 7,082,000 | 10,306,074 | |
| China Everbright | 3,638,000 | 9,457,275 | |
| China Foods | 20,798,000 | 17,279,680 | |
| China Travel International | |||
| Investment Hong Kong | 28,394,000 | a | 6,776,830 |
| CIMC Enric Holdings | 37,892,000 | a | 17,354,182 |
| CITIC Pacific | 6,745,000 | 17,969,263 | |
| Digital China Holdings | 10,322,000 | 18,643,187 | |
| Dynasty Fine Wines Group | 54,187,000 | 33,555,568 | |
| Ju Teng International Holdings | 2,829,000 | 1,405,148 | |
| Lifestyle International Holdings | 14,274,000 | 33,110,340 | |
| LK Technology Holdings | 59,187,500 | a,c | 18,784,228 |
| TCC International Holdings | 20,084,000 | a | 8,265,500 |
| Truly International Holdings | 4,284,000 | 6,079,536 | |
| 198,986,811 | |||
| Taiwan—7.9% | |||
| Coretronic | 6,086,000 | 9,281,590 | |
| D-Link | 12,677,000 | 12,792,296 | |
| HON HAI Precision Industry | 2,850,000 | 10,796,336 | |
| KGI Securities | 18,583,000 | 8,738,801 | |
| Shin Kong Financial Holding | 20,290,693 | a | 7,454,576 |
| Taiwan Fertilizer | 3,547,000 | 12,104,616 | |
| Wistron | 11,276,515 | 23,163,228 | |
| 84,331,443 | |||
| Total Common Stocks | |||
| (cost $768,882,293) | 1,020,419,877 |
10
| Number of | |||
| Rights—.0% | Rights | Value ($) | |
| Taiwan | |||
| Shin Kong Financial | |||
| (cost $0) | 1,394,878 a | 56,940 | |
| Number of | |||
| Warrants—4.5% | Warrants | Value ($) | |
| China | |||
| China XD Electric, Cl. A (5/5/14) | 6,508,000 | a | 7,258,372 |
| CITIC Securities, Cl. A (5/5/14) | 9,927,999 | a | 23,083,590 |
| Henan Pinggao Electric, Cl. A (5/5/14) | 8,246,247 | a | 17,491,939 |
| (cost $51,951,664) | 47,833,901 | ||
| Total Investments (cost $820,833,957) | 99.7% | 1,068,310,718 | |
| Cash and Receivables (Net) | .3% | 3,584,028 | |
| Net Assets | 100.0% | 1,071,894,746 | |
| ADR—American Depository Receipts |
| a Non-income producing security. |
| b The valuation of this security has been determined in good faith by management under the direction of the Board of |
| Directors.At October 31, 2010, the value of this security amounted to $32,666,453 or 3.0% of net assets. |
| c Investment in non-controlled affiliates (cost $53,743,950)—See Note 1(d). |
| Portfolio Summary (Unaudited)† | |||
| Value (%) | Value (%) | ||
| Information Technology | 23.1 | Materials | 12.9 |
| Industrial | 22.5 | Consumer Staples | 10.8 |
| Financial | 16.2 | Telecommunication Services | .6 |
| Consumer Discretionary | 13.6 | 99.7 | |
| † Based on net assets. | |||
| See notes to financial statements. | |||
TheFund 11
| STATEMENT OF ASSETS AND LIABILITIES |
| October 31, 2010 |
| Cost | Value | |||
| Assets ($): | ||||
| Investments in securities—See Statement of Investments: | ||||
| Unaffiliated issuers | 767,090,007 | 996,962,277 | ||
| Affiliated issuers | 53,743,950 | 71,348,441 | ||
| Cash | 1,618,126 | |||
| Cash denominated in foreign currencies | 3,512,268 | 3,537,789 | ||
| Receivable for shares of Common Stock subscribed | 2,142,247 | |||
| Receivable for investment securities sold | 1,839,909 | |||
| Dividends and interest receivable | 205,742 | |||
| Prepaid expenses | 28,199 | |||
| 1,077,682,730 | ||||
| Liabilities ($): | ||||
| Due to The Dreyfus Corporation and affiliates—Note 3(c) | 2,035,278 | |||
| Payable for shares of Common Stock redeemed | 2,115,924 | |||
| Payable for investment securities purchased | 1,254,946 | |||
| Interest payable—Note 2 | 2,078 | |||
| Accrued expenses | 379,758 | |||
| 5,787,984 | ||||
| Net Assets ($) | 1,071,894,746 | |||
| Composition of Net Assets ($): | ||||
| Paid-in capital | 805,217,928 | |||
| Accumulated net realized gain (loss) on investments | 19,170,318 | |||
| Accumulated net unrealized appreciation (depreciation) | ||||
| on investments and foreign currency transactions | 247,506,500 | |||
| Net Assets ($) | 1,071,894,746 | |||
| Net Asset Value Per Share | ||||
| Class A | Class B | Class C | Class I | |
| Net Assets ($) | 610,538,067 | 11,892,389 | 283,841,967 | 165,622,323 |
| Shares Outstanding | 11,948,545 | 255,163 | 6,085,624 | 3,154,219 |
| Net Asset Value Per Share ($) | 51.10 | 46.61 | 46.64 | 52.51 |
| See notes to financial statements. | ||||
12
| STATEMENT OF OPERATIONS |
| Year Ended October 31, 2010 |
| Investment Income ($): | |
| Income: | |
| Cash dividends (net of $1,332,857 foreign taxes withheld at source): | |
| Unaffiliated issuers | 13,426,742 |
| Affiliated issuers | 4,264 |
| Total Income | 13,431,006 |
| Expenses: | |
| Management fee—Note 3(a) | 13,037,941 |
| Shareholder servicing costs—Note 3(c) | 4,179,214 |
| Distribution fees—Note 3(b) | 2,132,265 |
| Custodian fees—Note 3(c) | 1,445,586 |
| Directors’ fees and expenses—Note 3(d) | 95,333 |
| Prospectus and shareholders’ reports | 81,253 |
| Registration fees | 62,740 |
| Professional fees | 56,616 |
| Interest expense—Note 2 | 28,716 |
| Loan commitment fees—Note 2 | 24,180 |
| Miscellaneous | 79,934 |
| Total Expenses | 21,223,778 |
| Less—reduction in fees due to earnings credits—Note 3(c) | (5,348) |
| Net Expenses | 21,218,430 |
| Investment (Loss)—Net | (7,787,424) |
| Realized and Unrealized Gain (Loss) on Investments—Note 4 ($): | |
| Net realized gain (loss) on investments and foreign currency transactions: | |
| Unaffiliated issuers | 84,542,818 |
| Affiliated issuers | 169,085 |
| Net realized gain (loss) on forward foreign currency exchange contracts | (200,308) |
| Net Realized Gain (Loss) | 84,511,595 |
| Net unrealized appreciation (depreciation) on | |
| investments and foreign currency transactions: | |
| Unaffiliated issuers | 147,289,372 |
| Affiliated issuers | 5,392,255 |
| Net unrealized appreciation (depreciation) on | |
| forward foreign currency exchange contracts | 799 |
| Net Unrealized Appreciation (Depreciation) | 152,682,426 |
| Net Realized and Unrealized Gain (Loss) on Investments | 237,194,021 |
| Net Increase in Net Assets Resulting from Operations | 229,406,597 |
| See notes to financial statements. | |
TheFund 13
STATEMENT OF CHANGES IN NET ASSETS
| Year Ended October 31, | ||
| 2010 | 2009a | |
| Operations ($): | ||
| Investment (loss)—net | (7,787,424) | (3,418,899) |
| Net realized gain (loss) on investments | 84,511,595 | 4,382,247 |
| Net unrealized appreciation | ||
| (depreciation) on investments | 152,682,426 | 448,284,415 |
| Net Increase (Decrease) in Net Assets | ||
| Resulting from Operations | 229,406,597 | 449,247,763 |
| Capital Stock Transactions ($): | ||
| Net proceeds from shares sold: | ||
| Class A Shares | 228,929,922 | 384,865,345 |
| Class B Shares | 449,262 | 1,391,887 |
| Class C Shares | 64,020,792 | 101,509,277 |
| Class I Shares | 126,866,545 | 35,553,757 |
| Class T Shares | — | 160,837 |
| Cost of shares redeemed: | ||
| Class A Shares | (382,993,296) | (181,056,848) |
| Class B Shares | (14,020,524) | (5,613,139) |
| Class C Shares | (98,037,702) | (57,577,715) |
| Class I Shares | (73,887,504) | (15,904,651) |
| Class T Shares | — | (3,678,224) |
| Increase (Decrease) in Net Assets | ||
| from Capital Stock Transactions | (148,672,505) | 259,650,526 |
| Total Increase (Decrease) in Net Assets | 80,734,092 | 708,898,289 |
| Net Assets ($): | ||
| Beginning of Period | 991,160,654 | 282,262,365 |
| End of Period | 1,071,894,746 | 991,160,654 |
14
| Year Ended October 31, | ||
| 2010 | 2009a | |
| Capital Share Transactions: | ||
| Class Ab,c | ||
| Shares sold | 5,128,168 | 11,679,633 |
| Shares redeemed | (8,903,329) | (5,855,691) |
| Net Increase (Decrease) in Shares Outstanding | (3,775,161) | 5,823,942 |
| Class Bb | ||
| Shares sold | 11,247 | 50,704 |
| Shares redeemed | (344,754) | (208,308) |
| Net Increase (Decrease) in Shares Outstanding | (333,507) | (157,604) |
| Class C | ||
| Shares sold | 1,546,833 | 3,203,215 |
| Shares redeemed | (2,465,655) | (2,066,971) |
| Net Increase (Decrease) in Shares Outstanding | (918,822) | 1,136,244 |
| Class I | ||
| Shares sold | 2,849,360 | 961,435 |
| Shares redeemed | (1,664,621) | (476,030) |
| Net Increase (Decrease) in Shares Outstanding | 1,184,739 | 485,405 |
| Class Tc | ||
| Shares sold | — | 9,527 |
| Shares redeemed | — | (190,015) |
| Net Increase (Decrease) in Shares Outstanding | — | (180,488) |
| a | Effective as of the close of business on February 4, 2009, the fund no longer offers Class T shares. |
| b | During the period ended October 31, 2010, 128,039 Class B shares representing $5,229,059 were automatically |
| converted to 117,403 Class A shares and during the period ended October 31, 2009, 47,477 Class B shares | |
| representing $1,341,364 were automatically converted to 43,809 Class A shares. | |
| c | On the close of business on February 4, 2009, 150,548 Class T shares representing $2,955,251 were converted to |
| 144,936 Class A shares. | |
| See notes to financial statements. | |
TheFund 15
FINANCIAL HIGHLIGHTS
The following tables describe the performance for each share class for the fiscal periods indicated.All information (except portfolio turnover rate) reflects financial results for a single fund share.Total return shows how much your investment in the fund would have increased (or decreased) during each period, assuming you had reinvested all dividends and distributions.These figures have been derived from the fund’s financial statements.
| Year Ended October 31, | |||||
| Class A Shares | 2010 | 2009 | 2008 | 2007 | 2006 |
| Per Share Data ($): | |||||
| Net asset value, beginning of period | 40.09 | 15.93 | 67.93 | 31.02 | 19.32 |
| Investment Operations: | |||||
| Investment income (loss)—neta | (.27) | (.10) | (.00)b | (.12) | .12 |
| Net realized and unrealized | |||||
| gain (loss) on investments | 11.26 | 24.22 | (43.59) | 41.61 | 11.59 |
| Total from Investment Operations | 10.99 | 24.12 | (43.59) | 41.49 | 11.71 |
| Distributions: | |||||
| Dividends from investment income—net | — | — | — | (.45) | (.01) |
| Dividends from net realized | |||||
| gain on investments | — | — | (8.41) | (4.13) | — |
| Total Distributions | — | — | (8.41) | (4.58) | (.01) |
| Proceeds from redemptions fees | .02 | .04 | — | — | — |
| Net asset value, end of period | 51.10 | 40.09 | 15.93 | 67.93 | 31.02 |
| Total Return (%)c | 27.43 | 151.88 | (72.40) | 148.75 | 60.66 |
| Ratios/Supplemental Data (%): | |||||
| Ratio of total expenses | |||||
| to average net assets | 1.89 | 1.95 | 1.95 | 1.77 | 1.92 |
| Ratio of net expenses | |||||
| to average net assets | 1.89d | 1.94 | 1.94 | 1.75 | 1.88 |
| Ratio of net investment income | |||||
| (loss) to average net assets | (.60) | (.33) | (.01) | (.26) | .44 |
| Portfolio Turnover Rate | 71.53 | 75.14 | 66.07 | 106.59 | 188.08 |
| Net Assets, end of period ($ x 1,000) | 610,538 | 630,399 | 157,682 | 1,008,291 | 165,363 |
| a | Based on average shares outstanding at each month end. |
| b | Amount represents less than $.01 per share. |
| c | Exclusive of sales charge. |
| d | Expense waivers and/or reimbursements amounted to less than .01%. |
| See notes to financial statements. | |
16
| Year Ended October 31, | |||||
| Class B Shares | 2010 | 2009 | 2008 | 2007 | 2006 |
| Per Share Data ($): | |||||
| Net asset value, beginning of period | 36.86 | 14.77 | 64.18 | 29.53 | 18.53 |
| Investment Operations: | |||||
| Investment (loss)—neta | (.59) | (.30) | (.24) | (.50) | (.14) |
| Net realized and unrealized | |||||
| gain (loss) on investments | 10.32 | 22.39 | (40.76) | 39.50 | 11.14 |
| Total from Investment Operations | 9.73 | 22.09 | (41.00) | 39.00 | 11.00 |
| Distributions: | |||||
| Dividends from investment income—net | — | — | — | (.22) | — |
| Dividends from net realized | |||||
| gain on investments | — | — | (8.41) | (4.13) | — |
| Total Distributions | — | — | (8.41) | (4.35) | — |
| Proceeds from redemption fees | .02 | — | — | — | — |
| Net asset value, end of period | 46.61 | 36.86 | 14.77 | 64.18 | 29.53 |
| Total Return (%)b | 26.45 | 149.56 | (72.60) | 146.79 | 59.37 |
| Ratios/Supplemental Data (%): | |||||
| Ratio of total expenses | |||||
| to average net assets | 2.60 | 2.69 | 2.68 | 2.58 | 2.73 |
| Ratio of net expenses | |||||
| to average net assets | 2.60c | 2.68 | 2.67 | 2.56 | 2.70 |
| Ratio of net investment (loss) | |||||
| to average net assets | (1.51) | (1.14) | (.68) | (1.19) | (.55) |
| Portfolio Turnover Rate | 71.53 | 75.14 | 66.07 | 106.59 | 188.08 |
| Net Assets, end of period ($ x 1,000) | 11,892 | 21,696 | 11,021 | 60,319 | 33,402 |
| a | Based on average shares outstanding at each month end. |
| b | Exclusive of sales charge. |
| c | Expense waivers and/or reimbursements amounted to less than .01%. |
| See notes to financial statements. | |
TheFund 17
FINANCIAL HIGHLIGHTS (continued)
| Year Ended October 31, | |||||
| Class C Shares | 2010 | 2009 | 2008 | 2007 | 2006 |
| Per Share Data ($): | |||||
| Net asset value, beginning of period | 36.86 | 14.76 | 64.13 | 29.56 | 18.54 |
| Investment Operations: | |||||
| Investment (loss)—neta | (.53) | (.31) | (.27) | (.46) | (.11) |
| Net realized and unrealized | |||||
| gain (loss) on investments | 10.29 | 22.40 | (40.69) | 39.46 | 11.13 |
| Total from Investment Operations | 9.76 | 22.09 | (40.96) | 39.00 | 11.02 |
| Distributions: | |||||
| Dividends from investment income—net | — | — | — | (.30) | — |
| Dividends from net realized | |||||
| gain on investments | — | — | (8.41) | (4.13) | — |
| Total Distributions | — | — | (8.41) | (4.43) | — |
| Proceeds from redemption fees | .02 | .01 | — | — | — |
| Net asset value, end of period | 46.64 | 36.86 | 14.76 | 64.13 | 29.56 |
| Total Return (%)b | 26.56 | 149.73 | (72.60) | 146.90 | 59.44 |
| Ratios/Supplemental Data (%): | |||||
| Ratio of total expenses | |||||
| to average net assets | 2.60 | 2.69 | 2.71 | 2.53 | 2.69 |
| Ratio of net expenses | |||||
| to average net assets | 2.60c | 2.68 | 2.70 | 2.51 | 2.66 |
| Ratio of net investment | |||||
| (loss) to average net assets | (1.31) | (1.13) | (.74) | (1.03) | (.42) |
| Portfolio Turnover Rate | 71.53 | 75.14 | 66.07 | 106.59 | 188.08 |
| Net Assets, end of period ($ x 1,000) | 283,842 | 258,190 | 86,643 | 513,012 | 86,666 |
| a | Based on average shares outstanding at each month end. |
| b | Exclusive of sales charge. |
| c | Expense waivers and/or reimbursements amounted to less than .01%. |
| See notes to financial statements. | |
18
| Year Ended October 31, | |||||
| Class I Shares | 2010 | 2009 | 2008 | 2007a | 2006 |
| Per Share Data ($): | |||||
| Net asset value, beginning of period | 41.06 | 16.27 | 69.02 | 31.43 | 19.56 |
| Investment Operations: | |||||
| Investment income (loss)—netb | (.10) | (.03) | .03 | .08 | .33 |
| Net realized and unrealized | |||||
| gain (loss) on investments | 11.53 | 24.81 | (44.37) | 42.16 | 11.60 |
| Total from Investment Operations | 11.43 | 24.78 | (44.34) | 42.24 | 11.93 |
| Distributions: | |||||
| Dividends from investment income—net | — | — | — | (.52) | (.06) |
| Dividends from net realized | |||||
| gain on investments | — | — | (8.41) | (4.13) | — |
| Total Distributions | — | — | (8.41) | (4.65) | (.06) |
| Proceeds from redemption fees | .02 | .01 | — | — | — |
| Net asset value, end of period | 52.51 | 41.06 | 16.27 | 69.02 | 31.43 |
| Total Return (%) | 27.86 | 152.43 | (72.31) | 149.45 | 61.14 |
| Ratios/Supplemental Data (%): | |||||
| Ratio of total expenses | |||||
| to average net assets | 1.56 | 1.63 | 1.66 | 1.49 | 1.62 |
| Ratio of net expenses | |||||
| to average net assets | 1.56c | 1.62 | 1.65 | 1.47 | 1.58 |
| Ratio of net investment income | |||||
| (loss) to average net assets | (.22) | (.09) | .07 | .16 | 1.13 |
| Portfolio Turnover Rate | 71.53 | 75.14 | 66.07 | 106.59 | 188.08 |
| Net Assets, end of period ($ x 1,000) | 165,622 | 80,875 | 24,147 | 233,751 | 18,752 |
| a | Effective June 1, 2007, Class R shares were redesignated as Class I shares. |
| b | Based on average shares outstanding at each month end. |
| c | Expense waivers and/or reimbursements amounted to less than .01%. |
| See notes to financial statements. | |
TheFund 19
NOTES TO FINANCIAL STATEMENTS
NOTE 1—Significant Accounting Policies:
Dreyfus Greater China Fund (the “fund”) is a separate non-diversified series of Dreyfus Premier Investment Funds, Inc. (the “Company”), which is registered under the Investment Company Act of 1940, as amended (the “Act”), as an open-end management investment company and operates as a series company currently offering ten series, including the fund. The fund’s investment objective is to seek long-term capital appreciation. The Dreyfus Corporation (the “Manager” or “Dreyfus”), a wholly-owned subsidiary of The Bank of New York Mellon Corporation (“BNY Mellon”), serves as the fund’s investment adviser. Hamon U.S. Investment Advisors Limited (“Hamon”) serves as the fund’s sub-investment adviser. Hamon is an affiliate of Dreyfus.
MBSC Securities Corporation (the “Distributor”), a wholly-owned subsidiary of Dreyfus, is the distributor of the fund’s shares.The fund is authorized to issue 1 billion shares of $.001 par value Common Stock. The fund currently offers four classes of shares: Class A (400 million shares authorized), Class B (200 million shares authorized), Class C (200 million shares authorized), and Class I (200 million shares authorized). Class A shares are subject to a sales charge imposed at the time of purchase. Class B shares are subject to a contingent deferred sales charge (“CDSC”) imposed on Class B share redemptions made within six years of purchase and automatically convert to Class A shares after six years. The fund no longer offers Class B shares, except in connection with dividend reinvestment and permitted exchanges of Class B shares. Class C shares are subject to a CDSC imposed on Class C sh ares redeemed within one year of purchase. Class I shares are sold at net asset value per share only to institutional investors. Other differences between the classes include the services offered to and the expenses borne by each
20
class, the allocation of certain transfer agency costs and certain voting rights. Income, expenses (other than expenses attributable to a specific class), and realized and unrealized gains or losses on investments are allocated to each class of shares based on its relative net assets.
The Company accounts separately for the assets, liabilities and operations of each series. Expenses directly attributable to each series are charged to that series’ operations; expenses which are applicable to all series are allocated among them on a pro rata basis.
The Financial Accounting Standards Board (“FASB”) Accounting Standards Codification (“ASC”) is the exclusive reference of authoritative U.S. generally accepted accounting principles (“GAAP”) recognized by the FASB to be applied by nongovernmental entities. Rules and interpretive releases of the Securities and Exchange Commission (“SEC”) under authority of federal laws are also sources of authoritative GAAP for SEC registrants. The fund’s financial statements are prepared in accordance with GAAP, which may require the use of management estimates and assumptions.Actual results could differ from those estimates.
The Company enters into contracts that contain a variety of indemnifications.The fund’s maximum exposure under these arrangements is unknown.The fund does not anticipate recognizing any loss related to these arrangements.
(a) Portfolio valuation: Investments in securities are valued at the last sales price on the securities exchange or national securities market on which such securities are primarily traded. Securities listed on the National Market System for which market quotations are available, are valued at the official closing price or, if there is no official closing price that day, at the last sales price. Securities not listed on an exchange or
TheFund 21
NOTES TO FINANCIAL STATEMENTS (continued)
the national securities market, or securities for which there were no transactions, are valued at the average of the most recent bid and asked prices, except for open short positions, where the asked price is used for valuation purposes. Bid price is used when no asked price is available. Registered investment companies that are not traded on an exchange are valued at their net asset value.When market quotations or official closing prices are not readily available, or are determined not to reflect accurately fair value, such as when the value of a security has been significantly affected by events after the close of the exchange or market on which the security is principally traded (for example, a foreign exchange or market),but before the fund calculates its net asset value, the fund may value these investments at fair value as determined in accordance with the procedures approved by the Board of Directors. Fair valuing of securities may be determined with the assistance of a pricing service using calculations based on indices of domestic securities and other appropriate indicators, such as prices of relevant ADR’s and futures contracts. For other securities that are fair valued by the Board of Directors, certain factors may be considered such as: fundamental analytical data, the nature and duration of restrictions on disposition, an evaluation of the forces that influence the market in which the securities are purchased and sold, and public trading in similar securities of the issuer or comparable issuers. Investments denominated in foreign currencies are translated to U.S. dollars at the prevailing rates of exchange. Forward foreign currency exchange contracts (“forward contracts”) are valued at the forward rate.
The fair value of a financial instrument is the amount that would be received to sell an asset or paid to transfer a liability in an orderly transaction between market participants at the measurement date (i.e. the exit price). GAAP establishes a fair value hierarchy that prioritizes the inputs of valuation techniques used to measure fair value.This hierarchy gives the highest priority to unadjusted quoted prices in active markets for identical assets or liabilities (Level 1 measurements) and the lowest priority to unobservable inputs (Level 3 measurements).
22
Additionally, GAAP provides guidance on determining whether the volume and activity in a market has decreased significantly and whether such a decrease in activity results in transactions that are not orderly. GAAP requires enhanced disclosures around valuation inputs and techniques used during annual and interim periods.
Various inputs are used in determining the value of the fund’s investments relating to fair value measurements.These inputs are summarized in the three broad levels listed below:
Level 1—unadjusted quoted prices in active markets for identical investments.
Level 2—other significant observable inputs (including quoted prices for similar investments, interest rates, prepayment speeds, credit risk, etc.).
Level 3—significant unobservable inputs (including the fund’s own assumptions in determining the fair value of investments).
The inputs or methodology used for valuing securities are not necessarily an indication of the risk associated with investing in those securities.
The following is a summary of the inputs used as of October 31, 2010 in valuing the fund’s investments:
| Level 2—Other | Level 3— | |||
| Level 1— | Significant | Significant | ||
| Unadjusted | Observable | Unobservable | ||
| Quoted Prices | Inputs | Inputs | Total | |
| Assets ($) | ||||
| Investments in Securities: | ||||
| Equity Securities— | ||||
| Foreign† | 987,753,424 | — | 32,666,453 | 1,020,419,877 |
| Rights† | 56,940 | — | — | 56,940 |
| Warrants† | 47,833,901 | — | — | 47,833,901 |
| † See Statement of Investments for country and industry classification. | ||||
TheFund 23
NOTES TO FINANCIAL STATEMENTS (continued)
The following is a reconciliation of Level 3 assets for which significant unobservable inputs were used to determine fair value:
| Investments in | |
| Equity Securities—Foreign ($) | |
| Balance as of 10/31/2009 | 2,139,300 |
| Realized gain (loss) | (6,598,339) |
| Change in unrealized appreciation (depreciation) | 9,054,739 |
| Net purchases (sales) | (4,595,700) |
| Transfers in and/or out of Level 3 | 32,666,453 |
| Balance as of 10/31/2010 | 32,666,453 |
| The amount of total gains (losses) for the | |
| period included in earnings attributable | |
| to the change in unrealized gains (losses) | |
| related to investments still held at 10/31/2010 | 5,613,172 |
In January 2010, FASB issued Accounting Standards Update (“ASU”) No. 2010-06 “Improving Disclosures about FairValue Measurements”. The portions of ASU No. 2010-06 which require reporting entities to prepare new disclosures surrounding amounts and reasons for significant transfers in and out of Level 1 and Level 2 fair value measurements as well as inputs and valuation techniques used to measure fair value for both recurring and nonrecurring fair value measurements that fall in either Level 2 or Level 3 have been adopted by the fund. No significant transfers between Level 1 or Level 2 fair value measurements occurred at October 31, 2010. The remaining portion of ASU No. 2010-06 requires reporting entities to make new disclosures about information on purchases, sales, issuances and settlements on a gross basis in the reconciliation of activity in Level 3 fair value measurements. These new and rev ised disclosures are required to be implemented for fiscal years beginning after December 15, 2010. Management is currently evaluating the impact that the adoption of this remaining portion of ASU No. 2010-06 may have on the fund’s financial statement disclosures.
(b) Foreign currency transactions: The fund does not isolate that portion of the results of operations resulting from changes in foreign
24
exchange rates on investments from the fluctuations arising from changes in the market prices of securities held. Such fluctuations are included with the net realized and unrealized gain or loss on investments.
Net realized foreign exchange gains or losses arise from sales of foreign currencies, currency gains or losses realized on securities transactions between trade and settlement date and the difference between the amounts of dividends, interest and foreign withholding taxes recorded on the fund’s books and the U.S. dollar equivalent of the amounts actually received or paid. Net unrealized foreign exchange gains and losses arise from changes in the value of assets and liabilities other than investments resulting from changes in exchange rates. Foreign currency gains and losses on investments are included with net realized and unrealized gain or loss on investments.
(c) Securities transactions and investment income: Securities transactions are recorded on a trade date basis. Realized gains and losses from securities transactions are recorded on the identified cost basis. Dividend income is recognized on the ex-dividend date and interest income, including, where applicable, accretion of discount and amortization of premium on investments, is recognized on the accrual basis.
Investing in foreign markets may involve special risks and considerations not typically associated with investing in the U.S. These risks include revaluation of currencies, high rates of inflation, repatriation restrictions on income and capital, and adverse political and economic developments. Moreover, securities issued in these markets may be less liquid, subject to government ownership controls and delayed settlements, and their prices may be more volatile than those of comparable securities in the U.S.
(d) Affiliated issuers: Investments in other investment companies advised by Dreyfus are defined as “affiliated” in the Act.
TheFund 25
NOTES TO FINANCIAL STATEMENTS (continued)
The fund may invest in shares of certain affiliated investment companies also advised or managed by Dreyfus. Investments in affiliated investment companies for the period ended October 31, 2010 were as follows:
| Affiliated | |||||
| Investment | Value | Value | Net | ||
| Company | 10/31/2009 ($) | Purchases ($) | Sales ($) | 10/31/2010 ($) | Assets (%) |
| Dreyfus | |||||
| Institutional | |||||
| Preferred | |||||
| Plus Money | |||||
| Market Fund | 5,300,000 | 156,190,000 | 161,490,000 | — | — |
Issuers in which the fund held 5% or more of the outstanding voting shares are also defined as “affiliated” in the Act.The following summarizes affiliated issuers, excluding investments in other investment companies, during the period ended October 31, 2010:
| Shares | ||||||
| Dividend | Market | |||||
| Name of issuer | 10/31/2009 | Purchases | Sales | 10/31/2010 | Income ($) | Value ($) |
| LK Technology | ||||||
| Holdings | 61,742,500 | 150,000 | 2,705,000 | 59,187,500 | — | 18,784,228 |
| Spreadtrum | ||||||
| Communications, | ||||||
| ADR | 2,323,715 | 224,700 | 85,000 | 2,463,415 | — | 35,103,664 |
| Visionchina | ||||||
| Media, ADR | 1,129,800 | 3,187,182 | 129,800 | 4,187,182 | — | 17,460,549 |
(e) Dividends to shareholders: Dividends are recorded on the ex-dividend date. Dividends from investment income-net and dividends from net realized capital gains, if any, are normally declared and paid annually, but the fund may make distributions on a more frequent basis to comply with the distribution requirements of the Internal Revenue Code of 1986, as amended (the “Code”).To the extent that net realized capital gains can be offset by capital loss carryovers, it is the policy of the fund not to distribute such gains. Income and capital gain distributions are determined in accordance with income tax regulations, which may differ from GAAP.
26
(f) Federal income taxes: It is the policy of the fund to continue to qualify as a regulated investment company, if such qualification is in the best interests of its shareholders, by complying with the applicable provisions of the Code, and to make distributions of taxable income sufficient to relieve it from substantially all federal income and excise taxes.
As of and during the period ended October 31, 2010, the fund did not have any liabilities for any uncertain tax positions.The fund recognizes interest and penalties, if any, related to uncertain tax positions as income tax expense in the Statement of Operations. During the period, the fund did not incur any interest or penalties.
Each of the tax years in the four-year period ended October 31, 2010 remains subject to examination by the Internal Revenue Service and state taxing authorities.
At October 31, 2010, the components of accumulated earnings on a tax basis were as follows: undistributed capital gains $28,685,016 and unrealized appreciation $237,991,802.
During the period ended October 31, 2010, as a result of permanent book to tax differences, primarily due to the tax treatment for foreign currency gains and losses and net operating losses, the fund increased accumulated undistributed investment income-net by $7,787,424, increased accumulated net realized gain (loss) on investments by $239,906 and decreased paid-in capital by $8,027,330. Net assets and net asset value per share were not affected by this reclassification.
NOTE 2—Bank Lines of Credit:
The fund participates with other Dreyfus-managed funds in a $225 million unsecured credit facility led by Citibank, N.A. and a $300 million unsecured credit facility provided by The Bank of NewYork Mellon, a subsidiary of BNY Mellon and an affiliate of Dreyfus (each, a “Facility”),
TheFund 27
NOTES TO FINANCIAL STATEMENTS (continued)
each to be utilized primarily for temporary or emergency purposes, including the financing of redemptions. In connection therewith, the fund has agreed to pay its pro rata portion of commitment fees for each Facility. Interest is charged to the fund based on rates determined pursuant to the terms of the respective Facility at the time of borrowing.
The average amount of borrowings outstanding under the Facilities during the period ended October 31, 2010, was approximately $1,913,300, with a related weighted average annualized interest rate of 1.50%.
NOTE 3—Management Fee, Sub-Investment Advisory Fee and Other Transactions with Affiliates:
(a) Pursuant to a management agreement with Dreyfus, the management fee is computed at the annual rate of 1.25% of the value of the fund’s average daily net assets and is payable monthly.
Pursuant to a sub-investment advisory agreement between Dreyfus and Hamon, Dreyfus pays Hamon a fee at the annual rate of .625% of the value of the fund’s average daily net assets and is payable monthly.
During the period ended October 31, 2010, the Distributor retained $331,337 from commissions earned on sales of the fund’s Class A shares and $21,931 and $283,417 from CDSCs on redemptions of the fund’s Class B and Class C shares, respectively.
(b) Under the Distribution Plan (the “Plan”) adopted pursuant to Rule 12b-1 under the Act, Class B and Class C shares pay the Distributor for distributing their shares at an annual rate of .75% of the value of the average daily net assets of Class B and Class C shares. During the period ended October 31, 2010, Class B and Class C shares were charged $112,053 and $2,020,212, respectively, pursuant to the Plan.
(c) Under the Shareholder Services Plan, Class A, Class B and Class C shares pay the Distributor at an annual rate of .25% of the value of their average daily net assets for the provision of certain services.The services provided may include personal services relating to shareholder
28
accounts, such as answering shareholder inquiries regarding the fund and providing reports and other information, and services related to the maintenance of shareholder accounts.The Distributor may make payments to Service Agents (a securities dealer, financial institution or other industry professional) in respect of these services.The Distributor determines the amounts to be paid to Service Agents. During the period ended October 31, 2010, Class A, Class B and Class C shares were charged $1,531,016, $37,351 and $673,404, respectively, pursuant to the Shareholder Services Plan.
The fund compensates Dreyfus Transfer, Inc., a wholly-owned subsidiary of Dreyfus, under a transfer agency agreement for providing personnel and facilities to perform transfer agency services for the fund. During the period ended October 31, 2010, the fund was charged $600,367 pursuant to the transfer agency agreement, which is included in Shareholder servicing costs in the Statement of Operations.
The fund has arrangements with the custodian and cash management bank whereby the fund may receive earnings credits when positive cash balances are maintained, which are used to offset custody and cash management fees. For financial reporting purposes, the fund includes net earnings credits as an expense offset in the Statement of Operations.
The fund compensates The Bank of New York Mellon under a cash management agreement for performing cash management services related to fund subscriptions and redemptions. During the period ended October 31, 2010, the fund was charged $88,163 pursuant to the cash management agreement, which is included in Shareholder servicing costs in the Statement of Operations. These fees were partially offset by earnings credits of $5,348.
The fund also compensates The Bank of New York Mellon under a custody agreement for providing custodial services for the fund. During the period ended October 31, 2010, the fund was charged $1,445,586 pursuant to the custody agreement.
TheFund 29
NOTES TO FINANCIAL STATEMENTS (continued)
During the period ended October 31, 2010, the fund was charged $6,114 for services performed by the Chief Compliance Officer.
The components of “Due to The Dreyfus Corporation and affiliates” in the Statement of Assets and Liabilities consist of: management fees $1,115,673, Rule 12b-1 distribution plan fees $183,978, shareholder services plan fees $188,850, custodian fees $459,976, chief compliance officer fees $2,248 and transfer agency per account fees $84,553.
(d) Each Board member also serves as a Board member of other funds within the Dreyfus complex. Annual retainer fees and attendance fees are allocated to each fund based on net assets.
(e) A 2% redemption fee is charged and retained by the fund on certain shares redeemed within sixty days following the date of issuance subject to exceptions, including redemptions made through use of the fund’s exchange privilege. During the period ended October 31, 2010, redemption fees charged and retained by the fund amounted to $449,526.
NOTE 4—Securities Transactions:
The aggregate amount of purchases and sales of investment securities, excluding short-term securities and forward contracts, during the period ended October 31, 2010, amounted to $735,580,205 and $887,810,142, respectively.
The provisions of ASC Topic 815 “Derivatives and Hedging” require qualitative disclosures about objectives and strategies for using derivatives, quantitative disclosures about fair value amounts of gains and losses on derivative instruments and disclosures about credit-risk-related contingent features in derivative agreements. The disclosure requirements distinguish between derivatives, which are accounted for as “hedges” and those that do not qualify for hedge accounting. Because investment companies value their derivatives at fair value and recognize changes in fair value through the Statement of Operations, they do not qualify for such accounting. Accordingly, even though a fund’s investments in derivatives may represent economic hedges, they are considered to be non-hedge transactions for purposes of this disclosure.
30
Forward Foreign Currency Exchange Contracts: The fund enters into forward contracts in order to hedge its exposure to changes in foreign currency exchange rates on its foreign portfolio holdings, to settle foreign currency transactions or as a part of its investment strategy. When executing forward contracts, the fund is obligated to buy or sell a foreign currency at a specified rate on a certain date in the future. With respect to sales of forward contracts, the fund incurs a loss if the value of the contract increases between the date the forward contract is opened and the date the forward contract is closed.The fund realizes a gain if the value of the contract decreases between those dates.With respect to purchases of forward contracts, the fund incurs a loss if the value of the contract decreases between the date the for ward contract is opened and the date the forward contract is closed.The fund realizes a gain if the value of the contract increases between those dates. Any realized gain or loss which occurred during the period is reflected in the Statement of Operations.The fund is exposed to foreign currency risk as a result of changes in value of underlying financial instruments. The fund is also exposed to credit risk associated with counterparty nonperformance on these forward contracts, which is typically limited to the unrealized gain on each open contract. At October 31, 2010, there were no forward contracts outstanding.
At October 31, 2010, the cost of investments for federal income tax purposes was $830,348,655; accordingly, accumulated net unrealized appreciation on investments was $237,962,063, consisting of $289,961,141 gross unrealized appreciation and $51,999,078 gross unrealized depreciation.
TheFund 31
| REPORT OF INDEPENDENT REGISTERED |
| PUBLIC ACCOUNTING FIRM |
Shareholders and Board of Directors
Dreyfus Greater China Fund
We have audited the accompanying statement of assets and liabilities, including the statement of investments, of Dreyfus Greater China Fund (one of the series comprising Dreyfus Premier Investment Funds, Inc.) as of October 31, 2010, and the related statement of operations for the year then ended, the statement of changes in net assets for each of the two years in the period then ended, and financial highlights for each of the years indicated therein.These financial statements and financial highlights are the responsibility of the Fund’s management. Our responsibility is to express an opinion on these financial statements and financial highlights based on our audits.
We conducted our audits in accordance with the standards of the Public Company Accounting Oversight Board (United States).Those standards require that we plan and perform the audit to obtain reasonable assurance about whether the financial statements and financial highlights are free of material misstatement.We were not engaged to perform an audit of the Fund’s internal control over financial reporting. Our audits included consideration of internal control over financial reporting as a basis for designing audit procedures that are appropriate in the circumstances, but not for the purpose of expressing an opinion on the effectiveness of the Fund’s internal control over financial reporting. Accordingly, we express no such opinion.An audit also includes examining, on a test basis, evidence supporting the amounts and disclosures in the financial statements and financial highlights, assessing the accounting p rinciples used and significant estimates made by management, and evaluating the overall financial statement presentation. Our procedures included confirmation of securities owned as of October 31, 2010 by correspondence with the custodian and others. We believe that our audits provide a reasonable basis for our opinion.
In our opinion, the financial statements and financial highlights referred to above present fairly, in all material respects, the financial position of Dreyfus Greater China Fund at October 31, 2010, the results of its operations for the year then ended, the changes in its net assets for each of the two years in the period then ended, and the financial highlights for each of the indicated years, in conformity with U.S. generally accepted accounting principles.
New York, New York
December 28, 2010
32
IMPORTANT TAX INFORMATION (Unaudited)
In accordance with federal tax law, the fund elects to provide each shareholder with their portion of the fund’s foreign taxes paid and the income sourced from foreign countries. Accordingly, the fund hereby makes the following designations regarding its fiscal year ended October 31, 2010:
—the total amount of taxes paid to foreign countries was $1,332,857
—the total amount of income sourced from foreign countries was $14,772,439.
Where required by federal tax law rules, shareholders will receive notification of their proportionate share of foreign taxes paid and foreign sourced income for the 2010 calendar year with Form 1099-DIV which will be mailed in early 2011.
TheFund 33
| INFORMATION ABOUT THE REVIEW AND APPROVAL |
| OF THE FUND’S MANAGEMENT AGREEMENT (Unaudited) |
At a meeting of the fund’s Board held on July 13, 2010, the Board considered the re-approval of the fund’s Management Agreement with Dreyfus and the Sub-Investment Advisory Agreement between Dreyfus and Hamon U.S. Investment Advisors Limited (“Hamon”) (together, the “Agreements”) for a one-year term ending July 31, 2011.The Board members, none of whom are “interested persons” (as defined in the Investment Company Act of 1940, as amended) of the fund, were assisted in their review by independent legal counsel and met with counsel in executive session separate from representatives of Dreyfus. In considering the re-approval of the Agreements, the Board considered all factors that it believed to be relevant, including, among other things, the factors discussed below.
Analysis of Nature, Extent and Quality of Services Provided to the Fund.The Board members received a presentation from representatives of Dreyfus regarding services provided to the fund and other funds in the Dreyfus fund complex, and discussed the nature, extent and quality of the services provided to the fund pursuant to the Agreements. Dreyfus’ representatives reviewed the fund’s distribution of accounts and the relationships Dreyfus has with various intermediaries and the different needs of each. Dreyfus’ representatives noted the various distribution channels for the fund as well as the diverse methods of distribution among other funds in the Dreyfus fund complex, and Dreyfus’ corresponding need for broad, deep, and diverse resources to be able to provide ongoing shareholder services to each distribution chan nel, including those of the fund. Dreyfus also provided the number of accounts investing in the fund, as well as the fund’s asset size.
The Board members considered Dreyfus’ and Hamon’s research and portfolio management capabilities. The Board members also considered that Dreyfus provides oversight of day-to-day fund operations, including fund accounting, administration and assistance in meeting legal and regulatory requirements.The Board members also considered Dreyfus’ extensive administrative, accounting and compliance infra-
34
structure, as well as Dreyfus’ supervisory activities over Hamon. The Board also considered Hamon’s brokerage policies and practices, the standards applied in seeking best execution and Hamon’s policies and practices regarding soft dollars.
Comparative Analysis of the Fund’s Performance and Management Fee and Expense Ratio. The Board members reviewed the fund’s performance for various periods compared to the performance of a group of comparable retail front-end load China region funds (the “Performance Group”) and to a larger universe of funds consisting of all retail and institutional China region funds (the “Performance Universe”), selected and provided by Lipper, Inc., an independent provider of investment company data.The Board was provided with a description of the methodology Lipper used to select the Performance Group and Performance Universe, as well as the Expense Group and Expense Universe (discussed below).The Board members discussed the results of the comparisons and noted that the fund’s total return performance was above the Performance Group and Performance Universe medians for all periods except the one- and three-year periods ended May 31, 2010 when it was below the Performance Group and Performance Universe medians. Dreyfus also provided a comparison of the fund’s calendar year total returns to the returns of the fund’s benchmark index.
The Board members also discussed the fund’s management fee and expense ratio and reviewed the range of actual and contractual management fees and total expense ratios of a group of comparable funds (the “Expense Group”) and a broader group of funds (the “Expense Universe”), each selected and provided by Lipper.The Board members noted that the fund’s actual management fee was higher than the Expense Group and Expense Universe medians, the fund’s contractual management fee was higher than the Expense Group median and the fund’s total expense ratio was higher than the Expense Group median and at the Expense Universe median.
TheFund 35
| INFORMATION ABOUT THE REVIEW AND APPROVAL OF THE |
| FUND’S MANAGEMENT AGREEMENT (Unaudited) (continued) |
Representatives of Dreyfus noted that there were no other mutual funds managed by Dreyfus, Hamon or their affiliates with similar investment objectives, policies and strategies, and reviewed with the Board other accounts managed by Dreyfus, Hamon or their affiliates with similar investment objectives, policies and strategies as the fund (the “Similar Accounts”). Dreyfus’ representatives explained the nature of the Similar Accounts and the differences, from Dreyfus’ and Hamon’s perspective, as applicable, in providing services to such Similar Accounts as compared to managing and providing services to the fund.The Board members considered the relevance of the fee information provided for the Similar Accounts to evaluate the appropriateness and reasonableness of the fund’s management fee.
The Board considered the fee to Hamon in relation to the fee paid to Dreyfus by the fund and the respective services provided by Hamon and Dreyfus.The Board also noted that Hamon’s fee is paid by Dreyfus (out of its fee from the fund) and not the fund.
Analysis of Profitability and Economies of Scale. Dreyfus’ representatives reviewed the dollar amount of expenses allocated and profit received by Dreyfus and the method used to determine such expenses and profit. The Board previously had been provided with information prepared by an independent consulting firm regarding Dreyfus’ approach to allocating costs to, and determining the profitability of, individual funds and the entire Dreyfus mutual fund complex.The Board members also had been informed that the methodology had been reviewed by an independent registered public accounting firm which, like the consultant, found the methodology to be reasonable. The consulting firm also analyzed where any economies of scale might emerge in connection with the management of the fund.The Board members evaluated the profitability anal ysis in light of the relevant circumstances for the fund and the extent to which economies of scale would be realized if the fund grows and
36
whether fee levels reflect these economies of scale for the benefit of fund investors. The Board members also considered potential benefits to Dreyfus from acting as investment adviser and to Hamon from acting as sub-adviser and noted the soft dollar arrangements with respect to trading the fund’s investments.
It was noted that the Board members should consider Dreyfus’ profitability with respect to the fund as part of their evaluation of whether the fees under the Agreements bear a reasonable relationship to the mix of services provided by Dreyfus, including the nature, extent and quality of such services and that a discussion of economies of scale is predicated on a fund having achieved a substantial size with increasing assets and that, if a fund’s assets had been static or decreasing, the possibility that Dreyfus may have realized any economies of scale would be less. Since Dreyfus, and not the fund, pays Hamon pursuant to the Sub-Investment Advisory Agreement, the Board did not consider Hamon’s profitability to be relevant to its deliberations. It also was noted that the profitability percentage for managing the fund was within the range determined by appropriate court cases to be reasonable given th e services rendered.
At the conclusion of these discussions, the Board agreed that it had been furnished with sufficient information to make an informed business decision with respect to re-approving the Agreements. Based on the discussions and considerations as described above, the Board made the following conclusions and determinations.
The Board concluded that the nature, extent and quality of the ser- vices provided by Dreyfus and Hamon are adequate and appropriate.
The Board was satisfied with the fund’s relative performance.
The Board concluded that the fees payable to Dreyfus and Hamon were reasonable in light of the considerations described above.
TheFund 37
| INFORMATION ABOUT THE REVIEW AND APPROVAL OF THE |
| FUND’S MANAGEMENT AGREEMENT (Unaudited) (continued) |
The Board determined that the economies of scale which may accrue to Dreyfus and its affiliates in connection with the manage- ment of the fund had been adequately considered by Dreyfus in connection with the management fee rate charged to the fund and that, to the extent in the future it were determined that material economies of scale had not been shared with the fund, the Board would seek to have those economies of scale shared with the fund.
The Board members considered these conclusions and determinations, along with information received on a routine and regular basis throughout the year, and, without any one factor being dispositive, the Board determined that re-approval of the Management Agreement and Sub-Investment Advisory Agreement was in the best interests of the fund and its shareholders.
38
OFFICERS OF THE FUND (Unaudited)
BRADLEY J. SKAPYAK, President since January 2010.
Chief Operating Officer and a director of the Manager since June 2009. From April 2003 to June 2009, Mr. Skapyak was the head of the Investment Accounting and Support Department of the Manager. He is an officer of 76 investment companies (comprised of 170 portfolios) managed by the Manager. He is 51 years old and has been an employee of the Manager since February 1988.
PHILLIP N. MAISANO, Executive Vice President since July 2007.
Chief Investment Officer,Vice Chair and a director of the Manager, and an officer of 76 investment companies (comprised of 170 portfolios) managed by the Manager. Mr. Maisano also is an officer and/or Board member of certain other investment management subsidiaries of The Bank of New York Mellon Corporation, each of which is an affiliate of the Manager. He is 63 years old and has been an employee of the Manager since November 2006. Prior to joining the Manager, Mr. Maisano served as Chairman and Chief Executive Officer of EACM Advisors, an affiliate of the Manager, since August 2004.
MICHAEL A. ROSENBERG, Vice President and Secretary since August 2005.
Assistant General Counsel of BNY Mellon, and an officer of 77 investment companies (comprised of 195 portfolios) managed by the Manager. He is 50 years old and has been an employee of the Manager since October 1991.
KIESHA ASTWOOD, Vice President and Assistant Secretary since January 2010.
Counsel of BNY Mellon, and an officer of 77 investment companies (comprised of 195 portfolios) managed by the Manager. She is 37 years old and has been an employee of the Manager since July 1995.
JAMES BITETTO, Vice President and Assistant Secretary since August 2005.
Senior Counsel of BNY Mellon and Secretary of the Manager, and an officer of 77 investment companies (comprised of 195 portfolios) managed by the Manager. He is 44 years old and has been an employee of the Manager since December 1996.
JONI LACKS CHARATAN, Vice President and Assistant Secretary since August 2005.
Senior Counsel of BNY Mellon, and an officer of 77 investment companies (comprised of 195 portfolios) managed by the Manager. She is 54 years old and has been an employee of the Manager since October 1988.
JOSEPH M. CHIOFFI, Vice President and Assistant Secretary since August 2005.
Senior Counsel of BNY Mellon, and an officer of 77 investment companies (comprised of 195 portfolios) managed by the Manager. He is 48 years old and has been an employee of the Manager since June 2000.
KATHLEEN DENICHOLAS, Vice President and Assistant Secretary since January 2010.
Senior Counsel of BNY Mellon, and an officer of 77 investment companies (comprised of 195 portfolios) managed by the Manager. She is 36 years old and has been an employee of the Manager since February 2001.
JANETTE E. FARRAGHER, Vice President and Assistant Secretary since August 2005.
Assistant General Counsel of BNY Mellon, and an officer of 77 investment companies (comprised of 195 portfolios) managed by the Manager. She is 47 years old and has been an employee of the Manager since February 1984.
TheFund 41
OFFICERS OF THE FUND (Unaudited) (continued)
JOHN B. HAMMALIAN, Vice President and Assistant Secretary since August 2005.
Managing Counsel of BNY Mellon, and an officer of 77 investment companies (comprised of 195 portfolios) managed by the Manager. He is 47 years old and has been an employee of the Manager since February 1991.
M. CRISTINA MEISER, Vice President and Assistant Secretary since January 2010.
Senior Counsel of BNY Mellon, and an officer of 77 investment companies (comprised of 195 portfolios) managed by the Manager. She is 40 years old and has been an employee of the Manager since August 2001.
ROBERT R. MULLERY, Vice President and Assistant Secretary since August 2005.
Managing Counsel of BNY Mellon, and an officer of 77 investment companies (comprised of 195 portfolios) managed by the Manager. He is 58 years old and has been an employee of the Manager since May 1986.
JEFF PRUSNOFSKY, Vice President and Assistant Secretary since August 2005.
Managing Counsel of BNY Mellon, and an officer of 77 investment companies (comprised of 195 portfolios) managed by the Manager. He is 45 years old and has been an employee of the Manager since October 1990.
JAMES WINDELS, Treasurer since November 2001.
Director – Mutual Fund Accounting of the Manager, and an officer of 77 investment companies (comprised of 195 portfolios) managed by the Manager. He is 52 years old and has been an employee of the Manager since April 1985.
RICHARD CASSARO, Assistant Treasurer since January 2008.
Senior Accounting Manager – Money Market and Municipal Bond Funds of the Manager, and an officer of 77 investment companies (comprised of 195 portfolios) managed by the Manager. He is 51 years old and has been an employee of the Manager since September 1982.
GAVIN C. REILLY, Assistant Treasurer since August 2005.
Tax Manager of the Investment Accounting and Support Department of the Manager, and an officer of 77 investment companies (comprised of 195 portfolios) managed by the Manager. He is 42 years old and has been an employee of the Manager since April 1991.
ROBERT ROBOL, Assistant Treasurer since August 2005.
Senior Accounting Manager – Fixed Income Funds of the Manager, and an officer of 77 investment companies (comprised of 195 portfolios) managed by the Manager. He is 46 years old and has been an employee of the Manager since October 1988.
ROBERT SALVIOLO, Assistant Treasurer since July 2007.
Senior Accounting Manager – Equity Funds of the Manager, and an officer of 77 investment companies (comprised of 195 portfolios) managed by the Manager. He is 43 years old and has been an employee of the Manager since June 1989.
42
ROBERT SVAGNA, Assistant Treasurer since August 2002.
Senior Accounting Manager – Equity Funds of the Manager, and an officer of 77 investment companies (comprised of 195 portfolios) managed by the Manager. He is 43 years old and has been an employee of the Manager since November 1990.
JOSEPH W. CONNOLLY, Chief Compliance Officer since October 2004.
Chief Compliance Officer of the Manager and The Dreyfus Family of Funds (77 investment companies, comprised of 195 portfolios). From November 2001 through March 2004, Mr. Connolly was first Vice-President, Mutual Fund Servicing for Mellon Global Securities Services. In that capacity, Mr. Connolly was responsible for managing Mellon’s Custody, Fund Accounting and Fund Administration services to third-party mutual fund clients. He is 53 years old and has served in various capacities with the Manager since 1980, including manager of the firm’s Fund Accounting Department from 1997 through October 2001.
NATALIA GRIBAS, Anti-Money Laundering Compliance Officer since July 2010.
Anti-Money Laundering Compliance Officer of the Distributor, and the Anti-Money Laundering Compliance Officer of 73 investment companies (comprised of 191 portfolios) managed by the Manager. She is 40 years old and has been an employee of the Distributor since September 2008.
TheFund 43
NOTES
Save time. Save paper. View your next shareholder report online as soon as it’s available. Log into www.dreyfus.com and sign up for Dreyfus eCommunications. It’s simple and only takes a few minutes.
The views expressed in this report reflect those of the portfolio manager only through the end of the period covered and do not necessarily represent the views of Dreyfus or any other person in the Dreyfus organization. Any such views are subject to change at any time based upon market or other conditions and Dreyfus disclaims any responsibility to update such views.These views may not be relied on as investment advice and, because investment decisions for a Dreyfus fund are based on numerous factors, may not be relied on as an indication of trading intent on behalf of any Dreyfus fund.
Not FDIC-Insured • Not Bank-Guaranteed • May Lose Value
Contents | |
THE FUND | |
| 2 | A Letter from the Chairman and CEO |
| 3 | Discussion of Fund Performance |
| 6 | Fund Performance |
| 8 | Understanding Your Fund’s Expenses |
| 8 | Comparing Your Fund’s Expenses With Those of Other Funds |
| 9 | Statement of Investments |
| 10 | Statement of Assets and Liabilities |
| 11 | Statement of Operations |
| 12 | Statement of Changes in Net Assets |
| 14 | Financial Highlights |
| 17 | Notes to Financial Statements |
| 26 | Report of Independent Registered Public Accounting Firm |
| 27 | Important Tax Information |
| 28 | Information About the Review and Approval of the Fund’s Management Agreement |
| 31 | Board Members Information |
| 33 | Officers of the Fund |
FOR MORE INFORMATION | |
Back Cover |
Dreyfus
Satellite Alpha Fund
The Fund

A LETTER FROM THE CHAIRMAN AND CEO
Dear Shareholder:
We are pleased to present this annual report for Dreyfus Satellite Alpha Fund, covering the 12-month period from November 1, 2009, through October 31, 2010.
Although a double-dip recession has recently become an increasingly unlikely scenario in our view, persistent uncertainty regarding the breadth and strength of the U.S. and global economic recoveries led to bouts of heightened volatility for U.S. stocks during most of 2010.The spending power of the U.S. consumer, long an important catalyst for economic growth, has been diminished by concerns over job security and an inability to generate cash from home equity.The second major driver of sustainable growth, corporate investment, has been stunted to a similar extent by tight credit conditions. However, the recent announcement of additional quantitative easing (QE2) measures by the Federal Reserve Board, as well as improved fundamentals across many developing nations, have helped support moderate global economic growth.
Uncertainty will probably remain in the broader financial markets until we see more evidence of robust economic growth, but we remain optimistic regarding the prospects for equities. Many stocks of quality companies with healthy balance sheets, higher credit ratings and strong cash flows appear to be currently priced at a discount.With that, we strongly suggest that you meet with your financial advisor to discuss the potential opportunities which may exist in the global markets, as well as to evaluate your portfolio to help meet your individual investment needs and your future goals relative to your risk-tolerance level.
For information about how the fund performed during the reporting period, as well as general market perspectives, we provide a Discussion of Fund Performance on the pages that follow.
Thank you for your continued confidence and support.
Jonathan R. Baum
Chairman and Chief Executive Officer
The Dreyfus Corporation
November 15, 2010
2

DISCUSSION OF FUND PERFORMANCE
For the period of November 1, 2009, through October 31, 2010, as provided by Richard B. Hoey, A. Paul Disdier, Christopher E. Sheldon, CFA, and Keith L. Stransky, CFA, Portfolio Managers
Market and Fund Performance Overview
For the 12-month period ended October 31, 2010, Dreyfus Satellite Alpha Fund’s Class A shares produced a total return of 12.09%, Class C shares returned 11.24% and Class I shares returned 12.35%.1 In comparison, the fund’s benchmark, the Morgan Stanley Capital International (MSCI) World Index (the “Index”), produced a total return of 12.74% for the same period.2 After rallying over the first half of the reporting period, financial markets encountered heightened volatility over the second half due to intensifying global and domestic economic concerns.The fund’s Class I share s produced returns that were roughly in line with its benchmark, as strong results from the emerging markets and global real estate investment trusts were offset by weaker returns from U.S. inflation-adjusted bonds, European stocks and currencies of developed countries.
The Fund’s Investment Approach
The fund seeks long-term capital appreciation. To pursue its goal, the fund normally allocates its assets among other mutual funds advised by The Dreyfus Corporation (Dreyfus) that provide exposure to alternative or non-traditional (i.e., satellite) asset categories or investment strategies. The fund also may invest in unaffiliated funds, including exchange-traded funds (ETFs).The underlying funds are selected by the Dreyfus Investment Committee based on their investment objectives and management policies, portfolio holdings, risk/reward profiles, historical performance and other factors.The Dreyfus Investment Committee will rebalance the fund’s investments in the underlying funds at least annually, but may do so more often in response to market conditions.As of October 31, 2010, the fund’s assets were allocated as follows:
| Underlying Funds | (%) |
| Dreyfus Global Absolute Return Fund | 30 |
| Dreyfus Global Real Estate Securities Fund | 17 |
| Dreyfus Inflation Adjusted Securities Fund | 14 |
| Dreyfus Natural Resources Fund | 13 |
| Dreyfus Emerging Markets Debt Local Currency Fund | 12 |
| Dreyfus International Bond Fund | 9 |
| Emerging Markets Opportunity Fund | 5 |
TheFund 3
DISCUSSION OF FUND PERFORMANCE (continued)
Economic Concerns Sparked Heightened Market Volatility
From the beginning of the reporting period through April 2010, the U.S. and global economies continued to recover from recession, propelling U.S. stocks, corporate bonds and emerging-markets securities higher. However, in May 2010 investors faced greater economic uncertainty when Europe was roiled by a sovereign debt crisis and inflation-fighting measures in China threatened to dampen a major engine of global growth. In the United States, mixed data regarding unemployment and housing markets suggested that stubborn economic headwinds might constrain already mild growth.As a result, rallies among stocks and higher yielding bonds were derailed over the spring and summer.Those losses generally proved temporary, however, as anticipation of reduced political uncertainty and new monetary stimulus from the Federal Reserve Board sparked a broad-based rally in September and October.
Underlying Investments Produced Mixed Results
Although the fund participated to a substantial degree in the financial markets’ gains over the reporting period, its exposure to certain asset classes prevented it from outpacing its equity-based benchmark. Most notably, two of the funds underlying investments—Dreyfus Global Absolute Return Fund and Dreyfus Inflation Adjusted Securities Fund—dampened the fund’s relative performance.The inflation-protected U.S. bonds in which Dreyfus Inflation Adjusted Securities Fund primarily invests lagged in a generally low-inflation environment, while Dreyfus Global Absolute Return Fund was hurt by some of its currency positions and exposure to struggling European equity markets.The fund achieved stronger results from Dreyfus Global Real Estate Securities Fund, Emerging Markets Opportunity Fund and Dreyfus Emerging Markets Debt Local Currency Fund.These underlying funds were buoyed during the reporting per iod by recovering global real estate values and continued robust economic growth in the world’s emerging markets.
The fund made several allocation changes during the reporting period. In February, we shifted assets from Emerging Markets Opportunity Fund to Dreyfus Global Absolute Return Fund. In March, we further reduced the allocation to Emerging Markets Opportunity Fund in favor of Dreyfus Emerging Markets Debt Local Currency Fund. In May, we reduced the fund’s exposure to equities by moving additional assets from Emerging Markets Opportunity Fund to Dreyfus Global Absolute Return Fund. In September, we restored the fund’s bias toward stocks through a shift of assets from Dreyfus Global Absolute Return Fund to Dreyfus Natural Resources Fund.
4
Favoring Stocks over Bonds
Although we remain concerned regarding economic headwinds, we have maintained the fund’s emphasis on stocks over bonds. In our judgment, rising corporate earnings could lead to an increase in mergers-and-acquisitions activity, potentially benefiting stocks as companies begin to deploy some of their massive cash reserves. In contrast, we expect bonds to trade within a relatively narrow range if interest rates remain low in a subpar economic expansion and European fiscal conditions remain under pressure.We believe that these strategies—as well as the fund’s broadly diversified exposure to some of our company’s portfolio managers—position the fund appropriately for today’s slow-growth environment.
November 15, 2010
| Equity funds are subject generally to market, market sector, market liquidity, issuer and investment | |
| style risks, among other factors, to varying degrees, all of which are more fully described in the | |
| prospectus of the fund and that of each underlying fund. | |
| The ability of the fund to achieve its investment goal depends, in part, on the ability of the | |
| Dreyfus Investment Committee to allocate effectively the fund’s assets among the underlying | |
| funds.There can be no assurance that the actual allocations will be effective in achieving the fund’s | |
| investment goal. | |
| Each underlying international equity fund’s performance will be influenced by political, social and | |
| economic factors affecting investments in foreign companies. Special risks associated with such | |
| companies include exposure to currency fluctuations, less liquidity, less developed or less efficient | |
| trading markets, lack of comprehensive company information, political instability and differing | |
| auditing and legal standards. | |
| Because one of the fund’s investments is concentrated in the securities of companies principally | |
| engaged in the real estate sector, the value of the fund’s shares will be affected by factors particular | |
| to the real estate sector and may fluctuate more widely than that of a fund which invests in a | |
| broader range of industries.The securities of issuers that are principally engaged in the real estate | |
| sector may be subject to risks similar to those associated with the direct ownership of real estate. | |
| Because the fund seeks to provide exposure to alternative or non-traditional (i.e., satellite) asset | |
| categories or investment strategies, the fund’s performance will be linked to the performance of these | |
| highly volatile asset categories and strategies.Accordingly, investors should consider purchasing | |
| shares of the fund only as part of an overall diversified portfolio and should be willing to assume | |
| the risks of potentially significant fluctuations in the value of fund shares. | |
| 1 | Total return includes reinvestment of dividends and any capital gains paid, and does not take into |
| consideration the maximum initial sales charge in the case of Class A shares, or the applicable | |
| contingent deferred sales charge imposed on redemptions in the case of Class C shares. Had these | |
| charges been reflected, returns would have been lower. Past performance is no guarantee of future | |
| results. Share price and investment return fluctuate such that upon redemption, fund shares may be | |
| worth more or less than their original cost. Return figures provided reflect the absorption of certain | |
| fund expenses by The Dreyfus Corporation pursuant to an agreement in effect until March 1, | |
| 2012. Had these expenses not been absorbed, the fund’s returns would have been lower. | |
| 2 | SOURCE: LIPPER INC. — Reflects reinvestment of net dividends and, where applicable, |
| capital gain distributions.The Morgan Stanley Capital International (MSCI) World Index is an | |
| unmanaged index of global stock market performance, including the United States, Canada, | |
| Europe,Australia, New Zealand and the Far East. |
TheFund 5
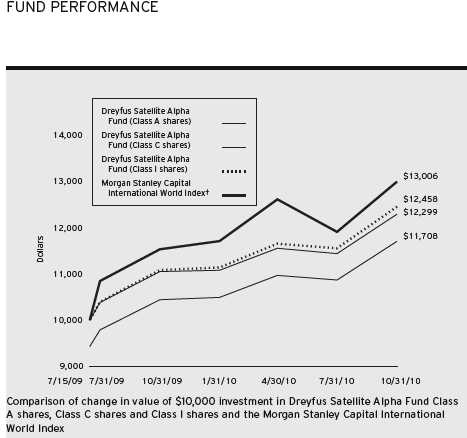
† Source: Lipper Inc.
Past performance is not predictive of future performance.
The above graph compares a $10,000 investment made in Class A, Class C and Class I shares of Dreyfus Satellite Alpha Fund on 7/15/09 (inception date) to a $10,000 investment made in the Morgan Stanley Capital International World Index (the “Index”) on that date. For comparative purposes, the value of the Index on 6/30/09 is used as the beginning value on 7/15/09.All dividends and capital gain distributions are reinvested.
The fund’s performance shown in the line graph takes into account the maximum initial sales charge on Class A shares and all other applicable fees and expenses on all classes.The Index is an unmanaged index of global stock market performance, including the United States, Canada, Europe,Australia, New Zealand and the Far East. Unlike a mutual fund, the Index is not subject to charges, fees and other expenses. Investors cannot invest directly in any index. Further information relating to fund performance, including expense reimbursements, if applicable, is contained in the Financial Highlights section of the prospectus and elsewhere in this report.
6
| Average Annual Total Returns as of 10/31/10 | |||
| Inception | From | ||
| Date | 1 Year | Inception | |
| Class A shares | |||
| with maximum sales charge (5.75%) | 7/15/09 | 5.68% | 12.90% |
| without sales charge | 7/15/09 | 12.09% | 18.14% |
| Class C shares | |||
| with applicable redemption charge † | 7/15/09 | 10.24% | 17.25% |
| without redemption | 7/15/09 | 11.24% | 17.25% |
| Class I shares | 7/15/09 | 12.35% | 18.42% |
| Morgan Stanley Capital | |||
| International World Index†† | 6/30/09 | 12.74% | 21.79% |
| Past performance is not predictive of future performance.The fund’s performance shown in the graph and table does not | |
| reflect the deduction of taxes that a shareholder would pay on fund distributions or the redemption of fund shares. | |
| † | The maximum contingent deferred sales charge for Class C shares is 1% for shares redeemed within one year of the |
| date of purchase. | |
| †† | For comparative purposes, the value of the Index as of 6/30/09 is used as the beginning value on 7/15/09. |
TheFund 7
UNDERSTANDING YOUR FUND’S EXPENSES (Unaudited)
As a mutual fund investor, you pay ongoing expenses, such as management fees and other expenses. Using the information below, you can estimate how these expenses affect your investment and compare them with the expenses of other funds.You also may pay one-time transaction expenses, including sales charges (loads) and redemption fees, which are not shown in this section and would have resulted in higher total expenses. For more information, see your fund’s prospectus or talk to your financial adviser.
Review your fund’s expenses
The table below shows the expenses you would have paid on a $1,000 investment in Dreyfus Satellite Alpha Fund from May 1, 2010 to October 31, 2010. It also shows how much a $1,000 investment would be worth at the close of the period, assuming actual returns and expenses.
| Expenses and Value of a $1,000 Investment | |||
| assuming actual returns for the six months ended October 31, 2010 | |||
| Class A | Class C | Class I | |
| Expenses paid per $1,000† | $ 2.87 | $ 6.76 | $ 1.67 |
| Ending value (after expenses) | $1,067.40 | $1,063.70 | $1,068.70 |
| COMPARING YOUR FUND’S EXPENSES |
| WITH THOSE OF OTHER FUNDS (Unaudited) |
Using the SEC’s method to compare expenses
The Securities and Exchange Commission (SEC) has established guidelines to help investors assess fund expenses. Per these guidelines, the table below shows your fund’s expenses based on a $1,000 investment, assuming a hypothetical 5% annualized return. You can use this information to compare the ongoing expenses (but not transaction expenses or total cost) of investing in the fund with those of other funds.All mutual fund shareholder reports will provide this information to help you make this comparison. Please note that you cannot use this information to estimate your actual ending account balance and expenses paid during the period.
| Expenses and Value of a $1,000 Investment | |||
| assuming a hypothetical 5% annualized return for the six months ended October 31, 2010 | |||
| Class A | Class C | Class I | |
| Expenses paid per $1,000† | $ 2.80 | $ 6.61 | $ 1.63 |
| Ending value (after expenses) | $1,022.43 | $1,018.65 | $1,023.59 |
† Expenses are equal to the fund’s annualized expense ratio of .55% for Class A, 1.30% for Class C and .32% for Class I, multiplied by the average account value over the period, multiplied by 184/365 (to reflect the one-half year period).
8
| STATEMENT OF INVESTMENTS |
| October 31, 2010 |
| Registered Investment Companies—100.6% | Shares | Value ($) | |
| Dreyfus Emerging Markets Debt Local Currency Fund, Cl. I | 3,145 | a | 47,106 |
| Dreyfus Global Absolute Return Fund, Cl. I | 9,142 | a,b | 117,020 |
| Dreyfus Global Real Estate Securities Fund, Cl. I | 8,769 | a | 65,855 |
| Dreyfus Inflation Adjusted Securities Fund, | |||
| Institutional Shares | 4,084 | a | 54,812 |
| Dreyfus International Bond Fund, Cl. I | 2,067 | a | 36,588 |
| Dreyfus Natural Resources Fund, Cl. I | 2,083 | a,b | 50,763 |
| Emerging Markets Opportunity Fund, Cl. I | 1,897 | a | 21,564 |
| Total Investments (cost $337,819) | 100.6% | 393,708 | |
| Liabilities, Less Cash and Receivables | (.6%) | (2,518) | |
| Net Assets | 100.0% | 391,190 | |
| a | Investment in affiliated mutual fund. |
| b | Non-income producing security. |
| Portfolio Summary (Unaudited)† | |||
| Value (%) | Value (%) | ||
| Mutual Funds: Foreign Equity | 73.6 | Mutual Funds: Domestic Equity | 27.0 |
| 100.6 | |||
| † Based on net assets. |
| See notes to financial statements. |
TheFund 9
| STATEMENT OF ASSETS AND LIABILITIES |
| October 31, 2010 |
| Cost | Value | ||
| Assets ($): | |||
| Investments in affiliated issuers—See Statement of Investments | 337,819 | 393,708 | |
| Cash | 18,201 | ||
| Prepaid expenses | 28,433 | ||
| 440,342 | |||
| Liabilities ($): | |||
| Due to The Dreyfus Corporation and affiliates—Note 2(c) | 11,486 | ||
| Accrued expenses | 37,666 | ||
| 49,152 | |||
| Net Assets ($) | 391,190 | ||
| Composition of Net Assets ($): | |||
| Paid-in capital | 333,767 | ||
| Accumulated undistributed investment income—net | 6,109 | ||
| Accumulated net realized gain (loss) on investments | (4,575) | ||
| Accumulated net unrealized appreciation | |||
| (depreciation) on investments in affiliated issuers | 55,889 | ||
| Net Assets ($) | 391,190 | ||
| Net Asset Value Per Share | |||
| Class A | Class C | Class I | |
| Net Assets ($) | 192,010 | 83,770 | 115,410 |
| Shares Outstanding | 12,376 | 5,453 | 7,419 |
| Net Asset Value Per Share ($) | 15.51 | 15.36 | 15.56 |
| See notes to financial statements. | |||
10
| STATEMENT OF OPERATIONS |
| Year Ended October 31, 2010 |
| Investment Income ($): | |
| Income: | |
| Cash dividends from affiliated issuers | 7,469 |
| Expenses: | |
| Registration fees | 44,088 |
| Audit fees | 41,242 |
| Legal fees | 36,190 |
| Prospectus and shareholders’ reports | 7,953 |
| Custodian fees—Note 2(c) | 1,423 |
| Shareholder servicing costs—Note 2(c) | 928 |
| Distribution fees—Note 2(b) | 563 |
| Directors’ fees and expenses—Note 2(d) | 221 |
| Miscellaneous | 6,986 |
| Total Expenses | 139,594 |
| Less—expense reimbursement from The Dreyfus | |
| Corporation due to undertaking—Note 2(a) | (137,385) |
| Less—reduction in fees due to earnings credits—Note 2(c) | (2) |
| Net Expenses | 2,207 |
| Investment Income—Net | 5,262 |
| Realized and Unrealized Gain (Loss) on Investments—Note 3 ($): | |
| Net realized gain (loss) on investments in affiliated issuers | (4,844) |
| Capital gain distributions from affiliated issuers | 907 |
| Net Realized Gain (Loss) | (3,937) |
| Net unrealized appreciation (depreciation) | |
| on investments in affiliated issuers | 36,155 |
| Net Realized and Unrealized Gain (Loss) on Investments | 32,218 |
| Net Increase in Net Assets Resulting from Operations | 37,480 |
| See notes to financial statements. | |
TheFund 11
STATEMENT OF CHANGES IN NET ASSETS
| Year Ended October 31, | ||
| 2010 | 2009a | |
| Operations ($): | ||
| Investment income (loss)—net | 5,262 | (29) |
| Net realized gain (loss) on | ||
| investments in affiliated issuers | (3,937) | 94 |
| Net unrealized appreciation (depreciation) | ||
| on investments in affiliated issuers | 36,155 | 19,734 |
| Net Increase (Decrease) in Net Assets | ||
| Resulting from Operations | 37,480 | 19,799 |
| Dividends to Shareholders from ($): | ||
| Investment income—net: | ||
| Class A Shares | (12) | — |
| Class I Shares | (122) | — |
| Net realized gain on investments: | ||
| Class A Shares | (35) | — |
| Class C Shares | (15) | — |
| Class I Shares | (46) | — |
| Total Dividends | (230) | — |
| Capital Stock Transactions ($): | ||
| Net proceeds from shares sold: | ||
| Class A Shares | 10,015 | 152,216 |
| Class C Shares | 5,250 | 65,376 |
| Class I Shares | 178,433 | 52,500 |
| Dividends reinvested: | ||
| Class A Shares | 47 | — |
| Class C Shares | 15 | — |
| Class I Shares | 56 | — |
| Cost of shares redeemed: | ||
| Class A Shares | (14) | — |
| Class I Shares | (129,753) | — |
| Increase (Decrease) in Net Assets | ||
| from Capital Stock Transactions | 64,049 | 270,092 |
| Total Increase (Decrease) in Net Assets | 101,299 | 289,891 |
| Net Assets ($): | ||
| Beginning of Period | 289,891 | — |
| End of Period | 391,190 | 289,891 |
| Undistributed investment income—net | 6,109 | 122 |
12
| Year Ended October 31, | ||
| 2010 | 2009a | |
| Capital Share Transactions: | ||
| Class A | ||
| Shares sold | 690 | 11,684 |
| Shares issued for dividends reinvested | 3 | — |
| Shares redeemed | (1) | — |
| Net Increase (Decrease) in Shares Outstanding | 692 | 11,684 |
| Class C | ||
| Shares sold | 378 | 5,074 |
| Shares issued for dividends reinvested | 1 | ��� |
| Net Increase (Decrease) in Shares Outstanding | 379 | 5,074 |
| Class I | ||
| Shares sold | 12,361 | 4,179 |
| Shares issued for dividends reinvested | 4 | — |
| Shares redeemed | (9,125) | — |
| Net Increase (Decrease) in Shares Outstanding | 3,240 | 4,179 |
| a From July 15, 2009 (commencement of operations) to October 31, 2009. | ||
| See notes to financial statements. | ||
TheFund 13
FINANCIAL HIGHLIGHTS
The following tables describe the performance for each share class for the fiscal periods indicated.All information (except portfolio turnover rate) reflects financial results for a single fund share.Total return shows how much your investment in the fund would have increased (or decreased) during each period, assuming you had reinvested all dividends and distributions.These figures have been derived from the fund’s financial statements.
| Year Ended October 31, | ||
| Class A Shares | 2010 | 2009a |
| Per Share Data ($): | ||
| Net asset value, beginning of period | 13.85 | 12.50 |
| Investment Operations: | ||
| Investment income—netb | .18 | .00c |
| Net realized and unrealized | ||
| gain (loss) on investments | 1.48 | 1.35 |
| Total from Investment Operations | 1.66 | 1.35 |
| Distributions: | ||
| Dividends from investment income—net | (.00)c | — |
| Dividends from net realized gain on investments | (.00)c | — |
| Total Distributions | (.00)c | — |
| Net asset value, end of period | 15.51 | 13.85 |
| Total Return (%)d | 12.09 | 10.80e |
| Ratios/Supplemental Data (%): | ||
| Ratio of total expenses to average net assetsf | 37.30 | 100.93g |
| Ratio of net expenses to average net assetsf | .53 | .50g |
| Ratio of net investment income | ||
| to average net assetsf | 1.24 | .08g |
| Portfolio Turnover Rate | 56.19 | 4.35e |
| Net Assets, end of period ($ x 1,000) | 192 | 162 |
| a | From July 15, 2009 (commencement of operations) to October 31, 2009. |
| b | Based on average shares outstanding at each month end. |
| c | Amount represents less than $.01 per share. |
| d | Exclusive of sales charge. |
| e | Not annualized. |
| f | Amounts do not include the activity of the underlying funds. |
| g | Annualized. |
| See notes to financial statements. | |
14
| Year Ended October 31, | ||
| Class C Shares | 2010 | 2009a |
| Per Share Data ($): | ||
| Net asset value, beginning of period | 13.82 | 12.50 |
| Investment Operations: | ||
| Investment income (loss)—netb | .07 | (.03) |
| Net realized and unrealized | ||
| gain (loss) on investments | 1.47 | 1.35 |
| Total from Investment Operations | 1.54 | 1.32 |
| Distributions: | ||
| Dividends from net realized gain on investments | (.00)c | — |
| Net asset value, end of period | 15.36 | 13.82 |
| Total Return (%)d | 11.24 | 10.56e |
| Ratios/Supplemental Data (%): | ||
| Ratio of total expenses to average net assetsf | 37.80 | 104.02g |
| Ratio of net expenses to average net assetsf | 1.28 | 1.25g |
| Ratio of net investment income | ||
| (loss) to average net assetsf | .48 | (.67)g |
| Portfolio Turnover Rate | 56.19 | 4.35e |
| Net Assets, end of period ($ x 1,000) | 84 | 70 |
| a | From July 15, 2009 (commencement of operations) to October 31, 2009. |
| b | Based on average shares outstanding at each month end. |
| c | Amount represents less than $.01 per share. |
| d | Exclusive of sales charge. |
| e | Not annualized. |
| f | Amounts do not include the activity of the underlying funds. |
| g | Annualized. |
| See notes to financial statements. | |
TheFund 15
FINANCIAL HIGHLIGHTS (continued)
| Year Ended October 31, | ||
| Class I Shares | 2010 | 2009a |
| Per Share Data ($): | ||
| Net asset value, beginning of period | 13.86 | 12.50 |
| Investment Operations: | ||
| Investment income—netb | .34 | .01 |
| Net realized and unrealized | ||
| gain (loss) on investments | 1.37 | 1.35 |
| Total from Investment Operations | 1.71 | 1.36 |
| Distributions: | ||
| Dividends from investment income—net | (.01) | — |
| Dividends from net realized gain on investments | (.00)c | — |
| Total Distributions | (.01) | — |
| Net asset value, end of period | 15.56 | 13.86 |
| Total Return (%) | 12.35 | 10.88d |
| Ratios/Supplemental Data (%): | ||
| Ratio of total expenses to average net assetse | 37.32 | 106.59f |
| Ratio of net expenses to average net assetse | .28 | .25f |
| Ratio of net investment income | ||
| to average net assetse | 2.20 | .34f |
| Portfolio Turnover Rate | 56.19 | 4.35d |
| Net Assets, end of period ($ x 1,000) | 115 | 58 |
| a | From July 15, 2009 (commencement of operations) to October 31, 2009. |
| b | Based on average shares outstanding at each month end. |
| c | Amount represents less than $.01 per share. |
| d | Not annualized. |
| e | Amounts do not include the activity of the underlying funds. |
| f | Annualized. |
| See notes to financial statements. | |
16
NOTES TO FINANCIAL STATEMENTS
NOTE 1—Significant Accounting Policies:
Dreyfus Satellite Alpha Fund (the “fund”) is a separate diversified series of Dreyfus Premier Investment Funds, Inc. (the “Company”), which is registered under the Investment Company Act of 1940, as amended (the “Act”), as an open-end management investment company and operates as a series company currently offering ten series, including the fund.The fund’s investment objective is to seek long-term capital appreciation. The Dreyfus Corporation (the “Manager” or “Dreyfus”), a wholly-owned subsidiary of The Bank of New York Mellon Corporation (“BNY Mellon”), serves as the fund’s investment adviser.
MBSC Securities Corporation (the “Distributor”), a wholly-owned subsidiary of the Manager, is the distributor of the fund’s shares. The fund is authorized to issue 50 million shares of $.001 par value Common Stock in each of the following classes of shares: Class A, Class C, and Class I. Class A shares are subject to a sales charge imposed at the time of purchase. Class C shares are subject to a contingent deferred sales charge (“CDSC”) imposed on Class C shares redeemed within one year of purchase. Class I shares are sold at net asset value per share only to institutional investors. Other differences between the classes include the services offered to and the expenses borne by each class, the allocation of certain transfer agency costs and certain voting rights. Income, expenses (other than expenses attributable to a specific class), and realized and unrealized gains or losses on investme nts are allocated to each class of shares based on its relative net assets.
As of October 31, 2010, MBC Investments Corp., an indirect subsidiary of BNY Mellon, held 8,002 Class A, 4,001 Class C and 4,003 Class I shares of the fund.
The Company accounts separately for the assets, liabilities and operations of each series. Expenses directly attributable to each series are charged to that series’ operations; expenses which are applicable to all series are allocated among them on a pro rata basis.
TheFund 17
NOTES TO FINANCIAL STATEMENTS (continued)
The Financial Accounting Standards Board (“FASB”) Accounting Standards Codification (“ASC”) is the exclusive reference of authoritative U.S. generally accepted accounting principles (“GAAP”) recognized by the FASB to be applied by nongovernmental entities. Rules and interpretive releases of the Securities and Exchange Commission (“SEC”) under authority of federal laws are also sources of authoritative GAAP for SEC registrants. The fund’s financial statements are prepared in accordance with GAAP, which may require the use of management estimates and assumptions.Actual results could differ from those estimates.
The Company enters into contracts that contain a variety of indemnifications.The fund’s maximum exposure under these arrangements is unknown.The fund does not anticipate recognizing any loss related to these arrangements.
(a) Portfolio valuation: Investments are valued at the net asset value of each underlying fund determined as of the close of the New York Stock Exchange (generally 4 p.m., Eastern time) on the valuation date.
The fair value of a financial instrument is the amount that would be received to sell an asset or paid to transfer a liability in an orderly transaction between market participants at the measurement date (i.e. the exit price). GAAP establishes a fair value hierarchy that prioritizes the inputs of valuation techniques used to measure fair value.This hierarchy gives the highest priority to unadjusted quoted prices in active markets for identical assets or liabilities (Level 1 measurements) and the lowest priority to unobservable inputs (Level 3 measurements).
Additionally, GAAP provides guidance on determining whether the volume and activity in a market has decreased significantly and whether such a decrease in activity results in transactions that are not orderly. GAAP requires enhanced disclosures around valuation inputs and techniques used during annual and interim periods.
18
Various inputs are used in determining the value of the fund’s investments relating to fair value measurements.These inputs are summarized in the three broad levels listed below:
Level 1—unadjusted quoted prices in active markets for identical investments.
Level 2—other significant observable inputs (including quoted prices for similar investments, interest rates, prepayment speeds, credit risk, etc.).
Level 3—significant unobservable inputs (including the fund’s own assumptions in determining the fair value of investments).
The inputs or methodology used for valuing securities are not necessarily an indication of the risk associated with investing in those securities.
The following is a summary of the inputs used as of October 31, 2010 in valuing the fund’s investments:
| Level 2—Other | Level 3— | |||
| Level 1— | Significant | Significant | ||
| Unadjusted | Observable | Unobservable | ||
| Quoted Prices | Inputs | Inputs | Total | |
| Assets ($) | ||||
| Investments in Securities: | ||||
| Mutual Funds | 393,708 | — | — | 393,708 |
In January 2010, FASB issued Accounting Standards Update (“ASU”) No. 2010-06 “Improving Disclosures about FairValue Measurements”. The portions of ASU No. 2010-06 which require reporting entities to prepare new disclosures surrounding amounts and reasons for significant transfers in and out of Level 1 and Level 2 fair value measurements as well as inputs and valuation techniques used to measure fair value for both recurring and nonrecurring fair value measurements that fall in either Level 2 or Level 3 have been adopted by the fund. No significant transfers between Level 1 or Level 2 fair value measurements occurred
TheFund 19
NOTES TO FINANCIAL STATEMENTS (continued)
at October 31, 2010. The remaining portion of ASU No. 2010-06 requires reporting entities to make new disclosures about information on purchases, sales, issuances and settlements on a gross basis in the reconciliation of activity in Level 3 fair value measurements. These new and revised disclosures are required to be implemented for fiscal years beginning after December 15, 2010. Management is currently evaluating the impact that the adoption of this remaining portion of ASU No. 2010-06 may have on the fund’s financial statement disclosures.
(b) Securities transactions and investment income: Securities transactions are recorded on a trade date basis. Realized gains and losses from securities transactions are recorded on the identified cost basis. Dividend income is recognized on the ex-dividend date and interest income, including, where applicable, accretion of discount and amortization of premium on investments, is recognized on the accrual basis.
(c) Affiliated issuers: Investments in other investment companies advised by Dreyfus are defined as “affiliated” in the Act.
The fund may invest in shares of certain affiliated investment companies also advised or managed by Dreyfus. Investments in affiliated investment companies for the period ended October 31, 2010 were as follows:
| Affiliated | |||||
| Investment | Value | Dividends/ | |||
| Company | 10/31/2009 ($) | Purchases ($) | Sales ($) | Distributions ($) | |
| Dreyfus Emerging | |||||
| Markets Debt Local | |||||
| Currency Fund, Cl. I | 14,222 | 36,166 | 8,302 | 517 | |
| Dreyfus Global Absolute | |||||
| Return Fund, Cl. I | 85,466 | 89,539 | 65,392 | — | |
| Dreyfus Global Real Estate | |||||
| Securities Fund, Cl. I | 46,501 | 33,285 | 21,462 | 4,098 | |
| Dreyfus Inflation Adjusted | |||||
| Securities Fund, | |||||
| Institutional Shares | 42,240 | 30,490 | 21,462 | 1,301 | |
| Dreyfus International | |||||
| Bond Fund, Cl. I | 42,969 | 30,129 | 37,886 | 2,004 | |
| Dreyfus Natural | |||||
| Resources Fund, Cl. I | 29,773 | 30,845 | 14,289 | — | |
| Emerging Markets | |||||
| Opportunity Fund, Cl. I | 29,140 | 29,304 | 38,879 | 456 | |
| Total | 290,311 | 279,758 | 207,672 | 8,376 | |
20
| Change in Net | |||||
| Affiliated | Unrealized | ||||
| Investment | Net Realized | Appreciation | Value | Net | |
| Company | Gain/(Loss) ($) | (Depreciation) ($) | 10/31/2010 ($) | Assets (%) | |
| Dreyfus Emerging | |||||
| Markets Debt Local | |||||
| Currency Fund, Cl. I | (91) | 5,111 | 47,106 | 12.0 | |
| Dreyfus Global Absolute | |||||
| Return Fund, Cl. I | (75) | 7,482 | 117,020 | 29.9 | |
| Dreyfus Global Real Estate | |||||
| Securities Fund, Cl. I | (1,576) | 9,107 | 65,855 | 16.8 | |
| Dreyfus Inflation Adjusted | |||||
| Securities Fund, | |||||
| Institutional Shares | (128) | 3,672 | 54,812 | 14.0 | |
| Dreyfus International | |||||
| Bond Fund, Cl. I | (1,409) | 2,785 | 36,588 | 9.4 | |
| Dreyfus Natural | |||||
| Resources Fund, Cl. I | (599) | 5,033 | 50,763 | 13.0 | |
| Emerging Markets | |||||
| Opportunity Fund, Cl. I | (966) | 2,965 | 21,564 | 5.5 | |
| Total | (4,844) | 36,155 | 393,708 | 100.6 | |
(d) Dividends to shareholders: Dividends are recorded on the ex-dividend date. Dividends from investment income-net and dividends from net realized capital gains, if any, are normally declared and paid annually, but the fund may make distributions on a more frequent basis to comply with the distribution requirements of the Internal Revenue Code of 1986, as amended (the “Code”).To the extent that net realized capital gains can be offset by capital loss carryovers, it is the policy of the fund not to distribute such gains. Income and capital gain distributions are determined in accordance with income tax regulations, which may differ from GAAP.
(e) Federal income taxes: It is the policy of the fund to continue to qualify as a regulated investment company, if such qualification is in the best interests of its shareholders, by complying with the applicable provisions of the Code, and to make distributions of taxable income sufficient to relieve it from substantially all federal income and excise taxes.
As of and during the period ended October 31, 2010, the fund did not have any liabilities for any uncertain tax positions.The fund recognizes interest and penalties, if any, related to uncertain tax positions as
TheFund 21
NOTES TO FINANCIAL STATEMENTS (continued)
income tax expense in the Statement of Operations. During the period, the fund did not incur any interest or penalties.
Each of the tax years in two-year period ended October 31, 2010 remains subject to examination by the Internal Revenue Service and state taxing authorities.
At October 31, 2010, the components of accumulated earnings on a tax basis were as follows: undistributed ordinary income $6,109, accumulated capital losses $4,149 and unrealized appreciation $55,463.
The accumulated capital loss carryover is available to be applied against future net securities profits, if any, realized subsequent to October 31, 2010. If not applied, the carryover expires in fiscal 2018.
The tax character of distributions paid to shareholders during the fiscal periods ended October 31, 2010 and October 31, 2009 were as follows: ordinary income $230 and $0, respectively.
During the period ended October 31, 2010, as a result of permanent book to tax differences, primarily due to the tax treatment for short-term capital gain distributions from regulated investment company holdings, the fund increased accumulated undistributed investment income-net by $859, decreased net realized gain (loss) on investments by $636 and decreased paid-in capital by $223. Net assets and net asset value per share were not affected by this reclassification.
NOTE 2—Management Fee and Other Transactions with Affiliates:
(a) Pursuant to a management agreement with the Manager, there is no management fee paid to the Manager. The fund invests in other mutual funds advised by the Manager. All fees and expenses of the underlying funds are reflected in the underlying fund’s net asset value.
The Manager has contractually agreed, until March 1, 2012, to assume the expenses of the fund so that the total annual fund and underlying fund’s expenses (excluding Rule 12b-1 fees, shareholder services fees, taxes, interest, brokerage commissions and extraordinary expenses) do
22
not exceed 1.35% of the value of the fund’s average daily net assets. The expense reimbursement, pursuant to the undertaking, amounted to $137,385 during the period ended October 31, 2010.
(b) Under the Distribution Plan (the “Plan”) adopted pursuant to Rule 12b-1 under the Act, Class C shares pay the Distributor for distributing its shares at an annual rate of .75% of the value of the average daily net assets of Class C shares. During the period ended October 31, 2010, Class C shares were charged $563 pursuant to the Plan.
(c) Under the Shareholder Services Plan, Class A and Class C shares pay the Distributor at an annual rate of .25% of the value of their average daily net assets for the provision of certain services.The services provided may include personal services relating to shareholder accounts, such as answering shareholder inquiries regarding the fund and providing reports and other information, and services related to the maintenance of shareholder accounts.The Distributor may make payments to Service Agents (a securities dealer, financial institution or other industry professional) in respect of these services. The Distributor determines the amounts to be paid to Service Agents. During the period ended October 31, 2010, Class A and Class C shares were charged $431 and $188, respectively, pursuant to the Shareholder Services Plan.
The fund compensates Dreyfus Transfer, Inc., a wholly-owned subsidiary of the Manager, under a transfer agency agreement for providing personnel and facilities to perform transfer agency services for the fund. During the period ended October 31, 2010, the fund was charged $324 pursuant to the transfer agency agreement, which is included in Shareholder servicing costs in the Statement of Operations.
The fund has arrangements with the custodian and cash management bank whereby the fund may receive earnings credits when positive cash balances are maintained, which are used to offset custody and cash management fees. For financial reporting purposes, the fund includes net earnings credits as an expense offset in the Statement of Operations.
TheFund 23
NOTES TO FINANCIAL STATEMENTS (continued)
The fund compensates The Bank of NewYork Mellon, a subsidiary of BNY Mellon and an affiliate of Dreyfus, under a cash management agreement for performing cash management services related to fund subscriptions and redemptions. During the period ended October 31, 2010, the fund was charged $25 pursuant to the cash management agreement, which is included in Shareholder servicing costs in the Statement of Operations. These fees were partially offset by earnings credits of $2.
The fund also compensates The Bank of New York Mellon under a custody agreement for providing custodial services for the fund. During the period ended October 31, 2010, the fund was charged $1,423 pursuant to the custody agreement.
During the period ended October 31, 2010, the fund was charged $6,114 for services performed by the Chief Compliance Officer.
The components of “Due to The Dreyfus Corporation and affiliates” in the Statement of Assets and Liabilities consist of: Rule 12b-1 distribution plan fees $53, shareholder services plan fees $58, custodian fees $411, chief compliance officer fees $2,248, other expenses $33,812 and transfer agency per account fees $30, which are offset against an expense reimbursement currently in effect in the amount of $25,126.
(d) Each Board member also serves as a Board member of other funds within the Dreyfus complex. Annual retainer fees and attendance fees are allocated to each fund based on net assets.
24
NOTE 3—Securities Transactions:
The aggregate amount of purchases and sales of investment securities, excluding short-term securities, during the period ended October 31, 2010, amounted to $279,758 and $207,672, respectively.
The provisions of ASC Topic 815 “Derivatives and Hedging” require qualitative disclosures about objectives and strategies for using derivatives, quantitative disclosures about fair value amounts of gains and losses on derivative instruments and disclosures about credit-risk-related contingent features in derivative agreements.The fund held no derivatives during the period ended October 31, 2010.
At October 31, 2010, the cost of investments for federal income tax purposes was $338,245; accordingly, accumulated net unrealized appreciation on investments was $55,463, consisting of $55,463 gross unrealized appreciation.
TheFund 25
| REPORT OF INDEPENDENT REGISTERED |
| PUBLIC ACCOUNTING FIRM |
Shareholders and Board of Directors
Dreyfus Satellite Alpha Fund
We have audited the accompanying statement of assets and liabilities, including the statement of investments, of Dreyfus Satellite Alpha Fund (one of the series comprising Dreyfus Premier Investment Funds, Inc.) as of October 31, 2010, and the related statement of operations for the year then ended and the statement of changes in net assets and financial highlights for the year then ended and for the period from July 15, 2009 (commencement of operations) to October 31, 2009. These financial statements and financial highlights are the responsibility of the Fund’s management. Our responsibility is to express an opinion on these financial statements and financial highlights based on our audits.
We conducted our audits in accordance with the standards of the Public Company Accounting Oversight Board (United States).Those standards require that we plan and perform the audit to obtain reasonable assurance about whether the financial statements and financial highlights are free of material misstatement.We were not engaged to perform an audit of the Fund’s internal control over financial reporting. Our audits included consideration of internal control over financial reporting as a basis for designing audit procedures that are appropriate in the circumstances, but not for the purpose of expressing an opinion on the effectiveness of the Fund’s internal control over financial reporting. Accordingly, we express no such opinion. An audit also includes examining, on a test basis, evidence supporting the amounts and disclosures in the financial statements and financial highlights, assessing the accounting principles used and significant estimates made by management, and evaluating the overall financial statement presentation. Our procedures included confirmation of securities owned as of October 31, 2010 by correspondence with the custodian and others.We believe that our audits provide a reasonable basis for our opinion.
In our opinion, the financial statements and financial highlights referred to above present fairly, in all material respects, the financial position of Dreyfus Satellite Alpha Fund at October 31, 2010, the results of its operations for the year then ended and the changes in its net assets and the financial highlights for the year then ended and for the period from July 15, 2009 to October 31, 2009, in conformity with U.S. generally accepted accounting principles.

New York, New York
December 28, 2010
26
IMPORTANT TAX INFORMATION (Unaudited)
In accordance with federal tax law, the fund hereby designates 100% of the ordinary dividends paid during the fiscal year ended October 31, 2010 as qualifying for the corporate dividends received deduction. For the fiscal year ended October 31, 2010, certain dividends paid by the fund may be subject to a maximum tax rate of 15%, as provided for by the Jobs and GrowthTax Relief Reconciliation Act of 2003. Of the distributions paid during the fiscal year, $230 represents the maximum amount that may be considered qualified dividend income. Shareholders will receive notification in early 2011 of the percentage applicable to the preparation of their 2010 income tax returns.Also, the fund hereby designates $.0030 per share as a short-term capital gain distribution paid on December 30, 2009.
TheFund 27
| INFORMATION ABOUT THE REVIEW AND APPROVAL |
| OF THE FUND’S MANAGEMENT AGREEMENT (Unaudited) |
At a meeting of the fund’s Board held on July 13, 2010, the Board considered the re-approval of the fund’s Management Agreement with Dreyfus for a one-year term ending July 31, 2011.The Board members, none of whom are “interested persons” (as defined in the Investment Company Act of 1940, as amended) of the fund, were assisted in their review by independent legal counsel and met with counsel in executive session separate from representatives of Dreyfus. In considering the re-approval of the Management Agreement, the Board considered all factors that it believed to be relevant, including, among other things, the factors discussed below.
Analysis of Nature, Extent and Quality of Services Provided to the Fund.The Board members received a presentation from representatives of Dreyfus regarding services provided to the fund and other funds in the Dreyfus fund complex, and discussed the nature, extent and quality of the services provided to the fund pursuant to its Management Agreement. Dreyfus’ representatives reviewed the fund’s distribution of accounts and the relationships Dreyfus has with various intermediaries and the different needs of each. Dreyfus’ representatives noted the various distribution channels for the fund as well as the diverse methods of distribution among other funds in the Dreyfus fund complex, and Dreyfus’ corresponding need for broad, deep, and diverse resources to be able to provide ongoing shareholder services to each distrib ution channel, including those of the fund. Dreyfus also provided the number of accounts investing in the fund, as well as the fund’s asset size.
The Board members also considered Dreyfus’ research and portfolio management capabilities and Dreyfus’ oversight of day-to-day fund operations, including fund accounting, administration and assistance in meeting legal and regulatory requirements. The Board members also considered Dreyfus’ extensive administrative, accounting and compliance infrastructure.
Comparative Analysis of the Fund’s Performance and Management Fee and Expense Ratio. The Board members reviewed the fund’s performance for the ten-month period ended May 31, 2010, and compared the fund’s performance to the performance of one other retail front-end
28
load global flexible portfolio fund and one flexible portfolio fund that are passively managed affiliated funds of funds (the “Performance Group”) and to a larger universe of funds consisting of all retail and institutional global flexible portfolio funds (the “Performance Universe”), selected and provided by Lipper, Inc., an independent provider of investment company data.The Board was provided with a description of the methodology Lipper used to select the Performance Group and Performance Universe, as well as the Expense Group and Expense Universe (discussed below).The Board members discussed the results of the comparisons and noted that the fund’s total return performance for the ten-month period ended May 31, 2010 was ranked second of the three funds in the Performance Group and above the Performance Universe median. Dreyfus also provided a comparison of the fund’s calendar year total returns to the returns of the fund’s benchmark index.
The Board members also discussed the fund’s management fee and expense ratio and reviewed the range of actual and contractual management fees and total expense ratios of two comparable funds (the “Expense Group”) and a broader group of three comparable funds (the “Expense Universe”), each selected and provided by Lipper.The Board members noted that the fund’s management fees are paid only at the underlying funds level and the fund’s total expense ratio was generally in the middle of the Expense Group and Expense Universe.The Board members noted that Dreyfus has contractually agreed, until March 1, 2011, to assume the expenses of the fund so that the total annual fund and underlying funds operating expenses of none of the classes (excluding Rule 12b-1 fees, shareholder services fees, taxes, interest, brokerage commissions, commitment fees on borrowings and extraordinary expenses) exceed 1.35%.
Representatives of Dreyfus reviewed with the Board members the fees paid to Dreyfus or its affiliates by the mutual funds managed by Dreyfus or its affiliates with similar investment objectives, policies and strategies, and included in the same Lipper category as the fund (the “Similar Funds”). It was noted that there were no other accounts managed by
TheFund 29
| INFORMATION ABOUT THE REVIEW AND APPROVAL OF THE |
| FUND’S MANAGEMENT AGREEMENT (Unaudited) (continued) |
Dreyfus or its affiliates with similar investment objectives, policies and strategies as the fund.The Board members considered the relevance of the fee information provided for the Similar Funds managed to evaluate the appropriateness and reasonableness of the fund’s management fee.
Analysis of Profitability and Economies of Scale. Dreyfus would not have direct profits from the fund’s management fee, since the fund would pay no direct management fee. Similarly, economies of scale were not relevant.The Board members considered potential benefits to Dreyfus from acting as investment adviser.
At the conclusion of these discussions, the Board agreed that it had been furnished with sufficient information to make an informed business decision with respect to re-approving the Management Agreement. Based on the discussions and considerations as described above, the Board made the following conclusions and determinations.
The Board concluded that the nature, extent and quality of the services provided by Dreyfus are adequate and appropriate.
The Board was satisfied with the fund’s relative performance.
Since the fund would not pay a direct management fee, profitability and economies of scale were not relevant.
The Board members considered these conclusions and determinations, along with information received on a routine and regular basis throughout the year, and, without any one factor being dispositive, the Board determined that re-approval of the Management Agreement through July 31, 2011 was in the best interests of the fund and its shareholders.
30

OFFICERS OF THE FUND (Unaudited)
BRADLEY J. SKAPYAK, President since January 2010.
Chief Operating Officer and a director of the Manager since June 2009. From April 2003 to June 2009, Mr. Skapyak was the head of the Investment Accounting and Support Department of the Manager. He is an officer of 76 investment companies (comprised of 170 portfolios) managed by the Manager. He is 51 years old and has been an employee of the Manager since February 1988.
PHILLIP N. MAISANO, Executive Vice President since July 2007.
Chief Investment Officer,Vice Chair and a director of the Manager, and an officer of 76 investment companies (comprised of 170 portfolios) managed by the Manager. Mr. Maisano also is an officer and/or Board member of certain other investment management subsidiaries of The Bank of New York Mellon Corporation, each of which is an affiliate of the Manager. He is 63 years old and has been an employee of the Manager since November 2006. Prior to joining the Manager, Mr. Maisano served as Chairman and Chief Executive Officer of EACM Advisors, an affiliate of the Manager, since August 2004.
MICHAEL A. ROSENBERG, Vice President and Secretary since August 2005.
Assistant General Counsel of BNY Mellon, and an officer of 77 investment companies (comprised of 195 portfolios) managed by the Manager. He is 50 years old and has been an employee of the Manager since October 1991.
KIESHA ASTWOOD, Vice President and Assistant Secretary since January 2010.
Counsel of BNY Mellon, and an officer of 77 investment companies (comprised of 195 portfolios) managed by the Manager. She is 37 years old and has been an employee of the Manager since July 1995.
JAMES BITETTO, Vice President and Assistant Secretary since August 2005.
Senior Counsel of BNY Mellon and Secretary of the Manager, and an officer of 77 investment companies (comprised of 195 portfolios) managed by the Manager. He is 44 years old and has been an employee of the Manager since December 1996.
JONI LACKS CHARATAN, Vice President and Assistant Secretary since August 2005.
Senior Counsel of BNY Mellon, and an officer of 77 investment companies (comprised of 195 portfolios) managed by the Manager. She is 54 years old and has been an employee of the Manager since October 1988.
JOSEPH M. CHIOFFI, Vice President and Assistant Secretary since August 2005.
Senior Counsel of BNY Mellon, and an officer of 77 investment companies (comprised of 195 portfolios) managed by the Manager. He is 48 years old and has been an employee of the Manager since June 2000.
KATHLEEN DENICHOLAS, Vice President and Assistant Secretary since January 2010.
Senior Counsel of BNY Mellon, and an officer of 77 investment companies (comprised of 195 portfolios) managed by the Manager. She is 36 years old and has been an employee of the Manager since February 2001.
JANETTE E. FARRAGHER, Vice President and Assistant Secretary since August 2005.
Assistant General Counsel of BNY Mellon, and an officer of 77 investment companies (comprised of 195 portfolios) managed by the Manager. She is 47 years old and has been an employee of the Manager since February 1984.
TheFund 33
OFFICERS OF THE FUND (Unaudited) (continued)
JOHN B. HAMMALIAN, Vice President and Assistant Secretary since August 2005.
Managing Counsel of BNY Mellon, and an officer of 77 investment companies (comprised of 195 portfolios) managed by the Manager. He is 47 years old and has been an employee of the Manager since February 1991.
M. CRISTINA MEISER, Vice President and Assistant Secretary since January 2010.
Senior Counsel of BNY Mellon, and an officer of 77 investment companies (comprised of 195 portfolios) managed by the Manager. She is 40 years old and has been an employee of the Manager since August 2001.
ROBERT R. MULLERY, Vice President and Assistant Secretary since August 2005.
Managing Counsel of BNY Mellon, and an officer of 77 investment companies (comprised of 195 portfolios) managed by the Manager. He is 58 years old and has been an employee of the Manager since May 1986.
JEFF PRUSNOFSKY, Vice President and Assistant Secretary since August 2005.
Managing Counsel of BNY Mellon, and an officer of 77 investment companies (comprised of 195 portfolios) managed by the Manager. He is 45 years old and has been an employee of the Manager since October 1990.
JAMES WINDELS, Treasurer since November 2001.
Director – Mutual Fund Accounting of the Manager, and an officer of 77 investment companies (comprised of 195 portfolios) managed by the Manager. He is 52 years old and has been an employee of the Manager since April 1985.
RICHARD CASSARO, Assistant Treasurer since January 2008.
Senior Accounting Manager – Money Market and Municipal Bond Funds of the Manager, and an officer of 77 investment companies (comprised of 195 portfolios) managed by the Manager. He is 51 years old and has been an employee of the Manager since September 1982.
GAVIN C. REILLY, Assistant Treasurer since August 2005.
Tax Manager of the Investment Accounting and Support Department of the Manager, and an officer of 77 investment companies (comprised of 195 portfolios) managed by the Manager. He is 42 years old and has been an employee of the Manager since April 1991.
ROBERT ROBOL, Assistant Treasurer since August 2005.
Senior Accounting Manager – Fixed Income Funds of the Manager, and an officer of 77 investment companies (comprised of 195 portfolios) managed by the Manager. He is 46 years old and has been an employee of the Manager since October 1988.
ROBERT SALVIOLO, Assistant Treasurer since July 2007.
Senior Accounting Manager – Equity Funds of the Manager, and an officer of 77 investment companies (comprised of 195 portfolios) managed by the Manager. He is 43 years old and has been an employee of the Manager since June 1989.
34
ROBERT SVAGNA, Assistant Treasurer
since August 2002.
NATALIA GRIBAS, Anti-Money Laundering
Compliance Officer since July 2010.
Senior Accounting Manager – Equity Funds of the Manager, and an officer of 77 investment companies (comprised of 195 portfolios) managed by the Manager. He is 43 years old and has been an employee of the Manager since November 1990.
JOSEPH W. CONNOLLY, Chief Compliance Officer since October 2004.
Chief Compliance Officer of the Manager and The Dreyfus Family of Funds (77 investment companies, comprised of 195 portfolios). From November 2001 through March 2004, Mr. Connolly was first Vice-President, Mutual Fund Servicing for Mellon Global Securities Services. In that capacity, Mr. Connolly was responsible for managing Mellon’s Custody, Fund Accounting and Fund Administration services to third-party mutual fund clients. He is 53 years old and has served in various capacities with the Manager since 1980, including manager of the firm’s Fund Accounting Department from 1997 through October 2001.
Anti-Money Laundering Compliance Officer of the Distributor, and the Anti-Money Laundering Compliance Officer of 73 investment companies (comprised of 191 portfolios) managed by the Manager. She is 40 years old and has been an employee of the Distributor since September 2008.
TheFund 35
NOTES
Item 2. Code of Ethics.
The Registrant has adopted a code of ethics that applies to the Registrant's principal executive officer, principal financial officer, principal accounting officer or controller, or persons performing similar functions. There have been no amendments to, or waivers in connection with, the Code of Ethics during the period covered by this Report.
Item 3. Audit Committee Financial Expert.
The Registrant's Board has determined that David P. Feldman, a member of the Audit Committee of the Board, is an audit committee financial expert as defined by the Securities and Exchange Commission (the "SEC"). David P. Feldman is "independent" as defined by the SEC for purposes of audit committee financial expert determinations.
Item 4. Principal Accountant Fees and Services.
(a) Audit Fees. The aggregate fees billed for each of the last two fiscal years (the "Reporting Periods") for professional services rendered by the Registrant's principal accountant (the "Auditor") for the audit of the Registrant's annual financial statements or services that are normally provided by the Auditor in connection with the statutory and regulatory filings or engagements for the Reporting Periods, were $158,580 in 2009 and $158,580 in 2010.
(b) Audit-Related Fees. The aggregate fees billed in the Reporting Periods for assurance and related services by the Auditor that are reasonably related to the performance of the audit of the Registrant's financial statements and are not reported under paragraph (a) of this Item 4 were $15,828 in 2009 and $39,292 in 2010. These services consisted of one or more of the following: (i) agreed upon procedures related to compliance with Internal Revenue Code section 817(h), (ii) security counts required by Rule 17f-2 under the Investment Company Act of 1940, as amended, (iii) advisory services as to the accounting or disclosure treatment of Registrant transactions or events a nd (iv) advisory services to the accounting or disclosure treatment of the actual or potential impact to the Registrant of final or proposed rules, standards or interpretations by the Securities and Exchange Commission, the Financial Accounting Standards Boards or other regulatory or standard-setting bodies.
The aggregate fees billed in the Reporting Periods for non-audit assurance and related services by the Auditor to the Registrant's investment adviser (not including any sub-investment adviser whose role is primarily portfolio management and is subcontracted with or overseen by another investment adviser), and any entity controlling, controlled by or under common control with the investment adviser that provides ongoing services to the Registrant ("Service Affiliates"), that were reasonably related to the performance of the annual audit of the Service Affiliate, which required pre-approval by the Audit Committee were $ 0 in 2009 and $0 in 2010.
(c) Tax Fees. The aggregate fees billed in the Reporting Periods for professional services rendered by the Auditor for tax compliance, tax advice, and tax planning ("Tax Services") were $9,217 in 2009 and $13,345i n 2010. These services consisted of: (i) review or preparation of U.S. federal, state, local and excise tax returns; (ii) U.S. federal, state and local tax planning, advice and assistance regarding statutory, regulatory or administrative developments; (iii) tax advice regarding tax qualification matters and/or treatment of various financial instrument s held or proposed to be acquired or held, and (iv) determination of Passive Foreign Investment Companies. The aggregate fees billed in the Reporting Periods for Tax Services by the Auditor to Service Affiliates, which required pre-approval by the Audit Committee were $ 0 in 2009 and $ 0 in 2010.
(d) All Other Fees. The aggregate fees billed in the Reporting Periods for products and services provided by the Auditor, other than the services reported in paragraphs (a) through (c) of this Item, were $ 105 in 2009 and $506 in 2010. [These services consisted of a review of the Registrant's anti-money laundering program].
-3-
The aggregate fees billed in the Reporting Periods for Non-Audit Services by the Auditor to Service Affiliates, other than the services reported in paragraphs (b) through (c) of this Item, which required pre-approval by the Audit Committee, were $0 in 2009 and $0 in 2010.
(e)(1) Audit Committee Pre-Approval Policies and Procedures. The Registrant's Audit Committee has established policies and procedures (the "Policy") for pre-approval (within specified fee limits) of the Auditor's engagements for non-audit services to the Registrant and Service Affiliates without specific case-by-case consideration. The pre-approved services in the Policy can include pre-approved audit services, pre-approved audit-related services, pre-approved tax services and pre-approved all other services. Pre-approval considerations include whether the proposed services are compatible with maintaining the Auditor's independence. Pre-approvals pursuant to the Policy are considered annually.
(e)(2) Note: None of the services described in paragraphs (b) through (d) of this Item 4 were approved by the Audit Committee pursuant to paragraph (c)(7)(i)(C) of Rule 2-01 of Regulation S-X.
(f) None of the hours expended on the principal accountant's engagement to audit the registrant's financial statements for the most recent fiscal year were attributed to work performed by persons other than the principal account's full-time, permanent employees.
Non-Audit Fees. The aggregate non-audit fees billed by the Auditor for services rendered to the Registrant, and rendered to Service Affiliates, for the Reporting Periods were $25,383,429 in 2009 and $31,544,905 in 2010.
Auditor Independence. The Registrant's Audit Committee has considered whether the provision of non-audit services that were rendered to Service Affiliates, which were not pre-approved (not requiring pre-approval), is compatible with maintaining the Auditor's independence.
Item 5. Audit Committee of Listed Registrants.
Not applicable. [CLOSED-END FUNDS ONLY]
Item 6. Investments.
(a) Not applicable.
Item 7. Disclosure of Proxy Voting Policies and Procedures for Closed-End Management Investment Companies.
Not applicable. [CLOSED-END FUNDS ONLY]
Item 8. Portfolio Managers of Closed-End Management Investment Companies.
Not applicable. [CLOSED-END FUNDS ONLY, beginning with reports for periods ended on and after December 31, 2005]
Item 9. Purchases of Equity Securities by Closed-End Management Investment Companies and Affiliated Purchasers.
Not applicable. [CLOSED-END FUNDS ONLY]
-4-
Item 10. Submission of Matters to a Vote of Security Holders.
There have been no material changes to the procedures applicable to Item 10.
Item 11. Controls and Procedures.
(a) The Registrant's principal executive and principal financial officers have concluded, based on their evaluation of the Registrant's disclosure controls and procedures as of a date within 90 days of the filing date of this report, that the Registrant's disclosure controls and procedures are reasonably designed to ensure that information required to be disclosed by the Registrant on Form N-CSR is recorded, processed, summarized and reported within the required time periods and that information required to be disclosed by the Registrant in the reports that it files or submits on Form N-CSR is accumulated and communicated to the Registrant's management, including its principal executive and principal financial officers, as appropriate to allow timely decisions regarding required disclosure.
(b) There were no changes to the Registrant's internal control over financial reporting that occurred during the second fiscal quarter of the period covered by this report that have materially affected, or are reasonably likely to materially affect, the Registrant's internal control over financial reporting.
Item 12. Exhibits.
(a)(1) Code of ethics referred to in Item 2.
(a)(2) Certifications of principal executive and principal financial officers as required by Rule 30a-2(a) under the Investment Company Act of 1940.
(a)(3) Not applicable.
(b) Certification of principal executive and principal financial officers as required by Rule 30a-2(b) under the Investment Company Act of 1940.
-5-
SIGNATURES
Pursuant to the requirements of the Securities Exchange Act of 1934 and the Investment Company Act of 1940, the Registrant has duly caused this Report to be signed on its behalf by the undersigned, thereunto duly authorized.
Dreyfus Premier Investment Funds, Inc.
By: /s/ Bradley J. Skapyak | |
Bradley J. Skapyak, President
| |
Date: | December 23, 2010 |
| |
Pursuant to the requirements of the Securities Exchange Act of 1934 and the Investment Company Act of 1940, this Report has been signed below by the following persons on behalf of the Registrant and in the capacities and on the dates indicated. | |
| |
By: /s/ Bradley J. Skapyak | |
Bradley J. Skapyak, President
| |
Date: | December 23, 2010 |
| |
By: /s/ James Windels | |
James Windels, Treasurer
| |
Date: | December 23, 2010 |
| |
EXHIBIT INDEX
(a)(1) Code of ethics referred to in Item 2.
(a)(2) Certifications of principal executive and principal financial officers as required by Rule 30a-2(a) under the Investment Company Act of 1940. (EX-99.CERT)
(b) Certification of principal executive and principal financial officers as required by Rule 30a-2(b) under the Investment Company Act of 1940. (EX-99.906CERT)
-6-
Exhibit A
Persons Covered by the Code of Ethics
Bradley J. Skapyak | President | (Principal Executive Officer) |
|
|
|
James Windels |
Treasurer | (Principal Financial and Accounting Officer) |
Revised as of January 1, 2010
-8-