UNITED STATES
SECURITIES AND EXCHANGE COMMISSION
Washington, D.C. 20549
FORM N-CSR
CERTIFIED SHAREHOLDER REPORT OF REGISTERED MANAGEMENT
INVESTMENT COMPANIES
Investment Company Act file number | 811- 6490 | |||||
|
| |||||
| Dreyfus Premier Investment Funds, Inc. |
| ||||
| (Exact name of Registrant as specified in charter) |
| ||||
|
|
| ||||
|
c/o The Dreyfus Corporation 200 Park Avenue New York, New York 10166 |
| ||||
| (Address of principal executive offices) (Zip code) |
| ||||
|
|
| ||||
| John Pak, Esq. 200 Park Avenue New York, New York 10166 |
| ||||
| (Name and address of agent for service) |
| ||||
| ||||||
Registrant's telephone number, including area code: | (212) 922-6000 | |||||
|
| |||||
Date of fiscal year end:
| 12/31 |
| ||||
Date of reporting period: | 12/31/13 |
| ||||
The following N-CSR relates only to the Registrant's series listed below and does not affect the other series of the Registrant, which has a different fiscal year end and, therefore, different N-CSR reporting requirements. A separate N-CSR Form will be filed for this series, as appropriate.
DREYFUS PREMIER INVESTMENT FUNDS, INC.
- Dreyfus Large Cap Equity Fund
- Dreyfus Large Cap Growth Fund
Save time. Save paper. View your next shareholder report online as soon as it’s available. Log into www.dreyfus.com and sign up for Dreyfus eCommunications. It’s simple and only takes a few minutes.
The views expressed in this report reflect those of the portfolio manager only through the end of the period covered and do not necessarily represent the views of Dreyfus or any other person in the Dreyfus organization. Any such views are subject to change at any time based upon market or other conditions and Dreyfus disclaims any responsibility to update such views.These views may not be relied on as investment advice and, because investment decisions for a Dreyfus fund are based on numerous factors, may not be relied on as an indication of trading intent on behalf of any Dreyfus fund.
Contents | |
THE FUND | |
| 2 | A Letter from the President |
| 3 | Discussion of Fund Performance |
| 6 | Fund Performance |
| 8 | Understanding Your Fund’s Expenses |
| 8 | Comparing Your Fund’s Expenses With Those of Other Funds |
| 9 | Statement of Investments |
| 14 | Statement of Assets and Liabilities |
| 15 | Statement of Operations |
| 16 | Statement of Changes in Net Assets |
| 18 | Financial Highlights |
| 21 | Notes to Financial Statements |
| 32 | Report of Independent Registered Public Accounting Firm |
| 33 | Important Tax Information |
| 34 | Board Members Information |
| 36 | Officers of the Fund |
FOR MORE INFORMATION | |
Back Cover |
| Dreyfus |
| Large Cap Equity Fund |
| The Fund |
A LETTER FROM THE PRESIDENT
Dear Shareholder:
We are pleased to present this annual report for Dreyfus Large Cap Equity Fund, covering the 12-month period from January 1, 2013, through December 31, 2013. For information about how the fund performed during the reporting period, as well as general market perspectives, we provide a Discussion of Fund Performance on the pages that follow.
The year 2013 proved to be outstanding for U.S. equities. Large-cap stocks delivered their strongest calendar-year performance in well over a decade, and small- and midcap stocks fared even better in an environment of low short-term interest rates, rising corporate earnings, sustained economic growth, and low inflation. In our view, 2013 provided ample evidence of the value of patience and discipline in equity investing, as those who favored a long-term perspective over a focus on news headlines and short-term volatility reaped the rewards provided by rising markets.
Will stocks continue to rally in 2014? We believe that they can. We expect the domestic economy to continue to strengthen over the next year, particularly if U.S. fiscal policy is less restrictive and short-term interest rates remain near historical lows. Stronger growth could convince businesses and consumers to spend more freely, unleashing pent up demand as economic uncertainty wanes. However, we caution that gains in 2014 are unlikely to match those of the past year, and a highly selective approach to security selection could be key to greater relative investment success in the months ahead. As always, we urge you to speak with your financial adviser to identify the investment strategies that are right for you.
Thank you for your continued confidence and support.

J. Charles Cardona
President
The Dreyfus Corporation
January 15, 2014
2
DISCUSSION OF FUND PERFORMANCE
For the period of January 1, 2013, through December 31, 2013, as provided by Irene D. O’Neill, Portfolio Manager
Fund and Market Performance Overview
For the 12-month period ended December 31, 2013, Dreyfus Large Cap Equity Fund’s Class A shares achieved a total return of 33.64%, Class C shares returned 32.57%, and Class I shares returned 34.12%.1 In comparison, the fund’s benchmark, the Standard & Poor’s 500® Composite Stock Price Index (“S&P 500® Index”), produced a total return of 32.37% for the same period.2
U.S. stocks responded positively during the reporting period to recovering domestic and global economies.The fund produced higher returns than its benchmark, mainly due to the success of our security selection strategy in the financials, energy, and utilities sectors.
The Fund’s Investment Approach
The fund seeks to provide long-term capital appreciation.To pursue its goal, the fund normally invests at least 80% of its assets in equity securities of large-capitalization companies with market capitalizations of $5 billion or more at the time of purchase.
The fund invests primarily in large, established companies that we believe have proven track records and the potential for superior relative earnings growth. The investment process begins with a top-down assessment of broad economic, political, and social trends and their implications for different market and industry sectors. Using a bottom-up approach, fundamental research is used to identify companies with characteristics such as: earnings power unrecognized by the market; sustainable revenue and cash flow growth; positive operational and/or financial catalysts; attractive relative value versus history and peers, and strong or improving financial condition.
The Fund 3
DISCUSSION OF FUND PERFORMANCE (continued)
Economic Growth Fueled Market Gains
The year 2013 began in the midst of a sustained stock market rally driven by improved U.S. employment and housing markets. Investors were particularly encouraged by a new, open-ended round of quantitative easing from the Federal Reserve Board (the “Fed”). Improving conditions in overseas markets also contributed to improved investor sentiment.
Economic data continued to improve, and stocks rallied, through the spring of 2013. However, in late May, remarks by Fed Chairman Ben Bernanke were widely interpreted as a signal that U.S. monetary policymakers would back away from quantitative easing sooner than expected, sparking market declines in June.The S&P 500® Index generally stabilized over the summer, and stocks advanced strongly in September when the Fed refrained from tapering its bond purchasing program. Even a 16-day federal government shutdown in October failed to derail the rally.
Stocks continued to climb over the final two months of the year amid new releases of encouraging economic data. The announcement of a modest reduction in the Fed’s bond buying program in mid-December had little impact on stock prices, enabling the S&P 500® Index to end the year near record highs.
Financial Stocks Buoyed Relative Performance
The fund participated more than fully in the stock market’s gains in 2013, led by particularly strong security selections in the financials sector. We positioned the fund with relatively light exposure to companies that we believed would be hurt by more stringent government regulation, instead favoring those that stood to benefit from regulatory changes and rising financial markets. Winners among financial holdings included securities exchange IntercontinentalExchange Group, which acquired NYSE Euronext during the year; investment manager Invesco; banking institutions State Street, PNC Financial Services Group, and Capital One Financial; and insurer MetLife.
In the energy sector, we generally avoided large, integrated oil producers, which we believe have challenging growth prospects. We focused instead on refiners, such as Valero Energy, that experienced expanding profit margins stemming from ample supplies of low-cost, domestic crude oil. Oil services provider Halliburton also fared well due to lower operating costs and an expanded share buyback program.The fund
4
further benefited from an underweighted position in the lagging utilities sector, as well as stock selection. CenterPoint Energy and Sempra Energy rallied in anticipation of potentially transferring natural gas assets into newly created master limited partnerships.
Disappointments during 2013 were mostly concentrated in the information technology sector, where overweighted exposure to consumer electronics giant Apple weighed on results early in the year. In addition, semiconductor manufacturer Broadcom encountered problems with the launch of a new product, and IT services manager Equinix suffered with excess capacity in its data centers.
Finding Opportunities in Cyclical Market Sectors
We currently expect the U.S. and global economic recoveries to persist in 2014, and strengthening consumer and business confidence may serve as a catalyst for higher corporate earnings and rising stock prices. Consequently, we have continued to identify opportunities in some of the market’s more economically sensitive areas, including the energy, financials, information technology, and industrials sectors.We also have favored individual companies that we believe are participating in positive, secular trends. We generally have maintained underweighted exposure to the traditionally defensive consumer staples, telecommunications services, and utilities sectors, where we see obstacles to earnings growth.
January 15, 2014
Please note, the position in any security highlighted with italicized typeface was sold during the reporting period. Equity funds are subject generally to market, market sector, market liquidity, issuer and investment style risks, among other factors, to varying degrees, all of which are more fully described in the fund’s prospectus.
| 1 Total return includes reinvestment of dividends and any capital gains paid, and does not take into consideration the |
| maximum initial sales charge in the case of Class A shares, or the applicable contingent deferred sales charge imposed on |
| the redemption of Class C shares. Had these charges been reflected, returns would have been lower. Past performance is |
| no guarantee of future results. Share price and investment return fluctuate such that upon redemption fund shares may |
| be worth more or less than their original cost. Return figures provided reflect the absorption of certain fund expenses by |
| The Dreyfus Corporation pursuant to an agreement through May 1, 2014, at which time it may be extended, |
| terminated or modified. Had these expenses not been absorbed, the fund’s returns would have been lower. |
| 2 SOURCE: LIPPER INC. — Reflects reinvestment of dividends and, where applicable, capital gain distributions. |
| The Standard & Poor’s 500® Composite Stock Price Index is a widely accepted, unmanaged index of U.S. stock |
| market performance. Investors cannot invest directly in any index. |
The Fund 5
FUND PERFORMANCE
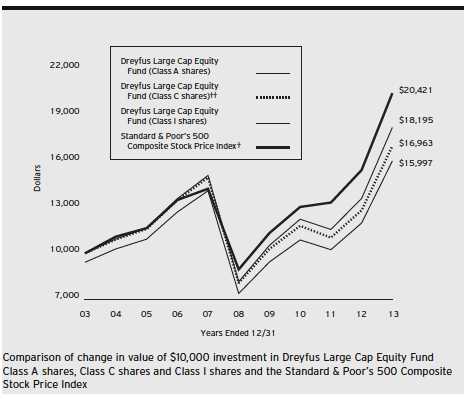
| † | Source: Lipper Inc. |
| †† | The total return figures presented for Class C shares of the fund reflect the performance of the fund’s Class A shares |
| for the period prior to 9/13/08 (the inception date for Class C shares). |
Past performance is not predictive of future performance.
The above graph compares a $10,000 investment made in each of the Class A, Class C and Class I shares of Dreyfus Large Cap Equity Fund on 12/31/03 to a $10,000 investment made in the Standard & Poor’s 500 Composite Stock Price Index (the “Index”) on that date. All dividends and capital gain distributions are reinvested.
The fund’s performance shown in the line graph above takes into account the maximum initial sales charge on Class A shares and all other applicable fees and expenses on all classes.The Index is a widely accepted, unmanaged index of U.S. stock market performance. Unlike a mutual fund, the Index is not subject to charges, fees and other expenses. Investors cannot invest directly in any index. Further information relating to fund performance, including expense reimbursements, if applicable, is contained in the Financial Highlights section of the prospectus and elsewhere in this report.
6
| Average Annual Total Returns as of 12/31/13 | |||||||
| Inception | |||||||
| Date | 1 | Year | 5 Years | 10 Years | |||
| Class A shares | |||||||
| with maximum sales charge (5.75%) | 8/10/92 | 26.00 | % | 15.32 | % | 4.81 | % |
| without sales charge | 8/10/92 | 33.64 | % | 16.70 | % | 5.43 | % |
| Class C shares | |||||||
| with applicable redemption charge † | 9/13/08 | 31.57 | % | 16.02 | % | 5.43 | %†† |
| without redemption | 9/13/08 | 32.57 | % | 16.02 | % | 5.43 | %†† |
| Class I shares | 8/10/92 | 34.12 | % | 17.41 | % | 6.17 | % |
| Standard & Poor’s 500 | |||||||
| Composite Stock Price Index | 32.37 | % | 17.93 | % | 7.40 | % | |
Past performance is not predictive of future performance.The fund’s performance shown in the graph and table does not reflect the deduction of taxes that a shareholder would pay on fund distributions or the redemption of fund shares.
| † | The maximum contingent deferred sales charge for Class C shares is 1% for shares redeemed within one year of the |
| date of purchase. | |
| †† | The total return performance figures presented for Class C shares of the fund reflect the performance of the fund’s |
| Class A shares for the period prior to 9/13/08 (the inception date for Class C shares). |
The Fund 7
UNDERSTANDING YOUR FUND’S EXPENSES (Unaudited)
As a mutual fund investor, you pay ongoing expenses, such as management fees and other expenses. Using the information below, you can estimate how these expenses affect your investment and compare them with the expenses of other funds.You also may pay one-time transaction expenses, including sales charges (loads) and redemption fees, which are not shown in this section and would have resulted in higher total expenses. For more information, see your fund’s prospectus or talk to your financial adviser.
Review your fund’s expenses
The table below shows the expenses you would have paid on a $1,000 investment in Dreyfus Large Cap Equity Fund from July 1, 2013 to December 31, 2013. It also shows how much a $1,000 investment would be worth at the close of the period, assuming actual returns and expenses.
Expenses and Value of a $1,000 Investment
assuming actual returns for the six months ended December 31, 2013
| Class A | Class C | Class I | ||||
| Expenses paid per $1,000† | $ | 6.23 | $ | 10.35 | $ | 4.25 |
| Ending value (after expenses) | $ | 1,188.60 | $ | 1,184.40 | $ | 1,191.40 |
COMPARING YOUR FUND’S EXPENSES
WITH THOSE OF OTHER FUNDS (Unaudited)
Using the SEC’s method to compare expenses
The Securities and Exchange Commission (SEC) has established guidelines to help investors assess fund expenses. Per these guidelines, the table below shows your fund’s expenses based on a $1,000 investment, assuming a hypothetical 5% annualized return. You can use this information to compare the ongoing expenses (but not transaction expenses or total cost) of investing in the fund with those of other funds.All mutual fund shareholder reports will provide this information to help you make this comparison. Please note that you cannot use this information to estimate your actual ending account balance and expenses paid during the period.
Expenses and Value of a $1,000 Investment
assuming a hypothetical 5% annualized return for the six months ended December 31, 2013
| Class A | Class C | Class I | ||||
| Expenses paid per $1,000† | $ | 5.75 | $ | 9.55 | $ | 3.92 |
| Ending value (after expenses) | $ | 1,019.51 | $ | 1,015.73 | $ | 1,021.32 |
| † Expenses are equal to the fund’s annualized expense ratio of 1.13% for Class A, 1.88% for Class C and .77% |
| for Class I, multiplied by the average account value over the period, multiplied by 184/365 (to reflect the one-half |
| year period). |
8
STATEMENT OF INVESTMENTS
December 31, 2013
| Common Stocks—96.7% | Shares | Value ($) | |
| Automobiles & Components—2.4% | |||
| Harley-Davidson | 72,990 | 5,053,828 | |
| Johnson Controls | 82,790 | 4,247,127 | |
| 9,300,955 | |||
| Banks—4.2% | |||
| Ocwen Financial | 71,450 | a | 3,961,903 |
| PNC Financial Services Group | 52,170 | 4,047,349 | |
| Wells Fargo & Co. | 181,800 | 8,253,720 | |
| 16,262,972 | |||
| Capital Goods—10.0% | |||
| Caterpillar | 40,340 | 3,663,275 | |
| Dover | 56,900 | 5,493,126 | |
| Eaton | 76,100 | 5,792,732 | |
| General Electric | 213,030 | 5,971,231 | |
| Honeywell International | 61,770 | 5,643,925 | |
| Ingersoll-Rand | 105,100 | 6,474,160 | |
| United Technologies | 48,570 | 5,527,266 | |
| 38,565,715 | |||
| Consumer Durables & Apparel—1.1% | |||
| PVH | 32,500 | 4,420,650 | |
| Consumer Services—2.5% | |||
| Las Vegas Sands | 69,660 | 5,494,084 | |
| Yum! Brands | 54,110 | 4,091,257 | |
| 9,585,341 | |||
| Diversified Financials—7.5% | |||
| Capital One Financial | 55,400 | 4,244,194 | |
| IntercontinentalExchange Group | 32,580 | 7,327,894 | |
| Invesco | 185,946 | 6,768,434 | |
| JPMorgan Chase & Co. | 60,020 | 3,509,970 | |
| State Street | 97,270 | 7,138,645 | |
| 28,989,137 |
The Fund 9
STATEMENT OF INVESTMENTS (continued)
| Common Stocks (continued) | Shares | Value ($) | ||
| Energy—11.6% | ||||
| Cabot Oil & Gas | 111,340 | 4,315,538 | ||
| Chevron | 38,850 | 4,852,753 | ||
| Exxon Mobil | 42,480 | 4,298,976 | ||
| Halliburton | 82,490 | 4,186,367 | ||
| Marathon Oil | 143,500 | 5,065,550 | ||
| National Oilwell Varco | 66,000 | 5,248,980 | ||
| Plains GP Holdings, Cl. A | 53,400 | 1,429,518 | ||
| Schlumberger | 53,050 | 4,780,336 | ||
| Southwestern Energy | 155,700 | a | 6,123,681 | |
| Valero Energy | 86,640 | 4,366,656 | ||
| 44,668,355 | ||||
| Food & Staples Retailing—1.1% | ||||
| Costco Wholesale | 35,580 | 4,234,376 | ||
| Food, Beverage & Tobacco—5.9% | ||||
| Beam | 69,060 | 4,700,224 | ||
| Coca-Cola | 88,190 | 3,643,129 | ||
| Mondelez International, Cl. A | 126,240 | 4,456,272 | ||
| PepsiCo | 75,940 | 6,298,464 | ||
| Philip Morris International | 43,160 | 3,760,531 | ||
| 22,858,620 | ||||
| Health Care Equipment & Services—1.1% | ||||
| Express Scripts Holding | 59,430 | a | 4,174,363 | |
| Household & Personal Products—1.8% | ||||
| Procter & Gamble | 84,965 | 6,917,001 | ||
| Insurance—4.9% | ||||
| Aon | 83,050 | 6,967,064 | ||
| Fidelity National Financial, Cl. A | 148,400 | 4,815,580 | ||
| MetLife | 133,000 | 7,171,360 | ||
| 18,954,004 | ||||
| Materials—2.8% | ||||
| Celanese, Ser. A | 69,600 | 3,849,576 |
10
| Common Stocks (continued) | Shares | Value ($) | ||
| Materials (continued) | ||||
| Freeport-McMoRan Copper & Gold | 73,000 | 2,755,020 | ||
| Nucor | 74,600 | 3,982,148 | ||
| 10,586,744 | ||||
| Media—2.9% | ||||
| Comcast, Cl. A | 126,210 | 6,558,503 | ||
| Walt Disney | 59,440 | 4,541,216 | ||
| 11,099,719 | ||||
| Pharmaceuticals, Biotech & | ||||
| Life Sciences—11.4% | ||||
| Actavis | 25,010 | a | 4,201,680 | |
| Allergan | 35,340 | 3,925,567 | ||
| Amgen | 45,300 | 5,171,448 | ||
| Bristol-Myers Squibb | 103,600 | 5,506,340 | ||
| Gilead Sciences | 63,730 | a | 4,789,309 | |
| Pfizer | 207,280 | 6,348,986 | ||
| Shire, ADR | 35,690 | 5,042,640 | ||
| Teva Pharmaceutical Industries, ADR | 128,800 | 5,162,304 | ||
| Thermo Fisher Scientific | 31,760 | 3,536,476 | ||
| 43,684,750 | ||||
| Retailing—3.5% | ||||
| Amazon.com | 17,000 | a | 6,779,430 | |
| Family Dollar Stores | 36,590 | 2,377,252 | ||
| Lowe’s | 83,610 | 4,142,875 | ||
| 13,299,557 | ||||
| Semiconductors & Semiconductor | ||||
| Equipment—2.7% | ||||
| Avago Technologies | 93,990 | 4,971,131 | ||
| KLA-Tencor | 32,590 | 2,100,751 | ||
| Taiwan Semiconductor | ||||
| Manufacturing, ADR | 183,520 | 3,200,589 | ||
| 10,272,471 |
The Fund 11
STATEMENT OF INVESTMENTS (continued)
| Common Stocks (continued) | Shares | Value ($) | ||
| Software & Services—10.8% | ||||
| Accenture, Cl. A | 17,750 | 1,459,405 | ||
| Adobe Systems | 80,670 | a | 4,830,520 | |
| Facebook, Cl. A | 44,900 | a | 2,454,234 | |
| Google, Cl. A | 10,850 | a | 12,159,703 | |
| salesforce.com | 94,840 | a,b | 5,234,220 | |
| ServiceNow | 100,070 | a | 5,604,921 | |
| VMware, Cl. A | 28,950 | a | 2,597,105 | |
| Yahoo! | 177,670 | a | 7,184,975 | |
| 41,525,083 | ||||
| Technology Hardware & | ||||
| Equipment—4.7% | ||||
| Alcatel-Lucent, ADR | 1,031,700 | b | 4,539,480 | |
| Apple | 24,100 | 13,522,751 | ||
| 18,062,231 | ||||
| Telecommunication Services—1.0% | ||||
| AT&T | 53,250 | 1,872,270 | ||
| Verizon Communications | 37,660 | 1,850,612 | ||
| 3,722,882 | ||||
| Transportation—.7% | ||||
| Union Pacific | 15,600 | 2,620,800 | ||
| Utilities—2.1% | ||||
| CenterPoint Energy | 165,900 | 3,845,562 | ||
| Sempra Energy | 46,150 | 4,142,424 | ||
| 7,987,986 | ||||
| Total Common Stocks | ||||
| (cost $303,358,584) | 371,793,712 | |||
| Other Investment—1.9% | ||||
| Registered Investment Company; | ||||
| Dreyfus Institutional Preferred | ||||
| Plus Money Market Fund | ||||
| (cost $7,247,616) | 7,247,616 | c | 7,247,616 | |
12
| Investment of Cash Collateral | |||
| for Securities Loaned—.5% | Shares | Value ($) | |
| Registered Investment Company; | |||
| Dreyfus Institutional Cash Advantage Fund | |||
| (cost $1,930,400) | 1,930,400 | c | 1,930,400 |
| Total Investments (cost $312,536,600) | 99.1 | % | 380,971,728 |
| Cash and Receivables (Net) | .9 | % | 3,469,147 |
| Net Assets | 100.0 | % | 384,440,875 |
ADR—American Depository Receipts
| a Non-income producing security. |
| b Security, or portion thereof, on loan.At December 31, 2013, the value of fund’s securities on loan was $5,892,971 |
| and the value of the collateral held by the fund was $6,116,920, consisting of cash collateral of $1,930,400 and |
| U.S. Government & Agency securities valued at $4,186,520. |
| c Investment in affiliated money market mutual fund. |
| Portfolio Summary (Unaudited)† | |||
| Value (%) | Value (%) | ||
| Energy | 11.6 | Semiconductors & | |
| Pharmaceuticals, | Semiconductor Equipment | 2.7 | |
| Biotech & Life Sciences | 11.4 | Consumer Services | 2.5 |
| Software & Services | 10.8 | Automobiles & Components | 2.4 |
| Capital Goods | 10.0 | Money Market Investments | 2.4 |
| Diversified Financials | 7.5 | Utilities | 2.1 |
| Food, Beverage & Tobacco | 5.9 | Household & Personal Products | 1.8 |
| Insurance | 4.9 | Consumer Durables & Apparel | 1.1 |
| Technology Hardware & Equipment | 4.7 | Food & Staples Retailing | 1.1 |
| Banks | 4.2 | Health Care Equipment & Services | 1.1 |
| Retailing | 3.5 | Telecommunication Services | 1.0 |
| Media | 2.9 | Transportation | .7 |
| Materials | 2.8 | 99.1 | |
| † Based on net assets. | |||
| See notes to financial statements. | |||
The Fund 13
STATEMENT OF ASSETS AND LIABILITIES
December 31, 2013
| Cost | Value | ||
| Assets ($): | |||
| Investments in securities—See Statement of Investments: | |||
| (including securities on loan, valued at $5,892,971)—Note 1(b): | |||
| Unaffiliated issuers | 303,358,584 | 371,793,712 | |
| Affiliated issuers | 9,178,016 | 9,178,016 | |
| Cash | 5,578,767 | ||
| Receivable for shares of Common Stock subscribed | 5,238,612 | ||
| Dividends and securities lending income receivable | 438,106 | ||
| Prepaid expenses | 15,784 | ||
| 392,242,997 | |||
| Liabilities ($): | |||
| Due to The Dreyfus Corporation and affiliates—Note 3(c) | 225,817 | ||
| Payable for investment securities purchased | 5,572,209 | ||
| Liability for securities on loan—Note 1(b) | 1,930,400 | ||
| Payable for shares of Common Stock redeemed | 49,486 | ||
| Accrued expenses | 24,210 | ||
| 7,802,122 | |||
| Net Assets ($) | 384,440,875 | ||
| Composition of Net Assets ($): | |||
| Paid-in capital | 337,350,689 | ||
| Accumulated undistributed investment income—net | 2,893,970 | ||
| Accumulated net realized gain (loss) on investments | (24,238,912 | ) | |
| Accumulated net unrealized appreciation | |||
| (depreciation) on investments | 68,435,128 | ||
| Net Assets ($) | 384,440,875 |
| Net Asset Value Per Share | |||
| Class A | Class C | Class I | |
| Net Assets ($) | 1,501,435 | 287,476 | 382,651,964 |
| Shares Outstanding | 99,707 | 18,884 | 24,207,160 |
| Net Asset Value Per Share ($) | 15.06 | 15.22 | 15.81 |
| See notes to financial statements. | |||
14
STATEMENT OF OPERATIONS
Year Ended December 31, 2013
| Investment Income ($): | ||
| Income: | ||
| Cash dividends (net of $28,105 foreign taxes withheld at source): | ||
| Unaffiliated issuers | 4,890,305 | |
| Affiliated issuers | 3,035 | |
| Income from securities lending—Note 1(b) | 3,967 | |
| Total Income | 4,897,307 | |
| Expenses: | ||
| Management fee—Note 3(a) | 1,787,890 | |
| Professional fees | 55,943 | |
| Registration fees | 43,584 | |
| Custodian fees—Note 3(c) | 32,019 | |
| Shareholder servicing costs—Note 3(c) | 25,316 | |
| Directors’ fees and expenses—Note 3(d) | 21,689 | |
| Prospectus and shareholders’ reports | 18,514 | |
| Loan commitment fees—Note 2 | 2,664 | |
| Distribution fees—Note 3(b) | 1,627 | |
| Miscellaneous | 14,499 | |
| Total Expenses | 2,003,745 | |
| Less—reduction in expenses due to undertaking—Note 3(a) | (900 | ) |
| Less—reduction in fees due to earnings credits—Note 3(c) | (73 | ) |
| Net Expenses | 2,002,772 | |
| Investment Income—Net | 2,894,535 | |
| Realized and Unrealized Gain (Loss) on Investments—Note 4 ($): | ||
| Net realized gain (loss) on investments | 33,986,729 | |
| Net realized gain (loss) on financial futures | 412,825 | |
| Net Realized Gain (Loss) | 34,399,554 | |
| Net unrealized appreciation (depreciation) on investments | 39,436,409 | |
| Net Realized and Unrealized Gain (Loss) on Investments | 73,835,963 | |
| Net Increase in Net Assets Resulting from Operations | 76,730,498 | |
| See notes to financial statements. | ||
The Fund 15
STATEMENT OF CHANGES IN NET ASSETS
| Year Ended December 31, | ||||
| 2013 | 2012 | |||
| Operations ($): | ||||
| Investment income—net | 2,894,535 | 2,807,145 | ||
| Net realized gain (loss) on investments | 34,399,554 | 6,343,854 | ||
| Net unrealized appreciation | ||||
| (depreciation) on investments | 39,436,409 | 20,833,978 | ||
| Net Increase (Decrease) in Net Assets | ||||
| Resulting from Operations | 76,730,498 | 29,984,977 | ||
| Dividends to Shareholders from ($): | ||||
| Investment income—net: | ||||
| Class A | (5,771 | ) | (3,602 | ) |
| Class C | (1,642 | ) | — | |
| Class I | (2,796,096 | ) | (1,706,543 | ) |
| Total Dividends | (2,803,509 | ) | (1,710,145 | ) |
| Capital Stock Transactions ($): | ||||
| Net proceeds from shares sold: | ||||
| Class A | 995,589 | 382,444 | ||
| Class C | 247,217 | 121,882 | ||
| Class I | 172,180,663 | 66,162,556 | ||
| Dividends reinvested: | ||||
| Class A | 4,986 | 3,270 | ||
| Class C | 1,435 | — | ||
| Class I | 690,049 | 315,000 | ||
| Cost of shares redeemed: | ||||
| Class A | (436,057 | ) | (311,681 | ) |
| Class C | (210,386 | ) | (44,848 | ) |
| Class I | (90,449,110 | ) | (36,698,907 | ) |
| Increase (Decrease) in Net Assets | ||||
| from Capital Stock Transactions | 83,024,386 | 29,929,716 | ||
| Total Increase (Decrease) in Net Assets | 156,951,375 | 58,204,548 | ||
| Net Assets ($): | ||||
| Beginning of Period | 227,489,500 | 169,284,952 | ||
| End of Period | 384,440,875 | 227,489,500 | ||
| Undistributed investment income—net | 2,893,970 | 2,802,944 | ||
16
| Year Ended December 31, | ||||
| 2013 | 2012 | |||
| Capital Share Transactions: | ||||
| Class Aa | ||||
| Shares sold | 76,054 | 34,519 | ||
| Shares issued for dividends reinvested | 405 | 289 | ||
| Shares redeemed | (34,432 | ) | (28,490 | ) |
| Net Increase (Decrease) in Shares Outstanding | 42,027 | 6,318 | ||
| Class Ca | ||||
| Shares sold | 18,013 | 10,727 | ||
| Shares issued for dividends reinvested | 114 | — | ||
| Shares redeemed | (15,228 | ) | (4,221 | ) |
| Net Increase (Decrease) in Shares Outstanding | 2,899 | 6,506 | ||
| Class I | ||||
| Shares sold | 12,126,494 | 5,716,498 | ||
| Shares issued for dividends reinvested | 53,492 | 26,582 | ||
| Shares redeemed | (6,936,847 | ) | (3,215,643 | ) |
| Net Increase (Decrease) in Shares Outstanding | 5,243,139 | 2,527,437 | ||
| a During the period ended December 31, 2013, 3,922 Class C shares representing $52,365 were exchanged for |
| 3,985 Class A shares. |
See notes to financial statements.
The Fund 17
FINANCIAL HIGHLIGHTS
The following tables describe the performance for each share class for the fiscal periods indicated. All information (except portfolio turnover rate) reflects financial results for a single fund share.Total return shows how much your investment in the fund would have increased (or decreased) during each period, assuming you had reinvested all dividends and distributions.These figures have been derived from the fund’s financial statements.
| Year Ended December 31, | |||||||||
| Class A Shares | 2013 | 2012 | 2011 | 2010 | 2009 | ||||
| Per Share Data ($): | |||||||||
| Net asset value, beginning of period | 11.38 | 9.79 | 10.45 | 9.14 | 7.16 | ||||
| Investment Operations: | |||||||||
| Investment income—neta | .11 | .11 | .06 | .03 | .05 | ||||
| Net realized and unrealized | |||||||||
| gain (loss) on investments | 3.69 | 1.54 | (.66 | ) | 1.35 | 1.93 | |||
| Total from Investment Operations | 3.80 | 1.65 | (.60 | ) | 1.38 | 1.98 | |||
| Distributions: | |||||||||
| Dividends from investment income—net | (.12 | ) | (.06 | ) | (.06 | ) | (.08 | ) | — |
| Settlement payment from | |||||||||
| unaffiliated third party | — | — | — | .01 | — | ||||
| Net asset value, end of period | 15.06 | 11.38 | 9.79 | 10.45 | 9.14 | ||||
| Total Return (%)b | 33.64 | 16.90 | (5.78 | ) | 15.23 | c | 27.62 | ||
| Ratios/Supplemental Data (%): | |||||||||
| Ratio of total expenses | |||||||||
| to average net assets | 1.19 | 1.30 | 1.34 | 2.04 | 3.75 | ||||
| Ratio of net expenses | |||||||||
| to average net assets | 1.13 | 1.25 | 1.17 | 1.50 | 1.50 | ||||
| Ratio of net investment income | |||||||||
| to average net assets | .81 | .96 | .56 | .30 | .61 | ||||
| Portfolio Turnover Rate | 66.65 | 34.07 | 47.87 | 43.92 | 59.68 | ||||
| Net Assets, end of period ($ x 1,000) | 1,501 | 657 | 503 | 374 | 262 | ||||
| a Based on average shares outstanding at each month end. |
| b Exclusive of sales charge. |
| c If settlement payment from an unaffiliated third party was not made, total return would have been 15.12%. |
See notes to financial statements.
18
| Year Ended December 31, | |||||||||
| Class C Shares | 2013 | 2012 | 2011 | 2010 | 2009 | ||||
| Per Share Data ($): | |||||||||
| Net asset value, beginning of period | 11.57 | 9.97 | 10.68 | 9.40 | 7.38 | ||||
| Investment Operations: | |||||||||
| Investment income (loss)—neta | .01 | .03 | (.03 | ) | (.02 | ) | (.00 | )b | |
| Net realized and unrealized | |||||||||
| gain (loss) on investments | 3.74 | 1.57 | (.66 | ) | 1.39 | 2.02 | |||
| Total from Investment Operations | 3.75 | 1.60 | (.69 | ) | 1.37 | 2.02 | |||
| Distributions: | |||||||||
| Dividends from investment income—net | (.10 | ) | — | (.02 | ) | (.09 | ) | — | |
| Settlement payment from | |||||||||
| unaffiliated third party | — | — | — | .00 | b | — | |||
| Net asset value, end of period | 15.22 | 11.57 | 9.97 | 10.68 | 9.40 | ||||
| Total Return (%)c | 32.57 | 16.05 | (6.47 | ) | 14.69 | d | 27.37 | ||
| Ratios/Supplemental Data (%): | |||||||||
| Ratio of total expenses | |||||||||
| to average net assets | 2.03 | 2.21 | 2.04 | 2.02 | 2.26 | ||||
| Ratio of net expenses | |||||||||
| to average net assets | 1.90 | 2.02 | 2.00 | 1.98 | 2.02 | ||||
| Ratio of net investment income | |||||||||
| (loss) to average net assets | .07 | .31 | (.24 | ) | (.18 | ) | (.02 | ) | |
| Portfolio Turnover Rate | 66.65 | 34.07 | 47.87 | 43.92 | 59.68 | ||||
| Net Assets, end of period ($ x 1,000) | 287 | 185 | 94 | 55 | 37 | ||||
| a Based on average shares outstanding at each month end. |
| b Amount represents less than $.01 per share. |
| c Exclusive of sales charge. |
| d The impact of the settlement payment from an unaffiliated third party on total return amounted to less than .01%. |
See notes to financial statements.
The Fund 19
FINANCIAL HIGHLIGHTS (continued)
| Year Ended December 31, | |||||||||
| Class I Shares | 2013 | 2012 | 2011 | 2010 | 2009 | ||||
| Per Share Data ($): | |||||||||
| Net asset value, beginning of period | 11.95 | 10.26 | 10.95 | 9.55 | 7.40 | ||||
| Investment Operations: | |||||||||
| Investment income—neta | .16 | .16 | .10 | .10 | .11 | ||||
| Net realized and unrealized | |||||||||
| gain (loss) on investments | 3.88 | 1.63 | (.69 | ) | 1.41 | 2.04 | |||
| Total from Investment Operations | 4.04 | 1.79 | (.59 | ) | 1.51 | 2.15 | |||
| Distributions: | |||||||||
| Dividends from investment income—net | (.18 | ) | (.10 | ) | (.10 | ) | (.12 | ) | — |
| Settlement payment from | |||||||||
| unaffiliated third party | — | — | — | .01 | — | ||||
| Net asset value, end of period | 15.81 | 11.95 | 10.26 | 10.95 | 9.55 | ||||
| Total Return (%) | 34.12 | 17.46 | (5.46 | ) | 16.09 | b | 29.05 | ||
| Ratios/Supplemental Data (%): | |||||||||
| Ratio of total expenses | |||||||||
| to average net assets | .78 | .81 | .81 | .80 | .86 | ||||
| Ratio of net expenses | |||||||||
| to average net assets | .78 | .81 | .81 | .77 | .78 | ||||
| Ratio of net investment income | |||||||||
| to average net assets | 1.14 | 1.39 | .92 | 1.02 | 1.37 | ||||
| Portfolio Turnover Rate | 66.65 | 34.07 | 47.87 | 43.92 | 59.68 | ||||
| Net Assets, end of period ($ x 1,000) | 382,652 | 226,648 | 168,688 | 194,970 | 184,456 | ||||
| a Based on average shares outstanding at each month end. |
| b If settlement payment from an unaffiliated third party was not made, total return would have been 15.99%. |
See notes to financial statements.
20
NOTES TO FINANCIAL STATEMENTS
NOTE 1—Significant Accounting Policies:
Dreyfus Large Cap Equity Fund (the “fund”) is a separate diversified series of Dreyfus Premier Investment Funds, Inc. (the “Company”), which is registered under the Investment Company Act of 1940, as amended (the “Act”), as an open-end management investment company and operates as a series company currently offering eight series, including the fund. The fund’s investment objective seeks to provide long-term capital appreciation.The Dreyfus Corporation (the “Manager” or “Dreyfus”), a wholly-owned subsidiary of The Bank of New York Mellon Corporation (“BNY Mellon”), serves as the fund’s investment adviser.
MBSC Securities Corporation (the “Distributor”), a wholly-owned subsidiary of the Manager, is the distributor of the fund’s shares. The fund is authorized to issue 250 million shares of $.001 par value Common Stock.The fund currently offers three Classes of shares: Class A (100 million shares authorized), Class C (50 million shares authorized) and Class I (100 million shares authorized). Class A shares generally are subject to a sales charge imposed at the time of purchase. Class C shares are subject to a contingent deferred sales charge (“CDSC”) imposed on Class C shares redeemed within one year of purchase. Class I shares are sold at net asset value per share only to institutional investors. Other differences between the classes include the services offered to and the expenses borne by each class, the allocation of certain transfer agency costs and certain voting rights. Income, expenses (other than expenses attributable to a specific class), and realized and unrealized gains or losses on investments are allocated to each class of shares based on its relative net assets.
The Fund 21
NOTES TO FINANCIAL STATEMENTS (continued)
The Company accounts separately for the assets, liabilities and operations of each series. Expenses directly attributable to each series are charged to that series’ operations; expenses which are applicable to all series are allocated among them on a pro rata basis.
The Financial Accounting Standards Board (“FASB”) Accounting Standards Codification is the exclusive reference of authoritative U.S. generally accepted accounting principles (“GAAP”) recognized by the FASB to be applied by nongovernmental entities. Rules and interpretive releases of the Securities and Exchange Commission (“SEC”) under authority of federal laws are also sources of authoritative GAAP for SEC registrants. The fund’s financial statements are prepared in accordance with GAAP, which may require the use of management estimates and assumptions.Actual results could differ from those estimates.
The Company enters into contracts that contain a variety of indemnifications. The fund’s maximum exposure under these arrangements is unknown.The fund does not anticipate recognizing any loss related to these arrangements.
(a) Portfolio valuation: The fair value of a financial instrument is the amount that would be received to sell an asset or paid to transfer a liability in an orderly transaction between market participants at the measurement date (i.e., the exit price). GAAP establishes a fair value hierarchy that prioritizes the inputs of valuation techniques used to measure fair value. This hierarchy gives the highest priority to unadjusted quoted prices in active markets for identical assets or liabilities (Level 1 measurements) and the lowest priority to unobservable inputs (Level 3 measurements).
Additionally, GAAP provides guidance on determining whether the volume and activity in a market has decreased significantly and whether such a decrease in activity results in transactions that are not orderly. GAAP requires enhanced disclosures around valuation inputs and techniques used during annual and interim periods.
22
Various inputs are used in determining the value of the fund’s investments relating to fair value measurements.These inputs are summarized in the three broad levels listed below:
Level 1—unadjusted quoted prices in active markets for identical investments.
Level 2—other significant observable inputs (including quoted prices for similar investments, interest rates, prepayment speeds, credit risk, etc.).
Level 3—significant unobservable inputs (including the fund’s own assumptions in determining the fair value of investments).
The inputs or methodology used for valuing securities are not necessarily an indication of the risk associated with investing in those securities.
Changes in valuation techniques may result in transfers in or out of an assigned level within the disclosure hierarchy. Valuation techniques used to value the fund’s investments are as follows:
Investments in securities are valued at the last sales price on the securities exchange or national securities market on which such securities are primarily traded. Securities listed on the National Market System for which market quotations are available are valued at the official closing price or, if there is no official closing price that day, at the last sales price. Securities not listed on an exchange or the national securities market, or securities for which there were no transactions, are valued at the average of the most recent bid and asked prices, except for open short positions, where the asked price is used for valuation purposes. Bid price is used when no asked price is available. Registered investment companies that are not traded on an exchange are valued at their net asset value. All of the preceding securities are categorized within Level 1 of the fair value hierarchy.
Fair valuing of securities may be determined with the assistance of a pricing service using calculations based on indices of domestic securi-
The Fund 23
NOTES TO FINANCIAL STATEMENTS (continued)
ties and other appropriate indicators, such as prices of relevant ADRs and financial futures. Utilizing these techniques may result in transfers between Level 1 and Level 2 of the fair value hierarchy.
When market quotations or official closing prices are not readily available, or are determined not to reflect accurately fair value, such as when the value of a security has been significantly affected by events after the close of the exchange or market on which the security is principally traded (for example, a foreign exchange or market), but before the fund calculates its net asset value, the fund may value these investments at fair value as determined in accordance with the procedures approved by the Company’s Board of Directors (the “Board”). Certain factors may be considered when fair valuing investments such as: fundamental analytical data, the nature and duration of restrictions on disposition, an evaluation of the forces that influence the market in which the securities are purchased and sold, and public trading in similar securities of the issuer or comparable issuers.These securities are either categorized within Level 2 or 3 of the fair value hierarchy depending on the relevant inputs used.
For restricted securities where observable inputs are limited, assumptions about market activity and risk are used and are categorized within Level 3 of the fair value hierarchy.
Financial futures, which are traded on an exchange, are valued at the last sales price on the securities exchange on which such securities are primarily traded or at the last sales price on the national securities market on each business day and are generally categorized within Level 1 of the fair value hierarchy.
The following is a summary of the inputs used as of December 31, 2013 in valuing the fund’s investments:
| Level 2—Other | Level 3— | |||
| Level 1— | Significant | Significant | ||
| Unadjusted | Observable | Unobservable | ||
| Quoted Prices | Inputs | Inputs | Total | |
| Assets ($) | ||||
| Investments in Securities: | ||||
| Equity Securities— | ||||
| Domestic | ||||
| Common Stocks† | 348,877,568 | — | — | 348,877,568 |
24
| Level 2—Other | Level 3— | |||
| Level 1— | Significant | Significant | ||
| Unadjusted | Observable | Unobservable | ||
| Quoted Prices | Inputs | Inputs | Total | |
| Assets ($) (continued) | ||||
| Investments in | ||||
| Securities (continued): | ||||
| Equity Securities— | ||||
| Foreign | ||||
| Common Stocks† | 22,916,144 | — | — | 22,916,144 |
| Mutual Funds | 9,178,016 | — | — | 9,178,016 |
| † | See Statement of Investments for additional detailed categorizations. |
At December 31, 2013, there were no transfers between Level 1 and Level 2 of the fair value hierarchy.
(b) Securities transactions and investment income: Securities transactions are recorded on a trade date basis. Realized gains and losses from securities transactions are recorded on the identified cost basis. Dividend income is recognized on the ex-dividend date and interest income, including, where applicable, accretion of discount and amortization of premium on investments, is recognized on the accrual basis.
Pursuant to a securities lending agreement with The Bank of New York Mellon, a subsidiary of BNY Mellon and an affiliate of Dreyfus, the fund may lend securities to qualified institutions. It is the fund’s policy that, at origination, all loans are secured by collateral of at least 102% of the value of U.S. securities loaned and 105% of the value of foreign securities loaned. Collateral equivalent to at least 100% of the market value of securities on loan is maintained at all times. Collateral is either in the form of cash, which can be invested in certain money market mutual funds managed by the Manager or U.S. Government and Agency securities. The fund is entitled to receive all dividends, interest and distributions on securities loaned, in addition to income earned as a result of the lending transaction. Should a borrower fail to return the securities in a timely manner, The Bank of New York Mellon is required to replace the securities for the benefit of the fund or credit the fund with the market value of the unreturned securities
The Fund 25
NOTES TO FINANCIAL STATEMENTS (continued)
and is subrogated to the fund’s rights against the borrower and the collateral. During the period ended December 31, 2013, The Bank of New York Mellon earned $825 from lending portfolio securities, pursuant to the securities lending agreement.
(c) Affiliated issuers: Investments in other investment companies advised by Dreyfus are defined as “affiliated” under the Act. Investments in affiliated investment companies during the period ended December 31, 2013 were as follows:
| Affiliated | |||||
| Investment | Value | Value | Net | ||
| Company | 12/31/2012($) | Purchases ($) | Sales ($) | 12/31/2013($) | Assets (%) |
| Dreyfus | |||||
| Institutional | |||||
| Preferred | |||||
| Plus Money | |||||
| Market | |||||
| Fund | 3,572,157 | 116,106,814 | 112,431,355 | 7,247,616 | 1.9 |
| Dreyfus | |||||
| Institutional | |||||
| Cash | |||||
| Advantage | |||||
| Fund | — | 26,473,213 | 24,542,813 | 1,930,400 | .5 |
| Total | 3,572,157 | 142,580,027 | 136,974,168 | 9,178,016 | 2.4 |
(d) Dividends to shareholders: Dividends are recorded on the ex-dividend date. Dividends from investment income-net and dividends from net realized capital gains, if any, are normally declared and paid annually, but the fund may make distributions on a more frequent basis to comply with the distribution requirements of the Internal Revenue Code of 1986, as amended (the “Code”).To the extent that net realized capital gains can be offset by capital loss carryovers, it is the policy of the fund not to distribute such gains. Income and capital gain distributions are determined in accordance with income tax regulations, which may differ from GAAP.
(e) Federal income taxes: It is the policy of the fund to continue to qualify as a regulated investment company, if such qualification is in the best interests of its shareholders, by complying with the applicable provisions of the Code, and to make distributions of taxable income sufficient to relieve it from substantially all federal income and excise taxes.
26
As of and during the period ended December 31, 2013, the fund did not have any liabilities for any uncertain tax positions.The fund recognizes interest and penalties, if any, related to uncertain tax positions as income tax expense in the Statement of Operations. During the period ended December 31, 2013, the fund did not incur any interest or penalties.
Each tax year in the four-year period ended December 31, 2013 remains subject to examination by the Internal Revenue Service and state taxing authorities.
At December 31, 2013, the components of accumulated earnings on a tax basis were as follows: undistributed ordinary income $2,893,970, accumulated capital losses $24,105,055 and unrealized appreciation $68,301,271.
Under the Regulated Investment Company Modernization Act of 2010 (the “2010 Act”), the fund is permitted to carry forward capital losses incurred in taxable years beginning after December 22, 2010 (“post-enactment losses”) for an unlimited period. Furthermore, post-enactment capital loss carryovers retain their character as either short-term or long-term capital losses rather than short-term as they were under previous statute.The 2010 Act requires post-enactment losses to be utilized before the utilization of losses incurred in taxable years prior to the effective date of the 2010 Act (“pre-enactment losses”).As a result of this ordering rule, pre-enactment losses may be more likely to expire unused.
The accumulated capital loss carryover is available for federal income tax purposes to be applied against future net realized capital gains, if any, realized subsequent to December 31, 2013. If not applied, the carryover expires in fiscal year 2017.
The tax character of distributions paid to shareholders during the fiscal periods ended December 31, 2013 and December 31, 2012 were as follows: ordinary income $2,803,509 and $1,710,145, respectively.
NOTE 2—Bank Lines of Credit:
The fund participates with other Dreyfus-managed funds in a $265 million unsecured credit facility led by Citibank, N.A. and a $300 million
The Fund 27
NOTES TO FINANCIAL STATEMENTS (continued)
unsecured credit facility provided by The Bank of New York Mellon (each, a “Facility”), each to be utilized primarily for temporary or emergency purposes, including the financing of redemptions. Prior to October 9, 2013, the unsecured credit facility with Citibank, N.A. was $210 million. In connection therewith, the fund has agreed to pay its pro rata portion of commitment fees for each Facility. Interest is charged to the fund based on rates determined pursuant to the terms of the respective Facility at the time of borrowing. During the period ended December 31, 2013, the fund did not borrow under the Facilities.
NOTE 3—Management Fee and Other Transactions With Affiliates:
(a) Pursuant to a management agreement with the Manager, the management fee is computed at an annual rate of .70% of the value of the fund’s average daily net assets and is payable monthly.
The Manager has contractually agreed from January 1, 2013 through May 1, 2014, to waive receipt of its fees and/or assume the direct expenses of the fund, so that the expenses of none of the classes (excluding Rule 12b-1 Distribution Plan fees, Shareholder Services Plan fees, taxes, interest expense, brokerage commissions, commitment fees on borrowings and extraordinary expenses) exceed .90% of the value of the fund’s average daily net assets.The reduction in expenses, pursuant to the undertaking, amounted to $900 during the period ended December 31, 2013.
During the period ended December 31, 2013, the Distributor retained $2,085 from commissions earned on sales of the fund’s Class A shares.
(b) Under the Distribution Plan adopted pursuant to Rule 12b-1 under the Act, Class C shares pay the Distributor for distributing its shares at an annual rate of .75% of the value of its average daily net assets. During the period ended December 31, 2013, Class C shares were charged $1,627 pursuant to the Distribution Plan.
28
(c) Under the Shareholder Services Plan, Class A and Class C shares pay the Distributor at an annual rate of .25% of the value of their average daily net assets for the provision of certain services.The services provided may include personal services relating to shareholder accounts, such as answering shareholder inquiries regarding the fund and providing reports and other information, and services related to the maintenance of shareholder accounts. The Distributor may make payments to Service Agents (securities dealers, financial institutions or other industry professionals) with respect to these services. The Distributor determines the amounts to be paid to Service Agents. During the period ended December 31, 2013, Class A and Class C shares were charged $2,465 and $543, respectively, pursuant to the Shareholder Services Plan.
The fund has arrangements with the transfer agent and the custodian whereby the fund may receive earnings credits when positive cash balances are maintained, which are used to offset transfer agency and custody fees. For financial reporting purposes, the fund includes net earnings credits as an expense offset in the Statement of Operations.
The fund compensates DreyfusTransfer, Inc., a wholly-owned subsidiary of the Manager, under a transfer agency agreement for providing transfer agency and cash management services for the fund. The majority of transfer agency fees are comprised of amounts paid on a per account basis, while cash management fees are related to fund subscriptions and redemptions. During the period ended December 31, 2013, the fund was charged $12,812 for transfer agency services and $690 for cash management services.These fees are included in Shareholder servicing costs in the Statement of Operations. Cash management fees were partially offset by earnings credits of $73.
The fund compensates The Bank of NewYork Mellon under a custody agreement for providing custodial services for the fund.These fees are determined based on net assets, geographic region and transaction
The Fund 29
NOTES TO FINANCIAL STATEMENTS (continued)
activity. During the period ended December 31, 2013, the fund was charged $32,019 pursuant to the custody agreement.
The fund compensated The Bank of New York Mellon under a cash management agreement that was in effect until December 31, 2013 for performing certain cash management services related to fund subscriptions and redemptions. During the period ended December 31, 2013, the fund was charged $244 pursuant to the cash management agreement, which is included in Shareholder servicing costs in the Statement of Operations.
During the period ended December 31, 2013, the fund was charged $9,093 for services performed by the Chief Compliance Officer and his staff.
The components of “Due to The Dreyfus Corporation and affiliates” in the Statement of Assets and Liabilities consist of: management fees $204,524, Distribution Plan fees $209, Shareholder Services Plan fees $392, custodian fees $15,809, Chief Compliance Officer fees $2,299 and transfer agency fees $2,585, which are offset against an expense reimbursement currently in effect in the amount of $1.
(d) Each Board member also serves as a Board member of other funds within the Dreyfus complex. Annual retainer fees and attendance fees are allocated to each fund based on net assets.
NOTE 4—Securities Transactions:
The aggregate amount of purchases and sales of investment securities, excluding short-term securities and financial futures, during the period ended December 31, 2013, amounted to $243,987,854 and $168,742,807, respectively.
Derivatives: A derivative is a financial instrument whose performance is derived from the performance of another asset. Each type of derivative instrument that was held by the fund during the period ended December 31, 2013 is discussed below.
30
Financial Futures: In the normal course of pursuing its investment objective, the fund is exposed to market risk, including equity price risk, as a result of changes in value of underlying financial instruments. The fund invests in financial futures in order to manage its exposure to or protect against changes in the market. A financial futures contract represents a commitment for the future purchase or a sale of an asset at a specified date. Upon entering into such contracts, these investments require initial margin deposits with a counterparty, which consist of cash or cash equivalents.The amount of these deposits is determined by the exchange or Board of Trade on which the contract is traded and is subject to change.Accordingly, variation margin payments are received or made to reflect daily unrealized gains or losses which are recorded in the Statement of Operations. When the contracts are closed, the fund recognizes a realized gain or loss which is reflected in the Statement of Operations.There is minimal counterparty credit risk to the fund with financial futures since they are exchange traded, and the exchange guarantees the financial futures against default. At December 31, 2013, there were no financial futures outstanding.
The following summarizes the average market value of derivatives outstanding during the period ended December 31, 2013:
| Average Market Value ($) | |
| Equity financial futures | 295,759 |
At December 31, 2013, the cost of investments for federal income tax purposes was $312,670,457; accordingly, accumulated net unrealized appreciation on investments was $68,301,271, consisting of $69,585,746 gross unrealized appreciation and $1,284,475 gross unrealized depreciation.
The Fund 31
REPORT OF INDEPENDENT REGISTERED
PUBLIC ACCOUNTING FIRM
Shareholders and Board of Directors
Dreyfus Large Cap Equity Fund
We have audited the accompanying statement of assets and liabilities, including the statement of investments, of Dreyfus Large Cap Equity Fund (one of the series comprising Dreyfus Premier Investment Funds, Inc.) as of December 31, 2013, and the related statement of operations for the year then ended, the statement of changes in net assets for each of the two years in the period then ended, and the financial highlights for each of the five years in the period then ended.These financial statements and financial highlights are the responsibility of the Fund’s management. Our responsibility is to express an opinion on these financial statements and financial highlights based on our audits.
We conducted our audits in accordance with the standards of the Public Company Accounting Oversight Board (United States).Those standards require that we plan and perform the audit to obtain reasonable assurance about whether the financial statements and financial highlights are free of material misstatement.We were not engaged to perform an audit of the Fund’s internal control over financial reporting. Our audits included consideration of internal control over financial reporting as a basis for designing audit procedures that are appropriate in the circumstances, but not for the purpose of expressing an opinion on the effectiveness of the Fund’s internal control over financial reporting. Accordingly, we express no such opinion. An audit also includes examining, on a test basis, evidence supporting the amounts and disclosures in the financial statements and financial highlights, assessing the accounting principles used and significant estimates made by management, and evaluating the overall financial statement presentation. Our procedures included confirmation of securities owned as of December 31, 2013 by correspondence with the custodian and others. We believe that our audits provide a reasonable basis for our opinion.
In our opinion, the financial statements and financial highlights referred to above present fairly, in all material respects, the financial position of Dreyfus Large Cap Equity Fund at December 31, 2013, the results of its operations for the year then ended, the changes in its net assets for each of the two years in the period then ended, and the financial highlights for each of the five years in the period then ended, in conformity with U.S. generally accepted accounting principles.

New York, New York
February 27, 2014
32
IMPORTANT TAX INFORMATION (Unaudited)
In accordance with federal tax law, the fund hereby reports 100% of the ordinary dividends paid during the fiscal year ended December 31, 2013 as qualifying for the corporate dividends received deduction. For the fiscal year ended December 31, 2013, certain dividends paid by the fund may be subject to a maximum tax rate of 15%, as provided for by the Jobs and Growth Tax Relief Reconciliation Act of 2003. Of the distributions paid during the fiscal year, $2,803,509 represents the maximum amount that may be considered qualified dividend income. Shareholders will receive notification in early 2014 of the percentage applicable to the preparation of their 2013 income tax returns.
The Fund 33
| BOARD MEMBERS INFORMATION (Unaudited) |
| INDEPENDENT BOARD MEMBERS |
| Joseph S. DiMartino (70) |
| Chairman of the Board (1995) |
| Principal Occupation During Past 5Years: |
| • Corporate Director and Trustee |
| Other Public Company Board Memberships During Past 5Years: |
| • CBIZ (formerly, Century Business Services, Inc.), a provider of outsourcing functions for small |
| and medium size companies, Director (1997-present) |
| • The Newark Group, a provider of a national market of paper recovery facilities, paperboard |
| mills and paperboard converting plants, Director (2000-2010) |
| • Sunair Services Corporation, a provider of certain outdoor-related services to homes and |
| businesses, Director (2005-2009) |
| No. of Portfolios for which Board Member Serves: 141 |
| ——————— |
| Peggy C. Davis (70) |
| Board Member (2012) |
| Principal Occupation During Past 5Years: |
| • Shad Professor of Law, New York University School of Law (1983-present) |
| No. of Portfolios for which Board Member Serves: 56 |
| ——————— |
| David P. Feldman (74) |
| Board Member (1991) |
| Principal Occupation During Past 5Years: |
| • Corporate Director and Trustee |
| Other Public Company Board Memberships During Past 5Years: |
| • BBH Mutual Funds Group (4 registered mutual funds), Director (1992-present) |
| No. of Portfolios for which Board Member Serves: 42 |
| ——————— |
| Ehud Houminer (73) |
| Board Member (2012) |
| Principal Occupation During Past 5Years: |
| • Executive-in-Residence at the Columbia Business School, Columbia University (1992-present) |
| Other Public Company Board Memberships During Past 5Years: |
| • Avnet Inc., an electronics distributor, Director (1993-2012) |
| No. of Portfolios for which Board Member Serves: 66 |
34
| Lynn Martin (74) |
| Board Member (1994) |
| Principal Occupation During Past 5Years: |
| • President of The Martin Hall Group LLC, a human resources consulting firm (2005-2012) |
| Other Public Company Board Memberships During Past 5Years: |
| • AT&T Inc., a telecommunications company, Director (1999-2012) |
| • Ryder System, Inc., a supply chain and transportation management company, Director (1993-2012) |
| • The Proctor & Gamble Co., a consumer products company, Director (1994-2009) |
| • Constellation Energy Group Inc., Director (2003-2009) |
| No. of Portfolios for which Board Member Serves: 42 |
| ——————— |
| Robin A. Melvin (50) |
| Board Member (2011) |
| Principal Occupation During Past 5Years: |
| • Board Member, Illinois Mentoring Partnership, non-profit organization dedicated to increasing |
| the quantity and quality of mentoring services in Illinois (2013-present) |
| • Director, Boisi Family Foundation, a private family foundation that supports youth-serving organi- |
| zations that promote the self sufficiency of youth from disadvantaged circumstances (1995-2012) |
| No. of Portfolios for which Board Member Serves: 90 |
| ——————— |
| Dr. Martin Peretz (74) |
| Board Member (2012) |
| Principal Occupation During Past 5Years: |
| • Editor-in-Chief Emeritus of The New Republic Magazine (2010-2011) (previously, |
| Editor-in-Chief, 1974-2010) |
| • Director of TheStreet.com, a financial information service on the web (1996-2010) |
| No. of Portfolios for which Board Member Serves: 42 |
| ——————— |
| Once elected all Board Members serve for an indefinite term, but achieve Emeritus status upon reaching age 80.The |
| address of the Board Members and Officers is c/o The Dreyfus Corporation, 200 Park Avenue, NewYork, NewYork |
| 10166.Additional information about the Board Members is available in the fund’s Statement of Additional Information |
| which can be obtained from Dreyfus free of charge by calling this toll free number: 1-800-DREYFUS. |
| Daniel Rose, Emeritus Board Member |
| Philip L.Toia, Emeritus Board Member |
| Sander Vanocur, Emeritus Board Member |
The Fund 35
OFFICERS OF THE FUND (Unaudited)

36

The Fund 37

Save time. Save paper. View your next shareholder report online as soon as it’s available. Log into www.dreyfus.com and sign up for Dreyfus eCommunications. It’s simple and only takes a few minutes.
The views expressed in this report reflect those of the portfolio manager only through the end of the period covered and do not necessarily represent the views of Dreyfus or any other person in the Dreyfus organization. Any such views are subject to change at any time based upon market or other conditions and Dreyfus disclaims any responsibility to update such views.These views may not be relied on as investment advice and, because investment decisions for a Dreyfus fund are based on numerous factors, may not be relied on as an indication of trading intent on behalf of any Dreyfus fund.
Contents | |
THE FUND | |
| 2 | A Letter from the President |
| 3 | Discussion of Fund Performance |
| 6 | Fund Performance |
| 8 | Understanding Your Fund’s Expenses |
| 8 | Comparing Your Fund’s Expenses With Those of Other Funds |
| 9 | Statement of Investments |
| 13 | Statement of Assets and Liabilities |
| 14 | Statement of Operations |
| 15 | Statement of Changes in Net Assets |
| 17 | Financial Highlights |
| 20 | Notes to Financial Statements |
| 30 | Report of Independent Registered Public Accounting Firm |
| 31 | Important Tax Information |
| 32 | Board Members Information |
| 34 | Officers of the Fund |
FOR MORE INFORMATION | |
Back Cover |
Dreyfus
Large Cap Growth Fund
The Fund
A LETTER FROM THE PRESIDENT
Dear Shareholder:
We are pleased to present this annual report for Dreyfus Large Cap Growth Fund, covering the 12-month period from January 1, 2013, through December 31, 2013. For information about how the fund performed during the reporting period, as well as general market perspectives, we provide a Discussion of Fund Performance on the pages that follow.
The year 2013 proved to be outstanding for U.S. equities. Large-cap stocks delivered their strongest calendar-year performance in well over a decade, and small- and midcap stocks fared even better in an environment of low short-term interest rates, rising corporate earnings, sustained economic growth, and low inflation. In our view, 2013 provided ample evidence of the value of patience and discipline in equity investing, as those who favored a long-term perspective over a focus on news headlines and short-term volatility reaped the rewards provided by rising markets.
Will stocks continue to rally in 2014? We believe that they can. We expect the domestic economy to continue to strengthen over the next year, particularly if U.S. fiscal policy is less restrictive and short-term interest rates remain near historical lows. Stronger growth could convince businesses and consumers to spend more freely, unleashing pent up demand as economic uncertainty wanes. However, we caution that gains in 2014 are unlikely to match those of the past year, and a highly selective approach to security selection could be key to greater relative investment success in the months ahead. As always, we urge you to speak with your financial adviser to identify the investment strategies that are right for you.
Thank you for your continued confidence and support.

J. Charles Cardona
President
The Dreyfus Corporation
January 15, 2014
2
DISCUSSION OF FUND PERFORMANCE
For the period of January 1, 2013, through December 31, 2013, as provided by Irene D. O’Neill, Portfolio Manager
Fund and Market Performance Overview
For the 12-month period ended December 31, 2013, Dreyfus Large Cap Growth Fund’s Class A shares achieved a total return of 36.02%, Class C shares returned 34.92%, and Class I shares returned 36.40%.1 In comparison, the Russell 1000® Growth Index (the “Index”), the fund’s benchmark, produced a total return of 33.48%.2
U.S. stocks responded positively during the reporting period to recovering domestic and global economies. The fund produced higher returns than its benchmark, mainly due to the success of our security selection strategy in the health care, energy, information technology, and industrials sectors.
The Fund’s Investment Approach
The fund seeks to provide long-term capital appreciation.To pursue its goal, the fund normally invests at least 80% of its assets in equity securities of large-capitalization companies with market capitalizations of $5 billion or more at the time of purchase.
The fund’s investment philosophy is based on the premise that earnings growth is the primary determinant of long-term stock appreciation.With this, we use an approach that combines top-down and bottom-up analysis, so stock selection and sector allocation are both factors in determining the fund’s holdings. Fundamental financial analysis is used to identify companies with characteristics such as: expected earnings growth rate exceeds market and industry trends; potential for positive earnings surprise relative to market expectations; positive operational or financial catalysts; attractive valuation based on growth prospects; and strong financial condition.
Economic Growth Fueled Market Gains
The year 2013 began in the midst of a sustained stock market rally driven by improved U.S. employment and housing markets. Investors were particularly encouraged by a new, open-ended round of quantitative easing from the Federal Reserve Board (the “Fed”). Improving conditions in overseas markets also contributed to improved investor sentiment.
The Fund 3
DISCUSSION OF FUND PERFORMANCE (continued)
Economic data continued to improve, and stocks rallied, through the spring of 2013. However, in late May, remarks by Fed Chairman Ben Bernanke were widely interpreted as a signal that U.S. monetary policymakers would soon back away from their quantitative easing program, sparking market declines in June. The market generally stabilized over the summer, and stocks advanced strongly in September when the Fed refrained from tapering its bond purchasing program. Even a 16-day government shutdown in October failed to derail the rally.
Stocks continued to climb over the final two months of the year amid new releases of encouraging economic data.The announcement of a modest reduction in the Fed’s bond buying program in mid-December had little impact on stock prices, enabling several broad measures of market performance to end the year near record highs.
Financial Stocks Buoyed Relative Performance
The fund’s security selection strategy proved particularly effective in the health care sector. The fund scored success with a number of pharmaceutical developers that reported positive results in clinical trials of new drugs, including ISIS Pharmaceuticals’ new treatments for muscular dystrophy and liver disease, and Celgene’s new medicine for pancreatic cancer. In addition, generic drug maker Actavis made a highly accretive acquisition of Warner-Chilcott. In the energy sector, independent exploration-and-production company Gulfport Energy reported robust production growth from its wells in the Utica shale formation. Oil services provider Halliburton benefited from lower operating costs and an expanded share buyback program. Pipeline operator Plains GP Holdings has prospered as oil and gas transportation volumes have risen due to the recent boom in domestic oil production. Refiner Phillips 66 experienced expanding profit margins due to an ample supply of low cost, domestic crude oil.
In the information technology sector, semiconductor manufacturer MicronTechnology benefited from waning competitive and pricing pressures in a consolidating industry, while software developer Splunk, business networking site LinkedIn, Internet portal Yahoo!, and online media giant Google advanced due to their participation in positive, secular growth trends.The industrials sector was bolstered by aircraft producer Boeing, which saw rising order volumes as the company recovered from earlier missteps, and conglomerate Ingersoll-Rand, which has divested non-core assets and engaged in other shareholder-friendly activities.
4
Shortfalls during 2013 were mostly concentrated in the consumer staples sector, where spirits producer Beam posted weaker-than-expected earnings. Tobacco seller Philip Morris International was hurt by weakness in Europe and operational problems in the Philippines and Japan. Household goods giant Procter & Gamble lagged more speculative companies in its industry group.
Finding Opportunities in Cyclical Market Sectors
We currently expect the U.S. economic recovery to persist, and strengthening consumer and business confidence may serve as a catalyst for higher corporate earnings and rising stock prices. Consequently, we have continued to identify opportunities in some of the market’s more economically sensitive areas, including the energy and information technology sectors. We also have favored health care companies with strong research-and-development pipelines. We generally have maintained underweighted exposure to the traditionally defensive consumer staples, telecommunications services, and utilities sectors, where we see obstacles to earnings growth.
January 15, 2014
Please note, the position in any security highlighted with italicized typeface was sold during the reporting period. Equity funds are subject generally to market, market sector, market liquidity, issuer and investment style risks, among other factors, to varying degrees, all of which are more fully described in the fund’s prospectus.
| 1 Total return includes reinvestment of dividends and any capital gains paid, and does not take into consideration the |
| maximum initial sales charge in the case of Class A shares, or the applicable contingent deferred sales charge imposed |
| on the redemption of Class C shares. Had these charges been reflected, returns would have been lower. Past |
| performance is no guarantee of future results. Share price and investment return fluctuate such that upon redemption |
| fund shares may be worth more or less than their original cost. Return figures provided reflect the absorption of certain |
| fund expenses by The Dreyfus Corporation pursuant to an undertaking in effect through May 1, 2014, at which |
| time it may be extended, terminated or modified. Had these expenses not been absorbed, the fund’s returns would |
| have been lower. |
| 2 SOURCE: LIPPER INC. — Reflects reinvestment of net dividends and, where applicable, capital gain |
| distributions.The Russell 1000® Growth Index is an unmanaged index that measures the performance of those |
| Russell 1000® companies with higher price-to-book ratios and higher forecasted growth values. Index return does not |
| reflect fees and expenses associated with operating a mutual fund. Investors cannot invest directly in any index. |
The Fund 5
FUND PERFORMANCE
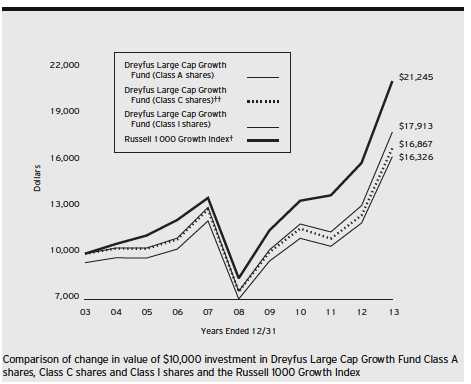
| † | Source: Lipper Inc. |
| †† | The total return figures presented for Class C shares of the fund reflect the performance of the fund’s Class A shares |
| for the period prior to 9/13/08 (the inception date for Class C shares). |
Past performance is not predictive of future performance.
The above graph compares a $10,000 investment made in each of the Class A, Class C and Class I shares of Dreyfus Large Cap Growth Fund on 12/31/03 to a $10,000 investment made in the Russell 1000 Growth Index (the “Index”) on that date. All dividends and capital gain distributions are reinvested.
The fund’s performance shown in the line graph above takes into account the maximum initial sales charge on Class A shares and all other applicable fees and expenses on all classes.The Index is an unmanaged index which measures the performance of those Russell 1000 companies with higher price-to-book ratios and higher forecasted growth values. Unlike a mutual fund, the Index is not subject to charges, fees and other expenses. Investors cannot invest directly in any index. Further information relating to fund performance, including expense reimbursements, if applicable, is contained in the Financial Highlights section of the prospectus and elsewhere in this report.
6
| Average Annual Total Returns as of 12/31/13 | |||||||
| Inception | |||||||
| Date | 1 | Year | 5 Years | 10 Years | |||
| Class A shares | |||||||
| with maximum sales charge (5.75%) | 12/31/86 | 28.26 | % | 16.88 | % | 5.02 | % |
| without sales charge | 12/31/86 | 36.02 | % | 18.28 | % | 5.65 | % |
| Class C shares | |||||||
| with applicable redemption charge † | 9/13/08 | 33.92 | % | 17.48 | % | 5.37 | %†† |
| without redemption | 9/13/08 | 34.92 | % | 17.48 | % | 5.37 | %†† |
| Class I shares | 4/1/97 | 36.40 | % | 18.86 | % | 6.00 | % |
| Russell 1000 Growth Index | 33.48 | % | 20.39 | % | 7.83 | % | |
Past performance is not predictive of future performance.The fund’s performance shown in the graph and table does not reflect the deduction of taxes that a shareholder would pay on fund distributions or the redemption of fund shares.
| † | The maximum contingent deferred sales charge for Class C shares is 1% for shares redeemed within one year of the |
| date of purchase. | |
| †† | The total return performance figures presented for Class C shares of the fund reflect the performance of the fund’s |
| Class A shares for the period prior to 9/13/08 (the inception date for Class C shares). |
The Fund 7
UNDERSTANDING YOUR FUND’S EXPENSES (Unaudited)
As a mutual fund investor, you pay ongoing expenses, such as management fees and other expenses. Using the information below, you can estimate how these expenses affect your investment and compare them with the expenses of other funds.You also may pay one-time transaction expenses, including sales charges (loads) and redemption fees, which are not shown in this section and would have resulted in higher total expenses. For more information, see your fund’s prospectus or talk to your financial adviser.
Review your fund’s expenses
The table below shows the expenses you would have paid on a $1,000 investment in Dreyfus Large Cap Growth Fund from July 1, 2013 to December 31, 2013. It also shows how much a $1,000 investment would be worth at the close of the period, assuming actual returns and expenses.
Expenses and Value of a $1,000 Investment
assuming actual returns for the six months ended December 31, 2013
| Class A | Class C | Class I | ||||
| Expenses paid per $1,000† | $ | 6.27 | $ | 10.17 | $ | 4.88 |
| Ending value (after expenses) | $ | 1,222.10 | $ | 1,217.20 | $ | 1,223.50 |
COMPARING YOUR FUND’S EXPENSES
WITH THOSE OF OTHER FUNDS (Unaudited)
Using the SEC’s method to compare expenses
The Securities and Exchange Commission (SEC) has established guidelines to help investors assess fund expenses. Per these guidelines, the table below shows your fund’s expenses based on a $1,000 investment, assuming a hypothetical 5% annualized return. You can use this information to compare the ongoing expenses (but not transaction expenses or total cost) of investing in the fund with those of other funds.All mutual fund shareholder reports will provide this information to help you make this comparison. Please note that you cannot use this information to estimate your actual ending account balance and expenses paid during the period.
Expenses and Value of a $1,000 Investment
assuming a hypothetical 5% annualized return for the six months ended December 31, 2013
| Class A | Class C | Class I | ||||
| Expenses paid per $1,000† | $ | 5.70 | $ | 9.25 | $ | 4.43 |
| Ending value (after expenses) | $ | 1,019.56 | $ | 1,016.03 | $ | 1,020.82 |
| † Expenses are equal to the fund’s annualized expense ratio of 1.12% for Class A, 1.82% for Class C and .87% |
| for Class I, multiplied by the average account value over the period, multiplied by 184/365 (to reflect the one-half |
| year period). |
8
STATEMENT OF INVESTMENTS
December 31, 2013
| Common Stocks—99.5% | Shares | Value ($) | |
| Automobiles & Components—2.6% | |||
| Harley-Davidson | 6,060 | 419,594 | |
| Johnson Controls | 6,360 | 326,268 | |
| 745,862 | |||
| Banks—1.8% | |||
| Ocwen Financial | 5,590 | a | 309,965 |
| Wells Fargo & Co. | 4,400 | 199,760 | |
| 509,725 | |||
| Capital Goods—10.7% | |||
| Boeing | 3,700 | 505,013 | |
| Caterpillar | 3,860 | 350,527 | |
| Dover | 5,300 | 511,662 | |
| Honeywell International | 7,170 | 655,123 | |
| Ingersoll-Rand | 10,060 | 619,696 | |
| United Technologies | 3,690 | 419,922 | |
| 3,061,943 | |||
| Consumer Durables & Apparel—3.3% | |||
| NIKE, Cl. B | 7,820 | 614,965 | |
| Ralph Lauren | 1,860 | 328,420 | |
| 943,385 | |||
| Consumer Services—2.4% | |||
| Las Vegas Sands | 8,660 | 683,014 | |
| Diversified Financials—1.9% | |||
| IntercontinentalExchange Group | 1,000 | 224,920 | |
| Invesco | 8,828 | 321,339 | |
| 546,259 | |||
| Energy—5.8% | |||
| Baker Hughes | 5,800 | 320,508 | |
| Gulfport Energy | 4,000 | a | 252,600 |
| Phillips 66 | 4,100 | 316,233 | |
| Plains GP Holdings, Cl. A | 15,100 | 404,227 | |
| Valero Energy | 7,000 | 352,800 | |
| 1,646,368 | |||
| Food & Staples Retailing—1.4% | |||
| Costco Wholesale | 3,370 | 401,064 | |
| Food, Beverage & Tobacco—5.3% | |||
| Beam | 4,620 | 314,437 |
The Fund 9
STATEMENT OF INVESTMENTS (continued)
| Common Stocks (continued) | Shares | Value ($) | |
| Food, Beverage & Tobacco (continued) | |||
| Coca-Cola | 15,190 | 627,499 | |
| Mondelez International, Cl. A | 5,080 | 179,324 | |
| Philip Morris International | 4,510 | 392,956 | |
| 1,514,216 | |||
| Health Care Equipment & Services—1.1% | |||
| Catamaran | 6,350 | a | 301,498 |
| Household & Personal Products—3.3% | |||
| Colgate-Palmolive | 6,510 | 424,517 | |
| Procter & Gamble | 6,170 | 502,300 | |
| 926,817 | |||
| Materials—3.7% | |||
| Celanese, Ser. A | 5,400 | 298,674 | |
| Nucor | 8,300 | 443,054 | |
| Praxair | 2,360 | 306,871 | |
| 1,048,599 | |||
| Media—4.0% | |||
| Comcast, Cl. A | 13,850 | 719,715 | |
| Walt Disney | 5,700 | 435,480 | |
| 1,155,195 | |||
| Pharmaceuticals, Biotech & | |||
| Life Sciences—12.7% | |||
| Actavis | 1,950 | a | 327,600 |
| Allergan | 2,800 | 311,024 | |
| Amgen | 3,860 | 440,658 | |
| Biogen Idec | 1,180 | a | 330,105 |
| Bristol-Myers Squibb | 12,210 | 648,961 | |
| Celgene | 2,110 | a | 356,506 |
| Gilead Sciences | 6,700 | a | 503,505 |
| Regeneron Pharmaceuticals | 900 | a | 247,716 |
| Shire, ADR | 3,270 | 462,018 | |
| 3,628,093 | |||
| Real Estate—.7% | |||
| DDR | 13,610 | b | 209,186 |
| Retailing—7.4% | |||
| Amazon.com | 1,920 | a | 765,677 |
| Lowe’s | 12,210 | 605,005 | |
| Tiffany & Co. | 4,780 | 443,488 |
10
| Common Stocks (continued) | Shares | Value ($) | |
| Retailing (continued) | |||
| TripAdvisor | 2,060 | a | 170,630 |
| Urban Outfitters | 3,430 | a | 127,253 |
| 2,112,053 | |||
| Semiconductors & Semiconductor | |||
| Equipment—4.8% | |||
| Avago Technologies | 5,500 | 290,895 | |
| Freescale Semiconductor | 15,080 | a | 242,034 |
| KLA-Tencor | 3,130 | 201,760 | |
| Micron Technology | 16,200 | a | 352,512 |
| Skyworks Solutions | 10,030 | a | 286,457 |
| 1,373,658 | |||
| Software & Services—18.4% | |||
| Accenture, Cl. A | 1,530 | 125,797 | |
| Adobe Systems | 5,710 | a | 341,915 |
| Facebook, Cl. A | 7,480 | a | 408,857 |
| Google, Cl. A | 1,220 | a | 1,367,266 |
| LinkedIn, Cl. A | 1,640 | a | 355,601 |
| Microsoft | 7,290 | 272,865 | |
| NetSuite | 3,470 | a | 357,479 |
| salesforce.com | 6,590 | a | 363,702 |
| ServiceNow | 6,640 | a | 371,906 |
| Splunk | 4,350 | a | 298,714 |
| 1,000 | c | 63,650 | |
| Workday, Cl. A | 3,330 | a | 276,923 |
| Yahoo! | 9,540 | a | 385,798 |
| Yelp | 3,790 | a | 261,321 |
| 5,251,794 | |||
| Technology Hardware & Equipment—6.1% | |||
| Apple | 2,540 | 1,425,219 | |
| Ciena | 13,490 | a | 322,816 |
| 1,748,035 | |||
| Telecommunication Services—.5% | |||
| Verizon Communications | 2,930 | 143,980 | |
| Transportation—1.6% | |||
| Union Pacific | 2,780 | 467,040 | |
| Total Common Stocks | |||
| (cost $19,820,178) | 28,417,784 |
The Fund 11
STATEMENT OF INVESTMENTS (continued)
| Other Investment—.5% | Shares | Value ($) | ||
| Registered Investment Company; | ||||
| Dreyfus Institutional Preferred | ||||
| Plus Money Market Fund | ||||
| (cost $135,292) | 135,292 | d | 135,292 | |
| Investment of Cash Collateral | ||||
| for Securities Loaned—.2% | ||||
| Registered Investment Company; | ||||
| Dreyfus Institutional Cash Advantage Fund | ||||
| (cost $55,575) | 55,575 | d | 55,575 | |
| Total Investments (cost $20,011,045) | 100.2 | % | 28,608,651 | |
| Liabilities, Less Cash and Receivables | (.2 | %) | (59,989 | ) |
| Net Assets | 100.0 | % | 28,548,662 | |
ADR—American Depository Receipts
| a Non-income producing security. |
| b Investment in real estate investment trust. |
| c Security, or portion thereof, on loan.At December 31, 2013, the value of the fund’s securities on loan was $57,285 |
| and the value of the collateral held by the fund was $55,575. See Note 1(b). |
| d Investment in affiliated money market mutual fund. |
| Portfolio Summary (Unaudited)† | |||
| Value (%) | Value (%) | ||
| Software & Services | 18.4 | Household & Personal Products | 3.3 |
| Pharmaceuticals, | Automobiles & Components | 2.6 | |
| Biotech & Life Sciences | 12.7 | Consumer Services | 2.4 |
| Capital Goods | 10.7 | Diversified Financials | 1.9 |
| Retailing | 7.4 | Banks | 1.8 |
| Technology Hardware & Equipment | 6.1 | Transportation | 1.6 |
| Energy | 5.8 | Food & Staples Retailing | 1.4 |
| Food, Beverage & Tobacco | 5.3 | Health Care Equipment & Services | 1.1 |
| Semiconductors & | Money Market Investments | .7 | |
| Semiconductor Equipment | 4.8 | Real Estate | .7 |
| Media | 4.0 | Telecommunication Services | .5 |
| Materials | 3.7 | ||
| Consumer Durables & Apparel | 3.3 | 100.2 | |
| † Based on net assets. | |||
| See notes to financial statements. | |||
12
STATEMENT OF ASSETS AND LIABILITIES
December 31, 2013
| Cost | Value | |
| Assets ($): | ||
| Investments in securities—See Statement of Investments (including | ||
| securities on loan, valued at $57,285)—Note 1(b): | ||
| Unaffiliated issuers | 19,820,178 | 28,417,784 |
| Affiliated issuers | 190,867 | 190,867 |
| Cash | 5,498 | |
| Dividends and securities lending income receivable | 30,630 | |
| Prepaid expenses | 11,869 | |
| 28,656,648 | ||
| Liabilities ($): | ||
| Due to The Dreyfus Corporation and affiliates—Note 3(c) | 18,395 | |
| Liability for securities on loan—Note 1(b) | 55,575 | |
| Payable for shares of Common Stock redeemed | 20,728 | |
| Accrued expenses | 13,288 | |
| 107,986 | ||
| Net Assets ($) | 28,548,662 | |
| Composition of Net Assets ($): | ||
| Paid-in capital | 19,471,912 | |
| Accumulated undistributed investment income—net | 35,123 | |
| Accumulated net realized gain (loss) on investments | 444,021 | |
| Accumulated net unrealized appreciation | ||
| (depreciation) on investments | 8,597,606 | |
| Net Assets ($) | 28,548,662 |
| Net Asset Value Per Share | |||
| Class A | Class C | Class I | |
| Net Assets ($) | 1,905,753 | 314,620 | 26,328,289 |
| Shares Outstanding | 212,619 | 35,676 | 2,873,144 |
| Net Asset Value Per Share ($) | 8.96 | 8.82 | 9.16 |
| See notes to financial statements. | |||
The Fund 13
STATEMENT OF OPERATIONS
Year Ended December 31, 2013
| Investment Income ($): | ||
| Income: | ||
| Cash dividends (net of $1,223 foreign taxes withheld at source): | ||
| Unaffiliated issuers | 412,459 | |
| Affiliated issuers | 118 | |
| Income from securities lending—Note 1(b) | 4,048 | |
| Total Income | 416,625 | |
| Expenses: | ||
| Management fee—Note 3(a) | 197,685 | |
| Professional fees | 42,329 | |
| Registration fees | 39,608 | |
| Shareholder servicing costs—Note 3(c) | 12,941 | |
| Prospectus and shareholders’ reports | 9,006 | |
| Custodian fees—Note 3(c) | 8,070 | |
| Directors’ fees and expenses—Note 3(d) | 2,253 | |
| Distribution fees—Note 3(b) | 1,966 | |
| Loan commitment fees—Note 2 | 301 | |
| Interest expense—Note 2 | 321 | |
| Miscellaneous | 16,509 | |
| Total Expenses | 330,989 | |
| Less—reduction in expenses due to undertakings—Note 3(a) | (62,033 | ) |
| Less—reduction in fees due to earnings credits—Note 3(c) | (39 | ) |
| Net Expenses | 268,917 | |
| Investment Income—Net | 147,708 | |
| Realized and Unrealized Gain (Loss) on Investments—Note 4 ($): | ||
| Net realized gain (loss) on investments | 3,087,641 | |
| Net unrealized appreciation (depreciation) on investments | 5,534,566 | |
| Net Realized and Unrealized Gain (Loss) on Investments | 8,622,207 | |
| Net Increase in Net Assets Resulting from Operations | 8,769,915 | |
| See notes to financial statements. | ||
14
STATEMENT OF CHANGES IN NET ASSETS
| Year Ended December 31, | ||||
| 2013 | 2012 | |||
| Operations ($): | ||||
| Investment income—net | 147,708 | 216,436 | ||
| Net realized gain (loss) on investments | 3,087,641 | 4,728,883 | ||
| Net unrealized appreciation | ||||
| (depreciation) on investments | 5,534,566 | (10,706 | ) | |
| Net Increase (Decrease) in Net Assets | ||||
| Resulting from Operations | 8,769,915 | 4,934,613 | ||
| Dividends to Shareholders from ($): | ||||
| Investment income—net: | ||||
| Class A | (9,692 | ) | — | |
| Class I | (318,978 | ) | (112,759 | ) |
| Net realized gain on investments: | ||||
| Class A | (197,525 | ) | — | |
| Class C | (33,311 | ) | — | |
| Class I | (2,865,839 | ) | — | |
| Total Dividends | (3,425,345 | ) | (112,759 | ) |
| Capital Stock Transactions ($): | ||||
| Net proceeds from shares sold: | ||||
| Class A | 592,597 | 724,801 | ||
| Class C | 131,054 | 62,496 | ||
| Class I | 1,400,443 | 1,494,451 | ||
| Dividends reinvested: | ||||
| Class A | 174,697 | — | ||
| Class C | 10,902 | — | ||
| Class I | 2,470,822 | 36,716 | ||
| Cost of shares redeemed: | ||||
| Class A | (260,767 | ) | (352,437 | ) |
| Class C | (32,863 | ) | (132,301 | ) |
| Class I | (8,557,051 | ) | (18,616,056 | ) |
| Increase (Decrease) in Net Assets | ||||
| from Capital Stock Transactions | (4,070,166 | ) | (16,782,330 | ) |
| Total Increase (Decrease) in Net Assets | 1,274,404 | (11,960,476 | ) | |
| Net Assets ($): | ||||
| Beginning of Period | 27,274,258 | 39,234,734 | ||
| End of Period | 28,548,662 | 27,274,258 | ||
| Undistributed investment income—net | 35,123 | 216,085 | ||
The Fund 15
STATEMENT OF CHANGES IN NET ASSETS (continued)
| Year Ended December 31, | ||||
| 2013 | 2012 | |||
| Capital Share Transactions: | ||||
| Class Aa | ||||
| Shares sold | 68,981 | 100,597 | ||
| Shares issued for dividends reinvested | 20,037 | — | ||
| Shares redeemed | (30,816 | ) | (49,176 | ) |
| Net Increase (Decrease) in Shares Outstanding | 58,202 | 51,421 | ||
| Class Ca | ||||
| Shares sold | 16,326 | 8,689 | ||
| Shares issued for dividends reinvested | 1,267 | — | ||
| Shares redeemed | (3,529 | ) | (19,532 | ) |
| Net Increase (Decrease) in Shares Outstanding | 14,064 | (10,843 | ) | |
| Class I | ||||
| Shares sold | 168,335 | 204,967 | ||
| Shares issued for dividends reinvested | 279,298 | 4,800 | ||
| Shares redeemed | (986,197 | ) | (2,577,717 | ) |
| Net Increase (Decrease) in Shares Outstanding | (538,564 | ) | (2,367,950 | ) |
| a During the period ended December 31, 2013, 418 Class C shares representing $3,481 were exchanged for 413 |
| Class A shares. |
See notes to financial statements.
16
FINANCIAL HIGHLIGHTS
The following tables describe the performance for each share class for the fiscal periods indicated.All information (except portfolio turnover rate) reflects financial results for a single fund share.Total return shows how much your investment in the fund would have increased (or decreased) during each period, assuming you had reinvested all dividends and distributions.These figures have been derived from the fund’s financial statements.
| Year Ended December 31, | ||||||||
| Class A Shares | 2013 | 2012 | 2011 | 2010 | 2009 | |||
| Per Share Data ($): | ||||||||
| Net asset value, beginning of period | 7.44 | 6.50 | 6.84 | 5.94 | 4.40 | |||
| Investment Operations: | ||||||||
| Investment income (loss)—neta | .02 | .02 | (.02 | ) | (.01 | ) | .01 | |
| Net realized and unrealized | ||||||||
| gain (loss) on investments | 2.61 | .92 | (.30 | ) | .92 | 1.53 | ||
| Total from Investment Operations | 2.63 | .94 | (.32 | ) | .91 | 1.54 | ||
| Distributions: | ||||||||
| Dividends from investment income—net | (.06 | ) | — | (.02 | ) | (.02 | ) | — |
| Dividends from net realized | ||||||||
| gain on investments | (1.05 | ) | — | — | — | — | ||
| Total Distributions | (1.11 | ) | — | (.02 | ) | (.02 | ) | — |
| Settlement payment from | ||||||||
| unaffiliated third party | — | — | — | .01 | — | |||
| Net asset value, end of period | 8.96 | 7.44 | 6.50 | 6.84 | 5.94 | |||
| Total Return (%)b | 36.02 | 14.46 | (4.73 | ) | 15.60 | c | 35.00 | |
| Ratios/Supplemental Data (%): | ||||||||
| Ratio of total expenses | ||||||||
| to average net assets | 1.50 | 1.57 | 1.47 | 1.66 | 2.37 | |||
| Ratio of net expenses | ||||||||
| to average net assets | 1.19 | 1.49 | 1.47 | 1.51 | 1.47 | |||
| Ratio of net investment income | ||||||||
| (loss) to average net assets | .29 | .28 | (.24 | ) | (.13 | ) | .12 | |
| Portfolio Turnover Rate | 76.66 | 61.52 | 58.58 | 63.42 | 82.53 | |||
| Net Assets, end of period ($ x 1,000) | 1,906 | 1,149 | 670 | 475 | 279 | |||
| a Based on average shares outstanding at each month end. |
| b Exclusive of sales charge. |
| c If settlement payment from unaffiliated third party was not made, total return would have been 15.43%. |
See notes to financial statements.
The Fund 17
FINANCIAL HIGHLIGHTS (continued)
| Year Ended December 31, | ||||||||||
| Class C Shares | 2013 | 2012 | 2011 | 2010 | 2009 | |||||
| Per Share Data ($): | ||||||||||
| Net asset value, beginning of period | 7.34 | 6.45 | 6.83 | 5.95 | 4.43 | |||||
| Investment Operations: | ||||||||||
| Investment (loss)—neta | (.04 | ) | (.04 | ) | (.07 | ) | (.05 | ) | (.03 | ) |
| Net realized and unrealized | ||||||||||
| gain (loss) on investments | 2.57 | .93 | (.31 | ) | .93 | 1.55 | ||||
| Total from Investment Operations | 2.53 | .89 | (.38 | ) | .88 | 1.52 | ||||
| Distributions: | ||||||||||
| Dividends from investment income—net | — | — | — | (.01 | ) | — | ||||
| Dividends from net realized | ||||||||||
| gain on investments | (1.05 | ) | — | — | — | — | ||||
| Total Distributions | (1.05 | ) | — | — | (.01 | ) | — | |||
| Settlement payment from | ||||||||||
| unaffiliated third party | — | — | — | .01 | — | |||||
| Net asset value, end of period | 8.82 | 7.34 | 6.45 | 6.83 | 5.95 | |||||
| Total Return (%)b | 34.92 | 13.80 | (5.56 | ) | 15.10 | c | 34.09 | |||
| Ratios/Supplemental Data (%): | ||||||||||
| Ratio of total expenses | ||||||||||
| to average net assets | 2.31 | 2.57 | 2.42 | 2.16 | 2.06 | |||||
| Ratio of net expenses | ||||||||||
| to average net assets | 1.90 | 2.26 | 2.25 | 2.16 | 2.06 | |||||
| Ratio of net investment (loss) | ||||||||||
| to average net assets | (.42 | ) | (.51 | ) | (1.02 | ) | (.81 | ) | (.48 | ) |
| Portfolio Turnover Rate | 76.66 | 61.52 | 58.58 | 63.42 | 82.53 | |||||
| Net Assets, end of period ($ x 1,000) | 315 | 159 | 209 | 52 | 83 | |||||
| a Based on average shares outstanding at each month end. |
| b Exclusive of sales charge. |
| c If settlement payment from unaffiliated third party was not made, total return would have been 14.76%. |
See notes to financial statements.
18
| Year Ended December 31, | |||||||||
| Class I Shares | 2013 | 2012 | 2011 | 2010 | 2009 | ||||
| Per Share Data ($): | |||||||||
| Net asset value, beginning of period | 7.61 | 6.64 | 6.97 | 6.03 | 4.44 | ||||
| Investment Operations: | |||||||||
| Investment income—neta | .05 | .05 | .02 | .03 | .04 | ||||
| Net realized and unrealized | |||||||||
| gain (loss) on investments | 2.66 | .94 | (.31 | ) | .94 | 1.55 | |||
| Total from Investment Operations | 2.71 | .99 | (.29 | ) | .97 | 1.59 | |||
| Distributions: | |||||||||
| Dividends from investment income—net | (.11 | ) | (.02 | ) | (.04 | ) | (.04 | ) | — |
| Dividends from net realized | |||||||||
| gain on investments | (1.05 | ) | — | — | — | — | |||
| Total Distributions | (1.16 | ) | (.02 | ) | (.04 | ) | (.04 | ) | — |
| Settlement payment from | |||||||||
| unaffiliated third party | — | — | — | .01 | — | ||||
| Net asset value, end of period | 9.16 | 7.61 | 6.64 | 6.97 | 6.03 | ||||
| Total Return (%) | 36.40 | 14.93 | (4.23 | ) | 16.34 | b | 35.81 | ||
| Ratios/Supplemental Data (%): | |||||||||
| Ratio of total expenses | |||||||||
| to average net assets | 1.14 | 1.11 | 1.00 | .92 | .88 | ||||
| Ratio of net expenses | |||||||||
| to average net assets | .93 | 1.05 | .97 | .88 | .87 | ||||
| Ratio of net investment income | |||||||||
| to average net assets | .55 | .64 | .24 | .47 | .75 | ||||
| Portfolio Turnover Rate | 76.66 | 61.52 | 58.58 | 63.42 | 82.53 | ||||
| Net Assets, end of period ($ x 1,000) | 26,328 | 25,967 | 38,356 | 56,083 | 91,803 | ||||
| a Based on average shares outstanding at each month end. |
| b If settlement payment from unaffiliated third party was not made, total return would have been 16.18%. |
See notes to financial statements.
The Fund 19
NOTES TO FINANCIAL STATEMENTS
NOTE 1—Significant Accounting Policies:
Dreyfus Large Cap Growth Fund (the “fund”) is a separate diversified series of Dreyfus Premier Investment Funds, Inc. (the “Company”), which is registered under the Investment Company Act of 1940, as amended (the “Act”), as an open-end management investment company and operates as a series company currently offering eight series, including the fund. The fund’s investment objective seeks to provide long-term capital appreciation. The Dreyfus Corporation (the “Manager” or “Dreyfus”), a wholly-owned subsidiary ofThe Bank of NewYork Mellon Corporation (“BNY Mellon”), serves as the fund’s investment adviser.
MBSC Securities Corporation (the “Distributor”), a wholly-owned subsidiary of the Manager, is the distributor of the fund’s shares. The fund is authorized to issue 250 million shares of $.001 par value Common Stock. The fund currently offers three Classes of shares: Class A (100 million shares authorized), Class C (50 million shares authorized) and Class I (100 million shares authorized). Class A shares generally are subject to a sales charge imposed at the time of purchase. Class C shares are subject to a contingent deferred sales charge (“CDSC”) imposed on Class C shares redeemed within one year of purchase. Class I shares are sold at net asset value per share only to institutional investors. Other differences between the classes include the services offered to and the expenses borne by each class, the allocation of certain transfer agency costs and certain voting rights. Income, expenses (other than expenses attributable to a specific class), and realized and unrealized gains or losses on investments are allocated to each class of shares based on its relative net assets.
The Company accounts separately for the assets, liabilities and operations of each series. Expenses directly attributable to each series are charged to that series’ operations; expenses which are applicable to all series are allocated among them on a pro rata basis.
The Financial Accounting Standards Board (“FASB”) Accounting Standards Codification is the exclusive reference of authoritative U.S. generally accepted accounting principles (“GAAP”) recognized by the FASB to be applied by nongovernmental entities. Rules and interpretive
20
releases of the Securities and Exchange Commission (“SEC”) under authority of federal laws are also sources of authoritative GAAP for SEC registrants. The fund’s financial statements are prepared in accordance with GAAP, which may require the use of management estimates and assumptions.Actual results could differ from those estimates.
The Company enters into contracts that contain a variety of indemnifications. The fund’s maximum exposure under these arrangements is unknown.The fund does not anticipate recognizing any loss related to these arrangements.
(a) Portfolio valuation: The fair value of a financial instrument is the amount that would be received to sell an asset or paid to transfer a liability in an orderly transaction between market participants at the measurement date (i.e., the exit price). GAAP establishes a fair value hierarchy that prioritizes the inputs of valuation techniques used to measure fair value. This hierarchy gives the highest priority to unadjusted quoted prices in active markets for identical assets or liabilities (Level 1 measurements) and the lowest priority to unobservable inputs (Level 3 measurements).
Additionally, GAAP provides guidance on determining whether the volume and activity in a market has decreased significantly and whether such a decrease in activity results in transactions that are not orderly. GAAP requires enhanced disclosures around valuation inputs and techniques used during annual and interim periods.
Various inputs are used in determining the value of the fund’s investments relating to fair value measurements.These inputs are summarized in the three broad levels listed below:
Level 1—unadjusted quoted prices in active markets for identical investments.
Level 2—other significant observable inputs (including quoted prices for similar investments, interest rates, prepayment speeds, credit risk, etc.).
Level 3—significant unobservable inputs (including the fund’s own assumptions in determining the fair value of investments).
The Fund 21
NOTES TO FINANCIAL STATEMENTS (continued)
The inputs or methodology used for valuing securities are not necessarily an indication of the risk associated with investing in those securities.
Changes in valuation techniques may result in transfers in or out of an assigned level within the disclosure hierarchy. Valuation techniques used to value the fund’s investments are as follows:
Investments in securities are valued at the last sales price on the securities exchange or national securities market on which such securities are primarily traded. Securities listed on the National Market System for which market quotations are available are valued at the official closing price or, if there is no official closing price that day, at the last sales price. Securities not listed on an exchange or the national securities market, or securities for which there were no transactions, are valued at the average of the most recent bid and asked prices, except for open short positions, where the asked price is used for valuation purposes. Bid price is used when no asked price is available. Registered investment companies that are not traded on an exchange are valued at their net asset value. All of the preceding securities are categorized within Level 1 of the fair value hierarchy.
Fair valuing of securities may be determined with the assistance of a pricing service using calculations based on indices of domestic securities and other appropriate indicators, such as prices of relevant ADRs and financial futures. Utilizing these techniques may result in transfers between Level 1 and Level 2 of the fair value hierarchy.
When market quotations or official closing prices are not readily available, or are determined not to reflect accurately fair value, such as when the value of a security has been significantly affected by events after the close of the exchange or market on which the security is principally traded (for example, a foreign exchange or market), but before the fund calculates its net asset value, the fund may value these investments at fair value as determined in accordance with the procedures approved by the Company’s Board of Directors (the “Board”). Certain factors may be considered when fair valuing investments such as: fundamental analytical data, the nature and duration of restrictions
22
on disposition, an evaluation of the forces that influence the market in which the securities are purchased and sold, and public trading in similar securities of the issuer or comparable issuers. These securities are either categorized within Level 2 or 3 of the fair value hierarchy depending on the relevant inputs used.
For restricted securities where observable inputs are limited, assumptions about market activity and risk are used and are categorized within Level 3 of the fair value hierarchy.
The following is a summary of the inputs used as of December 31, 2013 in valuing the fund’s investments:
| Level 2—Other | Level 3— | |||
| Level 1— | Significant | Significant | ||
| Unadjusted | Observable | Unobservable | ||
| Quoted Prices | Inputs | Inputs | Total | |
| Assets ($) | ||||
| Investments in Securities: | ||||
| Equity Securities— | ||||
| Domestic | ||||
| Common Stocks† | 27,664,871 | — | — | 27,664,871 |
| Equity Securities— | ||||
| Foreign | ||||
| Common Stocks† | 752,913 | — | — | 752,913 |
| Mutual Funds | 190,867 | — | — | 190,867 |
| † See Statement of Investments for additional detailed categorizations. | ||||
At December 31, 2013, there were no transfers between Level 1 and Level 2 of the fair value hierarchy.
(b) Securities transactions and investment income: Securities transactions are recorded on a trade date basis. Realized gains and losses from securities transactions are recorded on the identified cost basis. Dividend income is recognized on the ex-dividend date and interest income, including, where applicable, accretion of discount and amortization of premium on investments, is recognized on the accrual basis.
Pursuant to a securities lending agreement with The Bank of NewYork Mellon, a subsidiary of BNY Mellon and an affiliate of Dreyfus, the fund
The Fund 23
NOTES TO FINANCIAL STATEMENTS (continued)
may lend securities to qualified institutions. It is the fund’s policy that, at origination, all loans are secured by collateral of at least 102% of the value of U.S. securities loaned and 105% of the value of foreign securities loaned. Collateral equivalent to at least 100% of the market value of securities on loan is maintained at all times.At December 31, 2013, the value of the collateral was 97% of the market value of the securities on loan. The fund received additional collateral subsequent to year end which resulted in the market value of the collateral to be at least 100% of the market value of the securities. Collateral is either in the form of cash, which can be invested in certain money market mutual funds managed by the Manager or U.S. Government and Agency securities. The fund is entitled to receive all dividends, interest and distributions on securities loaned, in addition to income earned as a result of the lending transaction. Should a borrower fail to return the securities in a timely manner,The Bank of NewYork Mellon is required to replace the securities for the benefit of the fund or credit the fund with the market value of the unreturned securities and is subrogated to the fund’s rights against the borrower and the collateral. During the period ended December 31, 2013, The Bank of New York Mellon earned $1,053 from lending portfolio securities, pursuant to the securities lending agreement.
(c) Affiliated issuers: Investments in other investment companies advised by Dreyfus are defined as “affiliated” under the Act. Investments in affiliated investment companies during the period ended December 31, 2013 were as follows:
| Affiliated | |||||||
| Investment | Value | Value | Net | ||||
| Company | 12/31/2012 | ($) | Purchases ($) | Sales ($) | 12/31/2013 | ($) | Assets (%) |
| Dreyfus | |||||||
| Institutional | |||||||
| Preferred | |||||||
| Plus Money | |||||||
| Market Fund | 47,946 | 5,957,379 | 5,870,033 | 135,292 | .5 | ||
| Dreyfus | |||||||
| Institutional | |||||||
| Cash | |||||||
| Advantage | |||||||
| Fund | 1,577,820 | 8,849,604 | 10,371,849 | 55,575 | .2 | ||
| Total | 1,625,766 | 14,806,983 | 16,241,882 | 190,867 | .7 |
24
(d) Dividends to shareholders: Dividends are recorded on the ex-dividend date. Dividends from investment income-net and dividends from net realized capital gains, if any, are normally declared and paid annually, but the fund may make distributions on a more frequent basis to comply with the distribution requirements of the Internal Revenue Code of 1986, as amended (the “Code”).To the extent that net realized capital gains can be offset by capital loss carryovers, it is the policy of the fund not to distribute such gains. Income and capital gain distributions are determined in accordance with income tax regulations, which may differ from GAAP.
(e) Federal income taxes: It is the policy of the fund to continue to qualify as a regulated investment company, if such qualification is in the best interests of its shareholders, by complying with the applicable provisions of the Code, and to make distributions of taxable income sufficient to relieve it from substantially all federal income and excise taxes.
As of and during the period ended December 31, 2013, the fund did not have any liabilities for any uncertain tax positions.The fund recognizes interest and penalties, if any, related to uncertain tax positions as income tax expense in the Statement of Operations. During the period ended December 31, 2013, the fund did not incur any interest or penalties.
Each tax year in the four-year period ended December 31, 2013 remains subject to examination by the Internal Revenue Service and state taxing authorities.
At December 31, 2013, the components of accumulated earnings on a tax basis were as follows: undistributed ordinary income $249,011, undistributed capital gains $239,686 and unrealized appreciation $8,586,148.
The tax character of distributions paid to shareholders during the fiscal periods ended December 31, 2013 and December 31, 2012 were as follows: ordinary income $1,274,249 and $112,759, and long-term capital gains $2,151,096 and $0, respectively.
The Fund 25
NOTES TO FINANCIAL STATEMENTS (continued)
NOTE 2—Bank Lines of Credit:
The fund participates with other Dreyfus-managed funds in a $265 million unsecured credit facility led by Citibank, N.A. and a $300 million unsecured credit facility provided by The Bank of New York Mellon (each, a “Facility”), each to be utilized primarily for temporary or emergency purposes, including the financing of redemptions. Prior to October 9, 2013, the unsecured credit facility with Citibank, N.A. was $210 million. In connection therewith, the fund has agreed to pay its pro rata portion of commitment fees for each Facility. Interest is charged to the fund based on rates determined pursuant to the terms of the respective Facility at the time of borrowing.
The average amount of borrowings outstanding under the Facilities during the period ended December 31, 2013 was approximately $28,800 with a related weighted average annualized interest rate of 1.12%.
NOTE 3—Management Fee and Other Transactions With Affiliates:
(a) Pursuant to a management agreement with the Manager, the management fee is computed at an annual rate of .70% of the value of the fund’s average daily net assets and is payable monthly.The Manager had agreed from January 1, 2013 through March 30, 2013 to waive receipt of a portion of the fund’s management fee in the amount of .15% of the value of the fund’s average daily net assets.The Manager also had agreed from January 1, 2013 through April 30, 2013, to waive receipt of its fees and/or assume the expenses of the fund so that the direct expenses of none of the classes (excluding Rule 12b-1 Distribution Plan fees, Shareholder Services Plan fees, taxes, interest expense, brokerage commissions, commitment fees on borrowings and extraordinary expenses) exceeded 1.25% of the value of the fund’s average daily net assets. Thereafter, the Manager has agreed from May 1, 2013 through May 1, 2014, to waive receipt of its fees and/or assume the expenses of the fund so that the expenses of none of the classes (excluding certain expenses
26
as described above) exceed .90% of the value of the fund’s average daily net assets. The reduction in expenses, pursuant to the undertakings, amounted to $62,033 during the period ended December 31, 2013.
During the period ended December 31, 2013, the Distributor retained $533 from commissions earned on sales of the fund’s Class A shares.
(b) Under the Distribution Plan adopted pursuant to Rule 12b-1 under the Act, Class C shares pay the Distributor for distributing its shares at an annual rate of .75% of the value of its average daily net assets. During the period ended December 31, 2013, Class C shares were charged $1,966 pursuant to the Distribution Plan.
(c) Under the Shareholder Services Plan, Class A and Class C shares pay the Distributor at an annual rate of .25% of the value of their average daily net assets for the provision of certain services.The services provided may include personal services relating to shareholder accounts, such as answering shareholder inquiries regarding the fund and providing reports and other information, and services related to the maintenance of shareholder accounts.The Distributor may make payments to Service Agents (securities dealers, financial institutions or other industry professionals) with respect to these services.The Distributor determines the amounts to be paid to Service Agents. During the period ended December 31, 2013, Class A and Class C shares were charged $3,591 and $655, respectively, pursuant to the Shareholder Services Plan.
The fund has arrangements with the transfer agent and the custodian whereby the fund may receive earnings credits when positive cash balances are maintained, which are used to offset transfer agency and custody fees. For financial reporting purposes, the fund includes net earnings credits as an expense offset in the Statement of Operations.
The fund compensates DreyfusTransfer, Inc., a wholly-owned subsidiary of the Manager, under a transfer agency agreement for providing transfer agency and cash management services for the fund.The majority of
The Fund 27
NOTES TO FINANCIAL STATEMENTS (continued)
transfer agency fees are comprised of amounts paid on a per account basis, while cash management fees are related to fund subscriptions and redemptions. During the period ended December 31, 2013, the fund was charged $7,393 for transfer agency services and $374 for cash management services.These fees are included in Shareholder servicing costs in the Statement of Operations. Cash management fees were partially offset by earnings credits of $39.
The fund compensates The Bank of NewYork Mellon under a custody agreement for providing custodial services for the fund.These fees are determined based on net assets, geographic region and transaction activity. During the period ended December 31, 2013, the fund was charged $8,070 pursuant to the custody agreement.
The fund compensated The Bank of New York Mellon under a cash management agreement that was in effect until September 30, 2013 for performing certain cash management services related to fund subscriptions and redemptions. During the period ended December 31, 2013, the fund was charged $129 pursuant to the cash management agreement, which is included in Shareholder servicing costs in the Statement of Operations.
During the period ended December 31, 2013, the fund was charged $9,093 for services performed by the Chief Compliance Officer and his staff.
The components of “Due to The Dreyfus Corporation and affiliates” in the Statement of Assets and Liabilities consist of: management fees $16,917, Distribution Plan fees $201, Shareholder Services Plan fees $458, custodian fees $5,210, Chief Compliance Officer fees $2,299 and transfer agency fees $1,520, which are offset against an expense reimbursement currently in effect in the amount of $8,210.
(d) Each Board member also serves as a Board member of other funds within the Dreyfus complex. Annual retainer fees and attendance fees are allocated to each fund based on net assets.
28
NOTE 4—Securities Transactions:
The aggregate amount of purchases and sales of investment securities, excluding short-term securities, during the period ended December 31, 2013, amounted to $21,375,301 and $28,444,563, respectively.
At December 31, 2013, the cost of investments for federal income tax purposes was $20,022,503; accordingly, accumulated net unrealized appreciation on investments was $8,586,148, consisting of $8,656,188 gross unrealized appreciation and $70,040 gross unrealized depreciation.
The Fund 29
REPORT OF INDEPENDENT REGISTERED
PUBLIC ACCOUNTING FIRM
Shareholders and Board of Directors
Dreyfus Large Cap Growth Fund
We have audited the accompanying statement of assets and liabilities, including the statement of investments, of Dreyfus Large Cap Growth Fund (one of the series comprising Dreyfus Premier Investment Funds, Inc.) as of December 31, 2013, and the related statement of operations for the year then ended, the statement of changes in net assets for each of the two years in the period then ended, and the financial highlights for each of the five years in the period then ended.These financial statements and financial highlights are the responsibility of the Fund’s management. Our responsibility is to express an opinion on these financial statements and financial highlights based on our audits.
We conducted our audits in accordance with the standards of the Public Company Accounting Oversight Board (United States).Those standards require that we plan and perform the audit to obtain reasonable assurance about whether the financial statements and financial highlights are free of material misstatement.We were not engaged to perform an audit of the Fund’s internal control over financial reporting. Our audits included consideration of internal control over financial reporting as a basis for designing audit procedures that are appropriate in the circumstances, but not for the purpose of expressing an opinion on the effectiveness of the Fund’s internal control over financial reporting. Accordingly, we express no such opinion. An audit also includes examining, on a test basis, evidence supporting the amounts and disclosures in the financial statements and financial highlights, assessing the accounting principles used and significant estimates made by management, and evaluating the overall financial statement presentation. Our procedures included confirmation of securities owned as of December 31, 2013 by correspondence with the custodian and others. We believe that our audits provide a reasonable basis for our opinion.
In our opinion, the financial statements and financial highlights referred to above present fairly, in all material respects, the financial position of Dreyfus Large Cap Growth Fund at December 31, 2013, the results of its operations for the year then ended, the changes in its net assets for each of the two years in the period then ended, and the financial highlights for each of the five years in the period then ended, in conformity with U.S. generally accepted accounting principles.
New York, New York
February 27, 2014
30
IMPORTANT TAX INFORMATION (Unaudited)
In accordance with federal tax law, the fund hereby reports 40.58% of the ordinary dividends paid during the fiscal year ended December 31, 2013 as qualifying for the corporate dividends received deduction. For the fiscal year ended December 31, 2013, certain dividends paid by the fund may be subject to a maximum tax rate of 15%, as provided for by the Jobs and Growth Tax Relief Reconciliation Act of 2003. Of the distributions paid during the fiscal year, $609,747 represents the maximum amount that may be considered qualified dividend income. Shareholders will receive notification in early 2014 of the percentage applicable to the preparation of their 2013 income tax returns. Also, the fund hereby reports $.1407 per share as a long-term capital gain distribution paid on March 18, 2013 and the fund also reports $.3269 per share as a short-term capital gain distribution and $.5793 per share as a long-term capital gain distribution paid on December 23, 2013.
The Fund 31
| BOARD MEMBERS INFORMATION (Unaudited) |
| INDEPENDENT BOARD MEMBERS |
| Joseph S. DiMartino (70) |
| Chairman of the Board (1995) |
| Principal Occupation During Past 5Years: |
| • Corporate Director and Trustee |
| Other Public Company Board Memberships During Past 5Years: |
| • CBIZ (formerly, Century Business Services, Inc.), a provider of outsourcing functions for small |
| and medium size companies, Director (1997-present) |
| • The Newark Group, a provider of a national market of paper recovery facilities, paperboard |
| mills and paperboard converting plants, Director (2000-2010) |
| • Sunair Services Corporation, a provider of certain outdoor-related services to homes and |
| businesses, Director (2005-2009) |
| No. of Portfolios for which Board Member Serves: 141 |
| ——————— |
| Peggy C. Davis (70) |
| Board Member (2012) |
| Principal Occupation During Past 5Years: |
| • Shad Professor of Law, New York University School of Law (1983-present) |
| No. of Portfolios for which Board Member Serves: 56 |
| ——————— |
| David P. Feldman (74) |
| Board Member (1991) |
| Principal Occupation During Past 5Years: |
| • Corporate Director and Trustee |
| Other Public Company Board Memberships During Past 5Years: |
| • BBH Mutual Funds Group (4 registered mutual funds), Director (1992-present) |
| No. of Portfolios for which Board Member Serves: 42 |
| ——————— |
| Ehud Houminer (73) |
| Board Member (2012) |
| Principal Occupation During Past 5Years: |
| • Executive-in-Residence at the Columbia Business School, Columbia University (1992-present) |
| Other Public Company Board Memberships During Past 5Years: |
| • Avnet Inc., an electronics distributor, Director (1993-2012) |
| No. of Portfolios for which Board Member Serves: 66 |
32
| Lynn Martin (74) |
| Board Member (1994) |
| Principal Occupation During Past 5Years: |
| • President of The Martin Hall Group LLC, a human resources consulting firm (2005-2012) |
| Other Public Company Board Memberships During Past 5Years: |
| • AT&T Inc., a telecommunications company, Director (1999-2012) |
| • Ryder System, Inc., a supply chain and transportation management company, Director (1993-2012) |
| • The Proctor & Gamble Co., a consumer products company, Director (1994-2009) |
| • Constellation Energy Group Inc., Director (2003-2009) |
| No. of Portfolios for which Board Member Serves: 42 |
| ——————— |
| Robin A. Melvin (50) |
| Board Member (2011) |
| Principal Occupation During Past 5Years: |
| • Board Member, Illinois Mentoring Partnership, non-profit organization dedicated to increasing |
| the quantity and quality of mentoring services in Illinois (2013-present) |
| • Director, Boisi Family Foundation, a private family foundation that supports youth-serving orga- |
| nizations that promote the self sufficiency of youth from disadvantaged circumstances (1995-2012) |
| No. of Portfolios for which Board Member Serves: 90 |
| ——————— |
| Dr. Martin Peretz (74) |
| Board Member (2012) |
| Principal Occupation During Past 5Years: |
| • Editor-in-Chief Emeritus of The New Republic Magazine (2010-2011) (previously, |
| Editor-in-Chief, 1974-2010) |
| • Director of TheStreet.com, a financial information service on the web (1996-2010) |
| No. of Portfolios for which Board Member Serves: 42 |
| ——————— |
| Once elected all Board Members serve for an indefinite term, but achieve Emeritus status upon reaching age 80.The |
| address of the Board Members and Officers is c/o The Dreyfus Corporation, 200 Park Avenue, NewYork, NewYork |
| 10166.Additional information about the Board Members is available in the fund’s Statement of Additional Information |
| which can be obtained from Dreyfus free of charge by calling this toll free number: 1-800-DREYFUS. |
| Daniel Rose, Emeritus Board Member |
| Philip L.Toia, Emeritus Board Member |
| Sander Vanocur, Emeritus Board Member |
The Fund 33
OFFICERS OF THE FUND (Unaudited)
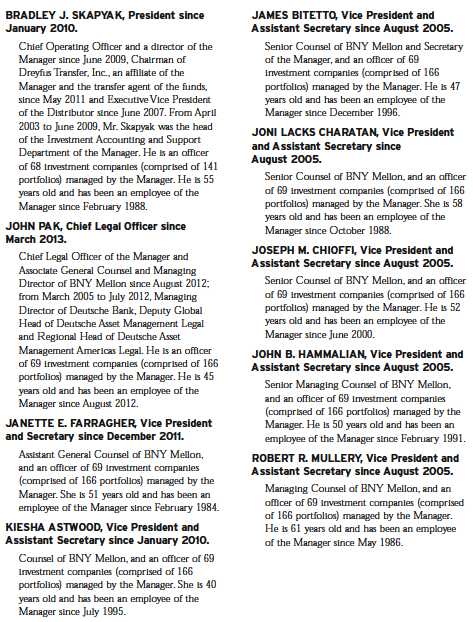
34

The Fund 35
NOTES
Item 2. Code of Ethics.
The Registrant has adopted a code of ethics that applies to the Registrant's principal executive officer, principal financial officer, principal accounting officer or controller, or persons performing similar functions. There have been no amendments to, or waivers in connection with, the Code of Ethics during the period covered by this Report.
Item 3. Audit Committee Financial Expert.
The Registrant's Board has determined that David P. Feldman, a member of the Audit Committee of the Board, is an audit committee financial expert as defined by the Securities and Exchange Commission (the "SEC"). David P. Feldman is "independent" as defined by the SEC for purposes of audit committee financial expert determinations.
Item 4. Principal Accountant Fees and Services.
(a) Audit Fees. The aggregate fees billed for each of the last two fiscal years (the "Reporting Periods") for professional services rendered by the Registrant's principal accountant (the "Auditor") for the audit of the Registrant's annual financial statements or services that are normally provided by the Auditor in connection with the statutory and regulatory filings or engagements for the Reporting Periods, were $103,338 in 2012 and $63,188 in 2013
(b) Audit-Related Fees. The aggregate fees billed in the Reporting Periods for assurance and related services by the Auditor that are reasonably related to the performance of the audit of the Registrant's financial statements and are not reported under paragraph (a) of this Item 4 were $18,000 in 2012 and $12,000 in 2013. These services consisted of one or more of the following: (i) agreed upon procedures related to compliance with Internal Revenue Code section 817(h), (ii) security counts required by Rule 17f-2 under the Investment Company Act of 1940, as amended, (iii) advisory services as to the accounting or disclosure treatment of Registrant transactions or events and (iv) advisory services to the accounting or disclosure treatment of the actual or potential impact to the Registrant of final or proposed rules, standards or interpretations by the Securities and Exchange Commission, the Financial Accounting Standards Boards or other regulatory or standard-setting bodies.
The aggregate fees billed in the Reporting Periods for non-audit assurance and related services by the Auditor to the Registrant's investment adviser (not including any sub-investment adviser whose role is primarily portfolio management and is subcontracted with or overseen by another investment adviser), and any entity controlling, controlled by or under common control with the investment adviser that provides ongoing services to the Registrant ("Service Affiliates"), that were reasonably related to the performance of the annual audit of the Service Affiliate, which required pre-approval by the Audit Committee were $0 in 2012 and $0 in 2013.
(c) Tax Fees. The aggregate fees billed in the Reporting Periods for professional services rendered by the Auditor for tax compliance, tax advice, and tax planning ("Tax Services") were $11,121 in 2012 and $7,681 in 2013. These services consisted of: (i) review or preparation of U.S. federal, state, local and excise tax returns; (ii) U.S. federal, state and local tax planning, advice and assistance regarding statutory, regulatory or administrative developments; (iii) tax advice regarding tax qualification matters and/or treatment of various financial instruments held or proposed to be acquired or held, and (iv) determination of Passive Foreign Investment Companies. The aggregate fees billed in the Reporting Periods for Tax Services by the Auditor to Service Affiliates, which required pre-approval by the Audit Committee were $0 in 2012 and $0 in 2013.
(d) All Other Fees. The aggregate fees billed in the Reporting Periods for products and services provided by the Auditor, other than the services reported in paragraphs (a) through (c) of this Item, were $151 in 2012 and $119 in 2013. These services consisted of a review of the Registrant's anti-money laundering program.
The aggregate fees billed in the Reporting Periods for Non-Audit Services by the Auditor to Service Affiliates, other than the services reported in paragraphs (b) through (c) of this Item, which required pre-approval by the Audit Committee, were $200,000 in 2012 and $0 in 2013.
(e)(1) Audit Committee Pre-Approval Policies and Procedures. The Registrant's Audit Committee has established policies and procedures (the "Policy") for pre-approval (within specified fee limits) of the Auditor's engagements for non-audit services to the Registrant and Service Affiliates without specific case-by-case consideration. The pre-approved services in the Policy can include pre-approved audit services, pre-approved audit-related services, pre-approved tax services and pre-approved all other services. Pre-approval considerations include whether the proposed services are compatible with maintaining the Auditor's independence. Pre-approvals pursuant to the Policy are considered annually.
(e)(2) Note: None of the services described in paragraphs (b) through (d) of this Item 4 were approved by the Audit Committee pursuant to paragraph (c)(7)(i)(C) of Rule 2-01 of Regulation S-X.
(f) None of the hours expended on the principal accountant's engagement to audit the registrant's financial statements for the most recent fiscal year were attributed to work performed by persons other than the principal account's full-time, permanent employees.
Non-Audit Fees. The aggregate non-audit fees billed by the Auditor for services rendered to the Registrant, and rendered to Service Affiliates, for the Reporting Periods were $49,204,697 in 2012 and $50,384,343 in 2013.
Auditor Independence. The Registrant's Audit Committee has considered whether the provision of non-audit services that were rendered to Service Affiliates, which were not pre-approved (not requiring pre-approval), is compatible with maintaining the Auditor's independence.
Item 5. Audit Committee of Listed Registrants.
Not applicable. [CLOSED-END FUNDS ONLY]
Item 6. Investments.
(a) Not applicable.
Item 7. Disclosure of Proxy Voting Policies and Procedures for Closed-End Management Investment Companies.
Not applicable. [CLOSED-END FUNDS ONLY]
Item 8. Portfolio Managers of Closed-End Management Investment Companies.
Not applicable. [CLOSED-END FUNDS ONLY, beginning with reports for periods ended on and after December 31, 2005]
Item 9. Purchases of Equity Securities by Closed-End Management Investment Companies and Affiliated Purchasers.
Not applicable. [CLOSED-END FUNDS ONLY]
Item 10. Submission of Matters to a Vote of Security Holders.
There have been no material changes to the procedures applicable to Item 10.
Item 11. Controls and Procedures.
(a) The Registrant's principal executive and principal financial officers have concluded, based on their evaluation of the Registrant's disclosure controls and procedures as of a date within 90 days of the filing date of this report, that the Registrant's disclosure controls and procedures are reasonably designed to ensure that information required to be disclosed by the Registrant on Form N-CSR is recorded, processed, summarized and reported within the required time periods and that information required to be disclosed by the Registrant in the reports that it files or submits on Form N-CSR is accumulated and communicated to the Registrant's management, including its principal executive and principal financial officers, as appropriate to allow timely decisions regarding required disclosure.
(b) There were no changes to the Registrant's internal control over financial reporting that occurred during the second fiscal quarter of the period covered by this report that have materially affected, or are reasonably likely to materially affect, the Registrant's internal control over financial reporting.
Item 12. Exhibits.
(a)(1) Code of ethics referred to in Item 2.
(a)(2) Certifications of principal executive and principal financial officers as required by Rule 30a-2(a) under the Investment Company Act of 1940.
(a)(3) Not applicable.
(b) Certification of principal executive and principal financial officers as required by Rule 30a-2(b) under the Investment Company Act of 1940.
SIGNATURES
Pursuant to the requirements of the Securities Exchange Act of 1934 and the Investment Company Act of 1940, the Registrant has duly caused this Report to be signed on its behalf by the undersigned, thereunto duly authorized.
Dreyfus Premier Investment Funds, Inc.
By: /s/ Bradley J. Skapyak | |
Bradley J. Skapyak President
| |
Date: | February 21, 2014 |
| |
Pursuant to the requirements of the Securities Exchange Act of 1934 and the Investment Company Act of 1940, this Report has been signed below by the following persons on behalf of the Registrant and in the capacities and on the dates indicated. | |
| |
By: /s/ Bradley J. Skapyak | |
Bradley J. Skapyak President
| |
Date: | February 21, 2014 |
| |
By: /s/ James Windels | |
James Windels Treasurer
| |
Date: | February 21, 2014 |
| |
EXHIBIT INDEX
(a)(1) Code of ethics referred to in Item 2.
(a)(2) Certifications of principal executive and principal financial officers as required by Rule 30a-2(a) under the Investment Company Act of 1940. (EX-99.CERT)
(b) Certification of principal executive and principal financial officers as required by Rule 30a-2(b) under the Investment Company Act of 1940. (EX-99.906CERT)