UNITED STATES
SECURITIES AND EXCHANGE COMMISSION
Washington, D.C. 20549
FORM N-CSR
CERTIFIED SHAREHOLDER REPORT OF
REGISTERED MANAGEMENT INVESTMENT COMPANIES
Investment Company Act file number: 811-06520
AMG FUNDS I
(Exact name of registrant as specified in charter)
680 Washington Blvd., Suite 500, Stamford, Connecticut 06901
(Address of principal executive offices) (Zip code)
AMG Funds LLC
680 Washington Blvd., Suite 500, Stamford, Connecticut 06901
(Name and address of agent for service)
Registrant’s telephone number, including area code: (203) 299-3500
Date of fiscal year end: September 30
Date of reporting period: OCTOBER 1, 2021 – SEPTEMBER 30, 2022
(Annual Shareholder Report)
| Item 1. | Reports to Shareholders |
| | |
 | | ANNUAL REPORT |
| | |
| | | AMG Funds September 30, 2022 |
| | | 
|
| | |
| | | AMG Boston Common Global Impact Fund |
| | | Class I: BRWIX |
| | | |
| | | |
| | | |
| | | |
| | | | |
| amgfunds.com | | | | 093022 AR074 |
| | |
| | | AMG Funds Annual Report — September 30, 2022 |
| | | | | | |
| | | |
| | | | | | | |
| | | TABLE OF CONTENTS | | PAGE | |
| | | | |
| | | LETTER TO SHAREHOLDERS | | | 2 | |
| | | |
| | | ABOUT YOUR FUND’S EXPENSES | | | 3 | |
| | | |
| | | PORTFOLIO MANAGER’S COMMENTS, FUND SNAPSHOTS AND SCHEDULE OF PORTFOLIO INVESTMENTS | | | 4 | |
| | | |
| | | FINANCIAL STATEMENTS | | | | |
| | | |
| | | Statement of Assets and Liabilities | | | 12 | |
| | | |
| | | Balance sheet, net asset value (NAV) per share computations and cumulative distributable earnings (loss) | | | | |
| | | |
| | | Statement of Operations | | | 13 | |
| | | |
| | | Detail of sources of income, expenses, and realized and unrealized gains (losses) during the fiscal year | | | | |
| | | |
| | | Statements of Changes in Net Assets | | | 14 | |
| | | |
| | | Detail of changes in assets for the past two fiscal years | | | | |
| | | |
| | | Financial Highlights | | | 15 | |
| | | |
| | | Historical net asset values per share, distributions, total returns, income and expense ratios, turnover ratios and net assets | | | | |
| | | |
| | | Notes to Financial Statements | | | 16 | |
| | | |
| | | Accounting and distribution policies, details of agreements and transactions with Fund management and affiliates, and descriptions of certain investment risks | | | | |
| | | |
| | | REPORT OF INDEPENDENT REGISTERED PUBLIC ACCOUNTING FIRM | | | 21 | |
| | | |
| | | OTHER INFORMATION | | | 22 | |
| | | |
| | | TRUSTEES AND OFFICERS | | | 23 | |
| | | |
| | | ANNUAL RENEWAL OF INVESTMENT MANAGEMENT AND SUBADVISORY AGREEMENTS | | | 25 | |
| | | | | | | |
|
Nothing contained herein is to be considered an offer, sale or solicitation of an offer to buy shares of any series of the AMG Funds Family of Funds. Such offering is made only by prospectus, which includes details as to offering price and other material information. | |
| | |
| | Letter to Shareholders |
Dear Shareholder:
The fiscal year ended September 30, 2022, was a volatile period for risk assets as uncertainties mounted about high inflation, monetary policy, and the Russian invasion of Ukraine. Global equity and bond markets fell in tandem amid sharply higher interest rates and eroding investor confidence as worries of an impending recession loomed over markets. A global commodity shock caused by the war in Ukraine only made matters worse. The S&P 500® Index slipped into a bear market with the Index falling more than (24)% from its peak earlier in the year. The abrupt shift in markets this year has reset expectations around future growth as stubbornly high inflation has necessitated the U.S. Federal Reserve and other global central banks to take more aggressive policy action in bringing down inflation. While the outlook is uncertain given the recent negative returns across many asset classes, one silver lining is that stock and bond valuations are now more attractive than where they were at the start of the year.
There was very wide dispersion in sector performance. Energy significantly outperformed all other sectors with a gain of 45.70% as the price of oil surged during the period. Defensive-oriented sectors also outperformed with a 5.55% return from utilities and a nearly flat (0.09)% return from consumer staples. All other sectors experienced negative returns, led by high growth technology and mega cap internet-related companies underperforming during the period. Communications services fell the most with a (39.07)% return during the fiscal year, followed by declines of (20.89)% for consumer discretionary and (19.96)% for information technology. Value stocks outperformed growth stocks as the Russell 1000® Value Index returned (11.36)% compared to the (22.59)% return for the Russell 1000® Growth Index. Small cap stocks struggled as the Russell 2000® Index lost (23.50)%. Outside the U.S., foreign developed markets lagged their U.S. counterparts as the U.S. dollar surged and the MSCI EAFE Index fell (25.13)%. Emerging Markets underperformed with a (28.11)% return for the MSCI Emerging Markets Index.
The 10-year Treasury yield more than doubled during the period, surging past the 3% threshold for the first time in the post-pandemic era. Rapidly rising rates from a very low base led to historically bad performance for bonds as the Bloomberg U.S. Aggregate Bond Index, a broad measure of U.S. bond market performance, lost (14.60)% over the period. Investment-grade corporate bonds underperformed, returning (18.53)% for the year. High yield bonds held up slightly better with a (14.14)% return as measured by the return of the Bloomberg U.S. Corporate High Yield Bond Index. Municipal bonds were slightly better with a (11.50)% return for the Bloomberg Municipal Bond Index. Non-U.S. bonds delivered weak performance and were also impacted by the stronger dollar as the Bloomberg Global Aggregate ex U.S. fell (24.77)%.
AMG Funds appreciates the privilege of providing investment tools to you and your clients. Our foremost goal is to provide investment solutions that help our shareholders successfully reach their long-term investment goals. AMG Funds provides access to a distinctive array of actively managed return-oriented investment strategies. We thank you for your continued confidence and investment in AMG Funds. You can rest assured that under all market conditions our team is focused on delivering excellent investment management services for your benefit.
|
Respectfully, |
 |
| Keitha Kinne |
| President |
| AMG Funds |
| | | | | | | | | | | | | | |
| | | | | Periods ended | |
| Average Annual Total Returns | | September 30, 2022* | |
| | | | |
| Stocks: | | | | 1 Year | | | 3 Years | | | 5 Years | |
| | | | |
Large Cap | | (S&P 500® Index) | | | (15.47 | )% | | | 8.16 | % | | | 9.24 | % |
| | | | |
Small Cap | | (Russell 2000® Index) | | | (23.50 | )% | | | 4.29 | % | | | 3.55 | % |
| | | | |
International | | (MSCI ACWI ex USA) | | | (25.17 | )% | | | (1.52 | )% | | | (0.81 | )% |
| | | | |
Bonds: | | | | | | | | | | | | | | |
| | | | |
Investment Grade | | (Bloomberg U.S. Aggregate Bond Index) | | | (14.60 | )% | | | (3.26 | )% | | | (0.27 | )% |
| | | | |
High Yield | | (Bloomberg U.S. Corporate High Yield Bond Index) | | | (14.14 | )% | | | (0.45 | )% | | | 1.57 | % |
| | | | |
Tax-exempt | | (Bloomberg Municipal Bond Index) | | | (11.50 | )% | | | (1.85 | )% | | | 0.59 | % |
| | | | |
Treasury Bills | | (ICE BofAML U.S. 6-Month Treasury Bill Index) | | | 0.39 | % | | | 0.68 | % | | | 1.25 | % |
*Source: FactSet. Past performance is no guarantee of future results.
2
| | |
| | | About Your Fund’s Expenses |
| | | |
| | | |
| | | | | | | | |
As a shareholder of a Fund, you may incur two types of costs: (1) transaction costs, which may include sales charges (loads) on purchase payments; redemption fees; and exchange fees; and (2) ongoing costs, including management fees; distribution (12b-1) fees; and other Fund expenses. This example is intended to help you understand your ongoing costs (in dollars) of investing in the Fund and to compare these costs with the ongoing costs of investing in other mutual funds. The example is based on $1,000 invested at the beginning of the period and held for the entire period as indicated below. ACTUAL EXPENSES The first line of the following table provides information about the actual account values and | | | | actual expenses. You may use the information in this line, together with the amount you invested, to estimate the expenses that you paid over the period. Simply divide your account value by $1,000 (for example, an $8,600 account value divided by $1,000 = 8.6), then multiply the result by the number in the first line under the heading entitled “Expenses Paid During the Period” to estimate the expenses you paid on your account during this period. HYPOTHETICAL EXAMPLE FOR COMPARISON PURPOSES The second line of the following table provides information about hypothetical account values and hypothetical expenses based on the Fund’s actual expense ratio and an assumed annual rate of return of 5% before expenses, which is not the Fund’s | | | | actual return. The hypothetical account values and expenses may not be used to estimate the actual ending account balance or expenses you paid for the period. You may use this information to compare the ongoing costs of investing in the Fund and other funds by comparing this 5% hypothetical example with the 5% hypothetical examples that appear in the shareholder reports of other funds. Please note that the expenses shown in the table are meant to highlight your ongoing costs only and do not reflect any transactional costs, such as sales charges (loads), redemption fees, or exchange fees. Therefore, the second line of the table is useful in comparing ongoing costs only, and will not help you determine the relative total costs of owning different funds. |
| | | | | | | | |
| | | | | | | | |
Six Months Ended
September 30, 2022 | | Expense
Ratio for
the Period | | Beginning
Account
Value
04/01/22 | | Ending
Account
Value
09/30/22 | | Expenses
Paid
During
the Period* |
AMG Boston Common Global Impact Fund |
|
Based on Actual Fund Return |
| | | | |
Class I | | 0.93% | | $1,000 | | $781 | | $4.15 |
|
Based on Hypothetical 5% Annual Return |
| | | | |
Class I | | 0.93% | | $1,000 | | $1,020 | | $4.71 |
| * | Expenses are equal to the Fund’s annualized expense ratio multiplied by the average account value over the period, multiplied by the number of days in the most recent fiscal half-year (183), then divided by 365. |
3
| | |
| | | AMG Boston Common Global Impact Fund Portfolio Manager’s Comments (unaudited) |
| | | |
| | | |
| | | | | | | | |
AMG Boston Common Global Impact Fund (the “Fund”) returned (29.90)% during the year ended September 30, 2022, compared to the (20.66)% return for the MSCI ACWI Index (the “Index”). Market Overview The year under review was marked by numerous cross currents. Geopolitical tensions, especially Russia’s war in Ukraine, soaring energy and food prices pushing up inflation & interest rates globally, hawkish central banks, China’s COVID lockdowns, and slowing global growth have all weighed on investor sentiment during the period. Encouragingly, supply chains seem to be unsnarling, with positive implications for near-term demand-supply imbalances and inflationary forces. Within the Index, Japan, Emerging Markets, and European equities declined most, while the U.K. and North American equities held up better relative to the Index. The traditional energy sector outperformed most, benefiting from elevated energy and gas prices, which have begun to roll over. Investor preference for defensive positions aided utilities and consumer staples, which also outperformed. Lagging most were communication services, especially media and entertainment stocks, and consumer discretionary and technology sectors, as higher interest rates, rising costs, and slowing demand pressured stock performance. Portfolio Review The difficult market environment impacted the portfolio, which underperformed the Index during the fiscal year. Stock selection was the primary driver of the underperformance. Detracting most was the selection in materials, especially in our green chemical holdings in Europe and the U.K., including Koninklijke DSM NV and Croda International PLC, as well as Norwegian manufacturer of petrochemical substitutes Borregaard A.S.A. and Belgian metal recycler & electric vehicle battery supplier Umicore, S.A.. Concerns regarding input costs and demand dynamics in a slowing growth environment have weighed on these positions. The industrials sector also lagged, as European holdings Schneider Electric SE, TOMRA Systems A.S.A., and Spirax-Sarco Engineering PLC declined with concerns around slowing economic activity, while wind turbine maker Vestas Wind Systems A/S was hurt by rising steel and freight costs. In the U.S., The AZEK Co., Inc. (“AZEK”), a leading manufacturer of recycled deck materials, and Carrier Global Corp., a global provider of safe and sustainable refrigeration and air conditioning appliances, declined amid concerns of | | | | a slowdown in residential and commercial real estate investment. Within healthcare, vaccine developer BioNTech SE, ADR (“BioNTech”), traditional Chinese medicine supplier China Traditional Chinese Medicine Holdings Co., Ltd., and Swiss hearing aid specialist Sonova Holding AG detracted value. Our lack of exposure to the lagging communication services sector proved most beneficial from an allocation perspective, while the underweight allocation to and selection within technology was also positive. Within technology, Enphase Energy, Inc. (“Enphase”) and First Solar, Inc., both U.S.-based renewable energy solutions providers, topped returns on resilient demand and conducive policy environment. Financials contributed during the period, led by Indonesian microfinance lender Bank Rakyat Indonesia Persero Tbk PT, ADR, which was positively correlated with commodities and benefits from an improving economy as mobility picks up. On a regional basis, our holdings in Europe, North America, and the U.K. detracted most, while those in Asia Pacific ex Japan and Emerging Markets were slightly positive. Outlook and Positioning The Russian war against Ukraine and the related European energy crisis are geopolitical threats that hinder global economic recovery. However, Europe looks rather well prepared to manage the winter of 2022 without Russian natural gas, having taken steps to collectively reduce energy demand, increase gas storage, and ensure fiscal support to lessen impact on consumers and small & medium-sized enterprises. China’s reluctance to abandon its “zero-COVID” policy is also stymying global growth. In this uncertain and higher interest rate market environment, we are increasingly cautious regarding stocks with elevated valuation levels. We have gradually moved the portfolio to more defensive positioning, decreasing our cyclical exposure in Europe and Japan while adding to positions within our more defensively tilted impact themes of Access to Health and Water Management. While short-term policy interest rates are poised to rise further, we see disinflationary trends on the horizon. Commodity-related inflation appears to be easing as corporations right-size supply chains and consumer demand moderates. Corporate executives of many holdings continue to display optimism about future revenue growth capabilities, especially as many companies stand to benefit from the electrification and renewable power energy transition. The recently passed Inflation Reduction Act (“IRA”) in the U.S. contains $369 billion in climate | | | | spending, including clean electricity tax credits, clean energy incentives, building efficiency, and electrification. This should help to drive U.S. climate action forward and help to rebuild the U.S.’ credibility on the international climate stage. Our Fund’s investment strategy is very well aligned with such policy measures. Portfolio Activity Over the period, we used the market selloff to initiate positions in a select number of predominantly U.S.-based, technology-oriented solutions names. In early 2022 we bought Enphase, a pure-play solutions company and leading provider of microinverter systems for the solar industry. Enphase is the market leader in this niche category, which helps support the provision of green, affordable, and reliable energy. Its technology approach brings solar energy generation, storage, control, and management into an all-in-one intelligent platform. We also purchased online payment platform PayPal Holdings, Inc. (“PayPal”), a dominant player in the payment industry, which facilitates online retailing for both large and small enterprises across more than two hundred markets. We regard PayPal as a solutions company within our Inclusive & Sustainable Finance impact theme. We also purchased salesforce.com, Inc., a cloud-based solutions provider of customer relationship management (“CRM”) systems to businesses of all sizes and industries worldwide. Within the eco-efficiency impact theme, we bought Infineon Technologies AG, a German/U.S. semiconductor manufacturer focused on structural trends like renewable energy adoption and e-mobility infrastructure, including EV charging. Other new positions during the period include U.S.-based AZEK and LKQ Corp (“LKQ”). AZEK is a manufacturer of high-quality recycled deck material, displaying strong organic growth in the attractive market for remodeling outdoor residential space. Increasing its products’ use of recycled content should help bolster margin expansion, bringing it closer to the industry’s market leader TREX. LKQ is a global leader within the auto recycling industry and thus part of our Recycling and Efficiency impact investment theme. Cars are the most recycled product on the planet, and 95% of car materials can be repurposed (like steel, copper, and aluminum). The auto recycling industry reclaims more than 750 million tons of scrap each month from wrecked or abandoned vehicles, and LKQ has been a consolidator in this highly fragmented market. LKQ gathers an average of 140 recycled and refurbished high-quality parts from each salvaged or total loss |
4
| | |
| | | AMG Boston Common Global Impact Fund Portfolio Manager’s Comments (continued) |
| | | |
| | | |
| | | | | | | | |
vehicle. The company has made important strides in repairing its balance sheet, which should allow for significant share buybacks. As we tilted into the more defensive impact themes, we bought Regeneron Pharmaceuticals, Inc. and BioNTech, both solutions names in our Access to Health impact theme. In terms of exits, we sold Cummins, Inc., a name we like for its long-term hydrogen potential, but which remains largely dependent on heavy diesel engine manufacturing. We also sold paper & packaging company DS Smith PLC, whose investment thesis appeared challenged during a period of decelerating economic growth, as well as Mohawk Industries, Inc., | | | | whose high free cash flow yield was expected to be impacted by higher energy & materials input prices. Cerner Corp. received a take-out offer from Oracle. Overall, on a sector basis, we raised our allocation to technology and financials, while reducing industrials and materials. The Fund remains focused on product solutions companies within our nine impact investment themes whose revenues stand to benefit from economic expansion, regulatory directives, and the long-term pathway to achieve carbon-neutral transformation. Our integrated ESG & Impact research process leads us to a portfolio of 40-60 companies that we believe are best positioned for | | | | this sustainable transition. At the end of the period, the largest impact investment themes in which we were invested were Recycling & Eco-Efficiency, Organic/Healthier Products, Sustainable & Inclusive Finance, and Access to Health. This commentary reflects the viewpoints of the portfolio manager, Boston Common Asset Management, as of September 30, 2022, is not intended as a forecast or guarantee of future results, and is subject to change without notice. |
5
| | |
| | | AMG Boston Common Global Impact Fund Portfolio Manager’s Comments (continued) |
| | | |
| | | |
CUMULATIVE TOTAL RETURN PERFORMANCE
AMG Boston Common Global Impact Fund’s cumulative total return is based on the daily change in net asset value (NAV), and assumes that all dividends and distributions were reinvested. The graph compares a hypothetical $10,000 investment made in the AMG Boston Common Global Impact Fund’s Class I shares on September 30, 2012, to a $10,000 investment made in the MSCI ACWI Index for the same time period. The graph and table do not reflect the deduction of taxes that a shareholder would pay on a Fund distribution or redemption of shares. The listed returns for the Fund are net of expenses and the returns for the index exclude expenses. Total returns would have been lower had certain expenses not been reduced.
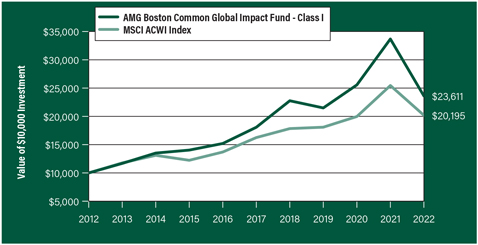
The table below shows the average annual total returns for the AMG Boston Common Global Impact Fund and the MSCI ACWI for the same time periods ended September 30, 2022.
| | | | | | |
| | | One | | Five | | Ten |
| Average Annual Total Returns1 | | Year | | Years | | Years |
|
AMG Boston Common Global Impact Fund2, 3, 4, 5, 6, 7, 8, 9, 10, 11, 12, 13, 14, 15 |
| | | |
Class I | | (29.90%) | | 5.49% | | 8.97% |
| | | |
MSCI ACWI Index16 | | (20.66%) | | 4.44% | | 7.28% |
The performance data shown represents past performance. Past performance is not a guarantee of future results. Current performance may be lower or higher than the performance data quoted. The investment return and principal value of an investment will fluctuate so that an investor’s shares, when redeemed, may be worth more or less than their original cost.
Investors should carefully consider the Fund’s investment objectives, risks, charges and expenses before investing. For performance information through the most recent month end, current net asset values per share for the Fund and other information, please call 800.548.4539 or visit our website at amgfunds.com for a free prospectus. Read it carefully before investing or sending money.
Distributed by AMG Distributors, Inc., member FINRA/SIPC.
| 1 | Total return equals income yield plus share price change and assumes reinvestment of all dividends and capital gain distributions. Returns are net of fees and may reflect offsets of Fund expenses as described in the prospectus. No adjustment has been made for taxes payable by shareholders on their reinvested dividends and capital gain distributions. Returns for periods greater than one year are annualized. The listed returns on the Fund are net of expenses and based on the published NAV as of September 30, 2022. All returns are in U.S. Dollars ($). |
| 2 | As of March 19, 2021, the Fund’s Subadviser was changed to Boston Common Asset Management, LLC. Prior to March 19, 2021, the Fund was known as the AMG Managers Brandywine Fund, and had different principal investment strategies and corresponding risks. Performance shown for periods prior to March 19, 2021, reflects |
|
the performance and investment strategies of the Fund’s previous Subadvisers, Friess Associates, LLC and Friess Associates of Delaware, LLC. The Fund’s past performance would have been different if the Fund were managed by the current Subadviser and strategy, and the Fund’s prior performance record might be less pertinent for investors considering whether to purchase shares of the fund. 3 Active and frequent trading of a fund may result in higher transaction costs and increased tax liability. 4 The Fund invests in growth stocks, which may be more sensitive to market movements because their prices tend to reflect future investor expectations rather than just current profits. Growth stocks may underperform value stocks during given periods. 5 Investments in international securities are subject to certain risks of overseas investing including currency fluctuations and changes in political and economic conditions, which could result in significant market fluctuations. These risks are magnified in emerging markets. 6 Companies that are in similar industry sectors may be similarly affected by particular economic or market events; to the extent the Fund has substantial holdings within a particular sector, the risks associated with that sector increase. 7 The Fund is subject to risks associated with investments in small-capitalization companies, such as erratic earnings patterns, competitive conditions, limited earnings history and a reliance on one or a limited number of products. 8 The Fund is subject to currency risk resulting from fluctuations in exchange rates that may affect the total loss or gain on a non-U.S. Dollar investment when converted back to U.S. Dollars. 9 Market prices of investments held by the Fund may fall rapidly or unpredictably due to a variety of economic or political factors, market conditions, disasters or public health issues, or in response to events that affect particular industries or companies. 10 Changes in the general political and social environment of a country can have substantial effects on the value of investments exposed to that country. 11 The Fund is subject to the risks associated with investments in emerging markets, such as erratic earnings patterns, economic and political instability, changing exchange controls, limitations on repatriation of foreign capital and changes in local governmental attitudes toward private investment, possibly leading to nationalization or confiscation of investor assets. |
6
| | |
| | | AMG Boston Common Global Impact Fund Portfolio Manager’s Comments (continued) |
| | | |
| | | |
| | | | | | | | |
12 Applying the Fund’s ESG investment criteria may result in the selection or exclusion of securities of certain issuers for reasons other than performance, and the Fund may underperform funds that do not utilize an ESG investment strategy. The application of this strategy may affect the Fund’s exposure to certain companies, sectors, regions, countries or types of investments, which could negatively impact the Fund’s performance depending on whether such investments are in or out of favor. Applying ESG criteria to investment decisions is qualitative and subjective by nature, and there is no guarantee that the criteria utilized by the Subadviser or any judgment exercised by the Subadviser will reflect the beliefs or values of any particular investor. | | | | 13 The Fund may not be able to dispose of particular investments, such as illiquid securities, readily at favorable times or prices or the Fund may have to sell them at a loss. 14 The Fund is subject to risks associated with investments in mid-capitalization companies such as greater price volatility, lower trading volume, and less liquidity than the stocks of larger, more established companies. 15 The Fund invests in value stocks, which may perform differently from the market as a whole and may be undervalued by the market for a long period of time. 16 The MSCI ACWI Index is a free float-adjusted market capitalization weighted index that is designed to measure the equity market performance of | | | | developed and emerging markets. Please go to msci.com for the most current list of countries represented by the index. Unlike the Fund, the MSCI ACWI Index is unmanaged, is not available for investment and does not incur expenses. All MSCI data is provided ‘as is’. The products described herein are not sponsored or endorsed and have not been reviewed or passed on by MSCI. In no event shall MSCI, its affiliates or any MSCI data provider have any liability of any kind in connection with the MSCI data or the products described herein. Copying or redistributing the MSCI data is strictly prohibited. Not FDIC insured, nor bank guaranteed. May lose value. |
7
| | |
| | | AMG Boston Common Global Impact Fund Fund Snapshots (unaudited) September 30, 2022 |
| | | |
| | | |
PORTFOLIO BREAKDOWN
| | | | | |
| Sector | | % of Net Assets |
| | |
Information Technology | | | | 20.7 | |
| | |
Industrials | | | | 17.8 | |
| | |
Health Care | | | | 14.5 | |
| | |
Consumer Discretionary | | | | 13.3 | |
| | |
Financials | | | | 10.2 | |
| | |
Materials | | | | 10.1 | |
| | |
Consumer Staples | | | | 6.1 | |
| | |
Utilities | | | | 3.4 | |
| | |
Real Estate | | | | 2.4 | |
| | |
Short-Term Investments | | | | 3.9 | |
| | |
Other Assets, Less Liabilities | | | | (2.4 | ) |
TOP TEN HOLDINGS
| | | | | |
| Security Name | | % of
Net Assets |
| | |
Xylem, Inc. (United States) | | | | 2.9 | |
| | |
PayPal Holdings, Inc. (United States) | | | | 2.8 | |
| | |
Bank Rakyat Indonesia Persero Tbk PT, ADR (Indonesia) | | | | 2.8 | |
| | |
Enphase Energy, Inc. (United States) | | | | 2.5 | |
| | |
Sprouts Farmers Market, Inc. (United States) | | | | 2.5 | |
| | |
TopBuild Corp. (United States) | | | | 2.5 | |
| | |
Carrier Global Corp. (United States) | | | | 2.5 | |
| | |
Intuit, Inc. (United States) | | | | 2.4 | |
| | |
ORIX Corp. (Japan) | | | | 2.4 | |
| | |
Shimano, Inc. (Japan) | | | | 2.4 | |
| | | | | | |
| | |
Top Ten as a Group | | | | 25.7 | |
| | | | | |
Because a fund’s strategy may result in multiple investments in particular sectors of the economy, its performance may depend on the performance of those sectors and may fluctuate more widely than investments diversified across more sectors. For additional information on these and other risk considerations, please see the Fund’s prospectus.
Any sectors, industries, or securities discussed should not be perceived as investment recommendations. Mention of a specific security should not be considered a recommendation to buy or solicitation to sell that security. Specific securities mentioned in this report may have been sold from the Fund’s portfolio of investments by the time you receive this report.
8
| | |
| | | AMG Boston Common Global Impact Fund Schedule of Portfolio Investments September 30, 2022 |
| | | |
| | | |
| | | | | | | | |
| | |
| | | Shares | | | Value | |
| | |
Common Stocks - 98.5% | | | | | | | | |
| |
Consumer Discretionary - 13.3% | | | | | |
| | |
Barratt Developments PLC (United Kingdom) | | | 1,957,955 | | | | $7,399,935 | |
| | |
BYD Co., Ltd., Class H (China) | | | 430,500 | | | | 10,605,610 | |
| | |
KB Home (United States) | | | 487,206 | | | | 12,628,379 | |
| | |
LKQ Corp. (United States) | | | 195,560 | | | | 9,220,654 | |
| | |
Shimano, Inc. (Japan) | | | 82,100 | | | | 12,845,784 | |
| | |
TopBuild Corp. (United States)* | | | 83,825 | | | | 13,812,683 | |
| | |
Yamaha Corp. (Japan) | | | 155,400 | | | | 5,522,043 | |
| | |
Total Consumer Discretionary | | | | | | | 72,035,088 | |
| | |
Consumer Staples - 6.1% | | | | | | | | |
| | |
Kerry Group PLC, Class A (Ireland) | | | 109,783 | | | | 9,785,215 | |
| | |
McCormick & Co., Inc., Non-Voting Shares (United States) | | | 135,280 | | | | 9,641,405 | |
| | |
Sprouts Farmers Market, Inc. (United States)*,1 | | | 497,825 | | | | 13,814,644 | |
| | |
Total Consumer Staples | | | | | | | 33,241,264 | |
| | |
Financials - 10.2% | | | | | | | | |
| | |
Bank Rakyat Indonesia Persero Tbk PT, ADR (Indonesia)1 | | | 1,077,959 | | | | 15,123,765 | |
| | |
Hannon Armstrong Sustainable Infrastructure Capital, Inc., REIT (United States)1 | | | 325,320 | | | | 9,736,827 | |
| | |
HDFC Bank, Ltd., ADR (India) | | | 160,149 | | | | 9,355,904 | |
| | |
ORIX Corp. (Japan) | | | 938,900 | | | | 13,153,101 | |
| | |
Ping An Insurance Group Co. of China, Ltd., Class H (China) | | | 1,581,000 | | | | 7,887,285 | |
| | |
Total Financials | | | | | | | 55,256,882 | |
| | |
Health Care - 14.5% | | | | | | | | |
| | |
Biogen, Inc. (United States)* | | | 29,649 | | | | 7,916,283 | |
| | |
BioNTech SE, ADR (Germany)1 | | | 59,780 | | | | 8,063,126 | |
| | |
China Traditional Chinese Medicine Holdings Co., Ltd. (Hong Kong) | | | 28,004,000 | | | | 9,742,437 | |
| | |
CSL, Ltd. (Australia) | | | 52,382 | | | | 9,526,565 | |
| | |
Gilead Sciences, Inc. (United States) | | | 201,610 | | | | 12,437,321 | |
| | |
Hoya Corp. (Japan) | | | 82,200 | | | | 7,920,678 | |
| | |
Illumina, Inc. (United States)* | | | 26,543 | | | | 5,064,139 | |
| | |
Regeneron Pharmaceuticals, Inc. (United States)* | | | 14,985 | | | | 10,322,717 | |
| | |
Sonova Holding AG (Switzerland) | | | 34,645 | | | | 7,624,013 | |
| | |
Total Health Care | | | | | | | 78,617,279 | |
| | |
Industrials - 17.8% | | | | | | | | |
| | |
The AZEK Co., Inc. (United States)* | | | 407,700 | | | | 6,775,974 | |
| | |
Carrier Global Corp. (United States) | | | 383,347 | | | | 13,631,819 | |
| | |
Daikin Industries, Ltd. (Japan) | | | 59,400 | | | | 9,139,823 | |
| | |
Kurita Water Industries, Ltd. (Japan) | | | 324,400 | | | | 11,517,239 | |
| | |
Schneider Electric SE (France) | | | 107,624 | | | | 12,156,215 | |
| | | | | | | | |
| | |
| | | Shares | | | Value | |
| | |
Spirax-Sarco Engineering PLC (United Kingdom) | | | 68,025 | | | | $7,819,689 | |
| | |
TOMRA Systems A.S.A. (Norway) | | | 409,410 | | | | 7,223,407 | |
| | |
Vestas Wind Systems A/S (Denmark) | | | 305,659 | | | | 5,628,057 | |
| | |
Westinghouse Air Brake Technologies Corp. (United States) | | | 84,754 | | | | 6,894,738 | |
| | |
Xylem, Inc. (United States) | | | 180,325 | | | | 15,753,192 | |
| | |
Total Industrials | | | | | | | 96,540,153 | |
| | |
Information Technology - 20.7% | | | | | | | | |
| | |
Adobe, Inc. (United States)* | | | 34,476 | | | | 9,487,795 | |
| | |
Applied Materials, Inc. (United States) | | | 107,156 | | | | 8,779,291 | |
| | |
Ciena Corp. (United States)* | | | 147,480 | | | | 5,962,616 | |
| | |
Enphase Energy, Inc. (United States)* | | | 49,820 | | | | 13,823,555 | |
| | |
First Solar, Inc. (United States)* | | | 73,278 | | | | 9,692,481 | |
| | |
Infineon Technologies AG (Germany) | | | 350,770 | | | | 7,676,263 | |
| | |
Intuit, Inc. (United States) | | | 34,209 | | | | 13,249,830 | |
| | |
Pagseguro Digital, Ltd., Class A (Brazil)* | | | 603,915 | | | | 7,989,796 | |
| | |
PayPal Holdings, Inc. (United States)* | | | 177,175 | | | | 15,249,452 | |
| | |
salesforce.com, Inc. (United States)* | | | 86,270 | | | | 12,409,077 | |
| | |
Xinyi Solar Holdings, Ltd. (China) | | | 7,800,000 | | | | 8,191,064 | |
| | |
Total Information Technology | | | | | | | 112,511,220 | |
| | |
Materials - 10.1% | | | | | | | | |
| | |
Borregaard A.S.A. (Norway) | | | 729,166 | | | | 8,611,907 | |
| | |
Croda International PLC (United Kingdom) | | | 84,089 | | | | 6,005,975 | |
| | |
Ecolab, Inc. (United States) | | | 67,265 | | | | 9,714,412 | |
| | |
Koninklijke DSM NV (Netherlands)1 | | | 76,812 | | | | 8,740,480 | |
| | |
Novozymes A/S, Class B (Denmark) | | | 156,888 | | | | 7,883,955 | |
| | |
Sociedad Quimica y Minera de Chile, S.A., ADR (Chile) | | | 94,035 | | | | 8,533,676 | |
| | |
Umicore, S.A. (Belgium) | | | 172,383 | | | | 5,060,697 | |
| | |
Total Materials | | | | | | | 54,551,102 | |
| | |
Real Estate - 2.4% | | | | | | | | |
| | |
Vonovia SE (Germany) | | | 249,428 | | | | 5,383,101 | |
| | |
Weyerhaeuser Co., REIT (United States) | | | 267,365 | | | | 7,635,944 | |
| | |
Total Real Estate | | | | | | | 13,019,045 | |
| | |
Utilities - 3.4% | | | | | | | | |
| | |
American Water Works Co., Inc. (United States) | | | 76,293 | | | | 9,930,297 | |
| | |
Orsted A.S. (Denmark)2 | | | 109,013 | | | | 8,688,420 | |
| | |
Total Utilities | | | | | | | 18,618,717 | |
| | |
Total Common Stocks | | | | | | | | |
(Cost $726,381,192) | | | | | | | 534,390,750 | |
The accompanying notes are an integral part of these financial statements.
9
| | |
| | | AMG Boston Common Global Impact Fund Schedule of Portfolio Investments (continued) |
| | | |
| | | |
| | | | | | | | |
| | |
| | | Principal
Amount | | | Value | |
| |
Short-Term Investments - 3.9% | | | | | |
| | |
Joint Repurchase
Agreements - 2.6%3 | | | | | | | | |
| | |
Amherst Pierpont Securities LLC, dated 09/30/22, due 10/03/22, 3.140% total to be received $3,291,524 (collateralized by various U.S. Government Agency Obligations, 0.000% - 5.000%, 03/31/23 - 11/20/69, totaling $3,356,476) | | | $3,290,663 | | | | $3,290,663 | |
| | |
Cantor Fitzgerald Securities, Inc., dated 09/30/22, due 10/03/22, 3.050% total to be received $3,072,320 (collateralized by various U.S. Government Agency Obligations and U.S. Treasuries, 0.000% - 9.000%, 11/01/22 - 08/20/72, totaling $3,132,970) | | | 3,071,539 | | | | 3,071,539 | |
| | |
Mirae Asset Securities USA, Inc., dated 09/30/22, due 10/03/22, 3.180% total to be received $3,291,535 (collateralized by various U.S. Government Agency Obligations, 0.400% - 7.500%, 10/15/23 - 05/15/61, totaling $3,357,366) | | | 3,290,663 | | | | 3,290,663 | |
| | |
MUFG Securities America, Inc., dated 09/30/22, due 10/03/22, 3.050% total to be received $1,949,088 (collateralized by various U.S. Government Agency Obligations, 2.000% - 5.000%, 09/01/28 - 09/01/52, totaling $1,987,565) | | | 1,948,593 | | | | 1,948,593 | |
| * | Non-income producing security. |
| 1 | Some of these securities, amounting to $18,411,134 or 3.4% of net assets, were out on loan to various borrowers and are collateralized by cash and various U.S. Treasury Obligations. See Note 4 of Notes to Financial Statements. |
| 2 | Security exempt from registration under Rule 144A of the Securities Act of 1933. This security may be resold in transactions exempt from registration, normally to qualified institutional buyers. At September 30, 2022, the value of this security amounted to $8,688,420 or 1.6% of net assets. |
| | | | | | | | |
| | |
| | | Principal
Amount | | | Value | |
| | |
State of Wisconsin Investment Board, dated 09/30/22, due 10/03/22, 3.040% total to be received $2,253,232 (collateralized by various U.S. Treasuries, 0.125% - 3.875%, 10/15/24 - 02/15/51, totaling $2,297,770) | | | $2,252,661 | | | | $2,252,661 | |
| | |
Total Joint Repurchase Agreements | | | | | | | 13,854,119 | |
| | |
| | | Shares | | | | |
| |
Other Investment Companies - 1.3% | | | | | |
| | |
Dreyfus Government Cash Management Fund, Institutional Shares, 2.75%4 | | | 4,552,992 | | | | 4,552,992 | |
| | |
JPMorgan U.S. Government Money Market Fund, IM Shares, 2.75%4 | | | 2,732,701 | | | | 2,732,701 | |
| | |
Total Other Investment Companies | | | | | | | 7,285,693 | |
| | |
Total Short-Term Investments
(Cost $21,139,812) | | | | | | | 21,139,812 | |
| | |
Total Investments - 102.4%
(Cost $747,521,004) | | | | | | | 555,530,562 | |
| |
Other Assets, less Liabilities - (2.4)% | | | | (13,207,237 | ) |
| | |
Net Assets - 100.0% | | | | | | $ | 542,323,325 | |
| 3 | Cash collateral received for securities lending activity was invested in these joint repurchase agreements. |
| 4 | Yield shown represents the September 30, 2022, seven day average yield, which refers to the sum of the previous seven days’ dividends paid, expressed as an annual percentage. |
ADR American Depositary Receipt
REIT Real Estate Investment Trust
The accompanying notes are an integral part of these financial statements.
10
| | |
| | | AMG Boston Common Global Impact Fund Schedule of Portfolio Investments (continued) |
| | | |
| | | |
The following table summarizes the inputs used to value the Fund’s investments by the fair value hierarchy levels as of September 30, 2022:
| | | | | | | | | | | | | | | | |
| | | Level 1 | | | Level 21 | | | Level 3 | | | Total | |
Investments in Securities | | | | | | | | | | | | | | | | |
| | | | |
Common Stocks | | | | | | | | | | | | | | | | |
| | | | |
Information Technology | | | $96,643,893 | | | | $15,867,327 | | | | — | | | | $112,511,220 | |
| | | | |
Industrials | | | 43,055,723 | | | | 53,484,430 | | | | — | | | | 96,540,153 | |
| | | | |
Health Care | | | 43,803,586 | | | | 34,813,693 | | | | — | | | | 78,617,279 | |
| | | | |
Consumer Discretionary | | | 35,661,716 | | | | 36,373,372 | | | | — | | | | 72,035,088 | |
| | | | |
Financials | | | 34,216,496 | | | | 21,040,386 | | | | — | | | | 55,256,882 | |
| | | | |
Materials | | | 26,859,995 | | | | 27,691,107 | | | | — | | | | 54,551,102 | |
| | | | |
Consumer Staples | | | 23,456,049 | | | | 9,785,215 | | | | — | | | | 33,241,264 | |
| | | | |
Utilities | | | 9,930,297 | | | | 8,688,420 | | | | — | | | | 18,618,717 | |
| | | | |
Real Estate | | | 7,635,944 | | | | 5,383,101 | | | | — | | | | 13,019,045 | |
| | | | |
Short-Term Investments | | | | | | | | | | | | | | | | |
| | | | |
Joint Repurchase Agreements | | | — | | | | 13,854,119 | | | | — | | | | 13,854,119 | |
| | | | |
Other Investment Companies | | | 7,285,693 | | | | — | | | | — | | | | 7,285,693 | |
| | | | | | | | | | | | | | | | |
Total Investments in Securities | | $ | 328,549,392 | | | $ | 226,981,170 | | | | — | | | $ | 555,530,562 | |
| | | | | | | | | | | | | | | | |
| 1 | An external pricing service is used to reflect any impact on security value due to market movements between the time the Fund valued such foreign securities and the earlier closing of foreign markets. |
For the fiscal year ended September 30, 2022, there were no transfers in or out of Level 3.
The country allocation in the Schedule of Portfolio Investments at September 30, 2022, was as follows:
| | |
| Country | | % of Long-Term
Investments |
| |
Australia | | 1.8 |
| |
Belgium | | 0.9 |
| |
Brazil | | 1.5 |
| |
Chile | | 1.6 |
| |
China | | 5.0 |
| |
Denmark | | 4.2 |
| |
France | | 2.3 |
| |
Germany | | 4.0 |
| |
Hong Kong | | 1.8 |
| |
India | | 1.8 |
| | |
| Country | | % of Long-Term
Investments |
| |
Indonesia | | 2.8 |
| |
Ireland | | 1.8 |
| |
Japan | | 11.2 |
| |
Netherlands | | 1.6 |
| |
Norway | | 3.0 |
| |
Switzerland | | 1.4 |
| |
United Kingdom | | 4.0 |
| |
United States | | 49.3 |
| | |
| |
| | | 100.0 |
| | |
The accompanying notes are an integral part of these financial statements.
11
| | |
| | | Statement of Assets and Liabilities September 30, 2022 |
| | | |
| | | |
| | | | |
| | | AMG
Boston Common
Global Impact
Fund | |
| |
Assets: | | | | |
| |
Investments at value1 (including securities on loan valued at $18,411,134) | | | $555,530,562 | |
| |
Dividend and interest receivables | | | 1,895,980 | |
| |
Securities lending income receivable | | | 3,406 | |
| |
Receivable for Fund shares sold | | | 357 | |
| |
Prepaid expenses and other assets | | | 16,541 | |
| |
Total assets | | | 557,446,846 | |
| |
Liabilities: | | | | |
| |
Payable upon return of securities loaned | | | 13,854,119 | |
| |
Payable for Fund shares repurchased | | | 653,913 | |
| |
Payable to Affiliate | | | 21,842 | |
| |
Accrued expenses: | | | | |
| |
Investment advisory and management fees | | | 353,756 | |
| |
Administrative fees | | | 72,690 | |
| |
Other | | | 167,201 | |
| |
Total liabilities | | | 15,123,521 | |
| | | | |
| |
Net Assets | | | $542,323,325 | |
| |
1 Investments at cost | | | $747,521,004 | |
| |
Net Assets Represent: | | | | |
| |
Paid-in capital | | | $740,488,552 | |
| |
Total distributable loss | | | (198,165,227 | ) |
| |
Net Assets | | | $542,323,325 | |
| |
Class I: | | | | |
| |
Net Assets | | | $542,323,325 | |
| |
Shares outstanding | | | 17,893,665 | |
| |
Net asset value, offering and redemption price per share | | | $30.31 | |
The accompanying notes are an integral part of these financial statements.
12
| | |
| | | Statement of Operations For the fiscal year ended September 30, 2022 |
| | | |
| | | |
| | | | |
| | | AMG
Boston Common
Global Impact
Fund | |
| |
Investment Income: | | | | |
| |
Dividend income | | | $13,018,154 | 1 |
| |
Securities lending income | | | 190,574 | |
| |
Foreign withholding tax | | | (864,080 | ) |
| |
Total investment income | | | 12,344,648 | |
| |
Expenses: | | | | |
| |
Investment advisory and management fees | | | 5,448,783 | |
| |
Administrative fees | | | 1,119,613 | |
| |
Custodian fees | | | 181,165 | |
| |
Professional fees | | | 93,735 | |
| |
Transfer agent fees | | | 82,186 | |
| |
Trustee fees and expenses | | | 49,731 | |
| |
Registration fees | | | 36,641 | |
| |
Reports to shareholders | | | 9,346 | |
| |
Interest expense | | | 773 | |
| |
Miscellaneous | | | 29,265 | |
| |
Repayment of prior reimbursements | | | 24,851 | |
| |
Total expenses before offsets | | | 7,076,089 | |
| |
Expense reimbursements | | | (133,716 | ) |
| |
Total expenses | | | 6,942,373 | |
| | | | |
| |
Net investment income | | | 5,402,275 | |
| |
Net Realized and Unrealized Loss: | | | | |
| |
Net realized loss on investments | | | (7,766,350 | ) |
| |
Net realized loss on foreign currency transactions | | | (237,672 | ) |
| |
Net change in unrealized appreciation/depreciation on investments | | | (242,107,534 | ) |
| |
Net change in unrealized appreciation/depreciation on foreign currency translations | | | (33,692 | ) |
| |
Net realized and unrealized loss | | | (250,145,248 | ) |
| | | | |
| |
Net decrease in net assets resulting from operations | | | $(244,742,973 | ) |
1 Includes non-recurring dividends of $2,335,932.
The accompanying notes are an integral part of these financial statements.
13
| | |
| | | Statements of Changes in Net Assets For the fiscal years ended September 30, |
| | | |
| | | |
| | | | | | | | |
| | | AMG
Boston Common
Global Impact
Fund |
| | |
| | | 2022 | | 2021 |
| | |
Increase (Decrease) in Net Assets Resulting From Operations: | | | | | | | | |
| | |
Net investment income | | | $5,402,275 | | | | $356,733 | |
| | |
Net realized gain (loss) on investments | | | (8,004,022 | ) | | | 341,638,350 | |
| | |
Net change in unrealized appreciation/depreciation on investments | | | (242,141,226 | ) | | | (86,333,640 | ) |
| | | | | | | | |
| | |
Net increase (decrease) in net assets resulting from operations | | | (244,742,973 | ) | | | 255,661,443 | |
| | |
Distributions to Shareholders: | | | | | | | | |
| | |
Class I | | | (5,876,761 | ) | | | (451,891,718 | ) |
| | |
Capital Share Transactions:1 | | | | | | | | |
| | |
Net increase (decrease) from capital share transactions | | | (111,352,185 | ) | | | 265,468,347 | |
| | | | | | | | |
| | |
Total increase (decrease) in net assets | | | (361,971,919 | ) | | | 69,238,072 | |
| | |
Net Assets: | | | | | | | | |
| | |
Beginning of year | | | 904,295,244 | | | | 835,057,172 | |
| | | | | | | | |
| | |
End of year | | | $542,323,325 | | | | $904,295,244 | |
1 See Note 1(g) of the Notes to Financial Statements.
The accompanying notes are an integral part of these financial statements.
14
| | |
| | | AMG Boston Common Global Impact Fund Financial Highlights For a share outstanding throughout each fiscal year |
| | | |
| | | |
| | | | | | | | | | | | | | | | | | | | |
| | | For the fiscal years ended September 30, |
| | | | | |
Class I | | 2022 | | 2021 | | 2020 | | 2019 | | 2018 |
| | | | | |
Net Asset Value, Beginning of Year | | | $43.52 | | | | $56.96 | | | | $52.89 | | | | $56.01 | | | | $44.48 | |
| | | | | |
Income (loss) from Investment Operations: | | | | | | | | | | | | | | | | | | | | |
| | | | | |
Net investment income (loss)1 | | | 0.28 | 2,3 | | | 0.02 | 3 | | | (0.27 | ) | | | (0.13 | ) | | | (0.21 | )3 |
| | | | | |
Net realized and unrealized gain (loss) on investments | | | (13.19 | ) | | | 15.47 | | | | 9.70 | | | | (2.99 | ) | | | 11.74 | |
| | | | | | | | | | | | | | | | | | | | |
| | | | | |
Total income (loss) from investment operations | | | (12.91 | ) | | | 15.49 | | | | 9.43 | | | | (3.12 | ) | | | 11.53 | |
| | | | | |
Less Distributions to Shareholders from: | | | | | | | | | | | | | | | | | | | | |
| | | | | |
Net investment income | | | (0.10 | ) | | | — | | | | — | | | | — | | | | — | |
| | | | | |
Net realized gain on investments | | | (0.20 | ) | | | (28.93 | ) | | | (5.36 | ) | | | — | | | | — | |
| | | | | | | | | | | | | | | | | | | | |
| | | | | |
Total distributions to shareholders | | | (0.30 | ) | | | (28.93 | ) | | | (5.36 | ) | | | — | | | | — | |
| | | | | |
Net Asset Value, End of Year | | | $30.31 | | | | $43.52 | | | | $56.96 | | | | $52.89 | | | | $56.01 | |
| | | | | | | | | | | | | | | | | | | | |
| | | | | |
Total Return4 | | | (29.90 | )%3 | | | 31.75 | %3 | | | 18.95 | % | | | (5.57 | )% | | | 25.92 | %3 |
| | | | | |
Ratio of net expenses to average net assets | | | 0.93 | % | | | 1.03 | % | | | 1.11 | % | | | 1.10 | % | | | 1.10 | % |
| | | | | |
Ratio of gross expenses to average net assets | | | 0.95 | %5 | | | 1.03 | %5 | | | 1.11 | % | | | 1.10 | % | | | 1.10 | %5 |
| | | | | |
Ratio of net investment income (loss) to average net assets | | | 0.72 | %3 | | | 0.04 | %3 | | | (0.51 | )% | | | (0.26 | )% | | | (0.43 | )%3 |
| | | | | |
Portfolio turnover | | | 25 | % | | | 202 | % | | | 221 | % | | | 145 | % | | | 138 | % |
| | | | | |
Net assets end of year (000’s) omitted | | | $542,323 | | | | $904,295 | | | | $835,057 | | | | $786,149 | | | | $893,301 | |
| 1 | Per share numbers have been calculated using average shares. |
| 2 | Includes non-recurring dividends. Without these dividends, net investment income per share would have been $0.16. |
| 3 | Total returns and net investment income (loss) would have been lower had certain expenses not been offset. |
| 4 | The total return is calculated using the published Net Asset Value as of fiscal year end. |
| 5 | Excludes the impact of expense reimbursement or fee waivers and expense reductions such as brokerage credits, but includes expense repayments and non-reimbursable expenses, if any, such as interest, taxes, and extraordinary expenses. (See Note 1(c) and 2 in the Notes to Financial Statements.) |
15
| | |
| | | Notes to Financial Statements September 30, 2022 |
| | | |
| | | |
1. ORGANIZATION AND SUMMARY OF SIGNIFICANT ACCOUNTING POLICIES
AMG Funds I (the “Trust”) is an open-end management investment company, organized as a Massachusetts business trust, and registered under the Investment Company Act of 1940, as amended (the “1940 Act”). Currently, the Trust consists of a number of different funds, each having distinct investment management objectives, strategies, risks, and policies. Included in this report is AMG Boston Common Global Impact Fund (the “Fund”).
Market disruptions associated with the COVID-19 pandemic have had a global impact, and uncertainty exists as to the long-term implications. Such disruptions can adversely affect assets of the Fund and thus Fund performance.
The Fund’s financial statements are prepared in accordance with accounting principles generally accepted in the United States of America (“U.S. GAAP”), including accounting and reporting guidance pursuant to Accounting Standards Codification Topic 946 applicable to investment companies. U.S. GAAP requires management to make estimates and assumptions that affect the reported amounts of assets and liabilities and disclosure of contingent assets and liabilities at the date of the financial statements and the reported amounts of income and expenses during the reporting period. Actual results could differ from those estimates and such differences could be material. The following is a summary of significant accounting policies followed by the Fund in the preparation of its financial statements:
a. VALUATION OF INVESTMENTS
Equity securities traded on a national securities exchange or reported on the NASDAQ national market system (“NMS”) are valued at the last quoted sales price on the primary exchange or, if applicable, the NASDAQ official closing price or the official closing price of the relevant exchange or, lacking any sales, at the last quoted bid price. Equity securities held by the Fund that are traded in the over-the-counter market (other than NMS securities) are valued at the bid price. Foreign equity securities (securities principally traded in markets other than U.S. markets) held by the Fund are valued at the official closing price on the primary exchange or, for markets that either do not offer an official closing price or where the official closing price may not be representative of the overall market, the last quoted sale price.
Fixed income securities purchased with a remaining maturity of 60 days or less are valued at amortized cost, provided that the amortized cost value is approximately the same as the fair value of the security valued without the use of amortized cost. Investments in other open-end registered investment companies are valued at their end of day net asset value per share.
The Fund’s portfolio investments are generally valued based on independent market quotations or prices or, if none, “evaluative” or other market based valuations provided by third party pricing services approved by the Board of Trustees of the Trust (the “Board”). Under certain circumstances, the value of certain Fund portfolio investments may be based on an evaluation of fair value, pursuant to procedures established by and under the general supervision of the Board. The Valuation Committee, which is comprised of the Independent Trustees of the Board, and the Pricing Committee, which is comprised of representatives from AMG Funds LLC (the “Investment Manager”) are the committees appointed by the Board to make fair value determinations. The Fund may use the fair value of a portfolio investment to calculate its net asset value (“NAV”) in the event that the market quotation, price or market based valuation for the portfolio investment is
not readily available or otherwise not determinable pursuant to the Board’s valuation procedures, if the Investment Manager or the Pricing Committee believes the quotation, price or market based valuation to be unreliable, or in certain other circumstances. When determining the fair value of an investment, the Pricing Committee and, if required under the Trust’s securities valuation procedures, the Valuation Committee, seeks to determine the price that the Fund might reasonably expect to receive from current sale of that portfolio investment in an arms-length transaction. Fair value determinations shall be based upon consideration of all available facts and information, including, but not limited to (i) attributes specific to the investment; (ii) fundamental and analytical data relating to the investment; and (iii) the value of other comparable securities or relevant financial instruments, including derivative securities, traded on other markets or among dealers.
The values assigned to fair value portfolio investments are based on available information and do not necessarily represent amounts that might ultimately be realized in the future, since such amounts depend on future developments inherent in long-term investments. Because of the inherent uncertainty of valuation, those estimated values may differ significantly from the values that would have been used had a ready market for the investments existed, and the differences could be material. The Board will be presented with a quarterly report showing as of the most recent quarter end, all outstanding securities fair valued by the Fund, including a comparison with the prior quarter end and the percentage of the Fund that the security represents at each quarter end.
With respect to foreign equity securities and certain foreign fixed income securities, the Board has adopted a policy that securities held in the Fund that can be fair valued by the applicable fair value pricing service are fair valued on each business day provided that each individual price exceeds a pre-established confidence level.
Effective September 8, 2022, the Fund adopted the requirements of Rule 2a-5 under the 1940 Act (“Rule 2a-5”), which the Fund’s Board designated the Fund’s Investment Manager as the Fund’s Valuation Designee to perform the Fund’s fair value determinations. Such determinations are subject to Board oversight and certain reporting and other requirements intended to ensure that the Board receives the information it needs to oversee the Investment Manager’s fair value determinations. The Fund’s adoption of Rule 2-a5 did not impact how the Fund determines fair value or the carrying amount of investments held in the Fund.
U.S. GAAP defines fair value as the price that a fund would receive to sell an asset or pay to transfer a liability in an orderly transaction between market participants at the measurement date. U.S. GAAP also establishes a framework for measuring fair value, and a three level hierarchy for fair value measurements based upon the transparency of inputs to the valuation of an asset or liability. Inputs may be observable or unobservable and refer broadly to the assumptions that market participants would use in pricing the asset or liability. Observable inputs reflect the assumptions market participants would use in pricing the asset or liability based on market data obtained from sources independent of the Fund. Unobservable inputs reflect the Fund’s own assumptions about the assumptions that market participants would use in pricing the asset or liability developed based on the best information available in the circumstances. Each investment is assigned a level based upon the observability of the inputs which are significant to the overall valuation.
The three-tier hierarchy of inputs is summarized below:
Level 1 – inputs are quoted prices in active markets for identical investments (e.g., equity securities, open-end investment companies)
16
| | |
| | | Notes to Financial Statements (continued) |
| | | |
| | | |
Level 2 – other observable inputs (including, but not limited to: quoted prices for similar assets or liabilities in markets that are active, quoted prices for identical or similar assets or liabilities in markets that are not active, inputs other than quoted prices that are observable for the assets or liabilities (such as interest rates, yield curves, volatilities, prepayment speeds, loss severities, credit risks and default rates) or other market corroborated inputs) (e.g., debt securities, government securities, foreign currency exchange contracts, foreign securities utilizing international fair value pricing, fair valued securities with observable inputs)
Level 3 – inputs are significant unobservable inputs (including the Fund’s own assumptions used to determine the fair value of investments) (e.g., fair valued securities with unobservable inputs)
Changes in inputs or methodologies used for valuing investments may result in a transfer in or out of levels within the fair value hierarchy. The inputs or methodologies used for valuing investments may not necessarily be an indication of the risk associated with investing in those investments.
b. SECURITY TRANSACTIONS
Security transactions are accounted for as of trade date. Realized gains and losses on securities sold are determined on the basis of identified cost.
c. INVESTMENT INCOME AND EXPENSES
Dividend income is recorded on the ex-dividend date. Dividends from foreign securities are recorded on the ex-dividend date, and if after the fact, as soon as the Fund becomes aware of the ex-dividend date. Interest income, which includes amortization of premium and accretion of discount on debt securities, is accrued as earned. Dividend and interest income on foreign securities is recorded gross of any withholding tax. Non-cash dividends included in dividend income, if any, are reported at the fair market value of the securities received. Other income and expenses are recorded on an accrual basis. Expenses that cannot be directly attributed to the Fund are apportioned among the funds in the Trust and other trusts or funds within the AMG Funds Family of Funds (collectively the “AMG Funds Family”) based upon their relative average net assets or number of shareholders.
d. DIVIDENDS AND DISTRIBUTIONS
Fund distributions resulting from either net investment income or realized net capital gains, if any, will normally be declared and paid at least annually in December. Distributions to shareholders are recorded on the ex-dividend date. Distributions are determined in accordance with federal income tax regulations, which may differ from net investment income and net realized capital gains for financial statement purposes (U.S. GAAP). Differences may be permanent or temporary. Permanent differences are reclassified among capital accounts in the financial statements to reflect their tax character. Permanent book and tax basis differences, if any, relating to shareholder distributions will result in reclassifications to paid-in capital. Temporary differences arise when certain items of income, expense and gain or loss are recognized in different periods for financial statement and tax purposes; these differences will reverse at some time in the future. There were no permanent differences. Temporary differences are primarily due to wash sale loss deferrals.
The tax character of distributions paid during the fiscal years ended September 30, 2022 and September 30, 2021 were as follows:
| | | | | | | | |
| | |
Distributions paid from: | | | 2022 | | | | 2021 | |
| | |
Ordinary income * | | | $1,897,407 | | | | $266,048,264 | |
| | |
Long-term capital gains | | | 3,979,354 | | | | 185,843,454 | |
| | | | | | | | |
| | |
| | | $5,876,761 | | | | $451,891,718 | |
| | | | | | | | |
| * | For tax purposes, short-term capital gain distributions, if any, are considered ordinary income distributions. |
As of September 30, 2022, the components of distributable earnings (excluding unrealized appreciation/depreciation) on a tax basis consisted of:
| | | | |
| |
Capital loss carryforward | | $ | 8,223,386 | |
| |
Undistributed ordinary income | | | 2,787,995 | |
At September 30, 2022, the cost of investments and the aggregate gross unrealized appreciation and depreciation for federal income tax purposes were as follows:
| | | | | | | | | | | | |
| Cost | | Appreciation | | | Depreciation | | | Net Depreciation | |
| | | |
| $748,218,257 | | | $15,342,156 | | | | $(208,071,992 | ) | | | $(192,729,836 | ) |
e. FEDERAL TAXES
The Fund currently qualifies as an investment company and intends to comply with the requirements under Subchapter M of the Internal Revenue Code of 1986, as amended, and to distribute substantially all of its taxable income and gains to its shareholders and to meet certain diversification and income requirements with respect to investment companies. Therefore, no provision for federal income or excise tax is included in the accompanying financial statements.
Additionally, based on the Fund’s understanding of the tax rules and rates related to income, gains and transactions for the foreign jurisdictions in which it invests, the Fund will provide for foreign taxes, and where appropriate, deferred foreign taxes.
Management has analyzed the Fund’s tax positions taken on federal income tax returns as of September 30, 2022, and for all open tax years (generally, the three prior taxable years), and has concluded that no provision for federal income tax is required in the Fund’s financial statements. Additionally, Management is not aware of any tax position for which it is reasonably possible that the total amounts of unrecognized tax benefits will change materially in the next twelve months.
f. CAPITAL LOSS CARRYOVERS AND DEFERRALS
As of September 30, 2022, the Fund had capital loss carryovers for federal income tax purposes as shown in the following chart. These amounts may be used to offset future realized capital gains indefinitely, and retain their character as short-term and/or long-term.
| | | | | | | | | | |
| Short-Term | | | Long-Term | | | Total | |
| | |
| | — | | | | $8,223,386 | | | | $8,223,386 | |
17
| | |
| | | Notes to Financial Statements (continued) |
| | | |
| | | |
g. CAPITAL STOCK
The Trust’s Declaration of Trust authorizes for the Fund the issuance of an unlimited number of shares of beneficial interest, without par value. The Fund records sales and repurchases of its capital stock on the trade date.
For the fiscal years ended September 30, 2022 and September 30, 2021, the capital stock transactions by class for the Fund were as follows:
| | | | | | | | | | | | | | | | |
| | | September 30, 2022 | | | September 30, 2021 | |
| | | | |
| | | Shares | | | Amount | | | Shares | | | Amount | |
| | | | | | | | | | | | | | | | |
| | | | |
Class I: | | | | | | | | | | | | | | | | |
| | | | |
Shares sold | | | 80,180 | | | | $3,054,181 | | | | 176,870 | | | | $8,489,156 | |
| | | | |
Shares issued in reinvestment of distributions | | | 123,799 | | | | 5,507,819 | | | | 9,562,894 | | | | 422,177,212 | |
| | | | |
Shares redeemed | | | (3,088,646 | ) | | | (119,914,185 | ) | | | (3,622,135 | ) | | | (165,198,021 | ) |
| | | | | | | | | | | | | | | | |
| | | | |
Net increase (decrease) | | | (2,884,667 | ) | | | $(111,352,185 | ) | | | 6,117,629 | | | | $265,468,347 | |
| | | | | | | | | | | | | | | | |
h. REPURCHASE AGREEMENTS AND JOINT REPURCHASE AGREEMENTS
The Fund may enter into third-party and bilateral repurchase agreements for temporary cash management purposes and third-party or bilateral joint repurchase agreements for reinvestment of cash collateral on securities lending transactions under the securities lending program offered by The Bank of New York Mellon (“BNYM”) (the “Program”) (collectively, “Repurchase Agreements”). The value of the underlying collateral, including accrued interest, must equal or exceed the value of the Repurchase Agreements during the term of the agreement. For joint repurchase agreements, the Fund participates on a pro rata basis with other clients of BNYM in its share of the underlying collateral under such joint repurchase agreements and in its share of proceeds from any repurchase or other disposition of the underlying collateral. The underlying collateral for all Repurchase Agreements is held in safekeeping by the Fund’s custodian or at the Federal Reserve Bank. If the seller defaults and the value of the collateral declines, or if bankruptcy proceedings commence with respect to the seller of the security, realization of the collateral by the Fund may be delayed or limited. Pursuant to the Program, the Fund is indemnified for such losses by BNYM on joint repurchase agreements.
At September 30, 2022, the market value of Repurchase Agreements outstanding was $13,854,119.
i. FOREIGN CURRENCY TRANSLATION
The books and records of the Fund are maintained in U.S. Dollars. The value of investments, assets and liabilities denominated in currencies other than U.S. Dollars are translated into U.S. Dollars based upon current foreign exchange rates. Purchases and sales of foreign investments, income and expenses are converted into U.S. Dollars based on currency exchange rates prevailing on the respective dates of such transactions. Net realized and unrealized gain (loss) on foreign currency transactions represent: (1) foreign exchange gains and losses from the sale and holdings of foreign currencies; (2) gains and losses between trade date and settlement date on investment securities transactions and foreign currency exchange contracts; and (3) gains and losses from the difference between amounts of interest and dividends recorded and the amounts actually received.
The Fund does not isolate the net realized and unrealized gain or loss resulting from changes in exchange rates from the fluctuations in market prices of securities held. Such fluctuations are included with the net realized and unrealized gain or loss on investments.
2. AGREEMENTS AND TRANSACTIONS WITH AFFILIATES
The Trust has entered into an investment advisory agreement under which the Investment Manager, a subsidiary and the U.S. retail distribution arm of Affiliated Managers Group, Inc. (“AMG”), serves as investment manager to the Fund and is responsible for the Fund’s overall administration and operations. The Investment Manager selects one or more subadvisers for the Fund (subject to Board approval) and monitors each subadviser’s investment performance, security holdings and investment strategies. The Fund’s investment portfolio is managed by Boston Common Asset Management, LLC (“Boston Common”) who serves pursuant to a subadvisory agreement with the Investment Manager. AMG owns a minority equity interest in Boston Common.
Investment management fees are paid directly by the Fund to the Investment Manager based on average daily net assets. For the fiscal year ended September 30, 2022, the Fund paid an investment management fee at the annual rate of 0.73% of the average daily net assets of the Fund. The fee paid to Boston Common for its services as subadviser is paid out of the fee the Investment Manager receives from the Fund and does not increase the expenses of the Fund. Prior to May 19, 2021, the annual rate for the investment management fees was 0.88% of the Fund’s average daily net assets.
The Investment Manager has contractually agreed, through at least February 1, 2023, to waive management fees and/or pay or reimburse fund expenses in order to limit total annual Fund operating expenses after fee waiver and expense reimbursements (exclusive of taxes, interest (including interest incurred in connection with bank and custody overdrafts, and in connection with securities sold short), shareholder servicing fees, distribution and service (12b-1) fees, brokerage commissions and other transaction costs, dividends payable with respect to securities sold short, acquired fund fees and expenses and extraordinary expenses) of the Fund to the annual rate of 0.93% of the Fund’s average daily net assets (this annual rate or such other annual rate that may be in effect from time to time, the “Expense Cap”), subject to later reimbursement by the
18
| | |
| | | Notes to Financial Statements (continued) |
| | | |
| | | |
Fund in certain circumstances. Prior to May 19, 2021, the Fund did not have an expense limitation.
In general, for a period of up to 36 months after the date any amounts are paid, waived or reimbursed by the Investment Manager, the Investment Manager may recover such amounts from the Fund, provided that such repayment would not cause the Fund’s total annual operating expenses after fee waiver and expense reimbursements (exclusive of the items noted in the parenthetical above) to exceed either (i) the Expense Cap in effect at the time such amounts were paid, waived or reimbursed, or (ii) the Expense Cap in effect at the time of such repayment by the Fund.
The contractual expense limitation may only be terminated in the event the Investment Manager or a successor ceases to be the investment manager of the Fund or a successor fund, by mutual agreement between the Investment Manager and the Board, or in the event of the Fund’s liquidation unless the Fund is reorganized or is a party to a merger in which the surviving entity is successor to the accounting and performance information of the Fund.
At September 30, 2022, the Fund’s expiration of reimbursements subject to recoupment is as follows:
| | |
Expiration Period | | |
| |
2-3 years | | $130,405* |
* As of September 30, 2022, the Fund owed the Investment Advisor $21,842 for recoupment of previously reimbursed expenses, which is reflected in the Statement of Assets and Liabilities under Payable to affiliate.
The Trust, on behalf of the Fund, has entered into an amended and restated Administration Agreement under which the Investment Manager serves as the Fund’s administrator (the “Administrator”) and is responsible for all non-portfolio management aspects of managing the Fund’s operations, including administration and shareholder services to the Fund. The Fund pays a fee to the Administrator at the rate of 0.15% per annum of the Fund’s average daily net assets for this service.
The Fund is distributed by AMG Distributors, Inc. (the “Distributor”), a wholly-owned subsidiary of the Investment Manager. The Distributor serves as the distributor and underwriter for the Fund and is a registered broker-dealer and member of the Financial Industry Regulatory Authority, Inc. (“FINRA”). Shares of the Fund will be continuously offered and will be sold directly to prospective purchasers and through brokers, dealers or other financial intermediaries who have executed selling agreements with the Distributor. Generally the Distributor bears all or a portion of the expenses of providing services pursuant to the distribution agreement, including the payment of the expenses relating to the distribution of prospectuses for sales purposes and any advertising or sales literature.
The Board provides supervision of the affairs of the Trust and other trusts within the AMG Funds Family. The Trustees of the Trust who are not affiliated with the Investment Manager receive an annual retainer and per meeting fees for regular, special and telephonic meetings, and they are reimbursed for out-of-pocket expenses incurred while carrying out their duties as Board members. The Chairman of the Board and the Audit Committee Chair receive additional annual retainers. Certain Trustees and Officers of the Fund are Officers and/or Directors of the Investment Manager, AMG and/or the Distributor.
The Securities and Exchange Commission (the “SEC”) granted an exemptive order that permits certain eligible funds in the AMG Funds Family to lend and borrow money for certain temporary purposes directly to and from other eligible funds in
the AMG Funds Family. Participation in this interfund lending program is voluntary for both the borrowing and lending funds, and an interfund loan is only made if it benefits each participating fund. The Administrator manages the program according to procedures approved by the Board, and the Board monitors the operation of the program. An interfund loan must comply with certain conditions set out in the exemptive order, which are designed to assure fairness and protect all participating funds. The interest earned and interest paid on interfund loans are included on the Statement of Operations as interest income and interest expense, respectively. At September 30, 2022, the Fund had no interfund loans outstanding.
The Fund utilized the interfund loan program during the fiscal year ended September 30, 2022 as follows:
| | | | | | | | | | | | | | |
| | | Average Borrowed | | Number
of Days | | | Interest
Paid | | | Average
Interest Rate | |
| | | | |
| | $3,204,006 | | | 6 | | | | $773 | | | | 1.468% | |
3. PURCHASES AND SALES OF SECURITIES
Purchases and sales of securities (excluding short-term securities and U.S. Government Obligations) for the fiscal year ended September 30, 2022, were $182,398,920 and $297,105,843, respectively.
The Fund had no purchases or sales of U.S. Government Obligations during the fiscal year ended September 30, 2022.
4. PORTFOLIO SECURITIES LOANED
The Fund participates in the Program providing for the lending of securities to qualified borrowers. Securities lending income includes earnings of such temporary cash investments, plus or minus any rebate to a borrower. These earnings (after any rebate) are then divided between BNYM, as a fee for its services under the Program, and the Fund, according to agreed-upon rates. Collateral on all securities loaned is accepted in cash, U.S. Treasury Obligations or U.S. Government Agency Obligations. Collateral is maintained at a minimum level of 102% (105% in the case of certain foreign securities) of the market value, plus interest, if applicable, of investments on loan. It is the Fund’s policy to obtain additional collateral from or return excess collateral to the borrower by the end of the next business day, following the valuation date of the securities loaned. Therefore, the value of the collateral held may be temporarily less than the value of the securities on loan. Lending securities entails a risk of loss to the Fund if and to the extent that the market value of the securities loaned were to increase and the borrower did not increase the collateral accordingly, and the borrower fails to return the securities. Under the terms of the Program, the Fund is indemnified for such losses by BNYM. Cash collateral is held in separate omnibus accounts managed by BNYM, who is authorized to exclusively enter into joint repurchase agreements for that cash collateral. Securities collateral is held in separate omnibus accounts managed by BNYM and cannot be sold or pledged. BNYM bears the risk of any deficiency in the amount of the cash collateral available for return to the borrower due to any loss on the collateral invested. Loans of securities are terminable at any time and the borrower, after notice, is required to return borrowed securities as soon as practical, which is normally within three business days.
19
| | |
| | | Notes to Financial Statements (continued) |
| | | |
| | | |
The value of securities loaned on positions held, cash collateral and securities collateral received at September 30, 2022, were as follows:
| | | | | | |
Securities Loaned | | Cash Collateral Received | | Securities Collateral Received | | Total Collateral Received |
| | | |
| $18,411,134 | | $13,854,119 | | $4,733,344 | | $18,587,463 |
The following table summarizes the securities received as collateral for securities lending at September 30, 2022:
| | | | |
Collateral Type | | Coupon Range | | Maturity
Date Range |
| | |
U.S. Treasury Obligations | | 0.000%-5.250% | | 01/12/23-11/15/51 |
5. FOREIGN SECURITIES
The Fund invests in securities of foreign entities and in instruments denominated in foreign currencies which involve risks not typically associated with investments in domestic securities. Non-domestic securities carry special risks, such as exposure to currency fluctuations, less developed or less efficient trading markets, political instability, a lack of company information, differing auditing and legal
standards, and, potentially, less liquidity. The Fund’s investments in emerging market countries are exposed to additional risks. The Fund’s performance will be influenced by political, social and economic factors affecting companies in emerging market countries. Emerging market countries generally have economic structures that are less diverse and mature, and political systems that are less stable, than those of developed countries. Realized gains in certain countries may be subject to foreign taxes at the Fund level and the Fund would pay such foreign taxes at the appropriate rate for each jurisdiction.
6. COMMITMENTS AND CONTINGENCIES
Under the Trust’s organizational documents, its trustees and officers are indemnified against certain liabilities arising out of the performance of their duties to the Trust. In addition, in the normal course of business, the Fund may enter into contracts and agreements that contain a variety of representations and warranties, which provide general indemnifications. The maximum exposure to the Fund under these arrangements is unknown, as this would involve future claims that may be made against the Fund that have not yet occurred. However, based on experience, the Fund had no prior claims or losses and expects the risks of loss to be remote.
7. MASTER NETTING AGREEMENTS
The Fund may enter into master netting agreements with its counterparties for the Program and Repurchase Agreements, which provide the right, in the event of default (including bankruptcy or insolvency) for the non-defaulting party to liquidate the collateral and calculate net exposure to the defaulting party or request additional collateral. For financial reporting purposes, the Fund does not offset financial assets and financial liabilities that are subject to master netting agreements in the Statement of Assets and Liabilities. For securities lending transactions, see Note 4.
The following table is a summary of the Fund’s open Repurchase Agreements that are subject to a master netting agreement as of September 30, 2022:
| | | | | | | | | | | | | | | | | | | | |
| | | | | | Gross Amount Not Offset in the
Statement of Assets and Liabilities | | | | | | | |
| | | | | |
| | | Gross Amounts of
Assets Presented in
the Statement of
Assets and Liabilities | | | Offset Amount | | | Net Asset Balance | | | Collateral Received | | | Net
Amount | |
| | | | | |
| | | | | | | | | | | | | | | | | | | | |
| | | | | |
| | | | | | | | | | | | | | | | | | | | |
| | | | | |
Amherst Pierpont Securities LLC | | | $3,290,663 | | | | — | | | | $3,290,663 | | | | $3,290,663 | | | | — | |
| | | | | |
Cantor Fitzgerald Securities, Inc. | | | 3,071,539 | | | | — | | | | 3,071,539 | | | | 3,071,539 | | | | — | |
| | | | | |
Mirae Asset Securities USA, Inc. | | | 3,290,663 | | | | — | | | | 3,290,663 | | | | 3,290,663 | | | | — | |
| | | | | |
MUFG Securities America, Inc. | | | 1,948,593 | | | | — | | | | 1,948,593 | | | | 1,948,593 | | | | — | |
| | | | | |
State of Wisconsin Investment Board | | | 2,252,661 | | | | — | | | | 2,252,661 | | | | 2,252,661 | | | | — | |
| | | | | | | | | | | | | | | | | | | | |
| | | | | |
Total | | | $13,854,119 | | | | — | | | | $13,854,119 | | | | $13,854,119 | | | | — | |
| | | | | | | | | | | | | | | | | | | | |
8. SUBSEQUENT EVENTS
The Fund has determined that no material events or transactions occurred through the issuance date of the Fund’s financial statements which require an additional disclosure in or adjustment of the Fund’s financial statements.
20
| | |
| | | Report of Independent Registered Public Accounting Firm |
| | | |
| | | |
TO THE BOARD OF TRUSTEES OF AMG FUNDS I AND THE SHAREHOLDERS OF AMG BOSTON COMMON GLOBAL IMPACT FUND
Opinion on the Financial Statements
We have audited the accompanying statement of assets and liabilities, including the schedule of portfolio investments, of AMG Boston Common Global Impact Fund (one of the funds constituting AMG Funds I, referred to hereafter as the “Fund”) as of September, 30 2022, the related statement of operations for the year ended September 30, 2022, the statements of changes in net assets for each of the two years in the period ended September 30, 2022, including the related notes, and the financial highlights for each of the five years in the period ended September 30, 2022 (collectively referred to as the “financial statements”). In our opinion, the financial statements present fairly, in all material respects, the financial position of the Fund as of September 30, 2022, the results of its operations for the year then ended, the changes in its net assets for each of the two years in the period ended September 30, 2022 and the financial highlights for each of the five years in the period ended September 30, 2022 in conformity with accounting principles generally accepted in the United States of America.
Basis for Opinion
These financial statements are the responsibility of the Fund’s management. Our responsibility is to express an opinion on the Fund’s financial statements based on our audits. We are a public accounting firm registered with the Public Company Accounting Oversight Board (United States) (PCAOB) and are required to be independent with respect to the Fund in accordance with the U.S. federal securities laws and the applicable rules and regulations of the Securities and Exchange Commission and the PCAOB.
We conducted our audits of these financial statements in accordance with the standards of the PCAOB. Those standards require that we plan and perform the audits to obtain reasonable assurance about whether the financial statements are free of material misstatement, whether due to error or fraud.
Our audits included performing procedures to assess the risks of material misstatement of the financial statements, whether due to error or fraud, and performing procedures that respond to those risks. Such procedures included examining, on a test basis, evidence regarding the amounts and disclosures in the financial statements. Our audits also included evaluating the accounting principles used and significant estimates made by management, as well as evaluating the overall presentation of the financial statements. Our procedures included confirmation of securities owned as of September 30, 2022 by correspondence with the custodian. We believe that our audits provide a reasonable basis for our opinion.
PricewaterhouseCoopers LLP
Boston, Massachusetts
November 18, 2022
We have served as the auditor of one or more investment companies in the AMG Funds Family since 1993.
21
| | |
| | | Other Information (unaudited) |
| | | |
| | | |
TAX INFORMATION
AMG Boston Common Global Impact Fund hereby designates the maximum amount allowable of its net taxable income as qualified dividends as provided in the Jobs and Growth Tax Relief Reconciliation Act of 2003. The 2022 Form 1099-DIV you receive for the Fund will show the tax status of all distributions paid to you during the calendar year.
Pursuant to section 852 of the Internal Revenue Code, AMG Boston Common Global Impact Fund hereby designates $3,979,354 as a capital gain distribution with respect to the taxable year ended September 30, 2022, or if subsequently determined to be different, the net capital gains of such year.
22
| | |
| | | AMG Funds Trustees and Officers |
| | | |
| | | |
| | | | |
The Trustees and Officers of the Trust, their business addresses, principal occupations for the past five years and ages are listed below. The Trustees provide broad supervision over the affairs of the Trust and the Funds. The Trustees are experienced executives who meet periodically throughout the year to oversee the Funds’ activities, review contractual arrangements with companies that provide services to the Funds, and | | review the Funds’ performance. Unless otherwise noted, the address of each Trustee or Officer is the address of the Trust: 680 Washington Blvd., Suite 500, Stamford, CT. 06901. There is no stated term of office for Trustees. Trustees serve until their resignation, retirement or removal in | | accordance with the Trust’s organizational documents and policies adopted by the Board from time to time. The Chairman of the Trustees, President, Treasurer and Secretary of the Trust are elected by the Trustees annually. Other officers hold office at the pleasure of the Trustees. |
Independent Trustees
The following Trustees are not “interested persons” of the Trust within the meaning of the 1940 Act:
| | |
Number of Funds Overseen in Fund Complex | | Name, Age, Principal Occupation(s) During Past 5 Years and Other Directorships Held by Trustee |
• Trustee since 2012 • Oversees 40 Funds in Fund Complex | | Bruce B. Bingham, 73 Partner, Hamilton Partners (real estate development firm) (1987-Present); Director of The Yacktman Funds, Inc. (2 portfolios) (2000-2012). |
• Trustee since 2013 • Chairman of the Audit Committee since 2021 • Oversees 44 Funds in Fund Complex | | Kurt A. Keilhacker, 58 Managing Partner, TechFund Europe (2000-Present); Managing Partner, TechFund Capital (1997-Present); Managing Partner, Elementum Ventures (2013-Present); Director, MetricStory, Inc. (2017-Present); Trustee, Wheaton College (2018-Present); Trustee, Gordon College (2001-2016); Board Member, 6wind SA (2002-2019). |
• Trustee since 2000 • Oversees 40 Funds in Fund Complex | | Steven J. Paggioli, 72 Independent Consultant (2002-Present); Trustee, Professionally Managed Portfolios (28 portfolios); Advisory Board Member, Sustainable Growth Advisors, LP; Independent Director, Muzinich BDC, Inc. (business development company) (2019-Present); Director, The Wadsworth Group; Independent Director, Chase Investment Counsel (2008–2019); Executive Vice President, Secretary and Director, Investment Company Administration, LLC and First Fund Distributors, INC. (1990-2001). |
• Independent Chairman of the Board of Trustees since 2017 • Chairman of the Governance Committee since 2017 • Trustee since 2000 • Oversees 44 Funds in Fund Complex | | Eric Rakowski, 64 Professor of Law, University of California at Berkeley School of Law (1990-Present); Tax Attorney at Davis Polk & Wardwell and clerked for Judge Harry T. Edwards of the U.S. Court of Appeals for the District of Columbia Circuit and for Justice William J. Brennan Jr. of the U.S. Supreme Court; Director of Harding, Loevner Funds, Inc. (10 portfolios); Trustee of Third Avenue Trust (3 portfolios) (2002-2019); Trustee of Third Avenue Variable Trust (1 portfolio) (2002-2019). |
• Trustee since 2013 • Oversees 44 Funds in Fund Complex | | Victoria L. Sassine, 57 Adjunct Professor, Babson College (2007–Present); Director, Board of Directors, PRG Group (2017-Present); CEO, Founder, Scale Smarter Partners, LLC (2018-Present); Adviser, EVOFEM Biosciences (2019-Present); Chairperson of the Board of Directors of Business Management Associates (2018 to 2019). |
• Trustee since 2000 • Oversees 40 Funds in Fund Complex | | Thomas R. Schneeweis, 75 Professor Emeritus, University of Massachusetts (2013-Present); President, TRS Associates (1982-Present); Board Member, Chartered Alternative Investment Association (“CAIA”) (2002-Present); Co-Founder and Director, Institute for Global Asset and Risk Management (Education) (2010-Present); Co-Owner, Quantitative Investment Technologies (2014-Present); Co-Owner, Yes Wealth Management (2018-Present); Director, CAIA Foundation (2010-2019); Partner, S Capital Wealth Advisors (2015-2018); Partner, S Capital Management, LLC (2007-2015); President, Alternative Investment Analytics, LLC (formerly Schneeweis Partners, LLC) (2001-2013). |
Interested Trustee
The Trustee in the following table is an “interested person” of the Trust within the meaning of the 1940 Act.
| | |
Number of Funds Overseen in
Fund Complex | | Name, Age, Principal Occupation(s) During Past 5 Years and Other Directorships Held by Trustee |
• Trustee since 2021 • Oversees 44 Funds in Fund Complex | | Garret W. Weston, 40 Affiliated Managers Group, Inc. (2008-Present): Managing Director, Co-Head of Affiliate Engagement (2021-Present), Senior Vice President, Affiliate Development (2016-2021), Vice President, Office of the CEO (2015-2016), Vice President, New Investments (2012-2015), Senior Associate, New Investments (2008-2012); Associate, Madison Dearborn Partners (2006-2008); Analyst, Merrill Lynch (2004-2006). |
23
| | |
| | | AMG Funds Trustees and Officers (continued) |
| | | |
| | | |
Officers
| | |
Position(s) Held with Fund and Length of Time Served | | Name, Age, Principal Occupation(s) During Past 5 Years |
• President since 2018 • Principal Executive Officer since 2018 • Chief Executive Officer since 2018 • Chief Operating Officer since 2007 | | Keitha L. Kinne, 64 Chief Operating Officer, AMG Funds LLC (2007-Present); Chief Investment Officer, AMG Funds LLC (2008-Present); President and Principal, AMG Distributors, Inc. (2018-Present); Chief Operating Officer, AMG Distributors, Inc. (2007-Present); President, Chief Executive Officer and Principal Executive Officer, AMG Funds, AMG Funds I, AMG Funds II, AMG Funds III and AMG Funds IV (2018-Present); Chief Operating Officer, AMG Funds, AMG Funds I, AMG Funds II, and AMG Funds III (2007-Present); Chief Operating Officer, AMG Funds IV (2016-Present); Chief Operating Officer and Chief Investment Officer, Aston Asset Management, LLC (2016); President and Principal Executive Officer, AMG Funds, AMG Funds I, AMG Funds II and AMG Funds III (2012-2014); Managing Partner, AMG Funds LLC (2007-2014); President and Principal, AMG Distributors, Inc. (2012-2014); Managing Director, Legg Mason & Co., LLC (2006-2007); Managing Director, Citigroup Asset Management (2004-2006). |
• Secretary since 2015 • Chief Legal Officer since 2015 | | Mark J. Duggan, 57 Managing Director and Senior Counsel, AMG Funds LLC (2021-Present); Senior Vice President and Senior Counsel, AMG Funds LLC (2015-2021); Secretary and Chief Legal Officer, AMG Funds, AMG Funds I, AMG Funds II, AMG Funds III and AMG Funds IV (2015-Present); Attorney, K&L Gates, LLP (2009-2015). |
• Chief Financial Officer since 2017 • Treasurer since 2017 • Principal Financial Officer since 2017 • Principal Accounting Officer since 2017 | | Thomas G. Disbrow, 56 Vice President, Mutual Fund Treasurer & CFO, AMG Funds, AMG Funds LLC (2017-Present); Chief Financial Officer, Principal Financial Officer, Treasurer and Principal Accounting Officer, AMG Funds, AMG Funds I, AMG Funds II, AMG Funds III and AMG Funds IV (2017-Present); Managing Director - Global Head of Traditional Funds Product Control, UBS Asset Management (Americas), Inc. (2015-2017); Managing Director - Head of North American Funds Treasury, UBS Asset Management (Americas), Inc. (2011-2015). |
• Deputy Treasurer since 2017 | | John A. Starace, 51 Vice President, Mutual Fund Accounting, AMG Funds LLC (2021-Present); Director, Mutual Fund Accounting, AMG Funds LLC (2017-2021); Vice President, Deputy Treasurer of Mutual Funds Services, AMG Funds LLC (2014-2017); Deputy Treasurer, AMG Funds, AMG Funds I, AMG Funds II, AMG Funds III and AMG Funds IV (2017-Present); Vice President, Citi Hedge Fund Services (2010-2014); Audit Senior Manager (2005-2010) and Audit Manager (2001-2005), Deloitte & Touche LLP. |
• Chief Compliance Officer and Sarbanes-Oxley Code of Ethics since 2019 | | Patrick J. Spellman, 48 Vice President, Chief Compliance Officer, AMG Funds LLC (2017-Present); Chief Compliance Officer, AMG Distributors, Inc. (2010-Present); Chief Compliance Officer and Sarbanes-Oxley Code of Ethics Compliance Officer, AMG Funds, AMG Funds I, AMG Funds II, AMG Funds III and AMG Funds IV (2019-Present); Senior Vice President, Chief Compliance Officer, AMG Funds LLC (2011-2017); Anti-Money Laundering Compliance Officer, AMG Funds, AMG Funds I, AMG Funds II, and AMG Funds III (2014-2019); Anti-Money Laundering Officer, AMG Funds IV (2016-2019); Compliance Manager, Legal and Compliance, Affiliated Managers Group, Inc. (2005-2011). |
• Assistant Secretary since 2016 | | Maureen M. Kerrigan, 37 Vice President, Senior Counsel, AMG Funds LLC (2021-Present); Vice President, Counsel, AMG Funds LLC (2019-2021); Director, Counsel, AMG Funds LLC (2017-2018); Vice President, Counsel, AMG Funds LLC (2015-2017); Assistant Secretary, AMG Funds, AMG Funds I, AMG Funds II, AMG Funds III and AMG Funds IV (2016-Present); Associate, Ropes & Gray LLP (2011-2015); Law Fellow, Massachusetts Appleseed Center for Law and Justice (2010-2011). |
• Anti-Money Laundering Compliance Officer since 2019 | | Hector D. Roman, 44* Director, Legal and Compliance, AMG Funds LLC (2020-Present); Anti-Money Laundering Compliance Officer, AMG Funds, AMG Funds I, AMG Funds II, AMG Funds III and AMG Funds IV (2019-Present); Manager, Legal and Compliance, AMG Funds LLC (2017-2019); Director of Compliance, Morgan Stanley Investment Management (2015-2017); Senior Advisory, PricewaterhouseCoopers LLP (2014-2015); Risk Manager, Barclays Investment Bank (2008-2014). |
* As of October 29, 2022, Hector D. Roman no longer serves as Anti-Money Laundering Compliance Officer of the Trust.
24
| | |
| | | Annual Renewal of Investment Management and Subadvisory Agreements |
| | | |
| | | |
| | | | | | | | |
AMG Boston Common Global Impact Fund: Approval of Investment Management Agreement and Subadvisory Agreement on June 22, 2022 At an in-person meeting held on June 22, 2022, the Board of Trustees (the “Board” or the “Trustees”), and separately a majority of the Trustees who are not “interested persons” of AMG Funds I (the “Trust”) (the “Independent Trustees”), approved (i) the Investment Management Agreement, as amended pursuant to letter agreements at any time prior to the date of the meeting, with AMG Funds LLC (the “Investment Manager”) for AMG Boston Common Global Impact Fund (the “Fund”) and separately each of Amendment No. 1 thereto dated July 1, 2015, and Amendment No. 2 thereto dated October 1, 2016 (collectively, the “Investment Management Agreement”); and (ii) the Subadvisory Agreement, as amended at any time prior to the date of the meeting, with the Subadviser for the Fund (the “Subadvisory Agreement”). The Independent Trustees were separately represented by independent legal counsel in connection with their consideration of the approval of these agreements. In considering the Investment Management Agreement and Subadvisory Agreement, the Trustees reviewed a variety of materials relating to the Fund, the Investment Manager and the Subadviser, including the nature, extent and quality of services, comparative performance, fee and expense information for an appropriate peer group of similar mutual funds for the Fund (the “Peer Group”), performance information for the relevant benchmark index for the Fund (the “Fund Benchmark”), other relevant matters, and other information provided to them on a periodic basis throughout the year. Prior to voting, the Independent Trustees: (a) reviewed the foregoing information with their independent legal counsel; (b) received materials from their independent legal counsel discussing the legal standards applicable to their consideration of the Investment Management Agreement and the Subadvisory Agreement; and (c) met with their independent legal counsel in private sessions at which no representatives of management were present. NATURE, EXTENT AND QUALITY OF SERVICES In considering the nature, extent and quality of the services provided by the Investment Manager, the Trustees reviewed information relating to the Investment Manager’s operations and personnel. Among other things, the Investment Manager provided financial information, information about its supervisory and professional staff and descriptions | | | | of its organizational and management structure. The Trustees also took into account information provided periodically throughout the previous year by the Investment Manager in Board meetings relating to the performance of its duties with respect to the Fund and the Trustees’ knowledge of the Investment Manager’s management and the quality of the performance of the Investment Manager’s duties under the Investment Management Agreement and Administration Agreement. In the course of their deliberations regarding the Investment Manager, the Trustees evaluated, among other things: (a) the extent and quality of the Investment Manager’s oversight of the operation and management of the Fund; (b) the quality of the Investment Manager’s oversight of the performance by the Subadviser of its portfolio management duties; (c) the Investment Manager’s ability to supervise the Fund’s other service providers; and (d) the Investment Manager’s compliance program. The Trustees also took into account that, in performing its functions under the Investment Management Agreement and supervising the Subadviser, the Investment Manager: performs periodic detailed analyses and reviews of the performance by the Subadviser of its obligations to the Fund, including without limitation, analysis and review of portfolio and other compliance matters and review of the Subadviser’s investment performance with respect to the Fund; prepares and presents periodic reports to the Board regarding the investment performance of the Subadviser and other information regarding the Subadviser, at such times and in such forms as the Board may reasonably request; reviews and considers any changes in the personnel of the Subadviser responsible for performing the Subadviser’s obligations and makes appropriate reports to the Board; reviews and considers any changes in the ownership or senior management of the Subadviser and makes appropriate reports to the Board; performs periodic in-person, telephonic or videoconference diligence meetings, including with respect to compliance matters, with representatives of the Subadviser; assists the Board and management of the Trust in developing and reviewing information with respect to the initial approval of the Subadvisory Agreement and annual consideration of the Subadvisory Agreement thereafter; prepares recommendations with respect to the continued retention of the Subadviser or the replacement of the Subadviser, including at the request of the Board; identifies potential successors to, or replacements of, the Subadviser or potential additional subadvisers, including performing appropriate due diligence, and developing and presenting to the Board a recommendation as to any such successor, | | | | replacement, or additional subadviser, including at the request of the Board; designates and compensates from its own resources such personnel as the Investment Manager may consider necessary or appropriate to the performance of its services; and performs such other review and reporting functions as the Board shall reasonably request consistent with the Investment Management Agreement and applicable law. The Trustees noted the affiliation of the Subadviser with the Investment Manager, noting any potential conflicts of interest. The Trustees also took into account the financial condition of the Investment Manager with respect to its ability to provide the services required under the Investment Management Agreement and the Investment Manager’s undertaking to maintain a contractual expense limitation for the Fund. The Trustees also considered the Investment Manager’s risk management processes. The Trustees also reviewed information relating to the Subadviser’s operations and personnel and the investment philosophy, strategies and techniques (its “Investment Strategy”) used in managing the Fund. Among other things, the Trustees reviewed information on portfolio management and other professional staff, information regarding the Subadviser’s organizational and management structure and the Subadviser’s brokerage policies and practices. The Trustees considered specific information provided regarding the experience of the individuals at the Subadviser with portfolio management responsibility for the Fund, including the information set forth in the Fund’s prospectus and statement of additional information. In the course of their deliberations, the Trustees evaluated, among other things: (a) the services rendered by the Subadviser in the past; (b) the qualifications and experience of the Subadviser’s personnel; and (c) the Subadviser’s compliance program. The Trustees also took into account the financial condition of the Subadviser with respect to its ability to provide the services required under the Subadvisory Agreement. The Trustees also considered the Subadviser’s risk management processes. PERFORMANCE The Board considered the Fund’s net performance during relevant time periods as compared to the Fund’s Peer Group and Fund Benchmark, considered the gross performance of the Fund as compared to the Subadviser’s relevant performance composite that utilizes a similar investment strategy and approach, and noted that the Board reviews on a quarterly basis detailed information about both the Fund’s performance results and portfolio |
25
| | |
| | | Annual Renewal of Investment Management and Subadvisory Agreements (continued) |
| | | |
| | | |
| | | | | | | | |
composition, as well as the Subadviser’s Investment Strategy. The Board was mindful of the Investment Manager’s expertise, resources and attention to monitoring the Subadviser’s performance, investment style and risk-adjusted performance with respect to the Fund and its discussions with the management of the Fund’s subadviser during the period regarding the factors that contributed to the performance of the Fund. Among other information relating to the Fund’s performance (including the predecessor fund’s performance for periods prior to its acquisition by the Trust on October 1, 2013), the Trustees noted that the Fund’s performance for Class I shares (the Fund’s sole share class) for the 1-year, 3-year, 5-year and 10-year periods ended March 31, 2022 was below, below, above, and above, respectively, the median performance of the Peer Group and below, below, above, and above, respectively, the performance of the Fund Benchmark, the MSCI ACWI Index. The Trustees also took into account management’s discussion of the Fund’s performance, including the reasons for the Fund’s more recent underperformance and the fact that the Fund ranked in the top decile relative to its Peer Group for the 5-year and 10-year periods. The Trustees also took into account the fact that the Fund’s subadviser, investment strategy, and Fund Benchmark changed effective March 19, 2021, and that the performance information prior to that date reflected that of the Fund’s prior subadviser and investment strategy. The Trustees concluded that the Fund’s overall performance has been satisfactory in light of the Fund’s investment objective, strategies and policies. ADVISORY AND SUBADVISORY FEES; FUND EXPENSES; PROFITABILITY; AND ECONOMIES OF SCALE In considering the reasonableness of the advisory fee payable to the Investment Manager, the Trustees reviewed information provided by the Investment Manager at the June 22, 2022 and prior meetings setting forth all revenues and other benefits, both direct and indirect (including any so-called “fallout benefits” such as reputational value derived from the Investment Manager serving as Investment Manager to the Fund), received by the Investment Manager and its affiliates attributable to managing the Fund and all the mutual funds in the AMG Funds Family of Funds; the cost of providing such services; the significant risks undertaken as Investment Manager and sponsor of the Fund, including investment, operational, enterprise, entrepreneurial, litigation, regulatory and compliance risks; and the resulting profitability to the Investment Manager and its | | | | affiliates from these relationships. The Trustees also considered the amount of the advisory fee retained by the Investment Manager after payment of the subadvisory fee with respect to the Fund. The Trustees also noted payments are made from the Subadviser to the Investment Manager, and other payments are made from the Investment Manager to the Subadviser. The Trustees also considered management’s discussion of the current asset level of the Fund, and the impact on profitability of both the current asset level and any future growth of assets of the Fund. In considering the cost of services to be provided by the Investment Manager under the Investment Management Agreement and the profitability to the Investment Manager of its relationship with the Fund, the Trustees noted the undertaking by the Investment Manager to maintain a contractual expense limitation for the Fund. The Board also took into account management’s discussion of the advisory fee structure, and the services the Investment Manager provides in performing its functions under the Investment Management Agreement and supervising the Subadviser. Based on the foregoing, the Trustees concluded that the profitability to the Investment Manager is reasonable and that the Investment Manager is not realizing material benefits from economies of scale that would warrant adjustments to the advisory fee at this time. Also with respect to economies of scale, the Trustees noted that as the Fund’s assets increase over time, the Fund may realize other economies of scale to the extent the increase in assets is proportionally greater than the increase in certain other expenses. In considering the reasonableness of the subadvisory fee payable by the Investment Manager to the Subadviser, the Trustees reviewed information regarding the cost to the Subadviser of providing subadvisory services to the Fund and the resulting profitability from the relationship. The Trustees noted that, because the Subadviser is an affiliate of the Investment Manager, a portion of the Subadviser’s revenues or profits might be shared directly or indirectly with the Investment Manager. The Trustees also noted that the subadvisory fees are paid by the Investment Manager out of its advisory fee. The Board also took into account management’s discussion of the subadvisory fee structure, and the services the Subadviser provides in performing its functions under the Subadvisory Agreement. Based on the foregoing, the Trustees concluded that the profitability to the Subadviser is reasonable and that the Subadviser is not realizing material benefits from economies of scale that would warrant adjustments to the subadvisory fees at this time. Also with | | | | respect to economies of scale, the Trustees noted that as the Fund’s assets increase over time, the Fund may realize other economies of scale to the extent the increase in assets is proportionally greater than the increase in certain other expenses. The Trustees noted that the Fund’s management fees (which include both the advisory and administration fees) and total expenses as of March 31, 2022 were both higher than the average for the Fund’s Peer Group. The Trustees took into account the fact that the Investment Manager has contractually agreed, through February 1, 2023, to limit the Fund’s net annual operating expenses (subject to certain excluded expenses) to 0.93%. The Trustees took into account management’s discussion of the Fund’s expenses and competitiveness with comparably sized funds and select competitors. The Trustees concluded that, in light of the nature, extent and quality of the services provided by the Investment Manager and the Subadviser (which is an affiliate of the Investment Manager), the foregoing expense limitation and the considerations noted above with respect to the Investment Manager and the Subadviser, the Fund’s advisory and subadvisory fees are reasonable. * * * * * After consideration of the foregoing, the Trustees also reached the following conclusions (in addition to the conclusions discussed above) regarding the Investment Management Agreement and the Subadvisory Agreement: (a) the Investment Manager and the Subadviser have demonstrated that they possess the capability and resources to perform the duties required of them under the Investment Management Agreement and the Subadvisory Agreement and (b) the Investment Manager and Subadviser maintain appropriate compliance programs. Based on all of the above-mentioned factors and their related conclusions, with no single factor or conclusion being determinative and with each Trustee not necessarily attributing the same weight to each factor, the Trustees concluded that approval of the Investment Management Agreement and the Subadvisory Agreement would be in the best interests of the Fund and its shareholders. Accordingly, on June 22, 2022, the Trustees, and separately a majority of the Independent Trustees, voted to approve the Investment Management Agreement and the Subadvisory Agreement for the Fund. |
26
THIS PAGE INTENTIONALLY LEFT BLANK
THIS PAGE INTENTIONALLY LEFT BLANK
|
|
| | | | | | | | |
INVESTMENT MANAGER AND ADMINISTRATOR AMG Funds LLC 680 Washington Blvd., Suite 500 Stamford, CT 06901 800.548.4539 DISTRIBUTOR AMG Distributors, Inc. 680 Washington Blvd., Suite 500 Stamford, CT 06901 800.548.4539 SUBADVISER Boston Common Asset Management, LLC 200 State Street 7th Floor Boston, MA 02109 CUSTODIAN The Bank of New York Mellon Mutual Funds Custody 6023 Airport Road Oriskany, NY 13424 | | | | LEGAL COUNSEL Ropes & Gray LLP Prudential Tower, 800 Boylston Street Boston, MA 02199-3600 TRANSFER AGENT BNY Mellon Investment Servicing (US) Inc. Attn: AMG Funds 4400 Computer Drive Westborough, MA 01581 800.548.4539 | | | | This report is prepared for the Fund’s shareholders. It is authorized for distribution to prospective investors only when preceded or accompanied by an effective prospectus. To receive a free copy of the prospectus or Statement of Additional Information, which includes additional information about Fund Trustees, please contact us by calling 800.548.4539. Distributed by AMG Distributors, Inc., member FINRA/SIPC. Current net asset values per share for the Fund are available on the Fund’s website at amgfunds.com. A description of the policies and procedures the Fund uses to vote its proxies is available: (i) without charge, upon request, by calling 800.548.4539, or (ii) on the Securities and Exchange Commission’s (SEC) website at sec.gov. For information regarding the Fund’s proxy voting record for the 12-month period ended June 30, call 800.548.4539 or visit the SEC website at sec.gov. The Fund files its complete schedule of portfolio holdings with the SEC for the first and third quarters of each fiscal year as an exhibit to their reports on Form N-PORT. The Fund’s portfolio holdings on Form N-PORT are available on the SEC’s website at sec.gov and the Fund’s website at amgfunds.com. To review a complete list of the Fund’s portfolio holdings, or to view the most recent semiannual report or annual report, please visit amgfunds.com. |
| | | | | | | | | |
|
|
| | | | | | | | |
BALANCED FUNDS AMG GW&K Global Allocation GW&K Investment Management, LLC EQUITY FUNDS AMG Beutel Goodman International Equity Beutel, Goodman & Company Ltd. AMG Boston Common Global Impact Boston Common Asset Management, LLC AMG Frontier Small Cap Growth Frontier Capital Management Co., LLC AMG GW&K Small Cap Core AMG GW&K Small Cap Value AMG GW&K Small/Mid Cap AMG GW&K Small/Mid Cap Growth AMG GW&K Emerging Markets Equity AMG GW&K Emerging Wealth Equity AMG GW&K International Small Cap GW&K Investment Management, LLC AMG Montrusco Bolton Large Cap Growth Montrusco Bolton Investments, Inc. AMG Renaissance Large Cap Growth The Renaissance Group LLC | | | | AMG River Road Dividend All Cap Value AMG River Road Focused Absolute Value AMG River Road International Value Equity AMG River Road Large Cap Value Select AMG River Road Mid Cap Value AMG River Road Small-Mid Cap Value AMG River Road Small Cap Value River Road Asset Management, LLC AMG TimesSquare Emerging Markets Small Cap AMG TimesSquare Global Small Cap AMG TimesSquare International Small Cap AMG TimesSquare Mid Cap Growth AMG TimesSquare Small Cap Growth TimesSquare Capital Management, LLC AMG Veritas Asia Pacific AMG Veritas China AMG Veritas Global Focus AMG Veritas Global Real Return Veritas Asset Management LLP AMG Yacktman AMG Yacktman Focused AMG Yacktman Global AMG Yacktman Special Opportunities Yacktman Asset Management LP | | | | FIXED INCOME FUNDS AMG Beutel Goodman Core Plus Bond Beutel, Goodman & Company Ltd. AMG GW&K Core Bond ESG AMG GW&K Enhanced Core Bond ESG AMG GW&K ESG Bond AMG GW&K High Income AMG GW&K Municipal Bond AMG GW&K Municipal Enhanced Yield GW&K Investment Management, LLC |
| | | | | | | | | |
| | | | | | | | | |
| | | | | | | | | |
| | | | | | | | | |
| | | | | | | | | |
| | | | | | | | | |
| | | | | | | | | |
| | | | | | | | | |
| | | | | | | | | |
| | | | |
| amgfunds.com | | | | 093022 AR074 |
| | |
| | | ANNUAL REPORT |
| | | | | | |
| | | | AMG Funds September 30, 2022 
AMG Veritas Global Real Return Fund |
| | | | |
| | | | | Class I: BLUEX | | |
| | | | |
| | | | | | | |
| | | | |
| amgfunds.com | | | | 093022 AR073 |
| | |
| | | AMG Funds Annual Report — September 30, 2022 |
| | | | | | |
| | | |
| | | | | | | |
| | | TABLE OF CONTENTS | | PAGE | |
| | | | |
| | | |
| | | LETTER TO SHAREHOLDERS | | | 2 | |
| | | |
| | | ABOUT YOUR FUND’S EXPENSES | | | 3 | |
| | | |
| | | PORTFOLIO MANAGER’S COMMENTS, FUND SNAPSHOTS AND SCHEDULE OF PORTFOLIO INVESTMENTS | | | 4 | |
| | | |
| | | FINANCIAL STATEMENTS | | | | |
| | | |
| | | Statement of Assets and Liabilities | | | 13 | |
| | | |
| | | Balance sheet, net asset value (NAV) per share computations
and cumulative distributable earnings (loss) | | | | |
| | | |
| | | Statement of Operations | | | 14 | |
| | | |
| | | Detail of sources of income, expenses, and realized and
unrealized gains (losses) during the fiscal year | | | | |
| | | |
| | | Statements of Changes in Net Assets | | | 15 | |
| | | |
| | | Detail of changes in assets for the past two fiscal years | | | | |
| | | |
| | | Financial Highlights | | | 16 | |
| | | |
| | | Historical net asset values per share, distributions, total returns, income
and expense ratios, turnover ratios and net assets | | | | |
| | | |
| | | Notes to Financial Statements | | | 17 | |
| | | |
| | | Accounting and distribution policies, details of agreements and
transactions with Fund management and affiliates, and descriptions of
certain investment risks | | | | |
| | | |
| | | REPORT OF INDEPENDENT REGISTERED PUBLIC ACCOUNTING FIRM | | | 23 | |
| | | |
| | | OTHER INFORMATION | | | 24 | |
| | | |
| | | TRUSTEES AND OFFICERS | | | 25 | |
| | | |
| | | ANNUAL RENEWAL OF INVESTMENT MANAGEMENT AND SUBADVISORY AGREEMENTS | | | 27 | |
| | | | | | | |
|
| |
Nothing contained herein is to be considered an offer, sale or solicitation of an offer to buy shares of any series of the AMG Funds Family of Funds. Such offering is made only by prospectus, which includes details as to offering price and other material information.
| | |
| | Letter to Shareholders |
Dear Shareholder:
The fiscal year ended September 30, 2022, was a volatile period for risk assets as uncertainties mounted about high inflation, monetary policy, and the Russian invasion of Ukraine. Global equity and bond markets fell in tandem amid sharply higher interest rates and eroding investor confidence as worries of an impending recession loomed over markets. A global commodity shock caused by the war in Ukraine only made matters worse. The S&P 500® Index slipped into a bear market with the Index falling more than (24)% from its peak earlier in the year. The abrupt shift in markets this year has reset expectations around future growth as stubbornly high inflation has necessitated the U.S. Federal Reserve and other global central banks to take more aggressive policy action in bringing down inflation. While the outlook is uncertain given the recent negative returns across many asset classes, one silver lining is that stock and bond valuations are now more attractive than where they were at the start of the year.
There was very wide dispersion in sector performance. Energy significantly outperformed all other sectors with a gain of 45.70% as the price of oil surged during the period. Defensive-oriented sectors also outperformed with a 5.55% return from utilities and a nearly flat (0.09)% return from consumer staples. All other sectors experienced negative returns, led by high growth technology and mega cap internet-related companies underperforming during the period. Communications services fell the most with a (39.07)% return during the fiscal year, followed by declines of (20.89)% for consumer discretionary and (19.96)% for information technology. Value stocks outperformed growth stocks as the Russell 1000® Value Index returned (11.36)% compared to the (22.59)% return for the Russell 1000® Growth Index. Small cap stocks struggled as the Russell 2000® Index lost (23.50)%. Outside the U.S., foreign developed markets lagged their U.S. counterparts as the U.S. dollar surged and the MSCI EAFE Index fell (25.13)%. Emerging Markets underperformed with a (28.11)% return for the MSCI Emerging Markets Index.
The 10-year Treasury yield more than doubled during the period, surging past the 3% threshold for the first time in the post-pandemic era. Rapidly rising rates from a very low base led to historically bad performance for bonds as the Bloomberg U.S. Aggregate Bond Index, a broad measure of U.S. bond market performance, lost (14.60)% over the period. Investment-grade corporate bonds underperformed, returning (18.53)% for the year. High yield bonds held up slightly better with a (14.14)% return as measured by the return of the Bloomberg U.S. Corporate High Yield Bond Index. Municipal bonds were slightly better with a (11.50)% return for the Bloomberg Municipal Bond Index. Non-U.S. bonds delivered weak performance and were also impacted by the stronger dollar as the Bloomberg Global Aggregate ex U.S. fell (24.77)%.
AMG Funds appreciates the privilege of providing investment tools to you and your clients. Our foremost goal is to provide investment solutions that help our shareholders successfully reach their long-term investment goals. AMG Funds provides access to a distinctive array of actively managed return-oriented investment strategies. We thank you for your continued confidence and investment in AMG Funds. You can rest assured that under all market conditions our team is focused on delivering excellent investment management services for your benefit.
Respectfully,
Keitha Kinne
President
AMG Funds
| | | | | | | | | | | | | | |
| Average Annual Total Returns | | Periods ended
September 30, 2022* | |
| | | | |
| Stocks: | | | | 1 Year | | | 3 Years | | | 5 Years | |
| | | | |
| Large Cap | | (S&P 500® Index) | | | (15.47 | )% | | | 8.16 | % | | | 9.24 | % |
| | | | |
| Small Cap | | (Russell 2000® Index) | | | (23.50 | )% | | | 4.29 | % | | | 3.55 | % |
| | | | |
| International | | (MSCI ACWI ex USA) | | | (25.17 | )% | | | (1.52 | )% | | | (0.81 | )% |
| | | | |
| Bonds: | | | | | | | | | | | |
| | | | |
| Investment Grade | | (Bloomberg U.S. Aggregate Bond Index) | | | (14.60 | )% | | | (3.26 | )% | | | (0.27 | )% |
| | | | |
| High Yield | | (Bloomberg U.S. Corporate High Yield Bond Index) | | | (14.14 | )% | | | (0.45 | )% | | | 1.57 | % |
| | | | |
| Tax-exempt | | (Bloomberg Municipal Bond Index) | | | (11.50 | )% | | | (1.85 | )% | | | 0.59 | % |
| | | | |
| Treasury Bills | | (ICE BofAML U.S. 6-Month Treasury Bill Index) | | | 0.39 | % | | | 0.68 | % | | | 1.25 | % |
*Source: FactSet. Past performance is no guarantee of future results.
2
| | |
| | | About Your Fund’s Expenses |
| | | |
| | | |
| | | | | | | | |
As a shareholder of a Fund, you may incur two types of costs: (1) transaction costs, which may include sales charges (loads) on purchase payments; redemption fees; and exchange fees; and (2) ongoing costs, including management fees; distribution (12b-1) fees; and other Fund expenses. This example is intended to help you understand your ongoing costs (in dollars) of investing in the Fund and to compare these costs with the ongoing costs of investing in other mutual funds. The example is based on $1,000 invested at the beginning of the period and held for the entire period as indicated below. ACTUAL EXPENSES The first line of the following table provides information about the actual account values and | | | | actual expenses. You may use the information in this line, together with the amount you invested, to estimate the expenses that you paid over the period. Simply divide your account value by $1,000 (for example, an $8,600 account value divided by $1,000 = 8.6), then multiply the result by the number in the first line under the heading entitled “Expenses Paid During the Period” to estimate the expenses you paid on your account during this period. HYPOTHETICAL EXAMPLE FOR COMPARISON PURPOSES The second line of the following table provides information about hypothetical account values and hypothetical expenses based on the Fund’s actual expense ratio and an assumed annual rate of return of 5% before expenses, which is not the Fund’s | | | | actual return. The hypothetical account values and expenses may not be used to estimate the actual ending account balance or expenses you paid for the period. You may use this information to compare the ongoing costs of investing in the Fund and other funds by comparing this 5% hypothetical example with the 5% hypothetical examples that appear in the shareholder reports of other funds. Please note that the expenses shown in the table are meant to highlight your ongoing costs only and do not reflect any transactional costs, such as sales charges (loads), redemption fees, or exchange fees. Therefore, the second line of the table is useful in comparing ongoing costs only, and will not help you determine the relative total costs of owning different funds. |
| | | | | | | | |
| | | | | | | | |
Six Months Ended September 30, 2022 | | Expense
Ratio for
the Period | | Beginning
Account
Value
04/01/22 | | Ending
Account
Value
09/30/22 | | Expenses
Paid
During
the Period* |
|
AMG Veritas Global Real Return Fund |
|
Based on Actual Fund Return |
| | | | |
Class I | | 1.15% | | $1,000 | | $850 | | $5.33 |
|
Based on Hypothetical 5% Annual Return |
| | | | |
Class I | | 1.15% | | $1,000 | | $1,019 | | $5.82 |
| | * | Expenses are equal to the Fund’s annualized expense ratio multiplied by the average account value over the period, multiplied by the number of days in the most recent fiscal half-year (183), then divided by 365. | |
3
| | |
| | | AMG Veritas Global Real Return Fund Portfolio Manager’s Comments (unaudited) |
| | | |
| | | |
| | | | | | | | |
For the 12 months ended September 30, 2022, the AMG Veritas Global Real Return Fund (the “Fund”) returned (17.69%), compared with the (11.57%) return for the Bloomberg U.S. Treasury Inflation-Linked Bond Index. Market Overview At the end of 2021, most economies around the globe roared back to life after COVID-19 restrictions were lifted. Fiscal stimulus enacted during the pandemic boosted consumer demand and both consumer and business confidence started to recover. Inflationary pressures were building but central banks, such as the U.S. Federal Reserve (the “Fed”), were forecasting these pricing pressures as transitory given pent-up demand and supply-chain disruptions due to the pandemic. Fast forward to the same period in 2022 and we see stark differences in geopolitics, economic indicators, and sentiment. Not many would have predicted such a significant turn of events. Russia’s attack on Ukraine in February of 2022 resulted in a humanitarian crisis in Europe and magnified supply-chain disruptions of vital resources such as energy, food, and raw materials. China’s “zero-COVID” policy continued to curtail the rebound in the global supply of goods, further igniting inflationary pressures. Global inflation is now forecast to rise from 4.7% in 2021 to 8.8% in 2022. Upside inflation surprises have been most widespread among advanced economies, with greater variability in emerging markets and developing economies. In June the Federal Open Market Committee (“FOMC”) hiked the federal funds rate by 0.75% to a range of 1.5% to 1.75%, in an attempt to temper the demand for credit, the largest increase since 1994. It was followed by subsequent rate rises of 0.75% in July and September 2022 to its current range of 3.00% to 3.25%. At the same time, global economic activity is experiencing a broad-based and sharper-than-expected slowdown. Global growth is forecast to slow from 6.0% in 2021 to 3.2% in 2022. This is the weakest growth profile since 2001; except for the global financial crisis in 2008 and the acute phase of the COVID-19 pandemic, and reflects significant slowdowns for the largest economies: a U.S. GDP contraction in the first half of 2022, a Euro area contraction in the second half of 2022, prolonged COVID-19 outbreaks and lockdowns in China with a growing property sector crisis, and a war in Ukraine. About a third of the world economy has faced two consecutive quarters of negative growth. Monetary policy should restore price stability, and fiscal policy should aim to alleviate cost-of-living pressures while maintaining a sufficiently tight stance aligned with monetary policy. Structural reforms can further support the fight against inflation by improving productivity and easing | | | | supply constraints, while multilateral cooperation is necessary for fast-tracking the green energy transition and preventing fragmentation. The global economy’s future health critically rests on the successful calibration of monetary policy, the course of the war in Ukraine, and the possibility of further pandemic-related supply-side disruptions, for example, in China. Rapid global tightening of monetary policy could increase the risk of financial crises. A U.S. recession could be induced by aggressive monetary policy tightening in response to elevated inflation and the recession in the Euro zone will likely reflect surging energy prices and rationing. China may escape the onset of a recession but will likely experience weak growth during the latter part of 2022 due to repeated lockdowns, a housing correction, and weakening external growth. During periods of such macro uncertainty, we continue to focus on our approach and the companies we invest in. Interest rate rises do not affect all equities uniformly however, companies where the bulk of earnings and cash flows are likely to rise in the distant future are typically more sensitive to interest rate changes. Many growth companies have already seen the impact of small changes to rates as the share prices of companies in the non-profitable tech universe have declined substantially. Conversely, companies delivering high cash flows today (and protected by substantial barriers to entry), while not completely immune to changes in interest rates, are much less affected. Our consistent and robust approach is to focus on businesses that are durable, competitively advantaged, and while not immune to macroeconomic challenges, those which can improve their competitive position through these periods. If these companies can compound high returns over time, they should generate significant economic value for shareholders. These are the types of business that the Fund looks to invest in when they are available at attractive valuations. Performance Review In the 12 months ended September 2022, the Fund returned (17.69)%, compared to the (11.57)% return of the Bloomberg U.S. Treasury Inflation-Linked Bond Index. The Fund has a mechanistic approach to the amount of index futures to use at a given point in time, this is based on the average valuation we observe of our “Veritas Investment Universe” which is made up of approximately 250 high quality companies that we would like to invest in at the right price, i.e., a collection of companies that have gone through our deep dive investment process to assess if they have the characteristics we would like to invest in. Given this is 250 companies out of a potential 4,000 or so, the list does not represent an index. Coming into 2022 the relatively high | | | | valuations witnessed across equity markets and the commensurately, average mid-single digit return expectation across the Veritas Investment Universe (from which we calculate the level of index future the Fund should have), the Fund had a net equity exposure of roughly 45%. As equity markets have fallen, this exposure has increased somewhat; although to a lesser extent than what might be expected. As we now account for an earnings recession over the next 12 to 24 months, the impact of this may damper the Internal Rate of Return (“IRR”) of the Veritas Investment Universe. As of September 30, 2022, the net equity exposure was approximately 58%, which reflects a slightly better than mid-single digit average expected return over the Fund’s 5-year horizon for the Veritas Investment Universe. Contributors In 2022, BAE Systems PLC (“BAE”) (+20.1% return during the period) generated 43% of its sales from the U.S., 20% from the U.K., and 12% from Saudi Arabia. This has benefited the company as the U.S. has increased its defense budget by around 15% over the past five years. When we initiated our position in BAE, sentiment toward the business was poor. The U.S. land division was suffering from the wind down of operations in Iraq and Afghanistan, and as a result, group revenue fell 20% from a peak at the start of the decade. Meanwhile, cash generation was weak as the company made onerous top up payments into its underfunded pension scheme and completed work for which it had been paid upfront in prior years. Understandably, the business was not perceived as a “quality” organization despite having many of the attributes we look for: entrenched and often dominant market positions supplying products that will be of strategic importance to their customers for decades to come; benign contracting arrangements (often cost plus); and a capital light business model. Over subsequent years many of the controversies that beset BAE have started to resolve positively as the business showed itself to be resilient in the face of a pandemic while growth has been reasonable; cash conversion has improved; a buyback has been initiated; and the pension funding gap has closed. Nevertheless, perception of the business (and the valuation) has been slow to change, and it is only with the invasion of Ukraine that the market’s view of the investment case has started to converge with our own. While the growth rate of BAE has improved marginally, as a consequence of Russia’s actions, the more significant change has been sentiment with regard to the importance of a well invested and |
4
| | |
| | | AMG Veritas Global Real Return Fund Portfolio Manager’s Comments (continued) |
| | | |
| | | |
| | | | | | | | |
resilient defense industrial base, and hence the vibrancy of the company’s business model. Despite the recent re-rating, we still see value in BAE. While most markets are dominated by competition and cycles that can lead to overexpansion and overproduction with the price swings that result, defense companies like BAE agree to large, long-term fixed contracts with primarily government bodies. While there is some competition at the top end of the market, the biggest companies have access to unique technology and skills not offered by smaller players. In the U.S., the world’s largest defense market, a new spending bill was signed into law at the beginning of March 2022 which increased defense spending to $743 billion this year and $773 billion in 2023. During June 2022, BAE won a $12 billion contract from the U.S. Department of Defense to support intercontinental ballistic missile systems over the next 18 years. While BAE was among five firms competing for the contract, the company is currently helping the military branch sustain the weapon as part of an eight-year, $534 million contract awarded in July 2013, so BAE was always likely to be in the driving seat to win the contract. While UnitedHealth Group, Inc. (“UNH”) (+30.9% return during the period) does not own a pharmacy network like CVS Health Corp., it has seen many of the same positive trends and has been the marker leader when it comes to applying artificial intelligence (AI). UNH aims to produce high-quality diversified growth, pursue excellence in every consumer experience at every touch point, and apply technology to help all stakeholders to improve access, affordability, and outcomes. The company has five key areas to help drive the long-term earnings per share growth, which it has targeted at 13% to 16%. The first is value-based care delivery. UNH expects to add 600,000 patients under value-based arrangements by the end of 2022. The aim here is to provide care in the setting that makes most sense for the patient. For instance, the company announced plans to acquire in-home healthcare company LHC Group, Inc. for $5.4 billion which will reinforce the company’s ability to deliver care and support in the home. The second growth area, health benefits, is focused on scaling value-based care for both commercial and Medicare insurance. In Medicare Advantage, UNH will serve an additional 800,000 people in 2022. With Medicare Advantage the service is offered via a private scheme but approved by the government. In the commercial benefits market, offerings such as physician-led and virtual first plans have grown to serve 350,000 more people over the past year. This underscores the consumer appeal for these high-quality primary care-based coverage options. Nearly 90% of newly enrolled people in individual | | | | exchange offerings, had selected plans with significant virtual components in the most recent open enrollment period and nearly 30% had selected a virtual-first offering. In the third growth area, health technology, the company continues to execute on the major new health system partnerships initiated last year; including a broad relationship with SSM Health and its 11,000 providers caring for people throughout the Midwest of the U.S. UNH helps alleviate administrative burdens and create operational capacity for their partners to focus on delivering patient care. Fourth, UNH is developing health financial services, streamlining and simplifying payments for providers, payers, and consumers, while reducing friction and increasing speed and convenience. With this goal in mind, they have introduced an integrated consumer card. Many people typically have separate cards for clinical care, pharmacy benefits, food assistance programs, fitness, rewards programs, etc. However, UNH has combined these benefits into a single card. And finally, pharmacy services. The high cost of specialty drugs is one of the most pressing issues for health plan providers. UNH Optum business provides advanced analytical capabilities, collaborating with health plans to provide clinicians with access to real-time medical and pharmacy analytics, which are coordinated with a patient-specific benefit plan design, thus enabling clinicians to determine the most effective and appropriate therapies at the point of care. As a result, specialty costs have fallen by over 15%. These efforts from expanding in-home and broad value-based care offerings, to enhancements to Medicare Advantage, to simplifying how to finance care are designed to create greater value for consumers and at the same time drive earnings for UNH. Detractors The share price of Charter Communications, Inc., Class A (“Charter”) has fallen significantly in 2022 (-58.3% return during the period). Given the company’s value lies in the provision of high-speed broadband to residential customers, we see the company as relatively defensive given the “must-have” subscription nature of broadband. Unfortunately, the share price has been anything but defensive; largely due to the threat of greater competition from 5G fixed wireless broadband (“FWA”). We believe that this threat has been exaggerated by investors and expect that the company will be able to demonstrate the continuing strength of its market position over the next two years. In the three years prior to COVID, Charter added an average of 1.2 million new internet subscribers per year. In 2020, this jumped to 2.1 million before returning to 1.1 million in 2021. It is likely there has been some demand pull forward for | | | | the cable industry and Charter specifically. By the end of 2022, we expect to see very few new subscribers in a year when FWA will add roughly 3 million new subscribers across the U.S. Consequently, many investors believe that FWA will continue to erode the market share of the U.S. cable companies in broadband provision. We think this is unlikely and see the share gain of FWA as a temporary phenomenon. FWA is a good solution for a certain cohort of subscribers: those with no other broadband option (largely rural customers) or households that do not have high demand in terms of either speed or capacity (both are constrained with FWA) and are price sensitive. From the carrier perspective, FWA is only worth offering in areas where they do not have any capacity constraint on their mobile network. This point is important because the spectrum needed to offer FWA is expensive, and a much higher return is generated if this spectrum can be used for traditional mobile telephony (both voice and data) rather than using the valuable spectrum to provide FWA where users will typically use 20 times the data for the same (or lower) price than a mobile subscriber (so the price per GB is typically less than 5% of a mobile subscribers). Currently, the carriers selling FWA are benefiting from offering a new service at a low price point to a limited cohort of customers, many of whom likely have no other broadband option. Over time (we believe within the next two years), these customers will be largely exhausted for the carriers and growth in FWA will stall. Furthermore, due to speed constraints in FWA (typically speeds are limited to about 100Mbps during peak times) it seems likely that as more data heavy applications are developed (4K TV/metaverse/virtual reality etc.) that many FWA subscribers will become frustrated and will upgrade to “full fat” broadband as offered by fiber and coaxial cable. At this point, we anticipate growth in subscribers for the cable companies will reaccelerate. In the meantime, Charter is not standing still as the company extends its broadband network by around one million residential passings per year into new rural areas and other under-served areas that are typically contiguous with its current network. Given the company has a roughly 50% penetration of households passed by its network and many of these new customers will have no other broadband option, we think that growth in net new subscribers will restart in 2023 albeit at a level below the historic one million per year. All this means that 2022 is likely to see subscriber numbers remaining level and revenues and earnings modestly increasing before growth improves in 2023 and again in 2024. However, even without any improvement the company appears extremely |
5
| | |
| | | AMG Veritas Global Real Return Fund Portfolio Manager’s Comments (continued) |
| | | |
| | | |
| | | | | | | | |
attractively valued with a future cash flow (“FCF”) in 2021 of $40 per share and a share price of $300, giving a historic FCF yield of 13%. Meta Platforms, Inc. (“Meta”) (-60.0% return during the period) reaches more than 3.6 billion people monthly across their services. Engagement trends on Facebook have generally been stronger than anticipated, and strong Reels (a short video feature on Facebook) growth is continuing to drive engagement across Facebook and Instagram. That said, the company acknowledges that it has entered an economic downturn that will have a broad impact on the digital advertising business. The aim is to position the business to be stronger coming out of this downturn, focusing on three areas: a “discovery engine” and Reels, a new ads infrastructure, and the metaverse. The company, mindful of the long-term payback for metaverse, is being rigorous about measuring returns and sizing these investments correctly. In line with this, Meta aims to steadily reduce headcount growth over the next year and “get more done with fewer resources.” Previously challenging periods have been transformational for Meta so the question is, will that be the case this time? There are two major technological waves that Meta is focused on. The first wave driving the business today is AI. Social feeds are going from being driven primarily by the people and accounts you follow to content driven by AI recommendations that you’ll find interesting from across Facebook or Instagram. Reels is one part of this trend that focuses on the growth of short-form video as a content format, but this overall AI trend is much broader and covers all types of content, including text, images, links, group content, and more. In this sense, Meta is taking a different approach than some competitors in that they have a lot of different types of content formats. Building a recommendation system across all these types of content is something Meta is focused on and what it refers to as a “discovery engine.” About 15% of content in a person’s Facebook feed and a little more than that of their Instagram feed is recommended by AI from people, groups, or accounts that they do not follow. Expect these numbers to more than double by the end of 2023 as AI finds additional content that people find | | | | interesting and increases the engagement and quality of feeds. Since Meta is already efficient at monetizing most of these formats, this should increase business opportunity over that period. Instead of people interacting through comments within their feeds, more and more people have begun to export and message that content to friends and interact there. This creates a “flywheel of discovery” and then social connection, inspiring those people to create more content themselves. Within advertising, on which Meta relies, the near-term challenge is the growth of short-form video. Reels has not monetized at the same rate as TikTok Feeds or Snapchat Stories, so in the near term the faster that Reels grows, the more revenue it displaces from higher-monetizing surfaces. The company is confident that Reels will grow engagement overall and quality and will eventually monetize closer to feed. The company crossed $1 billion in annual revenue run rate for Reels ads during Q3 2022, and Reels also has a higher revenue run rate than Snapchat Stories did at identical times post launch, but it is an overall drag currently as it diverts from higher revenue feeds. The second challenge for advertising is the signal loss from Apple’s iOS changes. The approach here is to grow first-party understanding of people’s interests by making it easier for people to engage with businesses in Meta’s own apps. For example, Click-to-Messaging is part of the business messaging strategy that is growing quickly with 40% of advertisers already using this format. Meta estimates that one billion users are messaging a business each week across WhatsApp, Messenger, and Instagram. Click-to-Message is already a multi-billion dollar business, where the company continues to see strong double-digit year-over-year growth. These ads are proving particularly popular with Server Message Blocks in emerging markets like Brazil and Mexico and big brands are incorporating business messaging into their campaigns, like Paramount Studios, who used Click-to-Messenger to promote their blockbuster movie, Top Gun: Maverick, and drive ticket sales. Advances in AI enable the company to deliver better personalized ads while using less data and making it simpler to create video ads for Instagram Stories. | | | | Additionally, they are testing ways for advertisers to transform static images with music and motion so they appear more like video. Small businesses are better at static photos than they are at video. The second technological wave is the Metaverse, which enables deeper social experiences where you feel a realistic sense of presence with other people. Meta aims to become a leader in the Metaverse race by investing in technologies. It has continued the expansion of Horizon, its social Metaverse platform, and the continued improvement of the Avatar platform. It launched an avatar store with digital clothes from leading fashion houses. It remains a long-term prospect with costs being adjusted accordingly. Looking at the two business segments, Family of Apps (Facebook, Instagram, WhatsApp, Messenger) and Reality Labs (Metaverse), the goal from a financial perspective is to generate sufficient operating income growth from Family of Apps to fund the growth of investment in Reality Labs, while still growing overall profitability. That’s not going to happen in 2022 and Meta talked of scaling back the investment in the Metaverse. They admitted it is possible that prolonged macroeconomic or business uncertainty could force them to trade off against shorter-term financial goals which is a sensible approach. Outlook The Fund’s strategy aim is to preserve and grow clients’ capital in real terms. Although the key driver of long-term performance is stock selection, the hedging via short positions in equity market futures contracts plays an important role in preserving capital in falling markets. We continue to believe the Fund can deliver real returns in challenging market conditions. This commentary reflects the viewpoints of Veritas Asset Management LLP, as of September 30, 2022 and is not intended as a forecast or guarantee of future results. |
6
| | |
| | | AMG Veritas Global Real Return Fund Portfolio Manager’s Comments (continued) |
| | | |
| | | |
CUMULATIVE TOTAL RETURN PERFORMANCE
AMG Veritas Global Real Return Fund’s cumulative total return is based on the daily change in net asset value (NAV), and assumes that all dividends and distributions were reinvested. The graph compares a hypothetical $10,000 investment made in the AMG Veritas Global Real Return Fund’s Class I shares on September 30, 2012, to a $10,000 investment made in the Bloomberg U.S. Treasury Inflation-Linked Bond Index for the same time period. The graph and table do not reflect the deduction of taxes that a shareholder would pay on a Fund distribution or redemption of shares. The listed returns for the Fund are net of expenses and the returns for the index exclude expenses.
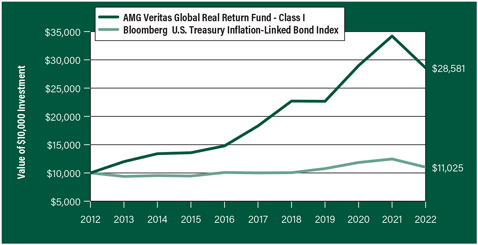
The table below shows the average annual total returns for the AMG Veritas Global Real Return Fund and the Bloomberg U.S. Treasury Inflation-Linked Bond Index for the same time periods ended September 30, 2022.
| | | | | | |
| | | One | | Five | | Ten |
| Average Annual Total Returns1 | | Year | | Years | | Years |
|
AMG Veritas Global Real Return Fund2, 3, 4, 5, 6, 7, 8, 9, 10, 11, 12, 13, 14, 15, 16, 17, 18, 19 |
| | | |
Class I | | (17.69%) | | 9.30% | | 11.07% |
| | | |
Bloomberg U.S. Treasury Inflation-Linked Bond Index20 | | (11.57%) | | 1.95% | | 0.98% |
The performance data shown represents past performance. Past performance is not a guarantee of future results. Current performance may be lower or higher than the performance data quoted. The investment return and principal value of an investment will fluctuate so that an investor’s shares, when redeemed, may be worth more or less than their original cost.
Investors should carefully consider the Fund’s investment objectives, risks, charges and expenses before investing. For performance information through the most recent month end, current net asset values per share for the Fund and other information, please call 800.548.4539 or visit our website at amgfunds.com for a free prospectus. Read it carefully before investing or sending money.
Distributed by AMG Distributors, Inc., member FINRA/SIPC.
| 1 | Total return equals income yield plus share price change and assumes reinvestment of all dividends and capital gain distributions. Returns are net of fees and may reflect offsets of Fund expenses as described in the prospectus. No adjustment has been made for taxes payable by shareholders on their reinvested dividends and capital gain distributions. Returns for periods greater than one year are annualized. The listed returns on the Fund are net of expenses and based on the published NAV as of September 30, 2022. All returns are in U.S. Dollars ($). |
| 2 | As of March 19, 2021, the Fund’s subadviser was changed to Veritas Asset Management LLP. Prior to March 19, 2021, the Fund was known as AMG Managers Brandywine Blue Fund, and had different principal investment strategies and corresponding risks. Performance shown for periods prior to March 19, 2021, reflects the performance and investment strategies of the Fund’s previous subadvisers, Friess Associates, LLC and Friess Associates of Delaware, LLC. The Fund’s past performance would have been different if the Fund were managed |
|
by the current subadviser and strategy, and the Fund’s prior performance record might be less pertinent for investors considering whether to purchase shares of the fund. 3 Active and frequent trading of a fund may result in higher transaction costs and increased tax liability. 4 A greater percentage of the Fund’s holdings may be focused in a smaller number of securities which may place the Fund at greater risk than a more diversified fund. 5 Investments in international securities are subject to certain risks of overseas investing including currency fluctuations and changes in political and economic conditions, which could result in significant market fluctuations. These risks are magnified in emerging markets. 6 The Fund is subject to currency risk resulting from fluctuations in exchange rates that may affect the total loss or gain on a non-U.S. Dollar investment when converted back to U.S. Dollars. 7 Market prices of investments held by the Fund may fall rapidly or unpredictably due to a variety of economic or political factors, market conditions, disasters or public health issues, or in response to events that affect particular industries or companies. 8 The issuers of bonds or other debt securities or a counterparty to a derivatives contract may be unable or unwilling to make interest, principal or settlement payments. 9 When the Fund has a significant cash balance for a sustained period, the benefit to the Fund of any market upswing may likely be reduced, and the Fund’s performance may be adversely affected. 10 Changes in the general political and social environment of a country can have substantial effects on the value of investments exposed to that country. 11 The Fund may invest in derivatives such as options and futures; the complexity and rapidly changing structure of derivatives markets may increase the possibility of market losses. 12 The Fund may not be able to value its investments in a manner that accurately reflects their market values, and the Fund may not be able to sell an investment at a price equal to the valuation ascribed to that investment by the Fund. |
7
| | |
| | | AMG Veritas Global Real Return Fund Portfolio Manager’s Comments (continued) |
| | | |
| | | |
| | | | | | | | |
13 The Fund is subject to the risks associated with investments in emerging markets, such as erratic earnings patterns, economic and political instability, changing exchange controls, limitations on repatriation of foreign capital and changes in local governmental attitudes toward private investment, possibly leading to nationalization or confiscation of investor assets. 14 Because exchange-traded funds (ETFs) incur their own costs, investing in them could result in a higher cost to the investor. Additionally, the fund will be indirectly exposed to all the risks of securities held by the ETFs. 15 The use of leverage in a Fund’s strategy, such as futures and forward commitment transactions, can magnify relatively small market movements into relatively larger losses for the Fund. 16 The Fund may not be able to dispose of particular investments, such as illiquid securities, readily at | | | | favorable times or prices or the Fund may have to sell them at a loss. 17 The Fund is subject to risks associated with investments in mid-capitalization companies such as greater price volatility, lower trading volume, and less liquidity than the stocks of larger, more established companies. 18 The Fund is subject to risks associated with investments in small-capitalization companies, such as erratic earnings patterns, competitive conditions, limited earnings history and a reliance on one or a limited number of products. 19 The Fund invests in value stocks, which may perform differently from the market as a whole and may be undervalued by the market for a long period of time. 20 The Bloomberg U.S. Treasury Inflation-Linked Bond Index measures the performance of the U.S. Treasury Inflation Protected Securities (TIPS) | | | | market. Unlike the Fund, the Bloomberg U.S. Treasury Inflation-Linked Bond Index is unmanaged, is not available for investment and does not incur expenses. “Bloomberg®” and Bloomberg U.S. Treasury Inflation-Linked Bond Index are service marks of Bloomberg Finance L.P. and its affiliates, including Bloomberg Index Services Limited (“BISL”), the administrator of the index (collectively, “Bloomberg”) and have been licensed for use for certain purposes by AMG Funds LLC. Bloomberg is not affiliated with AMG Funds LLC, and Bloomberg does not approve, endorse, review, or recommend the AMG Veritas Global Real Return Fund. Bloomberg does not guarantee the timeliness, accurateness, or completeness of any data or information relating to the AMG Veritas Global Real Return Fund Not FDIC insured, nor bank guaranteed. May lose value. |
8
| | |
| | | AMG Veritas Global Real Return Fund Fund Snapshots (unaudited) September 30, 2022 |
| | | |
| | | |
PORTFOLIO BREAKDOWN
| | |
| Sector | | %of
Net Assets |
| | |
| Health Care | | 29.4 |
| | |
| Industrials | | 20.0 |
| | |
| Communication Services | | 13.2 |
| | |
| Information Technology | | 12.9 |
| | |
| Consumer Staples | | 4.7 |
| | |
| Consumer Discretionary | | 4.6 |
| | |
| Financials | | 4.1 |
| | |
| Materials | | 2.7 |
| | |
| Short-Term Investments1 | | 10.1 |
| | |
| Other Assets, Less Liabilities2, 3 | | (1.7) |
| 1 | Includes reinvestment of cash collateral into joint repurchase agreements on security lending transactions. |
| 2 | Includes cash deposits with futures broker and net unrealized appreciation on futures contracts. |
| 3 | Includes repayment of cash collateral on security lending transactions. |
TOP TEN HOLDINGS
| | |
| Security Name | | %of
Net Assets |
| | |
Alphabet, Inc., Class A (United States) | | 5.6 |
| | |
Canadian Pacific Railway, Ltd. (Canada) | | 5.3 |
| | |
Fiserv, Inc. (United States) | | 4.7 |
| | |
Unilever PLC (United Kingdom) | | 4.7 |
| | |
Amazon.com, Inc. (United States) | | 4.6 |
| | |
Charter Communications, Inc., Class A (United States) | | 4.3 |
| | |
Microsoft Corp. (United States) | | 4.2 |
| | |
Vinci, S.A. (France) | | 4.1 |
| | |
BAE Systems PLC (United Kingdom) | | 4.1 |
| | |
Mastercard, Inc., Class A (United States) | | 4.0 |
| | |
| | |
Top Ten as a Group | | 45.6 |
| | |
Because a fund’s strategy may result in multiple investments in particular sectors of the economy, its performance may depend on the performance of those sectors and may fluctuate more widely than investments diversified across more sectors. For additional information on these and other risk considerations, please see the Fund’s prospectus.
Any sectors, industries, or securities discussed should not be perceived as investment recommendations. Mention of a specific security should not be considered a recommendation to buy or solicitation to sell that security. Specific securities mentioned in this report may have been sold from the Fund’s portfolio of investments by the time you receive this report.
9
| | |
| | | AMG Veritas Global Real Return Fund Schedule of Portfolio Investments September 30, 2022 |
| | | |
| | | |
| | | | | | | | |
| | | Shares | | | Value | |
Common Stocks - 91.6% | | | | | | | | |
| | |
Communication Services - 13.2% | | | | | | | | |
| | |
Alphabet, Inc., Class A (United States)* | | | 65,400 | | | | $6,255,510 | |
| | |
Charter Communications, Inc., Class A (United States)* | | | 15,764 | | | | 4,782,010 | |
| | |
Meta Platforms, Inc., Class A
(United States)* | | | 26,977 | | | | 3,660,239 | |
| | |
Total Communication Services | | | | | | | 14,697,759 | |
| | |
Consumer Discretionary - 4.6% | | | | | | | | |
| | |
Amazon.com, Inc. (United States)* | | | 45,336 | | | | 5,122,968 | |
| | |
Consumer Staples - 4.7% | | | | | | | | |
| | |
Unilever PLC (United Kingdom) | | | 119,283 | | | | 5,250,400 | |
| | |
Financials - 4.1% | | | | | | | | |
| | |
Intercontinental Exchange, Inc.
(United States) | | | 26,608 | | | | 2,404,033 | |
| | |
Moody’s Corp. (United States) | | | 9,153 | | | | 2,225,186 | |
| | |
Total Financials | | | | | | | 4,629,219 | |
| | |
Health Care - 29.4% | | | | | | | | |
| | |
Baxter International, Inc.
(United States) | | | 52,754 | | | | 2,841,330 | |
| | |
Becton Dickinson and Co.
(United States) | | | 15,539 | | | | 3,462,555 | |
| | |
Bio-Rad Laboratories, Inc., Class A (United States)* | | | 6,600 | | | | 2,753,124 | |
| | |
Catalent, Inc. (United States)* | | | 50,719 | | | | 3,670,027 | |
| | |
The Cooper Cos, Inc. (United States) | | | 11,801 | | | | 3,114,284 | |
| | |
CVS Health Corp. (United States) | | | 40,100 | | | | 3,824,337 | |
| | |
Embecta Corp. (United States) | | | 3,847 | | | | 110,755 | |
| | |
Illumina, Inc. (United States)* | | | 11,199 | | | | 2,136,657 | |
| | |
Sonic Healthcare, Ltd. (Australia) | | | 160,566 | | | | 3,131,873 | |
| | |
Thermo Fisher Scientific, Inc.
(United States) | | | 7,216 | | | | 3,659,883 | |
| | |
UnitedHealth Group, Inc.
(United States) | | | 8,213 | | | | 4,147,894 | |
| | |
Total Health Care | | | | | | | 32,852,719 | |
| | |
Industrials - 20.0% | | | | | | | | |
| | |
Aena SME SA (Spain)*,1 | | | 27,546 | | | | 2,858,714 | |
| | |
BAE Systems PLC (United Kingdom) | | | 519,506 | | | | 4,564,600 | |
| | |
Canadian Pacific Railway, Ltd. (Canada)2 | | | 88,402 | | | | 5,898,181 | |
| | |
Safran SA (France) | | | 48,527 | | | | 4,415,460 | |
| | |
Vinci, S.A. (France) | | | 56,773 | | | | 4,590,709 | |
| | |
Total Industrials | | | | | | | 22,327,664 | |
| | |
Information Technology - 12.9% | | | | | | | | |
| | |
Fiserv, Inc. (United States)* | | | 56,621 | | | | 5,298,027 | |
| | |
Mastercard, Inc., Class A
(United States) | | | 15,548 | | | | 4,420,918 | |
| | |
Microsoft Corp. (United States) | | | 19,974 | | | | 4,651,945 | |
| | |
Total Information Technology | | | | | | | 14,370,890 | |
| | |
| | | | | | | | |
| | | | | | | | |
| | | Shares | | | Value | |
| | |
Materials - 2.7% | | | | | | | | |
| | |
Franco-Nevada Corp. (Canada) | | | 25,586 | | | | $3,057,015 | |
| | |
Total Common Stocks
(Cost $128,063,411) | | | | | | | 102,308,634 | |
| | |
| | | Principal
Amount | | | | |
Short-Term Investments - 10.1% | | | | | | | | |
| |
Joint Repurchase Agreements - 5.5%3 | | | | | |
| | |
Amherst Pierpont Securities LLC, dated 09/30/22, due 10/03/22, 3.140% total to be received $1,456,712 (collateralized by various U.S. Government Agency Obligations, 0.000% - 5.000%, 03/31/23 - 11/20/69, totaling $1,485,458) | | | $1,456,331 | | | | 1,456,331 | |
| | |
BNP Paribas SA, dated 09/30/22, due 10/03/22, 2.940% total to be received $306,672 (collateralized by various U.S. Treasuries, 0.000% - 6.125%, 09/15/23 - 05/15/52, totaling $312,729) | | | 306,597 | | | | 306,597 | |
| | |
Mirae Asset Securities USA, Inc., dated 09/30/22, due 10/03/22, 3.180% total to be received $1,456,717 (collateralized by various U.S. Government Agency Obligations, 0.400% - 7.500%, 10/15/23 - 05/15/61, totaling $1,485,851) | | | 1,456,331 | | | | 1,456,331 | |
| | |
MUFG Securities America, Inc., dated 09/30/22, due 10/03/22, 3.050% total to be received $1,456,701 (collateralized by various U.S. Government Agency Obligations, 2.000% - 5.000%, 09/01/28 - 09/01/52, totaling $1,485,458) | | | 1,456,331 | | | | 1,456,331 | |
| | |
RBC Dominion Securities, Inc., dated 09/30/22, due 10/03/22, 3.040% total to be received $1,456,700 (collateralized by various U.S. Government Agency Obligations and U.S. Treasuries, 0.000% - 6.000%, 08/15/25 - 08/20/52, totaling $1,485,458) | | | 1,456,331 | | | | 1,456,331 | |
| | |
Total Joint Repurchase Agreements | | | | | | | 6,131,921 | |
| | |
| | | Shares | | | | |
| |
Other Investment Companies - 4.6% | | | | | |
| | |
Dreyfus Government Cash Management Fund, Institutional Shares, 2.75%4 | | | 3,365,452 | | | | 3,365,452 | |
| | |
JPMorgan U.S. Government Money Market Fund, IM Shares, 2.75%4 | | | 1,774,849 | | | | 1,774,849 | |
| | |
Total Other Investment Companies | | | | | | | 5,140,301 | |
| | |
Total Short-Term Investments
(Cost $11,272,222) | | | | | | | 11,272,222 | |
| | |
Total Investments - 101.7%
(Cost $139,335,633) | | | | | | | 113,580,856 | |
| | |
Derivatives - 4.2%5 | | | | | | | 4,733,009 | |
| | |
| | | | | | | | |
The accompanying notes are an integral part of these financial statements.
10
| | |
| | | AMG Veritas Global Real Return Fund Schedule of Portfolio Investments (continued) |
| | | |
| | | |
| | | | | | | | |
| | | | | | Value | |
| | |
Other Assets, less Liabilities - (5.9)% | | | | | | | $(6,637,256 | ) |
| | |
Net Assets - 100.0% | | | | | | | $111,676,609 | |
| | |
| | | | | | | | |
| * | Non-income producing security. |
| 1 | Security exempt from registration under Rule 144A of the Securities Act of 1933. This security may be resold in transactions exempt from registration, normally to qualified institutional buyers. At September 30, 2022, the value of this security amounted to $2,858,714 or 2.6% of net assets. |
| 2 | Some of this security, amounting to $5,839,134 or 5.2% of net assets, was out on loan to various borrowers and is collateralized by cash. See Note 4 of Notes to Financial Statements. |
| 3 | Cash collateral received for securities lending activity was invested in these joint repurchase agreements. |
| 4 | Yield shown represents the September 30, 2022, seven day average yield, which refers to the sum of the previous seven days’ dividends paid, expressed as an annual percentage. |
| 5 | Includes Futures Contracts. Please refer to the Futures Contracts table for the details. |
| | | | | | | | | | | | | | | | | | | | | | | | |
Open Futures Contracts | | | | | | | | | | | | | | | | | | | | | | | | |
| Description | | Currency | | | Number of
Contracts | | | Position | | | Expiration
Date | | | Current
Notional
Amount | | | Value and
Unrealized
Gain/(Loss) | |
| | | | | | |
EURO STOXX 50 | | | EUR | | | | 530 | | | | Short | | | | 12/16/22 | | | $ | (17,218,988 | ) | | | $1,483,737 | |
| | | | | | |
S&P 500 E-Mini Index | | | USD | | | | 123 | | | | Short | | | | 12/16/22 | | | | (22,149,225 | ) | | | 3,249,272 | |
| | | | | | | | | | | | | | | | | | | | | | | | |
| | | | | | |
| | | | | | | | | | | | | | | | | | | Total | | | | $4,733,009 | |
| | | | | | | | | | | | | | | | | | | | | | | | |
CURRENCY ABBREVIATIONS:
| | |
| EUR Euro Dollar |
|
| USD U.S. Dollar |
The following table summarizes the inputs used to value the Fund’s investments by the fair value hierarchy levels as of September 30, 2022:
| | | | | | | | | | | | | | | | |
| | | Level 1 | | | Level 21 | | | Level 3 | | | Total | |
Investments in Securities | | | | | | | | | | | | | | | | |
| | | | |
Common Stocks | | | | | | | | | | | | | | | | |
Health Care | | | $29,720,846 | | | | $3,131,873 | | | | — | | | | $32,852,719 | |
| | | | |
Industrials | | | 5,898,181 | | | | 16,429,483 | | | | — | | | | 22,327,664 | |
| | | | |
Communication Services | | | 14,697,759 | | | | — | | | | — | | | | 14,697,759 | |
| | | | |
Information Technology | | | 14,370,890 | | | | — | | | | — | | | | 14,370,890 | |
| | | | |
Consumer Staples | | | — | | | | 5,250,400 | | | | — | | | | 5,250,400 | |
| | | | |
Consumer Discretionary | | | 5,122,968 | | | | — | | | | — | | | | 5,122,968 | |
| | | | |
Financials | | | 4,629,219 | | | | — | | | | — | | | | 4,629,219 | |
| | | | |
Materials | | | 3,057,015 | | | | — | | | | — | | | | 3,057,015 | |
| | | | |
Short-Term Investments | | | | | | | | | | | | | | | | |
Joint Repurchase Agreements | | | — | | | | 6,131,921 | | | | — | | | | 6,131,921 | |
| | | | |
Other Investment Companies | | | 5,140,301 | | | | — | | | | — | | | | 5,140,301 | |
| | | | | | | | | | | | | | | | |
| | | | |
Total Investments in Securities | | | $82,637,179 | | | | $30,943,677 | | | | — | | | | $113,580,856 | |
| | | | | | | | | | | | | | | | |
| | | | |
Financial Derivative Instruments - Assets | | | | | | | | | | | | | | | | |
| | | | |
Equity Futures Contracts | | | $4,733,009 | | | | — | | | | — | | | | $4,733,009 | |
| | | | | | | | | | | | | | | | |
| | | | |
Total Financial Derivative Instruments | | | $4,733,009 | | | | — | | | | — | | | | $4,733,009 | |
| | | | | | | | | | | | | | | | |
| 1 | An external pricing service is used to reflect any impact on security value due to market movements between the time the Fund valued such foreign securities and the earlier closing of foreign markets. |
The accompanying notes are an integral part of these financial statements.
11
| | |
| | | AMG Veritas Global Real Return Fund Schedule of Portfolio Investments (continued) |
| | | |
| | | |
For the fiscal year ended September 30, 2022, there were no transfers in or out of Level 3.
The following schedule shows the value of derivative instruments at September 30, 2022:
| | | | | | | | | | |
| | | Asset Derivatives | | | Liability Derivatives |
Derivatives not accounted for as hedging instruments | | Statement of Assets and Liabilities Location | | | Fair Value | | | Statement of Assets and
Liabilities Location | | Fair Value |
| | | | |
Equity contracts | | Total equity of futures contracts1 | | | $4,786,300 | | | — | | — |
For the fiscal year ended September 30, 2022, the effect of derivative instruments on the Statement of Operations for the Fund and the amount of realized gain/loss and unrealized appreciation/depreciation on derivatives recognized in income was as follows:
| | | | | | | | | | |
| | | Realized Gain/(Loss) | | Change in Unrealized Appreciation/Depreciation | |
Derivatives not accounted for as hedging instruments | | Statement of Operations Location | | Realized Gain/(Loss) | | Statement of Operations Location | |
| Change in
Unrealized
Appreciation/
Depreciation |
|
Equity contracts | | Net realized gain on futures contracts | | $3,942,476 | | Net change in unrealized appreciation/ depreciation on futures contracts | | | $1,850,044 | |
1 Amount represents cash with futures broker and unrealized appreciation/depreciation on open futures contracts. See Note 9 for additional information.
The country allocation in the Schedule of Portfolio Investments at September 30, 2022, was as follows:
| | |
| Country | | % of Long-Term
Investments |
| |
Australia | | 3.1 |
| |
Canada | | 8.7 |
| |
France | | 8.8 |
| |
Spain | | 2.8 |
| |
United Kingdom | | 9.6 |
| |
United States | | 67.0 |
| | |
| |
| | 100.0 |
| | |
The accompanying notes are an integral part of these financial statements.
12
| | |
| | | Statement of Assets and Liabilities September 30, 2022 |
| | | |
| | | |
| | | | |
| | | AMG
Veritas Global
Real Return
Fund | |
| |
Assets: | | | | |
| |
Investments at value1 (including securities on loan valued at $5,839,134) | | | $113,580,856 | |
| |
Total equity of futures contracts (see Note 9) | | | 4,786,300 | |
| |
Dividend and interest receivables | | | 73,933 | |
| |
Securities lending income receivable | | | 246 | |
| |
Receivable for Fund shares sold | | | 33,018 | |
| |
Receivable from affiliate | | | 3,004 | |
| |
Prepaid expenses and other assets | | | 8,355 | |
| |
Total assets | | | 118,485,712 | |
| |
Liabilities: | | | | |
| |
Payable upon return of securities loaned | | | 6,131,921 | |
| |
Payable for Fund shares repurchased | | | 496,404 | |
| |
Accrued expenses: | | | | |
| |
Investment advisory and management fees | | | 86,154 | |
| |
Administrative fees | | | 14,685 | |
| |
Shareholder service fees | | | 4,210 | |
| |
Other | | | 75,729 | |
| |
Total liabilities | | | 6,809,103 | |
| | | | |
| |
Net Assets | | | $111,676,609 | |
| |
1 Investments at cost | | | $139,335,633 | |
| |
Net Assets Represent: | | | | |
| |
Paid-in capital | | | $127,982,783 | |
| |
Total distributable loss | | | (16,306,174 | ) |
| |
Net Assets | | | $111,676,609 | |
| |
Class I: | | | | |
| |
Net Assets | | | $111,676,609 | |
| |
Shares outstanding | | | 3,266,749 | |
| |
Net asset value, offering and redemption price per share | | | $34.19 | |
The accompanying notes are an integral part of these financial statements.
13
| | |
| | | Statement of Operations For the fiscal year ended September 30, 2022 |
| | | |
| | | |
| | | | |
| | | AMG
Veritas Global
Real Return
Fund | |
| |
Investment Income: | | | | |
| |
Dividend income | | | $1,442,874 | |
| |
Interest income | | | 824 | |
| |
Securities lending income | | | 8,846 | |
| |
Foreign withholding tax | | | (54,083 | ) |
| |
Total investment income | | | 1,398,461 | |
| |
Expenses: | | | | |
| |
Investment advisory and management fees | | | 1,250,112 | |
| |
Administrative fees | | | 213,087 | |
| |
Shareholder servicing fees - Class I | | | 61,085 | |
| |
Professional fees | | | 44,794 | |
| |
Custodian fees | | | 40,878 | |
| |
Registration fees | | | 26,264 | |
| |
Reports to shareholders | | | 19,244 | |
| |
Transfer agent fees | | | 10,422 | |
| |
Trustee fees and expenses | | | 9,477 | |
| |
Interest expense | | | 813 | |
| |
Miscellaneous | | | 5,994 | |
| |
Total expenses before offsets | | | 1,682,170 | |
| |
Expense reimbursements | | | (43,426 | ) |
| |
Total expenses | | | 1,638,744 | |
| | | | |
| |
Net investment loss | | | (240,283 | ) |
| |
Net Realized and Unrealized Loss: | | | | |
| |
Net realized gain on investments | | | 4,665,956 | |
| |
Net realized gain on futures contracts | | | 3,942,476 | |
| |
Net realized loss on foreign currency transactions | | | (1,594 | ) |
| |
Net change in unrealized appreciation/depreciation on investments | | | (35,813,769 | ) |
| |
Net change in unrealized appreciation/depreciation on futures contracts | | | 1,850,044 | |
| |
Net change in unrealized appreciation/depreciation on foreign currency translations | | | (2,541 | ) |
| |
Net realized and unrealized loss | | | (25,359,428 | ) |
| | | | |
| |
Net decrease in net assets resulting from operations | | | $(25,599,711) | |
The accompanying notes are an integral part of these financial statements.
14
| | |
| | | Statements of Changes in Net Assets For the fiscal years ended September 30, |
| | | |
| | | |
| | | | | | | | |
| | | AMG
Veritas Global
Real Return
Fund | |
| | | 2022 | | | 2021 | |
| | |
Increase (Decrease) in Net Assets Resulting From Operations: | | | | | | | | |
| | |
Net investment loss | | | $(240,283) | | | | $(810,456) | |
| | |
Net realized gain on investments | | | 8,606,838 | | | | 54,134,715 | |
| | |
Net change in unrealized appreciation/depreciation on investments | | | (33,966,266 | ) | | | (18,397,172 | ) |
| | |
Net increase (decrease) in net assets resulting from operations | | | (25,599,711 | ) | | | 34,927,087 | |
| | |
Distributions to Shareholders: | | | | | | | | |
| | |
From net investment income and/or realized gain on investments: | | | | | | | | |
| | |
Class I | | | — | | | | (92,131,621 | ) |
| | |
From paid-in capital: | | | | | | | | |
| | |
Class I | | | — | | | | (473,544 | ) |
| | |
Total distributions to shareholders | | | — | | | | (92,605,165 | ) |
| | |
Capital Share Transactions:1 | | | | | | | | |
| | |
Net increase (decrease) from capital share transactions | | | (26,929,221 | ) | | | 27,236,253 | |
| | | | | | | | |
| | |
Total decrease in net assets | | | (52,528,932 | ) | | | (30,441,825 | ) |
| | |
Net Assets: | | | | | | | | |
| | |
Beginning of year | | | 164,205,541 | | | | 194,647,366 | |
| | |
End of year | | | $111,676,609 | | | | $164,205,541 | |
1 See Note 1(g) of the Notes to Financial Statements.
The accompanying notes are an integral part of these financial statements.
15
| | |
| | | AMG Veritas Global Real Return Fund Financial Highlights For a share outstanding throughout each fiscal year |
| | | |
| | | |
| | | | | | | | | | | | | | | | | | | | | | | | | |
| Class I | | For the fiscal years ended September 30, |
| | 2022 | | 2021 | | 2020 | | 2019 | | 2018 |
| | | | | |
Net Asset Value, Beginning of Year | | | | $41.54 | | | | | $55.88 | | | | | $49.78 | | | | | $56.64 | | | | | $45.69 | |
| | | | | |
Income (loss) from Investment Operations: | | | | | | | | | | | | | | | | | | | | | | | | | |
| | | | | |
Net investment loss1 | | | | (0.07 | )2 | | | | (0.20 | )2 | | | | (0.22 | ) | | | | (0.10 | ) | | | | (0.24 | ) |
| | | | | |
Net realized and unrealized gain (loss) on investments | | | | (7.28 | ) | | | | 9.99 | | | | | 12.84 | | | | | (1.40 | ) | | | | 11.19 | |
| | | | | |
Total income (loss) from investment operations | | | | (7.35 | ) | | | | 9.79 | | | | | 12.62 | | | | | (1.50 | ) | | | | 10.95 | |
| | | | | |
Less Distributions to Shareholders from: | | | | | | | | | | | | | | | | | | | | | | | | | |
| | | | | |
Net realized gain on investments | | | | — | | | | | (24.01 | ) | | | | (6.52 | ) | | | | (5.36 | ) | | | | — | |
| | | | | |
Paid in capital | | | | — | | | | | (0.12 | ) | | | | — | | | | | — | | | | | — | |
| | | | | |
Total distributions to shareholders | | | | — | | | | | (24.13 | ) | | | | (6.52 | ) | | | | (5.36 | ) | | | | — | |
| | | | | |
Net Asset Value, End of Year | | | | $34.19 | | | | | $41.54 | | | | | $55.88 | | | | | $49.78 | | | | | $56.64 | |
| | | | | |
Total Return3 | | | | (17.69 | )%2 | | | | 19.79 | %2,4 | | | | 27.84 | % | | | | (0.17 | )% | | | | 23.97 | % |
| | | | | |
Ratio of expenses to average net assets | | | | 1.15 | % | | | | 1.15 | % | | | | 1.17 | % | | | | 1.15 | % | | | | 1.16 | % |
| | | | | |
Ratio of gross expenses to average net assets | | | | 1.18 | %5 | | | | 1.16 | %5 | | | | 1.17 | % | | | | 1.15 | % | | | | 1.16 | % |
| | | | | |
Ratio of net investment loss to average net assets | | | | (0.17 | )%2 | | | | (0.42 | )%2 | | | | (0.46 | )% | | | | (0.20 | )% | | | | (0.47 | )% |
| | | | | |
Portfolio turnover | | | | 22 | % | | | | 235 | % | | | | 215 | % | | | | 135 | % | | | | 122 | % |
| | | | | |
Net assets end of year (000’s) omitted | | | | $111,677 | | | | | $164,206 | | | | | $194,647 | | | | | $182,244 | | | | | $197,000 | |
| 1 | Per share numbers have been calculated using average shares. |
| 2 | Total returns and net investment income (loss) would have been lower had certain expenses not been offset. |
| 3 | The total return is calculated using the published Net Asset Value as of fiscal year end. |
| 4 | Includes a non-recurring securities litigation gain. Had the Fund not received the payment total return would have been 19.18%. |
| 5 | Excludes the impact of expense reimbursement or fee waivers and expense reductions such as brokerage credits, but includes expense repayments and non-reimbursable expenses, if any, such as interest, taxes, and extraordinary expenses. (See Note 1(c) and 2 in the Notes to Financial Statements.) |
16
| | |
| | | Notes to Financial Statements September 30, 2022 |
| | | |
| | | |
1. ORGANIZATION AND SUMMARY OF SIGNIFICANT ACCOUNTING POLICIES
AMG Funds I (the “Trust”) is an open-end management investment company, organized as a Massachusetts business trust, and registered under the Investment Company Act of 1940, as amended (the “1940 Act”). Currently, the Trust consists of a number of different funds, each having distinct investment management objectives, strategies, risks, and policies. Included in this report is AMG Veritas Global Real Return Fund (the “Fund”).
A significant portion of the Fund’s holdings may be focused in a relatively small number of securities, which may make the Fund more volatile and subject to greater risk than a more diversified fund.
Market disruptions associated with the COVID-19 pandemic have had a global impact, and uncertainty exists as to the long-term implications. Such disruptions can adversely affect assets of the Fund and thus Fund performance.
The Fund’s financial statements are prepared in accordance with accounting principles generally accepted in the United States of America (“U.S. GAAP”), including accounting and reporting guidance pursuant to Accounting Standards Codification Topic 946 applicable to investment companies. U.S. GAAP requires management to make estimates and assumptions that affect the reported amounts of assets and liabilities and disclosure of contingent assets and liabilities at the date of the financial statements and the reported amounts of income and expenses during the reporting period. Actual results could differ from those estimates and such differences could be material. The following is a summary of significant accounting policies followed by the Fund in the preparation of its financial statements:
a. VALUATION OF INVESTMENTS
Equity securities traded on a national securities exchange or reported on the NASDAQ national market system (“NMS”) are valued at the last quoted sales price on the primary exchange or, if applicable, the NASDAQ official closing price or the official closing price of the relevant exchange or, lacking any sales, at the last quoted bid price. Equity securities held by the Fund that are traded in the over-the-counter market (other than NMS securities) are valued at the bid price. Foreign equity securities (securities principally traded in markets other than U.S. markets) held by the Fund are valued at the official closing price on the primary exchange or, for markets that either do not offer an official closing price or where the official closing price may not be representative of the overall market, the last quoted sale price.
Fixed income securities purchased with a remaining maturity of 60 days or less are valued at amortized cost, provided that the amortized cost value is approximately the same as the fair value of the security valued without the use of amortized cost. Investments in other open-end registered investment companies are valued at their end of day net asset value per share.
Futures contracts for which market quotations are readily available are valued at the settlement price as of the close of the futures exchange.
The Fund’s portfolio investments are generally valued based on independent market quotations or prices or, if none, “evaluative” or other market based valuations provided by third party pricing services approved by the Board of Trustees of the Trust (the “Board”). Under certain circumstances, the value of certain Fund portfolio investments may be based on an evaluation of fair value, pursuant to procedures established by and under the general supervision of the
Board. The Valuation Committee, which is comprised of the Independent Trustees of the Board, and the Pricing Committee, which is comprised of representatives from AMG Funds LLC (the “Investment Manager”) are the committees appointed by the Board to make fair value determinations. The Fund may use the fair value of a portfolio investment to calculate its net asset value (“NAV”) in the event that the market quotation, price or market based valuation for the portfolio investment is not readily available or otherwise not determinable pursuant to the Board’s valuation procedures, if the Investment Manager or the Pricing Committee believes the quotation, price or market based valuation to be unreliable, or in certain other circumstances. When determining the fair value of an investment, the Pricing Committee and, if required under the Trust’s securities valuation procedures, the Valuation Committee, seeks to determine the price that the Fund might reasonably expect to receive from current sale of that portfolio investment in an arms-length transaction. Fair value determinations shall be based upon consideration of all available facts and information, including, but not limited to (i) attributes specific to the investment; (ii) fundamental and analytical data relating to the investment; and (iii) the value of other comparable securities or relevant financial instruments, including derivative securities, traded on other markets or among dealers.
The values assigned to fair value portfolio investments are based on available information and do not necessarily represent amounts that might ultimately be realized in the future, since such amounts depend on future developments inherent in long-term investments. Because of the inherent uncertainty of valuation, those estimated values may differ significantly from the values that would have been used had a ready market for the investments existed, and the differences could be material. The Board will be presented with a quarterly report showing as of the most recent quarter end, all outstanding securities fair valued by the Fund, including a comparison with the prior quarter end and the percentage of the Fund that the security represents at each quarter end.
With respect to foreign equity securities and certain foreign fixed income securities, the Board has adopted a policy that securities held in the Fund that can be fair valued by the applicable fair value pricing service are fair valued on each business day provided that each individual price exceeds a pre-established confidence level.
Effective September 8, 2022, the Fund adopted the requirements of Rule 2a-5 under the 1940 Act (“Rule 2a-5”), which the Fund’s Board designated the Fund’s Investment Manager as the Fund’s Valuation Designee to perform the Fund’s fair value determinations. Such determinations are subject to Board oversight and certain reporting and other requirements intended to ensure that the Board receives the information it needs to oversee the Investment Manager’s fair value determinations. The Fund’s adoption of Rule 2-a5 did not impact how the Fund determines fair value or the carrying amount of investments held in the Fund.
U.S. GAAP defines fair value as the price that a fund would receive to sell an asset or pay to transfer a liability in an orderly transaction between market participants at the measurement date. U.S. GAAP also establishes a framework for measuring fair value, and a three level hierarchy for fair value measurements based upon the transparency of inputs to the valuation of an asset or liability. Inputs may be observable or unobservable and refer broadly to the assumptions that market participants would use in pricing the asset or liability. Observable inputs reflect the assumptions market participants would use in pricing the asset or liability based on market data obtained from sources independent of the Fund.
Unobservable inputs reflect the Fund’s own assumptions about the assumptions that market participants would use in pricing the asset or liability developed based on the best information available in the circumstances. Each investment is
17
| | |
| | | Notes to Financial Statements (continued) |
| | | |
| | | |
assigned a level based upon the observability of the inputs which are significant to the overall valuation.
The three-tier hierarchy of inputs is summarized below:
Level 1 – inputs are quoted prices in active markets for identical investments (e.g., equity securities, open-end investment companies)
Level 2 – other observable inputs (including, but not limited to: quoted prices for similar assets or liabilities in markets that are active, quoted prices for identical or similar assets or liabilities in markets that are not active, inputs other than quoted prices that are observable for the assets or liabilities (such as interest rates, yield curves, volatilities, prepayment speeds, loss severities, credit risks and default rates) or other market corroborated inputs) (e.g., debt securities, government securities, foreign currency exchange contracts, foreign securities utilizing international fair value pricing, fair valued securities with observable inputs)
Level 3 – inputs are significant unobservable inputs (including the Fund’s own assumptions used to determine the fair value of investments) (e.g., fair valued securities with unobservable inputs)
Changes in inputs or methodologies used for valuing investments may result in a transfer in or out of levels within the fair value hierarchy. The inputs or methodologies used for valuing investments may not necessarily be an indication of the risk associated with investing in those investments.
b. SECURITY TRANSACTIONS
Security transactions are accounted for as of trade date. Realized gains and losses on securities sold are determined on the basis of identified cost.
c. INVESTMENT INCOME AND EXPENSES
Dividend income is recorded on the ex-dividend date. Dividends from foreign securities are recorded on the ex-dividend date, and if after the fact, as soon as the Fund becomes aware of the ex-dividend date. Interest income, which includes amortization of premium and accretion of discount on debt securities, is accrued as earned. Dividend and interest income on foreign securities is recorded gross of any withholding tax. Non-cash dividends included in dividend income, if any, are reported at the fair market value of the securities received. Other income and expenses are recorded on an accrual basis. Expenses that cannot be directly attributed to the Fund are apportioned among the funds in the Trust and other trusts or funds within the AMG Funds Family of Funds (collectively the “AMG Funds Family”) based upon their relative average net assets or number of shareholders.
d. DIVIDENDS AND DISTRIBUTIONS
Fund distributions resulting from either net investment income or realized net capital gains, if any, will normally be declared and paid at least annually in December. Distributions to shareholders are recorded on the ex-dividend date. Distributions are determined in accordance with federal income tax regulations, which may differ from net investment income and net realized capital gains for financial statement purposes (U.S. GAAP). Differences may be permanent or temporary. Permanent differences are reclassified among capital accounts in the financial statements to reflect their tax character. Permanent book and tax basis differences, if any, relating to shareholder distributions will result in reclassifications to paid-in capital. Temporary differences arise when certain items of income, expense and gain or loss are recognized in different periods for financial statement and tax purposes; these differences will reverse at some time
in the future. There were no permanent differences. Temporary differences are primarily due to wash sale loss deferrals and mark to market of futures.
The tax character of distributions paid during the fiscal years ended September 30, 2022 and September 30, 2021 were as follows:
| | | | | | | | |
| | |
Distributions paid from: | | 2022 | | | 2021 | |
| | |
Ordinary income * | | | — | | | $ | 69,482,282 | |
| | |
Long-term capital gains | | | — | | | | 22,649,339 | |
| | |
Paid-in capital | | | — | | | | 473,544 | |
| | | | | | | | |
| | |
| | | — | | | $ | 92,605,165 | |
| | | | | | | | |
| * | For tax purposes, short-term capital gain distributions, if any, are considered ordinary income distributions. |
As of September 30, 2022, the components of distributable earnings (excluding unrealized appreciation/depreciation) on a tax basis consisted of:
| | | | |
| |
Undistributed ordinary income | | $ | 2,289,053 | |
| |
Undistributed long-term capital gains | | | 7,388,767 | |
At September 30, 2022, the cost of investments and the aggregate gross unrealized appreciation and depreciation for federal income tax purposes were as follows:
| | | | | | | | | | | | |
| Cost | | Appreciation | | | Depreciation | | | Net Depreciation | |
| | | |
| $139,558,421 | | | $3,913,704 | | | | $(29,897,698 | ) | | | $(25,983,994 | ) |
e. FEDERAL TAXES
The Fund currently qualifies as an investment company and intends to comply with the requirements under Subchapter M of the Internal Revenue Code of 1986, as amended, and to distribute substantially all of its taxable income and gains to its shareholders and to meet certain diversification and income requirements with respect to investment companies. Therefore, no provision for federal income or excise tax is included in the accompanying financial statements.
Additionally, based on the Fund’s understanding of the tax rules and rates related to income, gains and transactions for the foreign jurisdictions in which it invests, the Fund will provide for foreign taxes, and where appropriate, deferred foreign taxes.
Management has analyzed the Fund’s tax positions taken on federal income tax returns as of September 30, 2022, and for all open tax years (generally, the three prior taxable years), and has concluded that no provision for federal income tax is required in the Fund’s financial statements. Additionally, Management is not aware of any tax position for which it is reasonably possible that the total amounts of unrecognized tax benefits will change materially in the next twelve months.
f. CAPITAL LOSS CARRYOVERS AND DEFERRALS
As of September 30, 2022, the Fund had no capital loss carryovers for federal income tax purposes. Should the Fund incur net capital losses for the fiscal year ended September 30, 2023, such amounts may be used to offset future realized capital gains indefinitely, and retain their character as short-term and/or long-term.
18
| | |
| | | Notes to Financial Statements (continued) |
| | | |
| | | |
g. CAPITALSTOCK
The Trust’s Declaration of Trust authorizes for the Fund the issuance of an unlimited number of shares of beneficial interest, without par value. The Fund records sales and repurchases of its capital stock on the trade date.
For the fiscal years ended September 30, 2022 and September 30, 2021, the capital stock transactions by class for the Fund were as follows:
| | | | | | | | | | | | | | | | |
| | | September 30, 2022 | | | September 30, 2021 | |
| | | | |
| | | Shares | | | Amount | | | Shares | | | Amount | |
| | | | |
Class I: | | | | | | | | | | | | | | | | |
| | | | |
Shares sold | | | 42,773 | | | | $1,644,922 | | | | 411,014 | | | | $21,389,777 | |
| | | | |
Shares issued in reinvestment of distributions | | | — | | | | — | | | | 1,900,323 | | | | 83,737,125 | |
| | | | |
Shares redeemed | | | (729,023) | | | | (28,574,143) | | | | (1,841,410) | | | | (77,890,649) | |
| | | | | | | | | | | | | | | | |
| | | | |
Net increase (decrease) | | | (686,250) | | | | $(26,929,221) | | | | 469,927 | | | | $27,236,253 | |
| | | | | | | | | | | | | | | | |
h. REPURCHASE AGREEMENTS AND JOINT REPURCHASE AGREEMENTS
The Fund may enter into third-party and bilateral repurchase agreements for temporary cash management purposes and third-party or bilateral joint repurchase agreements for reinvestment of cash collateral on securities lending transactions under the securities lending program offered by The Bank of New York Mellon (“BNYM”) (the “Program”) (collectively, “Repurchase Agreements”). The value of the underlying collateral, including accrued interest, must equal or exceed the value of the Repurchase Agreements during the term of the agreement. For joint repurchase agreements, the Fund participates on a pro rata basis with other clients of BNYM in its share of the underlying collateral under such joint repurchase agreements and in its share of proceeds from any repurchase or other disposition of the underlying collateral. The underlying collateral for all Repurchase Agreements is held in safekeeping by the Fund’s custodian or at the Federal Reserve Bank. If the seller defaults and the value of the collateral declines, or if bankruptcy proceedings commence with respect to the seller of the security, realization of the collateral by the Fund may be delayed or limited. Pursuant to the Program, the Fund is indemnified for such losses by BNYM on joint repurchase agreements.
At September 30, 2022, the market value of Repurchase Agreements outstanding was $6,131,921.
i. FOREIGN CURRENCY TRANSLATION
The books and records of the Fund are maintained in U.S. Dollars. The value of investments, assets and liabilities denominated in currencies other than U.S. Dollars are translated into U.S. Dollars based upon current foreign exchange rates. Purchases and sales of foreign investments, income and expenses are converted into U.S. Dollars based on currency exchange rates prevailing on the respective dates of such transactions. Net realized and unrealized gain (loss) on foreign currency transactions represent: (1) foreign exchange gains and losses from the sale and holdings of foreign currencies; (2) gains and losses between trade date and settlement date on investment securities transactions and foreign currency exchange contracts; and (3) gains and losses from the difference between amounts of interest and dividends recorded and the amounts actually received.
The Fund does not isolate the net realized and unrealized gain or loss resulting from changes in exchange rates from the fluctuations in market prices of securities held. Such fluctuations are included with the net realized and unrealized gain or loss on investments.
2. AGREEMENTS AND TRANSACTIONS WITH AFFILIATES
The Trust has entered into an investment advisory agreement under which the Investment Manager, a subsidiary and the U.S. retail distribution arm of Affiliated Managers Group, Inc. (“AMG”), serves as investment manager to the Fund and is responsible for the Fund’s overall administration and operations. The Investment Manager selects one or more subadvisers for the Fund (subject to Board approval) and monitors each subadviser’s investment performance, security holdings and investment strategies. The Fund’s investment portfolio is managed by Veritas Asset Management LLP (“Veritas”) who serves pursuant to a subadvisory agreement with the Investment Manager. AMG indirectly owns a majority interest in Veritas.
Investment management fees are paid directly by the Fund to the Investment Manager based on average daily net assets. For the fiscal year ended September 30, 2022, the Fund paid an investment management fee at the annual rate of 0.88% of the average daily net assets of the Fund. The fee paid to Veritas for its services as subadviser is paid out of the fee the Investment Manager receives from the Fund and does not increase the expenses of the Fund.
The Investment Manager has contractually agreed, through at least February 1, 2023, to waive management fees and/or pay or reimburse fund expenses in order to limit total annual Fund operating expenses after fee waiver and expense reimbursements (exclusive of taxes, interest (including interest incurred in connection with bank and custody overdrafts, and in connection with securities sold short), shareholder servicing fees, distribution and service (12b-1) fees, brokerage commissions and other transaction costs, dividends payable with respect to securities sold short, acquired fund fees and expenses and extraordinary expenses) of the Fund to the annual rate of 1.11% of the Fund’s average daily net assets (this annual rate or such other annual rate that may be in effect from time to time, the “Expense Cap”), subject to later reimbursement by the Fund in certain circumstances. Prior to May 24, 2021, the Fund did not have an expense limitation.
19
| | |
| | | Notes to Financial Statements (continued) |
| | | |
| | | |
In general, for a period of up to 36 months after the date any amounts are paid, waived or reimbursed by the Investment Manager, the Investment Manager may recover such amounts from the Fund, provided that such repayment would not cause the Fund’s total annual operating expenses after fee waiver and expense reimbursements (exclusive of the items noted in the parenthetical above) to exceed either (i) the Expense Cap in effect at the time such amounts were paid, waived or reimbursed, or (ii) the Expense Cap in effect at the time of such repayment by the Fund.
The contractual expense limitation may only be terminated in the event the Investment Manager or a successor ceases to be the investment manager of the Fund or a successor fund, by mutual agreement between the Investment Manager and the Board, or in the event of the Fund’s liquidation unless the Fund is reorganized or is a party to a merger in which the surviving entity is successor to the accounting and performance information of the Fund.
At September 30, 2022, the Fund’s expiration of reimbursements subject to recoupment is as follows:
| | | | |
Expiration Period | | | |
| |
1-2 years | | $ | 21,979 | |
| |
2-3 years | | | 43,426 | |
| | | | |
| |
Total | | $ | 65,405 | |
| | | | |
| | | | |
The Trust, on behalf of the Fund, has entered into an amended and restated Administration Agreement under which the Investment Manager serves as the Fund’s administrator (the “Administrator”) and is responsible for all non-portfolio management aspects of managing the Fund’s operations, including administration and shareholder services to the Fund. The Fund pays a fee to the Administrator at the rate of 0.15% per annum of the Fund’s average daily net assets for this service.
The Fund is distributed by AMG Distributors, Inc. (the “Distributor”), a wholly-owned subsidiary of the Investment Manager. The Distributor serves as the distributor and underwriter for the Fund and is a registered broker-dealer and member of the Financial Industry Regulatory Authority, Inc. (“FINRA”). Shares of the Fund will be continuously offered and will be sold directly to prospective purchasers and through brokers, dealers or other financial intermediaries who have executed selling agreements with the Distributor. Generally the Distributor bears all or a portion of the expenses of providing services pursuant to the distribution agreement, including the payment of the expenses relating to the distribution of prospectuses for sales purposes and any advertising or sales literature.
For Class I shares, the Board has approved reimbursement payments to the Investment Manager for shareholder servicing expenses (“shareholder servicing fees”) incurred. Shareholder servicing fees include payments to financial intermediaries, such as broker-dealers (including fund supermarket platforms), banks, and trust companies who provide shareholder recordkeeping, account servicing and other services. The Class I shares may reimburse the Investment Manager for the actual amount incurred up to a maximum annual rate of the Class’s average daily net assets as shown in the table below.
The impact on the annualized expense ratios for the fiscal year ended September 30, 2022, were as follows:
| | | | | | | | |
| | | Maximum Annual
Amount
Approved | | | Actual
Amount
Incurred | |
| | |
Class I | | | 0.15% | | | | 0.04% | |
The Board provides supervision of the affairs of the Trust and other trusts within the AMG Funds Family. The Trustees of the Trust who are not affiliated with the Investment Manager receive an annual retainer and per meeting fees for regular, special and telephonic meetings, and they are reimbursed for out-of-pocket expenses incurred while carrying out their duties as Board members. The Chairman of the Board and the Audit Committee Chair receive additional annual retainers. Certain Trustees and Officers of the Fund are Officers and/or Directors of the Investment Manager, AMG and/or the Distributor.
The Securities and Exchange Commission (the “SEC”) granted an exemptive order that permits certain eligible funds in the AMG Funds Family to lend and borrow money for certain temporary purposes directly to and from other eligible funds in the AMG Funds Family. Participation in this interfund lending program is voluntary for both the borrowing and lending funds, and an interfund loan is only made if it benefits each participating fund. The Administrator manages the program according to procedures approved by the Board, and the Board monitors the operation of the program. An interfund loan must comply with certain conditions set out in the exemptive order, which are designed to assure fairness and protect all participating funds. The interest earned and interest paid on interfund loans are included on the Statement of Operations as interest income and interest expense, respectively. At September 30, 2022, the Fund had no interfund loans outstanding.
The Fund utilized the interfund loan program during the fiscal year ended September 30, 2022 as follows:
| | | | | | | | | | |
Average
Lent | | Number
of Days | | Interest
Earned | | | Average
Interest Rate | |
| | | |
$1,016,546 | | 14 | | | $824 | | | | 2.112% | |
| | | |
Average Borrowed | | Number
of Days | | Interest
Paid | | | Average
Interest Rate | |
| | | |
$1,968,330 | | 16 | | | $813 | | | | 0.942% | |
3. PURCHASES AND SALES OF SECURITIES
Purchases and sales of securities (excluding short-term securities and U.S. Government Obligations) for the fiscal year ended September 30, 2022, were $28,660,255 and $46,496,015, respectively.
The Fund had no purchases or sales of U.S. Government Obligations during the fiscal year ended September 30, 2022.
4. PORTFOLIO SECURITIES LOANED
The Fund participates in the Program providing for the lending of securities to qualified borrowers. Securities lending income includes earnings of such temporary cash investments, plus or minus any rebate to a borrower. These earnings (after any rebate) are then divided between BNYM, as a fee for its services under the Program, and the Fund, according to agreed-upon rates. Collateral on all securities loaned is accepted in cash, U.S. Treasury Obligations or U.S. Government Agency Obligations. Collateral is maintained at a minimum level
20
| | |
| | | Notes to Financial Statements (continued) |
| | | |
| | | |
of 102% (105% in the case of certain foreign securities) of the market value, plus interest, if applicable, of investments on loan. It is the Fund’s policy to obtain additional collateral from or return excess collateral to the borrower by the end of the next business day, following the valuation date of the securities loaned. Therefore, the value of the collateral held may be temporarily less than the value of the securities on loan. Lending securities entails a risk of loss to the Fund if and to the extent that the market value of the securities loaned were to increase and the borrower did not increase the collateral accordingly, and the borrower fails to return the securities. Under the terms of the Program, the Fund is indemnified for such losses by BNYM. Cash collateral is held in separate omnibus accounts managed by BNYM, who is authorized to exclusively enter into joint repurchase agreements for that cash collateral. Securities collateral is held in separate omnibus accounts managed by BNYM and cannot be sold or pledged. BNYM bears the risk of any deficiency in the amount of the cash collateral available for return to the borrower due to any loss on the collateral invested. Loans of securities are terminable at any time and the borrower, after notice, is required to return borrowed securities as soon as practical, which is normally within three business days.
The value of securities loaned on positions held, cash collateral and securities collateral received at September 30, 2022, were as follows:
| | | | | | | | | | |
Securities Loaned | | Cash Collateral Received | | Securities Collateral Received | | | Total Collateral Received | |
| | | |
$5,839,134 | | $6,131,921 | | | — | | | $ | 6,131,921 | |
5. FOREIGN SECURITIES
The Fund invests in securities of foreign entities and in instruments denominated in foreign currencies which involve risks not typically associated with investments in domestic securities. Non-domestic securities carry special risks, such as exposure to currency fluctuations, less developed or less efficient trading markets, political instability, a lack of company information, differing auditing and legal standards, and, potentially, less liquidity. Realized gains in certain countries may be subject to foreign taxes at the Fund level and the Fund would pay such foreign taxes at the appropriate rate for each jurisdiction.
6. COMMITMENTS AND CONTINGENCIES
Under the Trust’s organizational documents, its trustees and officers are indemnified against certain liabilities arising out of the performance of their duties to the Trust. In addition, in the normal course of business, the Fund may enter into contracts and agreements that contain a variety of representations and warranties, which provide general indemnifications. The maximum exposure to the Fund under these arrangements is unknown, as this would involve future claims that may be made against the Fund that have not yet occurred. However, based on experience, the Fund had no prior claims or losses and expects the risks of loss to be remote.
7. FORWARD COMMITMENTS
Certain transactions, such as futures and forward transactions may have a similar effect on the Fund’s net asset value as if the Fund had created a degree of
leverage in its portfolio. However, if the Fund enters into such a transaction, the Fund will establish a segregated account with its custodian in which it will maintain cash, U.S. government securities or other liquid securities equal in value to its obligations in respect to such transaction. Securities and other assets held in the segregated account may not be sold while the transaction is outstanding, unless other suitable assets are substituted.
8. DERIVATIVE INSTRUMENTS
The following disclosures contain information on how and why the Fund uses derivative instruments, the credit risk and how derivative instruments affect the Fund’s financial position, and results of operations. The location and fair value amounts of these instruments on the Statement of Assets and Liabilities, and the realized gains and losses and changes in unrealized appreciation and depreciation on the Statement of Operations, each categorized by type of derivative contract, are included in a table at the end of the Fund’s Schedule of Portfolio Investments.
For the fiscal year ended September 30, 2022, the average monthly balances of derivative financial instruments outstanding were as follows:
| | | | |
| |
Financial Futures Contracts | | | | |
| |
Average number of contracts sold | | | 599 | |
| |
Average notional value of contracts sold | | | $61,746,820 | |
9. FUTURES CONTRACTS
The Fund generally expects to take short positions in index futures to seek to preserve capital. There are certain risks associated with futures contracts. Prices may not move as expected or the Fund may not be able to close out the contract when it desires to do so, resulting in losses.
On entering into a futures contract, either cash or securities in an amount equal to a certain percentage of the contract value (initial margin) must be deposited with the futures broker. Subsequent variation margin payments are made or received by the Fund depending on the fluctuations in the value of the futures contracts and the value of cash or securities on deposit with the futures broker. The Fund must have total value at the futures broker consisting of either net unrealized gains, cash or securities collateral to meet the initial margin requirement, and any value over the initial margin requirement may be transferred to the Fund. The Fund pays or receives variation margin periodically. As of September 30, 2022, the Fund had total equity in the futures account of $4,786,300 which consists of cash deposited with the futures broker of $53,291 and unrealized depreciation on open futures contracts of $4,733,009.
Variation margin on future contracts is recorded as unrealized appreciation or depreciation until the futures contract is closed or expired. The Fund recognizes a realized gain or loss when the contract is closed or expires equal to the difference between the value of the contract at the time it was opened and the value at the time it was closed. Fluctuations in the value of the contracts are recorded in the Statement of Assets and Liabilities as an asset (liability) and in the Statement of Operations as unrealized appreciation (depreciation) until the contracts are closed, when they are recorded as realized gains (losses) on futures contracts.
21
| | |
| | | Notes to Financial Statements (continued) |
| | | |
| | | |
10. MASTER NETTING AGREEMENTS
The Fund may enter into master netting agreements with its counterparties for the Program, Repurchase Agreements and derivatives, which provide the right, in the event of default (including bankruptcy or insolvency) for the non-defaulting party to liquidate the collateral and calculate net exposure to the defaulting party or request additional collateral. For financial reporting purposes, the Fund does not offset financial assets and financial liabilities that are subject to master netting agreements in the Statement of Assets and Liabilities. For securities lending transactions, see Note 4 and for futures transactions, see Note 9.
The following table is a summary of the Fund’s open Repurchase Agreements that are subject to a master netting agreement as of September 30, 2022:
| | | | | | | | | | | | | | | | | | | | |
| | | | | | Gross Amount Not Offset in the | | | | | | | |
| | | | | | Statement of Assets and Liabilities | | | | | | | |
| | | | | |
| | | Gross Amounts of Assets Presented in the Statement of Assets and Liabilities | | | Offset Amount | | | Net Asset Balance | | | Collateral Received | | | Net Amount | |
| | | | | |
| | | | | | | | | | | | | | | | | | | | |
| | | | | |
| | | | | | | | | | | | | | | | | | | | |
| | | | | |
Amherst Pierpont Securities LLC | | | $1,456,331 | | | | — | | | | $1,456,331 | | | | $1,456,331 | | | | — | |
| | | | | |
BNP Paribas SA | | | 306,597 | | | | — | | | | 306,597 | | | | 306,597 | | | | — | |
| | | | | |
Mirae Asset Securities USA, Inc. | | | 1,456,331 | | | | — | | | | 1,456,331 | | | | 1,456,331 | | | | — | |
| | | | | |
MUFG Securities America, Inc. | | | 1,456,331 | | | | — | | | | 1,456,331 | | | | 1,456,331 | | | | — | |
| | | | | |
RBC Dominion Securities, Inc. | | | 1,456,331 | | | | — | | | | 1,456,331 | | | | 1,456,331 | | | | — | |
| | | | | | | | | | | | | | | | | | | | |
| | | | | |
Total | | | $6,131,921 | | | | — | | | | $6,131,921 | | | | $6,131,921 | | | | — | |
| | | | | | | | | | | | | | | | | | | | |
11. REGULATORY UPDATES
On October 28, 2020, the SEC adopted regulations governing the use of derivatives by registered investment companies (“Rule 18f-4”), which came into effect on August 19, 2022. Rule 18f-4 imposes limits on the amount of derivatives a fund can enter into, eliminates the asset segregation framework previously used by funds to comply with Section 18 of the 1940 Act, treats derivatives as senior securities, requires funds whose use of derivatives is more than a limited specified exposure amount to establish and maintain a comprehensive derivatives risk management program and appoint a derivatives risk manager. The Fund has adopted the requirements of Rule 18f-4 and appointed the Investment Manager as the derivatives risk manager of the Fund. There was no significant impact on the financial statements and accompanying notes or the Fund’s operations upon the adoption of requirements of Rule 18f-4.
12. SUBSEQUENT EVENTS
The Fund has determined that no material events or transactions occurred through the issuance date of the Fund’s financial statements which require an additional disclosure in or adjustment of the Fund’s financial statements.
22
| | |
| | | Report of Independent Registered Public Accounting Firm |
| | | |
| | | |
TO THE BOARD OF TRUSTEES OF AMG FUNDS I AND THE SHAREHOLDERS OF AMG VERITAS GLOBAL REAL RETURN FUND
Opinion on the Financial Statements
We have audited the accompanying statement of assets and liabilities, including the schedule of portfolio investments, of AMG Veritas Global Real Return Fund (one of the funds constituting AMG Funds I, referred to hereafter as the “Fund”) as of September, 30 2022, the related statement of operations for the year ended September 30, 2022, the statements of changes in net assets for each of the two years in the period ended September 30, 2022, including the related notes, and the financial highlights for each of the five years in the period ended September 30, 2022 (collectively referred to as the “financial statements”). In our opinion, the financial statements present fairly, in all material respects, the financial position of the Fund as of September 30, 2022, the results of its operations for the year then ended, the changes in its net assets for each of the two years in the period ended September 30, 2022 and the financial highlights for each of the five years in the period ended September 30, 2022 in conformity with accounting principles generally accepted in the United States of America.
Basis for Opinion
These financial statements are the responsibility of the Fund’s management. Our responsibility is to express an opinion on the Fund’s financial statements based on our audits. We are a public accounting firm registered with the Public Company Accounting Oversight Board (United States) (PCAOB) and are required to be independent with respect to the Fund in accordance with the U.S. federal securities laws and the applicable rules and regulations of the Securities and Exchange Commission and the PCAOB.
We conducted our audits of these financial statements in accordance with the standards of the PCAOB. Those standards require that we plan and perform the audits to obtain reasonable assurance about whether the financial statements are free of material misstatement, whether due to error or fraud.
Our audits included performing procedures to assess the risks of material misstatement of the financial statements, whether due to error or fraud, and performing procedures that respond to those risks. Such procedures included examining, on a test basis, evidence regarding the amounts and disclosures in the financial statements. Our audits also included evaluating the accounting principles used and significant estimates made by management, as well as evaluating the overall presentation of the financial statements. Our procedures included confirmation of securities owned as of September 30, 2022 by correspondence with the custodian and broker. We believe that our audits provide a reasonable basis for our opinion.
PricewaterhouseCoopers LLP
Boston, Massachusetts
November 18, 2022
We have served as the auditor of one or more investment companies in the AMG Funds Family since 1993.
23
| | |
| | | Other Information (unaudited) |
| | | |
| | | |
TAX INFORMATION
AMG Veritas Global Real Return Fund hereby designates the maximum amount allowable of its net taxable income as qualified dividends as provided in the Jobs and Growth Tax Relief Reconciliation Act of 2003. The 2022 Form 1099-DIV you receive for the Fund will show the tax status of all distributions paid to you during the calendar year.
Pursuant to section 852 of the Internal Revenue Code, AMG Veritas Global Real Return Fund hereby designates $0 as a capital gain distribution with respect to the taxable year ended September 30, 2022, or if subsequently determined to be different, the net capital gains of such year.
24
| | |
| | | AMG Funds Trustees and Officers |
| | | |
| | | |
| | | | | | | | |
| The Trustees and Officers of the Trust, their business addresses, principal occupations for the past five years and ages are listed below. The Trustees provide broad supervision over the affairs of the Trust and the Funds. The Trustees are experienced executives who meet periodically throughout the year to oversee the Funds’ activities, review contractual arrangements with companies that provide services to the Funds, and | | | | review the Funds’ performance. Unless otherwise noted, the address of each Trustee or Officer is the address of the Trust: 680 Washington Blvd., Suite 500, Stamford, CT. 06901. There is no stated term of office for Trustees. Trustees serve until their resignation, retirement or removal in | | | | accordance with the Trust’s organizational documents and policies adopted by the Board from time to time. The Chairman of the Trustees, President, Treasurer and Secretary of the Trust are elected by the Trustees annually. Other officers hold office at the pleasure of the Trustees. |
| | | | | | | | | |
Independent Trustees
The following Trustees are not “interested persons” of the Trust within the meaning of the 1940 Act:
| | |
Number of Funds Overseen in Fund Complex | | Name, Age, Principal Occupation(s) During Past 5 Years and Other Directorships Held by Trustee |
| | |
• Trustee since 2012 • Oversees 40 Funds in Fund Complex | | Bruce B. Bingham, 73 Partner, Hamilton Partners (real estate development firm) (1987-Present); Director of The Yacktman Funds, Inc. (2 portfolios) (2000-2012). |
| | |
• Trustee since 2013 • Chairman of the Audit Committee since 2021 • Oversees 44 Funds in Fund Complex | | Kurt A. Keilhacker, 58 Managing Partner, TechFund Europe (2000-Present); Managing Partner, TechFund Capital (1997-Present); Managing Partner, Elementum Ventures (2013-Present); Director, MetricStory, Inc. (2017-Present); Trustee, Wheaton College (2018-Present); Trustee, Gordon College (2001-2016); Board Member, 6wind SA (2002-2019). |
| | |
• Trustee since 2000 • Oversees 40 Funds in Fund Complex | | Steven J. Paggioli, 72 Independent Consultant (2002-Present); Trustee, Professionally Managed Portfolios (28 portfolios); Advisory Board Member, Sustainable Growth Advisors, LP; Independent Director, Muzinich BDC, Inc. (business development company) (2019-Present); Director, The Wadsworth Group; Independent Director, Chase Investment Counsel (2008–2019); Executive Vice President, Secretary and Director, Investment Company Administration, LLC and First Fund Distributors, INC. (1990-2001). |
| | |
• Independent Chairman of the Board of Trustees since 2017 • Chairman of the Governance Committee since 2017 • Trustee since 2000 • Oversees 44 Funds in Fund Complex | | Eric Rakowski, 64 Professor of Law, University of California at Berkeley School of Law (1990-Present); Tax Attorney at Davis Polk & Wardwell and clerked for Judge Harry T. Edwards of the U.S. Court of Appeals for the District of Columbia Circuit and for Justice William J. Brennan Jr. of the U.S. Supreme Court; Director of Harding, Loevner Funds, Inc. (10 portfolios); Trustee of Third Avenue Trust (3 portfolios) (2002-2019); Trustee of Third Avenue Variable Trust (1 portfolio) (2002-2019). |
| | |
• Trustee since 2013 • Oversees 44 Funds in Fund Complex | | Victoria L. Sassine, 57 Adjunct Professor, Babson College (2007–Present); Director, Board of Directors, PRG Group (2017-Present); CEO, Founder, Scale Smarter Partners, LLC (2018-Present); Adviser, EVOFEM Biosciences (2019-Present); Chairperson of the Board of Directors of Business Management Associates (2018 to 2019). |
| | |
• Trustee since 2000 • Oversees 40 Funds in Fund Complex | | Thomas R. Schneeweis, 75 Professor Emeritus, University of Massachusetts (2013-Present); President, TRS Associates (1982-Present); Board Member, Chartered Alternative Investment Association (“CAIA”) (2002-Present); Co-Founder and Director, Institute for Global Asset and Risk Management (Education) (2010-Present); Co-Owner, Quantitative Investment Technologies (2014-Present); Co-Owner, Yes Wealth Management (2018-Present); Director, CAIA Foundation (2010-2019); Partner, S Capital Wealth Advisors (2015-2018); Partner, S Capital Management, LLC (2007-2015); President, Alternative Investment Analytics, LLC (formerly Schneeweis Partners, LLC) (2001-2013). |
|
Interested Trustee The Trustee in the following table is an “interested person” of the Trust within the meaning of the 1940 Act. |
Number of Funds Overseen in Fund Complex | | Name, Age, Principal Occupation(s) During Past 5 Years and Other Directorships Held by Trustee |
| | |
• Trustee since 2021 • Oversees 44 Funds in Fund Complex | | Garret W. Weston, 40 Affiliated Managers Group, Inc. (2008-Present): Managing Director, Co-Head of Affiliate Engagement (2021-Present), Senior Vice President, Affiliate Development (2016-2021), Vice President, Office of the CEO (2015-2016), Vice President, New Investments (2012-2015), Senior Associate, New Investments (2008-2012); Associate, Madison Dearborn Partners (2006-2008); Analyst, Merrill Lynch (2004-2006). |
25
| | |
| | | AMG Funds Trustees and Officers (continued) |
| | | |
| | | |
Officers
| | |
Position(s) Held with Fund and Length of Time Served | | Name, Age, Principal Occupation(s) During Past 5 Years |
| | |
• President since 2018 • Principal Executive Officer since 2018 • Chief Executive Officer since 2018 • Chief Operating Officer since 2007 | | Keitha L. Kinne, 64 Chief Operating Officer, AMG Funds LLC (2007-Present); Chief Investment Officer, AMG Funds LLC (2008-Present); President and Principal, AMG Distributors, Inc. (2018-Present); Chief Operating Officer, AMG Distributors, Inc. (2007-Present); President, Chief Executive Officer and Principal Executive Officer, AMG Funds, AMG Funds I, AMG Funds II, AMG Funds III and AMG Funds IV (2018-Present); Chief Operating Officer, AMG Funds, AMG Funds I, AMG Funds II, and AMG Funds III (2007-Present); Chief Operating Officer, AMG Funds IV (2016-Present); Chief Operating Officer and Chief Investment Officer, Aston Asset Management, LLC (2016); President and Principal Executive Officer, AMG Funds, AMG Funds I, AMG Funds II and AMG Funds III (2012-2014); Managing Partner, AMG Funds LLC (2007-2014); President and Principal, AMG Distributors, Inc. (2012-2014); Managing Director, Legg Mason & Co., LLC (2006-2007); Managing Director, Citigroup Asset Management (2004-2006). |
| | |
• Secretary since 2015 • Chief Legal Officer since 2015 | | Mark J. Duggan, 57 Managing Director and Senior Counsel, AMG Funds LLC (2021-Present); Senior Vice President and Senior Counsel, AMG Funds LLC (2015-2021); Secretary and Chief Legal Officer, AMG Funds, AMG Funds I, AMG Funds II, AMG Funds III and AMG Funds IV (2015-Present); Attorney, K&L Gates, LLP (2009-2015). |
| | |
• Chief Financial Officer since 2017 • Treasurer since 2017 • Principal Financial Officer since 2017 • Principal Accounting Officer since 2017 | | Thomas G. Disbrow, 56 Vice President, Mutual Fund Treasurer & CFO, AMG Funds, AMG Funds LLC (2017-Present); Chief Financial Officer, Principal Financial Officer, Treasurer and Principal Accounting Officer, AMG Funds, AMG Funds I, AMG Funds II, AMG Funds III and AMG Funds IV (2017-Present); Managing Director - Global Head of Traditional Funds Product Control, UBS Asset Management (Americas), Inc. (2015-2017); Managing Director - Head of North American Funds Treasury, UBS Asset Management (Americas), Inc. (2011-2015). |
| | |
• Deputy Treasurer since 2017 | | John A. Starace, 51 Vice President, Mutual Fund Accounting, AMG Funds LLC (2021-Present); Director, Mutual Fund Accounting, AMG Funds LLC (2017-2021); Vice President, Deputy Treasurer of Mutual Funds Services, AMG Funds LLC (2014-2017); Deputy Treasurer, AMG Funds, AMG Funds I, AMG Funds II, AMG Funds III and AMG Funds IV (2017-Present); Vice President, Citi Hedge Fund Services (2010-2014); Audit Senior Manager (2005-2010) and Audit Manager (2001-2005), Deloitte & Touche LLP. |
| | |
• Chief Compliance Officer and Sarbanes-Oxley Code of Ethics since 2019 | | Patrick J. Spellman, 48 Vice President, Chief Compliance Officer, AMG Funds LLC (2017-Present); Chief Compliance Officer, AMG Distributors, Inc. (2010-Present); Chief Compliance Officer and Sarbanes-Oxley Code of Ethics Compliance Officer, AMG Funds, AMG Funds I, AMG Funds II, AMG Funds III and AMG Funds IV (2019-Present); Senior Vice President, Chief Compliance Officer, AMG Funds LLC (2011-2017); Anti-Money Laundering Compliance Officer, AMG Funds, AMG Funds I, AMG Funds II, and AMG Funds III (2014-2019); Anti-Money Laundering Officer, AMG Funds IV (2016-2019); Compliance Manager, Legal and Compliance, Affiliated Managers Group, Inc. (2005-2011). |
| | |
• Assistant Secretary since 2016 | | Maureen M. Kerrigan, 37 Vice President, Senior Counsel, AMG Funds LLC (2021-Present); Vice President, Counsel, AMG Funds LLC (2019-2021); Director, Counsel, AMG Funds LLC (2017-2018); Vice President, Counsel, AMG Funds LLC (2015-2017); Assistant Secretary, AMG Funds, AMG Funds I, AMG Funds II, AMG Funds III and AMG Funds IV (2016-Present); Associate, Ropes & Gray LLP (2011-2015); Law Fellow, Massachusetts Appleseed Center for Law and Justice (2010-2011). |
| | |
• Anti-Money Laundering Compliance Officer since 2019 | | Hector D. Roman, 44* Director, Legal and Compliance, AMG Funds LLC (2020-Present); Anti-Money Laundering Compliance Officer, AMG Funds, AMG Funds I, AMG Funds II, AMG Funds III and AMG Funds IV (2019-Present); Manager, Legal and Compliance, AMG Funds LLC (2017-2019); Director of Compliance, Morgan Stanley Investment Management (2015-2017); Senior Advisory, PricewaterhouseCoopers LLP (2014-2015); Risk Manager, Barclays Investment Bank (2008-2014). |
* As of October 29, 2022, Hector D. Roman no longer serves as Anti-Money Laundering Compliance Officer of the Trust.
26
| | |
| | | Annual Renewal of Investment Management and Subadvisory Agreements |
| | | |
| | | |
| | | | | | | | |
AMG Veritas Global Real Return Fund: Approval of Investment Management Agreement and Subadvisory Agreement on June 22, 2022 At an in-person meeting held on June 22, 2022, the Board of Trustees (the “Board” or the “Trustees”), and separately a majority of the Trustees who are not “interested persons” of AMG Funds I (the “Trust”) (the “Independent Trustees”), approved (i) the Investment Management Agreement, as amended pursuant to letter agreements at any time prior to the date of the meeting, with AMG Funds LLC (the “Investment Manager”) for AMG Veritas Global Real Return Fund (the “Fund”) and separately each of Amendment No. 1 thereto dated July 1, 2015, and Amendment No. 2 thereto dated October 1, 2016 (collectively, the “Investment Management Agreement”); and (ii) the Subadvisory Agreement, as amended at any time prior to the date of the meeting, with the Subadviser for the Fund (the “Subadvisory Agreement”). The Independent Trustees were separately represented by independent legal counsel in connection with their consideration of the approval of these agreements. In considering the Investment Management Agreement and Subadvisory Agreement, the Trustees reviewed a variety of materials relating to the Fund, the Investment Manager and the Subadviser, including the nature, extent and quality of services, comparative performance, fee and expense information for an appropriate peer group of similar mutual funds for the Fund (the “Peer Group”), performance information for the relevant benchmark index for the Fund (the “Fund Benchmark”), other relevant matters, and other information provided to them on a periodic basis throughout the year. Prior to voting, the Independent Trustees: (a) reviewed the foregoing information with their independent legal counsel; (b) received materials from their independent legal counsel discussing the legal standards applicable to their consideration of the Investment Management Agreement and the Subadvisory Agreement; and (c) met with their independent legal counsel in private sessions at which no representatives of management were present. NATURE, EXTENT AND QUALITY OF SERVICES In considering the nature, extent and quality of the services provided by the Investment Manager, the Trustees reviewed information relating to the Investment Manager’s operations and personnel. Among other things, the Investment Manager provided financial information, information about its supervisory and professional staff and descriptions of its organizational and management structure. The Trustees also took into account information provided | | | | periodically throughout the previous year by the Investment Manager in Board meetings relating to the performance of its duties with respect to the Fund and the Trustees’ knowledge of the Investment Manager’s management and the quality of the performance of the Investment Manager’s duties under the Investment Management Agreement and Administration Agreement. In the course of their deliberations regarding the Investment Manager, the Trustees evaluated, among other things: (a) the extent and quality of the Investment Manager’s oversight of the operation and management of the Fund; (b) the quality of the Investment Manager’s oversight of the performance by the Subadviser of its portfolio management duties; (c) the Investment Manager’s ability to supervise the Fund’s other service providers; and (d) the Investment Manager’s compliance program. The Trustees also took into account that, in performing its functions under the Investment Management Agreement and supervising the Subadviser, the Investment Manager: performs periodic detailed analyses and reviews of the performance by the Subadviser of its obligations to the Fund, including without limitation, analysis and review of portfolio and other compliance matters and review of the Subadviser’s investment performance with respect to the Fund; prepares and presents periodic reports to the Board regarding the investment performance of the Subadviser and other information regarding the Subadviser, at such times and in such forms as the Board may reasonably request; reviews and considers any changes in the personnel of the Subadviser responsible for performing the Subadviser’s obligations and makes appropriate reports to the Board; reviews and considers any changes in the ownership or senior management of the Subadviser and makes appropriate reports to the Board; performs periodic in-person, telephonic or videoconference diligence meetings, including with respect to compliance matters, with representatives of the Subadviser; assists the Board and management of the Trust in developing and reviewing information with respect to the initial approval of the Subadvisory Agreement and annual consideration of the Subadvisory Agreement thereafter; prepares recommendations with respect to the continued retention of the Subadviser or the replacement of the Subadviser, including at the request of the Board; identifies potential successors to, or replacements of, the Subadviser or potential additional subadvisers, including performing appropriate due diligence, and developing and presenting to the Board a recommendation as to any such successor, replacement, or additional subadviser, including at the request of the Board; designates and | | | | compensates from its own resources such personnel as the Investment Manager may consider necessary or appropriate to the performance of its services; and performs such other review and reporting functions as the Board shall reasonably request consistent with the Investment Management Agreement and applicable law. The Trustees noted the affiliation of the Subadviser with the Investment Manager, noting any potential conflicts of interest. The Trustees also took into account the financial condition of the Investment Manager with respect to its ability to provide the services required under the Investment Management Agreement and the Investment Manager’s undertaking to maintain a contractual expense limitation for the Fund. The Trustees also considered the Investment Manager’s risk management processes. The Trustees also reviewed information relating to the Subadviser’s operations and personnel and the investment philosophy, strategies and techniques (its “Investment Strategy”) used in managing the Fund. Among other things, the Trustees reviewed information on portfolio management and other professional staff, information regarding the Subadviser’s organizational and management structure and the Subadviser’s brokerage policies and practices. The Trustees considered specific information provided regarding the experience of the individuals at the Subadviser with portfolio management responsibility for the Fund, including the information set forth in the Fund’s prospectus and statement of additional information. In the course of their deliberations, the Trustees evaluated, among other things: (a) the services rendered by the Subadviser in the past; (b) the qualifications and experience of the Subadviser’s personnel; and (c) the Subadviser’s compliance program. The Trustees also took into account the financial condition of the Subadviser with respect to its ability to provide the services required under the Subadvisory Agreement. The Trustees also considered the Subadviser’s risk management processes. PERFORMANCE The Board considered the Fund’s net performance during relevant time periods as compared to the Fund’s Peer Group and Fund Benchmark, considered the gross performance of the Fund as compared to the Subadviser’s relevant performance composite that utilizes a similar investment strategy and approach, and noted that the Board reviews on a quarterly basis detailed information about both the Fund’s performance results and portfolio composition, as well as the Subadviser’s Investment Strategy. The Board was mindful of the Investment |
| | | | | | | | |
27
| | |
| | | Annual Renewal of Investment Management and Subadvisory Agreements (continued) |
| | | |
| | | |
| | | | | | | | |
Manager’s expertise, resources and attention to monitoring the Subadviser’s performance, investment style and risk-adjusted performance with respect to the Fund and its discussions with the management of the Fund’s subadviser during the period regarding the factors that contributed to the performance of the Fund. Among other information relating to the Fund’s performance (including the predecessor fund’s performance for periods prior to its acquisition by the Trust on October 1, 2013), the Trustees noted that the Fund’s performance for Class I shares (the Fund’s sole share class) for the 1-year, 3-year, 5-year and 10-year periods ended March 31, 2022 was below, above, above, and above, respectively, the median performance of the Peer Group and below, above, above, and above, respectively, the performance of the Fund Benchmark, the Bloomberg U.S. Treasury Inflation-Linked Bond Index. The Trustees also took into account management’s discussion of the Fund’s performance, including the reasons for the Fund’s more recent underperformance and the fact that the Fund ranked in the top percentile relative to its Peer Group for the 5-year and 10-year periods and the top decile relative to its Peer Group for the 3-year period. The Trustees also took into account the fact that the Fund’s subadviser, investment strategy, and Fund Benchmark changed effective March 19, 2021, and that the performance information prior to that date reflected that of the Fund’s prior subadviser and investment strategy. The Trustees concluded that the Fund’s overall performance has been satisfactory. ADVISORY AND SUBADVISORY FEES; FUND EXPENSES; PROFITABILITY; AND ECONOMIES OF SCALE In considering the reasonableness of the advisory fee payable to the Investment Manager, the Trustees reviewed information provided by the Investment Manager at the June 22, 2022 and prior meetings setting forth all revenues and other benefits, both direct and indirect (including any so-called “fallout benefits” such as reputational value derived from the Investment Manager serving as Investment Manager to the Fund), received by the Investment Manager and its affiliates attributable to managing the Fund and all the mutual funds in the AMG Funds Family of Funds; the cost of providing such services; the significant risks undertaken as Investment Manager and sponsor of the Fund, including investment, operational, enterprise, entrepreneurial, litigation, regulatory and compliance risks; and the resulting profitability to the Investment Manager and its | | | | affiliates from these relationships. The Trustees also considered the amount of the advisory fee retained by the Investment Manager after payment of the subadvisory fee with respect to the Fund. The Trustees also noted payments are made from the Subadviser to the Investment Manager, and other payments are made from the Investment Manager to the Subadviser. The Trustees also considered management’s discussion of the current asset level of the Fund, and the impact on profitability of both the current asset level and any future growth of assets of the Fund. In considering the cost of services to be provided by the Investment Manager under the Investment Management Agreement and the profitability to the Investment Manager of its relationship with the Fund, the Trustees noted the undertaking by the Investment Manager to maintain a contractual expense limitation for the Fund. The Board also took into account management’s discussion of the advisory fee structure, and the services the Investment Manager provides in performing its functions under the Investment Management Agreement and supervising the Subadviser. Based on the foregoing, the Trustees concluded that the profitability to the Investment Manager is reasonable and that the Investment Manager is not realizing material benefits from economies of scale that would warrant adjustments to the advisory fee at this time. Also with respect to economies of scale, the Trustees noted that as the Fund’s assets increase over time, the Fund may realize other economies of scale to the extent the increase in assets is proportionally greater than the increase in certain other expenses. In considering the reasonableness of the subadvisory fee payable by the Investment Manager to the Subadviser, the Trustees reviewed information regarding the cost to the Subadviser of providing subadvisory services to the Fund and the resulting profitability from the relationship. The Trustees noted that, because the Subadviser is an affiliate of the Investment Manager, a portion of the Subadviser’s revenues or profits might be shared directly or indirectly with the Investment Manager. The Trustees also noted that the subadvisory fees are paid by the Investment Manager out of its advisory fee. The Board also took into account management’s discussion of the subadvisory fee structure, and the services the Subadviser provides in performing its functions under the Subadvisory Agreement. Based on the foregoing, the Trustees concluded that the profitability to the Subadviser is reasonable and that the Subadviser is not realizing material benefits from | | | | economies of scale that would warrant adjustments to the subadvisory fees at this time. Also with respect to economies of scale, the Trustees noted that as the Fund’s assets increase over time, the Fund may realize other economies of scale to the extent the increase in assets is proportionally greater than the increase in certain other expenses. The Trustees noted that the Fund’s management fees (which include both the advisory and administration fees) and total expenses (net of applicable expense waivers/reimbursements) as of March 31, 2022 were both lower than the average for the Peer Group. The Trustees took into account the fact that the Investment Manager has contractually agreed, through February 1, 2023, to limit the Fund’s net annual operating expenses (subject to certain excluded expenses) to 1.11%. The Trustees concluded that, in light of the nature, extent and quality of the services provided by the Investment Manager and the Subadviser (which is an affiliate of the Investment Manager), the foregoing expense limitation and the considerations noted above with respect to the Investment Manager and the Subadviser, the Fund’s advisory and subadvisory fees are reasonable. * * * * * After consideration of the foregoing, the Trustees also reached the following conclusions (in addition to the conclusions discussed above) regarding the Investment Management Agreement and the Subadvisory Agreement: (a) the Investment Manager and the Subadviser have demonstrated that they possess the capability and resources to perform the duties required of them under the Investment Management Agreement and the Subadvisory Agreement and (b) the Investment Manager and Subadviser maintain appropriate compliance programs. Based on all of the above-mentioned factors and their related conclusions, with no single factor or conclusion being determinative and with each Trustee not necessarily attributing the same weight to each factor, the Trustees concluded that approval of the Investment Management Agreement and the Subadvisory Agreement would be in the best interests of the Fund and its shareholders. Accordingly, on June 22, 2022, the Trustees, and separately a majority of the Independent Trustees, voted to approve the Investment Management Agreement and the Subadvisory Agreement for the Fund. |
| | | | | | | | | |
28
|
|
| | | | | | | | |
INVESTMENT MANAGER AND ADMINISTRATOR AMG Funds LLC 680 Washington Blvd., Suite 500 Stamford, CT 06901 800.548.4539 DISTRIBUTOR AMG Distributors, Inc. 680 Washington Blvd., Suite 500 Stamford, CT 06901 800.548.4539 SUBADVISER Veritas Asset Management LLP 1 Smart's Place London, WC2B 5LW CUSTODIAN The Bank of New York Mellon Mutual Funds Custody 6023 Airport Road Oriskany, NY 13424 | | | | LEGAL COUNSEL Ropes & Gray LLP Prudential Tower, 800 Boylston Street Boston, MA 02199-3600 TRANSFER AGENT BNY Mellon Investment Servicing (US) Inc. Attn: AMG Funds 4400 Computer Drive Westborough, MA 01581 800.548.4539 | | | | This report is prepared for the Fund's shareholders. It is authorized for distribution to prospective investors only when preceded or accompanied by an effective prospectus. To receive a free copy of the prospectus or Statement of Additional Information, which includes additional information about Fund Trustees, please contact us by calling 800.548.4539. Distributed by AMG Distributors, Inc., member FINRA/SIPC. Current net asset values per share for the Fund are available on the Fund's website at amgfunds.com. A description of the policies and procedures the Fund uses to vote its proxies is available: (i) without charge, upon request, by calling 800.548.4539, or (ii) on the Securities and Exchange Commission’s (SEC) website at sec.gov. For information regarding the Fund's proxy voting record for the 12-month period ended June 30, call 800.548.4539 or visit the SEC website at sec.gov. The Fund files its complete schedule of portfolio holdings with the SEC for the first and third quarters of each fiscal year as an exhibit to their reports on Form N-PORT. The Fund's portfolio holdings on Form N-PORT are available on the SEC’s website at sec.gov and the Fund's website at amgfunds.com. To review a complete list of the Fund's portfolio holdings, or to view the most recent semiannual report or annual report, please visit amgfunds.com. |
| | | | | | | | | |
|
|
| | | | | | | | |
BALANCED FUNDS AMG GW&K Global Allocation GW&K Investment Management, LLC EQUITY FUNDS AMG Beutel Goodman International
Equity Beutel, Goodman & Company Ltd. AMG Boston Common Global Impact Boston Common Asset Management, LLC AMG Frontier Small Cap Growth Frontier Capital Management Co., LLC AMG GW&K Small Cap Core AMG GW&K Small Cap Value AMG GW&K Small/Mid Cap AMG GW&K Small/Mid Cap Growth AMG GW&K Emerging Markets
Equity AMG GW&K Emerging Wealth Equity AMG GW&K International Small Cap GW&K Investment Management, LLC AMG Montrusco Bolton Large Cap
Growth Montrusco Bolton Investments, Inc. AMG Renaissance Large Cap
Growth The Renaissance Group LLC | | | | AMG River Road Dividend All Cap
Value AMG River Road Focused
Absolute Value AMG River Road International
Value Equity AMG River Road Large Cap Value
Select AMG River Road Mid Cap Value AMG River Road Small-Mid Cap
Value AMG River Road Small Cap
Value River Road Asset Management, LLC AMG TimesSquare Emerging
Markets Small Cap AMG TimesSquare Global Small Cap AMG TimesSquare International
Small Cap AMG TimesSquare Mid Cap Growth AMG TimesSquare Small Cap Growth TimesSquare Capital Management, LLC AMG Veritas Asia Pacific AMG Veritas China AMG Veritas Global Focus AMG Veritas Global Real Return Veritas Asset Management LLP AMG Yacktman AMG Yacktman Focused AMG Yacktman Global AMG Yacktman Special
Opportunities Yacktman Asset Management LP | | | | FIXED INCOME FUNDS AMG Beutel Goodman Core
Plus Bond Beutel, Goodman & Company Ltd. AMG GW&K Core Bond ESG AMG GW&K Enhanced Core
Bond ESG AMG GW&K ESG Bond AMG GW&K High Income AMG GW&K Municipal Bond AMG GW&K Municipal
Enhanced Yield GW&K Investment Management, LLC |
| | | | | | | | | |
| | | | | | | | | |
| | | | | | | | | |
| | | | | | | | | |
| | | | | | | | | |
| | | | | | | | | |
| | | | | | | | | |
| | | | | | | | | |
| | | | | | | | | |
| | | | | | | | | |
| | | | | | | | | |
| | | | | | | | | |
| | | | | | | | | |
| | | | | | | | | |
| | | | | | | | | |
| | | | | | | | | |
| | | | |
| amgfunds.com | | | | 093022 AR073 |
Registrant has adopted a Code of Ethics. See attached Exhibit (a)(1).
| Item 3. | AUDIT COMMITTEE FINANCIAL EXPERT |
Registrant’s Board of Trustees has determined that independent Trustee Mr. Steven J. Paggioli qualifies as an Audit Committee Financial Expert. Mr. Paggioli is “independent” as such term is defined in Form N-CSR.
| Item 4. | PRINCIPAL ACCOUNTANT FEES AND SERVICES |
(a) Audit Fees
The aggregate fees billed by the Funds’ independent registered public accounting firm, PricewaterhouseCoopers LLP (“PwC”), to the Funds for the Funds’ two most recent fiscal years for professional services rendered for audits of annual financial statements, or services that are normally provided in connection with statutory and regulatory filings or engagements (“Audit Fees”) were as follows:
| | | | | | | | |
| | | Fiscal 2022 | | | Fiscal 2021 | |
AMG Boston Common Global Impact Fund | | $ | 39,833 | | | $ | 25,008 | |
AMG Veritas Global Real Return Fund | | $ | 29,810 | | | $ | 23,557 | |
(b) Audit-Related Fees
There were no fees billed by PwC to the Funds in their two recent fiscal years for services rendered for assurance and related services that are reasonably related to the performance of the audit or review of the Funds’ financial statements, but are not reported as Audit Fees (“Audit-Related Fees”).
For the Funds’ two most recent fiscal years, there were no Audit-Related Fees billed by PwC for engagements related directly to the operations and financial reporting of one or more Funds by a Fund Service Provider. A Fund Service Provider is (a) any investment adviser to the Fund (not including any Subadvisor whose role is primarily portfolio management and is subcontracted with or overseen by another investment adviser) or (b) any entity that provides ongoing services to the Fund and is controlling, controlled by or under common control with a Fund investment adviser described in (a).
(c) Tax Fees
The aggregate fees billed by PwC to the Funds for the two most recent fiscal years for professional services rendered for tax compliance, tax advice, and tax planning (“Tax Fees”) were as follows:
| | | | | | | | |
| | | Fiscal 2022 | | | Fiscal 2021 | |
AMG Boston Common Global Impact Fund | | $ | 8,050 | | | $ | 6,250 | |
AMG Veritas Global Real Return Fund | | $ | 8,050 | | | $ | 6,250 | |
For the Funds’ two most recent fiscal years, Tax Fees billed by PwC for engagements by Fund Service Providers that related directly to the operations and financial reporting of the Funds were $0 for fiscal 2022 and $0 for fiscal 2021 respectively.
The services for which Tax Fees were charged comprise all services performed by professional staff in PwC’s tax division except those services related to the audit. Typically, this category would include fees for tax compliance, tax planning, and tax advice. Tax compliance, tax advice, and tax planning services include preparation of original and amended tax returns, claims for refund and tax payment-planning services, assistance with tax audits and appeals, tax advice related to mergers and acquisitions and requests for rulings or technical advice from taxing authorities.
(d) All Other Fees
There were no other fees billed by PwC to the Funds for all other non-audit services (“Other Fees”) during the Funds’ two most recent fiscal years. During the same period, there were no Other Fees billed by PwC for engagements by Fund Service Providers that related directly to the operations and financial reporting of the Funds.
(e)(1)According to policies adopted by the Audit Committee, services provided by PwC to the Funds must be pre-approved by the Audit Committee. On an annual basis, the Audit Committee reviews and pre-approves various types of services that PwC may perform for the Funds without specific approval of each engagement, subject to specified budget limitations. As contemplated by the Sarbanes-Oxley Act of 2002 and related SEC rules, the Audit Committee also pre-approves non-audit services provided by PwC to any Fund Service Provider for any engagement that relates directly to the operations and financial reporting of the Funds. Any engagement that is not already pre-approved or that will exceed a pre-approved budget must be submitted to the Audit Committee for pre-approval. The Chairman of the Audit Committee is authorized on behalf of the Board of Trustees and the Audit Committee to approve the engagement of PwC to perform non-audit services subject to certain conditions, including notification to the Audit Committee of such pre-approval not later than the next meeting of the Audit Committee following the date of such pre-approval.
(e)(2) None.
(f) Not applicable.
(g) The aggregate fees billed by PwC in 2022 and 2021 for non-audit services rendered to the Funds and Fund Service Providers were $53,100 and $54,875, respectively. For the fiscal year ended September 30, 2022, this amount reflects the amounts disclosed above in Item 4(b),(c),(d), plus $37,000 in fees billed to the Fund Service Providers for non-audit services that did not relate directly to the operations and financial reporting of the Funds. For the fiscal year ended September 30, 2021, this amount reflects the amounts disclosed above in Item 4(b),(c),(d), plus $42,375 in fees billed to the Fund Service Providers for non-audit services that did not relate directly to the operations and financial reporting of the Funds.
(h) The Trust’s Audit Committee has considered whether the provision of non-audit services by registrant’s independent registered public accounting firm to the registrant’s investment advisor, and any entity controlling, controlled, or under common control with the investment advisor that provided ongoing services to the registrant that were not pre-approved by the Committee (because such services did not relate directly to the operations and financial reporting of the registrant) was compatible with maintaining the independence of the independent registered public accounting firm.
| Item 5. | AUDIT COMMITTEE OF LISTED REGISTRANTS |
Not applicable.
| Item 6. | SCHEDULE OF INVESTMENTS |
The schedule of investments in unaffiliated issuers as of the close of the reporting period is included as part of the shareholder report contained in Item 1 hereof.
| Item 7. | DISCLOSURE OF PROXY VOTING POLICIES AND PROCEDURES FOR CLOSED-END MANAGEMENT INVESTMENT COMPANIES |
Not applicable.
| Item 8. | PORTFOLIO MANAGERS OF CLOSED-END MANAGEMENT INVESTMENT COMPANIES |
Not applicable.
| Item 9. | PURCHASES OF EQUITY SECURITIES BY CLOSED-END MANAGEMENT INVESTMENT COMPANIES AND AFFILIATED PURCHASERS |
Not applicable.
| Item 10. | SUBMISSION OF MATTERS TO A VOTE OF SECURITY HOLDERS |
Not applicable.
| Item 11. | CONTROLS AND PROCEDURES |
(a) The Registrant’s principal executive and principal financial officers have concluded, based on their evaluation of the registrant’s disclosure controls and procedures as of a date within 90 days of the filing of this report, that the Registrant’s disclosure controls and procedures are reasonably designed to ensure that information required to be disclosed by the Registrant on Form N-CSR is recorded, processed, summarized and reported within the required time periods and that information required to be disclosed by the registrant in the reports that it files or submits on Form N-CSR is accumulated and communicated to the Registrant’s management, including its principal executive and principal financial officers, as appropriate to allow timely decisions regarding required disclosure.
(b) There were no changes in the Registrant’s internal control over financial reporting during the period covered by this report that have materially affected, or are reasonably likely to materially affect, the internal control over financial reporting.
| Item 12. | DISCLOSURE OF SECURITIES LENDING ACTIVITIES FOR CLOSED-END MANAGEMENT INVESTMENT COMPANIES |
Not applicable.
SIGNATURES
Pursuant to the requirements of the Securities Exchange Act of 1934 and the Investment Company Act of 1940, the registrant has duly caused this report to be signed on its behalf by the undersigned, thereunto duly authorized.
| | |
| AMG FUNDS I |
| |
| By: | | /s/ Keitha L. Kinne |
| | Keitha L. Kinne, Principal Executive Officer |
| |
| Date: | | December 5, 2022 |
Pursuant to the requirements of the Securities Exchange Act of 1934 and the Investment Company Act of 1940, this report has been signed below by the following persons on behalf of the registrant and in the capacities and on the dates indicated.
| | |
| |
| By: | | /s/ Keitha L. Kinne |
| | Keitha L. Kinne, Principal Executive Officer |
| |
| Date: | | December 5, 2022 |
| |
| By: | | /s/ Thomas Disbrow |
| | Thomas Disbrow, Principal Financial Officer |
| |
| Date: | | December 5, 2022 |