UNITED STATES
SECURITIES AND EXCHANGE COMMISSION
Washington, D.C. 20549
FORM N-CSR
CERTIFIED SHAREHOLDER REPORT OF REGISTERED
MANAGEMENT INVESTMENT COMPANIES
Investment Company Act file number: 811-06520
AMG Funds I
(Exact name of registrant as specified in charter)
680 Washington Boulevard, Suite 500, Stamford, Connecticut 06901
(Address of principal executive offices) (Zip code)
AMG Funds LLC
680 Washington Boulevard, Suite 500, Stamford, Connecticut 06901
(Name and address of agent for service)
Registrant’s telephone number, including area code: (203) 299-3500
Date of fiscal year end: OCTOBER 31
Date of reporting period: NOVEMBER 1, 2020 – OCTOBER 31, 2021
(Annual Shareholder Report)
| Item 1. | Reports to Shareholders |
| | |
 | | ANNUAL REPORT |
| | | | | | | | |
| | | | | AMG Funds October 31, 2021 
AMG FQ Global Risk-Balanced Fund |
| | | | | |
| | | | | Class N: MMAVX | | Class I: MMASX | | Class Z: MMAFX |
| | |
| amgfunds.com | | 103121 AR014 |
| | |
| | | AMG Funds Annual Report — October 31, 2021 |
| | | | | | |
| | | |
| | | | | | | |
| | | TABLE OF CONTENTS | | PAGE | |
| | | | |
| | | LETTER TO SHAREHOLDERS | | | 2 | |
| | | |
| | | ABOUT YOUR FUND’S EXPENSES | | | 3 | |
| | | |
| | | PORTFOLIO MANAGER’S COMMENTS, FUND SNAPSHOTS AND SCHEDULE OF PORTFOLIO INVESTMENTS | | | 4 | |
| | | |
| | | FINANCIAL STATEMENTS | | | | |
| | | |
| | | Statement of Assets and Liabilities | | | 12 | |
| | | |
| | | Balance sheet, net asset value (NAV) per share computations and cumulative distributable earnings (loss) | | | | |
| | | |
| | | Statement of Operations | | | 14 | |
| | | |
| | | Detail of sources of income, expenses, and realized and unrealized gains (losses) during the fiscal year | | | | |
| | | |
| | | Statements of Changes in Net Assets | | | 15 | |
| | | |
| | | Detail of changes in assets for the past two fiscal years | | | | |
| | | |
| | | Financial Highlights | | | 16 | |
| | | |
| | | Historical net asset values per share, distributions, total returns, income and expense ratios, turnover ratios and net assets | | | | |
| | | |
| | | Notes to Financial Statements | | | 19 | |
| | | |
| | | Accounting and distribution policies, details of agreements and transactions with Fund management and affiliates, and descriptions of certain investment risks | | | | |
| | | |
| | | REPORT OF INDEPENDENT REGISTERED PUBLIC ACCOUNTING FIRM | | | 26 | |
| | | |
| | | OTHER INFORMATION | | | 27 | |
| | | |
| | | TRUSTEES AND OFFICERS | | | 28 | |
| | | |
| | | ANNUAL RENEWAL OF INVESTMENT MANAGEMENT AND SUBADVISORY AGREEMENTS | | | 31 | |
| | | | | | | |
|
| Nothing contained herein is to be considered an offer, sale or solicitation of an offer to buy shares of any series of the AMG Funds Family of Funds. Such offering is made only by prospectus, which includes details as to offering price and other material information. | |
| | |
| | Letter to Shareholders |
Dear Shareholder:
The fiscal year ended October 31, 2021, was marked by the continued extraordinary recovery amid an unprecedented global effort to stop the COVID-19 pandemic. Equities rallied to new record highs amid better-than-expected corporate earnings, colossal fiscal and monetary stimulus programs, and an improving economic backdrop. Since the market bottom on March 23, 2020, the S&P 500® Index has gained over 111%. Businesses and consumers contended with disrupted supply chains and rising prices on a wide range of goods such as lumber and gasoline, and outbreaks of coronavirus variants kept the world on edge. Volatility increased in September as investors grew more concerned about rising inflation and more hawkish global central bank policies, but equities were resilient and finished the fiscal year with a strong rally.
The S&P 500® gained 42.91% during the period and all sectors produced double-digit returns, but there was very wide dispersion in performance. Energy and financials led the market with returns of 111.38% and 72.14%, respectively. On the other hand, utilities and consumer staples lagged with returns of 10.64% and 19.02%, respectively. Value stocks edged out Growth stocks as the Russell 1000® Value Index returned 43.76% compared to the 43.21% return for the Russell 1000® Growth Index. Small cap stocks outperformed as the Russell 2000® Index experienced its best quarter (fourth quarter 2020) on record. Within small caps, the Value-Growth disparity was much more pronounced as the Russell 2000® Value Index returned 64.30% compared to 38.45% for the Russell 2000® Growth Index. Outside the U.S., foreign developed markets lagged their U.S. counterparts with a 34.18% return for the MSCI EAFE Index. A major regulatory crackdown in China shook investor confidence in Chinese equities and caused emerging markets to underperform with a 16.96% return for the MSCI Emerging Markets Index.
Interest rates lifted off from near-historic lows as the vaccine rollout initiated a return to normalcy and the economic outlook improved. The 10-year Treasury yield rose 69 basis points to 1.55% and ended the fiscal year not far off its post-pandemic high. The Bloomberg U.S. Aggregate Bond Index, a broad measure of U.S. bond market performance, lost 0.48% over the period. Healthy risk appetite drove credit spreads tighter and helped investment-grade corporate bonds produce a modestly positive 2.18% return. The global search for yield helped high-yield bonds outperform the investment-grade market with a 10.53% return as measured by the return of the Bloomberg U.S. Corporate High Yield Bond Index. Municipal bonds benefited from a strong technical backdrop and drove a 2.64% return for the Bloomberg Municipal Bond Index.
AMG Funds appreciates the privilege of providing investment tools to you and your clients. Our foremost goal is to provide investment solutions that help our shareholders successfully reach their long-term investment goals. AMG Funds provides access to a distinctive array of actively managed return-oriented investment strategies. We thank you for your continued confidence and investment in AMG Funds. You can rest assured that under all market conditions our team is focused on delivering excellent investment management services for your benefit.
Respectfully,

Keitha Kinne
President
AMG Funds
| | | | | | | | | | | | | | |
| Average Annual Total Returns | | Periods ended
October 31, 2021* | |
| | | | |
| Stocks: | | | | 1 Year | | | 3 Years | | | 5 Years | |
| | | | |
Large Cap | | (S&P 500® Index) | | | 42.91 | % | | | 21.48% | | | | 18.93% | |
| | | | |
Small Cap | | (Russell 2000® Index) | | | 50.80 | % | | | 16.47% | | | | 15.52% | |
| | | | |
International | | (MSCI All Country World Index ex USA) | | | 29.66 | % | | | 12.00% | | | | 9.77% | |
| Bonds: | | | | | | | | | | | |
| | | | |
Investment Grade | | (Bloomberg U.S. Aggregate Bond Index) | | | (0.48 | )% | | | 5.63% | | | | 3.10% | |
| | | | |
High Yield | | (Bloomberg U.S. Corporate High Yield Bond Index) | | | 10.53 | % | | | 7.43% | | | | 6.40% | |
| | | | |
Tax-exempt | | (Bloomberg Municipal Bond Index) | | | 2.64 | % | | | 5.17% | | | | 3.41% | |
| | | | |
Treasury Bills | | (ICE BofAML U.S. 6-Month Treasury Bill Index) | | | 0.11 | % | | | 1.37% | | | | 1.32% | |
*Source: FactSet. Past performance is no guarantee of future results.
2
|
About Your Fund’s Expenses |
| | | | | | | | |
As a shareholder of a Fund, you may incur two types of costs: (1) transaction costs, which may include sales charges (loads) on purchase payments; redemption fees; and exchange fees; and (2) ongoing costs, including management fees; distribution (12b-1) fees; and other Fund expenses. This example is intended to help you understand your ongoing costs (in dollars) of investing in the Fund and to compare these costs with the ongoing costs of investing in other mutual funds. The example is based on $1,000 invested at the beginning of the period and held for the entire period as indicated below. ACTUAL EXPENSES The first line of the following table provides information about the actual account values and | | | | actual expenses. You may use the information in this line, together with the amount you invested, to estimate the expenses that you paid over the period. Simply divide your account value by $1,000 (for example, an $8,600 account value divided by $1,000 = 8.6), then multiply the result by the number in the first line under the heading entitled “Expenses Paid During Period” to estimate the expenses you paid on your account during this period. HYPOTHETICAL EXAMPLE FOR COMPARISON PURPOSES The second line of the following table provides information about hypothetical account values and hypothetical expenses based on the Fund’s actual expense ratio and an assumed annual rate of return of 5% before expenses, which is not the Fund’s | | | | actual return. The hypothetical account values and expenses may not be used to estimate the actual ending account balance or expenses you paid for the period. You may use this information to compare the ongoing costs of investing in the Fund and other funds by comparing this 5% hypothetical example with the 5% hypothetical examples that appear in the shareholder reports of other funds. Please note that the expenses shown in the table are meant to highlight your ongoing costs only and do not reflect any transactional costs, such as sales charges (loads), redemption fees, or exchange fees. Therefore, the second line of the table is useful in comparing ongoing costs only, and will not help you determine the relative total costs of owning different funds. |
| | | | | | | | |
| | | | | | | | |
| | | | |
Six Months Ended October 31, 2021 | | Expense
Ratio for
the Period | | Beginning
Account
Value
05/01/21 | | Ending
Account
Value
10/31/21 | | Expenses
Paid
During
the Period* |
AMG FQ Global Risk-Balanced Fund |
|
Based on Actual Fund Return |
| | | | |
Class N | | 1.29% | | $1,000 | | $1,038 | | $6.63 |
| | | | |
Class I | | 1.04% | | $1,000 | | $1,040 | | $5.35 |
| | | | |
Class Z | | 0.89% | | $1,000 | | $1,041 | | $4.58 |
|
Based on Hypothetical 5% Annual Return |
| | | | |
Class N | | 1.29% | | $1,000 | | $1,019 | | $6.56 |
| | | | |
Class I | | 1.04% | | $1,000 | | $1,020 | | $5.30 |
| | | | |
Class Z | | 0.89% | | $1,000 | | $1,021 | | $4.53 |
| * | Expenses are equal to the Fund’s annualized expense ratio multiplied by the average account value over the period, multiplied by the number of days in the most recent fiscal half-year (184), then divided by 365. |
3
|
AMG FQ Global Risk-Balanced Fund Portfolio Manager’s Comments (unaudited) |
| | | | | | | | |
OVERVIEW For the fiscal year ended October 31, 2021, AMG FQ Global Risk-Balanced Fund’s (the “Fund”) Class N shares returned 16.52%, while the benchmark 60% MSCI World Index/40% FTSE World Government Bond Index - Hedged returned 21.86%. Risk assets performed well over the period, resulting in gains for the equity and commodity portfolios. The Fund’s bond portfolio modestly detracted. Nominal bonds fell as inflation and rate expectations rose. While the Fund also uses synthetic instruments such as futures contracts to gain exposure to the markets, this had no material impact on performance relative to holding physical securities MARKET OVERVIEW The fiscal year was a strong one for most risk assets. Markets priced in an optimistic growth scenario as vaccine trial results exceeded expectations and mass vaccinations began. Inflation expectations increased as supply chain bottlenecks limited the stock of available goods, but markets and central banks perceived most of the rise in price to be temporary. Toward the end of the fiscal year this started to change, as supply issues persisted and longer-term inflationary indicators began to rise. For most of the fiscal year the MRI1 was at 0.50, reflecting a tension across different indicators. The economic indicators were generally positive, with the manufacturing sector recovering as the economy reopened. Risk appetite, in contrast, was more mixed. Credit and bond markets signaled | | | | resilience, but implied volatility in crude and options markets remained high. The general advance in risk appetite may have masked longer-term uncertainty about the true health of the global economy. PERFORMANCE The Fund delivered positive returns, led by the equity portfolio. For most of the period, markets were growth-oriented as the global vaccination campaign began and parts of the economy reopened. Earnings and macro data were generally encouraging, consumer spending was strong, and labor markets were tight, outweighing concerns about potential inflation. The equity rally stalled a bit over the summer months as the Delta variant caused another crest in COVID-19 cases, but equities resumed their upward march in the fall. The reflationary trade supported inflation-linked assets, and Real Estate Investment Trust (REITs), Treasury Inflationary-Protected (TIP) securities, and commodities all finished the period up. The industrial commodities rallied as global manufacturing recovered and some travel resumed. Supply developments also supported prices, as ongoing bottlenecks limited the availability of most commodities. Precious metals were an exception to the general commodity advance, with gold falling back as demand for safe havens waned. Nominal bonds had mixed success over the period, reflecting the uncertainty around inflation and rates, but ultimately finished down. Most of the losses were realized in February 2021 and toward the end of the | | | | fiscal year-end. In February, sovereign bonds suffered their worst month in almost five years. The rise in yields was largely attributed to a rise in inflation expectations, though there is a contingent who believe the large influx of government bonds was also to blame. Nominal bonds started to recover in Q2 2021 but weakened again in September and October as markets priced in persistent inflation and more hawkish expectations for central banks. The Fund’s options hedge also detracted from overall results, given equity markets’ strong advance. OUTLOOK The MRI remained in a balanced market state (MRI of 0.50). Growth expectations remain positive, but risk appetite continues to be limited by the threat of persistent inflation and rising rates. We also may be observing a growing bubble mentality, based on activity in the cryptocurrency and SPAC (special-purpose acquisition company) markets. 1 The FQ Market Risk Indicator (“MRI”) is designed to indicate the current phase of the market cycle and the level of macro uncertainty, from resilience (MRI=0.00) to high fragility (MRI=1.00) in increments of 0.25 for a total of five levels. This commentary reflects the viewpoints of the portfolio manager, First Quadrant, L.P., as of October 31, 2021 and is not intended as a forecast or guarantee of future results, and is subject to change without notice. |
4
|
AMG FQ Global Risk-Balanced Fund Portfolio Manager’s Comments (continued) |
CUMULATIVE TOTAL RETURN PERFORMANCE
AMG FQ Global Risk-Balanced Fund’s cumulative total return is based on the daily change in net asset value (NAV), and assumes that all dividends and distributions were reinvested. This graph compares a hypothetical $10,000 investment made in the AMG FQ Global Risk Balanced Fund’s Class N shares on October 31, 2011, to a $10,000 investment made in the 60% MSCI World Index & 40% FTSE World Government Bond Index-Hedged (“Composite Hedged Index”) and the 60% MSCI World Index & 40% FTSE World Government Bond Index-UnHedged (“Composite UnHedged Index”) and S&P 500® Index for the same time period. The graph and table do not reflect the deduction of taxes that a shareholder would pay on a Fund distribution or redemption of shares. The listed returns for the Fund are net of expenses and the returns for the indexes exclude expenses. Total returns would have been lower had certain expenses not been reduced.
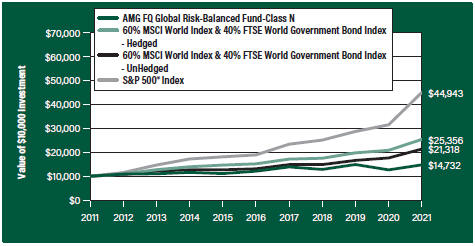
The table below shows the average annual total returns for the AMG FQ Global Risk-Balanced Fund and the AMG FQ Global Risk-Balanced Fund Composite Hedged and UnHedged Indexes and S&P 500® Index for the same time periods ended October 31, 2021.
| | | | | | | | | | | | |
| Average Annual Total Returns1 | | One
Year | | | Five
Years | | | Ten
Years | |
AMG FQ Global Risk-Balanced Fund2, 3, 4, 5, 6, 7, 8, 9, 10, 11, 12, 13, 14, 15, 16, 17 | |
| | | |
Class N | | | 16.52% | | | | 4.05% | | | | 3.95% | |
| | | |
Class I | | | 16.85% | | | | 4.35% | | | | 4.31% | |
| | | |
Class Z | | | 16.94% | | | | 4.47% | | | | 4.42% | |
| | | |
Composite Hedged Index18 | | | 21.86% | | | | 10.84% | | | | 9.75% | |
| | | |
Composite UnHedged Index18 | | | 21.02% | | | | 10.24% | | | | 7.87% | |
| | | |
S&P 500® Index19 | | | 42.91% | | | | 18.93% | | | | 16.21% | |
The performance data shown represents past performance. Past performance is not a guarantee of future results. Current performance may be lower or higher than the performance data quoted. The investment return and principal value of an investment will fluctuate so that an investor’s shares, when redeemed, may be worth more or less than their original cost.
Investors should carefully consider the Fund’s investment objectives, risks, charges and expenses before investing. For performance information through the most recent month end, current net asset values per share for the Fund and other information, please call 800.548.4539 or visit our website at amgfunds.com for a free prospectus. Read it carefully before investing or sending money.
Distributed by AMG Distributors, Inc., member FINRA/SIPC.
|
1 Total return equals income yield plus share price change and assumes reinvestment of all dividends and capital gain distributions. Returns are net of fees and may reflect offsets of Fund expenses as described in the prospectus. No adjustment has been made for taxes payable by shareholders on their reinvested dividends and capital gain distributions. Returns for periods greater than one year are annualized. The listed returns on the Fund are net of expenses and based on the published NAV as of October 31, 2021. All returns are in U.S. dollars ($). |
| |
2 From time to time, the Fund’s advisor has waived its fees and/or absorbed Fund expenses, which has resulted in higher returns. |
| |
3 Investments in international securities are subject to certain risks of overseas investing including currency fluctuations and changes in political and economic conditions, which could result in significant market fluctuations. These risks are magnified in emerging markets. |
| |
4 The Fund is subject to currency risk resulting from fluctuations in exchange rates that may affect the total loss or gain on a non-U.S. Dollar investment when converted back to U.S. Dollars. |
| |
5 The Fund is subject to the risks associated with investments in debt securities, such as default risk and fluctuations in the perception of the debtor’s ability to pay its creditors. Changing interest rates may adversely affect the value of an investment. An increase in interest rates typically causes the value of bonds and other fixed-income securities to fall. |
| |
6 Investments in commodities are subject to greater volatility than investments in traditional securities, such as stocks and bonds. Commodities are subject to risks, including but not limited to climate conditions, livestock disease, war, terrorism, political conflicts, interest rates, currency fluctuations, embargoes, tariffs and other regulatory developments. |
| |
7 Market prices of investments held by the Fund may fall rapidly or unpredictably due to a variety of economic or political factors, market conditions, disasters or public health issues, or in response to events that affect particular industries or companies. |
| |
8 The Fund may invest in derivatives such as options and futures; the complexity and rapidly changing structure of derivatives markets may increase the possibility of market losses. |
| |
9 The Fund is subject to the risks associated with investments in emerging markets, such as erratic earnings patterns, economic and political instability, changing exchange controls, limitations on repatriation of foreign capital and changes in local governmental attitudes toward private |
5
|
AMG FQ Global Risk-Balanced Fund Portfolio Manager’s Comments (continued) |
| | | | | | | | |
investment, possibly leading to nationalization or confiscation of investor assets. 10 Because exchange-traded funds (ETFs) incur their own costs, investing in them could result in a higher cost to the investor. Additionally, the Fund will be indirectly exposed to all the risks of securities held by the ETFs. 11 In managing the Fund, the Fund’s Subadviser may rely heavily on one or more quantitative models (“Model”) and information and data supplied by third parties (“Data”). When a Model or Data used in managing the Fund contains an error, or is incorrect or incomplete, any investment decision made in reliance on the Model or Data may not produce the desired results and the Fund may realize losses. In addition, any hedging based on a faulty Model or Data may prove to be unsuccessful. 12 High-yield bonds (also known as “junk bonds”) may be subject to greater levels of interest rate, credit, and liquidity risk than investments in higher rated securities. These securities are considered predominantly speculative with respect to the issuer’s continuing ability to make principal and interest payments. The issuers of the Fund’s holdings may be involved in bankruptcy proceedings, reorganizations, or financial restructurings, and are not as strong financially as higher-rated issuers. 13 The use of leverage in a Fund’s strategy, such as futures and forward commitment transactions, can magnify relatively small market movements into relatively larger losses for the Fund. 14 The Fund is subject to risks associated with investments in mid-capitalization companies such as greater price volatility, lower trading volume, and less liquidity than the stocks of larger, more established companies. | | | | 16 The Fund is subject to risks associated with investments in small-capitalization companies, such as erratic earnings patterns, competitive conditions, limited earnings history, and a reliance on one or a limited number of products. 17 Obligations of certain government agencies are not backed by the full faith and credit of the U.S. government. If one of these agencies defaulted on a loan, there is no guarantee that the U.S. government would provide financial support. Additionally, debt securities of the U.S. government may be affected by changing interest rates and subject to prepayment risk. 18 The benchmark is composed of 60% MSCI World Index and 40% FTSE World Government Bond Index. The MSCI World Index is a free float-adjusted market capitalization weighted index that is designed to measure the equity market performance of developed markets. The MSCI World Index consists of 23 developed market country indices. Please go to msci.com for most current list of countries represented by the index. The FTSE World Government Bond Index (FTSE) measures the performance of fixed-rate, local currency, investment grade sovereign bonds. The FTSE is a widely used benchmark that currently comprises sovereign debt from over 20 countries, denominated in a variety of currencies, and has more than 25 years of history available. Prior to July 31, 2018, the FTSE World Government Bond Index was known as the Citigroup World Government Bond Index. Unlike the Fund, the Composite Index is unmanaged, is not available for investment and does not incur fees. | | | | |
15 The Fund is subject to special risk considerations similar to those associated with the direct ownership of real estate. Real estate valuations may be subject to factors such as changing general and local economic, financial, competitive, and environmental conditions. | | | | 19 The S&P 500® Index is a capitalization-weighted index of 500 stocks. The S&P 500® Index is designed to measure performance of the broad domestic economy through changes in the aggregate market value of 500 stocks representing all major industries. Unlike the Fund, the S&P 500® Index is unmanaged, is not available for investment and does not incur expenses. All MSCI data is provided ‘as is’. The products described herein are not sponsored or endorsed and have not been reviewed or passed on by MSCI. In no event shall MSCI, its affiliates or any MSCI data provider have any liability of any kind in connection with the MSCI data or the products described herein. The S&P 500® Index is proprietary data of Standard & Poor’s, a division of McGraw-Hill Companies, Inc. Not FDIC insured, nor bank guaranteed. May lose value. | | | | |
6
|
AMG FQ Global Risk-Balanced Fund Schedule of Portfolio Investments October 31, 2021 |
| | | | | | | | |
| | | | | | | |
| | | Shares | | | Value | |
| |
Exchange Traded Funds - 53.1% | | | | | |
| | |
iShares Global Infrastructure ETF | | | 11,464 | | | | $547,635 | |
| | |
iShares iBoxx High Yield Corporate Bond ETF1,2 | | | 80,438 | | | | 6,992,475 | |
| | |
iShares TIPS Bond ETF | | | 52,521 | | | | 6,757,877 | |
| | |
Materials Select Sector SPDR Fund | | | 6,658 | | | | 566,729 | |
| | |
SPDR FTSE International Government Inflation-Protected Bond ETF2 | | | 24,923 | | | | 1,377,245 | |
| | |
VanEck Vectors Gold Miners ETF | | | 17,283 | | | | 548,044 | |
| | |
VanEck Vectors Natural Resource ETF | | | 11,469 | | | | 549,021 | |
| | |
Vanguard Global ex-U.S. Real Estate ETF | | | 3,311 | | | | 190,383 | |
| | |
Vanguard Real Estate ETF2 | | | 16,654 | | | | 1,815,952 | |
| |
Total Exchange Traded Funds | | | | | |
(Cost $18,154,308) | | | | | | | 19,345,361 | |
| | |
| | | Notes | | | | | |
| | | | | | | | |
| |
Exchange Traded Notes - 10.0% | | | | | |
| | |
Barclays PLC, iPath Bloomberg Commodity Index Total Return ETN, 06/12/36*,2 | | | 44,966 | | | | 1,359,322 | |
| | |
Deutsche Bank AG, DB Gold Double Long ETN, 02/15/38* | | | 19,814 | | | | 744,775 | |
| | |
Swedish Export Credit Corp., ELEMENTS Linked to the Rogers International Commodity Index Total Return, 10/24/22* | | | 217,804 | | | | 1,535,518 | |
| |
Total Exchange Traded Notes | | | | | |
(Cost $2,501,057) | | | | | | | 3,639,615 | |
| |
Purchased Options - 0.4% | | | | | |
| |
(See Open Exchange Traded Purchased Options schedule) | | | | | |
(Cost $363,254) | | | | | | | 145,210 | |
| | | Principal
Amount | | | | |
| |
Short-Term Investments - 47.6% | | | | | |
| |
Joint Repurchase Agreements - 9.8%3 | | | | | |
| | |
Bank of America Securities, Inc., dated 10/29/21, due 11/01/21, 0.050% total to be received $1,000,004 (collateralized by various U.S. Government Agency Obligations, 1.500% - 5.000%, 09/01/28 - 01/01/59, totaling $1,020,000) | | | $1,000,000 | | | | 1,000,000 | |
| | |
Daiwa Capital Markets America, dated 10/29/21, due 11/01/21, 0.050% total to be received $565,954 (collateralized by various U.S. Government Agency Obligations and U.S. Treasuries, 0.000% - 6.500%, 11/01/21 - 11/01/51, totaling $577,271) | | | 565,952 | | | | 565,952 | |
| | | | | | | | |
| | | Principal
Amount | | | Value | |
| | |
Deutsche Bank Securities, Inc., dated 10/29/21, due 11/01/21, 0.050% total to be received $1,000,004 (collateralized by various U.S. Government Agency Obligations and U.S. Treasuries, 0.000% - 8.000%, 11/04/21 - 08/15/51, totaling $1,020,000) | | | $1,000,000 | | | | $1,000,000 | |
| | |
RBC Dominion Securities, Inc., dated 10/29/21, due 11/01/21, 0.050% total to be received $1,000,004 (collateralized by various U.S. Government Agency Obligations and U.S. Treasuries, 0.000% - 6.000%, 11/01/21 - 07/20/51, totaling $1,020,000) | | | 1,000,000 | | | | 1,000,000 | |
| |
Total Joint Repurchase Agreements | | | | 3,565,952 | |
| |
U.S. Government Obligations - 22.0% | | | | | |
| | |
U.S. Treasury Bills, 0.035%, 01/13/221,4,5 | | | 2,500,000 | | | | 2,499,685 | |
| | |
U.S. Treasury Bills, 0.040%, 12/16/214,5 | | | 2,500,000 | | | | 2,499,875 | |
| | |
U.S. Treasury Bills, 0.043%, 11/18/215 | | | 3,000,000 | | | | 2,999,940 | |
| |
Total U.S. Government Obligations | | | | 7,999,500 | |
| | |
| | | Shares | | | | | |
| | | | | | | | |
| |
Other Investment Companies - 15.8% | | | | | |
| | |
Dreyfus Government Cash Management Fund, Institutional Shares, 0.03%6 | | | 1,901,905 | | | | 1,901,905 | |
| | |
Dreyfus Institutional Preferred Government Money Market Fund, Institutional Shares, 0.01%6 | | | 1,901,905 | | | | 1,901,905 | |
| | |
JPMorgan U.S. Government Money Market Fund, IM Shares, 0.03%6 | | | 1,959,538 | | | | 1,959,538 | |
| |
Total Other Investment Companies | | | | 5,763,348 | |
| | |
Total Short-Term Investments | | | | | | | | |
(Cost $17,328,938) | | | | | | | 17,328,800 | |
| | |
Total Investments - 111.1% | | | | | | | | |
(Cost $38,347,557) | | | | | | | 40,458,986 | |
| | |
Derivatives - (2.2)%7 | | | | | | | (815,667 | ) |
| |
Other Assets, less Liabilities - (8.9)% | | | | (3,242,217 | ) |
| | |
Net Assets - 100.0% | | | | | | | $36,401,102 | |
| * | Non-income producing security. |
| 1 | Some or all of these securities were held as collateral for written options as of October 31, 2021, amounting to $5,794,046 or 15.9% of net assets. |
| 2 | Some of these securities, amounting to $5,256,320 or 14.4% of net assets, were out on loan to various borrowers and are collateralized by cash and various U.S. Treasury Obligations. See Note 4 of Notes to Financial Statements. |
The accompanying notes are an integral part of these financial statements.
7
|
AMG FQ Global Risk-Balanced Fund Schedule of Portfolio Investments (continued) |
| 3 | Cash collateral received for securities lending activity was invested in these joint repurchase agreements. |
| 4 | Some or all of this security is held as collateral for futures contracts. The market value of collateral at October 31, 2021, amounted to $2,799,784, or 7.7% of net assets. |
| 5 | Represents yield to maturity at October 31, 2021. |
| 6 | Yield shown represents the October 31, 2021, seven day average yield, which refers to the sum of the previous seven days’ dividends paid, expressed as an annual percentage. |
| 7 | Includes Exchange Traded Written Options and Futures Contracts. Please refer to the Open Exchange Traded Written Options and Open Futures Contracts tables for the details. |
| | |
ETF ETN SPDR TIPS | | Exchange Traded Fund Exchange Traded Notes Standard & Poor’s Depositary Receipt Treasury Inflation-Protected Securities |
| | | | | | | | | | | | | | | | | | | | | | | | |
Open Exchange Traded Purchased Options | | | | | | | | | | | | | | | | | | | | | | | | |
Description | | | Strike Price | | | | Expiration Date | | |
| Number of
Contracts |
| |
| Notional
Amount |
| | | Cost | | | | Value | |
| | | | | | |
EURO STOXX 50 (Put) | | | 3,775 | | | | 11/19/21 | | | | 1 | | | | $37,750 | | | | $766 | | | $ | 53 | |
| | | | | | |
EURO STOXX 50 (Put) | | | 3,825 | | | | 12/17/21 | | | | 16 | | | | 612,000 | | | | 12,790 | | | | 3,773 | |
| | | | | | |
EURO STOXX 50 (Put) | | | 3,850 | | | | 01/21/22 | | | | 36 | | | | 1,386,000 | | | | 26,409 | | | | 18,103 | |
| | | | | | |
EURO STOXX 50 (Put) | | | 3,900 | | | | 12/17/21 | | | | 20 | | | | 780,000 | | | | 10,354 | | | | 6,012 | |
| | | | | | |
EURO STOXX 50 (Put) | | | 3,900 | | | | 11/19/21 | | | | 34 | | | | 1,326,000 | | | | 21,672 | | | | 2,869 | |
| | | | | | |
S&P 500 Index (Put) | | | 4,120 | | | | 11/19/21 | | | | 3 | | | | 1,236,000 | | | | 22,616 | | | | 1,410 | |
| | | | | | |
S&P 500 Index (Put) | | | 4,125 | | | | 12/17/21 | | | | 10 | | | | 4,125,000 | | | | 74,536 | | | | 21,450 | |
| | | | | | |
S&P 500 Index (Put) | | | 4,140 | | | | 01/21/22 | | | | 15 | | | | 6,210,000 | | | | 96,924 | | | | 71,100 | |
| | | | | | |
S&P 500 Index (Put) | | | 4,180 | | | | 11/19/21 | | | | 13 | | | | 5,434,000 | | | | 74,394 | | | | 7,475 | |
| | | | | | |
S&P 500 Index (Put) | | | 4,200 | | | | 12/17/21 | | | | 5 | | | | 2,100,000 | | | | 22,793 | | | | 12,965 | |
| | | | | | | | | | | | | | | | | | | | | | | | |
| | | | | | |
| | | | | | | | | | | | | | | Total | | | | $363,254 | | | $ | 145,210 | |
| | | | | | | | | | | | | | | | | | | | | | | | |
Open Exchange Traded Written Options | | | | | | | | | | | | | | | | | | | | | | | | |
Description | | | Strike Price | | | | Expiration Date | | |
| Number of
Contracts |
| |
| Notional
Amount |
| | | Premium | | | | Value | |
| | | | | | |
EURO STOXX 50 (Call) | | | 4,400 | | | | 12/17/21 | | | | 20 | | | | $880,000 | | | | $2,946 | | | $ | (4,277 | ) |
| | | | | | |
EURO STOXX 50 (Call) | | | 4,400 | | | | 11/19/21 | | | | 34 | | | | 1,496,000 | | | | 5,783 | | | | (1,415 | ) |
| | | | | | |
EURO STOXX 50 (Call) | | | 4,425 | | | | 11/19/21 | | | | 1 | | | | 44,250 | | | | 200 | | | | (25 | ) |
| | | | | | |
EURO STOXX 50 (Call) | | | 4,450 | | | | 12/17/21 | | | | 16 | | | | 712,000 | | | | 3,566 | | | | (1,794 | ) |
| | | | | | |
EURO STOXX 50 (Call) | | | 4,450 | | | | 01/21/22 | | | | 36 | | | | 1,602,000 | | | | 7,809 | | | | (11,819 | ) |
| | | | | | |
EURO STOXX 50 (Put) | | | 3,625 | | | | 11/19/21 | | | | 1 | | | | 36,250 | | | | 555 | | | | (34 | ) |
| | | | | | |
EURO STOXX 50 (Put) | | | 3,675 | | | | 12/17/21 | | | | 16 | | | | 588,000 | | | | 9,163 | | | | (2,405 | ) |
| | | | | | |
EURO STOXX 50 (Put) | | | 3,700 | | | | 01/21/22 | | | | 36 | | | | 1,332,000 | | | | 18,045 | | | | (12,526 | ) |
| | | | | | |
EURO STOXX 50 (Put) | | | 3,800 | | | | 12/17/21 | | | | 20 | | | | 760,000 | | | | 7,425 | | | | (4,370 | ) |
| | | | | | |
EURO STOXX 50 (Put) | | | 3,800 | | | | 11/19/21 | | | | 34 | | | | 1,292,000 | | | | 16,318 | | | | (1,965 | ) |
| | | | | | |
S&P 500 Index (Call) | | | 4,710 | | | | 11/19/21 | | | | 13 | | | | 6,123,000 | | | | 12,719 | | | | (9,945 | ) |
| | | | | | |
S&P 500 Index (Call) | | | 4,720 | | | | 12/17/21 | | | | 5 | | | | 2,360,000 | | | | 5,962 | | | | (14,950 | ) |
| | | | | | |
S&P 500 Index (Call) | | | 4,730 | | | | 11/19/21 | | | | 3 | | | | 1,419,000 | | | | 5,707 | | | | (1,395 | ) |
| | | | | | |
S&P 500 Index (Call) | | | 4,750 | | | | 12/17/21 | | | | 10 | | | | 4,750,000 | | | | 16,824 | | | | (22,000 | ) |
| | | | | | |
S&P 500 Index (Call) | | | 4,780 | | | | 01/21/22 | | | | 15 | | | | 7,170,000 | | | | 27,096 | | | | (57,615 | ) |
| | | | | | |
S&P 500 Index (Put) | | | 3,975 | | | | 11/19/21 | | | | 3 | | | | 1,192,500 | | | | 16,924 | | | | (960 | ) |
| | | | | | |
S&P 500 Index (Put) | | | 3,990 | | | | 01/21/22 | | | | 15 | | | | 5,985,000 | | | | 68,856 | | | | (51,450 | ) |
| | | | | | |
S&P 500 Index (Put) | | | 4,005 | | | | 12/17/21 | | | | 10 | | | | 4,005,000 | | | | 57,864 | | | | (14,500 | ) |
The accompanying notes are an integral part of these financial statements.
8
|
AMG FQ Global Risk-Balanced Fund Schedule of Portfolio Investments (continued) |
| | | | | | | | | | | | | | | | | | | | | | | | |
| Description | | Strike Price | | | Expiration Date | | | Number of Contracts | | | Notional Amount | | | Premium | | | Value | |
| | | | | | |
S&P 500 Index (Put) | | | 4,085 | | | | 11/19/21 | | | | 13 | | | | $5,310,500 | | | | $58,362 | | | | $(6,110 | ) |
| | | | | | |
S&P 500 Index (Put) | | | 4,100 | | | | 12/17/21 | | | | 5 | | | | 2,050,000 | | | | 16,982 | | | | (9,750 | ) |
| | | | | | | | | | | | | | | | | | | | | | | | |
| | | | | | |
| | | | | | | | | | | | | | | Total | | | | $359,106 | | | | $(229,305 | ) |
| | | | | | | | | | | | | | | | | | | | | | | | |
Open Futures Contracts
| | | | | | | | | | | | | | | | | | | | | | | | |
| Description | | Currency | | | Number of Contracts | | | Position | | | Expiration Date | | | Current Notional Amount | | | Value and Unrealized Gain/(Loss) | |
| | | | | | |
CBOT U.S. Long Bond | | | USD | | | | 29 | | | | Long | | | | 12/21/21 | | | $ | 4,664,469 | | | $ | (44,656 | ) |
| | | | | | |
CME E-mini Russell 2000 Index | | | USD | | | | 36 | | | | Long | | | | 12/17/21 | | | | 4,131,540 | | | | 89,217 | |
| | | | | | |
Eurex 30 Year Euro BUXL | | | EUR | | | | 16 | | | | Long | | | | 12/08/21 | | | | 3,865,294 | | | | 92,791 | |
| | | | | | |
Eurex EURO STOXX 50 | | | EUR | | | | 87 | | | | Long | | | | 12/17/21 | | | | 4,261,236 | | | | 68,767 | |
| | | | | | |
FTSE 100 Index | | | GBP | | | | 11 | | | | Long | | | | 12/17/21 | | | | 1,087,504 | | | | 30,922 | |
| | | | | | |
ICE U.S. MSCI Emerging Markets EM Index | | | USD | | | | 51 | | | | Long | | | | 12/17/21 | | | | 3,218,100 | | | | (122,730 | ) |
| | | | | | |
Long Gilt | | | GBP | | | | 37 | | | | Long | | | | 12/29/21 | | | | 6,325,493 | | | | (199,563 | ) |
| | | | | | |
Micro E-mini S&P 500 | | | USD | | | | 62 | | | | Long | | | | 12/17/21 | | | | 1,425,070 | | | | 23,998 | |
| | | | | | |
Mini Hang Seng Index | | | HKD | | | | 23 | | | | Long | | | | 11/29/21 | | | | 748,014 | | | | (18,803 | ) |
| | | | | | |
Montreal Exchange 10 Year Canadian Bond | | | CAD | | | | 42 | | | | Long | | | | 12/20/21 | | | | 4,783,371 | | | | (164,691 | ) |
| | | | | | |
Montreal Exchange S&P/TSX 60 Index | | | CAD | | | | 6 | | | | Long | | | | 12/16/21 | | | | 1,222,204 | | | | 33,583 | |
| | | | | | |
SFE 10 Year Australian Bond | | | AUD | | | | 46 | | | | Long | | | | 12/15/21 | | | | 4,666,330 | | | | (333,500 | ) |
| | | | | | |
SFE S&P ASX Share Price Index 200 | | | AUD | | | | 12 | | | | Long | | | | 12/16/21 | | | | 1,642,914 | | | | (27,572 | ) |
| | | | | | |
TSE Mini Topix | | | JPY | | | | 58 | | | | Long | | | | 12/09/21 | | | | 1,013,950 | | | | (14,125 | ) |
| | | | | | | | | | | | | | | | | | | | | | | | |
| | | | | | |
| | | | | | | | | | | | | | | | | | | Total | | | $ | (586,362 | ) |
| | | | | | | | | | | | | | | | | | | | | | | | |
CURRENCY ABBREVIATIONS:
| | |
| AUD | | Australian Dollar |
| CAD | | Canadian Dollar |
| EUR | | Euro Dollar |
| GBP | | British Pound |
| HKD | | Hong Kong Dollar |
| JPY | | Japanese Yen |
| USD | | U.S. Dollar |
The accompanying notes are an integral part of these financial statements.
9
|
AMG FQ Global Risk-Balanced Fund Schedule of Portfolio Investments (continued) |
The following table summarizes the inputs used to value the Fund’s investments by the fair value hierarchy levels as of October 31, 2021:
| | | | | | | | | | | | | | | | |
| | | Level 1 | | | Level 2 | | | Level 3 | | | Total | |
| | | | |
Investments in Securities | | | | | | | | | | | | | | | | |
| | | | |
Exchange Traded Funds† | | | $19,345,361 | | | | – | | | | – | | | | $19,345,361 | |
| | | | |
Exchange Traded Notes† | | | 3,639,615 | | | | – | | | | – | | | | 3,639,615 | |
| | | | |
Purchased Options | | | | | | | | | | | | | | | | |
| | | | |
Equity Contracts | | | 145,210 | | | | – | | | | – | | | | 145,210 | |
| | | | |
Short-Term Investments | | | | | | | | | | | | | | | | |
| | | | |
Joint Repurchase Agreements | | | – | | | | $3,565,952 | | | | – | | | | 3,565,952 | |
| | | | |
U.S. Government Obligations | | | – | | | | 7,999,500 | | | | – | | | | 7,999,500 | |
| | | | |
Other Investment Companies | | | 5,763,348 | | | | – | | | | – | | | | 5,763,348 | |
| | | | |
| | | | | | | | | | | | | | | | |
| | | | |
Total Investments in Securities | | | $28,893,534 | | | | $11,565,452 | | | | – | | | | $40,458,986 | |
| | | | | | | | | | | | | | | | |
| | | | |
Financial Derivative Instruments - Assets | | | | | | | | | | | | | | | | |
| | | | |
Equity Futures Contracts | | | $246,487 | | | | – | | | | – | | | | $246,487 | |
| | | | |
Interest Rate Futures Contracts | | | 92,791 | | | | – | | | | – | | | | 92,791 | |
| | | | |
Financial Derivative Instruments - Liabilities | | | | | | | | | | | | | | | | |
| | | | |
Equity Futures Contracts | | | (183,230 | ) | | | – | | | | – | | | | (183,230 | ) |
| | | | |
Equity Written Options | | | (229,305 | ) | | | – | | | | – | | | | (229,305 | ) |
| | | | |
Interest Rate Futures Contracts | | | (742,410 | ) | | | – | | | | – | | | | (742,410 | ) |
| | | | |
| | | | | | | | | | | | | | | | |
| | | | |
Total Financial Derivative Instruments | | | $(815,667 | ) | | | – | | | | – | | | | $(815,667 | ) |
| | | | | | | | | | | | | | | | |
| † | All exchange traded funds and exchange traded notes held in the Fund are level 1 securities. For a detailed listing of these securities, please refer to the Fund’s Schedule of Portfolio Investments. |
For the fiscal year ended October 31, 2021, there were no transfers in or out of Level 3.
The following schedule shows the value of derivative instruments at October 31, 2021:
| | | | | | | | | | | | |
| | | Asset Derivatives | | | Liability Derivatives | |
| | | | |
Derivatives not accounted for as hedging instruments | | Statement of Assets and Liabilities Location | | Fair Value | | | Statement of Assets and Liabilities Location | | Fair Value | |
| | | | |
Equity contracts | | Options purchased1 | | | $145,210 | | | Options written | | | $229,305 | |
| | | | |
Equity contracts | | Receivable for variation margin2 | | | 23,241 | | | Payable for variation margin2 | | | 85,510 | |
| | | | |
Interest rate contracts | | Receivable for variation margin2 | | | 9,969 | | | Payable for variation margin2 | | | 137,321 | |
| | | | | | | | | | | | |
| | | | |
| | Totals | | | $178,420 | | | | | | $452,136 | |
| | | | | | | | | | | | |
The accompanying notes are an integral part of these financial statements.
10
|
AMG FQ Global Risk-Balanced Fund Schedule of Portfolio Investments (continued) |
For the fiscal year ended October 31, 2021, the effect of derivative instruments on the Statement of Operations for the Fund and the amount of realized gain/loss and unrealized appreciation/depreciation on derivatives recognized in income was as follows:
| | | | | | | | | | | | | | |
| | | Realized Gain/(Loss) | | | Change in Unrealized Appreciation/Depreciation | |
| | | | |
Derivatives not accounted for as hedging instruments | | Statement of Operations Location | | Realized
Gain/(Loss) | | | Statement of Operations Location | | | Change in
Unrealized
Appreciation/
Depreciation | |
| | | | |
Equity contracts | | Net realized loss on options purchased1 | | | $(2,040,378 | ) | |
| Net change in unrealized appreciation/
depreciation on options purchased1 |
| | | $(384,320 | ) |
| | | | |
Equity contracts | | Net realized gain on options written | | | 764,886 | | |
| Net change in unrealized appreciation/
depreciation on options written |
| | | 46,276 | |
| | | | |
Interest rate contracts | | Net realized loss on futures contracts | | | (1,243,360 | ) | |
| Net change in unrealized appreciation/
depreciation on futures contracts |
| | | (496,495 | ) |
| | | | |
Equity contracts | | Net realized gain on futures contracts | | | 5,490,725 | | |
| Net change in unrealized appreciation/
depreciation on futures contracts |
| | | 668,977 | |
| | | | | | | | | | | | | | |
| | | | |
| | Totals | | | $2,971,873 | | | | | | | | $(165,562 | ) |
| | | | | | | | | | | | | | |
1 Options purchased are included in investments at value on the Statement of Assets and Liabilities. Net realized gain/(loss) on options purchased and net change in unrealized appreciation/depreciation on options purchased are included in the net realized gain/(loss) on investments and net change in unrealized appreciation/depreciation of investments, respectively, on the Statement of Operations.
2 Only current day’s variation margin is reported within the Statement of Assets and Liabilities. The variation margin is included in the open futures cumulative depreciation of $(586,362).
The accompanying notes are an integral part of these financial statements.
11
|
Statement of Assets and Liabilities October 31, 2021 |
| | | | |
| | | AMG
FQ Global
Risk-Balanced Fund | |
Assets: | | | | |
Investments at value1 (including securities on loan valued at $5,256,320) | | | $40,458,986 | |
Dividend and interest receivables | | | 101 | |
Securities lending income receivable | | | 3,063 | |
Receivable for Fund shares sold | | | 355 | |
Receivable from affiliate | | | 9,100 | |
Receivable for variation margin | | | 33,210 | |
Prepaid expenses and other assets | | | 4,461 | |
Total assets | | | 40,509,276 | |
Liabilities: | | | | |
Payable upon return of securities loaned | | | 3,565,952 | |
Payable for Fund shares repurchased | | | 8,757 | |
Written options2 | | | 229,305 | |
Payable for variation margin | | | 222,831 | |
Accrued expenses: | | | | |
Investment advisory and management fees | | | 18,521 | |
Administrative fees | | | 4,630 | |
Distribution fees | | | 248 | |
Shareholder service fees | | | 376 | |
Other | | | 57,554 | |
| |
Total liabilities | | | 4,108,174 | |
| |
| | | | |
| |
Net Assets | | | $36,401,102 | |
1 Investments at cost | | | $38,347,557 | |
2 Premiums received | | | $359,106 | |
The accompanying notes are an integral part of these financial statements.
12
|
Statement of Assets and Liabilities (continued) |
| | | | |
| | | AMG
FQ Global
Risk-Balanced Fund | |
| |
Net Assets Represent: | | | | |
Paid-in capital | | | $37,650,998 | |
Total distributable loss | | | (1,249,896 | ) |
Net Assets | | | $36,401,102 | |
| |
Class N: | | | | |
Net Assets | | | $1,175,430 | |
Shares outstanding | | | 74,569 | |
| |
Net asset value, offering and redemption price per share | | | $15.76 | |
Class I: | | | | |
Net Assets | | | $1,694,854 | |
Shares outstanding | | | 106,966 | |
| |
Net asset value, offering and redemption price per share | | | $15.84 | |
Class Z: | | | | |
Net Assets | | | $33,530,818 | |
Shares outstanding | | | 2,115,553 | |
| |
Net asset value, offering and redemption price per share | | | $15.85 | |
The accompanying notes are an integral part of these financial statements.
13
|
Statement of Operations For the fiscal year ended October 31, 2021 |
| | | | |
| | | AMG
FQ Global
Risk-Balanced Fund | |
Investment Income: | | | | |
Dividend income | | | $747,642 | |
Interest income | | | 2,516 | |
Securities lending income | | | 47,441 | |
Total investment income | | | 797,599 | |
Expenses: | | | | |
Investment advisory and management fees | | | 235,589 | |
Administrative fees | | | 58,897 | |
Distribution fees - Class N | | | 3,018 | |
Shareholder servicing fees - Class N | | | 1,811 | |
Shareholder servicing fees - Class I | | | 2,607 | |
Professional fees | | | 42,137 | |
Custodian fees | | | 19,254 | |
Registration fees | | | 18,999 | |
Transfer agent fees | | | 11,583 | |
Reports to shareholders | | | 10,807 | |
Trustee fees and expenses | | | 2,837 | |
Miscellaneous | | | 3,301 | |
Total expenses before offsets | | | 410,840 | |
Expense reimbursements | | | (53,948 | ) |
Expense reductions | | | (1,481 | ) |
Net expenses | | | 355,411 | |
| |
| | | | |
Net investment income | | | 442,188 | |
Net Realized and Unrealized Gain: | | | | |
Net realized loss on investments | | | (1,522,644 | ) |
Net realized gain on futures contracts | | | 4,247,365 | |
Net realized gain on written options | | | 764,886 | |
Net realized loss on foreign currency transactions | | | (17,222 | ) |
| |
Net change in unrealized appreciation/depreciation on investments | | | 2,146,421 | |
| |
Net change in unrealized appreciation/depreciation on futures contracts | | | 172,482 | |
| |
Net change in unrealized appreciation/depreciation on written options | | | 46,276 | |
| |
Net change in unrealized appreciation/depreciation on foreign currency translations | | | (1,416 | ) |
Net realized and unrealized gain | | | 5,836,148 | |
| |
| | | | |
Net increase in net assets resulting from
operations | | | $6,278,336 | |
The accompanying notes are an integral part of these financial statements.
14
|
Statements of Changes in Net Assets For the fiscal years ended October 31, |
| | | | | | | | |
| | | AMG
FQ Global
Risk-Balanced Fund | |
| | | 2021 | | | 2020 | |
| | |
Increase (Decrease) in Net Assets Resulting From Operations: | | | | | | | | |
Net investment income | | | $442,188 | | | | $245,432 | |
Net realized gain (loss) on investments | | | 3,472,385 | | | | (6,013,420 | ) |
Net change in unrealized appreciation/depreciation on investments | | | 2,363,763 | | | | (1,730,052 | ) |
| | |
Net increase (decrease) in net assets resulting from operations | | | 6,278,336 | | | | (7,498,040 | ) |
Distributions to Shareholders: | | | | | | | | |
Class N | | | (3,955 | ) | | | (81,284 | ) |
Class I | | | (10,887 | ) | | | (81,571 | ) |
Class Z | | | (298,407 | ) | | | (1,851,649 | ) |
Total distributions to shareholders | | | (313,249 | ) | | | (2,014,504 | ) |
Capital Share Transactions:1 | | | | | | | | |
| | |
Net decrease from capital share transactions | | | (8,394,212 | ) | | | (5,341,377 | ) |
| | | | | | | | |
| | |
Total decrease in net assets | | | (2,429,125 | ) | | | (14,853,921 | ) |
Net Assets: | | | | | | | | |
Beginning of year | | | 38,830,227 | | | | 53,684,148 | |
End of year | | | $36,401,102 | | | | $38,830,227 | |
| 1 | See Note 1(g) of the Notes to Financial Statements. |
The accompanying notes are an integral part of these financial statements.
15
|
AMG FQ Global Risk-Balanced Fund Financial Highlights For a share outstanding throughout each fiscal year |
| | | | | | | | | | | | | | | | | | | | |
| | | For the fiscal years ended October 31, | |
| | | | | |
| Class N | | 2021 | | | 2020 | | | 2019 | | | 2018 | | | 2017 | |
Net Asset Value, Beginning of Year | | | $13.57 | | | | $16.54 | | | | $14.56 | | | | $15.77 | | | | $13.89 | |
Income (loss) from Investment Operations: | | | | | | | | | | | | | | | | | | | | |
Net investment income1,2 | | | 0.11 | | | | 0.02 | | | | 0.21 | | | | 0.26 | | | | 0.11 | |
| | | | | |
Net realized and unrealized gain (loss) on investments | | | 2.13 | | | | (2.41 | ) | | | 2.06 | | | | (1.43 | ) | | | 1.91 | |
Total income (loss) from investment operations | | | 2.24 | | | | (2.39 | ) | | | 2.27 | | | | (1.17 | ) | | | 2.02 | |
Less Distributions to Shareholders from: | | | | | | | | | | | | | | | | | | | | |
Net investment income | | | (0.05 | ) | | | (0.58 | ) | | | (0.29 | ) | | | (0.04 | ) | | | (0.14 | ) |
Net Asset Value, End of Year | | | $15.76 | | | | $13.57 | | | | $16.54 | | | | $14.56 | | | | $15.77 | |
Total Return2,3 | | | 16.52 | % | | | (15.01 | )% | | | 15.98 | % | | | (7.43 | )% | | | 14.69 | % |
Ratio of net expenses to average net assets | | | 1.29 | %4 | | | 1.28 | %4 | | | 1.29 | % | | | 1.29 | % | | | 1.33 | % |
Ratio of gross expenses to average net assets5 | | | 1.43 | % | | | 1.45 | % | | | 1.41 | % | | | 1.37 | % | | | 1.39 | % |
| | | | | |
Ratio of net investment income to average net assets2 | | | 0.75 | % | | | 0.17 | % | | | 1.38 | % | | | 1.67 | % | | | 0.76 | % |
Portfolio turnover | | | 35 | % | | | 193 | % | | | 15 | % | | | 27 | % | | | 26 | % |
Net assets end of year (000’s) omitted | | | $1,175 | | | | $1,110 | | | | $2,340 | | | | $1,870 | | | | $2,200 | |
| | | | | | | | | | | | | | | | | | | | | |
16
|
AMG FQ Global Risk-Balanced Fund Financial Highlights For a share outstanding throughout each fiscal year |
| | | | | | | | | | | | | | | | | | | | |
| | | For the fiscal years ended October 31, | |
| | | | | |
| Class I | | 2021 | | | 2020 | | | 2019 | | | 2018 | | | 2017 | |
Net Asset Value, Beginning of Year | | | $13.65 | | | | $16.62 | | | | $14.64 | | | | $15.83 | | | | $13.97 | |
Income (loss) from Investment Operations: | | | | | | | | | | | | | | | | | | | | |
Net investment income1,2 | | | 0.15 | | | | 0.06 | | | | 0.25 | | | | 0.30 | | | | 0.16 | |
| | | | | |
Net realized and unrealized gain (loss) on investments | | | 2.13 | | | | (2.42 | ) | | | 2.06 | | | | (1.44 | ) | | | 1.92 | |
Total income (loss) from investment operations | | | 2.28 | | | | (2.36 | ) | | | 2.31 | | | | (1.14 | ) | | | 2.08 | |
Less Distributions to Shareholders from: | | | | | | | | | | | | | | | | | | | | |
Net investment income | | | (0.09 | ) | | | (0.61 | ) | | | (0.33 | ) | | | (0.05 | ) | | | (0.22 | ) |
Net Asset Value, End of Year | | | $15.84 | | | | $13.65 | | | | $16.62 | | | | $14.64 | | | | $15.83 | |
Total Return2,3 | | | 16.85 | % | | | (14.75 | )% | | | 16.23 | % | | | (7.20 | )% | | | 15.14 | % |
Ratio of net expenses to average net assets | | | 1.04 | %4 | | | 1.03 | %4 | | | 1.04 | % | | | 1.04 | % | | | 0.99 | % |
Ratio of gross expenses to average net assets5 | | | 1.18 | % | | | 1.20 | % | | | 1.16 | % | | | 1.12 | % | | | 1.05 | % |
| | | | | |
Ratio of net investment income to average net assets2 | | | 1.00 | % | | | 0.42 | % | | | 1.63 | % | | | 1.92 | % | | | 1.09 | % |
Portfolio turnover | | | 35 | % | | | 193 | % | | | 15 | % | | | 27 | % | | | 26 | % |
Net assets end of year (000’s) omitted | | | $1,695 | | | | $1,528 | | | | $2,182 | | | | $1,484 | | | | $1,420 | |
| | | | | | | | | | | | | | | | | | | | | |
17
|
AMG FQ Global Risk-Balanced Fund Financial Highlights For a share outstanding throughout each fiscal year |
| | | | | | | | | | | | | | | | | | | | |
| | | For the fiscal years ended October 31, | |
| | | | | |
| Class Z | | 2021 | | | 2020 | | | 2019 | | | 2018 | | | 2017 | |
Net Asset Value, Beginning of Year | | | $13.66 | | | | $16.62 | | | | $14.64 | | | | $15.87 | | | | $14.00 | |
Income (loss) from Investment Operations: | | | | | | | | | | | | | | | | | | | | |
Net investment income1,2 | | | 0.18 | | | | 0.08 | | | | 0.28 | | | | 0.32 | | | | 0.18 | |
| | | | | |
Net realized and unrealized gain (loss) on investments | | | 2.13 | | | | (2.40 | ) | | | 2.05 | | | | (1.44 | ) | | | 1.92 | |
Total income (loss) from investment operations | | | 2.31 | | | | (2.32 | ) | | | 2.33 | | | | (1.12 | ) | | | 2.10 | |
Less Distributions to Shareholders from: | | | | | | | | | | | | | | | | | | | | |
Net investment income | | | (0.12 | ) | | | (0.64 | ) | | | (0.35 | ) | | | (0.11 | ) | | | (0.23 | ) |
Net Asset Value, End of Year | | | $15.85 | | | | $13.66 | | | | $16.62 | | | | $14.64 | | | | $15.87 | |
Total Return2,3 | | | 16.94 | % | | | (14.57 | )% | | | 16.43 | % | | | (7.13 | )% | | | 15.23 | % |
Ratio of net expenses to average net assets | | | 0.89 | %4 | | | 0.88 | %4 | | | 0.89 | % | | | 0.89 | % | | | 0.89 | % |
Ratio of gross expenses to average net assets5 | | | 1.03 | % | | | 1.05 | % | | | 1.01 | % | | | 0.97 | % | | | 0.95 | % |
| | | | | |
Ratio of net investment income to average net assets2 | | | 1.15 | % | | | 0.57 | % | | | 1.78 | % | | | 2.07 | % | | | 1.19 | % |
Portfolio turnover | | | 35 | % | | | 193 | % | | | 15 | % | | | 27 | % | | | 26 | % |
Net assets end of year (000’s) omitted | | | $33,531 | | | | $36,192 | | | | $49,163 | | | | $50,058 | | | | $59,712 | |
| | | | | | | | | | | | | | | | | | | | | |
| 1 | Per share numbers have been calculated using average shares. |
| 2 | Total returns and net investment income would have been lower had certain expenses not been offset. |
| 3 | The total return is calculated using the published Net Asset Value as of fiscal year end. |
| 4 | Includes reduction from broker recapture amounting to less than 0.01% and 0.01% for the fiscal years ended 2021 and 2020. |
| 5 | Excludes the impact of expense reimbursement or fee waivers and expense reductions such as brokerage credits, but includes expense repayments and non-reimbursable expenses, if any, such as interest, taxes, and extraordinary expenses. (See Note 1(c) and 2 in the Notes to Financial Statements.) |
18
|
Notes to Financial Statements October 31, 2021 |
1. ORGANIZATION AND SUMMARY OF SIGNIFICANT ACCOUNTING POLICIES
AMG Funds I (the “Trust”) is an open-end management investment company, organized as a Massachusetts business trust, and registered under the Investment Company Act of 1940, as amended (the “1940 Act”). Currently, the Trust consists of a number of different funds, each having distinct investment management objectives, strategies, risks, and policies. Included in this report is AMG FQ Global Risk-Balanced Fund (the “Fund”).
The Fund offers Class N, Class I and Class Z shares. Each class represents an interest in the same assets of the Fund. Although all share classes generally have identical voting rights, each share class votes separately when required by law. Different share classes may have different net asset values per share to the extent the share classes pay different distribution amounts and/or the expenses of such share classes differ. Each share class has its own expense structure. Please refer to a current prospectus for additional information on each share class.
Market disruptions associated with the COVID-19 pandemic have had a global impact, and uncertainty exists as to the long-term implications. Such disruptions can adversely affect assets of the Fund and thus Fund performance.
The Fund’s financial statements are prepared in accordance with accounting principles generally accepted in the United States of America (“U.S. GAAP”), including accounting and reporting guidance pursuant to Accounting Standards Codification Topic 946 applicable to investment companies. U.S. GAAP requires management to make estimates and assumptions that affect the reported amounts of assets and liabilities and disclosure of contingent assets and liabilities at the date of the financial statements and the reported amounts of income and expenses during the reporting period. Actual results could differ from those estimates and such differences could be material. The following is a summary of significant accounting policies followed by the Fund in the preparation of its financial statements:
a. VALUATION OF INVESTMENTS
Equity securities, including option contracts, traded on a national securities exchange or reported on the NASDAQ national market system (“NMS”) are valued at the last quoted sales price on the primary exchange or, if applicable, the NASDAQ official closing price or the official closing price of the relevant exchange or, lacking any sales, at the last quoted mean between the last quoted bid and ask prices (the “mean price”). Equity securities traded in the over-the-counter market (other than NMS securities) are valued at the mean price. Foreign equity securities (securities principally traded in markets other than U.S. markets) are valued at the official closing price on the primary exchange or, for markets that either do not offer an official closing price or where the official closing price may not be representative of the overall market, the last quoted sale price. Effective October 1, 2021, equity securities lacking any sales or traded in the over-the-counter market (other than NMS securities) are valued at the bid price. There was no impact to the Fund relating to the change in valuation policy.
Fixed income securities purchased with a remaining maturity exceeding 60 days are valued at the evaluated mean price provided by an authorized pricing service or, if an evaluated price is not available, by reference to other securities which are considered comparable in credit rating, interest rate, due date and other features (generally referred to as “matrix pricing”) or other similar pricing methodologies. Effective October 1, 2021, fixed income securities purchased with a remaining maturity exceeding 60 days are valued at the evaluated bid price provided by an
authorized pricing service. There was no impact to the Fund relating to the change in valuation policy.
Fixed income securities purchased with a remaining maturity of 60 days or less are valued at amortized cost, provided that the amortized cost value is approximately the same as the fair value of the security valued without the use of amortized cost. Investments in other open-end registered investment companies are valued at their end of day net asset value per share.
Futures contracts for which market quotations are readily available are valued at the settlement price as of the close of the futures exchange.
The Fund’s portfolio investments are generally valued based on independent market quotations or prices or, if none, “evaluative” or other market based valuations provided by third party pricing services approved by the Board of Trustees of the Trust (the “Board”). Under certain circumstances, the value of certain Fund portfolio investments (including derivatives) may be based on an evaluation of fair value, pursuant to procedures established by and under the general supervision of the Board. The Valuation Committee, which is comprised of the Independent Trustees of the Board, and the Pricing Committee, which is comprised of representatives from AMG Funds LLC (the “Investment Manager”) are the committees appointed by the Board to make fair value determinations. The Fund may use the fair value of a portfolio investment to calculate its net asset value (“NAV”) in the event that the market quotation, price or market based valuation for the portfolio investment is not readily available or otherwise not determinable pursuant to the Board’s valuation procedures, if the Investment Manager or the Pricing Committee believes the quotation, price or market based valuation to be unreliable, or in certain other circumstances. When determining the fair value of an investment, the Pricing Committee and, if required under the Trust’s securities valuation procedures, the Valuation Committee, seeks to determine the price that the Fund might reasonably expect to receive from current sale of that portfolio investment in an arms-length transaction. Fair value determinations shall be based upon consideration of all available facts and information, including, but not limited to (i) attributes specific to the investment; (ii) fundamental and analytical data relating to the investment; and (iii) the value of other comparable securities or relevant financial instruments, including derivative securities, traded on other markets or among dealers.
The values assigned to fair value portfolio investments are based on available information and do not necessarily represent amounts that might ultimately be realized in the future, since such amounts depend on future developments inherent in long-term investments. Because of the inherent uncertainty of valuation, those estimated values may differ significantly from the values that would have been used had a ready market for the investments existed, and the differences could be material. The Board will be presented with a quarterly report showing as of the most recent quarter end, all outstanding securities fair valued by the Fund, including a comparison with the prior quarter end and the percentage of the Fund that the security represents at each quarter end.
With respect to foreign equity securities and certain foreign fixed income securities, the Board has adopted a policy that securities held in the Fund that can be fair valued by the applicable fair value pricing service are fair valued on each business day provided that each individual price exceeds a pre-established confidence level.
U.S. GAAP defines fair value as the price that a fund would receive to sell an asset or pay to transfer a liability in an orderly transaction between market participants at the measurement date. U.S. GAAP also establishes a framework for measuring fair value, and a three level hierarchy for fair value measurements based upon the
19
|
Notes to Financial Statements (continued) |
transparency of inputs to the valuation of an asset or liability. Inputs may be observable or unobservable and refer broadly to the assumptions that market participants would use in pricing the asset or liability. Observable inputs reflect the assumptions market participants would use in pricing the asset or liability based on market data obtained from sources independent of the Fund. Unobservable inputs reflect the Fund’s own assumptions about the assumptions that market participants would use in pricing the asset or liability developed based on the best information available in the circumstances. Each investment is assigned a level based upon the observability of the inputs which are significant to the overall valuation.
The three-tier hierarchy of inputs is summarized below:
Level 1 – inputs are quoted prices in active markets for identical investments (e.g., equity securities, open-end investment companies, futures contracts, options contracts)
Level 2 – other observable inputs (including, but not limited to: quoted prices for similar assets or liabilities in markets that are active, quoted prices for identical or similar assets or liabilities in markets that are not active, inputs other than quoted prices that are observable for the assets or liabilities (such as interest rates, yield curves, volatilities, prepayment speeds, loss severities, credit risks and default rates) or other market corroborated inputs) (e.g., debt securities, government securities, foreign currency exchange contracts, swaps, foreign securities utilizing international fair value pricing, fair valued securities with observable inputs)
Level 3 – inputs are significant unobservable inputs (including the Fund’s own assumptions used to determine the fair value of investments) (e.g., fair valued securities with unobservable inputs)
Changes in inputs or methodologies used for valuing investments may result in a transfer in or out of levels within the fair value hierarchy. The inputs or methodologies used for valuing investments may not necessarily be an indication of the risk associated with investing in those investments.
b. SECURITY TRANSACTIONS
Security transactions are accounted for as of trade date. Realized gains and losses on securities sold are determined on the basis of identified cost.
c. INVESTMENT INCOME AND EXPENSES
Dividend income is recorded on the ex-dividend date. Interest income, which includes amortization of premium and accretion of discount on debt securities, is accrued as earned. Dividend and interest income on foreign securities is recorded gross of any withholding tax. Non-cash dividends included in dividend income, if any, are reported at the fair market value of the securities received. Other income and expenses are recorded on an accrual basis. Expenses that cannot be directly attributed to the Fund are apportioned among the funds in the Trust and other trusts or funds within the AMG Funds Family of Funds (collectively the “AMG Funds Family”) based upon their relative average net assets or number of shareholders. Investment income, realized and unrealized capital gains and losses, the common expenses of the Fund, and certain fund level expense reductions, if any, are allocated on a pro-rata basis to each class based on the relative net assets of each class to the total net assets of the Fund.
The Fund had certain portfolio trades directed to various brokers under a brokerage recapture program. Credits received from the brokerage recapture program are earned and paid on a monthly basis, and are recorded as expense
offsets, which serve to reduce the Fund’s overall expense ratio. For the fiscal year ended October 31, 2021, the impact on the expenses and expense ratios was $1,481 or less than 0.01%.
d. DIVIDENDS AND DISTRIBUTIONS
Fund distributions resulting from either net investment income or realized net capital gains, if any, will normally be declared and paid at least annually in December. Distributions to shareholders are recorded on the ex-dividend date. Distributions are determined in accordance with federal income tax regulations, which may differ from net investment income and net realized capital gains for financial statement purposes (U.S. GAAP). Differences may be permanent or temporary. Permanent differences are reclassified among capital accounts in the financial statements to reflect their tax character. Permanent book and tax basis differences, if any, relating to shareholder distributions will result in reclassifications to paid-in capital. Temporary differences arise when certain items of income, expense and gain or loss are recognized in different periods for financial statement and tax purposes; these differences will reverse at some time in the future. There were no permanent differences during the year. Temporary differences are due to wash sale loss deferrals and mark-to-market of futures and option contracts.
The tax character of distributions paid during the fiscal years ended October 31, 2021 and October 31, 2020 were as follows:
| | | | | | | | |
| Distributions paid from: | | 2021 | | | 2020 | |
| | |
Ordinary income * | | | $313,249 | | | | $2,014,504 | |
| | | | | | | | |
| | | $313,249 | | | | $2,014,504 | |
| | | | | | | | |
| * | For tax purposes, short-term capital gain distributions, if any, are considered ordinary income distributions. |
As of October 31, 2021, the components of distributable earnings (excluding unrealized appreciation/depreciation) on a tax basis consisted of:
| | | | |
| Capital loss carryforward | | $2,593,868 | |
| |
Undistributed ordinary income | | | 59,412 | |
At October 31, 2021, the cost of investments and the aggregate gross unrealized appreciation and depreciation for federal income tax purposes were as follows:
| | | | | | | | | | | | |
| Cost | | Appreciation | | | Depreciation | | | Net Appreciation | |
| | | |
$38,648,110 | | | $2,647,397 | | | | $(1,362,837 | ) | | | $1,284,560 | |
e. FEDERAL TAXES
The Fund currently qualifies as an investment company and intends to comply with the requirements under Subchapter M of the Internal Revenue Code of 1986, as amended, and to distribute substantially all of its taxable income and gains to its shareholders and to meet certain diversification and income requirements with respect to investment companies. Therefore, no provision for federal income or excise tax is included in the accompanying financial statements.
Additionally, based on the Fund’s understanding of the tax rules and rates related to income, gains and transactions for the foreign jurisdictions in which it invests, the Fund will provide for foreign taxes, and where appropriate, deferred foreign taxes.
20
|
Notes to Financial Statements (continued) |
Management has analyzed the Fund’s tax positions taken on federal income tax returns as of October 31, 2021, and for all open tax years (generally, the three prior taxable years), and has concluded that no provision for federal income tax is required in the Fund’s financial statements. Additionally, Management is not aware of any tax position for which it is reasonably possible that the total amounts of unrecognized tax benefits will change materially in the next twelve months.
f. CAPITAL LOSS CARRYOVERS AND DEFERRALS
As of October 31, 2021, the Fund had capital loss carryovers for federal income tax purposes as shown in the following chart. These amounts may be used to offset future realized capital gains indefinitely, and retain their character as short-term and/or long-term.
| | | | | | | | | | | | | | |
Capital Loss Carryover Amounts | | | | | | | |
| | |
| Short-Term | | | Long-Term | | | Total | |
| | | |
| | $1,551,487 | | | | $1,042,381 | | | | $2,593,868 | | | | | |
For the fiscal year ended October 31, 2021, the Fund utilized capital loss carryovers in the amount of:
| | | | | | |
| Capital Loss Carryover Utilized |
| | | |
| | | Short-Term | | Long-Term | | |
| | | |
| | $2,442,363 | | $1,505,859 | | |
g. CAPITAL STOCK
The Trust’s Declaration of Trust authorizes for the Fund the issuance of an unlimited number of shares of beneficial interest, without par value. The Fund records sales and repurchases of its capital stock on the trade date.
For the fiscal years ended October 31, 2021 and October 31, 2020, the capital stock transactions by class for the Fund were as follows:
| | | | | | | | | | | | | | | | |
| | | October 31, 2021 | | | October 31, 2020 | |
| | | | |
| | | Shares | | | Amount | | | Shares | | | Amount | |
| | | | |
Class N: | | | | | | | | | | | | | | | | |
| | | | |
Proceeds from sale of shares | | | 749 | | | | $11,582 | | | | 9,833 | | | | $156,768 | |
| | | | |
Reinvestment of distributions | | | 266 | | | | 3,954 | | | | 5,052 | | | | 81,284 | |
| | | | |
Cost of shares repurchased | | | (8,209) | | | | (126,970) | | | | (74,612) | | | | (1,131,549) | |
| | | | | | | | | | | | | | | | |
| | | | |
Net decrease | | | (7,194) | | | | $(111,434) | | | | (59,727) | | | | $(893,497) | |
| | | | | | | | | | | | | | | | |
| | | | |
Class I: | | | | | | | | | | | | | | | | |
| | | | |
Proceeds from sale of shares | | | 31,539 | | | | $481,176 | | | | 12,337 | | | | $196,102 | |
| | | | |
Reinvestment of distributions | | | 731 | | | | 10,887 | | | | 5,010 | | | | 80,875 | |
| | | | |
Cost of shares repurchased | | | (37,246) | | | | (575,454) | | | | (36,648) | | | | (554,743) | |
| | | | | | | | | | | | | | | | |
| | | | |
Net decrease | | | (4,976) | | | | $(83,391) | | | | (19,301) | | | | $(277,766) | |
| | | | | | | | | | | | | | | | |
| | | | |
Class Z: | | | | | | | | | | | | | | | | |
| | | | |
Proceeds from sale of shares | | | 32,766 | | | | $489,806 | | | | 60,251 | | | | $825,289 | |
| | | | |
Reinvestment of distributions | | | 19,957 | | | | 296,758 | | | | 114,271 | | | | 1,843,200 | |
| | | | |
Cost of shares repurchased | | | (587,465) | | | | (8,985,951) | | | | (481,439) | | | | (6,838,603) | |
| | | | | | | | | | | | | | | | |
| | | | |
Net decrease | | | (534,742) | | | | $(8,199,387) | | | | (306,917) | | | | $(4,170,114) | |
| | | | | | | | | | | | | | | | |
h. REPURCHASE AGREEMENTS AND JOINT REPURCHASE AGREEMENTS
The Fund may enter into third-party repurchase agreements for temporary cash management purposes and third-party or bilateral joint repurchase agreements for reinvestment of cash collateral on securities lending transactions under the securities lending program offered by The Bank of New York Mellon (“BNYM”) (the “Program”) (collectively, “Repurchase Agreements”). The value of the underlying collateral, including accrued interest, must equal or exceed the value of the Repurchase Agreements during the term of the agreement. For joint repurchase agreements, the Fund participates on a pro rata basis with other clients of BNYM
in its share of the underlying collateral under such joint repurchase agreements and in its share of proceeds from any repurchase or other disposition of the underlying collateral. The underlying collateral for all Repurchase Agreements is held in safekeeping by the Fund’s custodian or at the Federal Reserve Bank. If the seller defaults and the value of the collateral declines, or if bankruptcy proceedings commence with respect to the seller of the security, realization of the collateral by the Fund may be delayed or limited. Pursuant to the Program, the Fund is indemnified for such losses by BNYM on joint repurchase agreements.
21
|
Notes to Financial Statements (continued) |
At October 31, 2021, the market value of Repurchase Agreements outstanding for the Fund was $3,565,952.
i. FOREIGN CURRENCY TRANSLATION
The books and records of the Fund are maintained in U.S. dollars. The value of investments, assets and liabilities denominated in currencies other than U.S. dollars are translated into U.S. dollars based upon current foreign exchange rates. Purchases and sales of foreign investments, income and expenses are converted into U.S. dollars based on currency exchange rates prevailing on the respective dates of such transactions. Net realized and unrealized gain (loss) on foreign currency transactions represent: (1) foreign exchange gains and losses from the sale and holdings of foreign currencies; (2) gains and losses between trade date and settlement date on investment securities transactions and foreign currency exchange contracts; and (3) gains and losses from the difference between amounts of interest and dividends recorded and the amounts actually received.
The Fund does not isolate the net realized and unrealized gain or loss resulting from changes in exchange rates from the fluctuations in market prices of securities held. Such fluctuations are included with the net realized and unrealized gain or loss on investments.
2. AGREEMENTS AND TRANSACTIONS WITH AFFILIATES
The Trust has entered into an investment advisory agreement under which the Investment Manager, a subsidiary and the U.S. retail distribution arm of Affiliated Managers Group, Inc. (“AMG”), serves as investment manager to the Fund and is responsible for the Fund’s overall administration and operations. The Investment Manager selects one or more subadvisers for the Fund (subject to Board approval) and monitors each subadviser’s investment performance, security holdings and investment strategies. The Fund’s investment portfolio is managed by First Quadrant, L.P. (“First Quadrant”), who serves pursuant to a subadvisory agreement with the Investment Manager. AMG indirectly owns a majority interest in First Quadrant.
Investment management fees are paid directly by the Fund to the Investment Manager based on average daily net assets. For the fiscal year ended October 31, 2021, the Fund paid an investment management fee at the annual rate of 0.60% of the average daily net assets of the Fund.
The Investment Manager has contractually agreed, through at least March 1, 2022, to waive management fees and/or pay or reimburse fund expenses in order to limit total annual Fund operating expenses after fee waiver and expense reimbursements (exclusive of taxes, interest (including interest incurred in connection with bank and custody overdrafts and in connection with securities sold short), shareholder servicing fees, distribution and service (12b-1) fees, brokerage commissions and other transaction costs, dividends payable with respect to securities sold short, acquired fund fees and expenses and extraordinary expenses) to 0.89% of the Fund’s average daily net assets (this annual rate or such other annual rate that may be in effect from time to time, the “Expense Cap”), subject to later reimbursement by the Fund in certain circumstances.
In general, for a period of up to 36 months after the date any amounts are paid, waived or reimbursed by the Investment Manager, the Investment Manager may recover such amounts from the Fund, provided that such repayment would not cause the Fund’s total annual operating expenses after fee waiver and expense reimbursements (exclusive of the items noted in the parenthetical above) to
exceed either (i) the Expense Cap in effect at the time such amounts were paid, waived or reimbursed, or (ii) the Expense Cap in effect at the time of such repayment by the Fund.
The contractual expense limitation may only be terminated in the event the Investment Manager or a successor ceases to be the investment manager of the Fund or a successor fund, by mutual agreement between the Investment Manager and the Board, or in the event of the Fund’s liquidation unless the Fund is reorganized or is a party to a merger in which the surviving entity is successor to the accounting and performance information of the Fund.
At October 31, 2021, the Fund’s expiration of reimbursements subject to recoupment is as follows:
| | | | |
Expiration Period | | | |
| |
Less than 1 year | | | $61,763 | |
| |
1-2 years | | | 70,694 | |
| |
2-3 years | | | 53,948 | |
| | | | |
| |
Total | | | $186,405 | |
| | | | |
The Trust, on behalf of the Fund, has entered into an amended and restated Administration Agreement under which the Investment Manager serves as the Fund’s administrator (the “Administrator”) and is responsible for all non-portfolio management aspects of managing the Fund’s operations, including administration and shareholder services to the Fund. The Fund pays a fee to the Administrator at the rate of 0.15% per annum of the Fund’s average daily net assets for this service.
The Fund is distributed by AMG Distributors, Inc. (the “Distributor”), a wholly-owned subsidiary of the Investment Manager. The Distributor serves as the distributor and underwriter for the Fund and is a registered broker-dealer and member of the Financial Industry Regulatory Authority, Inc. (“FINRA”). Shares of the Fund will be continuously offered and will be sold directly to prospective purchasers and through brokers, dealers or other financial intermediaries who have executed selling agreements with the Distributor. Generally the Distributor bears all or a portion of the expenses of providing services pursuant to the distribution agreement, including the payment of the expenses relating to the distribution of prospectuses for sales purposes and any advertising or sales literature.
The Trust has adopted a distribution and service plan (the “Plan”) with respect to the Class N shares, in accordance with the requirements of Rule 12b-1 under the 1940 Act and the requirements of the applicable rules of FINRA regarding asset-based sales charges. Pursuant to the Plan, the Fund may make payments to the Distributor for its expenditures in financing any activity primarily intended to result in the sale of the Fund’s Class N shares and for maintenance and personal service provided to existing shareholders of that class. The Plan authorized payments to the Distributor up to 0.25% annually of the Fund’s average daily net assets attributable to the Class N shares.
For Class N and Class I shares, the Board has approved reimbursement payments to the Investment Manager for shareholder servicing expenses (“shareholder servicing fees”) incurred. Shareholder servicing fees include payments to financial intermediaries, such as broker-dealers (including fund supermarket platforms), banks, and trust companies who provide shareholder recordkeeping, account servicing and other services. The Class N and Class I shares may reimburse the Investment Manager for the actual amount incurred up to a maximum annual rate of each Class’s average daily net assets as shown in the table below.
22
|
Notes to Financial Statements (continued) |
The impact on the annualized expense ratios for the fiscal year ended October 31, 2021, were as follows:
| | | | | | | | |
| | | Maximum Annual
Amount
Approved | | | Actual
Amount
Incurred | |
| | |
Class N | | | 0.15% | | | | 0.15% | |
Class I | | | 0.15% | | | | 0.15% | |
The Board provides supervision of the affairs of the Trust and other trusts within the AMG Funds Family. The Trustees of the Trust who are not affiliated with the Investment Manager receive an annual retainer and per meeting fees for regular, special and telephonic meetings, and they are reimbursed for out-of-pocket expenses incurred while carrying out their duties as Board members. The Chairman of the Board and the Audit Committee Chair receive additional annual retainers. Certain Trustees and Officers of the Fund are Officers and/or Directors of the Investment Manager, AMG and/or the Distributor.
The Securities and Exchange Commission (the “SEC”) granted an exemptive order that permits certain eligible funds in the AMG Funds Family to lend and borrow money for certain temporary purposes directly to and from other eligible funds in the AMG Funds Family. Participation in this interfund lending program is voluntary for both the borrowing and lending funds, and an interfund loan is only made if it benefits each participating fund. The Administrator manages the program according to procedures approved by the Board, and the Board monitors the operation of the program. An interfund loan must comply with certain conditions set out in the exemptive order, which are designed to assure fairness and protect all participating funds. The interest earned and interest paid on interfund loans are included on the Statement of Operations as interest income and miscellaneous expense, respectively. At October 31, 2021, the Fund had no interfund loans outstanding.
The Fund utilized the interfund loan program during the fiscal year ended October 31, 2021 as follows:
| | | | | | | | | | | | | | |
Average Lent | | | Number
of Days | | | Interest
Earned | | | Average
Interest Rate | |
| | | |
| | $1,164,362 | | | | 23 | | | | $683 | | | | 0.931 | % |
3. PURCHASES AND SALES OF SECURITIES
Purchases and sales of securities (excluding short-term securities and U.S. Government Obligations) for the fiscal year ended October 31, 2021, were $8,558,778 and $12,617,457, respectively.
The Fund had no purchases or sales of U.S. Government Obligations during the fiscal year ended October 31, 2021.
4. PORTFOLIO SECURITIES LOANED
The Fund participates in the Program providing for the lending of securities to qualified borrowers. Securities lending income includes earnings of such temporary cash investments, plus or minus any rebate to a borrower. These earnings (after any rebate) are then divided between BNYM, as a fee for its services under the Program, and the Fund, according to agreed-upon rates. Collateral on all securities loaned is accepted in cash, U.S. Treasury Obligations or U.S. Government Agency Obligations. Collateral is maintained at a minimum level of 102% (105% in the case of certain foreign securities) of the market value, plus
interest, if applicable, of investments on loan. It is the Fund’s policy to obtain additional collateral from or return excess collateral to the borrower by the end of the next business day, following the valuation date of the securities loaned. Therefore, the value of the collateral held may be temporarily less than the value of the securities on loan. Lending securities entails a risk of loss to the Fund if and to the extent that the market value of the securities loaned were to increase and the borrower did not increase the collateral accordingly, and the borrower fails to return the securities. Under the terms of the Program, the Fund is indemnified for such losses by BNYM. Cash collateral is held in separate omnibus accounts managed by BNYM, who is authorized to exclusively enter into joint repurchase agreements for that cash collateral, and securities collateral is held in separate omnibus accounts managed by BNYM and cannot be sold or pledged. BNYM bears the risk of any deficiency in the amount of the cash collateral available for return to the borrower due to any loss on the collateral invested. Loans of securities are terminable at any time and the borrower, after notice, is required to return borrowed securities as soon as practical, which is normally within three business days.
The value of securities loaned on positions held, cash collateral and securities collateral received at October 31, 2021, were as follows:
| | | | | | | | | | | | | | |
Securities
Loaned | | | Cash
Collateral
Received | | | Securities
Collateral
Received | | | Total
Collateral
Received | |
| | | |
| $ | 5,256,320 | | | $ | 3,565,952 | | | $ | 1,845,971 | | | $ | 5,411,923 | |
The following table summarizes the securities received as collateral for securities lending at October 31, 2021:
| | | | |
Collateral Type | | Coupon
Range | | Maturity Date Range |
| | |
| U.S. Treasury Obligations | | 0.010%-4.500% | | 04/15/22-05/15/50 |
5. FOREIGN SECURITIES
The Fund invests in securities of foreign entities and in instruments denominated in foreign currencies which involve risks not typically associated with investments in domestic securities. Non-domestic securities carry special risks, such as exposure to currency fluctuations, less developed or less efficient trading markets, political instability, a lack of company information, differing auditing and legal standards, and, potentially, less liquidity. The Fund’s investments in emerging market countries are exposed to additional risks. The Fund’s performance will be influenced by political, social and economic factors affecting companies in emerging market countries. Emerging market countries generally have economic structures that are less diverse and mature, and political systems that are less stable, than those of developed countries. Realized gains in certain countries may be subject to foreign taxes at the Fund level and the Fund would pay such foreign taxes at the appropriate rate for each jurisdiction.
6. COMMITMENTS AND CONTINGENCIES
Under the Trust’s organizational documents, its trustees and officers are indemnified against certain liabilities arising out of the performance of their duties to the Trust. In addition, in the normal course of business, the Fund may enter into contracts and agreements that contain a variety of representations and warranties, which provide general indemnifications. The maximum exposure to the Fund under these arrangements is unknown, as this would involve future claims
23
|
Notes to Financial Statements (continued) |
that may be made against the Fund that have not yet occurred. However, based on experience, the Fund had no prior claims or losses and expects the risks of loss to be remote.
7. FORWARD COMMITMENTS
Certain transactions, such as futures and forward transactions may have a similar effect on the Fund’s net asset value as if the Fund had created a degree of leverage in its portfolio. However, if the Fund enters into such a transaction, the Fund will establish a segregated account with its custodian in which it will maintain cash, U.S. government securities or other liquid securities equal in value to its obligations in respect to such transaction. Securities and other assets held in the segregated account may not be sold while the transaction is outstanding, unless other suitable assets are substituted.
8. DERIVATIVE INSTRUMENTS
The following disclosures contain information on how and why the Fund uses derivative instruments, the credit risk and how derivative instruments affect the Fund’s financial position, and results of operations. The location and fair value amounts of these instruments on the Statement of Assets and Liabilities, and the realized gains and losses and changes in unrealized appreciation and depreciation on the Statement of Operations, each categorized by type of derivative contract, are included in a table at the end of the Fund’s Schedule of Portfolio Investments.
For the fiscal year ended October 31, 2021, the average quarterly balances of derivative financial instruments outstanding were as follows:
| | | | |
Financial Futures Contracts | | | | |
| |
Average number of contracts purchased | | | 564 | |
| |
Average notional value of contracts purchased | | | $44,620,782 | |
| |
Options | | | | |
| |
Average value of option contracts purchased | | | $319,562 | |
| |
Average value of option contracts written | | | $410,226 | |
9. FUTURES CONTRACTS
The Fund entered into futures contracts, including futures contracts on fixed-income securities, interest rate futures contracts, foreign currency futures contracts and futures contracts on security indices (including broad-based security indices). The Fund purchased and sold futures contracts to achieve desired levels of investment. There are certain risks associated with futures contracts. Prices may not move as expected or the Fund may not be able to close out the contract when it desires to do so, resulting in losses.
On entering into a futures contract, either cash or securities in an amount equal to a certain percentage of the contract value (initial margin) must be deposited with the futures broker. Subsequent payments (variation margin) are made or received each day. As of October 31, 2021, the Fund had securities deposited with the futures broker valued at $2,799,784 reported as Investments at value in the Statement of Assets and Liabilities.
Variation margin on futures contracts is recorded as unrealized appreciation or depreciation until the futures contract is closed or expired. The Fund recognizes a realized gain or loss when the contract is closed or expires equal to the difference between the value of the contract at the time it was opened and the value at the
time it was closed. Fluctuations in the value of the contracts are recorded in the Statement of Assets and Liabilities as Receivable for variation margin or Payable for variation margin, and in the Statement of Operations as Net change in unrealized appreciation (depreciation) on futures contracts until the contracts are closed, when they are recorded as Net realized gain or loss on futures contracts.
10. OPTIONS
The Fund may purchase and write call options and put options on a variety of underlying securities and instruments, including, but not limited to, specific securities, securities indices, futures contracts and foreign currencies. A call option gives the purchaser the right to buy, and obligates the writer to sell, the underlying security or instrument at the agreed-upon price during the option period. A put option gives the purchaser the right to sell, and obligates the writer to buy, the underlying security or instrument at the agreed-upon price during the option period. Options purchased are recorded as an asset, while options written (sold) are recorded as liabilities. When the Fund writes options it bears the risk of an unfavorable change in the market value of the instrument underlying the written option. When an option expires, the premium (original option value) is realized as a gain if the option was written or as a loss if the option was purchased. When the exercise of an option results in a cash settlement, the difference between the premium and the settlement proceeds is recognized as realized gain or loss. When securities are acquired or delivered upon exercise of an option, the acquisition cost or sale proceeds are adjusted by the amount of the premium. When an option is closed, the difference between the premium and the cost to close the position is realized as a gain or loss.
11. EXCHANGE TRADED NOTES
The Fund invests in Exchange Traded Notes (“ETNs”). ETNs are senior, unsecured, unsubordinated debt securities issued by a financial institution, listed on an exchange and traded in the secondary market. There are no periodic interest payments, and principal is not protected. The Fund could lose some or all of the amount invested. The price in the secondary market is determined by supply and demand, the current performance of the index, and the credit rating of the ETN issuer. At maturity, the issuer pays the Fund a return linked to the performance of the market index, such as a commodity index, to which the ETN is linked, minus the issuer’s fee. ETNs are subject to the risk of a breakdown in the futures markets that they use. As a means to obtain commodity exposure, the Fund invests in ETNs linked to commodity indices. The Fund may be exposed to a wide variety of commodity sectors, including, without limitation, agriculture, livestock, base/industrial metals, oil, energy and precious metals. Commodity prices, and the value of stocks of companies exposed to commodities, can be extremely volatile and are affected by a wide range of factors.
12. MARKET, CREDIT AND COUNTERPARTY RISKS
In the normal course of business, the Fund invests in securities and enters into transactions where risks exist due to market fluctuations and is exposed to credit risk with parties with whom it trades (issuers or counterparties). Market prices of investments held by the Fund may fall rapidly or unpredictably and will rise and fall due to changing economic, political, or market conditions or in response to events that affect particular industries or companies. The Fund may be exposed to credit or counterparty risk, or the risk that an institution or other entity with which the Fund has unsettled or open transactions will default or not perform under the contract. The Fund minimizes credit risk and counterparty risk by undertaking transactions with a large number of customers and counterparties on recognized
24
|
Notes to Financial Statements (continued) |
and reputable exchanges. The Fund could lose money if the issuer or guarantor of a fixed income security, or the counterparty to a financial derivatives contract, repurchase agreement or a loan of portfolio securities, is unable or unwilling to make timely principal and/or interest payments, or to otherwise honor its obligations.
The Fund is subject to various Master Agreements, which govern the terms of certain transactions with select counterparties. These Master Agreements reduce the counterparty risk associated with relevant transactions by specifying credit protection mechanisms and providing standardization that improves legal certainty. Master Agreements can also help limit counterparty risk by specifying collateral posting arrangements at pre-arranged exposure levels. Under the Master Agreements, collateral is routinely transferred if the total net exposure to certain transactions (net of existing collateral already in place) governed under the relevant master agreement with a counterparty in a given account exceeds a
specified threshold, which typically ranges from zero to $250,000 depending on the counterparty and the type of Master Agreement.
International Swaps and Derivatives Association, Inc. Master Agreements (“ISDA Master Agreements”) govern OTC financial derivative transactions entered into by the Fund and the respective counterparty. The ISDA Master Agreements maintain provisions for general obligations, representations, agreements, collateral and events of default or termination. Certain ISDA Master Agreements allow counterparties to OTC derivatives to terminate derivative contracts prior to maturity in the event the Fund’s net assets decline by a stated percentage or the Fund fails to meet the terms of the ISDA Master Agreement, which requires accelerated settlement of all outstanding transactions under the applicable ISDA Master Agreement. Any election to terminate early could be material to the financial statements.
13. MASTER NETTING AGREEMENTS
The Fund may enter into master netting agreements with its counterparties for the securities lending program, Repurchase Agreements and derivatives, which provide the right, in the event of default (including bankruptcy or insolvency) for the non-defaulting party to liquidate the collateral and calculate net exposure to the defaulting party or request additional collateral. For financial reporting purposes, the Fund does not offset financial assets and financial liabilities that are subject to master netting agreements in the Statement of Assets and Liabilities. For securities lending transactions, see Note 4.
The following table is a summary of the Fund’s open Repurchase Agreements that are subject to a master netting agreement as of October 31, 2021:
| | | | | | | | | | | | | | | | | | | | |
| | | | | | Gross Amount Not Offset in the | | | | | | | |
| | | | | | Statement of Assets and Liabilities | | | | | | | |
| | | Gross Amounts of | | | | | | | | | | | | | |
| | | Assets Presented in | | | | | | Net | | | | | | | |
| | | the Statement of | | | Offset | | | Asset | | | Collateral | | | Net | |
| | | Assets and Liabilities | | | Amount | | | Balance | | | Received | | | Amount | |
| | | | |
| | | | | | | | | | | | | | | | | | | | |
| | | | | |
Bank of America Securities, Inc. | | | $1,000,000 | | | | — | | | | $1,000,000 | | | | $1,000,000 | | | | — | |
| | | | | |
Daiwa Capital Markets America | | | 565,952 | | | | — | | | | 565,952 | | | | 565,952 | | | | — | |
| | | | | |
Deutsche Bank Securities, Inc. | | | 1,000,000 | | | | — | | | | 1,000,000 | | | | 1,000,000 | | | | — | |
| | | | | |
RBC Dominion Securities, Inc. | | | 1,000,000 | | | | — | | | | 1,000,000 | | | | 1,000,000 | | | | — | |
| | | | | | | | | | | | | | | | | | | | |
| | | | | |
Total | | | $3,565,952 | | | | — | | | | $3,565,952 | | | | $3,565,952 | | | | — | |
| | | | | | | | | | | | | | | | | | | | |
14. SUBSEQUENT EVENTS
The Fund has determined that no material events or transactions occurred through the issuance date of the Fund’s financial statements which require an additional disclosure in or adjustment of the Fund’s financial statements.
25
|
Report of Independent Registered Public Accounting Firm |
| | |
| TO THE BOARD OF TRUSTEES OF AMG FUNDS I AND SHAREHOLDERS OF AMG FQ GLOBAL RISK-BALANCED FUND: | | |
| |
Opinion on the Financial Statements | | |
| |
| We have audited the accompanying statement of assets and liabilities, including the schedule of portfolio investments, of AMG FQ Global Risk-Balanced Fund (one of the funds constituting AMG Funds I) (the “Fund”) as of October 31, 2021, the related statement of operations for the year ended October 31, 2021, the statements of changes in net assets for each of the two years in the period ended October 31, 2021, including the related notes, and the financial highlights for each of the five years in the period ended October 31, 2021 (collectively referred to as the “financial statements”). In our opinion, the financial statements present fairly, in all material respects, the financial position of the Fund as of October 31, 2021, the results of its operations for the year then ended, the changes in its net assets for each of the two years in the period ended October 31, 2021 and the financial highlights for each of the five years in the period ended October 31, 2021 in conformity with accounting principles generally accepted in the United States of America. | | |
| |
| Basis for Opinion | | |
| |
| These financial statements are the responsibility of the Fund’s management. Our responsibility is to express an opinion on the Fund’s financial statements based on our audit. We are a public accounting firm registered with the Public Company Accounting Oversight Board (United States) (PCAOB) and are required to be independent with respect to the Fund in accordance with the U.S. federal securities laws and the applicable rules and regulations of the Securities and Exchange Commission and the PCAOB. | | |
| |
| We conducted our audit of these financial statements in accordance with the standards of the PCAOB. Those standards require that we plan and perform the audit to obtain reasonable assurance about whether the financial statements are free of material misstatement, whether due to error or fraud. | | |
| |
| Our audit included performing procedures to assess the risks of material misstatement of the financial statements, whether due to error or fraud, and performing procedures that respond to those risks. Such procedures included examining, on a test basis, evidence regarding the amounts and disclosures in the financial statements. Our audit also included evaluating the accounting principles used and significant estimates made by management, as well as evaluating the overall presentation of the financial statements. Our procedures included confirmation of securities owned as of October 31, 2021 by correspondence with the custodian, transfer agent and brokers; when replies were not received from brokers, we performed other auditing procedures. We believe that our audit provides a reasonable basis for our opinion. | | |
| |
| PricewaterhouseCoopers LLP | | |
| Boston, Massachusetts | | |
| December 22, 2021 | | |
| |
| We have served as the auditor of one or more investment companies in AMG Funds Family since1993. | | |
22
|
Other Information (unaudited) |
TAX INFORMATION
AMG FQ Global Risk-Balanced Fund hereby designates the maximum amount allowable of its net taxable income as qualified dividends as provided in the Jobs and Growth Tax Relief Reconciliation Act of 2003. The 2020/2021 Form 1099-DIV you receive for the Fund will show the tax status of all distributions paid to you during the year.
Pursuant to section 852 of the Internal Revenue Code, AMG FQ Global Risk-Balanced Fund hereby designates $0 as a capital gain distribution with respect to the taxable year ended October 31, 2021, or if subsequently determined to be different, the net capital gains of such fiscal year.
23
|
AMG Funds Trustees and Officers |
| | | | |
| The Trustees and Officers of the Trust, their business addresses, principal occupations for the past five years and ages are listed below. The Trustees provide broad supervision over the affairs of the Trust and the Funds. The Trustees are experienced executives who meet periodically throughout the year to oversee the Funds’ activities, review contractual arrangements with companies that provide services to the Funds, and | | review the Funds’ performance. Unless otherwise noted, the address of each Trustee or Officer is the address of the Trust: 680 Washington Blvd., Suite 500, Stamford, CT. 06901. There is no stated term of office for Trustees. Trustees serve until their resignation, retirement or removal in | | accordance with the Trust’s organizational documents and policies adopted by the Board from time to time. The Chairman of the Trustees, President, Treasurer and Secretary of the Trust are elected by the Trustees annually. Other officers hold office at the pleasure of the Trustees. |
Independent Trustees
The following Trustees are not “interested persons” of the Trust within the meaning of the 1940 Act:
| | |
Number of Funds Overseen in Fund Complex | | Name, Age, Principal Occupation(s) During Past 5 Years and Other Directorships Held by Trustee |
| |
• Trustee since 2012 • Oversees 42 Funds in Fund Complex | | Bruce B. Bingham, 72 Partner, Hamilton Partners (real estate development firm) (1987-Current); Director of The Yacktman Funds (2 portfolios) (2000-2012). |
| |
• Trustee since 2013 • Chairman of the Audit Committee since 2021 • Oversees 46 Funds in Fund Complex | | Kurt A. Keilhacker, 58 Managing Partner, TechFund Europe (2000-Present); Managing Partner, TechFund Capital (1997-Present); Managing Partner, Elementum Ventures (2013-Present); Director, MetricStory, Inc. (2017-Present); Trustee, Wheaton College (2018-Present); Trustee, Gordon College (2001-2016); Board Member, 6wind SA (2002-2019). |
| |
• Trustee since 2000 • Oversees 42 Funds in Fund Complex | | Steven J. Paggioli, 71 Independent Consultant (2002-Present); Trustee, Professionally Managed Portfolios (28 portfolios); Advisory Board Member, Sustainable Growth Advisors, LP; Independent Director, Muzinich BDC, Inc. (business development company) (2019-Present); Director, The Wadsworth Group; Independent Director, Chase Investment Counsel (2008–2019); Executive Vice President, Secretary and Director, Investment Company Administration, LLC and First Fund Distributors, INC. (1990-2001). |
| |
• Trustee since 2013 • Oversees 42 Funds in Fund Complex | | Richard F. Powers III, 75 Adjunct Professor, U.S. Naval War College (2016-Present); Adjunct Professor, Boston College (2011-2015); Director, Ameriprise Financial Inc. (2005-2009); President and CEO of Van Kampen Investments Inc. (1998-2003); President, Morgan Stanley Client Group (2000-2002); Executive Vice President and Chief Marketing Officer of the Morgan Stanley Individual Investor Group (1984-1998). |
| |
• Independent Chairman • Trustee since 2000 • Oversees 46 Funds in Fund Complex | | Eric Rakowski, 63 Professor of Law, University of California at Berkeley School of Law (1990-Present); Tax Attorney at Davis Polk & Wardwell and clerked for Judge Harry T. Edwards of the U.S. Court of Appeals for the District of Columbia Circuit and for Justice William J. Brennan Jr. of the U.S. Supreme Court; Director of Harding, Loevner Funds, Inc. (10 portfolios); Trustee of Third Avenue Trust (3 portfolios) (2002-2019); Trustee of Third Avenue Variable Trust (1 portfolio) (2002-2019). |
| |
• Trustee since 2013 • Oversees 46 Funds in Fund Complex | | Victoria L. Sassine, 56 Adjunct Professor, Babson College (2007–Present); Director, Board of Directors, PRG Group (2017-Present); CEO, Founder, Scale Smarter Partners, LLC (2018-Present); Adviser, EVOFEM Biosciences (2019-Present); Chairperson of the Board of Directors of Business Management Associates (2018 to 2019). |
| |
• Trustee since 2000 • Oversees 42 Funds in Fund Complex | | Thomas R. Schneeweis, 74 Professor Emeritus, University of Massachusetts (2013-Present); President, TRS Associates (1982-Present); Board Member, Chartered Alternative Investment Association (“CAIA”) (2002-Present); Co-Founder and Director, Institute for Global Asset and Risk Management (Education) (2010-Present); Co-Owner, Quantitative Investment Technologies (2014-Present); Co-Owner, Yes Wealth Management (2018-Present); Director, CAIA Foundation (2010-2019); Partner, S Capital Wealth Advisors (2015-2018); Partner, S Capital Management, LLC (2007-2015); President, Alternative Investment Analytics, LLC, (formerly Schneeweis Partners, LLC) (2001-2013). |
28
|
AMG Funds Trustees and Officers (continued) |
Interested Trustees
Each Trustee in the following table is an “interested person” of the Trust within the meaning of the 1940 Act. Ms. Carsman is an interested person of the Trust within the meaning of the 1940 Act by virtue of her position with, and interest in securities of, AMG.
| | |
Number of Funds Overseen in
Fund Complex | | Name, Age, Principal Occupation(s) During Past 5 Years and Other Directorships Held by Trustee |
| | |
• Trustee since 2011 • Oversees 42 Funds in Fund Complex | | Christine C. Carsman, 69 Affiliated Managers Group, Inc. (2004-Present): Senior Policy Advisor (2019-Present), Executive Vice President, Deputy General Counsel and Chief Regulatory Counsel (2017-2018), Senior Vice President and Deputy General Counsel (2011-2016), Senior Vice President and Chief Regulatory Counsel (2007-2011), Vice President and Chief Regulatory Counsel (2004-2007); Chair of the Board of Directors, AMG Funds plc (2015-2018); Director, AMG Funds plc (2010-2018); Senior Counsel, Vice President and Director of Operational Risk Management and Compliance, Wellington Management Company, LLP (1995-2004); Director Emeritus of Harding, Loevner Funds, Inc. (0 Portfolios) (2021- Present); Director of Harding, Loevner Funds, Inc. (9 portfolios) (2017-2020); Secretary and Chief Legal Officer, AMG Funds, AMG Funds I, AMG Funds II and AMG Funds III (2004-2011). |
| | |
• Trustee since 2021 • Oversees 42 Funds in Fund Complex | | Garret W. Weston, 40 Affiliated Managers Group, Inc. (2008-Present): Managing Director, Co-Head of Affiliate Engagement (2021-Present), Senior Vice President, Affiliate Development (2016-2021), Vice President, Office of the CEO (2015-2016), Vice President, New Investments (2012-2015), Senior Associate, New Investments (2008-2012); Associate, Madison Dearborn Partners (2006-2008); Analyst, Merrill Lynch (2004-2006). |
| | |
| Officers | | |
Position(s) Held with Fund and Length of Time Served | | Name, Age, Principal Occupation(s) During Past 5 Years |
| | |
• President since 2018 • Principal Executive Officer since 2018 • Chief Executive Officer since 2018 • Chief Operating Officer since 2007 | | Keitha L. Kinne, 63 Chief Operating Officer, AMG Funds LLC (2007-Present); Chief Investment Officer, AMG Funds LLC (2008-Present); President and Principal, AMG Distributors, Inc. (2018-Present); Chief Operating Officer, AMG Distributors, Inc. (2007-Present); President, Chief Executive Officer and Principal Executive Officer, AMG Funds, AMG Funds I, AMG Funds II, AMG Funds III and AMG Funds IV (2018-Present); Chief Operating Officer, AMG Funds, AMG Funds I, AMG Funds II, and AMG Funds III (2007-Present); Chief Operating Officer, AMG Funds IV (2016-Present); Chief Operating Officer and Chief Investment Officer, Aston Asset Management, LLC (2016); President and Principal Executive Officer, AMG Funds, AMG Funds I, AMG Funds II and AMG Funds III (2012-2014); Managing Partner, AMG Funds LLC (2007-2014); President and Principal, AMG Distributors, Inc. (2012-2014); Managing Director, Legg Mason & Co., LLC (2006-2007); Managing Director, Citigroup Asset Management (2004-2006). |
| | |
• Secretary since 2015 • Chief Legal Officer since 2015 | | Mark J. Duggan, 56 Managing Director and Senior Counsel, AMG Funds LLC (2021-Present); Senior Vice President and Senior Counsel, AMG Funds LLC (2015-2021); Secretary and Chief Legal Officer, AMG Funds, AMG Funds I, AMG Funds II, AMG Funds III and AMG Funds IV (2015-Present); Attorney, K&L Gates, LLP (2009-2015). |
| | |
• Chief Financial Officer since 2017 • Treasurer since 2017 • Principal Financial Officer since 2017 • Principal Accounting Officer since 2017 | | Thomas G. Disbrow, 55 Vice President, Mutual Fund Treasurer & CFO, AMG Funds, AMG Funds LLC (2017-Present); Chief Financial Officer, Principal Financial Officer, Treasurer and Principal Accounting Officer, AMG Funds, AMG Funds I, AMG Funds II, AMG Funds III and AMG Funds IV (2017-Present); Managing Director - Global Head of Traditional Funds Product Control, UBS Asset Management (Americas), Inc. (2015-2017); Managing Director - Head of North American Funds Treasury, UBS Asset Management (Americas), Inc. (2011-2015). |
| | |
• Deputy Treasurer since 2017 | | John A. Starace, 51 Vice President, Mutual Fund Accounting, AMG Funds LLC (2021-Present); Director, Mutual Fund Accounting, AMG Funds LLC (2017-2021); Vice President, Deputy Treasurer of Mutual Funds Services, AMG Funds LLC (2014-2017); Deputy Treasurer, AMG Funds, AMG Funds I, AMG Funds II, AMG Funds III and AMG Funds IV (2017-Present); Vice President, Citi Hedge Fund Services (2010-2014); Audit Senior Manager (2005-2010) and Audit Manager (2001-2005), Deloitte & Touche LLP. |
| | |
• Chief Compliance Officer and Sarbanes-Oxley Code of Ethics since 2019 | | Patrick J. Spellman, 47 Vice President, Chief Compliance Officer, AMG Funds LLC (2017-Present); Chief Compliance Officer, AMG Distributors, Inc., (2010-Present); Chief Compliance Officer and Sarbanes-Oxley Code of Ethics Compliance Officer, AMG Funds, AMG Funds I, AMG Funds II, AMG Funds III and AMG Funds IV (2019-Present); Senior Vice President, Chief Compliance Officer, AMG Funds LLC (2011-2017); Anti-Money Laundering Compliance Officer, AMG Funds, AMG Funds I, AMG Funds II, and AMG Funds III (2014-2019); Anti-Money Laundering Officer, AMG Funds IV, (2016-2019); Compliance Manager, Legal and Compliance, Affiliated Managers Group, Inc. (2005-2011). |
29
|
AMG Funds Trustees and Officers (continued) |
| | |
Position(s) Held with Fund and Length of Time Served | | Name, Age, Principal Occupation(s) During Past 5 Years |
| | |
• Assistant Secretary since 2016 | | Maureen A. Meredith, 36 Vice President, Senior Counsel, AMG Funds LLC (2021-Present); Vice President, Counsel, AMG Funds LLC (2019-2021); Director, Counsel, AMG Funds LLC (2017-2018); Vice President, Counsel, AMG Funds LLC (2015-2017); Assistant Secretary, AMG Funds, AMG Funds I, AMG Funds II, AMG Funds III and AMG Funds IV (2016-Present); Associate, Ropes & Gray LLP (2011-2015); Law Fellow, Massachusetts Appleseed Center for Law and Justice (2010-2011). |
| | |
• Anti-Money Laundering Compliance Officer since 2019 | | Hector D. Roman, 43 Director, Legal and Compliance, AMG Funds LLC (2020-Present); Anti-Money Laundering Compliance Officer, AMG Funds, AMG Funds I, AMG Funds II, AMG Funds III and AMG Funds IV (2019-Present); Manager, Legal and Compliance, AMG Funds LLC (2017-2019); Director of Compliance, Morgan Stanley Investment Management (2015-2017); Senior Advisory, PricewaterhouseCoopers LLP (2014-2015); Risk Manager, Barclays Investment Bank (2008-2014). |
30
|
Annual Renewal of Investment Management and Subadvisory Agreements |
AMG FQ Global Risk-Balanced Fund: Approval of Fund Management Agreement and Subadvisory Agreement on June 24, 2021
At a meeting held via telephone and video conference on June 24, 2021,1 the Board of Trustees (the “Board” or the “Trustees”), and separately a majority of the Trustees who are not “interested persons” of AMG Funds I (the “Trust”) (the “Independent Trustees”), approved (i) the Fund Management Agreement, as amended pursuant to letter agreements at any time prior to the date of the meeting, with AMG Funds LLC (the “Investment Manager”) for AMG FQ Global Risk-Balanced Fund (the “Fund”) and separately each of Amendment No. 1 thereto dated July 1, 2015, and Amendment No. 2 thereto dated October 1, 2016 (collectively, the “Fund Management Agreement”); and (ii) the Subadvisory Agreement, as amended at any time prior to the date of the meeting, with the Subadviser for the Fund (collectively, the “Subadvisory Agreement”). The Independent Trustees were separately represented by independent legal counsel in connection with their consideration of the approval of these agreements. In considering the Fund Management Agreement and Subadvisory Agreement, the Trustees reviewed a variety of materials relating to the Fund, the Investment Manager and the Subadviser, including the nature, extent and quality of services, comparative performance, fee and expense information for an appropriate peer group of similar mutual funds for the Fund (the “Peer Group”), performance information for the relevant benchmark index for the Fund (the “Fund Benchmark”), other relevant matters, and other information provided to them on a periodic basis throughout the year. Prior to voting, the Independent Trustees: (a) reviewed the foregoing information with their independent legal counsel; (b) received materials from their independent legal counsel discussing the legal standards applicable to their consideration of the Fund Management Agreement and the Subadvisory Agreement; and (c) met with their independent legal counsel in private sessions at which no representatives of management were present.
NATURE, EXTENT AND QUALITY OF SERVICES
In considering the nature, extent and quality of the services provided by the Investment Manager, the Trustees reviewed information relating to the Investment Manager’s operations and personnel. Among other things, the Investment Manager provided financial information, information about its supervisory and professional staff and descriptions of its organizational and management structure. The Trustees also took into account information provided
periodically throughout the previous year by the Investment Manager in Board meetings relating to the performance of its duties with respect to the Fund and the Trustees’ knowledge of the Investment Manager’s management and the quality of the performance of the Investment Manager’s duties under the Fund Management Agreement and Administration Agreement. In the course of their deliberations regarding the Investment Manager, the Trustees evaluated, among other things: (a) the extent and quality of the Investment Manager’s oversight of the operation and management of the Fund; (b) the quality of the Investment Manager’s oversight of the performance by the Subadviser of its portfolio management duties; (c) the Investment Manager’s ability to supervise the Fund’s other service providers; and (d) the Investment Manager’s compliance program. The Trustees also took into account that, in performing its functions under the Fund Management Agreement and supervising the Subadviser, the Investment Manager: performs periodic detailed analyses and reviews of the performance by the Subadviser of its obligations to the Fund, including without limitation, analysis and review of portfolio and other compliance matters and review of the Subadviser’s investment performance with respect to the Fund; prepares and presents periodic reports to the Board regarding the investment performance of the Subadviser and other information regarding the Subadviser, at such times and in such forms as the Board may reasonably request; reviews and considers any changes in the personnel of the Subadviser responsible for performing the Subadviser’s obligations and makes appropriate reports to the Board; reviews and considers any changes in the ownership or senior management of the Subadviser and makes appropriate reports to the Board; performs periodic in-person, telephonic or videoconference diligence meetings, including with respect to compliance matters, with representatives of the Subadviser; assists the Board and management of the Trust in developing and reviewing information with respect to the initial approval of the Subadvisory Agreement and annual consideration of the Subadvisory Agreement thereafter; prepares recommendations with respect to the continued retention of the Subadviser or the replacement of the Subadviser, including at the request of the Board; identifies potential successors to, or replacements of, the Subadviser or potential additional subadvisers, including performing appropriate due diligence, and developing and presenting to the Board a recommendation as to any such successor, replacement, or additional subadviser, including at the request of the Board; designates and
compensates from its own resources such personnel as the Investment Manager may consider necessary or appropriate to the performance of its services; and performs such other review and reporting functions as the Board shall reasonably request consistent with the Fund Management Agreement and applicable law. The Trustees noted the affiliation of the Subadviser with the Investment Manager, noting any potential conflicts of interest. The Trustees also took into account the financial condition of the Investment Manager with respect to its ability to provide the services required under the Fund Management Agreement and the Investment Manager’s undertaking to maintain a contractual expense limitation for the Fund. The Trustees also considered the Investment Manager’s risk management processes.
The Trustees also reviewed information relating to the Subadviser’s operations and personnel and the investment philosophy, strategies and techniques (the “Investment Strategy”) used in managing the Fund. Among other things, the Trustees reviewed information on portfolio management and other professional staff, information regarding the Subadviser’s organizational and management structure and the Subadviser’s brokerage policies and practices. The Trustees considered specific information provided regarding the experience of the individuals at the Subadviser with portfolio management responsibility for the Fund, including the information set forth in the Fund’s prospectus and statement of additional information. In the course of their deliberations, the Trustees evaluated, among other things: (a) the services rendered by the Subadviser in the past; (b) the qualifications and experience of the Subadviser’s personnel; and (c) the Subadviser’s compliance program. The Trustees also took into account the financial condition of the Subadviser with respect to its ability to provide the services required under the Subadvisory Agreement. The Trustees also considered the Subadviser’s risk management processes.
PERFORMANCE
The Board considered the Fund’s net performance during relevant time periods as compared to the Fund’s Peer Group and Fund Benchmark, considered the gross performance of the Fund as compared to the Subadviser’s relevant performance composite that utilizes the same investment strategy and approach and noted that the Board reviews on a quarterly basis detailed information about both the Fund’s performance results and portfolio composition, as well as the Subadviser’s Investment Strategy. The Board was mindful of the Investment
31
|
Annual Renewal of Investment Management and Subadvisory Agreements (continued) |
| | | | |
Manager’s expertise, resources and attention to monitoring the Subadviser’s performance, investment style and risk-adjusted performance with respect to the Fund and its discussions with the management of the Fund’s subadviser during the period regarding the factors that contributed to the performance of the Fund. Among other information relating to the Fund’s performance, the Trustees noted that the Fund’s performance for Class Z shares (which share class has the earliest inception date and the largest amount of assets of all the share classes of the Fund) for the 1-year, 3-year, 5-year and 10-year periods ended March 31, 2021 was below the median performance of the Peer Group and below the performance of the Fund Benchmark, a Composite Index (60% MSCI World Index and 40% FTSE World Government Bond Index (Hedged)). The Trustees took into account management’s discussion of the Fund’s performance, including the reasons for the Fund’s underperformance and the impact of the Fund’s recent underperformance on its longer-term performance rankings. The Trustees concluded that the Fund’s performance is being addressed. ADVISORY AND SUBADVISORY FEES; FUND EXPENSES; PROFITABILITY; AND ECONOMIES OF SCALE In considering the reasonableness of the advisory fee payable to the Investment Manager, the Trustees reviewed information provided by the Investment Manager at the June 24, 2021 and prior meetings setting forth all revenues and other benefits, both direct and indirect (including any so-called “fallout benefits” such as reputational value derived from the Investment Manager serving as Investment Manager to the Fund), received by the Investment Manager and its affiliates attributable to managing the Fund and all the mutual funds in the AMG Funds Family of Funds; the cost of providing such services; the significant risks undertaken as Investment Manager and sponsor of the Fund, including investment, operational, enterprise, entrepreneurial, litigation, regulatory and compliance risks; and the resulting profitability to the Investment Manager and its affiliates from these relationships. The Trustees also considered the amount of the advisory fee retained by the Investment Manager after payment of the subadvisory fee with respect to the Fund. The Trustees also noted payments made or to be made from the Subadviser to the Investment Manager, and other payments made or to be made from the Investment Manager to the Subadviser. The Trustees also considered management’s discussion of the current asset level of the Fund, and the impact on | | profitability of both the current asset level and any future growth of assets of the Fund. In considering the cost of services to be provided by the Investment Manager under the Fund Management Agreement and the profitability to the Investment Manager of its relationship with the Fund, the Trustees noted the undertaking by the Investment Manager to maintain a contractual expense limitation for the Fund. The Board also took into account management’s discussion of the advisory fee structure and the services the Investment Manager provides in performing its functions under the Fund Management Agreement and supervising the Subadviser. Based on the foregoing, the Trustees concluded that the profitability to the Investment Manager is reasonable and that the Investment Manager is not realizing material benefits from economies of scale that would warrant adjustments to the advisory fee at this time. Also with respect to economies of scale, the Trustees noted that as the Fund’s assets increase over time, the Fund may realize other economies of scale to the extent the increase in assets is proportionally greater than the increase in certain other expenses. In considering the reasonableness of the subadvisory fee payable by the Investment Manager to the Subadviser, the Trustees reviewed information regarding the cost to the Subadviser of providing subadvisory services to the Fund and the resulting profitability from the relationship. The Trustees noted that, because the Subadviser is an affiliate of the Investment Manager, a portion of the Subadviser’s revenues or profits might be shared directly or indirectly with the Investment Manager. The Trustees also noted that the subadvisory fees are paid by the Investment Manager out of its advisory fee. The Board also took into account management’s discussion of the subadvisory fee structure, and the services the Subadviser provides in performing its functions under the Subadvisory Agreement. Based on the foregoing, the Trustees concluded that the profitability to the Subadviser is reasonable and that the Subadviser is not realizing material benefits from economies of scale that would warrant adjustments to the subadvisory fees at this time. Also with respect to economies of scale, the Trustees noted that as the Fund’s assets increase over time, the Fund may realize other economies of scale to the extent the increase in assets is proportionally greater than the increase in certain other expenses. | | The Trustees noted that the management fees (which include both the advisory and administration fees) and total expenses (net of applicable expense waivers/reimbursements) of Class Z shares of the Fund as of March 31, 2021 were both lower than the average for the Fund’s Peer Group. The Trustees took into account the fact that the Investment Manager has contractually agreed, through March 1, 2022, to limit the Fund’s net annual operating expenses (subject to certain excluded expenses) to 0.89%. The Trustees concluded that, in light of the nature, extent and quality of the services provided by the Investment Manager and the Subadviser (which is an affiliate of the Investment Manager), the foregoing expense limitation and the considerations noted above with respect to the Investment Manager and the Subadviser, the Fund’s advisory and subadvisory fees are reasonable. * * * * After consideration of the foregoing, the Trustees also reached the following conclusions (in addition to the conclusions discussed above) regarding the Fund Management Agreement and the Subadvisory Agreement: (a) the Investment Manager and the Subadviser have demonstrated that they possess the capability and resources to perform the duties required of them under the Fund Management Agreement and the Subadvisory Agreement and (b) the Investment Manager and Subadviser maintain appropriate compliance programs. Based on all of the above-mentioned factors and their related conclusions, with no single factor or conclusion being determinative and with each Trustee not necessarily attributing the same weight to each factor, the Trustees concluded that approval of the Fund Management Agreement and the Subadvisory Agreement would be in the best interests of the Fund and its shareholders. Accordingly, on June 24, 2021, the Trustees, and separately a majority of the Independent Trustees, voted to approve the Fund Management Agreement and the Subadvisory Agreement for the Fund. 1 The Trustees determined that the conditions surrounding COVID-19 constituted unforeseen or emergency circumstances and that reliance on the Securities and Exchange Commission’s (“SEC”) exemptive order, which provides relief from the in-person voting requirements of the Investment Company Act of 1940, as amended (the “1940 Act”), in certain circumstances (the “In-Person Relief”), was necessary or appropriate due to the circumstances related to current or potential effects of COVID-19. The Trustees unanimously wished to rely on the In-Person Relief with respect to the approval of those matters on |
32
|
Annual Renewal of Investment Management and Subadvisory Agreements (continued) |
| | | | |
| the agenda for the June 24, 2021 meeting that would otherwise require in-person votes under the 1940 Act. See Investment Company Release No. 33897 (June 19, 2020). This exemptive order supersedes, in part, a | | similar, earlier exemptive order issued by the SEC (Investment Company Release No. 33824 (March 25, 2020)). | | |
33
THIS PAGE INTENTIONALLY LEFT BLANK
THIS PAGE INTENTIONALLY LEFT BLANK
THIS PAGE INTENTIONALLY LEFT BLANK
| | |
| | |
| | | | |
INVESTMENT MANAGER AND ADMINISTRATOR AMG Funds LLC 680 Washington Blvd., Suite 500 Stamford, CT 06901 800.548.4539 DISTRIBUTOR AMG Distributors, Inc. 680 Washington Blvd., Suite 500 Stamford, CT 06901 800.548.4539 SUBADVISER First Quadrant, L.P. 800 E. Colorado Boulevard, Suite 900 Pasadena, CA 91101 | | CUSTODIAN The Bank of New York Mellon Mutual Funds Custody 6023 Airport Road Oriskany, NY 13424 LEGAL COUNSEL Ropes & Gray LLP Prudential Tower, 800 Boylston Street Boston, MA 02199-3600 TRANSFER AGENT BNY Mellon Investment Servicing (US) Inc. Attn: AMG Funds 4400 Computer Drive Westborough, MA 01581 800.548.4539 | | This report is prepared for the Fund’s shareholders. It is authorized for distribution to prospective investors only when preceded or accompanied by an effective prospectus. To receive a free copy of the prospectus or Statement of Additional Information, which includes additional information about Fund Trustees, please contact us by calling 800.548.4539. Distributed by AMG Distributors, Inc., member FINRA/SIPC. Current net asset values per share for the Fund are available on the Fund’s website at amgfunds.com. A description of the policies and procedures the Fund uses to vote its proxies is available: (i) without charge, upon request, by calling 800.548.4539, or (ii) on the Securities and Exchange Commission’s (SEC) website at sec.gov. For information regarding the Fund’s proxy voting record for the 12-month period ended June 30, call 800.548.4539 or visit the SEC website at sec.gov. The Fund files its complete schedule of portfolio holdings with the SEC for the first and third quarters of each fiscal year as an exhibit to their reports on Form N-PORT. The Fund’s portfolio holdings on Form N-PORT are available on the SEC’s website at sec.gov and the Fund’s website at amgfunds.com. To review a complete list of the Fund’s portfolio holdings, or to view the most recent semiannual report or annual report, please visit amgfunds.com. |
| | |
| |
|
| | | | | | | | | | | | |
| | BALANCED FUNDS AMG GW&K Global Allocation GW&K Investment Management, LLC AMG FQ Global Risk-Balanced First Quadrant, L.P. EQUITY FUNDS AMG Beutel Goodman International Equity Beutel, Goodman & Company Ltd. AMG Boston Common Global Impact Boston Common Asset Management, LLC AMG Managers CenterSquare Real Estate CenterSquare Investment Management LLC AMG Frontier Small Cap Growth Frontier Capital Management Co., LLC AMG GW&K Small Cap Core AMG GW&K Small Cap Value AMG GW&K Small/Mid Cap AMG GW&K Small/Mid Cap Growth AMG GW&K Emerging Markets Equity AMG GW&K Emerging Wealth Equity AMG GW&K International Small Cap GW&K Investment Management, LLC AMG Montrusco Bolton Large Cap Growth Montrusco Bolton Investments, Inc. | | | | AMG Renaissance Large Cap Growth The Renaissance Group LLC AMG River Road Dividend All Cap Value AMG River Road Focused Absolute Value AMG River Road International Value Equity AMG River Road Large Cap Value Select AMG River Road Mid Cap Value AMG River Road Small-Mid Cap Value AMG River Road Small Cap Value River Road Asset Management, LLC AMG TimesSquare Emerging Markets Small Cap AMG TimesSquare Global Small Cap AMG TimesSquare International Small Cap AMG TimesSquare Mid Cap Growth AMG TimesSquare Small Cap Growth TimesSquare Capital Management, LLC AMG Veritas Asia Pacific AMG Veritas China AMG Veritas Global Focus AMG Veritas Global Real Return Veritas Asset Management LLP AMG Yacktman AMG Yacktman Focused AMG Yacktman Global AMG Yacktman Special Opportunities Yacktman Asset Management LP | | | | FIXED INCOME FUNDS AMG Beutel Goodman Core Plus Bond Beutel, Goodman & Company Ltd. AMG GW&K Core Bond ESG AMG GW&K Enhanced Core Bond ESG AMG GW&K ESG Bond AMG GW&K High Income AMG GW&K Municipal Bond AMG GW&K Municipal Enhanced Yield GW&K Investment Management, LLC | | |
| | | | |
| amgfunds.com | | 103121 | | AR014 |
| | |
| | | ANNUAL REPORT |
| | | | | | | | |
| | | | | AMG Funds October 31, 2021 
AMG GW&K Core Bond ESG Fund |
| | | | | |
| | | | | Class N: MBGVX | | Class I: MBDFX | | Class Z: MBDLX |
| | | | | |
| | | |
| | | | | AMG GW&K Emerging Markets Equity Fund |
| | | | | |
| | | | | Class N: TLEVX | | Class I: TLESX | | Class Z: TLEIX |
| | | |
| | | | | AMG GW&K Emerging Wealth Equity Fund |
| | | | | |
| | | | | Class N: TYWVX | | Class I: TYWSX | | Class Z: TYWIX |
| | | | | AMG GW&K Small/Mid Cap Growth Fund (formerly AMG GW&K Small Cap Fund II, which was formerly AMG Managers LMCG Small Cap Growth Fund) |
| | | | | |
| | | | | Class N: ACWDX | | Class I: ACWIX | | Class Z: ACWZX |
| | | | | |
| | | | | | | | | |
| | |
| amgfunds.com | | 103121 AR069 |
| | |
| | | AMG Funds Annual Report — October 31, 2021 |
| | | | | | |
| | | |
| | | | | | | |
| | | TABLE OF CONTENTS | | PAGE | |
| | | | |
| | | LETTER TO SHAREHOLDERS | | | 2 | |
| | | |
| | | ABOUT YOUR FUND’S EXPENSES | | | 3 | |
| | | |
| | | PORTFOLIO MANAGER’S COMMENTS, FUND SNAPSHOTS AND SCHEDULES OF PORTFOLIO INVESTMENTS | | | | |
| | | |
| | | AMG GW&K Core Bond ESG Fund | | | 4 | |
| | | |
| | | AMG GW&K Emerging Markets Equity Fund | | | 12 | |
| | | |
| | | AMG GW&K Emerging Wealth Equity Fund | | | 19 | |
| | | |
| | | AMG GW&K Small/Mid Cap Growth Fund | | | 25 | |
| | | |
| | | FINANCIAL STATEMENTS | | | | |
| | | |
| | | Statement of Assets and Liabilities | | | 31 | |
| | | |
| | | Balance sheets, net asset value (NAV) per share computations
and cumulative distributable earnings (loss) | | | | |
| | | |
| | | Statement of Operations | | | 33 | |
| | | |
| | | Detail of sources of income, expenses, and realized and
unrealized gains (losses) during the fiscal year | | | | |
| | | |
| | | Statements of Changes in Net Assets | | | 34 | |
| | | |
| | | Detail of changes in assets for the past two fiscal years | | | | |
| | | |
| | | Financial Highlights | | | 36 | |
| | | |
| | | Historical net asset values per share, distributions, total returns, income
and expense ratios, turnover ratios and net assets | | | | |
| | | |
| | | Notes to Financial Statements | | | 48 | |
| | | |
| | | Accounting and distribution policies, details of agreements and
transactions with Fund management and affiliates, and descriptions
of certain investment risks | | | | |
| | | |
| | | REPORT OF INDEPENDENT REGISTERED PUBLIC ACCOUNTING FIRM | | | 57 | |
| | | |
| | | OTHER INFORMATION | | | 58 | |
| | | |
| | | TRUSTEES AND OFFICERS | | | 60 | |
| | | |
| | | ANNUAL RENEWAL OF INVESTMENT MANAGEMENT AND SUBADVISORY AGREEMENTS | | | 63 | |
| | | | | | | |
|
| Nothing contained herein is to be considered an offer, sale or solicitation of an offer to buy shares of any series of the AMG Funds Family of Funds. Such offering is made only by prospectus, which includes details as to offering price and other material information. | |
| | |
 | | Letter to Shareholders |
Dear Shareholder:
The fiscal year ended October 31, 2021, was marked by the continued extraordinary recovery amid an unprecedented global effort to stop the COVID-19 pandemic. Equities rallied to new record highs amid better-than-expected corporate earnings, colossal fiscal and monetary stimulus programs, and an improving economic backdrop. Since the market bottom on March 23, 2020, the S&P 500® Index has gained over 111%. Businesses and consumers contended with disrupted supply chains and rising prices on a wide range of goods such as lumber and gasoline, and outbreaks of coronavirus variants kept the world on edge. Volatility increased in September as investors grew more concerned about rising inflation and more hawkish global central bank policies, but equities were resilient and finished the fiscal year with a strong rally.
The S&P 500® gained 42.91% during the period and all sectors produced double-digit returns, but there was very wide dispersion in performance. Energy and financials led the market with returns of 111.38% and 72.14%, respectively. On the other hand, utilities and consumer staples lagged with returns of 10.64% and
19.02%, respectively. Value stocks edged out Growth stocks as the Russell 1000® Value Index returned 43.76% compared to the 43.21% return for the Russell 1000® Growth Index. Small cap stocks outperformed as the Russell 2000® Index experienced its best quarter (fourth quarter 2020) on record. Within small caps, the Value-Growth disparity was much more pronounced as the Russell 2000® Value Index returned 64.30% compared to 38.45% for the Russell 2000® Growth Index. Outside the U.S., foreign developed markets lagged their U.S. counterparts with a 34.18% return for the MSCI EAFE Index. A major regulatory crackdown in China shook investor confidence in Chinese equities and caused emerging markets to underperform with a 16.96% return for the MSCI Emerging Markets Index.
Interest rates lifted off from near-historic lows as the vaccine rollout initiated a return to normalcy and the economic outlook improved. The 10-year Treasury yield rose 69 basis points to 1.55% and ended the fiscal year not far off its post-pandemic high. The Bloomberg U.S. Aggregate Bond Index, a broad measure of U.S. bond market performance, lost 0.48% over the period. Healthy risk appetite drove credit spreads tighter and helped investment-grade corporate bonds produce a modestly positive 2.18% return. The global search for yield helped high-yield bonds outperform the investment-grade market with a 10.53% return as measured by the return of the Bloomberg U.S. Corporate High Yield Bond Index. Municipal bonds benefited from a strong technical backdrop and drove a 2.64% return for the Bloomberg Municipal Bond Index.
AMG Funds appreciates the privilege of providing investment tools to you and your clients. Our foremost goal is to provide investment solutions that help our shareholders successfully reach their long-term investment goals. AMG Funds provides access to a distinctive array of actively managed return-oriented investment strategies. We thank you for your continued confidence and investment in AMG Funds. You can rest assured that under all market conditions our team is focused on delivering excellent investment management services for your benefit.
Respectfully,
Keitha Kinne
President
AMG Funds
| | | | | | | | | | | | | | |
Average Annual Total Returns | | Periods ended October 31, 2021* | |
| | | | |
| Stocks: | | | | 1 Year | | | 3 Years | | | 5 Years | |
| | | | |
Large Cap | | (S&P 500® Index) | | | 42.91 | % | | | 21.48% | | | | 18.93% | |
| | | | |
Small Cap | | (Russell 2000® Index) | | | 50.80 | % | | | 16.47% | | | | 15.52% | |
| | | | |
International | | (MSCI All Country World Index ex USA) | | | 29.66 | % | | | 12.00% | | | | 9.77% | |
| Bonds: | | | | | | | | | | | |
| | | | |
Investment Grade | | (Bloomberg U.S. Aggregate Bond Index) | | | (0.48 | )% | | | 5.63% | | | | 3.10% | |
| | | | |
High Yield | | (Bloomberg U.S. Corporate High Yield Bond Index) | | | 10.53 | % | | | 7.43% | | | | 6.40% | |
| | | | |
Tax-exempt | | (Bloomberg Municipal Bond Index) | | | 2.64 | % | | | 5.17% | | | | 3.41% | |
| | | | |
Treasury Bills | | (ICE BofAML U.S. 6-Month Treasury Bill Index) | | | 0.11 | % | | | 1.37% | | | | 1.32% | |
*Source: FactSet. Past performance is no guarantee of future results.
2
|
About Your Fund’s Expenses |
| | | | | | | | |
As a shareholder of a Fund, you may incur two types of costs: (1) transaction costs, which may include sales charges (loads) on purchase payments; redemption fees; and exchange fees; and (2) ongoing costs, including management fees; distribution (12b-1) fees; and other Fund expenses. This example is intended to help you understand your ongoing costs (in dollars) of investing in the Fund and to compare these costs with the ongoing costs of investing in other mutual funds. The example is based on $1,000 invested at the beginning of the period and held for the entire period as indicated below. ACTUAL EXPENSES The first line of the following table provides information about the actual account values and | | | | actual expenses. You may use the information in this line, together with the amount you invested, to estimate the expenses that you paid over the period. Simply divide your account value by $1,000 (for example, an $8,600 account value divided by $1,000 = 8.6), then multiply the result by the number in the first line under the heading entitled “Expenses Paid During Period” to estimate the expenses you paid on your account during this period. HYPOTHETICAL EXAMPLE FOR COMPARISON PURPOSES The second line of the following table provides information about hypothetical account values and hypothetical expenses based on the Fund’s actual expense ratio and an assumed annual rate of return of 5% before expenses, which is not the Fund’s | | | | actual return. The hypothetical account values and expenses may not be used to estimate the actual ending account balance or expenses you paid for the period. You may use this information to compare the ongoing costs of investing in the Fund and other funds by comparing this 5% hypothetical example with the 5% hypothetical examples that appear in the shareholder reports of other funds. Please note that the expenses shown in the table are meant to highlight your ongoing costs only and do not reflect any transactional costs, such as sales charges (loads), redemption fees, or exchange fees. Therefore, the second line of the table is useful in comparing ongoing costs only, and will not help you determine the relative total costs of owning different funds. |
| |
| | | | | | | | |
| | | | |
Six Months Ended October 31, 2021 | | Expense
Ratio for
the Period | | Beginning
Account
Value
05/01/21 | | Ending
Account
Value
10/31/21 | | Expenses
Paid
During
the Period* |
AMG GW&K Core Bond ESG Fund |
|
Based on Actual Fund Return |
| | | | |
Class N | | 0.88% | | $1,000 | | $1,007 | | $4.45 |
| | | | |
Class I | | 0.56% | | $1,000 | | $1,008 | | $2.83 |
| | | | |
Class Z | | 0.48% | | $1,000 | | $1,009 | | $2.43 |
|
Based on Hypothetical 5% Annual Return |
| | | | |
Class N | | 0.88% | | $1,000 | | $1,021 | | $4.48 |
| | | | |
Class I | | 0.56% | | $1,000 | | $1,022 | | $2.85 |
| | | | |
Class Z | | 0.48% | | $1,000 | | $1,023 | | $2.45 |
AMG GW&K Emerging Markets Equity Fund |
|
Based on Actual Fund Return |
| | | | |
Class N | | 1.27% | | $1,000 | | $904 | | $6.09 |
| | | | |
Class I | | 0.96% | | $1,000 | | $905 | | $4.61 |
| | | | |
Class Z | | 0.87% | | $1,000 | | $905 | | $4.18 |
|
Based on Hypothetical 5% Annual Return |
| | | | |
Class N | | 1.27% | | $1,000 | | $1,019 | | $6.46 |
| | | | |
Class I | | 0.96% | | $1,000 | | $1,020 | | $4.89 |
| | | | |
Class Z | | 0.87% | | $1,000 | | $1,021 | | $4.43 |
AMG GW&K Emerging Wealth Equity Fund |
|
Based on Actual Fund Return |
| | | | |
Class N | | 1.24% | | $1,000 | | $860 | | $5.81 |
| | | | |
Class I | | 0.94% | | $1,000 | | $861 | | $4.41 |
| | | | |
Class Z | | 0.84% | | $1,000 | | $862 | | $3.94 |
|
Based on Hypothetical 5% Annual Return |
| | | | |
Class N | | 1.24% | | $1,000 | | $1,019 | | $6.31 |
| | | | |
Class I | | 0.94% | | $1,000 | | $1,020 | | $4.79 |
| | | | |
Class Z | | 0.84% | | $1,000 | | $1,021 | | $4.28 |
| | | | | | | | |
| | | | |
Six Months Ended October 31, 2021 | | Expense
Ratio for
the Period | | Beginning
Account
Value
05/01/21 | | Ending
Account
Value
10/31/21 | | Expenses
Paid
During
the Period* |
AMG GW&K Small/Mid Cap Growth Fund |
|
Based on Actual Fund Return |
| | | | |
Class N | | 1.07% | | $1,000 | | $1,109 | | $5.69 |
| | | | |
Class I | | 0.93% | | $1,000 | | $1,110 | | $4.95 |
| | | | |
Class Z** | | 0.82% | | $1,000 | | $1,031 | | $1.39 |
|
Based on Hypothetical 5% Annual Return |
| | | | |
Class N | | 1.07% | | $1,000 | | $1,020 | | $5.45 |
| | | | |
Class I | | 0.93% | | $1,000 | | $1,021 | | $4.74 |
| | | | |
Class Z** | | 0.82% | | $1,000 | | $1,021 | | $4.18 |
| * | Expenses are equal to the Fund’s annualized expense ratio multiplied by the average account value over the period, multiplied by the number of days in the most recent fiscal half-year (184), then divided by 365. |
| ** | Commencement of operations was August 31, 2021. Expenses are equal to the Fund’s annualized expense ratio multiplied by the average account value over the period, multiplied by the number of days since inception (61), then divided by 365. |
3
|
AMG GW&K Core Bond ESG Fund Portfolio Manager’s Comments (unaudited) |
| | | | | | | | |
THE YEAR IN REVIEW For the 12 months ending October 31, 2021, AMG GW&K Core Bond ESG Fund’s (the “Fund”) Class I shares returned 0.15%, compared to the return of (0.48%) for the Bloomberg U.S. Aggregate Bond Index (the “Index”). OVERVIEW GW&K Investment Management, LLC (“GWK”) believes that responsible corporate behavior with respect to ESG (environmental, social, and governance) factors can lead to positive and sustainable long-term financial performance and aligns with our pursuit of quality investments. GW&K has been incorporating ESG factors into our equity and fixed income analysis process for several years, and as a signatory of the UN Principles for Responsible Investment, we are committed to incorporating the assessment of ESG issues into our fundamental research process. We believe ESG investing adds value to our investment process by improving our assessment of risk and enhancing our ability to identify high-quality credits; aids our up-in-quality bias by improving identification of credits with less long-term volatility; limits our exposure to credit ratings downgrades and negative events that are difficult to quantify; and deepens our fundamental credit analysis and leads to better outcomes by providing a more nuanced and complete picture. ESG considerations have long informed our process. We focus on business and credit fundamentals, relative valuation, and technical considerations. We believe ESG factors are important considerations in analyzing a company’s business and financial policy and that they highlight non-financial risks that can significantly affect a company’s financial health over the long term. Just as with credit risks, investors require additional compensation for ESG risks, leading to potential inefficiencies in valuation. MARKET OVERVIEW The beginning of the fiscal year in late 2020 represented a major inflection point for fixed income markets, as the most dominant trading narratives of 2020 were either resolved or significantly advanced. The closely contested U.S. election was decided, another round of fiscal stimulus was passed, and, most importantly, several COVID-19 vaccines were approved for worldwide distribution. But while some of 2020’s most salient overhangs have been removed, the year ahead promised challenges of its own. On the political front, the incoming administration certainly had its work cut out for itself | | | | in advancing meaningful legislation, with implications ranging from additional stimulus to changes in the regulatory landscape. The speed at which vaccines were distributed is likewise a point of uncertainty, to say nothing of how effective it will ultimately be at slowing the spread of the virus. Meanwhile, the economy continued its slow climb out of the recent downturn as businesses and consumers adapt to a post-COVID-19 world. Importantly for the bond market, the possibility of adverse outcomes is likely to be mitigated by the U.S. Federal Reserve (Fed). The central bank continues to exert massive influence over capital markets, and policymakers remain clear in their intentions to ensure their smooth functioning. Fixed income markets posted their worst returns since 1981 in the first quarter of 2021 amid a sharp rebound in growth expectations and burgeoning fears of higher inflation. The success of the nationwide vaccine rollout, a rapidly healing labor market, and swelling consumer confidence continued to drive the reflation narrative. Further support came in the form of a $1.9 trillion fiscal stimulus package on top of a commitment to ultra-loose monetary policy from the Fed. And beyond that, investors were confronted with the possibility of yet more fiscal support with a proposal of infrastructure spending. This combination of factors amounted to nothing less than a wholesale regime shift for a bond market that until just a few months ago struggled with an anemic growth outlook and fears of deflation. Fixed income markets rebounded solidly in the second quarter of 2021 following their worst selloff in decades. The most prominent catalyst behind the first-quarter rout—the threat of sharply faster economic growth and elevated inflation—proved far less menacing in light of lackluster data and a less dovish the Fed. In addition to the overhang of COVID-19, including fears of new variants and the elusiveness of herd immunity, signs began to emerge that the pace of the recovery had peaked. Nonfarm payrolls posted successive disappointing results, the manufacturing resurgence stalled, and retail sales slipped. Some of the more sensational commodity price spikes began to roll over as well, casting further doubt on the persistence of recent inflationary pressures. None of this suggests that the recovery is off track, but the bond market’s stubborn resilience points to a marked revision of the timeframe for normalization. Fixed income markets were essentially unchanged in the third quarter of 2021 despite a steady succession of headlines related to COVID-19, geopolitics, and | | | | price increases. Bond investors’ largely sanguine response to these challenges suggests they have been able to look beyond near-term headwinds toward the next stage of the recovery. The Delta variant drove a massive surge in cases across much of the U.S., even as new prevention and treatment options continued to emerge and data suggest cases have crested. Chinese authorities enacted assertive regulatory changes and pursued efforts to reduce systemic leverage, while nevertheless framing both as necessary to achieve long-term stability and prosperity. Supply-chain constraints, energy shortages, and limited labor availability threatened to weigh on growth around the world, but there have been few indications that these market failures reflect any weakness in aggregate demand. On balance, these various obstacles seem to have been relegated to the category of one-time items, and the bond market has demonstrated little concern that they represent a meaningful threat to the current trading regime. The Treasury yield curve flattened significantly in the month of October. The front end moved sharply higher amid elevated inflation fears, as the yield on the two-year jumped to a new post-pandemic high. Rates farther out the curve were more subdued, with the long end even enjoying a slight rally, as investors tempered their longer-term growth outlook. Inflation breakevens closed at the top of a multi-decade range. FUND REVIEW The Fund modestly outperformed the Index for the one-year period ended October 31, 2021. The above-benchmark allocation to spread product was the main contributor to returns. Specifically, an overweight to investment-grade corporate bonds helped as did an overweight to taxable municipals. An out of benchmark allocation to fixed-to-floating bonds also added to performance. The Fund’s notable underweight was to the Treasury sector, which underperformed. Security selection also helped returns, with positive results experienced in consumer cyclicals and consumer non-cyclicals as well as agency mortgage-backed securities (MBS) and taxable municipals. On the negative side, selection in capital goods, communications, and agency Collateralized MBS detracted. The Fund’s duration positioning also contributed. Rates rose during the period and the Fund’s shorter duration compared to the Index proved favorable. On the other hand, yield curve positioning subtracted from performance, as the Fund had modest underweights |
4
|
AMG GW&K Core Bond ESG Fund Portfolio Manager’s Comments (continued) |
| | | | | | | | |
to the short and long ends of the curve. The former saw yields fall in some spots, while the latter did not rise as much as other maturities. ESG continues to be a growing area of focus for the corporate bond market. The range of companies publishing sustainability reports and setting related goals and targets increased significantly this year. Large companies in even some of the highest emitting industries, like autos, oil & gas, and steel, set long-term reduction targets and committed to significant sustainability investments. Following this trend, 2021 will be another record-shattering year for ESG-labeled bond issuance, with green bonds dominating the market as investors clamor for ESG-related investments. While we continue to selectively add ESG-labeled bonds, we remain focused on avoiding corporate issuers with weaker ESG-related practices. We conducted the following trades based on ESG factors over the period: We purchased a Republic of Chile bond, a green bond that also allowed for diversification. The position was subsequently sold on potential for elevated political risk. We sold Cheniere on ESG concerns regarding its carbon profile. | | | | We exited T-Mobile due to ESG concerns surrounding its data breach. OUTLOOK The increasingly hawkish tone of commentary from central banks around the world has raised the temperature of rhetoric on both sides of the transitory versus structural inflation debate. In the former camp are those who caution that responding too hastily to one-time supply side-related shortages would result in a policy error; those in the latter camp fret that authorities are already behind the curve and that tapering should have begun months ago. The slope of the yield curve offers little clarity and points to a stalemate for now, sitting at or very near its multi-decade average (depending on which tenors you consider). While we recognize merits on both sides of the argument, we continue to see more risk to the upside in rates than the downside and thus remain broadly shorter than our benchmarks. We also see a more appealing risk profile in intermediate maturities in comparison to the long end, which would experience the greatest volatility in the event of a sharp move higher in rates. Our outlook for corporate credit remains constructive and we believe the space offers the most compelling value in the fixed income market. Insofar as Treasury yields sit near historic lows, corporates offer an attractive yield advantage, and in the event that | | | | rates begin to rise they offer a potential buffer. Additionally, as the recovery continues to unfold, we see opportunities in credit-improvement stories that could benefit from spread compression and that would generate further excess returns. The higher-rated segments of the high yield market in particular are rich in these opportunities, given the number of issuers downgraded from Investment Grade (“IG”) last year that are poised to regain their former IG status. We also anticipate further outperformance in select segments of the consumer-oriented sectors, while remaining wary of potential challenges posed by supply chain stresses. We are still neutral on the mortgage space in advance of the Fed’s tapering, but the recent uptick in mortgage rates offers a first step toward improving our confidence in the prepayment outlook. Our preference for higher-coupon, seasoned pools has already begun paying off as duration for the benchmark has lengthened into the rates selloff. Given that we expect this trend to persist, we maintain this preference within the MBS space. The views expressed represent the opinions of GW&K Investment Management, LLC as of October 31, 2021, and are not intended as a forecast or guarantee of future results, and are subject to change without notice. |
5
|
AMG GW&K Core Bond ESG Fund Portfolio Manager’s Comments (continued) |
|
CUMULATIVE TOTAL RETURN PERFORMANCE AMG GW&K Core Bond ESG Fund’s cumulative total return is based on the daily change in net asset value (NAV), and assumes that all dividends and distributions were reinvested. This graph compares a hypothetical $10,000 investment made in the AMG GW&K Core Bond ESG Fund’s Class I shares on October 31, 2011, to a $10,000 investment made in the Bloomberg U.S. Aggregate Bond Index for the same time period. The graph and table do not reflect the deduction of taxes that a shareholder would pay on a Fund distribution or redemption of shares. The listed returns for the Fund are net of expenses and the returns for the index exclude expenses. Total returns would have been lower had certain expenses not been reduced. 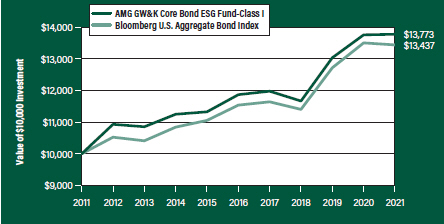
The table below shows the average annual total returns for the AMG GW&K Core Bond ESG Fund and the Bloomberg U.S. Aggregate Bond Index for the same time periods ended October 31, 2021. |
| | | | | | | | | | | | | | | | | | | | |
| Average Annual Total Returns1 | | One
Year | | | Five
Years | | | Ten
Years | | | Since
Inception | | | Inception
Date | |
AMG GW&K Core Bond ESG Fund2, 3, 4, 5, 6, 7, 8, 9 | | | | | |
| | | | | |
Class N | | | (0.27 | %) | | | 2.69 | % | | | – | | | | 2.63 | % | | | 05/08/15 | |
| | | | | |
Class I | | | 0.15 | % | | | 3.03 | % | | | 3.25% | | | | 5.64 | % | | | 04/30/93 | |
| | | | | |
Class Z | | | 0.13 | % | | | 3.11 | % | | | – | | | | 3.05 | % | | | 05/08/15 | |
| | | | | |
Bloomberg U.S. Aggregate Bond Index10 | | | (0.48 | %) | | | 3.10 | % | | | 3.00% | | | | 5.13 | % | | | 04/30/93 | † |
The performance data shown represents past performance. Past performance is not a guarantee of future results. Current performance may be lower or higher than the performance data quoted. The investment return and principal value of an investment will fluctuate so that an investor’s shares, when redeemed, may be worth more or less than their original cost.
Investors should carefully consider the Fund’s investment objectives, risks, charges and expenses before investing. For performance information through the most recent month end, current net asset values per share for the Fund and other information, please call 800.548.4539 or visit our website at amgfunds.com for a free prospectus. Read it carefully before investing or sending money.
Distributed by AMG Distributors, Inc., member FINRA/SIPC.
| † | Date reflects inception date of the Fund, not the index. |
| 1 | Total return equals income yield plus share price change and assumes reinvestment of all dividends and capital gain distributions. Returns are net of fees and may reflect offsets of Fund expenses as described in the prospectus. No adjustment has been made for taxes payable by shareholders on their reinvested dividends and |
|
capital gain distributions. Returns for periods greater than one year are annualized. The listed returns on the Fund are net of expenses and based on the published NAV as of October 31, 2021. All returns are in U.S. dollars($). 2 From time to time, the Fund’s advisor has waived its fees and/or absorbed Fund expenses, which has resulted in higher returns. 3 To the extent that the Fund invests in asset-backed or mortgage-backed securities, its exposure to prepayment and extension risks may be greater than investments in other fixed income securities. 4 Active and frequent trading of a fund may result in higher transaction costs and increased tax liability. 5 The Fund is subject to the risks associated with investments in debt securities, such as default risk and fluctuations in the perception of the debtor’s ability to pay its creditors. Changing interest rates may adversely affect the value of an investment. An increase in interest rates typically causes the value of bonds and other fixed income securities to fall. 6 The Fund may invest in derivatives such as options and futures; the complexity and rapidly changing structure of derivatives markets may increase the possibility of market losses. |
7 Many bonds have call provisions which allow the debtors to pay them back before maturity. This is especially true with mortgage securities, which can be paid back anytime. Typically debtors prepay their debt when it is to their advantage (when interest rates drop making a new loan at current rates more attractive), and thus likely to the disadvantage of bondholders, who may have to reinvest prepayment proceeds in securities with lower yields. Prepayment risk will vary depending on the provisions of the security and current interest rates relative to the interest rate of the debt. 8 Market prices of investments held by the Fund may fall rapidly or unpredictably due to a variety of economic or political factors, market conditions, disasters or public health issues, or in response to events that affect particular industries or companies. 9 Applying the Fund’s ESG investment criteria may result in the selection or exclusion of securities of certain issuers for reasons other than performance, and the Fund may underperform funds that do not utilize an ESG investment strategy. The application of this strategy may affect the Fund’s exposure to certain companies, sectors, regions, countries or types of investments, which could negatively impact the Fund’s performance depending on whether such investments are in or out of favor. Applying ESG criteria to investment decisions is qualitative and subjective by nature, and there is no guarantee that the criteria utilized by the Subadviser or any judgment exercised by the |
| |
6
|
AMG GW&K Core Bond ESG Fund Portfolio Manager’s Comments (continued) |
| | | | | | | | |
Subadviser will reflect the beliefs or values of any particular investor. 10 The Bloomberg U.S. Aggregate Bond Index is an index of the U.S. investment-grade fixed-rate bond market, including both government and corporate bonds. Unlike the Fund, the Bloomberg U.S. Aggregate Bond Index is unmanaged, is not available for investment, and does not incur expenses. | | | | “Bloomberg®” and Bloomberg U.S. Aggregate Bond Index are service marks of Bloomberg Finance L.P. and its affiliates, including Bloomberg Index Services Limited (“BISL”), the administrator of the index (collectively, “Bloomberg”) and have been licensed for use for certain purposes by AMG Funds LLC. Bloomberg is not affiliated with AMG Funds LLC, and Bloomberg does not approve, endorse, review, or recommend the AMG GW&K Core Bond ESG Fund. | | | | Bloomberg does not guarantee the timeliness, accurateness, or completeness of any data or information relating to the AMG GW&K Core Bond ESG Fund. Not FDIC insured, nor bank guaranteed. May lose value. |
7
|
AMG GW&K Core Bond ESG Fund Fund Snapshots (unaudited) October 31, 2021 |
PORTFOLIO BREAKDOWN
| | | | | |
| Category | | % of
Net Assets |
| | |
U.S. Government and Agency Obligations | | | | 46.6 | |
| | |
Corporate Bonds and Notes | | | | 40.5 | |
| | |
Municipal Bonds | | | | 7.6 | |
| | |
Foreign Government Obligations | | | | 0.7 | |
| | |
Other Assets Less Liabilities | | | | 4.6 | |
| |
| Rating | | % of Market Value1 |
| | |
U.S. Government and Agency Obligations | | | | 48.9 | |
| | |
Aaa/AAA | | | | 3.4 | |
| | |
Aa/AA | | | | 13.4 | |
| | |
A | | | | 8.7 | |
| | |
Baa/BBB | | | | 25.6 | |
|
| |
TOP TEN HOLDINGS
| | |
| Security Name | | % of
Net Assets |
| | |
U.S. Treasury Bonds, 2.250%, 05/15/41 | | 3.5 |
| | |
United States Treasury Notes, 2.000%, 11/30/22 | | 3.0 |
| | |
U.S. Treasury Bonds, 6.250%, 08/15/23 | | 2.8 |
| | |
FHLMC, 3.500%, 10/01/45 | | 2.7 |
| | |
U.S. Treasury Bonds, 1.875%, 02/15/51 | | 2.2 |
| | |
California State General Obligation, School Improvements, 7.550%, 04/01/39 | | 2.1 |
| | |
The Bank of Nova Scotia, 0.594%, 03/02/26 (Canada) | | 2.0 |
| | |
FHLMC, 3.000%, 11/01/49 | | 2.0 |
| | |
Verizon Communications, Inc., 3.875%, 02/08/29 | | 1.9 |
| | |
FHLMC, 2.500%, 10/01/34 | | 1.8 |
| | | |
| | |
Top Ten as a Group | | 24.0 |
| | |
| 1 | Includes market value of long-term fixed-income securities only. |
Credit quality ratings shown above reflect the highest rating assigned by either Standard & Poor’s (“S&P”) or Moody’s Investors Service, Inc. (“Moody’s”). These rating agencies are independent, nationally recognized statistical rating organizations and are widely used. Investment grade ratings are credit ratings of BBB/Baa or higher. Below investment grade ratings are credit ratings of BB/Ba or lower. Investments designated N/R are not rated by any of the rating agencies. Unrated investments do not necessarily indicate low credit quality. Credit quality ratings are subject to change.
Because a fund’s strategy may result in multiple investments in particular sectors of the economy, its performance may depend on the performance of those sectors and may fluctuate more widely than investments diversified across more sectors. For additional information on these and other risk considerations, please see the Fund’s prospectus.
Any sectors, industries, or securities discussed should not be perceived as investment recommendations. Mention of a specific security should not be considered a recommendation to buy or solicitation to sell that security. Specific securities mentioned in this report may have been sold from the Fund’s portfolio of investments by the time you receive this report.
8
|
AMG GW&K Core Bond ESG Fund Schedule of Portfolio Investments October 31, 2021 |
| | | | | | | | |
| | | Principal
Amount | | | Value | |
Corporate Bonds and Notes - 40.5% | | | | | |
| | |
Financials - 16.5% | | | | | | | | |
| | |
Air Lease Corp.
MTN, 3.000%, 02/01/30 | | | $2,113,000 | | | | $2,137,099 | |
| | |
Ally Financial, Inc.
8.000%, 11/01/31 | | | 1,404,000 | | | | 2,010,281 | |
| | |
American Express Co. | | | | | | | | |
(3.550% to 09/15/26 then U.S. Treasury Yield Curve CMT 5 year + 2.854%), 3.550%, 09/15/261,2,3 | | | 1,423,000 | | | | 1,430,115 | |
| | |
Bank of America Corp. | | | | | | | | |
MTN, (4.330% to 03/15/49 then 3 month LIBOR + 1.520%), 4.330%, 03/15/501,3 | | | 1,600,000 | | | | 1,990,795 | |
| | |
The Bank of New York Mellon Corp. | | | | | | | | |
MTN, 2.450%, 08/17/26 | | | 937,000 | | | | 979,113 | |
Series G, (4.700% to 09/20/25 then U.S. Treasury Yield Curve CMT 5 year + 4.358%), 4.700%, 09/20/251,2,3 | | | 910,000 | | | | 990,262 | |
| | |
The Bank of Nova Scotia (Canada) | | | | | | | | |
(SOFR + 0.545%), 0.594%, 03/02/263 | | | 3,986,000 | | | | 3,985,123 | |
| | |
Boston Properties, LP 3.400%, 06/21/29 | | | 1,841,000 | | | | 1,973,935 | |
| | |
The Charles Schwab Corp. | | | | | | | | |
Series I, (4.000% to 06/01/26 then U.S. Treasury Yield Curve CMT 5 year + 3.168%), 4.000%, 06/01/261,2,3 | | | 1,975,000 | | | | 2,032,571 | |
| | |
Crown Castle International Corp.
4.000%, 03/01/27 | | | 1,800,000 | | | | 1,981,047 | |
| | |
The Goldman Sachs Group, Inc.
3.500%, 11/16/26 | | | 2,726,000 | | | | 2,920,775 | |
| | |
JPMorgan Chase & Co. | | | | | | | | |
(SOFR + 0.580%), 0.629%, 03/16/243 | | | 1,962,000 | | | | 1,968,607 | |
(SOFR + 0.765%), 0.814%, 09/22/273 | | | 1,928,000 | | | | 1,940,773 | |
| | |
MetLife, Inc. | | | | | | | | |
Series G, (3.850% to 09/15/25 then U.S. Treasury Yield Curve CMT 5 year + 3.576%), 3.850%, 09/15/251,2,3 | | | 2,009,000 | | | | 2,084,338 | |
| | |
The Toronto-Dominion Bank, MTN (Canada) | | | | | | | | |
(SOFR + 0.350%), 0.399%, 09/10/243 | | | 1,951,000 | | | | 1,954,371 | |
| | |
Wells Fargo & Co. | | | | | | | | |
MTN, (5.013% to 04/04/50 then SOFR + 4.502%), 5.013%, 04/04/511,3 | | | 1,411,000 | | | | 1,948,827 | |
| | |
Total Financials | | | | | | | 32,328,032 | |
| | |
Industrials - 22.5% | | | | | | | | |
| | |
Ashtead Capital, Inc.
1.500%, 08/12/264 | | | 986,000 | | | | 967,528 | |
| | |
AT&T, Inc.
4.300%, 12/15/42 | | | 1,710,000 | | | | 1,935,581 | |
| | |
Block Financial LLC
3.875%, 08/15/30 | | | 1,767,000 | | | | 1,882,539 | |
| | |
Broadcom Corp./Broadcom Cayman Finance, Ltd.
3.875%, 01/15/27 | | | 1,808,000 | | | | 1,959,937 | |
| | | | | | | | |
| | | Principal
Amount | | | Value | |
| | |
Charter Communications Operating LLC/Charter Communications Operating Capital 2.250%, 01/15/29 | | | $2,000,000 | | | | $1,963,350 | |
| | |
Comcast Corp.
4.150%, 10/15/28 | | | 1,656,000 | | | | 1,889,650 | |
| | |
CommonSpirit Health
3.347%, 10/01/29 | | | 2,317,000 | | | | 2,470,593 | |
| | |
CVS Health Corp.
5.125%, 07/20/45 | | | 1,735,000 | | | | 2,282,812 | |
| | |
Dell International LLC/EMC Corp.
6.200%, 07/15/30 | | | 1,512,000 | | | | 1,929,690 | |
| | |
Discovery Communications LLC
3.950%, 03/20/28 | | | 1,766,000 | | | | 1,944,659 | |
| | |
Fiserv, Inc.
4.200%, 10/01/28 | | | 1,703,000 | | | | 1,928,084 | |
| | |
The Ford Foundation | | | | | | | | |
Series 2020, 2.415%, 06/01/50 | | | 2,207,000 | | | | 2,161,857 | |
| | |
GLP Capital LP/GLP Financing II, Inc. 5.375%, 04/15/26 | | | 2,610,000 | | | | 2,943,271 | |
| | |
HCA, Inc.
4.125%, 06/15/29 | | | 1,762,000 | | | | 1,951,560 | |
4.500%, 02/15/27 | | | 874,000 | | | | 969,902 | |
| | |
Microsoft Corp.
2.525%, 06/01/50 | | | 2,195,000 | | | | 2,158,960 | |
| | |
Parker-Hannifin Corp.
3.250%, 06/14/29 | | | 1,773,000 | | | | 1,899,937 | |
| | |
ServiceNow, Inc.
1.400%, 09/01/30 | | | 2,080,000 | | | | 1,946,733 | |
| | |
Smith & Nephew PLC (United Kingdom)
2.032%, 10/14/30 | | | 1,010,000 | | | | 981,752 | |
| | |
Sysco Corp.
2.400%, 02/15/30 | | | 2,324,000 | | | | 2,353,051 | |
| | |
Verizon Communications, Inc.
3.875%, 02/08/29 | | | 3,403,000 | | | | 3,792,188 | |
| | |
Walgreens Boots Alliance, Inc.
4.800%, 11/18/44 | | | 1,593,000 | | | | 1,929,537 | |
| | |
Total Industrials | | | | | | | 44,243,171 | |
| | |
Utilities - 1.5% | | | | | | | | |
Dominion Energy, Inc. | | | | | | | | |
| | |
Series B, (4.650% to 12/15/24 then U.S. Treasury Yield Curve CMT 5 year + 2.993%), 4.650%, 12/15/241,2,3 | | | 978,000 | | | | 1,041,570 | |
| | |
National Rural Utilities Cooperative Finance Corp.
1.350%, 03/15/31 | | | 2,024,000 | | | | 1,866,557 | |
| | |
Total Utilities | | | | | | | 2,908,127 | |
| | |
Total Corporate Bonds and Notes | | | | | | | | |
(Cost $78,090,151) | | | | | | | 79,479,330 | |
| | |
Municipal Bonds - 7.6% | | | | | | | | |
| | |
California State General Obligation, School Improvements 7.550%, 04/01/39 | | | 2,410,000 | | | | 4,058,434 | |
The accompanying notes are an integral part of these financial statements.
9
|
AMG GW&K Core Bond ESG Fund Schedule of Portfolio Investments (continued) |
| | | | | | | | |
| | | Principal
Amount | | | Value | |
| |
Municipal Bonds - 7.6% (continued) | | | | | |
| | |
JobsOhio Beverage System | | | | | | | | |
| | |
Series B, 4.532%, 01/01/35 | | | $1,705,000 | | | | $2,085,404 | |
| | |
Los Angeles Unified School District, School Improvements
5.750%, 07/01/34 | | | 2,635,000 | | | | 3,479,937 | |
| | |
Massachusetts School Building Authority Series B,
1.753%, 08/15/30 | | | 2,017,000 | | | | 1,989,370 | |
| | |
University of California, University & College Improvements Series BD, 3.349%, 07/01/29 | | | 2,935,000 | | | | 3,253,498 | |
| | |
Total Municipal Bonds | | | | | | | | |
(Cost $13,515,528) | | | | | | | 14,866,643 | |
| | |
U.S. Government and Agency Obligations - 46.6% | | | | | | | | |
| | |
Fannie Mae - 18.5% | | | | | | | | |
| | |
FNMA
2.000%, 02/01/36 to 10/01/50 | | | 2,356,564 | | | | 2,407,874 | |
3.000%, 06/01/38 | | | 506,000 | | | | 536,799 | |
3.500%, 03/01/30 to 03/01/48 | | | 9,354,688 | | | | 10,083,594 | |
4.000%, 03/01/44 to 01/01/51 | | | 9,809,275 | | | | 10,741,556 | |
4.500%, 04/01/39 to 06/01/41 | | | 9,694,635 | | | | 10,827,526 | |
5.000%, 07/01/47 | | | 1,498,060 | | | | 1,699,049 | |
Total Fannie Mae | | | | | | | 36,296,398 | |
| | |
Freddie Mac - 10.9% | | | | | | | | |
| | |
FHLMC
2.500%, 10/01/34 to 08/01/50 | | | 5,058,018 | | | | 5,287,019 | |
3.000%, 11/01/49 to 03/01/50 | | | 4,976,618 | | | | 5,287,481 | |
3.500%, 10/01/45 | | | 4,812,983 | | | | 5,211,500 | |
4.000%, 07/01/48 to 09/01/50 | | | 1,806,785 | | | | 1,967,470 | |
5.000%, 07/01/44 | | | 1,582,897 | | | | 1,797,638 | |
| 1 | Fixed to variable rate investment. The rate shown reflects the fixed rate in effect at October 31, 2021. Rate will reset at a future date. |
| 2 | Perpetuity Bond. The date shown represents the next call date. |
| 3 | Variable rate security. The rate shown is based on the latest available information as of October 31, 2021. Certain variable rate securities are not based on a published reference rate and spread but are determined by the issuer or agent and are based on current market conditions. These securities do not indicate a reference rate and spread in their description above. |
| 4 | Security exempt from registration under Rule 144A of the Securities Act of 1933. This security may be resold in transactions exempt from registration, normally to qualified institutional buyers. At October 31, 2021, the value of this security amounted to $967,528 or 0.5% of net assets. |
| | | | | | | | |
| | | Principal
Amount | | | Value | |
| | |
FHLMC Gold Pool 3.500%, 07/01/32 to 05/01/44 | | | $1,685,017 | | | | $1,822,361 | |
| | |
Total Freddie Mac | | | | | | | 21,373,469 | |
| | |
U.S. Treasury Obligations - 17.2% | | | | | | | | |
| | |
U.S. Treasury Bonds
1.875%, 02/15/51 | | | 4,292,000 | | | | 4,222,255 | |
2.250%, 05/15/41 | | | 6,587,000 | | | | 6,875,181 | |
3.125%, 05/15/48 | | | 1,598,000 | | | | 1,991,445 | |
4.500%, 02/15/36 | | | 2,589,000 | | | | 3,557,953 | |
6.250%, 08/15/23 | | | 4,918,000 | | | | 5,429,203 | |
6.750%, 08/15/26 | | | 1,506,000 | | | | 1,897,325 | |
| | |
U.S. Treasury Floating Rate Note | | | | | | | | |
(U.S. Treasury 3 month Bill Money Market Yield + 0.049%), 0.099%, 01/31/233 | | | 1,964,000 | | | | 1,964,606 | |
| | |
United States Treasury Notes 2.000%, 11/30/22 | | | 5,852,000 | | | | 5,967,440 | |
2.875%, 05/15/28 | | | 1,763,000 | | | | 1,924,356 | |
| | |
Total U.S. Treasury Obligations | | | | | | | 33,829,764 | |
Total U.S. Government and Agency Obligations | | | | | | | | |
(Cost $89,913,118) | | | | | | | 91,499,631 | |
| | |
Foreign Government Obligation - 0.7% | | | | | | | | |
The Korea Development Bank (South Korea) | | | | | | | | |
0.500%, 10/27/23
(Cost $1,382,683) | | | 1,385,000 | | | | 1,378,156 | |
| | |
Total Investments - 95.4% | | | | | | | | |
(Cost $182,901,480) | | | | | | | 187,223,760 | |
| | |
Other Assets, less Liabilities - 4.6% | | | | | | | 8,931,825 | |
| | |
Net Assets - 100.0% | | | | | | $ | 196,155,585 | |
| | |
| CMT | | Constant Maturity Treasury |
| FHLMC | | Freddie Mac |
| FNMA | | Fannie Mae |
| LIBOR | | London Interbank Offered Rate |
| MTN | | Medium-Term Note |
| SOFR | | Secured Overnight Financing Rate |
The accompanying notes are an integral part of these financial statements.
10
|
AMG GW&K Core Bond ESG Fund Schedule of Portfolio Investments (continued) |
The following table summarizes the inputs used to value the Fund’s investments by the fair value hierarchy levels as of October 31, 2021:
| | | | | | | | | | | | | | | | |
| | | Level 1 | | | Level 2 | | | Level 3 | | | Total | |
Investments in Securities | | | | | | | | | | | | | | | | |
| | | | |
Corporate Bonds and Notes† | | | – | | | | $79,479,330 | | | | – | | | | $79,479,330 | |
| | | | |
Municipal Bonds† | | | – | | | | 14,866,643 | | | | – | | | | 14,866,643 | |
| | | | |
U.S. Government and Agency Obligations† | | | – | | | | 91,499,631 | | | | – | | | | 91,499,631 | |
| | | | |
Foreign Government Obligation | | | – | | | | 1,378,156 | | | | – | | | | 1,378,156 | |
| | | | |
Total Investments in Securities | | | – | | | | $187,223,760 | | | | – | | | | $187,223,760 | |
| | | | | | | | | | | | | | | | |
| | † | All corporate bonds and notes, municipal bonds, and U.S. government and agency obligations held in the Fund are Level 2 securities. For a detailed breakout of corporate bonds and notes, municipal bonds, and U.S. government and agency obligations by major industry or agency classification, please refer to the Fund’s Schedule of Portfolio Investments. |
For the fiscal year ended October 31, 2021, there were no transfers in or out of Level 3.
The accompanying notes are an integral part of these financial statements.
11
|
AMG GW&K Emerging Markets Equity Fund Portfolio Manager’s Comments (unaudited) |
| | | | |
MARKET OVERVIEW Emerging markets (“EM”) advanced during the fiscal year ended October 2021, as global business activity accelerated thanks to effective COVID-19 vaccines, improved virus treatments, and pent-up demand. Commodity prices also rallied on favorable supply and demand dynamics. The MSCI Emerging Markets Index (“MSCI EM Index”) gained 16.96% but trailed developed markets (DM) considerably, as the MSCI World Index advanced 40.4%. That represents the second worst one-year underperformance of EM versus DM since 1999, eclipsed only by the “taper tantrum” period of late 2013. The performance gap appears to reflect EM’s incomplete and uneven recovery from the pandemic along with tighter financial conditions in EM. There was a notable change in regional leadership this year, as commodity-rich countries finished in the lead and an otherwise resilient Asia fell victim to disappointing returns from index heavyweight China. What seemed like a ceaseless flow of worrying news from the country—Beijing’s far-reaching regulatory offensive, the demise of heavily indebted real estate developer China Evergrande, and surprising power shortages—saw the MSCI China Index fall (9.2)%. South Korea and Taiwan delivered a second consecutive year of strong performance due to ongoing demand for semiconductors, and India quickly recovered from a dire outbreak of the Delta variant to end the year as the top Asian market. The EMEA region’s oil producing countries—Russia and the Gulf Corporation Council markets—were standout performers as Brent crude oil soared past $80/bbl. Eastern Europe rallied on unexpectedly good earnings across the continent. Higher commodity prices also drove gains in Latin America, though Brazil struggled later in the period as inflation took hold amid aggressive fiscal spending. Energy and materials outperformed substantially as commodity prices rallied, financials gained on a more favorable margin outlook in several markets, and record earnings in the semiconductor industry supported information technology. China-specific factors triggered negative returns in the consumer discretionary, communication services, and real estate sectors. | | FUND REVIEW For the fiscal year ending October 31, 2021, AMG GW&K Emerging Markets Equity Fund (the “Fund”) Class Z shares returned 10.15%, underperforming the 16.96% return for the MSCI EM Index. Sector exposure was a key factor in the performance shortfall, as investors shifted from structural growth companies in consumer-related industries to value cyclicals like mining and energy producers, where the Fund is typically underweight. Pressure on the Fund’s positions in China, where regulatory changes engulfed a number of industries, also detracted from relative performance. Proposed changes to casino licensing conditions caused a sharp fall in Macau-based Sands China Ltd., and Tencent Holdings Ltd., Tencent Music Entertainment Group, and Kuaishou Technology Class B also declined on uncertainty surrounding expected regulatory changes governing video gaming and social media content. Sands China and Kuaishou Technology were sold during the period. Similar concerns and signs of decelerating consumption weighed on Alibaba Group Holdings Ltd. Aside from the situation in China, several holdings performed quite well during the period. Russian gas producer Novatek PJSC gained on record prices for natural gas in Europe and Asia. Sberbank of Russia PJSC, the country’s largest financial services company, reported better-than-expected earnings and increased its profit target for 2021. Taiwan Semiconductor Manufacturing Co., LTD. reported consistently strong earnings throughout the past year due to robust worldwide demand for semiconductors. Samsung Electronics Co., Ltd. also advanced on record sales in its semiconductor division. Financials, led by Sberbank of Russia and India’s HDFC Bank, Ltd. and Housing Development Finance Corp. Ltd., was the Fund’s top performing sector. OUTLOOK AND PORTFOLIO POSITIONING EM equity performance stands in stark contrast to DM over the past 12 months. The uneven post-pandemic economic recovery across countries, | | earlier tightening of monetary policy in several markets, and China-specific factors have all contributed to this divergence in returns. As a result, EM are trading at a 33% discount to DM based on forward PE multiples. Undoubtedly, earnings growth will be the most important driver of future performance, but the ever-widening discount, particularly relative to the U.S. market, should provide a measure of downside support. Over the next three years, bottom-up analysts project EM earnings compounding at about 9% annually compared to 10% for DM earnings. The relatively modest advantage for DM earnings appears to reflect EM’s incomplete recoveries from the pandemic. The notable valuation discount suggests to us that any positive surprises for EM, like monetary and fiscal policy stimulus from China or an easing of its regulatory environment, could easily provide fuel for EM equities to substantially recover lost ground from DM equities over the year ahead. With respect to the Fund’s structure, trading and market activity during the fiscal year resulted in increased exposures to the financials, consumer discretionary, and energy sectors while our weights in industrials, consumer staples, and communication services decreased. At the close of the period, the Fund had overweight positions in the consumer discretionary, information technology, financials, consumer staples, and communication services sectors and underweight positions in the materials, energy, real estate, industrials, utilities, and health care sectors relative to the benchmark. Geographically, the portfolio finished the fiscal year with 76% in Asia, 12% in the EMEA region, and 12% in Latin America. The views expressed represent the opinions of GW&K Investment Management, LLC as of October 31, 2021, and are not intended as a forecast or guarantee of future results, and are subject to change without notice. |
12
|
AMG GW&K Emerging Markets Equity Fund Portfolio Manager’s Comments (continued) |
CUMULATIVE TOTAL RETURN PERFORMANCE
AMG GW&K Emerging Markets Equity Fund’s cumulative total return is based on the daily change in net asset value (NAV), and assumes that all dividends and distributions were reinvested. This graph compares a hypothetical $10,000 investment made in the AMG GW&K Emerging Markets Equity Fund’s Class Z shares on October 31, 2011, to a $10,000 investment made in the MSCI Emerging Markets Index for the same time period. The graph and table do not reflect the deduction of taxes that a shareholder would pay on a Fund distribution or redemption of shares. The listed returns for the Fund are net of expenses and the returns for the index exclude expenses. Total returns would have been lower had certain expenses not been reduced.
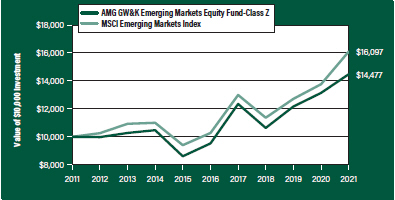
The table below shows the average annual total returns for the AMG GW&K Emerging Markets Equity Fund and the MSCI Emerging Markets Index for the same time periods ended October 31, 2021.
| | | | | | | | | | | | | | | | | | | | |
| Average Annual Total Returns1 | | One
Year | | | Five
Years | | | Ten
Years | | | Since
Inception | | | Inception
Date | |
| | |
AMG GW&K Emerging Markets Equity Fund2, 3, 4, 5, 6, 7, 8, 9, 10, 11, 12 | | | | | | | | | |
| | | | | |
Class N | | | 9.85% | | | | 8.29% | | | | – | | | | 2.58% | | | | 03/01/12 | |
| | | | | |
Class I | | | 10.13% | | | | 8.63% | | | | 3.67% | | | | 2.00% | | | | 03/01/11 | |
| | | | | |
Class Z | | | 10.15% | | | | 8.72% | | | | 3.77% | | | | 2.10% | | | | 03/01/11 | |
| | | | | |
MSCI Emerging Markets Index13 | | | 16.96% | | | | 9.39% | | | | 4.88% | | | | 3.69% | | | | 03/01/11† | |
The performance data shown represents past performance. Past performance is not a guarantee of future results. Current performance may be lower or higher than the performance data quoted. The investment return and principal value of an investment will fluctuate so that an investor’s shares, when redeemed, may be worth more or less than their original cost.
Investors should carefully consider the Fund’s investment objectives, risks, charges and expenses before investing. For performance information through the most recent month end, current net asset values per share for the Fund and other information, please call 800.548.4539 or visit our website at amgfunds.com for a free prospectus. Read it carefully before investing or sending money.
Distributed by AMG Distributors, Inc., member FINRA/SIPC.
| † | Date reflects inception date of the Fund, not the index. |
| 1 | Total return equals income yield plus share price change and assumes reinvestment of all dividends and capital gain distributions. Returns are net of fees and may reflect offsets of Fund expenses as described in the prospectus. No adjustment has been made for taxes payable by shareholders on their reinvested dividends and |
|
capital gain distributions. Returns for periods greater than one year are annualized. The listed returns on the Fund are net of expenses and based on the published NAV as of October 31, 2021. All returns are in U.S. dollars ($). |
|
2 From time to time, the Fund’s advisor has waived its fees and/or absorbed Fund expenses, which has resulted in higher returns. |
|
3 The Fund is subject to currency risk resulting from fluctuations in exchange rates that may affect the total loss or gain on a non-U.S. Dollar investment when converted back to U.S. Dollars. |
|
4 Market prices of investments held by the Fund may fall rapidly or unpredictably due to a variety of economic or political factors, market conditions, disasters or public health issues, or in response to events that affect particular industries or companies. |
|
5 The Fund may invest in derivatives such as options and futures; the complexity and rapidly changing structure of derivatives markets may increase the possibility of market losses. |
|
6 The Fund is subject to the risks associated with investments in emerging markets, such as erratic earnings patterns, economic and political instability, changing exchange controls, limitations on repatriation of foreign capital and changes in local governmental attitudes toward private investment, possibly leading to nationalization or confiscation of investor assets. |
|
7 The Fund invests in growth stocks, which may be more sensitive to market movements because their prices tend to reflect future investor expectations rather than just current profits. Growth stocks may underperform value stocks during given periods. |
|
8 Investments in international securities are subject to certain risks of overseas investing including currency fluctuations and changes in political and economic conditions, which could result in significant market fluctuations. These risks are magnified in emerging markets. |
|
9 Investing in initial public offerings (IPOs) is risky and the prices of stocks purchased in IPOs tend to fluctuate more widely than stocks of companies that have been publicly traded for a longer period of time. Stocks purchased in IPOs generally do not have a trading history, and information about the companies may be available for very limited periods. |
|
10 The Fund is subject to risks associated with investments in mid-capitalization companies such as greater price volatility, lower trading volume, and less liquidity than the stocks of larger, more established companies. |
|
11 Companies that are in similar industry sectors may be similarly affected by particular economic or |
|
|
13
|
AMG GW&K Emerging Markets Equity Fund Portfolio Manager’s Comments (continued) |
| | | | | | | | |
market events; to the extent the Fund has substantial holdings within a particular sector, the risks associated with that sector increase. 12 The Fund is subject to risks associated with investments in small-capitalization companies, such as erratic earnings patterns, competitive conditions, limited earnings history and a reliance on one or a limited number of products. | | | | 13 The MSCI Emerging Markets Index is a free float-adjusted market capitalization index that is designed to measure equity market performance of emerging markets. Please go to msci.com for most current list of countries represented by the index. Unlike the Fund, the MSCI Emerging Markets Index is unmanaged, is not available for investment and does not incur expenses. | | | | All MSCI data is provided “as is.” The products described herein are not sponsored or endorsed and have not been reviewed or passed on by MSCI. In no event shall MSCI, its affiliates or any MSCI data provider have any liability of any kind in connection with the MSCI data or the products described herein. Copying or redistributing the MSCI data is strictly prohibited. Not FDIC insured, nor bank guaranteed. May lose value. |
14
|
AMG GW&K Emerging Markets Equity Fund Fund Snapshots (unaudited) October 31, 2021 |
PORTFOLIO BREAKDOWN
| | |
Sector | | %of
Net Assets |
| | |
Financials | | 25.6 |
| | |
Information Technology | | 22.8 |
| | |
Consumer Discretionary | | 20.8 |
| | |
Communication Services | | 9.1 |
| | |
Consumer Staples | | 7.7 |
| | |
Energy | | 4.5 |
| | |
Health Care | | 3.2 |
| | |
Industrials | | 1.3 |
| | |
Real Estate | | 0.7 |
| | |
Short-Term Investments | | 3.4 |
| | |
Other Assets Less Liabilities | | 0.9 |
| | | | |
TOP TEN HOLDINGS | | | | |
| Security Name | | %of
Net Assets | |
| | |
Taiwan Semiconductor Manufacturing Co., Ltd. (Taiwan) | | | 8.2 | |
| | |
Samsung Electronics Co., Ltd. (South Korea) | | | 4.5 | |
| | |
Alibaba Group Holding, Ltd., Sponsored ADR (China) | | | 4.0 | |
| | |
Sberbank of Russia PJSC, Sponsored ADR (Russia) | | | 3.7 | |
| | |
Housing Development Finance Corp., Ltd. (India) | | | 3.5 | |
| | |
HDFC Bank, Ltd. (India) | | | 3.5 | |
| | |
Baidu, Inc., Sponsored ADR (China) | | | 3.0 | |
| | |
China International Capital Corp., Ltd., Class H (China) | | | 2.9 | |
| | |
Tencent Holdings, Ltd. (China) | | | 2.8 | |
| | |
Reliance Industries, Ltd. (India) | | | 2.5 | |
| | | | | |
| | |
Top Ten as a Group | | | 38.6 | |
| | | | | |
| | | | | |
Because a fund’s strategy may result in multiple investments in particular sectors of the economy, its performance may depend on the performance of those sectors and may fluctuate more widely than investments diversified across more sectors. For additional information on these and other risk considerations, please see the Fund’s prospectus.
Any sectors, industries, or securities discussed should not be perceived as investment recommendations. Mention of a specific security should not be considered a recommendation to buy or solicitation to sell that security. Specific securities mentioned in this report may have been sold from the Fund’s portfolio of investments by the time you receive this report.
15
|
AMG GW&K Emerging Markets Equity Fund Schedule of Portfolio Investments October 31, 2021 |
| | | | | | | | |
| | | Shares | | | Value | |
| | |
Common Stocks - 95.7% | | | | | | | | |
| | |
Communication Services - 9.1% | | | | | | | | |
| | |
Baidu, Inc., Sponsored ADR (China)* | | | 10,777 | | | | $1,748,461 | |
| | |
MultiChoice Group (South Africa) | | | 70,458 | | | | 560,297 | |
| | |
NetEase, Inc., ADR (China) | | | 5,965 | | | | 582,124 | |
| | |
Tencent Holdings, Ltd. (China) | | | 26,906 | | | | 1,636,686 | |
| | |
Tencent Music Entertainment Group, ADR (China)* | | | 104,272 | | | | 819,578 | |
| | |
Total Communication Services | | | | | | | 5,347,146 | |
| | |
Consumer Discretionary - 20.8% | | | | | | | | |
| | |
Alibaba Group Holding, Ltd., Sponsored ADR (China)* | | | 14,291 | | | | 2,357,158 | |
| | |
Feng TAY Enterprise Co., Ltd. (Taiwan) | | | 87,355 | | | | 679,716 | |
| | |
Galaxy Entertainment Group, Ltd. (Hong Kong)* | | | 148,000 | | | | 796,348 | |
| | |
Huazhu Group, Ltd., ADR (China)* | | | 12,200 | | | | 565,592 | |
| | |
JD Health International, Inc. (China)*,1,2 | | | 14,800 | | | | 129,921 | |
| | |
JD.com, Inc., ADR (China)* | | | 6,450 | | | | 504,906 | |
| | |
MakeMyTrip, Ltd. (India)* | | | 27,648 | | | | 875,612 | |
| | |
Midea Group Co., Ltd., Class A (China) | | | 75,485 | | | | 809,698 | |
| | |
Naspers, Ltd., N Shares (South Africa) | | | 6,799 | | | | 1,151,436 | |
| | |
Ozon Holdings PLC, ADR (Russia)* | | | 10,089 | | | | 454,005 | |
| | |
Pepco Group, N.V. (United Kingdom)*,1 | | | 3,830 | | | | 45,311 | |
| | |
Prosus, N.V. (Netherlands)2 | | | 12,612 | | | | 1,110,903 | |
| | |
Shenzhou International Group Holdings, Ltd. (China) | | | 10,660 | | | | 229,661 | |
| | |
Trip.com Group, Ltd., ADR (China)* | | | 37,077 | | | | 1,058,919 | |
| | |
Yum China Holdings, Inc. (China) | | | 24,617 | | | | 1,405,138 | |
| | |
Total Consumer Discretionary | | | | | | | 12,174,324 | |
| | |
Consumer Staples - 7.7% | | | | | | | | |
| | |
Angel Yeast Co., Ltd., Class A (China) | | | 34,000 | | | | 295,697 | |
| | |
Bid Corp., Ltd. (South Africa) | | | 46,393 | | | | 995,711 | |
| | |
CP All PCL (Thailand) | | | 156,468 | | | | 302,305 | |
| | |
Dino Polska, S.A. (Poland)*,1 | | | 3,851 | | | | 344,014 | |
| | |
Fomento Economico Mexicano, S.A.B de CV (Mexico) | | | 52,196 | | | | 429,905 | |
| | |
LG Household & Health Care, Ltd. (South Korea) | | | 212 | | | | 212,188 | |
| | |
Orion Corp. (South Korea) | | | 5,685 | | | | 574,946 | |
| | |
Vietnam Dairy Products JSC (Vietnam) | | | 44,800 | | | | 178,597 | |
| | |
Wal-Mart de Mexico, S.A.B. de CV (Mexico) | | | 340,138 | | | | 1,185,064 | |
| | |
Total Consumer Staples | | | | | | | 4,518,427 | |
| | |
Energy - 4.5% | | | | | | | | |
| | |
Novatek PJSC, Sponsored GDR (Russia) | | | 4,641 | | | | 1,178,210 | |
| | |
Reliance Industries, Ltd. (India) | | | 42,488 | | | | 1,441,838 | |
| | |
Total Energy | | | | | | | 2,620,048 | |
| | | | | | | | |
| | | Shares | | | Value | |
Financials - 25.6% | | | | | | | | |
| | |
AIA Group, Ltd. (Hong Kong) | | | 82,968 | | | | $929,823 | |
| | |
B3, S.A. - Brasil Bolsa Balcao (Brazil) | | | 175,900 | | | | 372,133 | |
| | |
Banco Bradesco, S.A., ADR (Brazil) | | | 236,385 | | | | 827,348 | |
| | |
Bank Mandiri Persero Tbk PT (Indonesia) | | | 1,297,416 | | | | 655,938 | |
| | |
Bank Rakyat Indonesia Persero Tbk PT (Indonesia) | | | 2,413,636 | | | | 724,535 | |
| | |
BDO Unibank, Inc. (Philippines) | | | 314,090 | | | | 773,041 | |
| | |
China International Capital Corp., Ltd., Class H (China)1 | | | 697,200 | | | | 1,726,106 | |
| | |
China Merchants Bank Co., Ltd., Class H (China) | | | 44,000 | | | | 368,726 | |
| | |
Grupo Financiero Banorte, S.A.B de CV, Class O (Mexico) | | | 157,742 | | | | 997,112 | |
| | |
HDFC Bank, Ltd. (India) | | | 97,940 | | | | 2,074,746 | |
| | |
Housing Development Finance Corp., Ltd. (India) | | | 54,569 | | | | 2,080,535 | |
| | |
Itau Unibanco Holding, S.A., Sponsored ADR (Brazil) | | | 57,600 | | | | 234,432 | |
| | |
OTP Bank Plc (Hungary)* | | | 16,673 | | | | 1,001,838 | |
| | |
Sberbank of Russia PJSC, Sponsored ADR (Russia) | | | 108,485 | | | | 2,175,670 | |
| | |
XP, Inc., Class A (Brazil)* | | | 2,614 | | | | 85,765 | |
| | |
Total Financials | | | | | | | 15,027,748 | |
| | |
Health Care - 3.2% | | | | | | | | |
| | |
China Resources Sanjiu Medical & | | | | | | | | |
| | |
Pharmaceutical Co., Ltd., Class A (China) | | | 167,700 | | | | 632,226 | |
| | |
Fleury, S.A. (Brazil) | | | 136,422 | | | | 453,467 | |
| | |
Jinxin Fertility Group, Ltd. (China)*,1 | | | 100,000 | | | | 141,043 | |
| | |
Lepu Medical Technology Beijing Co., Ltd., Class A (China) | | | 53,500 | | | | 178,156 | |
| | |
Odontoprev, S.A. (Brazil) | | | 199,311 | | | | 470,396 | |
| | |
Total Health Care | | | | | | | 1,875,288 | |
| | |
Industrials - 1.3% | | | | | | | | |
| | |
Grupo Aeroportuario del Pacifico, S.A.B de CV, Class B (Mexico)2 | | | 59,655 | | | | 753,366 | |
| |
Information Technology - 22.8% | | | | | |
| | |
Advantech Co., Ltd. (Taiwan) | | | 24,727 | | | | 323,380 | |
| | |
Beijing Kingsoft Office Software, Inc., Class A (China) | | | 18,800 | | | | 870,927 | |
| | |
Delta Electronics, Inc. (Taiwan) | | | 62,100 | | | | 548,180 | |
| | |
GDS Holdings, Ltd., ADR (China)* | | | 3,450 | | | | 204,930 | |
| | |
Infosys, Ltd., Sponsored ADR (India) | | | 27,276 | | | | 607,709 | |
| | |
MediaTek, Inc. (Taiwan) | | | 39,000 | | | | 1,283,595 | |
| | |
Pagseguro Digital, Ltd., Class A (Brazil)*,2 | | | 9,488 | | | | 343,466 | |
| | |
Samsung Electronics Co., Ltd. (South Korea) | | | 43,767 | | | | 2,620,467 | |
| | |
SK Hynix, Inc. (South Korea) | | | 13,184 | | | | 1,162,178 | |
The accompanying notes are an integral part of these financial statements.
16
|
AMG GW&K Emerging Markets Equity Fund Schedule of Portfolio Investments (continued) |
| | | | | | | | |
| | |
| | | Shares | | | Value | |
| |
Information Technology - 22.8% (continued) | | | | | |
| | |
Sunny Optical Technology Group Co., Ltd. (China)2 | | | 8,576 | | | �� | $230,124 | |
| | |
Taiwan Semiconductor Manufacturing Co., Ltd. (Taiwan) | | | 226,632 | | | | 4,809,201 | |
| | |
Tata Consultancy Services, Ltd. (India) | | | 8,460 | | | | 384,545 | |
| | |
Total Information Technology | | | | | | | 13,388,702 | |
| | |
Real Estate - 0.7% | | | | | | | | |
| | |
Greentown Service Group Co., Ltd. (China) | | | 376,023 | | | | 372,235 | |
| | |
Total Common Stocks | | | | | | | | |
(Cost $43,493,634) | | | | | | | 56,077,284 | |
| | |
| | | Principal
Amount | | | | |
| | |
Short-Term Investments - 3.4% | | | | | | | | |
| |
Joint Repurchase Agreements - 3.4%3 | | | | | |
| | |
Bank of America Securities, Inc., dated 10/29/21, due 11/01/21, 0.050% total to be received $1,000,004 (collateralized by various U.S. Government Agency Obligations, 1.500% - 5.000%, 09/01/28 - 01/01/59, totaling $1,020,000) | | $ | 1,000,000 | | | | 1,000,000 | |
| * | Non-income producing security. |
| 1 | Security exempt from registration under Rule 144A of the Securities Act of 1933. This security may be resold in transactions exempt from registration, normally to qualified institutional buyers. At October 31, 2021, the value of these securities amounted to $2,386,395 or 4.1% of net assets. |
| 2 | Some of these securities, amounting to $2,242,295 or 3.8% of net assets, were out on loan to various borrowers and are collateralized by cash and various U.S. Treasury Obligations. See Note 4 of Notes to Financial Statements. |
| | | | | | | | |
| | | Principal
Amount | | | Value | |
| | |
HSBC Securities USA, Inc., dated 10/29/21, due 11/01/21, 0.050% total to be received $15,149 (collateralized by various U.S. Treasuries, 0.000% - 5.500%, 11/30/22 - 05/15/48, totaling $15,452) | | | $15,149 | | | | $15,149 | |
| | |
RBC Dominion Securities, Inc., dated 10/29/21, due 11/01/21, 0.050% total to be received $1,000,004 (collateralized by various U.S. Government Agency Obligations and U.S. Treasuries, 0.000% - 6.000%, 11/01/21 - 07/20/51, totaling $1,020,000) | | | 1,000,000 | | | | 1,000,000 | |
| |
Total Short-Term Investments | | | | | |
(Cost $2,015,149) | | | | | | | 2,015,149 | |
| | |
Total Investments - 99.1% | | | | | | | | |
(Cost $45,508,783) | | | | | | | 58,092,433 | |
| |
Other Assets, less Liabilities - 0.9% | | | | 540,984 | |
| | |
Net Assets - 100.0% | | | | | | $ | 58,633,417 | |
| 3 | Cash collateral received for securities lending activity was invested in these joint repurchase agreements. |
ADR American Depositary Receipt
GDR Global Depositary Receipt
The accompanying notes are an integral part of these financial statements.
17
|
AMG GW&K Emerging Markets Equity Fund Schedule of Portfolio Investments (continued) |
The following table summarizes the inputs used to value the Fund’s investments by the fair value hierarchy levels as of October 31, 2021:
| | | | | | | | | | | | | | | | |
| | | Level 1 | | | Level 21 | | | Level 3 | | | Total | |
| | | | |
Investments in Securities | | | | | | | | | | | | | | | | |
| | | | |
Common Stocks | | | | | | | | | | | | | | | | |
| | | | |
Financials | | $ | 2,516,790 | | | $ | 12,510,958 | | | | – | | | $ | 15,027,748 | |
| | | | |
Information Technology | | | 1,156,105 | | | | 12,232,597 | | | | – | | | | 13,388,702 | |
| | | | |
Consumer Discretionary | | | 7,266,641 | | | | 4,907,683 | | | | – | | | | 12,174,324 | |
| | | | |
Communication Services | | | 3,710,460 | | | | 1,636,686 | | | | – | | | | 5,347,146 | |
| | | | |
Consumer Staples | | | 3,133,291 | | | | 1,385,136 | | | | – | | | | 4,518,427 | |
| | | | |
Energy | | | – | | | | 2,620,048 | | | | – | | | | 2,620,048 | |
| | | | |
Health Care | | | 923,863 | | | | 951,425 | | | | – | | | | 1,875,288 | |
| | | | |
Industrials | | | 753,366 | | | | – | | | | – | | | | 753,366 | |
| | | | |
Real Estate | | | – | | | | 372,235 | | | | – | | | | 372,235 | |
| | | | |
Short-Term Investments | | | | | | | | | | | | | | | | |
| | | | |
Joint Repurchase Agreements | | | – | | | | 2,015,149 | | | | – | | | | 2,015,149 | |
| | | | | | | | | | | | | | | | |
| | | | |
Total Investments in Securities | | $ | 19,460,516 | | | $ | 38,631,917 | | | | – | | | $ | 58,092,433 | |
| | | | | | | | | | | | | | | | |
| 1 | An external pricing service is used to reflect any impact on security value due to market movements between the time the Fund valued such foreign securities and the earlier closing of foreign markets. |
For the fiscal year ended October 31, 2021, there were no transfers in or out of Level 3.
The country allocation in the Schedule of Portfolio Investments at October 31, 2021, was as follows:
| | | | | |
| Country | | % of Long-Term
Investments |
| |
Brazil | | | | 5.0 | |
| |
China | | | | 30.1 | |
| |
Hong Kong | | | | 3.1 | |
| |
Hungary | | | | 1.8 | |
| |
India | | | | 13.3 | |
| |
Indonesia | | | | 2.5 | |
| |
Mexico | | | | 6.0 | |
| |
Netherlands | | | | 2.0 | |
| |
Philippines | | | | 1.4 | |
| |
Poland | | | | 0.6 | |
| | |
| Country | | % of Long-Term
Investments |
| |
Russia | | 6.8 |
| |
South Africa | | 4.8 |
| |
South Korea | | 8.1 |
| |
Taiwan | | 13.6 |
| |
Thailand | | 0.5 |
| |
United Kingdom | | 0.1 |
| |
Vietnam | | 0.3 |
| | |
| |
| | | 100.0 |
| | |
The accompanying notes are an integral part of these financial statements.
18
|
AMG GW&K Emerging Wealth Equity Fund Portfolio Manager’s Comments (unaudited) |
| | | | |
MARKET OVERVIEW Emerging markets (“EM”) advanced during the fiscal year ended October 2021, as global business activity accelerated thanks to effective COVID-19 vaccines, improved virus treatments, and pent-up demand. Commodity prices also rallied on favorable supply and demand dynamics. The MSCI Emerging Markets Index (“MSCI EM Index”) gained 16.96%, but trailed developed markets (“DM)” considerably, as the MSCI World Index advanced 40.4%. That represents the second-worst one-year underperformance of EM versus DM since 1999, eclipsed only by the “taper tantrum” period of late 2013. The performance gap appears to reflect EM’s incomplete and uneven recovery from the pandemic along with tighter financial conditions in EM. There was a notable change in regional leadership this year, as commodity rich countries finished in the lead and an otherwise resilient Asia fell victim to disappointing returns from index heavyweight China. What seemed like a ceaseless flow of worrying news from the country—Beijing’s far-reaching regulatory offensive, the demise of heavily indebted real estate developer China Evergrande, and surprising power shortages—saw the MSCI China Index fall (9.2)%. South Korea and Taiwan delivered a second consecutive year of strong performance due to ongoing demand for semiconductors, and India quickly recovered from a dire outbreak of the Delta variant to end the year as the top Asian market. The EMEA (Europe, the Middle East and Africa) region’s oil producing countries—Russia and the Gulf Corporation Council markets—were standout performers as Brent crude oil soared past $80/bbl. Eastern Europe rallied on unexpectedly good earnings across the continent. Higher commodity prices also drove gains in Latin America, though Brazil struggled later in the period as inflation took hold amid aggressive fiscal spending. Energy and materials outperformed substantially as commodity prices rallied, financials gained on a more favorable margin outlook in several markets, and record earnings in the semiconductor industry supported information technology. China-specific factors triggered negative returns in the consumer discretionary, communication services, and real estate sectors. | | FUND REVIEW For the fiscal year ending October 31, 2021, AMG GW&K Emerging Wealth Equity Fund (the “Fund”) Class N shares returned 0.98%, underperforming the MSCI EM Index, which returned 16.96%. Our strategic focus on the benefits of wealth creation in emerging markets, particularly in China at an average Fund weight of 51%, was the main cause of the performance shortfall. Investors shifted from structural growth companies in consumer-related industries that we believe are compelling long-term investments to value cyclicals like mining and energy producers, where the Fund has no exposure. Pressure on the Fund’s positions in China, where regulatory changes engulfed a number of industries, also detracted from relative performance. Proposed changes to casino licensing conditions caused a sharp fall in Macau-based Sands China Ltd. To promote “common prosperity,” a concept that aims to reduce China’s cost of living and promote larger families, the General office of the Chinese Communist Party (CCP) and the State Council announced new regulations for after-school tutoring that will likely shift the industry to nonprofit status. TAL Education Group and New Oriental Education and Technology fell precipitously with after-school tutoring stocks following the regulatory announcement. Both stocks were sold during the period. Tencent Music Entertainment Group also declined on uncertainty surrounding expected regulatory changes governing video gaming and social media content. A zero tolerance policy toward COVID-19 weighed on certain consumer companies in China, including hot pot restaurant operator Haidilao International Holdings, Ltd. Aside from the situation in China, several holdings performed quite well during the period, particularly in India, a market of strategic importance to the Fund. Jubilant Foodworks, Ltd, which operates Domino’s and Dunkin Donuts outlets, advanced on exceptional performance in delivery, which more than offset the impact of limited in person dining. India’s MakeMyTrip, Ltd. reported a marked improvement in transaction volumes thanks to a nascent recovery in travel across India. HDFC Bank, Ltd issued a favorable outlook for loan growth citing robust economic activity and the bank’s strong capital position. In developed markets, Infineon | | Technologies AG, a global leader in power semiconductors, raised 2021 guidance due to resilient end customer demand. OUTLOOK AND PORTFOLIO POSITIONING EM equity performance stands in stark contrast to DM over the past 12 months. The uneven post-pandemic economic recovery across countries, earlier tightening of monetary policy in several markets, and China-specific factors have all contributed to this divergence in returns. As a result, EM are trading at a 33% discount to DM based on forward PE multiples. Undoubtedly, earnings growth will be the most important driver of future performance, but the ever-widening discount, particularly relative to the U.S. market, should provide a measure of downside support. Over the next three years, bottom-up analysts project EM earnings compounding at about 9% annually compared to 10% for DM earnings. The relatively modest advantage for DM earnings appears to reflect EM’s incomplete recoveries from the pandemic. The notable valuation discount suggests to us that any positive surprises for EM, like monetary and fiscal policy stimulus from China or an easing of its regulatory environment, could easily provide fuel for EM equities to substantially recover lost ground from DM equities over the year ahead. With respect to the Fund’s structure, trading and market activity during the fiscal year resulted in increased exposure to communication services and information technology, while health care declined marginally. At the close of the period, the Fund had overweight positions in the consumer discretionary, health care, and financials sectors and underweight positions in the information technology, communication services, materials, energy, and industrials sectors relative to the benchmark. Geographically, the Fund finished the fiscal year with exposures of 79% in EM Asia, 19% in DM, 1% in EM Latin America and 1% in EM EMEA. The views expressed represent the opinions of GW&K Investment Management, LLC as of October 31, 2021, and are not intended as a forecast or guarantee of future results, and are subject to change without notice. |
19
|
AMG GW&K Emerging Wealth Equity Fund Portfolio Manager’s Comments (continued) |
CUMULATIVE TOTAL RETURN PERFORMANCE
AMG GW&K Emerging Wealth Equity Fund’s cumulative total return is based on the daily change in net asset value (NAV), and assumes that all dividends and distributions were reinvested. This graph compares a hypothetical $10,000 investment made in the AMG GW&K Emerging Wealth Equity Fund’s Class N shares on March 19, 2015 (inception date), to a $10,000 investment made in the MSCI Emerging Markets Index for the same time period. The graph and table do not reflect the deduction of taxes that a shareholder would pay on a Fund distribution or redemption of shares. The listed returns for the Fund are net of expenses and the returns for the index exclude expenses. Total returns would have been lower had certain expenses not been reduced.
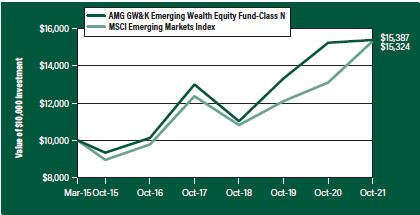
The table below shows the average annual total returns for the AMG GW&K Emerging Wealth Equity Fund and the MSCI Emerging Markets Index for the same time periods ended October 31, 2021.
| | | | | | | | | | | | | | | | |
| Average Annual Total Returns1 | | One
Year | | | Five
Years | | | Since
Inception | | | Inception
Date | |
|
AMG GW&K Emerging Wealth Equity Fund2, 3, 4, 5, 6, 7, 8, 9 | |
| | | | |
Class N | | | 0.98 | % | | | 8.72 | % | | | 6.73 | % | | | 03/19/15 | |
| | | | |
Class I | | | 1.27 | % | | | 9.03 | % | | | 7.01 | % | | | 03/19/15 | |
| | | | |
Class Z | | | 1.37 | % | | | 9.14 | % | | | 7.11 | % | | | 03/19/15 | |
| | | | |
MSCI Emerging Markets Index10 | | | 16.96 | % | | | 9.39 | % | | | 6.66 | % | | | 03/19/15 | † |
The performance data shown represents past performance. Past performance is not a guarantee of future results. Current performance may be lower or higher than the performance data quoted. The investment return and principal value of an investment will fluctuate so that an investor’s shares, when redeemed, may be worth more or less than their original cost.
Investors should carefully consider the Fund’s investment objectives, risks, charges and expenses before investing. For performance information through the most recent month end, current net asset values per share for the Fund and other information, please call 800.548.4539 or visit our website at amgfunds.com for a free prospectus. Read it carefully before investing or sending money.
Distributed by AMG Distributors, Inc., member FINRA/SIPC.
| † | Date reflects inception date of the Fund, not the index. |
| 1 | Total return equals income yield plus share price change and assumes reinvestment of all dividends and capital gain distributions. Returns are net of fees and may reflect offsets of Fund expenses as described in the prospectus. No adjustment has been made for taxes payable by shareholders on their reinvested dividends and |
|
capital gain distributions. Returns for periods greater than one year are annualized. The listed returns on the Fund are net of expenses and based on the published NAV as of October 31, 2021. All returns are in U.S. dollars ($). |
| |
2 Investments in international securities are subject to certain risks of overseas investing including currency fluctuations and changes in political and economic conditions, which could result in significant market fluctuations. These risks are magnified in emerging markets. |
| |
3 The Fund is subject to the risks associated with investments in emerging markets, such as erratic earnings patterns, economic and political instability, changing exchange controls, limitations on repatriation of foreign capital and changes in local governmental attitudes toward private investment, possibly leading to nationalization or confiscation of investor assets. |
| |
4 The Fund is subject to currency risk resulting from fluctuations in exchange rates that may affect the total loss or gain on a non-U.S. Dollar investment when converted back to U.S. Dollars. |
| |
5 The Fund may invest in derivatives such as options and futures; the complexity and rapidly changing structure of derivatives markets may increase the possibility of market losses. |
| |
6 The Fund is subject to risks associated with investments in mid-capitalization companies such as greater price volatility, lower trading volume, and less liquidity than the stocks of larger, more established companies. |
| |
7 The Fund is subject to risks associated with investments in small-capitalization companies, such as erratic earnings patterns, competitive conditions, limited earnings history and a reliance on one or a limited number of products. |
| |
8 Market prices of investments held by the Fund may fall rapidly or unpredictably due to a variety of economic or political factors, market conditions, disasters or public health issues, or in response to events that affect particular industries or companies. |
| |
9 Companies that are in similar industry sectors may be similarly affected by particular economic or market events; to the extent the Fund has substantial holdings within a particular sector, the risks associated with that sector increase. |
| |
10 The MSCI Emerging Markets Index is a free float-adjusted market capitalization index that is designed to measure equity market performance of emerging markets. Please go to msci.com for most current list of countries represented by the index. Unlike the Fund, the MSCI Emerging Markets Index is unmanaged, is not available for investment and does not incur expenses. |
| |
| |
20
|
AMG GW&K Emerging Wealth Equity Fund Portfolio Manager’s Comments (continued) |
| | | | | | | | |
| All MSCI data is provided “as is.” The products described herein are not sponsored or endorsed and have not been reviewed or passed on by MSCI. In no event shall MSCI, its affiliates or any MSCI data | | | | provider have any liability of any kind in connection with the MSCI data or the products described herein. Copying or redistributing the MSCI data is strictly prohibited. | | | | Not FIDC insured, not bank guaranteed. May lose value. |
21
|
AMG GW&K Emerging Wealth Equity Fund Fund Snapshots (unaudited) October 31, 2021 |
PORTFOLIO BREAKDOWN
| | |
| Sector | | %of
Net Assets |
| | |
Consumer Discretionary | | 37.8 |
| | |
Financials | | 20.1 |
| | |
Communication Services | | 13.2 |
| | |
Information Technology | | 13.1 |
| | |
Health Care | | 7.3 |
| | |
Consumer Staples | | 5.4 |
| | |
Materials | | 1.8 |
| | |
Short-Term Investments | | 0.2 |
| | |
Other Assets Less Liabilities | | 1.1 |
TOP TEN HOLDINGS
| | |
| Security Name | | %of Net Assets |
| | |
Tencent Holdings, Ltd. (China) | | 5.2 |
| | |
Infineon Technologies AG (Germany) | | 5.0 |
| | |
Alibaba Group Holding, Ltd., Sponsored ADR (China) | | 4.9 |
| | |
Trip.com Group, Ltd., ADR (China) | | 4.9 |
| | |
QUALCOMM, Inc. | | 4.6 |
| | |
HDFC Bank, Ltd., ADR (India) | | 4.5 |
| | |
Yum China Holdings, Inc. (China) | | 4.4 |
| | |
Kotak Mahindra (India) | | 4.2 |
| | |
Galaxy Entertainment Group, Ltd. (Hong Kong) | | 3.9 |
| | |
Baidu, Inc., Sponsored ADR (China) | | 3.6 |
| | | |
| | |
Top Ten as a Group | | 45.2 |
| | |
Because a fund’s strategy may result in multiple investments in particular sectors of the economy, its performance may depend on the performance of those sectors and may fluctuate more widely than investments diversified across more sectors. For additional information on these and other risk considerations, please see the Fund’s prospectus.
Any sectors, industries, or securities discussed should not be perceived as investment recommendations. Mention of a specific security should not be considered a recommendation to buy or solicitation to sell that security. Specific securities mentioned in this report may have been sold from the Fund’s portfolio of investments by the time you receive this report.
22
|
AMG GW&K Emerging Wealth Equity Fund Schedule of Portfolio Investments October 31, 2021 |
| | | | | | | | |
| | | Shares | | | Value | |
| | |
Common Stocks - 98.7% | | | | | | | | |
| | |
Communication Services - 13.2% | | | | | | | | |
| | |
Baidu, Inc., Sponsored ADR (China)* | | | 50,450 | | | | $8,185,008 | |
| | |
Kingsoft Corp., Ltd. (China) | | | 790,600 | | | | 3,373,526 | |
| | |
Kuaishou Technology (China)*,1 | | | 47,275 | | | | 618,424 | |
| | |
Tencent Holdings, Ltd. (China) | | | 192,240 | | | | 11,693,919 | |
| | |
Tencent Music Entertainment Group, ADR (China)* | | | 601,659 | | | | 4,729,040 | |
| | |
The Walt Disney Co. (United States)* | | | 7,068 | | | | 1,194,987 | |
| | |
Total Communication Services | | | | | | | 29,794,904 | |
| | |
Consumer Discretionary - 37.8% | | | | | | | | |
| | |
Alibaba Group Holding, Ltd., Sponsored ADR (China)* | | | 67,331 | | | | 11,105,575 | |
| | |
Eicher Motors, Ltd. (India) | | | 111,580 | | | | 3,713,804 | |
| | |
Galaxy Entertainment Group, Ltd. (Hong Kong)* | | | 1,650,000 | | | | 8,878,198 | |
| | |
Haidilao International Holding, Ltd. (China)1,2 | | | 925,000 | | | | 2,579,205 | |
| | |
Hermes International (France) | | | 2,044 | | | | 3,245,699 | |
| | |
Huazhu Group, Ltd., ADR (China)* | | | 153,359 | | | | 7,109,723 | |
| | |
JD Health International, Inc. (China)*,1 | | | 249,700 | | | | 2,191,979 | |
| | |
Jubilant Foodworks, Ltd. (India) | | | 55,388 | | | | 2,737,487 | |
| | |
LVMH Moet Hennessy Louis Vuitton SE (France) | | | 3,492 | | | | 2,738,153 | |
| | |
MakeMyTrip, Ltd. (India)* | | | 204,548 | | | | 6,478,035 | |
| | |
Meituan, Class B (China)*,1 | | | 65,700 | | | | 2,235,682 | |
| | |
Moncler SpA (Italy) | | | 36,733 | | | | 2,643,468 | |
| | |
NIKE, Inc., Class B (United States) | | | 10,889 | | | | 1,821,621 | |
| | |
Ozon Holdings PLC, ADR (Russia)* | | | 32,620 | | | | 1,467,900 | |
| | |
Pinduoduo, Inc., ADR (China)* | | | 12,100 | | | | 1,075,932 | |
| | |
Starbucks Corp. (United States) | | | 6,951 | | | | 737,293 | |
| | |
Titan Co., Ltd. (India) | | | 110,830 | | | | 3,536,291 | |
| | |
Trip.com Group, Ltd., ADR (China)* | | | 386,442 | | | | 11,036,783 | |
| | |
Yum China Holdings, Inc. (China) | | | 173,238 | | | | 9,888,425 | |
| | |
Total Consumer Discretionary | | | | | | | 85,221,253 | |
| | |
Consumer Staples - 5.4% | | | | | | | | |
| | |
The Estee Lauder Cos., Inc., Class A (United States) | | | 6,060 | | | | 1,965,440 | |
| | |
Foshan Haitian Flavouring & Food Co., Ltd., Class A (China) | | | 167,782 | | | | 3,072,295 | |
| | |
Wal-Mart de Mexico, S.A.B. de CV (Mexico) | | | 211,520 | | | | 736,950 | |
| | |
Wuliangye Yibin Co., Ltd., Class A (China) | | | 189,303 | | | | 6,396,816 | |
| | |
Total Consumer Staples | | | | | | | 12,171,501 | |
| | |
Financials - 20.1% | | | | | | | | |
| | |
AIA Group, Ltd. (Hong Kong) | | | 678,400 | | | | 7,602,836 | |
| | |
China International Capital Corp., Ltd., Class H (China)1 | | | 3,144,800 | | | | 7,785,799 | |
| | | | | | | | |
| | | Shares | | | Value | |
| | |
East Money Information Co., Ltd., Class A (China) | | | 483,020 | | | | $2,483,936 | |
| | |
Grupo Financiero Banorte, S.A.B de CV, Class O (Mexico) | | | 147,831 | | | | 934,463 | |
| | |
HDFC Bank, Ltd., ADR (India) | | | 142,333 | | | | 10,235,166 | |
| | |
Hong Kong Exchanges & Clearing, Ltd. (Hong Kong) | | | 71,350 | | | | 4,298,248 | |
| | |
Kotak Mahindra (India) | | | 350,886 | | | | 9,544,802 | |
| | |
LIC Housing Finance, Ltd. (India) | | | 472,800 | | | | 2,576,916 | |
| | |
Total Financials | | | | | | | 45,462,166 | |
| | |
Health Care - 7.3% | | | | | | | | |
| | |
China Resources Sanjiu Medical & Pharmaceutical Co., Ltd., Class A (China) | | | 1,748,012 | | | | 6,589,975 | |
| | |
CSPC Pharmaceutical Group, Ltd. (China) | | | 837,600 | | | | 874,036 | |
| | |
Jiangsu Hengrui Medicine Co., Ltd., Class A (China) | | | 189,860 | | | | 1,458,504 | |
| | |
Novo Nordisk A/S, Class B (Denmark) | | | 35,274 | | | | 3,867,967 | |
| | |
Wuxi Biologics Cayman, Inc. (China)*,1 | | | 241,700 | | | | 3,661,022 | |
| | |
Total Health Care | | | | | | | 16,451,504 | |
| | |
Information Technology - 13.1% | | | | | | | | |
| | |
Infineon Technologies AG (Germany) | | | 241,535 | | | | 11,311,412 | |
| | |
KLA Corp. (United States) | | | 3,550 | | | | 1,323,298 | |
| | |
Mastercard, Inc., Class A (United States) | | | 7,260 | | | | 2,435,875 | |
| | |
QUALCOMM, Inc. (United States) | | | 77,474 | | | | 10,307,141 | |
| | |
SK Hynix, Inc. (South Korea) | | | 24,400 | | | | 2,150,876 | |
| | |
Taiwan Semiconductor Manufacturing Co., Ltd. (Taiwan) | | | 57,000 | | | | 1,209,557 | |
| | |
Yeahka, Ltd. (China)* | | | 259,800 | | | | 784,673 | |
| | |
Total Information Technology | | | | | | | 29,522,832 | |
| | |
Materials - 1.8% | | | | | | | | |
| | |
Asian Paints, Ltd. (India) | | | 83,748 | | | | 3,470,796 | |
| | |
Chr Hansen Holding A/S (Denmark)2 | | | 7,948 | | | | 632,381 | |
| | |
Total Materials | | | | | | | 4,103,177 | |
| | |
Total Common Stocks
(Cost $192,579,167) | | | | | | | 222,727,337 | |
| | |
| | | Principal
Amount | | | | |
| | |
Short-Term Investments - 0.2% | | | | | | | | |
| |
Joint Repurchase Agreements - 0.2%3 | | | | | |
| | |
Daiwa Capital Markets America, dated 10/29/21, due 11/01/21, 0.050% total to be received $507,796 (collateralized by various U.S. Government Agency Obligations and U.S. Treasuries, 0.000% - 6.500%, 11/01/21 - 11/01/51, totaling $517,950) | | | $507,794 | | | | 507,794 | |
| | |
Total Short-Term Investments
(Cost $507,794) | | | | | | | 507,794 | |
The accompanying notes are an integral part of these financial statements.
23
|
AMG GW&K Emerging Wealth Equity Fund Schedule of Portfolio Investments (continued) |
| | | | | | | | |
| | | | | | Value | |
| | |
Total Investments - 98.9% | | | | | | | | |
(Cost $193,086,961) | | | | | | | $223,235,131 | |
| |
Other Assets, less Liabilities - 1.1% | | | | 2,474,452 | |
| | |
Net Assets - 100.0% | | | | | | | $225,709,583 | |
| * | Non-income producing security. |
| 1 | Security exempt from registration under Rule 144A of the Securities Act of 1933. This security may be resold in transactions exempt from registration, normally to qualified institutional buyers. At October 31, 2021, the value of these securities amounted to $19,072,111 or 8.4% of net assets. |
| 2 | Some of these securities, amounting to $1,589,618 or 0.7% of net assets, were out on loan to various borrowers and are collateralized by cash and various U.S. Treasury Obligations. See Note 4 of Notes to Financial Statements. |
| 3 | Cash collateral received for securities lending activity was invested in these joint repurchase agreements. |
ADR American Depositary Receipt
The following table summarizes the inputs used to value the Fund’s investments by the fair value hierarchy levels as of October 31, 2021:
| | | | | | | | | | | | | | | | |
| | | Level 1 | | | Level 21 | | | Level 3 | | | Total | |
| | | | |
Investments in Securities | | | | | | | | | | | | | | | | |
| | | | |
Common Stocks | | | | | | | | | | | | | | | | |
| | | | |
Consumer Discretionary | | | $50,721,287 | | | | $34,499,966 | | | | – | | | | $85,221,253 | |
| | | | |
Financials | | | 11,169,629 | | | | 34,292,537 | | | | – | | | | 45,462,166 | |
| | | | |
Communication Services | | | 14,109,035 | | | | 15,685,869 | | | | – | | | | 29,794,904 | |
| | | | |
Information Technology | | | 14,066,314 | | | | 15,456,518 | | | | – | | | | 29,522,832 | |
| | | | |
Health Care | | | – | | | | 16,451,504 | | | | – | | | | 16,451,504 | |
| | | | |
Consumer Staples | | | 2,702,390 | | | | 9,469,111 | | | | – | | | | 12,171,501 | |
| | | | |
Materials | | | 632,381 | | | | 3,470,796 | | | | – | | | | 4,103,177 | |
| | | | |
Short-Term Investments | | | | | | | | | | | | | | | | |
| | | | |
Joint Repurchase Agreements | | | – | | | | 507,794 | | | | – | | | | 507,794 | |
| | | | | | | | | | | | | | | | |
| | | | |
Total Investments in Securities | | | $93,401,036 | | | | $129,834,095 | | | | – | | | | $223,235,131 | |
| | | | | | | | | | | | | | | | |
| 1 | An external pricing service is used to reflect any impact on security value due to market movements between the time the Fund valued such foreign securities and the earlier closing of foreign markets. |
For the fiscal year ended October 31, 2021, there were no transfers in or out of Level 3.
The country allocation in the Schedule of Portfolio Investments at October 31, 2021, was as follows:
| | | | | |
| Country | | % of Long-Term
Investments |
| |
China | | | | 48.9 | |
| |
Denmark | | | | 2.0 | |
| |
France | | | | 2.7 | |
| |
Germany | | | | 5.1 | |
| |
Hong Kong | | | | 9.3 | |
| |
India | | | | 19.0 | |
| |
Italy | | | | 1.2 | |
| | |
| Country | | % of Long-Term
Investments |
| |
Mexico | | 0.7 |
| |
Russia | | 0.7 |
| |
South Korea | | 1.0 |
| |
Taiwan | | 0.5 |
| |
United States | | 8.9 |
| | |
| |
| | 100.0 |
| | |
The accompanying notes are an integral part of these financial statements.
24
|
AMG GW&K Small/Mid Cap Growth Fund Portfolio Manager’s Comments (unaudited) |
| | | | |
AMG GW&K Small/Mid Cap Growth Fund (the “Fund”) Class N shares outperformed its benchmark for the 12 months ended October 31, 2021, returning 46.66% vs. the Russell 2500® Growth Index return of 37.12%. The Fund’s prior benchmark, the Russell 2000® Growth Index, returned 38.45% over the same period. Effective March 19, 2021, the subadviser of Fund changed from LMCG Investments, LLC to GW&K Investment Management, LLC (“GW&K”). Also effective March 19, 2021, the Fund changed its name to AMG GW&K Small Cap Fund II and changed its principal investment strategies and principal risks. Furthermore, effective May 21, 2021, the Fund changed its name to AMG GW&K Small/Mid Cap Growth Fund and made changes to its principal investment strategies. U.S. equity markets enjoyed outsized gains over the trailing year as the economy recovered from the COVID pandemic fueled by massive monetary and fiscal stimulus, progress on the vaccine and therapeutics front, improving economic data, and strong corporate earnings growth. Markets saw volatility return in the third quarter of 2021 on concerns around the Delta variant, inflation, supply chain pressures, and peak growth, but then rebounded in October as corporate earnings results continued to impress and consumer demand remained robust. The domestic small/mid cap market experienced eye-popping returns, particularly in the first half of the fiscal year, with the Russell 2500® Index rising 49.4% as investors sought to gain exposure to the U.S. domestic reopening trade. As such, small/mid cap stocks outpaced large caps during the period (S&P 500 ® Index, returned 42.91%). Small/mid cap growth stocks were a bit lower as the Russell 2500® Growth Index returned 37.12%. Cyclicals and financials generally performed better than areas featuring more secular growers as the economy reopened, leading to the outperformance of value stocks for the year (Russell 2500® Value; up 58.1%). For the fiscal year period prior to the Fund’s transition to GW&K from November 1, 2020 to March 18, 2021, the Fund underperformed the legacy Russell 2000® Growth Index. Both stock selection and sector weightings negatively impacted relative | | performance over this period. An overweight and weak stock selection in the health care and technology sectors were the largest detractors. Underweight positioning and weak stock selection in industrials, financials, and consumer staples also detracted. Following the transition of the Fund to GW&K, relative performance improved significantly as the Fund strongly outperformed the Russell 2500® Growth Index through the remainder of the fiscal year. Stock selection drove the outperformance, with particular strength in information technology and health care. In information technology, the majority of the contribution can be attributed to our software holdings. While the benchmark return for this industry was a respectable 22.9%, our holdings returned 58.5% led by HubSpot, Inc., Paylocity Holding Corp., and Rapid7, Inc. Outside of Software, Gartner, Inc., EPAM Systems (EPAM Systems was sold during the period), and Brooks Automation, Inc. were also notably additive to the Strategy’s results. Within the health care sector, the largest contributor to relative performance came from biopharma, thanks entirely to stock selection. In particular, the big winners were Catalent, Inc., Biohaven Pharmaceutical Holding Co., Ltd., and Horizon Therapeutics PLC. All three stocks reported better-than-expected quarterly results, and subsequently saw increases in their forward sales and earnings estimates. On the other side of the ledger, the largest detractor to relative results was the financials sector, due to weakness in the Capital Markets industry. One stock, MarketAxess Holdings, Inc., accounted for most of the underperformance. The stock suffered late in the third quarter as the company’s share of bond trading volumes stepped down in August after increasing in July. Despite this short-term issue, we continue to admire the management team and prospects for the company moving forward. Consumer discretionary was also a challenging sector for us during the period. Grand Canyon Education, Inc., Krispy Kreme, Inc., and Burlington Stores, Inc. weighed most heavily on relative results. We continue to hold all three stocks at this time. Krispy Kreme, specifically, was a new purchase in the third quarter. We believe that the new management team has re-focused the company on its core, differentiated product and think | | the stock trades at an attractive valuation. Looking at relative performance through a factor lens, the allocation in our Strategy toward higher-quality stocks helped results by about 230 basis points based on an average of six factors, with earnings being the most prominent factor. While the past year has been quite strong for the market, the overall U.S. small/mid cap market, and the Russell 2500® Growth Index along with it, have not made much notional progress since March of 2021. The silver lining is that the composition of the benchmark is improving in both quality and valuation as the hard fall of meme and other low quality stocks has been met with continued earnings strength from many other components. Of course, that still leaves investors with a great many uncertainties to consider. This includes some waning fiscal support for the domestic economy, the partisan and even intra-party roadblocks in Washington, potential for U.S. Federal Reserve (Fed) tapering or a market tantrum from Fed speak or policy, supply chain shortages and challenges, and what appears to be an increasing acceptance of higher input prices; from commodities all the way up the value chain to labor. Will rising prices and interest rates result in a sudden change in the valuations investors are willing to pay for stocks? Could Delta or some other variant change the calculus on our recovery from the pandemic? And we haven’t even talked about China yet, which as the second largest economy in the world has domestic and foreign policy issues that could damage our best assumptions about future economic activity and corporate profits. Our conversations with small/mid cap companies reveal demand that is still robust and creative thinking and innovation that can help circumvent many of these fundamental challenges. The risk of larger macro changes are always present with many rivers to cross. If we take the long view and avoid meme shortcuts, our probability of investment success will increase meaningfully. The views expressed represent the opinions of GW&K Investment Management, LLC, as of October 31, 2021, and are not intended as a forecast or guarantee of future results and are subject to change without notice. |
25
|
AMG GW&K Small/Mid Cap Growth Fund Portfolio Manager’s Comments (continued) |
CUMULATIVE TOTAL RETURN PERFORMANCE
AMG GW&K Small/Mid Cap Growth Fund’s cumulative total return is based on the daily change in net asset value (NAV), and assumes that all dividends and distributions were reinvested. The graph compares a hypothetical $10,000 investment made in the AMG GW&K Small/Mid Cap Growth Fund’s Class N shares on October 31, 2011, to a $10,000 investment made in the Russell 2500® Growth Index and Russell 2000® Growth Index for the same time period. The graph and table do not reflect the deduction of taxes that a shareholder would pay on a Fund distribution or redemption of shares. The listed returns for the Fund are net of expenses and the returns for the indexes exclude expenses. Total returns would have been lower had certain expenses not been reduced.
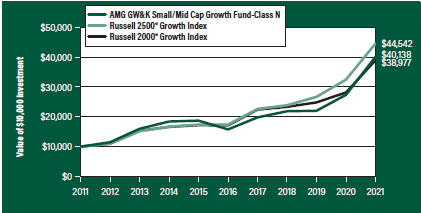
The table below shows the average annual total returns for the AMG GW&K Small/Mid Cap Growth Fund and the Russell 2500® Growth Index and Russell 2000® Growth Index for the same time periods ended October 31, 2021.
| | | | | | | | | | | | | | | | | | | | |
| Average Annual Total Returns1 | | One Year | | | Five
Years | | | Ten
Years | | | Since
Inception | | | Inception
Date | |
AMG GW&K Small/Mid Cap Growth Fund2, 3, 4, 5, 6, 7, 8, 9, 10, 11 | | | | | |
| | | | | |
Class N | | | 46.66 | % | | | 20.54 | % | | | 14.91 | % | | | 13.42 | % | | | 11/03/10 | |
| | | | | |
Class I | | | 46.94 | % | | | 20.77 | % | | | 15.16 | % | | | 12.13 | % | | | 06/01/11 | |
| | | | | |
Class Z | | | — | | | | — | | | | — | | | | 3.08 | % | | | 09/01/21 | |
| | | | | |
Russell 2500® Growth Index12 | | | 37.12 | % | | | 20.68 | % | | | 16.11 | % | | | 15.60 | % | | | 11/03/10 | † |
| | | | | |
Russell 2000® Growth Index13 | | | 38.45 | % | | | 17.90 | % | | | 14.57 | % | | | 14.00 | % | | | 11/03/10 | † |
The performance data shown represents past performance. Past performance is not a guarantee of future results. Current performance may be lower or higher than the performance data quoted. The investment return and principal value of an investment will fluctuate so that an investor’s shares, when redeemed, may be worth more or less than their original cost.
Investors should carefully consider the Fund’s investment objectives, risks, charges and expenses before investing. For performance information through the most recent month end, current net asset values per share for the Fund and other information, please call 800.548.4539 or visit our website at amgfunds.com for a free prospectus. Read it carefully before investing or sending money.
Distributed by AMG Distributors, Inc., member FINRA/SIPC.
| † | Date reflects the inception date of the Fund, not the index. |
| 1 | Total return equals income yield plus share price change and assumes reinvestment of all dividends and capital gain distributions. Returns are net of fees and may reflect offsets of Fund expenses as described in the |
| | |
| | | prospectus. No adjustment has been made for taxes payable by shareholders on their reinvested dividends and capital gain distributions. Returns for periods greater than one year are annualized. The listed returns on the Fund are net of expenses and based on the published NAV as of October 31, 2021. All returns are in U.S. dollars ($). |
| | |
| | | 2 As of March 19, 2021, the Fund’s subadvisor was changed to GW&K Investment Management, LLC. Prior to March 19, 2021, the Fund was known as the AMG Managers LMCG Small Cap Growth Fund and had different principal investment strategies and corresponding risks. Effective March 19, 2021, the Fund changed its name to AMG GW&K Small Cap Fund II. Effective May 21, 2021, the Fund changed its name to AMG GW&K Small/Mid Cap Growth Fund and made changes to its principal investment strategies. Performance shown for periods prior to March 19, 2021, reflects the performance and investment strategies of the Fund’s previous subadvisor, LMCG Investments, LLC. The Fund’s past performance would have been different if the Fund were managed by the current subadvisor and strategy, and the Fund’s prior performance record might be less pertinent for investors considering whether to purchase shares of the Fund. |
| | |
| | | 3 From time to time, the Fund’s advisor has waived its fees and/or absorbed Fund expenses, which has resulted in higher returns. |
| | |
| | | 4 The Fund is subject to risks associated with investments in small-capitalization companies, such as erratic earnings patterns, competitive conditions, limited earnings history and a reliance on one or a limited number of products. |
| | |
| | | 5 Active and frequent trading of a fund may result in higher transaction costs and increased tax liability. |
| | |
| | | 6 The Fund invests in growth stocks, which may be more sensitive to market movements because their prices tend to reflect future investor expectations rather than just current profits. Growth stocks may underperform value stocks during given periods. |
| | |
| | | 7 Investments in international securities are subject to certain risks of overseas investing including currency fluctuations and changes in political and economic conditions, which could result in significant market fluctuations. These risks are magnified in emerging markets. |
| | |
| | | 8 Investing in initial public offerings (IPOs) is risky and the prices of stocks purchased in IPOs tend to fluctuate more widely than stocks of companies that have been publicly traded for a longer period of time. Stocks purchased in IPOs generally do not have a trading history, and information about the companies may be available for very limited periods. |
| | |
| | | 9 The Fund is subject to risks associated with investments in mid-capitalization companies such |
26
|
AMG GW&K Small/Mid Cap Growth Fund Portfolio Manager’s Comments (continued) |
| | | | | | | | |
as greater price volatility, lower trading volume, and less liquidity than the stocks of larger, more established companies. 10 Companies that are in similar industry sectors may be similarly affected by particular economic or market events; to the extent the Fund has substantial holdings within a particular sector, the risks associated with that sector increase. 11 Market prices of investments held by the Fund may fall rapidly or unpredictably due to a variety of economic or political factors, market conditions, disasters or public health issues, or in response to | | | | events that affect particular industries or companies. 12 On March 19, 2021, the primary benchmark changed from the Russell 2000® Growth Index to the Russell 2500® Growth Index. The Russell 2500® Growth Index measures the performance of the small- to mid-cap growth segment of the U.S. equity universe. It includes those Russell 2500® companies with higher price-to-book ratios and higher forecasted growth values. Unlike the Fund, the Russell 2500® Growth Index is unmanaged, is not available for investment and does not incur expenses. | | | | 13 The Russell 2000® Growth Index measures the performance of the Russell 2000® companies with higher price-to-book ratios and higher forecasted growth values. Unlike the Fund, the Russell 2000® Growth Index is unmanaged, is not available for investment and does not incur expenses. The Russell Indices are a trademark of the London Stock Exchange Group companies. Not FDIC insured, nor bank guaranteed. May lose value. |
27
|
AMG GW&K Small/Mid Cap Growth Fund Fund Snapshots (unaudited) October 31, 2021 |
PORTFOLIO BREAKDOWN
| | | | | |
| Sector | | % of Net Assets |
| | |
Information Technology | | | | 31.5 | |
| | |
Health Care | | | | 26.2 | |
| | |
Industrials | | | | 14.7 | |
| | |
Consumer Discretionary | | | | 13.8 | |
| | |
Financials | | | | 4.6 | |
| | |
Materials | | | | 3.0 | |
| | |
Real Estate | | | | 2.5 | |
| | |
Energy | | | | 1.5 | |
| | |
Consumer Staples | | | | 1.2 | |
| | |
Short-Term Investments | | | | 1.1 | |
| | |
Other Assets Less Liabilities | | | | (0.1 | ) |
TOP TEN HOLDINGS
| | |
| Security Name | | % of Net Assets |
| | |
Gartner, Inc. | | 3.5 |
| | |
Paylocity Holding Corp. | | 3.1 |
| | |
HubSpot, Inc. | | 2.9 |
| | |
Catalent, Inc. | | 2.7 |
| | |
Brooks Automation, Inc. | | 2.3 |
| | |
Pool Corp. | | 2.2 |
| | |
SiteOne Landscape Supply, Inc. | | 2.1 |
| | |
Burlington Stores, Inc. | | 2.1 |
| | |
Rapid7, Inc. | | 2.0 |
| | |
Syneos Health, Inc. | | 2.0 |
| | | |
| | |
Top Ten as a Group | | 24.9 |
| | |
Because a fund’s strategy may result in multiple investments in particular sectors of the economy, its performance may depend on the performance of those sectors and may fluctuate more widely than investments diversified across more sectors. For additional information on these and other risk considerations, please see the Fund’s prospectus.
Any sectors, industries, or securities discussed should not be perceived as investment recommendations. Mention of a specific security should not be considered a recommendation to buy or solicitation to sell that security. Specific securities mentioned in this report may have been sold from the Fund’s portfolio of investments by the time you receive this report.
28
|
AMG GW&K Small/Mid Cap Growth Fund Schedule of Portfolio Investments October 31, 2021 |
| | | | | | | | |
| | | Shares | | | Value | |
| | |
Common Stocks - 99.0% | | | | | | | | |
| | |
Consumer Discretionary - 13.8% | | | | | | | | |
| | |
Bright Horizons Family Solutions, Inc.* | | | 2,133 | | | | $354,078 | |
| | |
Burlington Stores, Inc.* | | | 3,320 | | | | 917,283 | |
| | |
Churchill Downs, Inc. | | | 2,427 | | | | 558,210 | |
| | |
Five Below, Inc.* | | | 3,256 | | | | 642,409 | |
| | |
Grand Canyon Education, Inc.* | | | 4,956 | | | | 394,993 | |
| | |
Krispy Kreme Inc.1 | | | 23,575 | | | | 300,581 | |
| | |
Lithia Motors, Inc., Class A | | | 1,282 | | | | 409,240 | |
| | |
LKQ Corp.* | | | 10,484 | | | | 577,459 | |
| | |
Pool Corp. | | | 1,865 | | | | 960,774 | |
| | |
Texas Roadhouse, Inc. | | | 6,814 | | | | 605,151 | |
| | |
Vail Resorts, Inc. | | | 1,051 | | | | 362,290 | |
| | |
Total Consumer Discretionary | | | | | | | 6,082,468 | |
| | |
Consumer Staples - 1.2% | | | | | | | | |
| | |
Performance Food Group Co.* | | | 5,862 | | | | 265,138 | |
| | |
PriceSmart, Inc. | | | 3,385 | | | | 243,551 | |
| | |
Total Consumer Staples | | | | | | | 508,689 | |
| | |
Energy - 1.5% | | | | | | | | |
| | |
Matador Resources Co. | | | 16,050 | | | | 671,693 | |
| | |
Financials - 4.6% | | | | | | | | |
| | |
Evercore, Inc., Class A | | | 2,909 | | | | 441,703 | |
| | |
MarketAxess Holdings, Inc. | | | 1,566 | | | | 639,977 | |
| | |
Pinnacle Financial Partners, Inc. | | | 4,337 | | | | 418,824 | |
| | |
Signature Bank | | | 1,790 | | | | 533,098 | |
| | |
Total Financials | | | | | | | 2,033,602 | |
| | |
Health Care - 26.2% | | | | | | | | |
| | |
Acadia Healthcare Co., Inc.* | | | 9,391 | | | | 582,242 | |
| | |
Albireo Pharma, Inc.* | | | 10,439 | | | | 305,028 | |
| | |
Arena Pharmaceuticals, Inc.* | | | 5,512 | | | | 316,334 | |
| | |
Biohaven Pharmaceutical Holding Co., Ltd.* | | | 4,572 | | | | 650,687 | |
| | |
Bio-Rad Laboratories, Inc., Class A* | | | 769 | | | | 611,109 | |
| | |
Catalent, Inc.* | | | 8,723 | | | | 1,202,553 | |
| | |
Chemed Corp. | | | 672 | | | | 324,072 | |
| | |
CryoPort, Inc.*,1 | | | 7,298 | | | | 595,079 | |
| | |
Deciphera Pharmaceuticals, Inc.* | | | 8,973 | | | | 299,608 | |
| | |
Emergent BioSolutions, Inc.* | | | 4,758 | | | | 226,814 | |
| | |
Globus Medical, Inc., Class A* | | | 8,993 | | | | 693,990 | |
| | |
Halozyme Therapeutics, Inc.* | | | 8,059 | | | | 306,806 | |
| | |
HealthEquity, Inc.* | | | 7,273 | | | | 481,327 | |
| | |
Horizon Therapeutics PLC* | | | 5,754 | | | | 689,962 | |
| | |
ICU Medical, Inc.* | | | 917 | | | | 214,697 | |
| | |
Integra LifeSciences Holdings Corp.* | | | 6,959 | | | | 462,495 | |
| | | | | | | | |
| | | Shares | | | Value | |
| | |
LHC Group, Inc.* | | | 3,135 | | | | $421,940 | |
| | |
Medpace Holdings, Inc.* | | | 2,639 | | | | 597,865 | |
| | |
Neurocrine Biosciences, Inc.* | | | 3,757 | | | | 396,025 | |
| | |
Oyster Point Pharma, Inc.*,1 | | | 19,111 | | | | 225,128 | |
| | |
Phathom Pharmaceuticals, Inc.*,1 | | | 8,288 | | | | 195,017 | |
| | |
Syneos Health, Inc.* | | | 9,356 | | | | 873,289 | |
| | |
West Pharmaceutical Services, Inc. | | | 1,535 | | | | 659,866 | |
| | |
Zogenix, Inc.* | | | 15,392 | | | | 235,959 | |
| | |
Total Health Care | | | | | | | 11,567,892 | |
| | |
Industrials - 14.7% | | | | | | | | |
| | |
Booz Allen Hamilton Holding Corp. | | | 3,835 | | | | 333,108 | |
| | |
CACI International, Inc., Class A* | | | 1,488 | | | | 428,008 | |
| | |
Dycom Industries, Inc.* | | | 2,162 | | | | 171,706 | |
| | |
Gibraltar Industries, Inc.* | | | 3,954 | | | | 257,643 | |
| | |
Graco, Inc. | | | 6,325 | | | | 475,514 | |
| | |
IAA, Inc.* | | | 7,872 | | | | 469,565 | |
| | |
Ingersoll Rand, Inc.* | | | 10,057 | | | | 540,664 | |
| | |
JELD-WEN Holding, Inc.* | | | 5,127 | | | | 140,531 | |
| | |
Knight-Swift Transportation Holdings, Inc. | | | 6,089 | | | | 345,185 | |
| | |
RBC Bearings, Inc.* | | | 3,152 | | | | 737,347 | |
| | |
Ritchie Bros. Auctioneers, Inc. (Canada) | | | 11,608 | | | | 793,407 | |
| | |
SiteOne Landscape Supply, Inc.*,1 | | | 3,970 | | | | 932,791 | |
| | |
The Toro Co. | | | 4,834 | | | | 461,502 | |
| | |
Woodward, Inc. | | | 3,264 | | | | 368,669 | |
| | |
Total Industrials | | | | | | | 6,455,640 | |
| | |
Information Technology - 31.5% | | | | | | | | |
| | |
Brooks Automation, Inc. | | | 8,788 | | | | 1,023,363 | |
| | |
Cerence, Inc.*,1 | | | 8,044 | | | | 845,666 | |
| | |
Cognex Corp. | | | 8,262 | | | | 723,669 | |
| | |
The Descartes Systems Group, Inc. (Canada)* | | | 6,064 | | | | 495,853 | |
| | |
Entegris, Inc. | | | 5,815 | | | | 818,636 | |
| | |
Gartner, Inc.* | | | 4,610 | | | | 1,530,105 | |
| | |
Globant SA (Uruguay)* | | | 1,500 | | | | 478,785 | |
| | |
HubSpot, Inc.*,1 | | | 1,599 | | | | 1,295,558 | |
| | |
MACOM Technology Solutions Holdings, Inc.* | | | 7,182 | | | | 501,447 | |
| | |
Manhattan Associates, Inc.* | | | 4,361 | | | | 791,696 | |
| | |
Paycor HCM, Inc.*,1 | | | 15,213 | | | | 493,510 | |
| | |
Paylocity Holding Corp.* | | | 4,461 | | | | 1,361,229 | |
| | |
Rapid7, Inc.*,1 | | | 6,934 | | | | 892,752 | |
| | |
Rogers Corp.* | | | 1,896 | | | | 381,323 | |
| | |
Silicon Laboratories, Inc.* | | | 3,056 | | | | 576,850 | |
| | |
SS&C Technologies Holdings, Inc. | | | 4,370 | | | | 347,284 | |
| | |
Tyler Technologies, Inc.* | | �� | 908 | | | | 493,244 | |
The accompanying notes are an integral part of these financial statements.
29
|
AMG GW&K Small/Mid Cap Growth Fund Schedule of Portfolio Investments (continued) |
| | | | | | | | |
| | |
| | | Shares | | | Value | |
| | |
Information Technology - 31.5% | | | | | | | | |
(continued) | | | | | | | | |
| | |
Zebra Technologies Corp., Class A* | | | 1,599 | | | | $853,786 | |
| | |
Total Information Technology | | | | | | | 13,904,756 | |
| | |
Materials - 3.0% | | | | | | | | |
| | |
AptarGroup, Inc. | | | 3,097 | | | | 374,055 | |
| | |
Avient Corp. | | | 6,574 | | | | 354,207 | |
| | |
Eagle Materials, Inc. | | | 1,277 | | | | 189,456 | |
| | |
RPM International, Inc. | | | 4,780 | | | | 416,816 | |
| | |
Total Materials | | | | | | | 1,334,534 | |
| | |
Real Estate - 2.5% | | | | | | | | |
| | |
American Campus Communities, Inc., REIT | | | 4,796 | | | | 257,641 | |
| | |
CoreSite Realty Corp., REIT | | | 1,734 | | | | 247,025 | |
| | |
Sun Communities, Inc., REIT | | | 2,963 | | | | 580,689 | |
| | |
Total Real Estate | | | | | | | 1,085,355 | |
| | |
Total Common Stocks | | | | | | | | |
(Cost $36,482,263) | | | | | | | 43,644,629 | |
| | | | | | | | |
| | | Principal Amount | | | Value | |
| | |
Short-Term Investments - 1.1% | | | | | | | | |
| |
Joint Repurchase Agreements - 1.1%2 | | | | | |
| | |
Daiwa Capital Markets America, dated 10/29/21, due 11/01/21, 0.050% total to be received $485,592 (collateralized by various U.S. Government Agency Obligations and U.S. Treasuries, 0.000% - 6.500%, 11/01/21 -11/01/51, totaling $495,302) | | | $485,590 | | | | $485,590 | |
| | |
Total Short-Term Investments | | | | | | | | |
(Cost $485,590) | | | | | | | 485,590 | |
| | |
Total Investments - 100.1% | | | | | | | | |
(Cost $36,967,853) | | | | | | | 44,130,219 | |
| | |
Other Assets, less Liabilities - (0.1)% | | | | | | | (31,401 | ) |
| | |
Net Assets - 100.0% | | | | | | | $44,098,818 | |
| * | Non-income producing security. |
| 1 | Some of these securities, amounting to $4,624,938 or 10.5% of net assets, were out on loan to various borrowers and are collateralized by cash and various U.S. Treasury Obligations. See Note 4 of Notes to Financial Statements. |
| 2 | Cash collateral received for securities lending activity was invested in these joint repurchase agreements. |
REIT Real Estate Investment Trust
| | | | | | | | | | | | | | | | |
| | | Level 1 | | | Level 2 | | | Level 3 | | | Total | |
| | | | |
Investments in Securities | | | | | | | | | | | | | | | | |
| | | | |
Common Stocks† | | $ | 43,644,629 | | | | – | | | | – | | | $ | 43,644,629 | |
| | | | |
Short-Term Investments | | | | | | | | | | | | | | | | |
| | | | |
Joint Repurchase Agreements | | | – | | | $ | 485,590 | | | | – | | | | 485,590 | |
| | | | | | | | | | | | | | | | |
| | | | |
Total Investments in Securities | | $ | 43,644,629 | | | $ | 485,590 | | | | – | | | $ | 44,130,219 | |
| | | | | | | | | | | | | | | | |
| † | All common stocks held in the Fund are Level 1 securities. For a detailed breakout of common stocks by major industry classification, please refer to the Fund’s Schedule of Portfolio Investments. |
For the fiscal year ended October 31, 2021, there were no transfers in or out of Level 3.
The accompanying notes are an integral part of these financial statements.
30
|
Statement of Assets and Liabilities October 31, 2021 |
| | | | | | | | | | | | | | | | |
| | | AMG GW&K
Core Bond ESG Fund | | | AMG GW&K Emerging Markets Equity Fund | | | AMG GW&K Emerging Wealth Equity Fund | | | AMG GW&K Small/Mid Cap Growth Fund | |
| | | | |
Assets: | | | | | | | | | | | | | | | | |
| | | | |
Investments at value1 (including securities on loan valued at $0, $2,242,295, $1,589,618, and $4,624,938, respectively) | | | $187,223,760 | | | | $58,092,433 | | | | $223,235,131 | | | | $44,130,219 | |
| | | | |
Cash | | | 7,855,311 | | | | 2,094,705 | | | | 2,195,655 | | | | 369,165 | |
| | | | |
Foreign currency2 | | | – | | | | 503,550 | | | | 998,804 | | | | – | |
| | | | |
Receivable for investments sold | | | – | | | | – | | | | – | | | | 122,296 | |
| | | | |
Dividend and interest receivables | | | 1,160,434 | | | | 33,778 | | | | 91,512 | | | | 5,247 | |
| | | | |
Securities lending income receivable | | | – | | | | 210 | | | | 964 | | | | 3,004 | |
| | | | |
Receivable for Fund shares sold | | | 269,622 | | | | 29,291 | | | | 41,680 | | | | 1,399 | |
| | | | |
Receivable from affiliate | | | 19,060 | | | | 15,594 | | | | – | | | | 14,320 | |
| | | | |
Prepaid expenses and other assets | | | 12,566 | | | | 2,902 | | | | 10,963 | | | | 13,145 | |
| | | | |
Total assets | | | 196,540,753 | | | | 60,772,463 | | | | 226,574,709 | | | | 44,658,795 | |
| | | | |
Liabilities: | | | | | | | | | | | | | | | | |
| | | | |
Payable upon return of securities loaned | | | – | | | | 2,015,149 | | | | 507,794 | | | | 485,590 | |
| | | | |
Payable for investments purchased | | | – | | | | 10,683 | | | | – | | | | – | |
| | | | |
Payable for Fund shares repurchased | | | 196,959 | | | | – | | | | 15,821 | | | | 1,048 | |
| | | | |
Payable for foreign capital gains tax | | | – | | | | – | | | | 76,478 | | | | – | |
| | | | |
Accrued expenses: | | | | | | | | | | | | | | | | |
| | | | |
Investment advisory and management fees | | | 50,044 | | | | 27,572 | | | | 107,965 | | | | 22,469 | |
| | | | |
Administrative fees | | | 25,022 | | | | 7,520 | | | | 29,445 | | | | 5,436 | |
| | | | |
Distribution fees | | | 448 | | | | 92 | | | | 264 | | | | 5,320 | |
| | | | |
Shareholder service fees | | | 13,059 | | | | 2,440 | | | | 1,566 | | | | 273 | |
| | | | |
Other | | | 99,636 | | | | 75,590 | | | | 125,793 | | | | 39,841 | |
| | | | |
Total liabilities | | | 385,168 | | | | 2,139,046 | | | | 865,126 | | | | 559,977 | |
| | | | |
| | | | | | | | | | | | | | | | |
| | | | |
Net Assets | | | $196,155,585 | | | | $58,633,417 | | | | $225,709,583 | | | | $44,098,818 | |
| | | | |
1 Investments at cost | | | $182,901,480 | | | | $45,508,783 | | | | $193,086,961 | | | | $36,967,853 | |
| | | | |
2 Foreign currency at cost | | | – | | | | $509,084 | | | | $1,009,549 | | | | – | |
The accompanying notes are an integral part of these financial statements.
31
|
Statement of Assets and Liabilities (continued) |
| | | | | | | | | | | | | | | | |
| | | AMG GW&K
Core Bond
ESG Fund | | | AMG GW&K
Emerging Markets
Equity Fund | | | AMG GW&K
Emerging Wealth
Equity Fund | | | AMG GW&K
Small/Mid Cap
Growth Fund | |
| | | | |
Net Assets Represent: | | | | | | | | | | | | | | | | |
| | | | |
Paid-in capital | | | $187,344,468 | | | | $46,243,995 | | | | $196,202,624 | | | | $37,326,251 | |
| | | | |
Total distributable earnings | | | 8,811,117 | | | | 12,389,422 | | | | 29,506,959 | | | | 6,772,567 | |
| | | | |
Net Assets | | | $196,155,585 | | | | $58,633,417 | | | | $225,709,583 | | | | $44,098,818 | |
| | | | |
Class N: | | | | | | | | | | | | | | | | |
| | | | |
Net Assets | | | $2,124,979 | | | | $414,446 | | | | $967,435 | | | | $37,471,420 | |
| | | | |
Shares outstanding | | | 197,625 | | | | 40,245 | | | | 72,154 | | | | 2,120,110 | |
| | | | |
Net asset value, offering and redemption price per share | | | $10.75 | | | | $10.30 | | | | $13.41 | | | | $17.67 | |
| | | | |
Class I: | | | | | | | | | | | | | | | | |
| | | | |
Net Assets | | | $190,306,434 | | | | $24,570,809 | | | | $41,452,647 | | | | $6,611,932 | |
| | | | |
Shares outstanding | | | 17,691,563 | | | | 2,407,340 | | | | 3,060,018 | | | | 359,532 | |
| | | | |
Net asset value, offering and redemption price per share | | | $10.76 | | | | $10.21 | | | | $13.55 | | | | $18.39 | |
| | | | |
Class Z: | | | | | | | | | | | | | | | | |
| | | | |
Net Assets | | | $3,724,172 | | | | $33,648,162 | | | | $183,289,501 | | | | $15,466 | |
| | | | |
Shares outstanding | | | 346,421 | | | | 3,313,668 | | | | 13,552,956 | | | | 841 | |
| | | | |
Net asset value, offering and redemption price per share | | | $10.75 | | | | $10.15 | | | | $13.52 | | | | $18.39 | |
The accompanying notes are an integral part of these financial statements.
32
|
Statement of Operations For the fiscal year ended October 31, 2021 |
| | | | | | | | | | | | | | | | |
| | | AMG GW&K
Core Bond
ESG Fund | | | AMG GW&K
Emerging Markets
Equity Fund | | | AMG GW&K
Emerging Wealth
Equity Fund | | | AMG GW&K
Small/Mid Cap
Growth Fund | |
| | | | |
Investment Income: | | | | | | | | | | | | | | | | |
| | | | |
Dividend income | | | $97 | | | | $984,601 | | | | $1,764,081 | | | | $98,715 | |
| | | | |
Interest income | | | 3,984,290 | | | | – | | | | – | | | | – | |
| | | | |
Securities lending income | | | – | | | | 7,665 | | | | 34,047 | | | | 10,638 | |
| | | | |
Foreign withholding tax | | | – | | | | (118,669 | ) | | | (134,379 | ) | | | (1,385 | ) |
| | | | |
Total investment income | | | 3,984,387 | | | | 873,597 | | | | 1,663,749 | | | | 107,968 | |
| | | | |
Expenses: | | | | | | | | | | | | | | | | |
| | | | |
Investment advisory and management fees | | | 598,401 | | | | 326,599 | | | | 1,456,380 | | | | 337,346 | |
| | | | |
Administrative fees | | | 299,200 | | | | 89,073 | | | | 397,195 | | | | 63,507 | |
| | | | |
Distribution fees - Class N | | | 4,847 | | | | 1,231 | | | | 4,350 | | | | 63,201 | |
| | | | |
Shareholder servicing fees - Class N | | | 2,908 | | | | 738 | | | | 2,610 | | | | 15,385 | |
| | | | |
Shareholder servicing fees - Class I | | | 145,926 | | | | 21,441 | | | | 43,017 | | | | 4,523 | |
| | | | |
Professional fees | | | 55,841 | | | | 54,462 | | | | 65,293 | | | | 27,560 | |
| | | | |
Reports to shareholders | | | 29,232 | | | | 10,019 | | | | 24,699 | | | | 14,252 | |
| | | | |
Custodian fees | | | 29,014 | | | | 55,707 | | | | 124,386 | | | | 20,786 | |
| | | | |
Registration fees | | | 28,518 | | | | 20,604 | | | | 53,286 | | | | 27,049 | |
| | | | |
Transfer agent fees | | | 24,166 | | | | 3,456 | | | | 11,642 | | | | 10,117 | |
| | | | |
Trustee fees and expenses | | | 14,220 | | | | 4,170 | | | | 18,894 | | | | 3,063 | |
| | | | |
Interest expense | | | 33 | | | | – | | | | 408 | | | | 166 | |
| | | | |
Miscellaneous | | | 8,483 | | | | 3,501 | | | | 9,452 | | | | 3,409 | |
| | | | |
Repayment of prior reimbursements | | | – | | | | 7,118 | | | | – | | | | – | |
| | | | |
Total expenses before offsets | | | 1,240,789 | | | | 598,119 | | | | 2,211,612 | | | | 590,364 | |
| | | | |
Expense reimbursements | | | (129,634 | ) | | | (58,087 | ) | | | – | | | | (103,778 | ) |
| | | | |
Expense reductions | | | – | | | | – | | | | – | | | | (2,645 | ) |
| | | | |
Fee waivers | | | – | | | | (297 | ) | | | – | | | | – | |
| | | | |
Net expenses | | | 1,111,155 | | | | 539,735 | | | | 2,211,612 | | | | 483,941 | |
| | | | |
| | | | | | | | | | | | | | | | |
| | | | |
Net investment income (loss) | | | 2,873,232 | | | | 333,862 | | | | (547,863 | ) | | | (375,973 | ) |
| | | | |
Net Realized and Unrealized Gain (Loss): | | | | | | | | | | | | | | | | |
| | | | |
Net realized gain on investments | | | 4,909,231 | | | | 557,200 | | | | 2,895,248 | | | | 16,012,613 | |
| | | | |
Net realized gain (loss) on foreign currency transactions | | | – | | | | 7,230 | | | | (23,639 | ) | | | – | |
| | | | |
Net change in unrealized appreciation/depreciation on investments | | | (7,605,124 | ) | | | 2,367,756 | | | | (5,095,133 | ) | | | (137,250 | ) |
| | | | |
Net change in unrealized appreciation/depreciation on foreign currency translations | | | – | | | | (8,202 | ) | | | 68,588 | | | | – | |
| | | | |
Net realized and unrealized gain (loss) | | | (2,695,893 | ) | | | 2,923,984 | | | | (2,154,936 | ) | | | 15,875,363 | |
| | | | |
| | | | | | | | | | | | | | | | |
| | | | |
Net increase (decrease) in net assets resulting from operations | | | $177,339 | | | | $3,257,846 | | | | $(2,702,799 | ) | | | $15,499,390 | |
The accompanying notes are an integral part of these financial statements.
33
|
Statements of Changes in Net Assets For the fiscal years ended October 31, |
| | | | | | | | | | | | | | | | |
| | | AMG GW&K
Core Bond ESG Fund | | | AMG GW&K
Emerging Markets
Equity Fund | |
| | | | |
| | | 2021 | | | 2020 | | | 2021 | | | 2020 | |
| | | | |
Increase in Net Assets Resulting From Operations: | | | | | | | | | | | | | | | | |
| | | | |
Net investment income | | | $2,873,232 | | | | $4,276,093 | | | | $333,862 | | | | $243,007 | |
| | | | |
Net realized gain on investments | | | 4,909,231 | | | | 3,844,884 | | | | 564,430 | | | | 1,747,550 | |
| | | | |
Net change in unrealized appreciation/depreciation on investments | | | (7,605,124 | ) | | | 3,478,614 | | | | 2,359,554 | | | | 1,505,399 | |
| | | | |
Net increase in net assets resulting from operations | | | 177,339 | | | | 11,599,591 | | | | 3,257,846 | | | | 3,495,956 | |
| | | | |
Distributions to Shareholders: | | | | | | | | | | | | | | | | |
| | | | |
Class N | | | (21,649 | ) | | | (27,152 | ) | | | (17,233 | ) | | | (26,892 | ) |
| | | | |
Class I | | | (2,789,712 | ) | | | (4,226,935 | ) | | | (1,069,474 | ) | | | (1,090,353 | ) |
| | | | |
Class Z | | | (57,930 | ) | | | (77,096 | ) | | | (1,249,608 | ) | | | (1,569,541 | ) |
| | | | |
Total distributions to shareholders | | | (2,869,291 | ) | | | (4,331,183 | ) | | | (2,336,315 | ) | | | (2,686,786 | ) |
| | | | |
Capital Share Transactions:1 | | | | | | | | | | | | | | | | |
| | | | |
Net increase (decrease) from capital share transactions | | | (9,231,990 | ) | | | (16,453,440 | ) | | | 13,857,527 | | | | (13,302,131 | ) |
| | | | | | | | | | | | | | | | |
| | | | |
Total increase (decrease) in net assets | | | (11,923,942 | ) | | | (9,185,032 | ) | | | 14,779,058 | | | | (12,492,961 | ) |
| | | | |
Net Assets: | | | | | | | | | | | | | | | | |
| | | | |
Beginning of year | | | 208,079,527 | | | | 217,264,559 | | | | 43,854,359 | | | | 56,347,320 | |
| | | | |
End of year | | | $196,155,585 | | | | $208,079,527 | | | | $58,633,417 | | | | $43,854,359 | |
| | | | |
1 See Note 1(g) of the Notes to Financial Statements. | | | | | | | | | | | | | | | | |
The accompanying notes are an integral part of these financial statements.
34
|
Statements of Changes in Net Assets (continued) For the fiscal years ended October 31, |
| | | | | | | | | | | | | | | | |
| | | AMG GW&K
Emerging Wealth
Equity Fund | | | AMG GW&K
Small/Mid Cap
Growth Fund | |
| | | 2021 | | | 2020 | | | 2021 | | | 2020 | |
Increase (Decrease) in Net Assets Resulting From Operations: | | | | | | | | | | | | | | | | |
Net investment income (loss) | | | $(547,863 | ) | | | $55,701 | | | | $(375,973 | ) | | | $(314,735 | ) |
| | | | |
Net realized gain (loss) on investments | | | 2,871,609 | | | | (3,363,890 | ) | | | 16,012,613 | | | | 4,712,131 | |
| | | | |
Net change in unrealized appreciation/depreciation on investments | | | (5,026,545 | ) | | | 24,585,666 | | | | (137,250 | ) | | | 2,853,559 | |
| | | | |
Net increase (decrease) in net assets resulting from operations | | | (2,702,799 | ) | | | 21,277,477 | | | | 15,499,390 | | | | 7,250,955 | |
Distributions to Shareholders: | | | | | | | | | | | | | | | | |
From net investment income and/or realized gain on investments: | | | | | | | | | | | | | | | | |
| | | | |
Class N | | | – | | | | (55,712 | ) | | | (14,397,541 | ) | | | – | |
| | | | |
Class I | | | – | | | | (219,919 | ) | | | (3,078,320 | ) | | | – | |
| | | | |
Class Z | | | (35,421 | ) | | | (3,346,538 | ) | | | – | | | | – | |
From paid-in capital: | | | | | | | | | | | | | | | | |
| | | | |
Class N | | | – | | | | – | | | | (674,816 | ) | | | – | |
| | | | |
Class I | | | – | | | | – | | | | (144,282 | ) | | | – | |
| | | | |
Total distributions to shareholders | | | (35,421 | ) | | | (3,622,169 | ) | | | (18,294,959 | ) | | | – | |
Capital Share Transactions:1 | | | | | | | | | | | | | | | | |
| | | | |
Net increase (decrease) from capital share transactions | | | 18,163,731 | | | | 79,224,668 | | | | 11,502,921 | | | | (17,184,417 | ) |
| | | | | | | | | | | | | | | | |
| | | | |
Total increase (decrease) in net assets | | | 15,425,511 | | | | 96,879,976 | | | | 8,707,352 | | | | (9,933,462 | ) |
Net Assets: | | | | | | | | | | | | | | | | |
| | | | |
Beginning of year | | | 210,284,072 | | | | 113,404,096 | | | | 35,391,466 | | | | 45,324,928 | |
| | | | |
End of year | | | $225,709,583 | | | | $210,284,072 | | | | $44,098,818 | | | | $35,391,466 | |
| 1 | See Note 1(g) of the Notes to Financial Statements. |
The accompanying notes are an integral part of these financial statements.
35
|
AMG GW&K Core Bond ESG Fund Financial Highlights For a share outstanding throughout each fiscal year |
| | | | | | | | | | | | | | | | | | | | |
| | | For the fiscal years ended October 31, | |
| Class N | | 2021 | | | 2020 | | | 2019 | | | 2018 | | | 2017 | |
| | | | | |
Net Asset Value, Beginning of Year | | | $10.90 | | | | $10.53 | | | | $9.67 | | | | $10.14 | | | | $10.26 | |
| | | | | |
Income (loss) from Investment Operations: | | | | | | | | | | | | | | | | | | | | |
| | | | | |
Net investment income1,2 | | | 0.12 | | | | 0.18 | | | | 0.21 | | | | 0.18 | | | | 0.18 | |
| | | | | |
Net realized and unrealized gain (loss) on investments | | | (0.15 | ) | | | 0.37 | | | | 0.86 | | | | (0.46 | ) | | | (0.12 | ) |
| | | | | |
Total income (loss) from investment operations | | | (0.03 | ) | | | 0.55 | | | | 1.07 | | | | (0.28 | ) | | | 0.06 | |
| | | | | |
Less Distributions to Shareholders from: | | | | | | | | | | | | | | | | | | | | |
| | | | | |
Net investment income | | | (0.12 | ) | | | (0.18 | ) | | | (0.21 | ) | | | (0.19 | ) | | | (0.18 | ) |
| | | | | |
Net Asset Value, End of Year | | | $10.75 | | | | $10.90 | | | | $10.53 | | | | $9.67 | | | | $10.14 | |
| | | | | |
Total Return2,3 | | | (0.27 | )% | | | 5.31 | % | | | 11.20 | % | | | (2.79 | )% | | | 0.57 | % |
| | | | | |
Ratio of net expenses to average net assets | | | 0.88 | % | | | 0.88 | % | | | 0.88 | % | | | 0.88 | % | | | 0.88 | % |
| | | | | |
Ratio of gross expenses to average net assets4 | | | 0.94 | % | | | 0.96 | % | | | 0.95 | % | | | 0.93 | % | | | 0.93 | % |
| | | | | |
Ratio of net investment income to average net assets2 | | | 1.12 | % | | | 1.69 | % | | | 2.10 | % | | | 1.88 | % | | | 1.75 | % |
| | | | | |
Portfolio turnover | | | 62 | % | | | 56 | % | | | 48 | % | | | 17 | % | | | 18 | % |
| | | | | |
Net assets end of year (000’s) omitted | | | $2,125 | | | | $1,905 | | | | $1,255 | | | | $502 | | | | $146 | |
| | | | | | | | | | | | | | | | | | | | | |
36
|
AMG GW&K Core Bond ESG Fund Financial Highlights For a share outstanding throughout each fiscal year |
| | | | | | | | | | | | | | | | | | | | |
| | | For the fiscal years ended October 31, | |
| Class I | | 2021 | | | 2020 | | | 2019 | | | 2018 | | | 2017 | |
| | | | | |
Net Asset Value, Beginning of Year | | | $10.90 | | | | $10.54 | | | | $9.67 | | | | $10.15 | | | | $10.27 | |
| | | | | |
Income (loss) from Investment Operations: | | | | | | | | | | | | | | | | | | | | |
| | | | | |
Net investment income1,2 | | | 0.16 | | | | 0.22 | | | | 0.24 | | | | 0.22 | | | | 0.21 | |
| | | | | |
Net realized and unrealized gain (loss) on investments | | | (0.14 | ) | | | 0.36 | | | | 0.88 | | | | (0.48 | ) | | | (0.12 | ) |
| | | | | |
Total income (loss) from investment operations | | | 0.02 | | | | 0.58 | | | | 1.12 | | | | (0.26 | ) | | | 0.09 | |
| | | | | |
Less Distributions to Shareholders from: | | | | | | | | | | | | | | | | | | | | |
| | | | | |
Net investment income | | | (0.16 | ) | | | (0.22 | ) | | | (0.25 | ) | | | (0.22 | ) | | | (0.21 | ) |
| | | | | |
Net Asset Value, End of Year | | | $10.76 | | | | $10.90 | | | | $10.54 | | | | $9.67 | | | | $10.15 | |
| | | | | |
Total Return2,3 | | | 0.15 | % | | | 5.55 | % | | | 11.70 | % | | | (2.59 | )% | | | 0.91 | % |
| | | | | |
Ratio of net expenses to average net assets | | | 0.56 | % | | | 0.55 | % | | | 0.55 | % | | | 0.56 | % | | | 0.55 | % |
| | | | | |
Ratio of gross expenses to average net assets4 | | | 0.62 | % | | | 0.63 | % | | | 0.62 | % | | | 0.61 | % | | | 0.60 | % |
| | | | | |
Ratio of net investment income to average net assets2 | | | 1.44 | % | | | 2.01 | % | | | 2.42 | % | | | 2.20 | % | | | 2.08 | % |
| | | | | |
Portfolio turnover | | | 62 | % | | | 56 | % | | | 48 | % | | | 17 | % | | | 18 | % |
| | | | | |
Net assets end of year (000’s) omitted | | | $190,306 | | | | $202,363 | | | | $212,801 | | | | $264,795 | | | | $325,855 | |
| | | | | | | | | | | | | | | | | | | | | |
37
|
AMG GW&K Core Bond ESG Fund Financial Highlights For a share outstanding throughout each fiscal year |
| | | | | | | | | | | | | | | | | | | | |
| | | For the fiscal years ended October 31, | |
| Class Z | | 2021 | | | 2020 | | | 2019 | | | 2018 | | | 2017 | |
| | | | | |
Net Asset Value, Beginning of Year | | | $10.90 | | | | $10.53 | | | | $9.67 | | | | $10.14 | | | | $10.26 | |
| | | | | |
Income (loss) from Investment Operations: | | | | | | | | | | | | | | | | | | | | |
| | | | | |
Net investment income1,2 | | | 0.16 | | | | 0.22 | | | | 0.25 | | | | 0.23 | | | | 0.22 | |
| | | | | |
Net realized and unrealized gain (loss) on investments | | | (0.15 | ) | | | 0.38 | | | | 0.87 | | | | (0.47 | ) | | | (0.12 | ) |
| | | | | |
Total income (loss) from investment operations | | | 0.01 | | | | 0.60 | | | | 1.12 | | | | (0.24 | ) | | | 0.10 | |
| | | | | |
Less Distributions to Shareholders from: | | | | | | | | | | | | | | | | | | | | |
| | | | | |
Net investment income | | | (0.16 | ) | | | (0.23 | ) | | | (0.26 | ) | | | (0.23 | ) | | | (0.22 | ) |
| | | | | |
Net Asset Value, End of Year | | | $10.75 | | | | $10.90 | | | | $10.53 | | | | $9.67 | | | | $10.14 | |
| | | | | |
Total Return2,3 | | | 0.13 | % | | | 5.73 | % | | | 11.71 | % | | | (2.42 | )% | | | 0.98 | % |
| | | | | |
Ratio of net expenses to average net assets | | | 0.48 | % | | | 0.48 | % | | | 0.48 | % | | | 0.48 | % | | | 0.48 | % |
| | | | | |
Ratio of gross expenses to average net assets4 | | | 0.54 | % | | | 0.56 | % | | | 0.55 | % | | | 0.53 | % | | | 0.53 | % |
| | | | | |
Ratio of net investment income to average net assets2 | | | 1.52 | % | | | 2.09 | % | | | 2.50 | % | | | 2.28 | % | | | 2.15 | % |
| | | | | |
Portfolio turnover | | | 62 | % | | | 56 | % | | | 48 | % | | | 17 | % | | | 18 | % |
| | | | | |
Net assets end of year (000’s) omitted | | | $3,724 | | | | $3,812 | | | | $3,208 | | | | $5,005 | | | | $5,590 | |
| | | | | | | | | | | | | | | | | | | | | |
| 1 | Per share numbers have been calculated using average shares. |
| 2 | Total returns and net investment income would have been lower had certain expenses not been offset. |
| 3 | The total return is calculated using the published Net Asset Value as of fiscal year end. |
| 4 | Excludes the impact of expense reimbursement or fee waivers and expense reductions such as brokerage credits, but includes expense repayments and non-reimbursable expenses, if any, such as interest, taxes, and extraordinary expenses. (See Note 1(c) and 2 in the Notes to Financial Statements.) |
38
|
AMG GW&K Emerging Markets Equity Fund Financial Highlights For a share outstanding throughout each fiscal year |
| | | | | | | | | | | | | | | | | | | | |
| | | For the fiscal years ended October 31, | |
| | | | | |
| Class N | | 2021 | | | 2020 | | | 2019 | | | 2018 | | | 2017 | |
| | | | | |
Net Asset Value, Beginning of Year | | | $9.73 | | | | $9.52 | | | | $8.61 | | | | $10.11 | | | | $7.91 | |
| | | | | |
Income (loss) from Investment Operations: | | | | | | | | | | | | | | | | | | | | |
| | | | | |
Net investment income1,2 | | | 0.02 | | | | 0.01 | | | | 0.14 | | | | 0.11 | | | | 0.09 | |
| | | | | |
Net realized and unrealized gain (loss) on investments | | | 0.96 | | | | 0.70 | | | | 1.04 | | | | (1.54 | ) | | | 2.18 | |
| | | | | |
Total income (loss) from investment operations | | | 0.98 | | | | 0.71 | | | | 1.18 | | | | (1.43 | ) | | | 2.27 | |
| | | | | |
Less Distributions to Shareholders from: | | | | | | | | | | | | | | | | | | | | |
| | | | | |
Net investment income | | | (0.07 | ) | | | (0.06 | ) | | | (0.17 | ) | | | (0.07 | ) | | | (0.07 | ) |
| | | | | |
Net realized gain on investments | | | (0.34 | ) | | | (0.44 | ) | | | (0.10 | ) | | | – | | | | – | |
| | | | | |
Total distributions to shareholders | | | (0.41 | ) | | | (0.50 | ) | | | (0.27 | ) | | | (0.07 | ) | | | (0.07 | ) |
| | | | | |
Net Asset Value, End of Year | | | $10.30 | | | | $9.73 | | | | $9.52 | | | | $8.61 | | | | $10.11 | |
| | | | | |
Total Return2,3 | | | 9.85 | % | | | 7.55 | % | | | 13.94 | % | | | (14.24 | )% | | | 28.97 | % |
| | | | | |
Ratio of net expenses to average net assets | | | 1.27 | %4 | | | 1.34 | % | | | 1.30 | % | | | 1.27 | % | | | 1.31 | % |
| | | | | |
Ratio of gross expenses to average net assets5 | | | 1.37 | %4 | | | 1.52 | % | | | 1.30 | % | | | 1.27 | % | | | 1.31 | % |
| | | | | |
Ratio of net investment income to average net assets2 | | | 0.20 | % | | | 0.13 | % | | | 1.52 | % | | | 1.12 | % | | | 1.08 | % |
| | | | | |
Portfolio turnover | | | 36 | % | | | 40 | % | | | 123 | % | | | 24 | % | | | 29 | % |
| | | | | |
Net assets end of year (000’s) omitted | | | $414 | | | | $412 | | | | $520 | | | | $289 | | | | $350 | |
| | | | | | | | | | | | | | | | | | | | | |
39
|
AMG GW&K Emerging Markets Equity Fund Financial Highlights For a share outstanding throughout each fiscal year |
| | | | | | | | | | | | | | | | | | | | |
| | | For the fiscal years ended October 31, | |
| | | | | |
| Class I | | 2021 | | | 2020 | | | 2019 | | | 2018 | | | 2017 | |
| | | | | |
Net Asset Value, Beginning of Year | | | $9.69 | | | | $9.48 | | | | $8.60 | | | | $10.11 | | | | $7.90 | |
| | | | | |
Income (loss) from Investment Operations: | | | | | | | | | | | | | | | | | | | | |
| | | | | |
Net investment income1,2 | | | 0.06 | | | | 0.04 | | | | 0.17 | | | | 0.13 | | | | 0.12 | |
| | | | | |
Net realized and unrealized gain (loss) on investments | | | 0.95 | | | | 0.69 | | | | 1.04 | | | | (1.53 | ) | | | 2.18 | |
| | | | | |
Total income (loss) from investment operations | | | 1.01 | | | | 0.73 | | | | 1.21 | | | | (1.40 | ) | | | 2.30 | |
| | | | | |
Less Distributions to Shareholders from: | | | | | | | | | | | | | | | | | | | | |
| | | | | |
Net investment income | | | (0.15 | ) | | | (0.08 | ) | | | (0.23 | ) | | | (0.11 | ) | | | (0.09 | ) |
| | | | | |
Net realized gain on investments | | | (0.34 | ) | | | (0.44 | ) | | | (0.10 | ) | | | – | | | | – | |
| | | | | |
Total distributions to shareholders | | | (0.49 | ) | | | (0.52 | ) | | | (0.33 | ) | | | (0.11 | ) | | | (0.09 | ) |
| | | | | |
Net Asset Value, End of Year | | | $10.21 | | | | $9.69 | | | | $9.48 | | | | $8.60 | | | | $10.11 | |
| | | | | |
Total Return2,3 | | | 10.13 | % | | | 7.91 | % | | | 14.34 | % | | | (13.94 | )% | | | 29.34 | % |
| | | | | |
Ratio of net expenses to average net assets | | | 0.95 | %4 | | | 1.01 | % | | | 0.97 | % | | | 0.99 | % | | | 1.03 | % |
| | | | | |
Ratio of gross expenses to average net assets5 | | | 1.05 | %4 | | | 1.19 | % | | | 0.97 | % | | | 0.99 | % | | | 1.03 | % |
| | | | | |
Ratio of net investment income to average net assets2 | | | 0.52 | % | | | 0.47 | % | | | 1.85 | % | | | 1.40 | % | | | 1.36 | % |
| | | | | |
Portfolio turnover | | | 36 | % | | | 40 | % | | | 123 | % | | | 24 | % | | | 29 | % |
| | | | | |
Net assets end of year (000’s) omitted | | | $24,571 | | | | $19,251 | | | | $24,100 | | | | $11,210 | | | | $2,207 | |
| | | | | | | | | | | | | | | | | | | | | |
40
|
AMG GW&K Emerging Markets Equity Fund Financial Highlights For a share outstanding throughout each fiscal year |
| | | | | | | | | | | | | | | | | | | | |
| | | For the fiscal years ended October 31, | |
| | | | | |
| Class Z | | 2021 | | | 2020 | | | 2019 | | | 2018 | | | 2017 | |
| | | | | |
Net Asset Value, Beginning of Year | | | $9.64 | | | | $9.43 | | | | $8.56 | | | | $10.06 | | | | $7.86 | |
| | | | | |
Income (loss) from Investment Operations: | | | | | | | | | | | | | | | | | | | | |
| | | | | |
Net investment income1,2 | | | 0.07 | | | | 0.05 | | | | 0.18 | | | | 0.15 | | | | 0.13 | |
| | | | | |
Net realized and unrealized gain (loss) on investments | | | 0.93 | | | | 0.69 | | | | 1.02 | | | | (1.53 | ) | | | 2.16 | |
| | | | | |
Total income (loss) from investment operations | | | 1.00 | | | | 0.74 | | | | 1.20 | | | | (1.38 | ) | | | 2.29 | |
| | | | | |
Less Distributions to Shareholders from: | | | | | | | | | | | | | | | | | | | | |
| | | | | |
Net investment income | | | (0.15 | ) | | | (0.09 | ) | | | (0.23 | ) | | | (0.12 | ) | | | (0.09 | ) |
| | | | | |
Net realized gain on investments | | | (0.34 | ) | | | (0.44 | ) | | | (0.10 | ) | | | – | | | | – | |
| | | | | |
Total distributions to shareholders | | | (0.49 | ) | | | (0.53 | ) | | | (0.33 | ) | | | (0.12 | ) | | | (0.09 | ) |
| | | | | |
Net Asset Value, End of Year | | | $10.15 | | | | $9.64 | | | | $9.43 | | | | $8.56 | | | | $10.06 | |
| | | | | |
Total Return2,3 | | | 10.15 | % | | | 8.01 | % | | | 14.39 | % | | | (13.88 | )% | | | 29.62 | % |
| | | | | |
Ratio of net expenses to average net assets | | | 0.87 | %4 | | | 0.94 | % | | | 0.90 | % | | | 0.87 | % | | | 0.88 | % |
| | | | | |
Ratio of gross expenses to average net assets5 | | | 0.97 | %4 | | | 1.12 | % | | | 0.90 | % | | | 0.87 | % | | | 0.88 | % |
| | | | | |
Ratio of net investment income to average net assets2 | | | 0.60 | % | | | 0.53 | % | | | 1.92 | % | | | 1.52 | % | | | 1.51 | % |
| | | | | |
Portfolio turnover | | | 36 | % | | | 40 | % | | | 123 | % | | | 24 | % | | | 29 | % |
| | | | | |
Net assets end of year (000’s) omitted | | | $33,648 | | | | $24,191 | | | | $31,727 | | | | $133,688 | | | | $130,828 | |
| | | | | | | | | | | | | | | | | | | | | |
| 1 | Per share numbers have been calculated using average shares. |
| 2 | Total returns and net investment income would have been lower had certain expenses not been offset. |
| 3 | The total return is calculated using the published Net Asset Value as of fiscal year end. |
| 4 | Such ratio includes recapture of waived/reimbursed fees from prior periods amounting to 0.01% for the fiscal year ended October 31, 2021. |
| 5 | Excludes the impact of expense reimbursement or fee waivers and expense reductions such as brokerage credits, but includes expense repayments and non-reimbursable expenses, if any, such as interest, taxes, and extraordinary expenses. (See Note 1(c) and 2 in the Notes to Financial Statements.) |
41
|
AMG GW&K Emerging Wealth Equity Fund Financial Highlights For a share outstanding throughout each fiscal year |
| | | | | | | | | | | | | | | | | | | | |
| | | For the fiscal years ended October 31, | |
| | | | | |
| Class N | | 2021 | | | 2020 | | | 2019 | | | 2018 | | | 2017 | |
| | | | | |
Net Asset Value, Beginning of Year | | | $13.28 | | | | $11.93 | | | | $10.38 | | | | $12.94 | | | | $10.13 | |
| | | | | |
Income (loss) from Investment Operations: | | | | | | | | | | | | | | | | | | | | |
| | | | | |
Net investment income (loss)1,2 | | | (0.09 | ) | | | (0.04 | ) | | | 0.10 | | | | 0.06 | | | | 0.05 | |
| | | | | |
Net realized and unrealized gain (loss) on investments | | | 0.22 | | | | 1.72 | | | | 1.95 | | | | (1.88 | ) | | | 2.80 | |
| | | | | |
Total income (loss) from investment operations | | | 0.13 | | | | 1.68 | | | | 2.05 | | | | (1.82 | ) | | | 2.85 | |
| | | | | |
Less Distributions to Shareholders from: | | | | | | | | | | | | | | | | | | | | |
| | | | | |
Net investment income | | | – | | | | (0.06 | ) | | | (0.06 | ) | | | (0.05 | ) | | | (0.04 | ) |
| | | | | |
Net realized gain on investments | | | – | | | | (0.27 | ) | | | (0.44 | ) | | | (0.69 | ) | | | – | |
| | | | | |
Total distributions to shareholders | | | – | | | | (0.33 | ) | | | (0.50 | ) | | | (0.74 | ) | | | (0.04 | ) |
| | | | | |
Net Asset Value, End of Year | | | $13.41 | | | | $13.28 | | | | $11.93 | | | | $10.38 | | | | $12.94 | |
| | | | | |
Total Return2,3 | | | 0.98 | % | | | 14.37 | % | | | 20.82 | % | | | (15.16 | )% | | | 28.31 | % |
| | | | | |
Ratio of net expenses to average net assets | | | 1.22 | % | | | 1.26 | % | | | 1.37 | %4 | | | 1.45 | %4,5 | | | 1.45 | %4,5 |
| | | | | |
Ratio of gross expenses to average net assets6 | | | 1.22 | % | | | 1.26 | % | | | 1.37 | %4 | | | 1.45 | %4 | | | 1.45 | %4 |
| | | | | |
Ratio of net investment income (loss) to average net assets2 | | | (0.59 | )% | | | (0.35 | )% | | | 0.93 | % | | | 0.49 | % | | | 0.45 | % |
| | | | | |
Portfolio turnover | | | 57 | % | | | 37 | % | | | 40 | % | | | 37 | % | | | 68 | % |
| | | | | |
Net assets end of year (000’s) omitted | | | $967 | | | | $1,716 | | | | $2,007 | | | | $1,940 | | | | $10 | |
| | | | | | | | | | | | | | | | | | | | | |
42
|
AMG GW&K Emerging Wealth Equity Fund Financial Highlights For a share outstanding throughout each fiscal year |
| | | | | | | | | | | | | | | | | | | | |
| | | For the fiscal years ended October 31, | |
| | | | | |
| Class I | | 2021 | | | 2020 | | | 2019 | | | 2018 | | | 2017 | |
| | | | | |
Net Asset Value, Beginning of Year | | | $13.38 | | | | $12.03 | | | | $10.44 | | | | $12.96 | | | | $10.14 | |
| | | | | |
Income (loss) from Investment Operations: | | | | | | | | | | | | | | | | | | | | |
| | | | | |
Net investment income (loss)1,2 | | | (0.05 | ) | | | (0.01 | ) | | | 0.14 | | | | 0.09 | | | | 0.08 | |
| | | | | |
Net realized and unrealized gain (loss) on investments | | | 0.22 | | | | 1.73 | | | | 1.96 | | | | (1.88 | ) | | | 2.81 | |
| | | | | |
Total income (loss) from investment operations | | | 0.17 | | | | 1.72 | | | | 2.10 | | | | (1.79 | ) | | | 2.89 | |
| | | | | |
Less Distributions to Shareholders from: | | | | | | | | | | | | | | | | | | | | |
| | | | | |
Net investment income | | | – | | | | (0.10 | ) | | | (0.07 | ) | | | (0.04 | ) | | | (0.07 | ) |
| | | | | |
Net realized gain on investments | | | – | | | | (0.27 | ) | | | (0.44 | ) | | | (0.69 | ) | | | – | |
| | | | | |
Total distributions to shareholders | | | – | | | | (0.37 | ) | | | (0.51 | ) | | | (0.73 | ) | | | (0.07 | ) |
| | | | | |
Net Asset Value, End of Year | | | $13.55 | | | | $13.38 | | | | $12.03 | | | | $10.44 | | | | $12.96 | |
| | | | | |
Total Return2,3 | | | 1.27 | % | | | 14.63 | % | | | 21.15 | % | | | (14.89 | )% | | | 28.73 | % |
| | | | | |
Ratio of net expenses to average net assets | | | 0.93 | % | | | 0.97 | % | | | 1.08 | %4 | | | 1.19 | %4,5 | | | 1.12 | %4,5 |
| | | | | |
Ratio of gross expenses to average net assets6 | | | 0.93 | % | | | 0.97 | % | | | 1.08 | %4 | | | 1.19 | %4 | | | 1.16 | %4 |
| | | | | |
Ratio of net investment income (loss) to average net assets2 | | | (0.30 | )% | | | (0.06 | )% | | | 1.22 | % | | | 0.75 | % | | | 0.78 | % |
| | | | | |
Portfolio turnover | | | 57 | % | | | 37 | % | | | 40 | % | | | 37 | % | | | 68 | % |
| | | | | |
Net assets end of year (000’s) omitted | | | $41,453 | | | | $22,813 | | | | $6,328 | | | | $2,539 | | | | $1,646 | |
| | | | | | | | | | | | | | | | | | | | | |
43
|
AMG GW&K Emerging Wealth Equity Fund Financial Highlights For a share outstanding throughout each fiscal year |
| | | | | | | | | | | | | | | | | | | | |
| | | For the fiscal years ended October 31, | |
| | | | | |
| Class Z | | 2021 | | | 2020 | | | 2019 | | | 2018 | | | 2017 | |
| | | | | |
Net Asset Value, Beginning of Year | | | $13.34 | | | | $11.99 | | | | $10.41 | | | | $12.97 | | | | $10.15 | |
| | | | | |
Income (loss) from Investment Operations: | | | | | | | | | | | | | | | | | | | | |
| | | | | |
Net investment income (loss)1,2 | | | (0.03 | ) | | | 0.01 | | | | 0.15 | | | | 0.11 | | | | 0.10 | |
| | | | | |
Net realized and unrealized gain (loss) on investments | | | 0.21 | | | | 1.72 | | | | 1.96 | | | | (1.89 | ) | | | 2.80 | |
| | | | | |
Total income (loss) from investment operations | | | 0.18 | | | | 1.73 | | | | 2.11 | | | | (1.78 | ) | | | 2.90 | |
| | | | | |
Less Distributions to Shareholders from: | | | | | | | | | | | | | | | | | | | | |
| | | | | |
Net investment income | | | (0.00 | )7 | | | (0.11 | ) | | | (0.09 | ) | | | (0.09 | ) | | | (0.08 | ) |
| | | | | |
Net realized gain on investments | | | – | | | | (0.27 | ) | | | (0.44 | ) | | | (0.69 | ) | | | – | |
| | | | | |
Total distributions to shareholders | | | (0.00 | )7 | | | (0.38 | ) | | | (0.53 | ) | | | (0.78 | ) | | | (0.08 | ) |
| | | | | |
Net Asset Value, End of Year | | | $13.52 | | | | $13.34 | | | | $11.99 | | | | $10.41 | | | | $12.97 | |
| | | | | |
Total Return2,3 | | | 1.37 | % | | | 14.75 | % | | | 21.34 | % | | | (14.87 | )% | | | 28.86 | % |
| | | | | |
Ratio of net expenses to average net assets | | | 0.82 | % | | | 0.86 | % | | | 0.97 | %4 | | | 1.05 | %4,5 | | | 1.05 | %4,5 |
| | | | | |
Ratio of gross expenses to average net assets6 | | | 0.82 | % | | | 0.86 | % | | | 0.97 | %4 | | | 1.05 | %4 | | | 1.05 | %4 |
| | | | | |
Ratio of net investment income (loss) to average net assets2 | | | (0.19 | )% | | | 0.05 | % | | | 1.33 | % | | | 0.89 | % | | | 0.85 | % |
| | | | | |
Portfolio turnover | | | 57 | % | | | 37 | % | | | 40 | % | | | 37 | % | | | 68 | % |
| | | | | |
Net assets end of year (000’s) omitted | | | $183,290 | | | | $185,755 | | | | $105,069 | | | | $60,443 | | | | $59,500 | |
| | | | | | | | | | | | | | | | | | | | | |
| 1 | Per share numbers have been calculated using average shares. |
| 2 | Total returns and net investment income (loss) would have been lower had certain expenses not been offset. |
| 3 | The total return is calculated using the published Net Asset Value as of fiscal year end. |
| 4 | Such ratio includes recapture of waived/reimbursed fees from prior periods amounting to 0.02%, 0.07% and 0.04% for the fiscal years ended October 31, 2019, 2018 and 2017, respectively. |
| 5 | Includes reduction from broker recapture amounting to less than 0.01%. |
| 6 | Excludes the impact of expense reimbursement or fee waivers and expense reductions such as brokerage credits, but includes expense repayments and non-reimbursable expenses, if any, such as interest, taxes, and extraordinary expenses. (See Note 1(c) and 2 in the Notes to Financial Statements.) |
| 7 | Less than $(0.005) per share. |
44
|
AMG GW&K Small/Mid Cap Growth Fund Financial Highlights For a share outstanding throughout each fiscal year |
| | | | | | | | | | | | | | | | | | | | |
| | | For the fiscal years ended October 31, | |
| | | | | |
| Class N | | 2021 | | | 2020 | | | 2019 | | | 2018 | | | 2017 | |
| | | | | |
Net Asset Value, Beginning of Year | | | $21.14 | | | | $17.02 | | | | $16.90 | | | | $15.30 | | | | $12.19 | |
| | | | | |
Income (loss) from Investment Operations: | | | | | | | | | | | | | | | | | | | | |
| | | | | |
Net investment loss1,2 | | | (0.17 | ) | | | (0.17 | ) | | | (0.08 | ) | | | (0.12 | ) | | | (0.09 | )3 |
| | | | | |
Net realized and unrealized gain on investments | | | 7.74 | | | | 4.29 | | | | 0.20 | | | | 1.72 | | | | 3.20 | |
| | | | | |
Total income from investment operations | | | 7.57 | | | | 4.12 | | | | 0.12 | | | | 1.60 | | | | 3.11 | |
| | | | | |
Less Distributions to Shareholders from: | | | | | | | | | | | | | | | | | | | | |
| | | | | |
Net realized gain on investments | | | (10.55 | ) | | | – | | | | – | | | | – | | | | – | |
| | | | | |
Paid in capital | | | (0.49 | ) | | | – | | | | – | | | | – | | | | – | |
| | | | | |
Total distributions to shareholders | | | (11.04 | ) | | | – | | | | – | | | | – | | | | – | |
| | | | | |
Net Asset Value, End of Year | | | $17.67 | | | | $21.14 | | | | $17.02 | | | | $16.90 | | | | $15.30 | |
| | | | | |
Total Return2,4 | | | 46.66 | % | | | 24.27 | % | | | 0.71 | % | | | 10.46 | % | | | 25.51 | % |
| | | | | |
Ratio of net expenses to average net assets5 | | | 1.17 | % | | | 1.29 | %6 | | | 1.30 | % | | | 1.31 | % | | | 1.23 | % |
| | | | | |
Ratio of gross expenses to average net assets7 | | | 1.42 | % | | | 1.60 | % | | | 1.47 | % | | | 1.43 | % | | | 1.36 | % |
| | | | | |
Ratio of net investment loss to average net assets2 | | | (0.91 | )% | | | (0.92 | )% | | | (0.48 | )% | | | (0.73 | )% | | | (0.65 | )% |
| | | | | |
Portfolio turnover | | | 158 | % | | | 126 | % | | | 138 | % | | | 161 | % | | | 151 | % |
| | | | | |
Net assets end of year (000’s) omitted | | | $37,471 | | | | $28,908 | | | | $30,717 | | | | $37,232 | | | | $45,902 | |
| | | | | | | | | | | | | | | | | | | | | |
45
|
AMG GW&K Small/Mid Cap Growth Fund Financial Highlights For a share outstanding throughout each fiscal year |
| | | | | | | | | | | | | | | | | | | | |
| | | For the fiscal years ended October 31, | |
| | | | | |
| Class I | | 2021 | | | 2020 | | | 2019 | | | 2018 | | | 2017 | |
| | | | | |
Net Asset Value, Beginning of Year | | | $21.60 | | | | $17.35 | | | | $17.20 | | | | $15.54 | | | | $12.36 | |
| | | | | |
Income (loss) from Investment Operations: | | | | | | | | | | | | | | | | | | | | |
| | | | | |
Net investment loss1,2 | | | (0.15 | ) | | | (0.14 | ) | | | (0.05 | ) | | | (0.09 | ) | | | (0.07 | )3 |
| | | | | |
Net realized and unrealized gain on investments | | | 7.98 | | | | 4.39 | | | | 0.20 | | | | 1.75 | | | | 3.25 | |
| | | | | |
Total income from investment operations | | | 7.83 | | | | 4.25 | | | | 0.15 | | | | 1.66 | | | | 3.18 | |
| | | | | |
Less Distributions to Shareholders from: | | | | | | | | | | | | | | | | | | | | |
| | | | | |
Net realized gain on investments | | | (10.55 | ) | | | – | | | | – | | | | – | | | | – | |
| | | | | |
Paid in capital | | | (0.49 | ) | | | – | | | | – | | | | – | | | | – | |
| | | | | |
Total distributions to shareholders | | | (11.04 | ) | | | – | | | | – | | | | – | | | | – | |
| | | | | |
Net Asset Value, End of Year | | | $18.39 | | | | $21.60 | | | | $17.35 | | | | $17.20 | | | | $15.54 | |
| | | | | |
Total Return2,4 | | | 46.94 | % | | | 24.48 | % | | | 0.93 | % | | | 10.68 | % | | | 25.73 | % |
| | | | | |
Ratio of net expenses to average net assets5 | | | 1.02 | % | | | 1.10 | %6 | | | 1.10 | % | | | 1.10 | % | | | 1.05 | % |
| | | | | |
Ratio of gross expenses to average net assets7 | | | 1.27 | % | | | 1.41 | % | | | 1.27 | % | | | 1.22 | % | | | 1.18 | % |
| | | | | |
Ratio of net investment loss to average net assets2 | | | (0.76 | )% | | | (0.73 | )% | | | (0.28 | )% | | | (0.52 | )% | | | (0.47 | )% |
| | | | | |
Portfolio turnover | | | 158 | % | | | 126 | % | | | 138 | % | | | 161 | % | | | 151 | % |
| | | | | |
Net assets end of year (000’s) omitted | | | $6,612 | | | | $6,483 | | | | $14,608 | | | | $65,802 | | | | $79,652 | |
| | | | | | | | | | | | | | | | | | | | | |
46
|
AMG GW&K Small/Mid Cap Growth Fund Financial Highlights For a share outstanding throughout each fiscal period |
| | | | |
| |
| Class Z | | For the fiscal
period ended
October 31,20218 | |
| |
Net Asset Value, Beginning of Period | | | $17.84 | |
| |
Income (loss) from Investment Operations: | | | | |
| |
Net investment loss1,2 | | | (0.01 | ) |
| |
Net realized and unrealized gain on investments | | | 0.56 | |
| |
Total income from investment operations | | | 0.55 | |
| |
Net Asset Value, End of Period | | | $18.39 | |
| |
Total Return2,4 | | | 3.08 | %9 |
| |
Ratio of net expenses to average net assets10 | | | 0.82 | %11 |
| |
Ratio of gross expenses to average net assets7 | | | 1.13 | %11 |
| |
Ratio of net investment loss to average net assets2 | | | (0.49 | )%11 |
| |
Portfolio turnover | | | 158 | % |
| |
Net assets end of period (000’s) omitted | | | $15 | |
| | | | | |
| 1 | Per share numbers have been calculated using average shares. |
| 2 | Total returns and net investment loss would have been lower had certain expenses not been offset. |
| 3 | Includes non-recurring dividends. Without these dividends, net investment loss per share would have been $(0.11) and $(0.09) for Class N and Class I shares, respectively. |
| 4 | The total return is calculated using the published Net Asset Value as of fiscal year end. |
| 5 | Includes reduction from broker recapture amounting to less than 0.01%, 0.01%, less than 0.01%, 0.01% and 0.01% for the fiscal years ended 2021, 2020, 2019, 2018 and 2017, respectively. |
| 6 | Includes interest expense of 0.01%. |
| 7 | Excludes the impact of expense reimbursement or fee waivers and expense reductions such as brokerage credits, but includes expense repayments and non-reimbursable expenses, if any, such as interest, taxes, and extraordinary expenses. (See Note 1(c) and 2 in the Notes to Financial Statements.) |
| 8 | Commencement of operations was on August 31, 2021. |
| 10 | Includes reduction from broker recapture amounting to less than 0.01% for the fiscal period ended October 31, 2021. |
47
|
Notes to Financial Statements October 31, 2021 |
1. ORGANIZATION AND SUMMARY OF SIGNIFICANT ACCOUNTING POLICIES
AMG Funds, AMG Funds I and AMG Funds IV (the “Trusts”) are open-end management investment companies. AMG Funds and AMG Funds I are organized as Massachusetts business trusts, while AMG Funds IV is organized as a Delaware Statutory Trust. The Trusts are registered under the Investment Company Act of 1940, as amended (the “1940 Act”). Currently, the Trusts consist of a number of different funds, each having distinct investment management objectives, strategies, risks, and policies. Included in this report are AMG Funds I: AMG GW&K Core Bond ESG Fund (“Core Bond ESG”), AMG Funds: AMG GW&K Emerging Markets Equity Fund (“Emerging Markets Equity”) and AMG GW&K Emerging Wealth Equity Fund (“Emerging Wealth Equity”) and AMG Funds IV: AMG GW&K Small/Mid Cap Growth Fund (“Small/Mid Cap Growth”) (formerly AMG GW&K Small Cap Fund II, which was formerly AMG Managers LMCG Small Cap Growth Fund), each a “Fund” and collectively, the “Funds”.
Each Fund offers different classes of shares. Core Bond ESG, Emerging Markets Equity and Emerging Wealth Equity offer Class N, Class I and Class Z shares. Small/Mid Cap Growth offers Class N and Class I shares, and, effective August 31, 2021, commenced offering Class Z shares. Each class represents an interest in the same assets of the respective Fund. Although all share classes generally have identical voting rights, each share class votes separately when required by law. Different share classes may have different net asset values per share to the extent the share classes pay different distribution amounts and/or the expenses of such share classes differ. Each share class has its own expense structure. Please refer to a current prospectus for additional information on each share class.
On March 17-18, 2021, the Board of Trustees of AMG Funds IV (together with the Board of Trustees of AMG Funds and AMG Funds I, the “Board”) approved GW&K Investment Management, LLC (“GW&K”) as the subadviser to Small/Mid Cap Growth on an interim basis to replace LMCG Investments, LLC (“LMCG”), effective March 19, 2021, which was subsequently approved by the shareholders of Small/Mid Cap Growth on June 18, 2021. In conjunction with the subadviser change, Small/Mid Cap Growth seeks to achieve its investment objective by investing securities of small- and mid-capitalization companies. In conjunction with the changes in investment strategy for Small/Mid Cap Growth, Small/Mid Cap Growth sold substantially all open positions around the date of the subadviser change that increased Small/Mid Cap Growth’s portfolio turnover. Small/Mid Cap Growth also declared a special capital gain distribution on March 24, 2021.
Market disruptions associated with the COVID-19 pandemic have had a global impact, and uncertainty exists as to the long-term implications. Such disruptions can adversely affect assets of the Funds and thus Fund performance.
Certain instruments held by a Fund may pay an interest rate based on the London Interbank Offered Rate (“LIBOR”), which is the offered rate for short-term loans between certain major international banks. LIBOR is expected to be phased out by the end of 2021. While the effect of the phase out cannot yet be determined, it may result in, among other things, increased volatility or illiquidity in markets for instruments based on LIBOR and changes in the value of some LIBOR-based investments or the effectiveness of new hedges placed against existing LIBOR-based investments. These effects could occur prior to the end of 2021. There also remains uncertainty and risk regarding the willingness and ability of issuers to include enhanced provisions in new and existing contracts or instruments. All of the aforementioned may adversely affect a Fund’s performance or net asset value.
The Funds’ financial statements are prepared in accordance with accounting principles generally accepted in the United States of America (“U.S. GAAP”),
including accounting and reporting guidance pursuant to Accounting Standards Codification Topic 946 applicable to investment companies. U.S. GAAP requires management to make estimates and assumptions that affect the reported amounts of assets and liabilities and disclosure of contingent assets and liabilities at the date of the financial statements and the reported amounts of income and expenses during the reporting period. Actual results could differ from those estimates and such differences could be material. The following is a summary of significant accounting policies followed by the Funds in the preparation of their financial statements:
a. VALUATION OF INVESTMENTS
For the Funds, equity securities traded on a national securities exchange or reported on the NASDAQ national market system (“NMS”) are valued at the last quoted sales price on the primary exchange or, if applicable, the NASDAQ official closing price or the official closing price of the relevant exchange or, lacking any sales, at the last quoted bid price for Emerging Markets Equity, Emerging Wealth Equity and Small/Mid Cap Growth, or the mean between the last quoted bid and ask prices (the “mean price”) for Core Bond ESG. Equity securities held by the Funds that are traded in the over-the-counter market (other than NMS securities) are valued at the mean price. Foreign equity securities (securities principally traded in markets other than U.S. markets) held by the Funds are valued at the official closing price on the primary exchange or, for markets that either do not offer an official closing price or where the official closing price may not be representative of the overall market, the last quoted sale price. Effective October 1, 2021, equity securities lacking any sales in Core Bond ESG are valued at the last quoted bid price and equity securities traded in the over-the-counter market (other than NMS securities) in each Fund are valued at the bid price. As of October 1, 2021, there was no impact to the Funds due to the changes in valuation policy.
Fixed income securities purchased with a remaining maturity exceeding 60 days are valued at the evaluated mean price provided by an authorized pricing service or, if an evaluated price is not available, by reference to other securities which are considered comparable in credit rating, interest rate, due date and other features (generally referred to as “matrix pricing”) or other similar pricing methodologies. Effective October 1, 2021, fixed income securities purchased with a remaining maturity exceeding 60 days are valued at the evaluated bid price provided by an authorized pricing service. As of October 1, 2021, the impact of the change in valuation policy to Core Bond ESG was $182,653 of change in unrealized appreciation/deprecation, which equates to 0.01 Net Asset Value per share.
Fixed income securities purchased with a remaining maturity of 60 days or less are valued at amortized cost, provided that the amortized cost value is approximately the same as the fair value of the security valued without the use of amortized cost. Investments in other open-end registered investment companies are valued at their end of day net asset value per share.
The Funds’ portfolio investments are generally valued based on independent market quotations or prices or, if none, “evaluative” or other market based valuations provided by third party pricing services approved by the Board. Under certain circumstances, the value of certain Fund portfolio investments may be based on an evaluation of fair value, pursuant to procedures established by and under the general supervision of the Board. The Valuation Committee, which is comprised of the Independent Trustees of the Board, and the Pricing Committee, which is comprised of representatives from AMG Funds LLC (the “Investment Manager”) are the committees appointed by the Board to make fair value determinations. Each Fund may use the fair value of a portfolio investment to
48
|
Notes to Financial Statements (continued) |
calculate its net asset value (“NAV”) in the event that the market quotation, price or market based valuation for the portfolio investment is not readily available or otherwise not determinable pursuant to the Board’s valuation procedures, if the Investment Manager or the Pricing Committee believes the quotation, price or market based valuation to be unreliable, or in certain other circumstances. When determining the fair value of an investment, the Pricing Committee and, if required under the Trusts’ securities valuation procedures, the Valuation Committee, seeks to determine the price that the Fund might reasonably expect to receive from current sale of that portfolio investment in an arms-length transaction. Fair value determinations shall be based upon consideration of all available facts and information, including, but not limited to (i) attributes specific to the investment; (ii) fundamental and analytical data relating to the investment; and (iii) the value of other comparable securities or relevant financial instruments, including derivative securities, traded on other markets or among dealers.
The values assigned to fair value portfolio investments are based on available information and do not necessarily represent amounts that might ultimately be realized in the future, since such amounts depend on future developments inherent in long-term investments. Because of the inherent uncertainty of valuation, those estimated values may differ significantly from the values that would have been used had a ready market for the investments existed, and the differences could be material. The Board will be presented with a quarterly report showing as of the most recent quarter end, all outstanding securities fair valued by the Funds, including a comparison with the prior quarter end and the percentage of the Funds that the security represents at each quarter end.
With respect to foreign equity securities and certain foreign fixed income securities, the Board has adopted a policy that securities held in the Funds that can be fair valued by the applicable fair value pricing service are fair valued on each business day provided that each individual price exceeds a pre-established confidence level.
U.S. GAAP defines fair value as the price that a fund would receive to sell an asset or pay to transfer a liability in an orderly transaction between market participants at the measurement date. U.S. GAAP also establishes a framework for measuring fair value, and a three level hierarchy for fair value measurements based upon the transparency of inputs to the valuation of an asset or liability. Inputs may be observable or unobservable and refer broadly to the assumptions that market participants would use in pricing the asset or liability. Observable inputs reflect the assumptions market participants would use in pricing the asset or liability based on market data obtained from sources independent of the Funds. Unobservable inputs reflect the Funds’ own assumptions about the assumptions that market participants would use in pricing the asset or liability developed based on the best information available in the circumstances. Each investment is assigned a level based upon the observability of the inputs which are significant to the overall valuation.
The three-tier hierarchy of inputs is summarized below:
Level 1 – inputs are quoted prices in active markets for identical investments (e.g., equity securities, open-end investment companies)
Level 2 – other observable inputs (including, but not limited to: quoted prices for similar assets or liabilities in markets that are active, quoted prices for identical or similar assets or liabilities in markets that are not active, inputs other than quoted prices that are observable for the assets or liabilities (such as interest rates, yield curves, volatilities, prepayment speeds, loss severities, credit risks and default rates) or other market corroborated inputs) (e.g., debt securities, government
securities, foreign currency exchange contracts, swaps, foreign securities utilizing international fair value pricing, fair valued securities with observable inputs)
Level 3 – inputs are significant unobservable inputs (including the Fund’s own assumptions used to determine the fair value of investments) (e.g., fair valued securities with unobservable inputs)
Changes in inputs or methodologies used for valuing investments may result in a transfer in or out of levels within the fair value hierarchy. The inputs or methodologies used for valuing investments may not necessarily be an indication of the risk associated with investing in those investments.
b. SECURITY TRANSACTIONS
Security transactions are accounted for as of trade date. Realized gains and losses on securities sold are determined on the basis of identified cost.
c. INVESTMENT INCOME AND EXPENSES
Dividend income is recorded on the ex-dividend date. Dividends from foreign securities are recorded on the ex-dividend date, and if after the fact, as soon as the Funds become aware of the ex-dividend date, except for Korean securities where dividends are recorded on confirmation date. Interest income, which includes amortization of premium and accretion of discount on debt securities, is accrued as earned. Dividend and interest income on foreign securities is recorded gross of any withholding tax. Non-cash dividends included in dividend income, if any, are reported at the fair market value of the securities received. Other income and expenses are recorded on an accrual basis. Expenses that cannot be directly attributed to a Fund are apportioned among the funds in the Trusts and other trusts or funds within the AMG Funds Family of Funds (collectively the “AMG Funds Family”) based upon their relative average net assets or number of shareholders. Investment income, realized and unrealized capital gains and losses, the common expenses of each Fund, and certain fund level expense reductions, if any, are allocated on a pro-rata basis to each class based on the relative net assets of each class to the total net assets of each Fund.
Small/Mid Cap Growth had certain portfolio trades directed to various brokers under a brokerage recapture program. Credits received from the brokerage recapture program are earned and paid on a monthly basis, and are recorded as expense offsets, which serve to reduce the Fund’s overall expense ratio. For the fiscal year ended October 31, 2021, the impact on the expenses and expense ratios was $2,645 or less than 0.01%.
d. DIVIDENDS AND DISTRIBUTIONS
Fund distributions resulting from net investment income will normally be declared and paid monthly for Core Bond ESG and annually for Emerging Markets Equity, Emerging Wealth Equity and Small/Mid Cap Growth. Realized net capital gains distributions, if any, will normally be declared and paid at least annually in December. Distributions to shareholders are recorded on the ex-dividend date. Distributions are determined in accordance with federal income tax regulations, which may differ from net investment income and net realized capital gains for financial statement purposes (U.S. GAAP). Differences may be permanent or temporary. Permanent differences are reclassified among capital accounts in the financial statements to reflect their tax character. Permanent book and tax basis differences, if any, relating to shareholder distributions will result in reclassifications to paid-in capital. Temporary differences arise when certain items of income, expense and gain or loss are recognized in different periods for
49
|
Notes to Financial Statements (continued) |
financial statement and tax purposes; these differences will reverse at some time in the future. Permanent differences are primarily due to net operating losses. Temporary differences are primarily due to wash sale loss deferrals,
mark-to-market on passive foreign investment companies, and the deferral of qualified late year losses.
The tax character of distributions paid during the fiscal years ended October 31, 2021 and October 31, 2020 were as follows:
| | | | | | | | | | | | | | | | |
| | | Core Bond ESG | | | Emerging Markets Equity | |
| | | | |
| Distributions paid from: | | 2021 | | | 2020 | | | 2021 | | | 2020 | |
| | | | |
Ordinary income * | | | $2,869,291 | | | | $4,331,183 | | | | $711,110 | | | | $2,686,786 | |
| | | | |
Long-term capital gains | | | – | | | | – | | | | 1,625,205 | | | | – | |
| | | | | | | | | | | | | | | | |
| | | | |
| | | $2,869,291 | | | | $4,331,183 | | | | $2,336,315 | | | | $2,686,786 | |
| | | | | | | | | | | | | | | | |
| | |
| | | Emerging Wealth Equity | | | Small/Mid Cap Growth | |
| | | | |
| Distributions paid from: | | 2021 | | | 2020 | | | 2021 | | | 2020 | |
| | | | |
Ordinary income * | | | $35,159 | | | | $1,049,631 | | | | $9,053,185 | | | | – | |
| | | | |
Long-term capital gains | | | 262 | | | | 2,572,538 | | | | 8,422,676 | | | | – | |
| | | | |
Paid-in capital | | | – | | | | – | | | | 819,098 | | | | – | |
| | | | | | | | | | | | | | | | |
| | | | |
| | | $35,421 | | | | $3,622,169 | | | | $18,294,959 | | | | – | |
| | | | | | | | | | | | | | | | |
| * | For tax purposes, short-term capital gain distributions, if any, are considered ordinary income distributions. |
As of October 31, 2021, the components of distributable earnings (excluding unrealized appreciation/depreciation) on a tax basis consisted of:
| | | | | | | | | | | | | | | | |
| | | Core Bond ESG | | | Emerging Markets Equity | | | Emerging Wealth Equity | | | Small/Mid Cap Growth | |
| | | | |
Undistributed ordinary income | | | $478,093 | | | | $399,654 | | | | – | | | | – | |
Undistributed long-term capital gains | | | 4,019,861 | | | | 211,238 | | | | $2,341,935 | | | | – | |
Late-year loss deferral | | | – | | | | – | | | | 432,825 | | | | $312,728 | |
At October 31, 2021, the cost of investments and the aggregate gross unrealized appreciation and depreciation for federal income tax purposes were as follows:
| | | | | | | | | | | | | | | | |
| Fund | | Cost | | | Appreciation | | | Depreciation | | | Net Appreciation | |
| | | | |
Core Bond ESG | | | $182,910,597 | | | | $5,373,966 | | | | $(1,060,803 | ) | | | $4,313,163 | |
Emerging Markets Equity | | | 46,308,480 | | | | 14,591,299 | | | | (2,812,769 | ) | | | 11,778,530 | |
Emerging Wealth Equity | | | 195,604,187 | | | | 45,764,578 | | | | (18,166,729 | ) | | | 27,597,849 | |
Small/Mid Cap Growth | | | 37,043,331 | | | | 8,967,608 | | | | (1,880,720 | ) | | | 7,086,888 | |
e. FEDERAL TAXES
Each Fund currently qualifies as an investment company and intends to comply with the requirements under Subchapter M of the Internal Revenue Code of 1986, as amended, and to distribute substantially all of its taxable income and gains to its shareholders and to meet certain diversification and income requirements with respect to investment companies. Therefore, no provision for federal income or excise tax is included in the accompanying financial statements.
Additionally, based on each Fund’s understanding of the tax rules and rates related to income, gains and transactions for the foreign jurisdictions in which it invests, each Fund will provide for foreign taxes, and where appropriate, deferred foreign taxes.
Management has analyzed the Funds’ tax positions taken on federal income tax returns as of October 31, 2021, and for all open tax years (generally, the three prior taxable years), and has concluded that no provision for federal income tax is
required in the Funds’ financial statements. Additionally, Management is not aware of any tax position for which it is reasonably possible that the total amounts of unrecognized tax benefits will change materially in the next twelve months.
f. CAPITAL LOSS CARRYOVERS AND DEFERRALS
As of October 31, 2021, the Funds had no capital loss carryovers for federal income tax purposes. Should the Funds incur net capital losses for the fiscal year ended October 31, 2022, such amounts may be used to offset future realized capital gains indefinitely, and retain their character as short-term and/or long-term.
50
|
Notes to Financial Statements (continued) |
For the fiscal year ended October 31, 2021, the following Funds utilized capital loss carryovers in the amount of:
| | | | | | | | | | |
| | | Capital Loss Carryover Utilized |
| | |
| Fund | | Short-Term | | Long-Term |
| | |
Core Bond ESG | | | | $425,987 | | | | | – | |
| | |
Emerging Wealth Equity | | | | 911,098 | | | | | – | |
g. CAPITAL STOCK
The Trusts’ Declaration of Trust authorizes for each Fund the issuance of an unlimited number of shares of beneficial interest, without par value. Each Fund records sales and repurchases of its capital stock on the trade date.
For the fiscal years ended October 31, 2021 and October 31, 2020, the capital stock transactions by class for the Funds were as follows:
| | | | | | | | | | | | | | | | | | | | | | | | | | | | | | | | |
| | | | | | Core Bond ESG | | | | | | | | | Emerging Markets Equity | | | | |
| | | | |
| | | October 31, 2021 | | | October 31, 2020 | | | October 31, 2021 | | | October 31, 2020 | |
| | | | | | | | |
| | | Shares | | | Amount | | | Shares | | | Amount | | | Shares | | | Amount | | | Shares | | | Amount | |
| | | | | | | | |
Class N: | | | | | | | | | | | | | | | | | | | | | | | | | | | | | | | | |
| | | | | | | | |
Proceeds from sale of shares | | | 57,167 | | | | $617,603 | | | | 85,411 | | | | $920,846 | | | | 26,050 | | | | $301,090 | | | | 181,059 | | | | $1,744,337 | |
| | | | | | | | |
Reinvestment of distributions | | | 1,982 | | | | 21,505 | | | | 2,508 | | | | 26,975 | | | | 1,571 | | | | 17,233 | | | | 2,833 | | | | 26,891 | |
| | | | | | | | |
Cost of shares repurchased | | | (36,310 | ) | | | (394,283 | ) | | | (32,291 | ) | | | (348,057 | ) | | | (29,702 | ) | | | (340,566 | ) | | | (196,188 | ) | | | (1,558,530 | ) |
| | | | | | | | | | | | | | | | | | | | | | | | | | | | | | | | |
| | | | | | | | |
Net increase (decrease) | | | 22,839 | | | | $244,825 | | | | 55,628 | | | | $599,764 | | | | (2,081 | ) | | | $(22,243 | ) | | | (12,296 | ) | | | $212,698 | |
| | | | | | | | | | | | | | | | | | | | | | | | | | | | | | | | |
| | | | | | | | |
Class I: | | | | | | | | | | | | | | | | | | | | | | | | | | | | | | | | |
| | | | | | | | |
Proceeds from sale of shares | | | 1,732,406 | | | | $18,782,363 | | | | 1,374,556 | | | | $14,850,604 | | | | 635,502 | | | | $7,074,008 | | | | 1,230,745 | | | | $9,743,030 | |
| | | | | | | | |
Reinvestment of distributions | | | 244,961 | | | | 2,659,029 | | | | 374,177 | | | | 4,019,598 | | | | 35,661 | | | | 386,561 | | | | 52,112 | | | | 491,414 | |
| | | | | | | | |
Cost of shares repurchased | | | (2,843,986 | ) | | | (30,881,158 | ) | | | (3,385,772 | ) | | | (36,392,063 | ) | | | (251,494 | ) | | | (2,698,418 | ) | | | (1,837,609 | ) | | | (15,777,470 | ) |
| | | | | | | | | | | | | | | | | | | | | | | | | | | | | | | | |
| | | | | | | | |
Net increase (decrease) | | | (866,619 | ) | | | $(9,439,766 | ) | | | (1,637,039 | ) | | | $(17,521,861 | ) | | | 419,669 | | | | $4,762,151 | | | | (554,752 | ) | | | $(5,543,026 | ) |
| | | | | | | | | | | | | | | | | | | | | | | | | | | | | | | | |
| | | | | | | | |
Class Z: | | | | | | | | | | | | | | | | | | | | | | | | | | | | | | | | |
| | | | | | | | |
Proceeds from sale of shares | | | 58,501 | | | | $638,670 | | | | 82,098 | | | | $869,531 | | | | 762,904 | | | | $8,699,676 | | | | 231,629 | | | | $2,130,804 | |
| | | | | | | | |
Reinvestment of distributions | | | 5,343 | | | | 57,930 | | | | 7,172 | | | | 77,096 | | | | 115,827 | | | | 1,248,619 | | | | 128,421 | | | | 1,203,308 | |
| | | | | | | | |
Cost of shares repurchased | | | (67,164 | ) | | | (733,649 | ) | | | (44,147 | ) | | | (477,970 | ) | | | (75,374 | ) | | | (830,676 | ) | | | (1,213,641 | ) | | | (11,305,915 | ) |
| | | | | | | | | | | | | | | | | | | | | | | | | | | | | | | | |
| | | | | | | | |
Net increase (decrease) | | | (3,320 | ) | | | $(37,049 | ) | | | 45,123 | | | | $468,657 | | | | 803,357 | | | | $9,117,619 | | | | (853,591 | ) | | | $(7,971,803 | ) |
| | | | | | | | | | | | | | | | | | | | | | | | | | | | | | | | |
| | | | | | |
| | | | | | Emerging Wealth Equity | | | | | | | | | Small/Mid Cap Growth | | | | |
| | | | |
| | | October 31, 2021 | | | October 31, 2020 | | | October 31, 2021 | | | October 31, 2020 | |
| | | | | | | | |
| | | Shares | | | Amount | | | Shares | | | Amount | | | Shares | | | Amount | | | Shares | | | Amount | |
| | | | | | | | |
Class N: | | | | | | | | | | | | | | | | | | | | | | | | | | | | | | | | |
| | | | | | | | |
Proceeds from sale of shares | | | 8,974 | | | | $138,021 | | | | 24,646 | | | | $275,535 | | | | 91,217 | | | | $1,757,478 | | | | 36,920 | | | | $687,740 | |
| | | | | | | | |
Reinvestment of distributions | | | – | | | | – | | | | 4,548 | | | | 55,712 | | | | 972,672 | | | | 14,770,300 | | | | – | | | | – | |
| | | | | | | | |
Cost of shares repurchased | | | (66,077 | ) | | | (967,375 | ) | | | (68,095 | ) | | | (733,597 | ) | | | (311,010 | ) | | | (5,726,959 | ) | | | (473,941 | ) | | | (8,270,391 | ) |
| | | | | | | | | | | | | | | | | | | | | | | | | | | | | | | | |
| | | | | | | | |
Net increase (decrease) | | | (57,103 | ) | | | $(829,354 | ) | | | (38,901 | ) | | | $(402,350 | ) | | | 752,879 | | | | $10,800,819 | | | | (437,021 | ) | | | $(7,582,651 | ) |
| | | | | | | | | | | | | | | | | | | | | | | | | | | | | | | | |
51
|
Notes to Financial Statements (continued) |
| | | | | | | | | | | | | | | | | | | | | | | | | | | | | | | | |
| | | | | | |
| | | | | | Emerging Wealth Equity | | | | | | | | | Small/Mid Cap Growth | | | | |
| | | | |
| | | October 31, 2021 | | | October 31, 2020 | | | October 31, 2021 | | | October 31, 2020 | |
| | | | | | | | |
| | | Shares | | | Amount | | | Shares | | | Amount | | | Shares | | | Amount | | | Shares | | | Amount | |
| | | | | | | | |
Class I: | | | | | | | | | | | | | | | | | | | | | | | | | | | | | | | | |
| | | | | | | | |
Proceeds from sale of shares | | | 1,993,990 | | | | $30,549,706 | | | | 1,818,122 | | | | $21,632,228 | | | | 42,998 | | | | $900,118 | | | | 34,550 | | | | $621,155 | |
| | | | | | | | |
Reinvestment of distributions | | | – | | | | – | | | | 17,592 | | | | 216,555 | | | | 202,482 | | | | 3,199,629 | | | | – | | | | – | |
| | | | | | | | |
Cost of shares repurchased | | | (639,402 | ) | | | (9,207,782 | ) | | | (656,368 | ) | | | (7,085,572 | ) | | | (186,045 | ) | | | (3,412,645 | ) | | | (576,238 | ) | | | (10,222,921 | ) |
| | | | | | | | | | | | | | | | | | | | | | | | | | | | | | | | |
| | | | | | | | |
Net increase (decrease) | | | 1,354,588 | | | | $21,341,924 | | | | 1,179,346 | | | | $14,763,211 | | | | 59,435 | | | | $687,102 | | | | (541,688 | ) | | | $(9,601,766 | ) |
| | | | | | | | | | | | | | | | | | | | | | | | | | | | | | | | |
| | | | | | | | |
Class Z:1 | | | | | | | | | | | | | | | | | | | | | | | | | | | | | | | | |
| | | | | | | | |
Proceeds from sale of shares | | | 3,554,557 | | | | $54,731,525 | | | | 8,182,601 | | | | $98,216,854 | | | | 841 | | | | $15,000 | | | | – | | | | – | |
| | | | | | | | |
Reinvestment of distributions | | | 162 | | | | 2,470 | | | | 27,678 | | | | 339,331 | | | | – | | | | – | | | | – | | | | – | |
| | | | | | | | |
Cost of shares repurchased | | | (3,925,460 | ) | | | (57,082,834 | ) | | | (3,049,658 | ) | | | (33,692,378 | ) | | | – | | | | – | | | | – | | | | – | |
| | | | | | | | | | | | | | | | | | | | | | | | | | | | | | | | |
| | | | | | | | |
Net increase (decrease) | | | (370,741 | ) | | | $(2,348,839 | ) | | | 5,160,621 | | | | $64,863,807 | | | | 841 | | | | $15,000 | | | | – | | | | – | |
| | | | | | | | | | | | | | | | | | | | | | | | | | | | | | | | |
| 1 | Commencement of operations for Small/Mid Cap Growth was on August 31, 2021. |
At October 31, 2021, certain affiliated and unaffiliated shareholders of record individually or collectively held greater than 10% of the net assets of the Funds as follows: Emerging Markets Equity - one owns 39%. Transactions by this shareholder may have a material impact on the Fund.
h. REPURCHASE AGREEMENTS AND JOINT REPURCHASE AGREEMENTS
The Funds may enter into third-party repurchase agreements for temporary cash management purposes and third-party or bilateral joint repurchase agreements for reinvestment of cash collateral on securities lending transactions under the securities lending program offered by The Bank of New York Mellon (“BNYM”) (the “Program”) (collectively, “Repurchase Agreements”). The value of the underlying collateral, including accrued interest, must equal or exceed the value of the Repurchase Agreements during the term of the agreement. For joint repurchase agreements, the Funds participate on a pro rata basis with other clients of BNYM in its share of the underlying collateral under such joint repurchase agreements and in its share of proceeds from any repurchase or other disposition of the underlying collateral. The underlying collateral for all Repurchase Agreements is held in safekeeping by the Funds’ custodian or at the Federal Reserve Bank. If the seller defaults and the value of the collateral declines, or if bankruptcy proceedings commence with respect to the seller of the security, realization of the collateral by the Funds may be delayed or limited. Pursuant to the Program, the Funds are indemnified for such losses by BNYM on joint repurchase agreements.
At October 31, 2021, the market value of Repurchase Agreements outstanding for Emerging Markets Equity, Emerging Wealth Equity and Small/Mid Cap Growth were $2,015,149, $507,794 and $485,590, respectively.
i. FOREIGN CURRENCY TRANSLATION
The books and records of the Funds are maintained in U.S. dollars. The value of investments, assets and liabilities denominated in currencies other than U.S. dollars are translated into U.S. dollars based upon current foreign exchange rates. Purchases and sales of foreign investments, income and expenses are converted into U.S. dollars based on currency exchange rates prevailing on the respective dates of such transactions. Net realized and unrealized gain (loss) on foreign currency transactions represent: (1) foreign exchange gains and losses from the sale and holdings of foreign currencies; (2) gains and losses between trade date and settlement date on investment securities transactions and foreign currency
exchange contracts; and (3) gains and losses from the difference between amounts of interest and dividends recorded and the amounts actually received.
The Funds do not isolate the net realized and unrealized gain or loss resulting from changes in exchange rates from the fluctuations in market prices of securities held. Such fluctuations are included with the net realized and unrealized gain or loss on investments.
2. AGREEMENTS AND TRANSACTIONS WITH AFFILIATES
For each of the Funds, the Trusts have entered into an investment advisory agreement under which the Investment Manager, a subsidiary and the U.S. retail distribution arm of Affiliated Managers Group, Inc. (“AMG”), serves as investment manager to the Funds and is responsible for the Funds’ overall administration and operations. The Investment Manager selects one or more subadvisers for the Funds (subject to Board approval) and monitors each subadviser’s investment performance, security holdings and investment strategies. Each Fund’s investment portfolio is managed by GW&K, who serves pursuant to a subadvisory agreement with the Investment Manager. AMG indirectly owns a majority interest in GW&K. Prior to March 19, 2021, Small/Mid Cap Growth’s investment portfolio was managed by LMCG, who served pursuant to subadvisory agreements with the Investment Manager.
52
|
Notes to Financial Statements (continued) |
Investment management fees are paid directly by the Funds to the Investment Manager based on average daily net assets. For the fiscal year ended October 31, 2021, the Funds’ investment management fees were paid at the following annual rate of each Fund’s respective average daily net assets:
| | | | |
Core Bond ESG | | | 0.30 | % |
| |
Emerging Markets Equity | | | 0.55 | % |
Emerging Wealth Equity | | | 0.55 | % |
| |
Small/Mid Cap Growth1 | | | 0.62 | % |
| 1 | Prior to June 18, 2021, the investment management fees were 0.90%. |
The Investment Manager has contractually agreed, through at least March 1, 2022 for Core Bond ESG, Emerging Markets Equity, and Emerging Wealth Equity and March 1, 2023 for Small/Mid Cap Growth, to waive management fees and/or pay or reimburse fund expenses in order to limit total annual Fund operating expenses after fee waiver and expense reimbursements (exclusive of taxes, interest (including interest incurred in connection with bank and custody overdrafts and in connection with securities sold short), shareholder servicing fees, distribution and service (12b-1) fees, brokerage commissions and other transaction costs, dividends payable with respect to securities sold short, acquired fund fees and expenses and extraordinary expenses) of Core Bond ESG, Emerging Markets Equity, Emerging Wealth Equity and Small/Mid Cap Growth to 0.48%, 0.87%, 0.90% and 0.82%, respectively, of each Fund’s average daily net assets (this annual rate or such other annual rate that may be in effect from time to time, the “Expense Cap”), subject to later reimbursement by the Funds in certain circumstances. Prior to March 1, 2020, the total annual Fund operating expense limitation was 1.05% of Emerging Markets Equity’s average daily net assets. Prior to June 18 2021, the total annual Fund operating expense limitation was 1.03% of Small/Mid Cap Growth’s average daily net assets.
In general, for a period of up to 36 months after the date any amounts are paid, waived or reimbursed by the Investment Manager, the Investment Manager may recover such amounts from a Fund, provided that such repayment would not cause the Fund’s total annual operating expenses after fee waiver and expense reimbursements (exclusive of the items noted in the parenthetical above) to exceed either (i) the Expense Cap in effect at the time such amounts were paid, waived or reimbursed, or (ii) the Expense Cap in effect at the time of such repayment by the Fund.
The contractual expense limitation may only be terminated in the event the Investment Manager or a successor ceases to be the investment manager of a Fund or a successor fund, by mutual agreement between the Investment Manager and the Board, or in the event of a Fund’s liquidation unless the Fund is reorganized or is a party to a merger in which the surviving entity is successor to the accounting and performance information of a Fund.
At October 31, 2021, the Funds’ expiration of reimbursements subject to recoupment is as follows:
| | | | | | | | | | | | |
| Expiration | | | | | | | | | |
| Period | | Core Bond ESG | | | Emerging Markets Equity | | | Small/Mid Cap Growth | |
| | | |
Less than 1 year | | | $156,648 | | | | – | | | | $140,019 | |
| | | |
1-2 years | | | 159,696 | | | | $78,697 | | | | 111,190 | |
| | | |
2-3 years | | | 129,634 | | | | 58,087 | | | | 103,778 | |
| | | | | | | | | | | | |
| | | |
Total | | | $445,978 | | | | $136,784 | | | | $354,987 | |
| | | | | | | | | | | | |
The Investment Manager has contractually agreed, through March 1, 2021, to waive management fees and/or pay or reimburse Emerging Markets Equity’s expenses in an amount that is equal to the fees and expenses incurred indirectly by the Fund as a result of investment in shares of one or more acquired funds. The contractual expense limitation may only be terminated in the event the Investment Manager or a successor ceases to be the investment manager of the Fund or a successor fund, by mutual agreement among the Investment Manager, GW&K and the Board or in the event of the Fund’s liquidation unless the Fund is reorganized or is a party to a merger in which the surviving entity is successor to the accounting and performance information of the Fund. For the four months ended February 28, 2021, the Investment Manager waived $297 in fees.
The Trusts, on behalf of the Funds, have entered into an amended and restated Administration Agreement under which the Investment Manager serves as the Funds’ administrator (the “Administrator”) and is responsible for all non-portfolio management aspects of managing the Funds’ operations, including administration and shareholder services to each Fund. Each Fund pays a fee to the Administrator at the rate of 0.15% per annum of the Fund’s average daily net assets for this service.
The Funds are distributed by AMG Distributors, Inc. (the “Distributor”), a wholly-owned subsidiary of the Investment Manager. The Distributor serves as the distributor and underwriter for each Fund and is a registered broker-dealer and member of the Financial Industry Regulatory Authority, Inc. (“FINRA”). Shares of each Fund will be continuously offered and will be sold directly to prospective purchasers and through brokers, dealers or other financial intermediaries who have executed selling agreements with the Distributor. Generally the Distributor bears all or a portion of the expenses of providing services pursuant to the distribution agreement, including the payment of the expenses relating to the distribution of prospectuses for sales purposes and any advertising or sales literature.
The Trusts have adopted a distribution and service plan (the “Plan”) with respect to the Class N shares of each Fund, in accordance with the requirements of Rule 12b-1 under the 1940 Act and the requirements of the applicable rules of FINRA regarding asset-based sales charges. Pursuant to the Plan, each Fund may make payments to the Distributor for its expenditures in financing any activity primarily intended to result in the sale of each Fund’s Class N shares and for maintenance and personal service provided to existing shareholders of that class. The Plan authorized payments to the Distributor up to 0.25% annually of each Fund’s average daily net assets attributable to the Class N shares. For Small/Mid Cap Growth, the Plan is characterized as a reimbursement plan and is directly tied to expenses incurred by the Distributor; the payments the Distributor receives during any year may not exceed its actual expenses. The impact on the Class N annualized expense ratios for the fiscal year ended October 31, 2021, were 0.25%
53
|
Notes to Financial Statements (continued) |
for Core Bond ESG, Emerging Markets Equity, and Emerging Wealth Equity and 0.18% for Small/Mid Cap Growth.
For each of the Class N shares and Class I shares, the Board has approved reimbursement payments to the Investment Manager for shareholder servicing expenses (“shareholder servicing fees”) incurred. Shareholder servicing fees include payments to financial intermediaries, such as broker-dealers (including fund supermarket platforms), banks, and trust companies who provide shareholder recordkeeping, account servicing and other services. The Class N and Class I shares may reimburse the Investment Manager for the actual amount incurred up to a maximum annual rate of each Class’s average daily net assets as shown in the table below.
The impact on the annualized expense ratios for the fiscal year ended October 31, 2021, were as follows:
| | | | | | | | |
| Fund | | Maximum Annual
Amount
Approved | | | Actual Amount Incurred | |
| | |
Core Bond ESG | | | | | | | | |
Class N | | | 0.15% | | | | 0.15% | |
Class I | | | 0.10% | | | | 0.08% | |
Emerging Markets Equity | | | | | | | | |
Class N | | | 0.15% | | | | 0.15% | |
Class I | | | 0.15% | | | | 0.08% | |
Emerging Wealth Equity | | | | | | | | |
Class N | | | 0.15% | | | | 0.15% | |
Class I | | | 0.15% | | | | 0.11% | |
Small/Mid Cap Growth | | | | | | | | |
Class N* | | | – | | | | 0.04% | |
Class I* | | | 0.05% | | | | 0.06% | |
| * | Prior to June 18, 2021, the maximum annual amount approved was 0.15%. Effective, June 18, 2021, the shareholder servicing fees for Class N was eliminated. |
The Board provides supervision of the affairs of the Trusts and other trusts within the AMG Funds Family. The Trustees of the Trusts who are not affiliated with the Investment Manager receive an annual retainer and per meeting fees for regular, special and telephonic meetings, and they are reimbursed for out-of-pocket expenses incurred while carrying out their duties as Board members. The Chairman of the Board and the Audit Committee Chair receive additional annual retainers. Certain Trustees and Officers of the Funds are Officers and/or Directors of the Investment Manager, AMG and/or the Distributor.
The Securities and Exchange Commission (the “SEC”) granted an exemptive order that permits certain eligible funds in the AMG Funds Family to lend and borrow money for certain temporary purposes directly to and from other eligible funds in the AMG Funds Family. Participation in this interfund lending program is voluntary for both the borrowing and lending funds, and an interfund loan is only made if it benefits each participating fund. The Administrator manages the program according to procedures approved by the Board, and the Board monitors the operation of the program. An interfund loan must comply with certain conditions set out in the exemptive order, which are designed to assure fairness and protect all participating funds. The interest earned and interest paid on interfund loans are included on the Statement of Operations as interest income and interest expense,
respectively. Core Bond ESG, Emerging Markets Equity and Emerging Wealth Equity participated in the interfund lending program for the year ended October 31, 2021, while Small/Mid Cap Growth commenced participating in the interfund lending program on July 2, 2021. At October 31, 2021, the Funds had no interfund loans outstanding.
The following Funds utilized the interfund loan program during the fiscal year ended October 31, 2021 as follows:
| | | | | | | | | | | | | | | | |
| Fund | | Average
Lent | | | Number
of Days | | | Interest
Earned | | | Average
Interest Rate | |
| | | | |
Core Bond ESG | | | $1,335,266 | | | | 9 | | | | $308 | | | | 0.936% | |
| | | | |
| Fund | | Average
Borrowed | | | Number
of Days | | | Interest
Paid | | | Average
Interest Rate | |
| | | | |
Core Bond ESG | | | $1,344,381 | | | | 1 | | | | $33 | | | | 0.908% | |
| | | | |
Emerging Wealth Equity | | | 1,949,218 | | | | 8 | | | | 408 | | | | 0.955% | |
3. PURCHASES AND SALES OF SECURITIES
Purchases and sales of securities (excluding short-term securities and U.S. Government Obligations) for the fiscal year ended October 31, 2021, were as follows:
| | | | | | | | |
| | | Long Term Securities | |
| | |
| Fund | | Purchases | | | Sales | |
| | |
Core Bond ESG | | | $62,383,118 | | | | $86,118,731 | |
| | |
Emerging Markets Equity | | | 31,010,215 | | | | 20,056,587 | |
| | |
Emerging Wealth Equity | | | 167,557,733 | | | | 143,756,947 | |
| | |
Small/Mid Cap Growth | | | 65,349,566 | | | | 71,590,324 | |
Core Bond ESG purchases and sales of U.S. Government obligations during the fiscal year ended October 31, 2021 were $57,922,268 and $45,970,522, respectively.
4. PORTFOLIO SECURITIES LOANED
The Funds participate in the Program providing for the lending of securities to qualified borrowers. Securities lending income includes earnings of such temporary cash investments, plus or minus any rebate to a borrower. These earnings (after any rebate) are then divided between BNYM, as a fee for its services under the Program, and the Funds, according to agreed-upon rates. Collateral on all securities loaned is accepted in cash, U.S. Treasury Obligations or U.S. Government Agency Obligations. Collateral is maintained at a minimum level of 102% (105% in the case of certain foreign securities) of the market value, plus interest, if applicable, of investments on loan. It is the Funds’ policy to obtain additional collateral from or return excess collateral to the borrower by the end of the next business day, following the valuation date of the securities loaned. Therefore, the value of the collateral held may be temporarily less than the value of the securities on loan. Lending securities entails a risk of loss to the Funds if and to the extent that the market value of the securities loaned were to increase and the borrower did not increase the collateral accordingly, and the borrower fails to return the securities. Under the terms of the Program, the Funds are indemnified for such losses by BNYM. Cash collateral is held in separate omnibus accounts managed by BNYM, who is authorized to exclusively enter into joint repurchase agreements for that cash collateral, and securities collateral is held in separate
54
|
Notes to Financial Statements (continued) |
omnibus accounts managed by BNYM and cannot be sold or pledged. BNYM bears the risk of any deficiency in the amount of the cash collateral available for return to the borrower due to any loss on the collateral invested. Loans of securities are terminable at any time and the borrower, after notice, is required to return borrowed securities as soon as practical, which is normally within three business days.
The value of securities loaned on positions held, cash collateral and securities collateral received at October 31, 2021, were as follows:
| | | | | | | | | | | | | | | | |
| Fund | | Securities
Loaned | | | Cash
Collateral
Received | | | Securities
Collateral
Received | | | Total
Collateral
Received | |
| | | | |
Emerging Markets Equity | | | $2,242,295 | | | | $2,015,149 | | | | $360,842 | | | | $2,375,991 | |
| | | | |
Emerging Wealth Equity | | | 1,589,618 | | | | 507,794 | | | | 1,208,507 | | | | 1,716,301 | |
| | | | |
Small/Mid Cap Growth | | | 4,624,938 | | | | 485,590 | | | | 4,218,215 | | | | 4,703,805 | |
The following table summarizes the securities received as collateral for securities lending at October 31, 2021:
| | | | | | |
| Fund | | Collateral Type | | Coupon
Range | | Maturity Date Range |
| | | |
Emerging Markets Equity | | U.S. Treasury Obligations | | 0.000%-3.750% | | 11/30/21-02/15/51 |
| | | |
Emerging Wealth Equity | | U.S. Treasury Obligations | | 0.750%-3.625% | | 05/31/22-08/15/49 |
| | | |
Small/Mid Cap Growth | | U.S. Treasury Obligations | | 0.000%-6.875% | | 11/15/21-11/15/50 |
5. FOREIGN SECURITIES
Certain Funds invest in securities of foreign entities and in instruments denominated in foreign currencies which involve risks not typically associated with investments in domestic securities. Non-domestic securities carry special risks, such as exposure to currency fluctuations, less developed or less efficient trading markets, political instability, a lack of company information, differing auditing and legal standards, and, potentially, less liquidity. A Fund’s investments in emerging market countries are exposed to additional risks. A Fund’s performance will be influenced by political, social and economic factors affecting companies in emerging market countries. Emerging market countries generally have economic structures that are less diverse and mature, and political systems that are less stable, than those of developed countries. Realized gains in certain countries may be subject to foreign taxes at the Fund level and the Fund would pay such foreign taxes at the appropriate rate for each jurisdiction.
6. COMMITMENTS AND CONTINGENCIES
Under the Trusts’ organizational documents, its trustees and officers are indemnified against certain liabilities arising out of the performance of their duties
to the Trusts. In addition, in the normal course of business, the Funds may enter into contracts and agreements that contain a variety of representations and warranties, which provide general indemnifications. The maximum exposure to the Funds under these arrangements is unknown, as this would involve future claims that may be made against a Fund that have not yet occurred. However, based on experience, the Funds had no prior claims or losses and expect the risks of loss to be remote.
7. CREDIT AGREEMENT
Effective July 6, 2010, and amended and restated on July 22, 2020, AMG Funds IV entered into a Credit Agreement with BNYM (the “Credit Agreement”) which provides the funds in AMG Funds IV, including Small/Mid Cap Growth with a revolving line of credit of up to $50 million. The Credit Agreement expires in 365 days and can be renewed at the mutual agreement of AMG Funds IV and BNYM. The facility is shared by each fund of AMG Funds IV, and is available for temporary, emergency purposes including liquidity needs in meeting redemptions. The interest rate on outstanding Alternate Base Rate Loans is equal to the greater of the Prime Rate plus 1.25%, or 0.50% plus the Federal Funds Effective Rate plus 1.25%. The interest rate on outstanding Overnight Loans is equal to the greater of the Federal Funds Effective Rate plus 1.25%, or the One-Month LIBOR Rate plus 1.25%. AMG Funds IV pays a commitment fee on the unutilized commitment amount of 0.175% per annum, which is allocated to the funds in AMG Funds IV based on average daily net assets and included in miscellaneous expense on the Statement of Operations. Interest incurred on loans utilized is included in the Statement of Operations as interest expense. Upon the expiration of the Credit Agreement on July 21, 2021, Small/Mid Cap Growth did not participate in the Credit Agreement renewal.
The following Fund utilized the line of credit during the fiscal year ended October 31, 2021:
| | | | | | | | | | | | | | | | |
| Fund | | Weighted
Average
Borrowed | | | Number
of Days | | | Interest
Paid | | | Average
Interest Rate | |
| | | | |
Small/Mid Cap Growth | | | $1,471,403 | | | | 3 | | | | $166 | | | | 1.357 | % |
8. MASTER NETTING AGREEMENTS
The Funds may enter into master netting agreements with their counterparties for the securities lending program and Repurchase Agreements, which provide the right, in the event of default (including bankruptcy or insolvency) for the non-defaulting party to liquidate the collateral and calculate net exposure to the defaulting party or request additional collateral. For financial reporting purposes, the Funds do not offset financial assets and financial liabilities that are subject to master netting agreements in the Statement of Assets and Liabilities. For securities lending transactions, see Note 4.
55
|
Notes to Financial Statements (continued) |
The following table is a summary of the Funds’ open Repurchase Agreements that are subject to a master netting agreement as of October 31, 2021:
| | | | | | | | | | |
| | | | | Gross Amount Not Offset in the
Statement of Assets and Liabilities | | | | |
Fund | | Gross Amounts of
Assets Presented in
the Statement of
Assets and Liabilities | | Offset
Amount | | Net
Asset
Balance | | Collateral
Received | | Net
Amount |
| | | | | |
Emerging Markets Equity | | | | | | | | | | |
| | | | | |
Bank of America Securities, Inc. | | $1,000,000 | | – | | $1,000,000 | | $1,000,000 | | – |
| | | | | |
HSBC Securities USA, Inc. | | 15,149 | | – | | 15,149 | | 15,149 | | – |
| | | | | |
RBC Dominion Securities, Inc. | | 1,000,000 | | – | | 1,000,000 | | 1,000,000 | | – |
| | | | | | | | | | |
| | | | | |
Total | | $2,015,149 | | – | | $2,015,149 | | $2,015,149 | | – |
| | | | | | | | | | |
| | | | | |
Emerging Wealth Equity | | | | | | | | | | |
| | | | | |
Daiwa Capital Markets America | | $ 507,794 | | – | | $507,794 | | $507,794 | | – |
| | | | | |
Small/Mid Cap Growth | | | | | | | | | | |
| | | | | |
Daiwa Capital Markets America | | $ 485,590 | | – | | $485,590 | | $485,590 | | – |
9. SUBSEQUENT EVENTS
The Funds have determined that no material events or transactions occurred through the issuance date of the Funds’ financial statements which require an additional disclosure in or adjustment of the Funds’ financial statements.
56
|
Report of Independent Registered Public Accounting Firm |
TO THE BOARD OF TRUSTEES OF AMG FUNDS, AMG FUNDS I, AND AMG FUNDS IV AND SHAREHOLDERS OF AMG GW&K CORE BOND ESG FUND, AMG GW&K EMERGING MARKETS EQUITY FUND, AMG GW&K EMERGING WEALTH EQUITY FUND, AND AMG GW&K SMALL/MID CAP GROWTH FUND:
Opinion on the Financial Statements
We have audited the accompanying statements of assets and liabilities, including the schedules of portfolio investments, of AMG GW&K Core Bond ESG Fund (one of the funds constituting AMG Funds I), AMG GW&K Emerging Markets Equity Fund and AMG GW&K Emerging Wealth Equity Fund (two of the funds constituting AMG Funds), and AMG GW&K Small/Mid Cap Growth Fund (formerly AMG GW&K Small Cap Fund II, which was formerly AMG Managers LMCG Small Cap Growth Fund) (one of the funds constituting AMG Funds IV) (hereafter collectively referred to as the “Funds “) as of October 31, 2021, the related statements of operations for the year ended October 31, 2021, the statements of changes in net assets for each of the two years in the period ended October 31, 2021, including the related notes, and the financial highlights for each of the periods indicated therein (collectively referred to as the “financial statements”). In our opinion, the financial statements present fairly, in all material respects, the financial position of each of the Funds as of October 31, 2021, the results of each of their operations for the year then ended, the changes in each of their net assets for each of the two years in the period ended October 31, 2021 and the financial highlights for each of the periods indicated therein in conformity with accounting principles generally accepted in the United States of America.
Basis for Opinion
These financial statements are the responsibility of the Funds’ management. Our responsibility is to express an opinion on the Funds’ financial statements based on our audits. We are a public accounting firm registered with the Public Company Accounting Oversight Board (United States) (PCAOB) and are required to be independent with respect to the Funds in accordance with the U.S. federal securities laws and the applicable rules and regulations of the Securities and Exchange Commission and the PCAOB.
We conducted our audits of these financial statements in accordance with the standards of the PCAOB. Those standards require that we plan and perform the audit to obtain reasonable assurance about whether the financial statements are free of material misstatement, whether due to error or fraud.
Our audits included performing procedures to assess the risks of material misstatement of the financial statements, whether due to error or fraud, and performing procedures that respond to those risks. Such procedures included examining, on a test basis, evidence regarding the amounts and disclosures in the financial statements. Our audits also included evaluating the accounting principles used and significant estimates made by management, as well as evaluating the overall presentation of the financial statements. Our procedures included confirmation of securities owned as of October 31, 2021 by correspondence with the custodian, transfer agent and brokers; when replies were not received from brokers, we performed other auditing procedures. We believe that our audits provide a reasonable basis for our opinions.
PricewaterhouseCoopers LLP
Boston, Massachusetts
December 22, 2021
We have served as the auditor of one or more investment companies in AMG Funds Family since 1993.
57
|
Other Information (unaudited) |
TAX INFORMATION
AMG GW&K Core Bond ESG Fund, AMG GW&K Emerging Markets Equity Fund, AMG GW&K Emerging Wealth Equity Fund and AMG GW&K Small/Mid Cap Growth Fund each hereby designates the maximum amount allowable of their net taxable income as qualified dividends as provided in the Jobs and Growth Tax Relief Reconciliation Act of 2003. The 2020/2021 Form 1099-DIV you receive for each Fund will show the tax status of all distributions paid to you during the year.
In accordance with federal tax law, the following Funds elect to provide foreign taxes paid and the income sourced from foreign countries. Accordingly, each Fund hereby makes the following designations regarding its taxable period ended October 31, 2021:
AMG GW&K Emerging Markets Equity Fund
u The total amount of taxes paid and income sourced from foreign countries was $106,848 and $984,671, respectively.
AMG GW&K Emerging Wealth Equity Fund
u The total amount of taxes paid and income sourced from foreign countries was $767,841 and $1,367,271, respectively.
Pursuant to section 852 of the Internal Revenue Code, AMG GW&K Core Bond ESG Fund, AMG GW&K Emerging Markets Equity Fund, AMG GW&K Emerging Wealth Equity Fund and AMG GW&K Small/Mid Cap Growth Fund, each hereby designates as a capital gain distribution with respect to the taxable period ended October 31, 2021, $0, $1,625,205, $262 and $8,422,676, respectively, or, if subsequently determined to be different, the net capital gains of such period.
PROXY VOTE
A special meeting of the shareholders of AMG GW&K Small/Mid Cap Growth Fund (the “Fund”) was held on June 18, 2021, to vote on proposals to approve a new subadvisory agreement between AMG Funds LLC (the “Investment Manager”) and GW&K Investment Management, LLC (“GW&K”) with respect to the Fund. The proposals and results of the votes are summarized below.
| | | | | | | | | | | | | | | |
| | | | | Number of Eligible Shareholders | | |
| | | |
| Proposal 1 | | For | | Against | | Abstain |
| | | |
To approve a new subadvisory agreement between the Investment Manager and GW&K with respect to the Fund. | | 1,069,360 | | 77,401 | | 192,172 |
| | | |
% of Shares Present | | 79.866% | | 5.781% | | 14.353% |
| | | |
% of Outstanding Shares | | 40.246% | | 2.913% | | 7.232% |
| | | |
| | | | | Number of Eligible Shareholders | | |
| | | |
| Proposal 2 | | For | | Against | | Abstain |
| | | |
To approve the redesignation of the Fund’s fundamental investment objective as non-fundamental. | | 991,268 | | 163,495 | | 184,170 |
| | | |
% of Shares Present | | 74.034% | | 12.211% | | 13.755% |
| | | |
% of Outstanding Shares | | 37.307% | | 6.153% | | 6.931% |
| | | |
| | | | | Number of Eligible Shareholders | | |
| | | |
| Proposal 3a | | For | | Against | | Abstain |
| | | |
To approve the amendment of the Fund’s fundamental investment restriction with respect to borrowing and issuing senior securities. | | 1,033,279 | | 130,744 | | 174,910 |
| | | |
% of Shares Present | | 77.172% | | 9.765% | | 13.063% |
| | | |
% of Outstanding Shares | | 38.887% | | 4.921% | | 6.583% |
| | | |
| | | | | Number of Eligible Shareholders | | |
| | | |
| Proposal 3b | | For | | Against | | Abstain |
| | | |
To approve the amendment of the Funds fundamental investment restriction with respect to lending. | | 1,026,548 | | 137,533 | | 174,852 |
| | | |
% of Shares Present | | 76.669% | | 10.272% | | 13.059% |
| | | |
% of Outstanding Shares | | 38.634% | | 5.176% | | 6.581% |
58
|
Other Information (continued) |
| | | | | | | | | | | | | | | |
| | | |
| | | | | Number of Eligible Shareholders | | |
| | | |
| Proposal 4 | | For | | Against | | Abstain |
To approve a modified manager-of-managers structure for the Fund that would permit the Investment Manager to enter into and materially amend subadvisory agreements with unaffiliated and affiliated subadvisers without obtaining shareholder approval and would also permit the Fund to disclose fees paid to subadvisers on an aggregate, rather than individual, basis. | | 972,247 | | 176,963 | | 189,723 |
% of Shares Present | | 72.613% | | 13.217% | | 14.170% |
% of Outstanding Shares | | 36.591% | | 6.660% | | 7.140% |
| | | | |
| Fund Totals: | | Shares | |
Record Total | | | 2,657,099 | |
Shares Voted | | | 1,338,933 | |
Percent Present | | | 50.391% | |
59
|
AMG Funds Trustees and Officers |
| | | | | | | | |
The Trustees and Officers of the Trust, their business addresses, principal occupations for the past five years and ages are listed below. The Trustees provide broad supervision over the affairs of the Trust and the Funds. The Trustees are experienced executives who meet periodically throughout the year to oversee the Funds’ activities, review contractual arrangements with companies that provide services to the Funds, and | | | | review the Funds’ performance. Unless otherwise noted, the address of each Trustee or Officer is the address of the Trust: 680 Washington Blvd., Suite 500, Stamford, CT. 06901. There is no stated term of office for Trustees. Trustees serve until their resignation, retirement or removal in | | | | accordance with the Trust’s organizational documents and policies adopted by the Board from time to time. The Chairman of the Trustees, President, Treasurer and Secretary of the Trust are elected by the Trustees annually. Other officers hold office at the pleasure of the Trustees. |
Independent Trustees
The following Trustees are not “interested persons” of the Trust within the meaning of the 1940 Act:
| | |
Number of Funds Overseen in Fund Complex | | Name, Age, Principal Occupation(s) During Past 5 Years and Other Directorships Held by
Trustee |
| | |
• Trustee since 2012 - AMG Funds • Trustee since 2012 - AMG Funds I • Trustee since 2016 - AMG Funds IV • Oversees 42 Funds in Fund Complex | | Bruce B. Bingham, 72 Partner, Hamilton Partners (real estate development firm) (1987-Present); Director of The Yacktman Funds, Inc. (2 portfolios) (2000-2012). |
| | |
• Trustee since 2013 - AMG Funds • Trustee since 2013 - AMG Funds I • Trustee since 2013 - AMG Funds IV • Chairman of the Audit Committee since 2021 - AMG Funds, AMG Funds I • Chairman of the Audit Committee since 2020 - AMG Funds IV • Oversees 46 Funds in Fund Complex | | Kurt A. Keilhacker, 58 Managing Partner, TechFund Europe (2000-Present); Managing Partner, TechFund Capital (1997-Present); Managing Partner, Elementum Ventures (2013-Present); Director, MetricStory, Inc. (2017-Present); Trustee, Wheaton College (2018-Present); Trustee, Gordon College (2001-2016); Board Member, 6wind SA (2002-2019). |
| | |
• Trustee since 2000 - AMG Funds • Oversees 42 Funds in Fund Complex | | Steven J. Paggioli, 71 Independent Consultant (2002-Present); Trustee, Professionally Managed Portfolios (28 portfolios); Advisory Board Member, Sustainable Growth Advisors, LP; Independent Director, Muzinich BDC, Inc. (business development company) (2019-Present); Director, The Wadsworth Group; Independent Director, Chase Investment Counsel (2008–2019); Executive Vice President, Secretary and Director, Investment Company Administration, LLC and First Fund Distributors, INC. (1990-2001). |
| | |
��� Trustee since 2013 • Oversees 42 Funds in Fund Complex | | Richard F. Powers III, 75 Adjunct Professor, U.S. Naval War College (2016-Present); Adjunct Professor, Boston College (2011-2015); Director, Ameriprise Financial Inc. (2005-2009); President and CEO of Van Kampen Investments Inc. (1998-2003); President, Morgan Stanley Client Group (2000-2002); Executive Vice President and Chief Marketing Officer of the Morgan Stanley Individual Investor Group (1984-1998). |
| | |
• Independent Chairman of the Board of Trustees since 2017; Chairman of the Governance Committee since 2017 • Trustee since 2000 • Oversees 46 Funds in Fund Complex | | Eric Rakowski, 63 Professor of Law, University of California at Berkeley School of Law (1990-Present); Tax Attorney at Davis Polk & Wardwell and clerked for Judge Harry T. Edwards of the U.S. Court of Appeals for the District of Columbia Circuit and for Justice William J. Brennan Jr. of the U.S. Supreme Court; Director of Harding, Loevner Funds, Inc. (10 portfolios); Trustee of Third Avenue Trust (3 portfolios) (2002-2019); Trustee of Third Avenue Variable Trust (1 portfolio) (2002-2019). |
| | |
• Trustee since 2013 • Oversees 46 Funds in Fund Complex | | Victoria L. Sassine, 56 Adjunct Professor, Babson College (2007–Present); Director, Board of Directors, PRG Group (2017-Present); CEO, Founder, Scale Smarter Partners, LLC (2018-Present); Adviser, EVOFEM Biosciences (2019-Present); Chairperson of the Board of Directors of Business Management Associates (2018 to 2019). |
60
|
AMG Funds Trustees and Officers (continued) |
| | |
Number of Funds Overseen in Fund Complex | | Name, Age, Principal Occupation(s) During Past 5 Years and Other Directorships Held by
Trustee |
| | |
• Trustee since 2000 - AMG Funds I • Trustee since 2004 - AMG Funds • Trustee since 2016 - AMG Funds IV • Oversees 42 Funds in Fund Complex | | Thomas R. Schneeweis, 74 Professor Emeritus, University of Massachusetts (2013-Present); President, TRS Associates (1982-Present); Board Member, Chartered Alternative Investment Association (“CAIA”) (2002-Present); Co-Founder and Director, Institute for Global Asset and Risk Management (Education) (2010-Present); Co-Owner, Quantitative Investment Technologies (2014-Present); Co-Owner, Yes Wealth Management (2018-Present); Director, CAIA Foundation (2010-2019); Partner, S Capital Wealth Advisors (2015-2018); Partner, S Capital Management, LLC (2007-2015); President, Alternative Investment Analytics, LLC, (formerly Schneeweis Partners, LLC) (2001-2013). |
Interested Trustees
Each Trustee in the following table is an “interested person” of the Trust within the meaning of the 1940 Act. Ms. Carsman is an interested person of the Trust within the meaning of the 1940 Act by virtue of her position with, and interest in securities of, AMG.
| | |
Number of Funds Overseen in Fund Complex | | Name, Age, Principal Occupation(s) During Past 5 Years and Other Directorships Held by
Trustee |
| | |
• Trustee since 2011 • Oversees 42 Funds in Fund Complex | | Christine C. Carsman, 69 Affiliated Managers Group, Inc. (2004-Present): Senior Policy Advisor (2019-Present), Executive Vice President, Deputy General Counsel and Chief Regulatory Counsel (2017-2018), Senior Vice President and Deputy General Counsel (2011-2016), Senior Vice President and Chief Regulatory Counsel (2007-2011), Vice President and Chief Regulatory Counsel (2004-2007); Chair of the Board of Directors, AMG Funds plc (2015-2018); Director, AMG Funds plc (2010-2018); Secretary and Chief Legal Officer, AMG Funds, AMG Funds I, AMG Funds II and AMG Funds III (2004-2011); Senior Counsel, Vice President and Director of Operational Risk Management and Compliance, Wellington Management Company, LLP (1995-2004); Director Emeritus of Harding, Loevner Funds, Inc. (0 Portfolios) (2021- Present); Director of Harding, Loevner Funds, Inc. (9 portfolios) (2017-2020). |
| | |
• Trustee since 2021 • Oversees 42 Funds in Fund Complex | | Garret W. Weston, 40 Affiliated Managers Group, Inc. (2008-Present): Managing Director, Co-Head of Affiliate Engagement (2021-Present), Senior Vice President, Affiliate Development (2016-2021), Vice President, Office of the CEO (2015-2016), Vice President, New Investments (2012-2015), Senior Associate, New Investments (2008-2012); Associate, Madison Dearborn Partners (2006-2008); Analyst, Merrill Lynch (2004-2006). |
| |
| Officers | | |
Position(s) Held with Fund and Length of Time Served | | Name, Age, Principal Occupation(s) During Past 5 Years |
| | |
• President since 2018 • Principal Executive Officer since 2018 • Chief Executive Officer since 2018 • Chief Operating Officer since 2007 | | Keitha L. Kinne, 63 Chief Operating Officer, AMG Funds LLC (2007-Present); Chief Investment Officer, AMG Funds LLC (2008-Present); President and Principal, AMG Distributors, Inc. (2018-Present); Chief Operating Officer, AMG Distributors, Inc. (2007-Present); President, Chief Executive Officer and Principal Executive Officer, AMG Funds, AMG Funds I, AMG Funds II, AMG Funds III and AMG Funds IV (2018-Present); Chief Operating Officer, AMG Funds, AMG Funds I, AMG Funds II, and AMG Funds III (2007-Present); Chief Operating Officer, AMG Funds IV (2016-Present); Chief Operating Officer and Chief Investment Officer, Aston Asset Management, LLC (2016); President and Principal Executive Officer, AMG Funds, AMG Funds I, AMG Funds II and AMG Funds III (2012-2014); Managing Partner, AMG Funds LLC (2007-2014); President and Principal, AMG Distributors, Inc. (2012-2014); Managing Director, Legg Mason & Co., LLC (2006-2007); Managing Director, Citigroup Asset Management (2004-2006). |
| | |
• Secretary since 2015 • Chief Legal Officer since 2015 | | Mark J. Duggan, 56 Managing Director and Senior Counsel, AMG Funds LLC (2021-Present); Senior Vice President and Senior Counsel, AMG Funds LLC (2015-2021); Secretary and Chief Legal Officer, AMG Funds, AMG Funds I, AMG Funds II, AMG Funds III and AMG Funds IV (2015-Present); Attorney, K&L Gates, LLP (2009-2015). |
| | |
• Chief Financial Officer since 2017 • Treasurer since 2017 • Principal Financial Officer since 2017 • Principal Accounting Officer since 2017 | | Thomas G. Disbrow, 55 Vice President, Mutual Fund Treasurer & CFO, AMG Funds, AMG Funds LLC (2017-Present); Chief Financial Officer, Principal Financial Officer, Treasurer and Principal Accounting Officer, AMG Funds, AMG Funds I, AMG Funds II, AMG Funds III and AMG Funds IV (2017-Present); Managing Director - Global Head of Traditional Funds Product Control, UBS Asset Management (Americas), Inc. (2015-2017); Managing Director - Head of North American Funds Treasury, UBS Asset Management (Americas), Inc. (2011-2015). |
61
|
AMG Funds Trustees and Officers (continued) |
| | |
Position(s) Held with Fund and Length of Time Served | | Name, Age, Principal Occupation(s) During Past 5 Years |
| | |
• Deputy Treasurer since 2017 | | John A. Starace, 51 Vice President, Mutual Fund Accounting, AMG Funds LLC (2021-Present); Director, Mutual Fund Accounting, AMG Funds LLC (2017-2021); Vice President, Deputy Treasurer of Mutual Funds Services, AMG Funds LLC (2014-2017); Deputy Treasurer, AMG Funds, AMG Funds I, AMG Funds II, AMG Funds III and AMG Funds IV (2017-Present); Vice President, Citi Hedge Fund Services (2010-2014); Audit Senior Manager (2005-2010) and Audit Manager (2001-2005), Deloitte & Touche LLP. |
| | |
• Chief Compliance Officer and Sarbanes-Oxley Code of Ethics Compliance Officer since 2019 | | Patrick J. Spellman, 47 Vice President, Chief Compliance Officer, AMG Funds LLC (2017-Present); Chief Compliance Officer, AMG Distributors, Inc., (2010-Present); Chief Compliance Officer and Sarbanes-Oxley Code of Ethics Compliance Officer, AMG Funds, AMG Funds I, AMG Funds II, AMG Funds III and AMG Funds IV (2019-Present); Senior Vice President, Chief Compliance Officer, AMG Funds LLC (2011-2017); Anti-Money Laundering Compliance Officer, AMG Funds, AMG Funds I, AMG Funds II, and AMG Funds III (2014-2019); Anti-Money Laundering Officer, AMG Funds IV (2016-2019); Compliance Manager, Legal and Compliance, Affiliated Managers Group, Inc. (2005-2011). |
| | |
• Assistant Secretary since 2016 | | Maureen A. Meredith, 36 Vice President, Senior Counsel, AMG Funds LLC (2021-Present); Vice President, Counsel, AMG Funds LLC (2019-2021); Director, Counsel, AMG Funds LLC (2017-2018); Vice President, Counsel, AMG Funds LLC (2015-2017); Assistant Secretary, AMG Funds, AMG Funds I, AMG Funds II, AMG Funds III and AMG Funds IV (2016-Present); Associate, Ropes & Gray LLP (2011-2015); Law Fellow, Massachusetts Appleseed Center for Law and Justice (2010-2011). |
| | |
• Anti-Money Laundering Compliance Officer since 2019 | | Hector D. Roman, 43 Director, Legal and Compliance, AMG Funds LLC (2020-Present); Anti-Money Laundering Compliance Officer, AMG Funds, AMG Funds I, AMG Funds II, AMG Funds III and AMG Funds IV (2019-Present); Manager, Legal and Compliance, AMG Funds LLC (2017-2019); Director of Compliance, Morgan Stanley Investment Management (2015-2017); Senior Advisory, PricewaterhouseCoopers LLP (2014-2015); Risk Manager, Barclays Investment Bank (2008-2014). |
62
|
Annual Renewal of Investment Management and Subadvisory Agreements |
| | | | | | | | |
AMG GW&K Emerging Markets Equity Fund, AMG GW&K Emerging Wealth Equity Fund, AMG GW&K Core Bond ESG Fund, and AMG GW&K Small/Mid Cap Growth Fund (formerly AMG GW&K Small Cap Fund II, which was formerly AMG Managers LMCG Small Cap Growth Fund): Approval of Investment Management and Subadvisory Agreements on June 24, 2021 At a meeting held via telephone and video conference on June 24, 2021,1 the Board of Trustees (the “Board” or the “Trustees”) of each of AMG Funds, AMG Funds I, and AMG Funds IV (each, a “Trust” and collectively, the “Trusts”), and separately a majority of the Trustees who are not “interested persons” of the Trusts (the “Independent Trustees”), approved (i) the Investment Management Agreement, as amended pursuant to letter agreements at any time prior to the date of the meeting, with AMG Funds LLC (the “Investment Manager”) and AMG Funds for each of AMG GW&K Emerging Markets Equity Fund and AMG GW&K Emerging Wealth Equity Fund, and separately each of Amendment No. 1 thereto dated July 1, 2015, and Amendment No. 2 thereto dated October 1, 2016; the Fund Management Agreement, as amended pursuant to letter agreements at any time prior to the date of the meeting, with the Investment Manager and AMG Funds I for AMG GW&K Core Bond ESG Fund, and separately each of Amendment No. 1 thereto dated July 1, 2015, and Amendment No. 2 thereto dated October 1, 2016; and the Investment Advisory Agreement, as amended pursuant to letter agreements at any time prior to the date of the meeting, with the Investment Manager and AMG Funds IV for AMG GW&K Small/Mid Cap Growth Fund (formerly AMG GW&K Small Cap Fund II, which was formerly AMG Managers LMCG Small Cap Growth Fund), and separately Amendment No. 1 thereto dated October 1, 2016 (collectively, the “Investment Management Agreements”); and (ii) the Subadvisory Agreements, as amended at any time prior to the date of the meeting (collectively, the “Subadvisory Agreements”), with the Subadviser for AMG GW&K Emerging Markets Equity Fund, AMG GW&K Emerging Wealth Equity Fund, and AMG GW&K Core Bond ESG Fund. 2 The Independent Trustees were separately represented by independent legal counsel in connection with their consideration of the approval of these agreements. In considering the Investment Management Agreements and the Subadvisory Agreements, the Trustees reviewed a variety of materials relating to AMG GW&K Emerging Markets Equity Fund, AMG GW&K Emerging Wealth Equity Fund, AMG GW&K Core Bond ESG Fund, and AMG GW&K Small/Mid Cap Growth Fund (each, a | | | | “Fund,” and collectively, the “Funds”), the Investment Manager and, with respect to AMG GW&K Emerging Markets Equity Fund, AMG GW&K Emerging Wealth Equity Fund, and AMG GW&K Core Bond ESG Fund, the Subadviser, including the nature, extent and quality of services, comparative performance, fee and expense information for an appropriate peer group of similar mutual funds for each Fund (each, a “Peer Group”), performance information for the relevant benchmark index for each Fund (each, a “Fund Benchmark”), other relevant matters, and other information provided to them on a periodic basis throughout the year. Prior to voting, the Independent Trustees: (a) reviewed the foregoing information with their independent legal counsel; (b) received materials from their independent legal counsel discussing the legal standards applicable to their consideration of the Investment Management Agreements and the Subadvisory Agreements; and (c) met with their independent legal counsel in private sessions at which no representatives of management were present. NATURE, EXTENT AND QUALITY OF SERVICES In considering the nature, extent and quality of the services provided by the Investment Manager, the Trustees reviewed information relating to the Investment Manager’s operations and personnel. Among other things, the Investment Manager provided financial information, information about its supervisory and professional staff and descriptions of its organizational and management structure. The Trustees also took into account information provided periodically throughout the previous year by the Investment Manager in Board meetings relating to the performance of its duties with respect to the Funds and the Trustees’ knowledge of the Investment Manager’s management and the quality of the performance of the Investment Manager’s duties under the Investment Management Agreements and Administration Agreement. In the course of their deliberations regarding the Investment Manager, the Trustees evaluated, among other things: (a) the extent and quality of the Investment Manager’s oversight of the operation and management of the Funds; (b) the quality of the Investment Manager’s oversight of the performance by the Subadviser of its portfolio management duties; (c) the Investment Manager’s ability to supervise the Funds’ other service providers; and (d) the Investment Manager’s compliance program. The Trustees also took into account that, in performing its functions under the Investment Management Agreements and supervising the Subadviser, the Investment Manager: performs periodic detailed analyses and | | | | reviews of the performance by the Subadviser of its obligations to each Fund, including without limitation, analysis and review of portfolio and other compliance matters and review of the Subadviser’s investment performance with respect to each Fund; prepares and presents periodic reports to the Board regarding the investment performance of the Subadviser and other information regarding the Subadviser, at such times and in such forms as the Board may reasonably request; reviews and considers any changes in the personnel of the Subadviser responsible for performing the Subadviser’s obligations and makes appropriate reports to the Board; reviews and considers any changes in the ownership or senior management of the Subadviser and makes appropriate reports to the Board; performs periodic in-person, telephonic or videoconference diligence meetings, including with respect to compliance matters, with representatives of the Subadviser; assists the Board and management of the Trusts in developing and reviewing information with respect to the initial approval of each Subadvisory Agreement and the Small/Mid Cap Growth Subadvisory Agreement and annual consideration of each Subadvisory Agreement and the Small/Mid Cap Growth Subadvisory Agreement thereafter; prepares recommendations with respect to the continued retention of the Subadviser or the replacement of the Subadviser, including at the request of the Board; identifies potential successors to, or replacements of, the Subadviser or potential additional subadvisers, including performing appropriate due diligence, and developing and presenting to the Board a recommendation as to any such successor, replacement, or additional subadviser, including at the request of the Board; designates and compensates from its own resources such personnel as the Investment Manager may consider necessary or appropriate to the performance of its services; and performs such other review and reporting functions as the Board shall reasonably request consistent with the Investment Management Agreements and applicable law. The Trustees noted the affiliation of the Subadviser with the Investment Manager, noting any potential conflicts of interest. The Trustees also took into account the financial condition of the Investment Manager with respect to its ability to provide the services required under the Investment Management Agreements and the Investment Manager’s undertaking to maintain contractual expense limitations for the Funds. The Trustees also considered the Investment Manager’s risk management processes. |
63
|
Annual Renewal of Investment Management and Subadvisory Agreements (continued) |
| | | | | | | | |
For AMG GW&K Emerging Markets Equity Fund, AMG GW&K Emerging Wealth Equity Fund and AMG GW&K Core Bond ESG Fund, the Trustees also reviewed information relating to the Subadviser’s operations and personnel and the investment philosophy, strategies and techniques used in managing each Fund. Among other things, the Trustees reviewed information on portfolio management and other professional staff, information regarding the Subadviser’s organizational and management structure and the Subadviser’s brokerage policies and practices. The Trustees considered specific information provided regarding the experience of the individuals at the Subadviser with portfolio management responsibility for each Fund, including the information set forth in the Fund’s prospectus and statement of additional information. In the course of their deliberations, the Trustees evaluated, among other things: (a) the services rendered by the Subadviser in the past; (b) the qualifications and experience of the Subadviser’s personnel; and (c) the Subadviser’s compliance program. The Trustees also took into account the financial condition of the Subadviser with respect to its ability to provide the services required under each Subadvisory Agreement. The Trustees also considered the Subadviser’s risk management processes. PERFORMANCE The Board considered each Fund’s net performance during relevant time periods as compared to the Fund’s Peer Group and Fund Benchmark, considered the gross performance of each of AMG GW&K Emerging Markets Equity Fund, AMG GW&K Emerging Wealth Equity Fund and AMG GW&K Core Bond ESG Fund as compared to the Subadviser’s relevant performance composite that utilizes the same investment strategy and approach, and noted that the Board reviews on a quarterly basis detailed information about both a Fund’s performance results and portfolio composition, as well as the Subadviser’s investment philosophy, strategies and techniques used in managing the Fund. The Board was mindful of the Investment Manager’s expertise, resources and attention to monitoring the Subadviser’s performance, investment style and risk-adjusted performance with respect to the Funds and its discussions with the management of the Funds’ subadvisers during the period regarding the factors that contributed to the performance of the Funds. With respect to AMG GW&K Emerging Markets Equity Fund, among other information relating to the Fund’s performance, the Trustees noted that the Fund’s | | | | performance for Class Z shares (which share class has one of the earliest inception dates and the largest amount of assets of all the share classes of the Fund) for the 1-year, 3-year, 5-year, and 10-year periods ended March 31, 2021 was above, above, above, and below, respectively, the median performance of the Peer Group and above, above, above, and below, respectively, the performance of the Fund Benchmark, the MSCI Emerging Markets Index. The Trustees took into account management’s discussion of the Fund’s performance, including the Fund’s recent outperformance of the Peer Group and the Fund Benchmark. The Trustees concluded that the Fund’s overall performance has been satisfactory. With respect to AMG GW&K Emerging Wealth Equity Fund, among other information relating to the Fund’s performance, the Trustees noted that the Fund’s performance for Class Z shares (which share class has the largest amount of assets of all the share classes of the Fund) for the 1-year, 3-year, and 5-year periods ended March 31, 2021 and for the period from the Fund’s inception on March 19, 2015 through March 31, 2021 was below, above, above, and above the median performance of the Peer Group and above the performance of the Fund Benchmark, the MSCI Emerging Markets Index. The Trustees took into account management’s discussion of the Fund’s performance, noting that the Class Z shares of the Fund ranked in the top quintile relative to its Peer Group for the 3-year and 5-year periods and the period from inception through March 31, 2021. The Trustees concluded that the Fund’s overall performance has been satisfactory. With respect to AMG GW&K Core Bond ESG Fund, among other information relating to the Fund’s performance, the Trustees noted that the Fund’s performance for Class I shares (which share class has the earliest inception date and the largest amount of assets of all the share classes of the Fund) for the 1-year, 3-year, 5-year and 10-year periods ended March 31, 2021 was above, above, below, and below, respectively, the median performance of the Peer Group and above, above, at, and below, respectively, the performance of the Fund Benchmark, the Bloomberg Barclays U.S. Aggregate Bond Index. The Trustees took into account management’s discussion of the Fund’s performance, including the reasons for the Fund’s more recent outperformance of the Peer Group and the Fund Benchmark. The Trustees also noted the change in the Fund’s Subadviser in February 2015 and that the performance record prior to that time reflects that of the prior Subadviser. The Trustees | | | | also took into account the fact that the Fund transitioned to include an ESG strategy in 2019. The Trustees concluded that the Fund’s overall performance has been satisfactory. With respect to AMG GW&K Small/Mid Cap Growth Fund, among other information relating to the Fund’s performance, the Trustees noted that the Fund’s performance for Class N shares (which share class has the earliest inception date and the largest amount of assets of all the share classes of the Fund) for the 1-year, 3-year, 5-year, and 10-year periods ended March 31, 2021 was above, below, below, and below, respectively, the median performance of the Peer Group and below the performance of the Fund Benchmark, the Russell 2500® Growth Index. The Trustees took into account management’s discussion of the Fund’s performance, including the reasons for the Fund’s underperformance. The Trustees noted that the Fund ranked in the top third relative to its Peer Group for the 1-year period. The Trustees also took into account the fact that the Fund’s subadviser changed effective March 19, 2021, that the Fund’s investment strategy changed effective March 19, 2021 and further on May 21, 2021, that the Fund Benchmark changed effective May 21, 2021, and that the performance information reflected that of the Fund’s prior subadviser and investment strategy. The Trustees concluded that the Fund’s performance is being addressed. ADVISORY AND SUBADVISORY FEES; FUND EXPENSES; PROFITABILITY; AND ECONOMIES OF SCALE In considering the reasonableness of the advisory fee payable to the Investment Manager, the Trustees reviewed information provided by the Investment Manager at the June 24, 2021 and prior meetings setting forth all revenues and other benefits, both direct and indirect (including any so-called “fallout benefits” such as reputational value derived from the Investment Manager serving as Investment Manager to a Fund), received by the Investment Manager and its affiliates attributable to managing each Fund and all the mutual funds in the AMG Funds Family of Funds; the cost of providing such services; the significant risks undertaken as Investment Manager and sponsor of the Funds, including investment, operational, enterprise, entrepreneurial, litigation, regulatory and compliance risks; and the resulting profitability to the Investment Manager and its affiliates from these relationships. The Trustees also considered the changes to the management, subadvisory, and shareholder servicing fee rates that |
64
|
Annual Renewal of Investment Management and Subadvisory Agreements (continued) |
| | | | | | | | |
were implemented during the past year for AMG GW&K Small/Mid Cap Growth Fund and the changes to the expense caps that were implemented during the past year for AMG GW&K Emerging Wealth Equity Fund and AMG GW&K Small/Mid Cap Growth Fund. The Trustees also considered the amount of the advisory fee retained by the Investment Manager after payment of the subadvisory fee with respect to each Fund. The Trustees also noted payments made or to be made from the Subadviser to the Investment Manager, and other payments made or to be made from the Investment Manager to the Subadviser. The Trustees also considered management’s discussion of the current asset levels of the Funds, and the impact on profitability of both the current asset levels and any future growth of assets of the Funds. In considering the cost of services to be provided by the Investment Manager under each Investment Management Agreement and the profitability to the Investment Manager of its relationship with each Fund, the Trustees noted the undertaking by the Investment Manager to maintain contractual expense limitations for the Funds. The Board also took into account management’s discussion of the advisory fee structure, and the services the Investment Manager provides in performing its functions under each Investment Management Agreement and supervising the Subadviser. Based on the foregoing, the Trustees concluded that the profitability to the Investment Manager is reasonable and that the Investment Manager is not realizing material benefits from economies of scale that would warrant adjustments to the advisory fee at this time. Also with respect to economies of scale, the Trustees noted that as each Fund’s assets increase over time, the Fund may realize other economies of scale to the extent the increase in assets is proportionally greater than the increase in certain other expenses. For each of AMG GW&K Emerging Markets Equity Fund, AMG GW&K Emerging Wealth Equity Fund, and AMG GW&K Core Bond ESG Fund, in considering the reasonableness of the subadvisory fees payable by the Investment Manager to the Subadviser, the Trustees reviewed information regarding the cost to the Subadviser of providing subadvisory services to each Fund and the resulting profitability from these relationships. The Trustees noted that, because the Subadviser is an affiliate of the Investment Manager, a portion of the Subadviser’s revenues or profits might be shared directly or indirectly with the Investment Manager. The Trustees also noted that the subadvisory fees are paid by the Investment Manager out of its advisory fee. The Board also took into account management’s discussion of the subadvisory fee structure, and the services the | | | | Subadviser provides in performing its functions under each Subadvisory Agreement. Based on the foregoing, the Trustees concluded that the profitability to the Subadviser is reasonable and that the Subadviser is not realizing material benefits from economies of scale that would warrant adjustments to the subadvisory fees at this time. Also with respect to economies of scale, the Trustees noted that as a Fund’s assets increase over time, the Fund may realize other economies of scale to the extent the increase in assets is proportionally greater than the increase in certain other expenses. With respect to AMG GW&K Emerging Markets Equity Fund, the Trustees noted that the management fees (which include both the advisory and administration fees) and total expenses (net of applicable expense waivers/reimbursements) of Class I shares (the class of shares which is the primary focus of the Fund’s distribution) of the Fund as of March 31, 2021 were both lower than the average for the Fund’s Peer Group. The Trustees took into account the fact that the Investment Manager has contractually agreed, through March 1, 2022, to limit the Fund’s net annual operating expenses (subject to certain excluded expenses) to 0.87%. The Trustees concluded that, in light of the nature, extent and quality of the services provided by the Investment Manager and the Subadviser (which is an affiliate of the Investment Manager), the foregoing expense limitation and the considerations noted above with respect to the Investment Manager and the Subadviser, the Fund’s advisory and subadvisory fees are reasonable. With respect to AMG GW&K Emerging Wealth Equity Fund, the Trustees noted that the management fees (which include both the advisory and administration fees) and total expenses (net of applicable expense waivers/reimbursements) of Class I shares (the class of shares which is the primary focus of the Fund’s distribution) of the Fund as of March 31, 2021 were both lower than the average for the Fund’s Peer Group. The Trustees took into account the fact that, effective March 1, 2021, the Investment Manager has contractually agreed, through March 1, 2022, to lower the Fund’s contractual expense limitation from 1.05% to 0.90% of the Fund’s net annual operating expenses (subject to certain excluded expenses). The Trustees concluded that, in light of the nature, extent and quality of the services provided by the Investment Manager and the Subadviser (which is an affiliate of the Investment Manager), the foregoing expense limitation and the considerations noted above with respect to the Investment Manager and the Subadviser, the Fund’s advisory and subadvisory fees are reasonable. | | | | With respect to AMG GW&K Core Bond ESG Fund, the Trustees noted that the management fees (which include both the advisory and administration fees) and total expenses (net of applicable expense waivers/reimbursements) of Class I shares of the Fund as of March 31, 2021 were both higher than the average for the Fund’s Peer Group. The Trustees took into account the fact that the Investment Manager has contractually agreed, through March 1, 2022, to limit the Fund’s net annual operating expenses (subject to certain excluded expenses) to 0.48%. The Trustees also took into account management’s discussion of the Fund’s expenses and competitiveness with comparably sized funds and select competitors. The Trustees concluded that, in light of the nature, extent and quality of the services provided by the Investment Manager and the Subadviser (which is an affiliate of the Investment Manager), the foregoing expense limitation and the considerations noted above with respect to the Investment Manager and the Subadviser, the Fund’s advisory and subadvisory fees are reasonable. With respect to AMG GW&K Small/Mid Cap Growth Fund, the Trustees noted that the management fees (which include both the advisory and administration fees) and total expenses (net of applicable expense waivers/reimbursements) of Class I shares (the class of shares which is the primary focus of the Fund’s distribution) of the Fund as of March 31, 2021 were both higher than the average for the Fund’s Peer Group. The Trustees took into account the fact that, effective June 18, 2021, the Investment Manager has contractually agreed, through March 1, 2023, to lower the Fund’s contractual expense limitation from 1.03% to 0.82% of the Fund’s net annual operating expenses (subject to certain excluded expenses). The Trustees also noted that, effective June 18, 2021, the Fund’s management fee rate was reduced. The Trustees also took into account management’s discussion of the Fund’s expenses, including fees and expenses relative to comparably sized funds and select competitors, and the Fund’s small size relative to its peer universe. The Trustees concluded that, in light of the nature, extent and quality of the services provided by the Investment Manager, the foregoing expense limitation and the considerations noted above with respect to the Investment Manager, the Fund’s advisory fees are reasonable. With respect to AMG GW&K Small/Mid Cap Growth Fund, the Trustees also considered information provided by the Investment Manager throughout the previous year related to the benefits of the strategic repositioning of the AMG Funds complex for greater alignment with Affiliated Managers Group, Inc. (“AMG”), in which each fund that was not previously |
65
|
Annual Renewal of Investment Management and Subadvisory Agreements (continued) |
| | | | | | | | |
subadvised by an affiliate of AMG (each affiliate of AMG, an “Affiliate” and collectively, “Affiliates”) was transitioned to an AMG Affiliate subadviser. The Trustees considered that the strategic repositioning was expected to create value for the Fund, the other funds in the AMG Funds complex and their shareholders through enhanced resources and competitive fee levels. The Trustees noted the expectations that the changes would result in bringing the full range of AMG’s resources to bear on the growth and success of the AMG Funds, streamlining the lineup of funds in the AMG Funds complex and reducing the number of subadvisers in the AMG Funds complex, significantly reducing strategy overlap and providing more differentiated investment solutions for the AMG Funds complex that are otherwise not available to U.S. retail investors. The Trustees further considered the expectation that the repositioning would bring AMG’s strong partnerships in support of the Fund and the AMG Funds complex as a whole and enable AMG Funds to bring the best capabilities of AMG’s Affiliates to the Fund and the rest of the AMG Funds complex. The Trustees noted that AMG’s relationship with its Affiliates will also allow the Fund to have greater insight into the Affiliates’ compliance and business platform than is generally possible with third party subadvisers, aiding the ongoing monitoring of subadvisers. * * * * | | | | After consideration of the foregoing, the Trustees also reached the following conclusions (in addition to the conclusions discussed above) regarding the Investment Management and Subadvisory Agreements: (a) the Investment Manager and the Subadviser have demonstrated that they possess the capability and resources to perform the duties required of them under each Investment Management Agreement and each Subadvisory Agreement and (b) the Investment Manager and Subadviser maintain appropriate compliance programs. Based on all of the above-mentioned factors and their related conclusions, with no single factor or conclusion being determinative and with each Trustee not necessarily attributing the same weight to each factor, the Trustees concluded that approval of each Investment Management Agreement and each Subadvisory Agreement would be in the best interests of the applicable Fund and its shareholders. Accordingly, on June 24, 2021, the Trustees, and separately a majority of the Independent Trustees, voted to approve the Investment Management Agreement for each Fund and the Subadvisory Agreement for each of AMG GW&K Emerging Markets Equity Fund, AMG GW&K Emerging Wealth Equity Fund, and AMG GW&K Core Bond ESG Fund. 1 The Trustees determined that the conditions surrounding COVID-19 constituted unforeseen or emergency circumstances and that reliance on the | | | | Securities and Exchange Commission’s (“SEC”) exemptive order, which provides relief from the in-person voting requirements of the Investment Company Act of 1940, as amended (the “1940 Act”), in certain circumstances (the “In-Person Relief”), was necessary or appropriate due to the circumstances related to current or potential effects of COVID-19. The Trustees unanimously wished to rely on the In-Person Relief with respect to the approval of those matters on the agenda for the June 24, 2021 meeting that would otherwise require in-person votes under the 1940 Act. See Investment Company Release No. 33897 (June 19, 2020). This exemptive order supersedes, in part, a similar, earlier exemptive order issued by the SEC (Investment Company Release No. 33824 (March 25, 2020)). 2 At a meeting held via telephone and videoconference on March 17-18, 2021, the Board of AMG Funds IV, and separately a majority of the Independent Trustees, approved the Subadvisory Agreement with respect to AMG GW&K Small/Mid Cap Growth Fund (the “Small/Mid Cap Growth Subadvisory Agreement”). The Small/Mid Cap Growth Subadvisory Agreement was subsequently approved by the Fund’s shareholders at a special meeting held on June 18, 2021, for an initial two-year period. References herein to the “Subadvisory Agreements” refer to the Subadvisory Agreements for AMG GW&K Emerging Markets Equity Fund, AMG GW&K Emerging Wealth Equity Fund, and AMG GW&K Core Bond ESG Fund, and do not include the Small/Mid Cap Growth Subadvisory Agreement. |
66
THIS PAGE INTENTIONALLY LEFT BLANK
THIS PAGE INTENTIONALLY LEFT BLANK
| | |
| | |
| | | | |
INVESTMENT MANAGER AND ADMINISTRATOR AMG Funds LLC 680 Washington Blvd., Suite 500 Stamford, CT 06901 800.548.4539 DISTRIBUTOR AMG Distributors, Inc. 680 Washington Blvd., Suite 500 Stamford, CT 06901 800.548.4539 SUBADVISER GW&K Investment Management, LLC 222 Berkeley St. Boston, MA 02116 | | CUSTODIAN The Bank of New York Mellon Mutual Funds Custody 6023 Airport Road Oriskany, NY 13424 LEGAL COUNSEL Ropes & Gray LLP Prudential Tower, 800 Boylston Street Boston, MA 02199-3600 TRANSFER AGENT BNY Mellon Investment Servicing (US) Inc. Attn: AMG Funds 4400 Computer Drive Westborough, MA 01581 800.548.4539 | | This report is prepared for the Funds’ shareholders. It is authorized for distribution to prospective investors only when preceded or accompanied by an effective prospectus. To receive a free copy of the prospectus or Statement of Additional Information, which includes additional information about Fund Trustees, please contact us by calling 800.548.4539. Distributed by AMG Distributors, Inc., member FINRA/SIPC. Current net asset values per share for each Fund are available on the Funds’ website at amgfunds.com. A description of the policies and procedures each Fund uses to vote its proxies is available: (i) without charge, upon request, by calling 800.548.4539, or (ii) on the Securities and Exchange Commission’s (SEC) website at sec.gov. For information regarding each Fund’s proxy voting record for the 12-month period ended June 30, call 800.548.4539 or visit the SEC website at sec.gov. The Funds file their complete schedule of portfolio holdings with the SEC for the first and third quarters of each fiscal year as an exhibit to their reports on Form N-PORT. The Funds’ portfolio holdings on Form N-PORT are available on the SEC’s website at sec.gov and the Funds’ website at amgfunds.com. To review a complete list of the Funds’ portfolio holdings, or to view the most recent semiannual report or annual report, please visit amgfunds.com. |
| | |
| | |
| | | | | | | | |
BALANCED FUNDS AMG GW&K Global Allocation GW&K Investment Management, LLC AMG FQ Global Risk-Balanced First Quadrant, L.P. EQUITY FUNDS AMG Beutel Goodman International Equity Beutel, Goodman & Company Ltd. AMG Boston Common Global Impact Boston Common Asset Management, LLC AMG Managers CenterSquare Real Estate CenterSquare Investment Management LLC AMG Frontier Small Cap Growth Frontier Capital Management Co., LLC AMG GW&K Small Cap Core AMG GW&K Small Cap Value AMG GW&K Small/Mid Cap AMG GW&K Small/Mid Cap Growth AMG GW&K Emerging Markets Equity AMG GW&K Emerging Wealth Equity AMG GW&K International Small Cap GW&K Investment Management, LLC AMG Montrusco Bolton Large Cap Growth Montrusco Bolton Investments, Inc. | | | | AMG Renaissance Large Cap Growth The Renaissance Group LLC AMG River Road Dividend All Cap Value AMG River Road Focused Absolute Value AMG River Road International Value Equity AMG River Road Large Cap Value Select AMG River Road Mid Cap Value AMG River Road Small-Mid Cap Value AMG River Road Small Cap Value River Road Asset Management, LLC AMG TimesSquare Emerging Markets Small Cap AMG TimesSquare Global Small Cap AMG TimesSquare International Small Cap AMG TimesSquare Mid Cap Growth AMG TimesSquare Small Cap Growth TimesSquare Capital Management, LLC AMG Veritas Asia Pacific AMG Veritas China AMG Veritas Global Focus AMG Veritas Global Real Return Veritas Asset Management LLP AMG Yacktman AMG Yacktman Focused AMG Yacktman Global AMG Yacktman Special Opportunities Yacktman Asset Management LP | | | | FIXED INCOME FUNDS AMG Beutel Goodman Core Plus Bond Beutel, Goodman & Company Ltd. AMG GW&K Core Bond ESG AMG GW&K Enhanced Core Bond ESG AMG GW&K ESG Bond AMG GW&K High Income AMG GW&K Municipal Bond AMG GW&K Municipal Enhanced Yield GW&K Investment Management, LLC |
| | | | |
amgfunds.com | | 103121 | | AR069 |
| | |
 | | ANNUAL REPORT |
| | | | | | | | |
| | | | | AMG Funds October 31, 2021 
|
| | | | | AMG River Road Mid Cap Value Fund (formerly AMG Managers Fairpointe Mid Cap Fund) |
| | | | | Class N: CHTTX | | Class I: ABMIX | | Class Z: ABIZX |
| | | | | AMG River Road Large Cap Value Select Fund (formerly AMG FQ Long-Short Equity Fund) |
| | | | | Class N: FQUAX | | Class I: MEQFX | | |
| | | | | AMG River Road Small Cap Value Fund |
| | | | | Class N: ARSVX | | Class I: ARSIX | | Class Z: ARZMX |
| | | | | AMG River Road Dividend All Cap Value Fund |
| | | | | Class N: ARDEX | | Class I: ARIDX | | Class Z: ARZDX |
| | | | | AMG River Road Small-Mid Cap Value Fund |
| | | | | Class N: ARSMX | | Class I: ARIMX | | Class Z: ARSZX |
| | | | | AMG River Road International Value Equity Fund (formerly AMG River Road Long-Short Fund) |
| | | | | Class N: ARLSX | | Class I: ALSIX | | Class��Z: ARLZX |
| | | | | AMG River Road Focused Absolute Value Fund |
| | | | | Class N: ARRFX | | Class I: AFAVX | | Class Z: ARRZX |
| | |
| amgfunds.com | | 103121 AR082 |
| | |
| | | AMG Funds Annual Report — October 31, 2021 |
| | | | | | | | | | | | | | | | |
| | | | | | |
| | | | | | | | | | | | | | | | | |
| | | TABLE OF CONTENTS | | | | | | | | | | PAGE | |
| | | | |
| | | LETTER TO SHAREHOLDERS | | | 2 | |
| | | |
| | | ABOUT YOUR FUND’S EXPENSES | | | 3 | |
| | | |
| | | PORTFOLIO MANAGER’S COMMENTS, FUND SNAPSHOTS AND SCHEDULES OF PORTFOLIO INVESTMENTS | | | | |
| | | | | | |
| | | AMG River Road Mid Cap Value Fund | | | 5 | | | | | | | AMG River Road Small-Mid Cap Value Fund | | | 28 | |
| | | | | | |
| | | AMG River Road Large Cap Value Select Fund | | | 11 | | | | | | | AMG River Road International Value Equity Fund | | | 34 | |
| | | | | | |
| | | AMG River Road Small Cap Value Fund | | | 17 | | | | | | | AMG River Road Focused Absolute Value Fund | | | 40 | |
| | | | | | |
| | | AMG River Road Dividend All Cap Value Fund | | | 22 | | | | | | | | | | | |
| | | | | | | | | | | | | | | | |
| | | |
| | | FINANCIAL STATEMENTS | | | | |
| | | | | | |
| | | Statement of Assets and Liabilities | | | | | | | | | | | | | 47 | |
| | | | | |
| | | Balance sheets, net asset value (NAV) per share computations and cumulative distributable earnings (loss) | | | | | | | | | | | |
| | | | | | |
| | | Statement of Operations | | | | | | | | | | | | | 51 | |
| | | | | |
| | | Detail of sources of income, expenses, and realized and unrealized gains (losses) during the fiscal year | | | | | | | | | | | |
| | | |
| | | Statements of Changes in Net Assets | | | 53 | |
| | | | | |
| | | Detail of changes in assets for the past two fiscal years | | | | | | | | | | | |
| | | | | | |
| | | Financial Highlights | | | | | | | | | | | | | 56 | |
| | | | | |
| | | Historical net asset values per share, distributions, total returns, income and expense ratios, turnover ratios and net assets | | | | | | | | | | | |
| | | |
| | | Notes to Financial Statements | | | 76 | |
| | | | | |
| | | Accounting and distribution policies, details of agreements and transactions with Fund management and affiliates, and descriptions of certain investment risks | | | | | | | | | | | |
| | | |
| | | REPORT OF INDEPENDENT REGISTERED PUBLIC ACCOUNTING FIRM | | | 89 | |
| | | |
| | | OTHER INFORMATION | | | 90 | |
| | | |
| | | TRUSTEES AND OFFICERS | | | 93 | |
| | | |
| | ANNUAL RENEWAL OF INVESTMENT MANAGEMENT AND SUBADVISORY AGREEMENTS | | | 97 | |
| | | | | | |
| | | | | | | | | | | | | | | | | |
| |
| | Nothing contained herein is to be considered an offer, sale or solicitation of an offer to buy shares of any series of the AMG Funds Family of Funds. Such offering is made only by prospectus, which includes details as to offering price and other material information. | |
| | |
| | Letter to Shareholders |
Dear Shareholder:
The fiscal year ended October 31, 2021, was marked by the continued extraordinary recovery amid an unprecedented global effort to stop the COVID-19 pandemic. Equities rallied to new record highs amid better-than-expected corporate earnings, colossal fiscal and monetary stimulus programs, and an improving economic backdrop. Since the market bottom on March 23, 2020, the S&P 500® Index has gained over 111%. Businesses and consumers contended with disrupted supply chains and rising prices on a wide range of goods such as lumber and gasoline, and outbreaks of coronavirus variants kept the world on edge. Volatility increased in September as investors grew more concerned about rising inflation and more hawkish global central bank policies, but equities were resilient and finished the fiscal year with a strong rally.
The S&P 500® gained 42.91% during the period and all sectors produced double-digit returns, but there was very wide dispersion in performance. Energy and financials led the market with returns of 111.38% and 72.14%, respectively. On the other hand, utilities and consumer staples lagged with returns of 10.64% and 19.02%, respectively. Value stocks edged out Growth stocks as the Russell 1000® Value Index returned 43.76% compared to the 43.21% return for the Russell 1000® Growth Index. Small cap stocks outperformed as the Russell 2000® Index experienced its best quarter (fourth quarter 2020) on record. Within small caps, the Value-Growth disparity was much more pronounced as the Russell 2000® Value Index returned 64.30% compared to 38.45% for the Russell 2000® Growth Index. Outside the U.S., foreign developed markets lagged their U.S. counterparts with a 34.18% return for the MSCI EAFE Index. A major regulatory crackdown in China shook investor confidence in Chinese equities and caused emerging markets to underperform with a 16.96% return for the MSCI Emerging Markets Index.
Interest rates lifted off from near-historic lows as the vaccine rollout initiated a return to normalcy and the economic outlook improved. The 10-year Treasury yield rose 69 basis points to 1.55% and ended the fiscal year not far off its post-pandemic high. The Bloomberg U.S. Aggregate Bond Index, a broad measure of U.S. bond market performance, lost 0.48% over the period. Healthy risk appetite drove credit spreads tighter and helped investment-grade corporate bonds produce a modestly positive 2.18% return. The global search for yield helped high-yield bonds outperform the investment-grade market with a 10.53% return as measured by the return of the Bloomberg U.S. Corporate High Yield Bond Index. Municipal bonds benefited from a strong technical backdrop and drove a 2.64% return for the Bloomberg Municipal Bond Index.
AMG Funds appreciates the privilege of providing investment tools to you and your clients. Our foremost goal is to provide investment solutions that help our shareholders successfully reach their long-term investment goals. AMG Funds provides access to a distinctive array of actively managed return-oriented investment strategies. We thank you for your continued confidence and investment in AMG Funds. You can rest assured that under all market conditions our team is focused on delivering excellent investment management services for your benefit.
Respectfully,

Keitha Kinne
President
AMG Funds
| | | | | | | | | | | | | | |
| Average Annual Total Returns | | Periods ended
October 31, 2021* | |
| | | | |
| Stocks: | | | | 1 Year | | | 3 Years | | | 5 Years | |
| | | | |
Large Cap | | (S&P 500® Index) | | | 42.91 | % | | | 21.48% | | | | 18.93% | |
| | | | |
Small Cap | | (Russell 2000® Index) | | | 50.80 | % | | | 16.47% | | | | 15.52% | |
| | | | |
International | | (MSCI All Country World Index ex USA) | | | 29.66 | % | | | 12.00% | | | | 9.77% | |
| Bonds: | | | | | | | | | | | |
| | | | |
Investment Grade | | (Bloomberg U.S. Aggregate Bond Index) | | | (0.48 | )% | | | 5.63% | | | | 3.10% | |
| | | | |
High Yield | | (Bloomberg U.S. Corporate High Yield Bond Index) | | | 10.53 | % | | | 7.43% | | | | 6.40% | |
| | | | |
Tax-exempt | | (Bloomberg Municipal Bond Index) | | | 2.64 | % | | | 5.17% | | | | 3.41% | |
| | | | |
Treasury Bills | | (ICE BofAML U.S. 6-Month Treasury Bill Index) | | | 0.11 | % | | | 1.37% | | | | 1.32% | |
*Source: FactSet. Past performance is no guarantee of future results.
2
|
About Your Fund’s Expenses |
| | | | | | | | |
As a shareholder of a Fund, you may incur two types of costs: (1) transaction costs, which may include sales charges (loads) on purchase payments; redemption fees; and exchange fees; and (2) ongoing costs, including management fees; distribution (12b-1) fees; and other Fund expenses. This example is intended to help you understand your ongoing costs (in dollars) of investing in the Fund and to compare these costs with the ongoing costs of investing in other mutual funds. The example is based on $1,000 invested at the beginning of the period and held for the entire period as indicated below. ACTUAL EXPENSES The first line of the following table provides information about the actual account values and | | | | actual expenses. You may use the information in this line, together with the amount you invested, to estimate the expenses that you paid over the period. Simply divide your account value by $1,000 (for example, an $8,600 account value divided by $1,000 = 8.6), then multiply the result by the number in the first line under the heading entitled “Expenses Paid During Period” to estimate the expenses you paid on your account during this period. HYPOTHETICAL EXAMPLE FOR COMPARISON PURPOSES The second line of the following table provides information about hypothetical account values and hypothetical expenses based on the Fund’s actual expense ratio and an assumed annual rate of return of 5% before expenses, which is not the Fund’s | | | | actual return. The hypothetical account values and expenses may not be used to estimate the actual ending account balance or expenses you paid for the period. You may use this information to compare the ongoing costs of investing in the Fund and other funds by comparing this 5% hypothetical example with the 5% hypothetical examples that appear in the shareholder reports of other funds. Please note that the expenses shown in the table are meant to highlight your ongoing costs only and do not reflect any transactional costs, such as sales charges (loads), redemption fees, or exchange fees. Therefore, the second line of the table is useful in comparing ongoing costs only, and will not help you determine the relative total costs of owning different funds. |
| | | | | | | | |
| | | | | | | | |
Six Months Ended October 31, 2021 | | Expense
Ratio for
the Period | | Beginning
Account
Value
05/01/21 | | Ending
Account
Value
10/31/21 | | Expenses
Paid
During
the Period* |
AMG River Road Mid Cap Value Fund |
|
Based on Actual Fund Return |
| | | | |
Class N | | 1.11% | | $1,000 | | $1,070 | | $5.79 |
| | | | |
Class I | | 0.83% | | $1,000 | | $1,072 | | $4.33 |
| | | | |
Class Z | | 0.78% | | $1,000 | | $1,072 | | $4.07 |
|
Based on Hypothetical 5% Annual Return |
| | | | |
Class N | | 1.11% | | $1,000 | | $1,020 | | $5.65 |
| | | | |
Class I | | 0.83% | | $1,000 | | $1,021 | | $4.23 |
| | | | |
Class Z | | 0.78% | | $1,000 | | $1,021 | | $3.97 |
| | | | |
| | | | | | | | |
AMG River Road Large Cap Value Select Fund |
|
Based on Actual Fund Return |
| | | | |
Class N | | 0.97% | | $1,000 | | $1,052 | | $5.02 |
| | | | |
Class I | | 0.65% | | $1,000 | | $1,053 | | $3.36 |
|
Based on Hypothetical 5% Annual Return |
| | | | |
Class N | | 0.97% | | $1,000 | | $1,020 | | $4.94 |
| | | | |
Class I | | 0.65% | | $1,000 | | $1,022 | | $3.31 |
| | | | | | | | |
Six Months Ended October 31, 2021 | | Expense
Ratio for
the Period | | Beginning
Account
Value
05/01/21 | | Ending
Account
Value
10/31/21 | | Expenses
Paid
During
the Period* |
AMG River Road Small Cap Value Fund |
|
Based on Actual Fund Return |
| | | | |
Class N | | 1.36% | | $1,000 | | $997 | | $6.85 |
| | | | |
Class I | | 1.10% | | $1,000 | | $999 | | $5.54 |
| | | | |
Class Z | | 1.02% | | $1,000 | | $999 | | $5.14 |
|
Based on Hypothetical 5% Annual Return |
| | | | |
Class N | | 1.36% | | $1,000 | | $1,018 | | $6.92 |
| | | | |
Class I | | 1.10% | | $1,000 | | $1,020 | | $5.60 |
| | | | |
Class Z | | 1.02% | | $1,000 | | $1,020 | | $5.19 |
| | | | |
| | | | | | | | |
AMG River Road Dividend All Cap Value Fund |
|
Based on Actual Fund Return |
| | | | |
Class N | | 1.07% | | $1,000 | | $1,030 | | $5.48 |
| | | | |
Class I | | 0.82% | | $1,000 | | $1,031 | | $4.20 |
| | | | |
Class Z | | 0.78% | | $1,000 | | $1,032 | | $4.00 |
|
Based on Hypothetical 5% Annual Return |
| | | | |
Class N | | 1.07% | | $1,000 | | $1,020 | | $5.45 |
| | | | |
Class I | | 0.82% | | $1,000 | | $1,021 | | $4.18 |
| | | | |
Class Z | | 0.78% | | $1,000 | | $1,021 | | $3.97 |
3
|
About Your Fund’s Expenses (continued) |
| | | | | | | | |
Six Months Ended October 31, 2021 | | Expense
Ratio for
the Period | | Beginning
Account
Value
05/01/21 | | Ending
Account
Value
10/31/21 | | Expenses
Paid
During
the Period* |
AMG River Road Small-Mid Cap Value Fund |
|
Based on Actual Fund Return |
| | | | |
Class N | | 1.27% | | $1,000 | | $995 | | $6.39 |
| | | | |
Class I | | 1.02% | | $1,000 | | $996 | | $5.14 |
| | | | |
Class Z | | 0.98% | | $1,000 | | $997 | | $4.93 |
|
Based on Hypothetical 5% Annual Return |
| | | | |
Class N | | 1.27% | | $1,000 | | $1,019 | | $6.46 |
| | | | |
Class I | | 1.02% | | $1,000 | | $1,020 | | $5.20 |
| | | | |
Class Z | | 0.98% | | $1,000 | | $1,020 | | $4.99 |
| | | | |
| | | | | | | | |
AMG River Road International Value Equity Fund** |
|
Based on Actual Fund Return |
| | | | |
Class N | | 1.28% | | $1,000 | | $1,013 | | $6.49 |
| | | | |
Class I | | 1.07% | | $1,000 | | $1,014 | | $5.43 |
| | | | |
Class Z | | 0.98% | | $1,000 | | $1,015 | | $4.98 |
|
Based on Hypothetical 5% Annual Return |
| | | | |
Class N | | 1.28% | | $1,000 | | $1,019 | | $6.51 |
| | | | |
Class I | | 1.07% | | $1,000 | | $1,020 | | $5.45 |
| | | | |
Class Z | | 0.98% | | $1,000 | | $1,020 | | $4.99 |
| | | | | | | | |
Six Months Ended
October 31, 2021 | | Expense
Ratio for
the Period | | Beginning
Account
Value
05/01/21 | | Ending
Account
Value
10/31/21 | | Expenses
Paid
During
the Period* |
AMG River Road Focused Absolute Value Fund |
|
Based on Actual Fund Return |
| | | | |
Class N | | 1.08% | | $1,000 | | $979 | | $5.39 |
| | | | |
Class I | | 0.82% | | $1,000 | | $980 | | $4.09 |
| | | | |
Class Z | | 0.78% | | $1,000 | | $980 | | $3.89 |
|
Based on Hypothetical 5% Annual Return |
| | | | |
Class N | | 1.08% | | $1,000 | | $1,020 | | $5.50 |
| | | | |
Class I | | 0.82% | | $1,000 | | $1,021 | | $4.18 |
| | | | |
Class Z | | 0.78% | | $1,000 | | $1,021 | | $3.97 |
| * | Expenses are equal to the Fund’s annualized expense ratio multiplied by the average account value over the period, multiplied by the number of days in the most recent fiscal half-year (184), then divided by 365. |
| ** | Excludes interest expense and dividends on short positions. If included, your annualized expense ratios would be 1.71%, 1.50% and 1.41% for Class N, Class I and Class Z, respectively, and your actual and hypothetical expenses paid during the period would be $8.69, $7.61 and $7.16, and $8.68, $7.63 and $7.17 for Class N, Class I and Class Z, respectively. The fund stopped investing in short positions on August 8, 2021. |
4
|
AMG River Road Mid Cap Value Fund Portfolio Manager’s Comments (unaudited) |
| | | | | | | | |
OVERVIEW For the fiscal year ended October 31, 2021, AMG River Road Mid Cap Value Fund (the “Fund”) Class N shares returned 50.65%, outpacing the 48.60% return for the Russell Midcap® Value Index, the Fund’s current benchmark, and the 48.90% return for the Fund’s prior benchmark, the S&P MidCap 400® Index. On March 17-18, 2021, the Fund’s Board of Trustees approved the appointment of River Road Asset Management, LLC (“River Road”) as interim subadviser to the Fund effective March 19, 2021, as well as a change to the Fund’s name and benchmark. On June 14, 2021, the Fund’s shareholders approved the appointment of River Road as the subadviser to the Fund. MARKET AND PERFORMANCE REVIEW During the first portion of the fiscal year under the Fund’s prior subadviser, the Fund outpaced both the former and current benchmark. The Fund benefited from strong stock performance within the communication services and consumer discretionary sectors. This was partially offset by stock performance in the information technology sector. During the second portion of the fiscal year under River Road, the Fund continued to outpace both the former and current benchmarks. The sector with the largest positive contribution to relative return during this period was financials, which benefited from strong stock selection and an overweight allocation. The sector with the largest negative contribution to relative return was real estate, which suffered from an underweight allocation. The top contributing holdings in the Fund were KKR & Co., Inc. (KKR) and Ares Management Corp. (ARES). KKR is a leading global alternative asset manager. The firm generates highly visible earnings (87% of AUM has a duration of at least eight years) and expects to grow at double-digit rates over the next several years. During 2021, management fees, | | | | fee-related earnings, and adjusted book value per share have grown at attractive rates. Management expects $4-5/share of after-tax distributable earnings by 2023-2024 (versus $2 today). Ares is a leading global alternative investment manager. The business benefits from long-term top-line visibility, massive free cash flows, and insider ownership, along with a compelling growth outlook. During 2021, the company benefited from strong results with fee related earnings, record fundraising, and strong deployment activity. The bottom contributing holdings in the Fund were GoHealth, Inc. (Cl A) (GOCO) and Dollar Tree, Inc. (DLTR). GoHealth is a distribution platform primarily selling Medicare Advantage plans. The firm provides the 11,000 people turning 65 every day an independent platform to determine their most appropriate health care plan. Shares suffered after the company cut EBITDA guidance due to increased cost from a tight labor market and ineffective retention efforts in training programs. We misjudged the cost structure and our inability to project future cash flows. We exited the position. Dollar Tree is a leading discount retailer in the U.S. and Canada. The business is spilt between the $1 price point Dollar Tree business (71% of profits) and the multi-price point Family Dollar (29% of profits). Despite Family Dollar posting its best post-merger operating profit and an impressive two-year same-store-sales comp, the stock declined as continued disruption in the global supply chain resulted in higher-than-expected freight costs and a material reduction in annual earnings guidance for Dollar Tree. The rapid rise in freight costs is particularly challenging for the Dollar Tree banner, as it remains the only chain with principally $1 pricing. POSITIONING AND OUTLOOK The market has spent the past six months transitioning from the early, euphoric stage of recovery to a point in this unorthodox cycle where a | | | | solid wall of worry has been constructed. Investor concerns are not based on the typical factors that kill a bull market, but rather uncertainty regarding how long it will take to put COVID-19 and its accompanying fear in the rearview and for market forces to reconcile heavily damaged supply chains with the pent-up demand of consumers and businesses. From our perspective, these challenges are shorter term in nature with solutions that are currently in place and working. We believe resolution will simply require a bit more time. Additionally, many of the other elements that support a rising market (and strong performance by small- and mid-cap value stocks) remain intact, including robust growth expectations, strong employment, and tight credit spreads. Aside from the timely reconciliation of supply chain issues and higher energy prices, the biggest risk we are focused on is valuations. While mid cap value stocks look very attractive relative to mid-cap growth, they are still quite expensive on an absolute basis. On their own, high valuations rarely kill a bull market but they could severely limit upside and greatly amplify volatility, even in a booming economy. In our opinion, the combination of these opportunities and challenges creates an environment where fundamentals and intrinsic valuation matter—a lot! A market where active stock picking can shine, and, from our current perspective, the best opportunities are likely to be found among attractively priced, high quality mid cap stocks. This commentary reflects the viewpoints of River Road Asset Management as of October 31, 2021, and is not intended as a forecast or guarantee of future results. |
| | | | | | | | |
5
|
AMG River Road Mid Cap Value Fund Portfolio Manager’s Comments (continued) |
CUMULATIVE TOTAL RETURN PERFORMANCE
AMG River Road Mid Cap Value Fund’s cumulative total return is based on the daily change in net asset value (NAV), and assumes that all dividends and distributions were reinvested. The graph compares a hypothetical $10,000 investment made in the AMG River Road Mid Cap Value Fund’s Class N shares on October 31, 2011, to a $10,000 investment made in the Russell Midcap® Value Index and S&P MidCap 400® Index for the same time period. The graph and table do not reflect the deduction of taxes that a shareholder would pay on a Fund distribution or redemption of shares. The listed returns for the Fund are net of expenses and the returns for the indexes exclude expenses. Total returns would have been lower had certain expenses not been reduced.
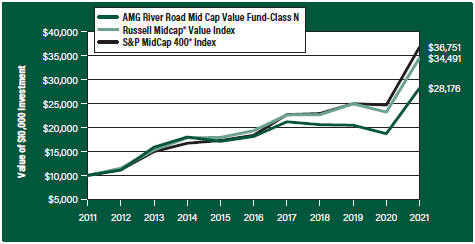
The table below shows the average annual total returns for the AMG River Road Mid Cap Value Fund and the Russell Midcap® Value Index and S&P MidCap 400® Index for the same time periods ended October 31, 2021.
| | | | | | | | | | | | | | | | | | | | |
| Average Annual Total Returns1 | | One
Year | | | Five
Years | | | Ten
Years | | | Since
Inception | | | Inception
Date | |
AMG River Road Mid Cap Value Fund2, 3, 4, 5, 6, 7, 8, 9, 10, 11, 12 | | | | | | | | | |
| | | | | |
Class N | | | 50.65 | % | | | 9.23 | % | | | 10.92 | % | | | 11.43 | % | | | 09/19/94 | |
| | | | | |
Class I | | | 51.11 | % | | | 9.52 | % | | | 11.20 | % | | | 9.39 | % | | | 07/06/04 | |
| | | | | |
Class Z | | | 51.18 | % | | | – | | | | – | | | | 6.83 | % | | | 09/29/17 | |
| | | | | |
Russell Midcap® Value Index13 | | | 48.60 | % | | | 12.30 | % | | | 13.18 | % | | | – | | | | 09/19/94 | † |
| | | | | |
S&P MidCap 400® Index14 | | | 48.90 | % | | | 14.89 | % | | | 13.90 | % | | | 12.28 | % | | | 09/19/94 | † |
The performance data shown represents past performance. Past performance is not a guarantee of future results. Current performance may be lower or higher than the performance data quoted. The investment return and principal value of an investment will fluctuate so that an investor’s shares, when redeemed, may be worth more or less than their original cost.
Investors should carefully consider the Fund’s investment objectives, risks, charges and expenses before investing. For performance information through the most recent month end, current net asset values per share for the Fund and other information, please call 800.548.4539 or visit our website at amgfunds.com for a free prospectus. Read it carefully before investing or sending money.
Distributed by AMG Distributors, Inc., member FINRA/SIPC.
| † | Date reflects the inception date of the Fund, not the index. |
| 1 | Total return equals income yield plus share price change and assumes reinvestment of all dividends and capital gain distributions. Returns are net of fees and may reflect offsets of Fund expenses as described in the prospectus. No adjustment has been made for taxes payable by shareholders on their reinvested dividends and |
| | |
| |
| | capital gain distributions. Returns for periods greater than one year are annualized. The listed returns on the Fund are net of expenses and based on the published NAV as of October 31, 2021. All returns are in U.S. dollars ($). |
| |
| | 2 From time to time, the Fund’s advisor has waived its fees and/or absorbed Fund expenses, which has resulted in higher returns. |
| |
| | 3 As of March 19, 2021, the Fund’s Subadviser was changed to River Road Asset Management, LLC. Prior to March 19, 2021, the Fund was known as the AMG Managers Fairpointe Mid Cap Fund and had different principal investment strategies and corresponding risks. Performance shown for periods prior to March 19, 2021, reflects the performance and investment strategies of the Fund’s previous Subadvisor, Fairpointe Capital LLC. The Fund’s past performance would have been different if the Fund were managed by the current Subadviser and strategy, and the Fund’s prior performance record might be less pertinent for investors considering whether to purchase shares of the Fund. |
| |
| | 4 The Fund is subject to risks associated with investments in mid-capitalization companies such as greater price volatility, lower trading volume, and less liquidity than the stocks of larger, more established companies. |
| |
| | 5 The Fund is subject to risks associated with investments in small-capitalization companies, such as erratic earnings patterns, competitive conditions, limited earnings history and a reliance on one or a limited number of products. |
| |
| | 6 The Fund may invest in derivatives such as options and futures; the complexity and rapidly changing structure of derivatives markets may increase the possibility of market losses. |
| |
| | 7 Investments in international securities are subject to certain risks of overseas investing including currency fluctuations and changes in political and economic conditions, which could result in significant market fluctuations. These risks are magnified in emerging markets. |
| |
| | 8 Companies that are in similar industry sectors may be similarly affected by particular economic or market events; to the extent the Fund has substantial holdings within a particular sector, the risks associated with that sector increase. |
| |
| | 9 The Fund invests in growth stocks, which may be more sensitive to market movements because their prices tend to reflect future investor expectations rather than just current profits. Growth stocks may underperform value stocks during given periods. |
| |
| | 10 The Fund invests in value stocks, which may perform differently from the market as a whole and |
| |
| | |
6
|
AMG River Road Mid Cap Value Fund Portfolio Manager’s Comments (continued) |
| | | | | | | | |
may be undervalued by the market for a long period of time. 11 Market prices of investments held by the Fund may fall rapidly or unpredictably due to a variety of economic or political factors, market conditions, disasters or public health issues, or in response to events that affect particular industries or companies. 12 The Fund is subject to special risk considerations similar to those associated with the direct ownership of real estate. Real estate valuations may be subject to factors such as changing general and local economic, financial, competitive, and environmental conditions. | | | | 13 On March 19, 2021, the primary benchmark changed from the S&P MidCap 400® Index to the Russell Midcap® Value Index. The Russell Midcap® Value Index measures the performance of those Russell Midcap® companies with lower price-to-book ratios and lower forecasted growth values. The stocks are also members of the Russell 1000® Value Index. Unlike the Fund, the Russell Midcap® Value Index is unmanaged, is not available for investment and does not incur expenses. 14 The S&P MidCap 400® Index provides investors with a benchmark for mid-sized companies. The Index, which is distinct from the large-cap S&P 500®, measures the performance of mid-sized companies, | | | | reflecting the distinctive risk and return characteristics of this market segment. Unlike the Fund, the S&P MidCap 400® Index is unmanaged, is not available for investment and does not incur expenses. The Russell Midcap® Value Index is a trademark of the London Stock Exchange Group companies. The S&P Index is proprietary data of Standard & Poor’s, a division of McGraw-Hill Companies, Inc. Not FDIC insured, nor bank guaranteed. May lose value. |
7
|
AMG River Road Mid Cap Value Fund Fund Snapshots (unaudited) October 31, 2021 |
PORTFOLIO BREAKDOWN
| | |
| Sector | | % of
Net Assets |
| | |
Financials | | 20.1 |
| | |
Consumer Discretionary | | 16.8 |
| | |
Communication Services | | 15.7 |
| | |
Industrials | | 14.7 |
| | |
Consumer Staples | | 7.4 |
| | |
Energy | | 7.2 |
| | |
Health Care | | 7.0 |
| | |
Information Technology | | 4.8 |
| | |
Materials | | 4.0 |
| | |
Real Estate | | 1.5 |
| | |
Short-Term Investments | | 0.1 |
| | |
Other Assets Less Liabilities | | 0.7 |
TOP TEN HOLDINGS
| | |
| Security Name | | % of
Net Assets |
KKR & Co., Inc. | | 5.5 |
| | |
News Corp., Class A | | 4.5 |
| | |
Liberty Media Corp.-Liberty SiriusXM, Class C | | 4.4 |
| | |
Willis Towers Watson PLC (United Kingdom) | | 3.8 |
| | |
Advance Auto Parts, Inc. | | 3.6 |
| | |
Liberty Broadband Corp., Class C | | 3.6 |
| | |
LKQ Corp. | | 3.4 |
| | |
Air Transport Services Group, Inc. | | 3.2 |
| | |
NCR Corp. | | 3.2 |
| | |
NVR, Inc. | | 3.0 |
| | | |
Top Ten as a Group | | 38.2 |
| | |
Because a fund’s strategy may result in multiple investments in particular sectors of the economy, its performance may depend on the performance of those sectors and may fluctuate more widely than investments diversified across more sectors. For additional information on these and other risk considerations, please see the Fund’s prospectus.
Any sectors, industries, or securities discussed should not be perceived as investment recommendations. Mention of a specific security should not be considered a recommendation to buy or solicitation to sell that security. Specific securities mentioned in this report may have been sold from the Fund’s portfolio of investments by the time you receive this report.
8
|
AMG River Road Mid Cap Value Fund Schedule of Portfolio Investments October 31, 2021 |
| | | | | | | | |
| | | Shares | | | Value | |
| | |
Common Stocks - 99.2% | | | | | | | | |
| |
Communication Services - 15.7% | | | | | |
| | |
Liberty Broadband Corp., Class C* | | | 89,709 | | | $ | 14,573,227 | |
| | |
Liberty Global PLC, Class C (United Kingdom)* | | | 207,682 | | | | 5,989,549 | |
| | |
Liberty Media Corp.-Liberty SiriusXM, Class C* | | | 366,209 | | | | 18,061,428 | |
| | |
Madison Square Garden Sports Corp.* | | | 36,867 | | | | 6,986,665 | |
| | |
News Corp., Class A | | | 801,235 | | | | 18,348,281 | |
| | |
Total Communication Services | | | | | | | 63,959,150 | |
| |
Consumer Discretionary - 16.8% | | | | | |
| | |
Advance Auto Parts, Inc. | | | 65,131 | | | | 14,688,343 | |
| | |
Bath & Body Works, Inc. | | | 119,173 | | | | 8,233,663 | |
| | |
Dollar Tree, Inc.* | | | 79,878 | | | | 8,607,653 | |
| | |
DR Horton, Inc. | | | 82,335 | | | | 7,350,045 | |
| | |
LKQ Corp.* | | | 253,151 | | | | 13,943,557 | |
| | |
Murphy USA, Inc. | | | 23,349 | | | | 3,804,720 | |
| | |
NVR, Inc.* | | | 2,458 | | | | 12,031,418 | |
| | |
Total Consumer Discretionary | | | | | | | 68,659,399 | |
| |
Consumer Staples - 7.4% | | | | | |
| | |
Albertsons Cos., Inc., Class A | | | 145,009 | | | | 4,488,029 | |
| | |
BJ’s Wholesale Club Holdings, Inc.* | | | 147,467 | | | | 8,617,971 | |
| | |
Fomento Economico Mexicano SAB de CV, Sponsored ADR (Mexico) | | | 95,853 | | | | 7,878,158 | |
| | |
Herbalife Nutrition, Ltd.* | | | 103,227 | | | | 4,789,733 | |
| | |
Molson Coors Beverage Co., Class B | | | 95,172 | | | | 4,196,133 | |
| | |
Total Consumer Staples | | | | | | | 29,970,024 | |
| |
Energy - 7.2% | | | | | |
| | |
Marathon Petroleum Corp. | | | 117,973 | | | | 7,777,960 | |
| | |
Pioneer Natural Resources Co. | | | 55,300 | | | | 10,339,994 | |
| | |
Texas Pacific Land Corp. | | | 2,458 | | | | 3,130,681 | |
| | |
The Williams Cos., Inc. | | | 293,704 | | | | 8,250,145 | |
| | |
Total Energy | | | | | | | 29,498,780 | |
| |
Financials - 20.1% | | | | | |
| | |
American Equity Investment Life Holding Co. | | | 309,680 | | | | 9,869,502 | |
| | |
Apollo Global Management, Inc. | | | 140,093 | | | | 10,780,156 | |
| | |
Ares Management Corp., Class A | | | 50,384 | | | | 4,269,540 | |
| | |
Cannae Holdings, Inc.* | | | 275,271 | | | | 9,386,741 | |
| | |
Fidelity National Financial, Inc. | | | 206,453 | | | | 9,891,163 | |
| | |
KKR & Co., Inc. | | | 282,644 | | | | 22,518,248 | |
| | |
Willis Towers Watson PLC (United Kingdom) | | | 63,902 | | | | 15,482,177 | |
| | |
Total Financials | | | | | | | 82,197,527 | |
| | | | | | | | |
| | | | | | | | |
| | | Shares | | | Value | |
| |
Health Care - 7.0% | | | | | |
| | |
Centene Corp.* | | | 121,660 | | | | $8,667,058 | |
| | |
McKesson Corp. | | | 50,384 | | | | 10,473,826 | |
| | |
Premier, Inc., Class A | | | 235,946 | | | | 9,190,097 | |
| | |
Total Health Care | | | | | | | 28,330,981 | |
| |
Industrials - 14.7% | | | | | |
| | |
Air Transport Services Group, Inc.* | | | 529,651 | | | | 13,183,014 | |
| | |
API Group Corp.* | | | 428,882 | | | | 9,341,050 | |
| | |
Armstrong World Industries, Inc. | | | 86,022 | | | | 9,088,224 | |
| | |
CACI International, Inc., Class A* | | | 35,638 | | | | 10,250,914 | |
| | |
Carlisle Cos., Inc. | | | 13,518 | | | | 3,013,433 | |
| | |
Huntington Ingalls Industries, Inc. | | | 23,349 | | | | 4,733,543 | |
| | |
UniFirst Corp. | | | 52,842 | | | | 10,460,602 | |
| | |
Total Industrials | | | | | | | 60,070,780 | |
| |
Information Technology - 4.8% | | | | | |
| | |
CDK Global, Inc. | | | 149,924 | | | | 6,524,693 | |
| | |
NCR Corp.* | | | 330,571 | | | | 13,070,777 | |
| |
Total Information Technology | | | | 19,595,470 | |
| |
Materials - 4.0% | | | | | |
| | |
Axalta Coating Systems, Ltd.* | | | 326,884 | | | | 10,195,512 | |
| | |
Royal Gold, Inc. | | | 62,673 | | | | 6,205,880 | |
| | |
Total Materials | | | | | | | 16,401,392 | |
| |
Real Estate - 1.5% | | | | | |
| | |
The St Joe Co. | | | 130,293 | | | | 6,126,377 | |
| | |
Total Common Stocks | | | | | | | | |
(Cost $367,569,811) | | | | | | | 404,809,880 | |
| |
Short-Term Investments - 0.1% | | | | | |
| |
Other Investment Companies - 0.1% | | | | | |
| | |
Dreyfus Government Cash Management Fund, Institutional Shares, 0.03%1 | | | 147,198 | | | | 147,198 | |
| | |
Dreyfus Institutional Preferred Government Money Market Fund, Institutional Shares, 0.01%1 | | | 147,198 | | | | 147,198 | |
| | |
JPMorgan U.S. Government Money Market Fund, IM Shares, 0.03%1 | | | 151,658 | | | | 151,658 | |
| | |
Total Short-Term Investments | | | | | | | | |
(Cost $446,054) | | | | | | | 446,054 | |
| | |
Total Investments - 99.3% | | | | | | | | |
(Cost $368,015,865) | | | | | | | 405,255,934 | |
| |
Other Assets, less Liabilities - 0.7% | | | | 2,887,775 | |
| | |
Net Assets - 100.0% | | | | | | | $408,143,709 | |
| | | | | | | | |
The accompanying notes are an integral part of these financial statements.
9
|
AMG River Road Mid Cap Value Fund Schedule of Portfolio Investments (continued) |
| * | Non-income producing security. |
| 1 | Yield shown represents the October 31, 2021, seven day average yield, which refers to the sum of the previous seven days’ dividends paid, expressed as an annual percentage. |
ADR American Depositary Receipt
The following table summarizes the inputs used to value the Fund’s investments by the fair value hierarchy levels as of October 31, 2021:
| | | | | | | | | | | | | | | | |
| | | Level 1 | | | Level 2 | | | Level 3 | | | Total | |
Investments in Securities | | | | | | | | | | | | | | | | |
| | | | |
Common Stocks† | | $ | 404,809,880 | | | | – | | | | – | | | $ | 404,809,880 | |
| | | | |
Short-Term Investments | | | | | | | | | | | | | | | | |
| | | | |
Other Investment Companies | | | 446,054 | | | | – | | | | – | | | | 446,054 | |
| | | | | | | | | | | | | | | | |
Total Investments in Securities | | $ | 405,255,934 | | | | – | | | | – | | | $ | 405,255,934 | |
| | | | | | | | | | | | | | | | |
| † | All common stocks held in the Fund are Level 1 securities. For a detailed breakout of common stocks by major industry classification, please refer to the Fund’s Schedule of Portfolio Investments. |
For the fiscal year ended October 31, 2021, there were no transfers in or out of Level 3.
For the fiscal year ended October 31, 2021, the effect of derivative instruments on the Statement of Operations for the Fund and the amount of realized gain/loss and unrealized appreciation/depreciation on derivatives recognized in income was as follows:
| | | | | | | | | | | | |
| | | Realized Gain/(Loss) | | | | | Change in Unrealized Appreciation/Depreciation | |
| | | |
Derivatives not accounted for as hedging instruments | | Statement of Operations Location | |
| Realized
Gain/(Loss) |
| | Statement of Operations Location | |
| Change in
Unrealized
Appreciation/
Depreciation |
|
Equity contracts | | Net realized loss on futures contracts | | | $(132,843 | ) | | Net change in unrealized appreciation/ depreciation on futures contracts | | | – | |
The accompanying notes are an integral part of these financial statements.
10
|
AMG River Road Large Cap Value Select Fund Portfolio Manager’s Comments (unaudited) |
| | | | | | | | |
OVERVIEW For the fiscal year ended October 31, 2021, AMG River Road Large Cap Value Select Fund (the “Fund”) Class N shares returned 33.53%, trailing the 43.76% return for the Russell 1000® Value Index, the Fund’s current benchmark, and the 43.90% return for the Fund’s prior benchmark, the Russell 3000® Index. On March 17-18, 2021, the Fund’s Board of Trustees approved the appointment of River Road Asset Management, LLC (“River Road”) as interim subadviser to the Fund, as well as a change to the Fund’s Principal Investment Strategies from investing primarily both long and short positions in equity and equity-related securities to investing primarily in long securities of large-cap companies. The Fund’s name and benchmark were changed effective March 22, 2021. On June 11, 2021, the Fund’s shareholders approved the appointment of River Road as the subadviser to the Fund, and a change in the Fund’s sub-classification from “diversified” to “non-diversified.” PERFORMANCE REVIEW During the first portion of the fiscal year under the Fund’s prior subadviser, the Fund underperformed both the former and current benchmarks. The Fund’s short positions detracted from absolute performance during this period. During the second portion of the fiscal year under River Road, the Fund outpaced both the former and current benchmarks. The sector with the largest positive contribution to relative return was financials, which benefited from strong stock selection and an overweight allocation. The sector with the largest negative contribution to relative return was information technology, which suffered from poor stock selection, partially offset by an underweight allocation. | | | | The top contributing holdings in the Fund were KKR & Co., Inc. (KKR) and Nestle SA Sponsored ADR (NSRGY). KKR is a leading global alternative asset manager. The company generates highly visible earnings (87% of AUM has a duration of at least eight years) and expects to grow at double-digit rates over the next several years. During 2021, management fees, fee-related earnings, and adjusted book value per share have grown at attractive rates. Management expects $4-5/share of after-tax distributable earnings by 2023-2024 (versus $2 today). Nestle is the largest food and beverage company in the world. The company operates with what we believe is a pristine balance sheet, has historically generated steady and predictable results, uses its global scale and reach to satisfy faster-growing emerging markets (over 40% of sales), and focuses on highly attractive segments (coffee + pet care + confectionary = 50% of profit) of the food and beverage industry. Since the first Nestle outsider CEO took over in early 2017 (at least since 1922), the company has improved operating margins, engaged in thoughtful M&A/divestures, raised the dividend, and repurchased shares at attractive prices. CEO Schneider’s efforts over the past five years to energize and refocus Nestle are showing up in the results. Nestle generated the best organic growth in more than a decade. The bottom contributing holdings in the Fund were Fiserv, Inc. (FISV) and Dollar Tree, Inc. (DLTR). FISV is a leading technology provider to financial institutions. Although some sell-side investment companies knock Fiserv merchant acceptance growth prospects, we think the segment’s financial | | | | performance spoke for itself with solid organic revenue growth, including robust growth at Clover, a cloud-based point-of-sale offering. Dollar Tree is a leading discount retailer in the U.S. and Canada. The business is spilt between the $1 price point Dollar Tree business (71% of profits) and the multi-price point Family Dollar (29% of profits). Despite Family Dollar posting its best post-merger operating profit and an impressive two-year same-store-sales comp, the stock declined as continued disruption in the global supply chain resulted in higher-than-expected freight costs and a material reduction in annual earnings guidance for Dollar Tree . The rapid rise in freight costs is particularly challenging for the Dollar Tree banner, as it remains the only chain with principally $1 pricing. POSITIONING AND OUTLOOK While external market valuations remain expensive in our opinion, the portfolio discount looks attractive. We believe our thoughtful approach to concentrated large cap investing is well positioned. High conviction positions remain the core growth engine (65%) of the Fund, while opportunistic holdings (33%) potentially provide more compelling upside (percentages based on total portfolio). According to FactSet, the Fund’s valuation (as measured by EV/EBITDA) is cheaper than the Russell 1000® Value benchmark. The views expressed represent the opinions of River Road Asset Management LLC, as of October 31, 2021, and are not intended as a forecast or guarantee of future results and are subject to change without notice. |
11
|
AMG River Road Large Cap Value Select Fund Portfolio Manager’s Comments (continued) |
CUMULATIVE TOTAL RETURN PERFORMANCE
AMG River Road Large Cap Value Select Fund’s cumulative total return is based on the daily change in net asset value (NAV), and assumes that all dividends and distributions were reinvested. The graph compares a hypothetical $10,000 investment made in the AMG River Road Large Cap Value Select Fund’s Class N shares on October 31, 2011, to a $10,000 investment made in the Russell 1000® Value Index and Russell 3000® Index for the same time period. The graph and table do not reflect the deduction of taxes that a shareholder would pay on a Fund distribution or redemption of shares. The listed returns for the Fund are net of expenses and the returns for the indexes exclude expenses. Total returns would have been lower had certain expenses not been reduced.
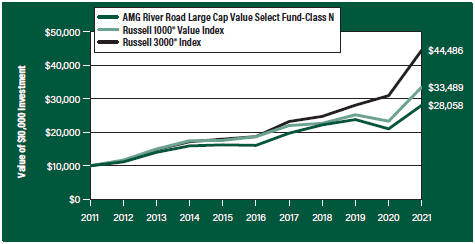
The table below shows the average annual total returns for the AMG River Road Large Cap Value Select Fund and the Russell 1000® Value Index and Russell 3000® Index for the same time periods ended October 31, 2021.
| | | | | | | | | | | | |
| Average Annual Total Returns1 | | One
Year | | | Five
Years | | | Ten
Years | |
AMG River Road Large Cap Value Select Fund2, 3, 4, 5, 6, 7, 8, 9, 10, 11, 12, 13, 14, 15, 16, 17, 18, 19, 20, 21 | |
| | | |
Class N | | | 33.53 | % | | | 11.77 | % | | | 10.87 | % |
| | | |
Class I | | | 33.93 | % | | | 12.11 | % | | | 11.18 | % |
| | | |
Russell 1000® Value Index22 | | | 43.76 | % | | | 12.39 | % | | | 12.85 | % |
Russell 3000® Index23 | | | 43.90 | % | | | 18.91 | % | | | 16.10 | % |
The performance data shown represents past performance. Past performance is not a guarantee of future results. Current performance may be lower or higher than the performance data quoted. The investment return and principal value of an investment will fluctuate so that an investor’s shares, when redeemed, may be worth more or less than their original cost.
Investors should carefully consider the Fund’s investment objectives, risks, charges and expenses before investing. For performance information through the most recent month end, current net asset values per share for the Fund and other information, please call 800.548.4539 or visit our website at amgfunds.com for a free prospectus. Read it carefully before investing or sending money.
Distributed by AMG Distributors, Inc., member FINRA/SIPC.
| 1 | Total return equals income yield plus share price change and assumes reinvestment of all dividends and capital gain distributions. Returns are net of fees and may reflect offsets of Fund expenses as described in the prospectus. No adjustment has been made for taxes payable by shareholders on their reinvested dividends and capital gain distributions. Returns for periods greater than one year are annualized. The listed returns on the Fund are net of expenses and based on the published NAV as of October 31, 2021. All returns are in U.S. dollars ($). |
| | |
| | | 2 From time to time, the Fund’s advisor has waived its fees and/or absorbed Fund expenses, which has resulted in higher returns. 3 As of March 22, 2021, the Fund’s Subadviser was changed to River Road Asset Management, LLC. Prior to March 22, 2021, the Fund was known as the AMG FQ Long-Short Equity Fund and had different principal investment strategies and corresponding risks. Performance shown for periods prior to March 22, 2021, reflects the performance and investment strategies of the Fund’s previous Subadvisor, First Quadrant, L.P. The Fund’s past performance would have been different if the Fund were managed by the current Subadviser and strategy, and the Fund’s prior performance record might be less pertinent for investors considering whether to purchase shares of the Fund. 4 Active and frequent trading of a fund may result in higher transaction costs and increased tax liability. 5 The Fund is subject to special risk considerations similar to those associated with the direct ownership of real estate. Real estate valuations may be subject to factors such as changing general and local economic, financial, competitive, and environmental conditions. 6 Investing in Publicly Traded Partnerships (PTPs) (including master limited partnerships) involves risks in addition to those typically associated with publicly traded companies. PTPs are exposed to the risks of their underlying assets, which in many cases includes the same types of risks as energy and natural resources companies. PTPs are also subject to capital markets risk. PTPs may lose their partnership status for tax purposes. The Fund’s status as a regulated investment company may be jeopardized if it does not appropriately limit such investments in PTPs or if such investments are recharacterized for tax purposes. 7 The Fund is subject to currency risk resulting from fluctuations in exchange rates that may affect the total loss or gain on a non-U.S. Dollar investment when converted back to U.S. Dollars. |
| | | 8 Market prices of investments held by the Fund may fall rapidly or unpredictably due to a variety of economic or political factors, market conditions, disasters or public health issues, or in response to events that affect particular industries or companies. 9 Convertible preferred stocks, which are convertible into shares of the common stock and pay regular dividends, and convertible debt securities, which are convertible into shares of the common stock and bear interest, are subject to the risks of equity securities and fixed income securities. 10 Investments in master limited partnerships (MLPs) are subject to similar risks to those associated with the specific industry or industries in which the partnership invests, such as the risk of investing in the real estate or oil and gas industries. In addition, |
12
|
AMG River Road Large Cap Value Select Fund Portfolio Manager’s Comments (continued) |
| | | | | | | | |
investments in MLPs are subject to the risks of investing in a partnership, including limited control and voting rights on matters affecting the partnership and fewer investor protections compared to corporations. 11 Because exchange-traded funds (ETFs) incur their own costs, investing in them could result in a higher cost to the investor. Additionally, the fund will be indirectly exposed to all the risks of securities held by the ETFs. 12 A greater percentage of the Fund’s holdings may be focused in a smaller number of securities which may place the Fund at greater risk than a more diversified fund. 13 Investments in international securities are subject to certain risks of overseas investing including currency fluctuations and changes in political and economic conditions, which could result in significant market fluctuations. These risks are magnified in emerging markets. 14 Companies that are in similar industry sectors may be similarly affected by particular economic or market events; to the extent the Fund has substantial holdings within a particular sector, the risks associated with that sector increase. 15 The Fund invests in large-capitalization companies that may underperform other stock funds (such as funds that focus on small-and medium-capitalization companies) when stocks of large-capitalization companies are out of favor. | | | | 16 The Fund may suffer significant losses on assets that it sells short. Unlike the possible loss on a security that is purchased, there is no limit on the amount of loss on an appreciating security that is sold short. 17 In managing the Fund, the Fund’s prior Subadviser may rely heavily on one or more quantitative models (“Model”) and information and data supplied by third parties (“Data”). When a Model or Data used in managing the Fund contains an error, or is incorrect or incomplete, any investment decision made in reliance on the Model or Data may not produce the desired results and the Fund may realize losses. In addition, any hedging based on a faulty Model or Data may prove to be unsuccessful. 18 The Fund may invest in derivatives such as options and futures; the complexity and rapidly changing structure of derivatives markets may increase the possibility of market losses. 19 The use of leverage in a Fund’s strategy, such as futures and forward commitment transactions, can magnify relatively small market movements into relatively larger losses for the Fund. 20 The Fund is subject to risks associated with investments in small-capitalization companies, such as erratic earnings patterns, competitive conditions, limited earnings history and a reliance on one or a limited number of products. | | | | 21 The Fund is subject to risks associated with investments in mid-capitalization companies such as greater price volatility, lower trading volume, and less liquidity than the stocks of larger, more established companies. 22 On March 22, 2021, the primary benchmark changed from the Russell 3000® Index to the Russell 1000® Value Index. The Russell 1000®Value Index is a market capitalization weighted index that measures the performance of those Russell 1000® companies with lower price-to-book ratios and lower forecasted growth values. Unlike the Fund, the Russell 1000® Value Index is unmanaged, is not available for investment and does not incur expenses. 23 The Russell 3000® Index is composed of the 3,000 largest U.S. companies as measured by market capitalization, and represents about 98% of the U.S. stock market. Unlike the Fund, the Russell 3000® Index is unmanaged, is not available for investment and does not incur expenses. The Russell indices are a trademark of the London Stock Exchange Group companies. Not FDIC insured, nor bank guaranteed. May lose value. |
| | | | | | | | |
13
|
AMG River Road Large Cap Value Select Fund Fund Snapshots (unaudited) October 31, 2021 |
PORTFOLIO BREAKDOWN
| | |
| Sector | | % of
Net Assets |
| | |
Communication Services | | 30.4 |
| | |
Financials | | 23.7 |
| | |
Consumer Staples | | 10.3 |
| | |
Health Care | | 10.0 |
| | |
Consumer Discretionary | | 8.4 |
| | |
Information Technology | | 6.7 |
| | |
Energy | | 4.6 |
| | |
Utilities | | 4.0 |
| | |
Short-Term Investments | | 2.3 |
| | |
Other Assets Less Liabilities | | (0.4) |
TOP TEN HOLDINGS
| | |
| Security Name | | % of
Net Assets |
KKR & Co., Inc. | | 8.4 |
| | |
Fiserv, Inc. | | 6.7 |
| | |
Berkshire Hathaway, Inc., Class B | | 6.1 |
| | |
Liberty Media Corp.-Liberty SiriusXM, Class C | | 5.8 |
| | |
Keurig Dr Pepper, Inc. | | 5.4 |
| | |
Meta Platforms, Inc. | | 5.2 |
| | |
Liberty Broadband Corp., Class C | | 5.1 |
| | |
Nestle SA, Sponsored ADR (Switzerland) | | 4.9 |
| | |
Comcast Corp., Class A | | 4.7 |
| | |
Willis Towers Watson PLC (United Kingdom) | | 4.6 |
| | | |
Top Ten as a Group | | 56.9 |
| | |
Because a fund’s strategy may result in multiple investments in particular sectors of the economy, its performance may depend on the performance of those sectors and may fluctuate more widely than investments diversified across more sectors. For additional information on these and other risk considerations, please see the Fund’s prospectus.
Any sectors, industries, or securities discussed should not be perceived as investment recommendations. Mention of a specific security should not be considered a recommendation to buy or solicitation to sell that security. Specific securities mentioned in this report may have been sold from the Fund’s portfolio of investments by the time you receive this report.
14
|
AMG River Road Large Cap Value Select Fund Schedule of Portfolio Investments October 31, 2021 |
| | | | | | | | |
| | | Shares | | | Value | |
| | |
Common Stocks - 98.1% | | | | | | | | |
| |
Communication Services - 30.4% | | | | | |
| | |
Alphabet, Inc., Class C* | | | 439 | | | | $1,301,815 | |
| | |
Comcast Corp., Class A | | | 38,020 | | | | 1,955,369 | |
| | |
Liberty Broadband Corp., Class C* | | | 12,971 | | | | 2,107,139 | |
| | |
Liberty Media Corp.-Liberty SiriusXM, Class C* | | | 48,738 | | | | 2,403,758 | |
| | |
Meta Platforms, Inc.* | | | 6,694 | | | | 2,165,978 | |
| | |
News Corp., Class A | | | 50,589 | | | | 1,158,488 | |
| | |
T-Mobile US, Inc.* | | | 13,344 | | | | 1,534,960 | |
| | |
Total Communication Services | | | | | | | 12,627,507 | |
| |
Consumer Discretionary - 8.4% | | | | | |
| | |
Bath & Body Works, Inc. | | | 15,046 | | | | 1,039,528 | |
| | |
LKQ Corp.* | | | 20,454 | | | | 1,126,606 | |
| | |
NVR, Inc.* | | | 270 | | | | 1,321,596 | |
| | |
Total Consumer Discretionary | | | | | | | 3,487,730 | |
| |
Consumer Staples - 10.3% | | | | | |
| | |
Keurig Dr Pepper, Inc. | | | 61,912 | | | | 2,234,404 | |
| | |
Nestle SA, Sponsored ADR (Switzerland) | | | 15,601 | | | | 2,056,524 | |
| | |
Total Consumer Staples | | | | | | | 4,290,928 | |
| |
Energy - 4.6% | | | | | |
| | |
Pioneer Natural Resources Co. | | | 10,106 | | | | 1,889,620 | |
| |
Financials - 23.7% | | | | | |
| | |
Berkshire Hathaway, Inc., Class B* | | | 8,887 | | | | 2,550,658 | |
| | |
KKR & Co., Inc. | | | 43,670 | | | | 3,479,189 | |
| | |
The Progressive Corp. | | | 20,013 | | | | 1,898,833 | |
| | |
Willis Towers Watson PLC (United Kingdom) | | | 7,916 | | | | 1,917,889 | |
| | |
Total Financials | | | | | | | 9,846,569 | |
| | |
| | | | | | | | |
| | | | | | | | |
| | | Shares | | | Value | |
| |
Health Care - 10.0% | | | | | |
| | |
CVS Health Corp. | | | 9,415 | | | | $840,571 | |
| | |
McKesson Corp. | | | 7,833 | | | | 1,628,324 | |
| | |
UnitedHealth Group, Inc. | | | 3,679 | | | | 1,694,069 | |
| | |
Total Health Care | | | | | | | 4,162,964 | |
| |
Information Technology - 6.7% | | | | | |
| | |
Fiserv, Inc.* | | | 28,092 | | | | 2,766,781 | |
| |
Utilities - 4.0% | | | | | |
| | |
American Electric Power Co., Inc. | | | 19,775 | | | | 1,675,140 | |
| | |
Total Common Stocks | | | | | | | | |
(Cost $37,633,732) | | | | | | | 40,747,239 | |
| | |
Short-Term Investments - 2.3% | | | | | | | | |
| |
Other Investment Companies - 2.3% | | | | | |
| | |
Dreyfus Government Cash Management Fund, Institutional Shares, 0.03%1 | | | 312,477 | | | | 312,477 | |
| | |
Dreyfus Institutional Preferred Government Money Market Fund, Institutional Shares, 0.01%1 | | | 312,475 | | | | 312,475 | |
| | |
JPMorgan U.S. Government Money Market Fund, IM Shares, 0.03%1 | | | 321,946 | | | | 321,946 | |
| | |
Total Short-Term Investments | | | | | | | | |
(Cost $946,898) | | | | | | | 946,898 | |
| | |
Total Investments - 100.4% | | | | | | | | |
(Cost $38,580,630) | | | | | | | 41,694,137 | |
| |
Other Assets, less Liabilities - (0.4)% | | | | (170,718 | ) |
| | |
Net Assets - 100.0% | | | | | | | $41,523,419 | |
| | |
| | | | | | | | |
| * | Non-income producing security. |
| 1 | Yield shown represents the October 31, 2021, seven day average yield, which refers to the sum of the previous seven days’ dividends paid, expressed as an annual percentage. |
ADR American Depositary Receipt
The following table summarizes the inputs used to value the Fund’s investments by the fair value hierarchy levels as of October 31, 2021:
| | | | | | | | | | | | | | | | |
| | | Level 1 | | | Level 2 | | | Level 3 | | | Total | |
Investments in Securities | | | | | | | | | | | | | | | | |
| | | | |
Common Stocks† | | $ | 40,747,239 | | | | – | | | | – | | | $ | 40,747,239 | |
| | | | |
Short-Term Investments | | | | | | | | | | | | | | | | |
| | | | |
Other Investment Companies | | | 946,898 | | | | – | | | | – | | | | 946,898 | |
| | | | | | | | | | | | | | | | |
Total Investments in Securities | | $ | 41,694,137 | | | | – | | | | – | | | $ | 41,694,137 | |
| | | | | | | | | | | | | | | | |
| † | All common stocks held in the Fund are Level 1 securities. For a detailed breakout of common stocks by major industry classification, please refer to the Fund’s Schedule of Portfolio Investments. |
The accompanying notes are an integral part of these financial statements.
15
|
AMG River Road Large Cap Value Select Fund Schedule of Portfolio Investments (continued) |
For the fiscal year ended October 31, 2021, there were no transfers in or out of Level 3.
For the fiscal year ended October 31, 2021, the effect of derivative instruments on the Statement of Operations for the Fund and the amount of realized gain/loss and unrealized appreciation/depreciation on derivatives recognized in income was as follows:
| | | | | | | | | | |
| | | Realized Gain/(Loss) | | | | Change in Unrealized Appreciation/Depreciation | |
| | | |
Derivatives not accounted for as hedging instruments | | Statement of Operations Location | | Realized Gain/(Loss) | | Statement of Operations Location | |
| Change in
Unrealized
Appreciation/
Depreciation |
|
Equity contracts | | Net realized gain on swaps | | $6,028,933 | | Net change in unrealized appreciation/ depreciation on swaps | | | $653,732 | |
The accompanying notes are an integral part of these financial statements.
16
|
AMG River Road Small Cap Value Fund Portfolio Manager’s Comments (unaudited) |
| | | | | | | | |
OVERVIEW For the fiscal year ended October 31, 2021, AMG River Road Small Cap Value Fund (the “Fund”) Class N shares returned 43.59%, trailing the 64.30% return for the Russell 2000® Value Index. PERFORMANCE REVIEW The sector with the largest negative contribution to relative return was financials, which suffered from negative stock selection. The sector with the largest positive contribution to relative return was utilities, which benefited from an underweight allocation. The Fund’s cash position, which averaged 9% during the period, was also a negative contributor to relative performance. The top contributing holdings in the Fund were Atkore, Inc. (ATKR) and NCR Corp. (NCR). Atkore is a manufacturer of branded products that protect and frame electrical circuitry. Atkore reported several strong quarters due to solid demand for PVC and metal conduit, leading to favorable pricing and volume growth. Atkore’s agile business model has allowed the company to manage supply chain and inflation constraints while maintaining industry-leading fill rates. As a result, EBITDA margins and free cash flow generation have surged higher, supporting a significant increase in 2021 guidance. We have trimmed the position, as this growth is not expected to be maintained in 2022. NCR is a provider of transaction software, services, and hardware largely to banks, retailers, restaurants, and the hospitality industry. As restaurants and retailers reopened and consumer mobility improved from COVID-19 induced lockdowns, the company delivered strong organic recurring revenue growth and EBITDA margin expansion from higher-margin | | | | software and services and aggressive cost cutting. NCR steadily progressed toward its goals of generating 80% of sales from software and services, 60% of revenues recurring, with 20% EBITDA margins. We added to the position at an attractive discount to our assessed valuation. The bottom contributing holdings in the Fund were GoHealth, Inc. (GOCO) and Air Transport Services Group, Inc. (ATSG). GoHealth is a distribution platform primarily selling Medicare Advantage plans to senior citizens. Shares dropped sharply when 2021 EBITDA guidance was cut (14)%, largely due to rising agent costs. GoHealth is on target to increase agent count ~50% amid a historically tight labor market, which has increased expenses more than expected. Graduation rates from the company’s agent training program fell from over 80% to roughly 50%. COVID-19 necessitated remote training, which has proven to be less effective than in-person training. Additionally, some trainees were recruited away to other industries before completing the six-week training course. GoHealth paid many trainees who never transitioned to productive, revenue-generating agents. The company has restructured incentives for trainees and is to pay bonuses at key milestones. Additionally, the pace of hiring after this annual enrollment period should slow, which will allow GoHealth to optimize its agent base rather than recruit massive numbers of new agents in potentially challenging labor markets. Management strongly believes this is a transitory issue and unit economics will be attractive going forward. Nonetheless, we trimmed the position in accordance with our sell discipline. Air Transport is the premier lessor of wide-body freighter aircraft, primarily the Boeing 767. Air Transport grew revenue and EBITDA throughout the year by expanding its fleet, including leasing new | | | | aircraft to Amazon under 10-year leases. The impact of COVID-19 accelerated the transition toward e-commerce, which should continue to drive demand for Air Transport’s unique cargo and logistics assets. We opportunistically added to the position due to its attractive valuation and promising growth outlook. OUTLOOK AND POSITIONING We continue to believe high-quality small-cap value stocks are extraordinarily well positioned as the COVID-19 Delta variant recedes and the reopening economy gains momentum. However, several fresh challenges to our outlook have emerged, most notably a sharp spike in commodity prices, continuing supply chain issues, and tightness in the labor force—all of which could put pressure on small cap earnings over the next few quarters. Aside from these challenges, the biggest risk we are focused on is valuations. While small cap value stocks look very attractive relative to large cap and small cap growth, they are expensive on an absolute basis. On their own, high absolute valuations rarely kill a bull market, but they could limit near-term upside and greatly amplify volatility. In our opinion, the combination of these factors creates an environment where fundamentals and intrinsic valuation greatly matter and, thus, the best opportunities are likely to be found among attractively priced, high-quality small cap stocks. This commentary reflects the viewpoints of River Road Asset Management as of October 31, 2021, and is not intended as a forecast or guarantee of future results. |
17
|
AMG River Road Small Cap Value Fund Portfolio Manager’s Comments (continued) |
CUMULATIVE TOTAL RETURN PERFORMANCE
AMG River Road Small Cap Value Fund’s cumulative total return is based on the daily change in net asset value (NAV), and assumes that all dividends and distributions were reinvested. The graph compares a hypothetical $10,000 investment made in the AMG River Road Small Cap Value Fund’s Class N shares on October 31, 2011, to a $10,000 investment made in the Russell 2000® Value Index for the same time period. The graph and table do not reflect the deduction of taxes that a shareholder would pay on a Fund distribution or redemption of shares. The listed returns for the Fund are net of expenses and the returns for the index exclude expenses. Total returns would have been lower had certain expenses not been reduced.
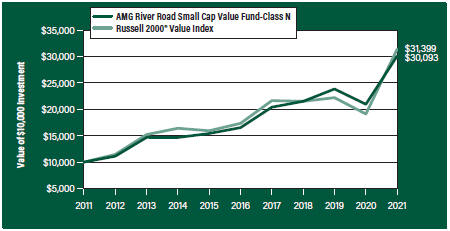
The table below shows the average annual total returns for the AMG River Road Small Cap Value Fund and the Russell 2000® Value Index for the same time periods ended October 31, 2021.
| | | | | | | | | | | | | | | | | | | | |
| Average Annual Total Returns1 | | One
Year | | | Five
Years | | | Ten
Years | | | Since
Inception | | | Inception
Date | |
AMG River Road Small Cap Value Fund2, 3, 4, 5, 6, 7, 8, 9 | |
| | | | | |
Class N | | | 43.59 | % | | | 12.73 | % | | | 11.65 | % | | | 8.68 | % | | | 06/28/05 | |
| | | | | |
Class I | | | 43.99 | % | | | 13.03 | % | | | 11.94 | % | | | 7.37 | % | | | 12/13/06 | |
| | | | | |
Class Z | | | 44.17 | % | | | – | | | | – | | | | 10.36 | % | | | 09/29/17 | |
Russell 2000® Value Index10 | | | 64.30 | % | | | 12.61 | % | | | 12.12 | % | | | 8.15 | % | | | 06/28/05 | † |
The performance data shown represents past performance. Past performance is not a guarantee of future results. Current performance may be lower or higher than the performance data quoted. The investment return and principal value of an investment will fluctuate so that an investor’s shares, when redeemed, may be worth more or less than their original cost.
Investors should carefully consider the Fund’s investment objectives, risks, charges and expenses before investing. For performance information through the most recent month end, current net asset values per share for the Fund and other information, please call 800.548.4539 or visit our website at amgfunds.com for a free prospectus. Read it carefully before investing or sending money.
Distributed by AMG Distributors, Inc., member FINRA/SIPC.
| † | Date reflects the inception date of the Fund, not the index. |
| 1 | Total return equals income yield plus share price change and assumes reinvestment of all dividends and capital gain distributions. Returns are net of fees and may reflect offsets of Fund expenses as described in the prospectus. No adjustment has been made for taxes payable by shareholders on their reinvested dividends and |
| | |
| | | capital gain distributions. Returns for periods greater than one year are annualized. The listed returns on the Fund are net of expenses and based on the published NAV as of October 31, 2021. All returns are in U.S. dollars ($). 2 From time to time, the Fund’s advisor has waived its fees and/or absorbed Fund expenses, which has resulted in higher returns. 3 The Fund is subject to risks associated with investments in small-capitalization companies, such as erratic earnings patterns, competitive conditions, limited earnings history and a reliance on one or a limited number of products. |
| | | 4 The Fund is subject to risks associated with investments in mid-capitalization companies such as greater price volatility, lower trading volume, and less liquidity than the stocks of larger, more established companies. |
| | | 5 The Fund is subject to special risk considerations similar to those associated with the direct ownership of real estate. Real estate valuations may be subject to factors such as changing general and local economic, financial, competitive, and environmental conditions. 6 The Fund invests in value stocks, which may perform differently from the market as a whole and may be undervalued by the market for a long period of time. |
| | | 7 Market prices of investments held by the Fund may fall rapidly or unpredictably due to a variety of economic or political factors, market conditions, disasters or public health issues, or in response to events that affect particular industries or companies. |
| | | 8 Investments in international securities are subject to certain risks of overseas investing including currency fluctuations and changes in political and economic conditions, which could result in significant market fluctuations. These risks are magnified in emerging markets. |
| | | 9 Companies that are in similar industry sectors may be similarly affected by particular economic or market events; to the extent the Fund has substantial holdings within a particular sector, the risks associated with that sector increase. |
| | | 10 The Russell 2000® Value Index is an unmanaged, market-value weighted, value-oriented index comprised of small stocks that have relatively low price-to-book ratios and lower forecasted growth values. Unlike the Fund, the Russell 2000® Value Index is unmanaged, is not available for investment and does not incur expenses. |
| | | The Russell 2000 Value Index® is a trademark of the London Stock Exchange Group companies. Not FDIC insured, nor bank guaranteed. May lose value. |
18
|
AMG River Road Small Cap Value Fund Fund Snapshots (unaudited) October 31, 2021 |
PORTFOLIO BREAKDOWN
| | |
| Sector | | % of
Net Assets |
| | |
Industrials | | 28.5 |
| | |
Information Technology | | 17.2 |
| | |
Financials | | 14.7 |
| | |
Consumer Staples | | 9.2 |
| | |
Health Care | | 7.2 |
| | |
Energy | | 3.7 |
| | |
Consumer Discretionary | | 3.6 |
| | |
Materials | | 3.3 |
| | |
Communication Services | | 1.8 |
| | |
Utilities | | 1.7 |
| | |
Real Estate | | 0.6 |
| | |
Short-Term Investments | | 10.8 |
| | |
Other Assets Less Liabilities | | (2.3) |
TOP TEN HOLDINGS
| | |
| Security Name | | % of
Net Assets |
Cannae Holdings, Inc. | | 3.8 |
| | |
Air Transport Services Group, Inc. | | 3.7 |
| | |
Murphy USA, Inc. | | 3.7 |
| | |
White Mountains Insurance Group, Ltd. | | 3.5 |
| | |
NCR Corp. | | 3.3 |
| | |
Premier, Inc., Class A | | 3.3 |
| | |
BJ’s Wholesale Club Holdings, Inc. | | 3.3 |
| | |
Hostess Brands, Inc. | | 3.0 |
| | |
Comfort Systems USA, Inc. | | 2.7 |
| | |
American Equity Investment Life Holding Co. | | 2.5 |
| | |
Top Ten as a Group | | 32.8 |
| | |
Because a fund’s strategy may result in multiple investments in particular sectors of the economy, its performance may depend on the performance of those sectors and may fluctuate more widely than investments diversified across more sectors. For additional information on these and other risk considerations, please see the Fund’s prospectus.
Any sectors, industries, or securities discussed should not be perceived as investment recommendations. Mention of a specific security should not be considered a recommendation to buy or solicitation to sell that security. Specific securities mentioned in this report may have been sold from the Fund’s portfolio of investments by the time you receive this report.
19
|
AMG River Road Small Cap Value Fund Schedule of Portfolio Investments October 31, 2021 |
| | | | | | | | |
| | | Shares | | | Value | |
| | |
Common Stocks - 91.5% | | | | | | | | |
| |
Communication Services - 1.8% | | | | | |
| | |
Liberty Latin America, Ltd., Class C* | | | 1,283,901 | | | | $15,445,329 | |
| |
Consumer Discretionary - 3.6% | | | | | |
| | |
Murphy USA, Inc. | | | 196,882 | | | | 32,081,922 | |
| |
Consumer Staples - 9.2% | | | | | |
| | |
BJ’s Wholesale Club Holdings, Inc.*,1 | | | 497,157 | | | | 29,053,855 | |
| | |
Hostess Brands, Inc.* | | | 1,400,004 | | | | 26,474,076 | |
| | |
Ingles Markets, Inc., Class A | | | 188,254 | | | | 13,025,294 | |
| | |
Whole Earth Brands, Inc.*,1 | | | 984,407 | | | | 11,940,857 | |
| | |
Total Consumer Staples | | | | | | | 80,494,082 | |
| |
Energy - 3.7% | | | | | |
| | |
Centennial Resource Development, Inc., Class A* | | | 597,102 | | | | 4,299,134 | |
| | |
Evolution Petroleum Corp. | | | 666,012 | | | | 3,956,111 | |
| | |
HollyFrontier Corp. | | | 352,370 | | | | 11,910,106 | |
| | |
SM Energy Co. | | | 133,876 | | | | 4,594,624 | |
| | |
World Fuel Services Corp. | | | 264,680 | | | | 8,080,681 | |
| | |
Total Energy | | | | | | | 32,840,656 | |
| |
Financials - 14.7% | | | | | |
| | |
American Equity Investment Life Holding Co. | | | 698,628 | | | | 22,265,274 | |
| | |
Axis Capital Holdings, Ltd. (Bermuda) | | | 412,225 | | | | 21,464,556 | |
| | |
Cannae Holdings, Inc.* | | | 968,614 | | | | 33,029,738 | |
| | |
eHealth, Inc.* | | | 54,698 | | | | 2,425,856 | |
| | |
Genworth Financial, Inc., Class A* | | | 3,585,582 | | | | 14,736,742 | |
| | |
GoHealth, Inc., Class A*,1 | | | 874,071 | | | | 4,719,983 | |
| | |
White Mountains Insurance Group, Ltd. | | | 29,025 | | | | 30,621,085 | |
| | |
Total Financials | | | | | | | 129,263,234 | |
| |
Health Care - 7.2% | | | | | |
| | |
Computer Programs and Systems, Inc.* | | | 271,550 | | | | 9,802,955 | |
| | |
Haemonetics Corp.* | | | 75,002 | | | | 5,153,387 | |
| | |
MEDNAX, Inc.* | | | 213,277 | | | | 5,807,533 | |
| | |
Patterson Cos., Inc. | | | 429,725 | | | | 13,433,204 | |
| | |
Premier, Inc., Class A | | | 750,671 | | | | 29,238,635 | |
| | |
Total Health Care | | | | | | | 63,435,714 | |
| |
Industrials - 28.5% | | | | | |
| | |
Air Transport Services Group, Inc.* | | | 1,312,125 | | | | 32,658,791 | |
| | |
Alight, Inc., Class A*,1 | | | 1,459,466 | | | | 15,878,990 | |
| | |
Argan, Inc. | | | 311,130 | | | | 12,837,224 | |
| | |
Armstrong World Industries, Inc. | | | 184,988 | | | | 19,543,982 | |
| | |
Atkore, Inc.* | | | 149,293 | | | | 14,112,667 | |
| | |
Barrett Business Services, Inc. | | | 76,699 | | | | 6,289,318 | |
| | |
Colfax Corp.*,1 | | | 160,148 | | | | 8,266,840 | |
| | |
Comfort Systems USA, Inc. | | | 255,718 | | | | 23,390,525 | |
| | |
| | | | | | | | |
| | | | | | | | |
| | | | | | | | |
| | | Shares | | | Value | |
| | |
CoreCivic, Inc.* | | | 1,266,419 | | | | $10,903,868 | |
| | |
GMS, Inc.* | | | 209,569 | | | | 10,379,953 | |
| | |
GrafTech International, Ltd. | | | 1,409,608 | | | | 15,082,806 | |
| | |
Harsco Corp.* | | | 496,759 | | | | 8,494,579 | |
| | |
McGrath RentCorp | | | 132,844 | | | | 9,583,366 | |
| | |
MSC Industrial Direct Co., Inc., Class A | | | 49,719 | | | | 4,179,876 | |
| | |
Park Aerospace Corp. | | | 511,833 | | | | 6,699,894 | |
| | |
SP Plus Corp.* | | | 543,009 | | | | 17,512,040 | |
| | |
UniFirst Corp. | | | 109,435 | | | | 21,663,753 | |
| | |
Univar Solutions, Inc.* | | | 294,807 | | | | 7,541,163 | |
| | |
Viad Corp.* | | | 115,983 | | | | 5,146,166 | |
| | |
Total Industrials | | | | | | | 250,165,801 | |
| |
Information Technology - 17.2% | | | | | |
| | |
ACI Worldwide, Inc.* | | | 526,726 | | | | 16,159,954 | |
| | |
Avaya Holdings Corp.* | | | 1,124,268 | | | | 20,933,870 | |
| | |
CDK Global, Inc. | | | 448,317 | | | | 19,510,756 | |
| | |
Computer Services, Inc. | | | 186,199 | | | | 10,240,945 | |
| | |
DXC Technology Co.* | | | 438,161 | | | | 14,270,904 | |
| | |
ePlus, Inc.* | | | 195,852 | | | | 21,655,355 | |
| | |
Ituran Location and Control, Ltd. (Israel) | | | 408,781 | | | | 10,632,394 | |
| | |
NCR Corp.* | | | 742,251 | | | | 29,348,604 | |
| | |
Vonage Holdings Corp.* | | | 537,239 | | | | 8,660,293 | |
| | |
Total Information Technology | | | | | | | 151,413,075 | |
| |
Materials - 3.3% | | | | | |
| | |
Axalta Coating Systems, Ltd.* | | | 666,255 | | | | 20,780,493 | |
| | |
TriMas Corp. | | | 238,108 | | | | 7,940,902 | |
| | |
Total Materials | | | | | | | 28,721,395 | |
| |
Real Estate - 0.6% | | | | | |
| | |
Newmark Group, Inc., Class A | | | 346,169 | | | | 5,150,995 | |
| |
Utilities - 1.7% | | | | | |
| | |
Southwest Gas Holdings, Inc. | | | 210,307 | | | | 14,563,760 | |
| | |
Total Common Stocks | | | | | | | | |
(Cost $620,872,717) | | | | | | | 803,575,963 | |
| | |
| | | Principal
Amount | | | | |
| |
Short-Term Investments - 10.8% | | | | | |
| |
Joint Repurchase Agreements - 1.9%2 | | | | | |
| | |
Bank of America Securities, Inc., dated 10/29/21,due 11/01/21, 0.050% total to be received $3,941,527 (collateralized by various U.S. Government Agency Obligations, 1.500% - 5.000%, 09/01/28 - 01/01/59, totaling $4,020,341) | | | $3,941,511 | | | | 3,941,511 | |
| | | | | | | | |
The accompanying notes are an integral part of these financial statements.
20
|
AMG River Road Small Cap Value Fund Schedule of Portfolio Investments (continued) |
| | | | | | | | |
| | | Principal
Amount | | | Value | |
| |
Joint Repurchase Agreements - 1.9%2 (continued) | | | | | |
| | |
Cantor Fitzgerald Securities, Inc., dated 10/29/21, due 11/01/21, 0.050% total to be received $3,941,516 (collateralized by various U.S. Government Agency Obligations, 0.430% - 9.500%, 11/25/21 - 07/20/71, totaling $4,020,330) | | $ | 3,941,500 | | | | $3,941,500 | |
| | |
Citigroup Global Markets, Inc., dated 10/29/21, due 11/01/21, 0.050% total to be received $829,782 (collateralized by various U.S. Treasuries, 0.125% - 3.625%, 02/15/22 - 02/15/51, totaling $846,375) | | | 829,779 | | | | 829,779 | |
| | |
Deutsche Bank Securities, Inc., dated 10/29/21, due 11/01/21, 0.050% total to be received $3,941,527 (collateralized by various U.S. Government Agency Obligations and U.S. Treasuries, 0.000% - 8.000%, 11/04/21 - 08/15/51, totaling $4,020,341) | | | 3,941,511 | | | | 3,941,511 | |
| | |
RBC Dominion Securities, Inc., dated 10/29/21, due 11/01/21, 0.050% total to be received $3,941,527 (collateralized by various U.S. Government Agency Obligations and U.S. Treasuries, 0.000% - 6.000%, 11/01/21 - 07/20/51, totaling $4,020,341) | | | 3,941,511 | | | | 3,941,511 | |
| |
Total Joint Repurchase Agreements | | | | 16,595,812 | |
| |
| | | | | |
| | | | | | | | |
| | | Shares | | | Value | |
| |
Other Investment Companies - 8.9% | | | | | |
| | |
Dreyfus Government Cash Management Fund, Institutional Shares, 0.03%3 | | | 25,750,904 | | | | $25,750,904 | |
| | |
Dreyfus Institutional Preferred Government Money Market Fund, Institutional Shares, 0.01%3 | | | 25,750,904 | | | | 25,750,904 | |
| | |
JPMorgan U.S. Government Money Market Fund, IM Shares, 0.03%3 | | | 26,531,234 | | | | 26,531,234 | |
| |
Total Other Investment Companies | | | | 78,033,042 | |
| |
Total Short-Term Investments | | | | | |
(Cost $94,628,854) | | | | | | | 94,628,854 | |
| | |
Total Investments - 102.3% | | | | | | | | |
(Cost $715,501,571) | | | | | | | 898,204,817 | |
| |
Other Assets, less Liabilities - (2.3)% | | | | (20,575,062 | ) |
| | |
Net Assets - 100.0% | | | | | | $ | 877,629,755 | |
| | |
| | | | | | | | |
| * | Non-income producing security. |
| 1 | Some of these securities, amounting to $34,877,877 or 4.0% of net assets, were out on loan to various borrowers and are collateralized by cash and various U.S. Treasury Obligations. See Note 4 of Notes to Financial Statements. |
| 2 | Cash collateral received for securities lending activity was invested in these joint repurchase agreements. |
| 3 | Yield shown represents the October 31, 2021, seven day average yield, which refers to the sum of the previous seven days’ dividends paid, expressed as an annual percentage. |
The following table summarizes the inputs used to value the Fund’s investments by the fair value hierarchy levels as of October 31, 2021:
| | | | | | | | | | | | | | | | |
| | | Level 1 | | | Level 2 | | | Level 3 | | | Total | |
Investments in Securities | | | | | | | | | | | | | | | | |
| | | | |
Common Stocks† | | $ | 803,575,963 | | | | – | | | | – | | | $ | 803,575,963 | |
| | | | |
Short-Term Investments | | | | | | | | | | | | | | | | |
| | | | |
Joint Repurchase Agreements | | | – | | | $ | 16,595,812 | | | | – | | | | 16,595,812 | |
| | | | |
Other Investment Companies | | | 78,033,042 | | | | – | | | | – | | | | 78,033,042 | |
| | | | | | | | | | | | | | | | |
Total Investments in Securities | | $ | 881,609,005 | | | $ | 16,595,812 | | | | – | | | $ | 898,204,817 | |
| | | | | | | | | | | | | | | | |
| † | All common stocks held in the Fund are Level 1 securities. For a detailed breakout of common stocks by major industry classification, please refer to the Fund’s Schedule of Portfolio Investments. |
For the fiscal year ended October 31, 2021, there were no transfers in or out of Level 3.
The accompanying notes are an integral part of these financial statements.
21
|
AMG River Road Dividend All Cap Value Fund Portfolio Manager’s Comments (unaudited) |
| | | | | | | | |
OVERVIEW For the fiscal year ended October 31, 2021, the AMG River Road Dividend All Cap Value Fund (the “Fund”) Class N shares returned 34.74%, while the Russell 3000® Value Index returned 44.97%. MARKET AND PERFORMANCE REVIEW The period started with a bang as the market surged following the FDA’s announced approval of the first vaccine for COVID-19. With hope growing, the market was led higher by lower quality, riskier issues, many of which suffered during the lockdown. Relative to the benchmark, the Fund’s bias toward lower-beta and higher-quality stocks were significant headwinds. As the strength of the market surge lessened in the second half of the period, so too did these headwinds. The consumer discretionary sector had the most significant positive impact on relative results in the period, due to strong stock selection. The financials sector had the most significant negative impact due to both the underweight allocation and adverse stock selection. The two holdings with the largest positive contribution to the Fund’s total return were discount retailer Target Corp. (TGT) and regional bank Truist Financial Corp. (TFC). Target was also the top contributor in the prior year, a testament to the company’s success both during and in the wake of the pandemic lockdown. The company has continued to report very strong sales trends, as the omni-channel strategy and differentiated merchandising drove substantial market share gains. Key to our investment thesis, in recent quarters more than 75% of digital sales were fulfilled by stores. Driven by this store infrastructure leverage and the substantial growth in higher-margin categories like apparel, home, and owned brands, the company’s operating profit grew 4x and margins expanded dramatically. Guests continue to use convenient same-day services like Drive Up which now represent more than 30% of the digital comp, up from just 5% two years ago. Further, Target is returning the substantial free cash flow it is generating to shareholders through share repurchases and a 32% dividend hike. Truist was formed by the merger of two Southeast banking leaders, BB&T and SunTrust. The banking industry is in the middle of a massive transformation as client interactions are rapidly shifting out of branch networks and moving online. Truist is embracing the challenge, investing heavily in digitalization, and improving the efficiency of the | | | | combined organization. Whereas banks came out of the 2008/2009 crisis in dire shape, Congress’ pandemic-related stimulus programs were very effective and banks like Truist are well capitalized, and the quality of their loan books is very strong. As such, Truist was able to announce a 7% dividend increase. Loan margins are historically low thanks to low prevailing interest rates, but rising rates promise to increase profitability at some point in the next couple years. The two holdings with the lowest contribution to the Fund’s total return during the period were Vistra Corp. (VST), an independent electricity producer, and M&T Bank Corp. (M&T), a regional bank. The initial position in Vistra was completed just days prior to the historic winter storms that hit the company’s largest market, Texas. The Texas market is unique as its electricity market is “deregulated,” meaning electricity prices are market based and a single utility does not have a monopoly on generation/distribution. Historically, the company has benefited from volatility in power prices given its conservative hedging policy, ownership of generation and retail electricity assets, and reliable fleet. Throughout the event, Vistra’s management team took a no-holds-barred approach to meeting its number one responsibility – keeping the lights and heat on, worrying about the cost later. While this was the correct ethical decision, and one we believe will ultimately benefit the firm longer term, ultimately this decision, combined with a systematic breakdown in the pricing mechanisms of ERCOT, the regulator of the Texas power grid, led to substantial losses. Over the subsequent months, the industry has worked to strengthen its grid and Vistra has recovered a good portion of its losses, but the stock has not kept up with the broader market advance despite management’s plans to return a substantial percentage of the current market cap to shareholders in the next year. M&T Bank is a regional bank based in the Northeast and is in the middle of a proposed merger with People’s United Financial Inc. (PBCT) that is expected to close by the end of 2021. It is our opinion that the merger positions M&T to gain scale and more efficiently invest in technology to support customers’ shift to digital banking channels. M&T’s footprint creates very specific challenges in its loan portfolio where it has above-average exposure to New York City hospitality properties. We established the position midway through the period as travel bans eased and this risk diminished. However, in June long-term treasury rates fell sharply and the yield | | | | curve flattened, and M&T was among the bank stocks that reacted negatively to the prospect of reduced net interest income. Consistent with our investment thesis, we believe credit trends are stable and improving, capital levels at the bank are near a record high, and the company should regain substantial flexibility to return capital after the deal is closed. POSITIONING AND OUTLOOK As of October 31, 2021, the Fund is significantly overweight in the utilities, consumer staples, and energy sectors and significantly underweight in the real estate, industrials, and materials sectors. The health care sector had the largest change in the past 12 months, going from modestly overweight in October 2020 to underweight at the end of the period, as the sector has not kept pace with the broader recovery. In contrast, the consumer discretionary sector went from a marginal underweight to a significant overweight as the holdings rebounded sharply, outpacing both the Fund and the broader market in the process. Almost a year after the vaccine was released, the market appears to have shifted to the mid-stage of the cycle. The sudden disruption of global supply chains left them unable to meet the return in global demand, and inflation has spiked as a result. In our view, as the pandemic-related disruptions come to an end and the labor market normalizes the economic expansion should reaccelerate, and much cheaper value stocks should outperform growth. As we move out of the early phase of the recovery amid low prevailing interest rates, the relative return for higher-quality and dividend-paying stocks we believe should be increasingly positive. This is doubly so given that while the short-term outlook is positive, it seems warning bells are going off everywhere. We continue to look to opportunities in defensive sectors which have lagged in recent months and should provide exposure to less-elastic demand categories that can pass along rising costs. We are pleased to have come out of the crisis with a collection of companies we believe can and will deliver attractive returns and stable, growing dividends in what will likely be a persistent low-rate environment in the coming quarters. This commentary reflects the viewpoints of River Road Asset Management, as of October 31, 2021, and is not intended as a forecast or guarantee of future results. |
22
|
AMG River Road Dividend All Cap Value Fund Portfolio Manager’s Comments (continued) |
CUMULATIVE TOTAL RETURN PERFORMANCE
AMG River Road Dividend All Cap Value Fund’s cumulative total return is based on the daily change in net asset value (NAV), and assumes that all dividends and distributions were reinvested. The graph compares a hypothetical $10,000 investment made in the AMG River Road Dividend All Cap Value Fund’s Class N shares on October 31, 2011, to a $10,000 investment made in the Russell 3000® Value Index for the same time period. The graph and table do not reflect the deduction of taxes that a shareholder would pay on a Fund distribution or redemption of shares. The listed returns for the Fund are net of expenses and the returns for the index exclude expenses. Total returns would have been lower had certain expenses not been reduced.
The table below shows the average annual total returns for the AMG River Road Dividend All Cap Value Fund and the Russell 3000® Value Index for the same time periods ended October 31, 2021.
| | | | | | | | | | | | | | | | | | | | |
| Average Annual Total Returns1 | | One
Year | | | Five
Years | | | Ten
Years | | | Since
Inception | | | Inception
Date | |
AMG River Road Dividend All Cap Value Fund2, 3, 4, 5, 6, 7, 8, 9, 10, 11 | | | | | |
| | | | | |
Class N | | | 34.74 | % | | | 9.13 | % | | | 10.18 | % | | | 8.19 | % | | | 06/28/05 | |
| | | | | |
Class I | | | 35.10 | % | | | 9.41 | % | | | 10.46 | % | | | 7.12 | % | | | 06/28/07 | |
| | | | | |
Class Z | | | 35.26 | % | | | – | | | | – | | | | 8.09 | % | | | 09/29/17 | |
| | | | | | |
Russell 3000® Value Index12 | | | 44.97 | % | | | 12.41 | % | | | 12.79 | % | | | 8.29 | % | | | 06/28/05 | † |
The performance data shown represents past performance. Past performance is not a guarantee of future results. Current performance may be lower or higher than the performance data quoted. The investment return and principal value of an investment will fluctuate so that an investor’s shares, when redeemed, may be worth more or less than their original cost.
Investors should carefully consider the Fund’s investment objectives, risks, charges and expenses before investing. For performance information through the most recent month end, current net asset values per share for the Fund and other information, please call 800.548.4539 or visit our website at amgfunds.com for a free prospectus. Read it carefully before investing or sending money.
Distributed by AMG Distributors, Inc., member FINRA/SIPC.
| † | Date reflects the inception date of the Fund, not the index. |
| 1 | Total return equals income yield plus share price change and assumes reinvestment of all dividends and capital gain distributions. Returns are net of fees and may reflect offsets of Fund expenses as described in the prospectus. No adjustment has been made for taxes payable by shareholders on their reinvested dividends and |
| | |
| | | capital gain distributions. Returns for periods greater than one year are annualized. The listed returns on the Fund are net of expenses and based on the published NAV as of October 31, 2021. All returns are in U.S. dollars ($). |
| | | 2 From time to time, the Fund’s advisor has waived its fees and/or absorbed Fund expenses, which has resulted in higher returns. |
| | | 3 Investing in Publicly Traded Partnerships (PTPs) (including master limited partnerships) involves risks in addition to those typically associated with publicly traded companies. PTPs are exposed to the risks of their underlying assets, which in many cases includes the same types of risks as energy and natural resources companies. PTPs are also subject to capital market risk. PTPs may lose their partnership status for tax purposes. The Fund’s status as a regulated investment company may be jeopardized if it does not appropriately limit such investments in PTPs or if such investments are recharacterized for tax purposes. |
| | | 4 An issuer of a security may be unwilling or unable to pay income on a security. Common stocks do not assure dividend payments and are paid only when declared by an issuer’s board of directors. |
| | | 5 Investments in international securities are subject to certain risks of overseas investing including currency fluctuations and changes in political and economic conditions, which could result in significant market fluctuations. These risks are magnified in emerging markets. |
| | | 6 The Fund is subject to risks associated with investments in mid-capitalization companies such as greater price volatility, lower trading volume, and less liquidity than the stocks of larger, more established companies. |
| | | 7 The Fund is subject to special risk considerations similar to those associated with the direct ownership of real estate. Real estate valuations may be subject to factors such as changing general and local economic, financial, competitive, and environmental conditions. |
| | | 8 The Fund is subject to risks associated with investments in small-capitalization companies, such as erratic earnings patterns, competitive conditions, limited earnings history and a reliance on one or a limited number of products. |
| | | 9 The Fund invests in value stocks, which may perform differently from the market as a whole and may be undervalued by the market for a long period of time. |
23
|
AMG River Road Dividend All Cap Value Fund Portfolio Manager’s Comments (continued) |
| | | | | | | | |
10 Market prices of investments held by the Fund may fall rapidly or unpredictably due to a variety of economic or political factors, market conditions, disasters or public health issues, or in response to events that affect particular industries or companies. 11 Companies that are in similar industry sectors may be similarly affected by particular economic or market events; to the extent the Fund has | | | | substantial holdings within a particular sector, the risks associated with that sector increase. 12 The Russell 3000® Value Index measures the performance of the broad value segment of the U.S. equity universe. It includes those Russell 3000® companies with lower price-to-book ratios and lower forecasted growth values. Unlike the Fund, the Russell 3000® Value Index is unmanaged, is not | | | | available for investment and does not incur expenses. The Russell 3000® Value Index is a trademark of the London Stock Exchange Group companies. Not FDIC insured, nor bank guaranteed. May lose value. |
24
|
AMG River Road Dividend All Cap Value Fund Fund Snapshots (unaudited) October 31, 2021 |
| | |
PORTFOLIO BREAKDOWN | | |
| Sector | | % of Net Assets |
| | |
Financials | | 19.3 |
| | |
Health Care | | 13.9 |
| | |
Information Technology | | 12.3 |
| | |
Consumer Staples | | 10.4 |
| | |
Utilities | | 10.0 |
| | |
Consumer Discretionary | | 9.1 |
| | |
Energy | | 8.9 |
| | |
Communication Services | | 8.1 |
| | |
Industrials | | 7.0 |
| | |
Short-Term Investments | | 2.0 |
| | |
Other Assets Less Liabilities | | (1.0) |
| | |
TOP TEN HOLDINGS | | |
| Security Name | | % of
Net Assets |
| | |
United Parcel Service, Inc., Class B | | 4.0 |
| | |
The AES Corp. | | 3.6 |
| | |
Truist Financial Corp. | | 3.5 |
| | |
Comcast Corp., Class A | | 3.2 |
| | |
Corning, Inc. | | 3.1 |
| | |
Target Corp. | | 3.0 |
| | |
Cisco Systems, Inc. | | 3.0 |
| | |
U.S. Bancorp | | 2.9 |
| | |
Verizon Communications, Inc. | | 2.9 |
| | |
Bristol-Myers Squibb Co. | | 2.5 |
| | | |
Top Ten as a Group | | 31.7 |
| | |
Because a fund’s strategy may result in multiple investments in particular sectors of the economy, its performance may depend on the performance of those sectors and may fluctuate more widely than investments diversified across more sectors. For additional information on these and other risk considerations, please see the Fund’s prospectus.
Any sectors, industries, or securities discussed should not be perceived as investment recommendations. Mention of a specific security should not be considered a recommendation to buy or solicitation to sell that security. Specific securities mentioned in this report may have been sold from the Fund’s portfolio of investments by the time you receive this report.
25
|
AMG River Road Dividend All Cap Value Fund Schedule of Portfolio Investments October 31, 2021 |
| | | | | | | | |
| | | Shares | | | Value | |
| | |
Common Stocks - 99.0% | | | | | | | | |
| |
Communication Services - 8.1% | | | | | |
| | |
Comcast Corp., Class A | | | 268,851 | | | $ | 13,827,007 | |
| | |
The Interpublic Group of Cos., Inc. | | | 232,570 | | | | 8,505,085 | |
| | |
Verizon Communications, Inc. | | | 233,256 | | | | 12,360,235 | |
| | |
Total Communication Services | | | | | | | 34,692,327 | |
| |
Consumer Discretionary - 9.1% | | | | | |
| | |
Advance Auto Parts, Inc. | | | 28,418 | | | | 6,408,828 | |
| | |
Genuine Parts Co. | | | 76,530 | | | | 10,033,848 | |
| | |
The Home Depot, Inc. | | | 6,408 | | | | 2,382,110 | |
| | |
Magna International, Inc. (Canada) | | | 86,081 | | | | 6,998,385 | |
| | |
Target Corp. | | | 50,021 | | | | 12,986,452 | |
| | |
Total Consumer Discretionary | | | | | | | 38,809,623 | |
| |
Consumer Staples - 10.4% | | | | | |
| | |
The JM Smucker Co. 1 | | | 31,913 | | | | 3,920,831 | |
| | |
Kimberly-Clark Corp. | | | 71,019 | | | | 9,196,250 | |
| | |
PepsiCo, Inc. | | | 54,127 | | | | 8,746,923 | |
| | |
Sysco Corp. | | | 118,201 | | | | 9,089,657 | |
| | |
Unilever PLC, Sponsored ADR (United Kingdom) | | | 187,849 | | | | 10,064,950 | |
| | |
Walgreens Boots Alliance, Inc. | | | 72,568 | | | | 3,412,147 | |
| | |
Total Consumer Staples | | | | | | | 44,430,758 | |
| | |
Energy - 8.9% | | | | | | | | |
| | |
Enterprise Products Partners LP, MLP | | | 378,367 | | | | 8,581,364 | |
| | |
Kinder Morgan, Inc. | | | 607,061 | | | | 10,168,272 | |
| | |
Magellan Midstream Partners LP, MLP | | | 57,580 | | | | 2,821,420 | |
| | |
Marathon Petroleum Corp. | | | 129,045 | | | | 8,507,937 | |
| | |
The Williams Cos., Inc. | | | 291,839 | | | | 8,197,757 | |
| | |
Total Energy | | | | | | | 38,276,750 | |
| |
Financials - 19.3% | | | | | |
| | |
Axis Capital Holdings, Ltd. (Bermuda) | | | 102,953 | | | | 5,360,763 | |
| | |
Chubb, Ltd. (Switzerland) | | | 49,748 | | | | 9,719,764 | |
| | |
CNA Financial Corp. | | | 147,380 | | | | 6,611,467 | |
| | |
Fidelity National Financial, Inc. | | | 173,047 | | | | 8,290,682 | |
| | |
M&T Bank Corp. | | | 52,922 | | | | 7,785,884 | |
| | |
The PNC Financial Services Group, Inc. | | | 32,997 | | | | 6,963,357 | |
| | |
The Progressive Corp. | | | 112,506 | | | | 10,674,569 | |
| | |
Truist Financial Corp. | | | 233,004 | | | | 14,788,764 | |
| | |
U.S. Bancorp | | | 208,021 | | | | 12,558,228 | |
| | |
Total Financials | | | | | | | 82,753,478 | |
| | |
Health Care - 13.9% | | | | | | | | |
| | |
AbbVie, Inc. | | | 85,342 | | | | 9,786,167 | |
| | |
Amgen, Inc. | | | 34,831 | | | | 7,208,972 | |
| | |
Bristol-Myers Squibb Co. | | | 183,656 | | | | 10,725,510 | |
| | | | | | | | |
| | | Shares | | | Value | |
| | |
Cerner Corp. | | | 60,307 | | | | $4,480,207 | |
| | |
Medtronic PLC (Ireland) | | | 25,636 | | | | 3,072,731 | |
| | |
Merck & Co., Inc. | | | 70,429 | | | | 6,201,273 | |
| | |
Pfizer, Inc. | | | 203,998 | | | | 8,922,873 | |
| | |
Premier, Inc., Class A | | | 237,884 | | | | 9,265,582 | |
| | |
Total Health Care | | | | | | | 59,663,315 | |
| |
Industrials - 7.0% | | | | | |
| | |
General Dynamics Corp. | | | 40,323 | | | | 8,175,488 | |
| | |
Lockheed Martin Corp. | | | 14,408 | | | | 4,788,067 | |
| | |
United Parcel Service, Inc., Class B | | | 80,123 | | | | 17,103,857 | |
| | |
Total Industrials | | | | | | | 30,067,412 | |
| |
Information Technology - 12.3% | | | | | |
| | |
Cass Information Systems, Inc. | | | 66,161 | | | | 2,711,939 | |
| | |
Cisco Systems, Inc. | | | 225,564 | | | | 12,624,817 | |
| | |
Corning, Inc. | | | 378,194 | | | | 13,452,361 | |
| | |
CSG Systems International, Inc. | | | 57,121 | | | | 2,858,906 | |
| | |
NortonLifeLock, Inc. | | | 191,367 | | | | 4,870,290 | |
| | |
Oracle Corp. | | | 92,751 | | | | 8,898,531 | |
| | |
QUALCOMM, Inc. | | | 54,836 | | | | 7,295,382 | |
| | |
Total Information Technology | | | | | | | 52,712,226 | |
| |
Utilities - 10.0% | | | | | |
| | |
The AES Corp. | | | 613,390 | | | | 15,414,491 | |
| | |
Atlantica Sustainable Infrastructure | | | | | | | | |
| | |
PLC (United Kingdom) | | | 225,001 | | | | 8,853,789 | |
| | |
Black Hills Corp. | | | 92,842 | | | | 6,162,852 | |
| | |
IDACORP, Inc. | | | 64,710 | | | | 6,750,547 | |
| | |
Vistra Corp. | | | 275,271 | | | | 5,392,559 | |
| | |
Total Utilities | | | | | | | 42,574,238 | |
| | |
Total Common Stocks | | | | | | | | |
(Cost $291,792,744) | | | | | | | 423,980,127 | |
| | |
Short-Term Investments - 2.0% | | | | | | | | |
| |
Other Investment Companies - 2.0% | | | | | |
| | |
Dreyfus Government Cash Management Fund, Institutional Shares, 0.03%2 | | | 2,910,893 | | | | 2,910,893 | |
| | |
Dreyfus Institutional Preferred Government Money Market Fund, Institutional Shares, 0.01%2 | | | 2,910,893 | | | | 2,910,893 | |
| | |
JPMorgan U.S. Government Money Market Fund, IM Shares, 0.03%2 | | | 2,999,102 | | | | 2,999,102 | |
| | |
Total Short-Term Investments | | | | | | | | |
(Cost $8,820,888) | | | | | | | 8,820,888 | |
| | |
Total Investments - 101.0% | | | | | | | | |
(Cost $300,613,632) | | | | | | | 432,801,015 | |
Other Assets, less Liabilities - (1.0)% | | | | | | | (4,369,964 | ) |
| | |
Net Assets - 100.0% | | | | | | $ | 428,431,051 | |
The accompanying notes are an integral part of these financial statements.
26
|
AMG River Road Dividend All Cap Value Fund Schedule of Portfolio Investments (continued) |
| | | | |
1 Some of these securities, amounting to $3,881,516 or 0.9% of net assets, were out on loan to various borrowers and are collateralized by various U.S. Treasury Obligations. See Note 4 of Notes to Financial Statements. 2 Yield shown represents the October 31, 2021, seven day average yield, which refers to the sum of the previous seven days’ dividends paid, expressed as an annual percentage. | | | | ADR American Depositary Receipt MLP Master Limited Partnership |
The following table summarizes the inputs used to value the Fund’s investments by the fair value hierarchy levels as of October 31, 2021:
| | | | | | | | | | | | | | | | |
| | | Level 1 | | | Level 2 | | | Level 3 | | | Total | |
Investments in Securities | | | | | | | | | | | | | | | | |
| | | | |
Common Stocks† | | $ | 423,980,127 | | | | – | | | | – | | | $ | 423,980,127 | |
| | | | |
Short-Term Investments | | | | | | | | | | | | | | | | |
| | | | |
Other Investment Companies | | | 8,820,888 | | | | – | | | | – | | | | 8,820,888 | |
| | | | | | | | | | | | | | | | |
| | | | |
Total Investments in Securities | | $ | 432,801,015 | | | | – | | | | – | | | $ | 432,801,015 | |
| | | | | | | | | | | | | | | | |
| † | All common stocks held in the Fund are Level 1 securities. For a detailed breakout of common stocks by major industry classification, please refer to the Fund’s Schedule of Portfolio Investments. |
For the fiscal year ended October 31, 2021, there were no transfers in or out of Level 3.
The accompanying notes are an integral part of these financial statements.
27
|
AMG River Road Small-Mid Cap Value Fund Portfolio Manager’s Comments (unaudited) |
| | | | | | | | |
OVERVIEW For the fiscal year ended October 31, 2021, AMG River Road Small-Mid Cap Value Fund (the “Fund”) Class N shares returned 44.27%, compared to the Russell 2500® Value Index return of 58.14%. PERFORMANCE REVIEW The sector with the largest negative contribution to relative return was financials, which suffered from negative stock selection and an underweight allocation to banks. The sector with the largest positive contribution to relative return was utilities, which benefited from an underweight allocation. The Fund’s cash position, which averaged 4% during the period, was also a negative contributor to relative performance. The top contributing holdings in the Fund were Atkore, Inc. (ATKR) and LKQ Corp. (LKQ). Atkore is a manufacturer of branded products that protect and frame electrical circuitry. Atkore reported several strong quarters due to solid demand for PVC and metal conduit leading to favorable pricing and volume growth. Atkore’s agile business model has allowed the company to manage supply chain and inflation constraints while maintaining industry-leading fill rates. As a result, EBITDA margins and free cash flow generation have surged higher, supporting a significant increase in 2021 guidance. We have trimmed the position, as this growth is not expected to be maintained in 2022. LKQ is a global distributor of aftermarket and recycled replacement parts for vehicle repair. Economic and industry conditions remain favorable as LKQ is currently benefiting from a global rebound in miles driven (more collisions) and the further aging of the car parc (constrained new vehicle inventory has pushed used car prices higher, which extends their lives and results in more repairs for out-of-warranty automobiles using less expensive alternative parts.) LKQ’s scale and network advantages are driving | | | | continued market share gains as smaller competitors struggle with inventory and their overall financial positions. LKQ is also seeing the favorable impact of the recreational vehicle (RV) sales boom on its growing specialty segment. We believe this sales growth is leveraging a permanently lower cost structure following implementation of a wide-ranging cost savings program during the pandemic, resulting in impressive margin expansion. Furthermore, significant improvements in working capital have aided record levels of free cash flow, which has driven leverage to its lowest level in nearly 10 years and earned LKQ an investment-grade credit rating. We maintained the position as it still trades at a discount to our assessed value. The bottom contributing holdings in the Fund were GoHealth, Inc. (GOCO) and Air Transport Services Group, Inc. (ATSG). GoHealth is a distribution platform primarily selling Medicare Advantage plans to senior citizens. Shares dropped sharply when 2021 EBITDA guidance was cut (14)% largely due to rising agent costs. GoHealth is on target to increase agent count ~50% amid a historically tight labor market, which has increased expenses more than expected. Graduation rates from the company’s agent training program fell from over 80% to roughly 50%. COVID-19 necessitated remote training, which has proven to be less effective than in-person training. Additionally, some trainees were recruited away to other industries before completing the six-week training course. GoHealth paid many trainees who never transitioned to productive, revenue-generating agents. The company has restructured incentives for trainees and is to pay bonuses at key milestones. Additionally, the pace of hiring after this annual enrollment period should slow, which will allow GoHealth to optimize its agent base rather than recruit massive numbers of new agents in potentially challenging labor markets. Management strongly believes this is a transitory issue and unit economics will be attractive going forward. Nonetheless, we | | | | trimmed the position in accordance with our sell discipline. Air Transport is the premier lessor of wide-body freighter aircraft, primarily the Boeing 767. Air Transport grew revenue and EBITDA throughout the year by expanding its fleet, including leasing new aircraft to Amazon under 10-year leases. The impact of COVID-19 accelerated the transition toward e-commerce, which should continue to drive demand for Air Transport’s unique cargo and logistics assets. We opportunistically added to the position due to its attractive valuation and promising growth outlook. OUTLOOK AND POSITIONING We continue to believe high-quality smaller-cap value stocks are extraordinarily well positioned as the COVID-19 Delta variant recedes and the reopening economy gains momentum. However, several fresh challenges to our outlook have emerged, most notably a sharp spike in commodity prices, continuing supply chain issues, and tightness in the labor force – all of which could put pressure on smaller cap earnings over the next few quarters. Aside from these challenges, the biggest risk we are focused on is valuations. While small cap value stocks look very attractive relative to large cap and small cap growth, they are expensive on an absolute basis. On their own, high absolute valuations rarely kill a bull market but they could limit near-term upside and greatly amplify volatility. In our opinion, the combination of these factors creates an environment where fundamentals and intrinsic valuation greatly matter and, thus, the best opportunities are likely to be found among attractively priced, high-quality smaller-cap stocks. This commentary reflects the viewpoints of River Road Asset Management as of October 31, 2021, and is not intended as a forecast or guarantee of future results. |
28
|
AMG River Road Small-Mid Cap Value Fund Portfolio Manager’s Comments (continued) |
CUMULATIVE TOTAL RETURN PERFORMANCE
AMG River Road Small-Mid Cap Value Fund’s cumulative total return is based on the daily change in net asset value (NAV), and assumes that all dividends and distributions were reinvested. The graph compares a hypothetical $10,000 investment made in the AMG River Road Small-Mid Cap Value Fund’s Class N shares on October 31, 2011, to a $10,000 investment made in the Russell 2500® Value Index and Russell 2000® Value Index for the same time period. The graph and table do not reflect the deduction of taxes that a shareholder would pay on a Fund distribution or redemption of shares. The listed returns for the Fund are net of expenses and the returns for the indexes exclude expenses. Total returns would have been lower had certain expenses not been reduced.
The table below shows the average annual total returns for the AMG River Road Small-Mid Cap Value Fund and the Russell 2500® Value Index and Russell 2000® Value Index for the same time periods ended October 31, 2021.
| | | | | | | | | | | | | | | | | | | | |
| Average Annual Total Returns1 | | One Year | | | Five Years | | | Ten Years | | | Since Inception | | | Inception Date | |
AMG River Road Small-Mid Cap Value Fund2, 3, 4, 5, 6, 7, 8, 9 | | | | | |
| | | | | |
Class N | | | 44.27% | | | | 14.01% | | | | 12.23% | | | | 7.98% | | | | 03/29/07 | |
| | | | | |
Class I | | | 44.70% | | | | 14.31% | | | | 12.51% | | | | 8.02% | | | | 06/28/07 | |
| | | | | |
Class Z | | | 44.77% | | | | – | | | | – | | | | 10.88% | | | | 09/29/17 | |
| | | | | |
Russell 2500® Value Index10 | | | 58.14% | | | | 12.20% | | | | 12.40% | | | | 7.82% | | | | 03/29/07 | † |
| | | | | |
Russell 2000® Value Index11 | | | 64.30% | | | | 12.61% | | | | 12.12% | | | | 7.27% | | | | 03/29/07 | † |
The performance data shown represents past performance. Past performance is not a guarantee of future results. Current performance may be lower or higher than the performance data quoted. The investment return and principal value of an investment will fluctuate so that an investor’s shares, when redeemed, may be worth more or less than their original cost.
Investors should carefully consider the Fund’s investment objectives, risks, charges and expenses before investing. For performance information through the most recent month end, current net asset values per share for the Fund and other information, please call 800.548.4539 or visit our website at amgfunds.com for a free prospectus. Read it carefully before investing or sending money.
Distributed by AMG Distributors, Inc., member FINRA/SIPC.
| † | Date reflects the inception date of the Fund, not the index. |
| 1 | Total return equals income yield plus share price change and assumes reinvestment of all dividends and capital gain distributions. Returns are net of fees and may reflect offsets of Fund expenses as described in the |
| | |
| | | prospectus. No adjustment has been made for taxes payable by shareholders on their reinvested dividends and capital gain distributions. Returns for periods greater than one year are annualized. The listed returns on the Fund are net of expenses and based on the published NAV as of October 31, 2021. All returns are in U.S. dollars ($). 2 From time to time, the Fund’s advisor has waived its fees and/or absorbed Fund expenses, which has resulted in higher returns. 3 The Fund is subject to special risk considerations similar to those associated with the direct ownership of real estate. Real estate valuations may be subject to factors such as changing general and local economic, financial, competitive, and environmental conditions. 4 The Fund is subject to risks associated with investments in small-capitalization companies, such as erratic earnings patterns, competitive conditions, limited earnings history and a reliance on one or a limited number of products. 5 The Fund invests in value stocks, which may perform differently from the market as a whole and may be undervalued by the market for a long period of time. 6 Market prices of investments held by the Fund may fall rapidly or unpredictably due to a variety of economic or political factors, market conditions, disasters or public health issues, or in response to events that affect particular industries or companies. |
| | | 7 Investments in international securities are subject to certain risks of overseas investing including currency fluctuations and changes in political and economic conditions, which could result in significant market fluctuations. These risks are magnified in emerging markets. 8 The Fund is subject to risks associated with investments in mid-capitalization companies such as greater price volatility, lower trading volume, and less liquidity than the stocks of larger, more established companies. 9 Companies that are in similar industry sectors may be similarly affected by particular economic or market events; to the extent the Fund has substantial holdings within a particular sector, the risks associated with that sector increase. 10 The Russell 2500® Value Index measures the performance of the Russell 2500® companies with lower price-to-book ratios and lower forecasted growth values. Unlike the Fund, the Russell 2500® Value Index is unmanaged, is not available for investment and does not incur expenses. |
29
|
AMG River Road Small-Mid Cap Value Fund Portfolio Manager’s Comments (continued) |
| | | | | | | | |
11 The Russell 2000® Value Index is an unmanaged, market-value weighted, value-oriented index comprised of small stocks that have relatively low price-to-book ratios and lower forecasted growth values. Unlike the Fund, the Russell 2000® Value | | | | Index is unmanaged, is not available for investment and does not incur expenses. The Russell Indices are a trademark of the London Stock Exchange Group companies. | | | | Not FDIC insured, nor bank guaranteed. May lose value. |
30
|
AMG River Road Small-Mid Cap Value Fund Fund Snapshots (unaudited) October 31, 2021 |
PORTFOLIO BREAKDOWN
| | |
| Sector | | % of
Net Assets |
| | |
Industrials | | 30.3 |
| | |
Financials | | 17.7 |
| | |
Information Technology | | 13.6 |
| | |
Consumer Discretionary | | 10.4 |
| | |
Consumer Staples | | 8.3 |
| | |
Health Care | | 6.2 |
| | |
Energy | | 3.0 |
| | |
Utilities | | 2.8 |
| | |
Materials | | 2.7 |
| | |
Communication Services | | 1.6 |
| | |
Real Estate | | 0.6 |
| | |
Short-Term Investments | | 3.4 |
| | |
Other Assets Less Liabilities | | (0.6) |
TOP TEN HOLDINGS
| | |
| Security Name | | % of
Net Assets |
| | |
LKQ Corp. | | 4.2 |
| | |
Cannae Holdings, Inc. | | 3.9 |
| | |
Air Transport Services Group, Inc. | | 3.8 |
| | |
White Mountains Insurance Group, Ltd. | | 3.5 |
| | |
Premier, Inc., Class A | | 3.3 |
| | |
NCR Corp. | | 3.2 |
| | |
Advance Auto Parts, Inc. | | 3.1 |
| | |
Murphy USA, Inc. | | 3.1 |
| | |
Hostess Brands, Inc. | | 2.9 |
| | |
Fidelity National Financial, Inc. | | 2.7 |
| | | |
| | |
Top Ten as a Group | | 33.7 |
| | |
Because a fund’s strategy may result in multiple investments in particular sectors of the economy, its performance may depend on the performance of those sectors and may fluctuate more widely than investments diversified across more sectors. For additional information on these and other risk considerations, please see the Fund’s prospectus.
Any sectors, industries, or securities discussed should not be perceived as investment recommendations. Mention of a specific security should not be considered a recommendation to buy or solicitation to sell that security. Specific securities mentioned in this report may have been sold from the Fund’s portfolio of investments by the time you receive this report.
31
|
AMG River Road Small-Mid Cap Value Fund Schedule of Portfolio Investments October 31, 2021 |
| | | | | | | | |
| | | Shares | | | Value | |
| | |
Common Stocks - 97.2% | | | | | | | | |
| |
Communication Services - 1.6% | | | | | |
| | |
Liberty Latin America, Ltd., Class A* | | | 141,852 | | | | $1,705,061 | |
| | |
Liberty Latin America, Ltd., Class C* | | | 235,335 | | | | 2,831,080 | |
| | |
Total Communication Services | | | | | | | 4,536,141 | |
| |
Consumer Discretionary - 10.4% | | | | | |
| | |
Advance Auto Parts, Inc. | | | 38,183 | | | | 8,611,030 | |
| | |
LKQ Corp.* | | | 211,761 | | | | 11,663,796 | |
| | |
Murphy USA, Inc. | | | 52,047 | | | | 8,481,059 | |
| | |
Total Consumer Discretionary | | | | | | | 28,755,885 | |
| |
Consumer Staples - 8.3% | | | | | |
| | |
BJ’s Wholesale Club Holdings, Inc.*,1 | | | 103,280 | | | | 6,035,683 | |
| | |
Hostess Brands, Inc.* | | | 427,278 | | | | 8,079,827 | |
| | |
Ingles Markets, Inc., Class A | | | 39,074 | | | | 2,703,530 | |
| | |
Molson Coors Beverage Co., Class B | | | 103,837 | | | | 4,578,174 | |
| | |
Whole Earth Brands, Inc.*,1 | | | 137,431 | | | | 1,667,038 | |
| | |
Total Consumer Staples | | | | | | | 23,064,252 | |
| |
Energy - 3.0% | | | | | |
| | |
Centennial Resource Development, Inc., Class A* | | | 91,843 | | | | 661,270 | |
| | |
HollyFrontier Corp. | | | 113,426 | | | | 3,833,799 | |
| | |
SM Energy Co. | | | 42,615 | | | | 1,462,547 | |
| | |
World Fuel Services Corp. | | | 80,546 | | | | 2,459,069 | |
| | |
Total Energy | | | | | | | 8,416,685 | |
| |
Financials - 17.7% | | | | | |
| | |
American Equity Investment Life Holding Co. | | | 213,461 | | | | 6,803,002 | |
| | |
Axis Capital Holdings, Ltd. (Bermuda) | | | 92,639 | | | | 4,823,713 | |
| | |
Cannae Holdings, Inc.* | | | 321,147 | | | | 10,951,113 | |
| | |
CNA Financial Corp. | | | 68,476 | | | | 3,071,833 | |
| | |
eHealth, Inc.* | | | 17,517 | | | | 776,879 | |
| | |
Fidelity National Financial, Inc. | | | 154,677 | | | | 7,410,575 | |
| | |
Genworth Financial, Inc., Class A* | | | 1,031,941 | | | | 4,241,278 | |
| | |
GoHealth, Inc., Class A*,1 | | | 241,865 | | | | 1,306,071 | |
| | |
White Mountains Insurance Group, Ltd. | | | 9,180 | | | | 9,684,808 | |
| | |
Total Financials | | | | | | | 49,069,272 | |
| |
Health Care - 6.2% | | | | | |
| | |
Computer Programs and Systems, Inc.* | | | 57,161 | | | | 2,063,512 | |
| | |
Haemonetics Corp.* | | | 25,307 | | | | 1,738,844 | |
| | |
MEDNAX, Inc.* | | | 46,771 | | | | 1,273,574 | |
| | |
Patterson Cos., Inc. | | | 97,548 | | | | 3,049,350 | |
| | |
Premier, Inc., Class A | | | 231,727 | | | | 9,025,767 | |
| | |
Total Health Care | | | | | | | 17,151,047 | |
| |
Industrials - 30.3% | | | | | |
| | |
Air Transport Services Group, Inc.* | | | 422,778 | | | | 10,522,944 | |
| | | | | | | | |
| | | Shares | | | Value | |
| | |
Alight, Inc., Class A*,1 | | | 473,296 | | | | $5,149,460 | |
| | |
Argan, Inc. | | | 99,631 | | | | 4,110,775 | |
| | |
Armstrong World Industries, Inc. | | | 61,860 | | | | 6,535,509 | |
| | |
Atkore, Inc.* | | | 42,792 | | | | 4,045,128 | |
| | |
CACI International, Inc., Class A* | | | 21,413 | | | | 6,159,235 | |
| | |
Colfax Corp.*,1 | | | 36,360 | | | | 1,876,903 | |
| | |
Comfort Systems USA, Inc. | | | 74,172 | | | | 6,784,513 | |
| | |
CoreCivic, Inc.* | | | 449,030 | | | | 3,866,148 | |
| | |
Curtiss-Wright Corp. | | | 36,432 | | | | 4,651,638 | |
| | |
Dun & Bradstreet Holdings, Inc.* | | | 187,868 | | | | 3,539,433 | |
| | |
GrafTech International, Ltd. | | | 433,027 | | | | 4,633,389 | |
| | |
Harsco Corp.* | | | 159,325 | | | | 2,724,457 | |
| | |
Huntington Ingalls Industries, Inc. | | | 23,224 | | | | 4,708,202 | |
| | |
SP Plus Corp.* | | | 105,859 | | | | 3,413,953 | |
| | |
UniFirst Corp. | | | 36,679 | | | | 7,260,975 | |
| | |
Univar Solutions, Inc.* | | | 91,865 | | | | 2,349,907 | |
| | |
Viad Corp.* | | | 36,345 | | | | 1,612,628 | |
| | |
Total Industrials | | | | | | | 83,945,197 | |
| |
Information Technology - 13.6% | | | | | |
| | |
ACI Worldwide, Inc.* | | | 167,166 | | | | 5,128,653 | |
| | |
Avaya Holdings Corp.* | | | 375,047 | | | | 6,983,375 | |
| | |
CDK Global, Inc. | | | 111,017 | | | | 4,831,460 | |
| | |
DXC Technology Co.* | | | 83,985 | | | | 2,735,391 | |
| | |
ePlus, Inc.* | | | 49,997 | | | | 5,528,168 | |
| | |
Ituran Location and Control, Ltd. (Israel) | | | 57,256 | | | | 1,489,229 | |
| | |
NCR Corp.* | | | 227,280 | | | | 8,986,651 | |
| | |
Vonage Holdings Corp.* | | | 117,482 | | | | 1,893,810 | |
| | |
Total Information Technology | | | | | | | 37,576,737 | |
| |
Materials - 2.7% | | | | | |
| | |
Axalta Coating Systems, Ltd.* | | | 197,750 | | | | 6,167,822 | |
| | |
TriMas Corp. | | | 35,380 | | | | 1,179,923 | |
| | |
Total Materials | | | | | | | 7,347,745 | |
| |
Real Estate - 0.6% | | | | | |
| | |
Newmark Group, Inc., Class A | | | 107,946 | | | | 1,606,236 | |
| |
Utilities - 2.8% | | | | | |
| | |
OGE Energy Corp. | | | 83,923 | | | | 2,859,256 | |
| | |
Pinnacle West Capital Corp. | | | 5,069 | | | | 326,900 | |
| | |
Vistra Corp. | | | 238,959 | | | | 4,681,207 | |
| | |
Total Utilities | | | | | | | 7,867,363 | |
| | |
Total Common Stocks | | | | | | | | |
(Cost $218,940,595) | | | | | | | 269,336,560 | |
The accompanying notes are an integral part of these financial statements.
32
|
AMG River Road Small-Mid Cap Value Fund Schedule of Portfolio Investments (continued) |
| | | | | | | | |
| | | Principal
Amount | | | Value | |
| | |
Short-Term Investments - 3.4% | | | | | | | | |
| |
Joint Repurchase Agreements - 1.2%2 | | | | | |
| | |
Bank of America Securities, Inc., dated 10/29/21, due 11/01/21, 0.050% total to be received $1,000,004 (collateralized by various U.S. Government Agency Obligations, 1.500% - 5.000%, 09/01/28 - 01/01/59, totaling $1,020,000) | | | $1,000,000 | | | | $1,000,000 | |
| | |
Citigroup Global Markets, Inc., dated 10/29/21, due 11/01/21, 0.050% total to be received $222,310 (collateralized by various U.S. Treasuries, 0.125% - 3.625%, 02/15/22 - 02/15/51, totaling $226,755) | | | 222,309 | | | | 222,309 | |
| | |
Deutsche Bank Securities, Inc., dated 10/29/21, due 11/01/21, 0.050% total to be received $1,000,004 (collateralized by various U.S. Government Agency Obligations and U.S. Treasuries, 0.000% - 8.000%, 11/04/21 - 08/15/51, totaling $1,020,000) | | | 1,000,000 | | | | 1,000,000 | |
| | |
RBC Dominion Securities, Inc., dated 10/29/21, due 11/01/21, 0.050% total to be received $1,000,004 (collateralized by various U.S. Government Agency Obligations and U.S. Treasuries, 0.000% - 6.000%, 11/01/21 - 07/20/51, totaling $1,020,000) | | | 1,000,000 | | | | 1,000,000 | |
| |
Total Joint Repurchase Agreements | | | | 3,222,309 | |
| | | | | | | | |
| | | Shares | | | Value | |
| |
Other Investment Companies - 2.2% | | | | | |
| | |
Dreyfus Government Cash Management Fund, Institutional Shares, 0.03%3 | | | 2,040,860 | | | | $2,040,860 | |
| | |
Dreyfus Institutional Preferred Government Money Market Fund, Institutional Shares, 0.01%3 | | | 2,040,859 | | | | 2,040,859 | |
| | |
JPMorgan U.S. Government Money Market Fund, IM Shares, 0.03%3 | | | 2,102,703 | | | | 2,102,703 | |
| |
Total Other Investment Companies | | | | 6,184,422 | |
| |
Total Short-Term Investments | | | | | |
(Cost $9,406,731) | | | | | | | 9,406,731 | |
| | |
Total Investments - 100.6% | | | | | | | | |
(Cost $228,347,326) | | | | | | | 278,743,291 | |
| |
Other Assets, less Liabilities - (0.6)% | | | | (1,576,842 | ) |
| | |
Net Assets - 100.0% | | | | | | | $277,166,449 | |
| * | Non-income producing security. |
| 1 | Some of these securities, amounting to $11,915,505 or 4.3% of net assets, were out on loan to various borrowers and are collateralized by cash and various U.S. Treasury Obligations. See Note 4 of Notes to Financial Statements. |
| 2 | Cash collateral received for securities lending activity was invested in these joint repurchase agreements. |
| 3 | Yield shown represents the October 31, 2021, seven day average yield, which refers to the sum of the previous seven days’ dividends paid, expressed as an annual percentage. |
The following table summarizes the inputs used to value the Fund’s investments by the fair value hierarchy levels as of October 31, 2021:
| | | | | | | | | | | | | | | | |
| | | Level 1 | | | Level 2 | | | Level 3 | | | Total | |
Investments in Securities | | | | | | | | | | | | | | | | |
| | | | |
Common Stocks† | | $ | 269,336,560 | | | | – | | | | – | | | $ | 269,336,560 | |
| | | | |
Short-Term Investments | | | | | | | | | | | | | | | | |
| | | | |
Joint Repurchase Agreements | | | – | | | $ | 3,222,309 | | | | – | | | | 3,222,309 | |
| | | | |
Other Investment Companies | | | 6,184,422 | | | | – | | | | – | | | | 6,184,422 | |
| | | | | | | | | | | | | | | | |
Total Investments in Securities | | $ | 275,520,982 | | | $ | 3,222,309 | | | | – | | | $ | 278,743,291 | |
| | | | | | | | | | | | | | | | |
| | † | All common stocks held in the Fund are Level 1 securities. For a detailed breakout of common stocks by major industry classification, please refer to the Fund’s Schedule of Portfolio Investments. |
For the fiscal year ended October 31, 2021, there were no transfers in or out of Level 3.
The accompanying notes are an integral part of these financial statements.
33
|
AMG River Road International Value Equity Fund Portfolio Manager’s Comments (unaudited) |
| | | | |
OVERVIEW For the fiscal year ended October 31, 2021, AMG River Road International Value Equity Fund (the “Fund”) Class N shares returned 22.06%, trailing the 34.18% return for the MSCI EAFE Index, the Fund’s current benchmark, and the 43.90% return for the Fund’s prior benchmark, the Russell 3000® Index. On August 12, 2021, the Fund’s shareholders approved a change to the Fund’s Principal Investment Strategies from seeking to provide absolute return while minimizing volatility over a full market cycle to seeking to provide long-term capital appreciation. The Fund’s mandate changed from long-short equity within domestic markets to long-only equity in non-U.S. markets. Also approved was the change in the Fund’s name and benchmark, and a change in the Fund’s sub-classification from “non-diversified” to “diversified.” These changes became effective August 16, 2021. PERFORMANCE REVIEW During the first portion of the fiscal year under the Fund’s prior mandate, the Fund underperformed both the former and current benchmark. The Fund’s short positions detracted from absolute performance during this period. During the second portion of the fiscal year under the new mandate, the Fund modestly trailed both the former and current benchmarks. The region with the largest negative contribution to relative return was Europe (ex UK) due to negative stock selection. Underperformance was partially offset by an overweight allocation to the Middle East. The sector with the largest negative contribution to relative return was financials, which suffered from an underweight allocation and negative stock selection. Most of the poor stock selection within financials was attributable to China | | as real estate concerns weighed on the sector. The underperformance was partially offset by positive stock selection and an underweight allocation within the materials sector. The top contributing holdings in the Fund were Sony Corp. (6758-JP) and Elbit Systems, Ltd. (ESLT-US). Sony is one of the world’s largest media entertainment and consumer electronics companies. The company holds market leadership positions for most of its business segments and is currently benefiting from robust demand for video gaming and music streaming. We expect Sony will further strengthen its market position in these two fast-growing businesses through its PlayStation ecosystem and world-class music content. Elbit is an Israel-based global defense electronics company engaged in a wide range of programs worldwide. Elbit appears to have strong technological competitive advantages in airborne and C4ISR systems and enjoys a low-cost advantage due to its synergistic “one company” management approach. We believe Elbit is well positioned to benefit from rising global defense spending and should continue to win large contracts. The bottom contributing holdings in the Fund were Deutsche Telekom AG (DTE-DE) and Novartis AG (NOVN-CH). Deutsche Telekom is the largest telecommunications provider in Europe and owns an approximate 48% stake in the second-largest U.S. wireless carrier, T-Mobile. Concerns over slowing subscriber growth for T-Mobile contributed to the recent underperformance of Deutsche Telekom. Despite these concerns, we believe Deutsche Telekom is well positioned to grow in both Europe and the United States, while also returning free cash flow to investors through dividends and share repurchases. Novartis is one of the world’s largest | | pharmaceutical companies and is a leader in cancer and rare disease treatments, as well as other therapy platforms. The Biden administration’s plan to reduce prescription drug prices by empowering the federal government to negotiate prices for Medicare drugs weighed on the sector. Although Novartis is generally viewed as having above-average exposure to potential price negotiation, we continue to view the stock as attractive given its global scale and R&D expertise, as well as its broad drug portfolio and robust pipeline that mitigates the risk of drug patent expiry. POSITIONING AND OUTLOOK Although global equity markets trade at premium valuations to their long-term averages, we believe international equity markets remain attractively valued relative to U.S. equity markets. Furthermore, we expect to see relatively stronger corporate earnings growth in international markets for the balance of 2021, based on increasing vaccination rates, additional monetary and fiscal stimulus, and ramping consumer activity. However, earnings are likely to moderate in 2022 if supply chain disruptions, labor shortages, and rising inflation persist well into the New Year. The Fund focuses on investing in high quality companies with improving fundamentals trading at attractive valuations. We believe the Fund is well positioned to benefit from attractive relative international market valuations and weather an uncertain outlook for 2022 earnings. This commentary reflects the viewpoints of River Road Asset Management as of October 31, 2021, and is not intended as a forecast or guarantee of future results. |
34
|
AMG River Road International Value Equity Fund Portfolio Manager’s Comments (continued) |
CUMULATIVE TOTAL RETURN PERFORMANCE
AMG River Road International Value Equity Fund’s cumulative total return is based on the daily change in net asset value (NAV), and assumes that all dividends and distributions were reinvested. The graph compares a hypothetical $10,000 investment made in the AMG River Road International Value Equity Fund’s Class N shares on October 31, 2011, to a $10,000 investment made in the MSCI EAFE Index, MSCI EAFE Value Index, and Russell 3000® Index for the same time period. The graph and table do not reflect the deduction of taxes that a shareholder would pay on a Fund distribution or redemption of shares. The listed returns for the Fund are net of expenses and the returns for the indexes exclude expenses. Total returns would have been lower had certain expenses not been reduced.
The table below shows the average annual total returns for the AMG River Road International Value Equity Fund and the MSCI EAFE Index, MSCI EAFE Value Index, and Russell 3000® Index for the same time periods ended October 31, 2021.
| | | | | | | | | | | | | | | | | | | | |
| Average Annual Total Returns1 | | One
Year | | | Five
Years | | | Ten
Years | | | Since Inception | | | Inception
Date | |
AMG River Road International Value Equity Fund2, 3, 4, 5, 6, 7, 8, 9, 10 | | | | | |
| | | | | |
Class N | | | 22.06% | | | | 7.82% | | | | 6.39% | | | | 6.01% | | | | 05/04/11 | |
| | | | | |
Class I | | | 22.48% | | | | 8.09% | | | | – | | | | 5.81% | | | | 03/04/13 | |
| | | | | |
Class Z | | | 22.58% | | | | – | | | | – | | | | 6.99% | | | | 09/29/17 | |
| | | | | |
MSCI EAFE Index11 | | | 34.18% | | | | 9.79% | | | | 7.37% | | | | 5.37% | | | | 05/04/11 | † |
| | | | | |
MSCI EAFE Value Index12 | | | 38.31% | | | | 6.25% | | | | 5.21% | | | | 3.27% | | | | 05/04/11 | † |
| | | | | |
Russell 3000® Index13 | | | 43.90% | | | | 18.91% | | | | 16.10% | | | | 14.41% | | | | 05/04/11 | † |
The performance data shown represents past performance. Past performance is not a guarantee of future results. Current performance may be lower or higher than the performance data quoted. The investment return and principal value of an investment will fluctuate so that an investor’s shares, when redeemed, may be worth more or less than their original cost.
Investors should carefully consider the Fund’s investment objectives, risks, charges and expenses before investing. For performance information through the most recent month end, current net asset values per share for the Fund and other information, please call 800.548.4539 or visit our website at amgfunds.com for a free prospectus. Read it carefully before investing or sending money.
Distributed by AMG Distributors, Inc., member FINRA/SIPC.
| † | Date reflects the inception date of the Fund, not the index. |
| | |
| | | 1 Total return equals income yield plus share price change and assumes reinvestment of all dividends and capital gain distributions. Returns are net of fees and may reflect offsets of Fund expenses as described in the prospectus. No adjustment has been made for taxes payable by shareholders on their reinvested dividends and capital gain distributions. Returns for periods greater than one year are annualized. The listed returns on the Fund are net of expenses and based on the published NAV as of October 31, 2021. All returns are in U.S. dollars ($). |
| | | 2 From time to time, the Fund’s advisor has waived its fees and/or absorbed Fund expenses, which has resulted in higher returns. 3 Effective August 16, 2021, the Fund went from a non-diversified fund to a diversified fund. 4 The Fund is subject to special risk considerations similar to those associated with the direct ownership of real estate. Real estate valuations may be subject to factors such as changing general and local economic, financial, competitive, and environmental conditions. 5 Investments in international securities are subject to certain risks of overseas investing including currency fluctuations and changes in political and economic conditions, which could result in significant market fluctuations. These risks are magnified in emerging markets. |
| | | 6 Investing in Publicly Traded Partnerships (PTPs) (including master limited partnerships) involves risks in addition to those typically associated with publicly traded companies. PTPs are exposed to the risks of their underlying assets, which in many cases includes the same types of risks as energy and natural resources companies. PTPs are also subject to capital markets risk. PTPs may lose their partnership status for tax purposes. The Fund’s status as a regulated investment company may be jeopardized if it does not appropriately limit such investments in PTPs or if such investments are recharacterized for tax purposes. |
| | | 7 Market prices of investments held by the Fund may fall rapidly or unpredictably due to a variety of economic or political factors, market conditions, disasters or public health issues, or in response to events that affect particular industries or companies. |
| | | 8 Companies that are in similar industry sectors may be similarly affected by particular economic or market events; to the extent the Fund has substantial holdings within a particular sector, the risks associated with that sector increase. 9 The Fund invests in value stocks, which may perform differently from the market as a whole and may be undervalued by the market for a long period of time. |
35
|
AMG River Road International Value Equity Fund Portfolio Manager’s Comments (continued) |
| | | | | | | | |
10 On August 16, 2021, the fund changed investment strategy. 11 On August 16, 2021, the primary benchmark changed from the Russell 3000® Index to the MSCI EAFE Index. The MSCI EAFE Index (Europe, Australasia, Far East) is a free float-adjusted market capitalization index that is designed to measure the equity market performance of developed markets, excluding the U.S. & Canada. Please go to msci.com for most current list of countries represented by the index. Unlike the Fund, the MSCI EAFE Index is unmanaged, is not available for investment and does not incur expenses. 12 The Fund’s secondary benchmark is the MSCI EAFE | | | | Value Index (Europe, Australasia, Far East) captures large and mid cap securities exhibiting overall value style characteristics across Developed Markets countries* around the world, excluding the U.S. and Canada. Please go to msci.com for most current list of countries represented by the index. Unlike the Fund, the MSCI EAFE Value Index is unmanaged, is not available for investment and does not incur expenses. 13 The Russell 3000® Index is composed of the 3,000 largest U.S. companies as measured by market capitalization, and represents about 98% of the U.S. stock market. Unlike the Fund, the Russell 3000® Index is unmanaged, is not available for investment and does not incur expenses. | | | | All MSCI data is provided “as is.” The products described herein are not sponsored or endorsed and have not been reviewed or passed on by MSCI. In no event shall MSCI, its affiliates, or any MSCI data provider have any liability of any kind in connection with the MSCI data or the products described herein. Copying or redistributing the MSCI data is strictly prohibited. The Russell 3000® Index is a trademark of London Stock Exchange Group companies. Not FDIC insured, nor bank guaranteed. May lose value. |
36
|
AMG River Road International Value Equity Fund Fund Snapshots (unaudited) October 31, 2021 |
PORTFOLIO BREAKDOWN
| | |
| Sector | | % of
Net Assets |
| | |
Financials | | 22.5 |
| | |
Industrials | | 15.4 |
| | |
Information Technology | | 14.4 |
| | |
Health Care | | 11.7 |
| | |
Communication Services | | 10.8 |
| | |
Consumer Staples | | 8.9 |
| | |
Consumer Discretionary | | 5.5 |
| | |
Energy | | 2.7 |
| | |
Materials | | 2.2 |
| | |
Utilities | | 2.0 |
| | |
Short-Term Investments | | 3.8 |
| | |
Other Assets Less Liabilities | | 0.1 |
TOP TEN HOLDINGS
| | |
| Security Name | | % of
Net Assets |
| | |
Sony Corp. (Japan) | | 3.8 |
| | |
SAP SE (Germany) | | 3.5 |
| | |
SK Telecom Co., Ltd., Sponsored ADR (South Korea) | | 3.4 |
| | |
Elbit Systems, Ltd. (Israel) | | 3.4 |
| | |
Check Point Software Technologies, Ltd. (Israel) | | 3.1 |
| | |
Genpact, Ltd. | | 2.8 |
| | |
Deutsche Boerse AG (Germany) | | 2.8 |
| | |
Nintendo Co., Ltd. (Japan) | | 2.8 |
| | |
Deutsche Telekom AG (Germany) | | 2.7 |
| | |
DBS Group Holdings, Ltd. (Singapore) | | 2.6 |
| | | |
Top Ten as a Group | | 30.9 |
| | |
Because a fund’s strategy may result in multiple investments in particular sectors of the economy, its performance may depend on the performance of those sectors and may fluctuate more widely than investments diversified across more sectors. For additional information on these and other risk considerations, please see the Fund’s prospectus.
Any sectors, industries, or securities discussed should not be perceived as investment recommendations. Mention of a specific security should not be considered a recommendation to buy or solicitation to sell that security. Specific securities mentioned in this report may have been sold from the Fund’s portfolio of investments by the time you receive this report.
37
|
AMG River Road International Value Equity Fund Schedule of Portfolio Investments October 31, 2021 |
| | | | | | | | |
| | | Shares | | | Value | |
| | |
Common Stocks - 96.1% | | | | | | | | |
| |
Communication Services - 10.8% | | | | | |
| | |
America Movil SAB de CV (Mexico) | | | 9,774 | | | | $173,782 | |
| | |
Deutsche Telekom AG (Germany) | | | 13,604 | | | | 252,995 | |
| | |
Nintendo Co., Ltd. (Japan) | | | 580 | | | | 256,161 | |
| | |
SK Telecom Co., Ltd., Sponsored ADR (South Korea)* | | | 10,907 | | | | 316,303 | |
| | |
Total Communication Services | | | | | | | 999,241 | |
| |
Consumer Discretionary - 5.5% | | | | | |
| | |
Continental AG (Germany)* | | | 1,316 | | | | 154,724 | |
| | |
Sony Corp. (Japan) | | | 3,057 | | | | 353,990 | |
| | |
Total Consumer Discretionary | | | | | | | 508,714 | |
| |
Consumer Staples - 8.9% | | | | | |
| | |
Coca-Cola HBC AG (Switzerland) | | | 6,532 | | | | 226,401 | |
| | |
Fomento Economico Mexicano SAB de CV, Sponsored ADR (Mexico) | | | 1,607 | | | | 132,079 | |
| | |
Kimberly-Clark de Mexico SAB de CV (Mexico) | | | 14,615 | | | | 116,043 | |
| | |
Nestle, S.A. (Switzerland) | | | 1,365 | | | | 180,053 | |
| | |
Unilever PLC (United Kingdom) | | | 3,009 | | | | 161,108 | |
| | |
Total Consumer Staples | | | | | | | 815,684 | |
| |
Energy - 2.7% | | | | | |
| | |
Royal Dutch Shell PLC, Class B (Netherlands) | | | 5,334 | | | | 122,408 | |
| | |
Total Energies SE (France) | | | 2,570 | | | | 128,693 | |
| | |
Total Energy | | | | | | | 251,101 | |
| |
Financials - 22.5% | | | | | |
| | |
AIA Group, Ltd. (Hong Kong) | | | 16,031 | | | | 179,659 | |
| | |
Allianz SE (Germany) | | | 854 | | | | 198,308 | |
| | |
Axa, S.A. (France) | | | 7,761 | | | | 225,791 | |
| | |
DBS Group Holdings, Ltd. (Singapore) | | | 10,331 | | | | 241,413 | |
| | |
Deutsche Boerse AG (Germany) | | | 1,551 | | | | 257,477 | |
| | |
Itau Unibanco Holding, S.A., Sponsored ADR (Brazil) | | | 23,860 | | | | 97,110 | |
| | |
Muenchener Rueckversicherungs-Gesellschaft AG in Muenchen (Germany) | | | 677 | | | | 200,451 | |
| | |
Ping An Insurance Group Co. of China, Ltd., Class H (China) | | | 25,103 | | | | 179,806 | |
| | |
Prudential PLC (United Kingdom) | | | 8,802 | | | | 179,631 | |
| | |
Tokio Marine Holdings, Inc. (Japan) | | | 2,907 | | | | 153,112 | |
| | |
UBS Group AG (Switzerland) | | | 8,937 | | | | 162,677 | |
| | |
Total Financials | | | | | | | 2,075,435 | |
| |
Health Care - 11.7% | | | | | |
| | |
GlaxoSmithKline PLC (United Kingdom) | | | 9,596 | | | | 199,221 | |
| | |
Novartis AG (Switzerland) | | | 2,622 | | | | 216,873 | |
| | | | | | | | |
| | | Shares | | | Value | |
| | |
Roche Holding AG (Switzerland) | | | 464 | | | | $179,751 | |
| | |
Sanofi (France) | | | 2,000 | | | | 200,888 | |
| | |
Smith & Nephew PLC (United Kingdom) | | | 8,682 | | | | 149,939 | |
| | |
Takeda Pharmaceutical Co., Ltd. (Japan) | | | 4,616 | | | | 129,552 | |
| | |
Total Health Care | | | | | | | 1,076,224 | |
| |
Industrials - 15.4% | | | | | |
| | |
Assa Abloy AB (Sweden) | | | 4,639 | | | | 136,121 | |
| | |
BAE Systems PLC (United Kingdom) | | | 30,048 | | | | 226,567 | |
| | |
CK Hutchison Holdings, Ltd. (Hong Kong) | | | 18,047 | | | | 120,995 | |
| | |
Elbit Systems, Ltd. (Israel) | | | 1,955 | | | | 310,473 | |
| | |
Smiths Group PLC (United Kingdom) | | | 12,428 | | | | 230,764 | |
| | |
Thales, S.A. (France) | | | 1,775 | | | | 163,794 | |
| | |
Vinci, S.A. (France) | | | 2,150 | | | | 229,857 | |
| | |
Total Industrials | | | | | | | 1,418,571 | |
| |
Information Technology - 14.4% | | | | | |
| | |
ams AG (Austria)* | | | 5,190 | | | | 102,753 | |
| | |
ASM Pacific Technology, Ltd. (Hong Kong) | | | 13,634 | | | | 147,525 | |
| | |
Check Point Software Technologies, Ltd. (Israel)* | | | 2,352 | | | | 281,299 | |
| | |
Genpact, Ltd. (United States) | | | 5,296 | | | | 261,358 | |
| | |
Murata Manufacturing Co., Ltd. (Japan) | | | 2,839 | | | | 210,593 | |
| | |
SAP SE (Germany) | | | 2,210 | | | | 320,033 | |
| | |
Total Information Technology | | | | | | | 1,323,561 | |
| |
Materials - 2.2% | | | | | |
| | |
Shin-Etsu Chemical Co., Ltd. (Japan) | | | 1,124 | | | | 200,446 | |
| |
Utilities - 2.0% | | | | | |
| | |
National Grid PLC (United Kingdom) | | | 14,496 | | | | 185,600 | |
| | |
Total Common Stocks | | | | | | | | |
(Cost $9,136,598) | | | | | | | 8,854,577 | |
| | |
Short-Term Investments - 3.8% | | | | | | | | |
| |
Other Investment Companies - 3.8% | | | | | |
| | |
Dreyfus Government Cash Management Fund, Institutional Shares, 0.03%1 | | | 115,270 | | | | 115,270 | |
| | |
Dreyfus Institutional Preferred Government Money Market Fund, Institutional Shares, 0.01%1 | | | 115,270 | | | | 115,270 | |
| | |
JPMorgan U.S. Government Money Market Fund, IM Shares, 0.03%1 | | | 118,763 | | | | 118,763 | |
| |
Total Short-Term Investments | | | | | |
(Cost $349,303) | | | | | | | 349,303 | |
| | |
Total Investments - 99.9% | | | | | | | | |
(Cost $9,485,901) | | | | | | | 9,203,880 | |
| |
Other Assets, less Liabilities - 0.1% | | | | 13,665 | |
| | |
Net Assets - 100.0% | | | | | | | $9,217,545 | |
The accompanying notes are an integral part of these financial statements.
38
|
AMG River Road International Value Equity Fund Schedule of Portfolio Investments (continued) |
| * | Non-income producing security. |
| 1 | Yield shown represents the October 31, 2021, seven day average yield, which refers to the sum of the previous seven days’ dividends paid, expressed as an annual percentage. |
| ADR | American Depositary Receipt |
The following table summarizes the inputs used to value the Fund’s investments by the fair value hierarchy levels as of October 31, 2021:
| | | | | | | | | | | | | | | | |
| | | Level 1 | | | Level 21 | | | Level 3 | | | Total | |
Investments in Securities | | | | | | | | | | | | | | | | |
| | | | |
Common Stocks | | | | | | | | | | | | | | | | |
| | | | |
Financials | | $ | 97,110 | | | $ | 1,978,325 | | | | – | | | $ | 2,075,435 | |
| | | | |
Industrials | | | 310,473 | | | | 1,108,098 | | | | – | | | | 1,418,571 | |
| | | | |
Information Technology | | | 542,657 | | | | 780,904 | | | | – | | | | 1,323,561 | |
| | | | |
Health Care | | | – | | | | 1,076,224 | | | | – | | | | 1,076,224 | |
| | | | |
Communication Services | | | 490,085 | | | | 509,156 | | | | – | | | | 999,241 | |
| | | | |
Consumer Staples | | | 248,122 | | | | 567,562 | | | | – | | | | 815,684 | |
| | | | |
Consumer Discretionary | | | – | | | | 508,714 | | | | – | | | | 508,714 | |
| | | | |
Energy | | | – | | | | 251,101 | | | | – | | | | 251,101 | |
| | | | |
Materials | | | – | | | | 200,446 | | | | – | | | | 200,446 | |
| | | | |
Utilities | | | – | | | | 185,600 | | | | – | | | | 185,600 | |
| | | | |
Short-Term Investments | | | | | | | | | | | | | | | | |
| | | | |
Other Investment Companies | | | 349,303 | | | | – | | | | – | | | | 349,303 | |
| | | | | | | | | | | | | | | | |
| | | | |
Total Investments in Securities | | $ | 2,037,750 | | | $ | 7,166,130 | | | | – | | | $ | 9,203,880 | |
| | | | | | | | | | | | | | | | |
| | 1 | An external pricing service is used to reflect any impact on security value due to market movements between the time the Fund valued such foreign securities and the earlier closing of foreign markets. |
For the fiscal year ended October 31, 2021, there were no transfers in or out of Level 3.
The country allocation in the Schedule of Portfolio Investments at October 31, 2021, was as follows:
| | | | |
Country | | % of Long-Term Investments |
| |
Austria | | | 1.2 | |
| |
Brazil | | | 1.1 | |
| |
China | | | 2.0 | |
| |
France | | | 10.7 | |
| |
Germany | | | 15.6 | |
| |
Hong Kong | | | 5.1 | |
| |
Israel | | | 6.7 | |
| |
Japan | | | 14.7 | |
| |
Mexico | | | 4.8 | |
| | | | |
Country | | % of Long-Term Investments |
| |
Netherlands | | | 1.4 | |
| |
Singapore | | | 2.7 | |
| |
South Korea | | | 3.6 | |
| |
Sweden | | | 1.5 | |
| |
Switzerland | | | 10.9 | |
| |
United Kingdom | | | 15.1 | |
| |
United States | | | 2.9 | |
| | | | |
| |
| | | 100.0 | |
| | | | |
The accompanying notes are an integral part of these financial statements.
39
|
AMG River Road Focused Absolute Value Fund Portfolio Manager’s Comments (unaudited) |
| | | | | | | | |
OVERVIEW For the fiscal year ended October 31, 2021, AMG River Road Focused Absolute Value Fund (the “Fund”) Class N shares returned 30.68%, trailing the 44.97% return for the Russell 3000® Value Index. PERFORMANCE REVIEW The Fund significantly underperformed the Russell 3000® Value during the last 12 months. From a sector perspective, the largest driver of relative underperformance was financials, where positive allocation was more than offset by negative stock selection. To a lesser extent, lack of exposure to energy and an overweight allocation to communication services also contributed to relative underperformance. These headwinds were partially offset by strong stock selection in the industrials, information technology, and utilities sectors. The top contributing holdings in the Fund were Berkshire Hathaway, Inc. (BRK.B) and LKQ Corp. (LKQ). Berkshire Hathaway is a conglomerate with a diverse group of wholly owned operating companies and other public/private investments. Over the past 12 months, Berkshire’s overall book value per share grew nearly 22%, driven by appreciation of the equity portfolio, internal cash generation, and significant share repurchase activity. Share repurchase activity has surged to record levels in recent quarters. In Q4 2020, buybacks totaled $8.8 billion, bringing the calendar year total to $24.7 billion (at an average price representing 1.15x year-end book value). In the first nine months of 2021, the company repurchased another $20 billion of stock. In total, $45 billion of buybacks in 2020 and 2021 to date have reduced the shares outstanding by more than 8% since the end of 2019. Results within insurance businesses have been strong, highlighted by premium growth supported by a sustained hard insurance market. Underwriting profits remain resilient, despite facing extremely challenging comparisons due to unusually high profits booked in much of 2020, particularly at Geico, which benefited from significantly lower claims during the pandemic last year. Berkshire’s operating businesses have seen impressive results over the past 12 months as the economy slowly emerges from pandemic-related shutdowns. This was particularly true for the manufacturing, service, and retailing businesses, which collectively achieved revenue growth of 14.6% while pre-tax earnings grew 42.7% for the year-to-date period compared to the prior year. The | | | | railroad BNSF has also seen steady improvement with higher volumes, improved pricing, and effective cost controls, leading to revenue growth of 11.7% and pre-tax earnings growth of 16.7% in the year-to-date period. LKQ is a global distributor of aftermarket and recycled replacement parts for vehicle repair. Management skillfully navigated a difficult COVID-19 impacted operating environment by focusing on controllable costs, which delivered exceptionally strong margins, including a new record for the North America segment. As the economic environment improved, industry conditions turned near ideal for LKQ’s business model. Indeed, LKQ is currently benefiting from a global rebound in miles driven (more collisions), the further aging of the car parc as new vehicle availability remains constrained (more repairs for out-of-warranty automobiles using less expensive alternative parts), the negative impact of the pandemic on smaller competitors’ inventories and overall financial positions, pricing power from scale, and an enviable inventory position that allows the pass-through of inflationary cost pressures. We believe the favorable impact of the recreational vehicle sales boom on the company’s profitable growing specialty segment as well as sales growth leverage on a permanently lower cost structure following cost reductions during the pandemic provide additional tailwinds. Furthermore, a laser focus on working capital has complemented sales growth and margin expansion, such that record free cash flow has driven leverage to its lowest level in nearly 10 years, recently earning LKQ an investment-grade credit rating. We reduced the position as the stock approached assessed value. The bottom contributing holdings in the Fund were GoHealth, Inc. (Cl A) (GOCO) and Avaya Holdings Corp. (AVYA). GoHealth is a direct-to-consumer health insurance distribution platform primarily selling Medicare Advantage plans. In August, shares dropped sharply as EBITDA declined (47)% year over year and full-year EBITDA guidance was cut (14)% largely due to rising agent costs. GOHealth is on target to increase agent count ~50% in 2021 to support continued revenue growth, but doing so amid a historically tight labor market has been more expensive than expected. Graduation rates from the company’s training program fell from over 80% to less than 50%, as COVID-19 has necessitated remote training, which has proven to be less effective than in-person training. Additionally, some trainees were recruited away to other industries before completing | | | | the six-week training course. As a result, GoHealth was forced to pay many trainees who never transitioned to productive, revenue-generating agents, and then incurred the cost of replacing those recruits who did not graduate. Given the small position size, GoHealth’s status as the largest unrealized loser, and the seasonal nature of the business that would have required the team to wait more than one year to see concrete improvements, the position was sold. Avaya provides communications networks for companies in on-premise, cloud, and hybrid formats. Shares lagged despite fiscal Q3 2021 EBITDA exceeding Wall Street estimates and a slight increase to full-year EBITDA guidance. Revenues grew for the fifth straight quarter on the strength of the Avaya Cloud Office product, recently launched in partnership with RingCentral. This product generates monthly subscription revenue per user, which we feel dramatically increases the predictability of the business and the value of the customer over time. However, as subscription contracts cycle through the customer base, it creates a temporary cash flow headwind as cash payments are received over time rather than a one-time payment at the time of sale. Avaya is in the early stages of transitioning toward subscriptions, so we expect cash flow to begin reflecting the benefits of the transition in 2022. We modestly trimmed Avaya due to unrealized losses. POSITIONING AND OUTLOOK As always, the Fund invests in companies we believe represent the most attractive combination of risk (conviction) and reward (discount) available across the River Road universe of U.S. equity portfolio holdings. We continue to believe high-quality smaller-cap and value stocks are well positioned as the COVID-19 Delta variant recedes and the reopening gains momentum. However, several fresh challenges to our outlook also emerged, most notably the sharp spike in commodity prices, continuing supply chain issues, and tightness in the labor force—all of which could weigh earnings over the next few quarters, particularly for smaller-cap stocks. Aside from these challenges, we view valuations as the biggest risk. On their own, high valuations rarely kill a bull market, but they could severely limit upside and greatly amplify volatility, even in a booming economy. In our opinion, the combination of these factors creates an environment where fundamentals and intrinsic valuation matter—a lot! This is a market |
40
|
AMG River Road Focused Absolute Value Fund Portfolio Manager’s Comments (continued) |
| | | | | | | | |
| where active stock picking can shine and, from our current perspective, the best opportunities are likely to be found among attractively priced, higher quality stocks. | | | | This commentary reflects the viewpoints of River Road Asset Management as of October 31, 2021, and is not intended as a forecast or guarantee of future results. | | | | |
41
|
AMG River Road Focused Absolute Value Fund Portfolio Manager’s Comments (continued) |
CUMULATIVE TOTAL RETURN PERFORMANCE
AMG River Road Focused Absolute Value Fund’s cumulative total return is based on the daily change in net asset value (NAV), and assumes that all dividends and distributions were reinvested. The graph compares a hypothetical $10,000 investment made in the AMG River Road Focused Absolute Value Fund’s Class N shares on November 3, 2015, to a $10,000 investment made in the Russell 3000® Value Index for the same time period. The graph and table do not reflect the deduction of taxes that a shareholder would pay on a Fund distribution or redemption of shares. The listed returns for the Fund are net of expenses and the returns for the index exclude expenses. Total returns would have been lower had certain expenses not been reduced.
The table below shows the average annual total returns for the AMG River Road Focused Absolute Value Fund and the Russell 3000® Value Index for the same time periods ended October 31, 2021.
| | | | | | | | | | | | | | | | |
| Average Annual Total Returns1 | | One
Year | | | Five
Years | | | Since
Inception | | | Inception
Date | |
AMG River Road Focused Absolute Value Fund2, 3, 4, 5, 6, 7, 8, 9, 10, 11, 12, 13 | |
| | | | |
Class N | | | 30.68% | | | | 11.14% | | | | 10.70% | | | | 11/03/15 | |
| | | | |
Class I | | | 30.98% | | | | 11.40% | | | | 10.97% | | | | 11/03/15 | |
| | | | |
Class Z | | | 31.12% | | | | – | | | | 9.13% | | | | 09/29/17 | |
| | | | |
Russell 3000® Value Index14 | | | 44.97% | | | | 12.41% | | | | 11.15% | | | | 11/03/15† | |
The performance data shown represents past performance. Past performance is not a guarantee of future results. Current performance may be lower or higher than the performance data quoted. The investment return and principal value of an investment will fluctuate so that an investor’s shares, when redeemed, may be worth more or less than their original cost.
Investors should carefully consider the Fund’s investment objectives, risks, charges and expenses before investing. For performance information through the most recent month end, current net asset values per share for the Fund and other information, please call 800.548.4539 or visit our website at amgfunds.com for a free prospectus. Read it carefully before investing or sending money.
Distributed by AMG Distributors, Inc., member FINRA/SIPC.
| † | Date reflects the inception date of the Fund, not the index. |
| 1 | Total return equals income yield plus share price change and assumes reinvestment of all dividends and capital gain distributions. Returns are net of fees and may reflect offsets of Fund expenses as described in the prospectus. No adjustment has been made for taxes payable by shareholders on their reinvested dividends and |
|
capital gain distributions. Returns for periods greater than one year are annualized. The listed returns on the Fund are net of expenses and based on the published NAV as of October 31, 2021. All returns are in U.S. dollars ($). 2 From time to time, the Fund’s advisor has waived its fees and/or absorbed Fund expenses, which has resulted in higher returns. 3 Investing in Publicly Traded Partnerships (PTPs) (including master limited partnerships) involves risks in addition to those typically associated with publicly traded companies. PTPs are exposed to the risks of their underlying assets, which in many cases includes the same types of risks as energy and natural resources companies. PTPs are also subject to capital market risk. PTPs may lose their partnership status for tax purposes. The Fund’s status as a regulated investment company may be jeopardized if it does not appropriately limit such investments in PTPs or if such investments are recharacterized for tax purposes. 4 The Fund is subject to risks associated with investments in small-capitalization companies, such as erratic earnings patterns, competitive conditions, limited earnings history and a reliance on one or a limited number of products. 5 The Fund is subject to risks associated with investments in mid-capitalization companies such as greater price volatility, lower trading volume, and less liquidity than the stocks of larger, more established companies. 6 Active and frequent trading of a fund may result in higher transaction costs and increased tax liability. |
7 A greater percentage of the Fund’s holdings may be focused in a smaller number of securities which may place the Fund at greater risk than a more diversified fund. |
8 Investments in international securities are subject to certain risks of overseas investing including currency fluctuations and changes in political and economic conditions, which could result in significant market fluctuations. These risks are magnified in emerging markets. 9 The Fund is subject to the risks associated with investments in emerging markets, such as erratic earnings patterns, economic and political instability, changing exchange controls, limitations on repatriation of foreign capital and changes in local governmental attitudes toward private investment, possibly leading to nationalization or confiscation of investor assets. 10 The Fund is subject to special risk considerations similar to those associated with the direct ownership of real estate. Real estate valuations may be subject to factors such as changing general and local economic, financial, competitive, and environmental conditions. |
42
|
AMG River Road Focused Absolute Value Fund Portfolio Manager’s Comments (continued) |
| | | | | | | | |
11 The Fund invests in value stocks, which may perform differently from the market as a whole and may be undervalued by the market for a long period of time. 12 Companies that are in similar industry sectors may be similarly affected by particular economic or market events; to the extent the Fund has substantial holdings within a particular sector, the risks associated with that sector increase. | | | | 13 Market prices of investments held by the Fund may fall rapidly or unpredictably due to a variety of economic or political factors, market conditions, disasters or public health issues, or in response to events that affect particular industries or companies. 14 The Russell 3000® Value Index measures the performance of the broad value segment of the U.S. equity universe. It includes those Russell 3000® companies with lower price-to-book ratios and | | | | lower forecasted growth values. Unlike the Fund, the Russell 3000® Value Index is unmanaged, is not available for investment and does not incur expenses. The Russell 3000® Value Index is a trademark of the London Stock Exchange Group companies. Not FDIC insured, nor bank guaranteed. May lose value. |
43
|
AMG River Road Focused Absolute Value Fund Fund Snapshots (unaudited) October 31, 2021 |
PORTFOLIO BREAKDOWN
| | | | | |
Sector | | % of Net Assets |
| | |
Communication Services | | | | 27.4 | |
| | |
Financials | | | | 19.9 | |
| | |
Information Technology | | | | 12.6 | |
| | |
Consumer Staples | | | | 12.1 | |
| | |
Utilities | | | | 7.4 | |
| | |
Health Care | | | | 7.0 | |
| | |
Consumer Discretionary | | | | 6.7 | |
| | |
Materials | | | | 3.2 | |
| | |
Industrials | | | | 3.2 | |
| | |
Short-Term Investments | | | | 0.6 | |
| | |
Other Assets Less Liabilities | | | | (0.1 | ) |
TOP TEN HOLDINGS
| | | | | |
Security Name | | % of Net Assets |
| | |
Berkshire Hathaway, Inc., Class B | | | | 10.5 | |
| | |
Liberty Broadband Corp., Class C | | | | 8.6 | |
| | |
Liberty Media Corp.-Liberty SiriusXM, Class C | | | | 6.3 | |
| | |
Comcast Corp., Class A | | | | 5.3 | |
| | |
The AES Corp. | | | | 4.9 | |
| | |
Fiserv, Inc. | | | | 4.6 | |
| | |
Fomento Economico Mexicano SAB de CV, Sponsored ADR (Mexico) | | | | 4.3 | |
| | |
Unilever PLC, Sponsored ADR (United Kingdom) | | | | 4.3 | |
| | |
NCR Corp. | | | | 4.3 | |
| | |
Fidelity National Financial, Inc. | | | | 3.9 | |
| | | | | | |
| | |
Top Ten as a Group | | | | 57.0 | |
| | | | | |
Because a fund’s strategy may result in multiple investments in particular sectors of the economy, its performance may depend on the performance of those sectors and may fluctuate more widely than investments diversified across more sectors. For additional information on these and other risk considerations, please see the Fund’s prospectus.
Any sectors, industries, or securities discussed should not be perceived as investment recommendations. Mention of a specific security should not be considered a recommendation to buy or solicitation to sell that security. Specific securities mentioned in this report may have been sold from the Fund’s portfolio of investments by the time you receive this report.
44
|
AMG River Road Focused Absolute Value Fund Schedule of Portfolio Investments October 31, 2021 |
| | | | | | | | |
| | | Shares | | | Value | |
| | |
Common Stocks - 99.5% | | | | | | | | |
| |
Communication Services - 27.4% | | | | | |
| | |
Comcast Corp., Class A | | | 200,944 | | | | $10,334,550 | |
| | |
Liberty Broadband Corp., Class C* | | | 102,565 | | | | 16,661,684 | |
| | |
Liberty Media Corp.-Liberty SiriusXM, Class C* | | | 246,296 | | | | 12,147,319 | |
| | |
Meta Platforms, Inc.* | | | 22,676 | | | | 7,337,273 | |
| | |
News Corp., Class A | | | 287,829 | | | | 6,591,284 | |
| | |
Total Communication Services | | | | | | | 53,072,110 | |
| | |
Consumer Discretionary - 6.7% | | | | | | | | |
| | |
DR Horton, Inc. | | | 63,493 | | | | 5,668,020 | |
| | |
LKQ Corp.* | | | 132,218 | | | | 7,282,567 | |
| | |
Total Consumer Discretionary | | | | | | | 12,950,587 | |
| | |
Consumer Staples - 12.1% | | | | | | | | |
| | |
Fomento Economico Mexicano SAB de CV, Sponsored ADR (Mexico) | | | 102,216 | | | | 8,401,133 | |
| | |
Molson Coors Beverage Co., Class B | | | 149,661 | | | | 6,598,553 | |
| | |
Unilever PLC, Sponsored ADR (United Kingdom) | | | 154,894 | | | | 8,299,221 | |
| | |
Total Consumer Staples | | | | | | | 23,298,907 | |
| | |
Financials - 19.9% | | | | | | | | |
| | |
American Equity Investment Life Holding Co. | | | 121,403 | | | | 3,869,114 | |
| | |
Berkshire Hathaway, Inc., Class B* | | | 70,819 | | | | 20,325,761 | |
| | |
Fidelity National Financial, Inc. | | | 158,775 | | | | 7,606,910 | |
| | |
The Progressive Corp. | | | 70,470 | | | | 6,686,194 | |
| | |
Total Financials | | | | | | | 38,487,979 | |
| | |
Health Care - 7.0% | | | | | | | | |
| | |
Bristol-Myers Squibb Co. | | | 126,636 | | | | 7,395,543 | |
| | |
Premier, Inc., Class A | | | 156,992 | | | | 6,114,838 | |
| | |
Total Health Care | | | | | | | 13,510,381 | |
| | |
Industrials - 3.2% | | | | | | | | |
| | |
CACI International, Inc., Class A* | | | 21,629 | | | | 6,221,366 | |
| | |
| | | | | | | | |
| | | | | | | | |
| | | Shares | | | Value | |
| | |
Information Technology - 12.6% | | | | | | | | |
| | |
Avaya Holdings Corp.* | | | 192,920 | | | | $3,592,170 | |
| | |
Fiserv, Inc.* | | | 90,006 | | | | 8,864,691 | |
| | |
NCR Corp.* | | | 208,270 | | | | 8,234,996 | |
| | |
QUALCOMM, Inc. | | | 27,560 | | | | 3,666,582 | |
| | |
Total Information Technology | | | | | | | 24,358,439 | |
| | |
Materials - 3.2% | | | | | | | | |
| | |
Axalta Coating Systems, Ltd.* | | | 200,246 | | | | 6,245,673 | |
| | |
Utilities - 7.4% | | | | | | | | |
| | |
The AES Corp. | | | 372,932 | | | | 9,371,781 | |
| | |
Vistra Corp. | | | 255,017 | | | | 4,995,783 | |
| | |
Total Utilities | | | | | | | 14,367,564 | |
| | |
Total Common Stocks | | | | | | | | |
| | |
(Cost $167,344,290) | | | | | | | 192,513,006 | |
| | |
Short-Term Investments - 0.6% | | | | | | | | |
| |
Other Investment Companies - 0.6% | | | | | |
| | |
Dreyfus Government Cash Management Fund, Institutional Shares, 0.03%1 | | | 358,381 | | | | 358,381 | |
| | |
Dreyfus Institutional Preferred Government Money Market Fund, Institutional Shares, 0.01%1 | | | 358,380 | | | | 358,380 | |
| | |
JPMorgan U.S. Government Money Market Fund, IM Shares, 0.03%1 | | | 369,241 | | | | 369,241 | |
| | |
Total Short-Term Investments | | | | | | | | |
| | |
(Cost $1,086,002) | | | | | | | 1,086,002 | |
| | |
Total Investments - 100.1% | | | | | | | | |
| | |
(Cost $168,430,292) | | | | | | | 193,599,008 | |
| |
Other Assets, less Liabilities - (0.1)% | | | | (149,930 | ) |
| | |
Net Assets - 100.0% | | | | | | | $193,449,078 | |
| | |
| | | | | | | | |
| * | Non-income producing security. |
| 1 | Yield shown represents the October 31, 2021, seven day average yield, which refers to the sum of the previous seven days’ dividends paid, expressed as an annual percentage. |
ADR American Depositary Receipt
The accompanying notes are an integral part of these financial statements.
45
|
AMG River Road Focused Absolute Value Fund Schedule of Portfolio Investments (continued) |
The following table summarizes the inputs used to value the Fund’s investments by the fair value hierarchy levels as of October 31, 2021:
| | | | | | | | | | | | | | | | |
| | | Level 1 | | | Level 2 | | | Level 3 | | | Total | |
| | | | |
Investments in Securities | | | | | | | | | | | | | | | | |
| | | | |
Common Stocks† | | | $192,513,006 | | | | – | | | | – | | | | $192,513,006 | |
| | | | |
Short-Term Investments | | | | | | | | | | | | | | | | |
| | | | |
Other Investment Companies | | | 1,086,002 | | | | – | | | | – | | | | 1,086,002 | |
| | | | | | | | | | | | | | | | |
| | | | |
Total Investments in Securities | | | $193,599,008 | | | | – | | | | – | | | | $193,599,008 | |
| | | | | | | | | | | | | | | | |
| † | All common stocks held in the Fund are Level 1 securities. For a detailed breakout of common stocks by major industry classification, please refer to the Fund’s Schedule of Portfolio Investments. |
For the fiscal year ended October 31, 2021, there were no transfers in or out of Level 3.
The accompanying notes are an integral part of these financial statements.
46
|
Statement of Assets and Liabilities October 31, 2021 |
| | | | | | | | | | | | | | | | | | | | | | | | | | | | | | | | | | | | | | | | | | | | | | | | |
| | | AMG
River Road
Mid Cap
Value Fund | | | AMG
River Road Large
Cap Value
Select Fund | | | AMG
River Road
Small Cap
Value Fund | | | AMG
River Road
Dividend All Cap
Value Fund | |
| | | | | | | | | | | | |
Assets: | | | | | | | | | | | | | | | | | | | | | | | | | | | | | | | | | | | | | | | | | | | | | | | | |
| | | | | | | | | | | | |
Investments at value1 (including securities on loan valued at $0, $0, $34,877,877, and $3,881,516, respectively) | | | | | | | $405,255,934 | | | | | | | | | | | | $41,694,137 | | | | | | | | | | | | $898,204,817 | | | | | | | | | | | | $432,801,015 | | | | | |
| | | | | | | | | | | | |
Receivable for investments sold | | | | | | | 6,926,208 | | | | | | | | | | | | 859,255 | | | | | | | | | | | | 40,995 | | | | | | | | | | | | – | | | | | |
| | | | | | | | | | | | |
Dividend and interest receivables | | | | | | | 136,583 | | | | | | | | | | | | 4,715 | | | | | | | | | | | | 164,180 | | | | | | | | | | | | 832,167 | | | | | |
| | | | | | | | | | | | |
Securities lending income receivable | | | | | | | – | | | | | | | | | | | | – | | | | | | | | | | | | 5,163 | | | | | | | | | | | | 594 | | | | | |
| | | | | | | | | | | | |
Receivable for Fund shares sold | | | | | | | 72,836 | | | | | | | | | | | | 85,296 | | | | | | | | | | | | 297,609 | | | | | | | | | | | | 74,963 | | | | | |
| | | | | | | | | | | | |
Receivable from affiliate | | | | | | | 2,429 | | | | | | | | | | | | 7,916 | | | | | | | | | | | | – | | | | | | | | | | | | 14,440 | | | | | |
| | | | | | | | | | | | |
Prepaid expenses and other assets | | | | | | | 24,852 | | | | | | | | | | | | 8,921 | | | | | | | | | | | | 17,829 | | | | | | | | | | | | 15,511 | | | | | |
| | | | | | | | | | | | |
Total assets | | | | | | | 412,418,842 | | | | | | | | | | | | 42,660,240 | | | | | | | | | | | | 898,730,593 | | | | | | | | | | | | 433,738,690 | | | | | |
| | | | | | | | | | | | |
Liabilities: | | | | | | | | | | | | | | | | | | | | | | | | | | | | | | | | | | | | | | | | | | | | | | | | |
| | | | | | | | | | | | |
Payable upon return of securities loaned | | | | | | | – | | | | | | | | | | | | – | | | | | | | | | | | | 16,595,812 | | | | | | | | | | | | – | | | | | |
| | | | | | | | | | | | |
Payable for investments purchased | | | | | | | 3,543,333 | | | | | | | | | | | | 1,042,421 | | | | | | | | | | | | 3,503,242 | | | | | | | | | | | | – | | | | | |
| | | | | | | | | | | | |
Payable for Fund shares repurchased | | | | | | | 279,665 | | | | | | | | | | | | 9,826 | | | | | | | | | | | | 92,416 | | | | | | | | | | | | 675,847 | | | | | |
| | | | | | | | | | | | |
Due to custodian | | | | | | | – | | | | | | | | | | | | – | | | | | | | | | | | | – | | | | | | | | | | | | 4,221,712 | | | | | |
| | | | | | | | | | | | |
Accrued expenses: | | | | | | | | | | | | | | | | | | | | | | | | | | | | | | | | | | | | | | | | | | | | | | | | |
| | | | | | | | | | | | |
Investment advisory and management fees | | | | | | | 192,025 | | | | | | | | | | | | 12,154 | | | | | | | | | | | | 591,611 | | | | | | | | | | | | 225,037 | | | | | |
| | | | | | | | | | | | |
Administrative fees | | | | | | | 51,435 | | | | | | | | | | | | 5,209 | | | | | | | | | | | | 110,927 | | | | | | | | | | | | 56,259 | | | | | |
| | | | | | | | | | | | |
Distribution fees | | | | | | | 59,443 | | | | | | | | | | | | 932 | | | | | | | | | | | | 7,529 | | | | | | | | | | | | 9,627 | | | | | |
| | | | | | | | | | | | |
Shareholder service fees | | | | | | | 28,861 | | | | | | | | | | | | – | | | | | | | | | | | | 75,030 | | | | | | | | | | | | 14,921 | | | | | |
| | | | | | | | | | | | |
Other | | | | | | | 120,371 | | | | | | | | | | | | 66,279 | | | | | | | | | | | | 124,271 | | | | | | | | | | | | 104,236 | | | | | |
| | | | | | | | | | | | |
Total liabilities | | | | | | | 4,275,133 | | | | | | | | | | | | 1,136,821 | | | | | | | | | | | | 21,100,838 | | | | | | | | | | | | 5,307,639 | | | | | |
| | | | | | | | | | | | |
| | | | | | | | | | | | | | | | | | | | | | | | | | | | | | | | | | | | | | | | | | | | | | | | |
| | | | | | | | | | | | |
Net Assets | | | | | | | $408,143,709 | | | | | | | | | | | | $41,523,419 | | | | | | | | | | | | $877,629,755 | | | | | | | | | | | | $428,431,051 | | | | | |
| | | | | | | | | | | | |
1 Investments at cost | | | | | | | $368,015,865 | | | | | | | | | | | | $38,580,630 | | | | | | | | | | | | $715,501,571 | | | | | | | | | | | | $300,613,632 | | | | | |
The accompanying notes are an integral part of these financial statements.
47
|
Statement of Assets and Liabilities (continued) |
| | | | | | | | | | | | | | | | | | | | | | | | | | | | | | | | | | | | | | | | | | | | | | | | |
| | | AMG
River Road
Mid Cap
Value Fund | | | AMG
River Road Large
Cap Value
Select Fund | | | AMG
River Road
Small Cap
Value Fund | | | AMG
River Road
Dividend All Cap
Value Fund | |
| | | | | | | | | | | | |
Net Assets Represent: | | | | | | | | | | | | | | | | | | | | | | | | | | | | | | | | | | | | | | | | | | | | | | | | |
| | | | | | | | | | | | |
Paid-in capital | | | | | | | $358,878,939 | | | | | | | | | | | | $44,306,391 | | | | | | | | | | | | $632,246,324 | | | | | | | | | | | | $233,832,660 | | | | | |
Total distributable earnings (loss) | | | | | | | 49,264,770 | | | | | | | | | | | | (2,782,972 | ) | | | | | | | | | | | 245,383,431 | | | | | | | | | | | | 194,598,391 | | | | | |
| | | | | | | | | | | | |
Net Assets | | | | | | | $408,143,709 | | | | | | | | | | | | $41,523,419 | | | | | | | | | | | | $877,629,755 | | | | | | | | | | | | $428,431,051 | | | | | |
| | | | | | | | | | | | |
Class N: | | | | | | | | | | | | | | | | | | | | | | | | | | | | | | | | | | | | | | | | | | | | | | | | |
| | | | | | | | | | | | |
Net Assets | | | | | | | $287,165,102 | | | | | | | | | | | | $4,623,179 | | | | | | | | | | | | $34,246,249 | | | | | | | | | | | | $43,430,378 | | | | | |
Shares outstanding | | | | | | | 14,776,160 | | | | | | | | | | | | 299,182 | | | | | | | | | | | | 2,216,497 | | | | | | | | | | | | 3,269,485 | | | | | |
| | | | | | | | | | | | |
Net asset value, offering and redemption price per share | | | | | | | $19.43 | | | | | | | | | | | | $15.45 | | | | | | | | | | | | $15.45 | | | | | | | | | | | | $13.28 | | | | | |
| | | | | | | | | | | | |
Class I: | | | | | | | | | | | | | | | | | | | | | | | | | | | | | | | | | | | | | | | | | | | | | | | | |
| | | | | | | | | | | | |
Net Assets | | | | | | | $112,741,282 | | | | | | | | | | | | $36,900,240 | | | | | | | | | | | | $835,472,715 | | | | | | | | | | | | $382,570,573 | | | | | |
Shares outstanding | | | | | | | 5,416,299 | | | | | | | | | | | | 2,367,899 | | | | | | | | | | | | 52,511,173 | | | | | | | | | | | | 28,822,703 | | | | | |
| | | | | | | | | | | | |
Net asset value, offering and redemption price per share | | | | | | | $20.82 | | | | | | | | | | | | $15.58 | | | | | | | | | | | | $15.91 | | | | | | | | | | | | $13.27 | | | | | |
| | | | | | | | | | | | |
Class Z: | | | | | | | | | | | | | | | | | | | | | | | | | | | | | | | | | | | | | | | | | | | | | | | | |
| | | | | | | | | | | | |
Net Assets | | | | | | | $8,237,325 | | | | | | | | | | | | – | | | | | | | | | | | | $7,910,791 | | | | | | | | | | | | $2,430,100 | | | | | |
Shares outstanding | | | | | | | 397,734 | | | | | | | | | | | | – | | | | | | | | | | | | 496,886 | | | | | | | | | | | | 183,054 | | | | | |
| | | | | | | | | | | | |
Net asset value, offering and redemption price per share | | | | | | | $20.71 | | | | | | | | | | | | – | | | | | | | | | | | | $15.92 | | | | | | | | | | | | $13.28 | | | | | |
The accompanying notes are an integral part of these financial statements.
48
|
Statement of Assets and Liabilities (continued) |
| | | | | | | | | | | | | | | | | | | | | | | | | | | | | | | | | | | | |
| | | AMG
River Road
Small-Mid Cap
Value Fund | | | AMG
River Road
International Value
Equity Fund | | | AMG
River Road
Focused Absolute
Value Fund | |
| | | | | | | | | |
Assets: | | | | | | | | | | | | | | | | | | | | | | | | | | | | | | | | | | | | |
| | | | | | | | | |
Investments at value1 (including securities on loan valued at $11,915,505, $0, and $0, respectively) | | | | | | | $278,743,291 | | | | | | | | | | | | $9,203,880 | | | | | | | | | | | | $193,599,008 | | | | | |
| | | | | | | | | |
Foreign currency2 | | | | | | | – | | | | | | | | | | | | 2,790 | | | | | | | | | | | | – | | | | | |
| | | | | | | | | |
Receivable for investments sold | | | | | | | 2,603,268 | | | | | | | | | | | | 70,996 | | | | | | | | | | | | – | | | | | |
| | | | | | | | | |
Dividend and interest receivables | | | | | | | 25,821 | | | | | | | | | | | | 22,254 | | | | | | | | | | | | 62,921 | | | | | |
| | | | | | | | | |
Securities lending income receivable | | | | | | | 1,568 | | | | | | | | | | | | – | | | | | | | | | | | | 133 | | | | | |
| | | | | | | | | |
Receivable for Fund shares sold | | | | | | | 48,450 | | | | | | | | | | | | 650 | | | | | | | | | | | | 38,480 | | | | | |
| | | | | | | | | |
Receivable from affiliate | | | | | | | – | | | | | | | | | | | | 16,030 | | | | | | | | | | | | 15,115 | | | | | |
| | | | | | | | | |
Prepaid expenses and other assets | | | | | | | 12,141 | | | | | | | | | | | | 4,477 | | | | | | | | | | | | 18,524 | | | | | |
| | | | | | | | | |
Total assets | | | | | | | 281,434,539 | | | | | | | | | | | | 9,321,077 | | | | | | | | | | | | 193,734,181 | | | | | |
| | | | | | | | | |
Liabilities: | | | | | | | | | | | | | | | | | | | | | | | | | | | | | | | | | | | | |
| | | | | | | | | |
Payable upon return of securities loaned | | | | | | | 3,222,309 | | | | | | | | | | | | – | | | | | | | | | | | | – | | | | | |
| | | | | | | | | |
Payable for investments purchased | | | | | | | 728,537 | | | | | | | | | | | | 52,722 | | | | | | | | | | | | – | | | | | |
| | | | | | | | | |
Payable for Fund shares repurchased | | | | | | | 20,153 | | | | | | | | | | | | – | | | | | | | | | | | | 92,353 | | | | | |
| | | | | | | | | |
Accrued expenses: | | | | | | | | | | | | | | | | | | | | | | | | | | | | | | | | | | | | |
| | | | | | | | | |
Investment advisory and management fees | | | | | | | 177,541 | | | | | | | | | | | | 4,153 | | | | | | | | | | | | 99,971 | | | | | |
| | | | | | | | | |
Administrative fees | | | | | | | 35,508 | | | | | | | | | | | | 1,175 | | | | | | | | | | | | 24,993 | | | | | |
| | | | | | | | | |
Distribution fees | | | | | | | 4,909 | | | | | | | | | | | | 346 | | | | | | | | | | | | 1,271 | | | | | |
| | | | | | | | | |
Shareholder service fees | | | | | | | 11,890 | | | | | | | | | | | | 368 | | | | | | | | | | | | 6,206 | | | | | |
| | | | | | | | | |
Other | | | | | | | 67,243 | | | | | | | | | | | | 44,768 | | | | | | | | | | | | 60,309 | | | | | |
| | | | | | | | | |
Total liabilities | | | | | | | 4,268,090 | | | | | | | | | | | | 103,532 | | | | | | | | | | | | 285,103 | | | | | |
| | | | | | | | | |
| | | | | | | | | | | | | | | | | | | | | | | | | | | | | | | | | | | | |
| | | | | | | | | |
Net Assets | | | | | | | $277,166,449 | | | | | | | | | | | | $9,217,545 | | | | | | | | | | | | $193,449,078 | | | | | |
| | | | | | | | | |
1 Investments at cost | | | | | | | $228,347,326 | | | | | | | | | | | | $9,485,901 | | | | | | | | | | | | $168,430,292 | | | | | |
| | | | | | | | | |
2 Foreign currency at cost | | | | | | | – | | | | | | | | | | | | $2,795 | | | | | | | | | | | | – | | | | | |
The accompanying notes are an integral part of these financial statements.
49
|
Statement of Assets and Liabilities (continued) |
| | | | | | | | | | | | | | | | | | | | | | | | | | | | | | | | | | | | |
| | | AMG
River Road
Small-Mid Cap
Value Fund | | | AMG
River Road
International Value
Equity Fund | | | AMG
River Road
Focused Absolute
Value Fund | |
| | | | | | | | | |
Net Assets Represent: | | | | | | | | | | | | | | | | | | | | | | | | | | | | | | | | | | | | |
| | | | | | | | | |
Paid-in capital | | | | | | | $212,951,624 | | | | | | | | | | | | $9,459,736 | | | | | | | | | | | | $157,588,940 | | | | | |
| | | | | | | | | |
Total distributable earnings (loss) | | | | | | | 64,214,825 | | | | | | | | | | | | (242,191 | ) | | | | | | | | | | | 35,860,138 | | | | | |
Net Assets | | | | | | | $277,166,449 | | | | | | | | | | | | $9,217,545 | | | | | | | | | | | | $193,449,078 | | | | | |
| | | | | | | | | |
Class N: | | | | | | | | | | | | | | | | | | | | | | | | | | | | | | | | | | | | |
| | | | | | | | | |
Net Assets | | | | | | | $22,702,355 | | | | | | | | | | | | $1,561,242 | | | | | | | | | | | | $3,666,155 | | | | | |
| | | | | | | | | |
Shares outstanding | | | | | | | 2,315,149 | | | | | | | | | | | | 164,096 | | | | | | | | | | | | 253,859 | | | | | |
| | | | | | | | | |
Net asset value, offering and redemption price per share | | | | | | | $9.81 | | | | | | | | | | | | $9.51 | | | | | | | | | | | | $14.44 | | | | | |
| | | | | | | | | |
Class I: | | | | | | | | | | | | | | | | | | | | | | | | | | | | | | | | | | | | |
| | | | | | | | | |
Net Assets | | | | | | | $218,697,941 | | | | | | | | | | | | $7,104,629 | | | | | | | | | | | | $176,459,833 | | | | | |
| | | | | | | | | |
Shares outstanding | | | | | | | 21,661,405 | | | | | | | | | | | | 720,406 | | | | | | | | | | | | 12,186,814 | | | | | |
| | | | | | | | | |
Net asset value, offering and redemption price per share | | | | | | | $10.10 | | | | | | | | | | | | $9.86 | | | | | | | | | | | | $14.48 | | | | | |
| | | | | | | | | |
Class Z: | | | | | | | | | | | | | | | | | | | | | | | | | | | | | | | | | | | | |
| | | | | | | | | |
Net Assets | | | | | | | $35,766,153 | | | | | | | | | | | | $551,674 | | | | | | | | | | | | $13,323,090 | | | | | |
| | | | | | | | | |
Shares outstanding | | | | | | | 3,540,219 | | | | | | | | | | | | 55,622 | | | | | | | | | | | | 919,634 | | | | | |
| | | | | | | | | |
Net asset value, offering and redemption price per share | | | | | | | $10.10 | | | | | | | | | | | | $9.92 | | | | | | | | | | | | $14.49 | | | | | |
The accompanying notes are an integral part of these financial statements.
50
|
Statement of Operations For the fiscal year ended October 31, 2021 |
| | | | | | | | | | | | | | | | | | | | | | | | | | | | | | | | | | | | | | | | | | | | | | | | |
| | | AMG
River Road
Mid Cap
Value Fund | | | AMG
River Road Large
Cap Value
Select Fund | | | AMG
River Road
Small Cap
Value Fund | | | AMG
River Road
Dividend All Cap
Value Fund | |
Investment Income: | | | | | | | | | | | | | | | | | | | | | | | | | | | | | | | | | | | | | | | | | | | | | | | | |
Dividend income | | | | | | | $5,537,866 | 1 | | | | | | | | | | | $465,423 | | | | | | | | | | | | $5,693,650 | | | | | | | | | | | | $13,150,845 | | | | | |
Interest income | | | | | | | – | | | | | | | | | | | | 38 | | | | | | | | | | | | – | | | | | | | | | | | | – | | | | | |
Securities lending income | | | | | | | – | | | | | | | | | | | | 109 | | | | | | | | | | | | 99,984 | | | | | | | | | | | | 17,687 | | | | | |
Foreign withholding tax | | | | | | | (31,688 | ) | | | | | | | | | | | (13,759 | ) | | | | | | | | | | | (75,571 | ) | | | | | | | | | | | (33,439 | ) | | | | |
Total investment income | | | | | | | 5,506,178 | | | | | | | | | | | | 451,811 | | | | | | | | | | | | 5,718,063 | | | | | | | | | | | | 13,135,093 | | | | | |
Expenses: | | | | | | | | | | | | | | | | | | | | | | | | | | | | | | | | | | | | | | | | | | | | | | | | |
Investment advisory and management fees | | | | | | | 2,816,151 | | | | | | | | | | | | 146,579 | | | | | | | | | | | | 6,294,216 | | | | | | | | | | | | 3,060,349 | | | | | |
Administrative fees | | | | | | | 681,025 | | | | | | | | | | | | 62,820 | | | | | | | | | | | | 1,180,166 | | | | | | | | | | | | 765,087 | | | | | |
Distribution fees - Class N | | | | | | | 713,540 | | | | | | | | | | | | 10,962 | | | | | | | | | | | | 83,347 | | | | | | | | | | | | 111,644 | | | | | |
Shareholder servicing fees - Class N | | | | | | | 256,207 | | | | | | | | | | | | 4,385 | | | | | | | | | | | | 33,470 | | | | | | | | | | | | 20,108 | | | | | |
Shareholder servicing fees - Class I | | | | | | | 106,487 | | | | | | | | | | | | 13,689 | | | | | | | | | | | | 655,080 | | | | | | | | | | | | 191,945 | | | | | |
Reports to shareholders | | | | | | | 115,540 | | | | | | | | | | | | 15,438 | | | | | | | | | | | | 85,443 | | | | | | | | | | | | 35,627 | | | | | |
Registration fees | | | | | | | 56,653 | | | | | | | | | | | | 30,534 | | | | | | | | | | | | 58,763 | | | | | | | | | | | | 51,605 | | | | | |
Custodian fees | | | | | | | 51,090 | | | | | | | | | | | | 16,763 | | | | | | | | | | | | 64,260 | | | | | | | | | | | | 48,242 | | | | | |
Professional fees | | | | | | | 41,881 | | | | | | | | | | | | 43,234 | | | | | | | | | | | | 65,295 | | | | | | | | | | | | 55,675 | | | | | |
Transfer agent fees | | | | | | | 35,340 | | | | | | | | | | | | 12,107 | | | | | | | | | | | | 26,677 | | | | | | | | | | | | 19,434 | | | | | |
Trustee fees and expenses | | | | | | | 33,083 | | | | | | | | | | | | 2,968 | | | | | | | | | | | | 54,582 | | | | | | | | | | | | 36,678 | | | | | |
Interest expense | | | | | | | 756 | | | | | | | | | | | | – | | | | | | | | | | | | – | | | | | | | | | | | | 1,944 | | | | | |
Miscellaneous | | | | | | | 17,207 | | | | | | | | | | | | 2,561 | | | | | | | | | | | | 65,925 | | | | | | | | | | | | 30,212 | | | | | |
Total expenses before offsets | | | | | | | 4,924,960 | | | | | | | | | | | | 362,040 | | | | | | | | | | | | 8,667,224 | | | | | | | | | | | | 4,428,550 | | | | | |
Expense reimbursements | | | | | | | (219,148 | ) | | | | | | | | | | | (58,404 | ) | | | | | | | | | | | – | | | | | | | | | | | | (97,897 | ) | | | | |
Expense reductions | | | | | | | (2,903 | ) | | | | | | | | | | | (339 | ) | | | | | | | | | | | (170,268 | ) | | | | | | | | | | | (32,421 | ) | | | | |
Net expenses | | | | | | | 4,702,909 | | | | | | | | | | | | 303,297 | | | | | | | | | | | | 8,496,956 | | | | | | | | | | | | 4,298,232 | | | | | |
| | | | | | | | | | | | |
| | | | | | | | | | | | | | | | | | | | | | | | | | | | | | | | | | | | | | | | | | | | | | | | |
Net investment income (loss) | | | | | | | 803,269 | | | | | | | | | | | | 148,514 | | | | | | | | | | | | (2,778,893 | ) | | | | | | | | | | | 8,836,861 | | | | | |
Net Realized and Unrealized Gain: | | | | | | | | | | | | | | | | | | | | | | | | | | | | | | | | | | | | | | | | | | | | | | | | |
| | | | | | | | | | | | |
Net realized gain on investments | | | | | | | 258,405,413 | | | | | | | | | | | | 2,351,234 | | | | | | | | | | | | 77,730,613 | | | | | | | | | | | | 74,356,959 | | | | | |
| | | | | | | | | | | | |
Net realized loss on futures contracts | | | | | | | (132,843 | ) | | | | | | | | | | | – | | | | | | | | | | | | – | | | | | | | | | | | | – | | | | | |
| | | | | | | | | | | | |
Net realized gain on swaps | | | | | | | – | | | | | | | | | | | | 6,028,933 | | | | | | | | | | | | – | | | | | | | | | | | | – | | | | | |
| | | | | | | | | | | | |
Net change in unrealized appreciation/depreciation on investments | | | | | | | (64,506,569 | ) | | | | | | | | | | | 3,189,774 | | | | | | | | | | | | 163,130,688 | | | | | | | | | | | | 67,143,423 | | | | | |
| | | | | | | | | | | | |
Net change in unrealized appreciation/depreciation on swaps | | | | | | | – | | | | | | | | | | | | 653,732 | | | | | | | | | | | | – | | | | | | | | | | | | – | | | | | |
Net realized and unrealized gain | | | | | | | 193,766,001 | | | | | | | | | | | | 12,223,673 | | | | | | | | | | | | 240,861,301 | | | | | | | | | | | | 141,500,382 | | | | | |
| | | | | | | | | | | | |
| | | | | | | | | | | | | | | | | | | | | | | | | | | | | | | | | | | | | | | | | | | | | | | | |
Net increase in net assets resulting from operations | | | | | | $ | 194,569,270 | | | | | | | | | | | | $12,372,187 | | | | | | | | | | | $ | 238,082,408 | | | | | | | | | | | $ | 150,337,243 | | | | | |
| 1 | Includes non-recurring dividends of $714,028. |
The accompanying notes are an integral part of these financial statements.
51
|
Statement of Operations (continued) |
| | | | | | | | | | | | | | | | | | | | | | | | | | | | | | | | | | | | |
| | | AMG
River Road
Small-Mid Cap
Value Fund | | | AMG
River Road
International Value
Equity Fund | | | AMG
River Road
Focused Absolute
Value Fund | |
Investment Income: | | | | | | | | | | | | | | | | | | | | | | | | | | | | | | | | | | | | |
Dividend income | | | | | | | $2,155,723 | | | | | | | | | | | | $219,061 | | | | | | | | | | | | $2,250,451 | | | | | |
Interest income | | | | | | | – | | | | | | | | | | | | – | | | | | | | | | | | | 202 | | | | | |
Securities lending income | | | | | | | 29,880 | | | | | | | | | | | | – | | | | | | | | | | | | 7,281 | | | | | |
Foreign withholding tax | | | | | | | (10,538 | ) | | | | | | | | | | | (3,857 | ) | | | | | | | | | | | – | | | | | |
Total investment income | | | | | | | 2,175,065 | | | | | | | | | | | | 215,204 | | | | | | | | | | | | 2,257,934 | | | | | |
Expenses: | | | | | | | | | | | | | | | | | | | | | | | | | | | | | | | | | | | | |
Investment advisory and management fees | | | | | | | 1,860,628 | | | | | | | | | | | | 123,794 | | | | | | | | | | | | 1,167,575 | | | | | |
Administrative fees | | | | | | | 372,126 | | | | | | | | | | | | 22,971 | | | | | | | | | | | | 291,894 | | | | | |
Distribution fees - Class N | | | | | | | 59,564 | | | | | | | | | | | | 4,158 | | | | | | | | | | | | 13,574 | | | | | |
Shareholder servicing fees - Class N | | | | | | | 14,639 | | | | | | | | | | | | 1,232 | | | | | | | | | | | | 2,172 | | | | | |
Shareholder servicing fees - Class I | | | | | | | 117,095 | | | | | | | | | | | | 9,921 | | | | | | | | | | | | 72,750 | | | | | |
Registration fees | | | | | | | 48,558 | | | | | | | | | | | | 29,748 | | | | | | | | | | | | 44,257 | | | | | |
Professional fees | | | | | | | 37,819 | | | | | | | | | | | | 33,362 | | | | | | | | | | | | 37,529 | | | | | |
Custodian fees | | | | | | | 32,362 | | | | | | | | | | | | 17,988 | | | | | | | | | | | | 27,045 | | | | | |
Reports to shareholders | | | | | | | 23,618 | | | | | | | | | | | | 10,689 | | | | | | | | | | | | 15,006 | | | | | |
Trustee fees and expenses | �� | | | | | | 17,169 | | | | | | | | | | | | 1,145 | | | | | | | | | | | | 13,656 | | | | | |
Transfer agent fees | | | | | | | 9,568 | | | | | | | | | | | | 990 | | | | | | | | | | | | 6,632 | | | | | |
Dividend expense | | | | | | | – | | | | | | | | | | | | 97,569 | | | | | | | | | | | | – | | | | | |
Interest expense | | | | | | | – | | | | | | | | | | | | 17,822 | | | | | | | | | | | | 1,275 | | | | | |
Miscellaneous | | | | | | | 15,831 | | | | | | | | | | | | 2,934 | | | | | | | | | | | | 12,859 | | | | | |
Total expenses before offsets | | | | | | | 2,608,977 | | | | | | | | | | | | 374,323 | | | | | | | | | | | | 1,706,224 | | | | | |
Expense reimbursements | | | | | | | – | | | | | | | | | | | | (79,873 | ) | | | | | | | | | | | (98,605 | ) | | | | |
Expense reductions | | | | | | | (46,339 | ) | | | | | | | | | | | (5,520 | ) | | | | | | | | | | | (12,836 | ) | | | | |
Net expenses | | | | | | | 2,562,638 | | | | | | | | | | | | 288,930 | | | | | | | | | | | | 1,594,783 | | | | | |
| | | | | | | | | |
| | | | | | | | | | | | | | | | | | | | | | | | | | | | | | | | | | | | |
Net investment income (loss) | | | | | | | (387,573 | ) | | | | | | | | | | | (73,726 | ) | | | | | | | | | | | 663,151 | | | | | |
Net Realized and Unrealized Gain: | | | | | | | | | | | | | | | | | | | | | | | | | | | | | | | | | | | | |
| | | | | | | | | |
Net realized gain on investments | | | | | | | 24,570,939 | | | | | | | | | | | | 6,411,942 | | | | | | | | | | | | 32,121,761 | | | | | |
| | | | | | | | | |
Net realized loss on short sales | | | | | | | – | | | | | | | | | | | | (2,041,447 | ) | | | | | | | | | | | – | | | | | |
| | | | | | | | | |
Net realized gain on foreign currency transactions | | | | | | | – | | | | | | | | | | | | 14,041 | | | | | | | | | | | | – | | | | | |
| | | | | | | | | |
Net change in unrealized appreciation/depreciation on investments | | | | | | | 54,476,017 | | | | | | | | | | | | (236,485 | ) | | | | | | | | | | | 14,157,205 | | | | | |
| | | | | | | | | |
Net change in unrealized appreciation/depreciation on short sales | | | | | | | – | | | | | | | | | | | | (381,575 | ) | | | | | | | | | | | – | | | | | |
| | | | | | | | | |
Net change in unrealized appreciation/depreciation on foreign currency translations | | | | | | | – | | | | | | | | | | | | (2,389 | ) | | | | | | | | | | | – | | | | | |
| | | | | | | | | |
Net realized and unrealized gain | | | | | | | 79,046,956 | | | | | | | | | | | | 3,764,087 | | | | | | | | | | | | 46,278,966 | | | | | |
| | | | | | | | | |
| | | | | | | | | | | | | | | | | | | | | | | | | | | | | | | | | | | | |
Net increase in net assets resulting from operations | | | | | | $ | 78,659,383 | | | | | | | | | | | $ | 3,690,361 | | | | | | | | | | | $ | 46,942,117 | | | | | |
The accompanying notes are an integral part of these financial statements.
52
|
Statements of Changes in Net Assets For the fiscal years ended October 31, |
| | | | | | | | | | | | | | | | | | | | | | | | |
| | | AMG | | | AMG | | | AMG | |
| | | River Road | | | River Road Large | | | River Road | |
| | | Mid Cap Value Fund | | | Cap Value Select Fund | | | Small Cap Value Fund | |
| | | | | | |
| | | 2021 | | | 2020 | | | 2021 | | | 2020 | | | 2021 | | | 2020 | |
| | | | | | |
Increase (Decrease) in Net Assets Resulting From Operations: | | | | | | | | | | | | | | | | | | | | | | | | |
Net investment income (loss) | | | $803,269 | | | | $4,726,723 | | | | $148,514 | | | | $372,445 | | | | $(2,778,893 | ) | | | $244,674 | |
Net realized gain (loss) on investments | | | 258,272,570 | | | | 124,204,848 | | | | 8,380,167 | | | | (7,603,426 | ) | | | 77,730,613 | | | | (10,803,606 | ) |
Net change in unrealized appreciation/depreciation on investments | | | (64,506,569 | ) | | | (179,176,911 | ) | | | 3,843,506 | | | | (4,306,653 | ) | | | 163,130,688 | | | | (29,318,189 | ) |
| | | | | | |
Net increase (decrease) in net assets resulting from operations | | | 194,569,270 | | | | (50,245,340 | ) | | | 12,372,187 | | | | (11,537,634 | ) | | | 238,082,408 | | | | (39,877,121 | ) |
Distributions to Shareholders: | | | | | | | | | | | | | | | | | | | | | | | | |
Class N | | | (178,403,401 | ) | | | (33,504,723 | ) | | | (667,556 | ) | | | (624,543 | ) | | | – | | | | (2,120,249 | ) |
Class I | | | (89,340,284 | ) | | | (37,562,764 | ) | | | (5,854,852 | ) | | | (3,646,142 | ) | | | (32,321 | ) | | | (23,298,854 | ) |
Class Z | | | (6,230,574 | ) | | | (3,451,809 | ) | | | – | | | | – | | | | (824 | ) | | | (11,458 | ) |
Total distributions to shareholders | | | (273,974,259 | ) | | | (74,519,296 | ) | | | (6,522,408 | ) | | | (4,270,685 | ) | | | (33,145 | ) | | | (25,430,561 | ) |
Capital Share Transactions:1 | | | | | | | | | | | | | | | | | | | | | | | | |
| | | | | | |
Net increase (decrease) from capital share transactions | | | 41,394,175 | | | | (1,097,820,771 | ) | | | (8,032,778 | ) | | | (38,109,098 | ) | | | 124,998,329 | | | | 175,396,275 | |
| | | | | | | | | | | | | | | | | | | | | | | | |
| | | | | | |
Total increase (decrease) in net assets | | | (38,010,814 | ) | | | (1,222,585,407 | ) | | | (2,182,999 | ) | | | (53,917,417 | ) | | | 363,047,592 | | | | 110,088,593 | |
Net Assets: | | | | | | | | | | | | | | | | | | | | | | | | |
Beginning of year | | | 446,154,523 | | | | 1,668,739,930 | | | | 43,706,418 | | | | 97,623,835 | | | | 514,582,163 | | | | 404,493,570 | |
End of year | | | $408,143,709 | | | | $446,154,523 | | | | $41,523,419 | | | | $43,706,418 | | | | $877,629,755 | | | | $514,582,163 | |
| 1 | See Note 1(g) of the Notes to Financial Statements. |
The accompanying notes are an integral part of these financial statements.
53
|
Statements of Changes in Net Assets (continued) For the fiscal years ended October 31, |
| | | | | | | | | | | | | | | | | | | | | | | | |
| | | AMG | | | AMG | | | AMG | |
| | | River Road | | | River Road | | | River Road | |
| | | Dividend All Cap | | | Small-Mid Cap | | | International Value | |
| | | Value Fund | | | Value Fund | | | Equity Fund | |
| | | | | | |
| | | 2021 | | | 2020 | | | 2021 | | | 2020 | | | 2021 | | | 2020 | |
| | | | | | |
Increase (Decrease) in Net Assets Resulting From Operations: | | | | | | | | | | | | | | | | | | | | | | | | |
Net investment income (loss) | | | $8,836,861 | | | | $13,424,588 | | | | $(387,573 | ) | | | $103,778 | | | | $(73,726 | ) | | | $(233,345 | ) |
Net realized gain (loss) on investments | | | 74,356,959 | | | | 2,020,791 | | | | 24,570,939 | | | | (9,195,938 | ) | | | 4,384,536 | | | | (637,581 | ) |
Net change in unrealized appreciation/depreciation on investments | | | 67,143,423 | | | | (77,612,710 | ) | | | 54,476,017 | | | | (14,720,991 | ) | | | (620,449 | ) | | | (272,397 | ) |
| | | | | | |
Net increase (decrease) in net assets resulting from operations | | | 150,337,243 | | | | (62,167,331 | ) | | | 78,659,383 | | | | (23,813,151 | ) | | | 3,690,361 | | | | (1,143,323 | ) |
Distributions to Shareholders: | | | | | | | | | | | | | | | | | | | | | | | | |
Class N | | | (727,705 | ) | | | (5,975,070 | ) | | | – | | | | (512,884 | ) | | | (532,006 | ) | | | (244,069 | ) |
Class I | | | (8,517,604 | ) | | | (47,458,557 | ) | | | (4,398 | ) | | | (3,093,005 | ) | | | (2,364,560 | ) | | | (1,797,271 | ) |
Class Z | | | (45,063 | ) | | | (20,856 | ) | | | (318 | ) | | | (3,815 | ) | | | (146,169 | ) | | | (6,804 | ) |
Total distributions to shareholders | | | (9,290,372 | ) | | | (53,454,483 | ) | | | (4,716 | ) | | | (3,609,704 | ) | | | (3,042,735 | ) | | | (2,048,144 | ) |
Capital Share Transactions:1 | | | | | | | | | | | | | | | | | | | | | | | | |
| | | | | | |
Net increase (decrease) from capital share transactions | | | (164,718,707 | ) | | | (45,255,562 | ) | | | 19,990,348 | | | | 35,471,352 | | | | (7,714,823 | ) | | | (6,117,855 | ) |
| | | | | | | | | | | | | | | | | | | | | | | | |
| | | | | | |
Total increase (decrease) in net assets | | | (23,671,836 | ) | | | (160,877,376 | ) | | | 98,645,015 | | | | 8,048,497 | | | | (7,067,197 | ) | | | (9,309,322 | ) |
Net Assets: | | | | | | | | | | | | | | | | | | | | | | | | |
Beginning of year | | | 452,102,887 | | | | 612,980,263 | | | | 178,521,434 | | | | 170,472,937 | | | | 16,284,742 | | | | 25,594,064 | |
End of year | | | $428,431,051 | | | | $452,102,887 | | | | $277,166,449 | | | | $178,521,434 | | | | $9,217,545 | | | | $16,284,742 | |
| 1 | See Note 1(g) of the Notes to Financial Statements. |
The accompanying notes are an integral part of these financial statements.
54
|
Statements of Changes in Net Assets (continued) For the fiscal years ended October 31, |
| | | | | | | | |
| | | AMG | |
| | | River Road | |
| | | Focused Absolute | |
| | | Value Fund | |
| | |
| | | 2021 | | | 2020 | |
| | |
Increase (Decrease) in Net Assets Resulting From Operations: | | | | | | | | |
Net investment income | | | $663,151 | | | | $861,559 | |
Net realized gain (loss) on investments | | | 32,121,761 | | | | (20,924,160 | ) |
Net change in unrealized appreciation/depreciation on investments | | | 14,157,205 | | | | (655,316 | ) |
| | |
Net increase (decrease) in net assets resulting from operations | | | 46,942,117 | | | | (20,717,917 | ) |
Distributions to Shareholders: | | | | | | | | |
Class N | | | – | | | | (376,933 | ) |
Class I | | | (950,327 | ) | | | (3,160,161 | ) |
Class Z | | | (18,026 | ) | | | (3,318 | ) |
Total distributions to shareholders | | | (968,353 | ) | | | (3,540,412 | ) |
Capital Share Transactions:1 | | | | | | | | |
| | |
Net increase from capital share transactions | | | 1,789,489 | | | | 23,576,015 | |
| | | | | | | | |
| | |
Total increase (decrease) in net assets | | | 47,763,253 | | | | (682,314 | ) |
Net Assets: | | | | | | | | |
Beginning of year | | | 145,685,825 | | | | 146,368,139 | |
End of year | | | $193,449,078 | | | | $145,685,825 | |
| 1 | See Note 1(g) of the Notes to Financial Statements. |
The accompanying notes are an integral part of these financial statements.
55
|
AMG River Road Mid Cap Value Fund Financial Highlights For a share outstanding throughout each fiscal year |
| | | | | | | | | | | | | | | | | | | | |
| | | For the fiscal years ended October 31, | |
| | | | | |
| Class N | | 2021 | | | 2020 | | | 2019 | | | 2018 | | | 2017 | |
Net Asset Value, Beginning of Year | | | $29.75 | | | | $34.95 | | | | $38.27 | | | | $41.95 | | | | $37.48 | |
Income (loss) from Investment Operations: | | | | | | | | | | | | | | | | | | | | |
Net investment income (loss)1,2 | | | 0.02 | 3 | | | 0.16 | | | | 0.34 | 4 | | | 0.08 | | | | (0.02 | ) |
| | | | | |
Net realized and unrealized gain (loss) on investments | | | 11.69 | | | | (2.85 | ) | | | (0.85 | ) | | | (0.95 | ) | | | 6.33 | |
Total income (loss) from investment operations | | | 11.71 | | | | (2.69 | ) | | | (0.51 | ) | | | (0.87 | ) | | | 6.31 | |
Less Distributions to Shareholders from: | | | | | | | | | | | | | | | | | | | | |
Net investment income | | | (0.02 | ) | | | (0.33 | ) | | | (0.15 | ) | | | – | | | | (0.13 | ) |
Net realized gain on investments | | | (22.01 | ) | | | (2.18 | ) | | | (2.66 | ) | | | (2.81 | ) | | | (1.71 | ) |
Total distributions to shareholders | | | (22.03 | ) | | | (2.51 | ) | | | (2.81 | ) | | | (2.81 | ) | | | (1.84 | ) |
Net Asset Value, End of Year | | | $19.43 | | | | $29.75 | | | | $34.95 | | | | $38.27 | | | | $41.95 | |
Total Return2,5 | | | 50.65 | % | | | (8.62 | )% | | | (0.55 | )% | | | (2.82 | )% | | | 16.87 | % |
Ratio of net expenses to average net assets | | | 1.13 | %6 | | | 1.14 | % | | | 1.15 | % | | | 1.12 | % | | | 1.12 | % |
Ratio of gross expenses to average net assets7 | | | 1.18 | % | | | 1.16 | % | | | 1.15 | % | | | 1.13 | % | | | 1.13 | % |
| | | | | |
Ratio of net investment income (loss) to average net assets2 | | | 0.08 | % | | | 0.52 | % | | | 0.95 | % | | | 0.19 | % | | | (0.05 | )% |
Portfolio turnover | | | 149 | % | | | 50 | % | | | 21 | % | | | 18 | % | | | 28 | % |
Net assets end of year (000’s) omitted | | $ | 287,165 | | | $ | 259,561 | | | $ | 518,354 | | | $ | 893,685 | | | $ | 1,292,107 | |
| | | | | | | | | | | | | | | | | | | | | |
56
|
AMG River Road Mid Cap Value Fund Financial Highlights For a share outstanding throughout each fiscal year |
| | | | | | | | | | | | | | | | | | | | |
| | | For the fiscal years ended October 31, | |
| | | | | |
| Class I | | 2021 | | | 2020 | | | 2019 | | | 2018 | | | 2017 | |
Net Asset Value, Beginning of Year | | | $30.68 | | | | $35.96 | | | | $39.33 | | | | $42.97 | | | | $38.39 | |
Income (loss) from Investment Operations: | | | | | | | | | | | | | | | | | | | | |
Net investment income1,2 | | | 0.09 | 3 | | | 0.25 | | | | 0.45 | 4 | | | 0.19 | | | | 0.08 | |
| | | | | |
Net realized and unrealized gain (loss) on investments | | | 12.16 | | | | (2.94 | ) | | | (0.89 | ) | | | (0.99 | ) | | | 6.49 | |
Total income (loss) from investment operations | | | 12.25 | | | | (2.69 | ) | | | (0.44 | ) | | | (0.80 | ) | | | 6.57 | |
Less Distributions to Shareholders from: | | | | | | | | | | | | | | | | | | | | |
Net investment income | | | (0.10 | ) | | | (0.41 | ) | | | (0.27 | ) | | | (0.03 | ) | | | (0.24 | ) |
Net realized gain on investments | | | (22.01 | ) | | | (2.18 | ) | | | (2.66 | ) | | | (2.81 | ) | | | (1.75 | ) |
Total distributions to shareholders | | | (22.11 | ) | | | (2.59 | ) | | | (2.93 | ) | | | (2.84 | ) | | | (1.99 | ) |
Net Asset Value, End of Year | | | $20.82 | | | | $30.68 | | | | $35.96 | | | | $39.33 | | | | $42.97 | |
Total Return2,5 | | | 51.11 | % | | | (8.38 | )% | | | (0.33 | )% | | | (2.56 | )% | | | 17.16 | % |
Ratio of net expenses to average net assets | | | 0.87 | %6 | | | 0.90 | % | | | 0.90 | % | | | 0.87 | % | | | 0.87 | % |
Ratio of gross expenses to average net assets7 | | | 0.92 | % | | | 0.92 | % | | | 0.90 | % | | | 0.88 | % | | | 0.88 | % |
| | | | | |
Ratio of net investment income to average net assets2 | | | 0.34 | % | | | 0.76 | % | | | 1.20 | % | | | 0.44 | % | | | 0.20 | % |
Portfolio turnover | | | 149 | % | | | 50 | % | | | 21 | % | | | 18 | % | | | 28 | % |
Net assets end of year (000’s) omitted | | $ | 112,741 | | | $ | 176,807 | | | $ | 1,102,479 | | | $ | 1,754,203 | | | $ | 2,668,464 | |
| | | | | | | | | | | | | | | | | | | | | |
57
|
AMG River Road Mid Cap Value Fund Financial Highlights For a share outstanding throughout each fiscal period |
| | | | | | | | | | | | | | | | | | | | |
| | | | | | | | | | | | | | | For the fiscal
period ended | |
| | | For the fiscal year ended October 31, | | | October 31, | |
| | | | | |
| Class Z | | 2021 | | | 2020 | | | 2019 | | | 2018 | | | 20178 | |
Net Asset Value, Beginning of Period | | | $30.63 | | | | $35.95 | | | | $39.34 | | | | $42.98 | | | | $44.24 | |
Income (loss) from Investment Operations: | | | | | | | | | | | | | | | | | | | | |
Net investment income1,2 | | | 0.10 | 3 | | | 0.28 | | | | 0.48 | 4 | | | 0.22 | | | | 0.00 | 9 |
Net realized and unrealized gain (loss) on investments | | | 12.13 | | | | (2.94 | ) | | | (0.89 | ) | | | (0.98 | ) | | | (1.26 | ) |
Total income (loss) from investment operations | | | 12.23 | | | | (2.66 | ) | | | (0.41 | ) | | | (0.76 | ) | | | (1.26 | ) |
Less Distributions to Shareholders from: | | | | | | | | | | | | | | | | | | | | |
Net investment income | | | (0.14 | ) | | | (0.48 | ) | | | (0.32 | ) | | | (0.07 | ) | | | – | |
Net realized gain on investments | | | (22.01 | ) | | | (2.18 | ) | | | (2.66 | ) | | | (2.81 | ) | | | – | |
Total distributions to shareholders | | | (22.15 | ) | | | (2.66 | ) | | | (2.98 | ) | | | (2.88 | ) | | | – | |
Net Asset Value, End of Period | | | $20.71 | | | | $30.63 | | | | $35.95 | | | | $39.34 | | | | $42.98 | |
Total Return2,5 | | | 51.18 | % | | | (8.32 | )% | | | (0.25 | )% | | | (2.48 | )% | | | (2.85 | )%10 |
Ratio of net expenses to average net assets | | | 0.80 | %6 | | | 0.82 | % | | | 0.82 | % | | | 0.79 | % | | | 0.79 | %11 |
Ratio of gross expenses to average net assets7 | | | 0.85 | % | | | 0.84 | % | | | 0.82 | % | | | 0.80 | % | | | 0.80 | %11 |
Ratio of net investment income to average net assets2 | | | 0.41 | % | | | 0.84 | % | | | 1.28 | % | | | 0.52 | % | | | 0.01 | %11 |
Portfolio turnover | | | 149 | % | | | 50 | % | | | 21 | % | | | 18 | % | | | 28 | %10 |
Net assets end of period (000’s) omitted | | | $8,237 | | | | $9,786 | | | | $47,907 | | | | $205,203 | | | | $9,625 | |
| | | | | | | | | | | | | | | | | | | | | |
| 1 | Per share numbers have been calculated using average shares. |
| 2 | Total returns and net investment income (loss) would have been lower had certain expenses not been offset. |
| 3 | Includes non-recurring dividends. Without these dividends, net investment income per share would have been $(0.02), $0.05 and $0.06 for Class N, Class I and Class z, respectively. |
| 4 | Includes non-recurring dividends. Without these dividends, net investment income per share would have been $0.23, $0.33 and $0.36 for Class N, Class I and Class z, respectively. |
| 5 | The total return is calculated using the published Net Asset Value as of fiscal year end. |
| 6 | Includes reduction from brokerage recapture amounting to less than 0.01% for the fiscal year ended 2021. |
| 7 | Excludes the impact of expense reimbursement or fee waivers and expense reductions such as brokerage credits, but includes expense repayments and non-reimbursable expenses, if any, such as interest, taxes, and extraordinary expenses. (See Note 1(c) and 2 in the Notes to Financial Statements.) |
| 8 | Commencement of operations was on October 2, 2017. |
| 9 | Less than $0.005 per share. |
58
|
AMG River Road Large Cap Value Select Fund Financial Highlights For a share outstanding throughout each fiscal year |
| | | | | | | | | | | | | | | | | | | | |
| | | For the fiscal years ended October 31, | |
| | | | | |
| Class N | | 2021 | | | 2020 | | | 2019 | | | 2018 | | | 2017 | |
Net Asset Value, Beginning of Year | | | $13.73 | | | | $16.22 | | | | $15.68 | | | | $17.97 | | | | $15.48 | |
Income (loss) from Investment Operations: | | | | | | | | | | | | | | | | | | | | |
Net investment income (loss)1,2 | | | 0.01 | | | | 0.04 | 3 | | | 0.12 | 4 | | | (0.07 | ) | | | 0.10 | 5 |
Net realized and unrealized gain (loss) on investments | | | 4.27 | | | | (1.84 | ) | | | 0.95 | | | | 1.94 | | | | 3.30 | |
Total income (loss) from investment operations | | | 4.28 | | | | (1.80 | ) | | | 1.07 | | | | 1.87 | | | | 3.40 | |
Less Distributions to Shareholders from: | | | | | | | | | | | | | | | | | | | | |
Net investment income | | | (2.56 | ) | | | – | | | | (0.02 | ) | | | – | | | | (0.16 | ) |
Net realized gain on investments | | | – | | | | (0.69 | ) | | | (0.51 | ) | | | (4.16 | ) | | | (0.75 | ) |
Total distributions to shareholders | | | (2.56 | ) | | | (0.69 | ) | | | (0.53 | ) | | | (4.16 | ) | | | (0.91 | ) |
Net Asset Value, End of Year | | | $15.45 | | | | $13.73 | | | | $16.22 | | | | $15.68 | | | | $17.97 | |
Total Return2,6 | | | 33.53 | % | | | (11.66 | )% | | | 7.15 | % | | | 12.54 | % | | | 22.62 | % |
Ratio of net expenses to average net assets | | | 1.00 | %7 | | | 1.04 | % | | | 1.28 | %7,8 | | | 2.24 | %7,8 | | | 1.09 | %8 |
Ratio of gross expenses to average net assets9 | | | 1.14 | % | | | 1.08 | % | | | 1.30 | % | | | 2.36 | % | | | 1.14 | % |
Ratio of net investment income (loss) to average net assets2 | | | 0.08 | % | | | 0.25 | % | | | 0.74 | % | | | (0.43 | )% | | | 0.60 | % |
Portfolio turnover | | | 256 | % | | | 750 | % | | | 330 | % | | | 240 | % | | | 159 | % |
Net assets end of year (000’s) omitted | | | $4,623 | | | | $4,716 | | | | $14,301 | | | | $24,536 | | | | $3,495 | |
| | | | | | | | | | | | | | | | | | | | | |
59
|
AMG River Road Large Cap Value Select Fund Financial Highlights For a share outstanding throughout each fiscal year |
| | | | | | | | | | | | | | | | | | | | | | | | | |
| | | For the fiscal years ended October 31, |
| | | | | |
| Class I | | 2021 | | 2020 | | 2019 | | 2018 | | 2017 |
| | | | | |
Net Asset Value, Beginning of Year | | | | $13.80 | | | | | $16.25 | | | | | $15.71 | | | | | $17.97 | | | | | $15.47 | |
| | | | | |
Income (loss) from Investment Operations: | | | | | | | | | | | | | | | | | | | | | | | | | |
| | | | | |
Net investment income (loss)1,2 | | | | 0.06 | | | | | 0.08 | 3 | | | | 0.16 | 4 | | | | (0.02 | ) | | | | 0.15 | 5 |
| | | | | | |
Net realized and unrealized gain (loss) on investments | | | | 4.29 | | | | | (1.84 | ) | | | | 0.95 | | | | | 1.92 | | | | | 3.33 | |
| | | | | |
Total income (loss) from investment operations | | | | 4.35 | | | | | (1.76 | ) | | | | 1.11 | | | | | 1.90 | | | | | 3.48 | |
| | | | | |
Less Distributions to Shareholders from: | | | | | | | | | | | | | | | | | | | | | | | | | |
| | | | | |
Net investment income | | | | (2.57 | ) | | | | – | | | | | (0.06 | ) | | | | – | | | | | (0.23 | ) |
| | | | | |
Net realized gain on investments | | | | – | | | | | (0.69 | ) | | | | (0.51 | ) | | | | (4.16 | ) | | | | (0.75 | ) |
| | | | | |
Total distributions to shareholders | | | | (2.57 | ) | | | | (0.69 | ) | | | | (0.57 | ) | | | | (4.16 | ) | | | | (0.98 | ) |
| | | | | |
Net Asset Value, End of Year | | | | $15.58 | | | | | $13.80 | | | | | $16.25 | | | | | $15.71 | | | | | $17.97 | |
| | | | | |
Total Return2,6 | | | | 33.93 | % | | | | (11.38 | )% | | | | 7.43 | % | | | | 12.82 | % | | | | 23.11 | % |
| | | | | |
Ratio of net expenses to average net assets | | | | 0.69 | %7 | | | | 0.76 | % | | | | 0.99 | %7,8 | | | | 1.92 | %7,8 | | | | 0.78 | %8 |
| | | | | |
Ratio of gross expenses to average net assets9 | | | | 0.83 | % | | | | 0.80 | % | | | | 1.01 | % | | | | 2.04 | % | | | | 0.87 | % |
| | | | | |
Ratio of net investment income (loss) to average net assets2 | | | | 0.39 | % | | | | 0.53 | % | | | | 1.03 | % | | | | (0.11 | )% | | | | 0.90 | % |
| | | | | |
Portfolio turnover | | | | 256 | % | | | | 750 | % | | | | 330 | % | | | | 240 | % | | | | 159 | % |
| | | | | |
Net assets end of year (000’s) omitted | | | | $36,900 | | | | | $38,990 | | | | | $83,323 | | | | | $55,590 | | | | | $37,002 | |
| | | | | | | |
| 1 | Per share numbers have been calculated using average shares. |
| 2 | Total returns and net investment income (loss) would have been lower had certain expenses not been offset. |
| 3 | Includes non-recurring dividends. Without these dividends, net investment income per share would have been $(0.01) and $0.03 for Class N and Class I, respectively. |
| 4 | Includes non-recurring dividends. Without these dividends, net investment income per share would have been $0.07 and $0.12 for Class N and Class I, respectively. |
| 5 | Includes non-recurring dividends. Without these dividends, net investment income per share would have been $0.07 and $0.12 for Class N and Class I, respectively. |
| 6 | The total return is calculated using the published Net Asset Value as of fiscal year end. |
| 7 | Includes reduction from broker recapture amounting to less than 0.01% for the fiscal years ended October 31, 2021 and 2019 and 0.01% for the fiscal year ended October 31, 2018, respectively. |
| 8 | Expense ratio includes dividend and interest expense related to securities sold short. Excluding such dividend and interest expense, the ratio of expenses to average net assets would be 1.04% and 0.75%, 1.04% and 0.72% and 1.04% and 0.73% for Class N and Class I, respectively, for the fiscal years ended October 31, 2019, October 31, 2018 and October 31, 2017, respectively. |
| 9 | Excludes the impact of expense reimbursement or fee waivers and expense reductions such as brokerage credits, but includes expense repayments and non-reimbursable expenses, if any, such as interest, taxes, and extraordinary expenses. (See Note 1(c) and 2 in the Notes to Financial Statements.) |
60
|
AMG River Road Small Cap Value Fund Financial Highlights For a share outstanding throughout each fiscal year |
| | | | | | | | | | | | | | | | | | | | | | | | | |
| | | For the fiscal years ended October 31, |
| | | | | |
| Class N | | 2021 | | 2020 | | 2019 | | 2018 | | 2017 |
| | | | | |
Net Asset Value, Beginning of Year | | | | $10.76 | | | | | $13.00 | | | | | $13.26 | | | | | $14.46 | | | | | $12.29 | |
| | | | | |
Income (loss) from Investment Operations: | | | | | | | | | | | | | | | | | | | | | | | | | |
| | | | | |
Net investment loss1,2 | | | | (0.09 | ) | | | | (0.02 | ) | | | | (0.04 | ) | | | | (0.05 | ) | | | | (0.05 | ) |
| | | | | |
Net realized and unrealized gain (loss) on investments | | | | 4.78 | | | | | (1.43 | ) | | | | 1.17 | | | | | 0.79 | | | | | 2.88 | |
| | | | | |
Total income (loss) from investment operations | | | | 4.69 | | | | | (1.45 | ) | | | | 1.13 | | | | | 0.74 | | | | | 2.83 | |
| | | | | |
Less Distributions to Shareholders from: | | | | | | | | | | | | | | | | | | | | | | | | | |
| | | | | |
Net realized gain on investments | | | | – | | | | | (0.79 | ) | | | | (1.39 | ) | | | | (1.94 | ) | | | | (0.66 | ) |
| | | | | |
Net Asset Value, End of Year | | | | $15.45 | | | | | $10.76 | | | | | $13.00 | | | | | $13.26 | | | | | $14.46 | |
| | | | | |
Total Return2,3 | | | | 43.59 | % | | | | (12.09 | )% | | | | 10.86 | % | | | | 5.41 | % | | | | 23.43 | % |
| | | | | |
Ratio of net expenses to average net assets4 | | | | 1.33 | % | | | | 1.34 | % | | | | 1.36 | % | | | | 1.35 | % | | | | 1.35 | % |
| | | | | |
Ratio of gross expenses to average net assets5 | | | | 1.35 | % | | | | 1.36 | % | | | | 1.37 | % | | | | 1.36 | % | | | | 1.36 | % |
| | | | | |
Ratio of net investment loss to average net assets2 | | | | (0.61 | )% | | | | (0.19 | )% | | | | (0.33 | )% | | | | (0.34 | )% | | | | (0.36 | )% |
| | | | | |
Portfolio turnover | | | | 39 | % | | | | 42 | % | | | | 47 | % | | | | 41 | % | | | | 42 | % |
| | | | | |
Net assets end of year (000’s) omitted | | | | $34,246 | | | | | $25,920 | | | | | $29,963 | | | | | $28,444 | | | | | $31,657 | |
| | | | | | | | | | | | | | | | | | | | | | | | | | |
61
|
AMG River Road Small Cap Value Fund Financial Highlights For a share outstanding throughout each fiscal year |
| | | | | | | | | | | | | | | | | | | | | | | | | |
| | | For the fiscal years ended October 31, |
| | | | | |
| Class I | | 2021 | | 2020 | | 2019 | | 2018 | | 2017 |
| | | | | |
Net Asset Value, Beginning of Year | | | | $11.05 | | | | | $13.30 | | | | | $13.51 | | | | | $14.68 | | | | | $12.44 | |
| | | | | |
Income (loss) from Investment Operations: | | | | | | | | | | | | | | | | | | | | | | | | | |
| | | | | |
Net investment income (loss)1,2 | | | | (0.05 | ) | | | | 0.01 | | | | | (0.01 | ) | | | | (0.01 | ) | | | | (0.01 | ) |
| | | | | |
Net realized and unrealized gain (loss) on investments | | | | 4.91 | | | | | (1.46 | ) | | | | 1.20 | | | | | 0.79 | | | | | 2.92 | |
| | | | | |
Total income (loss) from investment operations | | | | 4.86 | | | | | (1.45 | ) | | | | 1.19 | | | | | 0.78 | | | | | 2.91 | |
| | | | | |
Less Distributions to Shareholders from: | | | | | | | | | | | | | | | | | | | | | | | | | |
| | | | | |
Net investment income | | | | (0.00 | )6 | | | | (0.01 | ) | | | | (0.01 | ) | | | | (0.01 | ) | | | | – | |
| | | | | |
Net realized gain on investments | | | | – | | | | | (0.79 | ) | | | | (1.39 | ) | | | | (1.94 | ) | | | | (0.67 | ) |
| | | | | |
Total distributions to shareholders | | | | (0.00 | )6 | | | | (0.80 | ) | | | | (1.40 | ) | | | | (1.95 | ) | | | | (0.67 | ) |
| | | | | |
Net Asset Value, End of Year | | | | $15.91 | | | | | $11.05 | | | | | $13.30 | | | | | $13.51 | | | | | $14.68 | |
| | | | | |
Total Return2,3 | | | | 43.99 | % | | | | (11.91 | )% | | | | 11.23 | % | | | | 5.60 | % | | | | 23.80 | % |
| | | | | |
Ratio of net expenses to average net assets4 | | | | 1.07 | % | | | | 1.07 | % | | | | 1.09 | % | | | | 1.10 | % | | | | 1.10 | % |
| | | | | |
Ratio of gross expenses to average net assets5 | | | | 1.09 | % | | | | 1.09 | % | | | | 1.10 | % | | | | 1.11 | % | | | | 1.11 | % |
| | | | | |
Ratio of net investment income (loss) to average net assets2 | | | | (0.35 | )% | | | | 0.07 | % | | | | (0.06 | )% | | | | (0.09 | )% | | | | (0.11 | )% |
| | | | | |
Portfolio turnover | | | | 39 | % | | | | 42 | % | | | | 47 | % | | | | 41 | % | | | | 42 | % |
| | | | | |
Net assets end of year (000’s) omitted | | | | $835,473 | | | | | $487,637 | | | | | $374,344 | | | | | $330,245 | | | | | $279,574 | |
| | | | | | | |
62
|
AMG River Road Small Cap Value Fund Financial Highlights For a share outstanding throughout each fiscal period |
| | | | | | | | | | | | | | | | | | | | | | | | | |
| | | For the fiscal years ended October 31, | | For the fiscal
period ended
October 31, |
| | | | | |
| Class Z | | 2021 | | 2020 | | 2019 | | 2018 | | 20177 |
| | | | | |
Net Asset Value, Beginning of Period | | | | $11.05 | | | | | $13.30 | | | | | $13.51 | | | | | $14.68 | | | | | $14.68 | |
| | | | | |
Income (loss) from Investment Operations: | | | | | | | | | | | | | | | | | | | | | | | | | |
| | | | | |
Net investment income (loss)1,2 | | | | (0.04 | ) | | | | 0.02 | | | | | 0.00 | 8 | | | | 0.00 | 8 | | | | (0.01 | ) |
| | | | | |
Net realized and unrealized gain (loss) on investments | | | | 4.92 | | | | | (1.46 | ) | | | | 1.20 | | | | | 0.79 | | | | | 0.01 | |
| | | | | |
Total income (loss) from investment operations | | | | 4.88 | | | | | (1.44 | ) | | | | 1.20 | | | | | 0.79 | | | | | – | |
| | | | | |
Less Distributions to Shareholders from: | | | | | | | | | | | | | | | | | | | | | | | | | |
| | | | | |
Net investment income | | | | (0.01 | ) | | | | (0.02 | ) | | | | (0.02 | ) | | | | (0.02 | ) | | | | – | |
| | | | | |
Net realized gain on investments | | | | – | | | | | (0.79 | ) | | | | (1.39 | ) | | | | (1.94 | ) | | | | – | |
| | | | | |
Total distributions to shareholders | | | | (0.01 | ) | | | | (0.81 | ) | | | | (1.41 | ) | | | | (1.96 | ) | | | | – | |
| | | | | |
Net Asset Value, End of Period | | | | $15.92 | | | | | $11.05 | | | | | $13.30 | | | | | $13.51 | | | | | $14.68 | |
| | | | | |
Total Return2,3 | | | | 44.17 | % | | | | (11.78 | )% | | | | 11.29 | % | | | | 5.71 | % | | | | 0.00 | %9 |
| | | | | |
Ratio of net expenses to average net assets4 | | | | 0.98 | % | | | | 0.99 | % | | | | 1.01 | % | | | | 1.00 | % | | | | 1.03 | %10 |
| | | | | |
Ratio of gross expenses to average net assets5 | | | | 1.00 | % | | | | 1.01 | % | | | | 1.02 | % | | | | 1.01 | % | | | | 1.03 | %10 |
| | | | | |
Ratio of net investment income (loss) to average net assets2 | | | | (0.26 | )% | | | | 0.16 | % | | | | 0.02 | % | | | | 0.01 | % | | | | (0.58 | )%10 |
| | | | | |
Portfolio turnover | | | | 39 | % | | | | 42 | % | | | | 47 | % | | | | 41 | % | | | | 42 | %9 |
| | | | | |
Net assets end of period (000’s) omitted | | | | $7,911 | | | | | $1,025 | | | | | $186 | | | | | $163 | | | | | $154 | |
| | | | | | | |
| 1 | Per share numbers have been calculated using average shares. |
| 2 | Total returns and net investment income (loss) would have been lower had certain expenses not been offset. |
| 3 | The total return is calculated using the published Net Asset Value as of fiscal year end. |
| 4 | Includes reduction from broker recapture amounting to 0.02%, 0.02%, 0.01%, 0.01% and 0.01% for the fiscal years ended 2021, 2020, 2019, 2018, and 2017, respectively. |
| 5 | Excludes the impact of expense reimbursement or fee waivers and expense reductions such as brokerage credits, but includes expense repayments and non-reimbursable expenses, if any, such as interest, taxes, and extraordinary expenses. (See Note 1(c) and 2 in the Notes to Financial Statements.) |
| 6 | Less than $(0.005) per share. |
| 7 | The commencement of operations was October 2, 2017. |
| 8 | Less than $ 0.005 per share. |
63
|
AMG River Road Dividend All Cap Value Fund Financial Highlights For a share outstanding throughout each fiscal year |
| | | | | | | | | | | | | | | | | | | | | | | | | |
| | | For the fiscal years ended October 31, |
| | | | | |
| Class N | | 2021 | | 2020 | | 2019 | | 2018 | | 2017 |
| | | | | |
Net Asset Value, Beginning of Year | | | | $10.02 | | | | | $12.34 | | | | | $12.29 | | | | | $12.87 | | | | | $12.18 | |
| | | | | |
Income (loss) from Investment Operations: | | | | | | | | | | | | | | | | | | | | | | | | | |
| | | | | |
Net investment income1,2 | | | | 0.19 | | | | | 0.25 | | | | | 0.27 | | | | | 0.22 | | | | | 0.22 | |
| | | | | |
Net realized and unrealized gain (loss) on investments | | | | 3.27 | | | | | (1.49 | ) | | | | 0.80 | | | | | 0.06 | | | | | 1.54 | |
| | | | | |
Total income (loss) from investment operations | | | | 3.46 | | | | | (1.24 | ) | | | | 1.07 | | | | | 0.28 | | | | | 1.76 | |
| | | | | |
Less Distributions to Shareholders from: | | | | | | | | | | | | | | | | | | | | | | | | | |
| | | | | |
Net investment income | | | | (0.20 | ) | | | | (0.34 | ) | | | | (0.30 | ) | | | | (0.28 | ) | | | | (0.21 | ) |
| | | | | |
Net realized gain on investments | | | | – | | | | | (0.74 | ) | | | | (0.72 | ) | | | | (0.58 | ) | | | | (0.86 | ) |
| | | | | |
Total distributions to shareholders | | | | (0.20 | ) | | | | (1.08 | ) | | | | (1.02 | ) | | | | (0.86 | ) | | | | (1.07 | ) |
| | | | | |
Net Asset Value, End of Year | | | | $13.28 | | | | | $10.02 | | | | | $12.34 | | | | | $12.29 | | | | | $12.87 | |
| | | | | |
Total Return2,3 | | | | 34.74 | % | | | | (10.96 | )% | | | | 10.11 | % | | | | 2.06 | % | | | | 14.79 | % |
| | | | | |
Ratio of net expenses to average net assets4 | | | | 1.06 | % | | | | 1.13 | % | | | | 1.11 | % | | | | 1.10 | % | | | | 1.11 | % |
| | | | | |
Ratio of gross expenses to average net assets5 | | | | 1.09 | % | | | | 1.13 | % | | | | 1.12 | % | | | | 1.11 | % | | | | 1.12 | % |
| | | | | |
Ratio of net investment income to average net assets2 | | | | 1.51 | % | | | | 2.38 | % | | | | 2.32 | % | | | | 1.78 | % | | | | 1.75 | % |
| | | | | |
Portfolio turnover | | | | 20 | % | | | | 35 | % | | | | 29 | % | | | | 27 | % | | | | 28 | % |
| | | | | |
Net assets end of year (000’s) omitted | | | | $43,430 | | | | | $41,358 | | | | | $79,811 | | | | | $100,420 | | | | | $136,534 | |
| | | | | | | |
64
|
AMG River Road Dividend All Cap Value Fund Financial Highlights For a share outstanding throughout each fiscal year |
| | | | | | | | | | | | | | | | | | | | | | | | | |
| | | For the fiscal years ended October 31, |
| | | | | |
| Class I | | 2021 | | 2020 | | 2019 | | 2018 | | 2017 |
| | | | | |
Net Asset Value, Beginning of Year | | | | $10.01 | | | | | $12.33 | | | | | $12.29 | | | | | $12.86 | | | | | $12.17 | |
| | | | | |
Income (loss) from Investment Operations: | | | | | | | | | | | | | | | | | | | | | | | | | |
| | | | | |
Net investment income1,2 | | | | 0.22 | | | | | 0.28 | | | | | 0.31 | | | | | 0.26 | | | | | 0.24 | |
| | | | | |
Net realized and unrealized gain (loss) on investments | | | | 3.27 | | | | | (1.49 | ) | | | | 0.78 | | | | | 0.06 | | | | | 1.55 | |
| | | | | |
Total income (loss) from investment operations | | | | 3.49 | | | | | (1.21 | ) | | | | 1.09 | | | | | 0.32 | | | | | 1.79 | |
| | | | | |
Less Distributions to Shareholders from: | | | | | | | | | | | | | | | | | | | | | | | | | |
| | | | | |
Net investment income | | | | (0.23 | ) | | | | (0.37 | ) | | | | (0.33 | ) | | | | (0.31 | ) | | | | (0.24 | ) |
| | | | | |
Net realized gain on investments | | | | – | | | | | (0.74 | ) | | | | (0.72 | ) | | | | (0.58 | ) | | | | (0.86 | ) |
| | | | | |
Total distributions to shareholders | | | | (0.23 | ) | | | | (1.11 | ) | | | | (1.05 | ) | | | | (0.89 | ) | | | | (1.10 | ) |
| | | | | |
Net Asset Value, End of Year | | | | $13.27 | | | | | $10.01 | | | | | $12.33 | | | | | $12.29 | | | | | $12.86 | |
| | | | | |
Total Return2,3 | | | | 35.10 | % | | | | (10.69 | )% | | | | 10.32 | % | | | | 2.38 | % | | | | 15.07 | % |
| | | | | |
Ratio of net expenses to average net assets4 | | | | 0.81 | % | | | | 0.86 | % | | | | 0.84 | % | | | | 0.84 | % | | | | 0.86 | % |
| | | | | |
Ratio of gross expenses to average net assets5 | | | | 0.84 | % | | | | 0.86 | % | | | | 0.85 | % | | | | 0.85 | % | | | | 0.87 | % |
| | | | | |
Ratio of net investment income to average net assets2 | | | | 1.76 | % | | | | 2.65 | % | | | | 2.59 | % | | | | 2.04 | % | | | | 1.93 | % |
| | | | | |
Portfolio turnover | | | | 20 | % | | | | 35 | % | | | | 29 | % | | | | 27 | % | | | | 28 | % |
| | | | | |
Net assets end of year (000’s) omitted | | | | $382,571 | | | | | $408,844 | | | | | $533,106 | | | | | $743,984 | | | | | $788,023 | |
| | | | | | | |
65
|
AMG River Road Dividend All Cap Value Fund Financial Highlights For a share outstanding throughout each fiscal period |
| | | | | | | | | | | | | | | | | | | | | | | | | |
| | | For the fiscal year ended October 31, | | For the fiscal
period ended
October 31, |
| | | | | |
| Class Z | | 2021 | | 2020 | | 2019 | | 2018 | | 20176 |
| | | | | |
Net Asset Value, Beginning of Period | | | | $10.01 | | | | | $12.33 | | | | | $12.29 | | | | | $12.86 | | | | | $12.80 | |
| | | | | |
Income (loss) from Investment Operations: | | | | | | | | | | | | | | | | | | | | | | | | | |
| | | | | |
Net investment income1,2 | | | | 0.22 | | | | | 0.27 | | | | | 0.32 | | | | | 0.26 | | | | | 0.01 | |
| | | | | |
Net realized and unrealized gain (loss) on investments | | | | 3.29 | | | | | (1.47 | ) | | | | 0.77 | | | | | 0.06 | | | | | 0.07 | |
| | | | | |
Total income (loss) from investment operations | | | | 3.51 | | | | | (1.20 | ) | | | | 1.09 | | | | | 0.32 | | | | | 0.08 | |
| | | | | |
Less Distributions to Shareholders from: | | | | | | | | | | | | | | | | | | | | | | | | | |
| | | | | |
Net investment income | | | | (0.24 | ) | | | | (0.38 | ) | | | | (0.33 | ) | | | | (0.31 | ) | | | | (0.02 | ) |
| | | | | |
Net realized gain on investments | | | | – | | | | | (0.74 | ) | | | | (0.72 | ) | | | | (0.58 | ) | | | | – | |
| | | | | |
Total distributions to shareholders | | | | (0.24 | ) | | | | (1.12 | ) | | | | (1.05 | ) | | | | (0.89 | ) | | | | (0.02 | ) |
| | | | | |
Net Asset Value, End of Period | | | | $13.28 | | | | | $10.01 | | | | | $12.33 | | | | | $12.29 | | | | | $12.86 | |
| | | | | |
Total Return2,3 | | | | 35.26 | % | | | | (10.65 | )% | | | | 10.37 | % | | | | 2.42 | % | | | | 0.59 | %7 |
| | | | | |
Ratio of net expenses to average net assets4 | | | | 0.77 | % | | | | 0.81 | % | | | | 0.79 | % | | | | 0.78 | % | | | | 0.78 | %8 |
| | | | | |
Ratio of gross expenses to average net assets5 | | | | 0.80 | % | | | | 0.81 | % | | | | 0.80 | % | | | | 0.79 | % | | | | 0.79 | %8 |
| | | | | |
Ratio of net investment income to average net assets2 | | | | 1.80 | % | | | | 2.69 | % | | | | 2.64 | % | | | | 2.10 | % | | | | 0.79 | %8 |
| | | | | |
Portfolio turnover | | | | 20 | % | | | | 35 | % | | | | 29 | % | | | | 27 | % | | | | 28 | %7 |
| | | | | |
Net assets end of period (000’s) omitted | | | | $2,430 | | | | | $1,901 | | | | | $63 | | | | | $619 | | | | | $257 | |
| | | | | | | |
| 1 | Per share numbers have been calculated using average shares. |
| 2 | Total returns and net investment income (loss) would have been lower had certain expenses not been offset. |
| 3 | The total return is calculated using the published Net Asset Value as of fiscal year end. |
| 4 | Includes reduction from broker recapture amounting to $0.01, less than 0.01%, 0.01%, less than 0.01%, and less than 0.01% for the fiscal years ended 2021, 2020, 2019, 2018, and 2017, respectively. |
| 5 | Excludes the impact of expense reimbursement or fee waivers and expense reductions such as brokerage credits, but includes expense repayments and non-reimbursable expenses, if any, such as interest, taxes, and extraordinary expenses. (See Note 1(c) and 2 in the Notes to Financial Statements.) |
| 6 | The commencement of operations was on October 2, 2017. |
66
|
AMG River Road Small-Mid Cap Value Fund Financial Highlights For a share outstanding throughout each fiscal year |
| | | | | | | | | | | | | | | | | | | | | | | | | |
| | | For the fiscal years ended October 31, |
| | | | | |
| Class N | | 2021 | | 2020 | | 2019 | | 2018 | | 2017 |
| | | | | |
Net Asset Value, Beginning of Year | | | | $6.80 | | | | | $7.84 | | | | | $7.62 | | | | | $8.23 | | | | | $7.04 | |
| | | | | |
Income (loss) from Investment Operations: | | | | | | | | | | | | | | | | | | | | | | | | | |
| | | | | |
Net investment loss1,2 | | | | (0.04 | ) | | | | (0.01 | )3 | | | | (0.02 | ) | | | | (0.03 | ) | | | | (0.03 | ) |
| | | | | |
Net realized and unrealized gain (loss) on investments | | | | 3.05 | | | | | (0.88 | ) | | | | 0.78 | | | | | 0.57 | | | | | 1.81 | |
| | | | | |
Total income (loss) from investment operations | | | | 3.01 | | | | | (0.89 | ) | | | | 0.76 | | | | | 0.54 | | | | | 1.78 | |
| | | | | |
Less Distributions to Shareholders from: | | | | | | | | | | | | | | | | | | | | | | | | | |
| | | | | |
Net investment income | | | | – | | | | | (0.01 | ) | | | | – | | | | | (0.02 | ) | | | | (0.01 | ) |
| | | | | |
Net realized gain on investments | | | | – | | | | | (0.14 | ) | | | | (0.54 | ) | | | | (1.13 | ) | | | | (0.58 | ) |
| | | | | |
Total distributions to shareholders | | | | – | | | | | (0.15 | ) | | | | (0.54 | ) | | | | (1.15 | ) | | | | (0.59 | ) |
| | | | | |
Net Asset Value, End of Year | | | | $9.81 | | | | | $6.80 | | | | | $7.84 | | | | | $7.62 | | | | | $8.23 | |
| | | | | |
Total Return2,4 | | | | 44.27 | % | | | | (11.65 | )% | | | | 11.82 | % | | | | 7.09 | % | | | | 26.18 | % |
| | | | | |
Ratio of net expenses to average net assets5 | | | | 1.25 | % | | | | 1.31 | % | | | | 1.31 | % | | | | 1.32 | % | | | | 1.35 | % |
| | | | | |
Ratio of gross expenses to average net assets6 | | | | 1.27 | % | | | | 1.33 | % | | | | 1.37 | % | | | | 1.36 | % | | | | 1.46 | % |
| | | | | |
Ratio of net investment loss to average net assets2 | | | | (0.38 | )% | | | | (0.16 | )% | | | | (0.27 | )% | | | | (0.35 | )% | | | | (0.33 | )% |
| | | | | |
Portfolio turnover | | | | 44 | % | | | | 47 | % | | | | 38 | % | | | | 46 | % | | | | 57 | % |
| | | | | |
Net assets end of year (000’s) omitted | | | | $22,702 | | | | | $21,618 | | | | | $24,669 | | | | | $17,840 | | | | | $7,810 | |
| | | | | | | |
67
|
AMG River Road Small-Mid Cap Value Fund Financial Highlights For a share outstanding throughout each fiscal year |
| | | | | | | | | | | | | | | | | | | | | | | | | |
| | | For the fiscal years ended October 31, |
| | | | | |
| Class I | | 2021 | | 2020 | | 2019 | | 2018 | | 2017 |
| | | | | |
Net Asset Value, Beginning of Year | | | | $6.98 | | | | | $8.04 | | | | | $7.78 | | | | | $8.38 | | | | | $7.16 | |
| | | | | |
Income (loss) from Investment Operations: | | | | | | | | | | | | | | | | | | | | | | | | | |
| | | | | |
Net investment income (loss)1,2 | | | | (0.01 | ) | | | | 0.01 | 3 | | | | (0.00 | )7 | | | | (0.01 | ) | | | | 0.00 | 8 |
| | | | | | |
Net realized and unrealized gain (loss) on investments | | | | 3.13 | | | | | (0.91 | ) | | | | 0.80 | | | | | 0.57 | | | | | 1.84 | |
| | | | | |
Total income (loss) from investment operations | | | | 3.12 | | | | | (0.90 | ) | | | | 0.80 | | | | | 0.56 | | | | | 1.84 | |
| | | | | |
Less Distributions to Shareholders from: | | | | | | | | | | | | | | | | | | | | | | | | | |
| | | | | |
Net investment income | | | | (0.00 | )7 | | | | (0.02 | ) | | | | – | | | | | (0.03 | ) | | | | (0.03 | ) |
| | | | | |
Net realized gain on investments | | | | – | | | | | (0.14 | ) | | | | (0.54 | ) | | | | (1.13 | ) | | | | (0.59 | ) |
| | | | | |
Total distributions to shareholders | | | | (0.00 | )7 | | | | (0.16 | ) | | | | (0.54 | ) | | | | (1.16 | ) | | | | (0.62 | ) |
| | | | | |
Net Asset Value, End of Year | | | | $10.10 | | | | | $6.98 | | | | | $8.04 | | | | | $7.78 | | | | | $8.38 | |
| | | | | |
Total Return2,4 | | | | 44.70 | % | | | | (11.47 | )% | | | | 12.12 | % | | | | 7.32 | % | | | | 26.63 | % |
| | | | | |
Ratio of net expenses to average net assets5 | | | | 1.00 | % | | | | 1.05 | % | | | | 1.06 | % | | | | 1.08 | % | | | | 1.10 | % |
| | | | | |
Ratio of gross expenses to average net assets6 | | | | 1.02 | % | | | | 1.07 | % | | | | 1.12 | % | | | | 1.12 | % | | | | 1.21 | % |
| | | | | |
Ratio of net investment income (loss) to average net assets2 | | | | (0.13 | )% | | | | 0.09 | % | | | | (0.02 | )% | | | | (0.11 | )% | | | | (0.06 | )% |
| | | | | |
Portfolio turnover | | | | 44 | % | | | | 47 | % | | | | 38 | % | | | | 46 | % | | | | 57 | % |
| | | | | |
Net assets end of year (000’s) omitted | | | | $218,698 | | | | | $156,350 | | | | | $145,620 | | | | | $51,400 | | | | | $36,547 | |
| | | | | | | |
68
|
AMG River Road Small-Mid Cap Value Fund Financial Highlights For a share outstanding throughout each fiscal period |
| | | | | | | | | | | | | | | | | | | | | | | | | |
| | | For the fiscal year ended October 31, | | For the fiscal
period ended
October 31, |
| | | | | |
| Class Z | | 2021 | | 2020 | | 2019 | | 2018 | | 20179 |
| | | | | |
Net Asset Value, Beginning of Period | | | | $6.98 | | | | | $8.04 | | | | | $7.77 | | | | | $8.37 | | | | | $8.48 | |
| | | | | |
Income (loss) from Investment Operations: | | | | | | | | | | | | | | | | | | | | | | | | | |
| | | | | |
Net investment income (loss)1,2 | | | | (0.01 | ) | | | | 0.01 | 3 | | | | 0.00 | 8 | | | | (0.01 | ) | | | | (0.01 | ) |
| | | | | |
Net realized and unrealized gain (loss) on investments | | | | 3.13 | | | | | (0.91 | ) | | | | 0.81 | | | | | 0.58 | | | | | (0.10 | ) |
| | | | | |
Total income (loss) from investment operations | | | | 3.12 | | | | | (0.90 | ) | | | | 0.81 | | | | | 0.57 | | | | | (0.11 | ) |
| | | | | |
Less Distributions to Shareholders from: | | | | | | | | | | | | | | | | | | | | | | | | | |
| | | | | |
Net investment income | | | | (0.00 | )7 | | | | (0.02 | ) | | | | – | | | | | (0.04 | ) | | | | – | |
| | | | | |
Net realized gain on investments | | | | – | | | | | (0.14 | ) | | | | (0.54 | ) | | | | (1.13 | ) | | | | – | |
| | | | | |
Total distributions to shareholders | | | | (0.00 | )7 | | | | (0.16 | ) | | | | (0.54 | ) | | | | (1.17 | ) | | | | – | |
| | | | | |
Net Asset Value, End of Period | | | | $10.10 | | | | | $6.98 | | | | | $8.04 | | | | | $7.77 | | | | | $8.37 | |
| | | | | |
Total Return2,4 | | | | 44.77 | % | | | | (11.43 | )% | | | | 12.26 | % | | | | 7.37 | % | | | | (1.30 | )%10 |
| | | | | |
Ratio of net expenses to average net assets5 | | | | 0.95 | % | | | | 1.00 | % | | | | 1.01 | % | | | | 1.03 | % | | | | 1.04 | %11 |
| | | | | |
Ratio of gross expenses to average net assets6 | | | | 0.97 | % | | | | 1.02 | % | | | | 1.07 | % | | | | 1.07 | % | | | | 1.48 | %11 |
| | | | | |
Ratio of net investment income (loss) to average net assets2 | | | | (0.08 | )% | | | | 0.14 | % | | | | 0.03 | % | | | | (0.06 | )% | | | | (0.71 | )%11 |
| | | | | |
Portfolio turnover | | | | 44 | % | | | | 47 | % | | | | 38 | % | | | | 46 | % | | | | 57 | %10 |
| | | | | |
Net assets end of period (000’s) omitted | | | | $35,766 | | | | | $553 | | | | | $183 | | | | | $136 | | | | | $49 | |
| | | | | | | |
| 1 | Per share numbers have been calculated using average shares. |
| 2 | Total returns and net investment income (loss) would have been lower had certain expenses not been offset. |
| 3 | Includes non-recurring dividends. Without these dividends, net investment income per share would have been $(0.02), $(0.00), and $0.00 for Class N, Class I, and Class Z shares, respectively. |
| 4 | The total return is calculated using the published Net Asset Value as of fiscal year end. |
| 5 | Includes reduction from broker recapture amounting to 0.02%, 0.02%, 0.03%, 0.01% and 0.01% for the fiscal years ended 2021, 2020, 2019, 2018 and the fiscal period ended 2017, respectively. |
| 6 | Excludes the impact of expense reimbursement or fee waivers and expense reductions such as brokerage credits, but includes expense repayments and non-reimbursable expenses, if any, such as interest, taxes, and extraordinary expenses. (See Note 1(c) and 2 in the Notes to Financial Statements.) |
| 7 | Less than $(0.005) per share. |
| 8 | Less than $ 0.005 per share. |
| 9 | The commencement of operations was October 2, 2017. |
69
|
AMG River Road International Value Equity Fund Financial Highlights For a share outstanding throughout each fiscal year |
| | | | | | | | | | | | | | | | | | | | | | | | | |
| | | For the fiscal years ended October 31, |
| | | | | |
| Class N | | 2021 | | 2020 | | 2019 | | 2018 | | 2017 |
| | | | | |
Net Asset Value, Beginning of Year | | | | $11.40 | | | | | $13.06 | | | | | $12.19 | | | | | $12.33 | | | | | $11.04 | |
| | | | | |
Income (loss) from Investment Operations: | | | | | | | | | | | | | | | | | | | | | | | | | |
| | | | | |
Net investment loss1,2 | | | | (0.09 | ) | | | | (0.16 | ) | | | | (0.05 | ) | | | | (0.03 | )3 | | | | (0.25 | ) |
| | | | | |
Net realized and unrealized gain (loss) on investments | | | | 2.71 | | | | | (0.42 | ) | | | | 1.63 | | | | | (0.11 | ) | | | | 1.54 | |
| | | | | |
Total income (loss) from investment operations | | | | 2.62 | | | | | (0.58 | ) | | | | 1.58 | | | | | (0.14 | ) | | | | 1.29 | |
| | | | | |
Less Distributions to Shareholders from: | | | | | | | | | | | | | | | | | | | | | | | | | |
| | | | | |
Net realized gain on investments | | | | (4.51 | ) | | | | (1.08 | ) | | | | (0.71 | ) | | | | – | | | | | – | |
| | | | | |
Net Asset Value, End of Year | | | | $9.51 | | | | | $11.40 | | | | | $13.06 | | | | | $12.19 | | | | | $12.33 | |
| | | | | |
Total Return2,4 | | | | 22.06 | % | | | | (5.17 | )% | | | | 13.98 | % | | | | (1.14 | )% | | | | 11.69 | % |
| | | | | |
Ratio of net expenses to average net assets5,6 | | | | 2.08 | % | | | | 2.71 | % | | | | 2.41 | % | | | | 3.12 | % | | | | 3.60 | % |
| | | | | |
Ratio of gross expenses to average net assets7 | | | | 2.69 | % | | | | 3.23 | % | | | | 2.83 | % | | | | 3.41 | % | | | | 3.75 | % |
| | | | | |
Ratio of net investment loss to average net assets2 | | | | (0.70 | )% | | | | (1.35 | )% | | | | (0.43 | )% | | | | (0.25 | )% | | | | (2.23 | )% |
| | | | | |
Portfolio turnover | | | | 159 | % | | | | 257 | % | | | | 264 | % | | | | 189 | % | | | | 186 | % |
| | | | | |
Net assets end of year (000’s) omitted | | | | $1,561 | | | | | $1,584 | | | | | $2,654 | | | | | $3,749 | | | | | $5,508 | |
| | | | | | | |
70
|
AMG River Road International Value Equity Fund Financial Highlights For a share outstanding throughout each fiscal year |
| | | | | | | | | | | | | | | | | | | | | | | | | |
| | | For the fiscal years ended October 31, |
| | | | | |
| Class I | | 2021 | | 2020 | | 2019 | | 2018 | | 2017 |
| | | | | |
Net Asset Value, Beginning of Year | | | | $11.65 | | | | | $13.30 | | | | | $12.37 | | | | | $12.48 | | | | | $11.15 | |
| | | | | |
Income (loss) from Investment Operations: | | | | | | | | | | | | | | | | | | | | | | | | | |
| | | | | |
Net investment loss1,2 | | | | (0.06 | ) | | | | (0.14 | ) | | | | (0.02 | ) | | | | 0.00 | 3,8 | | | | (0.24 | ) |
| | | | | |
Net realized and unrealized gain (loss) on investments | | | | 2.78 | | | | | (0.43 | ) | | | | 1.66 | | | | | (0.11 | ) | | | | 1.57 | |
| | | | | |
Total income (loss) from investment operations | | | | 2.72 | | | | | (0.57 | ) | | | | 1.64 | | | | | (0.11 | ) | | | | 1.33 | |
| | | | | |
Less Distributions to Shareholders from: | | | | | | | | | | | | | | | | | | | | | | | | | |
| | | | | |
Net realized gain on investments | | | | (4.51 | ) | | | | (1.08 | ) | | | | (0.71 | ) | | | | – | | | | | – | |
| | | | | |
Net Asset Value, End of Year | | | | $9.86 | | | | | $11.65 | | | | | $13.30 | | | | | $12.37 | | | | | $12.48 | |
| | | | | |
Total Return2,4 | | | | 22.48 | % | | | | (4.98 | )% | | | | 14.28 | % | | | | (0.88 | )% | | | | 11.93 | % |
| | | | | |
Ratio of net expenses to average net assets5,6 | | | | 1.84 | % | | | | 2.46 | % | | | | 2.16 | % | | | | 2.87 | % | | | | 3.35 | % |
| | | | | |
Ratio of gross expenses to average net assets7 | | | | 2.45 | % | | | | 2.98 | % | | | | 2.58 | % | | | | 3.16 | % | | | | 3.50 | % |
| | | | | |
Ratio of net investment loss to average net assets2 | | | | (0.46 | )% | | | | (1.10 | )% | | | | (0.18 | )% | | | | 0.00 | %9 | | | | (1.98 | )% |
| | | | | |
Portfolio turnover | | | | 159 | % | | | | 257 | % | | | | 264 | % | | | | 189 | % | | | | 186 | % |
| | | | | |
Net assets end of year (000’s) omitted | | | | $7,105 | | | | | $14,041 | | | | | $22,856 | | | | | $24,925 | | | | | $29,030 | |
| | | | | | | |
71
|
AMG River Road International Value Equity Fund Financial Highlights For a share outstanding throughout each fiscal period |
| | | | | | | | | | | | | | | | | | | | | | | | | |
| | | For the fiscal year ended October 31, | | For the fiscal
period ended
October 31, |
| | | | | |
| Class Z | | 2021 | | 2020 | | 2019 | | 2018 | | 201710 |
| | | | | |
Net Asset Value, Beginning of Period | | | | $11.69 | | | | | $13.32 | | | | | $12.38 | | | | | $12.49 | | | | | $12.53 | |
| | | | | |
Income (loss) from Investment Operations: | | | | | | | | | | | | | | | | | | | | | | | | | |
| | | | | |
Net investment income (loss)1,2 | | | | (0.05 | ) | | | | (0.12 | ) | | | | (0.01 | ) | | | | 0.01 | 3 | | | | (0.02 | ) |
| | | | | |
Net realized and unrealized gain (loss) on investments | | | | 2.79 | | | | | (0.43 | ) | | | | 1.66 | | | | | (0.12 | ) | | | | (0.02 | ) |
| | | | | |
Total income (loss) from investment operations | | | | 2.74 | | | | | (0.55 | ) | | | | 1.65 | | | | | (0.11 | ) | | | | (0.04 | ) |
| | | | | |
Less Distributions to Shareholders from: | | | | | | | | | | | | | | | | | | | | | | | | | |
| | | | | |
Net realized gain on investments | | | | (4.51 | ) | | | | (1.08 | ) | | | | (0.71 | ) | | | | – | | | | | – | |
| | | | | |
Net Asset Value, End of Period | | | | $9.92 | | | | | $11.69 | | | | | $13.32 | | | | | $12.38 | | | | | $12.49 | |
| | | | | |
Total Return2,4 | | | | 22.58 | % | | | | (4.82 | )% | | | | 14.35 | % | | | | (0.88 | )% | | | | (0.32 | )%11 |
| | | | | |
Ratio of net expenses to average net assets5,6 | | | | 1.76 | % | | | | 2.38 | % | | | | 2.08 | % | | | | 2.79 | % | | | | 3.38 | %12 |
| | | | | |
Ratio of gross expenses to average net assets7 | | | | 2.37 | % | | | | 2.90 | % | | | | 2.50 | % | | | | 3.08 | % | | | | 3.38 | %12 |
| | | | | |
Ratio of net investment income (loss) to average net assets2 | | | | (0.38 | )% | | | | (1.02 | )% | | | | (0.10 | )% | | | | 0.09 | % | | | | (2.74 | )%12 |
| | | | | |
Portfolio turnover | | | | 159 | % | | | | 257 | % | | | | 264 | % | | | | 189 | % | | | | 186 | %11 |
| | | | | |
Net assets end of period (000’s) omitted | | | | $552 | | | | | $660 | | | | | $84 | | | | | $73 | | | | | $25 | |
| | | | | | | |
| 1 | Per share numbers have been calculated using average shares. |
| 2 | Total returns and net investment income (loss) would have been lower had certain expenses not been offset. |
| 3 | Includes non-recurring dividends. Without these dividends, net investment loss per share would have been $(0.17), $(0.14), and $(0.13) for Class N, Class I and Class Z shares, respectively. |
| 4 | The total return is calculated using the published Net Asset Value as of fiscal year end. |
| 5 | Includes reduction from brokerage recapture amounting to 0.04%, 0.11%, 0.01% and 0.02% for the fiscal years ended 2021, 2020, 2019, 2018, respectively, and 0.02%, 0.02%, and less than 0.01% for Class N, Class I, and Class Z, respectively, for the fiscal period ended 2017. |
| 6 | Expense ratio includes dividend and interest expense related to securities sold short. Excluding such dividend and interest expense, the ratio of expenses to average net assets would be 1.32%, 1.11%, and 1.01% for Class N, Class I and Class Z, respectively, for the fiscal year ended October 31, 2021, 1.34%, 1.09% and 1.01% for Class N, Class I and Class Z, respectively, for the fiscal year ended October 31, 2020, 1.44%, 1.19% and 1.11% for Class N, Class I and Class Z, respectively, for the fiscal year ended October 31, 2019, 1.45%, 1.20% and 1.12% for Class N, Class I and Class Z, respectively, for the fiscal year ended October 31, 2018, 1.48% and 1.23% for Class N and Class I, respectively, for the fiscal year ended October 31, 2017, and 1.12% for Class Z for the fiscal period ended 2017. |
| 7 | Excludes the impact of expense reimbursement or fee waivers and expense reductions such as brokerage credits, but includes expense repayments and non-reimbursable expenses, if any, such as interest, taxes, and extraordinary expenses. (See Note 1(c) and 2 in the Notes to Financial Statements.) |
| 8 | Less than $0.005 per share. |
| 10 | Commencement of operations was on October 2, 2017. |
72
|
AMG River Road Focused Absolute Value Fund Financial Highlights For a share outstanding throughout each fiscal year |
| | | | | | | | | | | | | | | | | | | | | | | | | |
| | | For the fiscal years ended October 31, |
| | | | | |
| Class N | | 2021 | | 2020 | | 2019 | | 2018 | | 2017 |
| | | | | |
Net Asset Value, Beginning of Year | | | | $11.05 | | | | | $12.65 | | | | | $11.91 | | | | | $11.87 | | | | | $10.85 | |
| | | | | |
Income (loss) from Investment Operations: | | | | | | | | | | | | | | | | | | | | | | | | | |
| | | | | |
Net investment income (loss)1,2 | | | | 0.01 | | | | | 0.04 | 3 | | | | 0.04 | | | | | 0.05 | | | | | (0.01 | ) |
| | | | | |
Net realized and unrealized gain (loss) on investments | | | | 3.38 | | | | | (1.39 | ) | | | | 1.45 | | | | | 0.93 | | | | | 1.85 | |
| | | | | |
Total income (loss) from investment operations | | | | 3.39 | | | | | (1.35 | ) | | | | 1.49 | | | | | 0.98 | | | | | 1.84 | |
| | | | | |
Less Distributions to Shareholders from: | | | | | | | | | | | | | | | | | | | | | | | | | |
| | | | | |
Net investment income | | | | – | | | | | (0.02 | ) | | | | (0.05 | ) | | | | (0.07 | ) | | | | (0.09 | ) |
| | | | | |
Net realized gain on investments | | | | – | | | | | (0.23 | ) | | | | (0.70 | ) | | | | (0.87 | ) | | | | (0.73 | ) |
| | | | | |
Total distributions to shareholders | | | | – | | | | | (0.25 | ) | | | | (0.75 | ) | | | | (0.94 | ) | | | | (0.82 | ) |
| | | | | |
Net Asset Value, End of Year | | | | $14.44 | | | | | $11.05 | | | | | $12.65 | | | | | $11.91 | | | | | $11.87 | |
| | | | | |
Total Return2,4 | | | | 30.68 | % | | | | (11.03 | )% | | | | 14.29 | % | | | | 8.69 | % | | | | 17.42 | % |
| | | | | |
Ratio of net expenses to average net assets5 | | | | 1.06 | % | | | | 1.03 | % | | | | 0.98 | % | | | | 0.99 | % | | | | 0.97 | % |
| | | | | |
Ratio of gross expenses to average net assets6 | | | | 1.12 | % | | | | 1.15 | % | | | | 1.21 | % | | | | 1.32 | % | | | | 1.50 | % |
| | | | | |
Ratio of net investment income (loss) to average net assets2 | | | | 0.10 | % | | | | 0.34 | % | | | | 0.34 | % | | | | 0.43 | % | | | | (0.09 | )% |
| | | | | |
Portfolio turnover | | | | 83 | % | | | | 103 | % | | | | 59 | % | | | | 88 | % | | | | 112 | % |
| | | | | |
Net assets end of year (000’s) omitted | | | | $3,666 | | | | | $12,466 | | | | | $15,284 | | | | | $9,184 | | | | | $7,448 | |
| | | | | | | |
73
|
AMG River Road Focused Absolute Value Fund Financial Highlights For a share outstanding throughout each fiscal year |
| | | | | | | | | | | | | | | | | | | | | | | | | |
| | | For the fiscal years ended October 31, |
| | | | | |
| Class I | | 2021 | | 2020 | | 2019 | | 2018 | | 2017 |
| | | | | |
Net Asset Value, Beginning of Year | | | | $11.12 | | | | | $12.72 | | | | | $11.98 | | | | | $11.92 | | | | | $10.88 | |
| | | | | |
Income (loss) from Investment Operations: | | | | | | | | | | | | | | | | | | | | | | | | | |
| | | | | |
Net investment income1,2 | | | | 0.05 | | | | | 0.07 | 3 | | | | 0.07 | | | | | 0.08 | | | | | 0.06 | |
| | | | | |
Net realized and unrealized gain (loss) on investments | | | | 3.39 | | | | | (1.40 | ) | | | | 1.46 | | | | | 0.93 | | | | | 1.81 | |
| | | | | |
Total income (loss) from investment operations | | | | 3.44 | | | | | (1.33 | ) | | | | 1.53 | | | | | 1.01 | | | | | 1.87 | |
| | | | | |
Less Distributions to Shareholders from: | | | | | | | | | | | | | | | | | | | | | | | | | |
| | | | | |
Net investment income | | | | (0.08 | ) | | | | (0.04 | ) | | | | (0.09 | ) | | | | (0.08 | ) | | | | (0.10 | ) |
| | | | | |
Net realized gain on investments | | | | – | | | | | (0.23 | ) | | | | (0.70 | ) | | | | (0.87 | ) | | | | (0.73 | ) |
| | | | | |
Total distributions to shareholders | | | | (0.08 | ) | | | | (0.27 | ) | | | | (0.79 | ) | | | | (0.95 | ) | | | | (0.83 | ) |
| | | | | |
Net Asset Value, End of Year | | | | $14.48 | | | | | $11.12 | | | | | $12.72 | | | | | $11.98 | | | | | $11.92 | |
| | | | | |
Total Return2,4 | | | | 30.98 | % | | | | (10.81 | )% | | | | 14.55 | % | | | | 8.91 | % | | | | 17.72 | % |
| | | | | |
Ratio of net expenses to average net assets5 | | | | 0.81 | % | | | | 0.78 | % | | | | 0.73 | % | | | | 0.74 | % | | | | 0.73 | % |
| | | | | |
Ratio of gross expenses to average net assets6 | | | | 0.87 | % | | | | 0.90 | % | | | | 0.96 | % | | | | 1.07 | % | | | | 1.20 | % |
| | | | | |
Ratio of net investment income to average net assets2 | | | | 0.35 | % | | | | 0.59 | % | | | | 0.59 | % | | | | 0.68 | % | | | | 0.50 | % |
| | | | | |
Portfolio turnover | | | | 83 | % | | | | 103 | % | | | | 59 | % | | | | 88 | % | | | | 112 | % |
| | | | | |
Net assets end of year (000’s) omitted | | | | $176,460 | | | | | $130,758 | | | | | $130,928 | | | | | $20,928 | | | | | $17,106 | |
| | | | | | | |
74
|
AMG River Road Focused Absolute Value Fund Financial Highlights For a share outstanding throughout each fiscal period |
| | | | | | | | | | | | | | | | | | | | | | | | | |
| | | For the fiscal year ended October 31, | | For the fiscal
period ended
October 31, |
| | | | | |
| Class Z | | 2021 | | 2020 | | 2019 | | 2018 | | 20177 |
| | | | | |
Net Asset Value, Beginning of Period | | | | $11.12 | | | | | $12.73 | | | | | $11.98 | | | | | $11.92 | | | | | $12.18 | |
| | | | | |
Income (loss) from Investment Operations: | | | | | | | | | | | | | | | | | | | | | | | | | |
| | | | | |
Net investment income (loss)1,2 | | | | 0.06 | | | | | 0.07 | 3 | | | | 0.07 | | | | | 0.08 | | | | | (0.01 | ) |
| | | | | |
Net realized and unrealized gain (loss) on investments | | | | 3.39 | | | | | (1.41 | ) | | | | 1.47 | | | | | 0.93 | | | | | (0.25 | ) |
| | | | | |
Total income (loss) from investment operations | | | | 3.45 | | | | | (1.34 | ) | | | | 1.54 | | | | | 1.01 | | | | | (0.26 | ) |
| | | | | |
Less Distributions to Shareholders from: | | | | | | | | | | | | | | | | | | | | | | | | | |
| | | | | |
Net investment income | | | | (0.08 | ) | | | | (0.04 | ) | | | | (0.09 | ) | | | | (0.08 | ) | | | | – | |
| | | | | |
Net realized gain on investments | | | | – | | | | | (0.23 | ) | | | | (0.70 | ) | | | | (0.87 | ) | | | | – | |
| | | | | |
Total distributions to shareholders | | | | (0.08 | ) | | | | (0.27 | ) | | | | (0.79 | ) | | | | (0.95 | ) | | | | – | |
| | | | | |
Net Asset Value, End of Period | | | | $14.49 | | | | | $11.12 | | | | | $12.73 | | | | | $11.98 | | | | | $11.92 | |
| | | | | |
Total Return2,4 | | | | 31.12 | % | | | | (10.86 | )% | | | | 14.69 | % | | | | 8.96 | % | | | | (2.13 | )%8 |
| | | | | |
Ratio of net expenses to average net assets5 | | | | 0.77 | % | | | | 0.74 | % | | | | 0.69 | % | | | | 0.70 | % | | | | 0.70 | %9 |
| | | | | |
Ratio of gross expenses to average net assets6 | | | | 0.83 | % | | | | 0.86 | % | | | | 0.92 | % | | | | 1.03 | % | | | | 1.32 | %9 |
| | | | | |
Ratio of net investment income (loss) to average net assets2 | | | | 0.39 | % | | | | 0.63 | % | | | | 0.63 | % | | | | 0.72 | % | | | | (0.59 | )%9 |
| | | | | |
Portfolio turnover | | | | 83 | % | | | | 103 | % | | | | 59 | % | | | | 88 | % | | | | 112 | %8 |
| | | | | |
Net assets end of period (000’s) omitted | | | | $13,323 | | | | | $2,462 | | | | | $157 | | | | | $66 | | | | | $61 | |
| | | | | | | |
| 1 | Per share numbers have been calculated using average shares. |
| 2 | Total returns and net investment income (loss) would have been lower had certain expenses not been offset. |
| 3 | Includes non-recurring dividends. Without these dividends, net investment income per share would have been $0.02, $0.05, and $0.05 for Class N, Class I, and Class Z shares, respectively. |
| 4 | The total return is calculated using the published Net Asset Value as of fiscal year end. |
| 5 | Includes reduction from broker recapture amounting to 0.01% for the fiscal years ended October 31, 2021 and 2020, 0.02% for the fiscal year ended October 31, 2019, 0.01% for the fiscal year ended October 31, 2018, and 0.03%, 0.02%, and less than 0.01% for Class N, Class I and Class Z, respectively, for the fiscal period ended October 31, 2017. |
| 6 | Excludes the impact of expense reimbursement or fee waivers and expense reductions such as brokerage credits, but includes expense repayments and non-reimbursable expenses, if any, such as interest, taxes, and extraordinary expenses. (See Note 1(c) and 2 in the Notes to Financial Statements.) |
| 7 | The commencement of operations for Class Z shares was October 2, 2017. |
75
|
Notes to Financial Statements October 31, 2021 |
1. ORGANIZATION AND SUMMARY OF SIGNIFICANT ACCOUNTING POLICIES
AMG Funds I and AMG Funds IV (the “Trusts”) are open-end management investment companies. AMG Funds I is organized as a Massachusetts business trust, while AMG Funds IV is organized as a Delaware Statutory Trust. The Trusts are registered under the Investment Company Act of 1940, as amended (the “1940 Act”). Currently, the Trusts consist of a number of different funds, each having distinct investment management objectives, strategies, risks, and policies. Included in this report are AMG Funds I: AMG River Road Large Cap Value Select Fund (“Large Cap Value Select”) (formerly AMG FQ Long-Short Equity Fund), AMG Trust IV: AMG River Road Mid Cap Value Fund (“Mid Cap Value”) (formerly AMG Managers Fairpointe Mid Cap Fund), AMG River Road Small Cap Value Fund (“Small Cap Value”), AMG River Road Dividend All Cap Value Fund (“Dividend All Cap Value”), AMG River Road Small-Mid Cap Value Fund (“Small-Mid Cap Value”), AMG River Road International Value Equity Fund (“International Value Equity “) (formerly AMG River Road Long-Short Fund), and AMG River Road Focused Absolute Value Fund (“Focused Absolute Value”), each a “Fund” and collectively, the “Funds”.
Each Fund is authorized to issue Class N and Class I shares. Mid Cap Value, Small Cap Value, Dividend All Cap Value, Small-Mid Cap Value, International Value Equity, and Focused Absolute Value are also authorized to issue Class Z shares. Each class represents an interest in the same assets of the respective Fund. Although all share classes generally have identical voting rights, each share class votes separately when required by law. Different share classes may have different net asset values per share to the extent the share classes pay different distribution amounts and/or the expenses of such share classes differ. Each share class has its own expense structure. Please refer to a current prospectus for additional information on each share class.
Effective June 11, 2021, Large Cap Value Select became a non-diversified fund and through August 15, 2021, International Value Equity was a non-diversified fund. A greater percentage of the Fund’s holdings may be focused in a smaller number of securities which may place the Fund at greater risk than a more diversified fund.
On March 17-18, 2021, the Board of Trustees of the Trusts (the “Board”) approved the following: River Road Asset Management, LLC (“River Road”), as the subadviser to Mid Cap Value and Large Cap Value Select, to replace Fairpointe Capital LLC (“Fairpointe Capital”) and First Quadrant, L.P. (“First Quadrant”), respectively, effective March 19, 2021 and March 22, 2021, respectively, which were subsequently approved by the shareholders of Mid Cap Value and Large Cap Value Select on June 14, 2021 and June 11, 2021, respectively. In connection with the subadviser change, Mid Cap Value seeks to achieve its investment objective by investing in a portfolio of mid-capitalization equity securities and Large Cap Value Select seeks to achieve its investment objective by investing in a focused portfolio of large-capitalization equity securities.
In conjunction with the respective changes in investment strategy for each Fund, each Fund sold substantially all open positions, including derivative positions, around the date of the subadviser change that increased each Fund’s portfolio turnover. Also, Mid Cap Value declared a special capital gain distribution on March 24, 2021, and Large Cap Value Select declared a special income distribution on March 25, 2021.
Effective August 16, 2021, International Value Equity changed its principal investment strategies, resulting in changes to its principal risks, as well as to its primary and secondary benchmarks. In conjunction with the respective investment strategy International Value Equity sold substantially all open
positions, including covering all securities sold short, that increased each Fund’s portfolio turnover.
Market disruptions associated with the COVID-19 pandemic have had a global impact, and uncertainty exists as to the long-term implications. Such disruptions can adversely affect assets of the Funds and thus Fund performance.
The Funds’ financial statements are prepared in accordance with accounting principles generally accepted in the United States of America (“U.S. GAAP”), including accounting and reporting guidance pursuant to Accounting Standards Codification Topic 946 applicable to investment companies. U.S. GAAP requires management to make estimates and assumptions that affect the reported amounts of assets and liabilities and disclosure of contingent assets and liabilities at the date of the financial statements and the reported amounts of income and expenses during the reporting period. Actual results could differ from those estimates and such differences could be material. The following is a summary of significant accounting policies followed by the Funds in the preparation of their financial statements:
a. VALUATION OF INVESTMENTS
For the Funds, equity securities, including securities sold short, traded on a national securities exchange or reported on the NASDAQ national market system (“NMS”) are valued at the last quoted sales price on the primary exchange or, if applicable, the NASDAQ official closing price or the official closing price of the relevant exchange or, lacking any sales, at the last quoted bid price for Mid Cap Value, Small Cap Value, Dividend All Cap Value, Small-Mid Cap Value, International Equity, and Focused Absolute Value or the mean between the last quoted bid and ask prices (the “mean price”) for Large Cap Value Select. Equity securities and securities sold short held by the Funds that are traded in the over-the-counter market (other than NMS securities) are valued at the mean price. Foreign equity securities (securities principally traded in markets other than U.S. markets) held by the Funds are valued at the official closing price on the primary exchange or, for markets that either do not offer an official closing price or where the official closing price may not be representative of the overall market, the last quoted sale price. Effective October 1, 2021, equity securities lacking any sales in Large Cap Value Select are valued at the last quoted bid price and equity securities traded in the over-the-counter market (other than NMS securities) in each Fund are valued at the bid price. As of October 1, 2021, there was no impact to the Funds due to the changes in valuation policy.
Fixed income securities purchased with a remaining maturity of 60 days or less are valued at amortized cost, provided that the amortized cost value is approximately the same as the fair value of the security valued without the use of amortized cost. Investments in other open-end registered investment companies are valued at their end of day net asset value per share.
Futures contracts for which market quotations are readily available are valued at the settlement price as of the close of the futures exchange.
Total Return Equity Basket Swaps (“Equity Basket Swap”) may be valued using a price obtained from the counterparty of the Equity Basket Swap as long as the value obtained from the counterparty is reasonable to the total value of the underlying securities constituting the Equity Basket Swap if such underlying securities were priced in accordance with the Funds’ equity security valuation policies as discussed above.
The Funds’ portfolio investments are generally valued based on independent market quotations or prices or, if none, “evaluative” or other market based
76
|
Notes to Financial Statements (continued) |
valuations provided by third party pricing services approved by the Board. Under certain circumstances, the value of certain Fund portfolio investments may be based on an evaluation of fair value, pursuant to procedures established by and under the general supervision of the Board. The Valuation Committee, which is comprised of the Independent Trustees of the Board, and the Pricing Committee, which is comprised of representatives from AMG Funds LLC (the “Investment Manager”) are the committees appointed by the Board to make fair value determinations. Each Fund may use the fair value of a portfolio investment to calculate its net asset value (“NAV”) in the event that the market quotation, price or market based valuation for the portfolio investment is not readily available or otherwise not determinable pursuant to the Board’s valuation procedures, if the Investment Manager or the Pricing Committee believes the quotation, price or market based valuation to be unreliable, or in certain other circumstances. When determining the fair value of an investment, the Pricing Committee and, if required under the Trusts’ securities valuation procedures, the Valuation Committee, seeks to determine the price that the Fund might reasonably expect to receive from current sale of that portfolio investment in an arms-length transaction. Fair value determinations shall be based upon consideration of all available facts and information, including, but not limited to (i) attributes specific to the investment; (ii) fundamental and analytical data relating to the investment; and (iii) the value of other comparable securities or relevant financial instruments, including derivative securities, traded on other markets or among dealers.
The values assigned to fair value portfolio investments are based on available information and do not necessarily represent amounts that might ultimately be realized in the future, since such amounts depend on future developments inherent in long-term investments. Because of the inherent uncertainty of valuation, those estimated values may differ significantly from the values that would have been used had a ready market for the investments existed, and the differences could be material. The Board will be presented with a quarterly report showing as of the most recent quarter end, all outstanding securities fair valued by the Funds, including a comparison with the prior quarter end and the percentage of the Funds that the security represents at each quarter end.
With respect to foreign equity securities and certain foreign fixed income securities, the Board has adopted a policy that securities held in the Funds that can be fair valued by the applicable fair value pricing service are fair valued on each business day provided that each individual price exceeds a pre-established confidence level.
U.S. GAAP defines fair value as the price that a fund would receive to sell an asset or pay to transfer a liability in an orderly transaction between market participants at the measurement date. U.S. GAAP also establishes a framework for measuring fair value, and a three level hierarchy for fair value measurements based upon the transparency of inputs to the valuation of an asset or liability. Inputs may be observable or unobservable and refer broadly to the assumptions that market participants would use in pricing the asset or liability. Observable inputs reflect the assumptions market participants would use in pricing the asset or liability based on market data obtained from sources independent of the Funds. Unobservable inputs reflect the Funds’ own assumptions about the assumptions that market participants would use in pricing the asset or liability developed based on the best information available in the circumstances. Each investment is assigned a level based upon the observability of the inputs which are significant to the overall valuation.
The three-tier hierarchy of inputs is summarized below:
Level 1 – inputs are quoted prices in active markets for identical investments (e.g., equity securities, open-end investment companies)
Level 2 – other observable inputs (including, but not limited to: quoted prices for similar assets or liabilities in markets that are active, quoted prices for identical or similar assets or liabilities in markets that are not active, inputs other than quoted prices that are observable for the assets or liabilities (such as interest rates, yield curves, volatilities, prepayment speeds, loss severities, credit risks and default rates) or other market corroborated inputs) (e.g., debt securities, government securities, foreign currency exchange contracts, swaps, foreign securities utilizing international fair value pricing, fair valued securities with observable inputs)
Level 3 – inputs are significant unobservable inputs (including the Fund’s own assumptions used to determine the fair value of investments) (e.g., fair valued securities with unobservable inputs)
Changes in inputs or methodologies used for valuing investments may result in a transfer in or out of levels within the fair value hierarchy. The inputs or methodologies used for valuing investments may not necessarily be an indication of the risk associated with investing in those investments.
b. SECURITY TRANSACTIONS
Security transactions are accounted for as of trade date. Realized gains and losses on securities sold are determined on the basis of identified cost.
c. INVESTMENT INCOME AND EXPENSES
Dividend income is recorded on the ex-dividend date. Dividends from foreign securities are recorded on the ex-dividend date, and if after the fact, as soon as the Funds become aware of the ex-dividend date, except for Korean securities where dividends are recorded on confirmation date. Dividends declared on short positions are recorded on ex-date as dividend expense. Interest income, which includes amortization of premium and accretion of discount on debt securities, is accrued as earned. Dividend and interest income on foreign securities is recorded gross of any withholding tax. Non-cash dividends included in dividend income, if any, are reported at the fair market value of the securities received. Upon notification from issuers, distributions received from a real estate investment trust (REIT) may be redesignated as a reduction of cost of investments and/or realized gain. Other income and expenses are recorded on an accrual basis. Expenses that cannot be directly attributed to a Fund are apportioned among the funds in the Trusts and other trusts or funds within the AMG Funds Family of Funds (collectively the “AMG Funds Family”) based upon their relative average net assets or number of shareholders. Investment income, realized and unrealized capital gains and losses, the common expenses of each Fund, and certain fund level expense reductions, if any, are allocated on a pro-rata basis to each class based on the relative net assets of each class to the total net assets of each Fund.
The following Funds had certain portfolio trades directed to various brokers under a brokerage recapture program. Credits received from the brokerage recapture program are earned and paid on a monthly basis, and are recorded as expense offsets, which serve to reduce the Funds’ overall expense ratio.
77
|
Notes to Financial Statements (continued) |
For the fiscal year ended October 31, 2021, the impact on the expenses and expense ratios were as follows:
| | | | | | | | |
| | | | | | Percentage | |
| | | Amount | | | Reduction | |
Mid Cap Value | | | $2,903 | | | | 0.00%1 | |
| | |
Large Cap Value Select | | | 339 | | | | 0.00%1 | |
| | |
Small Cap Value | | | 170,268 | | | | 0.02% | |
| | |
Dividend All Cap Value | | | 32,421 | | | | 0.01% | |
| | |
Small-Mid Cap Value | | | 46,339 | | | | 0.02% | |
| | |
International Value Equity | | | 5,520 | | | | 0.04% | |
| | |
Focused Absolute Value | | | 12,836 | | | | 0.01% | |
Value will declare and pay net investment income distributions quarterly. Each Fund will normally declare and pay realized net capital gains, if any, at least annually in December. Distributions to shareholders are recorded on the ex-dividend date. Distributions are determined in accordance with federal income tax regulations, which may differ from net investment income and net realized capital gains for financial statement purposes (U.S. GAAP). Differences may be permanent or temporary. Permanent differences are reclassified among capital accounts in the financial statements to reflect their tax character. Permanent book and tax basis differences, if any, relating to shareholder distributions will result in reclassification to paid-in capital. Temporary differences arise when certain items of income, expense and gain or loss are recognized in different periods for financial statement and tax purposes; these differences will reverse at some time in the future. Permanent differences are due to the write off of net operating losses. Temporary differences are due to the deferral of qualified late year losses, wash sale loss deferrals, and distributions received from investments in certain partnerships.
d. DIVIDENDS AND DISTRIBUTIONS
Fund distributions, except Dividend All Cap Value, resulting from net
investment income will normally be declared and paid at least annually.
Dividend All Cap
The tax character of distributions paid during the fiscal years ended October 31, 2021 and October 31, 2020 were as follows:
| | | | | | | | | | | | | | | | | | | | | | | | |
| | | Mid Cap Value | | | Large Cap Value Select | | | Small Cap Value | |
Distributions paid from: | | | 2021 | | | | 2020 | | | | 2021 | | | | 2020 | | | | 2021 | | | | 2020 | |
| | | | | | |
Ordinary income * | | | $26,955,595 | | | | $10,935,063 | | | | $6,522,408 | | | | $1,902,248 | | | | $29,406 | | | | $11,238,122 | |
| | | | | | |
Long-term capital gains | | | 247,018,664 | | | | 63,584,233 | | | | – | | | | 2,368,437 | | | | 3,739 | | | | 14,192,439 | |
| | | | | | | | | | | | | | | | | | | | | | | | |
| | | | | | |
| | | $273,974,259 | | | | $74,519,296 | | | | $6,522,408 | | | | $4,270,685 | | | | $33,145 | | | | $25,430,561 | |
| | | | | | | | | | | | | | | | | | | | | | | | |
| | | |
| | | Dividend All Cap Value | | | Small-Mid Cap Value | | | International Value Equity | |
Distributions paid from: | | | 2021 | | | | 2020 | | | | 2021 | | | | 2020 | | | | 2021 | | | | 2020 | |
| | | | | | |
Ordinary income * | | | $9,290,372 | | | | $19,814,208 | | | | – | | | | $1,878,170 | | | | $1,587,930 | | | | $1,618,532 | |
| | | | | | |
Long-term capital gains | | | – | | | | 33,640,275 | | | | $4,716 | | | | 1,731,534 | | | | 1,454,805 | | | | 429,612 | |
| | | | | | | | | | | | | | | | | | | | | | | | |
| | | | | | |
| | | $9,290,372 | | | | $53,454,483 | | | | $4,716 | | | | $3,609,704 | | | | $3,042,735 | | | | $2,048,144 | |
| | | | | | | | | | | | | | | | | | | | | | | | |
| | | | | |
| | | | | | | | | | | | | | | Focused Absolute Value | |
Distributions paid from: | | | | | | | | | | | | | | | | | | | 2021 | | | | 2020 | |
| | | | | | |
Ordinary income * | | | | | | | | | | | | | | | | | | | $968,353 | | | | $1,516,569 | |
| | | | | | |
Long-term capital gains | | | | | | | | | | | | | | | | | | | – | | | | 2,023,843 | |
| | | | | | | | | | | | | | | | | | | | | | | | |
| | | | | | |
| | | | | | | | | | | | | | | | | | | $968,353 | | | | $3,540,412 | |
| | | | | | | | | | | | | | | | | | | | | | | | |
| * | For tax purposes, short-term capital gain distributions, if any, are considered ordinary income distributions. |
78
|
Notes to Financial Statements (continued) |
As of October 31, 2021, the components of distributable earnings (excluding unrealized appreciation/depreciation) on a tax basis consisted of:
| | | | | | | | | | | | | | | | | | | | | | | | |
| | | | | | |
| | | Mid Cap Value | | | Large Cap Value Select | | | Small Cap Value | | | Dividend All Cap Value | | | Small-Mid Cap Value | | | International Value Equity | |
| | | | | | |
Capital loss carryforward | | | – | | | | $5,997,350 | | | | – | | | | – | | | | – | | | | – | |
| | | | | | |
Undistributed ordinary income | | | $12,500,413 | | | | 112,606 | | | | $25,727,975 | | | | $3,835,202 | | | | – | | | | $4,913 | |
| | | | | | |
Undistributed long-term capital gains | | | – | | | | – | | | | 38,262,243 | | | | 65,748,019 | | | | $15,292,294 | | | | 47,222 | |
| | | | | | |
Late-year loss deferral | | | – | | | | – | | | | – | | | | – | | | | 535,886 | | | | – | |
| | | | | | |
| | | | | | | | | | | | | | | | | | Focused Absolute Value | |
| | |
Capital loss carryforward | | | | | | | | – | |
| | |
Undistributed ordinary income | | | | | | | | $427,562 | |
| | |
Undistributed long-term capital gains | | | | | | | | 12,517,253 | |
| | |
Late-year loss deferral | | | | | | | | – | |
The undistributed ordinary income predominately consists of short-term capital gains.
At October 31, 2021, the cost of investments and the aggregate gross unrealized appreciation and depreciation for federal income tax purposes were as follows:
| | | | | | | | | | | | | | | | |
| | | | | | | | | | | | Net Appreciation | |
| Fund | | Cost | | | Appreciation | | | Depreciation | | | (Depreciation) | |
| | | | |
Mid Cap Value | | | $368,491,577 | | | | $46,424,771 | | | | $(9,660,414 | ) | | | $36,764,357 | |
| | | | |
Large Cap Value Select | | | 38,592,365 | | | | 4,095,137 | | | | (993,365 | ) | | | 3,101,772 | |
| | | | |
Small Cap Value | | | 716,811,604 | | | | 194,911,027 | | | | (13,517,814 | ) | | | 181,393,213 | |
| | | | |
Dividend All Cap Value | | | 307,781,507 | | | | 138,399,607 | | | | (13,380,099 | ) | | | 125,019,508 | |
| | | | |
Small-Mid Cap Value | | | 229,284,874 | | | | 55,793,700 | | | | (6,335,283 | ) | | | 49,458,417 | |
| | | | |
International Value Equity | | | 9,487,438 | | | | 189,910 | | | | (473,859 | ) | | | (283,949 | ) |
| | | | |
Focused Absolute Value | | | 170,681,981 | | | | 30,797,679 | | | | (7,880,652 | ) | | | 22,917,027 | |
e. FEDERAL TAXES
Each Fund currently qualifies as an investment company and intends to comply with the requirements under Subchapter M of the Internal Revenue Code of 1986, as amended, and to distribute substantially all of its taxable income and gains to its shareholders and to meet certain diversification and income requirements with respect to investment companies. Therefore, no provision for federal income or excise tax is included in the accompanying financial statements.
Additionally, based on each Fund’s understanding of the tax rules and rates related to income, gains and transactions for the foreign jurisdictions in which it invests, each Fund will provide for foreign taxes, and where appropriate, deferred foreign taxes.
Management has analyzed the Funds’ tax positions taken on federal income tax returns as of October 31, 2021, and for all open tax years (generally, the three prior taxable years), and has concluded that no provision for federal income tax is required in the Funds’ financial statements. Additionally, Management is not aware of any tax position for which it is reasonably possible that the total amounts of unrecognized tax benefits will change materially in the next twelve months.
f. CAPITAL LOSS CARRYOVERS AND DEFERRALS
As of October 31, 2021, the following Fund had capital loss carryovers for federal income tax purposes as shown in the following chart. These amounts may be used to offset future realized capital gains indefinitely, and retain their character as short-term and/or long-term.
| | | | | | | | | | | | |
| | | Capital Loss | | | | |
| | | Carryover Amounts | | | | |
| | | |
| Fund | | Short-Term | | | Long-Term | | | Total | |
Large Cap Value Select | | | $5,890,249 | | | | $107,101 | | | | $5,997,350 | |
As of October 31, 2021, all the Funds except for Large Cap Value Select had no capital loss carryovers for federal income tax purposes. Should the Funds incur net capital losses for the fiscal year ended October 31, 2022, such amounts may be used to offset future realized capital gains indefinitely, and retain their character as either short-term and/or long-term.
79
|
Notes to Financial Statements (continued) |
For the fiscal year ended October 31, 2021, the following Funds utilized capital loss carryovers in the amount of:
| | | | | | | |
| | | Capital Loss Carryover | | |
| | | Utilized | | |
| Fund | | Short-Term | | Long-Term |
| | |
Large Cap Value Select | | $2,299,690 | | | | $14,491 | |
| | |
Small Cap Value | | 9,222,296 | | | | 304,969 | |
| | |
Dividend All Cap Value | | 5,115,331 | | | | – | |
| | |
Small-Mid Cap Value | | 9,229,185 | | | | 238,952 | |
| | |
International Value Equity | | 824,816 | | | | – | |
| | |
Focused Absolute Value | | 14,782,383 | | | | 3,813,848 | |
g. CAPITAL STOCK
The Trusts’ Declaration of Trust authorizes for each Fund the issuance of an unlimited number of shares of beneficial interest, without par value. Each Fund records sales and repurchases of its capital stock on the trade date.
For the fiscal years ended October 31, 2021 and October 31, 2020, the capital stock transactions by class for the Funds were as follows:
| | | | | | | | | | | | | | | | | | | | | | | | | | | | | | | | |
| | | Mid Cap Value | | | Large Cap Value Select | |
| | | October 31, 2021 | | | October 31, 2020 | | | October 31, 2021 | | | October 31, 2020 | |
| | | Shares | | | Amount | | | Shares | | | Amount | | | Shares | | | Amount | | | Shares | | | Amount | |
| | | | | | | | |
Class N: | | | | | | | | | | | | | | | | | | | | | | | | | | | | | | | | |
| | | | | | | | |
Proceeds from sale of shares | | | 1,000,186 | | | | $21,108,563 | | | | 1,043,587 | | | | $30,389,017 | | | | 164,567 | | | | $2,473,353 | | | | 211,610 | | | | $3,163,296 | |
| | | | | | | | |
Reinvestment of distributions | | | 9,762,503 | | | | 173,639,301 | | | | 957,529 | | | | 32,737,912 | | | | 46,486 | | | | 636,854 | | | | 36,393 | | | | 578,284 | |
| | | | | | | | |
Cost of shares repurchased | | | (4,709,879) | | | | (107,167,675) | | | | (8,108,221) | | | | (259,648,250) | | | | (255,444) | | | | (3,802,758) | | | | (786,253) | | | | (11,087,771) | |
| | | | | | | | | | | | | | | | | | | | | | | | | | | | | | | | |
| | | | | | | | |
Net increase (decrease) | | | 6,052,810 | | | | $87,580,189 | | | | (6,107,105) | | | | $(196,521,321) | | | | (44,391) | | | | $(692,551) | | | | (538,250) | | | | $(7,346,191) | |
| | | | | | | | | | | | | | | | | | | | | | | | | | | | | | | | |
| | | | | | | | |
Class I: | | | | | | | | | | | | | | | | | | | | | | | | | | | | | | | | |
| | | | | | | | |
Proceeds from sale of shares | | | 555,161 | | | | $14,772,271 | | | | 2,707,562 | | | | $88,140,400 | | | | 181,073 | | | | $2,751,837 | | | | 888,503 | | | | $13,511,204 | |
| | | | | | | | |
Reinvestment of distributions | | | 4,458,635 | | | | 86,006,601 | | | | 1,012,059 | | | | 35,604,248 | | | | 419,365 | | | | 5,783,038 | | | | 227,253 | | | | 3,620,144 | |
| | | | | | | | |
Cost of shares repurchased | | | (5,360,001) | | | | (147,242,762) | | | | (28,612,112) | | | | (989,605,334) | | | | (1,058,936) | | | | (15,875,102) | | | | (3,416,477) | | | | (47,894,255) | |
| | | | | | | | | | | | | | | | | | | | | | | | | | | | | | | | |
| | | | | | | | |
Net decrease | | | (346,205) | | | | $(46,463,890) | | | | (24,892,491) | | | | $(865,860,686) | | | | (458,498) | | | | $(7,340,227) | | | | (2,300,721) | | | | $(30,762,907) | |
| | | | | | | | | | | | | | | | | | | | | | | | | | | | | | | | |
| | | | | | | | |
Class Z: | | | | | | | | | | | | | | | | | | | | | | | | | | | | | | | | |
| | | | | | | | |
Proceeds from sale of shares | | | 442,478 | | | | $8,605,426 | | | | 91,111 | | | | $3,232,335 | | | | – | | | | – | | | | – | | | | – | |
| | | | | | | | |
Reinvestment of distributions | | | 327,778 | | | | 6,230,541 | | | | 98,338 | | | | 3,451,659 | | | | – | | | | – | | | | – | | | | – | |
| | | | | | | | |
Cost of shares repurchased | | | (691,958) | | | | (14,558,091) | | | | (1,202,505) | | | | (42,122,758) | | | | – | | | | – | | | | – | | | | – | |
| | | | | | | | | | | | | | | | | | | | | | | | | | | | | | | | |
| | | | | | | | |
Net increase (decrease) | | | 78,298 | | | | $277,876 | | | | (1,013,056) | | | | $(35,438,764) | | | | – | | | | – | | | | – | | | | – | |
| | | | | | | | | | | | | | | | | | | | | | | | | | | | | | | | |
80
|
Notes to Financial Statements (continued) |
| | | | | | | | | | | | | | | | | | | | | | | | | | | | | | | | |
| | | Mid Cap Value | | | Large Cap Value Select | |
| | | October 31, 2021 | | | October 31, 2020 | | | October 31, 2021 | | | October 31, 2020 | |
| | | Shares | | | Amount | | | Shares | | | Amount | | | Shares | | | Amount | | | Shares | | | Amount | |
| | | | | | | | |
Class N: | | | | | | | | | | | | | | | | | | | | | | | | | | | | | | | | |
| | | | | | | | |
Proceeds from sale of shares | | | 454,023 | | | | $6,674,412 | | | | 2,345,923 | | | | $27,389,252 | | | | 98,286 | | | | $1,183,126 | | | | 167,234 | | | | $1,454,138 | |
| | | | | | | | |
Reinvestment of distributions | | | – | | | | – | | | | 163,198 | | | | 2,103,624 | | | | 58,595 | | | | 717,232 | | | | 515,286 | | | | 5,884,839 | |
| | | | | | | | |
Proceeds from sale of shares issued in connection with merger1 | | | – | | | | – | | | | – | | | | – | | | | – | | | | – | | | | 170,747 | | | | 1,522,394 | |
| | | | | | | | |
Cost of shares repurchased | | | (647,219) | | | | (9,299,010) | | | | (2,405,007) | | | | (24,167,828) | | | | (1,016,227) | | | | (12,362,195) | | | | (3,193,510) | | | | (34,235,056) | |
| | | | | | | | |
| | | | | | | | | | | | | | | | | | | | | | | | | | | | | | | | |
| | | | | | | | |
Net increase (decrease) | | | (193,196) | | | | $(2,624,598) | | | | 104,114 | | | | $5,325,048 | | | | (859,346) | | | | $(10,461,837) | | | | (2,340,243) | | | | $(25,373,685) | |
| | | | | | | | |
| | | | | | | | | | | | | | | | | | | | | | | | | | | | | | | | |
| | | | | | | | |
Class I: | | | | | | | | | | | | | | | | | | | | | | | | | | | | | | | | |
| | | | | | | | |
Proceeds from sale of shares | | | 18,321,840 | | | | $268,489,956 | | | | 27,142,324 | | | | $284,598,207 | | | | 3,534,890 | | | | $43,183,255 | | | | 9,321,078 | | | | $97,770,769 | |
| | | | | | | | |
Reinvestment of distributions | | | 1,899 | | | | 25,529 | | | | 1,701,697 | | | | 22,479,421 | | | | 683,668 | | | | 8,379,202 | | | | 4,140,352 | | | | 46,751,171 | |
| | | | | | | | |
Proceeds from sale of shares issued in connection with merger1 | | | – | | | | – | | | | – | | | | – | | | | – | | | | – | | | | 3,839,907 | | | | 34,205,889 | |
| | | | | | | | |
Cost of shares repurchased | | | (9,949,460) | | | | (147,247,886) | | | | (12,851,781) | | | | (137,875,911) | | | | (16,246,669) | | | | (205,721,380) | | | | (19,682,512) | | | | (200,460,605) | |
| | | | | | | | |
| | | | | | | | | | | | | | | | | | | | | | | | | | | | | | | | |
| | | | | | | | |
Net increase (decrease) | | | 8,374,279 | | | | $121,267,599 | | | | 15,992,240 | | | | $169,201,717 | | | | (12,028,111) | | | | $(154,158,923) | | | | (2,381,175) | | | | $(21,732,776) | |
| | | | | | | | |
| | | | | | | | | | | | | | | | | | | | | | | | | | | | | | | | |
| | | | | | | | |
Class Z: | | | | | | | | | | | | | | | | | | | | | | | | | | | | | | | | |
| | | | | | | | |
Proceeds from sale of shares | | | 427,783 | | | | $6,713,310 | | | | 92,949 | | | | $1,010,670 | | | | 10,627 | | | | $130,295 | | | | 164,880 | | | | $1,673,944 | |
| | | | | | | | |
Reinvestment of distributions | | | 61 | | | | 824 | | | | 868 | | | | 11,458 | | | | 3,663 | | | | 45,064 | | | | 2,015 | | | | 20,857 | |
| | | | | | | | |
Proceeds from sale of shares issued in connection with merger1 | | | – | | | | – | | | | – | | | | – | | | | – | | | | – | | | | 20,040 | | | | 178,535 | |
| | | | | | | | |
Cost of shares repurchased | | | (23,740) | | | | (358,806) | | | | (15,034) | | | | (152,618) | | | | (21,172) | | | | (273,306) | | | | (2,133) | | | | (22,437) | |
| | | | | | | | |
| | | | | | | | | | | | | | | | | | | | | | | | | | | | | | | | |
| | | | | | | | |
Net increase (decrease) | | | 404,104 | | | | $6,355,328 | | | | 78,783 | | | | $869,510 | | | | (6,882) | | | | $(97,947) | | | | 184,802 | | | | $1,850,899 | |
| | | | | | | | | | | | | | | | | | | | | | | | | | | | | | | | |
| | | | | | | | | | | | | | | | | | | | | | | | | | | | | | | | |
| | | Small-Mid Cap Value | | | International Value Equity | |
| | | October 31, 2021 | | | October 31, 2020 | | | October 31, 2021 | | | October 31, 2020 | |
| | | Shares | | | Amount | | | Shares | | | Amount | | | Shares | | | Amount | | | Shares | | | Amount | |
| | | | | | | | |
Class N: | | | | | | | | | | | | | | | | | | | | | | | | | | | | | | | | |
| | | | | | | | |
Proceeds from sale of shares | | | 462,130 | | | | $4,299,141 | | | | 2,175,588 | | | | $15,236,384 | | | | 16,199 | | | | $193,637 | | | | 46,000 | | | | $591,651 | |
| | | | | | | | |
Reinvestment of distributions | | | – | | | | – | | | | 62,404 | | | | 505,470 | | | | 53,951 | | | | 525,479 | | | | 19,409 | | | | 242,803 | |
| | | | | | | | |
Cost of shares repurchased | | | (1,326,562) | | | | (11,825,814) | | | | (2,205,618) | | | | (14,105,367) | | | | (45,025) | | | | (546,815) | | | | (129,701) | | | | (1,542,866) | |
| | | | | | | | |
| | | | | | | | | | | | | | | | | | | | | | | | | | | | | | | | |
| | | | | | | | |
Net increase (decrease) | | | (864,432) | | | | $(7,526,673) | | | | 32,374 | | | | $1,636,487 | | | | 25,125 | | | | $172,301 | | | | (64,292) | | | | $(708,412) | |
| | | | | | | | |
| | | | | | | | | | | | | | | | | | | | | | | | | | | | | | | | |
| | | | | | | | |
Class I: | | | | | | | | | | | | | | | | | | | | | | | | | | | | | | | | |
| | | | | | | | |
Proceeds from sale of shares | | | 6,623,387 | | | | $63,170,204 | | | | 12,348,904 | | | | $87,077,448 | | | | 90,642 | | | | $1,154,827 | | | | 288,767 | | | | $3,451,566 | |
| | | | | | | | |
Reinvestment of distributions | | | 455 | | | | 3,854 | | | | 335,635 | | | | 2,785,767 | | | | 233,034 | | | | 2,351,316 | | | | 140,762 | | | | 1,796,123 | |
| | | | | | | | |
Cost of shares repurchased | | | (7,353,482) | | | | (71,259,285) | | | | (8,407,421) | | | | (56,413,434) | | | | (808,059) | | | | (11,285,954) | | | | (943,700) | | | | (11,249,964) | |
| | | | | | | | |
| | | | | | | | | | | | | | | | | | | | | | | | | | | | | | | | |
| | | | | | | | |
Net increase (decrease) | | | (729,640) | | | | $(8,085,227) | | | | 4,277,118 | | | | $33,449,781 | | | | (484,383) | | | | $(7,779,811) | | | | (514,171) | | | | $(6,002,275) | |
| | | | | | | | | | | | | | | | | | | | | | | | | | | | | | | | |
| | | | | | | | | | | | | | | | | | | | | | | | | | | | | | | | |
81
|
Notes to Financial Statements (continued) |
| | | | | | | | | | | | | | | | | | | | | | | | | | | | | | | | |
| | | Small-Mid Cap Value | | | International Value Equity | |
| | | October 31, 2021 | | | October 31, 2020 | | | October 31, 2021 | | | October 31, 2020 | |
| | | Shares | | | Amount | | | Shares | | | Amount | | | Shares | | | Amount | | | Shares | | | Amount | |
| | | | | | | | |
Class Z: | | | | | | | | | | | | | | | | | | | | | | | | | | | | | | | | |
| | | | | | | | |
Proceeds from sale of shares | | | 3,492,412 | | | | $35,894,795 | | | | 62,039 | | | | $414,123 | | | | 13,162 | | | | $137,741 | | | | 50,123 | | | | $591,769 | |
| | | | | | | | |
Reinvestment of distributions | | | 37 | | | | 318 | | | | 460 | | | | 3,815 | | | | 14,400 | | | | 146,170 | | | | 532 | | | | 6,804 | |
| | | | | | | | |
Cost of shares repurchased | | | (31,459) | | | | (292,865) | | | | (6,100) | | | | (32,854) | | | | (28,403) | | | | (391,224) | | | | (484) | | | | (5,741) | |
| | | | | | | | | | | | | | | | | | | | | | | | | | | | | | | | |
| | | | | | | | |
Net increase (decrease) | | | 3,460,990 | | | | $35,602,248 | | | | 56,399 | | | | $385,084 | | | | (841) | | | | $(107,313) | | | | 50,171 | | | | $592,832 | |
| | | | | | | | | | | | | | | | | | | | | | | | | | | | | | | | |
| | | | | | | | | | | | | | | | |
| | | Focused Absolute Value | |
| | | October 31, 2021 | | | October 31, 2020 | |
| | | Shares | | | Amount | | | Shares | | | Amount | |
| | | | |
Class N: | | | | | | | | | | | | | | | | |
| | | | |
Proceeds from sale of shares | | | 30,865 | | | | $396,447 | | | | 605,991 | | | | $7,457,266 | |
| | | | |
Reinvestment of distributions | | | – | | | | – | | | | 28,703 | | | | 376,872 | |
| | | | |
Cost of shares repurchased | | | (905,026) | | | | (11,851,733) | | | | (714,432) | | | | (7,662,321) | |
| | | | | | | | | | | | | | | | |
| | | | |
Net increase (decrease) | | | (874,161) | | | | $(11,455,286) | | | | (79,738) | | | | $171,817 | |
| | | | | | | | | | | | | | | | |
| | | | |
Class I: | | | | | | | | | | | | | | | | |
| | | | |
Proceeds from sale of shares | | | 3,567,469 | | | | $47,793,216 | | | | 6,335,337 | | | | $71,527,063 | |
| | | | |
Reinvestment of distributions | | | 69,096 | | | | 901,014 | | | | 223,054 | | | | 2,939,854 | |
| | | | |
Cost of shares repurchased | | | (3,210,925) | | | | (45,922,762) | | | | (5,088,985) | | | | (53,279,690) | |
| | | | | | | | | | | | | | | | |
| | | | |
Net increase | | | 425,640 | | | | $2,771,468 | | | | 1,469,406 | | | | $21,187,227 | |
| | | | | | | | | | | | | | | | |
| | | | |
Class Z: | | | | | | | | | | | | | | | | |
| | | | |
Proceeds from sale of shares | | | 768,873 | | | | $11,515,688 | | | | 222,551 | | | | $2,353,952 | |
| | | | |
Reinvestment of distributions | | | 1,382 | | | | 18,026 | | | | 252 | | | | 3,319 | |
| | | | |
Cost of shares repurchased | | | (71,919) | | | | (1,060,407) | | | | (13,810) | | | | (140,300) | |
| | | | | | | | | | | | | | | | |
| | | | |
Net increase | | | 698,336 | | | | $10,473,307 | | | | 208,993 | | | | $2,216,971 | |
| | | | | | | | | | | | | | | | |
| 1 | See Note 13 of the Notes to Financial Statements. |
At October 31, 2021, certain affiliated and unaffiliated shareholders of record, including individually or collectively, held greater than 10% of the net assets of the Funds as follows: International Value Equity - one owns 48%. Transactions by this shareholder may have a material impact on the Fund.
h. REPURCHASE AGREEMENTS AND JOINT REPURCHASE AGREEMENTS
The Funds may enter into third-party repurchase agreements for temporary cash management purposes and third-party or bilateral joint repurchase agreements for reinvestment of cash collateral on securities lending transactions under the securities lending program offered by The Bank of New York Mellon (“BNYM”) (the “Program”) (collectively, “Repurchase Agreements”). The value of the underlying collateral, including accrued interest, must equal or exceed the value of the Repurchase Agreements during the term of the agreement. For joint repurchase
agreements, the Funds participate on a pro rata basis with other clients of BNYM in its share of the underlying collateral under such joint repurchase agreements and in its share of proceeds from any repurchase or other disposition of the underlying collateral. The underlying collateral for all Repurchase Agreements is held in safekeeping by the Funds’ custodian or at the Federal Reserve Bank. If the seller defaults and the value of the collateral declines, or if bankruptcy proceedings commence with respect to the seller of the security, realization of the collateral by the Funds may be delayed or limited. Pursuant to the Program, the Funds are indemnified for such losses by BNYM on joint repurchase agreements.
At October 31, 2021, the market value of Repurchase Agreements outstanding is as follows:
82
|
Notes to Financial Statements (continued) |
| | | | |
| | | Market Value | |
| |
Small Cap Value | | | $16,595,812 | |
| |
Small-Mid Cap Value | | | 3,222,309 | |
i. FOREIGN CURRENCY TRANSLATION
The books and records of the Funds are maintained in U.S. dollars. The value of investments, assets and liabilities denominated in currencies other than U.S. dollars are translated into U.S. dollars based upon current foreign exchange rates. Purchases and sales of foreign investments, income and expenses are converted into U.S. dollars based on currency exchange rates prevailing on the respective dates of such transactions. Net realized and unrealized gain (loss) on foreign currency transactions represent: (1) foreign exchange gains and losses from the sale and holdings of foreign currencies; (2) gains and losses between trade date and settlement date on investment securities transactions and foreign currency exchange contracts; and (3) gains and losses from the difference between amounts of interest and dividends recorded and the amounts actually received.
The Funds do not isolate the net realized and unrealized gain or loss resulting from changes in exchange rates from the fluctuations in market prices of securities held. Such fluctuations are included with the net realized and unrealized gain or loss on investments.
2. AGREEMENTS AND TRANSACTIONS WITH AFFILIATES
For each of the Funds, the Trusts have entered into an investment advisory agreement under which the Investment Manager, a subsidiary and the U.S. retail distribution arm of Affiliated Managers Group, Inc. (“AMG”), serves as investment manager to the Funds and is responsible for the Funds’ overall administration and operations. The Investment Manager selects one or more subadvisors for the Funds (subject to Board approval) and monitors each subadvisor’s investment performance, security holdings and investment strategies. Each Fund’s investment portfolio is managed by River Road. AMG indirectly owns a majority interest in River Road. Prior to March 19, 2021, the investment portfolios of Mid Cap Value was managed by Fairpointe Capital and prior to March 22, 2021, Large Cap Value Select was managed by First Quadrant.
Investment management fees are paid directly by the Funds to the Investment Manager based on average daily net assets. For the fiscal year ended October 31, 2021, the Funds’ investment management fees were paid at the following annual rate of each Fund’s respective average daily net assets:
| | | | | |
Mid Cap Value | | | | 0.56%1 | |
| |
Large Cap Value Select | | | | 0.35% | |
| |
Small Cap Value | | | | 0.80% | |
| |
Dividend All Cap Value | | | | 0.60% | |
| |
Small-Mid Cap Value | | | | 0.75% | |
| |
International Value Equity | | | | 0.53%2 | |
| |
Focused Absolute Value | | | | 0.60% | |
| 1 | Prior to June 14, 2021, the fee was 0.70% on the first $100 million, 0.65% on next $300 million, 0.60% in excess of $400 million. |
| 2 | Prior to August 16, 2021, the annual rate was 0.85%. |
The Investment Manager has contractually agreed, through at least March 1, 2023 for Mid Cap Value, Large Cap Value Select, and International Value Equity, and through at least March 1, 2022 for Dividend All Cap Value, Small-Mid Cap Value, and Focused Absolute Value to waive management fees and/or reimburse fund expenses in order to limit total annual Fund operating expenses after fee waiver and expense reimbursements (exclusive of taxes, interest (including interest incurred in connection with bank and custody overdrafts and in connection with securities sold short), shareholder servicing fees, distribution and service 12b-1 fees, brokerage commissions and other transaction costs, dividends payable with respect to securities sold short, acquired fund fees and expenses and extraordinary expenses). The percentages of the Funds’ average daily net assets subject to later reimbursement by the Funds in certain circumstances are as follows:
| | | | |
Mid Cap Value | | | 0.76%1 | |
| |
Large Cap Value Select | | | 0.60%2 | |
| |
Small Cap Value | | | N/A | |
| |
Dividend All Cap Value | | | 0.78%3 | |
| |
Small-Mid Cap Value | | | 1.04% | |
| |
International Value Equity | | | 0.73%4 | |
| |
Focused Absolute Value | | | 0.78% | |
| 1 | Prior to June 14, 2021, the limitation was 0.82%. |
| 2 | Prior to June 11, 2021, the limitation was 0.69%. |
| 3 | Prior to January 1, 2021, the limitation was 0.99%. |
| 4 | Prior to August 16, 2021, the limitation was 1.12%. |
In general, for a period of up to 36 months after the date any amounts are paid, waived or reimbursed by the Investment Manager, the Investment Manager may recover such amounts from a Fund, provided that such repayment would not cause the Fund’s total annual operating expenses after fee waiver and expense reimbursements (exclusive of the items noted in the parenthetical above) to exceed either (i) the Expense Cap in effect at the time such amounts were paid, waived or reimbursed, or (ii) the Expense Cap in effect at the time of such repayment by the Fund.
The contractual expense limitation may only be terminated in the event the Investment Manager or a successor ceases to be the investment manager of the Fund or a successor fund, by mutual agreement between the Investment Manager and the Board, or in the event of the Fund’s liquidation unless the Fund is reorganized or is a party to a merger in which the surviving entity is successor to the accounting and performance information of the Fund.
At October 31, 2021, each Fund’s expiration of recoupment are as follows:
| | | | | | | | | | | | |
Expiration Period | | Mid Cap Value | | | Large Cap Value Select | | | Dividend All Cap Value | |
| | | |
Less than 1 year | | | – | | | | $34,444 | | | | – | |
| | | |
1-2 years | | | $176,021 | | | | 24,885 | | | | – | |
| | | |
2-3 years | | | 219,148 | | | | 58,404 | | | | $97,897 | |
| | | | | | | | | | | | |
| | | |
Total | | | $395,169 | | | | $117,733 | | | | $97,897 | |
| | | | | | | | | | | | |
83
|
Notes to Financial Statements (continued) |
| | | | | | | | |
| | |
Expiration Period | | International Value Equity | | | Focused Absolute Value | |
| | |
Less than 1 year | | | $105,218 | | | | $166,409 | |
| | |
1-2 years | | | 84,419 | | | | 176,679 | |
| | |
2-3 years | | | 79,873 | | | | 98,605 | |
| | | | | | | | |
| | |
Total | | | $269,510 | | | | $441,693 | |
| | | | | | | | |
The Trusts, on behalf of the Funds, have entered into an amended and restated Administration Agreement under which the Investment Manager serves as the Funds’ administrator (the “Administrator”) and is responsible for all non-portfolio management aspects of managing the Funds’ operations, including administration and shareholder services to each Fund. Each Fund pays a fee to the Administrator at the rate of 0.15% per annum of the Fund’s average daily net assets for this service.
The Funds are distributed by AMG Distributors, Inc. (the “Distributor”), a wholly-owned subsidiary of the Investment Manager. The Distributor serves as the distributor and underwriter for each Fund and is a registered broker-dealer and member of the Financial Industry Regulatory Authority, Inc. (“FINRA”). Shares of each Fund will be continuously offered and will be sold directly to prospective purchasers and through brokers, dealers or other financial intermediaries who have executed selling agreements with the Distributor. Generally the Distributor bears all or a portion of the expenses of providing services pursuant to the distribution agreement, including the payment of the expenses relating to the distribution of prospectuses for sales purposes and any advertising or sales literature.
The Trusts have adopted a distribution and service plan (the “Plan”) with respect to the Class N shares, of each Fund in accordance with the requirements of Rule 12b-1 under the 1940 Act and the requirements of the applicable rules of FINRA regarding asset based sales charges. Pursuant to the Plan, each Fund may make payments to the Distributor for its expenditures in financing any activity primarily intended to result in the sale of each Fund’s Class N shares and for maintenance and personal service provided to existing shareholders of that class. The Plan authorizes payments to the Distributor of up to 0.25% annually of each Fund’s average daily net assets attributable to the Class N shares. For all Funds, except Large Cap Value Select, the Plan is characterized as a reimbursement plan and is directly tied to expenses incurred by the Distributor; the payments the Distributor receives during any year may not exceed its actual expenses.
The impact on the annualized expense ratios for the fiscal year ended October 31, 2021, were as follows:
| | | | |
| |
| Fund | | Actual Amount Incurred | |
| |
Mid Cap Value | | | | |
| |
Class N | | | 0.24% | |
| |
Large Cap Value Select | | | | |
| |
Class N | | | 0.25% | |
| |
Small Cap Value | | | | |
| |
Class N | | | 0.25% | |
| |
Dividend All Cap Value | | | | |
| |
Class N | | | 0.25% | |
| | | | |
| Fund | | Actual Amount Incurred | |
| |
Small-Mid Cap Value | | | | |
| |
Class N | | | 0.24% | |
| |
International Value Equity | | | | |
| |
Class N | | | 0.25% | |
| |
Focused Absolute Value | | | | |
| |
Class N | | | 0.25% | |
For each of the Class N shares and Class I shares, the Board has approved reimbursement payments to the Investment Manager for shareholder servicing expenses (“shareholder servicing fees”) incurred. Shareholder servicing fees include payments to financial intermediaries, such as broker-dealers (including fund supermarket platforms), banks, and trust companies who provide shareholder recordkeeping, account servicing and other services. The Class N and Class I shares may reimburse the Investment Manager for the actual amount incurred up to a maximum annual rate of each Class’s average daily net assets as shown in the table below.
The Investment Manager has agreed, through at least October 1, 2021, to waive a portion of shareholder servicing fees paid by the various share classes of each Fund, except for Large Cap Value Select, as necessary, to ensure the total net expense ratio for each share class of each Fund does not increase due to the changes in the methodology of shareholder servicing reimbursements described above. Effective January 1, 2021, the shareholder servicing fees waiver of Dividend All Cap Value was eliminated. The impact on the annualized expense ratios for the fiscal year ended October 31, 2021, were as follows:
| | | | | | | | |
| | | Maximum Annual | | | Actual | |
| | | Amount | | | Amount | |
| Fund | | Approved | | | Incurred | |
| | |
Mid Cap Value | | | | | | | | |
| | |
Class N1 | | | 0.10% | | | | 0.09% | |
| | |
Class I1 | | | 0.05% | | | | 0.07% | |
| | |
Large Cap Value Select | | | | | | | | |
| | |
Class N | | | 0.10% | | | | 0.10% | |
| | |
Class I2 | | | 0.05% | | | | 0.04% | |
| | |
Small Cap Value | | | | | | | | |
| | |
Class N | | | 0.15% | | | | 0.10% | |
| | |
Class I | | | 0.15% | | | | 0.09% | |
| | |
Dividend All Cap Value | | | | | | | | |
| | |
Class N3 | | | 0.04% | | | | 0.04% | |
| | |
Class I3 | | | 0.04% | | | | 0.04% | |
| | |
Small-Mid Cap Value | | | | | | | | |
| | |
Class N | | | 0.15% | | | | 0.06% | |
| | |
Class I | | | 0.15% | | | | 0.05% | |
84
|
Notes to Financial Statements (continued) |
| | | | | | | | |
| | | Maximum Annual | | | Actual | |
| | | Amount | | | Amount | |
| Fund | | Approved | | | Incurred | |
| | |
International Value Equity | | | | | | | | |
| | |
Class N4 | | | 0.05% | | | | 0.07% | |
| | |
Class I4 | | | 0.05% | | | | 0.08% | |
| | |
Focused Absolute Value | | | | | | | | |
| | |
Class N | | | 0.15% | | | | 0.04% | |
| | |
Class I | | | 0.15% | | | | 0.04% | |
| 1 | Prior to June 14, 2021, the maximum annual amount approved was 0.15%. |
| 2 | Prior to June 11, 2021, the maximum annual amount approved was 0.10%. |
| 3 | Prior to January 1, 2021, the maximum annual amount approved was 0.15%. |
| 4 | Prior to August 16, 2021, the maximum annual amount approved was 0.15%. |
The Board provides supervision of the affairs of the Trusts and other trusts within the AMG Funds Family. The Trustees of the Trusts who are not affiliated with the Investment Manager receive an annual retainer and per meeting fees for regular, special and telephonic meetings, and they are reimbursed for out-of-pocket expenses incurred while carrying out their duties as Board members. The Chairman of the Board and the Audit Committee Chair receive additional annual retainers. Certain Trustees and Officers of the Funds are Officers and/or Directors of the Investment Manager, AMG and/or the Distributor.
The Securities and Exchange Commission (the “SEC”) granted an exemptive order that permits certain eligible funds in the AMG Funds Family to lend and borrow money for certain temporary purposes directly to and from other eligible funds in the AMG Funds Family. Participation in this interfund lending program is voluntary for both the borrowing and lending funds, and an interfund loan is only made if it benefits each participating fund. The Administrator manages the program according to procedures approved by the Board, and the Board monitors the operation of the program. An interfund loan must comply with certain conditions set out in the exemptive order, which are designed to assure fairness and protect all participating funds. The interest earned and interest paid on interfund loans are included on the Statement of Operations as interest income and interest expense, respectively. Large Cap Value Select participated as a lender and borrower for the year ended October 31, 2021. Focused Absolute Value and International Value Equity participated as lenders for the year ended October 31, 2021. Mid Cap Value commenced participating in the interfund lending program as a lender and borrower on July 2, 2021, while International Value Equity commenced participating in the interfund lending program as a borrower on August 16, 2021. At October 31, 2021, the Funds had no interfund loans outstanding.
The following Funds utilized the interfund loan program during the fiscal year ended October 31, 2021 as follows:
| | | | | | | | | | | | | | | | |
| | | Average | | | Number | | | Interest | | | Average | |
| Fund | | Lent | | | of Days | | | Earned | | | Interest Rate | |
| | | | |
Large Cap Value Select | | | $1,455,560 | | | | 1 | | | | $38 | | | | 0.958% | |
| | | | |
Focused Absolute Value | | | 1,881,100 | | | | 4 | | | | 202 | | | | 0.980% | |
| | | | | | | | | | | | | | | | |
| | | Average | | | Number | | | Interest | | | Average | |
| Fund | | Borrowed | | | of Days | | | Paid | | | Interest Rate | |
| | | | |
Mid Cap Value | | | $2,777,528 | | | | 7 | | | | $502 | | | | 0.943% | |
| | | | | | | | | | | | | | | | |
| | | Average | | | Number | | | Interest | | | Average | |
| Fund | | Borrowed | | | of Days | | | Paid | | | Interest Rate | |
| | | | |
International Value Equity | | | $1,570,347 | | | | 1 | | | | $41 | | | | 0.950% | |
3. PURCHASES AND SALES OF SECURITIES
Purchases and sales of securities (excluding short-term securities and U.S. Government Obligations) for the fiscal year ended October 31, 2021, were as follows:
| | | | | | | | |
| | | Long Term Securities | |
| Fund | | Purchases | | | Sales | |
| | |
Mid Cap Value | | | $648,993,502 | | | | $838,380,536 | |
| | |
Large Cap Value Select | | | 109,261,376 | | | | 76,479,845 | |
| | |
Small Cap Value | | | 359,353,242 | | | | 274,411,834 | |
| | |
Dividend All Cap Value | | | 89,513,566 | | | | 249,060,085 | |
| | |
Small-Mid Cap Value | | | 118,106,904 | | | | 103,834,028 | |
| | |
International Value Equity | | | 31,604,267 | | | | 37,070,518 | |
| | |
Focused Absolute Value | | | 159,049,348 | | | | 156,504,660 | |
The Funds had no purchases or sales of U.S. Government Obligations during the fiscal year ended October 31, 2021.
4. PORTFOLIO SECURITIES LOANED
The Funds participate in the Program providing for the lending of securities to qualified borrowers. Securities lending income includes earnings of such temporary cash investments, plus or minus any rebate to a borrower. These earnings (after any rebate) are then divided between BNYM, as a fee for its services under the Program, and the Funds, according to agreed-upon rates. Collateral on all securities loaned is accepted in cash, U.S. Treasury Obligations or U.S. Government Agency Obligations. Collateral is maintained at a minimum level of 102% (105% in the case of certain foreign securities) of the market value, plus interest, if applicable, of investments on loan. It is the Funds’ policy to obtain additional collateral from or return excess collateral to the borrower by the end of the next business day, following the valuation date of the securities loaned. Therefore, the value of the collateral held may be temporarily less than the value of the securities on loan. Lending securities entails a risk of loss to the Funds if and to the extent that the market value of the securities loaned were to increase and the borrower did not increase the collateral accordingly, and the borrower fails to return the securities. Under the terms of the Program, the Funds are indemnified for such losses by BNYM. Cash collateral is held in separate omnibus accounts managed by BNYM, who is authorized to exclusively enter into joint repurchase agreements for that cash collateral, and securities collateral is held in separate omnibus accounts managed by BNYM and cannot be sold or pledged. BNYM bears the risk of any deficiency in the amount of the cash collateral available for return to the borrower due to any loss on the collateral invested. Loans of securities are terminable at any time and the borrower, after notice, is required to return borrowed securities as soon as practical, which is normally within three business days.
The value of securities loaned on positions held, cash collateral and securities collateral received at October 31, 2021, were as follows:
85
|
Notes to Financial Statements (continued) |
| | | | | | | | | | | | | | | | |
| | | | | | Cash | | | Securities | | | Total | |
| | | Securities | | | Collateral | | | Collateral | | | Collateral | |
| Fund | | Loaned | | | Received | | | Received | | | Received | |
| | | | |
Small Cap Value | | | $34,877,877 | | | | $16,595,812 | | | | $19,582,136 | | | | $36,177,948 | |
| | | | |
Dividend All Cap Value | | | 3,881,516 | | | | – | | | | 4,025,084 | | | | 4,025,084 | |
| | | | |
Small-Mid Cap Value | | | 11,915,505 | | | | 3,222,309 | | | | 9,033,667 | | | | 12,255,976 | |
The following table summarizes the securities received as collateral for securities lending at October 31, 2021:
| | | | | | |
| | | Collateral | | Coupon | | Maturity |
| Fund | | Type | | Range | | Date Range |
| | | |
Small Cap Value | | U.S.
Treasury
Obligations | | 0.000%-6.875% | | 11/15/21-11/15/50 |
| | | |
Dividend All Cap Value | | U.S.
Treasury
Obligations | | 0.000%-4.375% | | 01/27/22-11/15/50 |
| | | |
Small-Mid Cap Value | | U.S.
Treasury
Obligations | | 0.000%-6.875% | | 11/15/21-11/15/50 |
5. FOREIGN SECURITIES
Certain Funds invest in securities of foreign entities and in instruments denominated in foreign currencies which involve risks not typically associated with investments in domestic securities. Non-domestic securities carry special risks, such as exposure to currency fluctuations, less developed or less efficient trading markets, political instability, a lack of company information, differing auditing and legal standards, and, potentially, less liquidity. Realized gains in certain countries may be subject to foreign taxes at the Fund level and would pay such foreign taxes at the appropriate rate for each jurisdiction.
6. COMMITMENTS AND CONTINGENCIES
Under the Trusts’ organizational documents, its trustees and officers are indemnified against certain liabilities arising out of the performance of their duties to the Trusts. In addition, in the normal course of business, the Funds may enter into contracts and agreements that contain a variety of representations and warranties, which provide general indemnifications. The maximum exposure to the Funds under these arrangements is unknown, as this would involve future claims that may be made against a Fund that have not yet occurred. However, based on experience, the Funds had no prior claims or losses and expect the risks of loss to be remote.
7. DERIVATIVE INSTRUMENTS
The following disclosures contain information on how and why certain Funds use derivative instruments, the credit risk and how derivative instruments affect the Funds’ financial position, and results of operations. The location and fair value amounts of these instruments on the Statement of Assets and Liabilities, and the realized gains and losses and changes in unrealized appreciation and depreciation on the Statement of Operations, each categorized by type of derivative contract, are included in a table at the end of the applicable Fund’s Schedule of Portfolio Investments. From March 23, 2021 to March 29, 2021, for Mid Cap Value, the transition managers used futures contracts to realign the Fund’s portfolio.
For the fiscal year ended October 31, 2021, the average of derivative financial instruments outstanding were as follows:
| | | | | | | | |
| | | Mid Cap Value | | | Large Cap Value Select | |
| | |
Financial Futures Contracts | | | | | | | | |
| | |
Average daily number of contracts purchased | | | 2 | | | | – | |
| | |
Average daily notional value of contracts purchased | | | $386,873 | | | | – | |
| | |
Swap Agreements | | | | | | | | |
Long Position: | | | | | | | | |
| | |
Average quarterly notional value | | | – | | | | $26,446,062 | |
| | |
Short Position: | | | | | | | | |
| | |
Average quarterly notional value | | | – | | | | 17,392,090 | |
8. FUTURES CONTRACTS
During the transition of the portfolio for Mid Cap Value, the transition manager purchased futures contracts to achieve desired levels of investment. There are certain risks associated with futures contracts. Prices may not move as expected or the Fund may not be able to close out the contract when it desires to do so, resulting in losses.
On entering into a futures contract, either cash or securities in an amount equal to a certain percentage of the contract value (initial margin) must be deposited with the futures broker. Subsequent payments (variation margin) are made or received each day.
Variation margin on futures contracts is recorded as unrealized appreciation or depreciation until the futures contract is closed or expired. The Funds recognize a realized gain or loss when the contract is closed or expires equal to the difference between the value of the contract at the time it was opened and the value at the time it was closed. Fluctuations in the value of the contracts are recorded in the Statement of Assets and Liabilities as Receivable for variation margin or Payable for variation margin, and in the Statement of Operations as Net change in unrealized appreciation (depreciation) on futures contracts until the contracts are closed, when they are recorded as Net realized gain or loss on futures contracts.
At October 31, 2021, there were no open futures contracts.
9. SWAPS
The prior subadviser of Large Cap Value Select entered into Equity Basket Swaps to obtain exposure to a portfolio of long and short securities. Under the terms of the agreement, the equity return basket swap is designed to function as a fund of direct investments in long and short equity positions. The Fund will receive all of the economic benefits and risks equivalent to direct investments in these positions such as: capital appreciation or depreciation, corporate actions, and dividends and interest received and paid, all of which are reflected in the swap value. The swap value also includes interest charges and credits (“financing fees”) related to the notional values of the long and short positions and cash balances within the swap. This financing is based on defined market rates or a specified benchmark rate, plus or minus a specified spread. Underlying positions constituting the Equity Basket Swap are reset periodically. On reset date, any unrealized gains (losses) on positions and accrued financing costs become
86
|
Notes to Financial Statements (continued) |
available for cash settlement between the Fund and the swap counterparty. Cash settlement in and out of the swap may occur at a reset date, close-out date or at maturity.
A change in the market value of an Equity Basket Swap, unpaid dividend income and/or expense and financing are recognized as net change in unrealized appreciation or depreciation on swaps in the Statement of Operations. Payments received or paid, on resets, close-outs or maturities, are recorded in the Statement of Operations as realized gains or losses of swaps.
Swaps and Equity Basket Swaps are two-party contracts that may be subject to contractual restrictions on transferability and termination, and because they may have terms of greater than seven days, swap agreements may be considered to be illiquid. If a swap is not liquid, it may not be possible to initiate a transaction or liquidate a position at an advantageous time or price, which may result in significant losses. Moreover, the Fund bears the risk of loss of the amount expected to be received under a swap agreement in the event of the default or bankruptcy of a swap agreement counterparty. The Fund will enter into swap agreements only with counterparties that meet certain standards of creditworthiness. When a counterparty’s obligations are not fully secured by collateral, then the Fund is essentially an unsecured creditor of the counterparty. If the counterparty defaults, the Fund will have contractual remedies, but there is no assurance that a counterparty will be able to meet its obligations pursuant to such contracts or that, in the event of default, the Fund will succeed in enforcing contractual remedies. Counterparty risk still exists even if a counterparty’s obligations are secured by collateral because the Fund’s interest in collateral may not be perfected or additional collateral may not be promptly posted as required. Counterparty risk also may be more pronounced if a counterparty’s obligations exceed the amount of collateral held by the Fund, if any, the Fund is unable to exercise its interest in collateral upon default by the counterparty, or the termination value of the instrument varies significantly from the marked-to-market value of the instrument. Investments in short Equity Basket Swaps subject the Fund to an unlimited risk of loss.
At October 31, 2021, there were no open swap positions.
10. SECURITIES SOLD SHORT
The prior subadviser of International Value Equity utilized short sales as part of its overall portfolio management strategy. A short sale involves the sale of a security that is borrowed from a broker or other financial institution. A gain, limited to the price at which the Fund sold the security short, or a loss, unlimited in size, will be recognized upon closing a short sale. Short sales expose the Fund to the risk that it will be required to acquire, convert or exchange securities to replace the borrowed securities at a time when the securities sold short have appreciated in value, thus resulting in a loss to the Fund. The Fund must segregate liquid assets, or otherwise cover its position in a permissible manner. The Investment Manager determines the liquidity of assets, in accordance with procedures established by the Board. The Fund has entered into a Master Securities Loan Agreement (“MSLA”) with BNYM pursuant to which the Fund borrows securities from BNYM to facilitate short sale transactions. The Fund is required to pledge collateral, in cash and/or securities, to collateralize the Fund’s obligations to BNYM in respect of borrowed securities. The MSLA provides the right, in the event of default (including bankruptcy or insolvency) for the non-defaulting party to liquidate the collateral and calculate net exposure to the defaulting party. The Fund is subject to credit risk should BNYM be unable to meet its obligations to the Fund, including the obligation to return cash collateral to the Fund. For financial reporting purposes, the Fund does not offset financial assets and financial liabilities that are subject to
the MSLA in the Statement of Assets and Liabilities, and security positions segregated as collateral for short sales were included in investments at value in the Statement of Assets and Liabilities. As of October 31, 2021, International Value Equity had no securities sold short. In accordance with the terms of its MSLA, the Fund may receive rebate income or be charged a fee on the market value on the collateral of loaned securities. The income received or fee paid is calculated based upon a variable rate minus a spread. The Fund will recognize interest income if the variable rate is greater than the spread or interest expense if the variable rate is less than the spread. For the year ended October 31, 2021, International Value Equity had interest expense and dividend expense in the amount of $17,282 and $97,569, respectively.
11. CREDIT AGREEMENT
Effective July 6, 2010, and amended and restated on July 22, 2020, AMG Funds IV entered into a Credit Agreement with BNYM (the “Credit Agreement”) which provides the funds in AMG Funds IV, including the Funds except Large Cap Value Select, with a revolving line of credit of up to $50 million. The Credit Agreement expires in 365 days and can be renewed at the mutual agreement of AMG Funds IV and BNYM. The facility is shared by each fund of AMG Funds IV, and is available for temporary, emergency purposes including liquidity needs in meeting redemptions. The interest rate on outstanding Alternate Base Rate Loans is equal to the greater of the Prime Rate plus 1.25%, or 0.50% plus the Federal Funds Effective Rate plus 1.25%. The interest rate on outstanding Overnight Loans is equal to the greater of the Federal Funds Effective Rate plus 1.25%, or the One-Month LIBOR Rate (the “LIBOR Rate”) plus 1.25%. On July 21, 2021, the Credit Agreement was renewed; and Mid Cap Value did not participate in the renewal, while International Value Equity ceased participating in the Credit Agreement on August 16, 2021. As part of the renewal, the aforementioned LIBOR rate will be replaced by the greater of Term SOFR plus 0.11448% or the sum of Daily Simple SOFR plus 0.11448% upon when the LIBOR Rate’s administrator has ceased or will cease to provide publication of the LIBOR Rate or the LIBOR Rate is no longer be representative of the underlying market and economic reality the LIBOR Rate is intended to measure and that representativeness will not be restored. AMG Funds IV pays a commitment fee on the unutilized commitment amount of 0.175% per annum, which is allocated to the funds in AMG Funds IV based on average daily net assets and included in miscellaneous expense on the Statement of Operations. Interest incurred on loans utilized is included in the Statement of Operations as interest expense. At October 31, 2021, the Funds had no loans outstanding.
The following Funds utilized the line of credit during the fiscal year ended October 31, 2021:
| | | | | | | | | | | | | | | | |
| | | Weighted | | | | | | | | | | |
| | | Average | | | Number | | | Interest | | | Average | |
| Fund | | Borrowed | | | of Days | | | Paid | | | Interest Rate | |
| | | | |
Mid Cap Value | | | $3,373,926 | | | | 2 | | | | $254 | | | | 1.356% | |
| | | | |
Dividend All Cap Value | | | 3,079,378 | | | | 17 | | | | 1,944 | | | | 1.337% | |
| | | | |
International Value Equity | | | 2,657,585 | | | | 5 | | | | 499 | | | | 1.353% | |
| | | | |
Focused Absolute Value | | | 4,781,037 | | | | 7 | | | | 1,275 | | | | 1.371% | |
12. MASTER NETTING AGREEMENTS
The Funds may enter into master netting agreements with their counterparties for the securities lending, short-sale programs, Repurchase Agreements and derivatives, which provide the right, in the event of default (including bankruptcy
87
|
Notes to Financial Statements (continued) |
or insolvency) for the non-defaulting party to liquidate the collateral and calculate net exposure to the defaulting party or request additional collateral. For financial reporting purposes, the Funds do not offset financial assets and financial liabilities
that are subject to master netting agreements in the Statement of Assets and Liabilities. For securities lending transactions, see Note 4. At October 31, 2021, the Funds did not hold short sales.
The following table is a summary of the Funds’ open Repurchase Agreements that are subject to a master netting agreement as of October 31, 2021:
| | | | | | | | | | | | | | | | | | | | |
| | | | | Gross Amount Not Offset in the | | | | | | |
| | | | | Statement of Assets and Liabilities | | | | | | |
| | | | | |
| Fund | | Gross Amounts of
Assets Presented in
the Statement of
Assets and Liabilities | | Offset Amount | | | Net Asset Balance | | Collateral Received | | Net Amount | |
| | | | | |
Small Cap Value | | | | | | | | | | | | | | | | | | | | |
| | | | | |
Bank of America Securities, Inc. | | | $3,941,511 | | | | – | | | | $3,941,511 | | | | $3,941,511 | | | | – | |
| | | | | |
Cantor Fitzgerald Securities, Inc. | | | 3,941,500 | | | | – | | | | 3,941,500 | | | | 3,941,500 | | | | – | |
| | | | | |
Citigroup Global Markets, Inc. | | | 829,779 | | | | – | | | | 829,779 | | | | 829,779 | | | | – | |
| | | | | |
Deutsche Bank Securities, Inc. | | | 3,941,511 | | | | – | | | | 3,941,511 | | | | 3,941,511 | | | | – | |
| | | | | |
RBC Dominion Securities, Inc. | | | 3,941,511 | | | | – | | | | 3,941,511 | | | | 3,941,511 | | | | – | |
| | | | | |
| | | | | | | | | | | | | | | | | | | | |
| | | | | |
Total | | | $16,595,812 | | | | – | | | | $16,595,812 | | | | $16,595,812 | | | | – | |
| | | | | |
| | | | | | | | | | | | | | | | | | | | |
| | | | | |
Small-Mid Cap Value | | | | | | | | | | | | | | | | | | | | |
| | | | | |
Bank of America Securities, Inc. | | | $1,000,000 | | | | – | | | | $1,000,000 | | | | $1,000,000 | | | | – | |
| | | | | |
Citigroup Global Markets, Inc. | | | 222,309 | | | | – | | | | 222,309 | | | | 222,309 | | | | – | |
| | | | | |
Deutsche Bank Securities, Inc. | | | 1,000,000 | | | | – | | | | 1,000,000 | | | | 1,000,000 | | | | – | |
| | | | | |
RBC Dominion Securities, Inc. | | | 1,000,000 | | | | – | | | | 1,000,000 | | | | 1,000,000 | | | | – | |
| | | | | |
| | | | | | | | | | | | | | | | | | | | |
| | | | | |
Total | | | $3,222,309 | | | | – | | | | $3,222,309 | | | | $3,222,309 | | | | – | |
| | | | | | | | | | | | | | | | | | | | |
13. FUND MERGER
On April 27, 2020, Dividend All Cap Value acquired all the net assets of AMG River Road Dividend All Cap Value Fund II (“Dividend All Cap Value II”) based on the respective valuations as of the close of business on April 24, 2020, pursuant to a Plan of Reorganization approved by the Board of Dividend All Cap Value II on March 19, 2020.
The acquisition was accomplished by a tax-free exchange of 156,555 Class N shares of Dividend All Cap Value II at a net asset value of $8.92 per share for 170,747 Class N shares of Dividend All Cap Value; 3,508,101 Class I shares of Dividend All Cap Value II at a net asset value of $8.91 per share for 3,839,907 Class I shares of Dividend All Cap Value; and 18,306 Class Z shares of Dividend All Cap Value II at a net asset value of $8.91 per share for 20,040 Class Z shares of Dividend All Cap Value.
The net assets of Dividend All Cap Value and Dividend All Cap Value II immediately before the acquisition were $425,135,278 and $35,906,818 respectively, including unrealized appreciation of $675,273 for Dividend All Cap Value II. Immediately after the acquisition, the combined net assets of Dividend All Cap Value amounted to $461,042,096. For financial reporting purposes, assets received and shares issued by Dividend All Cap Value were recorded at fair value; however, the cost basis of the investments received from Dividend All Cap Value II was carried forward to
align ongoing reporting of Dividend All Cap Value’s realized and unrealized gains and losses with amounts distributable to shareholders for tax purposes.
Assuming this reorganization had been completed on November 1, 2019, the Fund’s results of operations for the fiscal year ended October 31, 2020 would have been as follows:
| | | | |
| |
Net Investment Income | | | $14,033,969 | |
| |
Realized and Unrealized Gain on Investments | | | (89,245,365) | |
| |
Net Decrease to Net Assets from Operations | | | $(75,211,396) | |
Because the combined investment portfolios have been managed as a single portfolio since the reorganization was completed, it is not practical to separate the amounts of revenue and earnings to the Fund that have been included in its statements of operations for the fiscal Year ended October 31, 2020.
14. SUBSEQUENT EVENTS
The Funds have determined that no material events or transactions occurred through the issuance date of the Funds’ financial statements which require an additional disclosure in or adjustment of the Funds’ financial statements.
88
|
Report of Independent Registered Public Accounting Firm |
| | |
| TO THE BOARD OF TRUSTEES OF AMG FUNDS I AND AMG FUNDS IV AND SHAREHOLDERS OF AMG RIVER ROAD LARGE CAP VALUE SELECT FUND, AMG RIVER ROAD MID CAP VALUE FUND, AMG RIVER ROAD SMALL CAP VALUE FUND, AMG RIVER ROAD DIVIDEND ALL CAP VALUE FUND, AMG RIVER ROAD SMALL-MID CAP VALUE FUND, AMG RIVER ROAD INTERNATIONAL VALUE EQUITY FUND, AND AMG RIVER ROAD FOCUSED ABSOLUTE VALUE FUND: | | |
| |
| OPINION ON THE FINANCIAL STATEMENTS | | |
| |
| We have audited the accompanying statements of assets and liabilities, including the schedules of portfolio investments of AMG River Road Large Cap Value Select Fund (formerly AMG FQ Long-Short Equity Fund) (one of the funds constituting AMG Funds I), AMG River Road Mid Cap Value Fund (formerly AMG Managers Fairpointe Mid Cap Fund), AMG River Road Small Cap Value Fund, AMG River Road Dividend All Cap Value Fund, AMG River Road Small-Mid Cap Value Fund, AMG River Road International Value Equity Fund (formerly AMG River Road Long-Short Fund), and AMG River Road Focused Absolute Value Fund (six of the funds constituting AMG Funds IV) (hereafter collectively referred to as the “Funds “) as of October 31, 2021, the related statements of operations for the year ended October 31, 2021, the statements of changes in net assets for each of the two years in the period ended October 31, 2021, including the related notes, and the financial highlights for each of the periods indicated therein (collectively referred to as the “financial statements”). In our opinion, the financial statements present fairly, in all material respects, the financial position of each of the Funds as of October 31, 2021, the results of each of their operations for the year then ended, the changes in each of their net assets for each of the two years in the period ended October 31, 2021 and the financial highlights for each of the periods indicated therein in conformity with accounting principles generally accepted in the United States of America. | | |
| |
| BASIS FOR OPINIONS | | |
| |
| These financial statements are the responsibility of the Funds’ management. Our responsibility is to express an opinion on the Funds’ financial statements based on our audits. We are a public accounting firm registered with the Public Company Accounting Oversight Board (United States) (PCAOB) and are required to be independent with respect to the Funds in accordance with the U.S. federal securities laws and the applicable rules and regulations of the Securities and Exchange Commission and the PCAOB. | | |
| |
| We conducted our audits of these financial statements in accordance with the standards of the PCAOB. Those standards require that we plan and perform the audit to obtain reasonable assurance about whether the financial statements are free of material misstatement, whether due to error or fraud. | | |
| |
| Our audits included performing procedures to assess the risks of material misstatement of the financial statements, whether due to error or fraud, and performing procedures that respond to those risks. Such procedures included examining, on a test basis, evidence regarding the amounts and disclosures in the financial statements. Our audits also included evaluating the accounting principles used and significant estimates made by management, as well as evaluating the overall presentation of the financial statements. Our procedures included confirmation of securities owned as of October 31, 2021 by correspondence with the custodian, transfer agent and brokers; when replies were not received from brokers, we performed other auditing procedures. We believe that our audits provide a reasonable basis for our opinions. | | |
| |
PricewaterhouseCoopers LLP Boston, Massachusetts December 22, 2021 We have served as the auditor of one or more investment companies in AMG Funds Family since 1993. | | |
89
|
Other Information (unaudited) |
TAX INFORMATION
AMG River Road Mid Cap Value Fund, AMG River Road Large Cap Value Select Fund, AMG River Road Small Cap Value Fund, AMG River Road Dividend All Cap Value Fund, AMG River Road Small-Mid Cap Value Fund, AMG River Road International Value Equity Fund and AMG River Road Focused Absolute Value Fund each hereby designates the maximum amount allowable of its net taxable income as qualified dividends as provided in the Jobs and Growth Tax Relief Reconciliation Act of 2003. The 2020/2021 Form 1099-DIV you receive for each Fund will show the tax status of all distributions paid to you during the year.
In accordance with federal tax law, the following Fund elects to provide foreign taxes paid and the income sourced from foreign countries. Accordingly, the Fund hereby makes the following designations regarding its taxable period ended October 31, 2021:
AMG River Road International Value Equity Fund
u The total amount of taxes paid and income sourced from foreign countries was $3,307 and $83,752, respectively.
Pursuant to section 852 of the Internal Revenue Code, the Funds each hereby designates as a capital gain distribution with respect to the taxable period ended October 31, 2021, or if subsequently determined to be different, the net capital gains of such period as follows:
| | | | |
| Fund | | Amount | |
| |
Mid Cap Value | | | $247,018,664 | |
| |
Small Cap Value | | | 3,739 | |
| | | | |
| Fund | | Amount | |
| |
Small-Mid Cap Value | | | $4,716 | |
| |
International Value Equity | | | 1,454,805 | |
PROXY VOTE
A special meeting of the shareholders of AMG River Road Mid Cap Value Fund (the “Fund”) was held on June 14, 2021, to vote on proposals including to approve a new subadvisory agreement between AMG Funds LLC (the “Investment Manager”) and River Road Asset Management, LLC (“River Road”), with respect to the Fund. The proposals and results of the votes are summarized below.
| | | | | | | | |
| | | | | | Number of Eligible Shareholders | | |
| | | |
| Proposal 1 | | For | | | Against | | Abstain |
| | | |
Approval of a new subadvisory agreement between the Investment Manager and River Road with respect to the Fund. | | | 10,379,947 | | | 429,957 | | 1,991,135 |
| | | |
% of Shares Present | | | 81.09% | | | 3.36% | | 15.55% |
| | | |
% of Outstanding Shares | | | 41.52% | | | 1.72% | | 7.96% |
| | | |
| | | | | | Number of Eligible Shareholders | | |
| | | |
| Proposal 2 | | For | | | Against | | Abstain |
| | | |
Approval of a change to the Fund’s fundamental investment objective. | | | 8,830,732 | | | 2,030,598 | | 1,939,709 |
| | | |
% of Shares Present | | | 68.98% | | | 15.86% | | 15.15% |
| | | |
% of Outstanding Shares | | | 35.32% | | | 8.12% | | 7.76% |
| | | |
| | | | | | Number of Eligible Shareholders | | |
| | | |
| Proposal 3 | | For | | | Against | | Abstain |
| | | |
Approval of the redesignation of the Fund’s fundamental investment objective as non-fundamental. | | | 7,718,261 | | | 3,063,590 | | 2,019,188 |
| | | |
% of Shares Present | | | 60.29% | | | 23.93% | | 15.77% |
| | | |
% of Outstanding Shares | | | 30.87% | | | 12.25% | | 8.08% |
| | | |
| | | | | | Number of Eligible Shareholders | | |
| | | |
| Proposal 4a | | For | | | Against | | Abstain |
| | | |
Approval of the amendment of the Fund’s fundamental investment restriction with respect to borrowing and issuing senior securities. | | | 8,676,723 | | | 2,068,735 | | 2,055,582 |
| | | |
% of Shares Present | | | 67.78% | | | 16.16% | | 16.06% |
| | | |
% of Outstanding Shares | | | 34.70% | | | 8.27% | | 8.22% |
90
|
Other Information (continued) |
| | | | | | | | |
| | | | | | Number of Eligible Shareholders | | |
| Proposal 4b | | For | | | Against | | Abstain |
| | | |
Approval of the amendment of the Fund’s fundamental investment restriction with respect to lending. | | | 8,659,043 | | | 2,086,915 | | 2,055,081 |
| | | |
% of Shares Present | | | 67.64% | | | 16.30% | | 16.05% |
| | | |
% of Outstanding Shares | | | 34.63% | | | 8.35% | | 8.22% |
| | | |
| | | | | | Number of Eligible Shareholders | | |
| | | |
| Proposal 4c | | For | | | Against | | Abstain |
| | | |
Approval of the elimination of the Fund’s fundamental investment restriction with respect to investing in new issuers. | | | 8,725,280 | | | 2,118,772 | | 1,956,988 |
| | | |
% of Shares Present | | | 68.16% | | | 16.55% | | 15.29% |
| | | |
% of Outstanding Shares | | | 34.90% | | | 8.47% | | 7.83% |
| | | |
| | | | | | Number of Eligible Shareholders | | |
| | | |
| Proposal 5 | | For | | | Against | | Abstain |
| | | |
Approval of a modified manager-of-managers structure for the Fund that would permit the Investment Manager to enter into and materially amend subadvisory agreements with unaffiliated and affiliated subadvisers without obtaining shareholder approval and would also permit the Fund to disclose fees paid to subadvisers on an aggregate, rather than individual, basis. | | | 9,745,910 | | | 1,074,655 | | 1,980,474 |
| | | |
% of Shares Present | | | 76.13% | | | 8.40% | | 15.47% |
| | | |
% of Outstanding Shares | | | 38.98% | | | 4.30% | | 7.92% |
A special meeting of the shareholders of AMG River Road Large Cap Value Select Fund (the “Fund”) was held on June 11, 2021, to vote on proposals including to approve a new subadvisory agreement between AMG Funds LLC (the “Investment Manager”) and River Road Asset Management, LLC (“River Road”), with respect to the Fund. The proposals and results of the votes are summarized below.
| | | | | | | | |
| | | | | | Number of Eligible Shareholders | | |
| | | |
| Proposal 1 | | For | | | Against | | Abstain |
| | | |
Approval of a new subadvisory agreement between the Investment Manager and River Road with respect to the Fund. | | | 1,600,093 | | | 53,977 | | 186,454 |
| | | |
% of Shares Present | | | 86.94% | | | 2.93% | | 10.13% |
| | | |
% of Outstanding Shares | | | 49.38% | | | 1.67% | | 5.75% |
| | | |
| | | | | | Number of Eligible Shareholders | | |
| | | |
| Proposal 2 | | For | | | Against | | Abstain |
| | | |
Approval of a change in the Fund’s sub-classification under the Investment Company Act of 1940, as amended, from “diversified” to “non-diversified”. | | | 1,483,727 | | | 169,659 | | 187,138 |
| | | |
% of Shares Present | | | 80.61% | | | 9.22% | | 10.17% |
| | | |
% of Outstanding Shares | | | 45.79% | | | 5.24% | | 5.78% |
| | | |
| | | | | | Number of Eligible Shareholders | | |
| | | |
| Proposal 3 | | For | | | Against | | Abstain |
| | | |
Approval of a modified manager-of-managers structure for the Fund that would permit the Investment Manager to enter into and materially amend subadvisory agreements with unaffiliated and affiliated subadvisers without obtaining shareholder approval and would also permit the Fund to disclose fees paid to subadvisers on an aggregate, rather than individual, basis. | | | 1,441,204 | | | 115,565 | | 283,754 |
| | | |
% of Shares Present | | | 78,30% | | | 6.28% | | 15.42% |
| | | |
% of Outstanding Shares | | | 44.48% | | | 3.57% | | 8.76% |
91
|
Other Information (continued) |
| | | | |
| Funds Totals: | | Shares | |
| |
Record Total | | | 3,240,214 | |
| |
Shares Voted | | | 1,840,524 | |
| |
Percent Present | | | 56.80% | |
A special meeting of the shareholders of AMG River Road International Value Equity Fund (the “Fund”) was held on August 12, 2021, to vote on proposals between AMG Funds LLC (the “Investment Manager”) and River Road Asset Management, LLC (“River Road”), with respect to the Fund. The proposals and results of the votes are summarized below.
| | | | | | | | |
| | | | | | Number of Eligible Shareholders | | |
| | | |
| Proposal 1 | | For | | | Against | | Abstain |
| | | |
Approval of a change to the Fund’s fundamental investment objective. | | | 421,268 | | | 3,173 | | 0 |
| | | |
% of Shares Present | | | 99.25% | | | 0.75% | | 0.00% |
| | | |
% of Outstanding Shares | | | 58.03% | | | 0.44% | | 0.00% |
| | | |
| | | | | | Number of Eligible Shareholders | | |
| | | |
| Proposal 2 | | For | | | Against | | Abstain |
| | | |
Approval of the redesignation of the Fund’s fundamental investment objective as non-fundamental. | | | 397,087 | | | 27,354 | | 0 |
| | | |
% of Shares Present | | | 93.56% | | | 6.44% | | 0.00% |
| | | |
% of Outstanding Shares | | | 54.70% | | | 3.77% | | 0.00% |
| | | |
| | | | | | Number of Eligible Shareholders | | |
| | | |
| Proposal 3 | | For | | | Against | | Abstain |
| | | |
Approval of the amendment of the Fund’s fundamental investment restriction with respect to borrowing. | | | 421,268 | | | 3,173 | | 0 |
| | | |
% of Shares Present | | | 99.25% | | | 0.75% | | 0.00% |
| | | |
% of Outstanding Shares | | | 58.03% | | | 0.44% | | 0.00% |
| | | |
| | | | | | Number of Eligible Shareholders | | |
| | | |
| Proposal 4 | | For | | | Against | | Abstain |
| | | |
Approval of a modified manager-of-managers structure for the Fund that would permit the Investment Manager to enter into and materially amend subadvisory agreements with unaffiliated and affiliated subadvisers without obtaining shareholder approval and would also permit the Fund to disclose fees paid to subadvisers on an aggregate, rather than individual, basis. | | | 419,010 | | | 3,173 | | 2,258 |
| | | |
% of Shares Present | | | 98.72% | | | 0.75% | | 0.53% |
| | | |
% of Outstanding Shares | | | 57.72% | | | 0.44% | | 0.31% |
| | | | |
| Funds Totals: | | Shares | |
| |
Record Total | | | 725,990 | |
| |
Shares Voted | | | 424,441 | |
| |
Percent Present | | | 58.46% | |
92
|
AMG Funds Trustees and Officers |
| | | | |
| The Trustees and Officers of the Trust, their business addresses, principal occupations for the past five years and ages are listed below. The Trustees provide broad supervision over the affairs of the Trust and the Funds. The Trustees are experienced executives who meet periodically throughout the year to oversee the Funds’ activities, review contractual arrangements with companies that provide services to the Funds, and | | review the Funds’ performance. Unless otherwise noted, the address of each Trustee or Officer is the address of the Trust: 680 Washington Blvd., Suite 500, Stamford, CT. 06901. There is no stated term of office for Trustees. Trustees serve until their resignation, retirement or removal in | | accordance with the Trust’s organizational documents and policies adopted by the Board from time to time. The Chairman of the Trustees, President, Treasurer and Secretary of the Trust are elected by the Trustees annually. Other officers hold office at the pleasure of the Trustees. |
Independent Trustees
The following Trustees are not “interested persons” of the Trust within the meaning of the 1940 Act:
| | |
Number of Funds Overseen in Fund Complex | | Name, Age, Principal Occupation(s) During Past 5 Years and Other Directorships Held by Trustee |
• Trustee since 2012 - AMG Funds I • Trustee since 2016 - AMG Funds IV • Oversees 42 Funds in Fund Complex | | Bruce B. Bingham, 72 Partner, Hamilton Partners (real estate development firm) (1987-Present); Director of The Yacktman Funds, Inc. (2 portfolios) (2000-2012). |
• Trustee since 2013 - AMG Funds I • Trustee since 2013 - AMG Funds IV • Chairman of the Audit Committee since 2021 - AMG Funds I • Chairman of the Audit Committee since 2020 - AMG Funds IV • Oversees 46 Funds in Fund Complex | | Kurt A. Keilhacker, 58 Managing Partner, TechFund Europe (2000-Present); Managing Partner, TechFund Capital (1997-Present); Managing Partner, Elementum Ventures (2013-Present); Director, MetricStory, Inc. (2017-Present); Trustee, Wheaton College (2018-Present); Trustee, Gordon College (2001-2016); Board Member, 6wind SA (2002-2019). |
• Trustee since 2000 • Oversees 42 Funds in Fund Complex | | Steven J. Paggioli, 71 Independent Consultant (2002-Present); Trustee, Professionally Managed Portfolios (28 portfolios); Advisory Board Member, Sustainable Growth Advisors, LP; Independent Director, Muzinich BDC, Inc. (business development company) (2019-Present); Director, The Wadsworth Group; Independent Director, Chase Investment Counsel (2008–2019); Executive Vice President, Secretary and Director, Investment Company Administration, LLC and First Fund Distributors, INC. (1990-2001). |
• Trustee since 2013 • Oversees 42 Funds in Fund Complex | | Richard F. Powers III, 75 Adjunct Professor, U.S. Naval War College (2016-Present); Adjunct Professor, Boston College (2011-2015); Director, Ameriprise Financial Inc. (2005-2009); President and CEO of Van Kampen Investments Inc. (1998-2003); President, Morgan Stanley Client Group (2000-2002); Executive Vice President and Chief Marketing Officer of the Morgan Stanley Individual Investor Group (1984-1998). |
• Independent Chairman of the Board of Trustees since 2017; Chairman of the Governance Committee since 2017 • Trustee since 2000 • Oversees 46 Funds in Fund Complex | | Eric Rakowski, 63 Professor of Law, University of California at Berkeley School of Law (1990-Present); Tax Attorney at Davis Polk & Wardwell and clerked for Judge Harry T. Edwards of the U.S. Court of Appeals for the District of Columbia Circuit and for Justice William J. Brennan Jr. of the U.S. Supreme Court; Director of Harding, Loevner Funds, Inc. (10 portfolios); Trustee of Third Avenue Trust (3 portfolios) (2002-2019); Trustee of Third Avenue Variable Trust (1 portfolio) (2002-2019). |
• Trustee since 2013 • Oversees 46 Funds in Fund Complex | | Victoria L. Sassine, 56 Adjunct Professor, Babson College (2007–Present); Director, Board of Directors, PRG Group (2017-Present); CEO, Founder, Scale Smarter Partners, LLC (2018-Present); Adviser, EVOFEM Biosciences (2019-Present); Chairperson of the Board of Directors of Business Management Associates (2018 to 2019). |
93
|
AMG Funds Trustees and Officers (continued) |
| | |
Number of Funds Overseen in
Fund Complex | | Name, Age, Principal Occupation(s) During Past 5 Years and Other Directorships Held by Trustee |
• Trustee since 2000 - AMG Funds I • Trustee since 2016 - AMG Funds IV • Oversees 42 Funds in Fund Complex | | Thomas R. Schneeweis, 74 Professor Emeritus, University of Massachusetts (2013-Present); President, TRS Associates (1982-Present); Board Member, Chartered Alternative Investment Association (“CAIA”) (2002-Present); Co-Founder and Director, Institute for Global Asset and Risk Management (Education) (2010-Present); Co-Owner, Quantitative Investment Technologies (2014-Present); Co-Owner, Yes Wealth Management (2018-Present); Director, CAIA Foundation (2010-2019); Partner, S Capital Wealth Advisors (2015-2018); Partner, S Capital Management, LLC (2007-2015); President, Alternative Investment Analytics, LLC (formerly Schneeweis Partners, LLC) (2001-2013). |
94
|
AMG Funds Trustees and Officers (continued) |
Interested Trustees
Each Trustee in the following table is an “interested person” of the Trust within the meaning of the 1940 Act. Ms. Carsman is an interested person of the Trust within the meaning of the 1940 Act by virtue of her position with, and interest in securities of, AMG.
| | |
Number of Funds Overseen in
Fund Complex | | Name, Age, Principal Occupation(s) During Past 5 Years and Other Directorships Held by Trustee |
• Trustee since 2011 • Oversees 42 Funds in Fund Complex | | Christine C. Carsman, 69 Affiliated Managers Group, Inc. (2004-Present): Senior Policy Advisor (2019-Present), Executive Vice President, Deputy General Counsel and Chief Regulatory Counsel (2017-2018), Senior Vice President and Deputy General Counsel (2011-2016), Senior Vice President and Chief Regulatory Counsel (2007-2011), Vice President and Chief Regulatory Counsel (2004-2007); Chair of the Board of Directors, AMG Funds plc (2015-2018); Director, AMG Funds plc (2010-2018); Secretary and Chief Legal Officer, AMG Funds, AMG Funds I, AMG Funds II and AMG Funds III (2004-2011); Senior Counsel, Vice President and Director of Operational Risk Management and Compliance, Wellington Management Company, LLP (1995-2004); Director Emeritus of Harding, Loevner Funds, Inc. (0 Portfolios) (2021- Present); Director of Harding, Loevner Funds, Inc. (9 portfolios) (2017-2020). |
• Trustee since 2021 • Oversees 42 Funds in Fund Complex | | Garret W. Weston, 40 Affiliated Managers Group, Inc. (2008-Present): Managing Director, Co-Head of Affiliate Engagement (2021-Present), Senior Vice President, Affiliate Development (2016-2021), Vice President, Office of the CEO (2015-2016), Vice President, New Investments (2012-2015), Senior Associate, New Investments (2008-2012); Associate, Madison Dearborn Partners (2006-2008); Analyst, Merrill Lynch (2004-2006). |
| |
Officers | | |
Position(s) Held with Fund and Length of Time Served | | Name, Age, Principal Occupation(s) During Past 5 Years |
• President since 2018 • Principal Executive Officer since 2018 • Chief Executive Officer since 2018 • Chief Operating Officer since 2007 | | Keitha L. Kinne, 63 Chief Operating Officer, AMG Funds LLC (2007-Present); Chief Investment Officer, AMG Funds LLC (2008-Present); President and Principal, AMG Distributors, Inc. (2018-Present); Chief Operating Officer, AMG Distributors, Inc. (2007-Present); President, Chief Executive Officer and Principal Executive Officer, AMG Funds, AMG Funds I, AMG Funds II, AMG Funds III and AMG Funds IV (2018-Present); Chief Operating Officer, AMG Funds, AMG Funds I, AMG Funds II, and AMG Funds III (2007-Present); Chief Operating Officer, AMG Funds IV (2016-Present); Chief Operating Officer and Chief Investment Officer, Aston Asset Management, LLC (2016); President and Principal Executive Officer, AMG Funds, AMG Funds I, AMG Funds II and AMG Funds III (2012-2014); Managing Partner, AMG Funds LLC (2007-2014); President and Principal, AMG Distributors, Inc. (2012-2014); Managing Director, Legg Mason & Co., LLC (2006-2007); Managing Director, Citigroup Asset Management (2004-2006). |
• Secretary since 2015 • Chief Legal Officer since 2015 | | Mark J. Duggan, 56 Managing Director and Senior Counsel, AMG Funds LLC (2021-Present); Senior Vice President and Senior Counsel, AMG Funds LLC (2015-2021); Secretary and Chief Legal Officer, AMG Funds, AMG Funds I, AMG Funds II, AMG Funds III and AMG Funds IV (2015-Present); Attorney, K&L Gates, LLP (2009-2015). |
• Chief Financial Officer since 2017 • Treasurer since 2017 • Principal Financial Officer since 2017 • Principal Accounting Officer since 2017 | | Thomas G. Disbrow, 55 Vice President, Mutual Fund Treasurer & CFO, AMG Funds, AMG Funds LLC (2017-Present); Chief Financial Officer, Principal Financial Officer, Treasurer and Principal Accounting Officer, AMG Funds, AMG Funds I, AMG Funds II, AMG Funds III and AMG Funds IV (2017-Present); Managing Director - Global Head of Traditional Funds Product Control, UBS Asset Management (Americas), Inc. (2015-2017); Managing Director - Head of North American Funds Treasury, UBS Asset Management (Americas), Inc. (2011-2015). |
• Deputy Treasurer since 2017 | | John A. Starace, 51 Vice President, Mutual Fund Accounting, AMG Funds LLC (2021-Present); Director, Mutual Fund Accounting, AMG Funds LLC (2017-2021); Vice President, Deputy Treasurer of Mutual Funds Services, AMG Funds LLC (2014-2017); Deputy Treasurer, AMG Funds, AMG Funds I, AMG Funds II, AMG Funds III and AMG Funds IV (2017-Present); Vice President, Citi Hedge Fund Services (2010-2014); Audit Senior Manager (2005-2010) and Audit Manager (2001-2005), Deloitte & Touche LLP. |
• Chief Compliance Officer and Sarbanes-Oxley Code of Ethics Compliance Officer since 2019 | | Patrick J. Spellman, 47 Vice President, Chief Compliance Officer, AMG Funds LLC (2017-Present); Chief Compliance Officer, AMG Distributors, Inc. (2010-Present); Chief Compliance Officer and Sarbanes-Oxley Code of Ethics Compliance Officer, AMG Funds, AMG Funds I, AMG Funds II, AMG Funds III and AMG Funds IV (2019-Present); Senior Vice President, Chief Compliance Officer, AMG Funds LLC (2011-2017); Anti-Money Laundering Compliance Officer, AMG Funds, AMG Funds I, AMG Funds II, and AMG Funds III (2014-2019); Anti-Money Laundering Officer, AMG Funds IV, (2016-2019); Compliance Manager, Legal and Compliance, Affiliated Managers Group, Inc. (2005-2011). |
95
|
AMG Funds Trustees and Officers (continued) |
| | |
Position(s) Held with Fund and
Length of Time Served | | Name, Age, Principal Occupation(s) During Past 5 Years |
• Assistant Secretary since 2016 | | Maureen A. Meredith, 36 Vice President, Senior Counsel, AMG Funds LLC (2021-Present); Vice President, Counsel, AMG Funds LLC (2019-2021); Director, Counsel, AMG Funds LLC (2017-2018); Vice President, Counsel, AMG Funds LLC (2015-2017); Assistant Secretary, AMG Funds, AMG Funds I, AMG Funds II, AMG Funds III and AMG Funds IV (2016-Present); Associate, Ropes & Gray LLP (2011-2015); Law Fellow, Massachusetts Appleseed Center for Law and Justice (2010-2011). |
• Anti-Money Laundering Compliance Officer since 2019 | | Hector D. Roman, 43 Director, Legal and Compliance, AMG Funds LLC (2020-Present); Anti-Money Laundering Compliance Officer, AMG Funds, AMG Funds I, AMG Funds II, AMG Funds III and AMG Funds IV (2019-Present); Manager, Legal and Compliance, AMG Funds LLC (2017-2019); Director of Compliance, Morgan Stanley Investment Management (2015-2017); Senior Advisory, PricewaterhouseCoopers LLP (2014-2015); Risk Manager, Barclays Investment Bank (2008-2014). |
96
|
Annual Renewal of Investment Management and Subadvisory Agreements |
| | | | | | | | |
AMG River Road Dividend All Cap Value Fund, AMG River Road Focused Absolute Value Fund, AMG River Road Long-Short Fund, AMG River Road Small-Mid Cap Value Fund, AMG River Road Small Cap Value Fund, AMG River Road Large Cap Value Select Fund (formerly AMG FQ Long-Short Equity Fund), and AMG River Road Mid Cap Value Fund (formerly AMG Managers Fairpointe Mid Cap Fund): Approval of Investment Management and Subadvisory Agreements on June 24, 2021 At a meeting held via telephone and video conference on June 24, 2021,1 the Board of Trustees (the “Board” or the “Trustees”) of each of AMG Funds I and AMG Funds IV (each a “Trust” and collectively, the “Trusts”), and separately a majority of the Trustees who are not “interested persons” of the Trusts (the “Independent Trustees”), approved (i) the Fund Management Agreement, as amended pursuant to letter agreements at any time prior to the date of the meeting, with AMG Funds LLC (the “Investment Manager”) and AMG Funds I for AMG River Road Large Cap Value Select Fund (formerly AMG FQ Long-Short Equity Fund) and separately each of Amendment No. 1 thereto dated July 1, 2015, and Amendment No. 2 thereto dated October 1, 2016; and the Investment Advisory Agreement, as amended pursuant to letter agreements at any time prior to the date of the meeting, with the Investment Manager and AMG Funds IV for each of AMG River Road Dividend All Cap Value Fund, AMG River Road Focused Absolute Value Fund, AMG River Road Long-Short Fund, AMG River Road Small-Mid Cap Value Fund, AMG River Road Small Cap Value Fund and AMG River Road Mid Cap Value Fund (formerly AMG Managers Fairpointe Mid Cap Fund), and separately Amendment No. 1 thereto dated October 1, 2016 (collectively, the “Investment Management Agreements”); and (ii) the Sub-Investment Advisory Agreements, as amended at any time prior to the date of the meeting (collectively, the “Subadvisory Agreements”), with the Subadviser for each of AMG River Road Dividend All Cap Value Fund, AMG River Road Focused Absolute Value Fund, AMG River Road Long-Short Fund, AMG River Road Small-Mid Cap Value Fund, and AMG River Road Small Cap Value Fund.2 The Independent Trustees were separately represented by independent legal counsel in connection with their consideration of the approval of these agreements. In considering the Investment Management Agreements and the Subadvisory Agreements, the Trustees reviewed a variety of materials relating to AMG River Road Dividend All Cap Value Fund, AMG River Road Focused Absolute Value Fund, AMG River Road Long-Short Fund, AMG | | | | River Road Small-Mid Cap Value Fund, AMG River Road Small Cap Value Fund, AMG River Road Large Cap Value Select Fund, and AMG River Road Mid Cap Value Fund (each, a “Fund,” and collectively, the “Funds”), the Investment Manager and the Subadviser, including the nature, extent and quality of services, comparative performance, fee and expense information for an appropriate peer group of similar mutual funds for each Fund (each, a “Peer Group”), performance information for the relevant benchmark index for each Fund (each, a “Fund Benchmark”), other relevant matters, and other information provided to them on a periodic basis throughout the year. Prior to voting, the Independent Trustees: (a) reviewed the foregoing information with their independent legal counsel; (b) received materials from their independent legal counsel discussing the legal standards applicable to their consideration of the Investment Management Agreements and the Subadvisory Agreements; and (c) met with their independent legal counsel in private sessions at which no representatives of management were present. NATURE, EXTENT AND QUALITY OF SERVICES In considering the nature, extent and quality of the services provided by the Investment Manager, the Trustees reviewed information relating to the Investment Manager’s operations and personnel. Among other things, the Investment Manager provided financial information, information about its supervisory and professional staff and descriptions of its organizational and management structure. The Trustees also took into account information provided periodically throughout the previous year by the Investment Manager in Board meetings relating to the performance of its duties with respect to the Funds and the Trustees’ knowledge of the Investment Manager’s management and the quality of the performance of the Investment Manager’s duties under the Investment Management Agreements and Administration Agreement. In the course of their deliberations regarding the Investment Manager, the Trustees evaluated, among other things: (a) the extent and quality of the Investment Manager’s oversight of the operation and management of the Funds; (b) the quality of the Investment Manager’s oversight of the performance by the Subadviser of its portfolio management duties; (c) the Investment Manager’s ability to supervise the Funds’ other service providers; and (d) the Investment Manager’s compliance program. The Trustees also took into account that, in performing its functions under the Investment Management Agreements and supervising the Subadviser, the Investment | | | | Manager: performs periodic detailed analyses and reviews of the performance by the Subadviser of its obligations to each Fund, including without limitation, analysis and review of portfolio and other compliance matters and review of the Subadviser’s investment performance with respect to each Fund; prepares and presents periodic reports to the Board regarding the investment performance of the Subadviser and other information regarding the Subadviser, at such times and in such forms as the Board may reasonably request; reviews and considers any changes in the personnel of the Subadviser responsible for performing the Subadviser’s obligations and makes appropriate reports to the Board; reviews and considers any changes in the ownership or senior management of the Subadviser and makes appropriate reports to the Board; performs periodic in-person, telephonic or videoconference diligence meetings, including with respect to compliance matters, with representatives of the Subadviser; assists the Board and management of the Trusts in developing and reviewing information with respect to the initial approval of each Subadvisory Agreement and the Large Cap Value Select Subadvisory Agreement and the Mid Cap Value Subadvisory Agreement and annual consideration of each Subadvisory Agreement and the Large Cap Value Select Subadvisory Agreement and the Mid Cap Value Subadvisory Agreement thereafter; prepares recommendations with respect to the continued retention of the Subadviser or the replacement of the Subadviser, including at the request of the Board; identifies potential successors to, or replacements of, the Subadviser or potential additional subadvisers, including performing appropriate due diligence, and developing and presenting to the Board a recommendation as to any such successor, replacement, or additional subadviser, including at the request of the Board; designates and compensates from its own resources such personnel as the Investment Manager may consider necessary or appropriate to the performance of its services; and performs such other review and reporting functions as the Board shall reasonably request consistent with the Investment Management Agreements and applicable law. The Trustees noted the affiliation of the Subadviser with the Investment Manager, noting any potential conflicts of interest. The Trustees also took into account the financial condition of the Investment Manager with respect to its ability to provide the services required under the Investment Management Agreements and the Investment Manager’s undertaking to maintain |
| | | | | | | | |
97
|
Annual Renewal of Investment Management and Subadvisory Agreements (continued) |
| | | | | | | | |
contractual expense limitations for certain Funds, as described below. The Trustees also considered the Investment Manager’s risk management processes. For AMG River Road Dividend All Cap Value Fund, AMG River Road Focused Absolute Value Fund, AMG River Road Long-Short Fund, AMG River Road Small-Mid Cap Value Fund, and AMG River Road Small Cap Value Fund, the Trustees also reviewed information relating to the Subadviser’s operations and personnel and the investment philosophy, strategies and techniques used in managing each Fund. Among other things, the Trustees reviewed information on portfolio management and other professional staff, information regarding the Subadviser’s organizational and management structure and the Subadviser’s brokerage policies and practices. The Trustees considered specific information provided regarding the experience of the individuals at the Subadviser with portfolio management responsibility for each Fund, including the information set forth in each Fund’s prospectus and statement of additional information. In the course of their deliberations, the Trustees evaluated, among other things: (a) the services rendered by the Subadviser in the past; (b) the qualifications and experience of the Subadviser’s personnel; and (c) the Subadviser’s compliance program. The Trustees also took into account the financial condition of the Subadviser with respect to its ability to provide the services required under each Subadvisory Agreement. The Trustees also considered the Subadviser’s risk management processes. PERFORMANCE The Board considered each Fund’s net performance during relevant time periods as compared to the Fund’s Peer Group and Fund Benchmark, considered the gross performance of each of AMG River Road Dividend All Cap Value Fund, AMG River Road Focused Absolute Value Fund, AMG River Road Long-Short Fund, AMG River Road Small-Mid Cap Value Fund, and AMG River Road Small Cap Value Fund as compared to the Subadviser’s relevant performance composite that utilizes the same investment strategy and approach, and noted that the Board reviews on a quarterly basis detailed information about both a Fund’s performance results and portfolio composition, as well as the Subadviser’s investment philosophy, strategies and techniques used in managing the Fund. The Board was mindful of the Investment Manager’s expertise, resources and attention to monitoring the Subadviser’s performance, investment style and risk-adjusted performance with respect to the Funds | | | | and its discussions with the management of the Funds’ subadvisers during the period regarding the factors that contributed to the performance of the Funds. With respect to AMG River Road Dividend All Cap Value Fund, among other information relating to the Fund’s performance, the Trustees noted that the Fund’s performance for Class N shares (which share class has the earliest inception date of all the share classes of the Fund) for the 1-year, 3-year, 5-year and 10-year periods ended March 31, 2021 was below the median performance of the Peer Group and below the performance of the Fund Benchmark, the Russell 3000 Value Index. The Trustees took into account management’s discussion of the Fund’s performance, including the reasons for the Fund’s underperformance and the impact of the Fund’s recent underperformance on its longer-term performance rankings. The Trustees concluded that the Fund’s overall performance has been satisfactory in light of the Fund’s investment objective, strategies and policies. With respect to AMG River Road Focused Absolute Value Fund, among other information relating to the Fund’s performance, the Trustees noted that the Fund’s performance for Class I shares (which share class has one of the earliest inception dates and the largest amount of assets of all the share classes of the Fund) for the 1-year, 3-year, and 5-year periods ended March 31, 2021 and for the period from the Fund’s inception on November 3, 2015 through March 31, 2021 was below, above, above, and above, respectively, the median performance of the Peer Group and below, above, above, and above, respectively, the performance of the Fund Benchmark, the Russell 3000 Value Index. The Trustees also took into account management’s discussion of the Fund’s performance, including the reasons for the Fund’s more recent underperformance. The Trustees also took into account the fact that Class I shares of the Fund ranked in the top quintile relative to its Peer Group for the period from the Fund’s inception through March 31, 2021, the top quartile relative to its Peer Group for the 5-year period, and the top third relative to its Peer Group for the 3-year period. The Trustees concluded that the Fund’s overall performance has been satisfactory. With respect to AMG River Road Long-Short Fund, among other information relating to the Fund’s performance, the Trustees noted that the Fund’s performance for Class N shares (which share class has the earliest inception date of all the share | | | | classes of the Fund) for the 1-year, 3-year and 5-year periods ended March 31, 2021 and for the period from the Class N shares’ inception on May 4, 2011 through March 31, 2021 was below, above, above, and above, respectively, the median performance of the Peer Group and below the performance of the Fund Benchmark, the Russell 3000 Index. The Trustees also took into account management’s discussion of the Fund’s performance, including the reasons for the Fund’s recent underperformance. The Trustees noted that Class N shares of the Fund outperformed the median of the Peer Group for the 3-year and 5-year periods and the period from the Fund’s inception through March 31, 2021. The Trustees concluded that the Fund’s overall performance has been satisfactory in light of the Fund’s investment objective, strategies and policies. With respect to AMG River Road Small-Mid Cap Value Fund, among other information relating to the Fund’s performance, the Trustees noted that the Fund’s performance for Class N shares (which share class has the earliest inception date of all the share classes of the Fund) for the 1-year, 3-year, 5-year and 10-year periods ended March 31, 2021 was below, above, above, and above, respectively, the median performance of the Peer Group and below, above, above, and above, respectively, the performance of the Fund Benchmark, the Russell 2500 Value Index. The Trustees also took into account management’s discussion of the Fund’s performance, including the reasons for the Fund’s more recent underperformance. The Trustees also took into account the fact that Class N shares of the Fund ranked in the top decile relative to its Peer Group for the 10-year period and in the top quintile relative to its Peer Group for the 3-year and 5-year periods. The Trustees concluded that the Fund’s overall performance has been satisfactory. With respect to AMG River Road Small Cap Value Fund, among other information relating to the Fund’s performance, the Trustees noted that the Fund’s performance for Class N shares (which share class has the earliest inception date of all the share classes of the Fund) for the 1-year, 3-year, 5-year and 10-year periods ended March 31, 2021 was below, above, above, and above, respectively, the median performance of the Peer Group and below, above, below, and above, respectively, the performance of the Fund Benchmark, the Russell 2000 Value Index. The Trustees also took into account management’s discussion of the Fund’s performance, including the reasons for the Fund’s more recent underperformance. The Trustees also took into account the fact that Class N shares of the Fund |
98
|
Annual Renewal of Investment Management and Subadvisory Agreements (continued) |
| | | | | | | | |
ranked in the top quartile relative to its Peer Group for the 3-year period and in the top quintile relative to its Peer Group for the 5-year and 10-year periods. The Trustees concluded that the Fund’s overall performance has been satisfactory. With respect to AMG River Road Large Cap Value Select Fund, among other information relating to the Fund’s performance, the Trustees noted that the Fund’s performance for Class I shares (which share class has the earliest inception date and the largest amount of assets of all the share classes of the Fund) for the 1-year, 3-year, 5-year and 10-year periods ended March 31, 2021 was below the median performance of the Peer Group and below the performance of the Fund Benchmark, the Russell 1000 Value Index. The Trustees took into account management’s discussion of the Fund’s performance, including the reasons for the Fund’s underperformance. The Trustees also took into account the fact that the Fund’s subadviser, investment strategy, and Fund Benchmark changed effective March 22, 2021, and that the performance information reflected that of the Fund’s prior subadviser and investment strategy. The Trustees concluded that the Fund’s performance is being addressed. With respect to AMG River Road Mid Cap Value Fund, among other information relating to the Fund’s performance, the Trustees noted that the Fund’s performance for Class N shares (which share class has the earliest inception date and the largest amount of assets of all the share classes of the Fund) for the 1-year, 3-year, 5-year and 10-year periods ended March 31, 2021 was below the median performance of the Peer Group and below the performance of the Fund Benchmark, the Russell Midcap Value Index. The Trustees took into account management’s discussion of the Fund’s performance, including the reasons for the Fund’s underperformance. The Trustees also took into account the fact that the Fund’s subadviser, investment strategy, and Fund Benchmark changed effective March 19, 2021, and that the performance information reflected that of the Fund’s prior subadviser and investment strategy. The Trustees concluded that the Fund’s performance is being addressed. ADVISORY AND SUBADVISORY FEES; FUND EXPENSES; PROFITABILITY; AND ECONOMIES OF SCALE In considering the reasonableness of the advisory fee payable to the Investment Manager, the Trustees reviewed information provided by the Investment Manager at the June 24, 2021 and prior meetings | | | | setting forth all revenues and other benefits, both direct and indirect (including any so-called “fallout benefits” such as reputational value derived from the Investment Manager serving as Investment Manager to a Fund), received by the Investment Manager and its affiliates attributable to managing each Fund and all the mutual funds in the AMG Funds Family of Funds; the cost of providing such services; the significant risks undertaken as Investment Manager and sponsor of the Funds, including investment, operational, enterprise, entrepreneurial, litigation, regulatory and compliance risks; and the resulting profitability to the Investment Manager and its affiliates from these relationships. The Trustees also considered the change to the management fee rate that was implemented during the past year for AMG River Road Mid Cap Value Fund, the changes to the subadvisory and shareholder servicing fee rates that were implemented during the past year for AMG River Road Large Cap Value Select Fund and AMG River Road Mid Cap Value Fund, and the changes to the expense caps that were implemented during the past year for AMG River Road Dividend All Cap Value Fund, AMG River Road Large Cap Value Select Fund, and AMG River Road Mid Cap Value Fund. The Trustees also considered the changes to the management fee, subadvisory fee and shareholder servicing fee rates and the change to the expense cap that were approved during the past year for AMG River Road Long-Short Fund. The Trustees also considered the amount of the advisory fee retained by the Investment Manager after payment of the subadvisory fee with respect to each Fund. The Trustees also noted payments made or to be made from the Subadviser to the Investment Manager, and other payments made or to be made from the Investment Manager to the Subadviser. The Trustees also considered management’s discussion of the current asset levels of the Funds, and the impact on profitability of both the current asset levels and any future growth of assets of the Funds. In considering the cost of services to be provided by the Investment Manager under each Investment Management Agreement and the profitability to the Investment Manager of its relationship with each Fund, the Trustees noted the undertaking by the Investment Manager to maintain contractual expense limitations for each Fund other than AMG River Road Small Cap Value Fund. The Board also took into account management’s discussion of the advisory fee structure, and the services the Investment Manager provides in performing its functions under each Investment Management Agreement and supervising the Subadviser. Based on the foregoing, the Trustees concluded that the profitability to the Investment Manager is reasonable | | | | and that the Investment Manager is not realizing material benefits from economies of scale that would warrant adjustments to the advisory fee at this time. Also with respect to economies of scale, the Trustees noted that as each Fund’s assets increase over time, the Fund may realize other economies of scale to the extent the increase in assets is proportionally greater than the increase in certain other expenses. For AMG River Road Dividend All Cap Value Fund, AMG River Road Focused Absolute Value Fund, AMG River Road Long-Short Fund, AMG River Road Small-Mid Cap Value Fund, and AMG River Road Small Cap Value Fund, in considering the reasonableness of the subadvisory fees payable by the Investment Manager to the Subadviser, the Trustees reviewed information regarding the cost to the Subadviser of providing subadvisory services to each Fund and the resulting profitability from these relationships. The Trustees noted that, because the Subadviser is an affiliate of the Investment Manager, a portion of the Subadviser’s revenues or profits might be shared directly or indirectly with the Investment Manager. The Trustees also noted that the subadvisory fees are paid by the Investment Manager out of its advisory fee. The Board also took into account management’s discussion of the subadvisory fee structure, and the services the Subadviser provides in performing its functions under each Subadvisory Agreement. Based on the foregoing, the Trustees concluded that the profitability to the Subadviser is reasonable and that the Subadviser is not realizing material benefits from economies of scale that would warrant adjustments to the subadvisory fees at this time. Also with respect to economies of scale, the Trustees noted that as a Fund’s assets increase over time, the Fund may realize other economies of scale to the extent the increase in assets is proportionally greater than the increase in certain other expenses. With respect to AMG River Road Dividend All Cap Value Fund, the Trustees noted that the management fees (which include both the advisory and administration fees) and total expenses (net of applicable expense waivers/reimbursements) of Class I shares (the class of shares which is the primary focus of the Fund’s distribution) of the Fund as of March 31, 2021 were both higher than the average for the Fund’s Peer Group. The Trustees took into account the fact that, effective January 1, 2021, the Investment Manager has contractually agreed, through March 1, 2022, to lower the Fund’s contractual expense limitation from 0.99% to 0.78% of the Fund’s net annual operating expenses (subject to certain excluded expenses). The Trustees also took into account management’s discussion of the Fund’s |
99
|
Annual Renewal of Investment Management and Subadvisory Agreements (continued) |
| | | | | | | | |
expenses, including fees and expenses relative to comparably sized funds and key competitors. The Trustees concluded that, in light of the nature, extent and quality of the services provided by the Investment Manager and the Subadviser (which is an affiliate of the Investment Manager), the foregoing expense limitation and the considerations noted above with respect to the Investment Manager and the Subadviser, the Fund’s advisory and subadvisory fees are reasonable. With respect to AMG River Road Focused Absolute Value Fund, the Trustees noted that the management fees (which include both the advisory and administration fees) and total expenses (net of applicable expense waivers/reimbursements) of Class I shares of the Fund as of March 31, 2021 were both lower than the average for the Fund’s Peer Group. The Trustees took into account the fact that the Investment Manager has contractually agreed, through March 1, 2022, to limit the Fund’s net annual operating expenses (subject to certain excluded expenses) to 0.78%. The Trustees concluded that, in light of the nature, extent and quality of the services provided by the Investment Manager and the Subadviser (which is an affiliate of the Investment Manager), the foregoing expense limitation and the considerations noted above with respect to the Investment Manager and the Subadviser, the Fund’s advisory and subadvisory fees are reasonable. With respect to AMG River Road Long-Short Fund, the Trustees noted that the management fees (which include both the advisory and administration fees) and total expenses (net of applicable expense waivers/reimbursements) of Class I shares (the class of shares which is the primary focus of the Fund’s distribution) of the Fund as of March 31, 2021 were both lower than the average for the Fund’s Peer Group. The Trustees took into account the fact that the Investment Manager has contractually agreed, through March 1, 2022, to limit the Fund’s net annual operating expenses (subject to certain excluded expenses) to 1.12%. The Trustees also took into account the fact that, effective on a date to be determined by the Fund after the date on which shareholders approve the change to the Fund’s fundamental investment objective or the redesignation of the Fund’s fundamental investment objective as non-fundamental (the “River Road Long-Short Implementation Date”), among other changes, the Fund would change its name and investment strategy and the Investment Manager would contractually agree, through March 1, 2023, to lower the Fund’s contractual expense limitation from 1.12% to 0.73% of the Fund’s net annual operating expenses (subject to certain excluded expenses). | | | | The Trustees also noted that, effective on the River Road Long-Short Implementation Date, the Fund’s management fee rate would be reduced. The Trustees concluded that, in light of the nature, extent and quality of the services provided by the Investment Manager and the Subadviser (which is an affiliate of the Investment Manager), the foregoing expense limitation and the considerations noted above with respect to the Investment Manager and the Subadviser, the Fund’s advisory and subadvisory fees are reasonable. With respect to AMG River Road Small-Mid Cap Value Fund, the Trustees noted that the management fees (which include both the advisory and administration fees) and total expenses (net of applicable expense waivers/reimbursements) of Class I shares (the class of shares which is the primary focus of the Fund’s distribution) of the Fund as of March 31, 2021 were both higher than the average for the Fund’s Peer Group. The Trustees took into account the fact that the Investment Manager has contractually agreed, through March 1, 2022, to limit the Fund’s net annual operating expenses (subject to certain excluded expenses) to 1.04%. The Trustees also took into account management’s discussion of the Fund’s expenses, including fees and expenses relative to comparably sized funds and select competitors. The Trustees concluded that, in light of the nature, extent and quality of the services provided by the Investment Manager and the Subadviser (which is an affiliate of the Investment Manager), the foregoing expense limitation and the considerations noted above with respect to the Investment Manager and the Subadviser, the Fund’s advisory and subadvisory fees are reasonable. With respect to AMG River Road Small Cap Value Fund, the Trustees noted that the management fees (which include both the advisory and administration fees) and total expenses of Class I shares (the class of shares which is the primary focus of the Fund’s distribution) of the Fund as of March 31, 2021 were both higher than the average for the Fund’s Peer Group. The Trustees took into account management’s discussion of the Fund’s expenses, including fees and expenses relative to comparably sized funds and select competitors. The Trustees concluded that, in light of the nature, extent and quality of the services provided by the Investment Manager and the Subadviser (which is an affiliate of the Investment Manager) and the considerations noted above with respect to the Investment Manager and the Subadviser, the Fund’s advisory and subadvisory fees are reasonable. | | | | With respect to AMG River Road Large Cap Value Select Fund, the Trustees noted that the management fees (which include both the advisory and administration fees) and total expenses (net of applicable expense waivers/reimbursements) of Class I shares of the Fund as of March 31, 2021 were lower and higher, respectively, than the average for the Fund’s Peer Group. The Trustees took into account the fact that, effective June 11, 2021, the Investment Manager has contractually agreed, through March 1, 2023, to lower the Fund’s contractual expense limitation from 0.69% to 0.60% of the Fund’s net annual operating expenses (subject to certain excluded expenses). The Trustees also took into account management’s discussion of the Fund’s expenses, including fees and expenses relative to comparably sized funds and select competitors. The Trustees concluded that, in light of the nature, extent and quality of the services provided by the Investment Manager, the foregoing expense limitation and the considerations noted above with respect to the Investment Manager, the Fund’s advisory fees are reasonable. With respect to AMG River Road Mid Cap Value Fund, the Trustees noted that the management fees (which include both the advisory and administration fees) and total expenses (net of applicable expense waivers/reimbursements) of Class I shares (the class of shares which is the primary focus of the Fund’s distribution) of the Fund as of March 31, 2021 were lower and higher, respectively, than the average for the Fund’s Peer Group. The Trustees took into account the fact that, effective June 14, 2021, the Investment Manager has contractually agreed, through March 1, 2023, to lower the Fund’s contractual expense limitation from 0.82% to 0.76% of the Fund’s net annual operating expenses (subject to certain excluded expenses). The Trustees also noted that, effective June 14, 2021, the Fund’s management fee rate was reduced. The Trustees also took into account management’s discussion of the Fund’s expenses, including fees and expenses relative to comparably sized funds and select competitors. The Trustees concluded that, in light of the nature, extent and quality of the services provided by the Investment Manager, the foregoing expense limitation and the considerations noted above with respect to the Investment Manager, the Fund’s advisory fees are reasonable. With respect to AMG River Road Mid Cap Value Fund, the Trustees also considered information provided by the Investment Manager throughout the previous year related to the benefits of the strategic repositioning of the AMG Funds complex for greater alignment with Affiliated Managers Group, Inc. |
100
|
Annual Renewal of Investment Management and Subadvisory Agreements (continued) |
| | | | | | | | |
(“AMG”), in which each fund that was not previously subadvised by an affiliate of AMG (each affiliate of AMG, an “Affiliate” and collectively, “Affiliates”) was transitioned to an AMG Affiliate subadviser. The Trustees considered that the strategic repositioning was expected to create value for the Fund, the other funds in the AMG Funds complex and their shareholders through enhanced resources and competitive fee levels. The Trustees noted the expectations that the changes would result in bringing the full range of AMG’s resources to bear on the growth and success of the AMG Funds, streamlining the lineup of funds in the AMG Funds complex and reducing the number of subadvisers in the AMG Funds complex, significantly reducing strategy overlap and providing more differentiated investment solutions for the AMG Funds complex that are otherwise not available to U.S. retail investors. The Trustees further considered the expectation that the repositioning would bring AMG’s strong partnerships in support of the Fund and the AMG Funds complex as a whole and enable AMG Funds to bring the best capabilities of AMG’s Affiliates to the Fund and the rest of the AMG Funds complex. The Trustees noted that AMG’s relationship with its Affiliates will also allow the Fund to have greater insight into the Affiliates’ compliance and business platform than is generally possible with third party subadvisers, aiding the ongoing monitoring of subadvisers. * * * * * After consideration of the foregoing, the Trustees also reached the following conclusions (in addition to the | | | | conclusions discussed above) regarding the Investment Management Agreements and Subadvisory Agreements: (a) the Investment Manager and the Subadviser have demonstrated that they possess the capability and resources to perform the duties required of them under the Investment Management Agreements and each Subadvisory Agreement and (b) the Investment Manager and Subadviser maintain appropriate compliance programs. Based on all of the above-mentioned factors and their related conclusions, with no single factor or conclusion being determinative and with each Trustee not necessarily attributing the same weight to each factor, the Trustees concluded that approval of each Investment Management Agreement and each Subadvisory Agreement would be in the best interests of the applicable Fund and its shareholders. Accordingly, on June 24, 2021, the Trustees, and separately a majority of the Independent Trustees, voted to approve the Investment Management Agreement for each Fund and the Subadvisory Agreement for each of AMG River Road Dividend All Cap Value Fund, AMG River Road Focused Absolute Value Fund, AMG River Road Long-Short Fund, AMG River Road Small-Mid Cap Value Fund, and AMG River Road Small Cap Value Fund. 1 The Trustees determined that the conditions surrounding COVID-19 constituted unforeseen or emergency circumstances and that reliance on the Securities and Exchange Commission’s (“SEC”) exemptive order, which provides relief from the in-person voting requirements of the Investment Company Act of 1940, as amended (the “1940 Act”), in certain circumstances (the | | | | “In-Person Relief”), was necessary or appropriate due to the circumstances related to current or potential effects of COVID-19. The Trustees unanimously wished to rely on the In-Person Relief with respect to the approval of those matters on the agenda for the June 24, 2021 meeting that would otherwise require in-person votes under the 1940 Act. See Investment Company Release No. 33897 (June 19, 2020). This exemptive order supersedes, in part, a similar, earlier exemptive order issued by the SEC (Investment Company Release No. 33824 (March 25, 2020)). 2 At a meeting held via telephone and videoconference on March 17-18, 2021 (the “March Meeting”), the Board of AMG Funds I, and separately a majority of the Independent Trustees, approved the Subadvisory Agreement with respect to AMG River Road Large Cap Value Select Fund (the “Large Cap Value Select Subadvisory Agreement”). The Large Cap Value Select Subadvisory Agreement was subsequently approved by the Fund’s shareholders at a special meeting held on June 11, 2021, for an initial two-year period. Also at the March Meeting, the Board of AMG Funds IV, and separately a majority of the Independent Trustees, approved the Subadvisory Agreement with respect to AMG River Road Mid Cap Value Fund (the “Mid Cap Value Subadvisory Agreement”). The Mid Cap Value Subadvisory Agreement was subsequently approved by the Fund’s shareholders at a special meeting held on June 14, 2021, for an initial two-year period. References herein to the “Subadvisory Agreements” refer to the Subadvisory Agreements for AMG River Road Dividend All Cap Value Fund, AMG River Road Focused Absolute Value Fund, AMG River Road Long-Short Fund, AMG River Road Small-Mid Cap Value Fund, and AMG River Road Small Cap Value Fund, and do not include the Large Cap Value Select Subadvisory Agreement or the Mid Cap Value Subadvisory Agreement. |
101
THIS PAGE INTENTIONALLY LEFT BLANK
THIS PAGE INTENTIONALLY LEFT BLANK
THIS PAGE INTENTIONALLY LEFT BLANK
| | |
| |
|
| | | | |
INVESTMENT MANAGER AND ADMINISTRATOR AMG Funds LLC 680 Washington Blvd., Suite 500 Stamford, CT 06901 800.548.4539 DISTRIBUTOR AMG Distributors, Inc. 680 Washington Blvd., Suite 500 Stamford, CT 06901 800.548.4539 SUBADVISER River Road Asset Management, LLC Meidinger Tower 462 South Fourth Street, Suite 2000 Louisville, KY 40202 | | CUSTODIAN The Bank of New York Mellon Mutual Funds Custody 6023 Airport Road Oriskany, NY 13424 LEGAL COUNSEL Ropes & Gray LLP Prudential Tower, 800 Boylston Street Boston, MA 02199-3600 TRANSFER AGENT BNY Mellon Investment Servicing (US) Inc. Attn: AMG Funds 4400 Computer Drive Westborough, MA 01581 800.548.4539 | | This report is prepared for the Funds’ shareholders. It is authorized for distribution to prospective investors only when preceded or accompanied by an effective prospectus. To receive a free copy of the prospectus or Statement of Additional Information, which includes additional information about Fund Trustees, please contact us by calling 800.548.4539. Distributed by AMG Distributors, Inc., member FINRA/SIPC. Current net asset values per share for each Fund are available on the Funds’ website at amgfunds.com. A description of the policies and procedures each Fund uses to vote its proxies is available: (i) without charge, upon request, by calling 800.548.4539, or (ii) on the Securities and Exchange Commission’s (SEC) website at sec.gov. For information regarding each Fund’s proxy voting record for the 12-month period ended June 30, call 800.548.4539 or visit the SEC website at sec.gov. The Funds file their complete schedule of portfolio holdings with the SEC for the first and third quarters of each fiscal year as an exhibit to their reports on Form N-PORT. The Funds’ portfolio holdings on Form N-PORT are available on the SEC’s website at sec.gov and the Funds’ website at amgfunds.com. To review a complete list of the Funds’ portfolio holdings, or to view the most recent semiannual report or annual report, please visit amgfunds.com. |
| | | | |
amgfunds.com |
| | |
| | |
| | | | | | | | | | | | |
BALANCED FUNDS AMG GW&K Global Allocation GW&K Investment Management, LLC AMG FQ Global Risk-Balanced First Quadrant, L.P. EQUITY FUNDS AMG Beutel Goodman International Equity Beutel, Goodman & Company Ltd. AMG Boston Common Global Impact Boston Common Asset Management, LLC AMG Managers CenterSquare Real Estate CenterSquare Investment Management LLC AMG Frontier Small Cap Growth Frontier Capital Management Co., LLC AMG GW&K Small Cap Core AMG GW&K Small Cap Value AMG GW&K Small/Mid Cap AMG GW&K Small/Mid Cap Growth AMG GW&K Emerging Markets Equity AMG GW&K Emerging Wealth Equity AMG GW&K International Small Cap GW&K Investment Management, LLC AMG Montrusco Bolton Large Cap Growth Montrusco Bolton Investments, Inc. | | | | AMG Renaissance Large Cap Growth The Renaissance Group LLC AMG River Road Dividend All Cap Value AMG River Road Focused Absolute Value AMG River Road International Value Equity AMG River Road Large Cap Value Select AMG River Road Mid Cap Value AMG River Road Small-Mid Cap Value AMG River Road Small Cap Value River Road Asset Management, LLC AMG TimesSquare Emerging Markets Small Cap AMG TimesSquare Global Small Cap AMG TimesSquare International Small Cap AMG TimesSquare Mid Cap Growth AMG TimesSquare Small Cap Growth TimesSquare Capital Management, LLC AMG Veritas Asia Pacific AMG Veritas China AMG Veritas Global Focus AMG Veritas Global Real Return Veritas Asset Management LLP AMG Yacktman AMG Yacktman Focused AMG Yacktman Global AMG Yacktman Special Opportunities Yacktman Asset Management LP | | | | FIXED INCOME FUNDS AMG Beutel Goodman Core Plus Bond Beutel, Goodman & Company Ltd. AMG GW&K Core Bond ESG AMG GW&K Enhanced Core Bond ESG AMG GW&K ESG Bond AMG GW&K High Income AMG GW&K Municipal Bond AMG GW&K Municipal Enhanced Yield GW&K Investment Management, LLC | | | | |
| | | | | | | | | | | | |
amgfunds.com | | 103121 AR082 |
| | |
| | | ANNUAL REPORT |
| | | | | | | | |
| | | | | AMG Funds October 31, 2021 
|
| | | | | AMG Veritas China Fund (formerly AMG Managers Emerging Opportunities Fund) |
| | | | | |
| | | | | Class N: MMCFX | | Class I: MIMFX | | |
| | | | | AMG Veritas Global Focus Fund (formerly AMG FQ Tax-Managed U.S. Equity Fund) |
| | | | | |
| | | | | Class N: MFQAX | | Class I: MFQTX | | |
| | | | | |
| | | | | | | | | |
| | | | |
| amgfunds.com | | | | 103121 AR084 |
| | |
| | | AMG Funds Annual Report — October 31, 2021 |
| | | | | | |
| | | |
| | | | | | | |
| | | TABLE OF CONTENTS | | PAGE | |
| | | | |
| | | LETTER TO SHAREHOLDERS | | | 2 | |
| | | |
| | | ABOUT YOUR FUND’S EXPENSES | | | 3 | |
| | | |
| | | PORTFOLIO MANAGER’S COMMENTS, FUND SNAPSHOTS AND SCHEDULES OF PORTFOLIO INVESTMENTS | | | | |
| | | |
| | | AMG Veritas China Fund | | | 4 | |
| | | |
| | | AMG Veritas Global Focus Fund | | | 10 | |
| | | |
| | | FINANCIAL STATEMENTS | | | | |
| | | |
| | | Statement of Assets and Liabilities | | | 18 | |
| | | |
| | | Balance sheets, net asset value (NAV) per share computations
and cumulative distributable earnings (loss) | | | | |
| | | |
| | | Statement of Operations | | | 20 | |
| | | |
| | | Detail of sources of income, expenses, and realized and
unrealized gains (losses) during the fiscal year | | | | |
| | | |
| | | Statements of Changes in Net Assets | | | 21 | |
| | | |
| | | Detail of changes in assets for the past two fiscal years | | | | |
| | | |
| | | Financial Highlights | | | 22 | |
| | | |
| | | Historical net asset values per share, distributions, total returns, income
and expense ratios, turnover ratios and net assets | | | | |
| | | |
| | | Notes to Financial Statements | | | 26 | |
| | | |
| | | Accounting and distribution policies, details of agreements and
transactions with Fund management and affiliates, and descriptions of
certain investment risks | | | | |
| | | |
| | | REPORT OF INDEPENDENT REGISTERED PUBLIC ACCOUNTING FIRM | | | 33 | |
| | | |
| | | OTHER INFORMATION | | | 34 | |
| | | |
| | | TRUSTEES AND OFFICERS | | | 36 | |
| | | |
| | | ANNUAL RENEWAL OF INVESTMENT MANAGEMENT AND SUBADVISORY AGREEMENTS | | | 39 | |
| | | |
| | | APPROVAL OF SUBADVISORY AGREEMENT | | | 42 | |
| | | | | | |
|
| Nothing contained herein is to be considered an offer, sale or solicitation of an offer to buy shares of any series of the AMG Funds Family of Funds. Such offering is made only by prospectus, which includes details as to offering price and other material information. | |
| | |
| | Letter to Shareholders |
Dear Shareholder:
The fiscal year ended October 31, 2021, was marked by the continued extraordinary recovery amid an unprecedented global effort to stop the COVID-19 pandemic. Equities rallied to new record highs amid better-than-expected corporate earnings, colossal fiscal and monetary stimulus programs, and an improving economic backdrop. Since the market bottom on March 23, 2020, the S&P 500® Index has gained over 111%. Businesses and consumers contended with disrupted supply chains and rising prices on a wide range of goods such as lumber and gasoline, and outbreaks of coronavirus variants kept the world on edge. Volatility increased in September as investors grew more concerned about rising inflation and more hawkish global central bank policies, but equities were resilient and finished the fiscal year with a strong rally.
The S&P 500® gained 42.91% during the period and all sectors produced double-digit returns, but there was very wide dispersion in performance. Energy and financials led the market with returns of 111.38% and 72.14%, respectively. On the other hand, utilities and consumer staples lagged with returns of 10.64% and 19.02%, respectively. Value stocks edged out Growth stocks as the Russell 1000® Value Index returned 43.76% compared to the 43.21% return for the Russell 1000® Growth Index. Small cap stocks outperformed as the Russell 2000® Index experienced its best quarter (fourth quarter 2020) on record. Within small caps, the Value-Growth disparity was much more pronounced as the Russell 2000® Value Index returned 64.30% compared to 38.45% for the Russell 2000® Growth Index. Outside the U.S., foreign developed markets lagged their U.S. counterparts with a 34.18% return for the MSCI EAFE Index. A major regulatory crackdown in China shook investor confidence in Chinese equities and caused emerging markets to underperform with a 16.96% return for the MSCI Emerging Markets Index.
Interest rates lifted off from near-historic lows as the vaccine rollout initiated a return to normalcy and the economic outlook improved. The 10-year Treasury yield rose 69 basis points to 1.55% and ended the fiscal year not far off its post-pandemic high. The Bloomberg U.S. Aggregate Bond Index, a broad measure of U.S. bond market performance, lost 0.48% over the period. Healthy risk appetite drove credit spreads tighter and helped investment-grade corporate bonds produce a modestly positive 2.18% return. The global search for yield helped high-yield bonds outperform the investment-grade market with a 10.53% return as measured by the return of the Bloomberg U.S. Corporate High Yield Bond Index. Municipal bonds benefited from a strong technical backdrop and drove a 2.64% return for the Bloomberg Municipal Bond Index.
AMG Funds appreciates the privilege of providing investment tools to you and your clients. Our foremost goal is to provide investment solutions that help our shareholders successfully reach their long-term investment goals. AMG Funds provides access to a distinctive array of actively managed return-oriented investment strategies. We thank you for your continued confidence and investment in AMG Funds. You can rest assured that under all market conditions our team is focused on delivering excellent investment management services for your benefit.
Respectfully,
Keitha Kinne
President
AMG Funds
| | | | | | | | | | | | | | |
| Average Annual Total Returns | | Periods ended
October 31, 2021* | |
| | | | |
| Stocks: | | | | 1 Year | | | 3 Years | | | 5 Years | |
| | | | |
Large Cap | | (S&P 500® Index) | | | 42.91 | % | | | 21.48% | | | | 18.93% | |
| | | | |
Small Cap | | (Russell 2000® Index) | | | 50.80 | % | | | 16.47% | | | | 15.52% | |
| | | | |
International | | (MSCI All Country World Index ex USA) | | | 29.66 | % | | | 12.00% | | | | 9.77% | |
| Bonds: | | | | | | | | | | | |
| | | | |
Investment Grade | | (Bloomberg U.S. Aggregate Bond Index) | | | (0.48 | )% | | | 5.63% | | | | 3.10% | |
| | | | |
High Yield | | (Bloomberg U.S. Corporate High Yield Bond Index) | | | 10.53 | % | | | 7.43% | | | | 6.40% | |
| | | | |
Tax-exempt | | (Bloomberg Municipal Bond Index) | | | 2.64 | % | | | 5.17% | | | | 3.41% | |
| | | | |
Treasury Bills | | (ICE BofAML U.S. 6-Month Treasury Bill Index) | | | 0.11 | % | | | 1.37% | | | | 1.32% | |
*Source: FactSet. Past performance is no guarantee of future results.
2
|
About Your Fund’s Expenses |
| | | | | | | | |
As a shareholder of a Fund, you may incur two types of costs: (1) transaction costs, which may include sales charges (loads) on purchase payments; redemption fees; and exchange fees; and (2) ongoing costs, including management fees; distribution (12b-1) fees; and other Fund expenses. This example is intended to help you understand your ongoing costs (in dollars) of investing in the Fund and to compare these costs with the ongoing costs of investing in other mutual funds. The example is based on $1,000 invested at the beginning of the period and held for the entire period as indicated below. ACTUAL EXPENSES The first line of the following table provides information about the actual account values and | | | | actual expenses. You may use the information in this line, together with the amount you invested, to estimate the expenses that you paid over the period. Simply divide your account value by $1,000 (for example, an $8,600 account value divided by $1,000 = 8.6), then multiply the result by the number in the first line under the heading entitled “Expenses Paid During Period” to estimate the expenses you paid on your account during this period. HYPOTHETICAL EXAMPLE FOR COMPARISON PURPOSES The second line of the following table provides information about hypothetical account values and hypothetical expenses based on the Fund’s actual expense ratio and an assumed annual rate of return of 5% before expenses, which is not the Fund’s | | | | actual return. The hypothetical account values and expenses may not be used to estimate the actual ending account balance or expenses you paid for the period. You may use this information to compare the ongoing costs of investing in the Fund and other funds by comparing this 5% hypothetical example with the 5% hypothetical examples that appear in the shareholder reports of other funds. Please note that the expenses shown in the table are meant to highlight your ongoing costs only and do not reflect any transactional costs, such as sales charges (loads), redemption fees, or exchange fees. Therefore, the second line of the table is useful in comparing ongoing costs only, and will not help you determine the relative total costs of owning different funds. |
| | | | | | | | |
| | | | | | | | |
Six Months Ended October 31, 2021 | | Expense
Ratio for
the Period | | Beginning
Account
Value
05/01/21 | | Ending
Account
Value
10/31/21 | | Expenses
Paid
During
the Period* |
AMG Veritas China Fund |
|
Based on Actual Fund Return |
| | | | |
Class N | | 1.17% | | $1,000 | | $853 | | $5.46 |
| | | | |
Class I | | 0.93% | | $1,000 | | $854 | | $4.35 |
|
Based on Hypothetical 5% Annual Return |
| | | | |
Class N | | 1.17% | | $1,000 | | $1,019 | | $5.96 |
| | | | |
Class I | | 0.93% | | $1,000 | | $1,021 | | $4.74 |
AMG Veritas Global Focus Fund |
|
Based on Actual Fund Return |
| | | | |
Class N | | 1.13% | | $1,000 | | $1,042 | | $5.82 |
| | | | |
Class I | | 0.88% | | $1,000 | | $1,044 | | $4.53 |
|
Based on Hypothetical 5% Annual Return |
| | | | |
Class N | | 1.13% | | $1,000 | | $1,020 | | $5.75 |
| | | | |
Class I | | 0.88% | | $1,000 | | $1,021 | | $4.48 |
| * | Expenses are equal to the Fund’s annualized expense ratio multiplied by the average account value over the period, multiplied by the number of days in the most recent fiscal half-year (184), then divided by 365. |
3
|
AMG Veritas China Fund Portfolio Manager’s Comments (unaudited) |
| | | | | | | | |
For the 12 months ended October 31, 2021, AMG Veritas China Fund (formerly AMG Managers Emerging Opportunities Fund) (the “Fund”) Class N shares returned 30.40%, compared with the (9.21)% return for the MSCI China Index, the Fund’s current benchmark, and the 62.54% return for the Russell Microcap® Index, the Fund’s former benchmark. On March 17-18, 2021, the Fund’s Board of Trustees approved the appointment of Veritas Asset Management LLP (“Veritas”) as interim subadviser to the Fund. On May 21, 2021, the Fund’s Principal Investment Strategies changed from primarily investing in U.S. micro-cap stocks to investing primarily in securities of issuers located in China or issuers that are not located in China but derive a majority of their income from China. Finally, on June 25, 2021, the Fund’s shareholders approved the appointment of Veritas as the subadviser to the Fund. Also approved was the change in the Fund’s name, its benchmark, and a change to the Fund’s sub-classification from “diversified” to “non-diversified”. MARKET OVERVIEW China in the 1980s was one of the poorest countries in the world. Since the launch of the economic reforms in the late 70s, about 800 million Chinese people have been lifted out of poverty, which is unprecedented in human history. Despite this success, there are still 600 million Chinese who earn about 1,000 yuan (US$141) per capita a month, according to Chinese Premier Li Keqiang. Although their income is above the poverty line, they can hardly afford a decent life. Their lives remain difficult, and they can only maintain a basic living and can hardly afford rental in a mid-size city. Among the 600 million low-income population, 36.2% are in the central provinces and 34.8% in western regions. Despite China’s status as an upper middle-income country of per capita GDP exceeding US$10,000, as well as the largest consumer of luxury goods globally, there is a widening wealth gap, which is a side effect of uneven development over the past 40 years. China in some ways resembles the Gilded Age United States of the late 1800s, as its huge prosperity | | | | and display of ostentatious wealth obscures the vulnerability of the population. In the long term, China’s success in building a prosperous society where wealth is shared by more people will make society more stable and this rise of a large educated middle class will lead to greater consumption power in China. From an investment point of view, this can be quite positive for the longer term despite the short-term misgivings of investors fearing uncertainty. We believe that investing in China is changing. Companies who ruthlessly exploit workers and disregard their social responsibilities are unlikely to do well in the new era. The unbridled capitalism of the previous decades is no longer tolerated by the people and government. In China, the winners of the future are likely to be companies that work not only for their shareholders but for all stakeholders including their workers and society at large, and at Veritas our stock-by-stock basis of navigating markets seeks to identify such companies that meet our high criteria and then wait for the opportunity to invest in them at attractive valuations. PERFORMANCE REVIEW During the period from November 1, 2020 to May 18, 2021, the Fund outperformed its former benchmark, the Russell Microcap® Index. The Fund benefited from strong performance across a number of sectors, most notably in health care, financials, and consumer staples. This was offset somewhat by detractors in the consumer discretionary sector. For the remainder of the period, the Fund outperformed its current benchmark, the MSCI China Index. The underperformance of the Asian markets and especially Chinese-related stocks was notable during the second half of the period, with the MSCI China Index falling (18.6)% in USD terms during the third calendar quarter due to China regulatory concerns over the technology and education sectors. In addition, investors were worried about the potential regulatory concerns on Hong Kong property and Macau casinos. The better-than-market performance of a number of the Fund’s holdings, especially in environmental sector, mitigated the fall. POSITIONING AND OUTLOOK Our main focus for new ideas continues to be on our Green China theme as we seek opportunities within renewable energy/new energy solutions in China. | | | | There are many interesting companies with strong business models which in some cases are world leaders in their field but are yet to be discovered by investors outside China. We have been researching this space methodically and it is very likely that the Fund could add on to the Fund’s current position of some of the best companies in the sector—companies such as Sungrow Power Supply and Shenzhen Inovance. Sungrow Power Supply is one of the world’s largest solar inverter manufacturers, a strong beneficiary as the world embarks on the path of decarbonization. It is taking market share in a fast-growing market. Earlier this year the stock was down (60)% from its peak at one point as some investors decided that it might be a good idea to rotate from growth to value. Shenzhen Inovance is a leader in research, development, manufacturing, and distribution of industrial automation control products and new energy-related products. It benefits from the burgeoning growth in industrial automation in manufacturing as well as the fast growth in electric vehicles. We took advantage of the volatility and built a good position in the business. In both cases, we saw volatility as an opportunity to get more invested in a company we like for the longer term. Our in-depth knowledge and grasp of the fundamentals of these companies gave us the conviction to add or initiate positions in what we believe to be wonderful business franchises at very attractive valuations. When it comes to investment, the times when it is most uncomfortable to invest can prove to be the most rewarding if one has a sufficiently long time horizon and investments are based on deep-dive fundamental analysis of companies. This commentary reflects the viewpoints of Veritas Asset Management LLP as of October 31, 2021 and is not intended as a forecast or guarantee of future results. |
| | | | | | | | |
4
|
AMG Veritas China Fund Portfolio Manager’s Comments (continued) |
CUMULATIVE TOTAL RETURN PERFORMANCE
AMG Veritas China Fund’s cumulative total return is based on the daily change in net asset value (NAV), and assumes that all dividends and distributions were reinvested. This graph compares a hypothetical $10,000 investment made in the AMG Veritas China Fund’s Class N shares on October 31, 2011, to a $10,000 investment made in the MSCI China Index and Russell Microcap® Index for the same time period. The graph and table do not reflect the deduction of taxes that a shareholder would pay on a Fund distribution or redemption of shares. The listed returns for the Fund are net of expenses and the returns for the indexes exclude expenses. Total returns would have been lower had certain expenses not been reduced.
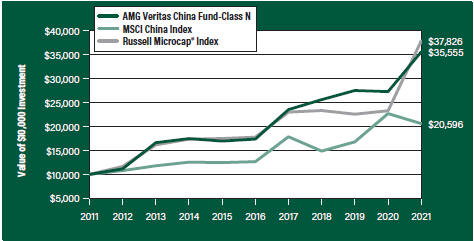
The table below shows the average annual total returns for the AMG Veritas China Fund, MSCI China Index and Russell Microcap® Index for the same time periods ended October 31, 2021.
| | | | | | | | | | | | |
| Average Annual Total Returns1 | | One
Year | | | Five
Years | | | Ten
Years | |
AMG Veritas China Fund2, 3, 4, 5, 6, 7, 8, 9, 10, 11, 12, 13, 14, 15, 16, 17, 18, 19, 20, 21 | |
| | | |
Class N | | | 30.40 | % | | | 15.41 | % | | | 13.53 | % |
| | | |
Class I | | | 30.75 | % | | | 15.70 | % | | | 13.81 | % |
| | | |
MSCI China Index22 | | | (9.21 | %) | | | 10.23 | % | | | 7.49 | % |
| | | |
Russell Microcap® Index23 | | | 62.54 | % | | | 16.33 | % | | | 14.23 | % |
The performance data shown represents past performance. Past performance is not a guarantee of future results. Current performance may be lower or higher than the performance data quoted. The investment return and principal value of an investment will fluctuate so that an investor’s shares, when redeemed, may be worth more or less than their original cost.
Investors should carefully consider the Fund’s investment objectives, risks, charges and expenses before investing. For performance information through the most recent month end, current net asset values per share for the Fund and other information, please call 800.548.4539 or visit our website at amgfunds.com for a free prospectus. Read it carefully before investing or sending money.
Distributed by AMG Distributors, Inc., member FINRA/SIPC.
| 1 | Total return equals income yield plus share price change and assumes reinvestment of all dividends and capital gain distributions. Returns are net of fees and may reflect offsets of Fund expenses as described in the prospectus. No adjustment has been made for taxes payable by shareholders on their reinvested dividends and capital gain distributions. Returns for periods greater than one year are annualized. The listed returns on the Fund are net of expenses and based on the published NAV as of October 31, 2021. All returns are in U.S. dollars ($). |
| 2 | As of May 21, 2021, the Fund’s Subadviser was changed to Veritas Asset Management LLP. Prior to May 21, 2021, the Fund was known as the AMG Managers Emerging Opportunities Fund and had different principal investment |
|
strategies and corresponding risks. Performance shown for periods prior to May 21, 2021, reflects the performance and investment strategies of the Fund’s previous Subadvisors, Next Century Growth Investors LLC, WEDGE Capital Management L.L.P. and RBC Global Asset Management (U.S.) Inc. The Fund’s past performance would have been different if the Fund were managed by the current Subadviser and strategy, and the Fund’s prior performance record might be less pertinent for investors considering whether to purchase shares of the Fund. |
| |
3 From time to time, the Fund’s advisor has waived its fees and/or absorbed Fund expenses, which has resulted in higher returns. |
| |
4 Investing in initial public offerings (IPOs) is risky and the prices of stocks purchased in IPOs tend to fluctuate more widely than stocks of companies that have been publicly traded for a longer period of time. Stocks purchased in IPOs generally do not have a trading history, and information about the companies may be available for very limited periods. |
| |
5 Companies that are in similar businesses may be similarly affected by particular economic or market events; to the extent the Fund has substantial holdings within a particular sector, the risks associated with that sector increase. |
| |
6 The Fund is subject to currency risk resulting from fluctuations in exchange rates that may affect the total loss or gain on a non-U.S. Dollar investment when converted back to U.S. Dollars. |
| |
7 Market prices of investments held by the Fund may fall rapidly or unpredictably due to a variety of economic or political factors, market conditions, disasters or public health issues, or in response to events that affect particular industries or companies. |
| |
8 To the extent the Fund focuses its investments in a particular country, group of countries or geographic region, the Fund is particularly susceptible to economic, political, regulatory or other events or conditions affecting such countries or region, and the NAV maybe more volatile than the NAV of a more geographically diversified fund and may result in losses. |
| |
9 When the Fund has a significant cash balance for a sustained period, the benefit to the Fund of any market upswing may likely be reduced, and the performance may be adversely affected. |
| |
10 An investment in participatory notes is subject to market risk. The performance results of participatory notes may not exactly replicate the performance of the underlying securities. An investment in participatory notes is also subject to counterparty risk, relating to the non-U.S. bank or broker-dealer that issues the participatory notes, and may be subject to liquidity risk. |
5
|
AMG Veritas China Fund Portfolio Manager’s Comments (continued) |
| | | | | | | | |
11 Changes in the general political and social environment of a country can have substantial effects on the value of investments exposed to that country. 12 The application of the tax laws and regulations of the People’s Republic of China (“PRC”) to income, including capital gains, derived from certain investments of the Fund remains unclear, and may well continue to evolve, possibly with retroactive effect. Any taxes imposed on the investments of the Fund pursuant to such laws and regulations will reduce the overall returns. 13 Trading in China A-Shares through Stock Connect is subject to sudden changes in quota limitations, application of trading suspensions, differences in trading days between the People’s Republic of China and Stock Connect, operational risk, clearing and settlement risk and regulatory and taxation risk. 14 The Fund may not be able to value its investments in a manner that accurately reflects their market values, and the Fund may not be able to sell an investment at a price equal to the valuation ascribed to that investment by the Fund. 15 The Fund is subject to the risks associated with investments in emerging markets, such as erratic earnings patterns, economic and political instability, changing exchange controls, limitations on repatriation of foreign capital and changes in local governmental attitudes toward private | | | | investment, possibly leading to nationalization or confiscation of investor assets. 16 A greater percentage of the Fund’s holdings may be focused in a smaller number of securities which may place the Fund at greater risk than a more diversified fund. 17 Investments in international securities are subject to certain risks of overseas investing including currency fluctuations and changes in political and economic conditions, which could result insignificant market fluctuations. These risks are magnified in emerging markets. 18 The Fund invests in large-capitalization companies that may underperform other stock funds (such as funds that focus on small-and medium-capitalization companies) when stocks of large-capitalization companies are out of favor. 19 The Fund is subject to risks associated with investments in mid-capitalization companies such as greater price volatility, lower trading volume, and less liquidity than the stocks of larger, more established companies. 20 The Fund is subject to risks associated with investments in small-capitalization companies, such as erratic earnings patterns, competitive conditions, limited earnings history and a reliance on one or a limited number of products. 21 The Fund invests in value stocks, which may perform differently from the market as a whole and | | | | may be undervalued by the market for a long period of time. 22 On May 21, 2021, the primary benchmark changed from the Russell Microcap® Index to the MSCI China Index. The MSCI China Index captures large and mid cap representation across China A shares, H shares, B shares, Red chips, P chips and foreign listings (e.g. ADRs). Unlike the Fund, the MSCI China Index is unmanaged, is not available for investment and does not incur expenses. 23 The Russell Microcap® Index tracks the microcap segment of the U.S. equity market. It makes up less than 3% of the U.S. equity market and is represented by the smallest 1,000 securities in the small-cap Russell 2000® Index plus the next 1,000 securities. Unlike the Fund, the Russell Microcap® Index is unmanaged, is not available for investment, and does not incur expenses. All MSCI data is provided ‘as is’. The products described herein are not sponsored or endorsed and have not been reviewed or passed on by MSCI. In no event shall MSCI, its affiliates or any MSCI data provider have any liability of any kind in connection with the MSCI data or the products described herein. The Russell Microcap® Index is a trademark of the London Stock Exchange Group companies. Not FDIC insured, nor bank guaranteed. May lose value. |
| | | | | | | | |
6
|
AMG Veritas China Fund Fund Snapshots (unaudited) October 31, 2021 |
| | |
PORTFOLIO BREAKDOWN |
Sector | | %of
Net Assets |
| | |
Industrials | | 34.1 |
| | |
Consumer Discretionary | | 13.5 |
| | |
Health Care | | 13.0 |
| | |
Consumer Staples | | 7.9 |
| | |
Materials | | 6.5 |
| | |
Information Technology | | 6.3 |
| | |
Real Estate | | 1.2 |
| | |
Short-Term Investments | | 17.6 |
| | |
Other Assets Less Liabilities | | (0.1) |
| | |
TOP TEN HOLDINGS |
Security Name | | %of
Net Assets |
| | |
| | |
Sungrow Power Supply Co., Ltd., Class A (China) | | 7.8 |
| | |
Shenzhen Inovance Technology Co., Ltd., Class A (China) | | 7.0 |
| | |
Zhejiang Shuanghuan Driveline Co., Ltd. (CLSA Ltd.) (China) | | 6.6 |
| | |
Guangzhou Kingmed Diagnostics Group Co., Ltd., Class A (China) | | 6.0 |
| | |
Estun Automation Co., Ltd., Class A (China) | | 5.5 |
| | |
Zhejiang Sanhua Intelligent Controls Co., Ltd., Class A (China) | | 4.5 |
| | |
Yunnan Energy New Material Co., Ltd., Class A (China) | | 4.2 |
| | |
Midea Group Co., Ltd., Class A (China) | | 3.6 |
| | |
Contemporary Amperex Technology Co., Ltd. (China) | | 3.4 |
| | |
Hangzhou First Applied Material Co., Ltd., Class A (China) | | 3.4 |
| | | |
| | |
Top Ten as a Group | | 52.0 |
| | | |
| | | |
Because a fund’s strategy may result in multiple investments in particular sectors of the economy, its performance may depend on the performance of those sectors and may fluctuate more widely than investments diversified across more sectors. For additional information on these and other risk considerations, please see the Fund’s prospectus.
Any sectors, industries, or securities discussed should not be perceived as investment recommendations. Mention of a specific security should not be considered a recommendation to buy or solicitation to sell that security. Specific securities mentioned in this report may have been sold from the Fund’s portfolio of investments by the time you receive this report.
7
|
AMG Veritas China Fund Schedule of Portfolio Investments October 31, 2021 |
| | | | | | | | |
| | | Shares | | | Value | |
| | |
Common Stocks - 75.9% | | | | | | | | |
| |
Consumer Discretionary - 6.9% | | | | | |
| | |
JS Global Lifestyle Co., Ltd. (Hong Kong)1 | | | 2,309,100 | | | | $4,276,157 | |
| | |
Midea Group Co., Ltd., Class A (China) | | | 437,196 | | | | 4,689,630 | |
| | |
Total Consumer Discretionary | | | | | | | 8,965,787 | |
| |
Consumer Staples - 7.9% | | | | | |
| | |
By-health Co., Ltd. (China) | | | 599,960 | | | | 2,388,272 | |
| | |
Chongqing Fuling Zhacai Group Co., Ltd., Class A (China) | | | 717,270 | | | | 3,908,713 | |
| | |
Kweichow Moutai Co., Ltd., Class A (China) | | | 14,000 | | | | 3,995,024 | |
| | |
Total Consumer Staples | | | | | | | 10,292,009 | |
| |
Health Care - 13.0% | | | | | |
| | |
Guangzhou Kingmed Diagnostics Group Co., Ltd., Class A (China) | | | 433,944 | | | | 7,788,666 | |
| | |
Jinxin Fertility Group, Ltd. (China)*,1 | | | 1,454,400 | | | | 2,051,321 | |
| | |
JW Cayman Therapeutics Co., Ltd. (China)*,1 | | | 746,000 | | | | 1,364,666 | |
| | |
WuXi AppTec Co., Ltd., Class A (China) | | | 185,703 | | | | 4,001,983 | |
| | |
Wuxi Biologics Cayman, Inc. (China)*,1 | | | 121,700 | | | | 1,843,386 | |
| | |
Total Health Care | | | | | | | 17,050,022 | |
| |
Industrials - 34.1% | | | | | |
| | |
Centre Testing International Group Co., Ltd., Class A (China) | | | 240,700 | | | | 1,037,575 | |
| | |
Contemporary Amperex Technology Co., Ltd. (China) | | | 45,000 | | | | 4,507,743 | |
| | |
Estun Automation Co., Ltd., Class A (China) | | | 1,723,567 | | | | 7,136,203 | |
| | |
Guangzhou GRG Metrology & Test Co., Ltd., Class A (China)* | | | 859,936 | | | | 3,457,917 | |
| | |
Shenzhen Inovance Technology Co., Ltd., Class A (China) | | | 902,354 | | | | 9,193,919 | |
| | |
Sungrow Power Supply Co., Ltd., Class A (China) | | | 396,014 | | | | 10,178,962 | |
| | |
Xinyi Glass Holdings, Ltd. (Hong Kong) | | | 1,128,000 | | | | 3,178,644 | |
| | |
Zhejiang Sanhua Intelligent Controls Co., Ltd., Class A (China) | | | 1,599,885 | | | | 5,929,973 | |
| | |
Total Industrials | | | | | | | 44,620,936 | |
| |
Information Technology - 6.3% | | | | | |
| | |
Hangzhou First Applied Material Co., Ltd., Class A (China) | | | 200,000 | | | | 4,488,241 | |
| | | | | | | | |
| | | Shares | | | Value | |
| | |
Wuxi Lead Intelligent Equipment Co., Ltd., Class A (China) | | | 299,996 | | | | $3,822,381 | |
| | |
Total Information Technology | | | | | | | 8,310,622 | |
| |
Materials - 6.5% | | | | | |
| | |
Shandong Sinocera Functional Material Co., Ltd., Class A (China) | | | 460,341 | | | | 3,070,456 | |
| | |
Yunnan Energy New Material Co., Ltd., Class A (China) | | | 119,904 | | | | 5,468,345 | |
| | |
Total Materials | | | | | | | 8,538,801 | |
| |
Real Estate - 1.2% | | | | | |
| | |
Country Garden Services Holdings Co., Ltd. (China) | | | 200,000 | | | | 1,539,697 | |
Total Common Stocks
(Cost $107,671,524) | | | | | | | 99,317,874 | |
| |
Participation Notes - 6.6% | | | | | |
| |
Consumer Discretionary - 6.6% | | | | | |
| | |
Zhejiang Shuanghuan Driveline Co., Ltd. (CLSA Ltd.) (China) | | | 2,100,000 | | | | 8,627,350 | |
Total Participation Notes
(Cost $7,566,380) | | | | | | | 8,627,350 | |
| |
Short-Term Investments - 17.6% | | | | | |
| |
Other Investment Companies - 17.6% | | | | | |
| | |
Dreyfus Government Cash Management Fund, Institutional Shares, 0.03%2 | | | 7,629,806 | | | | 7,629,806 | |
| | |
Dreyfus Institutional Preferred Government Money Market Fund, Institutional Shares, 0.01%2 | | | 7,629,710 | | | | 7,629,710 | |
| | |
JPMorgan U.S. Government Money Market Fund, IM Shares, 0.03%2 | | | 7,860,996 | | | | 7,860,996 | |
| | |
Total Short-Term Investments
(Cost $23,120,512) | | | | | | | 23,120,512 | |
| | |
Total Investments - 100.1%
(Cost $138,358,416) | | | | | | | 131,065,736 | |
| |
Other Assets, less Liabilities - (0.1)% | | | | (175,187 | ) |
| | |
Net Assets - 100.0% | | | | | | | $130,890,549 | |
| * | Non-income producing security. |
| 1 | Security exempt from registration under Rule 144A of the Securities Act of 1933. This security may be resold in transactions exempt from registration, normally to qualified institutional buyers. At October 31, 2021, the value of these securities amounted to $9,535,530 or 7.3% of net assets. |
| 2 | Yield shown represents the October 31, 2021, seven day average yield, which refers to the sum of the previous seven days’ dividends paid, expressed as an annual percentage. |
The accompanying notes are an integral part of these financial statements.
8
|
AMG Veritas China Fund Schedule of Portfolio Investments (continued) |
The following table summarizes the inputs used to value the Fund’s investments by the fair value hierarchy levels as of October 31, 2021:
| | | | | | | | | | | | | | | | |
| | | Level 1 | | | Level 21 | | | Level 3 | | | Total | |
Investments in Securities | | | | | | | | | | | | | | | | |
| | | | |
Common Stocks† | | | — | | | | $99,317,874 | | | | — | | | | $99,317,874 | |
| | | | |
Participation Notes† | | | — | | | | 8,627,350 | | | | — | | | | 8,627,350 | |
| | | | |
Short-Term Investments | | | | | | | | | | | | | | | | |
| | | | |
Other Investment Companies | | $ | 23,120,512 | | | | — | | | | — | | | | 23,120,512 | |
| | | | | | | | | | | | | | | | |
Total Investments in Securities | | $ | 23,120,512 | | | | $107,945,224 | | | | — | | | | $131,065,736 | |
| | | | | | | | | | | | | | | | |
| † | All common stocks and participation notes held in the Fund are Level 2 securities. For a detailed breakout of common stocks and participation notes by major industry classification, please refer to the Fund’s Schedule of Portfolio Investments. |
| 1 | An external pricing service is used to reflect any impact on security value due to market movements between the time the Fund valued such foreign securities and the earlier closing of foreign markets. |
For the fiscal year ended October 31, 2021, there were no transfers in or out of Level 3.
The country allocation in the Schedule of Portfolio Investments at October 31, 2021, was as follows:
| | | | | |
| Country | | % of Long-Term
Investments |
China | | | | 93.1 | |
Hong Kong | | | | 6.9 | |
| | | | | |
| | | | 100.0 | |
| | | | | |
The accompanying notes are an integral part of these financial statements.
9
|
AMG Veritas Global Focus Fund Portfolio Manager’s Comments (unaudited) |
| | | | | | | | |
For the 12 months ended October 31, 2021, the AMG Veritas Global Focus Fund (formerly AMG FQ Tax-Managed U.S. Equity Fund) (the “Fund”) Class N Shares returned 35.54%, compared with the 40.42% return for the MSCI World Index, the Fund’s current benchmark, and the 43.90% return for the Russell 3000® Index, the Fund’s former benchmark. On March 17-18, 2021, the Fund’s Board of Trustees approved the appointment of Veritas Asset Management LLP (“Veritas”) as interim subadviser to the Fund. On May 21, 2021, the Fund’s Principal Investment Strategies changed from primarily investing in U.S equity securities to investing in a relatively select group of global companies. On June 25, 2021, the Fund’s shareholders approved the appointment of Veritas as the subadviser to the Fund and the change in the Fund’s name and its benchmark. Also approved was a change to the Fund’s sub-classification from “diversified” to “non-diversified”. MARKET OVERVIEW The hot arena for investing continued to be in growth companies with a huge pool of money chasing high-growth assets. With policy makers encouraging borrowing and risk taking, capital has rarely (if ever) been so cheap and available and consequently the competition to buy fast-growing companies is intense. Private equity, venture capital, public equity funds, and retail investors are all clamoring to buy these fast-growth businesses at ever-increasing valuation multiples. For many of these “investors” presumably the intention is to sell to someone else at an even higher valuation multiple. In addition to these momentum investors there are a large proportion of funds that are completely value agnostic, with one recent estimate putting fundamental long only and fundamental hedge funds at only 15% of total volume in the U.S. equity markets. In the private markets we have seen a number of transactions where the value placed on a company expands multiple times in a few months, not driven by better operating performance but by an expansion of the valuation multiple ascribed to the business. While perhaps most obvious in the private markets, this phenomenon is also visible in public markets. One deliberate consequence of our investment philosophy and process is that we are not drawn in to investing in the latest fashionable areas. In the moment, this can feel as though we are missing out on the party when these areas become substantial parts of the equity market and are driving market returns. However, unless both the nature of capital | | | | markets and the nature of human emotions has fundamentally changed, we think that, like all previous investing fads, the current one will end badly for those heavily exposed. In normal times, interest rates are set by market forces and represent the price of money, which is then used to measure investment risk and determine the present value of estimated future cash flows. However, since the global financial crisis this price has become distorted as policy makers around the world have held their collective thumbs on the monetary scales to keep the cost of money artificially low. As these policy makers are well aware, interest rates power is everything in the financial world. Holding interest rates artificially low undoubtedly leads to excessive risk-taking as investors who previously relied on safe interest income need to invest in higher risk assets to maintain the same level of return. After more than a decade of policy makers determining the price of money (which they have effectively set at zero) it seems that investors have become increasingly disoriented with many (high growth) companies’ valuations becoming dissociated from reality. One indication of this is how many investors now value companies not based on fundamentals but instead on “total addressable market” and “pro forma” long-run margin estimates. What they seem to miss in this work is how exceptional (based on historical examples) these companies would be if their forecasts prove correct. This is particularly the case in technological areas where rapid development increases the risk of a better solution being adopted and the existing technology thereby facing obsolescence within the long time horizon demanded by extreme valuations. PERFORMANCE REVIEW For the period from November 1, 2020 through May 18, 2021, the Fund modestly underperformed its former benchmark, the Russell 3000® Index. Stock selection results within the financials, consumer discretionary, and information technology sectors detracted the most from relative performance. This was partially offset by more positive results within the consumer staples and health care sectors. For the remainder of the period, the Fund modestly underperformed the MSCI World Index. The following details selected biggest contributors and detractors. Starting with contributors, Alphabet continued to perform well over the period. Google’s sprawling ecosystem includes the world’s most popular online search engine, mobile operating system (Android), streaming video site (YouTube), web browser (Chrome), and email platform (Gmail). | | | | These platforms all support Google’s core advertising business, which sells search, display, and video ads across its platforms. According to eMarketer, Google will likely account for 28.6% of all digital ad spending worldwide this year. Additionally, Google Cloud’s revenues surged 46% when last reported, as the usage of its Cloud services accelerated throughout the pandemic. While Google Cloud is not profitable yet, and it still ranks a distant third place in the Cloud infrastructure market, it continues to expand and secure a growing list of major partners, including Target, Home Depot, and Twitter. Google Cloud’s profitability should improve as it expands, but it can subsidize its growth with its higher-margin advertising business until that happens. There have been some concerns about valuation should interest rates rise, but any pullback may make the shares attractive given the current 26 times forward multiple. Thermo Fisher shares rose after the company said it anticipates total revenues of $40 billion for 2022, a 12% increase over its $36 billion in anticipated revenues for 2021. It has also increased expected earnings per share. The company’s 2022 figures assume 8% core organic revenue growth and $750 million of COVID-19 testing response revenue, as well as $6 billion in revenue from clinical research services provider PPD, which Thermo Fisher is set to acquire by the end of 2021. As announced in April, Thermo Fisher is to buy PPD for $17.4 billion in cash and the assumption of $3.5 billion in debt. The acquisition is expected to add $1.50 to its adjusted Earnings per Share (EPS) in the first 12 months after the deal closed. PPD complements Thermo Fisher in being a leader in clinical trials management (80% of revenue) and lab services, which offers lab capability to support clinical trials. The company has 165 facilities in 50 countries and in the last five years has been involved in 400 drug approvals. Thermo Fisher also authorized the repurchase of $3 billion of shares of its common stock in the open market which replaces the company’s existing repurchase authorization, of which $500 million was remaining. Among a number of announcements over the quarter, the company has announced a contract award from the U.S. Department of Defense (DoD) to ensure reliable domestic production of pipette tips, which are used in research and diagnostic labs to dispense precise amounts of liquid. Laboratory consumables have been vital in global COVID-19 mobilization, from sample collection vials for diagnostic test kits to lab plastics and materials for vaccine production and biobanking (biorepositories that store biological samples for use in research). Since the start of the pandemic, Thermo Fisher has |
| | | | | | | | |
10
|
AMG Veritas Global Focus Fund Portfolio Manager’s Comments (continued) |
| | | | | | | | |
invested more than $180 million to expand its laboratory consumables production and another $600 million to increase global bioprocessing capacity. Catalent is a contract drug manufacturer that has been involved in the manufacturing of COVID-19 vaccines, including those from Moderna, AstraZeneca, and Johnson & Johnson. As one of the world’s largest drug manufacturers, it makes 73 billion doses of drug and health products annually, with 83 of the world’s top 100 drug companies as its customers. Catalent spent much of the pandemic scaling its capacity to meet the massive demand for the production of COVID vaccines and treatments (it’s on track to deliver over a billion vaccine doses this year alone) while also continuing to manufacture a broad range of other medicines (including over 130 products in its development pipeline). This demand was highlighted in the period under review when it reported revenue rising 26% to $1.2 billion, while EPS jumped 29% to $1.16. Adjusted EBITDA came in at record levels, driven by “robust growth” in its biologics segment, which accounted for 48% of net sales. Catalent has made a number of recent acquisitions to further its position in growth areas, buying Juniper Pharmaceuticals, Paragon Bioservices, and MaSTherCell in a bid to cement its position as a leading biologics and gene therapy manufacturer. During the period under review, Catalent acquired Bettera Holdings to expand its manufacturing capabilities for vitamins and supplements for $1 billion. Bettera owns such candy brands as Jolly Rancher, Whoppers, and Milk Duds but more importantly is also a manufacturer in the gummi, soft chew, and lozenge segments of the nutritional market. Chewable forms of vitamins, such as gummies, are gaining popularity, especially among people who find swallowing pills difficult, and the market is expected to reach $9.3 billion by 2026, according to an independent report by Allied Market Research. The current market is less than $6 billion. The acquisition will enable Catalent to expand its current consumer health technology platform with a wider range of technologies and ready-to-market product libraries, as well as a variety of packaging options to meet customers’ branding needs. Given that Catalent is the leading global innovator of softgel and oral technologies, the acquisition of Bettera will allow the company to significantly accelerate the growth of its consumer health business. Turning to detractors, the largest detractor over the period was Alibaba. There has been an onslaught of regulatory measures coming out of China, not solely | | | | aimed at Alibaba and the tech sector, but increasingly more broad-reaching. President Xiaoping promoted the ideal of letting some “get rich first” before allowing others to catch up. President Xi is now looking to focus on this catch-up phase with “common prosperity” for all. The Chinese Central Financial and Economic Affairs Commission, chaired by Xi, has emphasized the need to “regulate excessively high incomes and encourage high-income groups and enterprises to return more to society.” In fact, Xi has mentioned the phrase “common prosperity” over 60 times this year, and while the focus has largely been on e-commerce and greater competition, there is increasing emphasis on fairer employment rights (health plans, pensions, pay, etc.), with clear implications for those sectors seen as discriminating against the poorer in society, including online education, property, and healthcare (drug prices). Events that have taken place against this backdrop include the suspension of the Ant Group IPO last November after Ant’s founder Jack Ma criticized the country’s banking system (Alibaba owns a third of Ant and uses its Alipay platform to facilitate customers’ online transactions), China’s State Administration for Market Regulation launching an antitrust probe into Alibaba’s e-commerce business (the company was eventually fined 18.23 billion yuan ($2.82 billion) and its e-commerce business forced to eliminate its exclusive deals with merchants, which impacted all the large e-commerce firms), and Alibaba missing its revenue forecast, raising fears that the mounting list of new government regulations was taking its toll. This was followed by an abrupt decision by Alibaba (again not alone) to invest 100 billion yuan ($15.5 billion) into China’s “common prosperity” initiatives for improving social equality over the next five years, which has raised even more questions about its growth and subservience to the Chinese government. Additionally, they are being encouraged to sell the 5% stake in Mango Excellent Media Co., a TV shopping and entertainment network based in the central province of Hunan, only nine months after buying the stake. On top of this, we have had the Didi IPO reprimand, which has led to claims that China plans to propose rules that would stop companies from going public in the U.S. if they have large amounts of sensitive consumer data (and thus questioning the Variable Interest Entity (“VIE”) structure.) Meanwhile, China launched an extensive overhaul of its online education sector, posted notices that online food platforms must respect the rights of delivery staff and ensure that those workers earn at least the local minimum income, and China’s | | | | government quietly appointed a director to the Board of ByteDance Ltd.’s key domestic subsidiary. The government has proposed to stop treating some of its businesses as so-called key software enterprises (“KSE”), a designation that conferred a preferential 10% tax rate, meaning tax rates will rise for the e-commerce companies, and on top of that a U.S. law that could delist shares of Chinese companies that don’t comply with new auditing rules within the next three years. Against this feed of perceived negative news, Alibaba shares have been weak, as has the wider Chinese market. Setting aside that some of the actions of the Chinese government might be seen as fair and responsible, the short-term landscape has unsettled investors’ views on the likes of Alibaba. It’s highly probable the company will continue to play a pivotal role in supporting growth within the Chinese economy and benefiting from digitalization in all aspects of life. One area likely to grow significantly is Cloud infrastructure, which is still in an early stage in China and an area in which Alibaba not only excels but is on the cusp of turning profitable. For context, Cloud is the most profitable business segment at Amazon and helped transform Microsoft from a Windows business. Alibaba currently trades at less than 15x earnings, the lowest multiple in its history as a public company, and management is raising the size of share buybacks. Arguably, the barriers to entry have been raised and new entrants are likely to spend less amid the current regulatory environment. Alibaba will keep investing and pursue multi-app strategies that will further drive the user base across multiple initiatives that are in the early phase of growth (online bargain shopping platform Taobao Deals and a marketplace for secondhand goods called Idle Fish). Canadian Pacific Railway (“CP”) has won a takeover battle for Kansas City Southern (“KCS”), after Canadian National Railway (“CNR”) declined to increase its offer, claiming an asset that would create the first railroad spanning the U.S., Canada, and Mexico. Given the recent trade deal between the three countries, the onshoring of companies back to the U.S. against trade tensions with China, and the positive solution trains offer companies trying to lower their carbon footprint, the deal should be additive in the longer term. KCS terminated its $30 billion agreement with CNR and agreed to CP’s $27 billion merger proposal. The turning point in the deal was a ruling by the regulator, the Surface Transportation Board (“STB”), which decided unanimously against CNR making use of a voting trust, which CP had already been granted. The STB |
| | | | | | | | |
11
|
AMG Veritas Global Focus Fund Portfolio Manager’s Comments (continued) |
| | | | | | | | |
| essentially prohibited large-scale railroad consolidation in 2001, and CP and KCS knew going in it would likely take until mid-2022 to win approval for this combination. That’s a long time for KCS shareholders to be left waiting for an uncertain payout and could be enough to discourage any merger attempt. CP, mindful of the long wait, structured the deal in such a way as to alleviate most of the risk for KCS holders. CP proposed establishing an independent voting trust that will acquire the shares once KCS holders approve the deal, and before regulators have sounded off. Holders of KCS shares would get their cash as outlined in the merger agreement, even though CP would not yet officially own KCS. The STB has already granted CP permission to set up a trust that would allow KCS shareholders to get paid even before the deal wins approval, eliminating the uncertainty. The STB has also said that due to CP and KCS both being smaller railroads, they had only to prove that their deal doesn’t harm competition. CNR, by contrast, would have any bid judged under a higher standard that requires it to prove its proposal would benefit shipping customers. The STB denied CNR permission to set up a voting trust and CNR has walked away from the potential merger. There is still an element of uncertainty as President Biden’s executive order from July is aimed at anti-competition maneuvers in the railroad industry, among others. The STB must still approve the KCS and CP deal with this new scrutiny in the backdrop. Regulators in Mexico and shareholders must approve it as well. This may explain the subdued share price, despite the positive outcome and results that beat expectations coupled with reiteration of full-year guidance of double-digit EPS growth. | | | | Safran reported revenue and earnings that fell in the first half, as expected from an aero-engine manufacturer, but it expects a better second half and confirmed its 2021 outlook for sales and profitability. Adjusted recurring operating income came to EUR 659 million ($778.8 million) in the period, down (30)% on year. Adjusted revenue came to EUR 6.88 billion, down (22)% from the previous year. Much of Safran’s revenue is made up of servicing and parts, which are charged on a per-kilometer-flown basis. As such, its shorter-term figures are largely determined by the number of planes flying and distance flown. In China, for example, after being over 2019 levels between March and May and then down in June, flights are now back at 2019 levels. In the U.S., they are (15)% below 2019 levels, and Europe is at (35)%, having been at (70)% in May. Asia Pacific ex China is still the most impacted area at (70)% from pre-pandemic levels. Safran owns an interiors business, supplying, among other things, the seating. Safran’s seats business saw a strong decline in business class programs as airlines weigh whether business class demand will return to pre-pandemic levels. In terms of engine deliveries, the combined shipment of CFM56 and LEAP engines reached 448 units in H1 2021 versus 534 units in H1 2020 (down 16%). The company has a backlog of more than 9,300 engines as of the end of June 2021 and 60% of the popular Airbus A320neo family. During the period, Indigo selected the LEAP engines for its fleet of 310 new Airbus A320 planes with a multi-year service agreement. Safran confirms its full-year 2021 outlook and its underlying | | | | assumptions in a context in which the level of uncertainty over the timing of recovery continues to prevail. A delay in the pace of civil aftermarket recovery during the second half of the year constitutes an element of risk to this outlook. Shares performed well in September as more routes were opening up. Safran expects adjusted recurring operating margin to increase above 100 bps, at least a 300 bp improvement versus H2 2020, and free cash flow generation to increase above 2020 levels. OUTLOOK The continued focus is on ensuring that the portfolio is the best quality it can be in terms of characteristics. There is a mix of higher growth companies like Alphabet, Amazon, and Meta Platforms, Inc., coupled with companies like Charter Communications, Canadian Pacific Railway, Airbus and BAE, which are slower growth. What they have in common is high return on capital (ROC) and very high barriers to entry to ensure they are difficult to compete with. Given either low leverage or high cash generation, we believe the Fund is well positioned to weather more difficult environments that are likely over the next few years. The Fund, as always, looks to add long-term value by protecting and growing capital in real terms. This commentary reflects the viewpoints of Veritas Asset Management LLP as of October 31, 2021 and is not intended as a forecast or guarantee of future results. |
| | | | | | | | |
12
|
AMG Veritas Global Focus Fund Portfolio Manager’s Comments (continued) |
CUMULATIVE TOTAL RETURN PERFORMANCE
AMG Veritas Global Focus Fund’s cumulative total return is based on the daily change in net asset value (NAV), and assumes that all dividends and distributions were reinvested. This graph compares a hypothetical $10,000 investment made in the AMG Veritas Global Focus Fund’s Class N shares on October 31, 2011, to a $10,000 investment made in the MSCI World Index and Russell 3000® Index for the same time period. The graph and table do not reflect the deduction of taxes that a shareholder would pay on a Fund distribution or redemption of shares. The listed returns for the Fund are net of expenses and the returns for the indexes exclude expenses. Total returns would have been lower had certain expenses not been reduced.
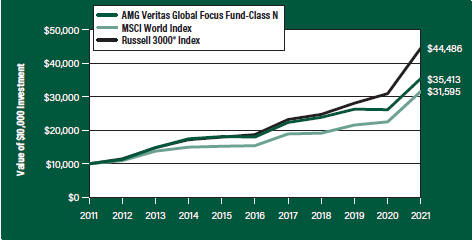
The table below shows the average annual total returns for the AMG Veritas Global Focus Fund, MSCI World Index and Russell 3000® Index for the same time periods ended October 31, 2021.
| | | | | | | | | | | | |
| Average Annual Total Returns1 | | One
Year | | | Five
Years | | | Ten
Years | |
AMG Veritas Global Focus Fund2, 3, 4, 5, 6, 7, 8, 9, 10, 11, 12, 13, 14 | | | | | |
| | | |
Class N | | | 35.54 | % | | | 14.54 | % | | | 13.48 | % |
| | | |
Class I | | | 35.85 | % | | | 14.82 | % | | | 13.76 | % |
| | | |
MSCI World Index15 | | | 40.42 | % | | | 15.45 | % | | | 12.19 | % |
| | | |
Russell 3000® Index16 | | | 43.90 | % | | | 18.91 | % | | | 16.10 | % |
The performance data shown represents past performance. Past performance is not a guarantee of future results. Current performance may be lower or higher than the performance data quoted. The investment return and principal value of an investment will fluctuate so that an investor’s shares, when redeemed, may be worth more or less than their original cost.
Investors should carefully consider the Fund’s investment objectives, risks, charges and expenses before investing. For performance information through the most recent month end, current net asset values per share for the Fund and other information, please call 800.548.4539 or visit our website at amgfunds.com for a free prospectus. Read it carefully before investing or sending money.
Distributed by AMG Distributors, Inc., member FINRA/SIPC.
| 1 | Total return equals income yield plus share price change and assumes reinvestment of all dividends and capital gain distributions. Returns are net of fees and may reflect offsets of Fund expenses as described in the prospectus. No adjustment has been made for taxes payable by shareholders on their reinvested dividends and capital gain distributions. Returns for periods greater than one year are annualized. The listed returns on the Fund are net of expenses and based on the published NAV as of October 31, 2021. All returns are in U.S. dollars ($). |
|
2 As of May 21, 2021, the Fund’s Subadviser was changed to Veritas Asset Management LLP. Prior to May 21, 2021, the Fund was known as the AMG FQ Tax-Managed U.S. Equity Fund and had different principal investment strategies and corresponding risks. Performance shown for periods prior to May 21, 2021, reflects the performance and investment strategies of the Fund’s previous Subadvisor, First Quadrant, L.P. The Fund’s past performance would have been different if the Fund were managed by the current Subadviser and strategy, and the Fund’s prior performance record might be less pertinent for investors considering whether to purchase shares of the Fund. 3 From time to time, the Fund’s advisor has waived its fees and/or absorbed Fund expenses, which has resulted in higher returns. 4 The Fund invests in large-capitalization companies that may underperform other stock funds (such as funds that focus on small- and medium-capitalization companies) when stocks of large-capitalization companies are out of favor. 5 The Fund is subject to currency risk resulting from fluctuations in exchange rates that may affect the total loss or gain on a non-U.S. Dollar investment when converted back to U.S. Dollars. 6 Market prices of investments held by the Fund may fall rapidly or unpredictably due to a variety of economic or political factors, market conditions, disasters or public health issues, or in response to events that affect particular industries or companies. |
7 When the Fund has a significant cash balance for a sustained period, the benefit to the Fund of any market upswing may likely be reduced, and the performance may be adversely affected. 8 Changes in the general political and social environment of a country can have substantial effects on the value of investments exposed to that country. 9 The Fund may not be able to value its investments in a manner that accurately reflects their market values, and the Fund may not be able to sell an investment at a price equal to the valuation ascribed to that investment by the Fund. 10 The Fund is subject to the risks associated with investments in emerging markets, such as erratic earnings patterns, economic and political instability, changing exchange controls, limitations on repatriation of foreign capital and changes in local governmental attitudes toward private investment, possibly leading to nationalization or confiscation of investor assets. 11 A greater percentage of the Fund’s holdings may be focused in a smaller number of securities which |
13
|
AMG Veritas Global Focus Fund Portfolio Manager’s Comments (continued) |
| | | | | | | | |
may place the Fund at greater risk than a more diversified fund. 12 Investments in international securities are subject to certain risks of overseas investing including currency fluctuations and changes in political and economic conditions, which could result insignificant market fluctuations. These risks are magnified in emerging markets. 13 The Fund may not be able to dispose of particular investments, such as illiquid securities, readily at favorable times or prices or the Fund may have to sell them at a loss. 14 In managing the Fund, the Fund’s Subadviser may rely heavily on one or more quantitative models (“Model”) and information and data supplied by third parties (“Data”). When a Model or Data used in managing the Fund contains an error, or is | | | | incorrect or incomplete, any investment decision made in reliance on the Model or Data may not produce the desired results and the Fund may realize losses. In addition, any hedging based on a faulty Model or Data may prove to be unsuccessful. 15 On May 21, 2021, the primary benchmark changed from the Russell 3000® Index to the MSCI World Index. The MSCI World Index is a free float-adjusted market capitalization weighted index that is designed to measure the equity market performance of developed markets. Please go to msci.com for most current list of countries represented by the index. Unlike the Fund, the MSCI World Index is unmanaged, is not available for investment and does not incur expenses. 16 The Russell 3000® Index is composed of the 3,000 largest U.S. companies as measured by market capitalization, and represents about 98% of the U.S. | | | | stock market. Unlike the Fund, the Russell 3000® Index is unmanaged, is not available for investment and does not incur expenses. All MSCI data is provided ‘as is’. The products described herein are not sponsored or endorsed and have not been reviewed or passed on by MSCI. In no event shall MSCI, its affiliates or any MSCI data provider have any liability of any kind in connection with the MSCI data or the products described herein. The Russell 3000® Index is a trademark of the London Stock Exchange Group companies. Not FDIC insured, nor bank guaranteed. May lose value. |
14
|
AMG Veritas Global Focus Fund Fund Snapshots (unaudited) October 31, 2021 |
PORTFOLIO BREAKDOWN
| | |
| Sector | | % of
Net Assets |
| | |
Health Care | | 29.5 |
| | |
Industrials | | 23.4 |
| | |
Communication Services | | 17.3 |
| | |
Information Technology | | 11.2 |
| | |
Consumer Discretionary | | 6.3 |
| | |
Financials | | 5.7 |
| | |
Consumer Staples | | 4.0 |
| | |
Short-Term Investments | | 2.7 |
| | |
Other Assets Less Liabilities | | (0.1) |
TOP TEN HOLDINGS
| | |
| Security Name | | % of
Net Assets |
Alphabet, Inc., Class A | | 8.5 |
| | |
Charter Communications, Inc., Class A | | 5.3 |
| | |
Microsoft Corp. | | 5.0 |
| | |
Canadian Pacific Railway, Ltd. (Canada) | | 4.7 |
| | |
UnitedHealth Group, Inc. | | 4.6 |
| | |
Thermo Fisher Scientific, Inc. | | 4.1 |
| | |
Amazon.com, Inc. | | 4.1 |
| | |
Unilever PLC (United Kingdom) | | 4.0 |
| | |
BAE Systems PLC (United Kingdom) | | 4.0 |
| | |
Vinci, S.A. (France) | | 3.9 |
| | | |
| | |
Top Ten as a Group | | 48.2 |
| | | |
Because a fund’s strategy may result in multiple investments in particular sectors of the economy, its performance may depend on the performance of those sectors and may fluctuate more widely than investments diversified across more sectors. For additional information on these and other risk considerations, please see the Fund’s prospectus.
Any sectors, industries, or securities discussed should not be perceived as investment recommendations. Mention of a specific security should not be considered a recommendation to buy or solicitation to sell that security. Specific securities mentioned in this report may have been sold from the Fund’s portfolio of investments by the time you receive this report.
15
|
AMG Veritas Global Focus Fund Schedule of Portfolio Investments October 31, 2021 |
| | | | | | | | |
| | | Shares | | | Value | |
| | |
Common Stocks - 97.4% | | | | | | | | |
| | |
Communication Services - 17.3% | | | | | | | | |
| | |
Alphabet, Inc., Class A (United States)* | | | 1,400 | | | | $4,145,288 | |
| | |
Charter Communications, Inc., Class A (United States)* | | | 3,850 | | | | 2,598,327 | |
| | |
Meta Platforms, Inc. (United States)* | | | 5,300 | | | | 1,714,921 | |
| | |
Total Communication Services | | | | | | | 8,458,536 | |
| | |
Consumer Discretionary - 6.3% | | | | | | | | |
| | |
Alibaba Group Holding, Ltd., Sponsored ADR (China)* | | | 6,500 | | | | 1,072,110 | |
| | |
Amazon.com, Inc. (United States)* | | | 600 | | | | 2,023,458 | |
| | |
Total Consumer Discretionary | | | | | | | 3,095,568 | |
| | |
Consumer Staples - 4.0% | | | | | | | | |
| | |
Unilever PLC (United Kingdom) | | | 36,900 | | | | 1,975,418 | |
| | |
Financials - 5.7% | | | | | | | | |
| | |
Intercontinental Exchange, Inc. (United States) | | | 10,600 | | | | 1,467,676 | |
| | |
Moody’s Corp. (United States) | | | 3,300 | | | | 1,333,695 | |
| | |
Total Financials | | | | | | | 2,801,371 | |
| | |
Health Care - 29.5% | | | | | | | | |
| | |
Baxter International, Inc. (United States) | | | 20,400 | | | | 1,610,784 | |
| | |
Becton Dickinson and Co. (United States) | | | 5,900 | | | | 1,413,581 | |
| | |
Catalent, Inc. (United States)* | | | 11,100 | | | | 1,530,246 | |
| | |
Cochlear, Ltd. (Australia) | | | 1,803 | | | | 301,574 | |
| | |
The Cooper Cos, Inc. (United States) | | | 3,400 | | | | 1,417,528 | |
| | |
CVS Health Corp. (United States) | | | 20,500 | | | | 1,830,240 | |
| | |
Illumina, Inc. (United States)* | | | 1,300 | | | | 539,578 | |
| | |
Sonic Healthcare, Ltd. (Australia) | | | 48,216 | | | | 1,463,090 | |
| | |
Thermo Fisher Scientific, Inc. (United States) | | | 3,200 | | | | 2,025,824 | |
| | |
UnitedHealth Group, Inc. (United States) | | | 4,900 | | | | 2,256,303 | |
| | |
Total Health Care | | | | | | | 14,388,748 | |
| | | | | | | | |
| | | Shares | | | Value | |
| | |
Industrials - 23.4% | | | | | | | | |
| | |
Aena SME SA (Spain)*,1 | | | 8,100 | | | | $1,330,316 | |
| | |
Airbus SE (France)* | | | 8,300 | | �� | | 1,064,741 | |
| | |
BAE Systems PLC (United Kingdom) | | | 259,000 | | | | 1,952,902 | |
| | |
Canadian Pacific Railway, Ltd. (Canada) | | | 29,600 | | | | 2,291,040 | |
| | |
CoStar Group, Inc. (United States)* | | | 13,500 | | | | 1,161,675 | |
| | |
Safran SA (France) | | | 12,700 | | | | 1,709,290 | |
| | |
Vinci, S.A. (France) | | | 17,900 | | | | 1,913,693 | |
| | |
Total Industrials | | | | | | | 11,423,657 | |
| | |
Information Technology - 11.2% | | | | | | | | |
| | |
Fiserv, Inc. (United States)* | | | 16,100 | | | | 1,585,689 | |
| | |
Mastercard, Inc., Class A (United States) | | | 4,200 | | | | 1,409,184 | |
| | |
Microsoft Corp. (United States) | | | 7,400 | | | | 2,453,988 | |
| | |
Total Information Technology | | | | | | | 5,448,861 | |
| | |
Total Common Stocks
(Cost $40,161,221) | | | | | | | 47,592,159 | |
| | |
Short-Term Investments - 2.7% | | | | | | | | |
| | |
Other Investment Companies - 2.7% | | | | | | | | |
| | |
Dreyfus Government Cash Management Fund, Institutional Shares, 0.03%2 | | | 431,811 | | | | 431,811 | |
| | |
Dreyfus Institutional Preferred Government Money Market Fund, Institutional Shares, 0.01%2 | | | 431,809 | | | | 431,809 | |
| | |
JPMorgan U.S. Government Money Market Fund, IM Shares, 0.03%2 | | | 444,896 | | | | 444,896 | |
| | |
Total Short-Term Investments
(Cost $1,308,516) | | | | | | | 1,308,516 | |
| | |
Total Investments - 100.1%
(Cost $41,469,737) | | | | | | | 48,900,675 | |
| | |
Other Assets, less Liabilities - (0.1)% | | | | | | | (72,439 | ) |
| | |
Net Assets - 100.0% | | | | | | | $48,828,236 | |
| * | Non-income producing security. |
| 1 | Security exempt from registration under Rule 144A of the Securities Act of 1933. This security may be resold in transactions exempt from registration, normally to qualified institutional buyers. At October 31, 2021, the value of these securities amounted to $1,330,316 or 2.7% of net assets. |
| 2 | Yield shown represents the October 31, 2021, seven day average yield, which refers to the sum of the previous seven days’ dividends paid, expressed as an annual percentage. |
ADR American Depositary Receipt
The accompanying notes are an integral part of these financial statements.
16
|
AMG Veritas Global Focus Fund Schedule of Portfolio Investments (continued) |
The following table summarizes the inputs used to value the Fund’s investments by the fair value hierarchy levels as of October 31, 2021:
| | | | | | | | | | | | | | | | |
| | | Level 1 | | | Level 21 | | | Level 3 | | | Total | |
Investments in Securities | | | | | | | | | | | | | | | | |
Common Stocks | | | | | | | | | | | | | | | | |
Health Care | | | $12,624,084 | | | | $1,764,664 | | | | — | | | | $14,388,748 | |
Industrials | | | 3,452,715 | | | | 7,970,942 | | | | — | | | | 11,423,657 | |
Communication Services | | | 8,458,536 | | | | — | | | | — | | | | 8,458,536 | |
Information Technology | | | 5,448,861 | | | | — | | | | — | | | | 5,448,861 | |
Consumer Discretionary | | | 3,095,568 | | | | — | | | | — | | | | 3,095,568 | |
Financials | | | 2,801,371 | | | | — | | | | — | | | | 2,801,371 | |
Consumer Staples | | | 1,975,418 | | | | — | | | | — | | | | 1,975,418 | |
Short-Term Investments | | | | | | | | | | | | | | | | |
Other Investment Companies | | | 1,308,516 | | | | — | | | | — | | | | 1,308,516 | |
| | | | | | | | | | | | | | | | |
Total Investments in Securities | | | $39,165,069 | | | | $9,735,606 | | | | — | | | | $48,900,675 | |
| | | | | | | | | | | | | | | | |
| 1 | An external pricing service is used to reflect any impact on security value due to market movements between the time the Fund valued such foreign securities and the earlier closing of foreign markets. |
For the fiscal year ended October 31, 2021, there were no transfers in or out of Level 3.
The country allocation in the Schedule of Portfolio Investments at October 31, 2021, was as follows:
| | | | |
| Country | | % of Long-Term
Investments | |
| |
Australia | | | 3.7 | |
| |
Canada | | | 4.8 | |
| |
China | | | 2.3 | |
| |
France | | | 9.8 | |
| |
Spain | | | 2.8 | |
| |
United Kingdom | | | 8.3 | |
| |
United States | | | 68.3 | |
| | | | |
| |
| | | 100.0 | |
| | | | |
The accompanying notes are an integral part of these financial statements.
17
|
Statement of Assets and Liabilities October 31, 2021 |
| | | | | | | | |
| | | AMG Veritas
China Fund | | | AMG Veritas
Global Focus
Fund | |
Assets: | | | | | | | | |
Investments at value1 | | | $131,065,736 | | | | $48,900,675 | |
Dividend and interest receivables | | | 4,449 | | | | 48,569 | |
Receivable for Fund shares sold | | | 14,418 | | | | 30,674 | |
Receivable from affiliate | | | 25,018 | | | | 14,648 | |
Prepaid expenses and other assets | | | 15,239 | | | | 11,348 | |
Total assets | | | 131,124,860 | | | | 49,005,914 | |
Liabilities: | | | | | | | | |
Payable for Fund shares repurchased | | | 32,332 | | | | 83,379 | |
Accrued expenses: | | | | | | | | |
Investment advisory and management fees | | | 77,776 | | | | 27,529 | |
Administrative fees | | | 16,431 | | | | 6,163 | |
Distribution fees | | | — | | | | 881 | |
Shareholder service fees | | | 23,405 | | | | — | |
Other | | | 84,367 | | | | 59,726 | |
| | |
Total liabilities | | | 234,311 | | | | 177,678 | |
| | |
| | | | | | | | |
| | |
Net Assets | | | $130,890,549 | | | | $48,828,236 | |
1 Investments at cost | | | $138,358,416 | | | | $41,469,737 | |
The accompanying notes are an integral part of these financial statements.
18
|
Statement of Assets and Liabilities (continued) |
| | | | | | | | |
| | | AMG Veritas
China Fund | | | AMG Veritas
Global Focus
Fund | |
| | |
Net Assets Represent: | | | | | | | | |
Paid-in capital | | | $138,711,664 | | | | $38,289,576 | |
Total distributable earnings (loss) | | | (7,821,115 | ) | | | 10,538,660 | |
Net Assets | | | $130,890,549 | | | | $48,828,236 | |
| | |
Class N: | | | | | | | | |
Net Assets | | | $111,536,788 | | | | $4,229,991 | |
Shares outstanding | | | 4,622,312 | | | | 213,117 | |
| | |
Net asset value, offering and redemption price per share | | | $24.13 | | | | $19.85 | |
Class I: | | | | | | | | |
Net Assets | | | $19,353,761 | | | | $44,598,245 | |
Shares outstanding | | | 762,672 | | | | 2,252,580 | |
| | |
Net asset value, offering and redemption price per share | | | $25.38 | | | | $19.80 | |
The accompanying notes are an integral part of these financial statements.
19
|
Statement of Operations For the fiscal year ended October 31, 2021 |
| | | | | | | | |
| | | AMG Veritas
China Fund | | | AMG Veritas
Global Focus
Fund | |
Investment Income: | | | | | | | | |
Dividend income | | | $1,940,829 | | | | $624,236 | |
Interest income | | | 457 | | | | — | |
Securities lending income | | | 18,982 | | | | 1,979 | |
Foreign withholding tax | | | (72,837 | ) | | | (4,318 | ) |
Total investment income | | | 1,887,431 | | | | 621,897 | |
Expenses: | | | | | | | | |
Investment advisory and management fees | | | 1,237,414 | | | | 444,372 | |
Administrative fees | | | 253,856 | | | | 96,419 | |
Distribution fees - Class N | | | — | | | | 17,091 | |
Shareholder servicing fees - Class N | | | 323,567 | | | | — | |
Reports to shareholders | | | 42,543 | | | | 26,443 | |
Professional fees | | | 39,526 | | | | 35,050 | |
Custodian fees | | | 39,477 | | | | 21,372 | |
Transfer agent fees | | | 33,487 | | | | 11,038 | |
Registration fees | | | 30,994 | | | | 28,048 | |
Trustee fees and expenses | | | 12,139 | | | | 4,571 | |
Miscellaneous | | | 6,442 | | | | 4,125 | |
Total expenses before offsets | | | 2,019,445 | | | | 688,529 | |
Expense reimbursements | | | (110,028 | ) | | | (100,614 | ) |
Expense reductions | | | (14,894 | ) | | | (1,632 | ) |
Net expenses | | | 1,894,523 | | | | 586,283 | |
| | |
| | | | | | | | |
Net investment income (loss) | | | (7,092 | ) | | | 35,614 | |
Net Realized and Unrealized Gain: | | | | | | | | |
Net realized gain on investments | | | 82,099,412 | | | | 44,152,685 | |
Net realized gain on foreign currency transactions | | | 186,095 | | | | 741 | |
Net change in unrealized appreciation/depreciation on investments | | | (34,376,117 | ) | | | (23,383,609 | ) |
Net change in unrealized appreciation/depreciation on foreign currency translations | �� | | — | | | | (374 | ) |
Net realized and unrealized gain | | | 47,909,390 | | | | 20,769,443 | |
| | |
| | | | | | | | |
Net increase in net assets resulting from operations | | | $47,902,298 | | | | $20,805,057 | |
The accompanying notes are an integral part of these financial statements.
20
|
Statements of Changes in Net Assets For the fiscal years ended October 31, |
| | | | | | | | | | | | | | | | |
| | | AMG Veritas
China Fund | | | AMG Veritas
Global Focus Fund | |
| | | 2021 | | | 2020 | | | 2021 | | | 2020 | |
| | | | |
Increase (Decrease) in Net Assets Resulting From Operations: | | | | | | | | | | | | | | | | |
Net investment income (loss) | | | $(7,092 | ) | | | $421,490 | | | | $35,614 | | | | $292,463 | |
Net realized gain on investments | | | 82,285,507 | | | | 6,134,621 | | | | 44,153,426 | | | | 882,650 | |
Net change in unrealized appreciation/depreciation on investments | | | (34,376,117 | ) | | | (10,442,976 | ) | | | (23,383,983 | ) | | | (1,682,389 | ) |
| | | | |
Net increase (decrease) in net assets resulting from operations | | | 47,902,298 | | | | (3,886,865 | ) | | | 20,805,057 | | | | (507,276 | ) |
Distributions to Shareholders: | | | | | | | | | | | | | | | | |
From net investment income and/or realized gain on investments: | | | | | | | | | | | | | | | | |
Class N | | | (69,495,237 | ) | | | (12,148,476 | ) | | | (4,406,717 | ) | | | (30,370 | ) |
Class I | | | (17,304,541 | ) | | | (2,572,340 | ) | | | (37,275,412 | ) | | | (392,779 | ) |
From paid-in capital: | | | | | | | | | | | | | | | | |
Class N | | | (11,557,485 | ) | | | — | | | | — | | | | — | |
Class I | | | (2,877,852 | ) | | | — | | | | — | | | | — | |
Total distributions to shareholders | | | (101,235,115 | ) | | | (14,720,816 | ) | | | (41,682,129 | ) | | | (423,149 | ) |
Capital Share Transactions:1 | | | | | | | | | | | | | | | | |
| | | | |
Net increase (decrease) from capital share transactions | | | 43,144,460 | | | | (9,256,576 | ) | | | 7,037,835 | | | | (6,357,745 | ) |
| | | | | | | | | | | | | | | | |
| | | | |
Total decrease in net assets | | | (10,188,357 | ) | | | (27,864,257 | ) | | | (13,839,237 | ) | | | (7,288,170 | ) |
Net Assets: | | | | | | | | | | | | | | | | |
Beginning of year | | | 141,078,906 | | | | 168,943,163 | | | | 62,667,473 | | | | 69,955,643 | |
End of year | | | $130,890,549 | | | | $141,078,906 | | | | $48,828,236 | | | | $62,667,473 | |
| 1 | See Note 1(g) of the Notes to Financial Statements. |
The accompanying notes are an integral part of these financial statements.
21
|
AMG Veritas China Fund Financial Highlights For a share outstanding throughout each fiscal year |
| | | | | | | | | | | | | | | | | | | | |
| | | For the fiscal years ended October 31, | |
| | | | | |
| Class N | | 2021 | | | 2020 | | | 2019 | | | 2018 | | | 20171 | |
Net Asset Value, Beginning of Year | | | $37.61 | | | | $41.44 | | | | $48.48 | | | | $50.06 | | | | $37.09 | |
Income (loss) from Investment Operations: | | | | | | | | | | | | | | | | | | | | |
Net investment income (loss)2,3 | | | (0.02 | ) | | | 0.09 | | | | (0.09 | ) | | | (0.32 | ) | | | (0.27 | )4 |
| | | | | |
Net realized and unrealized gain (loss) on investments | | | 15.11 | | | | (0.23 | ) | | | 1.70 | | | | 4.45 | | | | 13.38 | |
Total income (loss) from investment operations | | | 15.09 | | | | (0.14 | ) | | | 1.61 | | | | 4.13 | | | | 13.11 | |
Less Distributions to Shareholders from: | | | | | | | | | | | | | | | | | | | | |
Net investment income | | | (0.01 | ) | | | — | | | | — | | | | — | | | | — | |
Net realized gain on investments | | | (24.49 | ) | | | (3.69 | ) | | | (8.65 | ) | | | (5.71 | ) | | | (0.14 | ) |
Paid in capital | | | (4.07 | ) | | | — | | | | — | | | | — | | | | — | |
Total distributions to shareholders | | | (28.57 | ) | | | (3.69 | ) | | | (8.65 | ) | | | (5.71 | ) | | | (0.14 | ) |
Net Asset Value, End of Year | | | $24.13 | | | | $37.61 | | | | $41.44 | | | | $48.48 | | | | $50.06 | |
Total Return3,5 | | | 30.40 | % | | | (0.86 | )% | | | 7.46 | % | | | 8.82 | % | | | 35.43 | % |
Ratio of net expenses to average net assets6 | | | 1.16 | % | | | 1.18 | % | | | 1.24 | % | | | 1.41 | % | | | 1.42 | % |
Ratio of gross expenses to average net assets7 | | | 1.24 | % | | | 1.26 | % | | | 1.34 | % | | | 1.50 | % | | | 1.51 | % |
| | | | | |
Ratio of net investment income (loss) to average net assets3 | | | (0.05 | )% | | | 0.24 | % | | | (0.23 | )% | | | (0.63 | )% | | | (0.62 | )% |
Portfolio turnover | | | 184 | % | | | 75 | % | | | 79 | % | | | 55 | % | | | 58 | % |
Net assets end of year (000’s) omitted | | | $111,537 | | | | $114,122 | | | | $138,695 | | | | $148,419 | | | | $148,915 | |
| | | | | | | | | | | | | | | | | | | | | |
22
|
AMG Veritas China Fund Financial Highlights For a share outstanding throughout each fiscal year |
| | | | | | | | | | | | | | | | | | | | |
| | | For the fiscal years ended October 31, | |
| | | | | |
| Class I | | 2021 | | | 2020 | | | 2019 | | | 2018 | | | 2017 | |
Net Asset Value, Beginning of Year | | | $38.58 | | | | $42.31 | | | | $49.19 | | | | $50.60 | | | | $37.40 | |
Income (loss) from Investment Operations: | | | | | | | | | | | | | | | | | | | | |
Net investment income (loss)2,3 | | | 0.07 | | | | 0.18 | | | | 0.01 | | | | (0.20 | ) | | | (0.16 | )4 |
| | | | | |
Net realized and unrealized gain (loss) on investments | | | 15.40 | | | | (0.22 | ) | | | 1.76 | | | | 4.50 | | | | 13.51 | |
Total income (loss) from investment operations | | | 15.47 | | | | (0.04 | ) | | | 1.77 | | | | 4.30 | | | | 13.35 | |
Less Distributions to Shareholders from: | | | | | | | | | | | | | | | | | | | | |
Net investment income | | | (0.11 | ) | | | — | | | | — | | | | — | | | | — | |
Net realized gain on investments | | | (24.47 | ) | | | (3.69 | ) | | | (8.65 | ) | | | (5.71 | ) | | | (0.15 | ) |
Paid in capital | | | (4.09 | ) | | | — | | | | — | | | | — | | | | — | |
Total distributions to shareholders | | | (28.67 | ) | | | (3.69 | ) | | | (8.65 | ) | | | (5.71 | ) | | | (0.15 | ) |
Net Asset Value, End of Year | | | $25.38 | | | | $38.58 | | | | $42.31 | | | | $49.19 | | | | $50.60 | |
Total Return3,5 | | | 30.75 | % | | | (0.62 | )% | | | 7.72 | % | | | 9.09 | % | | | 35.80 | % |
Ratio of net expenses to average net assets6 | | | 0.93 | % | | | 0.93 | % | | | 0.99 | % | | | 1.16 | % | | | 1.17 | % |
Ratio of gross expenses to average net assets7 | | | 1.00 | % | | | 1.01 | % | | | 1.09 | % | | | 1.25 | % | | | 1.26 | % |
| | | | | |
Ratio of net investment income (loss) to average net assets3 | | | 0.19 | % | | | 0.49 | % | | | 0.02 | % | | | (0.38 | )% | | | (0.37 | )% |
Portfolio turnover | | | 184 | % | | | 75 | % | | | 79 | % | | | 55 | % | | | 58 | % |
Net assets end of year (000’s) omitted | | | $19,354 | | | | $26,957 | | | | $30,248 | | | | $28,485 | | | | $23,974 | |
| | | | | | | | | | | | | | | | | | | | | |
| 1 | Effective February 27, 2017, Class S was renamed Class N. |
| 2 | Per share numbers have been calculated using average shares. |
| 3 | Total returns and net investment loss would have been lower had certain expenses not been offset. |
| 4 | Includes non-recurring dividends. Without these dividends, net investment loss per share would have been $(0.34) and $(0.23) for Class N and Class I shares, respectively. |
| 5 | The total return is calculated using the published Net Asset Value as of fiscal year end. |
| 6 | Includes reduction from broker recapture amounting to 0.01%, 0.01%, 0.02%, 0.02% and 0.01% for the fiscal years ended 2021, 2020, 2019, 2018 and 2017, respectively. |
| 7 | Excludes the impact of expense reimbursement or fee waivers and expense reductions such as brokerage credits, but includes expense repayments and non-reimbursable expenses, if any, such as interest, taxes, and extraordinary expenses. (See Note 1(c) and 2 in the Notes to Financial Statements.) |
23
|
AMG Veritas Global Focus Fund Financial Highlights For a share outstanding throughout each fiscal year |
| | | | | | | | | | | | | | | | | | | | |
| | | For the fiscal years ended October 31, | |
| | | | | |
| Class N | | 2021 | | | 2020 | | | 2019 | | | 2018 | | | 2017 | |
Net Asset Value, Beginning of Year | | | $34.02 | | | | $34.33 | | | | $31.68 | | | | $29.69 | | | | $24.11 | |
Income (loss) from Investment Operations: | | | | | | | | | | | | | | | | | | | | |
Net investment income (loss)1,2 | | | (0.05 | ) | | | 0.07 | | | | 0.09 | 3 | | | 0.03 | | | | 0.03 | 4 |
| | | | | |
Net realized and unrealized gain (loss) on investments | | | 10.91 | | | | (0.25 | ) | | | 3.02 | | | | 2.00 | | | | 5.79 | |
Total income (loss) from investment operations | | | 10.86 | | | | (0.18 | ) | | | 3.11 | | | | 2.03 | | | | 5.82 | |
Less Distributions to Shareholders from: | | | | | | | | | | | | | | | | | | | | |
Net investment income | | | (0.05 | ) | | | (0.08 | ) | | | (0.05 | ) | | | — | | | | (0.24 | ) |
Net realized gain on investments | | | (24.98 | ) | | | (0.05 | ) | | | (0.41 | ) | | | (0.04 | ) | | | — | |
Total distributions to shareholders | | | (25.03 | ) | | | (0.13 | ) | | | (0.46 | ) | | | (0.04 | ) | | | (0.24 | ) |
Net Asset Value, End of Year | | | $19.85 | | | | $34.02 | | | | $34.33 | | | | $31.68 | | | | $29.69 | |
Total Return2,5 | | | 35.54 | % | | | (0.54 | )% | | | 10.15 | % | | | 6.84 | % | | | 24.27 | % |
Ratio of net expenses to average net assets | | | 1.13 | %6 | | | 1.13 | %6 | | | 1.13 | %6 | | | 1.14 | %6 | | | 1.14 | % |
Ratio of gross expenses to average net assets7 | | | 1.29 | % | | | 1.29 | % | | | 1.28 | % | | | 1.26 | % | | | 1.27 | % |
| | | | | |
Ratio of net investment income (loss) to average net assets2 | | | (0.17 | )% | | | 0.22 | % | | | 0.28 | % | | | 0.09 | % | | | 0.13 | % |
Portfolio turnover | | | 109 | % | | | 45 | % | | | 34 | % | | | 31 | % | | | 75 | % |
Net assets end of year (000’s) omitted | | | $4,230 | | | | $6,922 | | | | $8,188 | | | | $9,622 | | | | $12,131 | |
| | | | | | | | | | | | | | | | | | | | | |
24
|
AMG Veritas Global Focus Fund Financial Highlights For a share outstanding throughout each fiscal year |
| | | | | | | | | | | | | | | | | | | | |
| | | For the fiscal years ended October 31, | |
| | | | | |
| Class I | | 2021 | | | 2020 | | | 2019 | | | 2018 | | | 2017 | |
Net Asset Value, Beginning of Year | | | $34.00 | | | | $34.31 | | | | $31.69 | | | | $29.72 | | | | $24.14 | |
Income (loss) from Investment Operations: | | | | | | | | | | | | | | | | | | | | |
Net investment income1,2 | | | 0.02 | | | | 0.16 | | | | 0.17 | 3 | | | 0.11 | | | | 0.10 | 4 |
| | | | | |
Net realized and unrealized gain (loss) on investments | | | 10.91 | | | | (0.25 | ) | | | 3.00 | | | | 2.00 | | | | 5.79 | |
Total income (loss) from investment operations | | | 10.93 | | | | (0.09 | ) | | | 3.17 | | | | 2.11 | | | | 5.89 | |
Less Distributions to Shareholders from: | | | | | | | | | | | | | | | | | | | | |
Net investment income | | | (0.15 | ) | | | (0.17 | ) | | | (0.14 | ) | | | (0.10 | ) | | | (0.31 | ) |
Net realized gain on investments | | | (24.98 | ) | | | (0.05 | ) | | | (0.41 | ) | | | (0.04 | ) | | | — | |
Total distributions to shareholders | | | (25.13 | ) | | | (0.22 | ) | | | (0.55 | ) | | | (0.14 | ) | | | (0.31 | ) |
Net Asset Value, End of Year | | | $19.80 | | | | $34.00 | | | | $34.31 | | | | $31.69 | | | | $29.72 | |
Total Return2,5 | | | 35.85 | % | | | (0.27 | )% | | | 10.40 | % | | | 7.13 | % | | | 24.57 | % |
Ratio of net expenses to average net assets | | | 0.88 | %6 | | | 0.88 | %6 | | | 0.88 | %6 | | | 0.89 | %6 | | | 0.89 | % |
Ratio of gross expenses to average net assets7 | | | 1.04 | % | | | 1.04 | % | | | 1.03 | % | | | 1.01 | % | | | 1.02 | % |
| | | | | |
Ratio of net investment income to average net assets2 | | | 0.08 | % | | | 0.47 | % | | | 0.53 | % | | | 0.34 | % | | | 0.38 | % |
Portfolio turnover | | | 109 | % | | | 45 | % | | | 34 | % | | | 31 | % | | | 75 | % |
Net assets end of year (000’s) omitted | | | $44,598 | | | | $55,746 | | | | $61,767 | | | | $63,440 | | | | $60,421 | |
| | | | | | | | | | | | | | | | | | | | | |
| 1 | Per share numbers have been calculated using average shares. |
| 2 | Total returns and net investment income (loss) would have been lower had certain expenses not been offset. |
| 3 | Includes non-recurring dividends. Without these dividends, net investment income per share would have been $0.06 and $0.14 for Class N and Class I, respectively. |
| 4 | Includes non-recurring dividends. Without these dividends, net investment income per share would have been $0.01 and $0.08 for Class N and Class I, respectively. |
| 5 | The total return is calculated using the published Net Asset Value as of fiscal year end. |
| 6 | Includes reduction from broker recapture amounting to less than 0.01%, 0.01%, 0.01% and less than 0.01% for the fiscal years ended 2021, 2020, 2019 and 2018, respectively. |
| 7 | Excludes the impact of expense reimbursement or fee waivers and expense reductions such as brokerage credits, but includes expense repayments and non-reimbursable expenses, if any, such as interest, taxes, and extraordinary expenses. (See Note 1(c) and 2 in the Notes to Financial Statements.) |
25
|
Notes to Financial Statements October 31, 2021 |
1. ORGANIZATION AND SUMMARY OF SIGNIFICANT ACCOUNTING POLICIES
AMG Funds I (the “Trust”) is an open-end management investment company, organized as a Massachusetts business trust, and registered under the Investment Company Act of 1940, as amended (the “1940 Act”). Currently, the Trust consists of a number of different funds, each having distinct investment management objectives, strategies, risks, and policies. Included in this report are AMG Veritas China Fund (“China Fund”) (formerly AMG Managers Emerging Opportunities Fund) and AMG Veritas Global Focus Fund (“Global Focus”) (formerly AMG FQ Tax-Managed U.S. Equity Fund), each a “Fund” and collectively, the “Funds”.
Each Fund offers different classes of shares. Both Funds offer Class N and Class I shares. Each class represents an interest in the same assets of the respective Fund. Although all share classes generally have identical voting rights, each share class votes separately when required by law. Different share classes may have different net asset values per share to the extent the share classes pay different distribution amounts and/or the expenses of such share classes differ. Each share class has its own expense structure. Please refer to a current prospectus for additional information on each share class.
On March 17-18, 2021, the Board of Trustees of the Trust (the “Board”) approved Veritas Asset Management LLP (“Veritas”) as the subadviser to China Fund on an interim basis to replace Next Century Growth Investors LLC (“Next Century”), WEDGE Capital Management L.L.P. (“WEDGE Capital”) and RBC Global Asset Management (U.S.) Inc. (“RBC Global”), and approved Veritas as the subadviser to Global Focus on an interim basis to replace First Quadrant, L.P. (“First Quadrant”), effective May 21, 2021, which was subsequently approved by the shareholders of China Fund and Global Focus on June 25, 2021. In conjunction with the subadviser change, China Fund seeks to achieve its investment objective by investing in securities of issuers located in the Greater China Region, which consists of (the People’s Republic of China (“PRC”), Hong Kong, Taiwan or issuers that are not located in the Greater China Region but derive a majority (over 50%) of their income from the Greater China Region, while Global Focus seeks to achieve its investment objective by investing in equity securities of a relatively select group of global companies. In conjunction with the changes in investment strategy for China Fund and Global Focus, the Funds sold substantially all open positions around the date of the subadviser change that increased the Funds’ portfolio turnover. China Fund and Global Focus also declared special capital gain distributions on May 27, 2021. In addition, the Board also approved expense changes (See Note 2).
On June 25, 2021, shareholders approved a change to the Funds’ sub-classification from “diversified” to “non-diversified”. A greater percentage of the Funds’ holdings may be focused in a smaller number of securities which may place the Funds at greater risk than a more diversified fund.
Market disruptions associated with the COVID-19 pandemic have had a global impact, and uncertainty exists as to the long-term implications. Such disruptions can adversely affect assets of the Funds and thus Fund performance.
The Funds’ financial statements are prepared in accordance with accounting principles generally accepted in the United States of America (“U.S. GAAP”), including accounting and reporting guidance pursuant to Accounting Standards Codification Topic 946 applicable to investment companies. U.S. GAAP requires management to make estimates and assumptions that affect the reported amounts of assets and liabilities and disclosure of contingent assets and liabilities at the date of the financial statements and the reported amounts of income and expenses during the reporting period. Actual results could differ from those
estimates and such differences could be material. The following is a summary of significant accounting policies followed by the Funds in the preparation of their financial statements:
a. VALUATION OF INVESTMENTS
For the Funds, equity securities traded on a national securities exchange or reported on the NASDAQ national market system (“NMS”) are valued at the last quoted sales price on the primary exchange or, if applicable, the NASDAQ official closing price or the official closing price of the relevant exchange or, lacking any sales, at the last quoted bid price for Global Focus or the mean between the last quoted bid and ask prices (the “mean price”) for China Fund. Equity securities held by the Funds that are traded in the over-the-counter market (other than NMS securities) are valued at the mean price. Foreign equity securities (securities principally traded in markets other than U.S. markets) held by the Funds are valued at the official closing price on the primary exchange or, for markets that either do not offer an official closing price or where the official closing price may not be representative of the overall market, the last quoted sale price. Effective October 1, 2021, equity securities lacking any sales in China Fund are valued at the last quoted bid price and equity securities traded in the over-the-counter market (other than NMS securities) in each Fund are valued at the bid price. As of October 1, 2021, there was no impact to the Funds due to the changes in valuation policy.
Fixed income securities purchased with a remaining maturity of 60 days or less are valued at amortized cost, provided that the amortized cost value is approximately the same as the fair value of the security valued without the use of amortized cost. Investments in other open-end registered investment companies are valued at their end of day net asset value per share.
Participation notes (“P-Notes”) are valued using the underlying equity security’s official closing price on the primary exchange or, for markets that either do not offer an official closing price or where the official closing price may not be representative of the overall market, the last quoted sale price.
The Funds’ portfolio investments are generally valued based on independent market quotations or prices or, if none, “evaluative” or other market based valuations provided by third party pricing services approved by the Board. Under certain circumstances, the value of certain Fund portfolio investments may be based on an evaluation of fair value, pursuant to procedures established by and under the general supervision of the Board. The Valuation Committee, which is comprised of the Independent Trustees of the Board, and the Pricing Committee, which is comprised of representatives from AMG Funds LLC (the “Investment Manager”) are the committees appointed by the Board to make fair value determinations. Each Fund may use the fair value of a portfolio investment to calculate its net asset value (“NAV”) in the event that the market quotation, price or market based valuation for the portfolio investment is not readily available or otherwise not determinable pursuant to the Board’s valuation procedures, if the Investment Manager or the Pricing Committee believes the quotation, price or market based valuation to be unreliable, or in certain other circumstances. When determining the fair value of an investment, the Pricing Committee and, if required under the Trust’s securities valuation procedures, the Valuation Committee, seeks to determine the price that the Fund might reasonably expect to receive from current sale of that portfolio investment in an arms-length transaction. Fair value determinations shall be based upon consideration of all available facts and information, including, but not limited to (i) attributes specific to the investment; (ii) fundamental and analytical data relating to the investment; and (iii) the value
26
|
Notes to Financial Statements (continued) |
of other comparable securities or relevant financial instruments, including derivative securities, traded on other markets or among dealers.
The values assigned to fair value portfolio investments are based on available information and do not necessarily represent amounts that might ultimately be realized in the future, since such amounts depend on future developments inherent in long-term investments. Because of the inherent uncertainty of valuation, those estimated values may differ significantly from the values that would have been used had a ready market for the investments existed, and the differences could be material. The Board will be presented with a quarterly report showing as of the most recent quarter end, all outstanding securities fair valued by the Funds, including a comparison with the prior quarter end and the percentage of the Funds that the security represents at each quarter end.
With respect to foreign equity securities and certain foreign fixed income securities, the Board has adopted a policy that securities held in the Funds that can be fair valued by the applicable fair value pricing service are fair valued on each business day provided that each individual price exceeds a pre-established confidence level.
U.S. GAAP defines fair value as the price that a fund would receive to sell an asset or pay to transfer a liability in an orderly transaction between market participants at the measurement date. U.S. GAAP also establishes a framework for measuring fair value, and a three level hierarchy for fair value measurements based upon the transparency of inputs to the valuation of an asset or liability. Inputs may be observable or unobservable and refer broadly to the assumptions that market participants would use in pricing the asset or liability. Observable inputs reflect the assumptions market participants would use in pricing the asset or liability based on market data obtained from sources independent of the Funds. Unobservable inputs reflect the Funds’ own assumptions about the assumptions that market participants would use in pricing the asset or liability developed based on the best information available in the circumstances. Each investment is assigned a level based upon the observability of the inputs which are significant to the overall valuation.
The three-tier hierarchy of inputs is summarized below:
Level 1 – inputs are quoted prices in active markets for identical investments (e.g., equity securities, open-end investment companies)
Level 2 – other observable inputs (including, but not limited to: quoted prices for similar assets or liabilities in markets that are active, quoted prices for identical or similar assets or liabilities in markets that are not active, inputs other than quoted prices that are observable for the assets or liabilities (such as interest rates, yield curves, volatilities, prepayment speeds, loss severities, credit risks and default rates) or other market corroborated inputs) (e.g., debt securities, government securities, foreign currency exchange contracts, swaps, foreign securities utilizing international fair value pricing, fair valued securities with observable inputs)
Level 3 – inputs are significant unobservable inputs (including the Fund’s own assumptions used to determine the fair value of investments) (e.g., fair valued securities with unobservable inputs)
Changes in inputs or methodologies used for valuing investments may result in a transfer in or out of levels within the fair value hierarchy. The inputs or methodologies used for valuing investments may not necessarily be an indication of the risk associated with investing in those investments.
b. SECURITY TRANSACTIONS
Security transactions are accounted for as of trade date. Realized gains and losses on securities sold are determined on the basis of identified cost.
c. INVESTMENT INCOME AND EXPENSES
Dividend income is recorded on the ex-dividend date. Dividends from foreign securities are recorded on the ex-dividend date, and if after the fact, as soon as the Funds become aware of the ex-dividend date. Interest income, which includes amortization of premium and accretion of discount on debt securities, is accrued as earned. Dividend and interest income on foreign securities is recorded gross of any withholding tax. Non-cash dividends included in dividend income, if any, are reported at the fair market value of the securities received. Other income and expenses are recorded on an accrual basis. Expenses that cannot be directly attributed to a Fund are apportioned among the funds in the Trust and other trusts or funds within the AMG Funds Family of Funds (collectively the “AMG Funds Family”) based upon their relative average net assets or number of shareholders. Investment income, realized and unrealized capital gains and losses, the common expenses of each Fund, and certain fund level expense reductions, if any, are allocated on a pro-rata basis to each class based on the relative net assets of each class to the total net assets of each Fund.
The Funds had certain portfolio trades directed to various brokers under a brokerage recapture program. Credits received from the brokerage recapture program are earned and paid on a monthly basis, and are recorded as expense offsets, which serve to reduce the Fund’s overall expense ratio. For the fiscal year ended October 31, 2021, the impact on the expenses and expense ratios were as follows: China Fund - $14,894 or 0.01%, and Global Focus - $1,632 or less than 0.01%.
d. DIVIDENDS AND DISTRIBUTIONS
Fund distributions resulting from either net investment income or realized net capital gains, if any, will normally be declared and paid at least annually in December. Distributions to shareholders are recorded on the ex-dividend date. Distributions are determined in accordance with federal income tax regulations, which may differ from net investment income and net realized capital gains for financial statement purposes (U.S. GAAP). Differences may be permanent or temporary. Permanent differences are reclassified among capital accounts in the financial statements to reflect their tax character. Permanent book and tax basis differences, if any, relating to shareholder distributions will result in reclassifications to paid-in capital. Temporary differences arise when certain items of income, expense and gain or loss are recognized in different periods for financial statement and tax purposes; these differences will reverse at some time in the future. Permanent differences are due to tax equalization utilized. Temporary differences are primarily due to the deferral of qualified late year losses, certain investments in partnerships and wash sale loss deferrals.
27
|
Notes to Financial Statements (continued) |
The tax character of distributions paid during the fiscal years ended October 31, 2021 and October 31, 2020 were as follows:
| | | | | | | | | | | | | | | | |
| | | China Fund | | | Global Focus | |
| Distributions paid from: | | 2021 | | | 2020 | | | 2021 | | | 2020 | |
Ordinary income * | | | $16,209,326 | | | | — | | | | $2,236,726 | | | | $323,855 | |
Long-term capital gains | | | 70,590,452 | | | | $14,720,816 | | | | 39,445,403 | | | | 99,294 | |
Paid-in capital | | | 14,435,337 | | | | — | | | | — | | | | — | |
| | | | | | | | | | | | | | | | |
| | | $101,235,115 | | | | $14,720,816 | | | | $41,682,129 | | | | $423,149 | |
| | | | | | | | | | | | | | | | |
| * | For tax purposes, short-term capital gain distributions, if any, are considered ordinary income distributions. |
As of October 31, 2021, the components of distributable earnings (excluding unrealized appreciation/depreciation) on a tax basis consisted of:
| | | | | | | | |
| | | China Fund | | | Global Focus | |
Undistributed ordinary income | | | — | | | | $515,363 | |
Undistributed long-term capital gains | | | — | | | | 2,633,440 | |
Late-year loss deferral | | | $279,190 | | | | — | |
At October 31, 2021, the cost of investments and the aggregate gross unrealized appreciation and depreciation for federal income tax purposes were as follows:
| | | | | | | | | | | | | | | | |
| Fund | | Cost | | | Appreciation | | | Depreciation | | | Net Appreciation
(Depreciation) | |
China Fund | | | $138,607,661 | | | | $8,370,356 | | | | $(15,912,281 | ) | | | $(7,541,925 | ) |
Global Focus | | | 41,510,444 | | | | 9,134,338 | | | | (1,744,481 | ) | | | 7,389,857 | |
e. FEDERAL TAXES
Each Fund currently qualifies as an investment company and intends to comply with the requirements under Subchapter M of the Internal Revenue Code of 1986, as amended, and to distribute substantially all of its taxable income and gains to its shareholders and to meet certain diversification and income requirements with respect to investment companies. Therefore, no provision for federal income or excise tax is included in the accompanying financial statements.
Additionally, based on each Fund’s understanding of the tax rules and rates related to income, gains and transactions for the foreign jurisdictions in which it invests, each Fund will provide for foreign taxes, and where appropriate, deferred foreign taxes.
Management has analyzed the Funds’ tax positions taken on federal income tax returns as of October 31, 2021, and for all open tax years (generally, the three prior taxable years), and has concluded that no provision for federal income tax is required in the Funds’ financial statements. Additionally, Management is not aware of any tax position for which it is reasonably possible that the total amounts of unrecognized tax benefits will change materially in the next twelve months.
f. CAPITAL LOSS CARRYOVERS AND DEFERRALS
As of October 31, 2021, the Funds had no capital loss carryovers for federal income tax purposes. Should the Funds incur net capital losses for the fiscal year ended October 31, 2022, such amounts may be used to offset future realized capital gains indefinitely, and retain their character as short-term and/or long-term.
g. CAPITAL STOCK
The Trust’s Declaration of Trust authorizes for each Fund the issuance of an unlimited number of shares of beneficial interest, without par value. each Fund records sales and repurchases of its capital stock on the trade date.
28
|
Notes to Financial Statements (continued) |
For the fiscal years ended October 31, 2021 and October 31, 2020, the capital stock transactions by class for the Funds were as follows:
| | | | | | | | | | | | | | | | | | | | | | | | | | | | | | | | |
| | | China Fund | | | Global Focus | |
| | | October 31, 2021 | | | October 31, 2020 | | | October 31, 2021 | | | October 31, 2020 | |
| | | Shares | | | Amount | | | Shares | | | Amount | | | Shares | | | Amount | | | Shares | | | Amount | |
| | | | | | | | |
Class N: | | | | | | | | | | | | | | | | | | | | | | | | | | | | | | | | |
Proceeds from sale of shares | | | 155,072 | | | | $6,425,694 | | | | 164,332 | | | | $5,862,463 | | | | 14,273 | | | | $328,453 | | | | 9,440 | | | | $298,433 | |
Reinvestment of distributions | | | 2,755,480 | | | | 79,800,381 | | | | 300,381 | | | | 11,991,204 | | | | 214,857 | | | | 4,129,993 | | | | 798 | | | | 28,718 | |
Cost of shares repurchased | | | (1,322,201 | ) | | | (45,625,930 | ) | | | (777,792 | ) | | | (26,470,500 | ) | | | (219,484 | ) | | | (4,997,668 | ) | | | (45,297 | ) | | | (1,481,907 | ) |
| | | | | | | | | | | | | | | | | | | | | | | | | | | | | | | | |
Net increase (decrease) | | | 1,588,351 | | | | $40,600,145 | | | | (313,079 | ) | | | $(8,616,833 | ) | | | 9,646 | | | | $(539,222 | ) | | | (35,059 | ) | | | $(1,154,756 | ) |
| | | | | | | | | | | | | | | | | | | | | | | | | | | | | | | | |
| | | | | | | | |
Class I: | | | | | | | | | | | | | | | | | | | | | | | | | | | | | | | | |
Proceeds from sale of shares | | | 215,703 | | | | $8,470,854 | | | | 141,654 | | | | $5,004,115 | | | | 36,767 | | | | $1,104,339 | | | | 47,300 | | | | $1,530,200 | |
Reinvestment of distributions | | | 637,539 | | | | 19,357,411 | | | | 61,148 | | | | 2,498,494 | | | | 1,848,846 | | | | 35,461,375 | | | | 10,453 | | | | 375,154 | |
Cost of shares repurchased | | | (789,317 | ) | | | (25,283,950 | ) | | | (218,889 | ) | | | (8,142,352 | ) | | | (1,272,449 | ) | | | (28,988,657 | ) | | | (218,571 | ) | | | (7,108,343 | ) |
| | | | | | | | | | | | | | | | | | | | | | | | | | | | | | | | |
Net increase (decrease) | | | 63,925 | | | | $2,544,315 | | | | (16,087 | ) | | | $(639,743 | ) | | | 613,164 | | | | $7,577,057 | | | | (160,818 | ) | | | $(5,202,989 | ) |
| | | | | | | | | | | | | | | | | | | | | | | | | | | | | | | | |
h. REPURCHASE AGREEMENTS AND JOINT REPURCHASE AGREEMENTS
The Funds may enter into third-party repurchase agreements for temporary cash management purposes and third-party or bilateral joint repurchase agreements for reinvestment of cash collateral on securities lending transactions under the securities lending program offered by The Bank of New York Mellon (“BNYM”) (the “Program”) (collectively, “Repurchase Agreements”). The value of the underlying collateral, including accrued interest, must equal or exceed the value of the Repurchase Agreements during the term of the agreement. For joint repurchase agreements, the Funds participate on a pro rata basis with other clients of BNYM in its share of the underlying collateral under such joint repurchase agreements and in its share of proceeds from any repurchase or other disposition of the underlying collateral. The underlying collateral for all Repurchase Agreements is held in safekeeping by the Funds’ custodian or at the Federal Reserve Bank. If the seller defaults and the value of the collateral declines, or if bankruptcy proceedings commence with respect to the seller of the security, realization of the collateral by the Funds may be delayed or limited. Pursuant to the Program, the Funds are indemnified for such losses by BNYM on joint repurchase agreements.
At October 31, 2021, the Funds had no Repurchase Agreements outstanding.
i. FOREIGN CURRENCY TRANSLATION
The books and records of the Funds are maintained in U.S. dollars. The value of investments, assets and liabilities denominated in currencies other than U.S. dollars are translated into U.S. dollars based upon current foreign exchange rates. Purchases and sales of foreign investments, income and expenses are converted into U.S. dollars based on currency exchange rates prevailing on the respective dates of such transactions. Net realized and unrealized gain (loss) on foreign currency transactions represent: (1) foreign exchange gains and losses from the sale and holdings of foreign currencies; (2) gains and losses between trade date and settlement date on investment securities transactions and foreign currency exchange contracts; and (3) gains and losses from the difference between amounts of interest and dividends recorded and the amounts actually received.
The Funds do not isolate the net realized and unrealized gain or loss resulting from changes in exchange rates from the fluctuations in market prices of
securities held. Such fluctuations are included with the net realized and unrealized gain or loss on investments.
2. AGREEMENTS AND TRANSACTIONS WITH AFFILIATES
For each of the Funds, the Trust has entered into an investment advisory agreement under which the Investment Manager, a subsidiary and the U.S. retail distribution arm of Affiliated Managers Group, Inc. (“AMG”), serves as investment manager to the Funds and is responsible for the Funds’ overall administration and operations. The Investment Manager selects one or more subadvisers for the Funds (subject to Board approval) and monitors each subadviser’s investment performance, security holdings and investment strategies. Effective May 21, 2021, each Fund’s investment portfolio is managed by Veritas Asset Management LLP (“Veritas”) who serves pursuant to a subadvisory agreement with the Investment Manager. AMG indirectly owns a majority interest in Veritas. Prior to May 21, 2021, China Fund’s investment portfolio was managed by Next Century, RBC Global, and WEDGE Capital and Global Focus’ investment portfolio was managed by First Quadrant.
Investment management fees are paid directly by the Funds to the Investment Manager based on average daily net assets. Effective June 25, 2021, the Funds’ investment management fees were paid at the following annual rate of each Fund’s respective average daily net assets:
| | | | |
China Fund1 | | | 0.71% | |
Global Focus2 | | | 0.67% | |
| 1 | Prior to June 25, 2021, the investment management fees were 0.74%. |
| 2 | Prior to June 25, 2021, the investment management fees were 0.70%. |
The Investment Manager has contractually agreed, through at least March 1, 2023, to waive management fees and/or pay or reimburse fund expenses in order to limit total annual Fund operating expenses after fee waiver and expense reimbursements (exclusive of taxes, interest (including interest incurred in connection with bank and custody overdrafts and in connection with securities
29
|
Notes to Financial Statements (continued) |
sold short), shareholder servicing fees, distribution and service (12b-1) fees, brokerage commissions and other transaction costs, dividends payable with respect to securities sold short, acquired fund fees and expenses and extraordinary expenses) of China Fund and Global Focus to 0.93% and 0.88%, respectively, of each Fund’s average daily net assets (this annual rate or such other annual rate that may be in effect from time to time, the “Expense Cap”), subject to later reimbursement by the Funds in certain circumstances. Prior to June 25, 2021, the total annual Fund operating expense limitation was 0.94% of China Fund’s and 0.89% of Global Focus’s average daily net assets.
In general, for a period of up to 36 months after the date any amounts are paid, waived or reimbursed by the Investment Manager, the Investment Manager may recover such amounts from a Fund, provided that such repayment would not cause the Fund’s total annual operating expenses after fee waiver and expense reimbursements (exclusive of the items noted in the parenthetical above) to exceed either (i) the Expense Cap in effect at the time such amounts were paid, waived or reimbursed, or (ii) the Expense Cap in effect at the time of such repayment by the Fund.
The contractual expense limitation may only be terminated in the event the Investment Manager or a successor ceases to be the investment manager of a Fund or a successor fund, by mutual agreement between the Investment Manager and the Board, or in the event of a Fund’s liquidation unless the Fund is reorganized or is a party to a merger in which the surviving entity is successor to the accounting and performance information of a Fund.
At October 31, 2021, the Funds’ expiration of reimbursements subject to recoupment is as follows:
| | | | | | | | |
| Expiration | | | | | | |
| Period | | China Fund | | | Global Focus | |
Less than 1 year | | | $131,263 | | | | $98,178 | |
1-2 years | | | 104,667 | | | | 97,260 | |
2-3 years | | | 110,028 | | | | 100,614 | |
| | | | | | | | |
Total | | | $345,958 | | | | $296,052 | |
| | | | | | | | |
The Trust, on behalf of the Funds, has entered into an amended and restated Administration Agreement under which the Investment Manager serves as the Funds’ administrator (the “Administrator”) and is responsible for all non-portfolio management aspects of managing the Funds’ operations, including administration and shareholder services to each Fund. Each Fund pays a fee to the Administrator at the rate of 0.15% per annum of the Fund’s average daily net assets for this service.
The Funds are distributed by AMG Distributors, Inc. (the “Distributor”), a wholly-owned subsidiary of the Investment Manager. The Distributor serves as the distributor and underwriter for each Fund and is a registered broker-dealer and member of the Financial Industry Regulatory Authority, Inc. (“FINRA”). Shares of each Fund will be continuously offered and will be sold directly to prospective purchasers and through brokers, dealers or other financial intermediaries who have executed selling agreements with the Distributor. Generally the Distributor bears all or a portion of the expenses of providing services pursuant to the distribution agreement, including the payment of the expenses relating to the distribution of prospectuses for sales purposes and any advertising or sales literature.
Global Focus has adopted a distribution and service plan (the “Plan”) with respect to the Class N shares, in accordance with the requirements of Rule 12b-1 under the 1940 Act and the requirements of the applicable rules of FINRA regarding asset-based sales charges. Pursuant to the Plan, Global Focus may make payments to the Distributor for its expenditures in financing any activity primarily intended to result in the sale of the Fund’s Class N shares and for maintenance and personal service provided to existing shareholders of that class. The Plan authorized payments to the Distributor up to 0.25% annually of the Fund’s average daily net assets attributable to the Class N shares.
For Class N shares of China Fund, the Board has approved reimbursement payments to the Investment Manager for shareholder servicing expenses (“shareholder servicing fees”) incurred. Shareholder servicing fees include payments to financial intermediaries, such as broker-dealers (including fund supermarket platforms), banks, and trust companies who provide shareholder recordkeeping, account servicing and other services. The Class N shares of China Fund may reimburse the Investment Manager for the actual amount incurred up to a maximum annual rate of each Class’s average daily net assets as shown in the table below.
The impact on the annualized expense ratios for the fiscal year ended October 31, 2021, were as follows:
| | | | | | | | |
| Fund | | Maximum Annual
Amount
Approved | | | Actual
Amount
Incurred | |
China Fund | | | | | | | | |
Class N | | | 0.25 | % | | | 0.23 | % |
The Board provides supervision of the affairs of the Trust and other trusts within the AMG Funds Family. The Trustees of the Trust who are not affiliated with the Investment Manager receive an annual retainer and per meeting fees for regular, special and telephonic meetings, and they are reimbursed for out-of-pocket expenses incurred while carrying out their duties as Board members. The Chairman of the Board and the Audit Committee Chair receive additional annual retainers. Certain Trustees and Officers of the Funds are Officers and/or Directors of the Investment Manager, AMG and/or the Distributor.
The Securities and Exchange Commission (the “SEC”) granted an exemptive order that permits certain eligible funds in the AMG Funds Family to lend and borrow money for certain temporary purposes directly to and from other eligible funds in the AMG Funds Family. Participation in this interfund lending program is voluntary for both the borrowing and lending funds, and an interfund loan is only made if it benefits each participating fund. The Administrator manages the program according to procedures approved by the Board, and the Board monitors the operation of the program. An interfund loan must comply with certain conditions set out in the exemptive order, which are designed to assure fairness and protect all participating funds. The interest earned and interest paid on interfund loans are included on the Statement of Operations as interest income and miscellaneous expense, respectively. At October 31, 2021, the Funds had no interfund loans outstanding.
The following Funds utilized the interfund loan program during the fiscal year ended October 31, 2021 as follows:
| | | | | | | | | | | | | | | | |
| Fund | | Average
Lent | | | Number
of Days | | | Interest
Earned | | | Average
Interest Rate | |
China Fund | | | $2,947,155 | | | | 6 | | | | $457 | | | | 0.944 | % |
30
|
Notes to Financial Statements (continued) |
| | | | | | | | | | | | | | | | |
| Fund | | Average
Borrowed | | | Number
of Days | | | Interest
Paid | | | Average
Interest Rate | |
Global Focus | | | $3,260,344 | | | | 7 | | | | $583 | | | | 0.933 | % |
3. PURCHASES AND SALES OF SECURITIES
Purchases and sales of securities (excluding short-term securities and U.S. Government Obligations) for the fiscal year ended October 31, 2021, were as follows:
| | | | | | | | |
| | | Long Term Securities | |
| | |
| Fund | | Purchases | | | Sales | |
China Fund | | | $280,482,478 | | | | $354,259,980 | |
Global Focus | | | 62,590,893 | | | | 97,545,886 | |
The Funds had no purchases or sales of U.S. Government Obligations during the fiscal year ended October 31, 2021.
4. PORTFOLIO SECURITIES LOANED
The Funds participate in the Program providing for the lending of securities to qualified borrowers. Securities lending income includes earnings of such temporary cash investments, plus or minus any rebate to a borrower. These earnings (after any rebate) are then divided between BNYM, as a fee for its services under the Program, and the Funds, according to agreed-upon rates. Collateral on all securities loaned is accepted in cash, U.S. Treasury Obligations or U.S. Government Agency Obligations. Collateral is maintained at a minimum level of 102% (105% in the case of certain foreign securities) of the market value, plus interest, if applicable, of investments on loan. It is the Funds’ policy to obtain additional collateral from or return excess collateral to the borrower by the end of the next business day, following the valuation date of the securities loaned. Therefore, the value of the collateral held may be temporarily less than the value of the securities on loan. Lending securities entails a risk of loss to the Funds if and to the extent that the market value of the securities loaned were to increase and the borrower did not increase the collateral accordingly, and the borrower fails to return the securities. Under the terms of the Program, the Funds are indemnified for such losses by BNYM. Cash collateral is held in separate omnibus accounts managed by BNYM, who is authorized to exclusively enter into joint repurchase agreements for that cash collateral, and securities collateral is held in separate omnibus accounts managed by BNYM and cannot be sold or pledged. BNYM bears the risk of any deficiency in the amount of the cash collateral available for return to the borrower due to any loss on the collateral invested. Loans of securities are terminable at any time and the borrower, after notice, is required to return borrowed securities as soon as practical, which is normally within three business days.
The Funds had no securities on loan at October 31, 2021.
5. FOREIGN SECURITIES
The Funds invest in securities of foreign entities and in instruments denominated in foreign currencies which involve risks not typically associated with investments in domestic securities. Non-domestic securities carry special risks, such as exposure to currency fluctuations, less developed or less efficient trading markets, political instability, a lack of company information, differing auditing and legal
standards, and, potentially, less liquidity. Emerging market countries generally have economic structures that are less diverse and mature, and political systems that are less stable, than those of developed countries. Realized gains in certain countries may be subject to foreign taxes at the Fund level and the Fund would pay such foreign taxes at the appropriate rate for each jurisdiction.
6. GEOGRAPHICAL FOCUS RISK
China Fund is particularly susceptible to risks in the Greater China region. Economies in the Greater China region are dependent on the economies of other countries and can be significantly affected by currency fluctuations and increasing competition from other emerging economies in Asia with lower costs. Adverse events in any one country within the region may impact the other countries in the region or Asia as a whole. Markets in the Greater China region can experience significant volatility due to social, economic, regulatory and political uncertainties. Significant portions of the Chinese securities markets may become rapidly illiquid, as Chinese issuers have the ability to suspend the trading of their equity securities, and have shown a willingness to exercise that option in response to market volatility and other events. U.S. or foreign government restrictions or intervention could negatively affect the implementation of the China Fund’s investment strategies, for example by precluding the China Fund from making certain investments or causing the China Fund to sell investments at disadvantageous times. China has yet to develop comprehensive securities, corporate, or commercial laws, its market is relatively new and less developed, and its economy may be adversely impacted by a slowdown in export growth. China Fund’s NAV may be more volatile than the NAV of a more geographically diversified fund and may result in losses.
7. PARTICIPATION NOTES
China Fund invests in P-Notes to gain exposure to issuers in certain countries. P-Notes are a type of equity-linked derivative that generally are traded in the over-the counter market and constitute general unsecured contractual obligations of the banks or broker-dealers that issue them. Generally, banks and broker-dealers associated with non-U.S.-based brokerage firms buy securities listed on certain foreign exchanges and then issue P-Notes which are designed to replicate the performance of certain issuers and markets. The performance results of P-Notes will not replicate exactly the performance of the issuers or markets that the notes seek to replicate due to transaction costs and other expenses. The return on a P-Note that is linked to a particular underlying security generally is increased to the extent of any dividends paid in connection with the underlying security. However, the holder of a P-Note typically does not receive voting or other rights as it would if it directly owned the underlying security, and P-Notes present similar risks to investing directly in the underlying security. Additionally, P-Notes entail the risks that the counterparty or issuer of the P-Note may not be able to fulfill its obligations, that the holder and counterparty or issuer may disagree as to the meaning or application of contractual terms, or that the instrument may not perform as expected. Additionally, while P-Notes may be listed on an exchange, there is no guarantee that a liquid market will exist or that the counterparty or issuer of a P-Note will be willing to repurchase such instrument when a Fund wishes to sell it.
8. COMMITMENTS AND CONTINGENCIES
Under the Trust’s organizational documents, its trustees and officers are indemnified against certain liabilities arising out of the performance of their duties to the Trust. In addition, in the normal course of business, the Funds may enter into
31
|
Notes to Financial Statements (continued) |
contracts and agreements that contain a variety of representations and warranties, which provide general indemnifications. The maximum exposure to the Funds under these arrangements is unknown, as this would involve future claims that may be made against a Fund that have not yet occurred. However, based on experience, the Funds had no prior claims or losses and expect the risks of loss to be remote.
9. MASTER NETTING AGREEMENTS
The Funds may enter into master netting agreements with their counterparties for the securities lending program and Repurchase Agreements, which provide the right, in the event of default (including bankruptcy or insolvency) for the
non-defaulting party to liquidate the collateral and calculate net exposure to the defaulting party or request additional collateral. For financial reporting purposes, the Funds do not offset financial assets and financial liabilities that are subject to master netting agreements in the Statement of Assets and Liabilities. For securities lending transactions, see Note 4. At October 31, 2021, the Fund had no repurchase agreements outstanding.
10. SUBSEQUENT EVENTS
The Funds have determined that no material events or transactions occurred through the issuance date of the Funds’ financial statements which require an additional disclosure in or adjustment of the Funds’ financial statements.
32
|
Report of Independent Registered Public Accounting Firm |
| | |
TO THE BOARD OF TRUSTEES OF AMG FUNDS I AND SHAREHOLDERS OF AMG VERITAS CHINA FUND AND AMG VERITAS GLOBAL FOCUS FUND: | | |
| |
| Opinion on the Financial Statements | | |
| |
| We have audited the accompanying statements of assets and liabilities, including the schedules of portfolio investments, of AMG Veritas China Fund (formerly AMG Managers Emerging Opportunities Fund) and AMG Veritas Global Focus Fund (formerly AMG FQ Tax-Managed U.S. Equity Fund) (two of the funds constituting AMG Funds I) (hereafter collectively referred to as the “Funds “) as of October 31, 2021, the related statements of operations for the year ended October 31, 2021, the statements of changes in net assets for each of the two years in the period ended October 31, 2021, including the related notes, and the financial highlights for each of the periods indicated therein (collectively referred to as the “financial statements”). In our opinion, the financial statements present fairly, in all material respects, the financial position of each of the Funds as of October 31, 2021, the results of each of their operations for the year then ended, the changes in each of their net assets for each of the two years in the period ended October 31, 2021 and the financial highlights for each of the periods indicated therein in conformity with accounting principles generally accepted in the United States of America. | | |
| |
| Basis for Opinion | | |
| |
| These financial statements are the responsibility of the Funds’ management. Our responsibility is to express an opinion on the Funds’ financial statements based on our audits. We are a public accounting firm registered with the Public Company Accounting Oversight Board (United States) (PCAOB) and are required to be independent with respect to the Funds in accordance with the U.S. federal securities laws and the applicable rules and regulations of the Securities and Exchange Commission and the PCAOB. | | |
| |
| We conducted our audits of these financial statements in accordance with the standards of the PCAOB. Those standards require that we plan and perform the audit to obtain reasonable assurance about whether the financial statements are free of material misstatement, whether due to error or fraud. | | |
| |
Our audits included performing procedures to assess the risks of material misstatement of the financial statements, whether due to error or fraud, and performing procedures that respond to those risks. Such procedures included examining, on a test basis, evidence regarding the amounts and disclosures in the financial statements. Our audits also included evaluating the accounting principles used and significant estimates made by management, as well as evaluating the overall presentation of the financial statements. Our procedures included confirmation of securities owned as of October 31, 2021 by correspondence with the custodian, transfer agent and brokers; when replies were not received from brokers, we performed other auditing procedures. We believe that our audits provide a reasonable basis for our opinions. | | |
| |
PricewaterhouseCoopers LLP Boston, Massachusetts December 22, 2021 | | |
| |
| We have served as the auditor of one or more investment companies in the AMG Funds Family since 1993. | | |
33
|
Other Information (unaudited) |
TAX INFORMATION
AMG Veritas China Fund and AMG Veritas Global Focus Fund each hereby designates the maximum amount allowable of its net taxable income as qualified dividends as provided in the Jobs and Growth Tax Relief Reconciliation Act of 2003. The 2020/2021 Form 1099-DIV you receive for each Fund will show the tax status of all distributions paid to you during the year.
In accordance with federal tax law, AMG Veritas China Fund elects to provide foreign taxes paid and the income sourced from foreign countries in the amounts of $72,837 and $802,766, respectively, for its taxable period ended October 31, 2021.
Pursuant to section 852 of the Internal Revenue Code, AMG Veritas China Fund and AMG Veritas Global Focus Fund each hereby designates $70,590,452 and $39,845,256, respectively, as a capital gain distribution with respect to the taxable year ended October 31, 2021, or if subsequently determined to be different, the net capital gains of such fiscal year.
PROXY VOTE
A special meeting of the shareholders of AMG Veritas China Fund (the “Fund”) was held on June 25, 2021, to vote on proposals including to approve a new subadvisory agreement between AMG Funds LLC (the “Investment Manager”) and Veritas Asset Management LLP (“Veritas”) with respect to the Fund. The proposals and results of the votes are summarized below.
| | | | | | |
| | | | | Number of Eligible Shareholders | | |
| Proposal 1 | | For | | Against | | Abstain |
| | | |
To approve a new subadvisory agreement between the Investment Manager and Veritas with respect to the Fund. | | 1,441,989 | | 265,609 | | 172,846 |
% of Shares Present | | 76.68% | | 14.12% | | 9.19% |
% of Outstanding Shares | | 39.99% | | 7.37% | | 4.79% |
| | | |
| | | | | Number of Eligible Shareholders | | |
| Proposal 2 | | For | | Against | | Abstain |
To approve a change in the Fund’s sub-classification under the Investment Company Act of 1940, as amended, from “diversified” to “non-diversified.” | | 1,397,611 | | 296,571 | | 186,262 |
% of Shares Present | | 74.32% | | 15.77% | | 9.91% |
% of Outstanding Shares | | 38.76% | | 8.22% | | 5.17% |
| | | |
| | | | | Number of Eligible Shareholders | | |
| Proposal 3 | | For | | Against | | Abstain |
To approve a modified manager-of-managers structure for the Fund that would permit the Investment Manager to enter into and materially amend subadvisory agreements with unaffiliated and affiliated subadvisers without obtaining shareholder approval and would also permit the Fund to disclose fees paid to subadvisers on an aggregate, rather than individual, basis. | | 1,272,315 | | 435,638 | | 172,491 |
% of Shares Present | | 67.66% | | 23.17% | | 9.17% |
% of Outstanding Shares | | 35.28% | | 12.08% | | 4.78% |
| | |
| Funds Totals: | | Shares |
| |
Record Total | | 3,606,176 |
Shares Voted | | 1,880,444 |
Percent Present | | 52.15% |
34
|
Other Information (continued) |
PROXY VOTE
A special meeting of the shareholders of AMG Veritas Global Focus Fund (the “Fund”) was held on June 25, 2021, to vote on proposals including to approve a new subadvisory agreement between AMG Funds LLC (the “Investment Manager”) and Veritas Asset Management LLP (“Veritas”) with respect to the Fund. The proposals and results of the votes are summarized below.
| | | | | | |
| | | | | Number of Eligible Shareholders | | |
| Proposal 1 | | For | | Against | | Abstain |
| | | |
To approve a new subadvisory agreement between the Investment Manager and Veritas with respect to the Fund. | | 707,034 | | 90,781 | | 88,966 |
% of Shares Present | | 79.73% | | 10.24% | | 10.03% |
% of Outstanding Shares | | 40.10% | | 5.15% | | 5.05% |
| | | |
| | | | | Number of Eligible Shareholders | | |
| Proposal 2 | | For | | Against | | Abstain |
| | | |
To approve a change in the Fund’s sub-classification under the Investment Company Act of 1940, as amended, from “diversified” to “non-diversified.” | | 696,596 | | 99,282 | | 90,903 |
% of Shares Present | | 78.55% | | 11.20% | | 10.25% |
% of Outstanding Shares | | 39.51% | | 5.63% | | 5.16% |
| | | |
| | | | | Number of Eligible Shareholders | | |
| Proposal 3 | | For | | Against | | Abstain |
To approve a modified manager-of-managers structure for the Fund that would permit the Investment Manager to enter into and materially amend subadvisory agreements with unaffiliated and affiliated subadvisers without obtaining shareholder approval and would also permit the Fund to disclose fees paid to subadvisers on an aggregate, rather than individual, basis. | | 689,351 | | 114,147 | | 83,283 |
% of Shares Present | | 77.74% | | 12.87% | | 9.39% |
% of Outstanding Shares | | 39.10% | | 6.47% | | 4.72% |
| | |
| Funds Totals: | | Shares |
| |
Record Total | | 1,763,095 |
Shares Voted | | 886,781 |
Percent Present | | 50.30% |
35
|
AMG Funds Trustees and Officers |
| | | | |
| The Trustees and Officers of the Trust, their business addresses, principal occupations for the past five years and ages are listed below. The Trustees provide broad supervision over the affairs of the Trust and the Funds. The Trustees are experienced executives who meet periodically throughout the year to oversee the Funds’ activities, review contractual arrangements with companies that provide services to the Funds, and | | review the Funds’ performance. Unless otherwise noted, the address of each Trustee or Officer is the address of the Trust: 680 Washington Blvd., Suite 500, Stamford, CT. 06901. There is no stated term of office for Trustees. Trustees serve until their resignation, retirement or removal in | | accordance with the Trust’s organizational documents and policies adopted by the Board from time to time. The Chairman of the Trustees, President, Treasurer and Secretary of the Trust are elected by the Trustees annually. Other officers hold office at the pleasure of the Trustees. |
Independent Trustees
The following Trustees are not “interested persons” of the Trust within the meaning of the 1940 Act:
| | |
Number of Funds Overseen in Fund Complex | | Name, Age, Principal Occupation(s) During Past 5 Years and Other Directorships Held by Trustee |
| |
• Trustee since 2012 • Oversees 42 Funds in Fund Complex | | Bruce B. Bingham, 72 Partner, Hamilton Partners (real estate development firm) (1987-Current); Director of The Yacktman Funds (2 portfolios) (2000-2012). |
| |
• Trustee since 2013 • Chairman of the Audit Committee since 2021 • Oversees 46 Funds in Fund Complex | | Kurt A. Keilhacker, 58 Managing Partner, TechFund Europe (2000-Present); Managing Partner, TechFund Capital (1997-Present); Managing Partner, Elementum Ventures (2013-Present); Director, MetricStory, Inc. (2017-Present); Trustee, Wheaton College (2018-Present); Trustee, Gordon College (2001-2016); Board Member, 6wind SA (2002-2019). |
| |
• Trustee since 2000 • Oversees 42 Funds in Fund Complex | | Steven J. Paggioli, 71 Independent Consultant (2002-Present); Trustee, Professionally Managed Portfolios (28 portfolios); Advisory Board Member, Sustainable Growth Advisors, LP; Independent Director, Muzinich BDC, Inc. (business development company) (2019-Present); Director, The Wadsworth Group; Independent Director, Chase Investment Counsel (2008–2019); Executive Vice President, Secretary and Director, Investment Company Administration, LLC and First Fund Distributors, INC. (1990-2001). |
| |
• Trustee since 2013 • Oversees 42 Funds in Fund Complex | | Richard F. Powers III, 75 Adjunct Professor, U.S. Naval War College (2016-Present); Adjunct Professor, Boston College (2011-2015); Director, Ameriprise Financial Inc. (2005-2009); President and CEO of Van Kampen Investments Inc. (1998-2003); President, Morgan Stanley Client Group (2000-2002); Executive Vice President and Chief Marketing Officer of the Morgan Stanley Individual Investor Group (1984-1998). |
| |
• Independent Chairman • Trustee since 2000 • Oversees 46 Funds in Fund Complex | | Eric Rakowski, 63 Professor of Law, University of California at Berkeley School of Law (1990-Present); Tax Attorney at Davis Polk & Wardwell and clerked for Judge Harry T. Edwards of the U.S. Court of Appeals for the District of Columbia Circuit and for Justice William J. Brennan Jr. of the U.S. Supreme Court; Director of Harding, Loevner Funds, Inc. (10 portfolios); Trustee of Third Avenue Trust (3 portfolios) (2002-2019); Trustee of Third Avenue Variable Trust (1 portfolio) (2002-2019). |
| |
• Trustee since 2013 • Oversees 46 Funds in Fund Complex | | Victoria L. Sassine, 56 Adjunct Professor, Babson College (2007–Present); Director, Board of Directors, PRG Group (2017-Present); CEO, Founder, Scale Smarter Partners, LLC (2018-Present); Adviser, EVOFEM Biosciences (2019-Present); Chairperson of the Board of Directors of Business Management Associates (2018 to 2019). |
| |
• Trustee since 2000 • Oversees 42 Funds in Fund Complex | | Thomas R. Schneeweis, 74 Professor Emeritus, University of Massachusetts (2013-Present); President, TRS Associates (1982-Present); Board Member, Chartered Alternative Investment Association (“CAIA”) (2002-Present); Co-Founder and Director, Institute for Global Asset and Risk Management (Education) (2010-Present); Co-Owner, Quantitative Investment Technologies (2014-Present); Co-Owner, Yes Wealth Management (2018-Present); Director, CAIA Foundation (2010-2019); Partner, S Capital Wealth Advisors (2015-2018); Partner, S Capital Management, LLC (2007-2015); President, Alternative Investment Analytics, LLC, (formerly Schneeweis Partners, LLC) (2001-2013). |
36
|
AMG Funds Trustees and Officers (continued) |
Interested Trustees
Each Trustee in the following table is an “interested person” of the Trust within the meaning of the 1940 Act. Ms. Carsman is an interested person of the Trust within the meaning of the 1940 Act by virtue of her position with, and interest in securities of, AMG.
| | |
Number of Funds Overseen in Fund Complex | | Name, Age, Principal Occupation(s) During Past 5 Years and Other Directorships Held by Trustee |
| | |
• Trustee since 2011 • Oversees 42 Funds in Fund Complex | | Christine C. Carsman, 69 Affiliated Managers Group, Inc. (2004-Present): Senior Policy Advisor (2019-Present), Executive Vice President, Deputy General Counsel and Chief Regulatory Counsel (2017-2018), Senior Vice President and Deputy General Counsel (2011-2016), Senior Vice President and Chief Regulatory Counsel (2007-2011), Vice President and Chief Regulatory Counsel (2004-2007); Chair of the Board of Directors, AMG Funds plc (2015-2018); Director, AMG Funds plc (2010-2018); Senior Counsel, Vice President and Director of Operational Risk Management and Compliance, Wellington Management Company, LLP (1995-2004); Director Emeritus of Harding, Loevner Funds, Inc. (0 Portfolios) (2021- Present); Director of Harding, Loevner Funds, Inc. (9 portfolios) (2017-2020); Secretary and Chief Legal Officer, AMG Funds, AMG Funds I, AMG Funds II and AMG Funds III (2004-2011). |
| | |
• Trustee since 2021 • Oversees 42 Funds in Fund Complex | | Garret W. Weston, 40 Affiliated Managers Group, Inc. (2008-Present): Managing Director, Co-Head of Affiliate Engagement (2021-Present), Senior Vice President, Affiliate Development (2016-2021), Vice President, Office of the CEO (2015-2016), Vice President, New Investments (2012-2015), Senior Associate, New Investments (2008-2012); Associate, Madison Dearborn Partners (2006-2008); Analyst, Merrill Lynch (2004-2006). |
| | |
| Officers | | |
Position(s) Held with Fund and Length of Time Served | | Name, Age, Principal Occupation(s) During Past 5 Years |
| | |
• President since 2018 • Principal Executive Officer since 2018 • Chief Executive Officer since 2018 • Chief Operating Officer since 2007 | | Keitha L. Kinne, 63 Chief Operating Officer, AMG Funds LLC (2007-Present); Chief Investment Officer, AMG Funds LLC (2008-Present); President and Principal, AMG Distributors, Inc. (2018-Present); Chief Operating Officer, AMG Distributors, Inc. (2007-Present); President, Chief Executive Officer and Principal Executive Officer, AMG Funds, AMG Funds I, AMG Funds II, AMG Funds III and AMG Funds IV (2018-Present); Chief Operating Officer, AMG Funds, AMG Funds I, AMG Funds II, and AMG Funds III (2007-Present); Chief Operating Officer, AMG Funds IV (2016-Present); Chief Operating Officer and Chief Investment Officer, Aston Asset Management, LLC (2016); President and Principal Executive Officer, AMG Funds, AMG Funds I, AMG Funds II and AMG Funds III (2012-2014); Managing Partner, AMG Funds LLC (2007-2014); President and Principal, AMG Distributors, Inc. (2012-2014); Managing Director, Legg Mason & Co., LLC (2006-2007); Managing Director, Citigroup Asset Management (2004-2006). |
| | |
• Secretary since 2015 • Chief Legal Officer since 2015 | | Mark J. Duggan, 56 Managing Director and Senior Counsel, AMG Funds LLC (2021-Present); Senior Vice President and Senior Counsel, AMG Funds LLC (2015-2021); Secretary and Chief Legal Officer, AMG Funds, AMG Funds I, AMG Funds II, AMG Funds III and AMG Funds IV (2015-Present); Attorney, K&L Gates, LLP (2009-2015). |
| | |
• Chief Financial Officer since 2017 • Treasurer since 2017 • Principal Financial Officer since 2017 • Principal Accounting Officer since 2017 | | Thomas G. Disbrow, 55 Vice President, Mutual Fund Treasurer & CFO, AMG Funds, AMG Funds LLC (2017-Present); Chief Financial Officer, Principal Financial Officer, Treasurer and Principal Accounting Officer, AMG Funds, AMG Funds I, AMG Funds II, AMG Funds III and AMG Funds IV (2017-Present); Managing Director - Global Head of Traditional Funds Product Control, UBS Asset Management (Americas), Inc. (2015-2017); Managing Director - Head of North American Funds Treasury, UBS Asset Management (Americas), Inc. (2011-2015). |
| | |
• Deputy Treasurer since 2017 | | John A. Starace, 51 Vice President, Mutual Fund Accounting, AMG Funds LLC (2021-Present); Director, Mutual Fund Accounting, AMG Funds LLC (2017-2021); Vice President, Deputy Treasurer of Mutual Funds Services, AMG Funds LLC (2014-2017); Deputy Treasurer, AMG Funds, AMG Funds I, AMG Funds II, AMG Funds III and AMG Funds IV (2017-Present); Vice President, Citi Hedge Fund Services (2010-2014); Audit Senior Manager (2005-2010) and Audit Manager (2001-2005), Deloitte & Touche LLP. |
| | |
• Chief Compliance Officer and Sarbanes-Oxley Code of Ethics since 2019 | | Patrick J. Spellman, 47 Vice President, Chief Compliance Officer, AMG Funds LLC (2017-Present); Chief Compliance Officer, AMG Distributors, Inc., (2010-Present); Chief Compliance Officer and Sarbanes-Oxley Code of Ethics Compliance Officer, AMG Funds, AMG Funds I, AMG Funds II, AMG Funds III and AMG Funds IV (2019-Present); Senior Vice President, Chief Compliance Officer, AMG Funds LLC (2011-2017); Anti-Money Laundering Compliance Officer, AMG Funds, AMG Funds I, AMG Funds II, and AMG Funds III (2014-2019); Anti-Money Laundering Officer, AMG Funds IV, (2016-2019); Compliance Manager, Legal and Compliance, Affiliated Managers Group, Inc. (2005-2011). |
37
|
AMG Funds Trustees and Officers (continued) |
| | |
Position(s) Held with Fund and Length of Time Served | | Name, Age, Principal Occupation(s) During Past 5 Years |
| | |
• Assistant Secretary since 2016 | | Maureen A. Meredith, 36 Vice President, Senior Counsel, AMG Funds LLC (2021-Present); Vice President, Counsel, AMG Funds LLC (2019-2021); Director, Counsel, AMG Funds LLC (2017-2018); Vice President, Counsel, AMG Funds LLC (2015-2017); Assistant Secretary, AMG Funds, AMG Funds I, AMG Funds II, AMG Funds III and AMG Funds IV (2016-Present); Associate, Ropes & Gray LLP (2011-2015); Law Fellow, Massachusetts Appleseed Center for Law and Justice (2010-2011). |
| | |
• Anti-Money Laundering Compliance Officer since 2019 | | Hector D. Roman, 43 Director, Legal and Compliance, AMG Funds LLC (2020-Present); Anti-Money Laundering Compliance Officer, AMG Funds, AMG Funds I, AMG Funds II, AMG Funds III and AMG Funds IV (2019-Present); Manager, Legal and Compliance, AMG Funds LLC (2017-2019); Director of Compliance, Morgan Stanley Investment Management (2015-2017); Senior Advisory, PricewaterhouseCoopers LLP (2014-2015); Risk Manager, Barclays Investment Bank (2008-2014). |
38
|
Annual Renewal of Investment Management and Subadvisory Agreements |
| | | | |
AMG Veritas China Fund (formerly AMG Managers Emerging Opportunities Fund) and AMG Veritas Global Focus Fund (formerly AMG FQ Tax-Managed U.S. Equity Fund): Approval of Investment Management Agreements on June 24, 2021 At a meeting held via telephone and video conference on June 24, 2021,1 the Board of Trustees (the “Board” or the “Trustees”), and separately a majority of the Trustees who are not “interested persons” of AMG Funds I (the “Trust”) (the “Independent Trustees”), approved (i) the Fund Management Agreement, as amended pursuant to letter agreements at any time prior to the date of the meeting, with AMG Funds LLC (the “Investment Manager”) for AMG Veritas China Fund (formerly AMG Managers Emerging Opportunities Fund) and separately each of Amendment No. 1 thereto dated July 1, 2015, and Amendment No. 2 thereto dated October 1, 2016, and (ii) the Investment Management Agreement, as amended pursuant to letter agreements at any time prior to the date of the meeting, with the Investment Manager for AMG Veritas Global Focus Fund (formerly AMG FQ Tax-Managed U.S. Equity Fund) and separately each of Amendment No. 1 thereto dated July 1, 2015, and Amendment No. 2 thereto dated October 1, 2016 (collectively, the “Investment Management Agreements”).2 The Independent Trustees were separately represented by independent legal counsel in connection with their consideration of the approval of the Investment Management Agreements. In considering the Investment Management Agreements, the Trustees reviewed a variety of materials relating to AMG Veritas China Fund and AMG Veritas Global Focus Fund (each, a “Fund,” and collectively, the “Funds”) and the Investment Manager, including the nature, extent and quality of services, comparative performance, fee and expense information for an appropriate peer group of similar mutual funds for each Fund (each, a “Peer Group”), performance information for the relevant benchmark index for each Fund (each, a “Fund Benchmark”), other relevant matters, and other information provided to them on a periodic basis throughout the year. Prior to voting, the Independent Trustees: (a) reviewed the foregoing information with their independent legal counsel; (b) received materials from their independent legal counsel discussing the legal standards applicable to their consideration of the Investment Management Agreements; and (c) met with their independent legal counsel in private sessions at which no representatives of management were present. | | NATURE, EXTENT AND QUALITY OF SERVICES In considering the nature, extent and quality of the services provided by the Investment Manager, the Trustees reviewed information relating to the Investment Manager’s operations and personnel. Among other things, the Investment Manager provided financial information, information about its supervisory and professional staff and descriptions of its organizational and management structure. The Trustees also took into account information provided periodically throughout the previous year by the Investment Manager in Board meetings relating to the performance of its duties with respect to the Funds and the Trustees’ knowledge of the Investment Manager’s management and the quality of the performance of the Investment Manager’s duties under the Investment Management Agreements and Administration Agreement. In the course of their deliberations regarding the Investment Manager, the Trustees evaluated, among other things: (a) the extent and quality of the Investment Manager’s oversight of the operation and management of the Funds; (b) the quality of the Investment Manager’s oversight of the performance by the Subadviser of its portfolio management duties; (c) the Investment Manager’s ability to supervise the Funds’ other service providers; and (d) the Investment Manager’s compliance program. The Trustees also took into account that, in performing its functions under the Investment Management Agreements and supervising the Subadviser, the Investment Manager: performs periodic detailed analyses and reviews of the performance by the Subadviser of its obligations to each Fund, including without limitation, analysis and review of portfolio and other compliance matters and review of the Subadviser’s investment performance with respect to a Fund; prepares and presents periodic reports to the Board regarding the investment performance of the Subadviser and other information regarding the Subadviser, at such times and in such forms as the Board may reasonably request; reviews and considers any changes in the personnel of the Subadviser responsible for performing the Subadviser’s obligations and makes appropriate reports to the Board; reviews and considers any changes in the ownership or senior management of the Subadviser and makes appropriate reports to the Board; performs periodic in-person, telephonic or videoconference diligence meetings, including with respect to compliance matters, with representatives | | of the Subadviser; assists the Board and management of the Trust in developing and reviewing information with respect to the initial approval of each Subadvisory Agreement and annual consideration of each Subadvisory Agreement thereafter; prepares recommendations with respect to the continued retention of the Subadviser or the replacement of the Subadviser, including at the request of the Board; identifies potential successors to, or replacements of, the Subadviser or potential additional subadvisers, including performing appropriate due diligence, and developing and presenting to the Board a recommendation as to any such successor, replacement, or additional subadviser, including at the request of the Board; designates and compensates from its own resources such personnel as the Investment Manager may consider necessary or appropriate to the performance of its services; and performs such other review and reporting functions as the Board shall reasonably request consistent with the Investment Management Agreements and applicable law. The Trustees noted the affiliation of the Subadviser with the Investment Manager, noting any potential conflicts of interest. The Trustees also took into account the financial condition of the Investment Manager with respect to its ability to provide the services required under the Investment Management Agreements and the Investment Manager’s undertaking to maintain contractual expense limitations for the Funds. The Trustees also considered the Investment Manager’s risk management processes. PERFORMANCE The Board considered each Fund’s net performance during relevant time periods as compared to the Fund’s Peer Group and Fund Benchmark and noted that the Board reviews on a quarterly basis detailed information about both the Fund’s performance results and portfolio composition, as well as the Subadviser’s investment philosophy, strategy and techniques used in managing each Fund. The Board was mindful of the Investment Manager’s expertise, resources and attention to monitoring the Subadviser’s performance, investment style and risk-adjusted performance with respect to the Funds and its discussions with the management of the Funds’ subadvisers during the period regarding the factors that contributed to the performance of the Funds. |
39
|
Annual Renewal of Investment Management and Subadvisory Agreements (continued) |
| | | | |
With respect to AMG Veritas China Fund, among other information relating to the Fund’s performance, the Trustees noted that the Fund’s performance for Class N shares (which share class has the earliest inception date and the largest amount of assets of all the share classes of the Fund) for the 1-year, 3-year, 5-year and 10-year periods ended March 31, 2021 was above the median performance of the Peer Group and above the performance of the Fund Benchmark, the MSCI China Index. The Trustees took into account management’s discussion of the Fund’s performance, noting that Class N shares of the Fund ranked in first percentile relative to its Peer Group for the 1-year and 10-year periods, in the top quintile relative to its Peer Group for the 3-year period, and in the top quartile relative to its Peer Group for the 5-year period. The Trustees also took into account the fact that the Fund’s subadviser, investment strategy, and Fund Benchmark changed effective May 21, 2021, and that the performance information reflected that of the Fund’s prior subadvisers and investment strategy. The Trustees concluded that the Fund’s overall performance has been satisfactory. With respect to AMG Veritas Global Focus Fund, among other information relating to the Fund’s performance, the Trustees noted that the Fund’s performance for Class I shares (which share class has the earliest inception date and the largest amount of assets of all the share classes of the Fund) for the 1-year, 3-year, 5-year and 10-year periods ended March 31, 2021 was below, above, above, and above, respectively, the median performance of the Peer Group and below, below, below, and above, respectively, the performance of the Fund Benchmark, the MSCI World Index. The Trustees took into account management’s discussion of the Fund’s performance, noting that the Fund outperformed the median of its Peer Group for the 3-year, 5-year, and 10-year periods and ranked in the top quintile relative to its Peer Group for the 10-year period. The Trustees also took into account the fact that the Fund’s subadviser, investment strategy, and Fund Benchmark changed effective May 21, 2021, and that the performance information reflected that of the Fund’s prior subadviser and investment strategy. The Trustees concluded that the Fund’s performance is being addressed. ADVISORY FEES; FUND EXPENSES; PROFITABILITY; AND ECONOMIES OF SCALE In considering the reasonableness of the advisory fee payable to the Investment Manager, the Trustees reviewed information provided by the Investment Manager at the June 24, 2021 and prior meetings setting forth all revenues and other benefits, both | | direct and indirect (including any so-called “fallout benefits” such as reputational value derived from the Investment Manager serving as Investment Manager to a Fund), received by the Investment Manager and its affiliates attributable to managing each Fund and all the mutual funds in the AMG Funds Family of Funds; the cost of providing such services; the significant risks undertaken as Investment Manager and sponsor of the Funds, including investment, operational, enterprise, entrepreneurial, litigation, regulatory and compliance risks; and the resulting profitability to the Investment Manager and its affiliates from these relationships. The Trustees also considered the changes to the management and subadvisory fee rates and the changes to the expense caps that were approved by the Trustees during the past year for each Fund. The Trustees also considered the amount of the advisory fee retained by the Investment Manager after payment of the subadvisory fee with respect to each Fund. The Trustees also noted payments made or to be made from the Subadviser to the Investment Manager, and other payments made or to be made from the Investment Manager to the Subadviser. The Trustees also considered management’s discussion of the current asset levels of the Funds, and the impact on profitability of both the current asset levels and any future growth of assets of the Funds. In considering the cost of services to be provided by the Investment Manager under each Investment Management Agreement and the profitability to the Investment Manager of its relationship with each Fund, the Trustees noted the undertaking by the Investment Manager to maintain contractual expense limitations for the Funds. The Board also took into account management’s discussion of the advisory fee structure and the services the Investment Manager provides in performing its functions under each Investment Management Agreement and supervising the Subadviser. Based on the foregoing, the Trustees concluded that the profitability to the Investment Manager is reasonable and that the Investment Manager is not realizing material benefits from economies of scale that would warrant adjustments to the advisory fee at this time. Also with respect to economies of scale, the Trustees noted that as a Fund’s assets increase over time, the Fund may realize other economies of scale to the extent the increase in assets is proportionally greater than the increase in certain other expenses. With respect to AMG Veritas China Fund, the Trustees noted that the management fees (which include both the advisory and administration fees) and total expenses (net of applicable expense waivers/reimbursements) of Class I shares (the class | | of shares which is the primary focus of the Fund’s distribution) of the Fund as of March 31, 2021 were both lower than the average for the Peer Group. The Trustees took into account the fact that the Investment Manager has contractually agreed, through March 1, 2023, to limit the Fund’s net annual operating expenses (subject to certain excluded expenses) to 0.94%. The Trustees also took into account that the Investment Manager has agreed, effective upon shareholder approval and implementation of a new subadvisory agreement for the Fund, through March 1, 2023, to lower the Fund’s contractual expense limitation to 0.93% of the Fund’s net annual operating expenses (subject to certain excluded expenses). The Trustees also noted that, effective upon shareholder approval and implementation of a new subadvisory agreement for the Fund, the Fund’s management fee rate would be reduced. The Trustees concluded that, in light of the nature, extent and quality of the services provided by the Investment Manager, the foregoing expense limitation and the considerations noted above with respect to the Investment Manager, the Fund’s advisory fees are reasonable. With respect to AMG Veritas Global Focus Fund, the Trustees noted that the management fees (which include both the advisory and administration fees) and total expenses (net of applicable expense waivers/reimbursements) of Class I shares of the Fund as of March 31, 2021 were both lower than the average for the Fund’s Peer Group. The Trustees took into account the fact that the Investment Manager has contractually agreed, through March 1, 2023, to limit the Fund’s net annual operating expenses (subject to certain excluded expenses) to 0.89%. The Trustees also took into account that the Investment Manager has agreed, effective upon shareholder approval and implementation of a new subadvisory agreement for the Fund, through March 1, 2023, to lower the Fund’s contractual expense limitation to 0.88% of the Fund’s net annual operating expenses (subject to certain excluded expenses). The Trustees also noted that, effective upon shareholder approval and implementation of a new subadvisory agreement for the Fund, the Fund’s management fee rate would be reduced. The Trustees concluded that, in light of the nature, extent and quality of the services provided by the Investment Manager, the foregoing expense limitation and the considerations noted above with respect to the Investment Manager, the Fund’s advisory fees are reasonable. With respect to AMG Veritas China Fund, the Trustees also considered information provided by the Investment Manager throughout the previous year related to the benefits of the strategic repositioning |
40
|
Annual Renewal of Investment Management and Subadvisory Agreements (continued) |
| | | | |
| of the AMG Funds complex for greater alignment with Affiliated Managers Group, Inc. (“AMG”), in which each fund that was not previously subadvised by an affiliate of AMG (each affiliate of AMG, an “Affiliate” and collectively, “Affiliates”) was transitioned to an AMG Affiliate subadviser. The Trustees considered that the strategic repositioning was expected to create value for the Fund, the other funds in the AMG Funds complex and their shareholders through enhanced resources and competitive fee levels. The Trustees noted the expectations that the changes would result in bringing the full range of AMG’s resources to bear on the growth and success of the AMG Funds, streamlining the lineup of funds in the AMG Funds complex and reducing the number of subadvisers in the AMG Funds complex, significantly reducing strategy overlap and providing more differentiated investment solutions for the AMG Funds complex that are otherwise not available to U.S. retail investors. The Trustees further considered the expectation that the repositioning would bring AMG’s strong partnerships in support of the Fund and the AMG Funds complex as a whole and enable AMG Funds to bring the best capabilities of AMG’s Affiliates to the Fund and the rest of the AMG Funds complex. The Trustees noted that AMG’s relationship | | with its Affiliates will also allow the Fund to have greater insight into the Affiliates’ compliance and business platform than is generally possible with third party subadvisers, aiding the ongoing monitoring of subadvisers. * * * * After consideration of the foregoing, the Trustees also reached the following conclusions (in addition to the conclusions discussed above) regarding the Investment Management Agreements: (a) the Investment Manager has demonstrated that it possesses the capability and resources to perform the duties required of it under each Investment Management Agreement and (b) the Investment Manager maintains an appropriate compliance program. Based on all of the above-mentioned factors and their related conclusions, with no single factor or conclusion being determinative and with each Trustee not necessarily attributing the same weight to each factor, the Trustees concluded that approval of each Investment Management Agreement would be in the best interests of the applicable Fund and its shareholders. Accordingly, on June 24, 2021, the Trustees, and separately a majority of the | | Independent Trustees, voted to approve the Investment Management Agreement for each Fund. 1 The Trustees determined that the conditions surrounding COVID-19 constituted unforeseen or emergency circumstances and that reliance on the Securities and Exchange Commission’s (“SEC”) exemptive order, which provides relief from the in-person voting requirements of the Investment Company Act of 1940, as amended (the “1940 Act”), in certain circumstances (the “In-Person Relief”), was necessary or appropriate due to the circumstances related to current or potential effects of COVID-19. The Trustees unanimously wished to rely on the In-Person Relief with respect to the approval of those matters on the agenda for the June 24, 2021 meeting that would otherwise require in-person votes under the 1940 Act. See Investment Company Release No. 33897 (June 19, 2020). This exemptive order supersedes, in part, a similar, earlier exemptive order issued by the SEC (Investment Company Release No. 33824 (March 25, 2020)). 2 At a meeting held via telephone and videoconference on March 17-18, 2021, the Board of the Trust, and separately a majority of the Independent Trustees, approved the Subadvisory Agreements with respect to AMG Veritas China Fund and AMG Veritas Global Focus Fund (each, a “Subadvisory Agreement”). Each Subadvisory Agreement was subsequently approved by the applicable Fund’s shareholders at special meetings held on June 25, 2021, for an initial two-year period. |
41
|
Approval of Subadvisory Agreement |
| | | | |
AMG Managers Emerging Opportunities Fund: Approval of Subadvisory Agreements on March 17-18, 2021 At a meeting held via telephone and videoconference on March 17-18, 2021,1 the Board of Trustees (the “Board” or the “Trustees”), and separately a majority of the Trustees who are not “interested persons” of AMG Funds I (the “Trust”) (the “Independent Trustees”), unanimously voted to approve the termination of the subadvisory agreements between AMG Funds LLC (the “Investment Manager”) and each of Next Century Growth Investors LLC, WEDGE Capital Management L.L.P. and RBC Global Asset Management (U.S.) Inc. (each, an “Existing Subadviser”) with respect to AMG Managers Emerging Opportunities Fund (the “Fund”) (the “Existing Subadvisory Agreements”), and approve the interim subadvisory agreement between the Investment Manager and Veritas Asset Management LLP (“Veritas”) with respect to the Fund (the “Interim Subadvisory Agreement”), the new subadvisory agreement between the Investment Manager and Veritas with respect to the Fund (the “New Subadvisory Agreement” and together with the Interim Subadvisory Agreement, the “Agreements”), and the presentation of the New Subadvisory Agreement for shareholder approval at a special meeting to be held for such purpose, including a recommendation that shareholders vote to approve the New Subadvisory Agreement. The Independent Trustees were separately represented by independent legal counsel in their consideration of the Agreements. In considering the Agreements, the Trustees considered the information relating to the Fund and Veritas provided to them in connection with the meeting on March 17-18, 2021. Prior to voting, the Independent Trustees: (a) reviewed the foregoing information; (b) received materials from their independent legal counsel discussing the legal standards applicable to their consideration of the Agreements; and (c) met with their independent legal counsel in a private session at which no representatives of management were present. NATURE, EXTENT AND QUALITY OF SERVICES In considering the nature, extent and quality of the services to be provided by Veritas, the Trustees reviewed information relating to Veritas’ financial condition, operations and personnel and the investment philosophy, strategies and techniques (the “Investment Strategy”) that are intended to be used by Veritas in managing the Fund. The Trustees noted that, under normal circumstances, the Fund would invest at least 80% of its net assets, plus the | | amount of any borrowings for investment purposes, in securities of issuers located in China (People’s Republic of China and its Special Administrative Regions, Hong Kong and Macau) or issuers that are not located in China but derive a majority (over 50%) of their income from China. The Trustees further noted that in connection with hiring Veritas, shareholders would be asked to approve a change in the Fund’s status from operating as a diversified fund to operating as a non-diversified fund. Among other things, the Trustees reviewed information on portfolio management and other professional staff, information regarding Veritas’ organizational and management structure, and Veritas’ compliance policies and procedures. The Trustees noted that Veritas was founded in 2003 and has 42 employees. The Trustees considered specific information provided regarding the experience of the individual at Veritas that is expected to have portfolio management responsibility for the Fund. The Trustees noted that the proposed portfolio manager joined Veritas in 2004. In the course of their deliberations, the Trustees evaluated, among other things: (a) the expected services to be rendered by Veritas to the Fund; (b) the qualifications and experience of Veritas’ personnel; and (c) Veritas’ compliance program. The Trustees additionally considered Veritas’ risk management processes. The Trustees reviewed Veritas’ compliance policies and procedures, code of ethics, and specific information related to how Veritas monitors, among other things, portfolio compliance and proxy voting and deemed all of them to be adequate. The Trustees also took into account the financial condition of Veritas with respect to its ability to provide the services required under the Agreements and noted that, as of December 31, 2020, Veritas managed approximately $33 billion in assets. The Trustees concluded that, given Veritas’ financial condition, it would be able to meet any reasonably foreseeable obligations under the Agreements. PERFORMANCE Because Veritas was proposing to manage the Fund with its China equity investment strategy, the Trustees noted that they could not draw any conclusions regarding the performance of the Fund to date. The Trustees, however, considered the performance provided by Veritas with respect to Veritas’ China Long Composite, which is managed in a substantially similar manner to the Fund. In this regard, the Trustees noted that the performance of the China Long Composite had not been adjusted for the fees and expenses of the Fund. The Trustees reviewed the year over year performance of the China Long Composite and noted that the composite | | outperformed its benchmark for the period from the inception date of the composite on September 28, 2018 through December 31, 2018. SUBADVISORY FEES, PROFITABILITY AND ECONOMIES OF SCALE The Trustees noted that the Investment Manager, and not the Fund, is responsible for paying the fees charged by Veritas. In considering the anticipated profitability of Veritas with respect to the provision of subadvisory services to the Fund, the Trustees considered information regarding Veritas’ organization, management and financial stability. The Trustees noted that, because Veritas is an affiliate of the Investment Manager, a portion of Veritas’ revenues or anticipated profits might be shared directly or indirectly with the Investment Manager. The Trustees also noted that the subadvisory fee rate to be paid to Veritas under each Agreement was lower than the rate paid to each Existing Subadviser under the applicable Existing Subadvisory Agreement. The Trustees further noted that the Investment Manager proposed certain fee changes for the Fund, all of which would be implemented upon the effectiveness of the New Subadvisory Agreement and would result in the overall reduction of the Fund’s net expense ratios as compared with the Fund’s current fee structure. The Trustees also considered the percentage amount of the advisory fee retained by the Investment Manager after payment of the subadvisory fee with respect to the Fund, which would increase if the New Subadvisory Agreement was approved. The Trustees also noted payments made or to be made from Veritas to the Investment Manager, and other payments made or to be made from the Investment Manager to Veritas, including certain expense sharing arrangements related to, among other things, shareholder servicing and distribution. The Trustees concluded that these arrangements were reasonable. The Trustees noted that the management fees (which include both the advisory and administration fees) and total expenses (net of applicable expense waivers/reimbursements) of Class I shares (the class of shares which is the primary focus of the Fund’s distribution) of the Fund would both be lower than the average for an appropriate peer group of similar mutual funds for the Fund once the new fee changes went into effect. The Board took into account management’s discussion of the proposed subadvisory fee structure, and the services Veritas is expected to provide in performing its functions under the Agreements. The Trustees also were provided with the estimated profitability of Veritas with respect to |
42
|
Approval of Subadvisory Agreement (continued) |
| | | | |
its proposed subadvisory services to the Fund. Based on the foregoing, the Trustees concluded that the profitability to Veritas is expected to be reasonable and that Veritas is not expected to realize material benefits from economies of scale that would warrant adjustments to the subadvisory fees at this time. Also with respect to economies of scale, the Trustees noted that as the Fund’s assets increase over time, the Fund may realize economies of scale with respect to certain fees and expenses, other than the Fund’s management fee, to the extent the increase in assets is proportionally greater than the increase in such fees and expenses. In addition, the Trustees considered other potential benefits of the subadvisory relationship to Veritas, including, among others, the potential broadening of Veritas’ China equity investment capabilities, as well as the indirect benefits that Veritas may receive from Veritas’ relationship with the Fund, including any so-called “fallout benefits” to Veritas, such as reputational value derived from Veritas serving as subadviser to the Fund, which bears Veritas’ name. Taking into account all of the foregoing, the Trustees concluded that, in light of the nature, extent and quality of the services to be provided by Veritas, and the other considerations noted above with respect to Veritas, the Fund’s subadvisory fees are reasonable. The Trustees also considered information provided by the Investment Manager related to the benefits of the proposed strategic repositioning of the AMG Funds complex. The Trustees considered that the strategic repositioning was expected to create value for the Fund, the other funds in the AMG Funds | | complex and their shareholders through enhanced resources and competitive fee levels. The Trustees noted that the proposed changes would bring the full range of AMG’s resources to bear on the growth and success of the AMG Funds, streamline the lineup of funds in the AMG Funds complex and reduce the number of subadvisers, significantly reduce strategy overlap and provide more differentiated investment solutions for the AMG Funds complex that are otherwise not available to U.S. retail investors. The Trustees further considered that the repositioning would bring AMG’s strong partnerships in support of the Fund and the AMG Funds complex as a whole and enable AMG Funds to bring the best capabilities of AMG’s Affiliates to the Fund and the rest of the AMG Funds complex. The Trustees noted that AMG’s relationship with its Affiliates will also allow the Fund to have greater insight into the Affiliate’s compliance and business platform than is generally possible with third party subadvisers, aiding the ongoing monitoring of subadvisers. In light of the foregoing, in approving the Agreements, the Trustees, including a majority of the Independent Trustees, determined that the hiring of Veritas is in the best interests of the Fund and its shareholders and does not involve a conflict of interest from which the Investment Manager or an affiliated subadviser derives an inappropriate advantage. * * * * After consideration of the foregoing, the Trustees reached the following conclusions (in addition to the conclusions discussed above) regarding each Agreement: (a) Veritas has demonstrated that it | | possesses the capability and resources to perform the duties required of it under each Agreement; (b) Veritas’ Investment Strategy is appropriate for pursuing the Fund’s investment objective; (c) Veritas is reasonably likely to execute its investment strategy consistently over time; and (d) Veritas maintains appropriate compliance programs. Based on all of the above-mentioned factors and their related conclusions, with no single factor or conclusion being determinative and with each Trustee not necessarily attributing the same weight to each factor, the Trustees concluded that approval of each Agreement would be in the best interests of the Fund and its shareholders. Accordingly, on March 17-18, 2021, the Trustees, and separately a majority of the Independent Trustees, unanimously voted to approve each Agreement. 1 The Trustees determined that the conditions surrounding the COVID-19 virus constituted unforeseen or emergency circumstances and that reliance on the SEC’s exemptive order, which provides relief from the in-person voting requirements of the 1940 Act in certain circumstances (the “In-Person Relief”), was necessary or appropriate due to the circumstances related to current or potential effects of COVID-19. The Trustees unanimously wished to rely on the In-Person Relief with respect to the approval of those matters on the agenda for the March 17-18, 2021 meeting that would otherwise require in-person votes under the 1940 Act. See Investment Company Release No. 33897 (June 19, 2020). This exemptive order supersedes, in part, a similar, earlier exemptive order issued by the SEC (Investment Company Release No. 33824 (March 25, 2020)). |
43
THIS PAGE INTENTIONALLY LEFT BLANK
| | |
| |  |
| | | | |
INVESTMENT MANAGER AND ADMINISTRATOR AMG Funds LLC 680 Washington Blvd., Suite 500 Stamford, CT 06901 800.548.4539 DISTRIBUTOR AMG Distributors, Inc. 680 Washington Blvd., Suite 500 Stamford, CT 06901 800.548.4539 SUBADVISER Veritas Asset Management LLP 1 Smart’s Place London, WC2B 5LW CUSTODIAN The Bank of New York Mellon Mutual Funds Custody 6023 Airport Road Oriskany, NY 13424 | | LEGAL COUNSEL Ropes & Gray LLP Prudential Tower, 800 Boylston Street Boston, MA 02199-3600 TRANSFER AGENT BNY Mellon Investment Servicing (US) Inc. Attn: AMG Funds 4400 Computer Drive Westborough, MA 01581 800.548.4539 | | This report is prepared for the Funds’ shareholders. It is authorized for distribution to prospective investors only when preceded or accompanied by an effective prospectus. To receive a free copy of the prospectus or Statement of Additional Information, which includes additional information about Fund Trustees, please contact us by calling 800.548.4539. Distributed by AMG Distributors, Inc., member FINRA/SIPC. Current net asset values per share for each Fund are available on the Funds’ website at amgfunds.com. A description of the policies and procedures each Fund uses to vote its proxies is available: (i) without charge, upon request, by calling 800.548.4539, or (ii) on the Securities and Exchange Commission’s (SEC) website at sec.gov. For information regarding the Funds’ proxy voting record for the 12-month period ended June 30, call 800.548.4539 or visit the SEC website at sec.gov. The Funds file their complete schedule of portfolio holdings with the SEC for the first and third quarters of each fiscal year as an exhibit to their reports on Form N-PORT. The Funds’ portfolio holdings on Form N-PORT are available on the SEC’s website at sec.gov and the Funds’ website at amgfunds.com. To review a complete list of the Funds’ portfolio holdings, or to view the most recent semiannual report or annual report, please visit amgfunds.com. |
| | |
| | |
| | | | | | | | | | |
BALANCED FUNDS AMG GW&K Global Allocation GW&K Investment Management, LLC AMG FQ Global Risk-Balanced First Quadrant, L.P. EQUITY FUNDS AMG Beutel Goodman International Equity Beutel, Goodman & Company Ltd. AMG Boston Common Global Impact Boston Common Asset Management, LLC AMG Managers CenterSquare Real Estate CenterSquare Investment Management LLC AMG Frontier Small Cap Growth Frontier Capital Management Co., LLC AMG GW&K Small Cap Core AMG GW&K Small Cap Value AMG GW&K Small/Mid Cap AMG GW&K Small/Mid Cap Growth AMG GW&K Emerging Markets Equity AMG GW&K Emerging Wealth Equity AMG GW&K International Small Cap GW&K Investment Management, LLC AMG Montrusco Bolton Large Cap Growth Montrusco Bolton Investments, Inc. | | | | AMG Renaissance Large Cap Growth The Renaissance Group LLC AMG River Road Dividend All Cap Value AMG River Road Focused Absolute Value AMG River Road International Value Equity AMG River Road Large Cap Value Select AMG River Road Mid Cap Value AMG River Road Small-Mid Cap Value AMG River Road Small Cap Value River Road Asset Management, LLC AMG TimesSquare Emerging Markets Small Cap AMG TimesSquare Global Small Cap AMG TimesSquare International Small Cap AMG TimesSquare Mid Cap Growth AMG TimesSquare Small Cap Growth TimesSquare Capital Management, LLC AMG Veritas Asia Pacific AMG Veritas China AMG Veritas Global Focus AMG Veritas Global Real Return Veritas Asset Management LLP AMG Yacktman AMG Yacktman Focused AMG Yacktman Global AMG Yacktman Special Opportunities Yacktman Asset Management LP | | | | FIXED INCOME FUNDS AMG Beutel Goodman Core Plus Bond Beutel, Goodman & Company Ltd. AMG GW&K Core Bond ESG AMG GW&K Enhanced Core Bond ESG AMG GW&K ESG Bond AMG GW&K High Income AMG GW&K Municipal Bond AMG GW&K Municipal Enhanced Yield GW&K Investment Management, LLC | | |
| | | | |
amgfunds.com | | 103121 | | AR084 |
| | |
| | ANNUAL REPORT |
| | | | | | | | |
| | | | | AMG Funds October 31, 2021 |
| | | | | AMG Frontier Small Cap Growth Fund |
| | | | | Class N: MSSVX | | Class I: MSSCX | | Class Z: MSSYX |
| | | | | | | | | |
| | | | | | | | | |
| | | | | | | | | |
| | | | |
| amgfunds.com | | | | 103121 AR085 |
| | |
| | | AMG Funds Annual Report — October 31, 2021 |
| | | | | | |
| | | |
| | | | | | | |
| | | TABLE OF CONTENTS | | PAGE | |
| | | | |
| | | LETTER TO SHAREHOLDERS | | | 2 | |
| | | |
| | | ABOUT YOUR FUND’S EXPENSES | | | 3 | |
| | | |
| | | PORTFOLIO MANAGER’S COMMENTS, FUND SNAPSHOTS AND SCHEDULE OF PORTFOLIO INVESTMENTS | | | 4 | |
| | | |
| | | FINANCIAL STATEMENTS | | | | |
| | | |
| | | Statement of Assets and Liabilities | | | 10 | |
| | | |
| | | Balance sheet, net asset value (NAV) per share computations
and cumulative distributable earnings (loss) | | | | |
| | | |
| | | Statement of Operations | | | 12 | |
| | | |
| | | Detail of sources of income, expenses, and realized and
unrealized gains (losses) during the fiscal year | | | | |
| | | |
| | | Statements of Changes in Net Assets | | | 13 | |
| | | |
| | | Detail of changes in assets for the past two fiscal years | | | | |
| | | |
| | | Financial Highlights | | | 14 | |
| | | |
| | | Historical net asset values per share, distributions, total returns, income
and expense ratios, turnover ratios and net assets | | | | |
| | | |
| | | Notes to Financial Statements | | | 17 | |
| | | |
| | | Accounting and distribution policies, details of agreements and
transactions with Fund management and affiliates, and descriptions of
certain investment risks | | | | |
| | | |
| | | REPORT OF INDEPENDENT REGISTERED PUBLIC ACCOUNTING FIRM | | | 22 | |
| | | |
| | | OTHER INFORMATION | | | 23 | |
| | | |
| | | TRUSTEES AND OFFICERS | | | 24 | |
| | | |
| | | ANNUAL RENEWAL OF INVESTMENT MANAGEMENT AND SUBADVISORY AGREEMENTS | | | 27 | |
| | | | | | |
| | | | |
|
Nothing contained herein is to be considered an offer, sale or solicitation of an offer to buy shares of any series of the AMG Funds Family of Funds. Such offering is made only by prospectus, which includes details as to offering price and other material information. |
| | |
| | Letter to Shareholders |
Dear Shareholder:
The fiscal year ended October 31, 2021, was marked by the continued extraordinary recovery amid an unprecedented global effort to stop the COVID-19 pandemic. Equities rallied to new record highs amid better-than-expected corporate earnings, colossal fiscal and monetary stimulus programs, and an improving economic backdrop. Since the market bottom on March 23, 2020, the S&P 500® Index has gained over 111%. Businesses and consumers contended with disrupted supply chains and rising prices on a wide range of goods such as lumber and gasoline, and outbreaks of coronavirus variants kept the world on edge. Volatility increased in September as investors grew more concerned about rising inflation and more hawkish global central bank policies, but equities were resilient and finished the fiscal year with a strong rally.
The S&P 500® gained 42.91% during the period and all sectors produced double-digit returns, but there was very wide dispersion in performance. Energy and financials led the market with returns of 111.38% and 72.14%, respectively. On the other hand, utilities and consumer staples lagged with returns of 10.64% and 19.02%, respectively. Value stocks edged out Growth stocks as the Russell 1000® Value Index returned 43.76% compared to the 43.21% return for the Russell 1000® Growth Index. Small cap stocks outperformed as the Russell 2000® Index experienced its best quarter (fourth quarter 2020) on record. Within small caps, the Value-Growth disparity was much more pronounced as the Russell 2000® Value Index returned 64.30% compared to 38.45% for the Russell 2000® Growth Index. Outside the U.S., foreign developed markets lagged their U.S. counterparts with a 34.18% return for the MSCI EAFE Index. A major regulatory crackdown in China shook investor confidence in Chinese equities and caused emerging markets to underperform with a 16.96% return for the MSCI Emerging Markets Index.
Interest rates lifted off from near-historic lows as the vaccine rollout initiated a return to normalcy and the economic outlook improved. The 10-year Treasury yield rose 69 basis points to 1.55% and ended the fiscal year not far off its post-pandemic high. The Bloomberg U.S. Aggregate Bond Index, a broad measure of U.S. bond market performance, lost 0.48% over the period. Healthy risk appetite drove credit spreads tighter and helped investment-grade corporate bonds produce a modestly positive 2.18% return. The global search for yield helped high-yield bonds outperform the investment-grade market with a 10.53% return as measured by the return of the Bloomberg U.S. Corporate High Yield Bond Index. Municipal bonds benefited from a strong technical backdrop and drove a 2.64% return for the Bloomberg Municipal Bond Index.
AMG Funds appreciates the privilege of providing investment tools to you and your clients. Our foremost goal is to provide investment solutions that help our shareholders successfully reach their long-term investment goals. AMG Funds provides access to a distinctive array of actively managed return-oriented investment strategies. We thank you for your continued confidence and investment in AMG Funds. You can rest assured that under all market conditions our team is focused on delivering excellent investment management services for your benefit.
Respectfully,
Keitha Kinne
President
AMG Funds
| | | | | | | | | | | | | | |
| Average Annual Total Returns | | Periods ended October 31, 2021* | |
| | | | |
| Stocks: | | | | 1 Year | | | 3 Years | | | 5 Years | |
| | | | |
Large Cap | | (S&P 500® Index) | | | 42.91 | % | | | 21.48% | | | | 18.93% | |
| | | | |
Small Cap | | (Russell 2000® Index) | | | 50.80 | % | | | 16.47% | | | | 15.52% | |
| | | | |
International | | (MSCI All Country World Index ex USA) | | | 29.66 | % | | | 12.00% | | | | 9.77% | |
| Bonds: | | | | | | | | | | | |
| | | | |
Investment Grade | | (Bloomberg U.S. Aggregate Bond Index) | | | (0.48 | )% | | | 5.63% | | | | 3.10% | |
| | | | |
High Yield | | (Bloomberg U.S. Corporate High Yield Bond Index) | | | 10.53 | % | | | 7.43% | | | | 6.40% | |
| | | | |
Tax-exempt | | (Bloomberg Municipal Bond Index) | | | 2.64 | % | | | 5.17% | | | | 3.41% | |
| | | | |
Treasury Bills | | (ICE BofAML U.S. 6-Month Treasury Bill Index) | | | 0.11 | % | | | 1.37% | | | | 1.32% | |
*Source: FactSet. Past performance is no guarantee of future results.
2
|
About Your Fund’s Expenses |
| | | | | | | | |
As a shareholder of a Fund, you may incur two types of costs: (1) transaction costs, which may include sales charges (loads) on purchase payments; redemption fees; and exchange fees; and (2) ongoing costs, including management fees; distribution (12b-1) fees; and other Fund expenses. This example is intended to help you understand your ongoing costs (in dollars) of investing in the Fund and to compare these costs with the ongoing costs of investing in other mutual funds. The example is based on $1,000 invested at the beginning of the period and held for the entire period as indicated below. ACTUAL EXPENSES The first line of the following table provides information about the actual account values and | | | | actual expenses. You may use the information in this line, together with the amount you invested, to estimate the expenses that you paid over the period. Simply divide your account value by $1,000 (for example, an $8,600 account value divided by $1,000 = 8.6), then multiply the result by the number in the first line under the heading entitled “Expenses Paid During Period” to estimate the expenses you paid on your account during this period. HYPOTHETICAL EXAMPLE FOR COMPARISON PURPOSES The second line of the following table provides information about hypothetical account values and hypothetical expenses based on the Fund’s actual expense ratio and an assumed annual rate of return of 5% before expenses, which is not the Fund’s | | | | actual return. The hypothetical account values and expenses may not be used to estimate the actual ending account balance or expenses you paid for the period. You may use this information to compare the ongoing costs of investing in the Fund and other funds by comparing this 5% hypothetical example with the 5% hypothetical examples that appear in the shareholder reports of other funds. Please note that the expenses shown in the table are meant to highlight your ongoing costs only and do not reflect any transactional costs, such as sales charges (loads), redemption fees, or exchange fees. Therefore, the second line of the table is useful in comparing ongoing costs only, and will not help you determine the relative total costs of owning different funds. |
| | | | | | | | |
| | | | | | | | |
Six Months Ended October 31, 2021 | | Expense Ratio for the Period | | Beginning Account Value 05/01/21 | | Ending Account Value 10/31/21 | | Expenses Paid During the Period* |
AMG Frontier Small Cap Growth Fund |
|
Based on Actual Fund Return |
| | | | |
Class N | | 1.30% | | $1,000 | | $1,027 | | $6.64 |
| | | | |
Class I | | 0.94% | | $1,000 | | $1,028 | | $4.81 |
| | | | |
Class Z | | 0.90% | | $1,000 | | $1,029 | | $4.60 |
|
Based on Hypothetical 5% Annual Return |
| | | | |
Class N | | 1.30% | | $1,000 | | $1,019 | | $6.61 |
| | | | |
Class I | | 0.94% | | $1,000 | | $1,020 | | $4.79 |
| | | | |
Class Z | | 0.90% | | $1,000 | | $1,021 | | $4.58 |
| * | Expenses are equal to the Fund’s annualized expense ratio multiplied by the average account value over the period, multiplied by the number of days in the most recent fiscal half-year (184), then divided by 365. |
3
|
AMG Frontier Small Cap Growth Fund Portfolio Manager’s Comments (unaudited) |
| | | | | | | | |
THE YEAR IN REVIEW Despite investor fretting over severe supply chain disruptions, labor shortages, the COVID Delta variant, inflation, and rising long-term interest rates, domestic equites delivered substantial positive returns during the fiscal year. For the fiscal year ending October 31, 2021, small caps outperformed large caps as the Russell 2000® Index was up 50.8%, versus the 43.5% advance of the Russell 1000® Index. Growth lagged within the small cap segment as the Russell 2000® Value Index rose 64.30% compared to the 38.45% return for the Russell 2000® Growth Index. AMG Frontier Small Cap Growth Fund (the “Fund”) Class N shares returned 52.92% over this time, materially exceeding the Fund’s benchmark Russell 2000® Growth Index. The majority of our outperformance was driven by positive stock selection. The Fund also experienced positive allocation effect. Technology, the largest contributor to overall return, outperformed with a return of 111% versus 56% for the Russell 2000® Growth Index. Semiconductors were our strongest group within all industries. Top contributing stocks within semiconductors were SiTime Corp., up 217%, MACOM Technology Solutions Holdings, Inc., up 91%, and Ambarella, Inc., up 92%. SiTime was the second-largest single contributor in the Fund, advancing on an exceptionally strong earnings report in the second calendar quarter. During that period, their revenues outperformed consensus expectations by 10% and their gross margins increased 720 basis points sequentially from the prior quarter. We believe these increases are sustainable and that the company will continue to demonstrate strong revenue growth and margin upside. SiTime sells high-end oscillators used for clock management in electronics. Their differentiation is that their resonators, which are components in the oscillator, are based on micro-electromechanical systems (MEMS), rather than the vast majority of the market, which is based on quartz crystals. Their MEMS devices are 20x smaller than quartz offerings, which reduces vulnerability to vibration, impact shock, and temperature changes, while allowing for better operating performance. The Fund also experienced strong contribution from digital service company Upwork, Inc., up 155%. Upwork operates a leading platform that allows businesses to hire independent contractors quickly and efficiently. Pre-pandemic their growth had slowed, and as a result a new and impressive management team we had a lot of confidence in assumed leadership. When the pandemic occurred, we believed that Upwork’s | | | | business would benefit significantly as more companies became acclimated to hiring remote workers. Investors were initially skeptical, but the company has reported growth well above management’s targets, resulting in outperformance of the stock. We have reduced the position size into this strength. The Fund also had a strong positive contribution within the industrials, our largest relative industry overweight versus the Russell 2000® Growth Index. The largest industrial contributor, distributor WESCO International, Inc., rose 214%, appreciating on strong earnings reports. WESCO’s upside was driven by both better-than-expected sales and cost control. Additionally, the company increased the synergy target associated with its recent merger with Anixter International by 25% to $250 million. As progress toward a COVID vaccine accelerated in late 2020, investors became more confident that WESCO could return to normalized earnings over the next couple of years, justifying a meaningfully higher stock price. Industry outperformance was also led by our investments in engineering and contracting services companies MasTec, Inc. and Quanta Services, Inc., up 80% and 95%, respectively. MasTec beat consensus estimates and issued a better-than-expected 2021 outlook. Further, the company reiterated its medium-term vision of generating $10 billion in sales by 2023 with double-digit profit margins, one to two years ahead of the prior expectations. The company benefits from increased spending in telecom, renewable energy projects and electrical transmission, all markets with long growth runways that also benefit from the recently passed infrastructure bill. Similarly, Quanta delivered another strong quarter and also issued a better-than-expected fiscal year 2021 outlook. The company is well positioned to thrive from the multi-decade increase in transmission and distribution spending and will similarly be a major beneficiary of the infrastructure bill. On the downside, health care, the largest industry weight in the Fund but also our largest relative underweight, experienced negative stock selection and our 11% return trailed the index, up 14%. The largest detractor during the period was SmileDirectClub, Inc., down (54)%. Shares of SmileDirectClub significantly underperformed, following a ransomware attack on the company’s network which set back their product manufacturing of clear teeth aligners, causing a reduction in financial guidance and disappointing customers. We are now closely monitoring for any changes in customer sentiment and whether SmileDirectClub can regain customer confidence, which we believe | | | | they can. We reduced our weighting but maintain a position. We would also note than on a trailing three-and five-year basis that health care has been our strongest contributor to our outperformance. While we maintained a higher than typical balance of cyclical growth exposure in the Fund for the first half of calendar year 2021, we recently began moving the Fund toward more secular growth companies to reflect our belief in upcoming earnings challenges for cyclical companies due to supply chain disruptions and inflation pressures. Ironically, end demand is holding up quite well for these companies so we expect this to be an approximately two- to three-quarter challenge and will continue to closely monitor these cyclical stocks as valuations have dropped materially over the past few months. Longer term, we remain optimistic that the next decade will be quite favorable to the biotechnology and pharmaceutical industries given the vast amounts of capital that has been deployed in biological research and development and the tools to support breakthrough therapies. Given the foundation of research conducted by our team in biotech/pharma and the considerable investment success we have delivered over the past eight years, we believe that we have a sustainable competitive advantage in this burgeoning area. The backdrop for further domestic equity outperformance continues to be promising. Interest rates remain at historically low levels and the U.S. Federal Reserve continues to focus on employment, while dismissing current elevated inflation levels as something likely transitory. The recently passed federal infrastructure bill will provide further support to the economy in 2022 and beyond. Supply chain issues, impacting production and driving much of the inflation we are witnessing, are likely to abate in 2022. The subsequent increase in production should address unmet demand for goods and services and thus support earnings growth in 2022. The vaccines and newly approved anti-viral therapeutics to treat COVID are enabling the economy to reopen. We continue to maintain flexibility in our barbell approach to growth investing, focused on individual company analysis and maintaining a growth-at-a-reasonable-price portfolio. The views expressed represent the opinions of Frontier Capital Management Co. LLC as of October 31, 2021, and are not intended as a forecast or guarantee of future results, and are subject to change without notice. |
4
|
AMG Frontier Small Cap Growth Fund Portfolio Manager’s Comments (continued) |
CUMULATIVE TOTAL RETURN PERFORMANCE
AMG Frontier Small Cap Growth Fund’s cumulative total return is based on the daily change in net asset value (NAV), and assumes that all dividends and distributions were reinvested. This graph compares a hypothetical $10,000 investment made in the AMG Frontier Small Cap Growth Fund’s Class N shares on October 31, 2011, to a $10,000 investment made in the Russell 2000® Growth Index for the same time period. The graph and table do not reflect the deduction of taxes that a shareholder would pay on a Fund distribution or redemption of shares. The listed returns for the Fund are net of expenses and the returns for the index exclude expenses. Total returns would have been lower had certain expenses not been reduced.
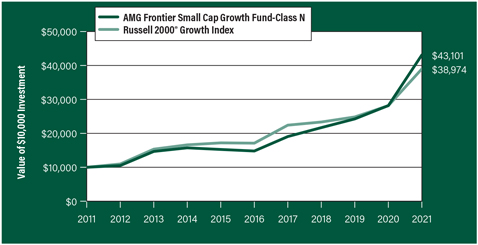
The table below shows the average annual total returns for the AMG Frontier Small Cap Growth Fund and the Russell 2000® Growth Index for the same time periods ended October 31, 2021.
| | | | | | | | | | | | |
| Average Annual Total Returns1 | | One Year | | | Five
Years | | | Ten Years | |
AMG Frontier Small Cap Growth Fund2, 3, 4, 5, 6, 7 | |
| | | |
Class N | | | 52.92 | % | | | 23.85 | % | | | 15.73 | % |
| | | |
Class I | | | 53.49 | % | | | 24.24 | % | | | 16.06 | % |
| | | |
Class Z | | | 53.62 | % | | | 24.36 | % | | | 16.26 | % |
| | | |
Russell 2000® Growth Index8 | | | 38.45 | % | | | 17.90 | % | | | 14.57 | % |
The performance data shown represents past performance. Past performance is not a guarantee of future results. Current performance may be lower or higher than the performance data quoted. The investment return and principal value of an investment will fluctuate so that an investor’s shares, when redeemed, may be worth more or less than their original cost.
Investors should carefully consider the Fund’s investment objectives, risks, charges and expenses before investing. For performance information through the most recent month end, current net asset values per share for the Fund and other information, please call 800.548.4539 or visit our website at amgfunds.com for a free prospectus. Read it carefully before investing or sending money.
Distributed by AMG Distributors, Inc., member FINRA/SIPC.
| 1 | Total return equals income yield plus share price change and assumes reinvestment of all dividends and capital gain distributions. Returns are net of fees and may reflect offsets of Fund expenses as described in the prospectus. No adjustment has been made for taxes payable by shareholders on their reinvested dividends and capital gain distributions. Returns for periods greater than one year are annualized. The listed returns on the Fund are net of expenses and based on the published NAV as of October 31, 2021. All returns are in U.S. dollars ($). |
| | |
| | | 2 From time to time, the Fund’s advisor has waived its fees and/or absorbed Fund expenses, which has resulted in higher returns. |
| | |
| | | 3 The Fund is subject to risks associated with investments in small-capitalization companies, such as erratic earnings patterns, competitive conditions, limited earnings history and a reliance on one or a limited number of products. |
| | |
| | | 4 Active and frequent trading of a fund may result in higher transaction costs and increased tax liability. |
| | |
| | | 5 The Fund invests in growth stocks, which may be more sensitive to market movements because their prices tend to reflect future investor expectations rather than just current profits. Growth stocks may underperform value stocks during given periods. |
| | |
| | | 6 Companies that are in similar businesses may be similarly affected by particular economic or market events; to the extent the Fund has substantial holdings within a particular sector, the risks associated with that sector increase. |
| | |
| | | 7 Market prices of investments held by the Fund may fall rapidly or unpredictably due to a variety of economic or political factors, market conditions, disasters or public health issues, or in response to events that affect particular industries or companies. |
| | |
| | | 8 The Russell 2000® Growth Index measures the performance of the Russell 2000® companies with higher price-to-book ratios and higher forecasted growth values. Unlike the Fund, the Russell 2000® Growth Index is unmanaged, is not available for investment and does not incur expenses. |
| | |
| | | The Russell 2000® Growth Index is a trademark of the London Stock Exchange Group companies. |
| | |
| | | Not FDIC insured, nor bank guaranteed. May lose value. |
| | | |
5
|
AMG Frontier Small Cap Growth Fund Fund Snapshots (unaudited) October 31, 2021 |
| | |
PORTFOLIO BREAKDOWN |
| Sector | | % of
Net Assets |
| | |
Information Technology | | 31.1 |
| | |
Health Care | | 25.7 |
| | |
Industrials | | 15.3 |
| | |
Consumer Discretionary | | 10.2 |
| | |
Financials | | 9.0 |
| | |
Materials | | 4.7 |
| | |
Real Estate | | 1.8 |
| | |
Communication Services | | 1.4 |
| | |
Energy | | 0.3 |
| | |
Short-Term Investments | | 4.8 |
| | |
Other Assets Less Liabilities | | (4.3) |
| | |
TOP TEN HOLDINGS |
Security Name | | % of
Net Assets |
| | |
Inspire Medical Systems, Inc. | | 4.3 |
| | |
SiTime Corp. | | 4.1 |
| | |
MACOM Technology Solutions Holdings, Inc. | | 4.0 |
| | |
MaxLinear, Inc. | | 3.6 |
| | |
Genpact, Ltd. | | 3.4 |
| | |
Quanterix Corp. | | 2.8 |
| | |
Mattel, Inc. | | 2.8 |
| | |
Horizon Therapeutics PLC | | 2.6 |
| | |
Caesars Entertainment, Inc. | | 2.6 |
| | |
LPL Financial Holdings, Inc. | | 2.5 |
| | |
| | |
Top Ten as a Group | | 32.7 |
| | |
Because a fund’s strategy may result in multiple investments in particular sectors of the economy, its performance may depend on the performance of those sectors and may fluctuate more widely than investments diversified across more sectors. For additional information on these and other risk considerations, please see the Fund’s prospectus.
Any sectors, industries, or securities discussed should not be perceived as investment recommendations. Mention of a specific security should not be considered a recommendation to buy or solicitation to sell that security. Specific securities mentioned in this report may have been sold from the Fund’s portfolio of investments by the time you receive this report.
6
|
AMG Frontier Small Cap Growth Fund Schedule of Portfolio Investments October 31, 2021 |
| | | | | | | | |
| | | Shares | | | Value | |
| | |
Common Stocks - 99.5% | | | | | | | | |
| |
Communication Services - 1.4% | | | | | |
| | |
Cardlytics, Inc.*,1 | | | 943 | | | | $74,176 | |
| | |
Radius Global Infrastructure, Inc., Class A*,1 | | | 17,987 | | | | 311,715 | |
| | |
Total Communication Services | | | | | | | 385,891 | |
| |
Consumer Discretionary - 10.2% | | | | | |
| | |
Adtalem Global Education, Inc.* | | | 5,873 | | | | 216,890 | |
| | |
Bed Bath & Beyond, Inc.*,1 | | | 370 | | | | 5,195 | |
| | |
BorgWarner, Inc. | | | 1,600 | | | | 72,112 | |
| | |
Caesars Entertainment, Inc.* | | | 6,397 | | | | 700,216 | |
| | |
Five Below, Inc.* | | | 26 | | | | 5,130 | |
| | |
Floor & Decor Holdings, Inc., Class A* | | | 2,139 | | | | 290,733 | |
| | |
Leslie’s, Inc.* | | | 15,309 | | | | 316,590 | |
| | |
Lithia Motors, Inc., Class A | | | 630 | | | | 201,108 | |
| | |
Mattel, Inc.* | | | 34,455 | | | | 751,463 | |
| | |
Porch Group, Inc.*,1 | | | 1,494 | | | | 31,419 | |
| | |
The Cheesecake Factory, Inc.* | | | 2,506 | | | | 101,844 | |
| | |
Under Armour, Inc., Class C* | | | 294 | | | | 5,551 | |
| | |
Xponential Fitness, Inc., Class A* | | | 1,227 | | | | 20,736 | |
| | |
Total Consumer Discretionary | | | | | | | 2,718,987 | |
| | |
Energy - 0.3% | | | | | | | | |
| | |
Euronav, N.V. (Belgium) | | | 4,392 | | | | 46,335 | |
| | |
International Seaways, Inc.1 | | | 1,994 | | | | 34,995 | |
| | |
Total Energy | | | | | | | 81,330 | |
| | |
Financials - 9.0% | | | | | | | | |
| | |
Argo Group International Holdings, Ltd. (Bermuda) | | | 5,313 | | | | 292,746 | |
| | |
BankUnited, Inc. | | | 5,982 | | | | 242,630 | |
| | |
LPL Financial Holdings, Inc. | | | 3,976 | | | | 652,144 | |
| | |
NMI Holdings, Inc., Class A* | | | 13,450 | | | | 326,566 | |
| | |
Pinnacle Financial Partners, Inc. | | | 2,902 | | | | 280,246 | |
| | |
Webster Financial Corp. | | | 5,230 | | | | 292,671 | |
| | |
Wintrust Financial Corp. | | | 3,476 | | | | 307,626 | |
| | |
Total Financials | | | | | | | 2,394,629 | |
| | |
Health Care - 25.7% | | | | | | | | |
| | |
ABIOMED, Inc.* | | | 7 | | | | 2,324 | |
| | |
ACADIA Pharmaceuticals, Inc.* | | | 2,468 | | | | 44,301 | |
| | |
Acceleron Pharma, Inc.* | | | 1,974 | | | | 343,831 | |
| | |
Adaptive Biotechnologies Corp.* | | | 1,015 | | | | 33,911 | |
| | |
Alnylam Pharmaceuticals, Inc.* | | | 13 | | | | 2,074 | |
| | |
Apellis Pharmaceuticals, Inc.* | | | 4,268 | | | | 131,198 | |
| | |
Arvinas, Inc.* | | | 2,035 | | | | 176,190 | |
| | |
Axonics, Inc.*,1 | | | 8,816 | | | | 646,654 | |
| | |
| | | | | | | | |
| | | | | | | | |
| | | Shares | | | Value | |
| | |
BioMarin Pharmaceutical, Inc.* | | | 35 | | | | $2,773 | |
| | |
Covetrus, Inc.* | | | 13,424 | | | | 271,031 | |
| | |
Cytokinetics Inc.* | | | 13,248 | | | | 462,488 | |
| | |
Exact Sciences Corp.*,1 | | | 49 | | | | 4,666 | |
| | |
Guardant Health, Inc.* | | | 21 | | | | 2,453 | |
| | |
Horizon Therapeutics PLC* | | | 5,871 | | | | 703,992 | |
| | |
Inari Medical, Inc.* | | | 1,557 | | | | 140,940 | |
| | |
Inovalon Holdings, Inc., Class A* | | | 3,636 | | | | 148,312 | |
| | |
Inspire Medical Systems, Inc.* | | | 4,227 | | | | 1,139,515 | |
| | |
Insulet Corp.* | | | 1,560 | | | | 483,631 | |
| | |
Iovance Biotherapeutics, Inc.*,1 | | | 5,840 | | | | 141,970 | |
| | |
Karyopharm Therapeutics, Inc.*,1 | | | 5,139 | | | | 28,059 | |
| | |
NanoString Technologies, Inc.* | | | 185 | | | | 8,935 | |
| | |
Natera, Inc.* | | | 3,796 | | | | 434,908 | |
| | |
Nektar Therapeutics* | | | 1,456 | | | | 22,073 | |
| | |
Novocure, Ltd. (Jersey)*,1 | | | 102 | | | | 10,462 | |
| | |
Pacira BioSciences, Inc.*,1 | | | 1,296 | | | | 67,755 | |
| | |
Quanterix Corp.* | | | 14,890 | | | | 753,583 | |
| | |
Sarepta Therapeutics, Inc.* | | | 1,832 | | | | 144,966 | |
| | |
SmileDirectClub, Inc.*,1 | | | 34,621 | | | | 178,298 | |
| | |
Supernus Pharmaceuticals, Inc.* | | | 4,088 | | | | 122,027 | |
| | |
Turning Point Therapeutics, Inc.* | | | 2,717 | | | | 112,973 | |
| | |
United Therapeutics Corp.* | | | 270 | | | | 51,505 | |
| | |
Vericel Corp.*,1 | | | 1,119 | | | | 51,496 | |
| | |
Total Health Care | | | | | | | 6,869,294 | |
| | |
Industrials - 15.3% | | | | | | | | |
| | |
American Woodmark Corp.* | | | 564 | | | | 38,769 | |
| | |
Array Technologies, Inc.*,1 | | | 25,466 | | | | 543,699 | |
| | |
Azul, S.A., ADR (Brazil)* | | | 4,172 | | | | 55,196 | |
| | |
Builders FirstSource, Inc.* | | | 9,071 | | | | 528,567 | |
| | |
CIRCOR International, Inc.* | | | 2,304 | | | | 65,756 | |
| | |
Controladora Vuela Cia de Aviacion, S.A.B de CV, ADR (Mexico)* | | | 4,365 | | | | 79,006 | |
| | |
EnerSys | | | 67 | | | | 5,363 | |
| | |
Interface, Inc. | | | 7,266 | | | | 104,340 | |
| | |
KBR, Inc. | | | 13,784 | | | | 584,993 | |
| | |
Knight-Swift Transportation Holdings, Inc. | | | 6,951 | | | | 394,052 | |
| | |
MasTec, Inc.* | | | 1,522 | | | | 135,656 | |
| | |
Quanta Services, Inc. | | | 4,061 | | | | 492,518 | |
| | |
Triumph Group, Inc.* | | | 8,814 | | | | 180,246 | |
| | |
Tutor Perini Corp.* | | | 4,775 | | | | 65,036 | |
| | |
Upwork, Inc.* | | | 8,255 | | | | 388,976 | |
| | |
View, Inc.*,1 | | | 14,750 | | | | 78,765 | |
| | |
| | | | | | | | |
The accompanying notes are an integral part of these financial statements.
7
|
AMG Frontier Small Cap Growth Fund Schedule of Portfolio Investments (continued) |
| | | | | | | | |
| | | Shares | | | Value | |
| | |
Industrials - 15.3% (continued) | | | | | | | | |
| | |
Welbilt, Inc.* | | | 7,140 | | | | $168,932 | |
| | |
WESCO International, Inc.* | | | 910 | | | | 117,900 | |
| | |
Willdan Group, Inc.* | | | 2,000 | | | | 66,860 | |
| | |
Total Industrials | | | | | | | 4,094,630 | |
| | |
Information Technology - 31.1% | | | | | | | | |
| | |
Alteryx, Inc., Class A*,1 | | | 186 | | | | 13,613 | |
| | |
Anaplan, Inc.* | | | 795 | | | | 51,842 | |
| | |
BigCommerce Holdings, Inc.,
Series 1*,1 | | | 7,664 | | | | 354,153 | |
| | |
Blackline, Inc.*,1 | | | 1,511 | | | | 191,701 | |
| | |
C3.ai, Inc., Class A*,1 | | | 4,142 | | | | 186,887 | |
| | |
Couchbase, Inc.*,1 | | | 9,955 | | | | 401,386 | |
| | |
Coupa Software, Inc.*,1 | | | 267 | | | | 60,796 | |
| | |
Dlocal, Ltd., Class A (Uruguay)*,1 | | | 3,599 | | | | 174,587 | |
| | |
Genpact, Ltd. | | | 18,373 | | | | 906,708 | |
| | |
HubSpot, Inc.*,1 | | | 4 | | | | 3,241 | |
| | |
II-VI, Inc.*,1 | | | 8,443 | | | | 510,886 | |
| | |
LiveRamp Holdings, Inc.* | | | 4,177 | | | | 223,511 | |
| | |
MACOM Technology Solutions Holdings, Inc.* | | | 15,112 | | | | 1,055,120 | |
| | |
MaxLinear, Inc.* | | | 15,242 | | | | 960,246 | |
| | |
Mimecast, Ltd.* | | | 6,695 | | | | 505,071 | |
| | |
MKS Instruments, Inc. | | | 86 | | | | 12,904 | |
| | |
Model N, Inc.*,1 | | | 202 | | | | 6,547 | |
| | |
MongoDB, Inc.* | | | 10 | | | | 5,213 | |
| | |
Monolithic Power Systems, Inc. | | | 27 | | | | 14,187 | |
| | |
NCR Corp.* | | | 3,421 | | | | 135,266 | |
| | |
Ouster, Inc.*,1 | | | 4,885 | | | | 30,092 | |
| | |
Paya Holdings, Inc., Class A* | | | 21,357 | | | | 194,562 | |
| | |
Paylocity Holding Corp.* | | | 20 | | | | 6,103 | |
| | |
Perficient, Inc.*,1 | | | 83 | | | | 10,259 | |
| | |
Rapid7, Inc.*,1 | | | 1,256 | | | | 161,710 | |
| | |
SiTime Corp.* | | | 4,177 | | | | 1,106,445 | |
| | |
Switch, Inc., Class A | | | 8,907 | | | | 225,169 | |
| | |
Teradyne, Inc. | | | 39 | | | | 5,391 | |
| | |
WalkMe, Ltd. (Israel)* | | | 10,103 | | | | 256,212 | |
| | |
Wolfspeed, Inc.*,1 | | | 44 | | | | 5,285 | |
| | |
Zendesk, Inc.* | | | 207 | | | | 21,073 | |
| | |
Zscaler, Inc.* | | | 19 | | | | 6,058 | |
| | |
Zuora, Inc., Class A* | | | 23,052 | | | | 503,917 | |
| | |
Total Information Technology | | | | | | | 8,306,141 | |
| | |
| | | | | | | | |
| | | | | | | | |
| | | Shares | | | Value | |
| | |
Materials - 4.7% | | | | | | | | |
| | |
Allegheny Technologies, Inc.* | | | 10,368 | | | | $166,925 | |
| | |
Carpenter Technology Corp. | | | 4,893 | | | | 151,096 | |
| | |
Eagle Materials, Inc. | | | 2,157 | | | | 320,012 | |
| | |
FMC Corp. | | | 79 | | | | 7,190 | |
| | |
Livent Corp.*,1 | | | 10,244 | | | | 289,086 | |
| | |
Summit Materials, Inc., Class A* | | | 9,429 | | | | 336,144 | |
| | |
Total Materials | | | | | | | 1,270,453 | |
| | |
Real Estate - 1.8% | | | | | | | | |
| | |
Brixmor Property Group, Inc., REIT | | | 2,202 | | | | 51,615 | |
| | |
SITE Centers Corp., REIT | | | 9,789 | | | | 155,547 | |
| | |
Spirit Realty Capital, Inc., REIT | | | 4,063 | | | | 198,802 | |
| | |
STAG Industrial, Inc., REIT | | | 1,890 | | | | 82,272 | |
| | |
Total Real Estate | | | | | | | 488,236 | |
| | |
Total Common Stocks | | | | | | | | |
(Cost $22,275,995) | | | | | | | 26,609,591 | |
| | |
| | | Principal
Amount | | | | |
Short-Term Investments - 4.8% | | | | | |
| |
Joint Repurchase Agreements - 3.0%2 | | | | | |
| | |
RBC Dominion Securities, Inc., dated 10/29/21, due 11/01/21, 0.050% total to be received $791,746 (collateralized by various U.S. Government Agency Obligations and U.S. Treasuries, 0.000% - 6.000%, 11/01/21 -07/20/51, totaling $807,578) | | | $791,743 | | | | 791,743 | |
| | |
| | | Shares | | | | |
| |
Other Investment Companies - 1.8% | | | | | |
| | |
Dreyfus Government Cash Management Fund, Institutional Shares, 0.03%3 | | | 162,106 | | | | 162,106 | |
| | |
Dreyfus Institutional Preferred Government Money Market Fund, Institutional Shares, 0.01%3 | | | 162,105 | | | | 162,105 | |
| | |
JPMorgan U.S. Government Money Market Fund, IM Shares, 0.03%3 | | | 167,018 | | | | 167,018 | |
| |
Total Other Investment Companies | | | | 491,229 | |
| | |
Total Short-Term Investments | | | | | | | | |
(Cost $1,282,972) | | | | | | | 1,282,972 | |
| | |
Total Investments - 104.3%
(Cost $23,558,967) | | | | | | | 27,892,563 | |
Other Assets, less Liabilities - (4.3)% | | | | (1,156,487 | ) |
| | |
Net Assets - 100.0% | | | | | | | $26,736,076 | |
| | |
| | | | | | | | |
The accompanying notes are an integral part of these financial statements.
8
|
AMG Frontier Small Cap Growth Fund Schedule of Portfolio Investments (continued) |
| * | Non-income producing security. |
| 1 | Some of these securities, amounting to $2,924,130 or 10.9% of net assets, were out on loan to various borrowers and are collateralized by cash and various U.S. Treasury Obligations. See Note 4 of Notes to Financial Statements. |
| 2 | Cash collateral received for securities lending activity was invested in these joint repurchase agreements. |
| 3 | Yield shown represents the October 31, 2021, seven day average yield, which refers to the sum of the previous seven days’ dividends paid, expressed as an annual percentage. |
| ADR | American Depositary Receipt |
| REIT | Real Estate Investment Trust |
The following table summarizes the inputs used to value the Fund’s investments by the fair value hierarchy levels as of October 31, 2021:
| | | | | | | | | | | | | | | | |
| | | Level 1 | | | Level 2 | | | Level 3 | | | Total | |
Investments in Securities | | | | | | | | | | | | | | | | |
| | | | |
Common Stocks† | | $ | 26,609,591 | | | | — | | | | — | | | | $26,609,591 | |
| | | | |
Short-Term Investments | | | | | | | | | | | | | | | | |
| | | | |
Joint Repurchase Agreements | | | — | | | | $791,743 | | | | — | | | | 791,743 | |
| | | | |
Other Investment Companies | | | 491,229 | | | | — | | | | — | | | | 491,229 | |
| | | | | | | | | | | | | | | | |
| | | | |
Total Investments in Securities | | $ | 27,100,820 | | | | $791,743 | | | | — | | | | $27,892,563 | |
| | | | | | | | | | | | | | | | |
| | † | All common stocks held in the Fund are Level 1 securities. For a detailed breakout of common stocks by major industry classification, please refer to the Fund’s Schedule of Portfolio Investments. |
For the fiscal year ended October 31, 2021, there were no transfers in or out of Level 3.
The accompanying notes are an integral part of these financial statements.
9
|
Statement of Assets and Liabilities October 31, 2021 |
| | | | | | | | | | |
| | | AMG Frontier
Small Cap
Growth Fund | | |
Assets: | | | | | | | |
|
|
|
Investments at value1 (including securities on loan
valued at $2,924,130) | | | | $27,892,563 | | | | | | |
Cash | | | | 74,456 | | | | | | |
Receivable for investments sold | | | | 513,510 | | | | | | |
Dividend and interest receivables | | | | 1,371 | | | | | | |
Securities lending income receivable | | | | 1,943 | | | | | | |
Receivable for Fund shares sold | | | | 100 | | | | | | |
Receivable from affiliate | | | | 9,137 | | | | | | |
Prepaid expenses and other assets | | | | 6,939 | | | | | | |
Total assets | | | | 28,500,019 | | | | | | |
Liabilities: | | | | | | | | | | |
Payable upon return of securities loaned | | | | 791,743 | | | | | | |
Payable for investments purchased | | | | 883,083 | | | | | | |
Payable for Fund shares repurchased | | | | 1,199 | | | | | | |
Accrued expenses: | | | | | | | | | | |
Investment advisory and management fees | | | | 15,266 | | | | | | |
Administrative fees | | | | 3,271 | | | | | | |
Distribution fees | | | | 165 | | | | | | |
Shareholder service fees | | | | 477 | | | | | | |
Other | | | | 68,739 | | | | | | |
Total liabilities | | | | 1,763,943 | | | | | | |
| | |
| | | | | | | | | | |
| | |
Net Assets | | | | $26,736,076 | | | | | | |
| | |
1 Investments at cost | | | | $23,558,967 | | | | | | |
The accompanying notes are an integral part of these financial statements.
10
|
Statement of Assets and Liabilities (continued) |
| | | | | | | | |
| | | AMG Frontier
Small Cap
Growth Fund | | | | |
| | |
Net Assets Represent: | | | | | | | | |
Paid-in capital | | | $14,827,778 | | | | | |
Total distributable earnings | | | 11,908,298 | | | | | |
Net Assets | | | $26,736,076 | | | | | |
| | |
Class N: | | | | | | | | |
Net Assets | | | $834,422 | | | | | |
Shares outstanding | | | 66,218 | | | | | |
Net asset value, offering and redemption price per share | | | $12.60 | | | | | |
Class I: | | | | | | | | |
Net Assets | | | $17,229,844 | | | | | |
Shares outstanding | | | 1,285,380 | | | | | |
Net asset value, offering and redemption price per share | | | $13.40 | | | | | |
Class Z: | | | | | | | | |
Net Assets | | | $8,671,810 | | | | | |
Shares outstanding | | | 619,121 | | | | | |
Net asset value, offering and redemption price per share | | | $14.01 | | | | | |
The accompanying notes are an integral part of these financial statements.
11
|
Statement of Operations For the fiscal year ended October 31, 2021 |
| | | | | | | | |
| | | AMG Frontier
Small Cap
Growth Fund | | | | |
Investment Income: | | | | | | | | |
Dividend income | | | $71,158 | | | | | |
Securities lending income | | | 10,701 | | | | | |
Foreign withholding tax | | | (258 | ) | | | | |
Total investment income | | | 81,601 | | | | | |
Expenses: | | | | | | | | |
Investment advisory and management fees | | | 176,869 | | | | | |
Administrative fees | | | 37,901 | | | | | |
Distribution fees - Class N | | | 1,819 | | | | | |
Shareholder servicing fees - Class N | | | 1,091 | | | | | |
Shareholder servicing fees - Class I | | | 6,814 | | | | | |
Custodian fees | | | 52,366 | | | | | |
Professional fees | | | 31,391 | | | | | |
Reports to shareholders | | | 11,587 | | | | | |
Registration fees | | | 10,977 | | | | | |
Transfer agent fees | | | 7,372 | | | | | |
Trustee fees and expenses | | | 1,825 | | | | | |
Miscellaneous | | | 2,986 | | | | | |
Total expenses before offsets | | | 342,998 | | | | | |
Expense reimbursements | | | (105,557 | ) | | | | |
Net expenses | | | 237,441 | | | | | |
| | |
| | | | | | | | |
Net investment loss | | | (155,840 | ) | | | | |
Net Realized and Unrealized Gain: | | | | | | | | |
Net realized gain on investments | | | 9,236,403 | | | | | |
Net change in unrealized appreciation/depreciation on investments | | | 906,558 | | | | | |
Net realized and unrealized gain | | | 10,142,961 | | | | | |
| | |
| | | | | | | | |
Net increase in net assets resulting from operations | | | $9,987,121 | | | | | |
The accompanying notes are an integral part of these financial statements.
12
|
Statements of Changes in Net Assets For the fiscal years ended October 31, |
| | | | | | | | |
| | | AMG Frontier
Small Cap Growth Fund | |
| | | 2021 | | | 2020 | |
| | |
Increase in Net Assets Resulting From Operations: | | | | | | | | |
Net investment loss | | | $(155,840) | | | | $(67,144 | ) |
Net realized gain on investments | | | 9,236,403 | | | | 1,105,007 | |
Net change in unrealized appreciation/depreciation on investments | | | 906,558 | | | | 1,636,337 | |
| | |
Net increase in net assets resulting from operations | | | 9,987,121 | | | | 2,674,200 | |
| | |
Distributions to Shareholders: | | | | | | | | |
Class N | | | (14,298 | ) | | | (28,430 | ) |
Class I | | | (499,904 | ) | | | (930,660 | ) |
Class Z | | | (307,436 | ) | | | (590,610 | ) |
| | |
Total distributions to shareholders | | | (821,638 | ) | | | (1,549,700 | ) |
Capital Share Transactions:1 | | | | | | | | |
| | |
Net increase (decrease) from capital share transactions | | | (2,131,904 | ) | | | 185,255 | |
| | |
| | | | | | | | |
| | |
Total increase in net assets | | | 7,033,579 | | | | 1,309,755 | |
Net Assets: | | | | | | | | |
Beginning of year | | | 19,702,497 | | | | 18,392,742 | |
End of year | | | $26,736,076 | | | | $19,702,497 | |
| 1 | See Note 1(g) of the Notes to Financial Statements. |
The accompanying notes are an integral part of these financial statements.
13
|
AMG Frontier Small Cap Growth Fund Financial Highlights For a share outstanding throughout each fiscal year |
| | | | | | | | | | | | | | | | | | | | | | | | |
| | | For the fiscal years ended October 31, | | | | |
| | | | | | |
| Class N | | 2021 | | | 2020 | | | 2019 | | | 2018 | | | 2017 | | | | |
Net Asset Value, Beginning of Year | | $ | 8.55 | | | $ | 8.03 | | | $ | 11.69 | | | $ | 13.20 | | | $ | 10.29 | | | | | |
Income (loss) from Investment Operations: | | | | | | | | | | | | | | | | | | | | | | | | |
| | | | | | |
Net investment loss1,2 | | | (0.12 | ) | | | (0.06 | ) | | | (0.06 | ) | | | (0.09 | ) | | | (0.11 | ) | | | | |
| | | | | | |
Net realized and unrealized gain on investments | | | 4.56 | | | | 1.30 | | | | 0.45 | | | | 1.58 | | | | 3.07 | | | | | |
Total income from investment operations | | | 4.44 | | | | 1.24 | | | | 0.39 | | | | 1.49 | | | | 2.96 | | | | | |
Less Distributions to Shareholders from: | | | | | | | | | | | | | | | | | | | | | | | | |
Net realized gain on investments | | | (0.39 | ) | | | (0.72 | ) | | | (4.05 | ) | | | (3.00 | ) | | | (0.05 | ) | | | | |
Net Asset Value, End of Year | | $ | 12.60 | | | $ | 8.55 | | | $ | 8.03 | | | $ | 11.69 | | | $ | 13.20 | | | | | |
Total Return2,3 | | | 52.92 | % | | | 16.22 | % | | | 11.83 | % | | | 13.81 | % | | | 28.82 | % | | | | |
| | | | | | |
Ratio of net expenses to average net assets | | | 1.30 | % | | | 1.30 | % | | | 1.30 | % | | | 1.30 | % | | | 1.43 | % | | | | |
| | | | | | |
Ratio of gross expenses to average net assets4 | | | 1.72 | % | | | 1.90 | % | | | 1.94 | % | | | 1.81 | % | | | 2.01 | % | | | | |
| | | | | | |
Ratio of net investment loss to average net assets2 | | | (0.98 | )% | | | (0.73 | )% | | | (0.79 | )% | | | (0.76 | )% | | | (0.93 | )% | | | | |
| | | | | | |
Portfolio turnover | | | 217 | % | | | 206 | % | | | 226 | % | | | 233 | % | | | 99 | % | | | | |
| | | | | | |
Net assets end of year (000’s) omitted | | $ | 834 | | | $ | 306 | | | $ | 324 | | | $ | 553 | | | $ | 210 | | | | | |
| | | | | | | | | | | | | | | | | | | | | | | | | |
| | | | | | | | | | | | | | | | | | | | | | | | | |
14
|
AMG Frontier Small Cap Growth Fund Financial Highlights For a share outstanding throughout each fiscal year |
| | | | | | | | | | | | | | | | | | | | | | | | |
| | | For the fiscal years ended October 31, | | | | |
| | | | | | |
| Class I | | 2021 | | | 2020 | | | 2019 | | | 2018 | | | 2017 | | | | |
Net Asset Value, Beginning of Year | | | $9.04 | | | | $8.43 | | | | $12.02 | | | | $13.46 | | | | $10.46 | | | | | |
Income (loss) from Investment Operations: | | | | | | | | | | | | | | | | | | | | | | | | |
| | | | | | |
Net investment loss1,2 | | | (0.08 | ) | | | (0.03 | ) | | | (0.04 | ) | | | (0.06 | ) | | | (0.08 | ) | | | | |
| | | | | | |
Net realized and unrealized gain on investments | | | 4.83 | | | | 1.36 | | | | 0.50 | | | | 1.62 | | | | 3.13 | | | | | |
Total income from investment operations | | | 4.75 | | | | 1.33 | | | | 0.46 | | | | 1.56 | | | | 3.05 | | | | | |
Less Distributions to Shareholders from: | | | | | | | | | | | | | | | | | | | | | | | | |
Net realized gain on investments | | | (0.39 | ) | | | (0.72 | ) | | | (4.05 | ) | | | (3.00 | ) | | | (0.05 | ) | | | | |
Net Asset Value, End of Year | | | $13.40 | | | | $9.04 | | | | $8.43 | | | | $12.02 | | | | $13.46 | | | | | |
Total Return2,3 | | | 53.49 | % | | | 16.69 | % | | | 12.08 | % | | | 14.12 | % | | | 29.22 | % | | | | |
| | | | | | |
Ratio of net expenses to average net assets | | | 0.94 | % | | | 0.95 | % | | | 0.96 | % | | | 1.01 | % | | | 1.15 | % | | | | |
| | | | | | |
Ratio of gross expenses to average net assets4 | | | 1.36 | % | | | 1.55 | % | | | 1.60 | % | | | 1.52 | % | | | 1.73 | % | | | | |
| | | | | | |
Ratio of net investment loss to average net assets2 | | | (0.62 | )% | | | (0.38 | )% | | | (0.45 | )% | | | (0.46 | )% | | | (0.65 | )% | | | | |
| | | | | | |
Portfolio turnover | | | 217 | % | | | 206 | % | | | 226 | % | | | 233 | % | | | 99 | % | | | | |
| | | | | | |
Net assets end of year (000’s) omitted | | | $17,230 | | | | $11,547 | | | | $10,873 | | | | $11,549 | | | | $11,009 | | | | | |
| | | | | | | | | | | | | | | | | | | | | | | | | |
| | | | | | | | | | | | | | | | | | | | | | | | | |
15
|
AMG Frontier Small Cap Growth Fund Financial Highlights For a share outstanding throughout each fiscal year |
| | | | | | | | | | | | | | | | | | | | | | | | |
| | | For the fiscal years ended October 31, | | | | |
| | | | | | |
| Class Z | | 2021 | | | 2020 | | | 2019 | | | 2018 | | | 2017 | | | | |
Net Asset Value, Beginning of Year | | | $9.43 | | | | $8.75 | | | | $12.31 | | | | $13.70 | | | | $10.63 | | | | | |
Income (loss) from Investment Operations: | | | | | | | | | | | | | | | | | | | | | | | | |
| | | | | | |
Net investment loss1,2 | | | (0.07 | ) | | | (0.03 | ) | | | (0.03 | ) | | | (0.05 | ) | | | (0.06 | ) | | | | |
| | | | | | |
Net realized and unrealized gain on investments | | | 5.04 | | | | 1.43 | | | | 0.52 | | | | 1.66 | | | | 3.18 | | | | | |
Total income from investment operations | | | 4.97 | | | | 1.40 | | | | 0.49 | | | | 1.61 | | | | 3.12 | | | | | |
Less Distributions to Shareholders from: | | | | | | | | | | | | | | | | | | | | | | | | |
Net realized gain on investments | | | (0.39 | ) | | | (0.72 | ) | | | (4.05 | ) | | | (3.00 | ) | | | (0.05 | ) | | | | |
Net Asset Value, End of Year | | | $14.01 | | | | $9.43 | | | | $8.75 | | | | $12.31 | | | | $13.70 | | | | | |
Total Return2,3 | | | 53.62 | % | | | 16.74 | % | | | 12.15 | % | | | 14.26 | % | | | 29.42 | % | | | | |
| | | | | | |
Ratio of net expenses to average net assets | | | 0.90 | % | | | 0.90 | % | | | 0.90 | % | | | 0.90 | % | | | 1.00 | % | | | | |
| | | | | | |
Ratio of gross expenses to average net assets4 | | | 1.32 | % | | | 1.50 | % | | | 1.54 | % | | | 1.41 | % | | | 1.58 | % | | | | |
| | | | | | |
Ratio of net investment loss to average net assets2 | | | (0.58 | )% | | | (0.33 | )% | | | (0.39 | )% | | | (0.36 | )% | | | (0.50 | )% | | | | |
| | | | | | |
Portfolio turnover | | | 217 | % | | | 206 | % | | | 226 | % | | | 233 | % | | | 99 | % | | | | |
| | | | | | |
Net assets end of year (000’s) omitted | | | $8,672 | | | | $7,850 | | | | $7,196 | | | | $6,418 | | | | $7,354 | | | | | |
| | | | | | | | | | | | | | | | | | | | | | | | | |
| | | | | | | | | | | | | | | | | | | | | | | | | |
| 1 | Per share numbers have been calculated using average shares. |
| 2 | Total returns and net investment loss would have been lower had certain expenses not been offset. |
| 3 | The total return is calculated using the published Net Asset Value as of fiscal year end. |
| 4 | Excludes the impact of expense reimbursement or fee waivers and expense reductions such as brokerage credits, but includes expense repayments and non-reimbursable expenses, if any, such as interest, taxes, and extraordinary expenses. (See Note 1(c) and 2 in the Notes to Financial Statements.) |
16
|
Notes to Financial Statements October 31, 2021 |
1. ORGANIZATION AND SUMMARY OF SIGNIFICANT ACCOUNTING POLICIES
AMG Funds I (the “Trust”) is an open-end management investment company, organized as a Massachusetts business trust, and registered under the Investment Company Act of 1940, as amended (the “1940 Act”). Currently, the Trust consists of a number of different funds, each having distinct investment management objectives, strategies, risks, and policies. Included in this report is AMG Frontier Small Cap Growth Fund (the “Fund”).
The Fund offers Class N, I and Z shares. Each class represents an interest in the same assets of the Fund. Although all share classes generally have identical voting rights, each share class votes separately when required by law. Different share classes may have different net asset values per share to the extent the share classes pay different distribution amounts and/or the expenses of such share classes differ. Each share class has its own expense structure. Please refer to a current prospectus for additional information on each share class.
Market disruptions associated with the COVID-19 pandemic have had a global impact, and uncertainty exists as to the long-term implications. Such disruptions can adversely affect assets of the Fund and thus Fund performance.
The Fund’s financial statements are prepared in accordance with accounting principles generally accepted in the United States of America (“U.S. GAAP”), including accounting and reporting guidance pursuant to Accounting Standards Codification Topic 946 applicable to investment companies. U.S. GAAP requires management to make estimates and assumptions that affect the reported amounts of assets and liabilities and disclosure of contingent assets and liabilities at the date of the financial statements and the reported amounts of income and expenses during the reporting period. Actual results could differ from those estimates and such differences could be material. The following is a summary of significant accounting policies followed by the Fund in the preparation of its financial statements:
a. VALUATION OF INVESTMENTS
Equity securities traded on a national securities exchange or reported on the NASDAQ national market system (“NMS”) are valued at the last quoted sales price on the primary exchange or, if applicable, the NASDAQ official closing price or the official closing price of the relevant exchange or, lacking any sales, at the last quoted mean between the last quoted bid and ask prices (the “mean price”). Equity securities traded in the over-the-counter market (other than NMS securities) are valued at the mean price. Foreign equity securities (securities principally traded in markets other than U.S. markets) are valued at the official closing price on the primary exchange or, for markets that either do not offer an official closing price or where the official closing price may not be representative of the overall market, the last quoted sale price. Effective October 1, 2021, equity securities lacking any sales and traded in the over-the-counter market (other than NMS securities) are valued at the bid price. There was no impact to the Fund relating to the change in valuation policy.
Fixed income securities purchased with a remaining maturity of 60 days or less are valued at amortized cost, provided that the amortized cost value is approximately the same as the fair value of the security valued without the use of amortized cost. Investments in other open-end registered investment companies are valued at their end of day net asset value per share.
The Fund’s portfolio investments are generally valued based on independent market quotations or prices or, if none, “evaluative” or other market based
valuations provided by third party pricing services approved by the Board of Trustees (the “Board”). Under certain circumstances, the value of certain Fund portfolio investments may be based on an evaluation of fair value, pursuant to procedures established by and under the general supervision of the Board. The Valuation Committee, which is comprised of the Independent Trustees of the Board, and the Pricing Committee, which is comprised of representatives from AMG Funds LLC (the “Investment Manager”) are the committees appointed by the Board to make fair value determinations. The Fund may use the fair value of a portfolio investment to calculate its net asset value (“NAV”) in the event that the market quotation, price or market based valuation for the portfolio investment is not readily available or otherwise not determinable pursuant to the Board’s valuation procedures, if the Investment Manager or the Pricing Committee believes the quotation, price or market based valuation to be unreliable, or in certain other circumstances. When determining the fair value of an investment, the Pricing Committee and, if required under the Trust’s securities valuation procedures, the Valuation Committee, seeks to determine the price that the Fund might reasonably expect to receive from current sale of that portfolio investment in an arms-length transaction. Fair value determinations shall be based upon consideration of all available facts and information, including, but not limited to (i) attributes specific to the investment; (ii) fundamental and analytical data relating to the investment; and (iii) the value of other comparable securities or relevant financial instruments, including derivative securities, traded on other markets or among dealers.
The values assigned to fair value portfolio investments are based on available information and do not necessarily represent amounts that might ultimately be realized in the future, since such amounts depend on future developments inherent in long-term investments. Because of the inherent uncertainty of valuation, those estimated values may differ significantly from the values that would have been used had a ready market for the investments existed, and the differences could be material. The Board will be presented with a quarterly report showing as of the most recent quarter end, all outstanding securities fair valued by the Fund, including a comparison with the prior quarter end and the percentage of the Fund that the security represents at each quarter end.
With respect to foreign equity securities and certain foreign fixed income securities, the Board has adopted a policy that securities held in the Fund that can be fair valued by the applicable fair value pricing service are fair valued on each business day provided that each individual price exceeds a pre-established confidence level.
U.S. GAAP defines fair value as the price that a fund would receive to sell an asset or pay to transfer a liability in an orderly transaction between market participants at the measurement date. U.S. GAAP also establishes a framework for measuring fair value, and a three level hierarchy for fair value measurements based upon the transparency of inputs to the valuation of an asset or liability. Inputs may be observable or unobservable and refer broadly to the assumptions that market participants would use in pricing the asset or liability. Observable inputs reflect the assumptions market participants would use in pricing the asset or liability based on market data obtained from sources independent of the Fund.
Unobservable inputs reflect the Fund’s own assumptions about the assumptions that market participants would use in pricing the asset or liability developed based on the best information available in the circumstances. Each investment is assigned a level based upon the observability of the inputs which are significant to the overall valuation.
The three-tier hierarchy of inputs is summarized below:
17
|
Notes to Financial Statements (continued) |
Level 1 – inputs are quoted prices in active markets for identical investments (e.g., equity securities, open-end investment companies)
Level 2 – other observable inputs (including, but not limited to: quoted prices for similar assets or liabilities in markets that are active, quoted prices for identical or similar assets or liabilities in markets that are not active, inputs other than quoted prices that are observable for the assets or liabilities (such as interest rates, yield curves, volatilities, prepayment speeds, loss severities, credit risks and default rates) or other market corroborated inputs) (e.g., debt securities, government securities, foreign currency exchange contracts, swaps, foreign securities utilizing international fair value pricing, fair valued securities with observable inputs)
Level 3 – inputs are significant unobservable inputs (including the Fund’s own assumptions used to determine the fair value of investments) (e.g., fair valued securities with unobservable inputs)
Changes in inputs or methodologies used for valuing investments may result in a transfer in or out of levels within the fair value hierarchy. The inputs or methodologies used for valuing investments may not necessarily be an indication of the risk associated with investing in those investments.
b. SECURITY TRANSACTIONS
Security transactions are accounted for as of trade date. Realized gains and losses on securities sold are determined on the basis of identified cost.
c. INVESTMENT INCOME AND EXPENSES
Dividend income is recorded on the ex-dividend date. Interest income, which includes amortization of premium and accretion of discount on debt securities, is accrued as earned. Dividend and interest income on foreign securities is recorded gross of any withholding tax. Non-cash dividends included in dividend income, if any, are reported at the fair market value of the securities received. Upon notification from issuers, distributions received from a real estate investment trust (REIT) may be redesignated as a reduction of cost of investments and/or realized gain. Other income and expenses are recorded on an accrual basis. Expenses that cannot be directly attributed to the Fund are apportioned among the funds in the Trust and other trusts or funds within the AMG Funds Family of Funds (collectively the “AMG Funds Family”) based upon their relative average net assets or number of shareholders. Investment income, realized and unrealized capital gains and losses, the common expenses of the Fund, and certain fund level expense reductions, if any, are allocated on a pro-rata basis to each class based on the relative net assets of each class to the total net assets of the Fund.
d. DIVIDENDS AND DISTRIBUTIONS
Fund distributions resulting from either net investment income or realized net capital gains, if any, will normally be declared and paid at least annually in December. Distributions to shareholders are recorded on the ex-dividend date. Distributions are determined in accordance with federal income tax regulations, which may differ from net investment income and net realized capital gains for financial statement purposes (U.S. GAAP). Differences may be permanent or temporary. Permanent differences are reclassified among capital accounts in the financial statements to reflect their tax character. Permanent book and tax basis differences, if any, relating to shareholder distributions will result in reclassifications to paid-in capital. Temporary differences arise when certain items of income, expense and gain or loss are recognized in different periods for
financial statement and tax purposes; these differences will reverse at some time in the future. Permanent differences are due to tax equalization utilized. Temporary differences are primarily due to wash sales loss deferrals.
The tax character of distributions paid during the fiscal years ended October 31, 2021 and October 31, 2020 were as follows:
| | | | | | | | |
Distributions paid from: | | | 2021 | | | | 2020 | |
Ordinary income * | | $ | 32,753 | | | | — | |
Long-term capital gains | | | 788,885 | | | $ | 1,549,700 | |
| | | | | | | | |
| | | $821,638 | | | $1,549,700 | |
| | | | | | | | |
| * | For tax purposes, short-term capital gain distributions, if any, are considered ordinary income distributions. |
As of October 31, 2021, the components of distributable earnings (excluding unrealized appreciation/depreciation) on a tax basis consisted of:
| | | | |
Undistributed ordinary income | | $ | 3,933,920 | |
Undistributed long-term capital gains | | | 4,217,212 | |
At October 31, 2021, the cost of investments and the aggregate gross unrealized appreciation and depreciation for federal income tax purposes were as follows:
| | | | | | | | | | | | |
| Cost | | Appreciation | | | Depreciation | | | Net Appreciation | |
| | | |
$24,135,397 | | $ | 5,093,198 | | | $ | (1,336,032 | ) | | $ | 3,757,166 | |
e. FEDERAL TAXES
The Fund currently qualifies as an investment company and intends to comply with the requirements under Subchapter M of the Internal Revenue Code of 1986, as amended, and to distribute substantially all of its taxable income and gains to its shareholders and to meet certain diversification and income requirements with respect to investment companies. Therefore, no provision for federal income or excise tax is included in the accompanying financial statements.
Additionally, based on the Fund’s understanding of the tax rules and rates related to income, gains and transactions for the foreign jurisdictions in which it invests, the Fund will provide for foreign taxes, and where appropriate, deferred foreign taxes.
Management has analyzed the Fund’s tax positions taken on federal income tax returns as of October 31, 2021, and for all open tax years (generally, the three prior taxable years), and has concluded that no provision for federal income tax is required in the Fund’s financial statements. Additionally, Management is not aware of any tax position for which it is reasonably possible that the total amounts of unrecognized tax benefits will change materially in the next twelve months.
f. CAPITAL LOSS CARRYOVERS AND DEFERRALS
As of October 31, 2021, the Fund had no capital loss carryovers for federal income tax purposes. Should the Fund incur net capital losses for the fiscal year ended October 31, 2022, such amounts may be used to offset future realized capital gains indefinitely, and retain their character as short-term and/or long-term.
18
|
Notes to Financial Statements (continued) |
g. CAPITAL STOCK
The Trust’s Declaration of Trust authorizes for the Fund the issuance of an unlimited number of shares of beneficial interest, without par value. The Fund records sales and repurchases of its capital stock on the trade date.
For the fiscal years ended October 31, 2021 and October 31, 2020, the capital stock transactions by class for the Fund were as follows:
| | | | | | | | | | | | | | | | | | | | | | |
| | | | | |
| | | October 31, 2021 | | October 31, 2020 | | | | | | |
| | | | | | | |
| | | Shares | | Amount | | Shares | | Amount | | | | | | |
| | | | | | | |
Class N: | | | | | | | | | | | | | | | | | | | | | | |
| | | | | | | |
Proceeds from sale of shares | | | 95,143 | | | | $1,142,441 | | | | 21,983 | | | | $171,687 | | | | | | | |
| | | | | | | |
Reinvestment of distributions | | | 1,373 | | | | 14,298 | | | | 3,530 | | | | 27,888 | | | | | | | |
| | | | | | | |
Cost of shares repurchased | | | (66,038 | ) | | | (772,841 | ) | | | (30,085 | ) | | | (207,132 | ) | | | | | | |
| | | | | | | | | | | | | | | | | | | | | | |
| | | | | | | |
Net increase (decrease) | | | 30,478 | | | | $383,898 | | | | (4,572 | ) | | | $(7,557 | ) | | | | | | |
| | | | | | | | | | | | | | | | | | | | | | |
| | | | | | | |
Class I: | | | | | | | | | | | | | | | | | | | | | | |
| | | | | | | |
Proceeds from sale of shares | | | 170,214 | | | | $2,163,054 | | | | 160,240 | | | | $1,351,935 | | | | | | | |
| | | | | | | |
Reinvestment of distributions | | | 44,866 | | | | 495,323 | | | | 110,211 | | | | 918,061 | | | | | | | |
| | | | | | | |
Cost of shares repurchased | | | (206,476 | ) | | | (2,458,029 | ) | | | (284,168 | ) | | | (2,168,212 | ) | | | | | | |
| | | | | | | | | | | | | | | | | | | | | | |
Net increase (decrease) | | | 8,604 | | | | $200,348 | | | | (13,717 | ) | | | $101,784 | | | | | | | |
| | | | | | | | | | | | | | | | | | | | | | |
| | | | | | | |
Class Z: | | | | | | | | | | | | | | | | | | | | | | |
Proceeds from sale of shares | | | 46,016 | | | | $620,199 | | | | 10,516 | | | | $55,000 | | | | | | | |
Reinvestment of distributions | | | 26,664 | | | | 307,436 | | | | 67,965 | | | | 590,610 | | | | | | | |
Cost of shares repurchased | | | (285,775 | ) | | | (3,643,785 | ) | | | (68,314 | ) | | | (554,582 | ) | | | | | | |
| | | | | | | | | | | | | | | | | | | | | | |
Net increase (decrease) | | | (213,095 | ) | | | $(2,716,150 | ) | | | 10,167 | | | | $91,028 | | | | | | | |
| | | | | | | | | | | | | | | | | | | | | | |
h. REPURCHASE AGREEMENTS AND JOINT REPURCHASE AGREEMENTS
The Fund may enter into third-party repurchase agreements for temporary cash management purposes and third-party or bilateral joint repurchase agreements for reinvestment of cash collateral on securities lending transactions under the securities lending program offered by The Bank of New York Mellon (“BNYM”) (the “Program”) (collectively, “Repurchase Agreements”). The value of the underlying collateral, including accrued interest, must equal or exceed the value of the Repurchase Agreements during the term of the agreement. For joint repurchase agreements, the Fund participates on a pro rata basis with other clients of BNYM in its share of the underlying collateral under such joint repurchase agreements and in its share of proceeds from any repurchase or other disposition of the underlying collateral. The underlying collateral for all Repurchase Agreements is held in safekeeping by the Fund’s custodian or at the Federal Reserve Bank. If the seller defaults and the value of the collateral declines, or if bankruptcy proceedings commence with respect to the seller of the security, realization of the collateral by the Fund may be delayed or limited. Pursuant to the Program, the Fund is indemnified for such losses by BNYM on joint repurchase agreements.
At October 31, 2021, the market value of Repurchase Agreements outstanding was $791,743.
2. AGREEMENTS AND TRANSACTIONS WITH AFFILIATES
The Trust has entered into an investment advisory agreement under which the Investment Manager, a subsidiary and the U.S. retail distribution arm of Affiliated Managers Group, Inc. (“AMG”), serves as investment manager to the Fund and is responsible for the Fund’s overall administration and operations. The Investment Manager selects one or more subadvisers for the Fund (subject to Board approval) and monitors each subadviser’s investment performance, security holdings and investment strategies. The Fund’s investment portfolio is managed by Frontier Capital Management Co., LLC (“Frontier”). AMG indirectly owns a majority interest in Frontier.
Investment management fees are paid directly by the Fund to the Investment Manager based on average daily net assets. For the fiscal year ended October 31, 2021, the Fund paid an investment management fee at the annual rate of 0.70% of the average daily net assets of the Fund.
The Investment Manager has contractually agreed, through at least March 1, 2022, to waive management fees and/or pay or reimburse fund expenses in order to limit total annual Fund operating expenses after fee waiver and expense reimbursements (exclusive of taxes, interest (including interest incurred in connection with bank and custody overdrafts and in connection with securities sold short), shareholder servicing fees, distribution and service (12b-1) fees, brokerage commissions and other transaction costs, dividends payable with respect to securities sold short, acquired fund fees and expenses and
19
|
Notes to Financial Statements (continued) |
extraordinary expenses) to the annual rate of 0.90% of the Fund’s average daily net assets (this annual rate or such other annual rate that may be in effect from time to time, the “Expense Cap”), subject to later reimbursement by the Fund in certain circumstances.
In general, for a period of up to 36 months after the date any amounts are paid, waived or reimbursed by the Investment Manager, the Investment Manager may recover such amounts from the Fund, provided that such repayment would not cause the Fund’s total annual operating expenses after fee waiver and expense reimbursements (exclusive of the items noted in the parenthetical above) to exceed either (i) the Expense Cap in effect at the time such amounts were paid, waived or reimbursed, or (ii) the Expense Cap in effect at the time of such repayment by the Fund.
The contractual expense limitation may only be terminated in the event the Investment Manager or a successor ceases to be the investment manager of the Fund or a successor fund, by mutual agreement between the Investment Manager and the Board, or in the event of the Fund’s liquidation unless the Fund is reorganized or is a party to a merger in which the surviving entity is successor to the accounting and performance information of the Fund.
At October 31, 2021, the Fund’s expiration of reimbursements subject to recoupment is as follows:
| | | | |
| |
Expiration Period | | | |
Less than 1 year | | $ | 121,636 | |
1-2 years | | | 110,484 | |
2-3 years | | | 105,557 | |
| | | | |
Total | | $ | 337,677 | |
| | | | |
The Trust, on behalf of the Fund, has entered into an amended and restated Administration Agreement under which the Investment Manager serves as the Fund’s administrator (the “Administrator”) and is responsible for all non-portfolio management aspects of managing the Fund’s operations, including administration and shareholder services to the Fund. The Fund pays a fee to the Administrator at the rate of 0.15% per annum of the Fund’s average daily net assets for this service.
The Fund is distributed by AMG Distributors, Inc. (the “Distributor”), a wholly-owned subsidiary of the Investment Manager. The Distributor serves as the distributor and underwriter for the Fund and is a registered broker-dealer and member of the Financial Industry Regulatory Authority, Inc. (“FINRA”). Shares of the Fund will be continuously offered and will be sold directly to prospective purchasers and through brokers, dealers or other financial intermediaries who have executed selling agreements with the Distributor. Generally the Distributor bears all or a portion of the expenses of providing services pursuant to the distribution agreement, including the payment of the expenses relating to the distribution of prospectuses for sales purposes and any advertising or sales literature.
The Fund has adopted a distribution and service plan (the “Plan”) with respect to the Class N shares, in accordance with the requirements of Rule 12b-1 under the 1940 Act and the requirements of the applicable rules of FINRA regarding asset-based sales charges. Pursuant to the Plan, the Fund may make payments to the Distributor for its expenditures in financing any activity primarily intended to result in the sale of the Fund’s Class N shares and for maintenance and personal service provided to existing shareholders of that class. The Plan authorized
payments to the Distributor up to 0.25% annually of the Fund’s average daily net assets attributable to the Class N shares.
For Class N and Class I, the Board has approved reimbursement payments to the Investment Manager for shareholder servicing expenses (“shareholder servicing fees”) incurred. Shareholder servicing fees include payments to financial intermediaries, such as broker-dealers (including fund supermarket platforms), banks, and trust companies who provide shareholder recordkeeping, account servicing and other services. The Class N and Class I shares may reimburse the Investment Manager for the actual amount incurred up to a maximum annual rate of each Class’s average daily net assets as shown in the table below.
The impact on the annualized expense ratios for the fiscal year ended October 31, 2021, were as follows:
| | | | | | | | | | | | |
| | | |
| | | Maximum Annual Amount Approved | | | | | | Actual Amount Incurred | |
| | | |
Class N | | | 0.15% | | | | | | | | 0.15% | |
Class I | | | 0.15% | | | | | | | | 0.04% | |
The Board provides supervision of the affairs of the Trust and other trusts within the AMG Funds Family. The Trustees of the Trust who are not affiliated with the Investment Manager receive an annual retainer and per meeting fees for regular, special and telephonic meetings, and they are reimbursed for out-of-pocket expenses incurred while carrying out their duties as Board members. The Chairman of the Board and the Audit Committee Chair receive additional annual retainers. Certain Trustees and Officers of the Fund are Officers and/or Directors of the Investment Manager, AMG and/or the Distributor.
The Securities and Exchange Commission (the “SEC”) granted an exemptive order that permits certain eligible funds in the AMG Funds Family to lend and borrow money for certain temporary purposes directly to and from other eligible funds in the AMG Funds Family. Participation in this interfund lending program is voluntary for both the borrowing and lending funds, and an interfund loan is only made if it benefits each participating fund. The Administrator manages the program according to procedures approved by the Board, and the Board monitors the operation of the program. An interfund loan must comply with certain conditions set out in the exemptive order, which are designed to assure fairness and protect all participating funds. The interest earned and interest paid on interfund loans are included on the Statement of Operations as interest income and miscellaneous expense, respectively. At October 31, 2021, the Fund had no interfund loans outstanding.
The Fund utilized the interfund loan program during the fiscal year ended October 31, 2021 as follows:
| | | | | | | | | | | | |
| | | |
Average
Borrowed | | Number
of Days | | | Interest
Paid | | | Average
Interest Rate | |
$1,557,880 | | | 4 | | | | $154 | | | | 0.903% | |
3. PURCHASES AND SALES OF SECURITIES
Purchases and sales of securities (excluding short-term securities and U.S. Government Obligations) for the fiscal year ended October 31, 2021, were $53,340,840 and $56,546,546, respectively.
The Fund had no purchases or sales of U.S. Government Obligations during the fiscal year ended October 31, 2021.
20
|
Notes to Financial Statements (continued) |
4. PORTFOLIO SECURITIES LOANED
The Fund participates in the Program providing for the lending of securities to qualified borrowers. Securities lending income includes earnings of such temporary cash investments, plus or minus any rebate to a borrower. These earnings (after any rebate) are then divided between BNYM, as a fee for its services under the Program, and the Fund, according to agreed-upon rates. Collateral on all securities loaned is accepted in cash, U.S. Treasury Obligations or U.S. Government Agency Obligations. Collateral is maintained at a minimum level of 102% (105% in the case of certain foreign securities) of the market value, plus interest, if applicable, of investments on loan. It is the Fund’s policy to obtain additional collateral from or return excess collateral to the borrower by the end of the next business day, following the valuation date of the securities loaned. Therefore, the value of the collateral held may be temporarily less than the value of the securities on loan. Lending securities entails a risk of loss to the Fund if and to the extent that the market value of the securities loaned were to increase and the borrower did not increase the collateral accordingly, and the borrower fails to return the securities. Under the terms of the Program, the Fund is indemnified for such losses by BNYM. Cash collateral is held in separate omnibus accounts managed by BNYM, who is authorized to exclusively enter into joint repurchase agreements for that cash collateral, and securities collateral is held in separate omnibus accounts managed by BNYM and cannot be sold or pledged. BNYM bears the risk of any deficiency in the amount of the cash collateral available for return to the borrower due to any loss on the collateral invested. Loans of securities are terminable at any time and the borrower, after notice, is required to return borrowed securities as soon as practical, which is normally within three business days.
The value of securities loaned on positions held, cash collateral and securities collateral received at October 31, 2021, were as follows:
| | | | | | | | | | | | | | | | | | |
Securities
Loaned | | Cash
Collateral
Received | | Securities
Collateral
Received | | Total
Collateral
Received |
| $2,924,130 | | $791,743 | | $2,225,548 | | $3,017,291 |
The following table summarizes the securities received as collateral for securities lending at October 31, 2021:
| | | | |
Collateral Type | | Coupon Range | | Maturity Date Range |
U.S. Treasury Obligations | | 0.000%-6.875% | | 11/15/21-02/15/51 |
5. COMMITMENTS AND CONTINGENCIES
Under the Trust’s organizational documents, its trustees and officers are indemnified against certain liabilities arising out of the performance of their duties to the Trust. In addition, in the normal course of business, the Fund may enter into contracts and agreements that contain a variety of representations and warranties, which provide general indemnifications. The maximum exposure to the Fund under these arrangements is unknown, as this would involve future claims that may be made against the Fund that have not yet occurred. However, based on experience, the Fund had no prior claims or losses and expects the risks of loss to be remote.
6. MASTER NETTING AGREEMENTS
The Fund may enter into master netting agreements with its counterparties for the securities lending program and Repurchase Agreements, which provide the right, in the event of default (including bankruptcy or insolvency) for the non-defaulting party to liquidate the collateral and calculate net exposure to the defaulting party or request additional collateral. For financial reporting purposes, the Fund does not offset financial assets and financial liabilities that are subject to master netting agreements in the Statement of Assets and Liabilities. For securities lending transactions, see Note 4.
The following table is a summary of the Fund’s open Repurchase Agreements that are subject to a master netting agreement as of October 31, 2021:
| | | | | | | | | | | | | | | | | | | | | | | | | |
| | | | |
| | | | | Gross Amount Not Offset in the
Statement of Assets and Liabilities | | | | |
| | | | | |
| | | Gross Amounts of
Assets Presented in
the Statement of
Assets and Liabilities | | Offset Amount | | Net Asset Balance | | Collateral
Received | | Net
Amount |
| | | | | |
RBC Dominion Securities, Inc. | | | $ | 791,743 | | | | | — | | | | $ | 791,743 | | | | $ | 791,743 | | | | | — | |
7. SUBSEQUENT EVENTS
| | |
| The Fund has determined that no material events or transactions occurred through the issuance date of the Fund’s financial statements which require an additional disclosure in or adjustment of the Fund’s financial statements. | | |
21
|
Report of Independent Registered Public Accounting Firm |
| | |
TO THE BOARD OF TRUSTEES OF AMG FUNDS I AND SHAREHOLDERS OF AMG FRONTIER SMALL CAP GROWTH FUND: | | |
| |
| Opinion on the Financial Statements | | |
| |
| We have audited the accompanying statement of assets and liabilities, including the schedule of portfolio investments, of AMG Frontier Small Cap Growth Fund (one of the funds constituting AMG Funds I) (the “Fund”) as of October 31, 2021, the related statement of operations for the year ended October 31, 2021, the statements of changes in net assets for each of the two years in the period ended October 31, 2021, including the related notes, and the financial highlights for each of the five years in the period ended October 31, 2021 (collectively referred to as the “financial statements”). In our opinion, the financial statements present fairly, in all material respects, the financial position of the Fund as of October 31, 2021, the results of its operations for the year then ended, the changes in its net assets for each of the two years in the period ended October 31, 2021 and the financial highlights for each of the five years in the period ended October 31, 2021 in conformity with accounting principles generally accepted in the United States of America. | | |
| |
| Basis for Opinion | | |
| |
| These financial statements are the responsibility of the Fund’s management. Our responsibility is to express an opinion on the Fund’s financial statements based on our audit. We are a public accounting firm registered with the Public Company Accounting Oversight Board (United States) (PCAOB) and are required to be independent with respect to the Fund in accordance with the U.S. federal securities laws and the applicable rules and regulations of the Securities and Exchange Commission and the PCAOB. | | |
| |
| We conducted our audit of these financial statements in accordance with the standards of the PCAOB. Those standards require that we plan and perform the audit to obtain reasonable assurance about whether the financial statements are free of material misstatement, whether due to error or fraud. | | |
| |
| Our audit included performing procedures to assess the risks of material misstatement of the financial statements, whether due to error or fraud, and performing procedures that respond to those risks. Such procedures included examining, on a test basis, evidence regarding the amounts and disclosures in the financial statements. Our audit also included evaluating the accounting principles used and significant estimates made by management, as well as evaluating the overall presentation of the financial statements. Our procedures included confirmation of securities owned as of October 31, 2021 by correspondence with the custodian, transfer agent and brokers; when replies were not received from brokers, we performed other auditing procedures. We believe that our audit provides a reasonable basis for our opinion. | | |
| |
| PricewaterhouseCoopers LLP | | |
| Boston, Massachusetts | | |
| December 22, 2021 | | |
|
| We have served as the auditor of one or more investment companies in AMG Funds Family since 1993. |
22
|
Other Information (unaudited) |
TAX INFORMATION
AMG Frontier Small Cap Growth Fund hereby designates the maximum amount allowable of its net taxable income as qualified dividends as provided in the Jobs and Growth Tax Relief Reconciliation Act of 2003. The 2020/2021 Form 1099-DIV you receive for the Fund will show the tax status of all distributions paid to you during the year.
Pursuant to section 852 of the Internal Revenue Code, AMG Frontier Small Cap Growth Fund hereby designates $1,213,889 as a capital gain distribution with respect to the taxable year ended October 31, 2021, or if subsequently determined to be different, the net capital gains of such fiscal year.
23
|
AMG Funds Trustees and Officers |
| | | | | | | | |
| The Trustees and Officers of the Trust, their business addresses, principal occupations for the past five years and ages are listed below. The Trustees provide broad supervision over the affairs of the Trust and the Funds. The Trustees are experienced executives who meet periodically throughout the year to oversee the Funds’ activities, review contractual arrangements with companies that provide services to the Funds, and | | | | review the Funds’ performance. Unless otherwise noted, the address of each Trustee or Officer is the address of the Trust: 680 Washington Blvd., Suite 500, Stamford, CT. 06901. There is no stated term of office for Trustees. Trustees serve until their resignation, retirement or removal in | | | | accordance with the Trust’s organizational documents and policies adopted by the Board from time to time. The Chairman of the Trustees, President, Treasurer and Secretary of the Trust are elected by the Trustees annually. Other officers hold office at the pleasure of the Trustees. |
Independent Trustees
The following Trustees are not “interested persons” of the Trust within the meaning of the 1940 Act:
| | |
Number of Funds Overseen in
Fund Complex | | Name, Age, Principal Occupation(s) During Past 5 Years and Other Directorships Held by Trustee |
| |
• Trustee since 2012 • Oversees 42 Funds in Fund Complex | | Bruce B. Bingham, 72 Partner, Hamilton Partners (real estate development firm) (1987-Current); Director of The Yacktman Funds (2 portfolios) (2000-2012). |
| | |
• Trustee since 2013 | | Kurt A. Keilhacker, 58 |
• Chairman of the Audit Committee since 2021 • Oversees 46 Funds in Fund Complex | | Managing Partner, TechFund Europe (2000-Present); Managing Partner, TechFund Capital (1997-Present); Managing Partner, Elementum Ventures (2013-Present); Director, MetricStory, Inc. (2017-Present); Trustee, Wheaton College (2018-Present); Trustee, Gordon College (2001-2016); Board Member, 6wind SA (2002-2019). |
| | |
• Trustee since 2000 | | Steven J. Paggioli, 71 |
• Oversees 42 Funds in Fund Complex | | Independent Consultant (2002-Present); Trustee, Professionally Managed Portfolios (28 portfolios); Advisory Board Member, Sustainable Growth Advisors, LP; Independent Director, Muzinich BDC, Inc. (business development company) (2019-Present);Director, The Wadsworth Group; Independent Director, Chase Investment Counsel (2008–2019); Executive Vice President, Secretary and Director, Investment Company Administration, LLC and First Fund Distributors, INC. (1990-2001). |
| | |
• Trustee since 2013 | | Richard F. Powers III, 75 |
• Oversees 42 Funds in Fund Complex | | Adjunct Professor, U.S. Naval War College (2016-Present); Adjunct Professor, Boston College (2011-2015);Director, Ameriprise Financial Inc. (2005-2009); President and CEO of Van Kampen Investments Inc. (1998-2003); President, Morgan Stanley Client Group (2000-2002); Executive Vice President and Chief Marketing Officer of the Morgan Stanley Individual Investor Group (1984-1998). |
| | |
• Independent Chairman | | Eric Rakowski, 63 |
• Trustee since 2000 • Oversees 46 Funds in Fund Complex | | Professor of Law, University of California at Berkeley School of Law (1990-Present); Tax Attorney at Davis Polk & Wardwell and clerked for Judge Harry T. Edwards of the U.S. Court of Appeals for the District of Columbia Circuit and for Justice William J. Brennan Jr. of the U.S. Supreme Court; Director of Harding, Loevner Funds, Inc. (10 portfolios); Trustee of Third Avenue Trust (3 portfolios) (2002-2019); Trustee of Third Avenue Variable Trust (1 portfolio) (2002-2019). |
| | |
• Trustee since 2013 | | Victoria L. Sassine, 56 |
• Oversees 46 Funds in Fund Complex | | Adjunct Professor, Babson College (2007–Present); Director, Board of Directors, PRG Group (2017-Present); CEO, Founder, Scale Smarter Partners, LLC (2018-Present); Adviser, EVOFEM Biosciences (2019-Present); Chairperson of the Board of Directors of Business Management Associates (2018 to 2019). |
| | |
• Trustee since 2000 | | Thomas R. Schneeweis, 74 |
• Oversees 42 Funds in Fund Complex | | Professor Emeritus, University of Massachusetts (2013-Present); President, TRS Associates (1982-Present);Board Member, Chartered Alternative Investment Association (“CAIA”) (2002-Present); Co-Founder and Director, Institute for Global Asset and Risk Management (Education) (2010-Present); Co-Owner, Quantitative Investment Technologies (2014-Present); Co-Owner, Yes Wealth Management (2018-Present); Director, CAIA Foundation (2010-2019); Partner, S Capital Wealth Advisors (2015-2018); Partner, S Capital Management, LLC (2007-2015); President, Alternative Investment Analytics, LLC, (formerly Schneeweis Partners, LLC) (2001-2013). |
24
|
AMG Funds Trustees and Officers (continued) |
Interested Trustees
Each Trustee in the following table is an “interested person” of the Trust within the meaning of the 1940 Act. Ms. Carsman is an interested person of the Trust within the meaning of the 1940 Act by virtue of her position with, and interest in securities of, AMG.
| | |
Number of Funds Overseen in
Fund Complex | | Name, Age, Principal Occupation(s) During Past 5 Years and Other Directorships Held by Trustee |
| |
• Trustee since 2011 • Oversees 42 Funds in Fund Complex | | Christine C. Carsman, 69 Affiliated Managers Group, Inc. (2004-Present): Senior Policy Advisor (2019-Present), Executive Vice President, Deputy General Counsel and Chief Regulatory Counsel (2017-2018), Senior Vice President and Deputy General Counsel (2011-2016), Senior Vice President and Chief Regulatory Counsel (2007-2011), Vice President and Chief Regulatory Counsel (2004-2007); Chair of the Board of Directors, AMG Funds plc (2015-2018); Director, AMG Funds plc (2010-2018); Senior Counsel, Vice President and Director of Operational Risk Management and Compliance, Wellington Management Company, LLP (1995-2004); Director Emeritus of Harding, Loevner Funds, Inc. (0 Portfolios) (2021- Present); Director of Harding, Loevner Funds, Inc. (9 portfolios) (2017-2020); Secretary and Chief Legal Officer, AMG Funds, AMG Funds I, AMG Funds II and AMG Funds III (2004-2011). |
| |
• Trustee since 2021 Oversees 42 Funds in Fund Complex | | Garret W. Weston, 40 Affiliated Managers Group, Inc. (2008-Present): Managing Director, Co-Head of Affiliate Engagement (2021-Present), Senior Vice President, Affiliate Development (2016-2021), Vice President, Office of the CEO (2015-2016), Vice President, New Investments (2012-2015), Senior Associate, New Investments (2008-2012); Associate, Madison Dearborn Partners (2006-2008); Analyst, Merrill Lynch (2004-2006). |
| |
| Officers | | |
Position(s) Held with Fund and
Length of Time Served | | Name, Age, Principal Occupation(s) During Past 5 Years |
| |
• President since 2018 • Principal Executive Officer since 2018 • Chief Executive Officer since 2018 • Chief Operating Officer since 2007 | | Keitha L. Kinne, 63 Chief Operating Officer, AMG Funds LLC (2007-Present); Chief Investment Officer, AMG Funds LLC (2008-Present); President and Principal, AMG Distributors, Inc. (2018-Present); Chief Operating Officer, AMG Distributors, Inc. (2007-Present); President, Chief Executive Officer and Principal Executive Officer, AMG Funds, AMG Funds I, AMG Funds II, AMG Funds III and AMG Funds IV (2018-Present); Chief Operating Officer, AMG Funds, AMG Funds I, AMG Funds II, and AMG Funds III (2007-Present); Chief Operating Officer, AMG Funds IV (2016-Present); Chief Operating Officer and Chief Investment Officer, Aston Asset Management, LLC (2016); President and Principal Executive Officer, AMG Funds, AMG Funds I, AMG Funds II and AMG Funds III (2012-2014); Managing Partner, AMG Funds LLC (2007-2014); President and Principal, AMG Distributors, Inc. (2012-2014); Managing Director, Legg Mason & Co., LLC (2006-2007); Managing Director, Citigroup Asset Management (2004-2006). |
| |
• Secretary since 2015 • Chief Legal Officer since 2015 | | Mark J. Duggan, 56 Managing Director and Senior Counsel, AMG Funds LLC (2021-Present); Senior Vice President and Senior Counsel, AMG Funds LLC (2015-2021); Secretary and Chief Legal Officer, AMG Funds, AMG Funds I, AMG Funds II, AMG Funds III and AMG Funds IV (2015-Present); Attorney, K&L Gates, LLP (2009-2015). |
| |
• Chief Financial Officer since 2017 • Treasurer since 2017 • Principal Financial Officer since 2017 • Principal Accounting Officer since 2017 | | Thomas G. Disbrow, 55 Vice President, Mutual Fund Treasurer & CFO, AMG Funds, AMG Funds LLC (2017-Present); Chief Financial Officer, Principal Financial Officer, Treasurer and Principal Accounting Officer, AMG Funds, AMG Funds I, AMG Funds II, AMG Funds III and AMG Funds IV (2017-Present); Managing Director - Global Head of Traditional Funds Product Control, UBS Asset Management (Americas), Inc. (2015-2017); Managing Director - Head of North American Funds Treasury, UBS Asset Management (Americas), Inc. (2011-2015). |
| |
• Deputy Treasurer since 2017 | | John A. Starace, 51 Vice President, Mutual Fund Accounting, AMG Funds LLC (2021-Present); Director, Mutual Fund Accounting, AMG Funds LLC (2017-2021); Vice President, Deputy Treasurer of Mutual Funds Services, AMG Funds LLC (2014-2017); Deputy Treasurer, AMG Funds, AMG Funds I, AMG Funds II, AMG Funds III and AMG Funds IV (2017-Present); Vice President, Citi Hedge Fund Services (2010-2014); Audit Senior Manager (2005-2010) and Audit Manager (2001-2005), Deloitte & Touche LLP. |
| |
• Chief Compliance Officer and Sarbanes-Oxley Code of Ethics since 2019 | | Patrick J. Spellman, 47 Vice President, Chief Compliance Officer, AMG Funds LLC (2017-Present); Chief Compliance Officer, AMG Distributors, Inc., (2010-Present); Chief Compliance Officer and Sarbanes-Oxley Code of Ethics Compliance Officer, AMG Funds, AMG Funds I, AMG Funds II, AMG Funds III and AMG Funds IV (2019-Present); Senior Vice President, Chief Compliance Officer, AMG Funds LLC (2011-2017); Anti-Money Laundering Compliance Officer, AMG Funds, AMG Funds I, AMG Funds II, and AMG Funds III (2014-2019); Anti-Money Laundering Officer, AMG Funds IV, (2016-2019); Compliance Manager, Legal and Compliance, Affiliated Managers Group, Inc. (2005-2011). |
25
|
AMG Funds Trustees and Officers (continued) |
| | |
Position(s) Held with Fund and
Length of Time Served | | Name, Age, Principal Occupation(s) During Past 5 Years |
• Assistant Secretary since 2016 | | Maureen A. Meredith, 36 Vice President, Senior Counsel, AMG Funds LLC (2021-Present); Vice President, Counsel, AMG Funds LLC (2019-2021); Director, Counsel, AMG Funds LLC (2017-2018); Vice President, Counsel, AMG Funds LLC (2015-2017); Assistant Secretary, AMG Funds, AMG Funds I, AMG Funds II, AMG Funds III and AMG Funds IV (2016-Present); Associate, Ropes & Gray LLP (2011-2015); Law Fellow, Massachusetts Appleseed Center for Law and Justice (2010-2011). |
• Anti-Money Laundering Compliance Officer since 2019 | | Hector D. Roman, 43 Director, Legal and Compliance, AMG Funds LLC (2020-Present); Anti-Money Laundering Compliance Officer, AMG Funds, AMG Funds I, AMG Funds II, AMG Funds III and AMG Funds IV (2019-Present); Manager, Legal and Compliance, AMG Funds LLC (2017-2019); Director of Compliance,Morgan Stanley Investment Management (2015-2017); Senior Advisory, PricewaterhouseCoopers LLP (2014-2015); Risk Manager, Barclays Investment Bank (2008-2014). |
26
|
Annual Renewal of Investment Management and Subadvisory Agreements |
| | | | | | | | |
AMG Frontier Small Cap Growth Fund: Approval of Fund Management Agreement and Subadvisory Agreement on June 24, 2021 At a meeting held via telephone and video conference on June 24, 2021,1 the Board of Trustees (the “Board” or the “Trustees”), and separately a majority of the Trustees who are not “interested persons” of AMG Funds I (the “Trust”) (the “Independent Trustees”), approved (i) the Fund Management Agreement, as amended pursuant to letter agreements at any time prior to the date of the meeting, with AMG Funds LLC (the “Investment Manager”) for AMG Frontier Small Cap Growth Fund (the “Fund”) and separately each of Amendment No. 1 thereto dated July 1, 2015, and Amendment No. 2 thereto dated October 1, 2016 (collectively, the “Fund Management Agreement”); and (ii) the Subadvisory Agreement, as amended at any time prior to the date of the meeting, with the Subadviser for the Fund (collectively, the “Subadvisory Agreement”). The Independent Trustees were separately represented by independent legal counsel in connection with their consideration of the approval of these agreements. In considering the Fund Management Agreement and Subadvisory Agreement, the Trustees reviewed a variety of materials relating to the Fund, the Investment Manager and the Subadviser, including the nature, extent and quality of services, comparative performance, fee and expense information for an appropriate peer group of similar mutual funds for the Fund (the “Peer Group”), performance information for the relevant benchmark index for the Fund (the “Fund Benchmark”), other relevant matters, and other information provided to them on a periodic basis throughout the year. Prior to voting, the Independent Trustees: (a) reviewed the foregoing information with their independent legal counsel; (b) received materials from their independent legal counsel discussing the legal standards applicable to their consideration of the Fund Management Agreement and the Subadvisory Agreement; and (c) met with their independent legal counsel in private sessions at which no representatives of management were present. NATURE, EXTENT AND QUALITY OF SERVICES In considering the nature, extent and quality of the services provided by the Investment Manager, the Trustees reviewed information relating to the Investment Manager’s operations and personnel. Among other things, the Investment Manager provided financial information, information about its supervisory and professional staff and descriptions of its organizational and management structure. The Trustees also took into account information provided | | | | periodically throughout the previous year by the Investment Manager in Board meetings relating to the performance of its duties with respect to the Fund and the Trustees’ knowledge of the Investment Manager’s management and the quality of the performance of the Investment Manager’s duties under the Fund Management Agreement and Administration Agreement. In the course of their deliberations regarding the Investment Manager, the Trustees evaluated, among other things: (a) the extent and quality of the Investment Manager’s oversight of the operation and management of the Fund; (b) the quality of the Investment Manager’s oversight of the performance by the Subadviser of its portfolio management duties; (c) the Investment Manager’s ability to supervise the Fund’s other service providers; and (d) the Investment Manager’s compliance program. The Trustees also took into account that, in performing its functions under the Fund Management Agreement and supervising the Subadviser, the Investment Manager: performs periodic detailed analyses and reviews of the performance by the Subadviser of its obligations to the Fund, including without limitation, analysis and review of portfolio and other compliance matters and review of the Subadviser’s investment performance with respect to the Fund; prepares and presents periodic reports to the Board regarding the investment performance of the Subadviser and other information regarding the Subadviser, at such times and in such forms as the Board may reasonably request; reviews and considers any changes in the personnel of the Subadviser responsible for performing the Subadviser’s obligations and makes appropriate reports to the Board; reviews and considers any changes in the ownership or senior management of the Subadviser and makes appropriate reports to the Board; performs periodic in-person, telephonic or videoconference diligence meetings, including with respect to compliance matters, with representatives of the Subadviser; assists the Board and management of the Trust in developing and reviewing information with respect to the initial approval of the Subadvisory Agreement and annual consideration of the Subadvisory Agreement thereafter; prepares recommendations with respect to the continued retention of the Subadviser or the replacement of the Subadviser, including at the request of the Board; identifies potential successors to, or replacements of, the Subadviser or potential additional subadvisers, including performing appropriate due diligence, and developing and presenting to the Board a recommendation as to any such successor, replacement, or additional subadviser, including at the request of the Board; designates and | | | | compensates from its own resources such personnel as the Investment Manager may consider necessary or appropriate to the performance of its services; and performs such other review and reporting functions as the Board shall reasonably request consistent with the Fund Management Agreement and applicable law. The Trustees noted the affiliation of the Subadviser with the Investment Manager, noting any potential conflicts of interest. The Trustees also took into account the financial condition of the Investment Manager with respect to its ability to provide the services required under the Fund Management Agreement and the Investment Manager’s undertaking to maintain a contractual expense limitation for the Fund. The Trustees also considered the Investment Manager’s risk management processes. The Trustees also reviewed information relating to the Subadviser’s operations and personnel and the investment philosophy, strategies and techniques (the “Investment Strategy”) used in managing the Fund. Among other things, the Trustees reviewed information on portfolio management and other professional staff, information regarding the Subadviser’s organizational and management structure and the Subadviser’s brokerage policies and practices. The Trustees considered specific information provided regarding the experience of the individuals at the Subadviser with portfolio management responsibility for the Fund, including the information set forth in the Fund’s prospectus and statement of additional information. In the course of their deliberations, the Trustees evaluated, among other things: (a) the services rendered by the Subadviser in the past; (b) the qualifications and experience of the Subadviser’s personnel; and (c) the Subadviser’s compliance program. The Trustees also took into account the financial condition of the Subadviser with respect to its ability to provide the services required under the Subadvisory Agreement. The Trustees also considered the Subadviser’s risk management processes. PERFORMANCE The Board considered the Fund’s net performance during relevant time periods as compared to the Fund’s Peer Group and Fund Benchmark, considered the gross performance of the Fund as compared to the Subadviser’s relevant performance composite that utilizes the same investment strategy and approach and noted that the Board reviews on a quarterly basis detailed information about both the Fund’s performance results and portfolio composition, as well as the Subadviser’s Investment Strategy. The Board was mindful of the Investment |
27
|
Annual Renewal of Investment Management and Subadvisory Agreements (continued) |
| | | | | | | | |
Manager’s expertise, resources and attention to monitoring the Subadviser’s performance, investment style and risk-adjusted performance with respect to the Fund and its discussions with the management of the Fund’s subadviser during the period regarding the factors that contributed to the performance of the Fund. Among other information relating to the Fund’s performance, the Trustees noted that the Fund’s performance for Class I shares (which share class has the earliest inception date and the largest amount of assets of all the share classes of the Fund) for the 1-year, 3-year, 5-year and 10-year periods ended March 31, 2021 was above the median performance of the Peer Group and above the performance of the Fund Benchmark, the Russell 2000® Growth Index. The Trustees took into account management’s discussion of the Fund’s performance, including the fact that the Fund ranked in the top decile relative to its Peer Group for the 1-year period and ranked in the top quartile relative to its Peer Group for the 3-year period. The Trustees concluded that the Fund’s overall performance has been satisfactory. ADVISORY AND SUBADVISORY FEES; FUND EXPENSES; PROFITABILITY; AND ECONOMIES OF SCALE In considering the reasonableness of the advisory fee payable to the Investment Manager, the Trustees reviewed information provided by the Investment Manager at the June 24, 2021 and prior meetings setting forth all revenues and other benefits, both direct and indirect (including any so-called “fallout benefits” such as reputational value derived from the Investment Manager serving as Investment Manager to the Fund), received by the Investment Manager and its affiliates attributable to managing the Fund and all the mutual funds in the AMG Funds Family of Funds; the cost of providing such services; the significant risks undertaken as Investment Manager and sponsor of the Fund, including investment, operational, enterprise, entrepreneurial, litigation, regulatory and compliance risks; and the resulting profitability to the Investment Manager and its affiliates from these relationships. The Trustees also considered the amount of the advisory fee retained by the Investment Manager after payment of the subadvisory fee with respect to the Fund. The Trustees also noted payments made or to be made from the Subadviser to the Investment Manager, and other payments made or to be made from the Investment Manager to the Subadviser. The Trustees also considered management’s discussion of the | | | | current asset level of the Fund, and the impact on profitability of both the current asset level and any future growth of assets of the Fund. In considering the cost of services to be provided by the Investment Manager under the Fund Management Agreement and the profitability to the Investment Manager of its relationship with the Fund, the Trustees noted the undertaking by the Investment Manager to maintain a contractual expense limitation for the Fund. The Board also took into account management’s discussion of the advisory fee structure and the services the Investment Manager provides in performing its functions under the Fund Management Agreement and supervising the Subadviser. Based on the foregoing, the Trustees concluded that the profitability to the Investment Manager is reasonable and that the Investment Manager is not realizing material benefits from economies of scale that would warrant adjustments to the advisory fee at this time. Also with respect to economies of scale, the Trustees noted that as the Fund’s assets increase over time, the Fund may realize other economies of scale to the extent the increase in assets is proportionally greater than the increase in certain other expenses. In considering the reasonableness of the subadvisory fee payable by the Investment Manager to the Subadviser, the Trustees reviewed information regarding the cost to the Subadviser of providing subadvisory services to the Fund and the resulting profitability from the relationship. The Trustees noted that, because the Subadviser is an affiliate of the Investment Manager, a portion of the Subadviser’s revenues or profits might be shared directly or indirectly with the Investment Manager. The Trustees also noted that the subadvisory fees are paid by the Investment Manager out of its advisory fee. The Board also took into account management’s discussion of the subadvisory fee structure, and the services the Subadviser provides in performing its functions under the Subadvisory Agreement. Based on the foregoing, the Trustees concluded that the profitability to the Subadviser is reasonable and that the Subadviser is not realizing material benefits from economies of scale that would warrant adjustments to the subadvisory fees at this time. Also with respect to economies of scale, the Trustees noted that as the Fund’s assets increase over time, the Fund may realize other economies of scale to the extent the increase in assets is proportionally greater than the increase in certain other expenses. The Trustees noted that the management fees (which include both the advisory and administration fees) and total expenses (net of applicable expense | | | | waivers/reimbursements) of Class I shares of the Fund as of March 31, 2021 were lower and higher, respectively, than the average for the Peer Group. The Trustees took into account the fact that the Investment Manager has contractually agreed, through March 1, 2022, to limit the Fund’s net annual operating expenses (subject to certain excluded expenses) to 0.90%. The Trustees also took into account management’s discussion of the Fund’s expenses. The Trustees concluded that, in light of the nature, extent and quality of the services provided by the Investment Manager and the Subadviser (which is an affiliate of the Investment Manager), the foregoing expense limitation and the considerations noted above with respect to the Investment Manager and the Subadviser, the Fund’s advisory and subadvisory fees are reasonable. .* * * * * After consideration of the foregoing, the Trustees also reached the following conclusions (in addition to the conclusions discussed above) regarding the Fund Management Agreement and the Subadvisory Agreement: (a) the Investment Manager and the Subadviser have demonstrated that they possess the capability and resources to perform the duties required of them under the Fund Management Agreement and the Subadvisory Agreement and (b) the Investment Manager and Subadviser maintain appropriate compliance programs. Based on all of the above-mentioned factors and their related conclusions, with no single factor or conclusion being determinative and with each Trustee not necessarily attributing the same weight to each factor, the Trustees concluded that approval of the Fund Management Agreement and the Subadvisory Agreement would be in the best interests of the Fund and its shareholders. Accordingly, on June 24, 2021, the Trustees, and separately a majority of the Independent Trustees, voted to approve the Fund Management Agreement and the Subadvisory Agreement for the Fund. 1 The Trustees determined that the conditions surrounding COVID-19 constituted unforeseen or emergency circumstances and that reliance on the Securities and Exchange Commission’s (“SEC”) exemptive order, which provides relief from the in-person voting requirements of the Investment Company Act of 1940, as amended (the “1940 Act”), in certain circumstances (the “In-Person Relief”), was necessary or appropriate due to the circumstances related to current or potential effects of COVID-19. The Trustees unanimously wished to rely on |
28
|
Annual Renewal of Investment Management and Subadvisory Agreements (continued) |
| | | | | | | | |
| the In-Person Relief with respect to the approval of those matters on the agenda for the June 24, 2021 meeting that would otherwise require in-person votes under the 1940 | | | | Act. See Investment Company Release No. 33897 (June 19, 2020). This exemptive order supersedes, in part, a similar, | | | | earlier exemptive order issued by the SEC (Investment Company Release No. 33824 (March 25, 2020)). |
29
THIS PAGE INTENTIONALLY LEFT BLANK
THIS PAGE INTENTIONALLY LEFT BLANK
THIS PAGE INTENTIONALLY LEFT BLANK
| | |
| | |
| | | | |
INVESTMENT MANAGER AND ADMINISTRATOR AMG Funds LLC 680 Washington Blvd., Suite 500 Stamford, CT 06901 800.548.4539 DISTRIBUTOR AMG Distributors, Inc. 680 Washington Blvd., Suite 500 Stamford, CT 06901 800.548.4539 SUBADVISER Frontier Capital Management Co., LLC 99 Summer Street Boston, MA 02110 | | CUSTODIAN The Bank of New York Mellon Mutual Funds Custody 6023 Airport Road Oriskany, NY 13424 LEGAL COUNSEL Ropes & Gray LLP Prudential Tower, 800 Boylston Street Boston, MA 02199-3600 TRANSFER AGENT BNY Mellon Investment Servicing (US) Inc. Attn: AMG Funds 4400 Computer Drive Westborough, MA 01581 800.548.4539 | | This report is prepared for the Fund’s shareholders. It is authorized for distribution to prospective investors only when preceded or accompanied by an effective prospectus. To receive a free copy of the prospectus or Statement of Additional Information, which includes additional information about Fund Trustees, please contact us by calling 800.548.4539. Distributed by AMG Distributors, Inc., member FINRA/SIPC. Current net asset values per share for the Fund are available on the Fund’s website at amgfunds.com. A description of the policies and procedures the Fund uses to vote its proxies is available: (i) without charge, upon request, by calling 800.548.4539, or (ii) on the Securities and Exchange Commission’s (SEC) website at sec.gov. For information regarding the Fund’s proxy voting record for the 12-month period ended June 30, call 800.548.4539 or visit the SEC website at sec.gov. The Fund files its complete schedule of portfolio holdings with the SEC for the first and third quarters of each fiscal year as an exhibit to their reports on Form N-PORT. The Fund’s portfolio holdings on Form N-PORT are available on the SEC’s website at sec.gov and the Fund’s website at amgfunds.com. To review a complete list of the Fund’s portfolio holdings, or to view the most recent semiannual report or annual report, please visit amgfunds.com. |
amgfunds.com |
| | |
| | |
| | | | | | | | | | |
BALANCED FUNDS AMG GW&K Global Allocation GW&K Investment Management, LLC AMG FQ Global Risk-Balanced First Quadrant, L.P. EQUITY FUNDS AMG Beutel Goodman International Equity Beutel, Goodman & Company Ltd. AMG Boston Common Global Impact Boston Common Asset Management, LLC AMG Managers CenterSquare Real Estate CenterSquare Investment Management LLC AMG Frontier Small Cap Growth Frontier Capital Management Co., LLC AMG GW&K Small Cap Core AMG GW&K Small Cap Value AMG GW&K Small/Mid Cap AMG GW&K Small/Mid Cap Growth AMG GW&K Emerging Markets Equity AMG GW&K Emerging Wealth Equity AMG GW&K International Small Cap GW&K Investment Management, LLC AMG Montrusco Bolton Large Cap Growth Montrusco Bolton Investments, Inc. | | | | AMG Renaissance Large Cap Growth The Renaissance Group LLC AMG River Road Dividend All Cap Value AMG River Road Focused Absolute Value AMG River Road International Value Equity AMG River Road Large Cap Value Select AMG River Road Mid Cap Value AMG River Road Small-Mid Cap Value AMG River Road Small Cap Value River Road Asset Management, LLC AMG TimesSquare Emerging Markets Small Cap AMG TimesSquare Global Small Cap AMG TimesSquare International Small Cap AMG TimesSquare Mid Cap Growth AMG TimesSquare Small Cap Growth TimesSquare Capital Management, LLC AMG Veritas Asia Pacific AMG Veritas China AMG Veritas Global Focus AMG Veritas Global Real Return Veritas Asset Management LLP AMG Yacktman AMG Yacktman Focused AMG Yacktman Global AMG Yacktman Special Opportunities Yacktman Asset Management LP | | | | FIXED INCOME FUNDS AMG Beutel Goodman Core Plus Bond Beutel, Goodman & Company Ltd. AMG GW&K Core Bond ESG AMG GW&K Enhanced Core Bond ESG AMG GW&K ESG Bond AMG GW&K High Income AMG GW&K Municipal Bond AMG GW&K Municipal Enhanced Yield GW&K Investment Management, LLC | | |
amgfunds.com | | 103121 AR085 |
Registrant has adopted a Code of Ethics. See attached Exhibit (a)(1).
| Item 3. | AUDIT COMMITTEE FINANCIAL EXPERT |
Registrant’s Board of Trustees has determined that independent Trustee Mr. Steven J. Paggioli qualifies as an Audit Committee Financial Expert. Mr. Paggioli is “independent” as such term is defined in Form N-CSR.
| Item 4. | PRINCIPAL ACCOUNTANT FEES AND SERVICES |
(a) Audit Fees
The aggregate fees billed by the Funds’ independent registered public accounting firm, PricewaterhouseCoopers LLP (“PwC”), to the Funds for the Funds’ two most recent fiscal years for professional services rendered for audits of annual financial statements, or services that are normally provided in connection with statutory and regulatory filings or engagements (“Audit Fees”) were as follows:
| | | | | | | | |
| | | Fiscal
2021 | | | Fiscal
2020 | |
AMG FQ Global Risk-Balanced Fund | | $ | 29,686 | | | $ | 26,031 | |
AMG Frontier Small Cap Growth Fund | | $ | 25,560 | | | $ | 21,760 | |
AMG GW&K Core Bond ESG Fund | | $ | 44,085 | | | $ | 41,896 | |
AMG River Road Large Cap Value Select Fund | | $ | 34,640 | | | $ | 34,587 | |
AMG Veritas China Fund | | $ | 28,237 | | | $ | 23,130 | |
AMG Veritas Global Focus Fund | | $ | 27,681 | | | $ | 22,860 | |
(b) Audit-Related Fees
There were no fees billed by PwC to the Funds in their two recent fiscal years for services rendered for assurance and related services that are reasonably related to the performance of the audit or review of the Fund’s financial statements, but are not reported as Audit Fees (“Audit-Related Fees”).
For the Funds’ two most recent fiscal years, there were no Audit-Related Fees billed by PwC for engagements related directly to the operations and financial reporting of one or more Funds by a Fund Service Provider. A Fund Service Provider is (a) any investment adviser to a Fund (not including any Subadvisor whose role is primarily portfolio management and is subcontracted with or overseen by another investment adviser) or (b) any entity that provides ongoing services to a Fund and is controlling, controlled by or under common control with a Fund investment adviser described in (a).
(c) Tax Fees
The aggregate fees billed by PwC to the Funds for the two most recent fiscal years for professional services rendered for tax compliance, tax advice, and tax planning (“Tax Fees”) were as follows:
| | | | | | | | |
| | | Fiscal
2021 | | | Fiscal
2020 | |
AMG FQ Global Risk-Balanced Fund | | $ | 7,000 | | | $ | 7,000 | |
AMG Frontier Small Cap Growth Fund | | $ | 4,850 | | | $ | 4,850 | |
AMG GW&K Core Bond ESG Fund | | $ | 4,850 | | | $ | 4,850 | |
AMG River Road Large Cap Value Select Fund | | $ | 7,000 | | | $ | 7,000 | |
AMG Veritas China Fund | | $ | 4,850 | | | $ | 4,850 | |
AMG Veritas Global Focus Fund | | $ | 4,850 | | | $ | 4,850 | |
For the Funds’ two most recent fiscal years, Tax Fees billed by PwC for engagements by Fund Service Providers that related directly to the operations and financial reporting of the Funds were $0 for fiscal 2021 and $0 for fiscal 2020, respectively.
The services for which Tax Fees were charged comprise all services performed by professional staff in PwC’s tax division except those services related to the audit. Typically, this category would include fees for tax compliance, tax planning, and tax advice. Tax compliance, tax advice, and tax planning services include preparation of original and amended tax returns, claims for refund and tax payment-planning services, assistance with tax audits and appeals, tax advice related to mergers and acquisitions and requests for rulings or technical advice from taxing authorities.
(d) All Other Fees
There were no other fees billed by PwC to the Funds for all other non-audit services (“Other Fees”) during the Funds’ two most recent fiscal years. During the same period, there were no Other Fees billed by PwC for engagements by Fund Service Providers that related directly to the operations and financial reporting of the Funds.
(e)(1) According to policies adopted by the Audit Committee, services provided by PwC to the Funds must be pre-approved by the Audit Committee. On an annual basis, the Audit Committee reviews and pre-approves various types of services that PwC may perform for the Funds without specific approval of each engagement, subject to specified budget limitations. As contemplated by the Sarbanes-Oxley Act of 2002 and related SEC rules, the Audit Committee also pre-approves non-audit services provided by PwC to any Fund Service Provider for any engagement that relates directly to the operations and financial reporting of the Funds. Any engagement that is not already pre-approved or that will exceed a pre-approved budget must be submitted to the Audit Committee for pre-approval. The Chairman of the Audit Committee is authorized on behalf of the Board of Trustees and the Audit Committee to approve the engagement of PwC to perform non-audit services subject to certain conditions, including notification to the Audit Committee of such pre-approval not later than the next meeting of the Audit Committee following the date of such pre-approval.
(e)(2) None.
(f) Not applicable.
(g) The aggregate fees billed by PwC in 2021 and 2020 for non-audit services rendered to the Funds and Fund Service Providers were $74,983 and $82,900, respectively. For the fiscal year ended October 31, 2021, this amount reflects the amounts disclosed above in Item 4(b),(c),(d), plus $41,583 in fees billed to the Fund Service Providers for non-audit services that did not relate directly to the operations and financial reporting of the Funds. For the fiscal year ended October 31, 2020, this amount reflects the amounts disclosed above in Item 4(b),(c),(d), plus $49,500 in fees billed to the Fund Service Providers for non-audit services that did not relate directly to the operations and financial reporting of the Funds.
(h) The Trust’s Audit Committee has considered whether the provision of non-audit services by registrant’s independent registered public accounting firm to the registrant’s investment adviser, and any entity controlling, controlled by, or under common control with the investment adviser that provided ongoing services to the registrant that were not pre-approved by the Committee (because such services did not relate directly to the operations and financial reporting of the registrant) was compatible with maintaining the independence of the independent registered public accounting firm.
| Item 5. | AUDIT COMMITTEE OF LISTED REGISTRANTS |
Not applicable.
| Item 6. | SCHEDULE OF INVESTMENTS |
The schedule of investments in securities of unaffiliated issuers as of the close of the reporting period is included as part of the report to shareholders filed under Item 1 of this form.
| Item 7. | DISCLOSURE OF PROXY VOTING POLICIES AND PROCEDURES FOR CLOSED-END MANAGEMENT INVESTMENT COMPANIES |
Not applicable.
| Item 8. | PORTFOLIO MANAGERS OF CLOSED-END MANAGEMENT INVESTMENT COMPANIES |
Not applicable.
| Item 9. | PURCHASES OF EQUITY SECURITIES BY CLOSED-END MANAGEMENT INVESTMENT COMPANIES AND AFFILIATED PURCHASERS |
Not applicable.
| Item 10. | SUBMISSION OF MATTERS TO A VOTE OF SECURITY HOLDERS |
Not applicable.
| Item 11. | CONTROLS AND PROCEDURES |
(a) The Registrant’s principal executive and principal financial officers have concluded, based on their evaluation of the registrant’s disclosure controls and procedures as of a date within 90 days of the filing of this report, that the Registrant’s disclosure controls and procedures are reasonably designed to ensure that information required to be disclosed by the Registrant on Form N-CSR is recorded, processed, summarized and reported within the required time periods and that information required to be disclosed by the registrant in the reports that it files or submits on Form N-CSR is accumulated and communicated to the Registrant’s management, including its principal executive and principal financial officers, as appropriate to allow timely decisions regarding required disclosure.
(b) There were no changes in the Registrant’s internal control over financial reporting during the period covered by this report that have materially affected, or are reasonably likely to materially affect, the internal control over financial reporting.
| Item 12. | DISCLOSURE OF SECURITIES LENDING ACTIVITIES FOR CLOSED-END MANAGEMENT INVESTMENT COMPANIES |
Not applicable.
SIGNATURES
Pursuant to the requirements of the Securities Exchange Act of 1934 and the Investment Company Act of 1940, the registrant has duly caused this report to be signed on its behalf by the undersigned, thereunto duly authorized.
| | |
| AMG Funds I |
| |
| By: | | /s/ Keitha L. Kinne |
| | Keitha L. Kinne, Principal Executive Officer |
| |
| Date: | | January 6, 2022 |
Pursuant to the requirements of the Securities Exchange Act of 1934 and the Investment Company Act of 1940, this report has been signed below by the following persons on behalf of the registrant and in the capacities and on the dates indicated.
| | |
| By: | | /s/ Keitha L. Kinne |
| | Keitha L. Kinne, Principal Executive Officer |
| |
| Date: | | January 6, 2022 |
| |
| By: | | /s/ Thomas Disbrow |
| | Thomas Disbrow, Principal Financial Officer |
| |
| Date: | | January 6, 2022 |