UNITED STATES
SECURITIES AND EXCHANGE COMMISSION
Washington, D.C. 20549
FORM N-CSR
CERTIFIED SHAREHOLDER REPORT OF REGISTERED
MANAGEMENT INVESTMENT COMPANIES
Investment Company Act file number: 811-06520
AMG Funds I
(Exact name of registrant as specified in charter)
One Stamford Plaza, 263 Tresser Boulevard, Suite 949, Stamford,
Connecticut 06901
(Address of principal executive offices) (Zip code)
AMG Funds LLC
One Stamford Plaza, 263 Tresser Boulevard, Suite 949, Stamford,
Connecticut 06901
(Name and address of agent for service)
Registrant’s telephone number, including area code: (203) 299-3500
Date of fiscal year end: DECEMBER 31
Date of reporting period: JANUARY 1, 2020 – DECEMBER 31, 2020
(Annual Shareholder Report)
Item 1. Reports to Shareholders
| | |
 | | ANNUAL REPORT |
| | | | | | | | |
| | | | AMG Funds |
| | | | December 31, 2020 |
| | | | AMG Managers CenterSquare Real Estate Fund |
| | | | Class N: MRESX | | Class I: MRASX | | Class Z: MREZX |
| | | | | | | | | |
| | | | | | | | |
| | | | | | | | |
| | |
| amgfunds.com | | 123120 AR017 |
| | |
| | | AMG Funds Annual Report — December 31, 2020 |
| | | | | | |
| | | |
| | | | | | | |
| | | TABLE OF CONTENTS | | PAGE | |
| | | | |
| | | LETTER TO SHAREHOLDERS | | | 2 | |
| | | |
| | | ABOUT YOUR FUND’S EXPENSES | | | 3 | |
| | | |
| | | PORTFOLIO MANAGER’S COMMENTS, FUND SNAPSHOTS AND SCHEDULE OF PORTFOLIO INVESTMENTS | | | 4 | |
| | | |
| | | FINANCIAL STATEMENTS | | | | |
| | | |
| | | Statement of Assets and Liabilities | | | 10 | |
| | | |
| | | Balance sheet, net asset value (NAV) per share computations and cumulative distributable earnings (loss) | | | | |
| | | |
| | | Statement of Operations | | | 12 | |
| | | |
| | | Detail of sources of income, expenses, and realized and unrealized gains (losses) during the fiscal year | | | | |
| | | |
| | | Statements of Changes in Net Assets | | | 13 | |
| | | |
| | | Detail of changes in assets for the past two fiscal years | | | | |
| | | |
| | | Financial Highlights | | | 14 | |
| | | |
| | | Historical net asset values per share, distributions, total returns, income and expense ratios, turnover ratios and net assets | | | | |
| | | |
| | | Notes to Financial Statements | | | 17 | |
| | | |
| | | Accounting and distribution policies, details of agreements and transactions with Fund management and affiliates, and descriptions of certain investment risks | | | | |
| | | |
| | | REPORT OF INDEPENDENT REGISTERED PUBLIC ACCOUNTING FIRM | | | 21 | |
| | | |
| | | OTHER INFORMATION | | | 22 | |
| | | |
| | | TRUSTEES AND OFFICERS | | | 23 | |
| | | | | | | |
|
| Nothing contained herein is to be considered an offer, sale or solicitation of an offer to buy shares of any series of the AMG Funds Family of Funds. Such offering is made only by prospectus, which includes details as to offering price and other material information. | |
| | |
| | Letter to Shareholders |
Dear Shareholder:
The fiscal year ending December 31, 2020, was a volatile period for financial markets that featured a dramatic selloff and extraordinary rebound amid the unprecedented global effort to stop the COVID-19 pandemic. Early in the year, equities achieved new record highs against the backdrop of a healthy economy and strong investor sentiment. However, a broad-based selloff occurred amid a global flight to quality as investors assessed the scope of the unfolding COVID-19 pandemic, a deteriorating economy, and skyrocketing unemployment. An oil price war initiated between Saudi Arabia and Russia only made matters worse. From its peak in mid-February 2020, the S&P 500® Index declined (33.79)% over the span of a few weeks, halting the eleven-year equity bull market. In response to the crisis, global central banks and governments were quick to flood the market with massive fiscal and monetary stimulus which helped to stabilize the market and led to an impressive recovery in risk assets, albeit a very uneven one. So despite the volatility, the S&P 500® Index still achieved an 18.40% return for 2020 while effective COVID-19 vaccines and further government stimulus bolstered investor optimism for a brighter future in 2021.
During the year there was very wide dispersion in performance across sectors, with information technology and consumer discretionary sectors leading the market with returns of 43.88% and 33.30%, respectively. On the other hand, companies in the energy sector fell (33.69)%, and financials and real estate also produced slightly negative returns. Growth stocks significantly outperformed value stocks for the period with returns of 38.49% and 2.80% for the Russell 1000® Growth and Russell 1000® Value Indexes, respectively. Small cap stocks endured a wild ride in 2020 as the Russell 2000® Index experienced both its best quarter (fourth quarter 2020) and worst quarter (first quarter 2020) on record. For the year as a whole, small cap returns were relatively in line with the broader market as the Russell 2000® Index gained 19.96% in 2020. Outside the U.S., emerging markets outperformed developed markets with an 18.31% return for the MSCI Emerging Markets Index compared to a 7.82% return for the MSCI EAFE Index.
Interest rates fell dramatically and led to strong returns for bond investors as the U.S. Federal Reserve (the Fed) slashed short-term rates in response to the slowing economy. The 10-year Treasury yield ended the year near a historic low yield of 0.93%. The Bloomberg Barclays U.S. Aggregate Bond Index, a broad measure of U.S. bond market performance, returned 7.51% over the period. Investment grade corporate bonds rebounded from the selloff early in the year and returned 9.89% in 2020. Riskier high yield bonds lagged the investment grade market with a 7.11% return as measured by the return of the Bloomberg Barclays U.S. Corporate High Yield Bond Index.
AMG Funds appreciates the privilege of providing investment tools to you and your clients. Our foremost goal is to provide investment solutions that help our shareholders successfully reach their long-term investment goals. AMG Funds provides access to a distinctive array of actively managed return-oriented investment strategies. We thank you for your continued confidence and investment in AMG Funds. You can rest assured that under all market conditions our team is focused on delivering excellent investment management services for your benefit.
Respectfully,

Keitha Kinne
President
AMG Funds
| | | | | | | | | | | | | | |
| Average Annual Total Returns | | Periods ended
December 31, 2020* | |
| | | | |
| Stocks: | | | | 1 Year | | | 3 Years | | | 5 Years | |
| | | | |
Large Cap | | (S&P 500® Index) | | | 18.40 | % | | | 14.18% | | | | 15.22% | |
| | | | |
Small Cap | | (Russell 2000® Index) | | | 19.96 | % | | | 10.25% | | | | 13.26% | |
| | | | |
International | | (MSCI All Country World Index ex USA) | | | 10.65 | % | | | 4.88% | | | | 8.93% | |
| Bonds: | | | | | | | | | | | |
| | | | |
Investment Grade | | (Bloomberg Barclays U.S. Aggregate Bond Index) | | | 7.51 | % | | | 5.34% | | | | 4.44% | |
| | | | |
High Yield | | (Bloomberg Barclays U.S. Corporate High Yield Bond Index) | | | 7.11 | % | | | 6.24% | | | | 8.59% | |
| | | | |
Tax-exempt | | (Bloomberg Barclays Municipal Bond Index) | | | 5.21 | % | | | 4.64% | | | | 3.91% | |
| | | | |
Treasury Bills | | (ICE BofAML U.S. 6-Month Treasury Bill Index) | | | 1.05 | % | | | 1.84% | | | | 1.43% | |
*Source: FactSet. Past performance is no guarantee of future results.
2
|
About Your Fund’s Expenses |
| | | | | | | | |
As a shareholder of a Fund, you may incur two types of costs: (1) transaction costs, which may include sales charges (loads) on purchase payments; redemption fees; and exchange fees; and (2) ongoing costs, including management fees; distribution (12b-1) fees; and other Fund expenses. This example is intended to help you understand your ongoing costs (in dollars) of investing in the Fund and to compare these costs with the ongoing costs of investing in other mutual funds. The example is based on $1,000 invested at the beginning of the period and held for the entire period as indicated below. ACTUAL EXPENSES The first line of the following table provides information about the actual account values and | | | | actual expenses. You may use the information in this line, together with the amount you invested, to estimate the expenses that you paid over the period. Simply divide your account value by $1,000 (for example, an $8,600 account value divided by $1,000 = 8.6), then multiply the result by the number in the first line under the heading entitled “Expenses Paid During Period” to estimate the expenses you paid on your account during this period. HYPOTHETICAL EXAMPLE FOR COMPARISON PURPOSES The second line of the following table provides information about hypothetical account values and hypothetical expenses based on the Fund’s actual expense ratio and an assumed annual rate of return of 5% before expenses, which is not the Fund’s | | | | actual return. The hypothetical account values and expenses may not be used to estimate the actual ending account balance or expenses you paid for the period. You may use this information to compare the ongoing costs of investing in the Fund and other funds by comparing this 5% hypothetical example with the 5% hypothetical examples that appear in the shareholder reports of other funds. Please note that the expenses shown in the table are meant to highlight your ongoing costs only and do not reflect any transactional costs, such as sales charges (loads), redemption fees, or exchange fees. Therefore, the second line of the table is useful in comparing ongoing costs only, and will not help you determine the relative total costs of owning different funds. |
| | | | | | | | |
| | | | | | | | | | | | | | | | | | | | |
| | | | |
Six Months Ended December 31, 2020 | | Expense
Ratio for
the Period | | Beginning
Account
Value
07/01/20 | | Ending
Account
Value
12/31/20 | | Expenses
Paid
During
the Period* |
AMG Managers CenterSquare Real Estate Fund | |
|
Based on Actual Fund Return | |
| | | | |
Class N | | | | 1.12 | % | | | $ | 1,000 | | | | $ | 1,093 | | | | $ | 5.89 | |
| | | | |
Class I | | | | 0.99 | % | | | $ | 1,000 | | | | $ | 1,094 | | | | $ | 5.21 | |
| | | | |
Class Z | | | | 0.87 | % | | | $ | 1,000 | | | | $ | 1,095 | | | | $ | 4.58 | |
|
Based on Hypothetical 5% Annual Return | |
| | | | |
Class N | | | | 1.12 | % | | | $ | 1,000 | | | | $ | 1,020 | | | | $ | 5.69 | |
| | | | |
Class I | | | | 0.99 | % | | | $ | 1,000 | | | | $ | 1,020 | | | | $ | 5.03 | |
| | | | |
Class Z | | | | 0.87 | % | | | $ | 1,000 | | | | $ | 1,021 | | | | $ | 4.42 | |
| * | Expenses are equal to the Fund’s annualized expense ratio multiplied by the average account value over the period, multiplied by the number of days in the most recent fiscal half-year (184), then divided by 366. | |
3
|
AMG Managers CenterSquare Real Estate Fund Portfolio Manager’s Comments (unaudited) |
| | | | | | | | |
THE YEAR IN REVIEW For the year ended December 31, 2020, AMG Managers CenterSquare Real Estate Fund (Class N shares) (the Fund) returned -2.61%, compared to -11.20% for its benchmark, the Dow Jones U.S. Select REIT Index. During the same period, the S&P 500® Index returned 18.40%. MARKET SUMMARY - 2020 The REIT market was heavily affected by the COVID-19 pandemic. REITs significantly underperformed the broader U.S. stock market. The Dow Jones Industrial Average and S&P 500 both had not only positive returns but double-digit returns (total return of 18.4% for both) compared to the -11.2% return for the Dow Jones U.S. Select REIT Index (DWRTF) and the -5% return for the FTSE Nareit All Equity REITs Index (FNER). During the first wave of the pandemic in the first quarter of 2020 the Index lost nearly a third of its value. Sectors that were especially sensitive to the economic shutdown fell tremendously. Regional malls, hotels, and shopping centers all lost half their value or more amid expectations that revenue would dry up as nonessential consumption disappeared. REIT returns bounced back in subsequent quarters as the economy partially re-opened but continued to lag broad equity markets. The announcement of three effective vaccines in November gave investors optimism that economic conditions could normalize in 2021. The fourth quarter saw REITs gain more than 12% which was at best in line with broad equity returns. This strong performance was led by the recovery of deep value stocks in Q4. However, it was not enough to make up for earlier losses. PERFORMANCE ATTRIBUTION AND POSITIONING The Fund’s outperformance relative to its benchmark was driven by sector allocation and stock selection. Stock selection was particularly strong in the hotel, | | | | infill office, and data center sectors. In the hotel sector, performance was driven by the portfolio’s overweight positions in Host Hotels & Resorts, Inc., and Ryman Hospitality Properties, Inc. In the infill office sector, our overweight positions in JBG SMITH Properties and Kilroy Realty Corp., added to relative outperformance, and in the data center sector our overweight position in out-of-benchmark position Equinix, Inc., contributed to alpha. As planned toward the end of 2019, we deliberately and methodically expanded the portfolio to include positions in some out-of-benchmark and under-represented sectors such as net lease, towers, and data centers. As part of this evolution, we initiated a new position in the cell tower sector, which was accomplished through the purchase of American Tower Corp. and Crown Castle International Corp. In 2020 we also initiated a position in SBA Communications Corp. Over the full year of 2020, towers made strong contributions to relative performance. Additionally, we continued to add weight to the portfolio’s position in the data center sector by adding to the Funds position in Equinix, Inc. We also trimmed the portfolio’s holding in a data center name Digital Realty Trust, Inc., and sold out of CyrusOne over the year. Elsewhere, we added net lease to the portfolio’s exposure through the purchase of NetSTREIT Corp, Store Capital Corp., and VEREIT Inc., and sold out of Realty Income Corp. OUTLOOK The outlook for 2021 will be defined by the effectiveness of the vaccine rollout and the most recent round of stimulus. The early part of the year | | | | will remain difficult until the vaccines are widely distributed to the global population. Many questions remain about the distribution and it will undoubtedly not occur overnight. Global economic growth will remain constrained by the pandemic in the near term. The most recent fiscal stimulus program should ease the U.S. economy across some turbulence in the immediate term, but only time will prove if it was sufficient to sustain the fragile recovery. If governments need to reimpose restrictions to keep the healthcare systems from becoming further overwhelmed, additional stimulus would be needed in our view. Monetary policy stands firmly set to support the economy to the maximum extent today. While the macroeconomic environment will be choppy and therefore demands caution, we are optimistic about the medium-term prospects for REITs and commercial real estate. The REITs market is in a strong position to both weather the recession and exploit the investment opportunities that have arisen from the dislocation. The attractiveness of well-supported dividend yields and hard real estate assets should rise in value in an uncertain world. Interest rates are likely to remain near zero for a considerable period. Yield-oriented investments like real estate should be attractive in a near zero interest rate world. This commentary reflects the viewpoints of the portfolio manager, CenterSquare Investment Management LLC, as of December 31, 2020, are not intended as a forecast or guarantee of future results, and are subject to change without notice. |
| | | | | | | | | |
4
|
AMG Managers CenterSquare Real Estate Fund Portfolio Manager’s Comments (continued) |
CUMULATIVE TOTAL RETURN PERFORMANCE
AMG Managers CenterSquare Real Estate Fund’s cumulative total return is based on the daily change in net asset value (NAV), and assumes that all dividends and distributions were reinvested. This graph compares a hypothetical $10,000 investment made in the AMG Managers CenterSquare Real Estate Fund’s Class N shares on December 31, 2010 to a $10,000 investment made in the Dow Jones U.S. Select REIT Index and S&P 500® Index for the same time period. The graph and table do not reflect the deduction of taxes that a shareholder would pay on a Fund distribution or redemption of shares. The listed returns for the Fund are net of expenses and the returns for the index exclude expenses. Total returns would have been lower had certain expenses not been reduced.
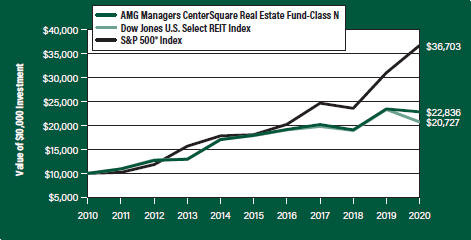
The table below shows the average annual total returns for the AMG Managers CenterSquare Real Estate Fund, Dow Jones U.S. Select REIT Index and S&P 500® Index for the same time periods ended December 31, 2020.
| | | | | | | | | | | | | | | | | | | | |
| Average Annual Total Returns1 | | One Year | | | Five
Years | | | Ten
Years | | | Since
Inception | | | Inception
Date | |
| | | | | |
AMG Managers CenterSquare | | | | | | | | | | | | | | | | | | | | |
Real Estate Fund2, 3, 4, 5, 6, 7 | | | | | | | | | | | | | | | | | | | | |
| | | | | |
Class N | | | (2.61%) | | | | 4.94% | | | | 8.61% | | | | 8.37% | | | | 12/31/97 | |
| | | | | |
Class I | | | (2.47%) | | | | – | | | | – | | | | 4.05% | | | | 02/24/17 | |
| | | | | |
Class Z | | | (2.34%) | | | | – | | | | – | | | | 4.16% | | | | 02/24/17 | |
| | | | | |
Dow Jones U.S. Select REIT Index8 | | | (11.20%) | | | | 3.00% | | | | 7.56% | | | | 8.03% | | | | 12/31/97† | |
| | | | | |
S&P 500® Index9 | | | 18.40% | | | | 15.22% | | | | 13.88% | | | | 8.08% | | | | 12/31/97† | |
The performance data shown represents past performance. Past performance is not a guarantee of future results. Current performance may be lower or higher than the performance data quoted. The investment return and principal value of an investment will fluctuate so that an investor’s shares, when redeemed, may be worth more or less than their original cost.
Investors should carefully consider the Fund’s investment objectives, risks, charges and expenses before investing. For performance information through the most recent month end, current net asset values per share for the Fund and other information, please call 800.548.4539 or visit our website at amgfunds.com for a free prospectus. Read it carefully before investing or sending money.
Distributed by AMG Distributors, Inc., member FINRA/SIPC.
| † | Date reflects the inception date of the Fund, not the index. |
| | |
| | | 1 Total return equals income yield plus share price change and assumes reinvestment of all dividends and capital gain distributions. Returns are net of fees and may reflect offsets of Fund expenses as described in the prospectus. No adjustment has been made for taxes payable by shareholders on their reinvested dividends and capital gain distributions. Returns for periods greater than one year are annualized. The listed returns on the Fund are net of expenses and based on the published NAV as of December 31, 2020. All returns are in U.S. dollars ($). 2 From time to time, the Fund’s advisor has waived its fees and/or absorbed Fund expenses, which has resulted in higher returns. 3 The Fund is subject to special risk considerations similar to those associated with the direct ownership of real estate. Real estate valuations may be subject to factors such as changing general and local economic, financial, competitive, and environmental conditions. 4 A greater percentage of the Fund’s holdings may be focused in a smaller number of securities which may place the Fund at greater risk than a more diversified fund. 5 Investing in initial public offerings (IPOs) is risky and the prices of stocks purchased in IPOs tend to fluctuate more widely than stocks of companies that have been publicly traded for a longer period of time. Stocks purchased in IPOs generally do not have a trading history, and information about the companies may be available for very limited periods. 6 Market prices of investments held by the Fund may fall rapidly or unpredictably due to a variety of economic or political factors, market conditions, disasters or public health issues, or in response to events that affect particular industries or companies. 7 Companies that are in similar businesses may be similarly affected by particular economic or market events; to the extent the Fund has substantial holdings within a particular sector, the risks associated with that sector increase. |
| | | 8 The Dow Jones U.S. Select REIT Index measures U.S. publicly traded real estate investment trusts. Unlike the Fund, the Dow Jones U.S. Select REIT Index is unmanaged, is not available for investment and does not incur expenses. |
| | | 9 The S&P 500® Index is capitalization-weighted index of 500 stocks. The S&P 500® Index is designed to measure performance of the broad domestic economy through changes in the aggregate market value of 500 stocks representing all major industries. Unlike the Fund, the S&P 500® Index is unmanaged, is not available for investment and does not incur expenses. |
5
|
AMG Managers CenterSquare Real Estate Fund Portfolio Manager’s Comments (continued) |
| | | | | | | | |
The Dow Jones U.S. Select REIT Index is proprietary data of Standard & Poor’s Dow Jones Indices LLC, a division of McGraw-Hill Companies, Inc. All rights reserved. | | | | The S&P 500® Index is proprietary data of Standard & Poor’s, a division of McGraw-Hill Companies, Inc. All rights reserved. | | | | Not FDIC insured, nor bank guaranteed. May lose value. |
6
|
AMG Managers CenterSquare Real Estate Fund Fund Snapshots (unaudited) December 31, 2020 |
PORTFOLIO BREAKDOWN
| | |
| Sector | | %of
Net Assets |
Diversified | | 35.7 |
| | |
Apartments | | 16.9 |
| | |
Warehouse/Industrials | | 9.9 |
| | |
Health Care | | 9.4 |
| | |
Office Property | | 9.3 |
| | |
Shopping Centers | | 7.6 |
| | |
Storage | | 4.6 |
| | |
Hotels | | 2.7 |
| | |
Manufactured Homes | | 2.7 |
| | |
Regional Malls | | 0.7 |
| | |
Short-Term Investments | | 0.1 |
| | |
Other Assets Less Liabilities | | 0.4 |
TOP TEN HOLDINGS
| | |
| Security Name | | %of
Net Assets |
American Tower Corp. | | 8.8 |
| | |
Equinix, Inc. | | 6.4 |
| | |
Prologis, Inc. | | 5.4 |
| | |
Crown Castle International Corp. | | 5.1 |
| | |
Invitation Homes, Inc. | | 4.6 |
| | |
SBA Communications Corp. | | 4.0 |
| | |
Welltower, Inc. | | 3.6 |
| | |
UDR, Inc. | | 3.5 |
| | |
Life Storage, Inc. | | 3.2 |
| | |
Healthpeak Properties, Inc. | | 2.8 |
| | | |
| | |
Top Ten as a Group | | 47.4 |
| | |
Because a fund’s strategy may result in multiple investments in particular sectors of the economy, its performance may depend on the performance of those sectors and may fluctuate more widely than investments diversified across more sectors. For additional information on these and other risk considerations, please see the Fund’s prospectus.
Any sectors, industries, or securities discussed should not be perceived as investment recommendations. Mention of a specific security should not be considered a recommendation to buy or solicitation to sell that security. Specific securities mentioned in this report may have been sold from the Fund’s portfolio of investments by the time you receive this report.
7
|
AMG Managers CenterSquare Real Estate Fund Schedule of Portfolio Investments December 31, 2020 |
| | | | | | | | |
| | | Shares | | | Value | |
| | |
REITs - 99.5% | | | | | | | | |
| | |
Apartments - 16.9% | | | | | | | | |
| | |
American Campus Communities, Inc. | | | 35,030 | | | | $1,498,233 | |
| | |
American Homes 4 Rent, Class A | | | 36,170 | | | | 1,085,100 | |
| | |
Equity Residential | | | 59,910 | | | | 3,551,465 | |
| | |
Essex Property Trust, Inc. | | | 12,713 | | | | 3,018,320 | |
| | |
Invitation Homes, Inc. | | | 216,400 | | | | 6,427,080 | |
| | |
Mid-America Apartment Communities, Inc. | | | 27,020 | | | | 3,423,164 | |
| | |
UDR, Inc. | | | 127,440 | | | | 4,897,519 | |
| | |
Total Apartments | | | | | | | 23,900,881 | |
| | |
Diversified - 35.7% | | | | | | | | |
| | |
American Tower Corp. | | | 55,260 | | | | 12,403,660 | |
| | |
Broadstone Net Lease, Inc., Class A | | | 89,280 | | | | 1,748,102 | |
| | |
Crown Castle International Corp. | | | 45,060 | | | | 7,173,101 | |
| | |
Digital Realty Trust, Inc. | | | 27,760 | | | | 3,872,798 | |
| | |
Duke Realty Corp. | | | 74,130 | | | | 2,962,976 | |
| | |
Equinix, Inc. | | | 12,700 | | | | 9,070,086 | |
| | |
Gaming and Leisure Properties, Inc. | | | 36,518 | | | | 1,548,363 | |
| | |
Outfront Media, Inc. | | | 49,580 | | | | 969,785 | |
| | |
SBA Communications Corp. | | | 20,160 | | | | 5,687,741 | |
| | |
STORE Capital Corp. | | | 38,950 | | | | 1,323,521 | |
| | |
Weyerhaeuser Co. | | | 106,160 | | | | 3,559,545 | |
| | |
Total Diversified | | | | | | | 50,319,678 | |
| | |
Health Care - 9.4% | | | | | | | | |
| | |
Diversified Healthcare Trust | | | 15,078 | | | | 62,121 | |
| | |
Healthpeak Properties, Inc. | | | 128,940 | | | | 3,897,856 | |
| | |
Medical Properties Trust, Inc. | | | 108,630 | | | | 2,367,048 | |
| | |
Sabra Health Care, Inc. | | | 50,000 | | | | 868,500 | |
| | |
Ventas, Inc. | | | 20,939 | | | | 1,026,848 | |
| | |
Welltower, Inc. | | | 78,180 | | | | 5,051,992 | |
| | |
Total Health Care | | | | | | | 13,274,365 | |
| | |
Hotels - 2.7% | | | | | | | | |
| | |
Apple Hospitality, Inc. | | | 69,860 | | | | 901,892 | |
| | |
Host Hotels & Resorts, Inc. | | | 123,030 | | | | 1,799,929 | |
| | |
Ryman Hospitality Properties, Inc. | | | 16,080 | | | | 1,089,581 | |
| | |
Total Hotels | | | | | | | 3,791,402 | |
| | |
Manufactured Homes - 2.7% | | | | | | | | |
| | |
Equity LifeStyle Properties, Inc. | | | 20,230 | | | | 1,281,773 | |
| | |
Sun Communities, Inc. | | | 16,840 | | | | 2,558,838 | |
| | |
Total Manufactured Homes | | | | | | | 3,840,611 | |
| | |
Office Property - 9.3% | | | | | | | | |
| | |
American Assets Trust, Inc. | | | 60,470 | | | | 1,746,373 | |
| | |
Columbia Property Trust, Inc. | | | 45,302 | | | | 649,631 | |
| | |
| | | | | | | | |
| | | | | | | | |
| | |
| | | | Shares | | | | Value | |
| | |
Cousins Properties, Inc. | | | 78,588 | | | | $2,632,698 | |
| | |
Douglas Emmett, Inc. | | | 28,890 | | | | 843,010 | |
| | |
Empire State Realty Trust, Inc., Class A | | | 3,574 | | | | 33,310 | |
| | |
JBG SMITH Properties | | | 71,870 | | | | 2,247,375 | |
| | |
Kilroy Realty Corp. | | | 30,761 | | | | 1,765,681 | |
| | |
VEREIT, Inc. | | | 76,322 | | | | 2,884,208 | |
| | |
Vornado Realty Trust | | | 8,440 | | | | 315,150 | |
| | |
Total Office Property | | | | | | | 13,117,436 | |
| | |
Regional Malls - 0.7% | | | | | | | | |
| | |
Simon Property Group, Inc. | | | 11,660 | | | | 994,365 | |
| | |
Shopping Centers - 7.6% | | | | | | | | |
| | |
Agree Realty Corp. | | | 47,700 | | | | 3,175,866 | |
| | |
Brixmor Property Group, Inc. | | | 121,300 | | | | 2,007,515 | |
| | |
NETSTREIT Corp. | | | 42,480 | | | | 827,935 | |
| | |
Regency Centers Corp. | | | 20,882 | | | | 952,011 | |
| | |
Retail Opportunity Investments Corp. | | | 54,385 | | | | 728,215 | |
| | |
Retail Properties of America, Inc., Class A | | | 207,631 | | | | 1,777,321 | |
| | |
RPT Realty | | | 20,090 | | | | 173,779 | |
| | |
Weingarten Realty | | | | | | | | |
| | |
Investors | | | 50,390 | | | | 1,091,951 | |
| | |
Total Shopping Centers | | | | | | | 10,734,593 | |
| | |
Storage - 4.6% | | | | | | | | |
| | |
Life Storage, Inc. | | | 37,680 | | | | 4,498,615 | |
| | |
Public Storage | | | 8,520 | | | | 1,967,524 | |
| | |
Total Storage | | | | | | | 6,466,139 | |
| | |
Warehouse/Industrials - 9.9% | | | | | | | | |
| | |
Americold Realty Trust | | | 65,070 | | | | 2,429,063 | |
| | |
First Industrial Realty Trust, Inc. | | | 59,600 | | | | 2,510,948 | |
| | |
Prologis, Inc. | | | 77,120 | | | | 7,685,779 | |
| | |
Rexford Industrial Realty, Inc. | | | 27,200 | | | | 1,335,792 | |
| | |
Total Warehouse/Industrials | | | | | | | 13,961,582 | |
| | |
Total REITs
(Cost $123,143,664) | | | | | | | 140,401,052 | |
| | |
Short-Term Investments - 0.1% | | | | | | | | |
| | |
Other Investment Companies - 0.1% | | | | | | | | |
| | |
Dreyfus Government Cash Management Fund, Institutional Shares, 0.03%1 | | | 28,831 | | | | 28,831 | |
| | |
Dreyfus Institutional Preferred Government Money Market Fund, Institutional Shares, 0.03%1 | | | 28,831 | | | | 28,831 | |
| | |
JPMorgan U.S. Government Money Market Fund, IM Shares, 0.03%1 | | | 29,704 | | | | 29,704 | |
| | |
Total Short-Term Investments
(Cost $87,366) | | | | | | | 87,366 | |
| | |
| | | | | | | | |
The accompanying notes are an integral part of these financial statements.
8
|
AMG Managers CenterSquare Real Estate Fund Schedule of Portfolio Investments (continued) |
| | | | |
| | | Value | |
| |
Total Investments - 99.6%
(Cost $123,231,030) | | $ | 140,488,418 | |
| |
Other Assets, less Liabilities - 0.4% | | | 565,865 | |
| |
Net Assets - 100.0% | | $ | 141,054,283 | |
| |
| | | | |
| 1 | Yield shown represents the December 31, 2020, seven day average yield, which refers to the sum of the previous seven days’ dividends paid, expressed as an annual percentage. |
REITs Real Estate Investment Trusts
The following table summarizes the inputs used to value the Fund’s investments by the fair value hierarchy levels as of December 31, 2020:
| | | | | | | | | | | | | | | | |
| | | Level 1 | | | Level 2 | | | Level 3 | | | Total | |
| | | | |
Investments in Securities | | | | | | | | | | | | | | | | |
| | | | |
REITs† | | $ | 140,401,052 | | | | — | | | | — | | | $ | 140,401,052 | |
| | | | |
Short-Term Investments | | | | | | | | | | | | | | | | |
| | | | |
Other Investment Companies | | | 87,366 | | | | — | | | | — | | | | 87,366 | |
| | | | | | | | | | | | | | | | |
| | | | |
Total Investments in Securities | | $ | 140,488,418 | | | | — | | | | — | | | $ | 140,488,418 | |
| | | | | | | | | | | | | | | | |
| † | All REITs held in the Fund are Level 1 securities. For a detailed breakout of REITs by major industry classification, please refer to the Fund’s Schedule of Portfolio Investments. |
For the fiscal year ended December 31, 2020, there were no transfers in or out of Level 3.
The accompanying notes are an integral part of these financial statements.
9
|
Statement of Assets and Liabilities December 31, 2020 |
| | | | | |
| | | AMG Managers
CenterSquare
Real
Estate Fund |
| |
Assets: | | | | | |
| |
Investments at value1 | | | $ | 140,488,418 | |
| |
Receivable for investments sold | | | | 440,696 | |
| |
Dividend and interest receivables | | | | 469,773 | |
| |
Receivable for Fund shares sold | | | | 116,135 | |
| |
Prepaid expenses and other assets | | | | 15,736 | |
| |
Total assets | | | | 141,530,758 | |
| |
Liabilities: | | | | | |
| |
Payable for Fund shares repurchased | | | | 275,220 | |
| |
Accrued expenses: | | | | | |
| |
Investment advisory and management fees | | | | 79,123 | |
| |
Administrative fees | | | | 17,744 | |
| |
Shareholder service fees | | | | 26,031 | |
| |
Other | | | | 78,357 | |
| |
Total liabilities | | | | 476,475 | |
| |
| | | | | |
| |
Net Assets | | | $ | 141,054,283 | |
| |
1 Investments at cost | | | $ | 123,231,030 | |
The accompanying notes are an integral part of these financial statements.
10
|
Statement of Assets and Liabilities (continued) |
| | | | |
| | | AMG Managers
CenterSquare
Real
Estate Fund | |
| |
Net Assets Represent: | | | | |
| |
Paid-in capital | | | $139,995,726 | |
| |
Total distributable earnings | | | 1,058,557 | |
| |
Net Assets | | | $141,054,283 | |
| |
Class N: | | | | |
| |
Net Assets | | | $90,167,201 | |
| |
Shares outstanding | | | 8,576,880 | |
| |
Net asset value, offering and redemption price per share | | | $10.51 | |
| |
Class I: | | | | |
| |
Net Assets | | | $50,587,135 | |
| |
Shares outstanding | | | 4,812,730 | |
| |
Net asset value, offering and redemption price per share | | | $10.51 | |
| |
Class Z: | | | | |
| |
Net Assets | | | $299,947 | |
| |
Shares outstanding | | | 28,527 | |
| |
Net asset value, offering and redemption price per share | | | $10.51 | |
The accompanying notes are an integral part of these financial statements.
11
|
Statements of Operations For the fiscal year ended December 31, 2020 |
| | | | | |
| | | AMG Managers
CenterSquare
Real
Estate Fund |
| |
Investment Income: | | | | | |
| |
Dividend income | | | | $3,571,876 | |
| |
Total investment income | | | | 3,571,876 | |
| |
Expenses: | | | | | |
| |
Investment advisory and management fees | | | | 982,532 | |
| |
Administrative fees | | | | 245,633 | |
| |
Shareholder servicing fees - Class N | | | | 267,636 | |
| |
Shareholder servicing fees - Class I | | | | 59,906 | |
| |
Reports to shareholders | | | | 73,040 | |
| |
Registration fees | | | | 50,332 | |
| |
Professional fees | | | | 44,591 | |
| |
Custodian fees | | | | 38,497 | |
| |
Trustee fees and expenses | | | | 14,313 | |
| |
Transfer agent fees | | | | 13,961 | |
| |
Miscellaneous | | | | 11,104 | |
| |
Total expenses before offsets | | | | 1,801,545 | |
| |
Expense reimbursements | | | | (46,645 | ) |
| |
Expense reductions | | | | (11,583 | ) |
| |
Net expenses | | | | 1,743,317 | |
| |
| | | | | |
| |
Net investment income | | | | 1,828,559 | |
| |
Net Realized and Unrealized Loss: | | | | | |
| |
Net realized loss on investments | | | | (14,812,568 | ) |
| |
Net change in unrealized appreciation/depreciation on investments | | | | (102,911 | ) |
| |
Net realized and unrealized loss | | | | (14,915,479 | ) |
| |
| | | | | |
| |
Net decrease in net assets resulting from operations | | | $ | (13,086,920 | ) |
The accompanying notes are an integral part of these financial statements.
12
|
Statements of Changes in Net Assets For the fiscal years ended December 31, |
| | | | | | | | |
| | | AMG Managers CenterSquare
Real Estate Fund | |
| | |
| | | 2020 | | | 2019 | |
Increase (Decrease) in Net Assets Resulting From Operations: | | | | | | | | |
| | |
Net investment income | | | $1,828,559 | | | | $4,002,626 | |
| | |
Net realized gain (loss) on investments | | | (14,812,568 | ) | | | 16,334,885 | |
| | |
Net change in unrealized appreciation/depreciation on investments | | | (102,911 | ) | | | 29,053,138 | |
| | |
Net increase (decrease) in net assets resulting from operations | | | (13,086,920 | ) | | | 49,390,649 | |
| | |
Distributions to Shareholders: | | | | | | | | |
| | |
From net investment income and/or realized gain on investments: | | | | | | | | |
| | |
Class N | | | (1,282,007 | ) | | | (10,181,489 | ) |
| | |
Class I | | | (621,810 | ) | | | (3,578,899 | ) |
| | |
Class Z | | | (122,598 | ) | | | (367,261 | ) |
| | |
From paid-in capital: | | | | | | | | |
| | |
Class N | | | (929,911 | ) | | | — | |
| | |
Class I | | | (451,033 | ) | | | — | |
| | |
Class Z | | | (88,927 | ) | | | — | |
| | |
Total distributions to shareholders | | | (3,496,286 | ) | | | (14,127,649 | ) |
| | |
Capital Share Transactions:1 | | | | | | | | |
| | |
Net decrease from capital share transactions | | | (71,175,043 | ) | | | (31,008,458 | ) |
| | |
| | | | | | | | |
| | |
Total increase (decrease) in net assets | | | (87,758,249 | ) | | | 4,254,542 | |
| | |
Net Assets: | | | | | | | | |
| | |
Beginning of year | | | 228,812,532 | | | | 224,557,990 | |
| | |
End of year | | | $141,054,283 | | | | $228,812,532 | |
| 1 | See Note 1(g) of the Notes to Financial Statements. |
The accompanying notes are an integral part of these financial statements.
13
|
AMG Managers CenterSquare Real Estate Fund Financial Highlights For a share outstanding throughout each fiscal period |
| | | | | | | | | | | | | | | | | | | | | | | | |
| | | For the fiscal years ended December 31, | | For the fiscal
period ended
December 31, | | For the fiscal years
ended October 31, |
| | | | | | |
| Class N | | 2020 | | 2019 | | 2018 | | 20171 | | 20172 | | 20163 | |
| | | | | | |
Net Asset Value, Beginning of Period | | | $11.04 | | | | $9.56 | | | | $10.43 | | | | $11.02 | | | | $11.68 | | | | $12.34 | |
| | | | | | |
Income (loss) from Investment Operations: | | | | | | | | | | | | | | | | | | | | | | | | |
| | | | | | |
Net investment income4,5 | | | 0.11 | | | | 0.18 | | | | 0.15 | | | | 0.09 | 6 | | | 0.10 | | | | 0.22 | 7 |
| | | | | | |
Net realized and unrealized gain (loss) on investments | | | (0.42 | ) | | | 1.99 | | | | (0.73 | ) | | | 0.34 | | | | 0.42 | | | | 0.40 | |
| | | | | | |
Total income (loss) from investment operations | | | (0.31 | ) | | | 2.17 | | | | (0.58 | ) | | | 0.43 | | | | 0.52 | | | | 0.62 | |
| | | | | | |
Less Distributions to Shareholders from: | | | | | | | | | | | | | | | | | | | | | | | | |
| | | | | | |
Net investment income | | | (0.13 | ) | | | (0.21 | ) | | | (0.19 | ) | | | (0.06 | ) | | | (0.21 | ) | | | (0.15 | ) |
| | | | | | |
Net realized gain on investments | | | — | | | | (0.48 | ) | | | (0.07 | ) | | | (0.96 | ) | | | (0.97 | ) | | | (1.13 | ) |
| | | | | | |
Paid in capital | | | (0.09 | ) | | | — | | | | (0.03 | ) | | | — | | | | — | | | | — | |
| | | | | | |
Total distributions to shareholders | | | (0.22 | ) | | | (0.69 | ) | | | (0.29 | ) | | | (1.02 | ) | | | (1.18 | ) | | | (1.28 | ) |
| | | | | | |
Net Asset Value, End of Period | | | $10.51 | | | | $11.04 | | | | $9.56 | | | | $10.43 | | | | $11.02 | | | | $11.68 | |
| | | | | | |
Total Return5,8 | | | (2.61 | )% | | | 22.90 | % | | | (5.55 | )% | | | 3.95 | %9 | | | 4.75 | % | | | 5.33 | % |
| | | | | | |
Ratio of net expenses to average net assets10 | | | 1.11 | % | | | 1.10 | % | | | 1.11 | % | | | 1.04 | %11 | | | 1.08 | % | | | 1.15 | % |
| | | | | | |
Ratio of gross expenses to average net assets12 | | | 1.15 | % | | | 1.10 | % | | | 1.12 | % | | | 1.06 | %11,13 | | | 1.09 | % | | | 1.16 | % |
| | | | | | |
Ratio of net investment income to average net assets5 | | | 1.07 | % | | | 1.62 | % | | | 1.50 | % | | | 3.61 | %11 | | | 0.91 | % | | | 1.88 | % |
| | | | | | |
Portfolio turnover | | | 131 | % | | | 76 | % | | | 57 | % | | | 13 | %9 | | | 71 | % | | | 65 | % |
| | | | | | |
Net assets end of period (000’s) omitted | | $ | 90,167 | | | $ | 166,047 | | | $ | 169,546 | | | $ | 235,690 | | | $ | 243,684 | | | $ | 422,106 | |
| | | | | | | | | | | | | | | | | | | | | | | | |
14
|
AMG Managers CenterSquare Real Estate Fund Financial Highlights For a share outstanding throughout each fiscal period |
| | | | | | | | | | | | | | | | | | | | | | | | | |
| | | For the fiscal years ended December 31, | | For the fiscal period
ended December 31, | | For the fiscal period
ended October 31, |
| | | | | |
| Class I | | 2020 | | 2019 | | 2018 | | 20171 | | 201714 |
| | | | | |
Net Asset Value, Beginning of Period | | | | $11.04 | | | | | $9.56 | | | | | $10.43 | | | | | $11.02 | | | | | $11.22 | |
| | | | | |
Income (loss) from Investment Operations: | | | | | | | | | | | | | | | | | | | | | | | | | |
| | | | | |
Net investment income4,5 | | | | 0.12 | | | | | 0.19 | | | | | 0.17 | | | | | 0.09 | 6 | | | | 0.11 | |
| | | | | |
Net realized and unrealized gain (loss) on investments | | | | (0.42 | ) | | | | 1.99 | | | | | (0.73 | ) | | | | 0.34 | | | | | (0.26 | ) |
| | | | | |
Total income (loss) from investment operations | | | | (0.30 | ) | | | | 2.18 | | | | | (0.56 | ) | | | | 0.43 | | | | | (0.15 | ) |
| | | | | |
Less Distributions to Shareholders from: | | | | | | | | | | | | | | | | | | | | | | | | | |
| | | | | |
Net investment income | | | | (0.13 | ) | | | | (0.22 | ) | | | | (0.21 | ) | | | | (0.06 | ) | | | | (0.05 | ) |
| | | | | |
Net realized gain on investments | | | | — | | | | | (0.48 | ) | | | | (0.07 | ) | | | | (0.96 | ) | | | | — | |
| | | | | |
Paid in capital | | | | (0.10 | ) | | | | — | | | | | (0.03 | ) | | | | — | | | | | — | |
| | | | | |
Total distributions to shareholders | | | | (0.23 | ) | | | | (0.70 | ) | | | | (0.31 | ) | | | | (1.02 | ) | | | | (0.05 | ) |
| | | | | |
Net Asset Value, End of Period | | | | $10.51 | | | | | $11.04 | | | | | $9.56 | | | | | $10.43 | | | | | $11.02 | |
| | | | | |
Total Return5,8 | | | | (2.47 | )% | | | | 23.06 | % | | | | (5.40 | )% | | | | 3.97 | %9 | | | | (1.30 | )%9 |
| | | | | |
Ratio of net expenses to average net assets15 | | | | 0.98 | % | | | | 0.97 | % | | | | 0.98 | % | | | | 0.90 | %11 | | | | 0.94 | %11 |
| | | | | |
Ratio of gross expenses to average net assets12 | | | | 1.02 | % | | | | 0.97 | % | | | | 0.99 | % | | | | 0.92 | %11,13 | | | | 0.95 | %11 |
| | | | | |
Ratio of net investment income to average net assets5 | | | | 1.19 | % | | | | 1.75 | % | | | | 1.64 | % | | | | 3.75 | %11 | | | | 1.46 | %11 |
| | | | | |
Portfolio turnover | | | | 131 | % | | | | 76 | % | | | | 57 | % | | | | 13 | %9 | | | | 71 | %9 |
| | | | | |
Net assets end of period (000’s) omitted | | | $ | 50,587 | | | | $ | 56,324 | | | | $ | 54,734 | | | | $ | 58,716 | | | | $ | 57,902 | |
| | | | | | | | | | | | | | | | | | | | | | | | | | |
15
|
AMG Managers CenterSquare Real Estate Fund Financial Highlights For a share outstanding throughout each fiscal period |
| | | | | | | | | | | | | | | | | | | | | | | | | |
| | | For the fiscal years ended December 31, | | For the fiscal period
ended December 31, | | For the fiscal period
ended October 31, |
| | | | | |
| Class Z | | 2020 | | 2019 | | 2018 | | 20171 | | 201714 |
| | | | | |
Net Asset Value, Beginning of Period | | | | $11.04 | | | | | $9.56 | | | | | $10.43 | | | | | $11.02 | | | | | $11.22 | |
| | | | | |
Income (loss) from Investment Operations: | | | | | | | | | | | | | | | | | | | | | | | | | |
| | | | | |
Net investment income4,5 | | | | 0.13 | | | | | 0.21 | | | | | 0.18 | | | | | 0.09 | 6 | | | | 0.12 | |
| | | | | |
Net realized and unrealized gain (loss) on investments | | | | (0.42 | ) | | | | 1.99 | | | | | (0.73 | ) | | | | 0.34 | | | | | (0.26 | ) |
| | | | | |
Total income (loss) from investment operations | | | | (0.29 | ) | | | | 2.20 | | | | | (0.55 | ) | | | | 0.43 | | | | | (0.14 | ) |
| | | | | |
Less Distributions to Shareholders from: | | | | | | | | | | | | | | | | | | | | | | | | | |
| | | | | |
Net investment income | | | | (0.14 | ) | | | | (0.24 | ) | | | | (0.22 | ) | | | | (0.06 | ) | | | | (0.06 | ) |
| | | | | |
Net realized gain on investments | | | | — | | | | | (0.48 | ) | | | | (0.07 | ) | | | | (0.96 | ) | | | | — | |
| | | | | |
Paid in capital | | | | (0.10 | ) | | | | — | | | | | (0.03 | ) | | | | — | | | | | — | |
| | | | | |
Total distributions to shareholders | | | | (0.24 | ) | | | | (0.72 | ) | | | | (0.32 | ) | | | | (1.02 | ) | | | | (0.06 | ) |
| | | | | |
Net Asset Value, End of Period | | | | $10.51 | | | | | $11.04 | | | | | $9.56 | | | | | $10.43 | | | | | $11.02 | |
| | | | | |
Total Return5,8 | | | | (2.34 | )% | | | | 23.21 | % | | | | (5.30 | )% | | | | 4.00 | %9 | | | | (1.27 | )%9 |
| | | | | |
Ratio of net expenses to average net assets15 | | | | 0.86 | % | | | | 0.85 | % | | | | 0.86 | % | | | | 0.79 | %11 | | | | 0.83 | %11 |
| | | | | |
Ratio of gross expenses to average net assets12 | | | | 0.90 | % | | | | 0.85 | % | | | | 0.87 | % | | | | 0.81 | %11,13 | | | | 0.84 | %11 |
| | | | | |
Ratio of net investment income to average net assets5 | | | | 1.32 | % | | | | 1.87 | % | | | | 1.75 | % | | | | 3.86 | %11 | | | | 1.57 | %11 |
| | | | | |
Portfolio turnover | | | | 131 | % | | | | 76 | % | | | | 57 | % | | | | 13 | %9 | | | | 71 | %9 |
| | | | | |
Net assets end of period (000’s) omitted | | | | $300 | | | | | $6,441 | | | | | $278 | | | | | $149 | | | | | $143 | |
| | | | | | | | | | | | | | | | | | | | | | | | | | |
| 1 | The Fund changed its fiscal year end from October 31 to December 31. |
| 2 | Effective February 27, 2017, Class S was renamed Class N. |
| 3 | Effective October 1, 2016, the shares were reclassified and redesignated as Class S shares. |
| 4 | Per share numbers have been calculated using average shares. |
| 5 | Total returns and net investment income would have been lower had certain expenses not been offset. |
| 6 | Includes non-recurring dividends. Without these dividends, net investment income per share would have been $0.08, $0.08 and $0.08 for Class N, Class I, and Class Z, respectively. |
| 7 | Includes non-recurring dividends. Without these dividends, net investment income per share would have been $0.12 for Class N shares. |
| 8 | The total return is calculated using the published Net Asset Value as of fiscal year end. |
| 10 | Includes reduction from broker recapture amounting to less than 0.01% for the fiscal years ended December 31, 2020, and 2019, 0.01% for the fiscal year ended December 31, 2018, less than 0.01% for the period ended December 31, 2017, and 0.01% and 0.01% for the fiscal years ended October 31, 2017 and 2016, respectively. |
| 12 | Excludes the impact of expense reimbursement or fee waivers and expense reductions such as brokerage credits, but includes expense repayments and non-reimbursable expenses, if any, such as interest, taxes, and extraordinary expenses. (See Note 1(c) and 2 in the Notes to Financial Statements.) |
| 13 | Ratio does not reflect the annualization of audit, printing and registration expenses. |
| 14 | Commencement of operations was on February 27, 2017. |
| 15 | Includes reduction from broker recapture amounting to 0.01% for the fiscal year ended December 31, 2020, less than 0.01% for the fiscal year ended 2019, 0.01% for the fiscal year ended December 31, 2018, less than 0.01% for the period ended December 31, 2017, and 0.01% for the period ended October 31, 2017. |
16
|
Notes to Financial Statements December 31, 2020 |
1. ORGANIZATION AND SUMMARY OF SIGNIFICANT ACCOUNTING POLICIES
AMG Funds I (the “Trust”) is an open-end management investment company, organized as a Massachusetts business trust, and registered under the Investment Company Act of 1940, as amended (the “1940 Act”). Currently, the Trust consists of a number of different funds, each having distinct investment management objectives, strategies, risks, and policies. Included in this report is the AMG Managers CenterSquare Real Estate Fund (the “Fund”).
The Fund offers Class N, Class I, and Class Z shares. Each class represents an interest in the same assets of the Fund. Although all share classes generally have identical voting rights, each share class votes separately when required by law. Different share classes may have different net asset values per share to the extent the share classes pay different distribution amounts and/or the expenses of such share classes differ. Each share class has its own expense structure. Please refer to a current prospectus for additional information on each share class.
The Fund is non-diversified. A greater percentage of the Fund’s holdings may be focused in a smaller number of securities which may place the Fund at greater risk than a more diversified fund.
Market disruptions associated with the COVID-19 pandemic have had a global impact, and uncertainty exists as to the long-term implications. Such disruptions can adversely affect assets of the Fund and thus Fund performance.
The Fund’s financial statements are prepared in accordance with accounting principles generally accepted in the United States of America (“U.S. GAAP”), including accounting and reporting guidance pursuant to Accounting Standards Codification Topic 946 applicable to investment companies. U.S. GAAP requires management to make estimates and assumptions that affect the reported amounts of assets and liabilities and disclosure of contingent assets and liabilities at the date of the financial statements and the reported amounts of income and expenses during the reporting period. Actual results could differ from those estimates and such differences could be material. The following is a summary of significant accounting policies followed by the Fund in the preparation of its financial statements:
a. VALUATION OF INVESTMENTS
Equity securities, including Real Estate Investment Trusts (“REITS”), traded on a national securities exchange or reported on the NASDAQ national market system (“NMS”) are valued at the last quoted sales price on the primary exchange or, if applicable, the NASDAQ official closing price or the official closing price of the relevant exchange or, lacking any sales, at the last quoted bid price or the mean between the last quoted bid and ask prices (the “mean price”). Equity securities traded in the over-the-counter market (other than NMS securities) are valued at the mean price. Foreign equity securities (securities principally traded in markets other than U.S. markets) are valued at the official closing price on the primary exchange or, for markets that either do not offer an official closing price or where the official closing price may not be representative of the overall market, the last quoted sale price.
Fixed income securities purchased with a remaining maturity of 60 days or less are valued at amortized cost, provided that the amortized cost value is approximately the same as the fair value of the security valued without the use of amortized cost. Investments in other open-end registered investment companies are valued at their end of day net asset value per share.
The Fund’s portfolio investments are generally valued based on independent market quotations or prices or, if none, “evaluative” or other market based valuations provided by third party pricing services approved by the Board of Trustees of the Trust (the “Board”). Under certain circumstances, the value of certain Fund portfolio investments may be based on an evaluation of fair value, pursuant to procedures established by and under the general supervision of the Board. The Valuation Committee, which is comprised of the Independent Trustees of the Board, and the Pricing Committee, which is comprised of representatives from AMG Funds LLC (the “Investment Manager”) are the committees appointed by the Board to make fair value determinations. The Fund may use the fair value of a portfolio investment to calculate its net asset value (“NAV”) in the event that the market quotation, price or market based valuation for the portfolio investment is not readily available or otherwise not determinable pursuant to the Board’s valuation procedures, if the Investment Manager or the Pricing Committee believes the quotation, price or market based valuation to be unreliable, or in certain other circumstances. When determining the fair value of an investment, the Pricing Committee and, if required under the Trust’s securities valuation procedures, the Valuation Committee, seeks to determine the price that the Fund might reasonably expect to receive from current sale of that portfolio investment in an arms-length transaction. Fair value determinations shall be based upon consideration of all available facts and information, including, but not limited to (i) attributes specific to the investment; (ii) fundamental and analytical data relating to the investment; and (iii) the value of other comparable securities or relevant financial instruments, including derivative securities, traded on other markets or among dealers.
The values assigned to fair value portfolio investments are based on available information and do not necessarily represent amounts that might ultimately be realized in the future, since such amounts depend on future developments inherent in long-term investments. Because of the inherent uncertainty of valuation, those estimated values may differ significantly from the values that would have been used had a ready market for the investments existed, and the differences could be material. The Board will be presented with a quarterly report showing as of the most recent quarter end, all outstanding securities fair valued by the Fund, including a comparison with the prior quarter end and the percentage of the Fund that the security represents at each quarter end.
With respect to foreign equity securities and certain foreign fixed income securities, the Board has adopted a policy that securities held in the Fund that can be fair valued by the applicable fair value pricing service are fair valued on each business day provided that each individual price exceeds a pre-established confidence level.
U.S. GAAP defines fair value as the price that a fund would receive to sell an asset or pay to transfer a liability in an orderly transaction between market participants at the measurement date. U.S. GAAP also establishes a framework for measuring fair value, and a three level hierarchy for fair value measurements based upon the transparency of inputs to the valuation of an asset or liability. Inputs may be observable or unobservable and refer broadly to the assumptions that market participants would use in pricing the asset or liability. Observable inputs reflect the assumptions market participants would use in pricing the asset or liability based on market data obtained from sources independent of the Fund.
Unobservable inputs reflect the Fund’s own assumptions about the assumptions that market participants would use in pricing the asset or liability developed based on the best information available in the circumstances. Each investment is assigned a level based upon the observability of the inputs which are significant to the overall valuation.
The three-tier hierarchy of inputs is summarized below:
17
|
Notes to Financial Statements (continued) |
Level 1 – inputs are quoted prices in active markets for identical investments (e.g., equity securities, open-end investment companies)
Level 2 – other observable inputs (including, but not limited to: quoted prices for similar assets or liabilities in markets that are active, quoted prices for identical or similar assets or liabilities in markets that are not active, inputs other than quoted prices that are observable for the assets or liabilities (such as interest rates, yield curves, volatilities, prepayment speeds, loss severities, credit risks and default rates) or other market corroborated inputs) (e.g., debt securities, government securities, foreign currency exchange contracts, swaps, foreign securities utilizing international fair value pricing, fair valued securities with observable inputs)
Level 3 – inputs are significant unobservable inputs (including the Fund’s own assumptions used to determine the fair value of investments) (e.g., fair valued securities with unobservable inputs)
Changes in inputs or methodologies used for valuing investments may result in a transfer in or out of levels within the fair value hierarchy. The inputs or methodologies used for valuing investments may not necessarily be an indication of the risk associated with investing in those investments.
b. SECURITY TRANSACTIONS
Security transactions are accounted for as of trade date. Realized gains and losses on securities sold are determined on the basis of identified cost.
c. INVESTMENT INCOME AND EXPENSES
Dividend income is recorded on the ex-dividend date. Interest income, which includes amortization of premium and accretion of discount on debt securities, is accrued as earned. Dividend and interest income on foreign securities is recorded gross of any withholding tax. Non-cash dividends included in dividend income, if any, are reported at the fair market value of the securities received. Upon notification from issuers, distributions received from a real estate investment trust (REIT) may be redesignated as a reduction of cost of investments and/or realized gain. Other income and expenses are recorded on an accrual basis. Expenses that cannot be directly attributed to a Fund are apportioned among the funds in the Trust and other trusts or funds within the AMG Funds Family of Funds (collectively the “AMG Funds Family”) based upon their relative average net assets or number of shareholders. Investment income, realized and unrealized capital gains and losses, the common expenses of the Fund, and certain fund level expense reductions, if any, are allocated on a pro-rata basis to each class based on the relative net assets of each class to the total net assets of the Fund.
The Fund had certain portfolio trades directed to various brokers under a brokerage recapture program. Credits received from the brokerage recapture program are earned and paid on a monthly basis, and are recorded as expense offsets, which serve to reduce the Fund’s overall expense ratio. For the fiscal year ended December 31, 2020, the impact on the expenses and expense ratios was $11,583 and 0.01%.
d. DIVIDENDS AND DISTRIBUTIONS
Fund distributions resulting from net investment income, if any, are generally declared and paid quarterly in March, June, September and December. Net realized capital gains, if any, are generally declared and paid at least annually in December. Distributions to shareholders are recorded on the ex-dividend date. Distributions are determined in accordance with federal income tax regulations, which may differ from net investment income and net realized capital gains for
financial statement purposes (U.S. GAAP). Differences may be permanent or temporary. Permanent differences are reclassified among capital accounts in the financial statements to reflect their tax character. Permanent book and tax basis differences, if any, relating to shareholder distributions will result in reclassifications to paid-in capital. Temporary differences arise when certain items of income, expense and gain or loss are recognized in different periods for financial statement and tax purposes; these differences will reverse at some time in the future. Temporary differences are due to capital loss carryforwards and wash sale loss deferrals.
The tax character of distributions paid during the fiscal years ended December 31, 2020 and December 31, 2019 were as follows:
| | | | | | | | |
| | |
| Distributions paid from: | | 2020 | | | 2019 | |
| | |
Ordinary income | | | $1,828,559 | | | | $3,799,577 | |
| | |
Long-term capital gains | | | 197,856 | | | | 10,328,072 | |
| | |
Paid-in capital | | | 1,469,871 | | | | — | |
| | | | | | | | |
| | |
| | | $3,496,286 | | | | $14,127,649 | |
| | | | | | | | |
As of December 31, 2020, the components of distributable earnings (excluding unrealized appreciation/depreciation) on a tax basis consisted of:
| | | | |
| |
Capital loss carryforward | | $ | 12,387,301 | |
At December 31, 2020, the cost of investments and the aggregate gross unrealized appreciation and depreciation for federal income tax purposes were as follows:
| | | | | | | | | | | | |
| Cost | | Appreciation | | | Depreciation | | | Net Appreciation | |
$127,042,559 | | $ | 18,660,835 | | | $ | (5,214,977) | | | $ | 13,445,858 | |
e. FEDERAL TAXES
The Fund currently qualifies as an investment company and intends to comply with the requirements under Subchapter M of the Internal Revenue Code of 1986, as amended, and to distribute substantially all of its taxable income and gains to its shareholders and to meet certain diversification and income requirements with respect to investment companies. Therefore, no provision for federal income or excise tax is included in the accompanying financial statements.
Additionally, based on the Fund’s understanding of the tax rules and rates related to income, gains and transactions for the foreign jurisdictions in which it invests, the Fund will provide for foreign taxes, and where appropriate, deferred foreign taxes.
Management has analyzed the Fund’s tax positions taken on federal income tax returns as of December 31, 2020, and for all open tax years (generally, the three prior taxable years), and has concluded that no provision for federal income tax is required in the Fund’s financial statements. Additionally, Management is not aware of any tax position for which it is reasonably possible that the total amounts of unrecognized tax benefits will change materially in the next twelve months.
18
|
Notes to Financial Statements (continued) |
f. CAPITAL LOSS CARRYOVERS AND DEFERRALS
As of December 31, 2020, the Fund had capital loss carryovers for federal income tax purposes as shown in the following chart. These amounts may be used to offset future realized capital gains indefinitely, and retain their character as short-term and/or long-term.
| | | | |
| Capital Loss Carryover Amounts |
| | |
| Short-Term | | Long-Term | | Total |
| $8,965,871 | | $3,421,430 | | $12,387,301 |
g. CAPITAL STOCK
The Trust’s Declaration of Trust authorizes for the Fund the issuance of an unlimited number of shares of beneficial interest, without par value. The Fund records sales and repurchases of its capital stock on the trade date.
For the fiscal years ended December 31, 2020 and December 31, 2019, the capital stock transactions by class for the Fund were as follows:
| | | | | | | | | | | | | | | | |
| | | December 31, 2020 | | December 31, 2019 |
| | | Shares | | Amount | | | Shares | | Amount |
| | | | |
Class N: | | | | | | | | | | | | | | | | |
| | | | |
Proceeds from sale of shares | | | 1,376,004 | | | | $13,676,168 | | | | 2,197,536 | | | | $24,186,831 | |
| | | | |
Reinvestment of distributions | | | 228,665 | | | | 2,142,002 | | | | 915,577 | | | | 9,939,155 | |
| | | | |
Cost of shares repurchased | | | (8,064,072 | ) | | | (78,993,444 | ) | | | (5,810,732 | ) | | | (63,936,007 | ) |
| | | | | | | | | | | | | | | | |
Net decrease | | | (6,459,403 | ) | | | $(63,175,274) | | | | (2,697,619 | ) | | | $(29,810,021 | ) |
| | | | | | | | | | | | | | | | |
Class I: | | | | | | | | | | | | | | | | |
| | | | |
Proceeds from sale of shares | | | 2,489,237 | | | | $24,258,994 | | | | 2,126,697 | | | | $23,353,418 | |
| | | | |
Reinvestment of distributions | | | 106,296 | | | | 1,011,435 | | | | 287,030 | | | | 3,116,129 | |
| | | | |
Cost of shares repurchased | | | (2,883,258 | ) | | | (28,728,328 | ) | | | (3,038,530 | ) | | | (33,863,834 | ) |
| | | | | | | | | | | | | | | | |
Net decrease | | | (287,725 | ) | | | $(3,457,899 | ) | | | (624,803 | ) | | | $(7,394,287 | ) |
| | | | | | | | | | | | | | | | |
Class Z: | | | | | | | | | | | | | | | | |
| | | | |
Proceeds from sale of shares | | | 973,514 | | | | $10,469,675 | | | | 520,669 | | | | $5,830,924 | |
| | | | |
Reinvestment of distributions | | | 23,315 | | | | 211,525 | | | | 33,835 | | | | 367,260 | |
| | | | |
Cost of shares repurchased | | | (1,551,637 | ) | | | (15,223,070 | ) | | | (211 | ) | | | (2,334 | ) |
| | | | | | | | | | | | | | | | |
Net increase (decrease) | | | (554,808 | ) | | | $(4,541,870 | ) | | | 554,293 | | | | $6,195,850 | |
| | | | | | | | | | | | | | | | |
2. AGREEMENTS AND TRANSACTIONS WITH AFFILIATES
The Trust has entered into an investment advisory agreement under which the Investment Manager, a subsidiary and the U.S. retail distribution arm of Affiliated Managers Group, Inc. (“AMG”), serves as investment manager to the Fund and is responsible for the Fund’s overall administration and operations. The Investment Manager selects one or more subadvisers for the Fund (subject to Board approval) and monitors each subadviser’s investment performance, security holdings and investment strategies. The Fund’s investment portfolio is managed by CenterSquare Investment Management, LLC who serves pursuant to a subadvisory agreement with the Investment Manager.
Investment management fees are paid directly by the Fund to the Investment Manager based on average daily net assets. For the fiscal year ended December 31, 2020, the Fund paid an investment management fee at the annual rate of 0.60% of average daily net assets of the Fund.
The Investment Manager has contractually agreed, through at least May 1, 2021, to waive management fees and/or pay or reimburse fund expenses in order to limit total annual Fund operating expenses after fee waiver and expense reimbursements (exclusive of taxes, interest (including interest incurred in connection with bank and custody overdrafts, and in connection with securities sold short), shareholder servicing fees, distribution and service (12b-1) fees, brokerage commissions and other transaction costs, dividends payable with respect to securities sold short, acquired fund fees and expenses and extraordinary expenses) of the Fund to the annual rate of 0.87% of the Fund’s average daily net assets (this annual rate or such other annual rate that may be in effect from time to time, the “Expense Cap”), subject to later reimbursement by the Fund in certain circumstances.
In general, for a period of up to 36 months after the date any amounts are paid, waived or reimbursed by the Investment Manager, the Investment Manager may recover such amounts from the Fund, provided that such repayment would not cause the Fund’s total annual operating expenses after fee waiver and expense
19
|
Notes to Financial Statements (continued) |
reimbursements (exclusive of the items noted in the parenthetical above) to exceed either (i) the Expense Cap in effect at the time such amounts were paid, waived or reimbursed, or (ii) the Expense Cap in effect at the time of such repayment by the Fund.
The contractual expense limitation may only be terminated in the event the Investment Manager or a successor ceases to be the investment manager of the Fund or a successor fund, by mutual agreement between the Investment Manager and the Board, or in the event of the Fund’s liquidation unless the Fund is reorganized or is a party to a merger in which the surviving entity is successor to the accounting and performance information of the Fund.
At December 31, 2020, the Fund’s expiration of reimbursements subject to recoupment is as follows:
| | | | |
Expiration Period | | | |
2-3 years | | $ | 46,645 | |
| | | | |
| |
Total | | $ | 46,645 | |
| | | | |
The Trust, on behalf of the Fund, has entered into an amended and restated Administration Agreement under which the Investment Manager serves as the Fund’s administrator (the “Administrator”) and is responsible for all non-portfolio management aspects of managing the Fund’s operations, including administration and shareholder services to the Fund. The Fund pays a fee to the Administrator at the rate of 0.15% per annum of the Fund’s average daily net assets for this service.
The Fund is distributed by AMG Distributors, Inc. (the “Distributor”), a wholly-owned subsidiary of the Investment Manager. The Distributor serves as the distributor and underwriter for the Fund and is a registered broker-dealer and member of the Financial Industry Regulatory Authority, Inc. (“FINRA”). Shares of the Fund will be continuously offered and will be sold directly to prospective purchasers and through brokers, dealers or other financial intermediaries who have executed selling agreements with the Distributor. Generally the Distributor bears all or a portion of the expenses of providing services pursuant to the distribution agreement, including the payment of the expenses relating to the distribution of prospectuses for sales purposes and any advertising or sales literature.
For each of the Class N and Class I shares, the Board has approved reimbursement payments to the Investment Manager for shareholder servicing expenses (“shareholder servicing fees”) incurred. Shareholder servicing fees include payments to financial intermediaries, such as broker-dealers (including fund supermarket platforms), banks, and trust companies who provide shareholder recordkeeping, account servicing and other services. The Class N and Class I shares may reimburse the Investment Manager for the actual amount incurred up to a maximum annual rate of each Class’s average daily net assets as shown in the table below.
The impact on the annualized expense ratios for the fiscal year ended December 31, 2020, were as follows:
| | | | | | | | |
| | | Maximum Annual
Amount
Approved | | | Actual
Amount
Incurred | |
Class N | | | 0.25% | | | | 0.25% | |
Class I | | | 0.15% | | | | 0.12% | |
The Board provides supervision of the affairs of the Trust and other trusts within the AMG Funds Family. The Trustees of the Trust who are not affiliated with the Investment Manager receive an annual retainer and per meeting fees for regular, special and telephonic meetings, and they are reimbursed for out-of-pocket expenses incurred while carrying out their duties as Board members. The Chairman of the Board and the Audit Committee Chair receive additional annual retainers. Certain Trustees and Officers of the Fund are Officers and/or Directors of the Investment Manager, AMG and/or the Distributor.
The Securities and Exchange Commission (the “SEC”) granted an exemptive order that permits the Fund to lend and borrow money for certain temporary purposes directly to and from other eligible funds in the AMG Funds Family. Participation in this interfund lending program is voluntary for both the borrowing and lending funds, and an interfund loan is only made if it benefits each participating fund. The Administrator manages the program according to procedures approved by the Board, and the Board monitors the operation of the program. An interfund loan must comply with certain conditions set out in the exemptive order, which are designed to assure fairness and protect all participating funds. The interest earned and interest paid on interfund loans are included on the Statement of Operations as interest income and miscellaneous expense, respectively. At December 31, 2020, the Fund had no interfund loans outstanding.
The Fund utilized the interfund loan program during the fiscal year ended December 31, 2020 as follows:
| | | | | | | | | | | | |
Average
Borrowed | | Number
of Days | | | Interest
Paid | | | Average
Interest Rate | |
| $2,130,414 | | | 31 | | | | $2,043 | | | | 1.129% | |
3. PURCHASES AND SALES OF SECURITIES
Purchases and sales of securities (excluding short-term securities and U.S. Government Obligations) for the fiscal year ended December 31, 2020, were $215,177,528 and $284,744,020, respectively.
The Fund had no purchases or sales of U.S. Government Obligations during the fiscal year ended December 31, 2020.
4. COMMITMENTS AND CONTINGENCIES
Under the Trust’s organizational documents, its trustees and officers are indemnified against certain liabilities arising out of the performance of their duties to the Trust. In addition, in the normal course of business, the Fund may enter into contracts and agreements that contain a variety of representations and warranties, which provide general indemnifications. The maximum exposure to the Fund under these arrangements is unknown, as this would involve future claims that may be made against the Fund that have not yet occurred. However, based on experience, the Fund had no prior claims or losses and expects the risks of loss to be remote.
5. SUBSEQUENT EVENTS
The Fund has determined that no material events or transactions occurred through the issuance date of the Fund’s financial statements which require an additional disclosure in or adjustment of the Fund’s financial statements.
20
|
Report of Independent Registered Public Accounting Firm |
TO THE BOARD OF TRUSTEES OF AMG FUNDS I AND SHAREHOLDERS OF AMG MANAGERS CENTERSQUARE REAL ESTATE FUND
Opinion on the Financial Statements
We have audited the accompanying statement of assets and liabilities, including the schedule of portfolio investments, of AMG Managers CenterSquare Real Estate Fund (one of the funds constituting AMG Funds I, referred to hereafter as the “Fund”) as of December 31, 2020, the related statement of operations for the year ended December 31, 2020, the statement of changes in net assets for each of the two years in the period ended December 31, 2020, including the related notes, and the financial highlights for each of the periods indicated therein (collectively referred to as the “financial statements”). In our opinion, the financial statements present fairly, in all material respects, the financial position of the Fund as of December 31, 2020, the results of its operations for the year then ended, the changes in its net assets for each of the two years in the period December 31, 2020, and the financial highlights for each of the periods indicated therein in conformity with accounting principles generally accepted in the United States of America.
Basis for Opinion
These financial statements are the responsibility of the Fund’s management. Our responsibility is to express an opinion on the Fund’s financial statements based on our audits. We are a public accounting firm registered with the Public Company Accounting Oversight Board (United States) (PCAOB) and are required to be independent with respect to the Fund in accordance with the U.S. federal securities laws and the applicable rules and regulations of the Securities and Exchange Commission and the PCAOB.
We conducted our audits of these financial statements in accordance with the standards of the PCAOB. Those standards require that we plan and perform the audit to obtain reasonable assurance about whether the financial statements are free of material misstatement, whether due to error or fraud.
Our audits included performing procedures to assess the risks of material misstatement of the financial statements, whether due to error or fraud, and performing procedures that respond to those risks. Such procedures included examining, on a test basis, evidence regarding the amounts and disclosures in the financial statements. Our audits also included evaluating the accounting principles used and significant estimates made by management, as well as evaluating the overall presentation of the financial statements. Our procedures included confirmation of securities owned as of December 31, 2020 by correspondence with the custodian. We believe that our audits provide a reasonable basis for our opinion.
PricewaterhouseCoopers LLP
Boston, Massachusetts
February 23, 2021
We have served as the auditor of one or more investment companies in the AMG Funds Family since 1993.
21
|
Other Information (unaudited) |
TAX INFORMATION
AMG Managers CenterSquare Real Estate Fund hereby designates the maximum amount allowable of its net taxable income as qualified dividends as provided in the Jobs and Growth Tax Relief Reconciliation Act of 2003. The 2020 Form 1099-DIV you receive for the Fund will show the tax status of all distributions paid to you during the year.
Pursuant to section 852 of the Internal Revenue Code, AMG Managers CenterSquare Real Estate Fund hereby designates $197,856 as a capital gain distribution with respect to the taxable year ended December 31, 2020, or if subsequently determined to be different, the net capital gains of such year. AMG Managers CenterSquare Real Estate Fund hereby designates $1,693,482 as a 199A dividend with respect to the taxable calendar year ended December 31, 2020, or if subsequently determined to be different, the 199A dividend of such calendar year.
AMG Managers CenterSquare Real Estate Fund previously announced the estimated sources of its distributions paid during the year ended December 31, 2020. AMG Managers CenterSquare Real Estate Fund has reclassified certain of those distributions previously announced as constituting ordinary income and return of capital.
Pursuant to Rule 19a-1(e) under the Investment Company Act of 1940, as amended, the information in the table below supersedes the Fund’s previously announced estimated sources of its distributions paid during the year ended December 31, 2020.
| | | | |
Distributions paid from: | | | | |
Ordinary income | | | $1,828,559 | |
Long-term capital gains | | | 197,856 | |
Return of capital | | | 1,469,871 | |
| | | | |
| | | $3,496,286 | |
| | | | |
Please note that the information in this table is for financial accounting purposes only. Form 1099-DIV received by shareholders for the calendar year specifies how shareholders should characterize and report distributions paid by the Fund during the year for U.S. federal income tax purposes.
22
|
AMG Funds Trustees and Officers |
| | | | | | | | |
The Trustees and Officers of the Trust, their business addresses, principal occupations for the past five years and ages are listed below. The Trustees provide broad supervision over the affairs of the Trust and the Funds. The Trustees are experienced executives who meet periodically throughout the year to oversee the Funds’ activities, review contractual arrangements with companies that provide services to the Funds, and | | | | review the Funds’ performance. Unless otherwise noted, the address of each Trustee or Officer is the address of the Trust: One Stamford Plaza, 263 Tresser Blvd, Suite 949, Stamford, Connecticut 06901. There is no stated term of office for Trustees. Trustees serve until their resignation, retirement or removal in | | | | accordance with the Trust’s organizational documents and policies adopted by the Board from time to time. The Chairman of the Trustees, President, Treasurer and Secretary of the Trust are elected by the Trustees annually. Other officers hold office at the pleasure of the Trustees. |
Independent Trustees
The following Trustees are not “interested persons” of the Trust within the meaning of the 1940 Act:
| | |
Number of Funds Overseen in
Fund Complex | | Name, Age, Principal Occupation(s) During Past 5 Years and Other Directorships Held by Trustee |
| | |
• Trustee since 2012 • Oversees 46 Funds in Fund Complex | | Bruce B. Bingham, 72 Partner, Hamilton Partners (real estate development firm) (1987-2020); Director of The Yacktman Funds (2 portfolios) (2000-2012). |
| | |
• Trustee since 2013 • Oversees 49 Funds in Fund Complex | | Kurt A. Keilhacker, 57 Managing Partner, TechFund Capital (1997-Present); Managing Partner, TechFund Europe (2000-Present); Managing Partner, Elementum Ventures (2013-Present); Director, MetricStory, Inc. (2017-Present); Trustee, Wheaton College (2018-Present); Trustee, Gordon College (2001-2016); Trustee, Board Member, 6wind SA, (2002-2019). |
| | |
• Trustee since 2000 • Oversees 46 Funds in Fund Complex | | Steven J. Paggioli, 70 Independent Consultant (2002-Present); Trustee, Professionally Managed Portfolios (28 portfolios); Advisory Board Member, Sustainable Growth Advisors, LP; Independent Director, Muzinich BDC, Inc. (business development company) (2019-Present); Director, The Wadsworth Group; Independent Director, Chase Investment Counsel (2008–2019); Executive Vice President, Secretary and Director, Investment Company Administration, LLC and First Fund Distributors, INC. (1990-2001). |
| | |
• Trustee since 2013 • Oversees 46 Funds in Fund Complex | | Richard F. Powers III, 75 Adjunct Professor, U.S. Naval War College (2016-Present); Adjunct Professor, Boston College (2011-2015); Director, Ameriprise Financial Inc. (2005-2009); President and CEO of Van Kampen Investments Inc. (1998-2003); President, Morgan Stanley Client Group (2000-2002); Executive Vice President and Chief Marketing Officer of the Morgan Stanley Individual Investor Group (1984-1998). |
| | |
• Independent Chairman • Trustee since 2000 • Oversees 49 Funds in Fund Complex | | Eric Rakowski, 62 Professor of Law, University of California at Berkeley School of Law (1990-Present); Tax Attorney at Davis Polk & Wardwell and clerked for Judge Harry T. Edwards of the U.S. Court of Appeals for the District of Columbia Circuit and for Justice William J. Brennan Jr. of the U.S. Supreme Court; Director of Harding, Loevner Funds, Inc. (9 portfolios); Trustee of Third Avenue Trust (3 portfolios) (2002-2019); Trustee of Third Avenue Variable Trust (1 portfolio) (2002-2019). |
| | |
• Trustee since 2013 • Oversees 49 Funds in Fund Complex | | Victoria L. Sassine, 55 Adjunct Professor, Babson College (2007–Present); Director, Board of Directors, PRG Group (2017-Present); CEO, Founder, Scale Smarter Partners, LLC (2018-Present); Adviser, EVOFEM Biosciences (2019-Present); Teaching Fellow, Goldman Sachs 10,000 Small Business Initiative (2010-Present); Chairperson of the Board of Directors of Business Management Associates (2018 to 2019). |
| | |
• Trustee since 2000 • Oversees 46 Funds in Fund Complex | | Thomas R. Schneeweis, 73 Professor Emeritus, University of Massachusetts (2013-Present); President, TRS Associates (1982-Present); Board Member, Chartered Alternative Investment Association (“CAIA”) (2002-Present); Director, CAIA Foundation (2010-2019); Director, Institute for Global Asset and Risk Management (Education) (2010-Present); Co-Owner, Quantitative Investment Technologies (2014-Present); Co-Owner, Yes Wealth Management (2018-Present); Director of Research, Yes Wealth Management (2018-Present); Partner, S Capital Wealth Advisors (2015-2018); Partner, S Capital Management, LLC (2007-2015); President, Alternative Investment Analytics, LLC, (formerly Schneeweis Partners, LLC) (2001-2013); Finance Professor, University of Massachusetts (1977-2013). |
23
|
AMG Funds Trustees and Officers (continued) |
Interested Trustees
Each Trustee in the following table is an “interested person” of the Trust within the meaning of the 1940 Act. Ms. Carsman is an interested person of the Trust within the meaning of the 1940 Act by virtue of her position with, and interest in securities of, AMG.
| | |
Number of Funds Overseen in
Fund Complex | | Name, Age, Principal Occupation(s) During Past 5 Years and Other Directorships Held by Trustee |
• Trustee since 2011 • Oversees 46 Funds in Fund Complex | | Christine C. Carsman, 68 Senior Policy Advisor, Affiliated Managers Group, Inc. (2019-Present); Chair of the Board of Directors, AMG Funds plc (2015-2018); Director, AMG Funds plc (2010-2018); Executive Vice President, Deputy General Counsel and Chief Regulatory Counsel, Affiliated Managers Group, Inc. (2017-2018); Senior Vice President and Deputy General Counsel, Affiliated Managers Group, Inc. (2011-2016); Senior Vice President and Chief Regulatory Counsel, Affiliated Managers Group, Inc. (2007-2011); Vice President and Chief Regulatory Counsel, Affiliated Managers Group, Inc. (2004-2007); Senior Counsel, Vice President and Director of Operational Risk Management and Compliance, Wellington Management Company, LLP (1995-2004); Director of Harding, Loevner Funds, Inc. (9 portfolios) (2017-Present); Secretary and Chief Legal Officer, AMG Funds, AMG Funds I, AMG Funds II and AMG Funds III (2004-2011). |
| |
| Officers |
Position(s) Held with Fund and
Length of Time Served | | Name, Age, Principal Occupation(s) During Past 5 Years |
| | |
• President since 2018 • Principal Executive Officer since 2018 • Chief Executive Officer since 2018 • Chief Operating Officer since 2007 | | Keitha L. Kinne, 62 Chief Operating Officer, AMG Funds LLC (2007-Present); Chief Investment Officer, AMG Funds LLC (2008-Present); President and Principal, AMG Distributors, Inc. (2018-Present); Chief Operating Officer, AMG Distributors, Inc. (2007-Present); President, Chief Executive Officer and Principal Executive Officer, AMG Funds, AMG Funds I, AMG Funds II, AMG Funds III and AMG Funds IV (2018-Present); Chief Operating Officer, AMG Funds, AMG Funds I, AMG Funds II, and AMG Funds III (2007-Present); Chief Operating Officer, AMG Funds IV (2016-Present); Chief Operating Officer and Chief Investment Officer, Aston Asset Management, LLC (2016); President and Principal Executive Officer, AMG Funds, AMG Funds I, AMG Funds II and AMG Funds III (2012-2014); Managing Partner, AMG Funds LLC (2007-2014); President and Principal, AMG Distributors, Inc. (2012-2014); Managing Director, Legg Mason & Co., LLC (2006-2007); Managing Director, Citigroup Asset Management (2004-2006). |
| | |
• Secretary since 2015 • Chief Legal Officer since 2015 | | Mark J. Duggan, 55 Senior Vice President and Senior Counsel, AMG Funds LLC (2015-Present); Secretary and Chief Legal Officer, AMG Funds, AMG Funds I, AMG Funds II, AMG Funds III and AMG Funds IV (2015-Present); Attorney, K&L Gates, LLP (2009-2015). |
| | |
• Chief Financial Officer since 2017 • Treasurer since 2017 • Principal Financial Officer since 2017 • Principal Accounting Officer since 2017 | | Thomas G. Disbrow, 54 Vice President, Mutual Fund Treasurer & CFO, AMG Funds, AMG Funds LLC (2017-Present); Chief Financial Officer, Principal Financial Officer, Treasurer and Principal Accounting Officer, AMG Funds, AMG Funds I, AMG Funds II, AMG Funds III and AMG Funds IV (2017-Present); Managing Director - Global Head of Traditional Funds Product Control, UBS Asset Management (Americas), Inc. (2015-2017); Managing Director - Head of North American Funds Treasury, UBS Asset Management (Americas), Inc. (2011-2015). |
| | |
• Deputy Treasurer since 2017 | | John A. Starace, 50 Director, Mutual Fund Accounting, AMG Funds LLC (2017-Present); Vice President, Deputy Treasurer of Mutual Funds Services, AMG Funds LLC (2014-2017); Deputy Treasurer, AMG Funds, AMG Funds I, AMG Funds II, AMG Funds III and AMG Funds IV (2017-Present); Vice President, Citi Hedge Fund Services (2010-2014); Audit Senior Manager (2005-2010) and Audit Manager (2001-2005), Deloitte & Touche LLP. |
| | |
• Chief Compliance Officer since 2019 | | Patrick J. Spellman, 46 Vice President, Chief Compliance Officer, AMG Funds LLC (2017-Present); Chief Compliance Officer and Sarbanes-Oxley Code of Ethics Compliance Officer, AMG Funds, AMG Funds I, AMG Funds II, AMG Funds III and AMG Funds IV (2019-Present); Chief Compliance Officer, AMG Distributors, Inc., (2010-Present); Senior Vice President, Chief Compliance Officer, AMG Funds LLC (2011-2017); Anti-Money Laundering Compliance Officer, AMG Funds, AMG Funds I, AMG Funds II, and AMG Funds III (2014-2019); Anti-Money Laundering Officer, AMG Funds IV, (2016-2019); Compliance Manager, Legal and Compliance, Affiliated Managers Group, Inc. (2005-2011). |
| | |
• Assistant Secretary since 2016 | | Maureen A. Meredith, 35 Vice President, Counsel, AMG Funds LLC (2019-Present); Director, Counsel, AMG Funds LLC (2017-2018); Vice President, Counsel, AMG Funds LLC (2015-2017); Assistant Secretary, AMG Funds, AMG Funds I, AMG Funds II, AMG Funds III and AMG Funds IV (2016-Present); Associate, Ropes & Gray LLP (2011-2015); Law Fellow, Massachusetts Appleseed Center for Law and Justice (2010-2011). |
| | |
• Anti-Money Laundering Compliance Officer since 2019 | | Hector D. Roman, 43 Director, Legal and Compliance, AMG Funds LLC (2020-Present); Manager, Legal and Compliance, AMG Funds LLC (2017-2019); Director of Compliance, Morgan Stanley Investment Management (2015-2017); Senior Advisory, PricewaterhouseCoopers LLP (2014-2015); Risk Manager, Barclays Investment Bank (2008-2014); Anti-Money Laundering Compliance Officer, AMG Funds, AMG Funds I, AMG Funds II, AMG Funds III and AMG Funds IV (2019-Present). |
24
| | |
| | |
| | | | |
INVESTMENT MANAGER AND ADMINISTRATOR AMG Funds LLC One Stamford Plaza 263 Tresser Blvd, Suite 949 Stamford, CT 06901 800.548.4539 DISTRIBUTOR AMG Distributors, Inc. One Stamford Plaza 263 Tresser Blvd, Suite 949 Stamford, CT 06901 800.548.4539 SUBADVISER CenterSquare Investment Management, Inc. 630 W Germantown Pike Suite 300 Plymouth Meeting, PA 19462 CUSTODIAN The Bank of New York Mellon 111 Sanders Creek Parkway East Syracuse, NY 13057 | | LEGAL COUNSEL Ropes & Gray LLP Prudential Tower, 800 Boylston Street Boston, MA 02199-3600 TRANSFER AGENT BNY Mellon Investment Servicing (US) Inc. Attn: AMG Funds 4400 Computer Drive Westborough, MA 01581 800.548.4539 | | This report is prepared for the Fund’s shareholders. It is authorized for distribution to prospective investors only when preceded or accompanied by an effective prospectus. To receive a free copy of the prospectus or Statement of Additional Information, which includes additional information about Fund Trustees, please contact us by calling 800.548.4539. Distributed by AMG Distributors, Inc., member FINRA/SIPC. Current net asset values per share for the Fund are available on the Fund’s website at amgfunds.com. A description of the policies and procedures the Fund uses to vote its proxies is available: (i) without charge, upon request, by calling 800.548.4539, or (ii) on the Securities and Exchange Commission’s (SEC) website at sec.gov. For information regarding the Fund’s proxy voting record for the 12-month period ended June 30, call 800.548.4539 or visit the SEC website at sec.gov. The Fund files its complete schedule of portfolio holdings with the SEC for the first and third quarters of each fiscal year as an exhibit to their reports on Form N-PORT. The Fund’s portfolio holdings on Form N-PORT are available on the SEC’s website at sec.gov and the Fund’s website at amgfunds.com. To review a complete list of the Fund’s portfolio holdings, or to view the most recent semi-annual report or annual report, please visit amgfunds.com. |
| | | | |
| | | | | | | | |
AFFILIATE SUBADVISED FUNDS BALANCED FUNDS AMG GW&K Global Allocation GW&K Investment Management, LLC AMG FQ Global Risk-Balanced First Quadrant, L.P. EQUITY FUNDS AMG FQ Tax-Managed U.S. Equity AMG FQ Long-Short Equity First Quadrant, L.P. AMG Frontier Small Cap Growth Frontier Capital Management Co., LLC AMG GW&K Small Cap Core AMG GW&K Small Cap Value AMG GW&K Small/Mid Cap AMG GW&K Mid Cap AMG GW&K Emerging Markets Equity AMG GW&K Emerging Wealth Equity AMG GW&K International Small Cap GW&K Investment Management, LLC AMG Renaissance Large Cap Growth The Renaissance Group LLC AMG River Road Dividend All Cap Value AMG River Road Focused Absolute Value AMG River Road Long-Short AMG River Road Small-Mid Cap Value AMG River Road Small Cap Value River Road Asset Management, LLC | | | | AMG TimesSquare Emerging Markets Small Cap AMG TimesSquare Global Small Cap AMG TimesSquare International Small Cap AMG TimesSquare Mid Cap Growth AMG TimesSquare Small Cap Growth TimesSquare Capital Management, LLC AMG Yacktman AMG Yacktman Focused AMG Yacktman Focused Fund - Security Selection Only AMG Yacktman Special Opportunities Yacktman Asset Management LP FIXED INCOME FUNDS AMG GW&K Core Bond ESG AMG GW&K Enhanced Core Bond ESG AMGGW&K High Income AMG GW&K Municipal Bond AMG GW&K Municipal Enhanced Yield GW&K Investment Management, LLC OPEN-ARCHITECTURE FUNDS EQUITY FUNDS AMG Managers Brandywine AMG Managers Brandywine Blue Friess Associates, LLC AMG Managers CenterSquare Real Estate CenterSquare Investment Management LLC | | | | AMG Managers Emerging Opportunities WEDGE Capital Management L.L.P. Next Century Growth Investors LLC RBC Global Asset Management (U.S.) Inc. AMG Managers Fairpointe Mid Cap Fairpointe Capital LLC AMG Managers LMCG Small Cap Growth LMCG Investments, LLC AMG Managers Montag & Caldwell Growth Montag & Caldwell, LLC AMG Managers Pictet International Pictet Asset Management Limited AMG Managers Silvercrest Small Cap Silvercrest Asset Management Group LLC AMG Managers Special Equity Ranger Investment Management, L.P. Lord, Abbett & Co. LLC Smith Asset Management Group, L.P. Federated MDTA LLC FIXED INCOME FUNDS AMG Managers DoubleLine Core Plus Bond DoubleLine Capital LP AMG Managers Loomis Sayles Bond Loomis, Sayles & Company, L.P. |
| | | | |
amgfunds.com | | 123120 | | AR017 |
Item 2. CODE OF ETHICS
Registrant has adopted a Code of Ethics. See attached Exhibit (a)(1).
Item 3. AUDIT COMMITTEE FINANCIAL EXPERT
Registrant’s Board of Trustees has determined that independent Trustee Mr. Steven J. Paggioli qualifies as an Audit Committee Financial Expert. Mr. Paggioli is “independent” as such term is defined in Form N-CSR.
Item 4. PRINCIPAL ACCOUNTANT FEES AND SERVICES
The aggregate fees billed by the Fund’s independent registered public accounting firm, PricewaterhouseCoopers LLP (“PwC”), to the Fund for the Fund’s two most recent fiscal years for professional services rendered for audits of annual financial statements, or services that are normally provided in connection with statutory and regulatory filings or engagements (“Audit Fees”) were as follows:
| | | | | | | | |
| | | Fiscal
2020 | | | Fiscal
2019 | |
AMG Managers CenterSquare Real Estate Fund | | $ | 30,634 | | | $ | 30,607 | |
There were no fees billed by PwC to the Fund in its two most recent fiscal years for services rendered for assurance and related services that are reasonably related to the performance of the audit or review of the Fund’s financial statements but are not reported as Audit Fees (“Audit-Related Fees”).
For the Fund’s two most recent fiscal years, there were no Audit-Related Fees billed by PwC for engagements related directly to the operations and financial reporting of one or more Funds by a Fund Service Provider. A Fund Service Provider is (a) any investment adviser to the Fund (not including any Subadvisor whose role is primarily portfolio management and is subcontracted with or overseen by another investment adviser) or (b) any entity that provides ongoing services to the Fund and is controlling, controlled by or under common control with a Fund investment adviser described in (a).
The aggregate fees billed by PwC to the Fund for the two most recent fiscal years for professional services rendered for tax compliance, tax advice, and tax planning (“Tax Fees”) were as follows:
| | | | | | | | |
| | | Fiscal
2020 | | | Fiscal
2019 | |
AMG Managers CenterSquare Real Estate Fund | | $ | 7,450 | | | $ | 7,450 | |
For the Fund’s two most recent fiscal years, Tax Fees billed by PwC for engagements by Fund Service Providers that related directly to the operations and financial reporting of the Fund were $0 for the fiscal year ended December 31, 2020 and $0 for the fiscal year ended December 31, 2019, respectively.
The services for which Tax Fees were charged comprise all services performed by professional staff in PwC’s tax division except those services related to the audit. Typically, this category would include fees for tax compliance, tax planning, and tax advice. Tax compliance, tax advice, and tax planning services include preparation of original and amended tax returns, claims for refund and tax payment-planning services, assistance with tax audits and appeals, tax advice related to mergers and acquisitions and requests for rulings or technical advice from taxing authorities.
There were no other fees billed by PwC to the Fund for all other non-audit services (“Other Fees”) during the Fund’s two most recent fiscal years. During the same period, there were no Other Fees billed by PwC for engagements by Fund Service Providers that related directly to the operations and financial reporting of the Fund.
(e)(1) According to policies adopted by the Audit Committee, services provided by PwC to the Fund must be pre-approved by the Audit Committee. On an annual basis, the Audit Committee reviews and pre-approves various types of services that PwC may perform for the Fund without specific approval of each engagement, subject to specified budget limitations. As contemplated by the Sarbanes-Oxley Act of 2002 and related SEC rules, the Audit Committee also pre-approves non-audit services provided by PwC to any Fund Service Provider for any engagement that relates directly to the operations and financial reporting of the Fund. Any engagement that is not already pre-approved or that will exceed a pre-approved budget must be submitted to the Audit Committee for pre-approval. The Chairman of the Audit Committee is authorized on behalf of the Board of Trustees and the Audit Committee to approve the engagement of PwC to perform non-audit services subject to certain conditions, including notification to the Audit Committee of such pre-approval not later than the next meeting of the Audit Committee following the date of such pre-approval.
(e)(2) None.
(f) Not applicable.
(g) The aggregate fees billed by PwC in 2020 and 2019 for non-audit services rendered to the Fund and Fund Service Providers were $56,950 and $56,950 respectively. For the fiscal year ended December 31, 2020, this amount reflects the amounts disclosed above in Item 4(b),(c),(d), plus $49,500 in fees billed to the Fund Service Providers for non-audit services that did not relate directly to the operations and financial reporting of the Funds. For the fiscal year ended December 31, 2019, this amount reflects the amounts disclosed above in Item 4(b),(c),(d), plus $49,500 in fees billed to the Fund Service Providers for non-audit services that did not relate directly to the operations and financial reporting of the Funds.
(h) The Trust’s Audit Committee has considered whether the provision of non-audit services by registrant’s independent registered public accounting firm to the registrant’s investment adviser, and any entity controlling, controlled by, or under common control with the investment adviser that provided ongoing services to the registrant that were not pre-approved by the Committee (because such services did not relate directly to the operations and financial reporting of the registrant) was compatible with maintaining the independence of the independent registered public accounting firm.
Item 5. AUDIT COMMITTEE OF LISTED REGISTRANTS
Not applicable.
Item 6. SCHEDULE OF INVESTMENTS
The schedule of investments in securities of unaffiliated issuers as of the close of the reporting period is included as part of the report to shareholders filed under Item 1 of this form.
Item 7. DISCLOSURE OF PROXY VOTING POLICIES AND PROCEDURES FOR CLOSED-END MANAGEMENT INVESTMENT COMPANIES
Not applicable.
Item 8. PORTFOLIO MANAGERS OF CLOSED-END MANAGEMENT INVESTMENT COMPANIES
Not applicable.
Item 9. PURCHASES OF EQUITY SECURITIES BY CLOSED-END MANAGEMENT INVESTMENT COMPANIES AND AFFILIATED PURCHASERS
Not applicable.
Item 10. SUBMISSION OF MATTERS TO A VOTE OF SECURITY HOLDERS
Not applicable.
Item 11. CONTROLS AND PROCEDURES
(a) The Registrant’s principal executive and principal financial officers have concluded, based on their evaluation of the registrant’s disclosure controls and procedures as of a date within 90 days of the filing of this report, that the Registrant’s disclosure controls and procedures are reasonably designed to ensure that information required to be disclosed by the Registrant on Form N-CSR is recorded, processed, summarized and reported within the required time periods and that information required to be disclosed by the registrant in the reports that it files or submits on Form N-CSR is accumulated and communicated to the Registrant’s management, including its principal executive and principal financial officers, as appropriate to allow timely decisions regarding required disclosure.
(b) There were no changes in the Registrant’s internal control over financial reporting during the period covered by this report that have materially affected, or are reasonably likely to materially affect, the internal control over financial reporting.
Item 12. DISCLOSURE OF SECURITIES LENDING ACTIVITIES FOR CLOSED-END MANAGEMENT INVESTMENT COMPANIES
Not applicable.
Item 13. EXHIBITS
SIGNATURES
Pursuant to the requirements of the Securities Exchange Act of 1934 and the Investment Company Act of 1940, the registrant has duly caused this report to be signed on its behalf by the undersigned, thereunto duly authorized.
| | |
| AMG Funds I |
| |
| By: | | /s/ Keitha L. Kinne |
| | Keitha L. Kinne, Principal Executive Officer |
| |
| Date: | | March 4, 2021 |
Pursuant to the requirements of the Securities Exchange Act of 1934 and the Investment Company Act of 1940, this report has been signed below by the following persons on behalf of the registrant and in the capacities and on the dates indicated.
| | |
| By: | | /s/ Keitha L. Kinne |
| | Keitha L. Kinne, Principal Executive Officer |
| |
| Date: | | March 4, 2021 |
| |
| By: | | /s/ Thomas Disbrow |
| | Thomas Disbrow, Principal Financial Officer |
| |
| Date: | | March 4, 2021 |