UNITED STATES
SECURITIES AND EXCHANGE COMMISSION
Washington, D.C. 20549
FORM N-CSR
CERTIFIED SHAREHOLDER REPORT OF
REGISTERED MANAGEMENT INVESTMENT COMPANIES
Investment Company Act file number: 811-06520
AMG Funds I
(Exact name of registrant as specified in charter)
600 Steamboat Road, Suite 300, Greenwich, Connecticut 06830
(Address of principal executive offices) (Zip code)
AMG Funds LLC
600 Steamboat Road, Suite 300, Greenwich, Connecticut 06830
(Name and address of agent for service)
Registrant’s telephone number, including area code: (203) 299-3500
Date of fiscal year end: OCTOBER 31
Date of reporting period: NOVEMBER 1, 2019 – OCTOBER 31, 2020
(Annual Shareholder Report)
| Item 1. | Reports to Shareholders |
| | |
 | | ANNUAL REPORT |
| | | | | | | | |
| | | | | AMG Funds October 31, 2020 
AMG GW&K Core Bond ESG Fund |
| | | | | |
| | | | | Class N: MBGVX | | Class I: MBDFX | | Class Z: MBDLX |
| | | | | AMG GW&K Emerging Wealth Equity Fund (formerly AMG GW&K Trilogy Emerging Wealth Equity Fund) |
| | | | | |
| | | | | Class N: TYWVX | | Class I: TYWSX | | Class Z: TYWIX |
| | | | | AMG GW&K Emerging Markets Equity Fund (formerly AMG GW&K Trilogy Emerging Markets Equity Fund) |
| | | | | |
| | | | | Class N: TLEVX | | Class I: TLESX | | Class Z: TLEIX |
| | | | | |
| | | | | | | | | |
Beginning on January 1, 2021, as permitted by regulations adopted by the Securities and Exchange Commission, paper copies of the Funds’ shareholder reports like this one will no longer be sent by mail, unless you specifically request paper copies of the reports from the Funds or from your financial intermediary, such as a broker-dealer or bank. Instead, the reports will be made available on the Funds’ website (https://www.amgfunds.com/resources/order_literature.html), and you will be notified by mail each time a report is posted and provided with a website link to access the report.
If you already elected to receive shareholder reports electronically, you will not be affected by this change and you need not take any action. You may elect to receive shareholder reports and other communications from the Funds electronically at any time by contacting your financial intermediary or, if you invest directly with the Funds, by logging into your account at www.amgfunds.com.
You may elect to receive all future reports in paper free of charge. If you invest through a financial intermediary, you can contact your financial intermediary to request that you continue to receive paper copies of your shareholder reports. If you invest directly with the Funds, you can call 1.800.548.4539 to inform the Funds that you wish to continue receiving paper copies of your shareholder reports. Your election to receive reports in paper will apply to all funds in the AMG Funds Family of Funds held in your account if you invest through your financial intermediary or all funds in the AMG Funds Family of Funds held with the fund complex if you invest directly with the Funds.
| | |
| amgfunds.com | | 103120 AR069 |
| | |
| | | AMG Funds Annual Report — October 31, 2020 |
| | | | | | |
| | | |
| | | | | | | |
| | | TABLE OF CONTENTS | | PAGE | |
| | | | |
| | | LETTER TO SHAREHOLDERS | | | 2 | |
| | | |
| | | ABOUT YOUR FUND’S EXPENSES | | | 3 | |
| | | |
| | | PORTFOLIO MANAGER’S COMMENTS, FUND SNAPSHOTS AND SCHEDULES OF PORTFOLIO INVESTMENTS | | | | |
| | | |
| | | AMG GW&K Core Bond ESG Fund | | | 4 | |
| | | |
| | | AMG GW&K Emerging Wealth Equity Fund | | | 12 | |
| | | |
| | | AMG GW&K Emerging Markets Equity Fund | | | 18 | |
| | | |
| | | FINANCIAL STATEMENTS | | | | |
| | | |
| | | Statement of Assets and Liabilities | | | 25 | |
| | | |
| | | Balance sheets, net asset value (NAV) per share computations
and cumulative distributable earnings (loss) | | | | |
| | | |
| | | Statement of Operations | | | 27 | |
| | | |
| | | Detail of sources of income, expenses, and realized and
unrealized gains (losses) during the fiscal year | | | | |
| | | |
| | | Statements of Changes in Net Assets | | | 28 | |
| | | |
| | | Detail of changes in assets for the past two fiscal years | | | | |
| | | |
| | | Financial Highlights | | | 29 | |
| | | |
| | | Historical net asset values per share, distributions, total returns, income
and expense ratios, turnover ratios and net assets | | | | |
| | | |
| | | Notes to Financial Statements | | | 38 | |
| | | |
| | | Accounting and distribution policies, details of agreements and
transactions with Fund management and affiliates, and descriptions of
certain investment risks | | | | |
| | | |
| | | REPORT OF INDEPENDENT REGISTERED PUBLIC ACCOUNTING FIRM | | | 46 | |
| | | |
| | | OTHER INFORMATION | | | 47 | |
| | | |
| | | TRUSTEES AND OFFICERS | | | 48 | |
| | | |
| | | ANNUAL RENEWAL OF INVESTMENT MANAGEMENT AND SUBADVISORY AGREEMENTS | | | 50 | |
| | | | | | | |
|
| Nothing contained herein is to be considered an offer, sale or solicitation of an offer to buy shares of any series of the AMG Funds Family of Funds. Such offering is made only by prospectus, which includes details as to offering price and other material information. | |
| | |
| | Letter to Shareholders |
Dear Shareholder:
The fiscal year ending October 31, 2020, was a volatile period for financial markets marked by a dramatic selloff and extraordinary rebound amid the unprecedented global effort to stop the COVID-19 pandemic. During the first half of the fiscal year, equities achieved new record highs against the backdrop of a healthy economy and strong investor sentiment. However, a broad-based selloff occurred amid a global flight to quality as investors assessed the scope of the unfolding COVID-19 health care crisis, a deteriorating economy, and skyrocketing unemployment. An oil price war initiated between Saudi Arabia and Russia only made matters worse. From its peak in mid-February 2020, the S&P 500® Index declined (33.79)% over the span of a few weeks, bringing the eleven-year bull market to an abrupt end. In response to the crisis, global central banks and governments were quick to flood the market with massive fiscal and monetary stimulus which helped to stabilize the market and led to an impressive recovery in risk assets, albeit a very uneven one. So despite the volatility, the S&P 500® Index still achieved a 9.71% return for the fiscal year.
During the year there was very wide dispersion in performance across sectors, with information technology and consumer discretionary sectors leading the market with returns of 34.47% and 24.69%, respectively. On the other hand, companies in the energy sector fell (45.24)%, and financials, real estate, and industrials also produced negative returns. Growth stocks significantly outperformed value stocks for the period with returns of 29.22% and (7.57)% for the Russell 1000® Growth and Russell 1000® Value Indexes, respectively. Large caps also outperformed small caps as measured by the 9.71% return for the S&P 500® Index compared to (0.14)% for the Russell 2000® Index. Outside the U.S., emerging markets outperformed developed markets with the 8.25% return for the MSCI Emerging Markets Index compared to the (6.86)% return for the MSCI EAFE Index.
Interest rates fell dramatically and led to strong returns for bond investors as the U.S. Federal Reserve slashed short-term rates in response to the slowing economy. The 10-year Treasury yield ended the year near a historic low yield of 0.88%. The Bloomberg Barclays U.S. Aggregate Bond Index®, a broad measure of U.S. bond market performance, returned 6.19% over the period. Riskier high yield bonds lagged the broader bond market with a 3.49% return as measured by the return of the Bloomberg Barclays U.S. Corporate High Yield Bond Index®.
AMG Funds appreciates the privilege of providing investment tools to you and your clients. Our foremost goal is to provide investment solutions that help our shareholders successfully reach their long-term investment goals. AMG Funds
provides access to a distinctive array of actively managed return-oriented investment strategies. We thank you for your continued confidence and investment in AMG Funds. You can rest assured that under all market conditions our team is focused on delivering excellent investment management services for your benefit.
Respectfully,

Keitha Kinne
President
AMG Funds
| | | | | | | | | | | | | | |
| Average Annual Total Returns | | Periods ended
October 31, 2020* | |
| | | | |
| Stocks: | | | | 1 Year | | | 3 Years | | | 5 Years | |
| | | | |
Large Cap | | (S&P 500® Index) | | | 9.71 | % | | | 10.42% | | | | 11.71% | |
| | | | |
Small Cap | | (Russell 2000® Index) | | | (0.14 | )% | | | 2.19% | | | | 7.27% | |
| | | | |
International | | (MSCI All Country World Index ex USA) | | | (2.61 | )% | | | (0.19)% | | | | 4.26% | |
| Bonds: | | | | | | | | | | | |
| | | | |
Investment Grade | | (Bloomberg Barclays U.S. Aggregate Bond Index) | | | 6.19 | % | | | 5.06% | | | | 4.08% | |
| | | | |
High Yield | | (Bloomberg Barclays U.S. Corporate High Yield Bond Index) | | | 3.49 | % | | | 4.24% | | | | 6.32% | |
| | | | |
Tax-exempt | | (Bloomberg Barclays
Municipal Bond Index) | | | 3.59 | % | | | 4.09% | | | | 3.70% | |
| | | | |
Treasury Bills | | (ICE BofAML U.S. 6-Month
Treasury Bill Index) | | | 1.30 | % | | | 1.89% | | | | 1.43% | |
*Source: FactSet. Past performance is no guarantee of future results.
2
|
About Your Fund’s Expenses |
| | | | | | | | |
As a shareholder of a Fund, you may incur two types of costs: (1) transaction costs, which may include sales charges (loads) on purchase payments; redemption fees; and exchange fees; and (2) ongoing costs, including management fees; distribution (12b-1) fees; and other Fund expenses. This example is intended to help you understand your ongoing costs (in dollars) of investing in the Fund and to compare these costs with the ongoing costs of investing in other mutual funds. The example is based on $1,000 invested at the beginning of the period and held for the entire period as indicated below. ACTUAL EXPENSES The first line of the following table provides information about the actual account values and | | | | actual expenses. You may use the information in this line, together with the amount you invested, to estimate the expenses that you paid over the period. Simply divide your account value by $1,000 (for example, an $8,600 account value divided by $1,000 = 8.6), then multiply the result by the number in the first line under the heading entitled “Expenses Paid During Period” to estimate the expenses you paid on your account during this period. HYPOTHETICAL EXAMPLE FOR COMPARISON PURPOSES The second line of the following table provides information about hypothetical account values and hypothetical expenses based on the Fund’s actual expense ratio and an assumed annual rate of return of 5% before expenses, which is not the Fund’s | | | | actual return. The hypothetical account values and expenses may not be used to estimate the actual ending account balance or expenses you paid for the period. You may use this information to compare the ongoing costs of investing in the Fund and other funds by comparing this 5% hypothetical example with the 5% hypothetical examples that appear in the shareholder reports of other funds. Please note that the expenses shown in the table are meant to highlight your ongoing costs only and do not reflect any transactional costs, such as sales charges (loads), redemption fees, or exchange fees. Therefore, the second line of the table is useful in comparing ongoing costs only, and will not help you determine the relative total costs of owning different funds. |
| | | | | | | | |
| | | | | | | | |
| | | | |
Six Months Ended October 31, 2020 | | Expense
Ratio for
the Period | | Beginning
Account
Value
05/01/20 | | Ending
Account
Value
10/31/20 | | Expenses
Paid
During
the Period* |
AMG GW&K Core Bond ESG Fund |
|
Based on Actual Fund Return |
| | | | |
Class N | | 0.88% | | $1,000 | | $1,021 | | $4.47 |
| | | | |
Class I | | 0.55% | | $1,000 | | $1,023 | | $2.80 |
| | | | |
Class Z | | 0.48% | | $1,000 | | $1,023 | | $2.44 |
|
Based on Hypothetical 5% Annual Return |
| | | | |
Class N | | 0.88% | | $1,000 | | $1,021 | | $4.47 |
| | | | |
Class I | | 0.55% | | $1,000 | | $1,022 | | $2.80 |
| | | | |
Class Z | | 0.48% | | $1,000 | | $1,023 | | $2.44 |
AMG GW&K Emerging Wealth Equity Fund |
|
Based on Actual Fund Return |
| | | | |
Class N | | 1.26% | | $1,000 | | $1,225 | | $7.05 |
| | | | |
Class I | | 0.97% | | $1,000 | | $1,226 | | $5.43 |
| | | | |
Class Z | | 0.86% | | $1,000 | | $1,227 | | $4.81 |
|
Based on Hypothetical 5% Annual Return |
| | | | |
Class N | | 1.26% | | $1,000 | | $1,019 | | $6.39 |
| | | | |
Class I | | 0.97% | | $1,000 | | $1,020 | | $4.93 |
| | | | |
Class Z | | 0.86% | | $1,000 | | $1,021 | | $4.37 |
| | | | | | | | |
| | | | |
Six Months Ended October 31, 2020 | | Expense
Ratio for
the Period | | Beginning
Account
Value
05/01/20 | | Ending
Account
Value
10/31/20 | | Expenses
Paid
During
the Period* |
AMG GW&K Emerging Markets Equity Fund |
|
Based on Actual Fund Return |
| | | | |
Class N | | 1.36% | | $1,000 | | $1,232 | | $7.63 |
| | | | |
Class I | | 1.00% | | $1,000 | | $1,234 | | $5.62 |
| | | | |
Class Z | | 0.93% | | $1,000 | | $1,236 | | $5.23 |
|
Based on Hypothetical 5% Annual Return |
| | | | |
Class N | | 1.36% | | $1,000 | | $1,018 | | $6.90 |
| | | | |
Class I | | 1.00% | | $1,000 | | $1,020 | | $5.08 |
| | | | |
Class Z | | 0.93% | | $1,000 | | $1,020 | | $4.72 |
| * | Expenses are equal to the Fund’s annualized expense ratio multiplied by the average account value over the period, multiplied by the number of days in the most recent fiscal half-year (184), then divided by 366. |
3
|
AMG GW&K Core Bond ESG Fund Portfolio Manager’s Comments (unaudited) |
| | | | | | | | |
For the 12 months ending October 31, 2020, AMG GW&K Core Bond ESG Fund’s (the “Fund)” Class I shares returned 5.55%, compared to the return of 6.19% for the Bloomberg Barclays U.S. Aggregate Bond Index® (the “Index”). OVERVIEW GW&K Investment Management, LLC (“GWK”) believes that responsible corporate behavior with respect to ESG (environmental, social, and governance) factors can lead to positive and sustainable long-term financial performance and aligns with our pursuit of quality investments. GW&K has been incorporating ESG factors into our equity and fixed income analysis process for several years, and as a signatory of the UN Principals for Responsible Investment, we are committed to incorporating the assessment of ESG issues into our fundamental research process. We believe ESG investing adds value to our investment process by improving our assessment of risk and enhancing our ability to identify high quality credits; aids our up-in-quality bias by improving identification of credits with less long-term volatility; limits our exposure to credit ratings downgrades and negative events that are difficult to quantify; and deepens our fundamental credit analysis and leads to better outcomes by providing a more nuanced and complete picture. ESG considerations have long informed our process. We focus on business and credit fundamentals, relative valuation, and technical considerations. We believe ESG factors are important considerations in analyzing a company’s business and financial policy and that they highlight non-financial risks that can significantly affect a company’s financial health over the long term. Just as with credit risks, investors require additional compensation for ESG risks, leading to potential inefficiencies in valuation. MARKET OVERVIEW The end of 2019 saw a sharp turn in sentiment across fixed income markets that led to a selloff in interest rates and further tightening in credit spreads. The primary catalyst for the reversal was the completion of a “phase one” trade agreement between the U.S. and China, though positive signs from the labor market and evidence of stability in global manufacturing lifted sentiment as well. Additionally, the U.S. Federal Reserve (the “Fed”) made it clear that tightening was effectively out of the question until the committee sees meaningful evidence of inflation, suggesting monetary policy is likely to remain accommodative indefinitely. By year-end, | | | | worries of a trade-war-inspired global slowdown or a central bank induced liquidity crisis had been replaced with talk of green shoots, inflection points, and the recession that never was. At the start of 2020, fixed income markets experienced an extraordinarily volatile quarter as COVID-19 evolved into a global pandemic and investors aggressively shed risk assets amid a massive, system-wide deleveraging. Measures enacted to slow the spread of the virus effectively shut down entire segments of the world economy, and the implications for growth, liquidity, and inflation were profound. Expectations for second quarter 2020 pointed to declines of as much as a third of Gross Domestic Product (GDP). Companies began hoarding cash by drawing down lines of credit, and break-evens fell to their lowest level in two decades. Adding to the tumult was the start of a crude price war between Russia and Saudi Arabia, which exacerbated the selloff inspired by an already dire outlook for demand and lead oil to post its worst quarter on record. Sentiment was similarly dismal, as investors struggled to handicap the ultimate duration and severity of the slowdown. They pulled record amounts of cash from investment grade mutual funds and caused dislocations in even the safest corners of the fixed income market, desperate to raise cash by selling anything they could. Fiscal and monetary authorities took significant steps to mitigate the fallout from the virus, but given the unprecedented nature of the threat it posed, the long-term efficacy of these efforts remained an open question. Fixed income markets made gains in the second quarter of 2020, benefiting from ongoing support from the Fed and renewed investor optimism amid the country’s gradual reopening. Data suggested the bottom was likely in, as green shoots across the economy drove the recovery narrative. The consumer proved remarkably resilient, with a V-shaped rebound unfolding in the retail, housing, and auto sectors. Business activity also bounced, as manufacturing sentiment and new orders pointed to a steady pace of progress in returning to pre-pandemic levels. Adding to the turnaround’s momentum were expectations of additional fiscal stimulus, which would not only provide an obvious boost to the economy but also, more importantly, narrow the range of potential adverse outcomes. Despite the unprecedented size and scope of the Fed’s intervention, however, alarming news of rising case counts, renewed lockdowns across the country, and uncertain progress on the development of treatments and vaccines tempered the rally in the | | | | closing weeks. The potential for a significant second wave in the fall loomed as well, and posed a serious threat to investor optimism. On the one hand, the Fed’s relatively downbeat economic outlook ensures that it is likely to provide necessary support for the indefinite future. On the other hand, it paints a challenging picture for the nation’s recovery. The key question fixed income markets faced was which of these two forces would prevail in the coming quarters. Fixed income markets were remarkably subdued in the third quarter, trading in an extremely narrow range despite major economic advances and significant developments epidemiologically and politically. For much of the period, this calm was striking for its apparent insensitivity to the steady progress of the U.S. recovery. The consumer continued to display astonishing resilience, the housing sector soared, and the labor market made major strides in its path back to normalcy. Encouraging results in the hunt for a COVID-19 vaccine and improved outcomes for those infected also seemed to have little impact. Toward the end of the quarter, this muted trading was all the more notable, considering the looming uncertainty investors face heading into year end. Signs had already begun to emerge that the “second wave” was forming, negotiators remained far apart in their efforts to agree on a second round of stimulus, and there was increasing concern that a protracted vote count could result in a weeks-long delay in determining the outcome of the election. Yet the bond market exited the quarter essentially where it started. Of course, the cause of this apparent tranquility is no mystery: The Fed remains absolutely dominant across all corners of the fixed income market. And as its influence continues to overwhelm fundamentals and distort pricing mechanisms, it has become increasingly challenging and all the more important for investors to be discerning in their yield curve positioning and sector allocation. Interest rates rose in October, particularly at the long end, as the market priced in growing odds of a Democratic sweep in the election. While the yield on the 10-year Treasury never broke out of its 0.50%–0.90% post-March trading range, the 2s-to-10s curve spread steepened to its highest level since 2018. For much of the month, the focus was on the prospects for a Phase 4 stimulus package out of Washington, with on-again/off-again negotiations reflected in volatile market swings. Meanwhile, behind the scenes, economic data remained encouraging, as housing stayed strong, consumer spending held up, and labor markets continued to |
4
|
AMG GW&K Core Bond ESG Fund Portfolio Manager’s Comments (continued) |
| | | | | | | | |
heal. We learned that third quarter GDP rebounded sharply, regaining almost two-thirds of lost output from the first half of 2020, leaving the economy only (3.5)% smaller than where it began the year. And yet, over the final week of October, risk aversion once again took center stage, routing oil prices and sending stocks tumbling. Several factors were responsible, from renewed coronavirus-related restrictions in Europe and the United States to jitters over the possibility of a contested U.S. election to changing timetables on the availability of COVID-19 vaccines. For the month, two-year Treasury yields edged up 3 bps while five-, 10-, and 30-year yields rose 11 bps, 19 bps, and 21 bps, respectively. FUND REVIEW The Fund underperformed in the first part of its fiscal year due to its overweight to spread product during the onset of the COVID-19 pandemic. The above-benchmark allocation to investment grade corporate bonds and taxable municipals detracted from returns. Treasuries, on the other hand, outperformed, and the Fund was underweighted. Partially offsetting these headwinds was an overweight to agency mortgage backed securities (“MBS”), which we took advantage of during the market’s indiscriminate selloff in part of March. Subsequently, markets grasped a risk-on tone toward the end of March, as the Fed and fiscal policy backstopped the economy. The Fund’s overweight to investment-grade corporates and taxable municipals served as strong tailwinds during this period. Corporate security selection for the full year was a modest detractor, the majority of which came from the technology sector. Selection in financials also hurt. Partially compensating for these was good selection within consumer cyclicals. Additionally, selection within agency MBS was a positive due to our preference for conventional and specified pools. The yield curve effect was negative. The Fund gained | | | | from its underweight to the long end of the yield curve, which experienced the smallest decrease in rates. However, the Fund’s duration positioning weighed on relative performance at times throughout the year, especially being short duration in March. The Fund’s ESG focus resulted in repositioning in the corporate bond sector during the period. Listed below are examples of trades conducted over the period where ESG factors had a key influence in our decision making process. Purchases throughout the period included: a green bond from stable-business Sysco Corp.; The Ford Foundation for its attractive valuation and favorable ESG characteristics; Xylem Inc. due to its strong ESG profile and solid fundamentals; Equinix Inc. as an opportunity to add a green bond with good fundamentals; National Rural Utilities Cooperative Finance Corp. to add ESG exposure with a newly issued sustainable bond in a defensive utility credit; and The Korea Development Bank to add high quality green bond exposure. Sales during the period included Exelon Inc. for its lower ESG score and Citigroup Inc. because of ESG concerns related to recent operational miscues. OUTLOOK The desultory tone of the rates market highlights the extent to which the Treasury sector has become a policy tool rather than a useful means of price discovery—particularly at the front end, where the effects of the Fed’s intervention are most apparent. The signal farther out is a little clearer and there is some evidence that inflation concerns have begun to influence trading at the long end, but the overall level and shape of the curve nevertheless reflect broad-based skepticism around the 2% target. In light of this tension between an economy with significant excess slack and the Fed’s stated goal, | | | | we are neutral duration across the Fund. But we are expressing this view by underweighting the long end in favor of intermediate maturities. The belly of the curve not only offers relatively attractive carry and roll, it is also less susceptible to an uptick in inflation in the event the Fed is successful sooner than expected. Rates have risen recently, mostly on the long end. Spreads have continued to tighten. As the recovery continues to unfold, we remain constructive on credit relative to Treasuries. The duration of the Treasury market reached yet another record length while its yield continues to sit near a record low. We believe this combination remains an unattractive value proposition and consequently the Fund has minimal exposure to the sector. Credit, meanwhile, is well positioned to benefit from both constructive fundamentals and Fed largesse, while spreads continue to sit wide of recent lows. The Fund remains overweighted in corporate credit, given its superior carry, potential for spread compression, and insulation against rising rates. Within the space, we continue to find high-quality franchises in COVID-19-exposed sectors that we expect to survive the slowdown and be in a strong competitive position on the other side. The Fund has also maintained an out-of-benchmark exposure to fixed-to-floating hybrid preferred bank securities, given their attractive yields and conservatively capitalized balance sheets. Our securitized exposure is neutral, in light of heightened prepayment uncertainty, though within the space we prefer higher-coupon, seasoned pools with more attractive convexity profiles. The views expressed represent the opinions of GW&K Investment Management, LLC as of October 31, 2020, and are not intended as a forecast or guarantee of future results, and are subject to change without notice. |
5
|
AMG GW&K Core Bond ESG Fund Portfolio Manager’s Comments (continued) |
CUMULATIVE TOTAL RETURN PERFORMANCE
AMG GW&K Core Bond ESG Fund’s cumulative total return is based on the daily change in net asset value (NAV), and assumes that all dividends and distributions were reinvested. This graph compares a hypothetical $10,000 investment made in the AMG GW&K Core Bond ESG Fund’s Class I shares on October 31, 2010 to a $10,000 investment made in the Bloomberg Barclays U.S. Aggregate Bond Index® for the same time period. The graph and table do not reflect the deduction of taxes that a shareholder would pay on a Fund distribution or redemption of shares. The listed returns for the Fund are net of expenses and the returns for the index exclude expenses. Total returns would have been lower had certain expenses not been reduced.
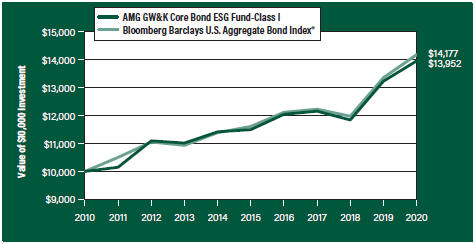
The table below shows the average annual total returns for the AMG GW&K Core Bond ESG Fund and the Bloomberg Barclays U.S. Aggregate Bond Index® for the same time periods ended October 31, 2020.
| | | | | | | | | | | | | | | | | | | | |
| Average Annual Total Returns1 | | One
Year | | | Five
Years | | | Ten
Years | | | Since
Inception | | | Inception
Date | |
AMG GW&K Core Bond ESG Fund2, 3, 4, 5, 6, 7, 8, 9 | |
| | | | | |
Class N | | | 5.31% | | | | 3.64% | | | | — | | | | 3.17% | | | | 05/08/15 | |
| | | | | |
Class I | | | 5.55% | | | | 3.96% | | | | 3.39% | | | | 5.84% | | | | 04/30/93 | |
| | | | | |
Class Z | | | 5.73% | | | | 4.06% | | | | — | | | | 3.59% | | | | 05/08/15 | |
| | | | | |
Bloomberg Barclays U.S. Aggregate Bond Index®10 | | | 6.19% | | | | 4.08% | | | | 3.55% | | | | 5.34% | | | | 04/30/93† | |
The performance data shown represents past performance. Past performance is not a guarantee of future results. Current performance may be lower or higher than the performance data quoted. The investment return and principal value of an investment will fluctuate so that an investor’s shares, when redeemed, may be worth more or less than their original cost.
Investors should carefully consider the Fund’s investment objectives, risks, charges and expenses before investing. For performance information through the most recent month end, current net asset values per share for the Fund and other information, please call 800.548.4539 or visit our website at amgfunds.com for a free prospectus. Read it carefully before investing or sending money.
Distributed by AMG Distributors, Inc., member FINRA/SIPC.
| † | Date reflects inception date of the Fund, not the index. |
| 1 | Total return equals income yield plus share price change and assumes reinvestment of all dividends and capital gain distributions. Returns are net of fees and may reflect offsets of Fund expenses as described in the prospectus. No adjustment has been made for taxes payable by shareholders on their reinvested dividends and |
|
capital gain distributions. Returns for periods greater than one year are annualized. The listed returns on the Fund are net of expenses and based on the published NAV as of October 31, 2020. All returns are in U.S. dollars ($). 2 From time to time, the Fund’s advisor has waived its fees and/or absorbed Fund expenses, which has resulted in higher returns. 3 To the extent that the Fund invests in asset-backed or mortgage-backed securities, its exposure to prepayment and extension risks may be greater than investments in other fixed income securities. 4 Active and frequent trading of a fund may result in higher transaction costs and increased tax liability. 5 The Fund is subject to the risks associated with investments in debt securities, such as default risk and fluctuations in the perception of the debtor’s ability to pay its creditors. Changing interest rates may adversely affect the value of an investment. An increase in interest rates typically causes the value of bonds and other fixed income securities to fall. 6 The Fund may invest in derivatives such as options and futures; the complexity and rapidly changing structure of derivatives markets may increase the possibility of market losses. |
7 Many bonds have call provisions which allow the debtors to pay them back before maturity. This is especially true with mortgage securities, which can be paid back anytime. Typically debtors prepay their debt when it is to their advantage (when interest rates drop making a new loan at current rates more attractive), and thus likely to the disadvantage of bondholders, who may have to reinvest prepayment proceeds in securities with lower yields. Prepayment risk will vary depending on the provisions of the security and current interest rates relative to the interest rate of the debt. |
8 Market prices of investments held by the Fund may fall rapidly or unpredictably due to a variety of economic or political factors, market conditions, disasters or public health issues, or in response to events that affect particular industries or companies. 9 Applying the Fund’s ESG investment criteria may result in the selection or exclusion of securities of certain issuers for reasons other than performance, and the Fund may underperform funds that do not utilize an ESG investment strategy. The application of this strategy may affect the Fund’s exposure to certain companies, sectors, regions, countries or types of investments, which could negatively impact the Fund’s performance depending on whether such investments are in or out of favor. Applying ESG criteria to investment decisions is qualitative and subjective by nature, and there is no guarantee that the criteria utilized by the Subadviser or any judgment exercised by the |
6
|
AMG GW&K Core Bond ESG Fund Portfolio Manager’s Comments (continued) |
| | | | | | | | |
Subadviser will reflect the beliefs or values of any particular investor. 10 The Bloomberg Barclays U.S. Aggregate Bond Index® is an index of the U.S. investment-grade fixed-rate bond market, including both government and corporate bonds. Unlike the Fund, the Bloomberg Barclays U.S. Aggregate Bond Index® is unmanaged, is not available for investment, and does not incur expenses. | | | | Bloomberg Index Services Limited. BLOOMBERG® is a trademark and service mark of Bloomberg Finance L.P. and its affiliates (collectively “Bloomberg”). BARCLAYS® is a trademark and service mark of Barclays Bank Plc (collectively with its affiliates, “Barclays”), used under license. Bloomberg or Bloomberg’s licensors, including Barclays, own all proprietary rights in the Bloomberg Barclays Indices. Neither Bloomberg nor Barclays approves or endorses this material, or guarantees the accuracy | | | | or completeness of any information herein, or makes any warranty, express or implied, as to the results to be obtained therefrom and, to the maximum extent allowed by law, neither shall have any liability or responsibility for injury or damages arising in connection therewith. Not FDIC insured, nor bank guaranteed. May lose value. |
7
|
AMG GW&K Core Bond ESG Fund Fund Snapshots (unaudited) October 31, 2020 |
PORTFOLIO BREAKDOWN
| | |
| Category | | % of Net Assets |
| | |
Corporate Bonds and Notes | | 48.8 |
| | |
U.S. Government and Agency Obligations | | 40.0 |
| | |
Municipal Bonds | | 8.5 |
| | |
Foreign Government Obligations | | 0.7 |
| | |
Other Assets Less Liabilities | | 2.0 |
| |
| Rating | | % of Market Value1 |
| | |
U.S. Government and Agency Obligations | | 40.9 |
| | |
Aaa/AAA | | 3.3 |
| | |
Aa/AA | | 14.9 |
| | |
A | | 16.4 |
| | |
Baa/BBB | | 24.5 |
| 1 | Includes market value of long-term fixed-income securities only. |
TOP TEN HOLDINGS
| | |
| Security Name | | % of
Net Assets |
| | |
United States Treasury Notes, 4.500%, 02/15/36 | | 4.4 |
| | |
FHLMC, 2.500%, 10/01/34 | | 2.3 |
| | |
FNMA, 4.500%, 06/01/41 | | 2.3 |
| | |
FNMA, 4.500%, 04/01/39 | | 2.0 |
| | |
California State General Obligation, School Improvements, 7.550%, 04/01/39 | | 2.0 |
| | |
Oracle Corp., 2.500%, 04/01/25 | | 2.0 |
| | |
FNMA, 4.500%, 04/01/39 | | 2.0 |
| | |
FHLMC, 2.500%, 08/01/50 | | 2.0 |
| | |
Verizon Communications, Inc., 3.875%, 02/08/29 | | 2.0 |
| | |
Campbell Soup Co., 4.150%, 03/15/28 | | 2.0 |
| | | |
| | |
Top Ten as a Group | | 23.0 |
| | |
Credit quality ratings shown above reflect the highest rating assigned by either Standard & Poor’s (“S&P”) or Moody’s Investors Service, Inc. (“Moody’s”). These rating agencies are independent, nationally recognized statistical rating organizations and are widely used. Investment grade ratings are credit ratings of BBB/Baa or higher. Below investment grade ratings are credit ratings of BB/Ba or lower. Investments designated N/R are not rated by any of the rating agencies. Unrated investments do not necessarily indicate low credit quality. Credit quality ratings are subject to change.
Because a fund’s strategy may result in multiple investments in particular sectors of the economy, its performance may depend on the performance of those sectors and may fluctuate more widely than investments diversified across more sectors. For additional information on these and other risk considerations, please see the Fund’s prospectus.
Any sectors, industries, or securities discussed should not be perceived as investment recommendations. Mention of a specific security should not be considered a recommendation to buy or solicitation to sell that security. Specific securities mentioned in this report may have been sold from the Fund’s portfolio of investments by the time you receive this report.
8
|
AMG GW&K Core Bond ESG Fund Schedule of Portfolio Investments October 31, 2020 |
| | | | | | | | |
| | | Principal
Amount | | | Value | |
| |
Corporate Bonds and Notes - 48.8% | | | | | |
| | |
Financials - 12.1% | | | | | | | | |
| | |
Bank of America Corp. | | | | | | | | |
Series MM, (4.300% to 01/28/25 then 3 month LIBOR + 2.664%), 4.300%, 01/28/251,2,3 | | | $2,129,000 | | | | $2,079,777 | |
| | |
The Bank of New York Mellon Corp. | | | | | | | | |
MTN, 2.450%, 08/17/26 | | | 987,000 | | | | 1,074,440 | |
| | |
Boston Properties, LP | | | | | | | | |
3.400%, 06/21/29 | | | 1,945,000 | | | | 2,111,821 | |
| | |
The Charles Schwab Corp. | | | | | | | | |
Series G, (5.375% to 06/01/25 then U.S. Treasury Yield Curve CMT 5 year + 4.971%), 5.375%, 06/01/251,2,3 | | | 2,926,000 | | | | 3,209,237 | |
| | |
Crown Castle International Corp. | | | | | | | | |
4.000%, 03/01/27 | | | 1,840,000 | | | | 2,080,642 | |
| | |
Equinix, Inc. | | | | | | | | |
1.000%, 09/15/25 | | | 1,050,000 | | | | 1,046,779 | |
| | |
The Goldman Sachs Group, Inc. | | | | | | | | |
3.500%, 11/16/26 | | | 2,794,000 | | | | 3,095,518 | |
| | |
JPMorgan Chase & Co. | | | | | | | | |
Series FF, (5.000% to 08/01/24 then SOFRRATE + 3.380%), 5.000%, 08/01/241,2,3 | | | 2,059,000 | | | | 2,060,740 | |
| | |
MetLife, Inc. | | | | | | | | |
Series G, (3.850% to 09/15/25 then U.S. Treasury Yield Curve CMT 5 year + 3.576%), 3.850%, 09/15/251,2,3 | | | 2,109,000 | | | | 2,120,304 | |
| | |
Morgan Stanley, GMTN | | | | | | | | |
(4.431% to 01/23/29 then 3 month LIBOR + 1.628%), 4.431%, 01/23/301,3 | | | 1,725,000 | | | | 2,068,584 | |
| | |
Truist Financial Corp. | | | | | | | | |
Series N, (4.800% to 09/01/24 then U.S. Treasury Yield Curve CMT 5 year + 3.003%), 4.800%, 09/01/241,2,3 | | | 1,036,000 | | | | 1,045,349 | |
| | |
Visa, Inc. | | | | | | | | |
3.150%, 12/14/25 | | | 2,753,000 | | | | 3,064,450 | |
| | |
Total Financials | | | | | | | 25,057,641 | |
| | |
Industrials - 35.7% | | | | | | | | |
| | |
Apple, Inc. | | | | | | | | |
2.900%, 09/12/27 | | | 1,868,000 | | | | 2,082,756 | |
| | |
AT&T, Inc. | | | | | | | | |
4.250%, 03/01/27 | | | 1,826,000 | | | | 2,101,796 | |
| | |
Automatic Data Processing, Inc. | | | | | | | | |
3.375%, 09/15/25 | | | 2,771,000 | | | | 3,122,660 | |
| | |
BorgWarner, Inc. | | | | | | | | |
2.650%, 07/01/27 | | | 2,044,000 | | | | 2,148,244 | |
| | |
Campbell Soup Co. | | | | | | | | |
4.150%, 03/15/28 | | | 3,516,000 | | | | 4,074,702 | |
| | |
Comcast Corp. | | | | | | | | |
4.150%, 10/15/28 | | | 1,761,000 | | | | 2,096,400 | |
| | |
CommonSpirit Health | | | | | | | | |
3.347%, 10/01/29 | | | 2,394,000 | | | | 2,503,937 | |
| | | | | | | | |
| | | | | | | | |
| | | Principal
Amount | | | Value | |
| | |
Costco Wholesale Corp. | | | | | | | | |
1.600%, 04/20/30 | | | $2,049,000 | | | | $2,073,366 | |
| | |
CVS Health Corp. | | | | | | | | |
5.125%, 07/20/45 | | | 1,785,000 | | | | 2,262,745 | |
| | |
Fiserv, Inc. | | | | | | | | |
4.200%, 10/01/28 | | | 1,785,000 | | | | 2,100,249 | |
| | |
The Ford Foundation | | | | | | | | |
Series 2020, 2.415%, 06/01/50 | | | 2,357,000 | | | | 2,314,094 | |
| | |
The George Washington University | | | | | | | | |
Series 2018, 4.126%, 09/15/48 | | | 2,726,000 | | | | 3,223,972 | |
| | |
Georgia-Pacific LLC | | | | | | | | |
8.000%, 01/15/24 | | | 1,583,000 | | | | 1,939,515 | |
| | |
Johnson Controls International plc/Tyco Fire & Security Finance SCA (Ireland) | | | | | | | | |
1.750%, 09/15/30 | | | 2,100,000 | | | | 2,092,550 | |
| | |
Kaiser Foundation Hospitals | | | | | | | | |
3.150%, 05/01/27 | | | 1,915,000 | | | | 2,114,066 | |
| | |
Lear Corp. | | | | | | | | |
3.800%, 09/15/27 | | | 1,991,000 | | | | 2,136,191 | |
| | |
Lowe’s Cos., Inc. | | | | | | | | |
4.000%, 04/15/25 | | | 1,852,000 | | | | 2,100,141 | |
| | |
Magna International, Inc. (Canada) | | | | | | | | |
2.450%, 06/15/30 | | | 2,037,000 | | | | 2,141,572 | |
| | |
McDonald’s Corp., MTN | | | | | | | | |
3.700%, 01/30/26 | | | 2,301,000 | | | | 2,598,968 | |
| | |
Microsoft Corp. | | | | | | | | |
2.525%, 06/01/50 | | | 2,263,000 | | | | 2,315,892 | |
| | |
Oracle Corp. | | | | | | | | |
2.500%, 04/01/25 | | | 3,933,000 | | | | 4,211,516 | |
| | |
Parker-Hannifin Corp. | | | | | | | | |
3.250%, 06/14/29 | | | 1,914,000 | | | | 2,151,957 | |
| | |
Precision Castparts Corp. | | | | | | | | |
3.250%, 06/15/25 | | | 1,866,000 | | | | 2,063,755 | |
| | |
RELX Capital, Inc. | | | | | | | | |
4.000%, 03/18/29 | | | 1,881,000 | | | | 2,183,558 | |
| | |
ServiceNow, Inc. | | | | | | | | |
1.400%, 09/01/30 | | | 2,130,000 | | | | 2,061,423 | |
| | |
Sysco Corp. | | | | | | | | |
2.400%, 02/15/30 | | | 2,424,000 | | | | 2,468,732 | |
| | |
T-Mobile USA, Inc. | | | | | | | | |
3.500%, 04/15/254 | | | 1,000,000 | | | | 1,096,610 | |
| | |
TWDC Enterprises 18 Corp., MTN | | | | | | | | |
1.850%, 07/30/26 | | | 2,007,000 | | | | 2,104,314 | |
| | |
Verizon Communications, Inc. | | | | | | | | |
3.875%, 02/08/29 | | | 3,527,000 | | | | 4,133,623 | |
| | |
VF Corp. | | | | | | | | |
2.800%, 04/23/27 | | | 2,023,000 | | | | 2,185,793 | |
| | |
Xylem, Inc. | | | | | | | | |
2.250%, 01/30/31 | | | 2,064,000 | | | | 2,161,388 | |
| | |
Total Industrials | | | | | | | 74,366,485 | |
| | | | | | | | |
The accompanying notes are an integral part of these financial statements.
9
|
AMG GW&K Core Bond ESG Fund Schedule of Portfolio Investments (continued) |
| | | | | | | | |
| | | Principal
Amount | | | Value | |
| | |
Utilities - 1.0% | | | | | | | | |
| | |
National Rural Utilities Cooperative Finance Corp. | | | | | | | | |
1.350%, 03/15/31 | | | $2,086,000 | | | | $2,052,336 | |
| | |
Total Corporate Bonds and Notes | | | | | | | | |
(Cost $95,490,877) | | | | | | | 101,476,462 | |
| | |
Municipal Bonds - 8.5% | | | | | | | | |
| | |
California State General Obligation, School Improvements | | | | | | | | |
7.550%, 04/01/39 | | | 2,475,000 | | | | 4,256,950 | |
| | |
JobsOhio Beverage System | | | | | | | | |
Series B, 4.532%, 01/01/35 | | | 1,735,000 | | | | 2,199,928 | |
| | |
Los Angeles Unified School District, School Improvements | | | | | | | | |
5.750%, 07/01/34 | | | 2,685,000 | | | | 3,643,438 | |
| | |
Massachusetts School Building Authority | | | | | | | | |
Series B, 1.753%, 08/15/30 | | | 2,142,000 | | | | 2,125,999 | |
| | |
Metropolitan Transportation Authority | | | | | | | | |
6.687%, 11/15/40 | | | 1,825,000 | | | | 2,168,301 | |
| | |
University of California, University & College Improvements | | | | | | | | |
Series BD, 3.349%, 07/01/29 | | | 2,985,000 | | | | 3,356,632 | |
| | |
Total Municipal Bonds | | | | | | | | |
(Cost $16,413,392) | | | | | | | 17,751,248 | |
| | |
| U.S. Government and Agency Obligations - 40.0% | | | | | | | | |
| | |
Fannie Mae - 21.0% | | | | | | | | |
| | |
FNMA | | | | | | | | |
2.000%, 08/01/50 to 09/01/50 | | | 2,721,283 | | | | 2,808,513 | |
3.500%, 03/01/30 to 03/01/48 | | | 10,131,909 | | | | 11,081,970 | |
4.000%, 03/01/44 to 07/01/49 | | | 9,789,094 | | | | 10,835,347 | |
4.500%, 04/01/39 to 06/01/41 | | | 13,834,394 | | | | 15,506,509 | |
5.000%, 08/01/40 | | | 3,082,645 | | | | 3,556,130 | |
| | |
Total Fannie Mae | | | | | | | 43,788,469 | |
| | |
Freddie Mac - 11.7% | | | | | | | | |
| | |
FHLMC | | | | | | | | |
1.500%, 11/01/50 | | | 819,000 | | | | 826,118 | |
2.000%, 09/01/50 | | | 1,667,857 | | | | 1,721,319 | |
| | | | | | | | |
| | | | | | | | |
| | | Principal
Amount | | | Value | |
| | |
FHLMC | | | | | | | | |
2.500%, 10/01/34 to 08/01/50 | | | $8,394,727 | | | | $8,893,949 | |
5.000%, 07/01/44 | | | 2,449,011 | | | | 2,823,664 | |
| | |
FHLMC Gold Pool | | | | | | | | |
3.500%, 07/01/32 to 05/01/44 | | | 2,231,881 | | | | 2,461,494 | |
4.000%, 05/01/26 | | | 115,158 | | | | 122,243 | |
| | |
FHLMC Multifamily Structured Pass Through Certificates | | | | | | | | |
Series K054, Class A2 2.745%, 01/25/26 | | | 1,472,000 | | | | 1,612,189 | |
Series K058, Class A2 2.653%, 08/25/26 | | | 191,000 | | | | 210,513 | |
Series K062, Class A2 3.413%, 12/25/26 | | | 513,000 | | | | 587,673 | |
Series K063, Class A2 3.430%, 01/25/273 | | | 2,544,000 | | | | 2,912,857 | |
Series K071, Class A2 3.286%, 11/25/27 | | | 1,912,000 | | | | 2,205,394 | |
| | |
Total Freddie Mac | | | | | | | 24,377,413 | |
| |
U.S. Treasury Obligations - 7.3% | | | | | |
| | |
United States Treasury Bonds | | | | | | | | |
4.500%, 02/15/36 | | | 6,137,000 | | | | 9,075,089 | |
| | |
United States Treasury Notes | | | | | | | | |
2.000%, 11/30/22 | | | 3,863,000 | | | | 4,010,579 | |
6.250%, 08/15/23 | | | 1,785,000 | | | | 2,086,288 | |
| | |
Total U.S. Treasury Obligations | | | | | | | 15,171,956 | |
| | |
Total U.S. Government and Agency Obligations | | | | | | | | |
(Cost $78,738,432) | | | | | | | 83,337,838 | |
| |
Foreign Government Obligation - 0.7% | | | | | |
| | |
The Korea Development Bank (South Korea) | | | | | | | | |
0.500%, 10/27/23 | | | | | | | | |
(Cost $1,381,526) | | | 1,385,000 | | | | 1,386,083 | |
| | |
Total Foreign Government Obligation | | | | | | | | |
(Cost $1,381,526) | | | | | | | 1,386,083 | |
| | |
Total Investments - 98.0% | | | | | | | | |
(Cost $192,024,227) | | | | | | | 203,951,631 | |
| |
Other Assets, less Liabilities - 2.0% | | | | 4,127,896 | |
| | |
Net Assets - 100.0% | | | | | | | $208,079,527 | |
| | | | | | | | |
| 1 | Fixed to variable rate investment. The rate shown reflects the fixed rate in effect at October 31, 2020. Rate will reset at a future date. |
| 2 | Perpetuity Bond. The date shown represents the next call date. |
| 3 | Variable rate security. The rate shown is based on the latest available information as of October 31, 2020. Certain variable rate securities are not based on a published reference rate and spread but are determined by the issuer or agent and are based on current market conditions. These securities do not indicate a reference rate and spread in their description above. |
| 4 | Security exempt from registration under Rule 144A of the Securities Act of 1933. This security may be resold in transactions exempt from registration, normally to qualified institutional buyers. At October 31, 2020, the value of these securities amounted to $1,096,610 or 0.5% of net assets. |
| | |
CMT FHLMC FNMA GMTN LIBOR MTN SOFRRATE | | Constant Maturity Treasury Freddie Mac Fannie Mae Global Medium-Term Notes London Interbank Offered Rate Medium-Term Note Secured Overnight Financing Rate |
The accompanying notes are an integral part of these financial statements.
10
|
AMG GW&K Core Bond ESG Fund Schedule of Portfolio Investments (continued) |
The following table summarizes the inputs used to value the Fund’s investments by the fair value hierarchy levels as of October 31, 2020:
| | | | | | | | | | | | | | | | | | | | |
| | | Level 1 | | Level 2 | | Level 3 | | Total |
Investments in Securities | | | | | | | | | | | | | | | | | | | | |
Corporate Bonds and Notes† | | | | — | | | | | $101,476,462 | | | | | — | | | | | $101,476,462 | |
Municipal Bonds | | | | — | | | | | 17,751,248 | | | | | — | | | | | 17,751,248 | |
U.S. Government and Agency Obligations† | | | | — | | | | | 83,337,838 | | | | | — | | | | | 83,337,838 | |
Foreign Government Obligation | | | | — | | | | | 1,386,083 | | | | | — | | | | | 1,386,083 | |
| | | | | | | | | | | | | | | | | | | | |
Total Investments in Securities | | | | — | | | | | $203,951,631 | | | | | — | | | | | $203,951,631 | |
| | | | | | | | | | | | | | | | | | | | |
| † | All corporate bonds and notes and U.S. government and agency obligations held in the Fund are Level 2 securities. For a detailed breakout of corporate bonds and notes and U.S. government and agency obligations by major industry or agency classification, please refer to the Fund’s Schedule of Portfolio Investments. |
For the fiscal year ended October 31, 2020, there were no transfers in or out of Level 3.
The accompanying notes are an integral part of these financial statements.
11
|
AMG GW&K Emerging Wealth Equity Fund Portfolio Manager’s Comments (unaudited) |
| | | | | | | | |
MARKET OVERVIEW Despite the economic impact of pandemic containment measures, emerging markets delivered respectable performance for the year ended October 2020; the MSCI Emerging Markets Index (“MSCI EM”) advanced 8.25%. The headline result does not tell the whole story, however, as returns varied markedly across regions. Thanks to the size, scale, and exceptional performance of China, Taiwan, and South Korea, Asia more than offset negative results in Latin America and Europe, Middle East and Africa (“EMEA”). North Asia’s economic activity quickly returned to normal thanks to robust public health measures. China and Taiwan are among the few major countries in the world to report positive year-on-year GDP growth in the third quarter of 2020, with gains of 4.9% and 3.3%, respectively. In addition, favorable exposure to information technology demand, particularly semiconductors, supported business activity in Taiwan and South Korea. As a result, the MSCI Asia Index returned 20.1% for the period. In contrast, Latin America and EMEA have fared poorly in terms of both public health and economic performance, as noted in the performance of their equity markets. The MSCI EM Latin America Index declined (33.1%), while the MSCI EMEA Index fell (18.0%). Weak oil prices have been an issue for both regions, as the price of Brent crude oil declined sharply over the past year. On a sector level, consumer discretionary 47.6%, information technology 35.3%, communication services 33.3%, and health care 32.0% were the strongest performing sectors while energy (29.9%), utilities (21.0%), and financials (20.5%) were down the most. | | | | FUND REVIEW AMG GW&K Emerging Wealth Equity Fund’s (the “Fund”) Class N shares returned 14.37%, compared to an 8.25% return for its benchmark, the MSCI EM for the fiscal year ended October 31, 2020. Much lower exposure to Latin America and EMEA had a positive impact on relative performance, as did the Fund’s developed market holdings, led by Infineon Technologies AG and QUALCOMM, Inc. Looking at performance on a sector basis, less exposure to the traditional banking industry in financials was a large contributor to performance, as was the Fund’s underweight allocation to the hard hit energy sector. Positive stock selection in the consumer staples sector was also additive as China’s leading baijiu spirits producer, Wuliangye Yibin Co., Ltd. performed well throughout the year, despite a challenging environment. Both an overweight allocation and stock selection in the health care sector also added significant value to fiscal year performance. Ping An Healthcare and Technology Co., Ltd., China’s leading online doctor consultation service, rallied on an increase in online consultations due to COVID-19. Finally, underweight allocations to the utilities, real estate, and industrials sectors helped relative performance. While the Fund’s overweight allocation to the consumer discretionary sector had a positive effect, this was offset by stock selection, and the sector ultimately detracted. Travel-related stocks, such as Macau based Sands China, Ltd, remain under pressure due to the negative impact of virus containment measures. Maruti Suzuki India, Ltd. also declined amid tough economic conditions in India. | | | | OUTLOOK AND PORTFOLIO POSITIONING As an efficacious COVID-19 vaccine becomes a closer reality, we are confident that a coordinated global economic recovery will unfold over the next several years. The U.S. dollar will likely remain benign or possibly decline versus a range of currencies as the country works to finance deficits at historically low interest rates. If history is any guide, EM equities should benefit from both economic recovery and potential dollar weakness. Relative equity valuations also remain a plus for EM, with the Shiller price/earnings ratio for the MSCI EM trading at 13.5x compared to 16.2x for the MSCI EAFE Index and 26.5x for the S&P 500® Index. With respect to the Fund’s structure, trading and market activity during the fiscal year resulted in increased exposure to the consumer discretionary and health care sectors while our weights in financials, industrials, communication services, information technology, materials, and consumer staples decreased. At the close of the period, the Fund had overweight positions in the consumer discretionary, health care, and financials sectors and underweight positions in the information technology, communication services, materials, energy, industrials sectors, real estate, utilities and consumer staples relative to the benchmark. Geographically, the portfolio finished the fiscal year with exposures of 75% in EM Asia, 20% in developed markets, and 5% in EM Latin America. The views expressed represent the opinions of GW&K Investment Management, LLC as of October 31, 2020, and are not intended as a forecast or guarantee of future results, and are subject to change without notice. |
12
|
AMG GW&K Emerging Wealth Equity Fund Portfolio Manager’s Comments (continued) |
CUMULATIVE TOTAL RETURN PERFORMANCE
AMG GW&K Emerging Wealth Equity Fund’s cumulative total return is based on the daily change in net asset value (NAV), and assumes that all dividends and distributions were reinvested. This graph compares a hypothetical $10,000 investment made in the AMG GW&K Emerging Wealth Equity Fund’s Class N shares on March 19, 2015 (inception date), to a $10,000 investment made in the MSCI Emerging Markets Index for the same time period. The graph and table do not reflect the deduction of taxes that a shareholder would pay on a Fund distribution or redemption of shares. The listed returns for the Fund are net of expenses and the returns for the index exclude expenses. Total returns would have been lower had certain expenses not been reduced.
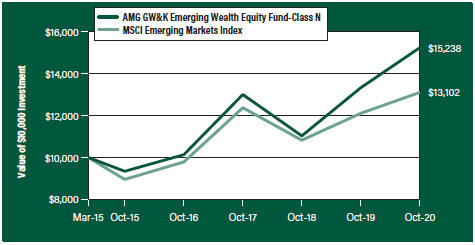
The table below shows the average annual total returns for the AMG GW&K Emerging Wealth Equity Fund and the MSCI Emerging Markets Index for the same time periods ended October 31, 2020.
| | | | | | | | | | | | | | | | |
| Average Annual Total Returns1 | | One
Year | | | Five
Years | | | Since
Inception | | | Inception
Date | |
AMG GW&K Emerging Wealth Equity Fund2, 3, 4, 5, 6, 7, 8, 9 | | | | | | | | | |
| | | | |
Class N | | | 14.37 | % | | | 10.29 | % | | | 7.78 | % | | | 03/19/15 | |
| | | | |
Class I | | | 14.63 | % | | | 10.60 | % | | | 8.06 | % | | | 03/19/15 | |
| | | | |
Class Z | | | 14.75 | % | | | 10.70 | % | | | 8.17 | % | | | 03/19/15 | |
| | | | |
MSCI Emerging Markets Index10 | | | 8.25 | % | | | 7.92 | % | | | 4.92 | % | | | 03/19/15 | † |
The performance data shown represents past performance. Past performance is not a guarantee of future results. Current performance may be lower or higher than the performance data quoted. The investment return and principal value of an investment will fluctuate so that an investor’s shares, when redeemed, may be worth more or less than their original cost.
Investors should carefully consider the Fund’s investment objectives, risks, charges and expenses before investing. For performance information through the most recent month end, current net asset values per share for the Fund and other information, please call 800.548.4539 or visit our website at amgfunds.com for a free prospectus. Read it carefully before investing or sending money.
Distributed by AMG Distributors, Inc., member FINRA/SIPC.
| † | Date reflects inception date of the Fund, not the index. |
| 1 | Total return equals income yield plus share price change and assumes reinvestment of all dividends and capital gain distributions. Returns are net of fees and may reflect offsets of Fund expenses as described in the prospectus. No adjustment has been made for taxes payable by shareholders on their reinvested dividends and |
|
capital gain distributions. Returns for periods greater than one year are annualized. The listed returns on the Fund are net of expenses and based on the published NAV as of October 31, 2020. All returns are in U.S. dollars ($). 2 Investments in international securities are subject to certain risks of overseas investing including currency fluctuations and changes in political and economic conditions, which could result in significant market fluctuations. These risks are magnified in emerging markets. 3 The Fund is subject to the risks associated with investments in emerging markets, such as erratic earnings patterns, economic and political instability, changing exchange controls, limitations on repatriation of foreign capital and changes in local governmental attitudes toward private investment, possibly leading to nationalization or confiscation of investor assets. 4 The Fund is subject to currency risk resulting from fluctuations in exchange rates that may affect the total loss or gain on a non-U.S. Dollar investment when converted back to U.S. Dollars. 5 The Fund may invest in derivatives such as options and futures; the complexity and rapidly changing structure of derivatives markets may increase the possibility of market losses. 6 The Fund is subject to risks associated with investments in mid-capitalization companies such as greater price volatility, lower trading volume, and less liquidity than the stocks of larger, more established companies. 7 The Fund is subject to risks associated with investments in small-capitalization companies, such as erratic earnings patterns, competitive conditions, limited earnings history and a reliance on one or a limited number of products. |
8 Market prices of investments held by the Fund may fall rapidly or unpredictably due to a variety of economic or political factors, market conditions, disasters or public health issues, or in response to events that affect particular industries or companies. 9 Companies that are in similar businesses may be similarly affected by particular economic or market events; to the extent the Fund has substantial holdings within a particular sector, the risks associated with that sector increase. 10 The MSCI Emerging Markets Index is a free float-adjusted market capitalization index that is designed to measure equity market performance of emerging markets. Please go to msci.com for most current list of countries represented by the index. Unlike the Fund, the MSCI Emerging Markets Index is unmanaged, is not available for investment and does not incur expenses. |
13
|
AMG GW&K Emerging Wealth Equity Fund Portfolio Manager’s Comments (continued) |
| | | | | | | | |
All MSCI data is provided “as is.” The products described herein are not sponsored or endorsed and have not been reviewed or passed on by MSCI. In no event shall MSCI, its affiliates or any MSCI data | | | | provider have any liability of any kind in connection with the MSCI data or the products described herein. Copying or redistributing the MSCI data is strictly prohibited. | | | | Not FIDC insured, not bank guaranteed. May lose value. |
14
|
AMG GW&K Emerging Wealth Equity Fund Fund Snapshots (unaudited) October 31, 2020 |
PORTFOLIO BREAKDOWN
| | |
| Sector | | % of
Net Assets |
| | |
Consumer Discretionary | | 44.3 |
| | |
Financials | | 20.0 |
| | |
Information Technology | | 9.6 |
| | |
Health Care | | 7.8 |
| | |
Communication Services | | 6.1 |
| | |
Consumer Staples | | 5.1 |
| | |
Materials | | 2.4 |
| | |
Other Assets Less Liabilities | | 4.7 |
TOP TEN HOLDINGS
| | |
| Security Name | | % of
Net Assets |
Alibaba Group Holding, Ltd., Sponsored ADR (China) | | 10.0 |
| | |
Sands China, Ltd. (Macau) | | 5.4 |
| | |
QUALCOMM, Inc. | | 4.9 |
| | |
HDFC Bank, Ltd., ADR (India) | | 4.7 |
| | |
Trip.com Group, Ltd., ADR (China) | | 4.5 |
| | |
Yum China Holdings, Inc. (China) | | 4.2 |
| | |
Infineon Technologies AG (Germany) | | 4.0 |
| | |
Kotak Mahindra (India) | | 3.5 |
| | |
AIA Group, Ltd. (Hong Kong) | | 3.4 |
| | |
Ping An Insurance Group Co. of China, Ltd., Class H (China) | | 3.4 |
| | | |
| | |
Top Ten as a Group | | 48.0 |
| | |
Because a fund’s strategy may result in multiple investments in particular sectors of the economy, its performance may depend on the performance of those sectors and may fluctuate more widely than investments diversified across more sectors. For additional information on these and other risk considerations, please see the Fund’s prospectus.
Any sectors, industries, or securities discussed should not be perceived as investment recommendations. Mention of a specific security should not be considered a recommendation to buy or solicitation to sell that security. Specific securities mentioned in this report may have been sold from the Fund’s portfolio of investments by the time you receive this report.
15
|
AMG GW&K Emerging Wealth Equity Fund Schedule of Portfolio Investments October 31, 2020 |
| | | | | | | | |
| | | Shares | | | Value | |
| | |
Common Stocks - 95.3% | | | | | | | | |
| | |
Communication Services - 6.1% | | | | | | | | |
| | |
Tencent Holdings, Ltd. (China) | | | 56,390 | | | | $4,308,515 | |
| | |
Tencent Music Entertainment Group, ADR (China)* | | | 426,059 | | | | 6,339,758 | |
| | |
The Walt Disney Co. (United States) | | | 18,318 | | | | 2,221,057 | |
| | |
Total Communication Services | | | | | | | 12,869,330 | |
| | |
Consumer Discretionary - 44.3% | | | | | | | | |
| | |
Alibaba Group Holding, Ltd., Sponsored ADR (China)* | | | 68,731 | | | | 20,941,648 | |
| | |
Booking Holdings, Inc. (United States)* | | | 1,248 | | | | 2,024,880 | |
| | |
Eicher Motors, Ltd. (India) | | | 102,980 | | | | 2,898,156 | |
| | |
Haidilao International Holding, Ltd. (China)1,2 | | | 236,000 | | | | 1,563,217 | |
| | |
Hermes International (France) | | | 2,119 | | | | 1,972,995 | |
| | |
Huazhu Group, Ltd., ADR (China)2 | | | 130,109 | | | | 5,156,220 | |
| | |
Jubilant Foodworks, Ltd. (India) | | | 132,038 | | | | 3,872,393 | |
| | |
LVMH Moet Hennessy Louis Vuitton SE (France) | | | 6,375 | | | | 2,988,256 | |
| | |
MakeMyTrip, Ltd. (India)*,2 | | | 253,700 | | | | 4,761,949 | |
| | |
Maruti Suzuki India, Ltd. (India) | | | 22,275 | | | | 2,092,153 | |
| | |
Moncler SpA (Italy)* | | | 83,683 | | | | 3,348,289 | |
| | |
New Oriental Education & Technology Group, Inc., Sponsored ADR (China)* | | | 11,303 | | | | 1,812,775 | |
| | |
NIKE, Inc., Class B (United States) | | | 17,539 | | | | 2,106,083 | |
| | |
Sands China, Ltd. (Macau) | | | 3,251,600 | | | | 11,411,828 | |
| | |
Starbucks Corp. (United States) | | | 19,326 | | | | 1,680,589 | |
| | |
TAL Education Group, ADR (China)* | | | 56,530 | | | | 3,756,984 | |
| | |
Titan Co., Ltd. (India) | | | 151,280 | | | | 2,381,024 | |
| | |
Trip.com Group, Ltd., ADR (China)* | | | 332,492 | | | | 9,562,470 | |
| | |
Yum China Holdings, Inc. (China) | | | 164,988 | | | | 8,782,311 | |
| | |
Total Consumer Discretionary | | | | | | | 93,114,220 | |
| | |
Consumer Staples - 5.1% | | | | | | | | |
| | |
The Estee Lauder Cos., Inc., Class A (United States) | | | 5,510 | | | | 1,210,327 | |
| | |
Foshan Haitian Flavouring & Food Co., Ltd., Class A (China) | | | 19,400 | | | | 464,312 | |
| | |
LG Household & Health Care, Ltd. (South Korea) | | | 3,314 | | | | 4,393,965 | |
| | |
Wal-Mart de Mexico, S.A.B. de CV (Mexico) | | | 760,570 | | | | 1,841,590 | |
| | |
Wuliangye Yibin Co., Ltd., Class A (China) | | | 77,103 | | | | 2,819,071 | |
| | |
Total Consumer Staples | | | | | | | 10,729,265 | |
| | |
Financials - 20.0% | | | | | | | | |
| | |
AIA Group, Ltd. (Hong Kong) | | | 759,100 | | | | 7,224,489 | |
| | | | | | | | |
| | | Shares | | | Value | |
| | |
China International Capital Corp., Ltd., Class H (China)*,1 | | | 1,063,600 | | | | $2,485,196 | |
| | |
Credicorp, Ltd. (Peru) | | | 17,688 | | | | 2,028,460 | |
| | |
Grupo Financiero Banorte, S.A.B de CV, Class O (Mexico)* | | | 1,121,804 | | | | 5,003,072 | |
| | |
HDFC Bank, Ltd., ADR (India)* | | | 173,283 | | | | 9,953,375 | |
| | |
Hong Kong Exchanges & Clearing, Ltd. (Hong Kong) | | | 20,300 | | | | 972,750 | |
| | |
Kotak Mahindra (India)* | | | 349,686 | | | | 7,297,439 | |
| | |
Ping An Insurance Group Co. of China, Ltd., Class H (China) | | | 681,250 | | | | 7,043,903 | |
| | |
Total Financials | | | | | | | 42,008,684 | |
| | |
Health Care - 7.8% | | | | | | | | |
| | |
Alibaba Health Information Technology, Ltd. (Hong Kong)* | | | 165,602 | | | | 434,280 | |
| | |
China Resources Sanjiu Medical & Pharmaceutical Co., Ltd., Class A (China) | | | 1,116,381 | | | | 4,520,825 | |
| | |
CSPC Pharmaceutical Group, Ltd. (China) | | | 329,600 | | | | 350,011 | |
| | |
Jiangsu Hengrui Medicine Co., Ltd., Class A (China) | | | 94,184 | | | | 1,252,697 | |
| | |
Meinian Onehealth Healthcare Holdings Co., Ltd., Class A (China)* | | | 1,440,748 | | | | 3,676,303 | |
| | |
Novo Nordisk A/S, Class B (Denmark) | | | 48,024 | | | | 3,062,282 | |
| | |
Ping An Healthcare and Technology Co., Ltd. (China)*,1 | | | 250,110 | | | | 3,227,337 | |
| | |
Total Health Care | | | | | | | 16,523,735 | |
| | |
Information Technology - 9.6% | | | | | | | | |
| | |
Infineon Technologies AG (Germany) | | | 302,435 | | | | 8,420,119 | |
| | |
Mastercard, Inc., Class A (United States) | | | 4,935 | | | | 1,424,438 | |
| | |
QUALCOMM, Inc. (United States) | | | 83,124 | | | | 10,254,177 | |
| | |
Total Information Technology | | | | | | | 20,098,734 | |
| | |
Materials - 2.4% | | | | | | | | |
| | |
Asian Paints, Ltd. (India) | | | 147,898 | | | | 4,411,335 | |
| | |
Chr Hansen Holding A/S (Denmark) | | | 7,423 | | | | 749,054 | |
| | |
Total Materials | | | | | | | 5,160,389 | |
| | |
Total Common Stocks | | | | | | | | |
(Cost $165,261,054) | | | | | | | 200,504,357 | |
| | |
Total Investments - 95.3% | | | | | | | | |
(Cost $165,261,054) | | | | | | | 200,504,357 | |
| | |
Other Assets, less Liabilities - 4.7% | | | | | | | 9,779,715 | |
| | |
Net Assets - 100.0% | | | | | | | $210,284,072 | |
The accompanying notes are an integral part of these financial statements.
16
|
AMG GW&K Emerging Wealth Equity Fund Schedule of Portfolio Investments (continued) |
| * | Non-income producing security. |
| 1 | Security exempt from registration under Rule 144A of the Securities Act of 1933. This security may be resold in transactions exempt from registration, normally to qualified institutional buyers. At October 31, 2020, the value of these securities amounted to $7,275,750 or 3.5% of net assets. |
| 2 | Some of these securities, amounting to $7,345,204 or 3.5% of net assets, were out on loan to various borrowers and are collateralized by various U.S. Treasury Obligations. See Note 4 of Notes to Financial Statements. |
| ADR | American Depositary Receipt |
The following table summarizes the inputs used to value the Fund’s investments by the fair value hierarchy levels as of October 31, 2020:
| | | | | | | | | | | | | | | | | | | | |
| | | Level 1 | | Level 21 | | Level 3 | | Total |
Investments in Securities | | | | | | | | | | | | | | | | | | | | |
Common Stocks | | | | | | | | | | | | | | | | | | | | |
Consumer Discretionary | | | | $63,484,065 | | | | | $29,630,155 | | | | | — | | | | | $93,114,220 | |
Financials | | | | 16,984,907 | | | | | 25,023,777 | | | | | — | | | | | 42,008,684 | |
Information Technology | | | | 11,678,615 | | | | | 8,420,119 | | | | | — | | | | | 20,098,734 | |
Health Care | | | | — | | | | | 16,523,735 | | | | | — | | | | | 16,523,735 | |
Communication Services | | | | 8,560,815 | | | | | 4,308,515 | | | | | — | | | | | 12,869,330 | |
Consumer Staples | | | | 3,051,917 | | | | | 7,677,348 | | | | | — | | | | | 10,729,265 | |
Materials | | | | — | | | | | 5,160,389 | | | | | — | | | | | 5,160,389 | |
| | | | | | | | | | | | | | | | | | | | |
Total Investments in Securities | | | | $103,760,319 | | | | | $96,744,038 | | | | | — | | | | | $200,504,357 | |
| | | | | | | | | | | | | | | | | | | | |
| 1 | An external pricing service is used to reflect any impact on security value due to market movements between the time the Fund valued such foreign securities and the earlier closing of foreign markets. |
For the fiscal year ended October 31, 2020, there were no transfers in or out of Level 3.
The country allocation in the Schedule of Portfolio Investments at October 31, 2020, was as follows:
| | |
| Country | | % of Long-Term
Investments |
China | | 43.9 |
Denmark | | 1.9 |
France | | 2.5 |
Germany | | 4.2 |
Hong Kong | | 4.3 |
India | | 18.8 |
Italy | | 1.7 |
Macau | | 5.7 |
Mexico | | 3.4 |
Peru | | 1.0 |
South Korea | | 2.2 |
United States | | 10.4 |
| | |
| | 100.0 |
| | |
The accompanying notes are an integral part of these financial statements.
17
|
AMG GW&K Emerging Markets Equity Fund Portfolio Manager’s Comments (unaudited) |
| | | | |
MARKET OVERVIEW Despite the economic impact of pandemic containment measures, emerging markets delivered respectable performance for the year ended October 2020; the MSCI Emerging Markets Index (“MSCI EM”) advanced 8.25%. The headline result does not tell the entire story, however, as returns varied markedly across regions. Thanks to the size, scale, and exceptional performance of China, Taiwan, and South Korea, Asia more than offset negative results in Latin America and Europe, Middle East and Africa (“EMEA”). North Asia’s economic activity quickly returned to normal thanks to robust public health measures. China and Taiwan are among the few major countries in the world to report positive year-on-year GDP growth in the third quarter of 2020, with gains of 4.9% and 3.3%, respectively. In addition, favorable exposure to information technology demand, particularly semiconductors, supported business activity in Taiwan and South Korea. As a result, the MSCI Asia Index returned 20.1% for the period. In contrast, Latin America and EMEA have fared poorly in terms of both public health and economic performance, as noted in the performance of their equity markets. The MSCI EM Latin America Index declined (33.1%), while the MSCI EMEA Index fell (18.0%). Weak oil prices have been an issue for both regions, as the price of Brent crude oil declined sharply over the past year. On a sector level, consumer discretionary 47.6%, information technology 35.3%, communication services 33.3%, and health care 32.0% were the strongest performing sectors while energy (29.9%), utilities (21.0%), and financials (20.5%) were down the most. | | FUND REVIEW AMG GW&K Emerging Markets Equity Fund’s (the “Fund”) Class Z shares returned 8.01%, compared to an 8.25% return for its benchmark, the MSCI EM, for the fiscal year ended October 31, 2020. Regional allocation was a key factor in the performance shortfall due to the portfolio’s higher exposure to struggling Latin American markets. In addition, the portfolio’s bank holdings, particularly Brazil’s Banco Bradesco S.A. and Itau Unibanco Holding S.A., came under pressure over credit quality concerns in the wake of the pandemic. Recent company updates have been encouraging and both stocks have recovered from mid fiscal year lows. Notwithstanding the portfolio’s strong consumer discretionary performance, not owning all the Chinese internet service companies detracted from the sector’s relative results. Stock selection in the health care sector detracted from performance due to the portfolio’s lack of exposure to Indian and Chinese pharmaceutical companies. Positive sector highlights include an underweight position and strong stock selection in energy, thanks to standout performance from Indian oil marketing company Reliance Industries. Stock selection in consumer staples was also positive, as China’s leading baijiu spirits producer, Wuliangye Yibin Co., Ltd. delivered strong sales throughout the year. Taiwan Semiconductor Manufacturing Co., Ltd reported earnings well ahead of estimates and took the lead in the portfolio’s information technology sector, which also outperformed the Index. Less exposure to the weaker performing utilities and real estate sectors helped on a relative basis. | | OUTLOOK AND PORTFOLIO POSITIONING As an efficacious COVID-19 vaccine becomes a closer reality, we are confident that a coordinated global economic recovery will unfold over the next several years. The U.S. dollar will likely remain benign or possibly decline versus a range of currencies as the country works to finance deficits at historically low interest rates. If history is any guide, EM equities should benefit from both economic recovery and potential dollar weakness. Relative equity valuations also remain a plus for EM, with the Shiller price/earnings ratio for the MSCI EM trading at 13.5x compared to 16.2x for the MSCI EAFE Index and 26.5x for the S&P 500® Index. With respect to the Fund’s structure, trading and market activity during the fiscal year resulted in increased exposures to the information technology, consumer discretionary, and communication services sectors while our weights in financials, industrials, energy, real estate, and consumer staples decreased. At the close of the period, the Fund had overweight positions in the consumer discretionary, information technology, financials, consumer staples, and communication services sectors and underweight positions in the materials, energy, real estate, industrials, utilities, and health care sectors relative to the benchmark. Geographically, the portfolio finished the fiscal year with 79% in Asia, 9% in Latin America, and 8% in the EMEA region, including a small cash balance. The views expressed represent the opinions of GW&K Investment Management, LLC as of October 31, 2020, and are not intended as a forecast or guarantee of future results, and are subject to change without notice. |
18
|
AMG GW&K Emerging Markets Equity Fund Portfolio Manager’s Comments (continued) |
CUMULATIVE TOTAL RETURN PERFORMANCE
AMG GW&K Emerging Markets Equity Fund’s cumulative total return is based on the daily change in net asset value (NAV), and assumes that all dividends and distributions were reinvested. This graph compares a hypothetical $10,000 investment made in the AMG GW&K Emerging Markets Equity Fund’s Class Z shares on March 01, 2011 (inception date), to a $10,000 investment made in the MSCI Emerging Markets Index for the same time period. The graph and table do not reflect the deduction of taxes that a shareholder would pay on a Fund distribution or redemption of shares. The listed returns for the Fund are net of expenses and the returns for the index exclude expenses. Total returns would have been lower had certain expenses not been reduced.
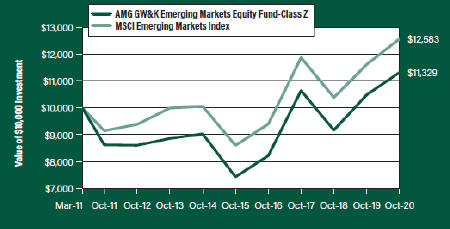
The table below shows the average annual total returns for the AMG GW&K Emerging Markets Equity Fund and the MSCI Emerging Markets Index for the same time periods ended October 31, 2020.
| | | | | | | | | | | | | | | | |
Average Annual Total Returns1 | | One
Year | | | Five
Years | | | Since
Inception | | | Inception
Date | |
AMG GW&K Emerging Markets Equity Fund2, 3, 4, 5, 6, 7, 8, 9, 10, 11 | |
| | | | |
Class N | | | 7.55 | % | | | 8.35 | % | | | 1.78% | | | | 03/01/12 | |
| | | | |
Class I | | | 7.91 | % | | | 8.70 | % | | | 1.20% | | | | 03/01/11 | |
| | | | |
Class Z | | | 8.01 | % | | | 8.83 | % | | | 1.30% | | | | 03/01/11 | |
| | | | |
MSCI Emerging Markets Index12 | | | 8.25 | % | | | 7.92 | % | | | 2.41% | | | | 03/01/11 | † |
The performance data shown represents past performance. Past performance is not a guarantee of future results. Current performance may be lower or higher than the performance data quoted. The investment return and principal value of an investment will fluctuate so that an investor’s shares, when redeemed, may be worth more or less than their original cost.
Investors should carefully consider the Fund’s investment objectives, risks, charges and expenses before investing. For performance information through the most recent month end, current net asset values per share for the Fund and other information, please call 800.548.4539 or visit our website at amgfunds.com for a free prospectus. Read it carefully before investing or sending money.
Distributed by AMG Distributors, Inc., member FINRA/SIPC.
| † | Date reflects inception date of the Fund, not the index. |
| 1 | Total return equals income yield plus share price change and assumes reinvestment of all dividends and capital gain distributions. Returns are net of fees and may reflect offsets of Fund expenses as described in the prospectus. No adjustment has been made for taxes payable by shareholders on their reinvested dividends and |
|
capital gain distributions. Returns for periods greater than one year are annualized. The listed returns on the Fund are net of expenses and based on the published NAV as of October 31, 2020. All returns are in U.S. dollars ($). 2 The Fund is subject to currency risk resulting from fluctuations in exchange rates that may affect the total loss or gain on a non-U.S. Dollar investment when converted back to U.S. Dollars. 3 Market prices of investments held by the Fund may fall rapidly or unpredictably due to a variety of economic or political factors, market conditions, disasters or public health issues, or in response to events that affect particular industries or companies. 4 The Fund may invest in derivatives such as options and futures; the complexity and rapidly changing structure of derivatives markets may increase the possibility of market losses. 5 The Fund is subject to the risks associated with investments in emerging markets, such as erratic earnings patterns, economic and political instability, changing exchange controls, limitations on repatriation of foreign capital and changes in local governmental attitudes toward private investment, possibly leading to nationalization or confiscation of investor assets. 6 The Fund invests in growth stocks, which may be more sensitive to market movements because their prices tend to reflect future investor expectations rather than just current profits. Growth stocks may underperform value stocks during given periods. |
7 Investments in international securities are subject to certain risks of overseas investing including currency fluctuations and changes in political and economic conditions, which could result in significant market fluctuations. These risks are magnified in emerging markets. 8 Investing in initial public offerings (IPOs) is risky and the prices of stocks purchased in IPOs tend to fluctuate more widely than stocks of companies that have been publicly traded for a longer period of time. Stocks purchased in IPOs generally do not have a trading history, and information about the companies may be available for very limited periods. 9 The Fund is subject to risks associated with investments in mid-capitalization companies such as greater price volatility, lower trading volume, and less liquidity than the stocks of larger, more established companies. 10 Companies that are in similar businesses may be similarly affected by particular economic or market events; to the extent the Fund has substantial holdings within a particular sector, the risks associated with that sector increase. |
19
|
AMG GW&K Emerging Markets Equity Fund Portfolio Manager’s Comments (continued) |
| | | | | | | | |
11 The Fund is subject to risks associated with investments in small-capitalization companies, such as erratic earnings patterns, competitive conditions, limited earnings history and a reliance on one or a limited number of products. | | | | 12 The MSCI Emerging Markets Index is a free float-adjusted market capitalization index that is designed to measure equity market performance of emerging markets. Please go to msci.com for most current list of countries represented by the index. Unlike the Fund, the MSCI Emerging Markets Index is unmanaged, is not available for investment and does not incur expenses. | | | | All MSCI data is provided “as is.” The products described herein are not sponsored or endorsed and have not been reviewed or passed on by MSCI. In no event shall MSCI, its affiliates or any MSCI data provider have any liability of any kind in connection with the MSCI data or the products described herein. Copying or redistributing the MSCI data is strictly prohibited. Not FDIC insured, nor bank guaranteed. May lose value. |
20
|
AMG GW&K Emerging Markets Equity Fund Fund Snapshots (unaudited) October 31, 2020 |
PORTFOLIO BREAKDOWN
| | |
| Sector | | % of
Net Assets |
| | |
Consumer Discretionary | | 23.7 |
| | |
Information Technology | | 21.2 |
| | |
Financials | | 19.4 |
| | |
Communication Services | | 14.4 |
| | |
Consumer Staples | | 8.0 |
| | |
Health Care | | 3.8 |
| | |
Industrials | | 2.4 |
| | |
Energy | | 2.2 |
| | |
Materials | | 1.1 |
| | |
Other Assets Less Liabilities | | 3.8 |
TOP TEN HOLDINGS
| | |
| Security Name | | % of
Net Assets |
Alibaba Group Holding, Ltd., Sponsored ADR (China) | | 8.2 |
| | |
Taiwan Semiconductor Manufacturing Co., Ltd. (Taiwan) | | 6.9 |
| | |
Tencent Holdings, Ltd. (China) | | 6.2 |
| | |
Samsung Electronics Co., Ltd. (South Korea) | | 4.7 |
| | |
Prosus, N.V. (Netherlands) | | 2.8 |
| | |
HDFC Bank, Ltd. (India) | | 2.6 |
| | |
Housing Development Finance Corp., Ltd. (India) | | 2.6 |
| | |
Ping An Insurance Group Co. of China, Ltd., Class H (China) | | 2.4 |
| | |
Tencent Music Entertainment Group, ADR (China) | | 2.1 |
| | |
Baidu, Inc., Sponsored ADR (China) | | 1.9 |
| | | |
| | |
Top Ten as a Group | | 40.4 |
| | | |
Because a fund’s strategy may result in multiple investments in particular sectors of the economy, its performance may depend on the performance of those sectors and may fluctuate more widely than investments diversified across more sectors. For additional information on these and other risk considerations, please see the Fund’s prospectus.
Any sectors, industries, or securities discussed should not be perceived as investment recommendations. Mention of a specific security should not be considered a recommendation to buy or solicitation to sell that security. Specific securities mentioned in this report may have been sold from the Fund’s portfolio of investments by the time you receive this report.
21
|
AMG GW&K Emerging Markets Equity Fund Schedule of Portfolio Investments October 31, 2020 |
| | | | | | | | |
| | | Shares | | | Value | |
| | |
Common Stocks - 96.2% | | | | | | | | |
| | |
Communication Services - 14.4% | | | | | | | | |
| | |
Autohome, Inc., ADR (China) | | | 1,881 | | | | $179,730 | |
| | |
Baidu, Inc., Sponsored ADR
(China)* | | | 6,177 | | | | 821,850 | |
| | |
MultiChoice Group (South Africa) | | | 61,858 | | | | 510,136 | |
| | |
NetEase, Inc., ADR (China) | | | 6,165 | | | | 535,060 | |
| | |
Telekomunikasi Indonesia Persero Tbk PT (Indonesia) | | | 1,348,521 | | | | 238,769 | |
| | |
Tencent Holdings, Ltd. (China) | | | 35,506 | | | | 2,712,859 | |
| | |
Tencent Music Entertainment Group, ADR (China)* | | | 61,422 | | | | 913,959 | |
| | |
Zee Entertainment Enterprises, Ltd. (India) | | | 161,549 | | | | 409,155 | |
| | |
Total Communication Services | | | | | | | 6,321,518 | |
| | |
Consumer Discretionary - 23.7% | | | | | | | | |
| | |
Alibaba Group Holding, Ltd., Sponsored ADR (China)* | | | 11,791 | | | | 3,592,600 | |
| | |
Feng TAY Enterprise Co., Ltd. (Taiwan) | | | 119,916 | | | | 727,920 | |
| | |
Huazhu Group, Ltd., ADR (China)1 | | | 5,550 | | | | 219,946 | |
| | |
MakeMyTrip, Ltd. (India)*,1 | | | 22,548 | | | | 423,226 | |
| | |
Maruti Suzuki India, Ltd. (India) | | | 1,600 | | | | 150,278 | |
| | |
Midea Group Co., Ltd., Class A (China) | | | 46,585 | | | | 543,656 | |
| | |
Naspers, Ltd., N Shares
(South Africa)* | | | 2,663 | | | | 519,891 | |
| | |
New Oriental Education & Technology Group, Inc., Sponsored ADR
(China)* | | | 3,087 | | | | 495,093 | |
| | |
Prosus, N.V. (Netherlands) | | | 12,612 | | | | 1,259,127 | |
| | |
Sands China, Ltd. (Macau) | | | 189,439 | | | | 664,856 | |
| | |
Shenzhou International Group Holdings, Ltd. (China) | | | 30,160 | | | | 524,765 | |
| | |
Trip.com Group, Ltd., ADR
(China)* | | | 23,677 | | | | 680,951 | |
| | |
Yum China Holdings, Inc. (China) | | | 11,417 | | | | 607,727 | |
| | |
Total Consumer Discretionary | | | | | | | 10,410,036 | |
| | |
Consumer Staples - 8.0% | | | | | | | | |
| | |
Bid Corp., Ltd. (South Africa) | | | 33,397 | | | | 459,804 | |
| | |
CP All PCL (Thailand)* | | | 126,168 | | | | 217,199 | |
| | |
Dino Polska, S.A. (Poland)*,2 | | | 7,153 | | | | 393,268 | |
| | |
Fomento Economico Mexicano, S.A.B de CV (Mexico) | | | 46,396 | | | | 249,593 | |
| | |
Inner Mongolia Yili Industrial Group Co., Ltd., Class A (China) | | | 34,500 | | | | 205,019 | |
| | |
LG Household & Health Care, Ltd. (South Korea) | | | 385 | | | | 510,464 | |
| | |
Orion Corp. (South Korea) | | | 3,619 | | | | 346,768 | |
| | |
Wal-Mart de Mexico, S.A.B. de CV (Mexico) | | | 232,838 | | | | 563,777 | |
| | |
Wuliangye Yibin Co., Ltd., Class A (China) | | | 15,500 | | | | 566,717 | |
| | |
Total Consumer Staples | | | | | | | 3,512,609 | |
| | | | | | | | |
| | | | | | | | |
| | | Shares | | | Value | |
| | |
Energy - 2.2% | | | | | | | | |
| | |
Novatek PJSC, Sponsored GDR (Russia) | | | 3,214 | | | | $387,522 | |
| | |
Reliance Industries, Ltd. (India) | | | 21,388 | | | | 592,978 | |
| | |
Total Energy | | | | | | | 980,500 | |
| | |
Financials - 19.4% | | | | | | | | |
| | |
AIA Group, Ltd. (Hong Kong) | | | 68,368 | | | | 650,670 | |
| | |
Banco Bradesco, S.A., ADR (Brazil) | | | 126,069 | | | | 441,242 | |
| | |
Bank Mandiri Persero Tbk PT (Indonesia) | | | 828,016 | | | | 322,538 | |
| | |
Bank Rakyat Indonesia Persero Tbk PT (Indonesia) | | | 1,651,601 | | | | 373,876 | |
| | |
BDO Unibank, Inc. (Philippines) | | | 155,785 | | | | 285,268 | |
| | |
China International Capital Corp., Ltd., Class H (China)*,2 | | | 174,800 | | | | 408,436 | |
| | |
Credicorp, Ltd. (Peru) | | | 4,316 | | | | 494,959 | |
| | |
Grupo Financiero Banorte, S.A.B de CV, Class O (Mexico)* | | | 137,042 | | | | 611,186 | |
| | |
HDFC Bank, Ltd. (India)* | | | 71,240 | | | | 1,137,698 | |
| | |
Housing Development Finance Corp., Ltd. (India) | | | 43,669 | | | | 1,132,916 | |
| | |
Itau Unibanco Holding, S.A., Sponsored ADR (Brazil) | | | 55,642 | | | | 227,576 | |
| | |
Noah Holdings, Ltd., ADR (China)* | | | 4,819 | | | | 126,884 | |
| | |
OTP Bank Plc (Hungary)* | | | 11,945 | | | | 372,619 | |
| | |
Ping An Insurance Group Co. of China, Ltd., Class H (China) | | | 103,720 | | | | 1,072,431 | |
| | |
Sberbank of Russia PJSC, Sponsored ADR (Russia) | | | 73,485 | | | | 742,304 | |
| | |
Turkiye Garanti Bankasi, A.S.
(Turkey)* | | | 134,938 | | | | 106,535 | |
| | |
Total Financials | | | | | | | 8,507,138 | |
| | |
Health Care - 3.8% | | | | | | | | |
| | |
Alibaba Health Information Technology, Ltd. (Hong Kong)* | | | 44,000 | | | | 115,387 | |
| | |
China Resources Sanjiu Medical & Pharmaceutical Co., Ltd., Class A (China) | | | 105,000 | | | | 425,201 | |
| | |
Fleury, S.A. (Brazil) | | | 103,931 | | | | 497,743 | |
| | |
Meinian Onehealth Healthcare Holdings Co., Ltd., Class A
(China)* | | | 133,000 | | | | 339,371 | |
| | |
Odontoprev, S.A. (Brazil) | | | 124,811 | | | | 271,028 | |
| | |
Total Health Care | | | | | | | 1,648,730 | |
| | |
Industrials - 2.4% | | | | | | | | |
| | |
Adani Ports & Special Economic Zone, Ltd. (India) | | | 79,283 | | | | 384,573 | |
| | |
Grupo Aeroportuario del Pacifico, S.A.B de CV, Class B (Mexico) | | | 35,762 | | | | 297,743 | |
| | |
Shanghai International Airport Co., Ltd., Class A (China) | | | 35,569 | | | | 351,881 | |
| | |
Total Industrials | | | | | | | 1,034,197 | |
| | | | | | | | |
The accompanying notes are an integral part of these financial statements.
22
|
AMG GW&K Emerging Markets Equity Fund Schedule of Portfolio Investments (continued) |
| | | | | | | | |
| | | Shares | | | Value | |
| | |
Information Technology - 21.2% | | | | | | | | |
| | |
Advantech Co., Ltd. (Taiwan) | | | 33,727 | | | | $341,447 | |
| | |
Delta Electronics, Inc. (Taiwan) | | | 84,100 | | | | 559,553 | |
| | |
GDS Holdings, Ltd., ADR (China)*,1 | | | 2,750 | | | | 231,110 | |
| | |
Infosys, Ltd., Sponsored ADR (India) | | | 41,369 | | | | 590,336 | |
| | |
Kingsoft Corp., Ltd. (China) | | | 43,000 | | | | 231,307 | |
| | |
MediaTek, Inc. (Taiwan) | | | 28,000 | | | | 665,568 | |
| | |
Pagseguro Digital, Ltd., Class A (Brazil)* | | | 10,657 | | | | 390,153 | |
| | |
Samsung Electronics Co., Ltd. (South Korea) | | | 40,767 | | | | 2,049,179 | |
| | |
SK Hynix, Inc. (South Korea) | | | 9,484 | | | | 672,822 | |
| | |
Sunny Optical Technology Group Co., Ltd. (China) | | | 17,376 | | | | 288,496 | |
| | | | | | | | |
| | | Shares | | | Value | |
| | |
Taiwan Semiconductor Manufacturing Co., Ltd. (Taiwan) | | | 199,632 | | | | $3,020,367 | |
| | |
Tata Consultancy Services, Ltd. (India) | | | 7,060 | | | | 254,446 | |
| | |
Total Information Technology | | | | | | | 9,294,784 | |
| | |
Materials - 1.1% | | | | | | | | |
| | |
UPL, Ltd. (India) | | | 80,933 | | | | 494,475 | |
| | |
Total Common Stocks
(Cost $31,988,093) | | | | | | | 42,203,987 | |
| | |
Total Investments - 96.2%
(Cost $31,988,093) | | | | | | | 42,203,987 | |
| | |
Other Assets, less Liabilities - 3.8% | | | | | | | 1,650,372 | |
| | |
Net Assets - 100.0% | | | | | | | $43,854,359 | |
| * | Non-income producing security. |
| 1 | Some of these securities, amounting to $865,468 or 2.0% of net assets, were out on loan to various borrowers and are collateralized by various U.S. Treasury Obligations. See Note 4 of Notes to Financial Statements. |
| 2 | Security exempt from registration under Rule 144A of the Securities Act of 1933. This security may be resold in transactions exempt from registration, normally to qualified institutional buyers. At October 31, 2020, the value of these securities amounted to $801,704 or 1.8% of net assets. |
ADR American Depositary Receipt
GDR Global Depositary Receipt
The following table summarizes the inputs used to value the Fund’s investments by the fair value hierarchy levels as of October 31, 2020:
| | | | | | | | | | | | | | | | |
| | | Level 1 | | | Level 21 | | | Level 3 | | | Total | |
Investments in Securities | | | | | | | | | | | | | | | | |
| | | | |
Common Stocks | | | | | | | | | | | | | | | | |
| | | | |
Consumer Discretionary | | | $6,019,543 | | | | $4,390,493 | | | | — | | | | $10,410,036 | |
| | | | |
Information Technology | | | 1,211,599 | | | | 8,083,185 | | | | — | | | | 9,294,784 | |
| | | | |
Financials | | | 1,901,847 | | | | 6,605,291 | | | | — | | | | 8,507,138 | |
| | | | |
Communication Services | | | 2,450,599 | | | | 3,870,919 | | | | — | | | | 6,321,518 | |
| | | | |
Consumer Staples | | | 813,370 | | | | 2,699,239 | | | | — | | | | 3,512,609 | |
| | | | |
Health Care | | | 768,771 | | | | 879,959 | | | | — | | | | 1,648,730 | |
| | | | |
Industrials | | | 297,743 | | | | 736,454 | | | | — | | | | 1,034,197 | |
| | | | |
Energy | | | — | | | | 980,500 | | | | — | | | | 980,500 | |
| | | | |
Materials | | | — | | | | 494,475 | | | | — | | | | 494,475 | |
| | | | | | | | | | | | | | | | |
Total Investments in Securities | | | $13,463,472 | | | | $28,740,515 | | | | — | | | | $42,203,987 | |
| | | | | | | | | | | | | | | | |
| | 1 | An external pricing service is used to reflect any impact on security value due to market movements between the time the Fund valued such foreign securities and the earlier closing of foreign markets. |
For the fiscal year ended October 31, 2020, there were no transfers in or out of Level 3.
The accompanying notes are an integral part of these financial statements.
23
|
AMG GW&K Emerging Markets Equity Fund Schedule of Portfolio Investments (continued) |
The country allocation in the Schedule of Portfolio Investments at October 31, 2020, was as follows:
| | | | | |
| Country | | % of Long-Term
Investments |
| |
Brazil | | | | 4.3 | |
| |
China | | | | 38.1 | |
| |
Hong Kong | | | | 1.8 | |
| |
Hungary | | | | 0.9 | |
| |
India | | | | 13.2 | |
| |
Indonesia | | | | 2.2 | |
| |
Macau | | | | 1.6 | |
| |
Mexico | | | | 4.1 | |
| |
Netherlands | | | | 3.0 | |
| |
Peru | | | | 1.2 | |
| |
Philippines | | | | 0.7 | |
| |
Poland | | | | 0.9 | |
| |
Russia | | | | 2.7 | |
| |
South Africa | | | | 3.5 | |
| |
South Korea | | | | 8.5 | |
| |
Taiwan | | | | 12.6 | |
| |
Thailand | | | | 0.5 | |
| |
Turkey | | | | 0.2 | |
| | | | | |
| |
| | | | 100.0 | |
| | | | | |
The accompanying notes are an integral part of these financial statements.
24
|
Statement of Assets and Liabilities October 31, 2020 |
| | | | | | | | | | | | | | | |
| | | AMG GW&K Core
Bond
ESG Fund | | AMG GW&K
Emerging Wealth
Equity Fund | | AMG GW&K
Emerging Markets
Equity Fund |
Assets: | | | | | | | | | | | | | | | |
Investments at value1 (including securities on loan valued at $0, $7,345,204, and $865,468, respectively) | | | | $203,951,631 | | | | | $200,504,357 | | | | | $42,203,987 | |
Cash | | | | 2,854,804 | | | | | 9,732,532 | | | | | 959,259 | |
Foreign currency2 | | | | — | | | | | 272,807 | | | | | 439,615 | |
Receivable for investments sold | | | | 554,051 | | | | | — | | | | | 231,986 | |
Dividend and interest receivables | | | | 1,188,398 | | | | | 63,853 | | | | | 93,377 | |
Securities lending income receivable | | | | — | | | | | 2,066 | | | | | 110 | |
Receivable for Fund shares sold | | | | 158,110 | | | | | 73,278 | | | | | 9,492 | |
Receivable from affiliate | | | | 14,822 | | | | | — | | | | | 5,582 | |
Prepaid expenses and other assets | | | | 13,289 | | | | | 16,788 | | | | | 8,836 | |
Total assets | | | | 208,735,105 | | | | | 210,665,681 | | | | | 43,952,244 | |
Liabilities: | | | | | | | | | | | �� | | | | |
Payable for investments purchased | | | | 481,604 | | | | | — | | | | | — | |
Payable for Fund shares repurchased | | | | 15,872 | | | | | 86,441 | | | | | 7,000 | |
Payable for foreign capital gains tax | | | | — | | | | | 106,120 | | | | | — | |
Accrued expenses: | | | | | | | | | | | | | | | |
Investment advisory and management fees | | | | 53,187 | | | | | 98,929 | | | | | 20,619 | |
Administrative fees | | | | 26,594 | | | | | 26,981 | | | | | 5,623 | |
Distribution fees | | | | 394 | | | | | 372 | | | | | 90 | |
Shareholder service fees | | | | 13,179 | | | | | 2,668 | | | | | 6,558 | |
Other | | | | 64,748 | | | | | 60,098 | | | | | 57,995 | |
| | | |
Total liabilities | | | | 655,578 | | | | | 381,609 | | | | | 97,885 | |
| | | |
| | | | | | | | | | | | | | | |
| | | |
Net Assets | | | | $208,079,527 | | | | | $210,284,072 | | | | | $43,854,359 | |
1 Investments at cost | | | | $192,024,227 | | | | | $165,261,054 | | | | | $31,988,093 | |
2 Foreign currency at cost | | | | — | | | | | $270,341 | | | | | $434,300 | |
The accompanying notes are an integral part of these financial statements.
25
|
Statement of Assets and Liabilities (continued) |
| | | | | | | | | | | | | | | |
| | | AMG GW&K Core
Bond
ESG Fund | | AMG GW&K
Emerging Wealth
Equity Fund | | AMG GW&K
Emerging Markets
Equity Fund |
| | | |
Net Assets Represent: | | | | | | | | | | | | | | | |
Paid-in capital | | | | $196,576,458 | | | | | $178,819,306 | | | | | $32,386,468 | |
Total distributable earnings | | | | 11,503,069 | | | | | 31,464,766 | | | | | 11,467,891 | |
Net Assets | | | | $208,079,527 | | | | | $210,284,072 | | | | | $43,854,359 | |
| | | |
Class N: | | | | | | | | | | | | | | | |
Net Assets | | | | $1,905,230 | | | | | $1,716,223 | | | | | $411,924 | |
Shares outstanding | | | | 174,786 | | | | | 129,257 | | | | | 42,326 | |
| | | |
Net asset value, offering and redemption price per share | | | | $10.90 | | | | | $13.28 | | | | | $9.73 | |
Class I: | | | | | | | | | | | | | | | |
Net Assets | | | | $202,362,758 | | | | | $22,813,334 | | | | | $19,250,954 | |
Shares outstanding | | | | 18,558,182 | | | | | 1,705,430 | | | | | 1,987,671 | |
| | | |
Net asset value, offering and redemption price per share | | | | $10.90 | | | | | $13.38 | | | | | $9.69 | |
Class Z: | | | | | | | | | | | | | | | |
Net Assets | | | | $3,811,539 | | | | | $185,754,515 | | | | | $24,191,481 | |
Shares outstanding | | | | 349,741 | | | | | 13,923,697 | | | | | 2,510,311 | |
| | | |
Net asset value, offering and redemption price per share | | | | $10.90 | | | | | $13.34 | | | | | $9.64 | |
The accompanying notes are an integral part of these financial statements.
26
|
Statements of Operations For the fiscal year ended October 31, 2020 |
| | | | | | | | | | | | |
| | | AMG GW&K Core
Bond
ESG Fund | | | AMG GW&K
Emerging Wealth
Equity Fund | | | AMG GW&K
Emerging Markets
Equity Fund | |
Investment Income: | | | | | | | | | | | | |
Dividend income | | | $17,505 | | | | $1,511,387 | | | | $826,655 | |
Interest income | | | 5,440,398 | | | | 295 | | | | — | |
Securities lending income | | | — | | | | 25,536 | | | | 2,896 | |
Foreign withholding tax | | | — | | | | (107,803 | ) | | | (112,548 | ) |
Total investment income | | | 5,457,903 | | | | 1,429,415 | | | | 717,003 | |
Expenses: | | | | | | | | | | | | |
Investment advisory and management fees | | | 638,009 | | | | 865,518 | | | | 267,454 | |
Administrative fees | | | 319,004 | | | | 236,050 | | | | 72,942 | |
Distribution fees - Class N | | | 3,985 | | | | 4,374 | | | | 2,375 | |
Shareholder servicing fees - Class N | | | 2,391 | | | | 2,625 | | | | 1,425 | |
Shareholder servicing fees - Class I | | | 154,620 | | | | 15,677 | | | | 13,205 | |
Professional fees | | | 55,756 | | | | 55,056 | | | | 61,382 | |
Reports to shareholders | | | 44,538 | | | | 22,407 | | | | 8,989 | |
Registration fees | | | 44,080 | | | | 55,413 | | | | 48,313 | |
Custodian fees | | | 30,352 | | | | 90,788 | | | | 70,996 | |
Transfer agent fees | | | 20,042 | | | | 6,589 | | | | 2,163 | |
Trustee fees and expenses | | | 19,576 | | | | 13,511 | | | | 4,470 | |
Miscellaneous | | | 9,153 | | | | 5,706 | | | | 6,835 | |
Total expenses before offsets | | | 1,341,506 | | | | 1,373,714 | | | | 560,549 | |
Expense reimbursements | | | (159,696 | ) | | | — | | | | (85,815 | ) |
Fee waivers | | | — | | | | — | | | | (738 | ) |
Net expenses | | | 1,181,810 | | | | 1,373,714 | | | | 473,996 | |
| | | |
| | | | | | | | | | | | |
Net investment income | | | 4,276,093 | | | | 55,701 | | | | 243,007 | |
Net Realized and Unrealized Gain: | | | | | | | | | | | | |
Net realized gain (loss) on investments | | | 3,844,884 | | | | (3,341,676 | ) | | | 1,772,151 | |
Net realized loss on foreign currency transactions | | | — | | | | (22,214 | ) | | | (24,601 | ) |
Net change in unrealized appreciation/depreciation on investments | | | 3,478,614 | | | | 24,559,222 | | | | 1,493,011 | |
Net change in unrealized appreciation/depreciation on foreign currency translations | | | — | | | | 26,444 | | | | 12,388 | |
Net realized and unrealized gain | | | 7,323,498 | | | | 21,221,776 | | | | 3,252,949 | |
| | | |
| | | | | | | | | | | | |
Net increase in net assets resulting from operations | | $ | 11,599,591 | | | $ | 21,277,477 | | | $ | 3,495,956 | |
The accompanying notes are an integral part of these financial statements.
27
|
Statements of Changes in Net Assets For the fiscal years ended October 31, |
| | | | | | | | | | | | | | | | | | | | | | | | |
| | | AMG GW&K Core
Bond ESG Fund | | | AMG GW&K
Emerging Wealth
Equity Fund | | | AMG GW&K
Emerging Markets
Equity Fund | |
| | | 2020 | | | 2019 | | | 2020 | | | 2019 | | | 2020 | | | 2019 | |
| | | | | | |
Increase in Net Assets Resulting From Operations: | | | | | | | | | | | | | | | | | | | | | | | | |
Net investment income | | | $4,276,093 | | | | $5,533,713 | | | | $55,701 | | | | $1,148,596 | | | | $243,007 | | | | $2,954,181 | |
Net realized gain (loss) on investments | | | 3,844,884 | | | | (417,409 | ) | | | (3,363,890 | ) | | | 2,253,942 | | | | 1,747,550 | | | | 12,546,813 | |
Net change in unrealized appreciation/depreciation on investments | | | 3,478,614 | | | | 20,112,764 | | | | 24,585,666 | | | | 11,877,912 | | | | 1,505,399 | | | | 4,413,987 | |
| | | | | | |
Net increase in net assets resulting from operations | | | 11,599,591 | | | | 25,229,068 | | | | 21,277,477 | | | | 15,280,450 | | | | 3,495,956 | | | | 19,914,981 | |
Distributions to Shareholders: | | | | | | | | | | | | | | | | | | | | | | | | |
Class N | | | (27,152 | ) | | | (15,730 | ) | | | (55,712 | ) | | | (91,676 | ) | | | (26,892 | ) | | | (12,186 | ) |
Class I | | | (4,226,935 | ) | | | (5,461,302 | ) | | | (219,919 | ) | | | (88,034 | ) | | | (1,090,353 | ) | | | (702,208 | ) |
Class Z | | | (77,096 | ) | | | (85,424 | ) | | | (3,346,538 | ) | | | (3,150,911 | ) | | | (1,569,541 | ) | | | (5,489,154 | ) |
Total distributions to shareholders | | | (4,331,183 | ) | | | (5,562,456 | ) | | | (3,622,169 | ) | | | (3,330,621 | ) | | | (2,686,786 | ) | | | (6,203,548 | ) |
Capital Share Transactions:1 | | | | | | | | | | | | | | | | | | | | | | | | |
| | | | | | |
Net increase (decrease) from capital share transactions | | | (16,453,440 | ) | | | (72,704,031 | ) | | | 79,224,668 | | | | 36,532,694 | | | | (13,302,131 | ) | | | (102,551,166 | ) |
| | | | | | | | | | | | | | | | | | | | | | | | |
| | | | | | |
Total increase (decrease) in net assets | | | (9,185,032 | ) | | | (53,037,419 | ) | | | 96,879,976 | | | | 48,482,523 | | | | (12,492,961 | ) | | | (88,839,733 | ) |
Net Assets: | | | | | | | | | | | | | | | | | | | | | | | | |
Beginning of year | | | 217,264,559 | | | | 270,301,978 | | | | 113,404,096 | | | | 64,921,573 | | | | 56,347,320 | | | | 145,187,053 | |
End of year | | | $208,079,527 | | | | $217,264,559 | | | | $210,284,072 | | | | $113,404,096 | | | | $43,854,359 | | | | $56,347,320 | |
| 1 | See Note 1(g) of the Notes to Financial Statements. |
The accompanying notes are an integral part of these financial statements.
28
|
AMG GW&K Core Bond ESG Fund Financial Highlights For a share outstanding throughout each fiscal year |
| | | | | | | | | | | | | | | | | | | | | | | | | |
| | | For the fiscal years ended October 31, |
| | | | | |
| Class N | | 2020 | | 2019 | | 2018 | | 2017 | | 20161 |
Net Asset Value, Beginning of Year | | | | $10.53 | | | | | $9.67 | | | | | $10.14 | | | | | $10.26 | | | | | $10.23 | |
Income (loss) from Investment Operations: | | | | | | | | | | | | | | | | | | | | | | | | | |
Net investment income2,3 | | | | 0.18 | | | | | 0.21 | | | | | 0.18 | | | | | 0.18 | | | | | 0.16 | |
| | | | | |
Net realized and unrealized gain (loss) on investments | | | | 0.37 | | | | | 0.86 | | | | | (0.46 | ) | | | | (0.12 | ) | | | | 0.28 | |
Total income (loss) from investment operations | | | | 0.55 | | | | | 1.07 | | | | | (0.28 | ) | | | | 0.06 | | | | | 0.44 | |
Less Distributions to Shareholders from: | | | | | | | | | | | | | | | | | | | | | | | | | |
Net investment income | | | | (0.18 | ) | | | | (0.21 | ) | | | | (0.19 | ) | | | | (0.18 | ) | | | | (0.17 | ) |
Net realized gain on investments | | | | — | | | | | — | | | | | — | | | | | — | | | | | (0.24 | ) |
Total distributions to shareholders | | | | (0.18 | ) | | | | (0.21 | ) | | | | (0.19 | ) | | | | (0.18 | ) | | | | (0.41 | ) |
Net Asset Value, End of Year | | | | $10.90 | | | | | $10.53 | | | | | $9.67 | | | | | $10.14 | | | | | $10.26 | |
Total Return3,4 | | | | 5.31 | % | | | | 11.20 | % | | | | (2.79 | )% | | | | 0.57 | % | | | | 4.44 | % |
Ratio of net expenses to average net assets | | | | 0.88 | % | | | | 0.88 | % | | | | 0.88 | % | | | | 0.88 | % | | | | 0.88 | % |
Ratio of gross expenses to average net assets5 | | | | 0.96 | % | | | | 0.95 | % | | | | 0.93 | % | | | | 0.93 | % | | | | 0.97 | % |
| | | | | |
Ratio of net investment income to average net assets3 | | | | 1.69 | % | | | | 2.10 | % | | | | 1.88 | % | | | | 1.75 | % | | | | 1.51 | % |
Portfolio turnover | | | | 56 | % | | | | 48 | % | | | | 17 | % | | | | 18 | % | | | | 48 | % |
Net assets end of year (000’s) omitted | | | | $1,905 | | | | | $1,255 | | | | | $502 | | | | | $146 | | | | | $293 | |
| | | | | | | | | | | | | | | | | | | | | | | | | | |
29
|
AMG GW&K Core Bond ESG Fund Financial Highlights For a share outstanding throughout each fiscal year |
| | | | | | | | | | | | | | | | | | | | | | | | | |
| | | For the fiscal years ended October 31, |
| | | | | |
| Class I | | 2020 | | 2019 | | 2018 | | 2017 | | 20161 |
Net Asset Value, Beginning of Year | | | | $10.54 | | | | | $9.67 | | | | | $10.15 | | | | | $10.27 | | | | | $10.24 | |
Income (loss) from Investment Operations: | | | | | | | | | | | | | | | | | | | | | | | | | |
Net investment income2,3 | | | | 0.22 | | | | | 0.24 | | | | | 0.22 | | | | | 0.21 | | | | | 0.21 | |
| | | | | |
Net realized and unrealized gain (loss) on investments | | | | 0.36 | | | | | 0.88 | | | | | (0.48 | ) | | | | (0.12 | ) | | | | 0.26 | |
Total income (loss) from investment operations | | | | 0.58 | | | | | 1.12 | | | | | (0.26 | ) | | | | 0.09 | | | | | 0.47 | |
Less Distributions to Shareholders from: | | | | | | | | | | | | | | | | | | | | | | | | | |
Net investment income | | | | (0.22 | ) | | | | (0.25 | ) | | | | (0.22 | ) | | | | (0.21 | ) | | | | (0.20 | ) |
Net realized gain on investments | | | | — | | | | | — | | | | | — | | | | | — | | | | | (0.24 | ) |
Total distributions to shareholders | | | | (0.22 | ) | | | | (0.25 | ) | | | | (0.22 | ) | | | | (0.21 | ) | | | | (0.44 | ) |
Net Asset Value, End of Year | | | | $10.90 | | | | | $10.54 | | | | | $9.67 | | | | | $10.15 | | | | | $10.27 | |
Total Return3,4 | | | | 5.55 | % | | | | 11.70 | % | | | | (2.59 | )% | | | | 0.91 | % | | | | 4.79 | % |
Ratio of net expenses to average net assets | | | | 0.55 | % | | | | 0.55 | % | | | | 0.56 | % | | | | 0.55 | % | | | | 0.55 | % |
Ratio of gross expenses to average net assets5 | | | | 0.63 | % | | | | 0.62 | % | | | | 0.61 | % | | | | 0.60 | % | | | | 0.65 | % |
| | | | | |
Ratio of net investment income to average net assets3 | | | | 2.01 | % | | | | 2.42 | % | | | | 2.20 | % | | | | 2.08 | % | | | | 2.01 | % |
Portfolio turnover | | | | 56 | % | | | | 48 | % | | | | 17 | % | | | | 18 | % | | | | 48 | % |
Net assets end of year (000’s) omitted | | | | $202,363 | | | | | $212,801 | | | | | $264,795 | | | | | $325,855 | | | | | $414,400 | |
| | | | | | | | | | | | | | | | | | | | | | | | | | |
30
|
AMG GW&K Core Bond ESG Fund Financial Highlights For a share outstanding throughout each fiscal year |
| | | | | | | | | | | | | | | | | | | | | | | | | |
| | | For the fiscal years ended October 31, |
| | | | | |
| Class Z | | 2020 | | 2019 | | 2018 | | 2017 | | 20161 |
Net Asset Value, Beginning of Year | | | | $10.53 | | | | | $9.67 | | | | | $10.14 | | | | | $10.26 | | �� | | | $10.23 | |
Income (loss) from Investment Operations: | | | | | | | | | | | | | | | | | | | | | | | | | |
Net investment income2,3 | | | | 0.22 | | | | | 0.25 | | | | | 0.23 | | | | | 0.22 | | | | | 0.19 | |
| | | | | |
Net realized and unrealized gain (loss) on investments | | | | 0.38 | | | | | 0.87 | | | | | (0.47 | ) | | | | (0.12 | ) | | | | 0.29 | |
Total income (loss) from investment operations | | | | 0.60 | | | | | 1.12 | | | | | (0.24 | ) | | | | 0.10 | | | | | 0.48 | |
Less Distributions to Shareholders from: | | | | | | | | | | | | | | | | | | | | | | | | | |
Net investment income | | | | (0.23 | ) | | | | (0.26 | ) | | | | (0.23 | ) | | | | (0.22 | ) | | | | (0.21 | ) |
Net realized gain on investments | | | | — | | | | | — | | | | | — | | | | | — | | | | | (0.24 | ) |
Total distributions to shareholders | | | | (0.23 | ) | | | | (0.26 | ) | | | | (0.23 | ) | | | | (0.22 | ) | | | | (0.45 | ) |
Net Asset Value, End of Year | | | | $10.90 | | | | | $10.53 | | | | | $9.67 | | | | | $10.14 | | | | | $10.26 | |
Total Return3,4 | | | | 5.73 | % | | | | 11.71 | % | | | | (2.42 | )% | | | | 0.98 | % | | | | 4.85 | % |
Ratio of net expenses to average net assets | | | | 0.48 | % | | | | 0.48 | % | | | | 0.48 | % | | | | 0.48 | % | | | | 0.48 | % |
Ratio of gross expenses to average net assets5 | | | | 0.56 | % | | | | 0.55 | % | | | | 0.53 | % | | | | 0.53 | % | | | | 0.58 | % |
| | | | | |
Ratio of net investment income to average net assets3 | | | | 2.09 | % | | | | 2.50 | % | | | | 2.28 | % | | | | 2.15 | % | | | | 1.88 | % |
Portfolio turnover | | | | 56 | % | | | | 48 | % | | | | 17 | % | | | | 18 | % | | | | 48 | % |
Net assets end of year (000’s) omitted | | | | $3,812 | | | | | $3,208 | | | | | $5,005 | | | | | $5,590 | | | | | $5,668 | |
| | | | | | | | | | | | | | | | | | | | | | | | | | |
| 1 | Effective October 1, 2016, the Investor Class, Service Class and Institutional Class were renamed Class N, Class I and Class Z, respectively. |
| 2 | Per share numbers have been calculated using average shares. |
| 3 | Total returns and net investment income would have been lower had certain expenses not been offset. |
| 4 | The total return is calculated using the published Net Asset Value as of fiscal year end. |
| 5 | Excludes the impact of expense reimbursement or fee waivers and expense reductions such as brokerage credits, but includes expense repayments and non-reimbursable expenses, if any, such as interest, taxes, and extraordinary expenses. (See Note 1(c) and 2 in the Notes to Financial Statements.) |
31
|
AMG GW&K Emerging Wealth Equity Fund Financial Highlights For a share outstanding throughout each fiscal year |
| | | | | | | | | | | | | | | | | | | | | | | | | |
| | | For the fiscal years ended October 31, |
| | | | | |
| Class N | | 2020 | | 2019 | | 2018 | | 2017 | | 20161 |
Net Asset Value, Beginning of Year | | | | $11.93 | | | | | $10.38 | | | | | $12.94 | | | | | $10.13 | | | | | $9.34 | |
Income (loss) from Investment Operations: | | | | | | | | | | | | | | | | | | | | | | | | | |
Net investment income (loss)2,3 | | | | (0.04 | ) | | | | 0.10 | | | | | 0.06 | | | | | 0.05 | | | | | 0.05 | |
| | | | | |
Net realized and unrealized gain (loss) on investments | | | | 1.72 | | | | | 1.95 | | | | | (1.88 | ) | | | | 2.80 | | | | | 0.74 | |
Total income (loss) from investment operations | | | | 1.68 | | | | | 2.05 | | | | | (1.82 | ) | | | | 2.85 | | | | | 0.79 | |
Less Distributions to Shareholders from: | | | | | | | | | | | | | | | | | | | | | | | | | |
Net investment income | | | | (0.06 | ) | | | | (0.06 | ) | | | | (0.05 | ) | | | | (0.04 | ) | | | | — | |
Net realized gain on investments | | | | (0.27 | ) | | | | (0.44 | ) | | | | (0.69 | ) | | | | — | | | | | — | |
Total distributions to shareholders | | | | (0.33 | ) | | | | (0.50 | ) | | | | (0.74 | ) | | | | (0.04 | ) | | | | — | |
Net Asset Value, End of Year | | | | $13.28 | | | | | $11.93 | | | | | $10.38 | | | | | $12.94 | | | | | $10.13 | |
Total Return3,4 | | | | 14.37 | % | | | | 20.82 | % | | | | (15.16 | )% | | | | 28.31 | % | | | | 8.46 | % |
Ratio of net expenses to average net assets | | | | 1.26 | % | | | | 1.37 | %5 | | | | 1.45 | %5,6 | | | | 1.45 | %5,6 | | | | 1.44 | % |
Ratio of gross expenses to average net assets7 | | | | 1.26 | % | | | | 1.37 | %5 | | | | 1.45 | %5 | | | | 1.45 | %5 | | | | 1.53 | % |
| | | | | |
Ratio of net investment income (loss) to average net assets3 | | | | (0.35 | )% | | | | 0.93 | % | | | | 0.49 | % | | | | 0.45 | % | | | | 0.51 | % |
Portfolio turnover | | | | 37 | % | | | | 40 | % | | | | 37 | % | | | | 68 | % | | | | 58 | % |
Net assets end of year (000’s) omitted | | | | $1,716 | | | | | $2,007 | | | | | $1,940 | | | | | $10 | | | | | $10 | |
| | | | | | | | | | | | | | | | | | | | | | | | | | |
32
|
AMG GW&K Emerging Wealth Equity Fund Financial Highlights For a share outstanding throughout each fiscal year |
| | | | | | | | | | | | | | | | | | | | | | | | | |
| | | For the fiscal years ended October 31, |
| | | | | |
| Class I | | 2020 | | 2019 | | 2018 | | 2017 | | 20161 |
Net Asset Value, Beginning of Year | | | | $12.03 | | | | | $10.44 | | | | | $12.96 | | | | | $10.14 | | | | | $9.34 | |
Income (loss) from Investment Operations: | | | | | | | | | | | | | | | | | | | | | | | | | |
Net investment income (loss)2,3 | | | | (0.01 | ) | | | | 0.14 | | | | | 0.09 | | | | | 0.08 | | | | | 0.07 | |
| | | | | |
Net realized and unrealized gain (loss) on investments | | | | 1.73 | | | | | 1.96 | | | | | (1.88 | ) | | | | 2.81 | | | | | 0.75 | |
Total income (loss) from investment operations | | | | 1.72 | | | | | 2.10 | | | | | (1.79 | ) | | | | 2.89 | | | | | 0.82 | |
Less Distributions to Shareholders from: | | | | | | | | | | | | | | | | | | | | | | | | | |
Net investment income | | | | (0.10 | ) | | | | (0.07 | ) | | | | (0.04 | ) | | | | (0.07 | ) | | | | (0.02 | ) |
Net realized gain on investments | | | | (0.27 | ) | | | | (0.44 | ) | | | | (0.69 | ) | | | | — | | | | | — | |
Total distributions to shareholders | | | | (0.37 | ) | | | | (0.51 | ) | | | | (0.73 | ) | | | | (0.07 | ) | | | | (0.02 | ) |
Net Asset Value, End of Year | | | | $13.38 | | | | | $12.03 | | | | | $10.44 | | | | | $12.96 | | | | | $10.14 | |
Total Return3,4 | | | | 14.63 | % | | | | 21.15 | % | | | | (14.89 | )% | | | | 28.73 | % | | | | 8.77 | % |
Ratio of net expenses to average net assets | | | | 0.97 | % | | | | 1.08 | %5 | | | | 1.19 | %5,6 | | | | 1.12 | %5,6 | | | | 1.16 | % |
Ratio of gross expenses to average net assets7 | | | | 0.97 | % | | | | 1.08 | %5 | | | | 1.19 | %5 | | | | 1.16 | %5 | | | | 1.24 | % |
| | | | | |
Ratio of net investment income (loss) to average net assets3 | | | | (0.06 | )% | | | | 1.22 | % | | | | 0.75 | % | | | | 0.78 | % | | | | 0.79 | % |
Portfolio turnover | | | | 37 | % | | | | 40 | % | | | | 37 | % | | | | 68 | % | | | | 58 | % |
Net assets end of year (000’s) omitted | | | | $22,813 | | | | | $6,328 | | | | | $2,539 | | | | | $1,646 | | | | | $16,639 | |
| | | | | | | | | | | | | | | | | | | | | | | | | | |
33
|
AMG GW&K Emerging Wealth Equity Fund Financial Highlights For a share outstanding throughout each fiscal year |
| | | | | | | | | | | | | | | | | | | | |
| | | For the fiscal years ended October 31, | |
| | | | | |
| Class Z | | 2020 | | | 2019 | | | 2018 | | | 2017 | | | 20161 | |
Net Asset Value, Beginning of Year | | | $11.99 | | | | $10.41 | | | | $12.97 | | | | $10.15 | | | | $9.35 | |
Income (loss) from Investment Operations: | | | | | | | | | | | | | | | | | | | | |
Net investment income2,3 | | | 0.01 | | | | 0.15 | | | | 0.11 | | | | 0.10 | | | | 0.09 | |
Net realized and unrealized gain (loss) on investments | | | 1.72 | | | | 1.96 | | | | (1.89 | ) | | | 2.80 | | | | 0.74 | |
Total income (loss) from investment operations | | | 1.73 | | | | 2.11 | | | | (1.78 | ) | | | 2.90 | | | | 0.83 | |
Less Distributions to Shareholders from: | | | | | | | | | | | | | | | | | | | | |
Net investment income | | | (0.11 | ) | | | (0.09 | ) | | | (0.09 | ) | | | (0.08 | ) | | | (0.03 | ) |
Net realized gain on investments | | | (0.27 | ) | | | (0.44 | ) | | | (0.69 | ) | | | — | | | | — | |
Total distributions to shareholders | | | (0.38 | ) | | | (0.53 | ) | | | (0.78 | ) | | | (0.08 | ) | | | (0.03 | ) |
Net Asset Value, End of Year | | | $13.34 | | | | $11.99 | | | | $10.41 | | | | $12.97 | | | | $10.15 | |
Total Return3,4 | | | 14.75 | % | | | 21.34 | % | | | (14.87 | )% | | | 28.86 | % | | | 8.86 | % |
Ratio of net expenses to average net assets | | | 0.86 | % | | | 0.97 | %5 | | | 1.05 | %5,6 | | | 1.05 | %5,6 | | | 1.05 | % |
Ratio of gross expenses to average net assets7 | | | 0.86 | % | | | 0.97 | %5 | | | 1.05 | %5 | | | 1.05 | %5 | | | 1.15 | % |
Ratio of net investment income to average net assets3 | | | 0.05 | % | | | 1.33 | % | | | 0.89 | % | | | 0.85 | % | | | 0.94 | % |
Portfolio turnover | | | 37 | % | | | 40 | % | | | 37 | % | | | 68 | % | | | 58 | % |
Net assets end of year (000’s) omitted | | | $185,755 | | | | $105,069 | | | | $60,443 | | | | $59,500 | | | | $30,777 | |
| | | | | | | | | | | | | | | | | | | | | |
| 1 | Effective October 1, 2016, the Investor Class, Service Class and Institutional Class were renamed Class N, Class I and Class Z, respectively. |
| 2 | Per share numbers have been calculated using average shares. |
| 3 | Total returns and net investment income (loss) would have been lower had certain expenses not been offset. |
| 4 | The total return is calculated using the published Net Asset Value as of fiscal year end. |
| 5 | Such ratio includes recapture of waived/reimbursed fees from prior periods amounting to 0.02%, 0.07% and 0.04% for the fiscal years ended October 31, 2019, 2018 and 2017, respectively. |
| 6 | Includes reduction from broker recapture amounting to less than 0.01%. |
| 7 | Excludes the impact of expense reimbursement or fee waivers and expense reductions such as brokerage credits, but includes expense repayments and non-reimbursable expenses, if any, such as interest, taxes, and extraordinary expenses. (See Note 1(c) and 2 in the Notes to Financial Statements.) |
34
|
AMG GW&K Emerging Markets Equity Fund Financial Highlights For a share outstanding throughout each fiscal year |
| | | | | | | | | | | | | | | | | | | | |
| | | For the fiscal years ended October 31, | |
| | | | | |
| Class N | | 2020 | | | 2019 | | | 2018 | | | 2017 | | | 20161 | |
Net Asset Value, Beginning of Year | | | $9.52 | | | | $8.61 | | | | $10.11 | | | | $7.91 | | | | $7.23 | |
Income (loss) from Investment Operations: | | | | | | | | | | | | | | | | | | | | |
Net investment income2,3 | | | 0.01 | | | | 0.14 | | | | 0.11 | | | | 0.09 | | | | 0.06 | |
Net realized and unrealized gain (loss) on investments | | | 0.70 | | | | 1.04 | | | | (1.54 | ) | | | 2.18 | | | | 0.66 | |
Total income (loss) from investment operations | | | 0.71 | | | | 1.18 | | | | (1.43 | ) | | | 2.27 | | | | 0.72 | |
Less Distributions to Shareholders from: | | | | | | | | | | | | | | | | | | | | |
Net investment income | | | (0.06 | ) | | | (0.17 | ) | | | (0.07 | ) | | | (0.07 | ) | | | (0.04 | ) |
Net realized gain on investments | | | (0.44 | ) | | | (0.10 | ) | | | — | | | | — | | | | — | |
Total distributions to shareholders | | | (0.50 | ) | | | (0.27 | ) | | | (0.07 | ) | | | (0.07 | ) | | | (0.04 | ) |
Net Asset Value, End of Year | | | $9.73 | | | | $9.52 | | | | $8.61 | | | | $10.11 | | | | $7.91 | |
Total Return3 | | | 7.55 | %4 | | | 13.94 | %4 | | | (14.24 | )%4 | | | 28.97 | %4 | | | 10.01 | % |
Ratio of net expenses to average net assets | | | 1.34 | % | | | 1.30 | % | | | 1.27 | % | | | 1.31 | % | | | 1.44 | % |
Ratio of gross expenses to average net assets5 | | | 1.52 | % | | | 1.30 | % | | | 1.27 | % | | | 1.31 | % | | | 1.44 | % |
Ratio of net investment income to average net assets3 | | | 0.13 | % | | | 1.52 | % | | | 1.12 | % | | | 1.08 | % | | | 0.81 | % |
Portfolio turnover | | | 40 | % | | | 123 | % | | | 24 | % | | | 29 | % | | | 33 | % |
Net assets end of year (000’s) omitted | | | $412 | | | | $520 | | | | $289 | | | | $350 | | | | $497 | |
| | | | | | | | | | | | | | | | | | | | | |
35
|
AMG GW&K Emerging Markets Equity Fund Financial Highlights For a share outstanding throughout each fiscal year |
| | | | | | | | | | | | | | | | | | | | |
| | | For the fiscal years ended October 31, | |
| | | | | |
| Class I | | 2020 | | | 2019 | | | 2018 | | | 2017 | | | 20161 | |
Net Asset Value, Beginning of Year | | | $9.48 | | | | $8.60 | | | | $10.11 | | | | $7.90 | | | | $7.19 | |
Income (loss) from Investment Operations: | | | | | | | | | | | | | | | | | | | | |
Net investment income2,3 | | | 0.04 | | | | 0.17 | | | | 0.13 | | | | 0.12 | | | | 0.08 | |
Net realized and unrealized gain (loss) on investments | | | 0.69 | | | | 1.04 | | | | (1.53 | ) | | | 2.18 | | | | 0.67 | |
Total income (loss) from investment operations | | | 0.73 | | | | 1.21 | | | | (1.40 | ) | | | 2.30 | | | | 0.75 | |
Less Distributions to Shareholders from: | | | | | | | | | | | | | | | | | | | | |
Net investment income | | | (0.08 | ) | | | (0.23 | ) | | | (0.11 | ) | | | (0.09 | ) | | | (0.04 | ) |
Net realized gain on investments | | | (0.44 | ) | | | (0.10 | ) | | | — | | | | — | | | | — | |
Total distributions to shareholders | | | (0.52 | ) | | | (0.33 | ) | | | (0.11 | ) | | | (0.09 | ) | | | (0.04 | ) |
Net Asset Value, End of Year | | | $9.69 | | | | $9.48 | | | | $8.60 | | | | $10.11 | | | | $7.90 | |
Total Return3 | | | 7.91 | %4 | | | 14.34 | %4 | | | (13.94 | )%4 | | | 29.34 | %4 | | | 10.48 | %4 |
Ratio of net expenses to average net assets | | | 1.01 | % | | | 0.97 | % | | | 0.99 | % | | | 1.03 | % | | | 1.07 | % |
Ratio of gross expenses to average net assets5 | | | 1.19 | % | | | 0.97 | % | | | 0.99 | % | | | 1.03 | % | | | 1.07 | % |
Ratio of net investment income to average net assets3 | | | 0.47 | % | | | 1.85 | % | | | 1.40 | % | | | 1.36 | % | | | 1.14 | % |
Portfolio turnover | | | 40 | % | | | 123 | % | | | 24 | % | | | 29 | % | | | 33 | % |
Net assets end of year (000’s) omitted | | | $19,251 | | | | $24,100 | | | | $11,210 | | | | $2,207 | | | | $1,271 | |
| | | | | | | | | | | | | | | | | | | | | |
36
|
AMG GW&K Emerging Markets Equity Fund Financial Highlights For a share outstanding throughout each fiscal year |
| | | | | | | | | | | | | | | | | | | | |
| | | For the fiscal years ended October 31, | |
| | | | | |
| Class Z | | 2020 | | | 2019 | | | 2018 | | | 2017 | | | 20161 | |
Net Asset Value, Beginning of Year | | | $9.43 | | | | $8.56 | | | | $10.06 | | | | $7.86 | | | | $7.20 | |
Income (loss) from Investment Operations: | | | | | | | | | | | | | | | | | | | | |
Net investment income2,3 | | | 0.05 | | | | 0.18 | | | | 0.15 | | | | 0.13 | | | | 0.09 | |
Net realized and unrealized gain (loss) on investments | | | 0.69 | | | | 1.02 | | | | (1.53 | ) | | | 2.16 | | | | 0.65 | |
Total income (loss) from investment operations | | | 0.74 | | | | 1.20 | | | | (1.38 | ) | | | 2.29 | | | | 0.74 | |
Less Distributions to Shareholders from: | | | | | | | | | | | | | | | | | | | | |
Net investment income | | | (0.09 | ) | | | (0.23 | ) | | | (0.12 | ) | | | (0.09 | ) | | | (0.08 | ) |
Net realized gain on investments | | | (0.44 | ) | | | (0.10 | ) | | | — | | | | — | | | | — | |
Total distributions to shareholders | | | (0.53 | ) | | | (0.33 | ) | | | (0.12 | ) | | | (0.09 | ) | | | (0.08 | ) |
Net Asset Value, End of Year | | | $9.64 | | | | $9.43 | | | | $8.56 | | | | $10.06 | | | | $7.86 | |
Total Return3 | | | 8.01 | %4 | | | 14.39 | %4 | | | (13.88 | )%4 | | | 29.62 | %4 | | | 10.52 | % |
Ratio of net expenses to average net assets | | | 0.94 | % | | | 0.90 | % | | | 0.87 | % | | | 0.88 | % | | | 0.94 | % |
Ratio of gross expenses to average net assets5 | | | 1.12 | % | | | 0.90 | % | | | 0.87 | % | | | 0.88 | % | | | 0.94 | % |
Ratio of net investment income to average net assets3 | | | 0.53 | % | | | 1.92 | % | | | 1.52 | % | | | 1.51 | % | | | 1.25 | % |
Portfolio turnover | | | 40 | % | | | 123 | % | | | 24 | % | | | 29 | % | | | 33 | % |
Net assets end of year (000’s) omitted | | | $24,191 | | | | $31,727 | | | | $133,688 | | | | $130,828 | | | | $102,086 | |
| | | | | | | | | | | | | | | | | | | | | |
| 1 | Effective October 1, 2016, the Investor Class, Service Class and Institutional Class were renamed Class N, Class I and Class Z, respectively. |
| 2 | Per share numbers have been calculated using average shares. |
| 3 | Total returns and net investment income would have been lower had certain expenses not been offset. |
| 4 | The total return is calculated using the published Net Asset Value as of fiscal year end. |
| 5 | Excludes the impact of expense reimbursement or fee waivers and expense reductions such as brokerage credits, but includes expense repayments and non-reimbursable expenses, if any, such as interest, taxes, and extraordinary expenses. (See Note 1(c) and 2 in the Notes to Financial Statements.) |
37
|
Notes to Financial Statements October 31, 2020 |
1. ORGANIZATION AND SUMMARY OF SIGNIFICANT ACCOUNTING POLICIES
AMG Funds and AMG Funds I (the “Trusts”) are open-end management investment companies, organized as Massachusetts business trusts, and registered under the Investment Company Act of 1940, as amended (the “1940 Act”). Currently, the Trusts consist of a number of different funds, each having distinct investment management objectives, strategies, risks, and policies. Included in this report are AMG Funds I: AMG GW&K Core Bond ESG Fund (“Core Bond ESG”) and AMG Funds: AMG GW&K Emerging Wealth Equity Fund (“Emerging Wealth Equity”) (formerly AMG GW&K Trilogy Emerging Wealth Equity Fund) and AMG GW&K Emerging Markets Equity Fund (“Emerging Markets Equity”) (formerly AMG GW&K Trilogy Emerging Markets Equity Fund), each a “Fund” and collectively, the “Funds”.
Each Fund offers different classes of shares. Each Fund offers Class N, Class I and Class Z shares. Each class represents an interest in the same assets of the respective Fund. Although all share classes generally have identical voting rights, each share class votes separately when required by law. Different share classes may have different net asset values per share to the extent the share classes pay different distribution amounts and/or the expenses of such share classes differ. Each share class has its own expense structure. Please refer to a current prospectus for additional information on each share class.
Effective May 1, 2019, Core Bond ESG changed its principle investment strategy to give special consideration to environmental, social and governance (“ESG”) criteria.
Market disruptions associated with the COVID-19 pandemic have had a global impact, and uncertainty exists as to the long-term implications. Such disruptions can adversely affect assets of the Funds and thus Fund performance.
Certain instruments held by a Fund may pay an interest rate based on the London Interbank Offered Rate (“LIBOR”), which is the offered rate for short-term loans between certain major international banks. LIBOR is expected to be phased out by the end of 2021. While the effect of the phase out cannot yet be determined, it may result in, among other things, increased volatility or illiquidity in markets for instruments based on LIBOR and changes in the value of some LIBOR-based investments or the effectiveness of new hedges placed against existing LIBOR-based investments. These effects could occur prior to the end of 2021. There also remains uncertainty and risk regarding the willingness and ability of issuers to include enhanced provisions in new and existing contracts or instruments. All of the aforementioned may adversely affect a Fund’s performance or net asset value.
The Funds’ financial statements are prepared in accordance with accounting principles generally accepted in the United States of America (“U.S. GAAP”), including accounting and reporting guidance pursuant to Accounting Standards Codification Topic 946 applicable to investment companies. U.S. GAAP requires management to make estimates and assumptions that affect the reported amounts of assets and liabilities and disclosure of contingent assets and liabilities at the date of the financial statements and the reported amounts of income and expenses during the reporting period. Actual results could differ from those estimates and such differences could be material. The following is a summary of significant accounting policies followed by the Funds in the preparation of their financial statements:
a. VALUATION OF INVESTMENTS
Equity securities traded on a national securities exchange or reported on the NASDAQ national market system (“NMS”) are valued at the last quoted sales price
on the primary exchange or, if applicable, the NASDAQ official closing price or the official closing price of the relevant exchange or, lacking any sales, at the last quoted bid price or the mean between the last quoted bid and ask prices (the “mean price”). Equity securities traded in the over-the-counter market (other than NMS securities) are valued at the mean price. Foreign equity securities (securities principally traded in markets other than U.S. markets) are valued at the official closing price on the primary exchange or, for markets that either do not offer an official closing price or where the official closing price may not be representative of the overall market, the last quoted sale price.
Fixed income securities purchased with a remaining maturity exceeding 60 days are valued at the evaluated mean price provided by an authorized pricing service or, if an evaluated price is not available, by reference to other securities which are considered comparable in credit rating, interest rate, due date and other features (generally referred to as “matrix pricing”) or other similar pricing methodologies.
Fixed income securities purchased with a remaining maturity of 60 days or less are valued at amortized cost, provided that the amortized cost value is approximately the same as the fair value of the security valued without the use of amortized cost. Investments in other open-end registered investment companies are valued at their end of day net asset value per share.
The Funds’ portfolio investments are generally valued based on independent market quotations or prices or, if none, “evaluative” or other market based valuations provided by third party pricing services approved by the Board of Trustees of the Trusts (the “Board”). Under certain circumstances, the value of certain Fund portfolio investments may be based on an evaluation of fair value, pursuant to procedures established by and under the general supervision of the Board. The Valuation Committee, which is comprised of the Independent Trustees of the Board, and the Pricing Committee, which is comprised of representatives from AMG Funds LLC (the “Investment Manager”) are the committees appointed by the Board to make fair value determinations. Each Fund may use the fair value of a portfolio investment to calculate its net asset value (“NAV”) in the event that the market quotation, price or market based valuation for the portfolio investment is not readily available or otherwise not determinable pursuant to the Board’s valuation procedures, if the Investment Manager or the Pricing Committee believes the quotation, price or market based valuation to be unreliable, or in certain other circumstances. When determining the fair value of an investment, the Pricing Committee and, if required under the Trusts’ securities valuation procedures, the Valuation Committee, seeks to determine the price that the Fund might reasonably expect to receive from current sale of that portfolio investment in an arms-length transaction. Fair value determinations shall be based upon consideration of all available facts and information, including, but not limited to (i) attributes specific to the investment; (ii) fundamental and analytical data relating to the investment; and (iii) the value of other comparable securities or relevant financial instruments, including derivative securities, traded on other markets or among dealers.
The values assigned to fair value portfolio investments are based on available information and do not necessarily represent amounts that might ultimately be realized in the future, since such amounts depend on future developments inherent in long-term investments. Because of the inherent uncertainty of valuation, those estimated values may differ significantly from the values that would have been used had a ready market for the investments existed, and the differences could be material. The Board will be presented with a quarterly report showing as of the most recent quarter end, all outstanding securities fair valued by the Funds, including a comparison with the prior quarter end and the percentage of the Funds that the security represents at each quarter end.
38
|
Notes to Financial Statements (continued) |
With respect to foreign equity securities and certain foreign fixed income securities, the Board has adopted a policy that securities held in the Funds that can be fair valued by the applicable fair value pricing service are fair valued on each business day provided that each individual price exceeds a pre-established confidence level.
U.S. GAAP defines fair value as the price that a fund would receive to sell an asset or pay to transfer a liability in an orderly transaction between market participants at the measurement date. U.S. GAAP also establishes a framework for measuring fair value, and a three level hierarchy for fair value measurements based upon the transparency of inputs to the valuation of an asset or liability. Inputs may be observable or unobservable and refer broadly to the assumptions that market participants would use in pricing the asset or liability. Observable inputs reflect the assumptions market participants would use in pricing the asset or liability based on market data obtained from sources independent of the Funds. Unobservable inputs reflect the Funds’ own assumptions about the assumptions that market participants would use in pricing the asset or liability developed based on the best information available in the circumstances. Each investment is assigned a level based upon the observability of the inputs which are significant to the overall valuation.
The three-tier hierarchy of inputs is summarized below:
Level 1 – inputs are quoted prices in active markets for identical investments (e.g., equity securities, open-end investment companies)
Level 2 – other observable inputs (including, but not limited to: quoted prices for similar assets or liabilities in markets that are active, quoted prices for identical or similar assets or liabilities in markets that are not active, inputs other than quoted prices that are observable for the assets or liabilities (such as interest rates, yield curves, volatilities, prepayment speeds, loss severities, credit risks and default rates) or other market corroborated inputs) (e.g., debt securities, government securities, foreign currency exchange contracts, swaps, foreign securities utilizing international fair value pricing, fair valued securities with observable inputs)
Level 3 – inputs are significant unobservable inputs (including the Fund’s own assumptions used to determine the fair value of investments) (e.g., fair valued securities with unobservable inputs)
Changes in inputs or methodologies used for valuing investments may result in a transfer in or out of levels within the fair value hierarchy. The inputs or methodologies used for valuing investments may not necessarily be an indication of the risk associated with investing in those investments.
b. SECURITY TRANSACTIONS
Security transactions are accounted for as of trade date. Realized gains and losses on securities sold are determined on the basis of identified cost.
c. INVESTMENT INCOME AND EXPENSES
Dividend income is recorded on the ex-dividend date. Dividends from foreign securities are recorded on the ex-dividend date, and if after the fact, as soon as the Funds become aware of the ex-dividend date, except for Korean securities where dividends are recorded on confirmation date. Interest income, which includes amortization of premium and accretion of discount on debt securities, is accrued as earned. Dividend and interest income on foreign securities is recorded gross of any withholding tax. Non-cash dividends included in dividend income, if any, are reported at the fair market value of the securities received. Upon notification from issuers, distributions received from a real estate investment trust (REIT) may be redesignated as a reduction of cost of investments and/or realized gain. Other income and expenses are recorded on an accrual basis. Expenses that cannot be directly attributed to a Fund are apportioned among the funds in the Trusts and other trusts or funds within the AMG Funds Family of Funds (collectively the “AMG Funds Family”) based upon their relative average net assets or number of shareholders. Investment income, realized and unrealized capital gains and losses, the common expenses of each Fund, and certain fund level expense reductions, if any, are allocated on a pro-rata basis to each class based on the relative net assets of each class to the total net assets of each Fund.
d. DIVIDENDS AND DISTRIBUTIONS
Fund distributions resulting from either net investment income or realized net capital gains, if any, will normally be declared and paid at least annually in December. Distributions to shareholders are recorded on the ex-dividend date. Distributions are determined in accordance with federal income tax regulations, which may differ from net investment income and net realized capital gains for financial statement purposes (U.S. GAAP). Differences may be permanent or temporary. Permanent differences are reclassified among capital accounts in the financial statements to reflect their tax character. Permanent book and tax basis differences, if any, relating to shareholder distributions will result in reclassifications to paid-in capital. Temporary differences arise when certain items of income, expense and gain or loss are recognized in different periods for financial statement and tax purposes; these differences will reverse at some time in the future. Temporary differences are primarily due to wash sale loss deferrals, mark-to-market on passive foreign investment companies, and capital loss carryforwards.
The tax character of distributions paid during the fiscal years ended October 31, 2020 and October 31, 2019 were as follows:
| | | | | | | | | | | | | | | | | | | | | | | | |
| | | Core Bond ESG | | | Emerging Wealth Equity | | | Emerging Markets Equity | |
| Distributions paid from: | | 2020 | | 2019 | | | 2020 | | | 2019 | | | 2020 | | | 2019 | |
Ordinary income * | | $4,331,183 | | | $5,562,456 | | | | $1,049,631 | | | | $542,178 | | | | $2,686,786 | | | | $6,203,548 | |
Long-term capital gains | | — | | | — | | | | 2,572,538 | | | | 2,788,443 | | | | — | | | | — | |
| | | | | | | | | | | | | | | | | | | | | | |
| | $4,331,183 | | | $5,562,456 | | | | $3,622,169 | | | | $3,330,621 | | | | $2,686,786 | | | | $6,203,548 | |
| | | | | | | | | | | | | | | | | | | | | | |
| * | For tax purposes, short-term capital gain distributions, if any, are considered ordinary income distributions. |
39
|
Notes to Financial Statements (continued) |
As of October 31, 2020, the components of distributable earnings (excluding unrealized appreciation/depreciation) on a tax basis consisted of:
| | | | | | | | | | | | |
| | | Core Bond ESG | | | Emerging Wealth Equity | | | Emerging Markets Equity | |
Capital loss carryforward | | | $425,987 | | | | $911,098 | | | | — | |
Undistributed ordinary income | | | 10,769 | | | | 35,159 | | | | $710,745 | |
Undistributed long-term capital gains | | | — | | | | — | | | | 1,624,970 | |
At October 31, 2020, the cost of investments and the aggregate gross unrealized appreciation and depreciation for federal income tax purposes were as follows:
| | | | | | | | | | | | | | | | |
| Fund | | Cost | | | Appreciation | | | Depreciation | | | Net Appreciation | |
Core Bond ESG | | | $192,033,344 | | | | $12,461,398 | | | | $(543,111) | | | | $11,918,287 | |
Emerging Wealth Equity | | | 168,061,969 | | | | 40,527,752 | | | | (8,187,047) | | | | 32,340,705 | |
Emerging Markets Equity | | | 33,074,590 | | | | 12,330,056 | | | | (3,197,880) | | | | 9,132,176 | |
e. FEDERAL TAXES
Each Fund currently qualifies as an investment company and intends to comply with the requirements under Subchapter M of the Internal Revenue Code of 1986, as amended, and to distribute substantially all of its taxable income and gains to its shareholders and to meet certain diversification and income requirements with respect to investment companies. Therefore, no provision for federal income or excise tax is included in the accompanying financial statements.
Additionally, based on each Fund’s understanding of the tax rules and rates related to income, gains and transactions for the foreign jurisdictions in which it invests, each Fund will provide for foreign taxes, and where appropriate, deferred foreign taxes.
Management has analyzed the Funds’ tax positions taken on federal income tax returns as of October 31, 2020, and for all open tax years (generally, the three prior taxable years), and has concluded that no provision for federal income tax is required in the Funds’ financial statements. Additionally, Management is not aware of any tax position for which it is reasonably possible that the total amounts of unrecognized tax benefits will change materially in the next twelve months.
f. CAPITAL LOSS CARRYOVERS AND DEFERRALS
As of October 31, 2020, the following Fund had capital loss carryovers for federal income tax purposes as shown in the following chart. These amounts may be used to offset future realized capital gains indefinitely, and retain their character as short-term and/or long-term.
| | | | | | | | | | | | |
| | | Capital Loss Carryover Amounts | |
| | | |
| Fund | | Short-Term | | | Long-Term | | | Total | |
Core Bond ESG | | | $425,987 | | | | $0 | | | | $425,987 | |
Emerging Wealth Equity | | | 911,098 | | | | 0 | | | | 911,098 | |
As of October 31, 2020, Emerging Markets Equity had no capital loss carryovers for federal income tax purposes. Should the Fund incur net capital losses for the fiscal year ended October 31, 2021, such amounts may be used to offset future realized capital gains indefinitely, and retain their character as either short-term and/or long-term.
For the fiscal year ended October 31, 2020, the following Funds utilized capital loss carryovers in the amount of:
| | | | | | | | |
| | | Capital Loss Carryover Utilized | |
| | |
| Fund | | Short-Term | | | Long-Term | |
Core Bond ESG | | | $1,501,319 | | | | $2,340,507 | |
40
|
Notes to Financial Statements (continued) |
g. CAPITAL STOCK
The Trusts’ Declaration of Trust authorizes for each Fund the issuance of an unlimited number of shares of beneficial interest, without par value. Each Fund records sales and repurchases of its capital stock on the trade date. Prior to March 1, 2019, Emerging Wealth Equity and Emerging Markets Equity deducted a 2.00% redemption fee from the proceeds of any redemption of shares (including a redemption by exchange) if the redemption occurred within 60 days of the purchase of those shares. For the fiscal year ended October 31, 2019, Emerging Wealth Equity and Emerging Markets Equity had redemption fees amounting to $25 and $194, respectively. These amounts are netted against the cost of shares repurchased.
For the fiscal years ended October 31, 2020 and October 31, 2019, the capital stock transactions by class for the Funds were as follows:
| | | | | | | | | | | | | | | | | | | | | | | | | | | | | | | | |
| | | | | Core Bond ESG | | | | | | Emerging Wealth Equity | | |
| | | October 31, 2020 | | October 31, 2019 | | October 31, 2020 | | October 31, 2019 |
| | | Shares | | Amount | | Shares | | Amount | | Shares | | Amount | | Shares | | Amount |
| | | | | | | | |
Class N: | | | | | | | | | | | | | | | | | | | | | | | | | | | | | | | | |
| | | | | | | | |
Proceeds from sale of shares | | | 85,411 | | | | $920,846 | | | | 87,070 | | | | $910,282 | | | | 24,646 | | | | $275,535 | | | | 69,471 | | | | $769,916 | |
| | | | | | | | |
Reinvestment of distributions | | | 2,508 | | | | 26,975 | | | | 1,518 | | | | 15,524 | | | | 4,548 | | | | 55,712 | | | | 9,251 | | | | 90,748 | |
| | | | | | | | |
Cost of shares repurchased | | | (32,291 | ) | | | (348,057 | ) | | | (21,364 | ) | | | (222,853 | ) | | | (68,095 | ) | | | (733,597 | ) | | | (97,339 | ) | | | (1,084,456 | ) |
| | | | | | | | | | | | | | | | | | | | | | | | | | | | | | | | |
| | | | | | | | |
Net increase (decrease) | | | 55,628 | | | | $599,764 | | | | 67,224 | | | | $702,953 | | | | (38,901 | ) | | | $(402,350 | ) | | | (18,617 | ) | | | $(223,792 | ) |
| | | | | | | | | | | | | | | | | | | | | | | | | | | | | | | | |
| | | | | | | | |
Class I: | | | | | | | | | | | | | | | | | | | | | | | | | | | | | | | | |
| | | | | | | | |
Proceeds from sale of shares | | | 1,374,556 | | | | $14,850,604 | | | | 875,494 | | | | $8,860,974 | | | | 1,818,122 | | | | $21,632,228 | | | | 471,195 | | | | $5,535,916 | |
| | | | | | | | |
Reinvestment of distributions | | | 374,177 | | | | 4,019,598 | | | | 515,172 | | | | 5,217,134 | | | | 17,592 | | | | 216,555 | | | | 8,893 | | | | 87,775 | |
| | | | | | | | |
Cost of shares repurchased | | | (3,385,772 | ) | | | (36,392,063 | ) | | | (8,572,748 | ) | | | (85,400,513 | ) | | | (656,368 | ) | | | (7,085,572 | ) | | | (197,196 | ) | | | (2,166,432 | ) |
| | | | | | | | | | | | | | | | | | | | | | | | | | | | | | | | |
| | | | | | | | |
Net increase (decrease) | | | (1,637,039 | ) | | | $(17,521,861 | ) | | | (7,182,082 | ) | | | $(71,322,405 | ) | | | 1,179,346 | | | | $14,763,211 | | | | 282,892 | | | | $3,457,259 | |
| | | | | | | | | | | | | | | | | | | | | | | | | | | | | | | | |
| | | | | | | | |
Class Z: | | | | | | | | | | | | | | | | | | | | | | | | | | | | | | | | |
| | | | | | | | |
Proceeds from sale of shares | | | 82,098 | | | | $869,531 | | | | 27,467 | | | | $272,702 | | | | 8,182,601 | | | | $98,216,854 | | | | 3,990,467 | | | | $44,631,920 | |
| | | | | | | | |
Reinvestment of distributions | | | 7,172 | | | | 77,096 | | | | 7,734 | | | | 78,419 | | | | 27,678 | | | | 339,331 | | | | 32,301 | | | | 317,526 | |
| | | | | | | | |
Cost of shares repurchased | | | (44,147 | ) | | | (477,970 | ) | | | (248,245 | ) | | | (2,435,700 | ) | | | (3,049,658 | ) | | | (33,692,378 | ) | | | (1,063,505 | ) | | | (11,650,219 | ) |
| | | | | | | | | | | | | | | | | | | | | | | | | | | | | | | | |
| | | | | | | | |
Net increase (decrease) | | | 45,123 | | | | $468,657 | | | | (213,044 | ) | | | $(2,084,579 | ) | | | 5,160,621 | | | | $64,863,807 | | | | 2,959,263 | | | | $33,299,227 | |
| | | | | | | | | | | | | | | | | | | | | | | | | | | | | | | | |
| | | | | | | | | | | | | | | | | | | | | | | | |
| | | | | Emerging Markets Equity | | | | | | | | | | |
| | | | | | |
| | | October 31, 2020 | | October 31, 2019 | | | | | | | | |
| | | | | | | | |
| | | Shares | | Amount | | Shares | | Amount | | | | | | | | |
| | | | | | | | |
Class N: | | | | | | | | | | | | | | | | | | | | | | | | |
| | | | | | | | |
Proceeds from sale of shares | | | 181,059 | | | | $1,744,337 | | | | 26,442 | | | | $249,645 | | | | | | | | | |
| | | | | | | | |
Reinvestment of distributions | | | 2,833 | | | | 26,891 | | | | 1,362 | | | | 12,186 | | | | | | | | | |
| | | | | | | | |
Cost of shares repurchased | | | (196,188 | ) | | | (1,558,530 | ) | | | (6,762 | ) | | | (64,732 | ) | | | | | | | | |
| | | | | | | | | | | | | | | | | | | | | | | | |
| | | | | | | | |
Net increase (decrease) | | | (12,296 | ) | | | $212,698 | | | | 21,042 | | | | $197,099 | | | | | | | | | |
| | | | | | | | | | | | | | | | | | | | | | | | |
| | | | | | | | |
Class I: | | | | | | | | | | | | | | | | | | | | | | | | |
| | | | | | | | |
Proceeds from sale of shares | | | 1,230,745 | | | | $9,743,030 | | | | 1,450,638 | | | | $13,047,613 | | | | | | | | | |
| | | | | | | | |
Reinvestment of distributions | | | 52,112 | | | | 491,414 | | | | 32,500 | | | | 286,519 | | | | | | | | | |
| | | | | | | | |
Cost of shares repurchased | | | (1,837,609 | ) | | | (15,777,470 | ) | | | (243,911 | ) | | | (2,243,793 | ) | | | | | | | | |
| | | | | | | | | | | | | | | | | | | | | | | | |
Net increase (decrease) | | | (554,752 | ) | | | $(5,543,026 | ) | | | 1,239,227 | | | | $11,090,339 | | | | | | | | | |
| | | | | | | | | | | | | | | | | | | | | | | | |
41
|
Notes to Financial Statements (continued) |
| | | | | | | | | | | | | | | | | | | | | | | | |
| | | | | Emerging Markets Equity | | | | | | | | | | |
| | | | | | |
| | | October 31, 2020 | | October 31, 2019 | | | | | | | | |
| | | | | | | | |
| | | Shares | | Amount | | Shares | | Amount | | | | | | | | |
| | | | | | | | |
Class Z: | | | | | | | | | | | | | | | | | | | | | | | | |
Proceeds from sale of shares | | | 231,629 | | | | $2,130,804 | | | | 1,633,015 | | | | $15,883,163 | | | | | | | | | |
| | | | | | | | |
Reinvestment of distributions | | | 128,421 | | | | 1,203,308 | | | | 577,222 | | | | 5,074,236 | | | | | | | | | |
| | | | | | | | |
Cost of shares repurchased | | | (1,213,641 | ) | | | (11,305,915 | ) | | | (14,461,736 | ) | | | (134,796,003 | ) | | | | | | | | |
| | | | | | | | | | | | | | | | | | | | | | | | |
| | | | | | | | |
Net decrease | | | (853,591 | ) | | | $(7,971,803 | ) | | | (12,251,499 | ) | | | $(113,838,604 | ) | | | | | | | | |
| | | | | | | | | | | | | | | | | | | | | | | | |
At October 31, 2020, certain affiliated and unaffiliated shareholders of record individually or collectively held greater than 10% of the net assets of the Funds as follows: Emerging Markets Equity - one owns 34%. Transactions by this shareholder may have a material impact on the Fund.
h. REPURCHASE AGREEMENTS AND JOINT REPURCHASE AGREEMENTS
The Funds may enter into third-party repurchase agreements for temporary cash management purposes and third-party or bilateral joint repurchase agreements for reinvestment of cash collateral on securities lending transactions under the securities lending program offered by The Bank of New York Mellon (“BNYM”) (the “Program”) (collectively, “Repurchase Agreements”). The value of the underlying collateral, including accrued interest, must equal or exceed the value of the Repurchase Agreements during the term of the agreement. For joint repurchase agreements, the Funds participate on a pro rata basis with other clients of BNYM in its share of the underlying collateral under such joint repurchase agreements and in its share of proceeds from any repurchase or other disposition of the underlying collateral. The underlying collateral for all Repurchase Agreements is held in safekeeping by the Funds’ custodian or at the Federal Reserve Bank. If the seller defaults and the value of the collateral declines, or if bankruptcy proceedings commence with respect to the seller of the security, realization of the collateral by the Funds may be delayed or limited. Pursuant to the Program, the Funds are indemnified for such losses by BNYM on joint repurchase agreements.
At October 31, 2020, the Funds had no repurchase agreements.
i. FOREIGN CURRENCY TRANSLATION
The books and records of the Funds are maintained in U.S. dollars. The value of investments, assets and liabilities denominated in currencies other than U.S. dollars are translated into U.S. dollars based upon current foreign exchange rates. Purchases and sales of foreign investments, income and expenses are converted into U.S. dollars based on currency exchange rates prevailing on the respective dates of such transactions. Net realized and unrealized gain (loss) on foreign currency transactions represent: (1) foreign exchange gains and losses from the sale and holdings of foreign currencies; (2) gains and losses between trade date and settlement date on investment securities transactions and foreign currency exchange contracts; and (3) gains and losses from the difference between amounts of interest and dividends recorded and the amounts actually received.
The Funds do not isolate the net realized and unrealized gain or loss resulting from changes in exchange rates from the fluctuations in market prices of securities held. Such fluctuations are included with the net realized and unrealized gain or loss on investments.
2. AGREEMENTS AND TRANSACTIONS WITH AFFILIATES
For each of the Funds, the Trusts have entered into an investment advisory agreement under which the Investment Manager, a subsidiary and the U.S. retail distribution arm of Affiliated Managers Group, Inc. (“AMG”), serves as investment manager to the Funds and is responsible for the Funds’ overall administration and operations. The Investment Manager selects one or more subadvisers for the Funds (subject to Board approval) and monitors each subadviser’s investment performance, security holdings and investment strategies. Each Fund’s investment portfolio is managed by GW&K Investment Management, LLC, (“GW&K”), who serves pursuant to a subadvisory agreement with the Investment Manager. AMG indirectly owns a majority interest in GW&K.
Investment management fees are paid directly by the Funds to the Investment Manager based on average daily net assets. For the fiscal year ended October 31, 2020, the Funds’ investment management fees were paid at the following annual rate of each Fund’s respective average daily net assets:
| | | | |
Core Bond ESG | | | 0.30% | |
Emerging Wealth Equity | | | 0.55% | |
Emerging Markets Equity | | | 0.55% | |
The Investment Manager has contractually agreed, through at least March 1, 2021, to waive management fees and/or pay or reimburse fund expenses in order to limit total annual Fund operating expenses after fee waiver and expense reimbursements (exclusive of taxes, interest (including interest incurred in connection with bank and custody overdrafts and in connection with securities sold short), shareholder servicing fees, distribution and service (12b-1) fees, brokerage commissions and other transaction costs, dividends payable with respect to securities sold short, acquired fund fees and expenses and extraordinary expenses) of Core Bond ESG, Emerging Wealth Equity and Emerging Markets Equity to 0.48%, 1.05% and 0.87%, respectively, of each Fund’s average daily net assets (this annual rate or such other annual rate that may be in effect from time to time, the “Expense Cap”), subject to later reimbursement by the Funds in certain circumstances. Prior to March 1, 2020, the total annual Fund operating expense limitation was 1.05% of Emerging Markets Equity’s average daily net assets.
In general, for a period of up to 36 months after the date any amounts are paid, waived or reimbursed by the Investment Manager, the Investment Manager may
42
|
Notes to Financial Statements (continued) |
recover such amounts from a Fund, provided that such repayment would not cause the Fund’s total annual operating expenses after fee waiver and expense reimbursements (exclusive of the items noted in the parenthetical above) to exceed either (i) the Expense Cap in effect at the time such amounts were paid, waived or reimbursed, or (ii) the Expense Cap in effect at the time of such repayment by the Fund.
The contractual expense limitation may only be terminated in the event the Investment Manager or a successor ceases to be the investment manager of a Fund or a successor fund, by mutual agreement between the Investment Manager and the Board, or in the event of a Fund’s liquidation unless the Fund is reorganized or is a party to a merger in which the surviving entity is successor to the accounting and performance information of a Fund.
At October 31, 2020, the Funds’ expiration of reimbursements subject to recoupment is as follows:
| | | | | | | | |
| Expiration | | | | | | |
| Period | | Core Bond ESG | | | Emerging Markets Equity | |
Less than 1 year | | | $146,013 | | | | — | |
1-2 years | | | 156,648 | | | | — | |
2-3 years | | | 159,696 | | | | $85,815 | |
| | | | | | | | |
Total | | | $462,357 | | | | $85,815 | |
| | | | | | | | |
The Investment Manager has contractually agreed, through at least March 1, 2021, to waive management fees and/or pay or reimburse Emerging Markets Equity’s expenses in an amount that is equal to the fees and expenses incurred indirectly by the Fund as a result of investment in shares of one or more acquired funds. The contractual expense limitation may only be terminated in the event the Investment Manager or a successor ceases to be the investment manager of the Fund or a successor fund, by mutual agreement among the Investment Manager, GW&K and the AMG Funds Board of Trustees or in the event of the Fund’s liquidation unless the Fund is reorganized or is a party to a merger in which the surviving entity is successor to the accounting and performance information of the Fund. For the fiscal year ended October 31, 2020, the Investment Manager waived $738 in fees.
The Trusts, on behalf of the Funds, have entered into an amended and restated Administration Agreement under which the Investment Manager serves as the Funds’ administrator (the “Administrator”) and is responsible for all non-portfolio management aspects of managing the Funds’ operations, including administration and shareholder services to each Fund. Each Fund pays a fee to the Administrator at the rate of 0.15% per annum of the Fund’s average daily net assets for this service.
The Funds are distributed by AMG Distributors, Inc. (the “Distributor”), a wholly-owned subsidiary of the Investment Manager. The Distributor serves as the distributor and underwriter for each Fund and is a registered broker-dealer and member of the Financial Industry Regulatory Authority, Inc. (“FINRA”). Shares of each Fund will be continuously offered and will be sold directly to prospective purchasers and through brokers, dealers or other financial intermediaries who have executed selling agreements with the Distributor. Generally the Distributor bears all or a portion of the expenses of providing services pursuant to the distribution agreement, including the payment of the expenses relating to the distribution of prospectuses for sales purposes and any advertising or sales literature.
The Trusts have adopted a distribution and service plan (the “Plan”) with respect to the Class N shares of each Fund, in accordance with the requirements of Rule 12b-1 under the 1940 Act and the requirements of the applicable rules of FINRA regarding asset-based sales charges. Pursuant to the Plan, each Fund may make payments to the Distributor for its expenditures in financing any activity primarily intended to result in the sale of each Fund’s Class N shares and for maintenance and personal service provided to existing shareholders of that class. The Plan authorized payments to the Distributor up to 0.25% annually of each Fund’s average daily net assets attributable to the Class N shares.
For each of the Class N shares and Class I shares, the Board has approved reimbursement payments to the Investment Manager for shareholder servicing expenses (“shareholder servicing fees”) incurred. Shareholder servicing fees include payments to financial intermediaries, such as broker-dealers (including fund supermarket platforms), banks, and trust companies who provide shareholder recordkeeping, account servicing and other services. The Class N and Class I shares may reimburse the Investment Manager for the actual amount incurred up to a maximum annual rate of each Class’s average daily net assets as shown in the table below.
The impact on the annualized expense ratios for the fiscal year ended October 31, 2020, were as follows:
| | | | | | | | |
| Fund | | Maximum Annual Amount Approved | | | Actual Amount Incurred | |
Core Bond ESG | | | | | | | | |
Class N | | | 0.15 | % | | | 0.15 | % |
Class I | | | 0.10 | % | | | 0.07 | % |
Emerging Wealth Equity | | | | | | | | |
Class N | | | 0.15 | % | | | 0.15 | % |
Class I | | | 0.15 | % | | | 0.11 | % |
Emerging Markets Equity | | | | | | | | |
Class N | | | 0.15 | % | | | 0.15 | % |
Class I | | | 0.15 | % | | | 0.07 | % |
The Board provides supervision of the affairs of the Trusts and other trusts within the AMG Funds Family. The Trustees of the Trusts who are not affiliated with the Investment Manager receive an annual retainer and per meeting fees for regular, special and telephonic meetings, and they are reimbursed for out-of-pocket expenses incurred while carrying out their duties as Board members. The Chairman of the Board and the Audit Committee Chair receive additional annual retainers. Certain Trustees and Officers of the Funds are Officers and/or Directors of the Investment Manager, AMG and/or the Distributor.
The Securities and Exchange Commission (the “SEC”) granted an exemptive order that permits the Funds to lend and borrow money for certain temporary purposes directly to and from other eligible funds in the AMG Funds Family. Participation in this interfund lending program is voluntary for both the borrowing and lending funds, and an interfund loan is only made if it benefits each participating fund. The Administrator manages the program according to procedures approved by the Board, and the Board monitors the operation of the program. An interfund loan must comply with certain conditions set out in the exemptive order, which are designed to assure fairness and protect all participating funds. The interest earned and interest paid on interfund loans are included on the Statement of Operations
43
|
Notes to Financial Statements (continued) |
as interest income and miscellaneous expense, respectively. At October 31, 2020, the Funds had no interfund loans outstanding.
The following Funds utilized the interfund loan program during the fiscal year ended October 31, 2020:
| | | | | | | | | | | | | | | | |
| Fund | | Average
Lent | | | Number
of Days | | | Interest
Earned | | | Average
Interest Rate | |
Core Bond ESG | | | $1,272,899 | | | | 5 | | | | $173 | | | | 0.993% | |
Emerging Wealth Equity | | | 892,738 | | | | 5 | | | | 295 | | | | 2.413% | |
| | | | |
| Fund | | Average
Borrowed | | | Number
of Days | | | Interest
Paid | | | Average
Interest Rate | |
Emerging Wealth Equity | | | $2,094,556 | | | | 2 | | | | $175 | | | | 1.525% | |
| | | | |
Emerging Markets Equity | | | 2,522,039 | | | | 24 | | | | 2,848 | | | | 1.720% | |
3. PURCHASES AND SALES OF SECURITIES
Purchases and sales of securities (excluding short-term securities and U.S. Government Obligations) for the fiscal year ended October 31, 2020, were as follows:
| | | | | | | | |
| | | Long Term Securities | |
| | |
| Fund | | Purchases | | | Sales | |
| | |
Core Bond ESG | | | $88,539,079 | | | | $82,154,915 | |
| | |
Emerging Wealth Equity | | | 125,376,235 | | | | 55,936,702 | |
| | |
Emerging Markets Equity | | | 18,868,574 | | | | 34,999,551 | |
Core Bond ESG purchases and sales of U.S. Government obligations during the fiscal year ended October 31, 2020 were $28,625,380 and $49,123,629, respectively.
4. PORTFOLIO SECURITIES LOANED
The Funds participate in the Program providing for the lending of securities to qualified borrowers. Securities lending income includes earnings of such temporary cash investments, plus or minus any rebate to a borrower. These earnings (after any rebate) are then divided between BNYM, as a fee for its services under the Program, and the Funds, according to agreed-upon rates. Collateral on all securities loaned is accepted in cash, U.S. Treasury Obligations or U.S. Government Agency Obligations. Collateral is maintained at a minimum level of 102% (105% in the case of certain foreign securities) of the market value, plus interest, if applicable, of investments on loan. It is the Funds’ policy to obtain additional collateral from or return excess collateral to the borrower by the end of the next business day, following the valuation date of the securities loaned. Therefore, the value of the collateral held may be temporarily less than the value of the securities on loan. Lending securities entails a risk of loss to the Funds if and to the extent that the market value of the securities loaned were to increase and the borrower did not increase the collateral accordingly, and the borrower fails to return the securities. Under the terms of the Program, the Funds are indemnified for such losses by BNYM. Cash collateral is held in separate omnibus accounts managed by BNYM, who is authorized to exclusively enter into joint repurchase agreements for that cash collateral. Securities collateral is held in separate omnibus accounts managed by BNYM that cannot be sold or pledged. BNYM bears the risk of any deficiency in the amount of the cash collateral available for return to the borrower due to any loss on the collateral invested. Loans of securities are
terminable at any time and the borrower, after notice, is required to return borrowed securities as soon as practical, which is normally within three business days.
The value of securities loaned on positions held, cash collateral and securities collateral received at October 31, 2020, were as follows:
| | | | | | | | | | | | | | | | |
| Fund | | Securities
Loaned | | | Cash
Collateral
Received | | | Securities
Collateral
Received | | | Total
Collateral
Received | |
Emerging Wealth Equity | | | $7,345,204 | | | | — | | | | $7,692,326 | | | | $7,692,326 | |
Emerging Markets Equity | | | 865,468 | | | | — | | | | 884,372 | | | | 884,372 | |
The following table summarizes the securities received as collateral for securities lending at October 31, 2020:
| | | | | | |
| Fund | | Collateral Type | | Coupon
Range | | Maturity Date Range |
Emerging Wealth Equity | | U.S. Treasury Obligations | | 0.010%-8.125% | | 11/15/20-02/15/50 |
Emerging Markets Equity | | U.S. Treasury Obligations | | 0.010%-8.125% | | 11/15/20-02/15/50 |
5. FOREIGN SECURITIES
Certain Funds invest in securities of foreign entities and in instruments denominated in foreign currencies which involve risks not typically associated with investments in domestic securities. Non-domestic securities carry special risks, such as exposure to currency fluctuations, less developed or less efficient trading markets, political instability, a lack of company information, differing auditing and legal standards, and, potentially, less liquidity. A Fund’s investments in emerging market countries are exposed to additional risks. A Fund’s performance will be influenced by political, social and economic factors affecting companies in emerging market countries. Emerging market countries generally have economic structures that are less diverse and mature, and political systems that are less stable, than those of developed countries. Realized gains in certain countries may be subject to foreign taxes at the Fund level and the Fund would pay such foreign taxes at the appropriate rate for each jurisdiction.
6. COMMITMENTS AND CONTINGENCIES
Under the Trusts’ organizational documents, its trustees and officers are indemnified against certain liabilities arising out of the performance of their duties to the Trusts. In addition, in the normal course of business, the Funds may enter into contracts and agreements that contain a variety of representations and warranties, which provide general indemnifications. The maximum exposure to the Funds under these arrangements is unknown, as this would involve future claims that may be made against a Fund that have not yet occurred. However, based on experience, the Funds had no prior claims or losses and expect the risks of loss to be remote.
44
|
Notes to Financial Statements (continued) |
7. MASTER NETTING AGREEMENTS
The Funds may enter into master netting agreements with their counterparties for the securities lending program and Repurchase Agreements, which provide the right, in the event of default (including bankruptcy or insolvency) for the non-defaulting party to liquidate the collateral and calculate net exposure to the defaulting party or request additional collateral. For financial reporting purposes, the Funds do not offset financial assets and financial liabilities that are subject to master netting agreements in the Statement of Assets and Liabilities. For securities lending transactions, see Note 4.
8. SUBSEQUENT EVENTS
The Funds have determined that no material events or transactions occurred through the issuance date of the Funds’ financial statements which require an additional disclosure in or adjustment of the Funds’ financial statements.
45
|
Report of Independent Registered Public Accounting Firm |
TO THE BOARD OF TRUSTEES OF AMG FUNDS AND AMG FUNDS I AND SHAREHOLDERS OF AMG GW&K CORE BOND ESG FUND, AMG GW&K EMERGING WEALTH EQUITY FUND (FORMERLY AMG GW&K TRILOGY EMERGING WEALTH EQUITY FUND) AND AMG GW&K EMERGING MARKETS EQUITY FUND (FORMERLY AMG GW&K TRILOGY EMERGING MARKETS EQUITY FUND):
Opinion on the Financial Statements
We have audited the accompanying statements of assets and liabilities, including the schedules of portfolio investments, of AMG GW&K Core Bond ESG Fund (one of the funds constituting AMG Funds I), AMG GW&K Emerging Wealth Equity Fund (formerly AMG GW&K Trilogy Emerging Wealth Equity Fund) and AMG GW&K Emerging Markets Equity Fund (formerly AMG GW&K Trilogy Emerging Markets Equity Fund) (two of the funds constituting AMG Funds) (hereafter collectively referred to as the “Funds”) as of October 31, 2020, the related statements of operations for the year ended October 31, 2020, the statements of changes in net assets for each of the two years in the period ended October 31, 2020, including the related notes, and the financial highlights for each of the five years in the period ended October 31, 2020 (collectively referred to as the “financial statements”). In our opinion, the financial statements present fairly, in all material respects, the financial position of each of the Funds as of October 31, 2020, the results of each of their operations for the year then ended, the changes in each of their net assets for each of the two years in the period ended October 31 2020, and each of the financial highlights for each of the five years in the period ended October 31, 2020, in conformity with accounting principles generally accepted in the United States of America.
Basis for Opinion
These financial statements are the responsibility of the Funds’ management. Our responsibility is to express an opinion on the Funds’ financial statements based on our audits. We are a public accounting firm registered with the Public Company Accounting Oversight Board (United States) (PCAOB) and are required to be independent with respect to the Funds in accordance with the U.S. federal securities laws and the applicable rules and regulations of the Securities and Exchange Commission and the PCAOB.
We conducted our audits of these financial statements in accordance with the standards of the PCAOB. Those standards require that we plan and perform the audits to obtain reasonable assurance about whether the financial statements are free of material misstatement, whether due to error or fraud.
Our audits included performing procedures to assess the risks of material misstatement of the financial statements, whether due to error or fraud, and performing procedures that respond to those risks. Such procedures included examining, on a test basis, evidence regarding the amounts and disclosures in the financial statements. Our audits also included evaluating the accounting principles used and significant estimates made by management, as well as evaluating the overall presentation of the financial statements. Our procedures included confirmation of securities owned as of October 31, 2020, by correspondence with the custodian, transfer agent, and brokers; when replies were not received from brokers, we performed other auditing procedures. We believe that our audits provide a reasonable basis for our opinion.
PricewaterhouseCoopers LLP
Boston, Massachusetts
December 23, 2020
We have served as the auditor of one or more investment companies in the AMG Funds Family since 1993.
46
|
Other Information (unaudited) |
TAX INFORMATION
The AMG GW&K Core Bond ESG Fund, AMG GW&K Emerging Wealth Equity Fund and AMG GW&K Emerging Markets Equity Fund each hereby designates the maximum amount allowable of their net taxable income as qualified dividends as provided in the Jobs and Growth Tax Relief Reconciliation Act of 2003. The 2019/2020 Form 1099-DIV you receive for each Fund will show the tax status of all distributions paid to you during the year.
In accordance with federal tax law, the following Funds elect to provide foreign taxes paid and the income sourced from foreign countries. Accordingly, each Fund hereby makes the following designations regarding its taxable period ended October 31, 2020:
AMG GW&K Emerging Wealth Equity Fund
uThe total amount of taxes paid and income sourced from foreign countries was $100,564 and $1,226,917, respectively.
AMG GW&K Emerging Markets Equity Fund
uThe total amount of taxes paid and income sourced from foreign countries was $103,720 and $823,225, respectively.
Pursuant to section 852 of the Internal Revenue Code, AMG GW&K Core Bond ESG Fund, AMG GW&K Emerging Wealth Equity Fund and AMG GW&K Emerging Markets Equity Fund, each hereby designates as a capital gain distribution with respect to the taxable period ended October 31, 2020, $0, $2,572,538 and $0, respectively, or, if subsequently determined to be different, the net capital gains of such period.
47
|
AMG Funds Trustees and Officers |
| | | | |
| The Trustees and Officers of the Trust, their business addresses, principal occupations for the past five years and ages are listed below. The Trustees provide broad supervision over the affairs of the Trust and the Funds. The Trustees are experienced executives who meet periodically throughout the year to oversee the Funds’ activities, review contractual arrangements with companies that provide services to the Funds, and | | review the Fund’s performance. Unless otherwise noted, the address of each Trustee or Officer is the address of the Trust: 600 Steamboat Road, Suite 300, Greenwich, Connecticut 06830. There is no stated term of office for Trustees. Trustees serve until their resignation, retirement or removal in | | accordance with the Trust’s organizational documents and policies adopted by the Board from time to time. The Chairman of the Trustees, President, Treasurer and Secretary of the Trust are elected by the Trustees annually. Other officers hold office at the pleasure of the Trustees. |
Independent Trustees
The following Trustees are not “interested persons” of the Trust within the meaning of the 1940 Act:
| | |
Number of Funds Overseen in Fund Complex | | Name, Age, Principal Occupation(s) During Past 5 Years and Other Directorships Held by Trustee |
| |
• Trustee since 2012 • Oversees 46 Funds in Fund Complex | | Bruce B. Bingham, 72 Partner, Hamilton Partners (real estate development firm) (1987-2020); Director of The Yacktman Funds (2 portfolios) (2000-2012). |
| |
• Trustee of AMG Funds since 1999 • Trustee of AMG Funds I since 2000 • Oversees 35 Funds in Fund Complex | | Edward J. Kaier, 75 Attorney at Law and Partner, Teeters Harvey Marrone & Kaier LLP (2007-Present); Attorney at Law and Partner, Hepburn Willcox Hamilton & Putnam, LLP (1977-2007); Trustee of Third Avenue Trust (3 portfolios) (2002-2019); Trustee of Third Avenue Variable Trust (1 portfolio) (2002-2019); Trustee of AMG Funds IV (11 portfolios) (2010 - 2020). |
| |
• Trustee since 2013 • Oversees 49 Funds in Fund Complex | | Kurt A. Keilhacker, 57 Managing Partner, TechFund Capital (1997-Present); Managing Partner, TechFund Europe (2000-Present); Managing Partner, Elementum Ventures (2013-Present); Director, MetricStory, Inc. (2017-Present); Trustee, Wheaton College (2018-Present); Trustee, Gordon College (2001-2016); Trustee, Board Member, 6wind SA, (2002-2019). |
| |
• Trustee since 2000 • Oversees 46 Funds in Fund Complex | | Steven J. Paggioli, 70 Independent Consultant (2002-Present); Trustee, Professionally Managed Portfolios (28 portfolios); Advisory Board Member, Sustainable Growth Advisors, LP; Independent Director, Muzinich BDC, Inc. (business development company) (2019-Present); Director, The Wadsworth Group; Independent Director, Chase Investment Counsel (2008–2019); Executive Vice President, Secretary and Director, Investment Company Administration, LLC and First Fund Distributors, INC. (1990-2001). |
| |
• Trustee since 2013 • Oversees 46 Funds in Fund Complex | | Richard F. Powers III, 74 Adjunct Professor, U.S. Naval War College (2016-Present); Adjunct Professor, Boston College (2011-2015); Director, Ameriprise Financial Inc. (2005-2009); President and CEO of Van Kampen Investments Inc. (1998-2003); President, Morgan Stanley Client Group (2000-2002); Executive Vice President and Chief Marketing Officer of the Morgan Stanley Individual Investor Group (1984-1998). |
| |
• Independent Chairman • Trustee since 2000 • Oversees 49 Funds in Fund Complex | | Eric Rakowski, 62 Professor of Law, University of California at Berkeley School of Law (1990-Present); Tax Attorney at Davis Polk & Wardwell and clerked for Judge Harry T. Edwards of the U.S. Court of Appeals for the District of Columbia Circuit and for Justice William J. Brennan Jr. of the U.S. Supreme Court; Director of Harding, Loevner Funds, Inc. (9 portfolios); Trustee of Third Avenue Trust (3 portfolios) (2002-2019); Trustee of Third Avenue Variable Trust (1 portfolio) (2002-2019). |
| |
• Trustee since 2013 • Oversees 49 Funds in Fund Complex | | Victoria L. Sassine, 55 Adjunct Professor, Babson College (2007–Present); Director, Board of Directors, PRG Group (2017-Present); CEO, Founder, Scale Smarter Partners, LLC (2018-Present); Adviser, EVOFEM Biosciences (2019-Present); Teaching Fellow, Goldman Sachs 10,000 Small Business Initiative (2010-Present); Chairperson of the Board of Directors of Business Management Associates (2018 to 2019). |
| |
• Trustee of AMG Funds since 2004 • Trustee of AMG Funds I since 2000 • Oversees 46 Funds in Fund Complex | | Thomas R. Schneeweis, 73 Professor Emeritus, University of Massachusetts (2013-Present); President, TRS Associates (1982-Present); Board Member, Chartered Alternative Investment Association (“CAIA”) (2002-Present); Director, CAIA Foundation (2010-2019); Director, Institute for Global Asset and Risk Management (Education) (2010-Present); Co-Owner, Quantitative Investment Technologies (2014-Present); Co-Owner, Yes Wealth Management (2018-Present); Director of Research, Yes Wealth Management (2018-Present); Partner, S Capital Wealth Advisors (2015-2018); Partner, S Capital Management, LLC (2007-2015); President, Alternative Investment Analytics, LLC, (formerly Schneeweis Partners, LLC) (2001-2013); Finance Professor, University of Massachusetts (1977-2013). |
48
|
AMG Fund Trustees and Officers (continued) |
Interested Trustees
Each Trustee in the following table is an “interested person” of the Trust within the meaning of the 1940 Act. Ms. Carsman is an interested person of the Trust within the meaning of the 1940 Act by virtue of her position with, and interest in securities of, AMG.
| | |
Number of Funds Overseen in Fund Complex | | Name, Age, Principal Occupation(s) During Past 5 Years and Other Directorships Held by Trustee |
| | |
• Trustee since 2011 • Oversees 46 Funds in Fund Complex | | Christine C. Carsman, 68 Senior Policy Advisor, Affiliated Managers Group, Inc. (2019-Present); Chair of the Board of Directors, AMG Funds plc (2015-2018); Director, AMG Funds plc (2010-2018); Executive Vice President, Deputy General Counsel and Chief Regulatory Counsel, Affiliated Managers Group, Inc. (2017-2018); Senior Vice President and Deputy General Counsel, Affiliated Managers Group, Inc. (2011-2016); Senior Vice President and Chief Regulatory Counsel, Affiliated Managers Group, Inc. (2007-2011); Vice President and Chief Regulatory Counsel, Affiliated Managers Group, Inc. (2004-2007); Senior Counsel, Vice President and Director of Operational Risk Management and Compliance, Wellington Management Company, LLP (1995-2004); Director of Harding, Loevner Funds, Inc. (9 portfolios) (2017-Present); Secretary and Chief Legal Officer, AMG Funds, AMG Funds I, AMG Funds II and AMG Funds III (2004-2011). |
| | |
| Officers | | |
| Position(s) Held with Fund and Length of Time Served | | Name, Age, Principal Occupation(s) During Past 5 Years |
| | |
• President since 2018 • Principal Executive Officer since 2018 • Chief Executive Officer since 2018 • Chief Operating Officer since 2007 | | Keitha L. Kinne, 62 Chief Operating Officer, AMG Funds LLC (2007-Present); Chief Investment Officer, AMG Funds LLC (2008-Present); President and Principal, AMG Distributors, Inc. (2018-Present); Chief Operating Officer, AMG Distributors, Inc. (2007-Present); President, Chief Executive Officer and Principal Executive Officer, AMG Funds, AMG Funds I, AMG Funds II, AMG Funds III and AMG Funds IV (2018-Present); Chief Operating Officer, AMG Funds, AMG Funds I, AMG Funds II, and AMG Funds III (2007-Present); Chief Operating Officer, AMG Funds IV (2016-Present); Chief Operating Officer and Chief Investment Officer, Aston Asset Management, LLC (2016); President and Principal Executive Officer, AMG Funds, AMG Funds I, AMG Funds II and AMG Funds III (2012-2014); Managing Partner, AMG Funds LLC (2007-2014); President and Principal, AMG Distributors, Inc. (2012-2014); Managing Director, Legg Mason & Co., LLC (2006-2007); Managing Director, Citigroup Asset Management (2004-2006). |
| | |
• Secretary since 2015 • Chief Legal Officer since 2015 | | Mark J. Duggan, 55 Senior Vice President and Senior Counsel, AMG Funds LLC (2015-Present); Secretary and Chief Legal Officer, AMG Funds, AMG Funds I, AMG Funds II, AMG Funds III and AMG Funds IV (2015-Present); Attorney, K&L Gates, LLP (2009-2015). |
| | |
• Chief Financial Officer since 2017 • Treasurer since 2017 • Principal Financial Officer since 2017 • Principal Accounting Officer since 2017 | | Thomas G. Disbrow, 54 Vice President, Mutual Fund Treasurer & CFO, AMG Funds, AMG Funds LLC (2017-Present); Chief Financial Officer, Principal Financial Officer, Treasurer and Principal Accounting Officer, AMG Funds, AMG Funds I, AMG Funds II, AMG Funds III and AMG Funds IV (2017-Present); Managing Director - Global Head of Traditional Funds Product Control, UBS Asset Management (Americas), Inc. (2015-2017); Managing Director - Head of North American Funds Treasury, UBS Asset Management (Americas), Inc. (2011-2015). |
| | |
• Deputy Treasurer since 2017 | | John A. Starace, 50 Director, Mutual Fund Accounting, AMG Funds LLC (2017-Present); Vice President, Deputy Treasurer of Mutual Funds Services, AMG Funds LLC (2014-2017); Deputy Treasurer, AMG Funds, AMG Funds I, AMG Funds II, AMG Funds III and AMG Funds IV (2017-Present); Vice President, Citi Hedge Fund Services (2010-2014); Audit Senior Manager (2005-2010) and Audit Manager (2001-2005), Deloitte & Touche LLP. |
| | |
• Chief Compliance Officer since 2019 | | Patrick J. Spellman, 46 Vice President, Chief Compliance Officer, AMG Funds LLC (2017-Present); Chief Compliance Officer and Sarbanes-Oxley Code of Ethics Compliance Officer, AMG Funds, AMG Funds I, AMG Funds II, AMG Funds III and AMG Funds IV (2019-Present); Chief Compliance Officer, AMG Distributors, Inc., (2010-Present); Senior Vice President, Chief Compliance Officer, AMG Funds LLC (2011-2017); Anti-Money Laundering Compliance Officer, AMG Funds, AMG Funds I, AMG Funds II, and AMG Funds III (2014-2019); Anti-Money Laundering Officer, AMG Funds IV, (2016-2019); Compliance Manager, Legal and Compliance, Affiliated Managers Group, Inc. (2005-2011). |
| | |
• Assistant Secretary since 2016 | | Maureen A. Meredith, 35 Vice President, Counsel, AMG Funds LLC (2019-Present); Director, Counsel, AMG Funds LLC (2017-2018); Vice President, Counsel, AMG Funds LLC (2015-2017); Assistant Secretary, AMG Funds, AMG Funds I, AMG Funds II, AMG Funds III and AMG Funds IV (2016-Present); Associate, Ropes & Gray LLP (2011-2015); Law Fellow, Massachusetts Appleseed Center for Law and Justice (2010-2011). |
| | |
• Anti-Money Laundering Compliance Officer since 2019 | | Hector D. Roman, 43 Director, Legal and Compliance, AMG Funds LLC (2020-Present); Manager, Legal and Compliance, AMG Funds LLC (2017-2019); Director of Compliance, Morgan Stanley Investment Management (2015-2017); Senior Advisory, PricewaterhouseCoopers LLP (2014-2015); Risk Manager, Barclays Investment Bank (2008-2014); Anti-Money Laundering Compliance Officer, AMG Funds, AMG Funds I, AMG Funds II, AMG Funds III and AMG Funds IV (2019-Present). |
49
|
Annual Renewal of Investment Management and Subadvisory Agreements |
| | | | |
AMG GW&K Emerging Markets Equity Fund (formerly AMG GW&K Trilogy Emerging Markets Equity Fund), AMG GW&K Emerging Wealth Equity Fund (formerly AMG GW&K Trilogy Emerging Wealth Equity Fund), and AMG GW&K Core Bond ESG Fund: Approval of Investment Management and Subadvisory Agreements on June 25, 2020 At a meeting held via telephone and video conference on June 25, 2020,1 the Board of Trustees (the “Board” or the “Trustees”) of each of AMG Funds and AMG Funds I (each, a “Trust” and collectively, the “Trusts”), and separately a majority of the Trustees who are not “interested persons” of the Trusts (the “Independent Trustees”), approved (i) the Investment Management Agreement, as amended pursuant to letter agreements at any time prior to the date of the meeting, with AMG Funds LLC (the “Investment Manager”) and AMG Funds for each of AMG GW&K Emerging Markets Equity Fund (formerly AMG GW&K Trilogy Emerging Markets Equity Fund) and AMG GW&K Emerging Wealth Equity Fund (formerly AMG GW&K Trilogy Emerging Wealth Equity Fund), and separately each of Amendment No. 1 thereto dated July 1, 2015, and Amendment No. 2 thereto dated October 1, 2016; and the Investment Management Agreement, as amended pursuant to letter agreements at any time prior to the date of the meeting, with the Investment Manager and AMG Funds I for AMG GW&K Core Bond ESG Fund, and separately each of Amendment No. 1 thereto dated July 1, 2015, and Amendment No. 2 thereto dated October 1, 2016 (collectively, the “Investment Management Agreements”) and (ii) the Subadvisory Agreements, as amended at any time prior to the date of the meeting (collectively, the “Subadvisory Agreements”), with the Subadviser for AMG GW&K Emerging Markets Equity Fund, AMG GW&K Emerging Wealth Equity Fund, and AMG GW&K Core Bond ESG Fund (each, a “Fund,” and collectively, the “Funds”). The Independent Trustees were separately represented by independent legal counsel in connection with their consideration of the approval of these agreements. In considering the Investment Management Agreements and the Subadvisory Agreements, the Trustees reviewed a variety of materials | | them on a periodic basis throughout the year. Prior to voting, the Independent Trustees: (a) reviewed the foregoing information with their independent legal counsel; (b) received materials from their independent legal counsel discussing the legal standards applicable to their consideration of the Investment Management Agreement and the Subadvisory Agreements; and (c) met with their independent legal counsel in private sessions at which no representatives of management were present. NATURE, EXTENT AND QUALITY OF SERVICES In considering the nature, extent and quality of the services provided by the Investment Manager, the Trustees reviewed information relating to the Investment Manager’s operations and personnel. Among other things, the Investment Manager provided financial information, information about its supervisory and professional staff and descriptions of its organizational and management structure. The Trustees also took into account information provided periodically throughout the previous year by the Investment Manager in Board meetings relating to the performance of its duties with respect to the Funds and the Trustees’ knowledge of the Investment Manager’s management and the quality of the performance of the Investment Manager’s duties under the Investment Management Agreements and Administration Agreement. In the course of their deliberations regarding the Investment Manager, the Trustees evaluated, among other things: (a) the extent and quality of the Investment Manager’s oversight of the operation and management of the Funds; (b) the quality of the Investment Manager’s oversight of the performance by the Subadviser of its portfolio management duties; (c) the Investment Manager’s ability to supervise the Funds’ other service providers; and (d) the Investment Manager’s compliance program. The Trustees also took into account that, in performing its functions under the Investment Management Agreements and supervising the Subadviser, the Investment Manager: performs periodic detailed analyses and | | Subadviser responsible for performing the Subadviser’s obligations and makes appropriate reports to the Board; reviews and considers any changes in the ownership or senior management of the Subadviser and makes appropriate reports to the Board; performs periodic in-person or telephonic diligence meetings, including with respect to compliance matters, with representatives of the Subadviser; assists the Board and management of the Trust in developing and reviewing information with respect to the initial approval of each Subadvisory Agreement and annual consideration of each Subadvisory Agreement thereafter; prepares recommendations with respect to the continued retention of the Subadviser or the replacement of the Subadviser, including at the request of the Board; identifies potential successors to, or replacements of, the Subadviser or potential additional subadvisers, including performing appropriate due diligence, and developing and presenting to the Board a recommendation as to any such successor, replacement, or additional subadviser, including at the request of the Board; designates and compensates from its own resources such personnel as the Investment Manager may consider necessary or appropriate to the performance of its services; and performs such other review and reporting functions as the Board shall reasonably request consistent with the Investment Management Agreements and applicable law. The Trustees noted the affiliation of the Subadviser with the Investment Manager, noting any potential conflicts of interest. The Trustees also took into account the financial condition of the Investment Manager with respect to its ability to provide the services required under the Investment Management Agreements and the Investment Manager’s undertaking to maintain contractual expense limitations for the Funds. The Trustees also considered the Investment Manager’s risk management processes. The Trustees also reviewed information relating to the Subadviser’s operations and personnel and the investment philosophy, strategies and techniques (its “Investment Strategy”) used in managing |
| | | | |
| relating to each Fund, the Investment Manager and the Subadviser, including the nature, extent and quality of services, comparative performance, fee and expense information for an appropriate peer group of similar mutual funds for each Fund (each, a “Peer Group”), performance information for the relevant benchmark index for each Fund (each, a “Fund Benchmark”), other relevant matters, and other information provided to | | reviews of the performance by the Subadviser of its obligations to each Fund, including without limitation, analysis and review of portfolio and other compliance matters and review of the Subadviser’s investment performance with respect to each Fund; prepares and presents periodic reports to the Board regarding the investment performance of the Subadviser and other information regarding the Subadviser, at such times and in such forms as the Board may reasonably request; reviews and considers any changes in the personnel of the | | each Fund. Among other things, the Trustees reviewed information on portfolio management and other professional staff, information regarding the Subadviser’s organizational and management structure and the Subadviser’s brokerage policies and practices. The Trustees considered specific information provided regarding the experience of the individuals at the Subadviser with portfolio management responsibility for each Fund, including the information set forth in the Fund’s prospectus and statement of additional information. In the |
50
|
Annual Renewal of Investment Management and Subadvisory Agreements (continued) |
| | | | |
course of their deliberations, the Trustees evaluated, among other things: (a) the services rendered by the Subadviser in the past; (b) the qualifications and experience of the Subadviser’s personnel; and (c) the Subadviser’s compliance program. The Trustees also took into account the financial condition of the Subadviser with respect to its ability to provide the services required under each Subadvisory Agreement. The Trustees also considered the Subadviser’s risk management processes. PERFORMANCE The Board considered each Fund’s net performance during relevant time periods as compared to the Fund’s Peer Group and Fund Benchmark and considered the gross performance of the Fund as compared to the Subadviser’s relevant performance composite that utilizes the same investment strategy and approach and noted that the Board reviews on a quarterly basis detailed information about both the Fund’s performance results and portfolio composition, as well as the Subadviser’s Investment Strategy. The Board was mindful of the Investment Manager’s expertise, resources and attention to monitoring the Subadviser’s performance, investment style and risk-adjusted performance with respect to the Funds and its discussions with the Subadviser’s management regarding the factors that contributed to the performance of the Funds. With respect to AMG GW&K Emerging Markets Equity Fund, among other information relating to the Fund’s performance, the Trustees noted that the Fund’s performance for Class Z shares (which share class has one of the earliest inception dates and the largest amount of assets of all the share classes of the Fund) for the 1-year, 3-year and 5-year periods ended March 31, 2020 and for the period from the Class Z shares’ inception on March 1, 2011 through March 31, 2020 was below, above, above, and below, respectively, the median performance of the Peer Group and below, above, above, and below, respectively, the performance of the Fund Benchmark, the MSCI Emerging Markets Index. The Trustees took into account management’s discussion of the Fund’s performance, including the reasons for the Fund’s recent underperformance. The | | has the largest amount of assets of all the share classes of the Fund) for the 1-year, 3-year, and 5-year periods ended March 31, 2020 and for the period from the Fund’s inception on March 19, 2015 through March 31, 2020 was above the median performance of the Peer Group and above the performance of the Fund Benchmark, the MSCI Emerging Markets Index. The Trustees took into account management’s discussion of the Fund’s performance, noting that the Fund ranked in the top decile relative to its Peer Group for the 3-year and 5-year periods and the period from inception through March 31, 2020. The Trustees concluded that the Fund’s overall performance has been satisfactory. With respect to AMG GW&K Core Bond ESG Fund, among other information relating to the Fund’s performance, the Trustees noted that the Fund’s performance for Class I shares (which share class has the earliest inception date and the largest amount of assets of all the share classes of the Fund) for the 1-year, 3-year, 5-year and 10-year periods ended March 31, 2020 was below the median performance of the Peer Group and below the performance of the Fund Benchmark, the Bloomberg Barclays U.S. Aggregate Bond Index®. The Trustees took into account management’s discussion of the Fund’s performance, including the reasons for the Fund’s underperformance. The Trustees specifically noted the change in the Fund’s Subadviser in February 2015 and that the performance record prior to that time reflects that of the prior Subadviser. The Trustees also took into account the fact that the Fund transitioned to include an ESG strategy in 2019. The Trustees concluded that the Fund’s overall performance has been satisfactory in light of the Fund’s investment objective, strategies and policies. ADVISORY AND SUBADVISORY FEES; FUND EXPENSES ; PROFITABILITY; AND ECONOMIES OF SCALE In considering the reasonableness of the advisory fee payable to the Investment Manager, the Trustees reviewed information provided by the Investment | | Manager and its affiliates from these relationships. The Trustees also considered the change to the expense cap that was implemented during the past year for AMG GW&K Emerging Markets Equity Fund. The Trustees also considered the amount of the advisory fee retained by the Investment Manager after payment of the subadvisory fee with respect to each Fund. The Trustees also noted payments made or to be made from the Subadviser to the Investment Manager, and other payments made or to be made from the Investment Manager to the Subadviser. The Trustees also considered management’s discussion of the current asset levels of the Funds, and the impact on profitability of both the current asset levels and any future growth of assets of the Funds. In considering the cost of services to be provided by the Investment Manager under each Investment Management Agreement and the profitability to the Investment Manager of its relationship with each Fund, the Trustees noted the undertaking by the Investment Manager to maintain contractual expense limitations for the Funds. The Board also took into account management’s discussion of the advisory fee structure, and the services the Investment Manager provides in performing its functions under each Investment Management Agreement and supervising the Subadviser. Based on the foregoing, the Trustees concluded that the profitability to the Investment Manager is reasonable and that the Investment Manager is not realizing material benefits from economies of scale that would warrant adjustments to the advisory fee at this time. Also with respect to economies of scale, the Trustees noted that as each Fund’s assets increase over time, the Fund may realize other economies of scale to the extent the increase in assets is proportionally greater than the increase in certain other expenses. In considering the reasonableness of the subadvisory fees payable by the Investment Manager to the Subadviser, the Trustees reviewed information regarding the cost to the Subadviser of providing subadvisory services to each Fund and the resulting profitability from |
| | | | |
Trustees noted that the Fund ranked in the top third relative to its Peer Group for the 3-year and 5-year periods. The Trustees concluded that the Fund’s overall performance has been satisfactory in light of the Fund’s investment objective, strategies and policies. With respect to AMG GW&K Emerging Wealth Equity Fund, among other information relating to the Fund’s performance, the Trustees noted that the Fund’s performance for Class Z shares (which share class | | Manager setting forth all revenues and other benefits, both direct and indirect (including any so-called “fallout benefits” such as reputational value derived from the Investment Manager serving as Investment Manager to a Fund), received by the Investment Manager and its affiliates attributable to managing each Fund and all the mutual funds in the AMG Funds Family of Funds; the cost of providing such services; the significant risks undertaken as Investment Manager and sponsor of the Funds, including investment, operational, enterprise, entrepreneurial, litigation, regulatory and compliance risks; and the resulting profitability to the Investment | | the relationships. The Trustees noted that, because the Subadviser is an affiliate of the Investment Manager, a portion of the Subadviser’s revenues or profits might be shared directly or indirectly with the Investment Manager. The Trustees also noted that the subadvisory fees are paid by the Investment Manager out of its advisory fee. The Board also took into account management’s discussion of the subadvisory fee structure, and the services the Subadviser provides in performing its functions under each Subadvisory Agreement. Based on the foregoing, the Trustees concluded that the profitability to the Subadviser is reasonable and that |
51
|
Annual Renewal of Investment Management and Subadvisory Agreements (continued) |
| | | | |
the Subadviser is not realizing material benefits from economies of scale that would warrant adjustments to the subadvisory fees at this time. Also with respect to economies of scale, the Trustees noted that as a Fund’s assets increase over time, the Fund may realize other economies of scale to the extent the increase in assets is proportionally greater than the increase in certain other expenses. With respect to AMG GW&K Emerging Markets Equity Fund, the Trustees noted that the management fees (which include both the advisory and administration fees) and total expenses (net of applicable expense waivers/reimbursements) of Class I shares (the class of shares which is the primary focus of the Fund’s distribution) of the Fund as of March 31, 2020 were both lower than the average for the Fund’s Peer Group. The Trustees took into account the fact that, effective March 1, 2020, the Investment Manager has contractually agreed, through March 1, 2021, (a) to lower the Fund’s contractual expense limitation from 1.05% to 0.87% of the Fund’s net annual operating expenses (subject to certain excluded expenses), and (b) to waive management fees and/or pay or reimburse the Fund’s expenses in an amount equal to the fees and expenses incurred indirectly by the Fund as a result of investment in shares of one or more acquired funds. The Trustees concluded that, in light of the nature, extent and quality of the services provided by the Investment Manager and the Subadviser (which is an affiliate of the Investment Manager), the foregoing expense limitation and the considerations noted above with respect to the Investment Manager and the Subadviser, the Fund’s advisory and subadvisory fees are reasonable. With respect to AMG GW&K Emerging Wealth Equity Fund, the Trustees noted that the management fees (which include both the advisory and administration fees) and total expenses (net of applicable expense waivers/reimbursements) of Class I shares (the class of shares which is the primary focus of the Fund’s distribution) of the Fund as of March 31, 2020 were | | both lower than the average for the Fund’s Peer Group. The Trustees took into account the fact that the Investment Manager has contractually agreed, through March 1, 2021, to limit the Fund’s net annual operating expenses (subject to certain excluded expenses) to 1.05%. The Trustees concluded that, in light of the nature, extent and quality of the services provided by the Investment Manager and the Subadviser (which is an affiliate of the Investment Manager), the foregoing expense limitation and the considerations noted above with respect to the Investment Manager and the Subadviser, the Fund’s advisory and subadvisory fees are reasonable. With respect to AMG GW&K Core Bond ESG Fund, the Trustees noted that the management fees (which include both the advisory and administration fees) and total expenses (net of applicable expense waivers/reimbursements) of Class I shares of the Fund as of March 31, 2020 were both higher than the average for the Fund’s Peer Group. The Trustees took into account the fact that the Investment Manager has contractually agreed, through March 1, 2021, to limit the Fund’s net annual operating expenses (subject to certain excluded expenses) to 0.48%. The Trustees also took into account management’s discussion of the Fund’s expenses and competitiveness with comparably sized funds and select competitors. The Trustees concluded that, in light of the nature, extent and quality of the services provided by the Investment Manager and the Subadviser (which is an affiliate of the Investment Manager), the foregoing expense limitation and the considerations noted above with respect to the Investment Manager and the Subadviser, the Fund’s advisory and subadvisory fees are reasonable. * * * * After consideration of the foregoing, the Trustees also reached the following conclusions (in addition to the conclusions discussed above) regarding the Investment Management and Subadvisory Agreements: (a) the Investment Manager and the | | Subadviser have demonstrated that they possess the capability and resources to perform the duties required of them under each Investment Management Agreement and each Subadvisory Agreement and (b) the Investment Manager and Subadviser maintain appropriate compliance programs. Based on all of the above-mentioned factors and their related conclusions, with no single factor or conclusion being determinative and with each Trustee not necessarily attributing the same weight to each factor, the Trustees concluded that approval of each Investment Management Agreement and each Subadvisory Agreement would be in the best interests of the applicable Fund and its shareholders. Accordingly, on June 25, 2020, the Trustees, and separately a majority of the Independent Trustees, voted to approve the Investment Management and the Subadvisory Agreements for each Fund. 1 The Trustees determined that the conditions surrounding COVID-19 constituted unforeseen or emergency circumstances and that reliance on the Securities and Exchange Commission’s (“SEC”) exemptive order, which provides relief from the in-person voting requirements of the Investment Company Act of 1940, as amended (the “1940 Act”), in certain circumstances (the “In-Person Relief”), was necessary or appropriate due to the circumstances related to current or potential effects of COVID-19. The Trustees unanimously wished to rely on the In-Person Relief with respect to the approval of those matters on the agenda for the June 25, 2020 meeting that would otherwise require in-person votes under the 1940 Act. The Trustees, including a majority of the Trustees who are not “interested persons” of AMG Funds or AMG Funds I, undertook to ratify the actions taken pursuant to the In-Person Relief at the Board’s next in-person meeting, consistent with the requirements of the In-Person Relief. See Investment Company Release No. 33897 (June 19, 2020). This exemptive order supersedes, in part, a similar, earlier exemptive order issued by the SEC (Investment Company Release No. 33824 (March 25, 2020)). |
52
| | |
| | |
| | | | |
INVESTMENT MANAGER AND ADMINISTRATOR AMG Funds LLC 600 Steamboat Road, Suite 300 Greenwich, CT 06830 800.548.4539 DISTRIBUTOR AMG Distributors, Inc. 600 Steamboat Road, Suite 300 Greenwich, CT 06830 800.548.4539 SUBADVISER GW&K Investment Management, LLC 222 Berkeley St. Boston, MA 02116 | | CUSTODIAN The Bank of New York Mellon 111 Sanders Creek Parkway East Syracuse, NY 13057 LEGAL COUNSEL Ropes & Gray LLP Prudential Tower, 800 Boylston Street Boston, MA 02199-3600 TRANSFER AGENT BNY Mellon Investment Servicing (US) Inc. Attn: AMG Funds 4400 Computer Drive Westborough, MA 01581 800.548.4539 | | This report is prepared for the Funds’ shareholders. It is authorized for distribution to prospective investors only when preceded or accompanied by an effective prospectus. To receive a free copy of the prospectus or Statement of Additional Information, which includes additional information about Fund Trustees, please contact us by calling 800.548.4539. Distributed by AMG Distributors, Inc., member FINRA/SIPC. Current net asset values per share for each Fund are available on the Funds’ website at amgfunds.com. A description of the policies and procedures each Fund uses to vote its proxies is available: (i) without charge, upon request, by calling 800.548.4539, or (ii) on the Securities and Exchange Commission’s (SEC) website at sec.gov. For information regarding each Fund’s proxy voting record for the 12-month period ended June 30, call 800.548.4539 or visit the SEC website at sec.gov. The Funds file their complete schedule of portfolio holdings with the SEC for the first and third quarters of each fiscal year as an exhibit to their reports on Form N-PORT. The Funds’ portfolio holdings on Form N-PORT are available on the SEC’s website at sec.gov. To review a complete list of the Funds’ portfolio holdings, or to view the most recent semiannual report or annual report, please visit amgfunds.com. |
| | |
| | |
| | | | |
AFFILIATE SUBADVISED FUNDS BALANCED FUNDS AMG GW&K Global Allocation GW&K Investment Management, LLC AMG FQ Global Risk-Balanced First Quadrant, L.P. EQUITY FUNDS AMG FQ Tax-Managed U.S. Equity AMG FQ Long-Short Equity First Quadrant, L.P. AMG Frontier Small Cap Growth Frontier Capital Management Co., LLC AMG GW&K Small Cap Core AMG GW&K Small Cap Value AMG GW&K Small/Mid Cap AMG GW&K Mid Cap AMG GW&K Emerging Markets Equity AMG GW&K Emerging Wealth Equity AMG GW&K International Small Cap GW&K Investment Management, LLC AMG Renaissance Large Cap Growth The Renaissance Group LLC AMG River Road Dividend All Cap Value AMG River Road Focused Absolute Value AMG River Road Long-Short AMG River Road Small-Mid Cap Value AMG River Road Small Cap Value River Road Asset Management, LLC | | AMG TimesSquare Emerging Markets Small Cap AMG TimesSquare Global Small Cap AMG TimesSquare International Small Cap AMG TimesSquare Mid Cap Growth AMG TimesSquare Small Cap Growth TimesSquare Capital Management, LLC AMG Yacktman AMG Yacktman Focused AMG Yacktman Focused Fund - Security Selection Only AMG Yacktman Special Opportunities Yacktman Asset Management LP FIXED INCOME FUNDS AMG GW&K Core Bond ESG AMG GW&K Enhanced Core Bond ESG AMG GW&K High Income AMG GW&K Municipal Bond AMG GW&K Municipal Enhanced Yield GW&K Investment Management, LLC OPEN-ARCHITECTURE FUNDS EQUITY FUNDS AMG Managers Brandywine AMG Managers Brandywine Blue Friess Associates, LLC AMG Managers CenterSquare Real Estate CenterSquare Investment Management LLC | | AMG Managers Emerging Opportunities WEDGE Capital Management L.L.P. Next Century Growth Investors LLC RBC Global Asset Management (U.S.) Inc. AMG Managers Fairpointe Mid Cap Fairpointe Capital LLC AMG Managers LMCG Small Cap Growth LMCG Investments, LLC AMG Managers Montag & Caldwell Growth Montag & Caldwell, LLC AMG Managers Pictet International Pictet Asset Management Limited AMG Managers Silvercrest Small Cap Silvercrest Asset Management Group LLC AMG Managers Special Equity Ranger Investment Management, L.P. Lord, Abbett & Co. LLC Smith Asset Management Group, L.P. Federated MDTA LLC AMG SouthernSun Small Cap AMG SouthernSun U.S. Equity SouthernSun Asset Management, LLC FIXED INCOME FUNDS AMG Managers Doubleline Core Plus Bond DoubleLine Capital LP AMG Managers Loomis Sayles Bond Loomis, Sayles & Company, L.P. |
| | | | |
amgfunds.com | | 103120 | | AR069 |
| | |
| | | ANNUAL REPORT |
| | | | | | | | |
| | | | | AMG Funds October 31, 2020 
AMG FQ Tax-Managed U.S. Equity Fund |
| | | | | |
| | | | | Class N: MFQAX | | Class I: MFQTX | | |
| | | | | |
| | | |
| | | | | AMG FQ Long-Short Equity Fund |
| | | | | |
| | | | | Class N: FQUAX | | Class I: MEQFX | | |
| | | |
| | | | | AMG FQ Global Risk-Balanced Fund |
| | | | | |
| | | | | Class N: MMAVX | | Class I: MMASX | | Class Z: MMAFX |
| | | | | |
| | | | | | | | | |
Beginning on January 1, 2021, as permitted by regulations adopted by the Securities and Exchange Commission, paper copies of the Funds’ shareholder reports like this one will no longer be sent by mail, unless you specifically request paper copies of the reports from the Funds or from your financial intermediary, such as a broker-dealer or bank. Instead, the reports will be made available on the Funds’ website (https://www.amgfunds.com/resources/order_literature.html), and you will be notified by mail each time a report is posted and provided with a website link to access the report.
If you already elected to receive shareholder reports electronically, you will not be affected by this change and you need not take any action. You may elect to receive shareholder reports and other communications from the Funds electronically at any time by contacting your financial intermediary or, if you invest directly with the Funds, by logging into your account at www.amgfunds.com.
You may elect to receive all future reports in paper free of charge. If you invest through a financial intermediary, you can contact your financial intermediary to request that you continue to receive paper copies of your shareholder reports. If you invest directly with the Funds, you can call 1.800.548.4539 to inform the Funds that you wish to continue receiving paper copies of your shareholder reports. Your election to receive reports in paper will apply to all funds in the AMG Funds Family of Funds held in your account if you invest through your financial intermediary or all funds in the AMG Funds Family of Funds held with the fund complex if you invest directly with the Funds.
| | | | |
| amgfunds.com | | | | 103120 AR014 |
| | |
| | | AMG Funds Annual Report — October 31, 2020 |
| | | | | | |
| | | |
| | | | | | | |
| | | TABLE OF CONTENTS | | PAGE | |
| | | | |
| | | LETTER TO SHAREHOLDERS | | | 2 | |
| | | |
| | | ABOUT YOUR FUND’S EXPENSES | | | 3 | |
| | | |
| | | PORTFOLIO MANAGER’S COMMENTS, FUND SNAPSHOTS AND SCHEDULES OF PORTFOLIO
INVESTMENTS | | | | |
| | | |
| | | AMG FQ Tax-Managed U.S. Equity Fund | | | 4 | |
| | | |
| | | AMG FQ Long-Short Equity Fund | | | 12 | |
| | | |
| | | AMG FQ Global Risk-Balanced Fund | | | 34 | |
| | | |
| | | FINANCIAL STATEMENTS | | | | |
| | | |
| | | Statement of Assets and Liabilities | | | 42 | |
| | | |
| | | Balance sheets, net asset value (NAV) per share computations
and cumulative distributable earnings (loss) | | | | |
| | | |
| | | Statement of Operations | | | 44 | |
| | | |
| | | Detail of sources of income, expenses, and realized and
unrealized gains (losses) during the fiscal year | | | | |
| | | |
| | | Statements of Changes in Net Assets | | | 45 | |
| | | |
| | | Detail of changes in assets for the past two fiscal years | | | | |
| | | |
| | | Financial Highlights | | | 46 | |
| | | |
| | | Historical net asset values per share, distributions, total returns, income
and expense ratios, turnover ratios and net assets | | | | |
| | | |
| | | Notes to Financial Statements | | | 53 | |
| | | |
| | | Accounting and distribution policies, details of agreements and
transactions with Fund management and affiliates, and descriptions
of certain investment risks | | | | |
| | | |
| | | REPORT OF INDEPENDENT REGISTERED PUBLIC ACCOUNTING FIRM | | | 62 | |
| | | |
| | | OTHER INFORMATION | | | 63 | |
| | | |
| | | TRUSTEES AND OFFICERS | | | 64 | |
| | | |
| | | ANNUAL RENEWAL OF INVESTMENT MANAGEMENT AND SUBADVISORY AGREEMENTS | | | 66 | |
| | | | | | | |
|
| Nothing contained herein is to be considered an offer, sale or solicitation of an offer to buy shares of any series of the AMG Funds Family of Funds. Such offering is made only by prospectus, which includes details as to offering price and other material information. | |
| | |
| | Letter to Shareholders |
Dear Shareholder:
The fiscal year ending October 31, 2020, was a volatile period for financial markets marked by a dramatic selloff and extraordinary rebound amid the unprecedented global effort to stop the COVID-19 pandemic. During the first half of the fiscal year, equities achieved new record highs against the backdrop of a healthy economy and strong investor sentiment. However, a broad-based selloff occurred amid a global flight to quality as investors assessed the scope of the unfolding COVID-19 health care crisis, a deteriorating economy, and skyrocketing unemployment. An oil price war initiated between Saudi Arabia and Russia only made matters worse. From its peak in mid-February 2020, the S&P 500® Index declined (33.79)% over the span of a few weeks, bringing the eleven-year bull market to an abrupt end. In response to the crisis, global central banks and governments were quick to flood the market with massive fiscal and monetary stimulus which helped to stabilize the market and led to an impressive recovery in risk assets, albeit a very uneven one. So despite the volatility, the S&P 500® Index still achieved a 9.71% return for the fiscal year.
During the year there was very wide dispersion in performance across sectors, with information technology and consumer discretionary sectors leading the market with returns of 34.47% and 24.69%, respectively. On the other hand, companies in the energy sector fell (45.24)%, and financials, real estate, and industrials also produced negative returns. Growth stocks significantly outperformed value stocks for the period with returns of 29.22% and (7.57)% for the Russell 1000® Growth and Russell 1000® Value Indexes, respectively. Large caps also outperformed small caps as measured by the 9.71% return for the S&P 500® Index compared to (0.14)% for the Russell 2000® Index. Outside the U.S., emerging markets outperformed developed markets with the 8.25% return for the MSCI Emerging Markets Index compared to the (6.86)% return for the MSCI EAFE Index.
Interest rates fell dramatically and led to strong returns for bond investors as the U.S. Federal Reserve slashed short-term rates in response to the slowing economy. The 10-year Treasury yield ended the year near a historic low yield of 0.88%. The Bloomberg Barclays U.S. Aggregate Bond Index®, a broad measure of U.S. bond market performance, returned 6.19% over the period. Riskier high yield bonds lagged the broader bond market with a 3.49% return as measured by the return of the Bloomberg Barclays U.S. Corporate High Yield Bond Index®.
AMG Funds appreciates the privilege of providing investment tools to you and your clients. Our foremost goal is to provide investment solutions that help our shareholders successfully reach their long-term investment goals. AMG Funds
provides access to a distinctive array of actively managed return-oriented investment strategies. We thank you for your continued confidence and investment in AMG Funds. You can rest assured that under all market conditions our team is focused on delivering excellent investment management services for your benefit.
Respectfully,
Keitha Kinne
President
AMG Funds
| | | | | | | | | | | | | | |
| Average Annual Total Returns | | Periods ended
October 31, 2020* | |
| | | | |
| Stocks: | | | | 1 Year | | | 3 Years | | | 5 Years | |
| | | | |
Large Cap | | (S&P 500® Index) | | | 9.71 | % | | | 10.42% | | | | 11.71% | |
| | | | |
Small Cap | | (Russell 2000® Index) | | | (0.14 | )% | | | 2.19% | | | | 7.27% | |
| | | | |
International | | (MSCI All Country World Index ex USA) | | | (2.61 | )% | | | (0.19)% | | | | 4.26% | |
| Bonds: | | | | | | | | | | | |
| | | | |
Investment Grade | | (Bloomberg Barclays U.S. Aggregate Bond Index) | | | 6.19 | % | | | 5.06% | | | | 4.08% | |
| | | | |
High Yield | | (Bloomberg Barclays U.S. Corporate High Yield Bond Index) | | | 3.49 | % | | | 4.24% | | | | 6.32% | |
| | | | |
Tax-exempt | | (Bloomberg Barclays Municipal Bond Index) | | | 3.59 | % | | | 4.09% | | | | 3.70% | |
| | | | |
Treasury Bills | | (ICE BofAML U.S. 6-Month Treasury Bill Index) | | | 1.30 | % | | | 1.89% | | | | 1.43% | |
*Source: FactSet. Past performance is no guarantee of future results.
2
|
About Your Fund’s Expenses |
| | | | | | | | |
As a shareholder of a Fund, you may incur two types of costs: (1) transaction costs, which may include sales charges (loads) on purchase payments; redemption fees; and exchange fees; and (2) ongoing costs, including management fees; distribution (12b-1) fees; and other Fund expenses. This example is intended to help you understand your ongoing costs (in dollars) of investing in the Fund and to compare these costs with the ongoing costs of investing in other mutual funds. The example is based on $1,000 invested at the beginning of the period and held for the entire period as indicated below. ACTUAL EXPENSES The first line of the following table provides information about the actual account values and | | | | actual expenses. You may use the information in this line, together with the amount you invested, to estimate the expenses that you paid over the period. Simply divide your account value by $1,000 (for example, an $8,600 account value divided by $1,000 = 8.6), then multiply the result by the number in the first line under the heading entitled “Expenses Paid During Period” to estimate the expenses you paid on your account during this period. HYPOTHETICAL EXAMPLE FOR COMPARISON PURPOSES The second line of the following table provides information about hypothetical account values and hypothetical expenses based on the Fund’s actual expense ratio and an assumed annual rate of return of 5% before expenses, which is not the Fund’s | | | | actual return. The hypothetical account values and expenses may not be used to estimate the actual ending account balance or expenses you paid for the period. You may use this information to compare the ongoing costs of investing in the Fund and other funds by comparing this 5% hypothetical example with the 5% hypothetical examples that appear in the shareholder reports of other funds. Please note that the expenses shown in the table are meant to highlight your ongoing costs only and do not reflect any transactional costs, such as sales charges (loads), redemption fees, or exchange fees. Therefore, the second line of the table is useful in comparing ongoing costs only, and will not help you determine the relative total costs of owning different funds. |
| |
| | | | | | | | |
| | | | |
Six Months Ended
October 31, 2020 | | Expense
Ratio for
the Period | | Beginning
Account
Value
05/01/20 | | Ending
Account
Value
10/31/20 | | Expenses Paid During
the Period* |
AMG FQ Tax-Managed U.S. Equity Fund |
|
Based on Actual Fund Return |
| | | | |
Class N | | 1.14% | | $1,000 | | $1,112 | | $6.05 |
| | | | |
Class I | | 0.89% | | $1,000 | | $1,114 | | $4.73 |
|
Based on Hypothetical 5% Annual Return |
| | | | |
Class N | | 1.14% | | $1,000 | | $1,019 | | $5.79 |
| | | | |
Class I | | 0.89% | | $1,000 | | $1,021 | | $4.52 |
AMG FQ Long-Short Equity Fund |
|
Based on Actual Fund Return |
| | | | |
Class N | | 1.04% | | $1,000 | | $969 | | $5.15 |
| | | | |
Class I | | 0.76% | | $1,000 | | $971 | | $3.76 |
|
Based on Hypothetical 5% Annual Return |
| | | | |
Class N | | 1.04% | | $1,000 | | $1,020 | | $5.28 |
| | | | |
Class I | | 0.76% | | $1,000 | | $1,021 | | $3.86 |
| | | | | | | | |
| | | | |
Six Months Ended
October 31, 2020 | | Expense
Ratio for
the Period | | Beginning
Account
Value
05/01/20 | | Ending
Account
Value
10/31/20 | | Expenses
Paid
During
the Period* |
AMG FQ Global Risk-Balanced Fund |
|
Based on Actual Fund Return |
| | | | |
Class N | | 1.29% | | $1,000 | | $1,020 | | $6.55 |
| | | | |
Class I | | 1.04% | | $1,000 | | $1,021 | | $5.28 |
| | | | |
Class Z | | 0.89% | | $1,000 | | $1,022 | | $4.52 |
| |
Based on Hypothetical 5% Annual Return |
| | | | |
Class N | | 1.29% | | $1,000 | | $1,019 | | $6.55 |
| | | | |
Class I | | 1.04% | | $1,000 | | $1,020 | | $5.28 |
| | | | |
Class Z | | 0.89% | | $1,000 | | $1,021 | | $4.52 |
* Expenses are equal to the Fund’s annualized expense ratio multiplied by the average account value over the period, multiplied by the number of days in the most recent fiscal half-year (184), then divided by 366. |
3
|
AMG FQ Tax-Managed U.S. Equity Fund Portfolio Manager’s Comments (unaudited) |
| | | | | | | | |
For the fiscal year ended October 31, 2020, AMG FQ Tax-Managed U.S. Equity Fund’s (“the Fund”) Class N shares returned (0.54)%, compared to 10.15% for its benchmark, the Russell 3000® Index. MARKET OVERVIEW This fiscal year featured both an unprecedented equity advance and a historic market crash. After a roaring 2019, the bull market collapsed in stunning fashion in early 2020 as the market priced in the COVID-19 pandemic and accompanying lockdowns. The bear market was ultimately brief, with equities recovering from mid-April through October. The subsequent recovery was also anomalous, with the rebound highly concentrated in mega-cap growth companies, instead of small cap value. PERFORMANCE REVIEW Given the weakness in economic fundamentals, the Fund was positioned for significant market fragility, with overweight positioning in profitability and certain forms of value, such as earnings-based value. It also had overweight positioning in small cap, which tends to outperform during market recoveries. | | | | However, style preferences this year deviated from historical behavior. Typically, market recoveries create opportunities for small, high quality companies that are underpriced, with investors buying the dip as risk appetite increases and fundamentals stabilize. Fiscal and monetary stimulus may further buoy small companies, which tend to have increased sensitivity to solvency and the borrowing environment. This time, when markets started to recover from their unprecedented crash in Q1, investors instead poured into large-cap tech stocks and markets became even more concentrated. Ongoing restrictions on business and social activity shifted consumption from services to manufactured goods, and bankruptcies mounted as small companies struggled to claim fiscal stimulus relief. Diversifying exposure to certain forms of growth provided partially offsetting gains. In addition, while the Fund’s tilt toward quality had an overall neutral | | | | impact on performance over the full period, it helped buttress results during the Q1 crash, when equity beta was failing. For most of the period, the Fund held overweight positioning in financials, consumer discretionary, and health care. Both of the latter detracted, while our exposure to financial companies provided partially offsetting gains. OUTLOOK Most of our current exposures are persisting into the next fiscal year. Although economic fundamentals have improved since the broad lockdowns, the Fund continues to see significant opportunity in quality, particularly profitability. This commentary reflects the viewpoints of the portfolio manager, First Quadrant, L.P., as of October 31, 2020 and is not intended as a forecast or guarantee of future results, and is subject to change without notice. |
4
|
AMG FQ Tax-Managed U.S. Equity Fund Portfolio Manager’s Comments (continued) |
|
CUMULATIVE TOTAL RETURN PERFORMANCE AMG FQ Tax-Managed U.S. Equity Fund’s cumulative total return is based on the daily change in net asset value (NAV), and assumes that all dividends and distributions were reinvested. This graph compares a hypothetical $10,000 investment made in the AMG FQ Tax-Managed U.S. Equity Fund’s Class N shares on October 31, 2010, to a $10,000 investment made in the Russell 3000® Index for the same time period. The graph and table do not reflect the deduction of taxes that a shareholder would pay on a Fund distribution or redemption of shares. The listed returns for the Fund are net of expenses and the returns for the index exclude expenses. Total returns would have been lower had certain expenses not been reduced. 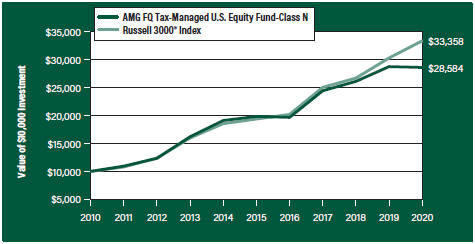
The table below shows the average annual total returns for the AMG FQ Tax-Managed U.S. Equity Fund and the Russell 3000® Index for the same time periods ended October 31, 2020. |
| | | | | | | | | | | | |
| Average Annual Total Returns1 | | One Year | | | Five
Years | | | Ten Years | |
|
AMG FQ Tax-Managed U.S. Equity Fund2, 3, 4, 5, 6, 7 | |
| | | |
Class N | | | (0.54%) | | | | 7.59% | | | | 11.07% | |
| | | |
Class I | | | (0.27%) | | | | 7.87% | | | | 11.35% | |
| | | | |
Russell 3000® Index8 | | | 10.15% | | | | 11.48% | | | | 12.80% | |
| | | |
Return After Taxes on Distributions9 | | | | | | | | | | | | |
| | | |
Class N | | | (0.63%) | | | | 7.42% | | | | 10.96% | |
| | | |
Class I | | | (0.41%) | | | | 7.63% | | | | 11.18% | |
|
Returns After Taxes on Distributions & Sale of Fund Shares9 | |
| | | |
Class N | | | (0.25%) | | | | 5.95% | | | | 9.20% | |
| | | |
Class I | | | (0.05%) | | | | 6.16% | | | | 9.44% | |
The performance data shown represents past performance. Past performance is not a guarantee of future results. Current performance may be lower or higher than the performance data quoted. The investment return and principal value of an investment will fluctuate so that an investor’s shares, when redeemed, may be worth more or less than their original cost.
Investors should carefully consider the Fund’s investment objectives, risks, charges and expenses before investing. For performance information through the most recent month end, current net asset values per share for the Fund and other information, please call 800.548.4539 or visit our website at amgfunds.com for a free prospectus. Read it carefully before investing or sending money.
|
Distributed by AMG Distributors, Inc., member FINRA/SIPC. 1 Total return equals income yield plus share price change and assumes reinvestment of all dividends and capital gain distributions. Returns are net of fees and may reflect offsets of Fund expenses as described in the prospectus. No adjustment has been made for taxes payable by shareholders on their reinvested dividends and capital gain distributions. Returns for periods greater than one year are annualized. The listed returns on the Fund are net of expenses and based on the published NAV as of October 31, 2020. All returns are in U.S. dollars ($). 2 From time to time, the Fund’s advisor has waived its fees and/or absorbed Fund expenses, which has resulted in higher returns. 3 The Fund may invest in derivatives such as options and futures; the complexity and rapidly changing structure of derivatives markets may increase the possibility of market losses. 4 The Fund invests in large-capitalization companies that may underperform other stock funds (such as funds that focus on small- and medium-capitalization companies) when stocks of large-capitalization companies are out of favor. 5 Although the Fund is managed to minimize taxable distributions, it may not be able to avoid taxable distributions. 6 Market prices of investments held by the Fund may fall rapidly or unpredictably due to a variety of economic or political factors, market conditions, disasters or public health issues, or in response to events that affect particular industries or companies. |
7 In managing the Fund, the Fund’s Subadviser may rely heavily on one or more quantitative models (“Model”) and information and data supplied by third parties (“Data”). When a Model or Data used in managing the Fund contains an error, or is incorrect or incomplete, any investment decision made in reliance on the Model or Data may not produce the desired results and the Fund may realize losses. In addition, any hedging based on a faulty Model or Data may prove to be unsuccessful. 8 The Russell 3000® Index is composed of the 3,000 largest U.S. companies as measured by market capitalization, and represents about 98% of the U.S. stock market. Unlike the Fund, the Russell 3000® Index is unmanaged, is not available for investment and does not incur expenses. 9 After-tax returns are calculated using the historical highest individual federal marginal income tax rates and do not reflect the impact of state and local taxes. Actual after-tax returns depend on an investor’s tax situation and may differ from those |
| |
5
|
AMG FQ Tax-Managed U.S. Equity Fund Portfolio Manager’s Comments (continued) |
| | | | | | | | |
| shown, and after-tax returns are not relevant to investors who hold their Fund shares through tax-deferred arrangements, such as 401(k) plans or individual retirement accounts. | | | | The Russell 3000® Index is a trademark of the London Stock Exchange Group companies. Not FDIC insured, nor bank guaranteed. May lose value. | | | | |
6
|
AMG FQ Tax-Managed U.S. Equity Fund Fund Snapshots (unaudited) October 31, 2020 |
| | |
PORTFOLIO BREAKDOWN |
| Sector | | % of
Net Assets |
| | |
Information Technology | | 27.1 |
| | |
Health Care | | 14.5 |
| | |
Consumer Discretionary | | 12.6 |
| | |
Financials | | 11.1 |
| | |
Communication Services | | 10.1 |
| | |
Industrials | | 9.1 |
| | |
Consumer Staples | | 5.9 |
| | |
Real Estate | | 2.7 |
| | |
Utilities | | 2.4 |
| | |
Materials | | 1.8 |
| | |
Energy | | 1.4 |
| | |
Short-Term Investments | | 0.5 |
| | |
Other Assets Less Liabilities | | 0.8 |
| | |
TOP TEN HOLDINGS |
| Security Name | | % of
Net Assets |
| | |
Apple, Inc. | | 5.1 |
| | |
Microsoft Corp. | | 4.6 |
| | |
Visa, Inc., Class A | | 4.2 |
| | |
Mastercard, Inc., Class A | | 4.2 |
| | |
Amazon.com, Inc. | | 4.0 |
| | |
UnitedHealth Group, Inc. | | 4.0 |
| | |
Berkshire Hathaway, Inc., Class B | | 3.3 |
| | |
Brown & Brown, Inc. | | 2.9 |
| | |
Facebook, Inc., Class A | | 2.4 |
| | |
Amgen, Inc. | | 2.2 |
| | |
| | |
Top Ten as a Group | | 36.9 |
| | |
Because a fund’s strategy may result in multiple investments in particular sectors of the economy, its performance may depend on the performance of those sectors and may fluctuate more widely than investments diversified across more sectors. For additional information on these and other risk considerations, please see the Fund’s prospectus.
Any sectors, industries, or securities discussed should not be perceived as investment recommendations. Mention of a specific security should not be considered a recommendation to buy or solicitation to sell that security. Specific securities mentioned in this report may have been sold from the Fund’s portfolio of investments by the time you receive this report.
7
|
AMG FQ Tax-Managed U.S. Equity Fund Schedule of Portfolio Investments October 31, 2020 |
| | | | | | | | |
| | | Shares | | | Value | |
| |
Common Stocks - 98.7% | | | | | |
| | |
Communication Services - 10.1% | | | | | | | | |
| | |
Activision Blizzard, Inc. | | | 1,347 | | | | $102,008 | |
| | |
Alphabet, Inc., Class A* | | | 706 | | | | 1,140,974 | |
| | |
Alphabet, Inc., Class C* | | | 715 | | | | 1,159,022 | |
| | |
Altice USA, Inc., Class A* | | | 696 | | | | 18,757 | |
| | |
AT&T, Inc. | | | 10,870 | | | | 293,707 | |
| | |
Charter Communications, Inc., Class A*,1 | | | 571 | | | | 344,781 | |
| | |
Comcast Corp., Class A | | | 3,542 | | | | 149,614 | |
| | |
Electronic Arts, Inc.* | | | 3,363 | | | | 402,988 | |
| | |
Facebook, Inc., Class A* | | | 5,716 | | | | 1,503,937 | |
| | |
Fox Corp., Class B | | | 1,036 | | | | 27,081 | |
| | |
Glu Mobile, Inc.* | | | 3,034 | | | | 21,724 | |
| | |
Netflix, Inc.* | | | 934 | | | | 444,341 | |
| | |
News Corp., Class B | | | 1,963 | | | | 25,558 | |
| | |
Spotify Technology S.A. (Sweden)* | | | 400 | | | | 95,956 | |
| | |
Take-Two Interactive Software, Inc.* | | | 332 | | | | 51,434 | |
| | |
TechTarget, Inc.* | | | 4,156 | | | | 182,033 | |
| | |
Verizon Communications, Inc. | | | 2,872 | | | | 163,675 | |
| | |
The Walt Disney Co. | | | 869 | | | | 105,366 | |
| | |
Zynga, Inc., Class A* | | | 8,227 | | | | 73,961 | |
| | |
Total Communication Services | | | | | | | 6,306,917 | |
| | |
Consumer Discretionary - 12.6% | | | | | | | | |
| | |
Amazon.com, Inc.* | | | 827 | | | | 2,510,896 | |
| | |
Best Buy Co., Inc. | | | 2,515 | | | | 280,548 | |
| | |
Booking Holdings, Inc.* | | | 108 | | | | 175,230 | |
| | |
Bright Horizons Family Solutions, Inc.* | | | 1,676 | | | | 264,892 | |
| | |
Crocs, Inc.* | | | 1,408 | | | | 73,681 | |
| | |
Deckers Outdoor Corp.* | | | 173 | | | | 43,833 | |
| | |
eBay, Inc. | | | 2,099 | | | | 99,975 | |
| | |
Gentex Corp. | | | 31,224 | | | | 863,968 | |
| | |
Groupon, Inc.*,1 | | | 4,440 | | | | 86,092 | |
| | |
The Home Depot, Inc. | | | 1,153 | | | | 307,517 | |
| | |
La-Z-Boy, Inc. | | | 1,279 | | | | 43,780 | |
| | |
LKQ Corp.* | | | 926 | | | | 29,623 | |
| | |
Lowe’s Cos., Inc. | | | 6,998 | | | | 1,106,384 | |
| | |
Malibu Boats, Inc., Class A* | | | 545 | | | | 27,702 | |
| | |
NIKE, Inc., Class B | | | 3,048 | | | | 366,004 | |
| | |
Tesla, Inc.* | | | 1,269 | | | | 492,423 | |
| | |
Texas Roadhouse, Inc. | | | 866 | | | | 60,646 | |
| | |
The Gap, Inc. | | | 2,707 | | | | 52,651 | |
| | |
The TJX Cos., Inc. | | | 5,235 | | | | 265,938 | |
| | |
Tractor Supply Co. | | | 2,107 | | | | 280,673 | |
| | | | | | | | |
| | | | | | | | |
| | | Shares | | | Value | |
| | |
Ulta Beauty, Inc.* | | | 154 | | | | $31,843 | |
| | |
The Wendy’s Co. | | | 17,503 | | | | 382,440 | |
| | |
Yum! Brands, Inc. | | | 488 | | | | 45,545 | |
| | |
Total Consumer Discretionary | | | | | | | 7,892,284 | |
| | |
Consumer Staples - 5.9% | | | | | | | | |
| | |
Brown-Forman Corp., Class A | | | 352 | | | | 22,088 | |
| | |
Central Garden & Pet Co., Class A* | | | 11,889 | | | | 420,752 | |
| | |
Church & Dwight Co., Inc. | | | 1,119 | | | | 98,908 | |
| | |
The Coca-Cola Co. | | | 1,229 | | | | 59,066 | |
| | |
The Hershey Co. | | | 1,939 | | | | 266,535 | |
| | |
Lamb Weston Holdings, Inc. | | | 1,609 | | | | 102,091 | |
| | |
Medifast, Inc. | | | 2,117 | | | | 297,417 | |
| | |
National Beverage Corp.*,1 | | | 2,990 | | | | 234,087 | |
| | |
PepsiCo, Inc. | | | 313 | | | | 41,720 | |
| | |
The Procter & Gamble Co. | | | 2,511 | | | | 344,258 | |
| | |
Spectrum Brands Holdings, Inc. | | | 15,454 | | | | 878,869 | |
| | |
Sysco Corp. | | | 1,059 | | | | 58,573 | |
| | |
Tyson Foods, Inc., Class A | | | 10,099 | | | | 577,966 | |
| | |
USANA Health Sciences, Inc.* | | | 2,250 | | | | 170,213 | |
| | |
Walmart, Inc. | | | 952 | | | | 132,090 | |
| | |
Total Consumer Staples | | | | | | | 3,704,633 | |
| | |
Energy - 1.4% | | | | | | | | |
| | |
Apache Corp. | | | 11,674 | | | | 96,894 | |
| | |
Baker Hughes Co. | | | 5,700 | | | | 84,189 | |
| | |
ConocoPhillips | | | 7,302 | | | | 208,983 | |
| | |
EOG Resources, Inc. | | | 2,410 | | | | 82,518 | |
| | |
Phillips 66 | | | 4,600 | | | | 214,636 | |
| | |
ProPetro Holding Corp.* | | | 31,491 | | | | 124,390 | |
| | |
Renewable Energy Group, Inc.* | | | 1,254 | | | | 70,726 | |
| | |
Total Energy | | | | | | | 882,336 | |
| | |
Financials - 11.1% | | | | | | | | |
| | |
Arch Capital Group, Ltd. (Bermuda)* | | | 34,786 | | | | 1,050,885 | |
| | |
Bank of America Corp. | | | 7,256 | | | | 171,967 | |
| | |
Berkshire Hathaway, Inc., Class B* | | | 10,154 | | | | 2,050,093 | |
| | |
Brown & Brown, Inc. | | | 41,475 | | | | 1,804,577 | |
| | |
Canadian Imperial Bank of Commerce (Canada)1 | | | 1,790 | | | | 133,570 | |
| | |
Citigroup, Inc. | | | 3,599 | | | | 149,071 | |
| | |
First American Financial Corp. | | | 10,182 | | | | 454,015 | |
| | |
Intercontinental Exchange, Inc. | | | 1,127 | | | | 106,389 | |
| | |
JPMorgan Chase & Co. | | | 4,600 | | | | 450,984 | |
| | |
S&P Global, Inc. | | | 1,043 | | | | 336,607 | |
| | |
StoneX Group, Inc.* | | | 1,014 | | | | 53,722 | |
| | |
| | | | | | | | |
The accompanying notes are an integral part of these financial statements.
8
|
AMG FQ TX-Managed U.S Equity Fund Schedule of Portfolio Investments (continued) |
| | | | | | | | |
| | | Shares | | | Value | |
| | |
Financials - 11.1% (continued) | | | | | | | | |
| | |
Truist Financial Corp. | | | 4,140 | | | | $174,377 | |
| | |
Total Financials | | | | | | | 6,936,257 | |
| | |
Health Care - 14.5% | | | | | | | | |
| | |
AbbVie, Inc. | | | 1,657 | | | | 141,011 | |
| | |
Agilent Technologies, Inc. | | | 1,239 | | | | 126,490 | |
| | |
Amgen, Inc. | | | 6,211 | | | | 1,347,414 | |
| | |
Anika Therapeutics, Inc.* | | | 3,739 | | | | 121,966 | |
| | |
Atrion Corp. | | | 251 | | | | 150,889 | |
| | |
Biogen, Inc.* | | | 1,735 | | | | 437,341 | |
| | |
Cardiovascular Systems, Inc.* | | | 2,036 | | | | 72,583 | |
| | |
Centene Corp.* | | | 5,321 | | | | 314,471 | |
| | |
Charles River Laboratories International, Inc.* | | | 4,884 | | | | 1,112,087 | |
| | |
DexCom, Inc.* | | | 83 | | | | 26,525 | |
| | |
Edwards Lifesciences Corp.* | | | 1,914 | | | | 137,215 | |
| | |
Eli Lilly & Co. | | | 1,970 | | | | 257,006 | |
| | |
Haemonetics Corp.* | | | 570 | | | | 57,621 | |
| | |
Hologic, Inc.* | | | 3,446 | | | | 237,154 | |
| | |
Humana, Inc. | | | 357 | | | | 142,543 | |
| | |
IDEXX Laboratories, Inc.* | | | 560 | | | | 237,899 | |
| | |
Illumina, Inc.* | | | 160 | | | | 46,832 | |
| | |
Johnson & Johnson | | | 3,524 | | | | 483,176 | |
| | |
McKesson Corp. | | | 1,199 | | | | 176,840 | |
| | |
Merck & Co., Inc. | | | 1,326 | | | | 99,728 | |
| | |
NuVasive, Inc.* | | | 376 | | | | 16,706 | |
| | |
Pfizer, Inc. | | | 5,199 | | | | 184,461 | |
| | |
The Providence Service Corp.* | | | 1,986 | | | | 233,454 | |
| | |
Puma Biotechnology, Inc.* | | | 4,217 | | | | 35,296 | |
| | |
Select Medical Holdings Corp.* | | | 3,715 | | | | 77,941 | |
| | |
Simulations Plus, Inc.1 | | | 1,181 | | | | 76,552 | |
| | |
UnitedHealth Group, Inc. | | | 8,147 | | | | 2,485,976 | |
| | |
West Pharmaceutical Services, Inc. | | | 86 | | | | 23,398 | |
| | |
Zoetis, Inc. | | | 1,287 | | | | 204,054 | |
| | |
Total Health Care | | | | | | | 9,064,629 | |
| | |
Industrials - 9.1% | | | | | | | | |
| | |
AeroVironment, Inc.* | | | 358 | | | | 27,337 | |
| | |
Alaska Air Group, Inc. | | | 17,345 | | | | 657,202 | |
| | |
AMETEK, Inc. | | | 944 | | | | 92,701 | |
| | |
BWX Technologies, Inc. | | | 9,602 | | | | 528,206 | |
| | |
CBIZ, Inc.* | | | 898 | | | | 20,358 | |
| | |
Copa Holdings, S.A., Class A
(Panama)1 | | | 1,480 | | | | 72,934 | |
| | |
CSX Corp. | | | 1,366 | | | | 107,832 | |
| | |
Delta Air Lines, Inc. | | | 2,728 | | | | 83,586 | |
| | | | | | | | |
| | | Shares | | | Value | |
| | |
Emerson Electric Co. | | | 1,211 | | | | $78,461 | |
| | |
HEICO Corp., Class A | | | 1,155 | | | | 107,992 | |
| | |
Herman Miller, Inc. | | | 4,029 | | | | 122,764 | |
| | |
Hubbell, Inc. | | | 1,129 | | | | 164,281 | |
| | |
Huntington Ingalls Industries, Inc. | | | 2,831 | | | | 417,516 | |
| | |
ICF International, Inc. | | | 1,569 | | | | 102,597 | |
| | |
IDEX Corp. | | | 1,933 | | | | 329,364 | |
| | |
ITT, Inc. | | | 322 | | | | 19,484 | |
| | |
Landstar System, Inc. | | | 3,371 | | | | 420,364 | |
| | |
Lincoln Electric Holdings, Inc. | | | 256 | | | | 26,066 | |
| | |
Mueller Industries, Inc. | | | 1,157 | | | | 33,472 | |
| | |
Primoris Services Corp. | | | 30,894 | | | | 582,970 | |
| | |
Robert Half International, Inc. | | | 5,769 | | | | 292,430 | |
| | |
Rollins, Inc. | | | 9,663 | | | | 559,004 | |
| | |
Schneider National, Inc., Class B | | | 5,730 | | | | 126,404 | |
| | |
TransUnion | | | 1,098 | | | | 87,467 | |
| | |
TriNet Group, Inc.* | | | 863 | | | | 59,478 | |
| | |
UFP Industries, Inc. | | | 2,430 | | | | 121,281 | |
| | |
UniFirst Corp. | | | 3,000 | | | | 491,430 | |
| | |
Total Industrials | | | | | | | 5,732,981 | |
| | |
Information Technology - 27.1% | | | | | | | | |
| | |
Adobe, Inc.* | | | 1,212 | | | | 541,885 | |
| | |
Amkor Technology, Inc.* | | | 2,139 | | | | 25,347 | |
| | |
Appfolio, Inc., Class A* | | | 2,427 | | | | 346,745 | |
| | |
Apple, Inc. | | | 29,502 | | | | 3,211,588 | |
| | |
Broadcom, Inc. | | | 45 | | | | 15,733 | |
| | |
CACI International, Inc., Class A* | | | 476 | | | | 99,260 | |
| | |
Cadence Design Systems, Inc.* | | | 2,192 | | | | 239,739 | |
| | |
CDW Corp. | | | 7,497 | | | | 919,132 | |
| | |
Ciena Corp.* | | | 4,571 | | | | 180,052 | |
| | |
Cisco Systems, Inc. | | | 2,711 | | | | 97,325 | |
| | |
ExlService Holdings, Inc.* | | | 592 | | | | 44,838 | |
| | |
FormFactor, Inc.* | | | 6,751 | | | | 191,391 | |
| | |
GoDaddy, Inc., Class A* | | | 455 | | | | 32,187 | |
| | |
Intel Corp. | | | 2,556 | | | | 113,180 | |
| | |
Intuit, Inc. | | | 1,001 | | | | 314,995 | |
| | |
Lumentum Holdings, Inc.* | | | 1,486 | | | | 122,877 | |
| | |
Mastercard, Inc., Class A | | | 9,078 | | | | 2,620,274 | |
| | |
Microsoft Corp. | | | 14,264 | | | | 2,888,032 | |
| | |
Mitek Systems, Inc.* | | | 1,964 | | | | 24,452 | |
| | |
National Instruments Corp. | | | 3,683 | | | | 115,204 | |
| | |
NortonLifeLock, Inc. | | | 3,116 | | | | 64,096 | |
| | |
NVIDIA Corp. | | | 1,046 | | | | 524,422 | |
The accompanying notes are an integral part of these financial statements.
9
|
AMG FQ TX-Managed U.S Equity Fund Schedule of Portfolio Investments (continued) |
| | | | | | | | |
| | | Shares | | | Value | |
| | |
Information Technology - 27.1% (continued) | | | | | | | | |
| | |
Onto Innovation, Inc.* | | | 1,166 | | | | $37,394 | |
| | |
Oracle Corp. | | | 2,316 | | | | 129,951 | |
| | |
PayPal Holdings, Inc.* | | | 391 | | | | 72,777 | |
| | |
Progress Software Corp. | | | 5,295 | | | | 192,579 | |
| | |
QAD, Inc., Class A | | | 5,290 | | | | 221,334 | |
| | |
QUALCOMM, Inc. | | | 1,853 | | | | 228,586 | |
| | |
salesforce.com, Inc.* | | | 1,695 | | | | 393,698 | |
| | |
Sanmina Corp.* | | | 2,990 | | | | 73,076 | |
| | |
ServiceNow, Inc.* | | | 326 | | | | 162,208 | |
| | |
SPS Commerce, Inc.* | | | 650 | | | | 55,633 | |
| | |
VeriSign, Inc.* | | | 32 | | | | 6,102 | |
| | |
Visa, Inc., Class A1 | | | 14,537 | | | | 2,641,518 | |
| | |
Zoom Video Communications, Inc., Class A* | | | 91 | | | | 41,943 | |
| | |
Total Information Technology | | | | | | | 16,989,553 | |
| | |
Materials - 1.8% | | | | | | | | |
| | |
Avient Corp. | | | 4,438 | | | | 137,888 | |
| | |
FutureFuel Corp. | | | 39,209 | | | | 466,195 | |
| | |
Graphic Packaging Holding Co. | | | 25,298 | | | | 336,210 | |
| | |
Myers Industries, Inc. | | | 1,705 | | | | 24,450 | |
| | |
Orion Engineered Carbons, S.A. (Luxembourg) | | | 2,616 | | | | 38,377 | |
| | |
Royal Gold, Inc. | | | 185 | | | | 21,980 | |
| | |
The Sherwin-Williams Co. | | | 98 | | | | 67,422 | |
| | |
Trecora Resources* | | | 3,512 | | | | 20,791 | |
| | |
Total Materials | | | | | | | 1,113,313 | |
| | |
Real Estate - 2.7% | | | | | | | | |
| | |
American Tower Corp., REIT | | | 481 | | | | 110,462 | |
| | |
Camden Property Trust, REIT | | | 2,481 | | | | 228,847 | |
| | |
CareTrust REIT, Inc. | | | 12,604 | | | | 215,528 | |
| | |
DiamondRock Hospitality Co., REIT | | | 25,116 | | | | 124,073 | |
| * | Non-income producing security. |
| 1 | Some of these securities, amounting to $3,698,901 or 5.9% of net assets, were out on loan to various borrowers and are collateralized by cash and various U.S. Treasury Obligations. See Note 4 of Notes to Financial Statements. |
| | | | | | | | |
| | | Shares | | | Value | |
| | |
Equity LifeStyle Properties, Inc., REIT | | | 8,562 | | | | $506,785 | |
| | |
Life Storage, Inc., REIT | | | 472 | | | | 53,879 | |
| | |
RE/MAX Holdings, Inc., Class A | | | 872 | | | | 28,201 | |
| | |
Rexford Industrial Realty, Inc., REIT 1 | | | 4,252 | | | | 197,548 | |
| | |
Weyerhaeuser Co., REIT | | | 9,546 | | | | 260,510 | |
| | |
Total Real Estate | | | | | | | 1,725,833 | |
| | |
Utilities - 2.4% | | | | | | | | |
| | |
American Water Works Co., Inc. | | | 4,551 | | | | 684,971 | |
| | |
Avangrid, Inc. | | | 1,690 | | | | 83,385 | |
| | |
Hawaiian Electric Industries, Inc. | | | 10,503 | | | | 347,019 | |
| | |
IDACORP, Inc. | | | 446 | | | | 39,128 | |
| | |
NRG Energy, Inc. | | | 3,423 | | | | 108,235 | |
| | |
Public Service Enterprise Group, Inc. | | | 3,728 | | | | 216,783 | |
| | |
Total Utilities | | | | | | | 1,479,521 | |
| | |
Total Common Stocks
(Cost $31,013,710) | | | | | | | 61,828,257 | |
| | |
| | | Principal
Amount | | | | |
Short-Term Investments - 0.5% | | | | | | | | |
| | |
Joint Repurchase Agreements - 0.5%2 | | | | | | | | |
| | |
Citigroup Global Markets, Inc., dated 10/30/20, due 11/02/20, 0.090% total to be received $340,573 (collateralized by various U.S. Government Agency Obligations and U.S. Treasuries, 0.000% - 6.500%, 10/31/20 - 08/20/70, totaling $347,381) | | | $340,570 | | | | 340,570 | |
| | |
Total Short-Term Investments
(Cost $340,570) | | | | | | | 340,570 | |
| | |
Total Investments - 99.2%
(Cost $31,354,280) | | | | | | | 62,168,827 | |
| | |
Other Assets, less Liabilities - 0.8% | | | | | | | 498,646 | |
| | |
Net Assets - 100.0% | | | | | | $ | 62,667,473 | |
| 2 | Cash collateral received for securities lending activity was invested in these joint repurchase agreements. |
| REIT | Real Estate Investment Trust |
The accompanying notes are an integral part of these financial statements.
10
|
AMG FQ TX-Managed U.S Equity Fund Schedule of Portfolio Investments (continued) |
The following table summarizes the inputs used to value the Fund’s investments by the fair value hierarchy levels as of October 31, 2020:
| | | | | | | | | | | | | | | | | | | | |
| | | Level 1 | | Level 2 | | Level 3 | | Total |
Investments in Securities | | | | | | | | | | | | | | | | | | | | |
| | | | |
Common Stocks† | | | $ | 61,828,257 | | | | | — | | | | | — | | | | | $61,828,257 | |
| | | | |
Short-Term Investments | | | | | | | | | | | | | | | | | | | | |
| | | | |
Joint Repurchase Agreements | | | | — | | | | | $340,570 | | | | | — | | | | | 340,570 | |
| | | | | | | | | | | | | | | | | | | | |
| | | | |
Total Investments in Securities | | | $ | 61,828,257 | | | | | $340,570 | | | | | — | | | | | $62,168,827 | |
| | | | | | | | | | | | | | | | | | | | |
| | † | All common stocks held in the Fund are Level 1 securities. For a detailed breakout of common stocks by major industry classification, please refer to the Fund’s Schedule of Portfolio Investments. |
For the fiscal year ended October 31, 2020, there were no transfers in or out of Level 3.
The accompanying notes are an integral part of these financial statements.
11
|
AMG FQ Long-Short Equity Fund Portfolio Manager’s Comments (unaudited) |
| | | | |
OVERVIEW For the fiscal year ended October 31, 2020, AMG FQ Long-Short Equity Fund’s (the “Fund”) Class N shares returned (11.66)%, trailing the 10.15% return for its primary benchmark, the Russell 3000® Index, and the 6.98% return of its secondary benchmark, an equally weighted average of the Russell 3000® Index and the ICE BofAML 0-3 Month U.S. Treasury Bill Index. MARKET REVIEW This fiscal year featured both an unprecedented equity advance and a historic market crash. After a roaring 2019, the bull market collapsed in stunning fashion in early 2020 as the market priced in the COVID-19 pandemic and accompanying lockdowns. The bear market was ultimately brief, with equities recovering from mid-April through October. The subsequent recovery was also anomalous, with the rebound highly concentrated in mega-cap growth companies, instead of small cap value. FUND PERFORMANCE Beta Management The Fund identified limited opportunity to express active beta views, as activity in the cash and options market was aligned for most of the period. Nevertheless, both of its major bets were profitable. The first significant bet came during Q1 2020, when the Fund developed contrarian overweight beta positioning as markets sold off in late February. Risk | | appetite indeed recovered, and the position turned profitable as markets stabilized in the second half of March. The Fund identified its next big opportunity in late August, when it perceived the rally to be unsustainable. As expected, in early September, the market started to fall back. By mid-September, the strategy began to perceive the correction as an overshoot, and flipped to overweight beta positioning. Again, the strategy was prescient, and markets soon recovered, at which point the strategy neutralized its positioning. The Fund utilizes equity index futures contracts to tactically adjust beta in these cases. Stock Selection Given the weakness in economic fundamentals, the Fund spent much of the fiscal year positioning for market fragility, preferring underpriced stocks with high quality and low volatility. Typically, in periods of high uncertainty these more defensive-oriented exposures are rewarded. Instead, mega-cap tech companies have been the clear beneficiaries of a structural shift toward remote business activity. These stocks significantly outperformed not only during the Q1 market crash, but also during the subsequent recovery—a clear break from the usual pattern, which often features a reversal of leadership. Moreover, consumption has shifted dramatically from experiences to goods as social distancing policies and norms persist. This too has benefited large growth companies, at the expense of small businesses and value opportunities. | | Diversifying exposure to certain forms of growth, particularly profitability growth, provided partially offsetting gains. The strategy also benefited from successful rotations in momentum, participating in the momentum rally during the initial market recovery, then shifting to short exposure just before momentum crashed in June. In addition, while the Fund’s strong tilt toward quality was a drag on performance over the period as a whole, it helped buttress results during the Q1 crash, when equity beta was failing. Altogether, though, it was a disappointing year, with the Fund positioning for risk-off episodes that never fully materialized. The Fund utilizes swaps to achieve synthetic exposure to individual equity exposures. The use of swaps had no material impact on performance relative to holding physical securities. OUTLOOK AND POSITIONING The Fund ended the fiscal year with a neutral view on market beta. In cash equities, as economic fundamentals stabilized, the Fund began to reorient toward growth opportunities. Additionally, it notably shifted its views on investor preferences, identifying bullish opportunity for leverage and less robust demand for stocks with attractive dividends. This commentary reflects the viewpoints of the portfolio manager, First Quadrant, L.P., as of October 31, 2020 and is not intended as a forecast or guarantee of future results, and is subject to change without notice. |
12
|
AMG FQ Long-Short Equity Fund Portfolio Manager’s Comments (continued) |
CUMULATIVE TOTAL RETURN PERFORMANCE
AMG FQ Long-Short Equity Fund’s cumulative total return is based on the daily change in net asset value (NAV), and assumes that all dividends and distributions were reinvested. This graph compares a hypothetical $10,000 investment made in the AMG FQ Long-Short Equity Fund’s Class N shares on October 31, 2010, to a $10,000 investment made in the Russell 3000® Index and 50% Russell 3000® Index/50% ICE BofAML 0-3 Month U.S. Treasury Bill Index for the same time period. The graph and table do not reflect the deduction of taxes that a shareholder would pay on a Fund distribution or redemption of shares. The listed returns for the Fund are net of expenses and the returns for the index exclude expenses. Total returns would have been lower had certain expenses not been reduced.
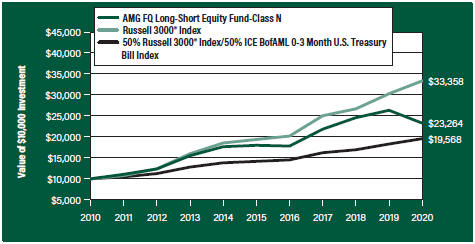
The table below shows the average annual total returns for the AMG FQ Long-Short Equity Fund and the Russell 3000® Index and 50% Russell 3000® Index/50% ICE BofAML 0-3 Month U.S. Treasury Bill Index for the same time periods ended October 31, 2020.
| | | | | | | | | | | | |
| Average Annual Total Returns1 | | One Year | | | Five Years | | | Ten Years | |
AMG FQ Long-Short Equity Fund2, 3, 4, 5, 6, 7, 8, 9, 10, 11, 12 | | | | | |
| | | |
Class N | | | (11.66%) | | | | 5.28% | | | | 8.81% | |
| | | |
Class I | | | (11.38%) | | | | 5.59% | | | | 9.12% | |
| | | |
Russell 3000® Index13 | | | 10.15% | | | | 11.48% | | | | 12.80% | |
| | | |
50% Russell 3000® Index/50% ICE BofAML 0-3 Month
U.S. Treasury Bill Index13, 14 | | | 6.98% | | | | 6.69% | | | | 6.95% | |
The performance data shown represents past performance. Past performance is not a guarantee of future results. Current performance may be lower or higher than the performance data quoted. The investment return and principal value of an investment will fluctuate so that an investor’s shares, when redeemed, may be worth more or less than their original cost.
Investors should carefully consider the Fund’s investment objectives, risks, charges and expenses before investing. For performance information through the most recent month end, current net asset values per share for the Fund and other information, please call 800.548.4539 or visit our website at amgfunds.com for a free prospectus. Read it carefully before investing or sending money.
Distributed by AMG Distributors, Inc., member FINRA/SIPC.
| 1 | Total return equals income yield plus share price change and assumes reinvestment of all dividends and capital gain distributions. Returns are net of fees and may reflect offsets of Fund expenses as described in the prospectus. No adjustment has been made for taxes payable by shareholders on their reinvested dividends and |
|
|
capitalgain distributions. Returns for periods greater than one year are annualized. The listed returns on the Fund are net of expenses and based on the published NAV as of October 31, 2020. All returns are in U.S. dollars ($). 2 From time to time, the Fund’s advisor has waived its fees and/or absorbed Fund expenses, which has resulted in higher returns. 3 The Fund may suffer significant losses on assets that it sells short. Unlike the possible loss on a security that is purchased, there is no limit on the amount of loss on an appreciating security that is sold short. 4 Market prices of investments held by the Fund may fall rapidly or unpredictably due to a variety of economic or political factors, market conditions, disasters or public health issues, or in response to events that affect particular industries or companies. 5 In managing the Fund, the Fund’s Subadviser may rely heavily on one or more quantitative models (“Model”) and information and data supplied by third parties (“Data”). When a Model or Data used in managing the Fund contains an error, or is incorrect or incomplete, any investment decision made in reliance on the Model or Data may not produce the desired results and the Fund may realize losses. In addition, any hedging based on a faulty Model or Data may prove to be unsuccessful. 6 The Fund may invest in derivatives such as options and futures; the complexity and rapidly changing structure of derivatives markets may increase the possibility of market losses. 7 The use of leverage in a Fund’s strategy, such as future and forward commitment transactions, can magnify relatively small market movements into relatively larger losses for the Fund. |
|
8 The Fund is subject to risks associated with investments in small-capitalization companies, such as erratic earnings patterns, competitive conditions, limited earnings history and a reliance on one or a limited number of products. 9 The Fund is subject to risks associated with investments in mid-capitalization companies such as greater price volatility, lower trading volume, and less liquidity than the stocks of larger, more established companies. 10 Active and frequent trading of a fund may result in higher transaction costs and increased tax liability. 11 The Fund is subject to special risk considerations similar to those associated with the direct ownership of real estate. Real estate valuations may be subject to factors such as 12 The Fund invests in large-capitalization companies that may underperform other stock funds (such as |
13
|
AMG FQ Long-Short Equity Fund Portfolio Manager’s Comments (continued) |
| | | | | | | | |
funds that focus on small- and medium- capitalization companies) when stocks of large-capitalization companies are out of favor. 13 The Russell 3000® Index is composed of the 3,000 largest U.S. companies as measured by market capitalization, and represents about 98% of the U.S. stock market. Unlike the Fund, the Russell 3000® Index is unmanaged, is not available for investment, and does not incur expenses. | | | | 14 ICE BofAML 0-3 Month U.S. Treasury Bill Index is comprised of a single issue purchased at the beginning of the month and held for a full month. At the end of the month that issue is sold and rolled into a newly selected issue. The issue selected at each month-end rebalancing is the outstanding Treasury Bill that matures closest to, but not beyond, three months from the rebalancing date. Unlike the Fund, the ICE BofAML 0-3 Month U.S. Treasury Bill Index is unmanaged, is not | | | | available for investment and does not incur expenses. The Russell 3000® Index is a trademark of the London Stock Exchange Group companies. Not FDIC insured, nor bank guaranteed. May lose value. |
14
|
AMG FQ Long-Short Equity Fund Fund Snapshots (unaudited) October 31, 2020 |
PORTFOLIO BREAKDOWN
| | | | | | | | | | |
| Sector | | Long
Exposure1, 2 | | | | Short
Exposure1, 2 | | | | Net
Exposure1, 2 |
| | | | | | |
Information Technology | | 31.3 | | | | (19.8) | | | | 11.5 |
| | | | | | |
Health Care | | 22.9 | | | | (14.5) | | | | 8.4 |
| | | | | | |
Industrials | | 20.7 | | | | (16.4) | | | | 4.3 |
| | | | | | |
Financials | | 19.3 | | | | (12.8) | | | | 6.5 |
| | | | | | |
Consumer Staples | | 15.1 | | | | (7.8) | | | | 7.3 |
| | | | | | |
Consumer Discretionary | | 14.9 | | | | (10.6) | | | | 4.3 |
| | | | | | |
Real Estate | | 10.3 | | | | (5.1) | | | | 5.2 |
| | | | | | |
Communication Services | | 10.2 | | | | (3.5) | | | | 6.7 |
| | | | | | |
Utilities | | 9.0 | | | | (4.7) | | | | 4.3 |
| | | | | | |
Materials | | 8.2 | | | | (5.9) | | | | 2.3 |
| | | | | | |
Energy | | 2.3 | | | | (2.3) | | | | — |
| | | | | | |
Short Term Investments | | 36.2 | | | | — | | | | 36.2 |
| | | | | | |
Other Assets3 | | — | | | | — | | | | 3.0 |
| 1 | As a percentage of net assets. |
| 2 | Includes notional market value of constituents in Equity Basket Swaps. |
| 3 | Includes collateral for swaps. |
TOP TEN HOLDINGS
| | |
| Security Name | | %of
Net Assets |
| | |
Prologis, Inc. | | 0.8 |
| | |
Neurocrine Biosciences, Inc. | | 0.6 |
| | |
Donaldson Co., Inc. | | 0.6 |
| | |
IAC/InteractiveCorp. | | 0.6 |
| | |
Johnson & Johnson | | 0.5 |
| | |
IQVIA Holdings, Inc. | | 0.4 |
| | |
Exxon Mobil Corp. | | 0.4 |
| | |
ConocoPhillips | | 0.3 |
| | |
American Tower Corp. | | 0.3 |
| | |
Berkshire Hathaway, Inc., Class B | | 0.3 |
| | | |
| | |
Top Ten as a Group | | 4.8 |
| | |
Because a fund’s strategy may result in multiple investments in particular sectors of the economy, its performance may depend on the performance of those sectors and may fluctuate more widely than investments diversified across more sectors. For additional information on these and other risk considerations, please see the Fund’s prospectus.
Any sectors, industries, or securities discussed should not be perceived as investment recommendations. Mention of a specific security should not be considered a recommendation to buy or solicitation to sell that security. Specific securities mentioned in this report may have been sold from the Fund’s portfolio of investments by the time you receive this report.
15
|
AMG FQ Long-Short Equity Fund Schedule of Portfolio Investments October 31, 2020 |
| | | | | | | | |
| | | Shares | | | Value | |
| | |
Common Stocks - 5.7% | | | | | | | | |
| | |
Communication Services - 0.6% | | | | | | | | |
| | |
IAC/InteractiveCorp.* | | | 2,023 | | | | $244,217 | |
| | |
Consumer Discretionary - 0.4% | | | | | | | | |
| | |
McDonald’s Corp. | | | 358 | | | | 76,254 | |
| | |
O’Reilly Automotive, Inc.* | | | 124 | | | | 54,138 | |
| | |
Starbucks Corp. | | | 455 | | | | 39,567 | |
| | |
Total Consumer Discretionary | | | | | | | 169,959 | |
| | |
Energy - 0.7% | | | | | | | | |
| | |
ConocoPhillips | | | 5,263 | | | | 150,627 | |
| | |
Exxon Mobil Corp. | | | 4,757 | | | | 155,173 | |
| | |
Total Energy | | | | | | | 305,800 | |
| | |
Financials - 0.5% | | | | | | | | |
| | |
Berkshire Hathaway, Inc., Class B* | | | 657 | | | | 132,649 | |
| | |
Principal Financial Group, Inc. | | | 2,528 | | | | 99,148 | |
| | |
Total Financials | | | | | | | 231,797 | |
| | |
Health Care - 1.6% | | | | | | | | |
| | |
Anthem, Inc. | | | 253 | | | | 69,018 | |
| | |
IQVIA Holdings, Inc.* | | | 1,113 | | | | 171,391 | |
| | |
Johnson & Johnson | | | 1,474 | | | | 202,100 | |
| | |
Neurocrine Biosciences, Inc.* | | | 2,689 | | | | 265,324 | |
| | |
Total Health Care | | | | | | | 707,833 | |
| | |
Industrials - 0.8% | | | | | | | | |
| | |
Donaldson Co., Inc. | | | 5,460 | | | | 259,350 | |
| | | | | | | | |
| | | Shares | | | Value | |
| | |
Uber Technologies, Inc.* | | | 1,964 | | | | $65,617 | |
| | |
Total Industrials | | | | | | | 324,967 | |
| | |
Real Estate - 1.1% | | | | | | | | |
| | |
American Tower Corp., REIT | | | 610 | | | | 140,087 | |
| | |
Prologis, Inc., REIT | | | 3,487 | | | | 345,910 | |
| | |
Total Real Estate | | | | | | | 485,997 | |
| | |
Total Common Stocks | | | | | | | | |
(Cost $2,553,305) | | | | | | | 2,470,570 | |
| | |
Short-Term Investments - 36.2% | | | | | | | | |
| |
Other Investment Companies - 36.2% | | | | | |
| | |
Morgan Stanley Institutional Liquidity Funds Prime Portfolio, Institutional Shares, 0.10%1 | | | 7,201,924 | | | | 7,202,644 | |
| | |
Dreyfus Government Cash Management Fund, Institutional Shares, 0.02%1 | | | 2,849,349 | | | | 2,849,349 | |
| | |
Dreyfus Institutional Preferred Government Money Market Fund, Institutional Shares, 0.04%1 | | | 2,849,349 | | | | 2,849,349 | |
| | |
JPMorgan U.S. Government Money Market Fund, IM Shares, 0.04%1 | | | 2,935,693 | | | | 2,935,693 | |
| | |
Total Short-Term Investments | | | | | | | | |
(Cost $15,830,567) | | | | | | | 15,837,035 | |
| | |
Total Investments - 41.9% | | | | | | | | |
(Cost $18,383,872) | | | | | | | 18,307,605 | |
| | |
Derivatives - (1.5)%2 | | | | | | | (653,732 | ) |
| | |
Other Assets, less Liabilities - 59.6% | | | | | | | 26,052,545 | |
| | |
Net Assets - 100.0% | | | | | | | $43,706,418 | |
* Non-income producing security.
1 Yield shown represents the October 31, 2020, seven day average yield, which refers to the sum of the previous seven days’ dividends paid, expressed as an annual percentage.
2 Includes over-the-counter total return basket swaps. Please refer to the over-the-counter total return basket swap tables for the details.
REIT Real Estate Investment Trust
Over-the-counter long total return basket swap
| | | | | | | | | | | | | | |
| Counterparty | | Description | | Notional | | | Termination
Date | | | Value | |
| | | | |
Morgan Stanley & Co. | | The Fund receives or pays the total return on a portfolio of long positions and pays the 1-Month LIBOR (plus a spread). | | | $69,300,035 | | | | 7/22/22 | | | | $(2,225,043) | |
Components of over-the-counter long total return basket swap
| | | | | | | | | | | | | | | | |
| Reference Entity | | Shares | | | Notional Value | | | Net Unrealized
Appreciation/
(Depreciation) | | | % of Notional
Market Value | |
Communication Services | | | | | | | | | | | | | | | | |
Alphabet, Inc., Class A | | | 193 | | | | $308,584 | | | | $3,325 | | | | 0.5 | |
Alphabet, Inc., Class C | | | 202 | | | | 324,060 | | | | 3,384 | | | | 0.5 | |
AT&T, Inc. | | | 4,160 | | | | 111,987 | | | | 416 | | | | 0.2 | |
The accompanying notes are an integral part of these financial statements.
16
|
AMG FQ Long-Short Equity Fund Schedule of Portfolio Investments (continued) |
Components of over-the-counter long total return basket swap (continued)
| | | | | | | | | | | | | | | | |
| Reference Entity | | Shares | | | Notional Value | | | Net Unrealized
Appreciation/
(Depreciation) | | | % of Notional
Market Value | |
Communication Services (continued) | | | | | | | | | | | | | | | | |
Cable One, Inc. | | | 153 | | | | $268,284 | | | | $(3,309 | ) | | | 0.4 | |
Comcast Corp., Class A | | | 2,664 | | | | 115,724 | | | | (3,197 | ) | | | 0.2 | |
Facebook, Inc., Class A | | | 1,479 | | | | 418,986 | | | | (29,846 | ) | | | 0.6 | |
John Wiley & Sons, Inc., Class A | | | 8,262 | | | | 267,028 | | | | (11,236 | ) | | | 0.4 | |
Liberty Media Corp-Liberty SiriusXM | | | 8,321 | | | | 295,395 | | | | (7,739 | ) | | | 0.4 | |
Match Group, Inc. | | | 1,675 | | | | 200,012 | | | | (4,405 | ) | | | 0.3 | |
Netflix, Inc. | | | 229 | | | | 112,210 | | | | (3,266 | ) | | | 0.1 | |
News Corp., Class B | | | 18,793 | | | | 250,887 | | | | (6,202 | ) | | | 0.4 | |
Pinterest, Inc., Class A | | | 5,699 | | | | 290,706 | | | | 45,250 | | | | 0.5 | |
Telephone and Data Systems, Inc. | | | 13,157 | | | | 229,984 | | | | (6,315 | ) | | | 0.3 | |
T-Mobile US, Inc. | | | 1,947 | | | | 217,636 | | | | (4,303 | ) | | | 0.3 | |
TripAdvisor, Inc. | | | 13,352 | | | | 261,566 | | | | (6,409 | ) | | | 0.4 | |
Twitter, Inc. | | | 5,543 | | | | 284,190 | | | | (54,931 | ) | | | 0.3 | |
Verizon Communications, Inc. | | | 2,416 | | | | 139,403 | | | | (1,715 | ) | | | 0.2 | |
The Walt Disney Co. | | | 1,112 | | | | 137,121 | | | | (2,291 | ) | | | 0.2 | |
| | | | | | | | | | | | | | | | |
Total Communication Services | | | | | | | 4,233,763 | | | | (92,789 | ) | | | 6.2 | |
Consumer Discretionary | | | | | | | | | | | | | | | | |
Amazon.com, Inc. | | | 250 | | | | 806,250 | | | | (47,212 | ) | | | 1.1 | |
AutoNation, Inc. | | | 593 | | | | 34,323 | | | | (682 | ) | | | 0.1 | |
Booking Holdings, Inc. | | | 162 | | | | 275,029 | | | | (12,184 | ) | | | 0.4 | |
Bright Horizons Family Solutions, Inc. | | | 359 | | | | 57,436 | | | | (696 | ) | | | 0.1 | |
Capri Holdings, Ltd. (Virgin Islands, British) | | | 12,207 | | | | 272,582 | | | | (13,550 | ) | | | 0.4 | |
CarMax, Inc. | | | 88 | | | | 7,695 | | | | (88 | ) | | | 0.0 | # |
Carter’s, Inc. | | | 3,117 | | | | 274,421 | | | | (20,541 | ) | | | 0.4 | |
Carvana Co. | | | 1,261 | | | | 262,692 | | | | (28,965 | ) | | | 0.3 | |
Chegg, Inc. | | | 3,191 | | | | 258,471 | | | | (24,124 | ) | | | 0.4 | |
Dick’s Sporting Goods, Inc. | | | 4,490 | | | | 258,893 | | | | (4,535 | ) | | | 0.4 | |
eBay, Inc. | | | 5,480 | | | | 293,454 | | | | (32,442 | ) | | | 0.4 | |
Etsy, Inc. | | | 1,917 | | | | 279,460 | | | | (46,372 | ) | | | 0.3 | |
Grand Canyon Education, Inc. | | | 3,228 | | | | 264,631 | | | | (11,653 | ) | | | 0.4 | |
H&R Block, Inc. | | | 13,065 | | | | 234,647 | | | | (9,146 | ) | | | 0.3 | |
The Home Depot, Inc. | | | 582 | | | | 161,121 | | | | (5,896 | ) | | | 0.2 | |
Lowe’s Cos., Inc. | | | 2,032 | | | | 335,565 | | | | (14,305 | ) | | | 0.5 | |
NVR, Inc. | | | 65 | | | | 260,043 | | | | (3,092 | ) | | | 0.4 | |
Polaris, Inc. | | | 2,746 | | | | 252,742 | | | | (3,240 | ) | | | 0.4 | |
PVH Corp. | | | 4,255 | | | | 259,512 | | | | (11,489 | ) | | | 0.4 | |
Tempur Sealy International, Inc. | | | 2,993 | | | | 262,845 | | | | 3,532 | | | | 0.4 | |
The accompanying notes are an integral part of these financial statements.
17
|
AMG FQ Long-Short Equity Fund Schedule of Portfolio Investments (continued) |
Components of over-the-counter long total return basket swap (continued)
| | | | | | | | | | | | | | | | |
| Reference Entity | | Shares | | | Notional Value | | | Net Unrealized
Appreciation/
(Depreciation) | | | % of Notional
Market Value | |
Consumer Discretionary (continued) | | | | | | | | | | | | | | | | |
Terminix Global Holdings, Inc. | | | 4,822 | | | | $229,849 | | | | $(2,781 | ) | | | 0.3 | |
Tesla, Inc. | | | 1,061 | | | | 450,586 | | | | (38,875 | ) | | | 0.6 | |
The TJX Cos., Inc. | | | 483 | | | | 26,145 | | | | (1,608 | ) | | | 0.0 | # |
Ulta Beauty, Inc. | | | 1,196 | | | | 255,202 | | | | (7,906 | ) | | | 0.4 | |
Wayfair, Inc., Class A | | | 926 | | | | 254,039 | | | | (24,363 | ) | | | 0.3 | |
| | | | | | | | | | | | | | | | |
Total Consumer Discretionary | | | | | | | 6,327,633 | | | | (362,213 | ) | | | 8.9 | |
Consumer Staples | | | | | | | | | | | | | | | | |
Altria Group, Inc. | | | 8,514 | | | | 316,465 | | | | (9,280 | ) | | | 0.4 | |
Beyond Meat, Inc. | | | 1,532 | | | | 248,107 | | | | (29,905 | ) | | | 0.3 | |
Brown-Forman Corp., Class A | | | 3,995 | | | | 262,711 | | | | (12,025 | ) | | | 0.4 | |
Casey’s General Stores, Inc. | | | 1,377 | | | | 248,521 | | | | (16,400 | ) | | | 0.3 | |
Church & Dwight Co., Inc. | | | 2,758 | | | | 254,370 | | | | (10,591 | ) | | | 0.4 | |
The Coca-Cola Co. | | | 3,823 | | | | 190,768 | | | | (7,034 | ) | | | 0.3 | |
Costco Wholesale Corp. | | | 417 | | | | 155,424 | | | | (6,297 | ) | | | 0.2 | |
Energizer Holdings, Inc. | | | 6,425 | | | | 268,244 | | | | (15,420 | ) | | | 0.4 | |
Flowers Foods, Inc. | | | 11,307 | | | | 273,629 | | | | (7,010 | ) | | | 0.4 | |
Herbalife Nutrition, Ltd. (Cayman Islands) | | | 391 | | | | 18,643 | | | | (993 | ) | | | 0.0 | # |
The Hershey Co. | | | 2,002 | | | | 285,285 | | | | (10,090 | ) | | | 0.4 | |
Ingredion, Inc. | | | 3,532 | | | | 266,101 | | | | (15,718 | ) | | | 0.4 | |
Keurig Dr Pepper, Inc. | | | 10,009 | | | | 286,257 | | | | (17,015 | ) | | | 0.4 | |
Lamb Weston Holdings, Inc. | | | 3,954 | | | | 261,874 | | | | (10,992 | ) | | | 0.4 | |
Mondelez International, Inc., Class A | | | 6,304 | | | | 346,783 | | | | (11,915 | ) | | | 0.5 | |
Monster Beverage Corp. | | | 2,989 | | | | 240,286 | | | | (11,418 | ) | | | 0.3 | |
Nu Skin Enterprises, Inc., Class A | | | 5,097 | | | | 265,605 | | | | (14,068 | ) | | | 0.4 | |
PepsiCo, Inc. | | | 1,414 | | | | 196,716 | | | | (8,244 | ) | | | 0.3 | |
The Procter & Gamble Co. | | | 2,491 | | | | 353,622 | | | | (12,106 | ) | | | 0.5 | |
Reynolds Consumer Products, Inc. | | | 8,744 | | | | 259,522 | | | | (12,591 | ) | | | 0.4 | |
Spectrum Brands Holdings, Inc. | | | 4,454 | | | | 265,993 | | | | (12,694 | ) | | | 0.4 | |
Sprouts Farmers Market, Inc. | | | 12,756 | | | | 260,222 | | | | (17,221 | ) | | | 0.4 | |
Sysco Corp. | | | 3,743 | | | | 218,367 | | | | (11,341 | ) | | | 0.3 | |
Tyson Foods, Inc., Class A | | | 4,744 | | | | 273,587 | | | | (2,087 | ) | | | 0.4 | |
US Foods Holding Corp. | | | 11,237 | | | | 251,597 | | | | (16,743 | ) | | | 0.3 | |
Walgreens Boots Alliance, Inc. | | | 4,029 | | | | 145,044 | | | | (7,897 | ) | | | 0.2 | |
Walmart, Inc. | | | 1,366 | | | | 195,160 | | | | (5,628 | ) | | | 0.3 | |
| | | | | | | | | | | | | | | | |
Total Consumer Staples | | | | | | | 6,608,903 | | | | (312,723 | ) | | | 9.4 | |
Energy | | | | | | | | | | | | | | | | |
Apache Corp. | | | 11,895 | | | | 99,264 | | | | (535 | ) | | | 0.2 | |
The accompanying notes are an integral part of these financial statements.
18
|
AMG FQ Long-Short Equity Fund Schedule of Portfolio Investments (continued) |
Components of over-the-counter long total return basket swap (continued)
| | | | | | | | | | | | | | | | |
| Reference Entity | | Shares | | | Notional Value | | | Net Unrealized Appreciation/ (Depreciation) | | | % of Notional Market Value | |
Energy (continued) | | | | | | | | | | | | | | | | |
Chevron Corp. | | | 4,205 | | | | $292,289 | | | | $(42) | | | | 0.4 | |
Cimarex Energy Co. | | | 193 | | | | 4,995 | | | | (98 | ) | | | 0.0 | # |
Continental Resources, Inc. | | | 9,702 | | | | 125,350 | | | | (8,635 | ) | | | 0.2 | |
Murphy Oil Corp. | | | 1,333 | | | | 10,664 | | | | (373 | ) | | | 0.0 | # |
Occidental Petroleum Corp. | | | 2,991 | | | | 27,726 | | | | (419 | ) | | | 0.0 | # |
Targa Resources Corp. | | | 8,676 | | | | 141,853 | | | | (2,603 | ) | | | 0.2 | |
| | | | | | | | | | | | | | | | |
| | | | |
Total Energy | | | | | | | 702,141 | | | | (12,705 | ) | | | 1.0 | |
Financials | | | | | | | | | | | | | | | | |
Apollo Global Management, Inc. | | | 6,011 | | | | 241,582 | | | | (20,017 | ) | | | 0.3 | |
Ares Management Corp., Class A | | | 3,487 | | | | 149,767 | | | | (2,267 | ) | | | 0.2 | |
Associated Banc-Corp | | | 19,076 | | | | 271,261 | | | | (10,110 | ) | | | 0.4 | |
Assurant, Inc. | | | 1,959 | | | | 236,432 | | | | 7,209 | | | | 0.4 | |
Athene Holding, Ltd., Class A (Bermuda) | | | 6,887 | | | | 228,166 | | | | (7,231 | ) | | | 0.3 | |
Brighthouse Financial, Inc. | | | 1,318 | | | | 39,052 | | | | 4,573 | | | | 0.1 | |
Capital One Financial Corp. | | | 3,741 | | | | 277,058 | | | | (3,666 | ) | | | 0.4 | |
Citigroup, Inc. | | | 6,557 | | | | 274,607 | | | | (3,016 | ) | | | 0.4 | |
CME Group, Inc. | | | 906 | | | | 145,177 | | | | (8,625 | ) | | | 0.2 | |
Comerica, Inc. | | | 3,731 | | | | 161,813 | | | | 7,984 | | | | 0.3 | |
Commerce Bancshares, Inc. | | | 225 | | | | 13,799 | | | | 207 | | | | 0.0 | # |
Cullen/Frost Bankers, Inc. | | | 3,941 | | | | 272,520 | | | | 4,414 | | | | 0.4 | |
Discover Financial Services | | | 4,280 | | | | 280,896 | | | | (2,654 | ) | | | 0.4 | |
Erie Indemnity Co., Class A | | | 1,195 | | | | 274,922 | | | | 3,358 | | | | 0.4 | |
Evercore, Inc., Class A | | | 3,309 | | | | 271,338 | | | | (8,140 | ) | | | 0.4 | |
FactSet Research Systems, Inc. | | | 733 | | | | 233,754 | | | | (9,089 | ) | | | 0.3 | |
Fifth Third Bancorp | | | 5,276 | | | | 120,847 | | | | 1,662 | | | | 0.2 | |
First American Financial Corp. | | | 5,258 | | | | 244,812 | | | | (10,358 | ) | | | 0.3 | |
First Horizon National Corp. | | | 25,538 | | | | 271,724 | | | | (5,874 | ) | | | 0.4 | |
FNB Corp. | | | 35,097 | | | | 269,896 | | | | (4,563 | ) | | | 0.4 | |
JPMorgan Chase & Co. | | | 1,556 | | | | 156,394 | | | | (3,843 | ) | | | 0.2 | |
Kemper Corp. | | | 3,715 | | | | 234,825 | | | | (5,758 | ) | | | 0.3 | |
MarketAxess Holdings, Inc. | | | 515 | | | | 280,660 | | | | (3,152 | ) | | | 0.4 | |
Moody’s Corp. | | | 932 | | | | 251,733 | | | | (6,710 | ) | | | 0.4 | |
Northern Trust Corp. | | | 3,335 | | | | 269,135 | | | | (8,104 | ) | | | 0.4 | |
Old Republic International Corp. | | | 16,550 | | | | 272,248 | | | | (2,814 | ) | | | 0.4 | |
PacWest Bancorp | | | 13,549 | | | | 268,948 | | | | (8,265 | ) | | | 0.4 | |
The PNC Financial Services Group, Inc. | | | 2,271 | | | | 247,971 | | | | 6,109 | | | | 0.4 | |
Primerica, Inc. | | | 2,068 | | | | 233,891 | | | | (5,915 | ) | | | 0.3 | |
The accompanying notes are an integral part of these financial statements.
19
|
AMG FQ Long-Short Equity Fund Schedule of Portfolio Investments (continued) |
Components of over-the-counter long total return basket swap (continued)
| | | | | | | | | | | | | | | | |
| Reference Entity | | Shares | | | Notional Value | | | Net Unrealized Appreciation/ (Depreciation) | | | % of Notional Market Value | |
Financials (continued) | | | | | | | | | | | | | | | | |
Santander Consumer USA Holdings, Inc. | | | 13,065 | | | | $270,576 | | | | $(4,834) | | | | 0.4 | |
SEI Investments Co. | | | 4,946 | | | | 246,459 | | | | (3,363 | ) | | | 0.4 | |
State Street Corp. | | | 2,876 | | | | 177,305 | | | | (7,909 | ) | | | 0.3 | |
Sterling Bancorp | | | 8,430 | | | | 110,180 | | | | 2,613 | | | | 0.2 | |
Synchrony Financial | | | 4,892 | | | | 131,546 | | | | (9,148 | ) | | | 0.2 | |
T Rowe Price Group, Inc. | | | 1,991 | | | | 290,029 | | | | (37,849 | ) | | | 0.4 | |
TCF Financial Corp. | | | 9,297 | | | | 267,940 | | | | (14,968 | ) | | | 0.4 | |
W R Berkley Corp. | | | 3,789 | | | | 232,796 | | | | (5,001 | ) | | | 0.3 | |
| | | | | | | | | | | | | | | | |
| | | | |
Total Financials | | | | | | | 8,222,059 | | | | (185,114 | ) | | | 12.0 | |
Health Care | | | | | | | | | | | | | | | | |
10X Genomics, Inc., Class A | | | 1,714 | | | | 244,982 | | | | (10,335 | ) | | | 0.3 | |
AbbVie, Inc. | | | 4,245 | | | | 351,104 | | | | 10,146 | | | | 0.5 | |
Acceleron Pharma, Inc. | | | 2,393 | | | | 259,521 | | | | (9,261 | ) | | | 0.4 | |
Avantor, Inc. | | | 11,195 | | | | 278,196 | | | | (17,688 | ) | | | 0.4 | |
Baxter International, Inc. | | | 59 | | | | 4,757 | | | | (180 | ) | | | 0.0 | # |
Bristol-Myers Squibb Co. | | | 5,179 | | | | 307,425 | | | | (4,713 | ) | | | 0.4 | |
Cardinal Health, Inc. | | | 5,743 | | | | 274,803 | | | | (11,831 | ) | | | 0.4 | |
Centene Corp. | | | 4,368 | | | | 268,020 | | | | (9,872 | ) | | | 0.4 | |
Chemed Corp. | | | 558 | | | | 273,844 | | | | (6,942 | ) | | | 0.4 | |
DENTSPLY SIRONA, Inc. | | | 3,748 | | | | 178,180 | | | | (1,312 | ) | | | 0.3 | |
DexCom, Inc. | | | 697 | | | | 275,475 | | | | (52,728 | ) | | | 0.3 | |
Eli Lilly and Co. | | | 2,117 | | | | 279,232 | | | | (3,048 | ) | | | 0.4 | |
Exact Sciences Corp. | | | 101 | | | | 13,243 | | | | (736 | ) | | | 0.0 | # |
Exelixis, Inc. | | | 10,945 | | | | 236,959 | | | | (12,806 | ) | | | 0.3 | |
Globus Medical, Inc., Class A | | | 4,737 | | | | 242,819 | | | | 4,074 | | | | 0.4 | |
Haemonetics Corp. | | | 2,511 | | | | 268,752 | | | | (14,915 | ) | | | 0.4 | |
Hill-Rom Holdings, Inc. | | | 2,999 | | | | 274,169 | | | | (1,050 | ) | | | 0.4 | |
IDEXX Laboratories, Inc. | | | 680 | | | | 292,584 | | | | (3,706 | ) | | | 0.4 | |
Illumina, Inc. | | | 875 | | | | 281,522 | | | | (25,410 | ) | | | 0.4 | |
Incyte Corp. | | | 2,997 | | | | 264,785 | | | | (5,125 | ) | | | 0.4 | |
Insulet Corp. | | | 1,095 | | | | 275,524 | | | | (32,160 | ) | | | 0.3 | |
Integra LifeSciences Holdings Corp. | | | 4,822 | | | | 224,464 | | | | (11,814 | ) | | | 0.3 | |
Ionis Pharmaceuticals, Inc. | | | 5,468 | | | | 256,887 | | | | (164 | ) | | | 0.4 | |
Iovance Biotherapeutics, Inc. | | | 1,687 | | | | 61,626 | | | | (1,434 | ) | | | 0.1 | |
Laboratory Corp. of America Holdings | | | 906 | | | | 183,474 | | | | (2,482 | ) | | | 0.3 | |
McKesson Corp. | | | 1,870 | | | | 284,502 | | | | (8,696 | ) | | | 0.4 | |
Mettler-Toledo International, Inc. | | | 270 | | | | 283,735 | | | | (14,299 | ) | | | 0.4 | |
The accompanying notes are an integral part of these financial statements.
20
|
AMG FQ Long-Short Equity Fund Schedule of Portfolio Investments (continued) |
Components of over-the-counter long total return basket swap (continued)
| | | | | | | | | | | | | | | | |
| Reference Entity | | Shares | | | Notional Value | | | Net Unrealized Appreciation/ (Depreciation) | | | % of Notional Market Value | |
Health Care (continued) | | | | | | | | | | | | | | | | |
Molina Healthcare, Inc. | | | 1,334 | | | | $270,882 | | | | $(22,131) | | | | 0.4 | |
Novocure, Ltd. (Jersey) | | | 2,101 | | | | 251,069 | | | | 5,463 | | | | 0.4 | |
PRA Health Sciences, Inc. | | | 2,526 | | | | 261,441 | | | | (15,308 | ) | | | 0.4 | |
Premier, Inc., Class A | | | 8,009 | | | | 272,226 | | | | (10,091 | ) | | | 0.4 | |
Regeneron Pharmaceuticals, Inc. | | | 502 | | | | 292,425 | | | | (19,558 | ) | | | 0.4 | |
Tandem Diabetes Care, Inc. | | | 2,318 | | | | 271,507 | | | | (18,845 | ) | | | 0.4 | |
Teladoc Health, Inc. | | | 1,256 | | | | 280,163 | | | | (33,410 | ) | | | 0.4 | |
United Therapeutics Corp. | | | 2,215 | | | | 272,733 | | | | 24,587 | | | | 0.4 | |
UnitedHealth Group, Inc. | | | 492 | | | | 158,946 | | | | (8,817 | ) | | | 0.2 | |
Universal Health Services, Inc., Class B | | | 2,405 | | | | 274,579 | | | | (11,111 | ) | | | 0.4 | |
Vertex Pharmaceuticals, Inc. | | | 1,216 | | | | 253,354 | | | | 12 | | | | 0.4 | |
Waters Corp. | | | 43 | | | | 9,675 | | | | (94 | ) | | | 0.0 | # |
| | | | | | | | | | | | | | | | |
| | | | |
Total Health Care | | | | | | | 9,309,584 | | | | (357,790 | ) | | | 13.3 | |
Industrials | | | | | | | | | | | | | | | | |
ADT, Inc. | | | 30,543 | | | | 218,688 | | | | (17,410 | ) | | | 0.3 | |
Air Lease Corp. | | | 229 | | | | 6,694 | | | | (456 | ) | | | 0.0 | # |
Allison Transmission Holdings, Inc. | | | 6,747 | | | | 251,191 | | | | (7,287 | ) | | | 0.4 | |
Armstrong World Industries, Inc. | | | 3,924 | | | | 246,859 | | | | (11,811 | ) | | | 0.3 | |
Axon Enterprise, Inc. | | | 2,585 | | | | 261,214 | | | | (5,558 | ) | | | 0.4 | |
The Boeing Co. | | | 1,765 | | | | 280,635 | | | | (25,787 | ) | | | 0.4 | |
Carrier Global Corp. | | | 8,526 | | | | 288,435 | | | | (3,751 | ) | | | 0.4 | |
Clean Harbors, Inc. | | | 4,701 | | | | 262,645 | | | | (13,633 | ) | | | 0.4 | |
CoreLogic, Inc. | | | 4,015 | | | | 274,506 | | | | 34,368 | | | | 0.5 | |
Crane Co. | | | 5,035 | | | | 280,147 | | | | (24,621 | ) | | | 0.4 | |
CSX Corp. | | | 3,828 | | | | 302,374 | | | | (191 | ) | | | 0.4 | |
FTI Consulting, Inc. | | | 2,425 | | | | 265,125 | | | | (26,360 | ) | | | 0.3 | |
GrafTech International, Ltd. | | | 36,183 | | | | 249,301 | | | | (5,066 | ) | | | 0.4 | |
HD Supply Holdings, Inc. | | | 6,591 | | | | 266,145 | | | | (3,427 | ) | | | 0.4 | |
Hubbell, Inc. | | | 1,850 | | | | 272,468 | | | | (3,274 | ) | | | 0.4 | |
Illinois Tool Works, Inc. | | | 1,523 | | | | 302,498 | | | | (4,173 | ) | | | 0.4 | |
Kansas City Southern | | | 1,339 | | | | 235,865 | | | | (13 | ) | | | 0.3 | |
Lincoln Electric Holdings, Inc. | | | 1,708 | | | | 173,361 | | | | 547 | | | | 0.2 | |
Lockheed Martin Corp. | | | 771 | | | | 279,433 | | | | (9,483 | ) | | | 0.4 | |
ManpowerGroup, Inc. | | | 3,689 | | | | 255,426 | | | | (5,054 | ) | | | 0.4 | |
Nordson Corp. | | | 1,355 | | | | 267,951 | | | | (5,854 | ) | | | 0.4 | |
Northrop Grumman Corp. | | | 837 | | | | 252,874 | | | | (10,295 | ) | | | 0.4 | |
Old Dominion Freight Line, Inc. | | | 1,288 | | | | 244,192 | | | | 1,005 | | | | 0.4 | |
The accompanying notes are an integral part of these financial statements.
21
|
AMG FQ Long-Short Equity Fund Schedule of Portfolio Investments (continued) |
Components of over-the-counter long total return basket swap (continued)
| | | | | | | | | | | | | | |
| Reference Entity | | Shares | | | Notional Value | | | Net Unrealized Appreciation/ (Depreciation) | | % of Notional Market Value | |
Industrials (continued) | | | | | | | | | | | | | | |
Raytheon Technologies Corp. | | | 5,424 | | | | $306,619 | | | $(11,987) | | | 0.4 | |
Regal Beloit Corp. | | | 2,450 | | | | 231,133 | | | 10,560 | | | 0.4 | |
Robert Half International, Inc. | | | 4,868 | | | | 245,104 | | | 1,655 | | | 0.4 | |
Rollins, Inc. | | | 4,667 | | | | 278,433 | | | (8,447) | | | 0.4 | |
Ryder System, Inc. | | | 5,370 | | | | 271,561 | | | (7,035) | | | 0.4 | |
Schneider National, Inc., Class B | | | 4,583 | | | | 106,784 | | | (5,683) | | | 0.1 | |
Teledyne Technologies, Inc. | | | 840 | | | | 265,163 | | | (5,477) | | | 0.4 | |
Textron, Inc. | | | 6,747 | | | | 224,727 | | | 16,816 | | | 0.4 | |
The Toro Co. | | | 2,778 | | | | 231,185 | | | (3,111) | | | 0.3 | |
TransUnion | | | 3,219 | | | | 259,451 | | | (3,026) | | | 0.4 | |
Univar Solutions, Inc. | | | 15,147 | | | | 262,497 | | | (11,209) | | | 0.4 | |
Woodward, Inc. | | | 104 | | | | 8,635 | | | (362) | | | 0.0 | # |
XPO Logistics, Inc. | | | 2,912 | | | | 273,670 | | | (11,590) | | | 0.4 | |
| | | | | | | | | | | | | | |
| | | | |
Total Industrials | | | | | | | 8,702,989 | | | (186,480) | | | 12.7 | |
Information Technology | | | | | | | | | | | | | | |
2U, Inc. | | | 2,057 | | | | 76,808 | | | (1,008) | | | 0.1 | |
Alteryx, Inc., Class A | | | 1,936 | | | | 276,538 | | | (33,861) | | | 0.4 | |
Apple, Inc. | | | 7,253 | | | | 845,700 | | | (56,138) | | | 1.2 | |
Arista Networks, Inc. | | | 1,264 | | | | 266,135 | | | (2,086) | | | 0.4 | |
Aspen Technology, Inc. | | | 302 | | | | 36,316 | | | (3,153) | | | 0.0 | # |
Autodesk, Inc. | | | 1,151 | | | | 288,441 | | | (17,334) | | | 0.4 | |
Automatic Data Processing, Inc. | | | 2,036 | | | | 297,500 | | | 24,106 | | | 0.5 | |
Avnet, Inc. | | | 9,775 | | | | 254,346 | | | (13,196) | | | 0.4 | |
Black Knight, Inc. | | | 2,941 | | | | 264,749 | | | (6,088) | | | 0.4 | |
Booz Allen Hamilton Holding Corp. | | | 3,296 | | | | 255,967 | | | 2,769 | | | 0.4 | |
Cadence Design Systems, Inc. | | | 2,521 | | | | 276,907 | | | (1,185) | | | 0.4 | |
Ciena Corp. | | | 6,649 | | | | 262,901 | | | (997) | | | 0.4 | |
Cirrus Logic, Inc. | | | 3,881 | | | | 264,917 | | | 2,367 | | | 0.4 | |
Corning, Inc. | | | 8,168 | | | | 280,244 | | | (19,113) | | | 0.4 | |
Crowdstrike Holdings, Inc., Class A | | | 250 | | | | 33,538 | | | (2,577) | | | 0.0 | # |
Datadog, Inc., Class A | | | 2,507 | | | | 254,034 | | | (26,524) | | | 0.3 | |
Dolby Laboratories, Inc., Class A | | | 3,832 | | | | 273,030 | | | 14,677 | | | 0.4 | |
Dropbox, Inc., Class A | | | 13,935 | | | | 265,183 | | | (10,730) | | | 0.4 | |
DXC Technology Co. | | | 13,862 | | | | 247,437 | | | 7,901 | | | 0.4 | |
Enphase Energy, Inc. | | | 2,443 | | | | 240,953 | | | (1,319) | | | 0.3 | |
Euronet Worldwide, Inc. | | | 2,933 | | | | 259,160 | | | 1,408 | | | 0.4 | |
F5 Networks, Inc. | | | 1,403 | | | | 191,173 | | | (4,658) | | | 0.3 | |
The accompanying notes are an integral part of these financial statements.
22
|
AMG FQ Long-Short Equity Fund Schedule of Portfolio Investments (continued) |
Components of over-the-counter long total return basket swap (continued)
| | | | | | | | | | | | | | |
| Reference Entity | | Shares | | | Notional Value | | | Net Unrealized Appreciation/ (Depreciation) | | % of Notional Market Value | |
Information Technology (continued) | | | | | | | | | | | | | | |
Fair Isaac Corp. | | | 645 | | | | $261,767 | | | $(9,281) | | | 0.4 | |
Fiserv, Inc. | | | 2,884 | | | | 278,623 | | | (3,288) | | | 0.4 | |
FleetCor Technologies, Inc. | | | 35 | | | | 8,109 | | | (377) | | | 0.0 | # |
FLIR Systems, Inc. | | | 1,126 | | | | 39,421 | | | (360) | | | 0.1 | |
Gartner, Inc. | | | 1,859 | | | | 227,973 | | | (4,708) | | | 0.3 | |
GoDaddy, Inc., Class A | | | 3,600 | | | | 260,064 | | | (5,400) | | | 0.4 | |
Hewlett Packard Enterprise Co. | | | 28,875 | | | | 254,100 | | | (4,620) | | | 0.4 | |
Intuit, Inc. | | | 908 | | | | 299,885 | | | (14,156) | | | 0.4 | |
Littelfuse, Inc. | | | 1,392 | | | | 271,398 | | | 4,134 | | | 0.4 | |
Manhattan Associates, Inc. | | | 2,741 | | | | 250,445 | | | (16,090) | | | 0.3 | |
Marvell Technology Group, Ltd. (Bermuda) | | | 6,714 | | | | 278,430 | | | (26,587) | | | 0.4 | |
Mastercard, Inc., Class A | | | 360 | | | | 114,160 | | | (10,249) | | | 0.1 | |
Microsoft Corp. | | | 3,418 | | | | 728,889 | | | (36,846) | | | 1.0 | |
MongoDB, Inc. | | | 1,056 | | | | 257,675 | | | (16,410) | | | 0.4 | |
National Instruments Corp. | | | 7,567 | | | | 257,429 | | | (20,734) | | | 0.3 | |
New Relic, Inc. | | | 4,355 | | | | 271,926 | | | (7,752) | | | 0.4 | |
Nutanix, Inc., Class A | | | 200 | | | | 4,908 | | | (40) | | | 0.0 | # |
NVIDIA Corp. | | | 227 | | | | 121,643 | | | (7,834) | | | 0.2 | |
Okta, Inc. | | | 1,179 | | | | 260,948 | | | (13,558) | | | 0.4 | |
Palo Alto Networks, Inc. | | | 97 | | | | 22,459 | | | (1,004) | | | 0.0 | # |
Paycom Software, Inc. | | | 695 | | | | 265,977 | | | (12,934) | | | 0.4 | |
Pluralsight, Inc., Class A | | | 14,006 | | | | 243,144 | | | (23,250) | | | 0.3 | |
PTC, Inc. | | | 2,382 | | | | 200,707 | | | (905) | | | 0.3 | |
Pure Storage, Inc., Class A | | | 15,018 | | | | 262,214 | | | (20,424) | | | 0.4 | |
Science Applications International Corp. | | | 3,409 | | | | 254,584 | | | 5,761 | | | 0.4 | |
ServiceNow, Inc. | | | 540 | | | | 269,897 | | | (1,210) | | | 0.4 | |
SolarWinds Corp. | | | 12,590 | | | | 271,315 | | | (14,101) | | | 0.4 | |
Teradata Corp. | | | 10,639 | | | | 204,056 | | | (8,618) | | | 0.3 | |
Ubiquiti, Inc. | | | 1,375 | | | | 260,755 | | | (5,541) | | | 0.4 | |
VeriSign, Inc. | | | 1,362 | | | | 271,120 | | | (11,386) | | | 0.4 | |
Visa, Inc., Class A | | | 679 | | | | 129,051 | | | (5,670) | | | 0.2 | |
Western Digital Corp. | | | 6,732 | | | | 271,502 | | | (17,503) | | | 0.4 | |
Xilinx, Inc. | | | 2,441 | | | | 303,538 | | | (13,816) | | | 0.4 | |
Zebra Technologies Corp., Class A | | | 940 | | | | 277,375 | | | (10,754) | | | 0.4 | |
| | | | | | | | | | | | | | |
| | | | |
Total Information Technology | | | | | | | 13,667,464 | | | (482,250) | | | 19.7 | |
Materials | | | | | | | | | | | | | | |
Cabot Corp. | | | 6,789 | | | | 262,259 | | | (4,209) | | | 0.4 | |
The accompanying notes are an integral part of these financial statements.
23
|
AMG FQ Long-Short Equity Fund Schedule of Portfolio Investments (continued) |
| | | | | | | | | | | | | | | | |
| Components of over-the-counter long total return basket swap (continued) | |
| | | | |
| Reference Entity | | Shares | | | Notional Value | | | Net Unrealized Appreciation/ (Depreciation) | | | % of Notional Market Value | |
| | | | |
Materials (continued) | | | | | | | | | | | | | | | | |
| | | | |
CF Industries Holdings, Inc. | | | 8,748 | | | | $228,848 | | | | $12,684 | | | | 0.4 | |
| | | | |
The Chemours Co. | | | 1,277 | | | | 26,076 | | | | (358 | ) | | | 0.0 | # |
| | | | |
Dow, Inc. | | | 5,673 | | | | 266,177 | | | | (8,112 | ) | | | 0.4 | |
| | | | |
Ecolab, Inc. | | | 1,191 | | | | 226,016 | | | | (7,360 | ) | | | 0.3 | |
| | | | |
Freeport-McMoRan, Inc. | | | 17,611 | | | | 306,784 | | | | (1,409 | ) | | | 0.5 | |
| | | | |
The Mosaic Co. | | | 14,815 | | | | 271,855 | | | | 2,222 | | | | 0.4 | |
| | | | |
NewMarket Corp. | | | 767 | | | | 263,457 | | | | 10,891 | | | | 0.4 | |
| | | | |
Newmont Corp. | | | 4,809 | | | | 296,475 | | | | 5,723 | | | | 0.4 | |
| | | | |
Olin Corp. | | | 15,723 | | | | 261,473 | | | | (1,258 | ) | | | 0.4 | |
| | | | |
Reliance Steel & Aluminum Co. | | | 2,521 | | | | 274,512 | | | | 252 | | | | 0.4 | |
| | | | |
Royal Gold, Inc. | | | 2,251 | | | | 273,114 | | | | (5,673 | ) | | | 0.4 | |
| | | | |
Sonoco Products Co. | | | 5,140 | | | | 259,416 | | | | (8,121 | ) | | | 0.4 | |
| | | | |
Valvoline, Inc. | | | 12,006 | | | | 226,913 | | | | 9,245 | | | | 0.3 | |
| | | | |
W R Grace & Co. | | | 2,608 | | | | 119,829 | | | | (6,407 | ) | | | 0.2 | |
| | | | | | | | | | | | | | | | |
| | | | |
Total Materials | | | | | | | 3,563,204 | | | | (1,890 | ) | | | 5.3 | |
| | | | |
Real Estate | | | | | | | | | | | | | | | | |
| | | | |
Americold Realty Trust, REIT | | | 7,460 | | | | 275,423 | | | | (5,147 | ) | | | 0.4 | |
| | | | |
Apartment Investment & Management Co., Class A, REIT | | | 7,745 | | | | 247,298 | | | | (232 | ) | | | 0.4 | |
| | | | |
Camden Property Trust, REIT | | | 2,978 | | | | 265,935 | | | | 8,755 | | | | 0.4 | |
| | | | |
Crown Castle International Corp., REIT | | | 1,684 | | | | 269,760 | | | | (6,719 | ) | | | 0.4 | |
| | | | |
Duke Realty Corp., REIT | | | 7,354 | | | | 277,540 | | | | 1,838 | | | | 0.4 | |
| | | | |
Equity Commonwealth, REIT | | | 1,543 | | | | 40,704 | | | | 62 | | | | 0.0 | # |
| | | | |
Equity LifeStyle Properties, Inc., REIT | | | 4,497 | | | | 270,540 | | | | (4,362 | ) | | | 0.4 | |
| | | | |
Essex Property Trust, Inc., REIT | | | 1,240 | | | | 242,222 | | | | 11,470 | | | | 0.4 | |
| | | | |
First Industrial Realty Trust, Inc., REIT | | | 6,489 | | | | 264,816 | | | | (6,489 | ) | | | 0.4 | |
| | | | |
Gaming and Leisure Properties, Inc., REIT | | | 7,381 | | | | 282,102 | | | | (13,803 | ) | | | 0.4 | |
| | | | |
Lamar Advertising Co., Class A, REIT | | | 3,942 | | | | 255,245 | | | | (10,998 | ) | | | 0.4 | |
| | | | |
Omega Healthcare Investors, Inc., REIT | | | 399 | | | | 11,918 | | | | (423 | ) | | | 0.0 | # |
| | | | |
Outfront Media, Inc., REIT | | | 17,973 | | | | 253,419 | | | | (17,793 | ) | | | 0.3 | |
| | | | |
Rayonier, Inc., REIT | | | 9,952 | | | | 262,733 | | | | (10,151 | ) | | | 0.4 | |
| | | | |
Sun Communities, Inc., REIT | | | 1,959 | | | | 274,965 | | | | (5,348 | ) | | | 0.4 | |
| | | | |
UDR, Inc., REIT | | | 8,215 | | | | 255,404 | | | | 1,232 | | | | 0.4 | |
| | | | |
Weyerhaeuser Co., REIT | | | 10,133 | | | | 279,266 | | | | (2,736 | ) | | | 0.4 | |
| | | | | | | | | | | | | | | | |
| | | | |
Total Real Estate | | | | | | | 4,029,290 | | | | (60,844 | ) | | | 5.9 | |
| | | | |
| Utilities | | | | | | | | | | | | |
| | | | |
Ameren Corp. | | | 3,576 | | | | 301,206 | | | | (11,121 | ) | | | 0.4 | |
| | | | |
Avangrid, Inc. | | | 5,160 | | | | 260,219 | | | | (5,624 | ) | | | 0.4 | |
The accompanying notes are an integral part of these financial statements.
24
|
AMG FQ Long-Short Equity Fund Schedule of Portfolio Investments (continued) |
| | | | | | | | | | | | | | | | |
| Components of over-the-counter long total return basket swap (continued) | |
| | | | |
| Reference Entity | | Shares | | | Notional Value | | | Net Unrealized Appreciation/ (Depreciation) | | | % of Notional Market Value | |
| | | | |
Utilities (continued) | | | | | | | | | | | | | | | | |
| | | | |
DTE Energy Co. | | | 2,370 | | | | $301,393 | | | | $(8,888 | ) | | | 0.4 | |
| | | | |
Entergy Corp. | | | 2,782 | | | | 299,232 | | | | (17,638 | ) | | | 0.4 | |
| | | | |
Hawaiian Electric Industries, Inc. | | | 8,014 | | | | 276,643 | | | | (11,861 | ) | | | 0.4 | |
| | | | |
IDACORP, Inc. | | | 3,039 | | | | 277,187 | | | | (10,576 | ) | | | 0.4 | |
| | | | |
MDU Resources Group, Inc. | | | 11,563 | | | | 277,396 | | | | (2,659 | ) | | | 0.4 | |
| | | | |
NextEra Energy, Inc. | | | 2,800 | | | | 212,184 | | | | (7,196 | ) | | | 0.3 | |
| | | | |
NiSource, Inc. | | | 11,641 | | | | 282,411 | | | | (15,017 | ) | | | 0.4 | |
| | | | |
NRG Energy, Inc. | | | 8,391 | | | | 283,868 | | | | (18,544 | ) | | | 0.4 | |
| | | | |
OGE Energy Corp. | | | 8,512 | | | | 279,960 | | | | (18,045 | ) | | | 0.4 | |
| | | | |
UGI Corp. | | | 8,006 | | | | 281,251 | | | | (22,337 | ) | | | 0.4 | |
| | | | |
Vistra Corp. | | | 14,929 | | | | 283,651 | | | | (24,334 | ) | | | 0.4 | |
| | | | |
WEC Energy Group, Inc. | | | 3,092 | | | | 316,404 | | | | (5,504 | ) | | | 0.5 | |
| | | | | | | | | | | | | | | | |
| | | | |
Total Utilities | | | | | | | 3,933,005 | | | | (179,344 | ) | | | 5.6 | |
| | | | | | | | | | | | | | | | |
| | | | |
Total long equity positions | | | | | | | 69,300,035 | | | | (2,234,142 | ) | | | 100.0 | |
| | | | |
Dividend and financing | | | | | | | — | | | | 9,099 | | | | — | |
| | | | | | | | | | | | | | | | |
| | | | |
| | | Total | | | | $69,300,035 | | | | $(2,225,043 | ) | | | 100.0 | |
| | | | | | | | | | | | | | | | |
| | | | | | | | | | | | | | |
| Over-the-counter short total return basket swap | |
| | | | |
| Counterparty | | Description | | Notional | | | Termination Date | | | Value | |
Morgan Stanley & Co. | | The Fund receives or pays the total return on a portfolio of short positions and receives the 1-Month LIBOR (minus a spread). | | $ | (45,141,055 | ) | | | 7/22/22 | | | $ | 1,573,082 | |
| | | | | | | | | | | | | | | | |
| Components of over-the-counter short total return basket swap | |
| | | | |
| Reference Entity | | Shares | | | Notional Value | | | Net Unrealized Appreciation/ (Depreciation) | | | % of Notional Market Value | |
| | | | |
Communication Services | | | | | | | | | | | | | | | | |
| | | | |
Activision Blizzard, Inc. | | | (2,867 | ) | | | $(232,112 | ) | | | $14,995 | | | | 0.5 | |
| | | | |
CenturyLink, Inc. | | | (25,868 | ) | | | (231,777 | ) | | | 8,795 | | | | 0.5 | |
| | | | |
Discovery, Inc., Class A | | | (12,070 | ) | | | (242,607 | ) | | | (1,690 | ) | | | 0.5 | |
| | | | |
DISH Network Corp., Class A | | | (8,617 | ) | | | (224,042 | ) | | | 4,395 | | | | 0.5 | |
| | | | |
Fox Corp., Class A | | | (9,421 | ) | | | (246,689 | ) | | | (3,156 | ) | | | 0.6 | |
| | | | |
Liberty Media Corp-Liberty Formula One, Class C | | | (1,106 | ) | | | (39,816 | ) | | | (144 | ) | | | 0.1 | |
| | | | |
ViacomCBS, Inc., Class B | | | (8,952 | ) | | | (252,536 | ) | | | (3,223 | ) | | | 0.6 | |
| | | | |
World Wrestling Entertainment, Inc., Class A | | | (1,107 | ) | | | (41,491 | ) | | | 1,240 | | | | 0.1 | |
| | | | | | | | | | | | | | | | |
| | | | |
Total Communication Services | | | | | | | (1,511,070 | ) | | | 21,212 | | | | 3.4 | |
The accompanying notes are an integral part of these financial statements.
25
|
AMG FQ Long-Short Equity Fund Schedule of Portfolio Investments (continued) |
| | | | | | | | | | | | | | | | |
| Components of over-the-counter short total return basket swap (continued) | |
| | | | |
| Reference Entity | | Shares | | | Notional Value | | | Net Unrealized Appreciation/ (Depreciation) | | | % of Notional Market Value | |
| | | | |
Consumer Discretionary | | | | | | | | | | | | | | | | |
| | | | |
Advance Auto Parts, Inc. | | | (1,108 | ) | | | $(166,721 | ) | | | $3,535 | | | | 0.4 | |
| | | | |
Aptiv PLC (Jersey) | | | (2,572 | ) | | | (251,902 | ) | | | 3,729 | | | | 0.6 | |
| | | | |
BorgWarner, Inc. | | | (6,552 | ) | | | (245,962 | ) | | | 16,773 | | | | 0.5 | |
| | | | |
Dollar General Corp. | | | (508 | ) | | | (108,565 | ) | | | 2,540 | | | | 0.2 | |
| | | | |
Floor & Decor Holdings, Inc., Class A | | | (3,306 | ) | | | (259,951 | ) | | | 18,613 | | | | 0.6 | |
| | | | |
Ford Motor Co. | | | (31,366 | ) | | | (251,242 | ) | | | 8,782 | | | | 0.6 | |
| | | | |
General Motors Co. | | | (6,850 | ) | | | (243,517 | ) | | | 6,987 | | | | 0.5 | |
| | | | |
Harley-Davidson, Inc. | | | (3,873 | ) | | | (137,104 | ) | | | 9,760 | | | | 0.3 | |
| | | | |
Hasbro, Inc. | | | (2,632 | ) | | | (221,088 | ) | | | 3,369 | | | | 0.5 | |
| | | | |
Hyatt Hotels Corp., Class A | | | (508 | ) | | | (27,711 | ) | | | (300 | ) | | | 0.1 | |
| | | | |
Lear Corp. | | | (2,039 | ) | | | (265,784 | ) | | | 19,452 | | | | 0.6 | |
| | | | |
Leggett & Platt, Inc. | | | (6,044 | ) | | | (253,908 | ) | | | 1,692 | | | | 0.6 | |
| | | | |
Lululemon Athletica, Inc. | | | (749 | ) | | | (250,024 | ) | | | 10,875 | | | | 0.5 | |
| | | | |
Mohawk Industries, Inc. | | | (1,341 | ) | | | (130,506 | ) | | | (7,872 | ) | | | 0.3 | |
| | | | |
Newell Brands, Inc. | | | (15,216 | ) | | | (261,563 | ) | | | (7,152 | ) | | | 0.6 | |
| | | | |
NIKE, Inc., Class B | | | (1,384 | ) | | | (178,231 | ) | | | 12,041 | | | | 0.4 | |
| | | | |
Penske Automotive Group, Inc. | | | (4,797 | ) | | | (258,127 | ) | | | 12,712 | | | | 0.6 | |
| | | | |
Ralph Lauren Corp. | | | (3,503 | ) | | | (266,543 | ) | | | 32,368 | | | | 0.5 | |
| | | | |
Target Corp. | | | (1,370 | ) | | | (215,131 | ) | | | 6,590 | | | | 0.5 | |
| | | | |
Thor Industries, Inc. | | | (2,656 | ) | | | (231,789 | ) | | | 7,145 | | | | 0.5 | |
| | | | |
Whirlpool Corp. | | | (1,352 | ) | | | (264,749 | ) | | | 14,683 | | | | 0.6 | |
| | | | |
Williams-Sonoma, Inc. | | | (1,009 | ) | | | (97,035 | ) | | | 5,005 | | | | 0.2 | |
| | | | |
Wyndham Hotels & Resorts, Inc. | | | (183 | ) | | | (8,764 | ) | | | 253 | | | | 0.0 | # |
| | | | |
Wynn Resorts, Ltd. | | | (259 | ) | | | (18,604 | ) | | | (155 | ) | | | 0.0 | # |
| | | | | | | | | | | | | | | | |
| | | | |
Total Consumer Discretionary | | | | | | | (4,614,521 | ) | | | 181,425 | | | | 10.2 | |
| | | | |
Consumer Staples | | | | | | | | | | | | | | | | |
| | | | |
Archer-Daniels-Midland Co. | | | (4,750 | ) | | | (242,298 | ) | | | 22,658 | | | | 0.5 | |
| | | | |
The Boston Beer Co., Inc., Class A | | | (7 | ) | | | (7,350 | ) | | | 76 | | | | 0.0 | # |
| | | | |
Campbell Soup Co. | | | (5,329 | ) | | | (257,071 | ) | | | 8,367 | | | | 0.6 | |
| | | | |
The Clorox Co. | | | (1,139 | ) | | | (243,951 | ) | | | 7,893 | | | | 0.5 | |
| | | | |
Constellation Brands, Inc., Class A | | | (1,241 | ) | | | (213,651 | ) | | | 8,600 | | | | 0.5 | |
| | | | |
Coty, Inc., Class A | | | (76,567 | ) | | | (235,826 | ) | | | 13,782 | | | | 0.5 | |
| | | | |
The Estee Lauder Cos., Inc., Class A | | | (21 | ) | | | (4,852 | ) | | | 239 | | | | 0.0 | # |
| | | | |
General Mills, Inc. | | | (3,767 | ) | | | (230,239 | ) | | | 7,534 | | | | 0.5 | |
| | | | |
Grocery Outlet Holding Corp. | | | (5,584 | ) | | | (246,645 | ) | | | 838 | | | | 0.6 | |
| | | | |
Hormel Foods Corp. | | | (5,166 | ) | | | (256,079 | ) | | | 4,546 | | | | 0.6 | |
| | | | |
The JM Smucker Co. | | | (2,200 | ) | | | (248,820 | ) | | | 1,980 | | | | 0.6 | |
The accompanying notes are an integral part of these financial statements.
26
|
AMG FQ Long-Short Equity Fund Schedule of Portfolio Investments (continued) |
| | | | | | | | | | | | | | | | |
| Components of over-the-counter short total return basket swap (continued) | |
| | | | |
| Reference Entity | | Shares | | | Notional Value | | | Net Unrealized Appreciation/ (Depreciation) | | | % of Notional Market Value | |
| | | | |
Consumer Staples (continued) | | | | | | | | | | | | | | | | |
| | | | |
Kellogg Co. | | | (3,844 | ) | | | $(249,591 | ) | | | $7,842 | | | | 0.5 | |
| | | | |
The Kraft Heinz Co. | | | (6,680 | ) | | | (204,942 | ) | | | 601 | | | | 0.5 | |
| | | | |
The Kroger Co. | | | (7,215 | ) | | | (233,333 | ) | | | 938 | | | | 0.5 | |
| | | | |
Molson Coors Beverage Co., Class B | | | (290 | ) | | | (9,805 | ) | | | (421 | ) | | | 0.0 | # |
| | | | |
Seaboard Corp. | | | (79 | ) | | | (267,546 | ) | | | (4,609 | ) | | | 0.6 | |
| | | | |
TreeHouse Foods, Inc. | | | (6,570 | ) | | | (267,202 | ) | | | 12,023 | | | | 0.6 | |
| | | | | | | | | | | | | | | | |
| | | | |
Total Consumer Staples | | | | | | | (3,419,201 | ) | | | 92,887 | | | | 7.6 | |
| | | | |
Energy | | | | | | | | | | | | | | | | |
| | | | |
Cabot Oil & Gas Corp. | | | (6,473 | ) | | | (124,282 | ) | | | 9,127 | | | | 0.3 | |
| | | | |
Cheniere Energy, Inc. | | | (2,463 | ) | | | (117,953 | ) | | | 49 | | | | 0.3 | |
| | | | |
Diamondback Energy, Inc. | | | (734 | ) | | | (19,502 | ) | | | 448 | | | | 0.0 | # |
| | | | |
EQT Corp. | | | (8,400 | ) | | | (131,040 | ) | | | 3,864 | | | | 0.3 | |
| | | | |
Equitrans Midstream Corp. | | | (14,311 | ) | | | (112,055 | ) | | | 8,157 | | | | 0.2 | |
| | | | |
Halliburton Co. | | | (7,667 | ) | | | (97,448 | ) | | | 4,984 | | | | 0.2 | |
| | | | |
Hess Corp. | | | (2,355 | ) | | | (88,077 | ) | | | 424 | | | | 0.2 | |
| | | | |
Kinder Morgan, Inc. | | | (6,994 | ) | | | (85,117 | ) | | | 1,888 | | | | 0.2 | |
| | | | |
Marathon Oil Corp. | | | (22,849 | ) | | | (94,366 | ) | | | 3,884 | | | | 0.2 | |
| | | | |
ONEOK, Inc. | | | (4,051 | ) | | | (119,343 | ) | | | 1,864 | | | | 0.3 | |
| | | | |
Schlumberger, N.V. (Curaçao) | | | (1,056 | ) | | | (15,935 | ) | | | 158 | | | | 0.0 | # |
| | | | | | | | | | | | | | | | |
| | | | |
Total Energy | | | | | | | (1,005,118 | ) | | | 34,847 | | | | 2.2 | |
| | | | |
| Financials | | | | | | | | | | | | |
| | | | |
The Allstate Corp. | | | (2,727 | ) | | | (247,012 | ) | | | 4,990 | | | | 0.6 | |
| | | | |
Ally Financial, Inc. | | | (8,630 | ) | | | (235,513 | ) | | | 5,264 | | | | 0.5 | |
| | | | |
American International Group, Inc. | | | (7,261 | ) | | | (226,253 | ) | | | (2,396 | ) | | | 0.5 | |
| | | | |
American National Group, Inc. | | | (3,755 | ) | | | (266,980 | ) | | | 8,637 | | | | 0.6 | |
| | | | |
Aon PLC, Class A (Ireland) | | | (1,168 | ) | | | (232,993 | ) | | | 18,069 | | | | 0.5 | |
| | | | |
Arch Capital Group, Ltd. (Bermuda) | | | (8,690 | ) | | | (262,872 | ) | | | 348 | | | | 0.6 | |
| | | | |
Assured Guaranty, Ltd. (Bermuda) | | | (9,694 | ) | | | (266,876 | ) | | | 19,388 | | | | 0.6 | |
| | | | |
BlackRock, Inc. | | | (345 | ) | | | (212,013 | ) | | | 5,285 | | | | 0.5 | |
| | | | |
BOK Financial Corp. | | | (4,478 | ) | | | (269,531 | ) | | | 6,493 | | | | 0.6 | |
| | | | |
Brown & Brown, Inc. | | | (5,692 | ) | | | (268,947 | ) | | | 21,288 | | | | 0.6 | |
| | | | |
Credit Acceptance Corp. | | | (700 | ) | | | (227,206 | ) | | | 18,522 | | | | 0.5 | |
| | | | |
First Hawaiian, Inc. | | | (320 | ) | | | (5,667 | ) | | | 144 | | | | 0.0 | # |
| | | | |
First Republic Bank | | | (1,654 | ) | | | (212,010 | ) | | | 3,374 | | | | 0.5 | |
| | | | |
Lazard, Ltd., Class A (Bermuda) | | | (315 | ) | | | (10,956 | ) | | | 350 | | | | 0.0 | # |
| | | | |
Marsh & McLennan Cos., Inc. | | | (2,071 | ) | | | (228,659 | ) | | | 14,394 | | | | 0.5 | |
| | | | |
MetLife, Inc. | | | (6,427 | ) | | | (252,710 | ) | | | 9,448 | | | | 0.6 | |
The accompanying notes are an integral part of these financial statements.
27
|
AMG FQ Long-Short Equity Fund Schedule of Portfolio Investments (continued) |
| | | | | | | | | | | | | | | | |
| Components of over-the-counter short total return basket swap (continued) | |
| | | | |
| Reference Entity | | Shares | | | Notional Value | | | Net Unrealized Appreciation/ (Depreciation) | | | % of Notional Market Value | |
| | | | |
Financials (continued) | | | | | | | | | | | | | | | | |
| | | | |
The Progressive Corp. | | | (2,458 | ) | | | $(230,560 | ) | | | $4,670 | | | | 0.5 | |
| | | | |
Raymond James Financial, Inc. | | | (3,128 | ) | | | (244,735 | ) | | | 5,630 | | | | 0.5 | |
| | | | |
Reinsurance Group of America, Inc. | | | (2,227 | ) | | | (222,433 | ) | | | (2,539 | ) | | | 0.5 | |
| | | | |
Signature Bank | | | (2,711 | ) | | | (215,850 | ) | | | (3,036 | ) | | | 0.5 | |
| | | | |
SLM Corp. | | | (28,468 | ) | | | (267,599 | ) | | | 5,978 | | | | 0.6 | |
| | | | |
TFS Financial Corp. | | | (14,781 | ) | | | (234,574 | ) | | | 2,365 | | | | 0.5 | |
| | | | |
Tradeweb Markets, Inc., Class A | | | (4,551 | ) | | | (270,921 | ) | | | 22,983 | | | | 0.6 | |
| | | | |
Voya Financial, Inc. | | | (1,016 | ) | | | (49,774 | ) | | | 1,077 | | | | 0.1 | |
| | | | |
Western Alliance Bancorp | | | (5,376 | ) | | | (215,405 | ) | | | (6,086 | ) | | | 0.5 | |
| | | | |
White Mountains Insurance Group, Ltd. (Bermuda) | | | (235 | ) | | | (223,562 | ) | | | 10,105 | | | | 0.5 | |
| | | | | | | | | | | | | | | | |
| | | | |
Total Financials | | | | | | | (5,601,611 | ) | | | 174,745 | | | | 12.5 | |
| | | | |
Health Care | | | | | | | | | | | | | | | | |
| | | | |
Abbott Laboratories | | | (1,389 | ) | | | (151,568 | ) | | | 5,570 | | | | 0.3 | |
| | | | |
Acadia Healthcare Co., Inc. | | | (8,294 | ) | | | (250,728 | ) | | | (44,953 | ) | | | 0.7 | |
| | | | |
Agilent Technologies, Inc. | | | (2,413 | ) | | | (254,065 | ) | | | 7,722 | | | | 0.6 | |
| | | | |
Alnylam Pharmaceuticals, Inc. | | | (1,868 | ) | | | (236,900 | ) | | | 7,192 | | | | 0.5 | |
| | | | |
Becton Dickinson and Co. | | | (953 | ) | | | (231,541 | ) | | | 11,274 | | | | 0.5 | |
| | | | |
Bio-Rad Laboratories, Inc., Class A | | | (449 | ) | | | (261,390 | ) | | | (1,913 | ) | | | 0.6 | |
| | | | |
Catalent, Inc. | | | (2,885 | ) | | | (265,103 | ) | | | 11,886 | | | | 0.6 | |
| | | | |
Cerner Corp. | | | (2,889 | ) | | | (210,637 | ) | | | 8,147 | | | | 0.5 | |
| | | | |
Change Healthcare, Inc. | | | (18,166 | ) | | | (268,675 | ) | | | 11,626 | | | | 0.6 | |
| | | | |
Charles River Laboratories International, Inc. | | | (433 | ) | | | (99,270 | ) | | | 676 | | | | 0.2 | |
| | | | |
The Cooper Cos., Inc. | | | (748 | ) | | | (261,112 | ) | | | 22,462 | | | | 0.5 | |
| | | | |
CVS Health Corp. | | | (3,737 | ) | | | (220,931 | ) | | | 11,323 | | | | 0.5 | |
| | | | |
Danaher Corp. | | | (768 | ) | | | (181,117 | ) | | | 4,831 | | | | 0.4 | |
| | | | |
Gilead Sciences, Inc. | | | (3,359 | ) | | | (201,574 | ) | | | 6,248 | | | | 0.4 | |
| | | | |
Global Blood Therapeutics, Inc. | | | (3,973 | ) | | | (225,070 | ) | | | 14,978 | | | | 0.5 | |
| | | | |
HCA Healthcare, Inc. | | | (1,847 | ) | | | (249,253 | ) | | | 20,335 | | | | 0.5 | |
| | | | |
Masimo Corp. | | | (1,076 | ) | | | (266,827 | ) | | | 25,996 | | | | 0.6 | |
| | | | |
Moderna, Inc. | | | (3,550 | ) | | | (250,878 | ) | | | 11,360 | | | | 0.6 | |
| | | | |
PerkinElmer, Inc. | | | (1,705 | ) | | | (216,671 | ) | | | (4,211 | ) | | | 0.5 | |
| | | | |
Pfizer, Inc. | | | (2,773 | ) | | | (102,878 | ) | | | 4,492 | | | | 0.2 | |
| | | | |
Quidel Corp. | | | (1,014 | ) | | | (271,194 | ) | | | (852 | ) | | | 0.6 | |
| | | | |
Repligen Corp. | | | (1,499 | ) | | | (267,481 | ) | | | 17,793 | | | | 0.6 | |
| | | | |
Sage Therapeutics, Inc. | | | (3,915 | ) | | | (277,182 | ) | | | (10,101 | ) | | | 0.7 | |
| | | | |
Seagen, Inc. | | | (1,276 | ) | | | (251,270 | ) | | | 38,433 | | | | 0.5 | |
| | | | |
Thermo Fisher Scientific, Inc. | | | (320 | ) | | | (155,200 | ) | | | 3,802 | | | | 0.3 | |
The accompanying notes are an integral part of these financial statements.
28
|
AMG FQ Long-Short Equity Fund Schedule of Portfolio Investments (continued) |
| | | | | | | | |
Components of over-the-counter short total return basket swap (continued) |
| | | | | | | | | | | | | | | | |
| Reference Entity | | Shares | | | Notional Value | | | Net Unrealized
Appreciation/
(Depreciation) | | | % of Notional
Market Value | |
Health Care (continued) | | | | | | | | | | | | | | | | |
Veeva Systems, Inc., Class A | | | (830 | ) | | $ | (250,950 | ) | | $ | 26,809 | | | | 0.5 | |
West Pharmaceutical Services, Inc. | | | (894 | ) | | | (255,747 | ) | | | 12,516 | | | | 0.6 | |
Zimmer Biomet Holdings, Inc. | | | (1,371 | ) | | | (190,021 | ) | | | 8,912 | | | | 0.4 | |
| | | | | | | | | | | | | | | | |
Total Health Care | | | | | | | (6,325,233 | ) | | | 232,353 | | | | 14.0 | |
Industrials | | | | | | | | | | | | | | | | |
Acuity Brands, Inc. | | | (2,074 | ) | | | (190,290 | ) | | | 5,413 | | | | 0.4 | |
AECOM | | | (4,913 | ) | | | (217,793 | ) | | | (2,506 | ) | | | 0.5 | |
Caterpillar, Inc. | | | (409 | ) | | | (64,585 | ) | | | 352 | | | | 0.1 | |
CH Robinson Worldwide, Inc. | | | (871 | ) | | | (87,126 | ) | | | 10,104 | | | | 0.2 | |
Colfax Corp. | | | (8,417 | ) | | | (248,722 | ) | | | 19,864 | | | | 0.5 | |
Copart, Inc. | | | (2,240 | ) | | | (251,104 | ) | | | 3,898 | | | | 0.6 | |
Cummins, Inc. | | | (1,134 | ) | | | (261,863 | ) | | | 12,508 | | | | 0.6 | |
Equifax, Inc. | | | (1,643 | ) | | | (242,852 | ) | | | 18,418 | | | | 0.5 | |
Expeditors International of Washington, Inc. | | | (2,297 | ) | | | (217,273 | ) | | | 14,287 | | | | 0.5 | |
FedEx Corp. | | | (830 | ) | | | (227,760 | ) | | | 12,400 | | | | 0.5 | |
Flowserve Corp. | | | (8,989 | ) | | | (267,603 | ) | | | 5,843 | | | | 0.6 | |
General Dynamics Corp. | | | (1,761 | ) | | | (237,506 | ) | | | 6,234 | | | | 0.5 | |
General Electric Co. | | | (31,653 | ) | | | (232,966 | ) | | | (1,899 | ) | | | 0.5 | |
Graco, Inc. | | | (3,527 | ) | | | (221,637 | ) | | | 3,315 | | | | 0.5 | |
IAA, Inc. | | | (4,715 | ) | | | (267,293 | ) | | | 472 | | | | 0.6 | |
Ingersoll Rand, Inc. | | | (7,182 | ) | | | (262,143 | ) | | | 11,204 | | | | 0.6 | |
L3Harris Technologies, Inc. | | | (1,399 | ) | | | (232,598 | ) | | | 7,205 | | | | 0.5 | |
Lyft, Inc., Class A | | | (712 | ) | | | (16,333 | ) | | | 78 | | | | 0.0 | # |
The Middleby Corp. | | | (2,255 | ) | | | (232,784 | ) | | | 8,321 | | | | 0.5 | |
Nielsen Holdings PLC (United Kingdom) | | | (18,890 | ) | | | (271,638 | ) | | | 16,434 | | | | 0.6 | |
Oshkosh Corp. | | | (3,374 | ) | | | (247,854 | ) | | | 20,581 | | | | 0.5 | |
PACCAR, Inc. | | | (2,757 | ) | | | (250,225 | ) | | | 14,833 | | | | 0.5 | |
Quanta Services, Inc. | | | (4,270 | ) | | | (259,488 | ) | | | (7,088 | ) | | | 0.6 | |
Rockwell Automation, Inc. | | | (1,050 | ) | | | (248,724 | ) | | | (252 | ) | | | 0.6 | |
Spirit AeroSystems Holdings, Inc., Class A | | | (11,588 | ) | | | (217,623 | ) | | | 6,837 | | | | 0.5 | |
Stanley Black & Decker, Inc. | | | (1,465 | ) | | | (243,644 | ) | | | 161 | | | | 0.6 | |
Stericycle, Inc. | | | (4,033 | ) | | | (265,775 | ) | | | 14,519 | | | | 0.6 | |
The Timken Co. | | | (3,960 | ) | | | (231,066 | ) | | | (5,346 | ) | | | 0.5 | |
Trex Co., Inc. | | | (3,475 | ) | | | (254,023 | ) | | | 12,371 | | | | 0.6 | |
United Parcel Service, Inc., Class B | | | (1,132 | ) | | | (193,391 | ) | | | 15,542 | | | | 0.4 | |
Valmont Industries, Inc. | | | (1,840 | ) | | | (268,346 | ) | | | 7,158 | | | | 0.6 | |
Virgin Galactic Holdings, Inc. | | | (631 | ) | | | (11,541 | ) | | | 549 | | | | 0.0 | # |
The accompanying notes are an integral part of these financial statements.
29
|
AMG FQ Long-Short Equity Fund Schedule of Portfolio Investments (continued) |
| | | | | | | | |
Components of over-the-counter short total return basket swap (continued) |
| | | | | | | | | | | | | | | | |
| Reference Entity | | Shares | | | Notional Value | | | Net Unrealized
Appreciation/
(Depreciation) | | | % of Notional
Market Value | |
Industrials (continued) | | | | | | | | | | | | | | | | |
Wabtec Corp. | | | (4,033 | ) | | | $(236,374 | ) | | | $(2,783 | ) | | | 0.6 | |
| | | | | | | | | | | | | | | | |
Total Industrials | | | | | | | (7,179,943 | ) | | | 229,027 | | | | 15.9 | |
Information Technology | | | | | | | | | | | | | | | | |
Advanced Micro Devices, Inc. | | | (2,666 | ) | | | (210,294 | ) | | | 9,571 | | | | 0.5 | |
Akamai Technologies, Inc. | | | (2,399 | ) | | | (255,997 | ) | | | 27,804 | | | | 0.5 | |
Amphenol Corp., Class A | | | (2,204 | ) | | | (256,458 | ) | | | 7,758 | | | | 0.6 | |
ANSYS, Inc. | | | (772 | ) | | | (248,715 | ) | | | 13,742 | | | | 0.5 | |
Atlassian Corp. PLC, Class A (United Kingdom) | | | (1,161 | ) | | | (247,305 | ) | | | 24,834 | | | | 0.5 | |
Broadridge Financial Solutions, Inc. | | | (34 | ) | | | (4,760 | ) | | | 81 | | | | 0.0 | # |
Coupa Software, Inc. | | | (876 | ) | | | (255,818 | ) | | | 21,313 | | | | 0.5 | |
Cree, Inc. | | | (3,679 | ) | | | (250,172 | ) | | | 16,188 | | | | 0.5 | |
Dell Technologies, Inc., Class C | | | (3,840 | ) | | | (244,109 | ) | | | 12,710 | | | | 0.5 | |
DocuSign, Inc. | | | (1,104 | ) | | | (245,292 | ) | | | 22,008 | | | | 0.5 | |
EchoStar Corp., Class A | | | (10,119 | ) | | | (245,588 | ) | | | 11,232 | | | | 0.5 | |
Elastic, N.V. | | | (2,231 | ) | | | (240,725 | ) | | | 14,479 | | | | 0.5 | |
EPAM Systems, Inc. | | | (775 | ) | | | (253,254 | ) | | | 13,818 | | | | 0.6 | |
Fidelity National Information Services, Inc. | | | (1,600 | ) | | | (220,576 | ) | | | 21,232 | | | | 0.5 | |
First Solar, Inc. | | | (3,192 | ) | | | (265,319 | ) | | | (12,529 | ) | | | 0.6 | |
Globant, S.A. (Luxembourg) | | | (1,385 | ) | | | (257,998 | ) | | | 7,853 | | | | 0.6 | |
HP, Inc. | | | (13,474 | ) | | | (242,262 | ) | | | 269 | | | | 0.6 | |
HubSpot, Inc. | | | (223 | ) | | | (67,917 | ) | | | 3,231 | | | | 0.1 | |
Inphi Corp. | | | (667 | ) | | | (79,073 | ) | | | (14,147 | ) | | | 0.2 | |
Intel Corp. | | | (568 | ) | | | (25,924 | ) | | | 772 | | | | 0.1 | |
International Business Machines Corp. | | | (1,754 | ) | | | (193,922 | ) | | | (1,929 | ) | | | 0.5 | |
Jabil, Inc. | | | (4,180 | ) | | | (139,696 | ) | | | 1,170 | | | | 0.3 | |
Lam Research Corp. | | | (685 | ) | | | (235,524 | ) | | | 1,199 | | | | 0.5 | |
Leidos Holdings, Inc. | | | (2,983 | ) | | | (246,694 | ) | | | (895 | ) | | | 0.6 | |
Lumentum Holdings, Inc. | | | (2,701 | ) | | | (223,211 | ) | | | (135 | ) | | | 0.5 | |
Motorola Solutions, Inc. | | | (1,499 | ) | | | (257,888 | ) | | | 20,956 | | | | 0.5 | |
PayPal Holdings, Inc. | | | (796 | ) | | | (157,974 | ) | | | 9,815 | | | | 0.3 | |
Pegasystems, Inc. | | | (2,075 | ) | | | (270,580 | ) | | | 30,129 | | | | 0.6 | |
Qorvo, Inc. | | | (1,763 | ) | | | (231,447 | ) | | | 6,911 | | | | 0.5 | |
salesforce.com, Inc. | | | (34 | ) | | | (8,510 | ) | | | 613 | | | | 0.0 | # |
SolarEdge Technologies, Inc. | | | (869 | ) | | | (227,539 | ) | | | 3,606 | | | | 0.5 | |
Splunk, Inc. | | | (1,225 | ) | | | (258,659 | ) | | | 16,060 | | | | 0.6 | |
SYNNEX Corp. | | | (1,824 | ) | | | (250,618 | ) | | | 10,506 | | | | 0.6 | |
Synopsys, Inc. | | | (1,152 | ) | | | (256,792 | ) | | | 10,426 | | | | 0.6 | |
The accompanying notes are an integral part of these financial statements.
30
|
AMG FQ Long-Short Equity Fund Schedule of Portfolio Investments (continued) |
| | | | | | | | |
Components of over-the-counter short total return basket swap (continued) |
| | | | | | | | | | | | | | | | |
| Reference Entity | | Shares | | | Notional Value | | | Net Unrealized
Appreciation/
(Depreciation) | | | % of Notional
Market Value | |
Information Technology (continued) | | | | | | | | | | | | | | | | |
Teradyne, Inc. | | | (2,954 | ) | | | $(265,358 | ) | | | $5,849 | | | | 0.6 | |
The Trade Desk, Inc., Class A | | | (426 | ) | | | (261,291 | ) | | | 19,984 | | | | 0.6 | |
Tyler Technologies, Inc. | | | (662 | ) | | | (265,409 | ) | | | 10,950 | | | | 0.6 | |
The Western Union Co. | | | (12,460 | ) | | | (259,791 | ) | | | 17,569 | | | | 0.6 | |
Xerox Holdings Corp. | | | (13,766 | ) | | | (254,946 | ) | | | 15,693 | | | | 0.5 | |
Zscaler, Inc. | | | (1,677 | ) | | | (249,269 | ) | | | 21,617 | | | | 0.5 | |
| | | | | | | | | | | | | | | | |
Total Information Technology | | | | | | | (8,632,674 | ) | | | 402,313 | | | | 18.9 | |
Materials | | | | | | | | | | | | | | | | |
Air Products and Chemicals, Inc. | | | (615 | ) | | | (174,352 | ) | | | 4,465 | | | | 0.4 | |
Ashland Global Holdings, Inc. | | | (3,597 | ) | | | (256,970 | ) | | | 6,007 | | | | 0.6 | |
Ball Corp. | | | (2,585 | ) | | | (237,174 | ) | | | 7,109 | | | | 0.5 | |
Celanese Corp. | | | (2,186 | ) | | | (245,072 | ) | | | (3,061 | ) | | | 0.6 | |
DuPont de Nemours, Inc. | | | (3,600 | ) | | | (209,160 | ) | | | 4,392 | | | | 0.5 | |
Eastman Chemical Co. | | | (798 | ) | | | (65,795 | ) | | | 1,285 | | | | 0.1 | |
Graphic Packaging Holding Co. | | | (10,116 | ) | | | (139,297 | ) | | | 4,856 | | | | 0.3 | |
International Paper Co. | | | (5,440 | ) | | | (241,373 | ) | | | 3,373 | | | | 0.5 | |
Marrone Bio Innovations, Inc. | | | (66,689 | ) | | | (78,693 | ) | | | 5,335 | | | | 0.2 | |
Nucor Corp. | | | (98 | ) | | | (4,726 | ) | | | 45 | | | | 0.0 | # |
PPG Industries, Inc. | | | (1,737 | ) | | | (221,276 | ) | | | (4,047 | ) | | | 0.5 | |
Sealed Air Corp. | | | (6,449 | ) | | | (261,829 | ) | | | 6,513 | | | | 0.6 | |
Steel Dynamics, Inc. | | | (159 | ) | | | (4,993 | ) | | | (13 | ) | | | 0.0 | # |
Westlake Chemical Corp. | | | (3,822 | ) | | | (266,355 | ) | | | 7,911 | | | | 0.6 | |
Westrock Co. | | | (4,245 | ) | | | (162,584 | ) | | | 3,184 | | | | 0.4 | |
| | | | | | | | | | | | | | | | |
Total Materials | | | | | | | (2,569,649 | ) | | | 47,354 | | | | 5.8 | |
Real Estate | | | | | | | | | | | | | | | | |
American Campus Communities, Inc., REIT | | | (247 | ) | | | (9,282 | ) | | | 30 | | | | 0.0 | # |
American Homes 4 Rent, Class A, REIT | | | (836 | ) | | | (24,085 | ) | | | 451 | | | | 0.1 | |
CoreSite Realty Corp., REIT | | | (38 | ) | | | (4,611 | ) | | | 75 | | | | 0.0 | # |
CyrusOne, Inc., REIT | | | (240 | ) | | | (18,266 | ) | | | 1,214 | | | | 0.0 | # |
Digital Realty Trust, Inc., REIT | | | (1,464 | ) | | | (224,241 | ) | | | 12,986 | | | | 0.5 | |
EPR Properties, REIT | | | (9,040 | ) | | | (222,377 | ) | | | 6,863 | | | | 0.5 | |
Equinix, Inc., REIT | | | (227 | ) | | | (176,788 | ) | | | 10,796 | | | | 0.4 | |
Equity Residential, REIT | | | (117 | ) | | | (5,814 | ) | | | 317 | | | | 0.0 | # |
Federal Realty Investment Trust, REIT | | | (118 | ) | | | (8,285 | ) | | | 169 | | | | 0.0 | # |
Healthcare Trust of America, Inc., Class A, REIT | | | (10,218 | ) | | | (252,283 | ) | | | 3,985 | | | | 0.6 | |
The Howard Hughes Corp. | | | (3,528 | ) | | | (217,868 | ) | | | (1,539 | ) | | | 0.5 | |
Iron Mountain, Inc., REIT | | | (9,164 | ) | | | (247,611 | ) | | | 8,797 | | | | 0.5 | |
The accompanying notes are an integral part of these financial statements.
31
|
AMG FQ Long-Short Equity Fund Schedule of Portfolio Investments (continued) |
| | | | | | | | | | | | | | | | |
Components of over-the-counter short total return basket swap (continued) | |
| Reference Entity | | Shares | | | Notional Value | | | Net Unrealized
Appreciation/
(Depreciation) | | | % of Notional
Market Value | |
Real Estate (continued) | | | | | | | | | | | | | | | | |
Jones Lang LaSalle, Inc. | | | (2,397 | ) | | | $(263,358 | ) | | | $(7,167 | ) | | | 0.6 | |
Public Storage, REIT | | | (505 | ) | | | (119,806 | ) | | | 4,126 | | | | 0.3 | |
Rexford Industrial Realty, Inc., REIT | | | (189 | ) | | | (9,015 | ) | | | 234 | | | | 0.0 | # |
STORE Capital Corp., REIT | | | (9,342 | ) | | | (251,767 | ) | | | 11,678 | | | | 0.6 | |
Stratus Properties, Inc. | | | (3,450 | ) | | | (75,900 | ) | | | 2,174 | | | | 0.2 | |
VEREIT, Inc., REIT | | | (14,213 | ) | | | (92,242 | ) | | | 4,122 | | | | 0.2 | |
Total Real Estate | | | | | | | (2,223,599 | ) | | | 59,311 | | | | 5.0 | |
Utilities | | | | | | | | | | | | | | | | |
American Electric Power Co., Inc. | | | (2,204 | ) | | | (205,148 | ) | | | 6,943 | | | | 0.5 | |
Atmos Energy Corp. | | | (2,614 | ) | | | (255,283 | ) | | | 15,658 | | | | 0.5 | |
Edison International | | | (3,581 | ) | | | (207,018 | ) | | | 6,338 | | | | 0.5 | |
Essential Utilities, Inc. | | | (5,841 | ) | | | (257,530 | ) | | | 16,881 | | | | 0.5 | |
FirstEnergy Corp. | | | (7,263 | ) | | | (242,512 | ) | | | 26,655 | | | | 0.5 | |
PG&E Corp. | | | (20,872 | ) | | | (206,841 | ) | | | 7,305 | | | | 0.5 | |
PPL Corp. | | | (8,232 | ) | | | (237,987 | ) | | | 11,607 | | | | 0.5 | |
Public Service Enterprise Group, Inc. | | | (3,688 | ) | | | (224,820 | ) | | | 10,363 | | | | 0.5 | |
Sempra Energy | | | (1,688 | ) | | | (221,297 | ) | | | 9,689 | | | | 0.5 | |
| | | | | | | | | | | | | | | | |
Total Utilities | | | | | | | (2,058,436 | ) | | | 111,439 | | | | 4.5 | |
| | | | | | | | | | | | | | | | |
Total short equity positions | | | | | | | (45,141,055 | ) | | | 1,586,913 | | | | 100.0 | |
Dividend and financing | | | | | | | — | | | | (13,831 | ) | | | — | |
| | | | | | | | | | | | | | | | |
| | | Total | | | | $(45,141,055 | ) | | | $1,573,082 | | | | 100.0 | |
| | | | | | | | | | | | | | | | |
| | | | | | | | | | | | | | |
Over-the-counter short total return basket swap warrants | |
| Counterparty | | Description | | Notional | | | Termination
Date | | | Value | |
Morgan Stanley & Co. | | The Fund receives or pays the total return on a portfolio of a short position. | | $ | (0 | ) | | | 7/22/22 | | | $ | (1,771) | |
| | | | | | | | | | | | | | | | |
Components of over-the-counter short total return basket swap warrants | |
| Reference Entity | | Shares | | | Notional Value | | | Net Unrealized
Appreciation/
(Depreciation) | | | % of Notional
Market Value | |
Health Care | | | | | | | | | | | | | | | | |
Pulse Biosciences, Inc. Warrant (exercise price $7.01), 5/14/25 | | | (347 | ) | | | $(0 | ) | | | $(1,771 | ) | | | 0.0 | # |
| | | | | | | | | | | | | | | | |
Total short equity positions | | | | | | | (0 | ) | | | (1,771 | ) | | | 0.0 | |
Dividend and financing | | | | | | | — | | | | — | | | | — | |
| | | | | | | | | | | | | | | | |
| | | | |
| | | Total | | | | $(0 | ) | | | $(1,771 | ) | | | 0.0 | |
| | | | | | | | | | | | | | | | |
# Less than 0.05%. | | | | | | | | | | | | | | | | |
The accompanying notes are an integral part of these financial statements.
32
|
AMG FQ Long-Short Equity Fund Schedule of Portfolio Investments (continued) |
The following table summarizes the inputs used to value the Fund’s investments by the fair value hierarchy levels as of October 31, 2020:
| | | | | | | | | | | | | | | | |
| | | Level 1 | | | Level 2 | | | Level 3 | | | Total | |
| | | | |
Investments in Securities | | | | | | | | | | | | | | | | |
| | | | |
Common Stocks† | | | $2,470,570 | | | | — | | | | — | | | | $2,470,570 | |
| | | | |
Short-Term Investments | | | | | | | | | | | | | | | | |
| | | | |
Other Investment Companies | | | 15,837,035 | | | | — | | | | — | | | | 15,837,035 | |
| | | | | | | | | | | | | | | | |
| | | | |
Total Investments in Securities | | | $18,307,605 | | | | — | | | | — | | | | $18,307,605 | |
| | | | | | | | | | | | | | | | |
| | | | |
Financial Derivative Instruments - Assets | | | | | | | | | | | | | | | | |
| | | | |
Equity Swap Contracts | | | — | | | | $1,573,082 | | | | — | | | | $1,573,082 | |
| | | | |
Financial Derivative Instruments - Liabilities | | | | | | | | | | | | | | | | |
| | | | |
Equity Swap Contracts | | | — | | | | (2,226,814) | | | | — | | | | (2,226,814) | |
| | | | | | | | | | | | | | | | |
| | | | |
Total Financial Derivative Instruments | | | — | | | | $(653,732) | | | | — | | | | $(653,732) | |
| | | | | | | | | | | | | | | | |
| † | All common stocks held in the Fund are Level 1 securities. For a detailed breakout of common stocks by major industry classification, please refer to the Fund’s Schedule of Portfolio Investments. |
For the fiscal year ended October 31, 2020, there were no transfers in or out of Level 3.
The following schedule shows the value of derivative instruments at October 31, 2020:
| | | | | | | | | | | | |
| | | Asset Derivatives | | | Liability Derivatives | |
| | | | |
Derivatives not accounted
for as hedging instruments | | Statement of Assets and
Liabilities Location | | Fair Value | | | Statement of Assets and
Liabilities Location | | Fair Value | |
| | | | |
Equity contracts | | Swaps at value | | | $1,573,082 | | | Swaps at value | | | $2,226,814 | |
| | | | | | | | | | | | |
| | | | |
| | Totals | | | $1,573,082 | | | | | | $2,226,814 | |
| | | | | | | | | | | | |
For the fiscal year ended October 31, 2020, the effect of derivative instruments on the Statement of Operations for the Fund and the amount of realized gain/loss and unrealized appreciation/depreciation on derivatives recognized in income was as follows:
| | | | | | | | | | | | |
| | | Realized Gain/(Loss) | | | Change in Unrealized Appreciation/Depreciation | |
| | | | |
Derivatives not accounted
for as hedging instruments | | Statement of Operations Location | | Realized
Gain/(Loss) | | | Statement of Operations Location | | Change in Unrealized Appreciation/ Depreciation | |
| | | | |
Equity contracts | | Net realized gain on futures contracts | | | $488,971 | | | Net change in unrealized appreciation/ depreciation on futures contracts | | | $(809,046) | |
| | | | |
| | Net realized loss on swaps | | | (305,332) | | | Net change in unrealized appreciation/ depreciation on swaps | | | (757,346) | |
| | | | | | | | | | | | |
| | | | |
| | Totals | | | $183,639 | | | | | | $(1,566,392) | |
| | | | | | | | | | | | |
The accompanying notes are an integral part of these financial statements.
33
|
AMG FQ Global Risk-Balanced Fund Portfolio Manager’s Comments (unaudited) |
| | | | | | | | |
OVERVIEW For the fiscal year ended October 31, 2020, AMG FQ Global Risk-Balanced Fund’s (the “Fund”) Class N shares returned (15.01)%, while the benchmark 60% MSCI World Index/40% FTSE World Government Bond Index - Hedged returned 5.41%. The “black swan” event that struck markets and the global economy in late February 2020 was the type of exogenous shock that had not occurred for decades, and it had a large detrimental impact on performance. While the Fund had risk controls in place for such an event, the decline in markets was so rapid and severe that the hedges provided only limited protection when the shock occurred. While the Fund also uses synthetic instruments such as futures contracts to gain exposure to the markets, this had no material impact on performance relative to holding physical securities. PERFORMANCE REVIEW In the fourth quarter of 2019, the global economy was facing a slowdown brought on by the trade wars between the U.S. and China, as well as uncertainty surrounding Brexit and its resolution. These “known unknowns” dominated the news. At that time, the Market Risk Indicator (“MRI”)1 identified significant market fragility, as credit risk was high, global business conditions were slow, and equity risk appetite was low. The Fund had a defensive position, with risk primarily allocated to bonds and a lower allocation to risk assets. These conditions began improving in December as credit risk and equity risk declined, bringing the market state into more resilient territory. As a result, the strategy reallocated risk from bonds to risk assets in December 2019. This ended the fourth quarter and all of 2019 with a significant positive return. By January, the market state had moved to fully resilient territory. Business conditions had improved and risk appetite was strong, as the “Phase 1” trade deal between the U.S. and China created optimism that the trade wars would be winding down in 2020. In mid-January came news of an outbreak of an | | | | unknown virus in China. The situation looked dire but contained to China. At that time, in order to reduce potential risk associated with the virus, the allocations to emerging market equities and commodities were reduced to “neutral” positions. In early to mid-February, markets rallied significantly on trade war optimism, but by late February the initial viral outbreak rapidly evolved into a pandemic. Markets crashed quickly in the last week of February and into March as governments shut down the global economy in an effort to control the disease now named COVID-19. Since fundamental risks were low at this point, the Fund was positioned for growth. The MRI, which is based upon economic and financial fundamentals, cannot anticipate a non-economic shock. The pandemic was certainly one. In the case of a “black swan” event, the Fund has options in place to hedge a portion of the downside if such a shock were to hit. Unfortunately, the market decline was so rapid, with the S&P 500® Index declining by (25)% in mere days, that the options only provided limited protection, resulting in losses from late February into the first week of March. The MRI, which normally shifts from resilient to fragile market readings over several months, did so over two weeks. By March 10, the Fund was in a fully defensive position, where it remained until late October, but the decline was already severe. Central banks across the globe began providing massive liquidity in response to the pandemic. Governments also offered substantial support in the form of unemployment benefits and subsidies to businesses. While often called “stimulus,” these funds were actually compensation for lost business and wages to stem a potential depression-level economic decline. The abrupt decline and rebound in the economy did cause the largest stocks in the market to rebound substantially. Working from home became the norm as many businesses remained in lockdown, and large tech companies profited handsomely. This masked the broader weakness in the markets, just as the large number of jobs lost has been masked by a | | | | rebound in parts of the economy as the lockdown eased. It also worked against the Fund’s risk-balanced design. Small cap and value tend to experience outsized opportunity during market recoveries, but instead the rally was highly concentrated in mega-cap U.S. tech stocks. While the Fund did participate in the recovery and regained lost ground, it has not yet been enough to make up for those weeks in February and March that markets declined. OUTLOOK In late October, the Fund’s outlook began to change. Credit risk fell and global manufacturing became expansionary, though still at a fraction of pre-pandemic levels. Optimism that vaccines would soon be available fueled a market rally in November. Yet, the globe is facing a third wave of infections and economic restrictions are being reintroduced to try to contain the virus. The restrictions come at a time when fiscal support in the U.S. is about to expire and congressional infighting has kept new support from being passed. Businesses already weak from the first two waves may not have the resilience to survive this wave. However, if immunity comes quickly enough to the population, there is hope that some sort of return to normalcy will come in 2021. The MRI ended the fiscal year at a balanced reading. The risks are split between the possibility of recovery as vaccines are administered, or another leg down in the global economy and a second recession if that help does not come soon enough. A cautious view appears prudent for the current environment. 1 The FQ Market Risk Indicator (“MRI”) is designed to indicate the current phase of the market cycle and the level of macro uncertainty, from resilience (MRI=0.00) to high fragility (MRI=1.00) in increments of 0.25 for a total of five levels. This commentary reflects the viewpoints of the portfolio manager, First Quadrant, L.P., as of October 31, 2020 and is not intended as a forecast or guarantee of future results, and is subject to change without notice. |
34
|
AMG FQ Global Risk-Balanced Fund Portfolio Manager’s Comments (continued) |
CUMULATIVE TOTAL RETURN PERFORMANCE
AMG FQ Global Risk-Balanced Fund’s cumulative total return is based on the daily change in net asset value (NAV), and assumes that all dividends and distributions were reinvested. This graph compares a hypothetical $10,000 investment made in the AMG FQ Global Risk Balanced Fund’s Class N shares on October 31, 2010, to a $10,000 investment made in the 60% MSCI World Index & 40% FTSE World Government Bond Index-Hedged (“Composite Hedged Index”) and the 60% MSCI World Index & 40% FTSE World Government Bond Index-UnHedged (“Composite UnHedged Index”) and S&P 500® Index for the same time period. The graph and table do not reflect the deduction of taxes that a shareholder would pay on a Fund distribution or redemption of shares. The listed returns for the Fund are net of expenses and the returns for the index exclude expenses. Total returns would have been lower had certain expenses not been reduced.
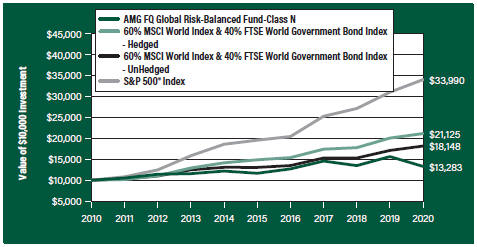
The table below shows the average annual total returns for the AMG FQ Global Risk-Balanced Fund and the AMG FQ Global Risk-Balanced Fund Composite Hedged and UnHedged Indexes and S&P 500® Index for the same time periods ended October 31, 2020.
| | | | | | | | | | | | |
| Average Annual Total Returns1 | | One Year | | | Five
Years | | | Ten Years | |
AMG FQ Global Risk-Balanced Fund2, 3, 4, 5, 6, 7, 8, 9, 10, 11, 12, 13, 14, 15, 16 | |
| | | |
Class N | | | (15.01%) | | | | 2.66% | | | | 2.88% | |
| | | |
Class I | | | (14.75%) | | | | 2.99% | | | | 3.25% | |
| | | |
Class Z | | | (14.57%) | | | | 3.12% | | | | 3.37% | |
| | | |
Composite Hedged Index17 | | | 5.41% | | | | 7.29% | | | | 7.77% | |
| | | |
Composite UnHedged Index17 | | | 6.18% | | | | 6.82% | | | | 6.14% | |
| | | |
S&P 500® Index18 | | | 9.71% | | | | 11.71% | | | | 13.01% | |
The performance data shown represents past performance. Past performance is not a guarantee of future results. Current performance may be lower or higher than the performance data quoted. The investment return and principal value of an investment will fluctuate so that an investor’s shares, when redeemed, may be worth more or less than their original cost.
Investors should carefully consider the Fund’s investment objectives, risks, charges and expenses before investing. For performance information through the most recent month end, current net asset values per share for the Fund and other information, please call 800.548.4539 or visit our website at amgfunds.com for a free prospectus. Read it carefully before investing or sending money.
Distributed by AMG Distributors, Inc., member FINRA/SIPC.
|
1 Total return equals income yield plus share price change and assumes reinvestment of all dividends and capital gain distributions. Returns are net of fees and may reflect offsets of Fund expenses as described in the prospectus. No adjustment has been made for taxes payable by shareholders on their reinvested dividends and capital gain distributions. Returns for periods greater than one year are annualized. The listed returns on the Fund are net of expenses and based on the published NAV as of October 31, 2020. All returns are in U.S. dollars ($). 2 From time to time, the Fund’s advisor has waived its fees and/or absorbed Fund expenses, which has resulted in higher returns. 3 Investments in international securities are subject to certain risks of overseas investing including currency fluctuations and changes in political and economic conditions, which could result in significant market fluctuations. These risks are magnified in emerging markets. 4 The Fund is subject to currency risk resulting from fluctuations in exchange rates that may affect the total loss or gain on a non-U.S. Dollar investment when converted back to U.S. Dollars. 5 The Fund is subject to the risks associated with investments in debt securities, such as default risk and fluctuations in the perception of the debtor’s ability to pay its creditors. Changing interest rates may adversely affect the value of an investment. An increase in interest rates typically causes the value of bonds and other fixed-income securities to fall. |
6 Investments in commodities are subject to greater volatility than investments in traditional securities, such as stocks and bonds. Commodities are subject to risks, including but not limited to climate conditions, livestock disease, war, terrorism, political conflicts, interest rates, currency fluctuations, embargoes, tariffs and other regulatory developments. |
7 Market prices of investments held by the Fund may fall rapidly or unpredictably due to a variety of economic or political factors, market conditions, disasters or public health issues, or in response to events that affect particular industries or companies. |
8 The Fund may invest in derivatives such as options and futures; the complexity and rapidly changing structure of derivatives markets may increase the possibility of market losses. 9 The Fund is subject to the risks associated with investments in emerging markets, such as erratic earnings patterns, economic and political instability, changing exchange controls, limitations on repatriation of foreign capital and changes in local governmental attitudes toward private |
35
|
AMG FQ Global Risk-Balanced Fund Portfolio Manager’s Comments (continued) |
| | | | | | | | |
investment, possibly leading to nationalization or confiscation of investor assets. 10 Because exchange-traded funds (ETFs) incur their own costs, investing in them could result in a higher cost to the investor. Additionally, the Fund will be indirectly exposed to all the risks of securities held by the ETFs. 11 High-yield bonds (also known as “junk bonds”) may be subject to greater levels of interest rate, credit, and liquidity risk than investments in higher rated securities. These securities are considered predominantly speculative with respect to the issuer’s continuing ability to make principal and interest payments. The issuers of the Fund’s holdings may be involved in bankruptcy proceedings, reorganizations, or financial restructurings, and are not as strong financially as higher-rated issuers. 12 The use of leverage in a Fund’s strategy, such as futures and forward commitment transactions, can magnify relatively small market movements into relatively larger losses for the Fund. 13 The Fund is subject to risks associated with investments in mid-capitalization companies such as greater price volatility, lower trading volume, and less liquidity than the stocks of larger, more established companies. | | | | 14 The Fund is subject to special risk considerations similar to those associated with the direct ownership of real estate. Real estate valuations may be subject to factors such as changing general and local economic, financial, competitive, and environmental conditions. 15 The Fund is subject to risks associated with investments in small-capitalization companies, such as erratic earnings patterns, competitive conditions, limited earnings history, and a reliance on one or a limited number of products. 16 Obligations of certain government agencies are not backed by the full faith and credit of the U.S. government. If one of these agencies defaulted on a loan, there is no guarantee that the U.S. government would provide financial support. Additionally, debt securities of the U.S. government may be affected by changing interest rates and subject to prepayment risk. 17 The benchmark is comprised of 60% MSCI World Index and 40% FTSE World Government Bond Index. The MSCI World Index is a free float-adjusted market capitalization weighted index that is designed to measure the equity market performance of developed markets. The MSCI World Index consists of 23 developed market country indices. Please go to msci.com for most current list of countries represented by the index. The FTSE | | | | World Government Bond Index (FTSE) measures the performance of fixed-rate, local currency, investment grade sovereign bonds. The FTSE is a widely used benchmark that currently comprises sovereign debt from over 20 countries, denominated in a variety of currencies, and has more than 25 years of history available. Prior to July 31, 2018, the FTSE World Government Bond Index was known as the Citigroup World Government Bond Index. Unlike the Fund, the Composite Index is unmanaged, is not available for investment and does not incur fees. 18 The S&P 500® Index is a capitalization-weighted index of 500 stocks. The S&P 500® Index is designed to measure performance of the broad domestic economy through changes in the aggregate market value of 500 stocks representing all major industries. Unlike the Fund, the S&P 500® Index is unmanaged, is not available for investment and does not incur expenses. The S&P 500® Index is proprietary data of Standard & Poor’s, a division of McGraw-Hill Companies, Inc. Not FDIC insured, nor bank guaranteed. May lose value. |
| | | | | | | | |
36
|
AMG FQ Global Risk-Balanced Fund Schedule of Portfolio Investments October 31, 2020 |
| | | | | | | | |
| | | Shares | | | Value | |
| |
Exchange Traded Funds - 51.8% | | | | | |
| | |
iShares Global Infrastructure ETF | | | 14,947 | | | | $569,780 | |
| | |
iShares iBoxx $ High Yield Corporate Bond ETF1,2 | | | 87,005 | | | | 7,297,979 | |
| | |
iShares TIPS Bond ETF | | | 55,701 | | | | 6,975,436 | |
| | |
Materials Select Sector SPDR Fund | | | 9,314 | | | | 588,459 | |
| | |
SPDR Citi International Government Inflation-Protected Bond ETF | | | 29,089 | | | | 1,574,878 | |
| | |
VanEck Vectors Gold Miners ETF | | | 15,289 | | | | 573,185 | |
| | |
VanEck Vectors Natural Resource ETF | | | 18,251 | | | | 578,830 | |
| | |
Vanguard Global ex-U.S. Real Estate ETF | | | 4,194 | | | | 197,034 | |
| | |
Vanguard REIT ETF | | | 23,263 | | | | 1,781,713 | |
| | |
Total Exchange Traded Funds | | | | | | | | |
(Cost $20,254,584) | | | | | | | 20,137,294 | |
| | |
| | | Notes | | | | |
| |
Exchange Traded Notes - 10.0% | | | | | |
| | |
Deutsche Bank AG, PowerShares DB Gold Double Long, 02/15/38* | | | 16,999 | | | | 751,356 | |
| | |
iPath Bloomberg Commodity Index Total Return ETN, 06/12/36*,2 | | | 76,592 | | | | 1,520,351 | |
| | |
Swedish Export Credit Corp., ELEMENTS Linked to the Rogers International Commodity Index Total Return, 10/24/22* | | | 375,095 | | | | 1,597,905 | |
| | |
Total Exchange Traded Notes | | | | | | | | |
(Cost $3,953,589) | | | | | | | 3,869,612 | |
| | |
Purchased Options - 2.1% | | | | | | | | |
(See Open Purchased Options schedule) | | | | | | | | |
(Cost $652,362) | | | | | | | 818,637 | |
| | | | | | | | |
| | | Principal
Amount | | | Value | |
| | |
Short-Term Investments - 37.9% | | | | | | | | |
| |
Joint Repurchase Agreements - 0.5%3 | | | | | |
| | |
Nomura Securities International, Inc., dated 10/30/20, due 11/02/20, 0.090% total to be received $182,292 (collateralized by various U.S. Government Agency Obligations, 2.000% -5.500%, 10/01/34 - 09/20/50, totaling $185,937) | | | $182,291 | | | | $182,291 | |
| |
U.S. Government and Agency Obligation - 7.7% | | | | | |
| | |
United States Treasury Bills, 0.096%, 11/27/201,4,5 | | | 3,000,000 | | | | 2,999,810 | |
| | |
| | | Shares | | | | |
| |
Other Investment Companies - 29.7% | | | | | |
| | |
Dreyfus Government Cash Management Fund, Institutional Shares, 0.02%6 | | | 3,806,175 | | | | 3,806,175 | |
| | |
Dreyfus Institutional Preferred Government Money Market Fund, Institutional Shares, 0.04%6 | | | 3,806,174 | | | | 3,806,174 | |
| | |
JPMorgan U.S. Government Money Market Fund, IM Shares, 0.04%6 | | | 3,921,513 | | | | 3,921,513 | |
| | |
Total Other Investment Companies | | | | | | | 11,533,862 | |
| | |
Total Short-Term Investments | | | | | | | | |
(Cost $14,715,963) | | | | | | | 14,715,963 | |
| | |
Total Investments - 101.8% | | | | | | | | |
(Cost $39,576,498) | | | | | | | 39,541,506 | |
| | |
Derivatives - 3.4)%7 | | | | | | | (1,321,319 | ) |
| |
Other Assets, less Liabilities - 1.6% | | | | 610,040 | |
| | |
Net Assets - 100.0% | | | | | | | $38,830,227 | |
| * | Non-income producing security. |
| 1 | Some or all of these securities were held as collateral for written options as of October 31, 2020, amounting to $2,864,060 or 7.4% of net assets. |
| 2 | Some of these securities, amounting to $974,420 or 2.5% of net assets, were out on loan to various borrowers and are collateralized by cash and various U.S. Treasury Obligations. See Note 4 of Notes to Financial Statements. |
| 3 | Cash collateral received for securities lending activity was invested in these joint repurchase agreements. |
| 4 | Some or all of this security is held as collateral for futures contracts. The market value of collateral at October 31, 2020, amounted to $2,299,854, or 5.9% of net assets. |
| 5 | Represents yield to maturity at October 31, 2020. |
| 6 | Yield shown represents the October 31, 2020, seven day average yield, which refers to the sum of the previous seven days’ dividends paid, expressed as an annual percentage. |
| 7 | Includes Written Options and Futures Contracts. Please refer to the Open Written Options and Open Futures Contracts tables for the details. |
| REIT | Real Estate Investment Trust |
| SPDR | Standard & Poor’s Depositary Receipt |
| TIPS | Treasury Inflation-Protected Securities |
The accompanying notes are an integral part of these financial statements.
37
|
AMG FQ Global Risk-Balanced Fund Schedule of Portfolio Investments (continued) |
Open Exchange Traded Purchased Options
| | | | | | | | | | | | | | | | | | | | | | | | |
| Description | | Strike Price | | | Expiration Date | | | Number of
Contracts | | | Notional
Amount | | | Cost | | | Value | |
EURO STOXX 50 (Put) | | | 2,525 | | | | 02/19/2021 | | | | 67 | | | | $1,691,750 | | | | $56,876 | | | | $51,579 | |
EURO STOXX 50 (Put) | | | 2,900 | | | | 01/15/2021 | | | | 32 | | | | 928,000 | | | | 21,844 | | | | 49,530 | |
EURO STOXX 50 (Put) | | | 2,925 | | | | 11/20/2020 | | | | 9 | | | | 263,250 | | | | 7,034 | | | | 8,081 | |
EURO STOXX 50 (Put) | | | 2,950 | | | | 11/20/2020 | | | | 16 | | | | 472,000 | | | | 13,247 | | | | 16,175 | |
EURO STOXX 50 (Put) | | | 3,025 | | | | 12/18/2020 | | | | 27 | | | | 816,750 | | | | 22,124 | | | | 50,344 | |
EURO STOXX 50 (Put) | | | 3,075 | | | | 11/20/2020 | | | | 2 | | | | 61,500 | | | | 1,286 | | | | 3,550 | |
S&P 500 Index (Put) | | | 2,800 | | | | 02/19/2021 | | | | 38 | | | | 10,640,000 | | | | 316,221 | | | | 349,638 | |
S&P 500 Index (Put) | | | 3,050 | | | | 12/18/2020 | | | | 8 | | | | 2,440,000 | | | | 63,506 | | | | 67,840 | |
S&P 500 Index (Put) | | | 3,110 | | | | 11/20/2020 | | | | 10 | | | | 3,110,000 | | | | 82,101 | | | | 64,400 | |
S&P 500 Index (Put) | | | 3,210 | | | | 01/15/2021 | | | | 9 | | | | 2,889,000 | | | | 68,123 | | | | 157,500 | |
| | | | | | | | | | | | | | | | | | | | | | | | |
| | | | | | | | | | | | | | | Total | | | | $652,362 | | | | $818,637 | |
| | | | | | | | | | | | | | | | | | | | | | | | |
Open Exchange Traded Written Options
| | | | | | | | | | | | | | | | | | | | | | | | |
| Description | | Strike Price | | | Expiration Date | | | Number of
Contracts | | | Notional
Amount | | | Premium | | | Value | |
EURO STOXX 50 (Call) | | | 3,375 | | | | 02/19/2021 | | | | 67 | | | | $2,261,250 | | | | $18,808 | | | | $(15,997 | ) |
EURO STOXX 50 (Call) | | | 3,500 | | | | 11/20/2020 | | | | 25 | | | | 875,000 | | | | 9,393 | | | | (146 | ) |
EURO STOXX 50 (Call) | | | 3,500 | | | | 01/15/2021 | | | | 32 | | | | 1,120,000 | | | | 8,676 | | | | (1,528 | ) |
EURO STOXX 50 (Call) | | | 3,525 | | | | 11/20/2020 | | | | 2 | | | | 70,500 | | | | 631 | | | | (9 | ) |
EURO STOXX 50 (Call) | | | 3,575 | | | | 12/18/2020 | | | | 27 | | | | 965,250 | | | | 10,158 | | | | (377 | ) |
EURO STOXX 50 (Put) | | | 2,350 | | | | 02/19/2021 | | | | 67 | | | | 1,574,500 | | | | 37,472 | | | | (34,100 | ) |
EURO STOXX 50 (Put) | | | 2,725 | | | | 11/20/2020 | | | | 25 | | | | 681,250 | | | | 11,093 | | | | (8,356 | ) |
EURO STOXX 50 (Put) | | | 2,725 | | | | 01/15/2021 | | | | 32 | | | | 872,000 | | | | 13,050 | | | | (30,859 | ) |
EURO STOXX 50 (Put) | | | 2,800 | | | | 12/18/2020 | | | | 27 | | | | 756,000 | | | | 11,674 | | | | (24,370 | ) |
EURO STOXX 50 (Put) | | | 2,900 | | | | 11/20/2020 | | | | 2 | | | | 58,000 | | | | 679 | | | | (1,593 | ) |
S&P 500 Index (Call) | | | 3,640 | | | | 11/20/2020 | | | | 10 | | | | 3,640,000 | | | | 34,368 | | | | (2,700 | ) |
S&P 500 Index (Call) | | | 3,690 | | | | 12/18/2020 | | | | 8 | | | | 2,952,000 | | | | 30,832 | | | | (5,520 | ) |
S&P 500 Index (Call) | | | 3,770 | | | | 02/19/2021 | | | | 38 | | | | 14,326,000 | | | | 89,239 | | | | (71,630 | ) |
S&P 500 Index (Call) | | | 3,840 | | | | 01/15/2021 | | | | 9 | | | | 3,456,000 | | | | 31,637 | | | | (5,355 | ) |
S&P 500 Index (Put) | | | 2,625 | | | | 02/19/2021 | | | | 38 | | | | 9,975,000 | | | | 219,959 | | | | (220,970 | ) |
S&P 500 Index (Put) | | | 2,805 | | | | 12/18/2020 | | | | 8 | | | | 2,244,000 | | | | 32,910 | | | | (32,600 | ) |
S&P 500 Index (Put) | | | 2,880 | | | | 11/20/2020 | | | | 10 | | | | 2,880,000 | | | | 48,009 | | | | (22,620 | ) |
S&P 500 Index (Put) | | | 2,970 | | | | 01/15/2021 | | | | 9 | | | | 2,673,000 | | | | 37,412 | | | | (83,745 | ) |
| | | | | | | | | | | | | | | | | | | | | | | | |
| | | | | | | | | | | | | | | Total | | | | $646,000 | | | | $(562,475 | ) |
| | | | | | | | | | | | | | | | | | | | | | | | |
Open Futures Contracts
| | | | | | | | | | | | | | | | | | |
| Description | | Currency | | Number of
Contracts | | Position | | Expiration
Date | | | Current
Notional
Amount | | | Value and
Unrealized
Gain/(Loss) | |
ASX SPI 200 Index | | AUD | | 15 | | Long | | | 12/17/20 | | | | $1,552,528 | | | | $(16,962) | |
Australia 10-Year Bond | | AUD | | 48 | | Long | | | 12/15/20 | | | | 5,044,479 | | | | 62,455 | |
Canadian 10-Year Bond | | CAD | | 44 | | Long | | | 12/18/20 | | | | 4,988,186 | | | | (11,324 | ) |
EURO STOXX 50 | | EUR | | 118 | | Long | | | 12/18/20 | | | | 4,066,501 | | | | (336,532 | ) |
The accompanying notes are an integral part of these financial statements.
38
|
AMG FQ Global Risk-Balanced Fund Schedule of Portfolio Investments (continued) |
| | | | | | | | | | | | | | | | | | |
Description | | Currency | | Number of Contracts | | Position | | Expiration Date | | | Current Notional Amount | | | Value and Unrealized
Gain/(Loss) | |
FTSE 100 Index | | GBP | | 15 | | Long | | | 12/18/20 | | | | $1,081,131 | | | | $(50,602 | ) |
Hang Seng Mini Index | | HKD | | 25 | | Long | | | 11/27/20 | | | | 779,007 | | | | (15,816 | ) |
MSCI Emerging Markets Index | | USD | | 61 | | Long | | | 12/18/20 | | | | 3,360,795 | | | | (83,444 | ) |
Russell 2000® Mini Index | | USD | | 51 | | Long | | | 12/18/20 | | | | 3,918,840 | | | | 8,105 | |
S&P 500 E-Mini Index | | USD | | 83 | | Long | | | 12/18/20 | | | | 1,354,850 | | | | (45,146 | ) |
S&P/TSX 60 Index | | CAD | | 10 | | Long | | | 12/17/20 | | | | 1,389,177 | | | | (41,907 | ) |
TOPIX Mini Index | | JPY | | 74 | | Long | | | 12/10/20 | | | | 1,111,820 | | | | (23,416 | ) |
U.K. 10-Year Gilt | | GBP | | 38 | | Long | | | 12/29/20 | | | | 6,679,414 | | | | (15,793 | ) |
US LONG BOND(CBT) | | USD | | 52 | | Long | | | 12/21/20 | | | | 8,968,375 | | | | (188,462 | ) |
| | | | | | | | | | | | | | | | | | |
| | | | | | | | | | | | | Total | | | | $(758,844 | ) |
| | | | | | | | | | | | | | | | | | |
CURRENCY ABBREVIATIONS:
The accompanying notes are an integral part of these financial statements.
39
|
AMG FQ Global Risk-Balanced Fund Schedule of Portfolio Investments (continued) |
The following table summarizes the inputs used to value the Fund’s investments by the fair value hierarchy levels as of October 31, 2020:
| | | | | | | | | | | | | | | | |
| | | Level 1 | | | Level 2 | | | Level 3 | | | Total | |
Investments in Securities | | | | | | | | | | | | | | | | |
Exchange Traded Funds† | | | $20,137,294 | | | | — | | | | — | | | | $20,137,294 | |
Exchange Traded Notes† | | | 3,869,612 | | | | — | | | | — | | | | 3,869,612 | |
Purchased Options | | | | | | | | | | | | | | | | |
Equity Contracts | | | 818,637 | | | | — | | | | — | | | | 818,637 | |
Short-Term Investments | | | | | | | | | | | | | | | | |
Joint Repurchase Agreements | | | — | | | | $182,291 | | | | — | | | | 182,291 | |
U.S. Government and Agency Obligation | | | — | | | | 2,999,810 | | | | — | | | | 2,999,810 | |
| | | | |
Other Investment Companies | | | 11,533,862 | | | | — | | | | — | | | | 11,533,862 | |
| | | | | | | | | | | | | | | | |
| | | | |
Total Investments in Securities | | | $36,359,405 | | | | $3,182,101 | | | | — | | | | $39,541,506 | |
| | | | | | | | | | | | | | | | |
| | | | |
Financial Derivative Instruments - Assets | | | | | | | | | | | | | | | | |
Equity Futures Contracts | | | $8,105 | | | | — | | | | — | | | | $8,105 | |
Interest Rate Futures Contracts | | | 62,455 | | | | — | | | | — | | | | 62,455 | |
Financial Derivative Instruments - Liabilities | | | | | | | | | | | | | | | | |
Equity Futures Contracts | | | (613,825) | | | | — | | | | — | | | | (613,825) | |
Equity Written Options | | | (562,475) | | | | — | | | | — | | | | (562,475) | |
Interest Rate Futures Contracts | | | (215,579) | | | | — | | | | — | | | | (215,579) | |
| | | | | | | | | | | | | | | | |
| | | | |
Total Financial Derivative Instruments | | | $(1,321,319) | | | | — | | | | — | | | | $(1,321,319) | |
| | | | | | | | | | | | | | | | |
| † | All exchange traded funds and exchange traded notes held in the Fund are level 1 securities. For a detailed listing of these securities, please refer to the Fund’s Schedule of Portfolio Investments. |
For the fiscal year ended October 31, 2020, there were no transfers in or out of Level 3.
The following schedule shows the value of derivative instruments at October 31, 2020:
| | | | | | | | | | | | |
| | | Asset Derivatives | | | Liability Derivatives | |
| | | | |
Derivatives not accounted for as hedging instruments | | Statement of Assets and Liabilities Location | | Fair Value | | | Statement of Assets and Liabilities Location | | Fair Value | |
| | | | |
Equity contracts | | Options purchased1 | | | $818,637 | | | Options written | | | $562,475 | |
| | | | |
Equity contracts | | Receivable for variation margin2 | | | 115,478 | | | Payable for variation margin2 | | | 170,432 | |
| | | | |
Interest rate contracts | | Receivable for variation margin2 | | | — | | | Payable for variation margin2 | | | 118,781 | |
| | | | | | | | | | | | |
| | | | |
| | Totals | | | $934,115 | | | | | | $851,688 | |
| | | | | | | | | | | | |
The accompanying notes are an integral part of these financial statements.
40
|
AMG FQ Global Risk-Balanced Fund Schedule of Portfolio Investments (continued) |
For the fiscal year ended October 31, 2020, the effect of derivative instruments on the Statement of Operations for the Fund and the amount of realized gain/loss and unrealized appreciation/depreciation on derivatives recognized in income was as follows:
| | | | | | | | | | | | |
| | | Realized Gain/(Loss) | | | Change in Unrealized Appreciation/Depreciation | |
| | | | |
Derivatives not accounted for as hedging instruments | | Statement of Operations Location | | Realized Gain/(Loss) | | | Statement of Operations Location | | Change in Unrealized Appreciation/ Depreciation | |
| | | | |
Equity contracts | | Net realized gain on options purchased1 | | | $2,415,453 | | | Net change in unrealized appreciation/
depreciation on options purchased1 | | | $462,610 | |
| | | | |
Equity contracts | | Net realized loss on futures contracts | | | (3,655,677 | ) | | Net change in unrealized appreciation/
depreciation on future contracts | | | (832,204 | ) |
| | | | |
Interest rate contracts | | Net realized gain on futures contracts | | | 396,239 | | | Net change in unrealized appreciation/
depreciation on futures contracts | | | 273,528 | |
| | | | |
Equity contracts | | Net realized loss on options written | | | (2,823,208 | ) | | Net change in unrealized appreciation/
depreciation on options written | | | (143,185 | ) |
| | | | | | | | | | | | |
| | | | |
| | Totals | | | $(3,667,193 | ) | | | | | $(239,251 | ) |
| | | | | | | | | | | | |
1 Options purchased are included in investments at value on the Statement of Assets and Liabilities. Net realized gain/(loss) on options purchased and net change in unrealized appreciation/depreciation on options purchased are included in the net realized gain/(loss) on investments and net change in unrealized appreciation/depreciation of investments, respectively, on the Statement of Operations.
2 Only current day’s variation margin is reported within the Statement of Assets and Liabilities. The variation margin is included in the open futures cumulative appreciation/depreciation of $(758,844).
The accompanying notes are an integral part of these financial statements.
41
|
Statement of Assets and Liabilities October 31, 2020 |
| | | | | | | | | | | | |
| | | AMG FQ
Tax-Managed
U.S.
Equity Fund | | | AMG
FQ Long-Short
Equity Fund | | | AMG
FQ Global
Risk-Balanced Fund | |
Assets: | | | | | | | | | | | | |
| | | |
Investments at value1 (including securities on loan valued at $3,698,901, $0, and $974,420, respectively) | | | $62,168,827 | | | | $18,307,605 | | | | $39,541,506 | |
| | | |
Cash | | | — | | | | — | | | | 910,797 | |
Due from broker | | | — | | | | — | | | | 949,409 | |
Receivable for investments sold | | | 1,013,761 | | | | — | | | | — | |
Segregated cash | | | — | | | | 26,330,071 | | | | — | |
Dividend and interest receivables | | | 32,910 | | | | 2,542 | | | | 923 | |
Securities lending income receivable | | | 450 | | | | — | | | | 703 | |
Receivable for Fund shares sold | | | 4,268 | | | | 13,953 | | | | 970 | |
Receivable from affiliate | | | 4,264 | | | | — | | | | 2,463 | |
Swaps at value | | | — | | | | 1,573,082 | | | | — | |
| | | |
Receivable for variation margin | | | — | | | | — | | | | 115,478 | |
| | | |
Prepaid expenses and other assets | | | 14,680 | | | | 12,301 | | | | 7,984 | |
Total assets | | | 63,239,160 | | | | 46,239,554 | | | | 41,530,233 | |
Liabilities: | | | | | | | | | | | | |
Payable upon return of securities loaned | | | 340,570 | | | | — | | | | 182,291 | |
Payable for investments purchased | | | 27,717 | | | | — | | | | 1,589,222 | |
Payable for Fund shares repurchased | | | 62,507 | | | | 221,760 | | | | 9,363 | |
Written options2 | | | — | | | | — | | | | 562,475 | |
Payable for variation margin | | | — | | | | — | | | | 289,213 | |
Swaps at value | | | — | | | | 2,226,814 | | | | — | |
Due to custodian | | | 53,014 | | | | — | | | | — | |
Accrued expenses: | | | | | | | | | | | | |
Investment advisory and management fees | | | 39,742 | | | | 21,426 | | | | 20,141 | |
Administrative fees | | | 8,516 | | | | 5,814 | | | | 5,035 | |
Distribution fees | | | 1,561 | | | | 1,043 | | | | 246 | |
Shareholder service fees | | | — | | | | 4,680 | | | | 444 | |
Other | | | 38,060 | | | | 51,599 | | | | 41,576 | |
Total liabilities | | | 571,687 | | | | 2,533,136 | | | | 2,700,006 | |
| | | | | | | | | | | | |
Net Assets | | | $62,667,473 | | | | $43,706,418 | | | | $38,830,227 | |
1 Investments at cost | | | $31,354,280 | | | | $18,383,872 | | | | $39,576,498 | |
2 Premiums received | | | — | | | | — | | | | $646,000 | |
The accompanying notes are an integral part of these financial statements.
42
|
Statement of Assets and Liabilities (continued) |
| | | | | | | | | | | | |
| | | AMG FQ
Tax-Managed
U.S.
Equity Fund | | | AMG
FQ Long-Short
Equity Fund | | | AMG
FQ Global
Risk-Balanced Fund | |
| | | |
Net Assets Represent: | | | | | | | | | | | | |
Paid-in capital | | | $30,773,637 | | | | $52,339,169 | | | | $46,045,210 | |
Total distributable earnings (loss) | | | 31,893,836 | | | | (8,632,751 | ) | | | (7,214,983 | ) |
Net Assets | | | $62,667,473 | | | | $43,706,418 | | | | $38,830,227 | |
| | | |
Class N: | | | | | | | | | | | | |
Net Assets | | | $6,921,829 | | | | $4,716,195 | | | | $1,109,862 | |
Shares outstanding | | | 203,471 | | | | 343,573 | | | | 81,763 | |
| | | |
Net asset value, offering and redemption price per share | | | $34.02 | | | | $13.73 | | | | $13.57 | |
Class I: | | | | | | | | | | | | |
Net Assets | | | $55,745,644 | | | | $38,990,223 | | | | $1,528,248 | |
Shares outstanding | | | 1,639,416 | | | | 2,826,397 | | | | 111,942 | |
| | | |
Net asset value, offering and redemption price per share | | | $34.00 | | | | $13.80 | | | | $13.65 | |
Class Z: | | | | | | | | | | | | |
Net Assets | | | — | | | | — | | | | $36,192,117 | |
Shares outstanding | | | — | | | | — | | | | 2,650,295 | |
| | | |
Net asset value, offering and redemption price per share | | | — | | | | — | | | | $13.66 | |
The accompanying notes are an integral part of these financial statements.
43
|
Statements of Operations For the fiscal year ended October 31, 2020 |
| | | | | | | | | | | | |
| | | AMG FQ
Tax-Managed
U.S.
Equity Fund | | AMG
FQ Long-
Short
Equity Fund | | AMG
FQ Global
Risk-Balanced Fund |
Investment Income: | | | | | | | | | | | | |
Dividend income | | | $887,595 | | | | $964,674 | 1 | | | $570,378 | |
Interest income | | | — | | | | 15,565 | | | | 57,565 | |
Securities lending income | | | 9,723 | | | | 1,790 | | | | 23,405 | |
Foreign withholding tax | | | (1,167 | ) | | | — | | | | — | |
Total investment income | | | 896,151 | | | | 982,029 | | | | 651,348 | |
Expenses: | | | | | | | | | | | | |
Investment advisory and management fees | | | 463,651 | | | | 266,600 | | | | 269,945 | |
Administrative fees | | | 99,353 | | | | 114,257 | | | | 67,486 | |
Distribution fees - Class N | | | 18,652 | | | | 25,848 | | | | 3,923 | |
Shareholder servicing fees - Class N | | | — | | | | 10,339 | | | | 2,354 | |
Shareholder servicing fees - Class I | | | — | | | | 47,514 | | | | 2,696 | |
Registration fees | | | 31,672 | | | | 39,540 | | | | 44,871 | |
Professional fees | | | 31,194 | | | | 45,348 | | | | 35,509 | |
Custodian fees | | | 20,412 | | | | 28,043 | | | | 20,568 | |
Reports to shareholders | | | 19,214 | | | | 27,096 | | | | 15,579 | |
Transfer agent fees | | | 11,640 | | | | 12,497 | | | | 9,145 | |
Trustee fees and expenses | | | 5,875 | | | | 7,116 | | | | 4,087 | |
Miscellaneous | | | 3,761 | | | | 4,646 | | | | 3,940 | |
Repayment of prior reimbursements | | | — | | | | 5,625 | | | | — | |
Total expenses before offsets | | | 705,424 | | | | 634,469 | | | | 480,103 | |
Expense reimbursements | | | (97,260 | ) | | | (24,885 | ) | | | (70,694 | ) |
Expense reductions | | | (4,476 | ) | | | — | | | | (3,493 | ) |
Net expenses | | | 603,688 | | | | 609,584 | | | | 405,916 | |
| | | | | | | | | | | | |
Net investment income | | | 292,463 | | | | 372,445 | | | | 245,432 | |
Net Realized and Unrealized Loss: | | | | | | | | | | | | |
Net realized gain (loss) on investments | | | 882,650 | | | | (7,787,065 | ) | | | 68,151 | |
Net realized gain (loss) on futures contracts | | | — | | | | 488,971 | | | | (3,259,438 | ) |
Net realized loss on written options | | | — | | | | — | | | | (2,823,208 | ) |
Net realized loss on swaps | | | — | | | | (305,332 | ) | | | — | |
Net realized gain on foreign currency transactions | | | — | | | | — | | | | 1,075 | |
Net change in unrealized appreciation/depreciation on investments | | | (1,682,389 | ) | | | (2,740,261 | ) | | | (1,028,400 | ) |
Net change in unrealized appreciation/depreciation on futures contracts | | | — | | | | (809,046 | ) | | | (558,676 | ) |
Net change in unrealized appreciation/depreciation on written options | | | — | | | | — | | | | (143,185 | ) |
Net change in unrealized appreciation/depreciation on swaps | | | — | | | | (757,346 | ) | | | — | |
Net change in unrealized appreciation/depreciation on foreign currency translations | | | — | | | | — | | | | 209 | |
Net realized and unrealized loss | | | (799,739 | ) | | | (11,910,079 | ) | | | (7,743,472 | ) |
| | | | | | | | | | | | |
Net decrease in net assets resulting from operations | | | $(507,276 | ) | | | $(11,537,634 | ) | | | $(7,498,040 | ) |
| 1 | Includes non-recurring dividends of $242,088. |
The accompanying notes are an integral part of these financial statements.
44
|
Statements of Changes in Net Assets For the fiscal year ended October 31, |
| | | | | | | | | | | | | | | | | | | | | | | | |
| | | AMG FQ
Tax-Managed
U.S. Equity Fund | | | AMG
FQ Long-Short
Equity Fund | | | AMG
FQ Global
Risk-Balanced Fund | |
| | | 2020 | | | 2019 | | | 2020 | | | 2019 | | | 2020 | | | 2019 | |
Increase (Decrease) in Net Assets Resulting From Operations: | | | | | | | | | | | | | | | | | | | | | | | | |
| | | | | | |
Net investment income | | | $292,463 | | | | $342,119 | | | | $372,445 | | | | $846,274 | | | | $245,432 | | | | $931,979 | |
| | | | | | |
Net realized gain (loss) on investments | | | 882,650 | | | | 110,218 | | | | (7,603,426 | ) | | | 2,325,910 | | | | (6,013,420 | ) | | | 3,056,834 | |
| | | | | | |
Net change in unrealized appreciation/depreciation on investments | | | (1,682,389 | ) | | | 5,907,820 | | | | (4,306,653 | ) | | | 2,307,516 | | | | (1,730,052 | ) | | | 4,078,231 | |
| | | | | | |
Net increase (decrease) in net assets resulting from operations | | | (507,276 | ) | | | 6,360,157 | | | | (11,537,634 | ) | | | 5,479,700 | | | | (7,498,040 | ) | | | 8,067,044 | |
Distributions to Shareholders: | | | | | | | | | | | | | | | | | | | | | | | | |
| | | | | | |
Class N | | | (30,370 | ) | | | (128,969 | ) | | | (624,543 | ) | | | (1,339,503 | ) | | | (81,284 | ) | | | (37,124 | ) |
| | | | | | |
Class I | | | (392,779 | ) | | | (1,073,001 | ) | | | (3,646,142 | ) | | | (2,076,653 | ) | | | (81,571 | ) | | | (33,497 | ) |
| | | | | | |
Class Z | | | — | | | | — | | | | — | | | | — | | | | (1,851,649 | ) | | | (1,184,019 | ) |
| | | | | | |
Total distributions to shareholders | | | (423,149 | ) | | | (1,201,970 | ) | | | (4,270,685 | ) | | | (3,416,156 | ) | | | (2,014,504 | ) | | | (1,254,640 | ) |
Capital Share Transactions:1 | | | | | | | | | | | | | | | | | | | | | | | | |
| | | | | | |
Net increase (decrease) from capital share transactions | | | (6,357,745 | ) | | | (8,264,352 | ) | | | (38,109,098 | ) | | | 15,433,917 | | | | (5,341,377 | ) | | | (6,539,924 | ) |
| | | | | | | | | | | | | | | | | | | | | | | | |
| | | | | | |
Total increase (decrease) in net assets | | | (7,288,170 | ) | | | (3,106,165 | ) | | | (53,917,417 | ) | | | 17,497,461 | | | | (14,853,921 | ) | | | 272,480 | |
Net Assets: | | | | | | | | | | | | | | | | | | | | | | | | |
| | | | | | |
Beginning of year | | | 69,955,643 | | | | 73,061,808 | | | | 97,623,835 | | | | 80,126,374 | | | | 53,684,148 | | | | 53,411,668 | |
| | | | | | |
End of year | | | $62,667,473 | | | | $69,955,643 | | | | $43,706,418 | | | | $97,623,835 | | | | $38,830,227 | | | | $53,684,148 | |
| 1 | See Note 1(g) of the Notes to Financial Statements. |
The accompanying notes are an integral part of these financial statements.
45
|
AMG FQ Tax-Managed U.S. Equity Fund Financial Highlights For a share outstanding throughout each fiscal period |
| | | | | | | | | | | | | | | | | | | | |
| | | For the fiscal years ended October 31, | |
| Class N | | 2020 | | | 2019 | | | 2018 | | | 2017 | | | 20161 | |
| | | | | |
Net Asset Value, Beginning of Year | | | $34.33 | | | | $31.68 | | | | $29.69 | | | | $24.11 | | | | $24.42 | |
| | | | | |
Income (loss) from Investment Operations: | | | | | | | | | | | | | | | | | | | | |
| | | | | |
Net investment income2,3 | | | 0.07 | | | | 0.09 | 4 | | | 0.03 | | | | 0.03 | 5 | | | 0.22 | 6 |
| | | | | |
Net realized and unrealized gain (loss) on investments | | | (0.25 | ) | | | 3.02 | | | | 2.00 | | | | 5.79 | | | | (0.43 | ) |
| | | | | |
Total income (loss) from investment operations | | | (0.18 | ) | | | 3.11 | | | | 2.03 | | | | 5.82 | | | | (0.21 | ) |
| | | | | |
Less Distributions to Shareholders from: | | | | | | | | | | | | | | | | | | | | |
| | | | | |
Net investment income | | | (0.08 | ) | | | (0.05 | ) | | | — | | | | (0.24 | ) | | | (0.10 | ) |
| | | | | |
Net realized gain on investments | | | (0.05 | ) | | | (0.41 | ) | | | (0.04 | ) | | | — | | | | — | |
| | | | | |
Total distributions to shareholders | | | (0.13 | ) | | | (0.46 | ) | | | (0.04 | ) | | | (0.24 | ) | | | (0.10 | ) |
| | | | | |
Net Asset Value, End of Year | | | $34.02 | | | | $34.33 | | | | $31.68 | | | | $29.69 | | | | $24.11 | |
| | | | | |
Total Return3,7 | | | (0.54 | )% | | | 10.15 | % | | | 6.84 | % | | | 24.27 | % | | | (0.86 | )% |
| | | | | |
Ratio of net expenses to average net assets | | | 1.13 | %8 | | | 1.13 | %8 | | | 1.14 | %8 | | | 1.14 | % | | | 1.14 | % |
| | | | | |
Ratio of gross expenses to average net assets9 | | | 1.29 | % | | | 1.28 | % | | | 1.26 | % | | | 1.27 | % | | | 1.26 | % |
| | | | | |
Ratio of net investment income to average net assets3 | | | 0.22 | % | | | 0.28 | % | | | 0.09 | % | | | 0.13 | % | | | 0.93 | % |
| | | | | |
Portfolio turnover | | | 45 | % | | | 34 | % | | | 31 | % | | | 75 | % | | | 102 | % |
| | | | | |
Net assets end of year (000’s) omitted | | | $6,922 | | | | $8,188 | | | | $9,622 | | | | $12,131 | | | | $22,885 | |
| | | | | | | | | | | | | | | | | | | | | |
46
|
AMG FQ Tax-Managed U.S. Equity Fund Financial Highlights For a share outstanding throughout each fiscal period |
| | | | | | | | | | | | | | | | | | | | |
| | | For the fiscal years ended October 31, | |
Class I | | 2020 | | | 2019 | | | 2018 | | | 2017 | | | 20161 | |
| | | | | |
Net Asset Value, Beginning of Year | | | $34.31 | | | | $31.69 | | | | $29.72 | | | | $24.14 | | | | $24.42 | |
| | | | | |
Income (loss) from Investment Operations: | | | | | | | | | | | | | | | | | | | | |
| | | | | |
Net investment income2,3 | | | 0.16 | | | | 0.17 | 4 | | | 0.11 | | | | 0.10 | 5 | | | 0.28 | 6 |
| | | | | |
Net realized and unrealized gain (loss) on investments | | | (0.25 | ) | | | 3.00 | | | | 2.00 | | | | 5.79 | | | | (0.43 | ) |
| | | | | |
Total income (loss) from investment operations | | | (0.09 | ) | | | 3.17 | | | | 2.11 | | | | 5.89 | | | | (0.15 | ) |
| | | | | |
Less Distributions to Shareholders from: | | | | | | | | | | | | | | | | | | | | |
Net investment income | | | (0.17 | ) | | | (0.14 | ) | | | (0.10 | ) | | | (0.31 | ) | | | (0.13 | ) |
| | | | | |
Net realized gain on investments | | | (0.05 | ) | | | (0.41 | ) | | | (0.04 | ) | | | — | | | | — | |
| | | | | |
Total distributions to shareholders | | | (0.22 | ) | | | (0.55 | ) | | | (0.14 | ) | | | (0.31 | ) | | | (0.13 | ) |
| | | | | |
Net Asset Value, End of Year | | | $34.00 | | | | $34.31 | | | | $31.69 | | | | $29.72 | | | | $24.14 | |
| | | | | |
Total Return3,7 | | | (0.27 | )% | | | 10.40 | % | | | 7.13 | % | | | 24.57 | % | | | (0.59 | )% |
| | | | | |
Ratio of net expenses to average net assets | | | 0.88 | %8 | | | 0.88 | %8 | | | 0.89 | %8 | | | 0.89 | % | | | 0.89 | % |
| | | | | |
Ratio of gross expenses to average net assets9 | | | 1.04 | % | | | 1.03 | % | | | 1.01 | % | | | 1.02 | % | | | 1.01 | % |
| | | | | |
Ratio of net investment income to average net assets3 | | | 0.47 | % | | | 0.53 | % | | | 0.34 | % | | | 0.38 | % | | | 1.19 | % |
| | | | | |
Portfolio turnover | | | 45 | % | | | 34 | % | | | 31 | % | | | 75 | % | | | 102 | % |
| | | | | |
Net assets end of year (000’s) omitted | | | $55,746 | | | | $61,767 | | | | $63,440 | | | | $60,421 | | | | $53,494 | |
| | | | | | | | | | | | | | | | | | | | | |
| 1 | Effective October 1, 2016, the Investor Class and Institutional Class were renamed Class N and Class I, respectively. |
| 2 | Per share numbers have been calculated using average shares. |
| 3 | Total returns and net investment income would have been lower had certain expenses not been offset. |
| 4 | Includes non-recurring dividends. Without these dividends, net investment income per share would have been $0.06 and $0.14 for Class N and Class I, respectively. |
| 5 | Includes non-recurring dividends. Without these dividends, net investment income per share would have been $0.01 and $0.08 for Class N and Class I, respectively. |
| 6 | Includes non-recurring dividends. Without these dividends, net investment income per share would have been $0.11 and $0.17 for Class N and Class I, respectively. |
| 7 | The total return is calculated using the published Net Asset Value as of fiscal year end. |
| 8 | Includes reduction from broker recapture amounting to 0.01%, 0.01% and less than 0.01% for the fiscal years ended 2020, 2019 and 2018, respectively. |
| 9 | Excludes the impact of expense reimbursement or fee waivers and expense reductions such as brokerage credits, but includes expense repayments and non-reimbursable expenses, if any, such as interest, taxes, and extraordinary expenses. (See Note 1(c) and 2 in the Notes to Financial Statements.) |
47
|
AMG FQ Long-Short Equity Fund Financial Highlights For a share outstanding throughout each fiscal year |
| | | | | | | | | | | | | | | | | | | | |
| | | For the fiscal years ended October 31, | |
| Class N | | 2020 | | | 2019 | | | 2018 | | | 2017 | | | 20161 | |
| | | | | |
Net Asset Value, Beginning of Year | | | $16.22 | | | | $15.68 | | | | $17.97 | | | | $15.48 | | | | $17.38 | |
| | | | | |
Income (loss) from Investment Operations: | | | | | | | | | | | | | | | | | | | | |
| | | | | |
Net investment income (loss)2,3 | | | 0.04 | 4 | | | 0.12 | 5 | | | (0.07 | ) | | | 0.10 | 6 | | | 0.14 | |
| | | | | |
Net realized and unrealized gain (loss) on investments | | | (1.84 | ) | | | 0.95 | | | | 1.94 | | | | 3.30 | | | | (0.31 | ) |
| | | | | |
Total income (loss) from investment operations | | | (1.80 | ) | | | 1.07 | | | | 1.87 | | | | 3.40 | | | | (0.17 | ) |
| | | | | |
Less Distributions to Shareholders from: | | | | | | | | | | | | | | | | | | | | |
| | | | | |
Net investment income | | | — | | | | (0.02 | ) | | | — | | | | (0.16 | ) | | | (0.15 | ) |
| | | | | |
Net realized gain on investments | | | (0.69 | ) | | | (0.51 | ) | | | (4.16 | ) | | | (0.75 | ) | | | (1.58 | ) |
| | | | | |
Total distributions to shareholders | | | (0.69 | ) | | | (0.53 | ) | | | (4.16 | ) | | | (0.91 | ) | | | (1.73 | ) |
| | | | | |
Net Asset Value, End of Year | | | $13.73 | | | | $16.22 | | | | $15.68 | | | | $17.97 | | | | $15.48 | |
| | | | | |
Total Return3,7 | | | (11.66 | )% | | | 7.15 | % | | | 12.54 | % | | | 22.62 | % | | | (0.98 | )% |
| | | | | |
Ratio of net expenses to average net assets | | | 1.04 | % | | | 1.28 | %8,9 | | | 2.24 | %8,9 | | | 1.09 | %9 | | | 1.05 | % |
| | | | | |
Ratio of gross expenses to average net assets10 | | | 1.08 | % | | | 1.30 | % | | | 2.36 | % | | | 1.14 | % | | | 1.08 | % |
| | | | | |
Ratio of net investment income (loss) to average net assets3 | | | 0.25 | % | | | 0.74 | % | | | (0.43 | )% | | | 0.60 | % | | | 0.88 | % |
| | | | | |
Portfolio turnover | | | 750 | % | | | 330 | % | | | 240 | % | | | 159 | % | | | 178 | % |
| | | | | |
Net assets end of year (000’s) omitted | | | $4,716 | | | | $14,301 | | | | $24,536 | | | | $3,495 | | | | $24,752 | |
| | | | | | | | | | | | | | | | | | | | | |
48
|
AMG FQ Long-Short Equity Fund Financial Highlights For a share outstanding throughout each fiscal year |
| | | | | | | | | | | | | | | | | | | | |
| | | For the fiscal years ended October 31, | |
| | | | | |
| Class I | | 2020 | | | 2019 | | | 2018 | | | 2017 | | | 20161 | |
| | | | | |
Net Asset Value, Beginning of Year | | | $16.25 | | | | $15.71 | | | | $17.97 | | | | $15.47 | | | | $17.37 | |
| | | | | |
Income (loss) from Investment Operations: | | | | | | | | | | | | | | | | | | | | |
| | | | | |
Net investment income (loss)2,3 | | | 0.08 | 4 | | | 0.16 | 5 | | | (0.02 | ) | | | 0.15 | 6 | | | 0.18 | |
| | | | | |
Net realized and unrealized gain (loss) on investments | | | (1.84 | ) | | | 0.95 | | | | 1.92 | | | | 3.33 | | | | (0.31 | ) |
| | | | | |
Total income (loss) from investment operations | | | (1.76 | ) | | | 1.11 | | | | 1.90 | | | | 3.48 | | | | (0.13 | ) |
| | | | | |
Less Distributions to Shareholders from: | | | | | | | | | | | | | | | | | | | | |
| | | | | |
Net investment income | | | — | | | | (0.06 | ) | | | — | | | | (0.23 | ) | | | (0.19 | ) |
| | | | | |
Net realized gain on investments | | | (0.69 | ) | | | (0.51 | ) | | | (4.16 | ) | | | (0.75 | ) | | | (1.58 | ) |
| | | | | |
Total distributions to shareholders | | | (0.69 | ) | | | (0.57 | ) | | | (4.16 | ) | | | (0.98 | ) | | | (1.77 | ) |
| | | | | |
Net Asset Value, End of Year | | | $13.80 | | | | $16.25 | | | | $15.71 | | | | $17.97 | | | | $15.47 | |
| | | | | |
Total Return3,7 | | | (11.38 | )% | | | 7.43 | % | | | 12.82 | % | | | 23.11 | % | | | (0.73 | )% |
| | | | | |
Ratio of net expenses to average net assets | | | 0.76 | % | | | 0.99 | %8,9 | | | 1.92 | %8,9 | | | 0.78 | %9 | | | 0.79 | % |
| | | | | |
Ratio of gross expenses to average net assets10 | | | 0.80 | % | | | 1.01 | % | | | 2.04 | % | | | 0.87 | % | | | 0.82 | % |
| | | | | |
Ratio of net investment income (loss) to average net assets3 | | | 0.53 | % | | | 1.03 | % | | | (0.11 | )% | | | 0.90 | % | | | 1.14 | % |
| | | | | |
Portfolio turnover | | | 750 | % | | | 330 | % | | | 240 | % | | | 159 | % | | | 178 | % |
| | | | | |
Net assets end of year (000’s) omitted | | | $38,990 | | | | $83,323 | | | | $55,590 | | | | $37,002 | | | | $33,715 | |
| | | | | | | | | | | | | | | | | | | | | |
| 1 | Effective October 1, 2016, the Investor Class and Institutional Class were renamed Class N and Class I, respectively. |
| 2 | Per share numbers have been calculated using average shares. |
| 3 | Total returns and net investment income (loss) would have been lower had certain expenses not been offset. |
| 4 | Includes non-recurring dividends. Without these dividends, net investment income (loss) per share would have been $(0.01) and $0.03 for Class N and Class I, respectively. |
| 5 | Includes non-recurring dividends. Without these dividends, net investment income per share would have been $0.07 and $0.12 for Class N and Class I, respectively. |
| 6 | Includes non-recurring dividends. Without these dividends, net investment income per share would have been $0.07 and $0.12 for Class N and Class I, respectively. |
| 7 | The total return is calculated using the published Net Asset Value as of fiscal year end. |
| 8 | Includes reduction from broker recapture amounting to less than 0.01% and 0.01% for the fiscal years ended October 31, 2019 and October 31, 2018, respectively. |
| 9 | Expense ratio includes dividend and interest expense related to securities sold short. Excluding such dividend and interest expense, the ratio of expenses to average net assets would be 1.04% and 0.75%, 1.04% and 0.72% and 1.04% and 0.73% for Class N and Class I, respectively, for the fiscal years ended October 31, 2019, October 31, 2018 and October 31, 2017, respectively. |
| 10 | Excludes the impact of expense reimbursement or fee waivers and expense reductions such as brokerage credits, but includes expense repayments and non-reimbursable expenses, if any, such as interest, taxes, and extraordinary expenses. (See Note 1(c) and 2 in the Notes to Financial Statements.) |
49
|
AMG FQ Global Risk-Balanced Fund Financial Highlights For a share outstanding throughout each fiscal year |
| | | | | | | | | | | | | | | | | | | | |
| | | For the fiscal years ended October 31, | |
| | | | | |
| Class N | | 2020 | | | 2019 | | | 2018 | | | 2017 | | | 20161 | |
| | | | | |
Net Asset Value, Beginning of Year | | | $16.54 | | | | $14.56 | | | | $15.77 | | | | $13.89 | | | | $12.93 | |
| | | | | |
Income (loss) from Investment Operations: | | | | | | | | | | | | | | | | | | | | |
| | | | | |
Net investment income (loss)2,3 | | | 0.02 | | | | 0.21 | | | | 0.26 | | | | 0.11 | | | | (0.02 | ) |
| | | | | |
Net realized and unrealized gain (loss) on investments | | | (2.41 | ) | | | 2.06 | | | | (1.43 | ) | | | 1.91 | | | | 1.16 | |
| | | | | |
Total income (loss) from investment operations | | | (2.39 | ) | | | 2.27 | | | | (1.17 | ) | | | 2.02 | | | | 1.14 | |
| | | | | |
Less Distributions to Shareholders from: | | | | | | | | | | | | | | | | | | | | |
| | | | | |
Net investment income | | | (0.58 | ) | | | (0.29 | ) | | | (0.04 | ) | | | (0.14 | ) | | | (0.18 | ) |
| | | | | |
Net Asset Value, End of Year | | | $13.57 | | | | $16.54 | | | | $14.56 | | | | $15.77 | | | | $13.89 | |
| | | | | |
Total Return3,4 | | | (15.01 | )% | | | 15.98 | % | | | (7.43 | )% | | | 14.69 | % | | | 8.97 | % |
| | | | | |
Ratio of net expenses to average net assets | | | 1.28 | %5 | | | 1.29 | % | | | 1.29 | % | | | 1.33 | % | | | 1.39 | % |
| | | | | |
Ratio of gross expenses to average net assets6 | | | 1.45 | % | | | 1.41 | % | | | 1.37 | % | | | 1.39 | % | | | 1.55 | % |
| | | | | |
Ratio of net investment income (loss) to average net assets3 | | | 0.17 | % | | | 1.38 | % | | | 1.67 | % | | | 0.76 | % | | | (0.15 | )% |
| | | | | |
Portfolio turnover | | | 193 | % | | | 15 | % | | | 27 | % | | | 26 | % | | | 71 | % |
| | | | | |
Net assets end of year (000’s) omitted | | | $1,110 | | | | $2,340 | | | | $1,870 | | | | $2,200 | | | | $3,725 | |
| | | | | | | | | | | | | | | | | | | | | |
50
|
AMG FQ Global Risk-Balanced Fund Financial Highlights For a share outstanding throughout each fiscal year |
| | | | | | | | | | | | | | | | | | | | |
| | | For the fiscal years ended October 31, | |
| | | | | |
| Class I | | 2020 | | | 2019 | | | 2018 | | | 2017 | | | 20161 | |
| | | | | |
Net Asset Value, Beginning of Year | | | $16.62 | | | | $14.64 | | | | $15.83 | | | | $13.97 | | | | $13.02 | |
| | | | | |
Income (loss) from Investment Operations: | | | | | | | | | | | | | | | | | | | | |
| | | | | |
Net investment income (loss)2,3 | | | 0.06 | | | | 0.25 | | | | 0.30 | | | | 0.16 | | | | (0.01 | ) |
| | | | | |
Net realized and unrealized gain (loss) on investments | | | (2.42 | ) | | | 2.06 | | | | (1.44 | ) | | | 1.92 | | | | 1.21 | |
| | | | | |
Total income (loss) from investment operations | | | (2.36 | ) | | | 2.31 | | | | (1.14 | ) | | | 2.08 | | | | 1.20 | |
| | | | | |
Less Distributions to Shareholders from: | | | | | | | | | | | | | | | | | | | | |
| | | | | |
Net investment income | | | (0.61 | ) | | | (0.33 | ) | | | (0.05 | ) | | | (0.22 | ) | | | (0.25 | ) |
| | | | | |
Net Asset Value, End of Year | | | $13.65 | | | | $16.62 | | | | $14.64 | | | | $15.83 | | | | $13.97 | |
| | | | | |
Total Return3,4 | | | (14.75 | )% | | | 16.23 | % | | | (7.20 | )% | | | 15.14 | % | | | 9.43 | % |
| | | | | |
Ratio of net expenses to average net assets | | | 1.03 | %5 | | | 1.04 | % | | | 1.04 | % | | | 0.99 | % | | | 0.99 | % |
| | | | | |
Ratio of gross expenses to average net assets6 | | | 1.20 | % | | | 1.16 | % | | | 1.12 | % | | | 1.05 | % | | | 1.15 | % |
| | | | | |
Ratio of net investment income to average net assets3 | | | 0.42 | % | | | 1.63 | % | | | 1.92 | % | | | 1.09 | % | | | 0.25 | % |
| | | | | |
Portfolio turnover | | | 193 | % | | | 15 | % | | | 27 | % | | | 26 | % | | | 71 | % |
| | | | | |
Net assets end of year (000’s) omitted | | | $1,528 | | | | $2,182 | | | | $1,484 | | | | $1,420 | | | | $7,215 | |
| | | | | | | | | | | | | | | | | | | | | |
51
|
AMG FQ Global Risk-Balanced Fund Financial Highlights For a share outstanding throughout each fiscal year |
| | | | | | | | | | | | | | | | | | | | |
| | | For the fiscal years ended October 31, | |
| | | | | |
| Class Z | | 2020 | | | 2019 | | | 2018 | | | 2017 | | | 20161 | |
Net Asset Value, Beginning of Year | | | $16.62 | | | | $14.64 | | | | $15.87 | | | | $14.00 | | | | $13.05 | |
Income (loss) from Investment Operations: | | | | | | | | | | | | | | | | | | | | |
Net investment income2,3 | | | 0.08 | | | | 0.28 | | | | 0.32 | | | | 0.18 | | | | 0.05 | |
| | | | | |
Net realized and unrealized gain (loss) on investments | | | (2.40 | ) | | | 2.05 | | | | (1.44 | ) | | | 1.92 | | | | 1.16 | |
Total income (loss) from investment operations | | | (2.32 | ) | | | 2.33 | | | | (1.12 | ) | | | 2.10 | | | | 1.21 | |
Less Distributions to Shareholders from: | | | | | | | | | | | | | | | | | | | | |
Net investment income | | | (0.64 | ) | | | (0.35 | ) | | | (0.11 | ) | | | (0.23 | ) | | | (0.26 | ) |
Net Asset Value, End of Year | | | $13.66 | | | | $16.62 | | | | $14.64 | | | | $15.87 | | | | $14.00 | |
Total Return3,4 | | | (14.57 | )% | | | 16.43 | % | | | (7.13 | )% | | | 15.23 | % | | | 9.55 | % |
Ratio of net expenses to average net assets | | | 0.88 | %5 | | | 0.89 | % | | | 0.89 | % | | | 0.89 | % | | | 0.89 | % |
Ratio of gross expenses to average net assets6 | | | 1.05 | % | | | 1.01 | % | | | 0.97 | % | | | 0.95 | % | | | 1.05 | % |
| | | | | |
Ratio of net investment income to average net assets3 | | | 0.57 | % | | | 1.78 | % | | | 2.07 | % | | | 1.19 | % | | | 0.36 | % |
Portfolio turnover | | | 193 | % | | | 15 | % | | | 27 | % | | | 26 | % | | | 71 | % |
Net assets end of year (000’s) omitted | | | $36,192 | | | | $49,163 | | | | $50,058 | | | | $59,712 | | | | $58,670 | |
| | | | | | | | | | | | | | | | | | | | | |
| 1 | Effective October 1, 2016, the Investor Class, Service Class and Institutional Class were renamed Class N, Class I and Class Z, respectively. |
| 2 | Per share numbers have been calculated using average shares. |
| 3 | Total returns and net investment income (loss) would have been lower had certain expenses not been offset. |
| 4 | The total return is calculated using the published Net Asset Value as of fiscal year end. |
| 5 | Includes reduction from broker recapture amounting to 0.01% for the fiscal year ended 2020. |
| 6 | Excludes the impact of expense reimbursement or fee waivers and expense reductions such as brokerage credits, but includes expense repayments and non-reimbursable expenses, if any, such as interest, taxes, and extraordinary expenses. (See Note 1(c) and 2 in the Notes to Financial Statements.) |
52
|
Notes to Financial Statements October 31, 2020 |
1. ORGANIZATION AND SUMMARY OF SIGNIFICANT ACCOUNTING POLICIES
AMG Funds I (the “Trust”) is an open-end management investment company, organized as a Massachusetts business trust, and registered under the Investment Company Act of 1940, as amended (the “1940 Act”). Currently, the Trust consists of a number of different funds, each having distinct investment management objectives, strategies, risks, and policies. Included in this report are AMG FQ Tax-Managed U.S. Equity Fund (“Tax-Managed”), AMG FQ Long-Short Equity Fund (“Long-Short Equity”) and AMG FQ Global Risk-Balanced Fund (“Global Risk-Balanced”), each a “Fund” and collectively, the “Funds”.
Each Fund offers different classes of shares. Tax-Managed and Long-Short Equity offer Class N and Class I shares. Global Risk-Balanced offers Class N, Class I and Class Z shares. Each class represents an interest in the same assets of the respective Fund. Although all share classes generally have identical voting rights, each share class votes separately when required by law. Different share classes may have different net asset values per share to the extent the share classes pay different distribution amounts and/or the expenses of such share classes differ. Each share class has its own expense structure. Please refer to a current prospectus for additional information on each share class.
Market disruptions associated with the COVID-19 pandemic have had a global impact, and uncertainty exists as to the long-term implications. Such disruptions can adversely affect assets of the Funds and thus Fund performance.
The Funds’ financial statements are prepared in accordance with accounting principles generally accepted in the United States of America (“U.S. GAAP”), including accounting and reporting guidance pursuant to Accounting Standards Codification Topic 946 applicable to investment companies. U.S. GAAP requires management to make estimates and assumptions that affect the reported amounts of assets and liabilities and disclosure of contingent assets and liabilities at the date of the financial statements and the reported amounts of income and expenses during the reporting period. Actual results could differ from those estimates and such differences could be material. The following is a summary of significant accounting policies followed by the Funds in the preparation of their financial statements:
a. VALUATION OF INVESTMENTS
Equity securities, including option contracts, traded on a national securities exchange or reported on the NASDAQ national market system (“NMS”) are valued at the last quoted sales price on the primary exchange or, if applicable, the NASDAQ official closing price or the official closing price of the relevant exchange or, lacking any sales, at the last quoted bid price or the mean between the last quoted bid and ask prices (the “mean price”). Equity securities traded in the over-the-counter market (other than NMS securities) are valued at the mean price. Foreign equity securities (securities principally traded in markets other than U.S. markets) are valued at the official closing price on the primary exchange or, for markets that either do not offer an official closing price or where the official closing price may not be representative of the overall market, the last quoted sale price.
Fixed income securities purchased with a remaining maturity exceeding 60 days are valued at the evaluated mean price provided by an authorized pricing service or, if an evaluated price is not available, by reference to other securities which are considered comparable in credit rating, interest rate, due date and other features (generally referred to as “matrix pricing”) or other similar pricing methodologies.
Fixed income securities purchased with a remaining maturity of 60 days or less are valued at amortized cost, provided that the amortized cost value is approximately the same as the fair value of the security valued without the use of amortized cost. Investments in other open-end registered investment companies are valued at their end of day net asset value per share.
Futures contracts for which market quotations are readily available are valued at the settlement price as of the close of the futures exchange.
Total Return Equity Basket Swaps (“Equity Basket Swap”) may be valued using a price obtained from the counterparty of the Equity Basket Swap as long as the value obtained from the counterparty is reasonable to the total value of the underlying securities constituting the Equity Basket Swap if such underlying securities were priced in accordance with the Funds’ equity security valuation policies as discussed above.
The Funds’ portfolio investments are generally valued based on independent market quotations or prices or, if none, “evaluative” or other market based valuations provided by third party pricing services approved by the Board of Trustees of the Trust (the “Board”). Under certain circumstances, the value of certain Fund portfolio investments (including derivatives) may be based on an evaluation of fair value, pursuant to procedures established by and under the general supervision of the Board. The Valuation Committee, which is comprised of the Independent Trustees of the Board, and the Pricing Committee, which is comprised of representatives from AMG Funds LLC (the “Investment Manager”) are the committees appointed by the Board to make fair value determinations. Each Fund may use the fair value of a portfolio investment to calculate its net asset value (“NAV”) in the event that the market quotation, price or market based valuation for the portfolio investment is not readily available or otherwise not determinable pursuant to the Board’s valuation procedures, if the Investment Manager or the Pricing Committee believes the quotation, price or market based valuation to be unreliable, or in certain other circumstances. When determining the fair value of an investment, the Pricing Committee and, if required under the Trust’s securities valuation procedures, the Valuation Committee, seeks to determine the price that the Fund might reasonably expect to receive from current sale of that portfolio investment in an arms-length transaction. Fair value determinations shall be based upon consideration of all available facts and information, including, but not limited to (i) attributes specific to the investment; (ii) fundamental and analytical data relating to the investment; and (iii) the value of other comparable securities or relevant financial instruments, including derivative securities, traded on other markets or among dealers.
The values assigned to fair value portfolio investments are based on available information and do not necessarily represent amounts that might ultimately be realized in the future, since such amounts depend on future developments inherent in long-term investments. Because of the inherent uncertainty of valuation, those estimated values may differ significantly from the values that would have been used had a ready market for the investments existed, and the differences could be material. The Board will be presented with a quarterly report showing as of the most recent quarter end, all outstanding securities fair valued by the Funds, including a comparison with the prior quarter end and the percentage of the Funds that the security represents at each quarter end.
With respect to foreign equity securities and certain foreign fixed income securities, the Board has adopted a policy that securities held in the Funds that can be fair valued by the applicable fair value pricing service are fair valued on each business day provided that each individual price exceeds a pre-established confidence level.
53
|
Notes to Financial Statements (continued) |
U.S. GAAP defines fair value as the price that a fund would receive to sell an asset or pay to transfer a liability in an orderly transaction between market participants at the measurement date. U.S. GAAP also establishes a framework for measuring fair value, and a three level hierarchy for fair value measurements based upon the transparency of inputs to the valuation of an asset or liability. Inputs may be observable or unobservable and refer broadly to the assumptions that market participants would use in pricing the asset or liability. Observable inputs reflect the assumptions market participants would use in pricing the asset or liability based on market data obtained from sources independent of the Funds. Unobservable inputs reflect the Funds’ own assumptions about the assumptions that market participants would use in pricing the asset or liability developed based on the best information available in the circumstances. Each investment is assigned a level based upon the observability of the inputs which are significant to the overall valuation.
The three-tier hierarchy of inputs is summarized below:
Level 1 – inputs are quoted prices in active markets for identical investments (e.g., equity securities, open-end investment companies, futures contracts, options contracts)
Level 2 – other observable inputs (including, but not limited to: quoted prices for similar assets or liabilities in markets that are active, quoted prices for identical or similar assets or liabilities in markets that are not active, inputs other than quoted prices that are observable for the assets or liabilities (such as interest rates, yield curves, volatilities, prepayment speeds, loss severities, credit risks and default rates) or other market corroborated inputs) (e.g., debt securities, government securities, foreign currency exchange contracts, swaps, foreign securities utilizing international fair value pricing, fair valued securities with observable inputs)
Level 3 – inputs are significant unobservable inputs (including the Fund’s own assumptions used to determine the fair value of investments) (e.g., fair valued securities with unobservable inputs)
Changes in inputs or methodologies used for valuing investments may result in a transfer in or out of levels within the fair value hierarchy. The inputs or methodologies used for valuing investments may not necessarily be an indication of the risk associated with investing in those investments.
b. SECURITY TRANSACTIONS
Security transactions are accounted for as of trade date. Realized gains and losses on securities sold are determined on the basis of identified cost.
c. INVESTMENT INCOME AND EXPENSES
Dividend income is recorded on the ex-dividend date. Dividends from foreign securities are recorded on the ex-dividend date, and if after the fact, as soon as the Funds become aware of the ex-dividend date. Interest income, which includes amortization of premium and accretion of discount on debt securities, is accrued as earned. Dividend and interest income on foreign securities is recorded gross of any withholding tax. Non-cash dividends included in dividend income, if any, are reported at the fair market value of the securities received. Upon notification from issuers, distributions received from a real estate investment trust (“REIT”) may be redesignated as a reduction of cost of investments and/or realized gain. Other income and expenses are recorded on an accrual basis. Expenses that cannot be directly attributed to a Fund are apportioned among the funds in the Trust and other trusts or funds within the AMG Funds Family of Funds (collectively the “AMG Funds Family”) based upon their relative average net assets or number of shareholders. Investment income, realized and unrealized capital gains and losses, the common expenses of each Fund, and certain fund level expense reductions, if any, are allocated on a pro-rata basis to each class based on the relative net assets of each class to the total net assets of each Fund.
Tax Managed and Global Risk-Balanced had certain portfolio trades directed to various brokers under a brokerage recapture program. Credits received from the brokerage recapture program are earned and paid on a monthly basis, and are recorded as expense offsets, which serve to reduce the Funds’ overall expense ratio. For the fiscal year ended October 31, 2020, the impact on the expenses and expense ratios were as follows: Tax Managed - $4,476 or 0.01%, and Global Risk-Balanced - $3,493 or 0.01%.
d. DIVIDENDS AND DISTRIBUTIONS
Fund distributions resulting from either net investment income or realized net capital gains, if any, will normally be declared and paid at least annually in December. Distributions to shareholders are recorded on the ex-dividend date. Distributions are determined in accordance with federal income tax regulations, which may differ from net investment income and net realized capital gains for financial statement purposes (U.S. GAAP). Differences may be permanent or temporary. Permanent differences are reclassified among capital accounts in the financial statements to reflect their tax character. Permanent book and tax basis differences, if any, relating to shareholder distributions will result in reclassifications to paid-in capital. Temporary differences arise when certain items of income, expense and gain or loss are recognized in different periods for financial statement and tax purposes; these differences will reverse at some time in the future. Permanent differences are due to write-off of net operating loss. Temporary differences are due to wash sales, mark-to-market of open swaps, mark-to-market of foreign currency, futures and option contracts, qualified late-year losses, return of capital from REITs and capital loss carryforwards.
The tax character of distributions paid during the fiscal years ended October 31, 2020 and October 31, 2019 were as follows:
| | | | | | | | | | | | | | | | | | | | | | | | |
| | | Tax-Managed | | | Long-Short Equity | | | Global Risk-Balanced | |
| | | | | | |
| Distributions paid from: | | 2020 | | | 2019 | | | 2020 | | | 2019 | | | 2020 | | | 2019 | |
| | | | | | |
Ordinary income * | | | $323,855 | | | | $272,993 | | | | $1,902,248 | | | | $841,450 | | | | $2,014,504 | | | | $1,254,640 | |
| | | | | | |
Long-term capital gains | | | 99,294 | | | | 928,977 | | | | 2,368,437 | | | | 2,574,706 | | | | — | | | | — | |
| | | | | | | | | | | | | | | | | | | | | | | | |
| | | | | | |
| | | $423,149 | | | | $1,201,970 | | | | $4,270,685 | | | | $3,416,156 | | | | $2,014,504 | | | | $1,254,640 | |
| | | | | | | | | | | | | | | | | | | | | | | | |
| * | For tax purposes, short-term capital gain distributions, if any, are considered ordinary income distributions. |
54
|
Notes to Financial Statements (continued) |
As of October 31, 2020, the components of distributable earnings (excluding unrealized appreciation/depreciation) on a tax basis consisted of:
| | | | | | | | | | | | |
| | | Tax-Managed | | | Long-Short Equity | | | Global Risk-Balanced | |
Capital loss carryforward | | | — | | | | $8,317,424 | | | | $6,549,715 | |
Undistributed ordinary income | | | $186,394 | | | | — | | | | 216,168 | |
Undistributed long-term capital gains | | | 902,557 | | | | — | | | | — | |
Late-year loss deferral | | | — | | | | 209,913 | | | | — | |
At October 31, 2020, the cost of investments and the aggregate gross unrealized appreciation and depreciation for federal income tax purposes were as follows:
| | | | | | | | | | | | | | | | |
| Fund | | Cost | | | Appreciation | | | Depreciation | | | Net Appreciation (Depreciation) | |
Tax-Managed | | | $31,363,942 | | | | $31,116,003 | | | | $(311,118 | ) | | | $30,804,885 | |
Long-Short Equity | | | 18,413,019 | | | | 88,783 | | | | (198,049 | ) | | | (109,266 | ) |
Global Risk-Balanced | | | 40,376,181 | | | | 650,931 | | | | (1,532,367 | ) | | | (881,436 | ) |
e. FEDERAL TAXES
Each Fund currently qualifies as an investment company and intends to comply with the requirements under Subchapter M of the Internal Revenue Code of 1986, as amended, and to distribute substantially all of its taxable income and gains to its shareholders and to meet certain diversification and income requirements with respect to investment companies. Therefore, no provision for federal income or excise tax is included in the accompanying financial statements.
Additionally, based on each Fund’s understanding of the tax rules and rates related to income, gains and transactions for the foreign jurisdictions in which it invests, each Fund will provide for foreign taxes, and where appropriate, deferred foreign taxes.
Management has analyzed the Funds’ tax positions taken on federal income tax returns as of October 31, 2020, and for all open tax years (generally, the three prior taxable years), and has concluded that no provision for federal income tax is required in the Funds’ financial statements. Additionally, Management is not aware of any tax position for which it is reasonably possible that the total amounts of unrecognized tax benefits will change materially in the next twelve months.
f. CAPITAL LOSS CARRYOVERS AND DEFERRALS
As of October 31, 2020, the following Funds had capital loss carryovers for federal income tax purposes as shown in the following chart. These amounts may be used to offset future realized capital gains indefinitely, and retain their character as short-term and/or long-term.
| | | | | | | | | | | | |
| | | Capital Loss Carryover Amounts | | | | |
| | | |
| Fund | | Short-Term | | | Long-Term | | | Total | |
| | | |
Long-Short Equity | | | $8,194,720 | | | | $122,704 | | | | $8,317,424 | |
| | | |
Global Risk-Balanced | | | $3,996,587 | | | | $2,553,128 | | | | $6,549,715 | |
As of October 31, 2020, Tax Managed had no capital loss carryovers for federal income tax purposes. Should the Fund incur net capital losses for the fiscal year ended October 31, 2021, such amounts may be used to offset future realized capital gains indefinitely, and retain their character as either short-term and/or long-term.
g. CAPITAL STOCK
The Trust’s Declaration of Trust authorizes for each Fund the issuance of an unlimited number of shares of beneficial interest, without par value. Each Fund records sales and repurchases of its capital stock on the trade date.
For the fiscal years ended October 31, 2020 and October 31, 2019, the capital stock transactions by class for the Funds were as follows:
| | | | | | | | | | | | | | | | | | | | | | | | | | | | | | | | |
| | | | | | Tax-Managed | | | | | | | | | Long-Short Equity | | | | |
| | | | |
| | | October 31, 2020 | | | October 31, 2019 | | | October 31, 2020 | | | October 31, 2019 | |
| | | | | | | | |
| | | Shares | | | Amount | | | Shares | | | Amount | | | Shares | | | Amount | | | Shares | | | Amount | |
| | | | | | | | |
Class N: | | | | | | | | | | | | | | | | | | | | | | | | | | | | | | | | |
| | | | | | | | |
Proceeds from sale of shares | | | 9,440 | | | | $298,433 | | | | 18,717 | | | | $599,541 | | | | 211,610 | | | | $3,163,296 | | | | 1,989,840 | | | | $31,414,305 | |
| | | | | | | | |
Reinvestment of distributions | | | 798 | | | | 28,718 | | | | 4,186 | | | | 118,708 | | | | 36,393 | | | | 578,284 | | | | 88,302 | | | | 1,309,108 | |
| | | | | | | | |
Cost of shares repurchased | | | (45,297 | ) | | | (1,481,907 | ) | | | (88,040 | ) | | | (2,673,664 | ) | | | (786,253 | ) | | | (11,087,771 | ) | | | (2,761,497 | ) | | | (42,260,498 | ) |
| | | | | | | | | | | | | | | | | | | | | | | | | | | | | | | | |
| | | | | | | | |
Net decrease | | | (35,059 | ) | | | $(1,154,756 | ) | | | (65,137 | ) | | | $(1,955,415 | ) | | | (538,250 | ) | | | $(7,346,191) | | | | (683,355 | ) | | | $(9,537,085) | |
| | | | | | | | | | | | | | | | | | | | | | | | | | | | | | | | |
55
|
Notes to Financial Statements (continued) |
| | | | | | | | | | | | | | | | | | | | | | | | | | | | | | | | |
| | | | | | Tax-Managed | | | | | | | | | Long-Short Equity | | | | |
| | | | |
| | | October 31, 2020 | | | October 31, 2019 | | | October 31, 2020 | | | October 31, 2019 | |
| | | | | | | | |
| | | Shares | | | Amount | | | Shares | | | Amount | | | Shares | | | Amount | | | Shares | | | Amount | |
| | | | | | | | |
Class I: | | | | | | | | | | | | | | | | | | | | | | | | | | | | | | | | |
| | | | | | | | |
Proceeds from sale of shares | | | 47,300 | | | | $1,530,200 | | | | 66,958 | | | | $2,097,380 | | | | 888,503 | | | | $13,511,204 | | | | 2,854,424 | | | | $44,768,398 | |
| | | | | | | | |
Reinvestment of distributions | | | 10,453 | | | | 375,154 | | | | 36,540 | | | | 1,033,349 | | | | 227,253 | | | | 3,620,144 | | | | 137,041 | | | | 2,048,386 | |
| | | | | | | | |
Cost of shares repurchased | | | (218,571 | ) | | | (7,108,343 | ) | | | (305,225 | ) | | | (9,439,666 | ) | | | (3,416,477 | ) | | | (47,894,255 | ) | | | (1,403,852 | ) | | | (21,845,782 | ) |
| | | | | | | | | | | | | | | | | | | | | | | | | | | | | | | | |
| | | | | | | | |
Net increase (decrease) | | | (160,818 | ) | | | $(5,202,989 | ) | | | (201,727 | ) | | | $(6,308,937 | ) | | | (2,300,721 | ) | | | $(30,762,907 | ) | | | 1,587,613 | | | | $24,971,002 | |
| | | | | | | | | | | | | | | | | | | | | | | | | | | | | | | | |
| | | | | | | | | | | | | | | | | | | | | | | | |
| | | | | | Global Risk-Balanced | | | | | | | | | | | | |
| | | | | | |
| | | October 31, 2020 | | | October 31, 2019 | | | �� | | | | | | |
| | | | | | | | |
| | | Shares | | | Amount | | | Shares | | | Amount | | | | | | | | | |
| | | | | | | | |
Class N: | | | | | | | | | | | | | | | | | | | | | | | | |
| | | | | | | | |
Proceeds from sale of shares | | | 9,833 | | | | $156,768 | | | | 49,315 | | | | $808,428 | | | | | | | | | |
| | | | | | | | |
Reinvestment of distributions | | | 5,052 | | | | 81,284 | | | | 2,679 | | | | 37,124 | | | | | | | | | |
| | | | | | | | |
Cost of shares repurchased | | | (74,612 | ) | | | (1,131,549 | ) | | | (38,960 | ) | | | (619,410 | ) | | | | | | | | |
| | | | | | | | | | | | | | | | | | | | | | | | |
| | | | | | | | |
Net increase (decrease) | | | (59,727 | ) | | | $(893,497 | ) | | | 13,034 | | | | $226,142 | | | | | | | | | |
| | | | | | | | | | | | | | | | | | | | | | | | |
| | | | | | | | |
Class I: | | | | | | | | | | | | | | | | | | | | | | | | |
| | | | | | | | |
Proceeds from sale of shares | | | 12,337 | | | | $196,102 | | | | 63,262 | | | | $997,739 | | | | | | | | | |
| | | | | | | | |
Reinvestment of distributions | | | 5,010 | | | | 80,875 | | | | 2,408 | | | | 33,497 | | | | | | | | | |
| | | | | | | | |
Cost of shares repurchased | | | (36,648 | ) | | | (554,743 | ) | | | (35,813 | ) | | | (567,632 | ) | | | | | | | | |
| | | | | | | | | | | | | | | | | | | | | | | | |
| | | | | | | | |
Net increase (decrease) | | | (19,301 | ) | | | $(277,766 | ) | | | 29,857 | | | | $463,604 | | | | | | | | | |
| | | | | | | | | | | | | | | | | | | | | | | | |
| | | | | | | | |
Class Z: | | | | | | | | | | | | | | | | | | | | | | | | |
| | | | | | | | |
Proceeds from sale of shares | | | 60,251 | | | | $825,289 | | | | 25,286 | | | | $381,973 | | | | | | | | | |
| | | | | | | | |
Reinvestment of distributions | | | 114,271 | | | | 1,843,200 | | | | 83,556 | | | | 1,160,590 | | | | | | | | | |
| | | | | | | | |
Cost of shares repurchased | | | (481,439 | ) | | | (6,838,603 | ) | | | (570,377 | ) | | | (8,772,233 | ) | | | | | | | | |
| | | | | | | | | | | | | | | | | | | | | | | | |
| | | | | | | | |
Net decrease | | | (306,917 | ) | | $ | (4,170,114 | ) | | | (461,535 | ) | | $ | (7,229,670 | ) | | | | | | | | |
| | | | | | | | | | | | | | | | | | | | | | | | |
h. REPURCHASE AGREEMENTS AND JOINT REPURCHASE AGREEMENTS
The Funds may enter into third-party repurchase agreements for temporary cash management purposes and third-party or bilateral joint repurchase agreements for reinvestment of cash collateral on securities lending transactions under the securities lending program offered by The Bank of New York Mellon (“BNYM”) (the “Program”) (collectively, “Repurchase Agreements”). The value of the underlying collateral, including accrued interest, must equal or exceed the value of the Repurchase Agreements during the term of the agreement. For joint repurchase agreements, the Funds participate on a pro rata basis with other clients of BNYM in its share of the underlying collateral under such joint repurchase agreements and in its share of proceeds from any repurchase or other disposition of the underlying collateral. The underlying collateral for all Repurchase Agreements is held in safekeeping by the Funds’ custodian or at the Federal Reserve Bank. If the seller defaults and the value of the collateral declines, or if bankruptcy proceedings commence with respect to the seller of the security, realization of the collateral by the Funds may be delayed or limited. Pursuant to the Program, the Funds are indemnified for such losses by BNYM on joint repurchase agreements.
At October 31, 2020, the market value of Repurchase Agreements outstanding for Tax-Managed and Global Risk-Balanced were $340,570 and $182,291, respectively. Long-Short Equity had no Repurchase Agreements outstanding.
i. FOREIGN CURRENCY TRANSLATION
The books and records of the Funds are maintained in U.S. dollars. The value of investments, assets and liabilities denominated in currencies other than U.S. dollars are translated into U.S. dollars based upon current foreign exchange rates. Purchases and sales of foreign investments, income and expenses are converted into U.S. dollars based on currency exchange rates prevailing on the respective dates of such transactions. Net realized and unrealized gain (loss) on foreign currency transactions represent: (1) foreign exchange gains and losses from the sale and holdings of foreign currencies; (2) gains and losses between trade date and settlement date on investment securities transactions and foreign currency exchange contracts; and (3) gains and losses from the difference between amounts of interest and dividends recorded and the amounts actually received.
56
|
Notes to Financial Statements (continued) |
The Funds do not isolate the net realized and unrealized gain or loss resulting from changes in exchange rates from the fluctuations in market prices of securities held. Such fluctuations are included with the net realized and unrealized gain or loss on investments.
2. AGREEMENTS AND TRANSACTIONS WITH AFFILIATES
For each of the Funds, the Trust has entered into an investment advisory agreement under which the Investment Manager, a subsidiary and the U.S. retail distribution arm of Affiliated Managers Group, Inc. (“AMG”), serves as investment manager to the Funds and is responsible for the Funds’ overall administration and operations. The Investment Manager selects one or more subadvisers for the Funds (subject to Board approval) and monitors each subadviser’s investment performance, security holdings and investment strategies. Each Fund’s investment portfolio is managed by First Quadrant, L.P. (“First Quadrant”), who serves pursuant to a subadvisory agreement with the Investment Manager. AMG indirectly owns a majority interest in First Quadrant.
Investment management fees are paid directly by the Funds to the Investment Manager based on average daily net assets. For the fiscal year ended October 31, 2020, the Funds’ investment management fees were paid at the following annual rate of each Fund’s respective average daily net assets:
| | | | |
Tax-Managed | | | 0.70 | % |
| |
Long-Short Equity | | | 0.35 | % |
| |
Global Risk-Balanced | | | 0.60 | % |
The Investment Manager has contractually agreed, through at least March 1, 2021, to waive management fees and/or pay or reimburse fund expenses in order to limit total annual Fund operating expenses after fee waiver and expense reimbursements (exclusive of taxes, interest (including interest incurred in connection with bank and custody overdrafts and in connection with securities sold short), shareholder servicing fees, distribution and service (12b-1) fees, brokerage commissions and other transaction costs, dividends payable with respect to securities sold short, acquired fund fees and expenses and extraordinary expenses) of Tax-Managed, Long-Short Equity and Global Risk-Balanced to 0.89%, 0.69% and 0.89%, respectively, of each Fund’s average daily net assets (this annual rate or such other annual rate that may be in effect from time to time, the “Expense Cap”), subject to later reimbursement by the Funds in certain circumstances.
In general, for a period of up to 36 months after the date any amounts are paid, waived or reimbursed by the Investment Manager, the Investment Manager may recover such amounts from a Fund, provided that such repayment would not cause the Fund’s total annual operating expenses after fee waiver and expense reimbursements (exclusive of the items noted in the parenthetical above) to exceed either (i) the Expense Cap in effect at the time such amounts were paid, waived or reimbursed, or (ii) the Expense Cap in effect at the time of such repayment by the Fund.
The contractual expense limitation may only be terminated in the event the Investment Manager or a successor ceases to be the investment manager of a Fund or a successor fund, by mutual agreement between the Investment Manager and the Board, or in the event of a Fund’s liquidation unless the Fund is reorganized or is a party to a merger in which the surviving entity is successor to the accounting and performance information of a Fund.
At October 31, 2020, the Funds’ expiration of reimbursements subject to recoupment is as follows:
| | | | | | | | | | | | |
| Expiration | | | | | | | | | |
| Period | | Tax-Managed | | | Long-Short Equity | | | Global Risk-Balanced | |
| | | |
Less than 1 year | | | $92,665 | | | | $58,523 | | | | $49,633 | |
| | | |
1-2 years | | | 98,178 | | | | 34,444 | | | | 61,763 | |
| | | |
2-3 years | | | 97,260 | | | | 24,885 | | | | 70,694 | |
| | | | | | | | | | | | |
| | | |
Total | | | $288,103 | | | | $117,852 | | | | $182,090 | |
| | | | | | | | | | | | |
The Trust, on behalf of the Funds, has entered into an amended and restated Administration Agreement under which the Investment Manager serves as the Funds’ administrator (the “Administrator”) and is responsible for all non-portfolio management aspects of managing the Funds’ operations, including administration and shareholder services to each Fund. Each Fund pays a fee to the Administrator at the rate of 0.15% per annum of the Fund’s average daily net assets for this service.
The Funds are distributed by AMG Distributors, Inc. (the “Distributor”), a wholly-owned subsidiary of the Investment Manager. The Distributor serves as the distributor and underwriter for each Fund and is a registered broker-dealer and member of the Financial Industry Regulatory Authority, Inc. (“FINRA”). Shares of each Fund will be continuously offered and will be sold directly to prospective purchasers and through brokers, dealers or other financial intermediaries who have executed selling agreements with the Distributor. Generally the Distributor bears all or a portion of the expenses of providing services pursuant to the distribution agreement, including the payment of the expenses relating to the distribution of prospectuses for sales purposes and any advertising or sales literature.
The Trust has adopted a distribution and service plan (the “Plan”) with respect to the Class N shares of each Fund, in accordance with the requirements of Rule 12b-1 under the 1940 Act and the requirements of the applicable rules of FINRA regarding asset-based sales charges. Pursuant to the Plan, each Fund may make payments to the Distributor for its expenditures in financing any activity primarily intended to result in the sale of each Fund’s Class N shares and for maintenance and personal service provided to existing shareholders of that class. The Plan authorized payments to the Distributor up to 0.25% annually of each Fund’s average daily net assets attributable to the Class N shares.
For Class N and Class I shares of Long-Short Equity and Global Risk-Balanced, the Board has approved reimbursement payments to the Investment Manager for shareholder servicing expenses (“shareholder servicing fees”) incurred. Shareholder servicing fees include payments to financial intermediaries, such as broker-dealers (including fund supermarket platforms), banks, and trust companies who provide shareholder recordkeeping, account servicing and other services. The Class N and Class I shares may reimburse the Investment Manager for the actual amount incurred up to a maximum annual rate of each Class’s average daily net assets as shown in the table below.
57
|
Notes to Financial Statements (continued) |
The impact on the annualized expense ratios for the fiscal year ended October 31, 2020, were as follows:
| | | | | | | | |
| Fund | | Maximum Annual
Amount
Approved | | | Actual
Amount
Incurred | |
Long-Short Equity | | | | | | | | |
Class N | | | 0.10% | | | | 0.10% | |
Class I | | | 0.10% | | | | 0.07% | |
Global Risk-Balanced | | | | | | | | |
Class N | | | 0.15% | | | | 0.15% | |
Class I | | | 0.15% | | | | 0.15% | |
The Board provides supervision of the affairs of the Trust and other trusts within the AMG Funds Family. The Trustees of the Trust who are not affiliated with the Investment Manager receive an annual retainer and per meeting fees for regular, special and telephonic meetings, and they are reimbursed for out-of-pocket expenses incurred while carrying out their duties as Board members. The Chairman of the Board and the Audit Committee Chair receive additional annual retainers. Certain Trustees and Officers of the Funds are Officers and/or Directors of the Investment Manager, AMG and/or the Distributor.
The Securities and Exchange Commission (the “SEC”) granted an exemptive order that permits the Funds to lend and borrow money for certain temporary purposes directly to and from other eligible funds in the AMG Funds Family. Participation in this interfund lending program is voluntary for both the borrowing and lending funds, and an interfund loan is only made if it benefits each participating fund. The Administrator manages the program according to procedures approved by the Board, and the Board monitors the operation of the program. An interfund loan must comply with certain conditions set out in the exemptive order, which are designed to assure fairness and protect all participating funds. The interest earned and interest paid on interfund loans are included on the Statement of Operations as interest income and miscellaneous expense, respectively. At October 31, 2020, the Funds had no interfund loans outstanding.
The following Funds utilized the interfund loan program during the fiscal year ended October 31, 2020:
| | | | | | | | | | | | | | | | |
| Fund | | Average
Lent | | | Number
of Days | | | Interest
Earned | | | Average
Interest Rate | |
| | | | |
Long-Short Equity | | | $2,344,007 | | | | 10 | | | | $1,323 | | | | 2.059% | |
| | | | |
Global Risk-Balanced | | | 986,446 | | | | 10 | | | | 475 | | | | 1.757% | |
3. PURCHASES AND SALES OF SECURITIES
Purchases and sales of securities (excluding short-term securities and U.S. Government Obligations) for the fiscal year ended October 31, 2020, were as follows:
| | | | | | | | |
| | | Long Term Securities | |
| | |
| Fund | | Purchases | | | Sales | |
| | |
Tax-Managed | | | $28,989,219 | | | | $35,479,959 | |
| | |
Long-Short Equity | | | 296,482,203 | | | | 347,568,778 | |
| | |
Global Risk-Balanced | | | 39,177,528 | | | | 41,983,230 | |
The Funds had no purchases or sales of U.S. Government Obligations during the fiscal year ended October 31, 2020.
4. PORTFOLIO SECURITIES LOANED
The Funds participate in the Program providing for the lending of securities to qualified borrowers. Securities lending income includes earnings of such temporary cash investments, plus or minus any rebate to a borrower. These earnings (after any rebate) are then divided between BNYM, as a fee for its services under the Program, and the Funds, according to agreed-upon rates. Collateral on all securities loaned is accepted in cash, U.S. Treasury Obligations or U.S. Government Agency Obligations. Collateral is maintained at a minimum level of 102% (105% in the case of certain foreign securities) of the market value, plus interest, if applicable, of investments on loan. It is the Funds’ policy to obtain additional collateral from or return excess collateral to the borrower by the end of the next business day, following the valuation date of the securities loaned. Therefore, the value of the collateral held may be temporarily less than the value of the securities on loan. Lending securities entails a risk of loss to the Funds if and to the extent that the market value of the securities loaned were to increase and the borrower did not increase the collateral accordingly, and the borrower fails to return the securities. Under the terms of the Program, the Funds are indemnified for such losses by BNYM. Cash collateral is held in separate omnibus accounts managed by BNYM, who is authorized to exclusively enter into joint repurchase agreements for that cash collateral. Securities collateral is held in separate omnibus accounts managed by BNYM that cannot be sold or pledged. BNYM bears the risk of any deficiency in the amount of the cash collateral available for return to the borrower due to any loss on the collateral invested. Loans of securities are terminable at any time and the borrower, after notice, is required to return borrowed securities as soon as practical, which is normally within three business days.
The value of securities loaned on positions held, cash collateral and securities collateral received at October 31, 2020, were as follows:
| | | | | | | | | | | | | | | | |
| Fund | | Securities
Loaned | | | Cash
Collateral
Received | | | Securities
Collateral
Received | | | Total
Collateral
Received | |
| | | | |
Tax-Managed | | | $3,698,901 | | | | $340,570 | | | | $3,484,228 | | | | $3,824,798 | |
| | | | |
Global Risk-Balanced | | | 974,420 | | | | 182,291 | | | | 810,012 | | | | 992,303 | |
The following table summarizes the securities received as collateral for securities lending at October 31, 2020:
| | | | | | |
| Fund | | Collateral Type | | Coupon
Range | | Maturity Date Range |
| | | |
Tax-Managed | | U.S.
Treasury
Obligations | | 0.010%-8.125% | | 11/15/20-05/15/50 |
| | | |
Global Risk-Balanced | | U.S.
Treasury
Obligations | | 0.010%-3.625% | | 12/31/20-02/15/50 |
5. FOREIGN SECURITIES
Global Risk-Balanced invests in securities of foreign entities and in instruments denominated in foreign currencies which involve risks not typically associated with investments in domestic securities. Non-domestic securities carry special risks, such as exposure to currency fluctuations, less developed or less efficient trading markets, political instability, a lack of company information, differing auditing and legal standards, and, potentially, less liquidity. Realized gains in
58
|
Notes to Financial Statements (continued) |
certain countries may be subject to foreign taxes at the Fund level and the Fund would pay such foreign taxes at the appropriate rate for each jurisdiction.
6. COMMITMENTS AND CONTINGENCIES
Under the Trust’s organizational documents, its trustees and officers are indemnified against certain liabilities arising out of the performance of their duties to the Trust. In addition, in the normal course of business, the Funds may enter into contracts and agreements that contain a variety of representations and warranties, which provide general indemnifications. The maximum exposure to the Funds under these arrangements is unknown, as this would involve future claims that may be made against a Fund that have not yet occurred. However, based on experience, the Funds had no prior claims or losses and expect the risks of loss to be remote.
7. FORWARD COMMITMENTS
Certain transactions, such as futures and forward transactions may have a similar effect on a Fund’s net asset value as if a Fund had created a degree of leverage in its portfolio. However, if a Fund enters into such a transaction, a Fund will establish a segregated account with its custodian in which it will maintain cash, U.S. government securities or other liquid securities equal in value to its obligations in respect to such transaction. Securities and other assets held in the segregated account may not be sold while the transaction is outstanding, unless other suitable assets are substituted.
8. DERIVATIVE INSTRUMENTS
The following disclosures contain information on how and why certain Funds use derivative instruments, the credit risk and how derivative instruments affect the Funds’ financial position, and results of operations. The location and fair value amounts of these instruments on the Statement of Assets and Liabilities, and the realized gains and losses and changes in unrealized gains and losses on the Statement of Operations, each categorized by type of derivative contract, are included in a table at the end of the applicable Fund’s Schedule of Portfolio Investments. For the fiscal year ended October 31, 2020, the average quarterly balances of derivative financial instruments outstanding were as follows:
| | | | | | | | | | | | |
| | | Long-Short Equity | | | Global Risk-Balanced | | | | |
| |
Financial Futures Contracts | | | | | |
| | | |
Average number of contracts purchased | | | 181 | | | | 580 | | | | | |
| | | |
Average number of contracts sold | | | 13 | | | | — | | | | | |
| | | |
Average notional value of contracts purchased | | | $27,671,970 | | | | $53,913,183 | | | | | |
| | | |
Average notional value of contracts sold | | | $2,127,840 | | | | — | | | | | |
| | | |
Options | | | | | | | | | | | | |
| | | |
Average value of option contracts purchased | | | — | | | | $649,304 | | | | | |
| | | |
Average value of option contracts written | | | — | | | | $537,829 | | | | | |
| | | | | | | | | | | | |
| | | Long-Short Equity | | | Global Risk-Balanced | | | | |
| | | |
Swap Agreements | | | | | | | | | | | | |
| | | |
Long Position: | | | | | | | | | | | | |
| | | |
Average notional value | | | $57,665,594 | | | | — | | | | | |
| | | |
Short Position: | | | | | | | | | | | | |
| | | |
Average notional value | | | $76,323,267 | | | | — | | | | | |
9. FUTURES CONTRACTS
Long-Short Equity entered into equity index futures contracts with the objective of maintaining exposure to equity stock markets while maintaining liquidity. Global Risk-Balanced entered into futures contracts, including futures contracts on fixed-income securities, interest rate futures contracts, foreign currency futures contracts and futures contracts on security indices (including broad-based security indices). Long-Short Equity and Global Risk-Balanced purchased and sold futures contracts to achieve a desired level of investment, whether to accommodate portfolio turnover or cash flows from capital shares transactions. There are certain risks associated with futures contracts. Prices may not move as expected or the Fund may not be able to close out the contract when it desires to do so, resulting in losses.
On entering into a futures contract, either cash or securities in an amount equal to a certain percentage of the contract value (initial margin) must be deposited with the futures broker. Subsequent variation margin payments are made or received by the Funds depending on the fluctuations in the value of the futures contracts and the value of cash or securities on deposit with the futures broker. The Funds must have total value at the futures broker consisting of either net unrealized gains, cash or securities collateral to meet the initial margin requirement, and any value over the initial margin requirement may be transferred to the Fund.
Long-Short Equity paid or received variation margin periodically, while Global Risk-Balanced paid or received variation margin on a daily basis. As of October 31, 2020, Long-Short Equity did not hold futures, while Global Risk-Balanced had an initial margin requirement of $2,361,069, which Global Risk-Balanced covered with securities deposited with the futures broker.
Variation margin on future contracts is recorded as unrealized appreciation or depreciation until the futures contract is closed or expired. The Funds recognize a realized gain or loss when the contract is closed or expires equal to the difference between the value of the contract at the time it was opened and the value at the time it was closed. Fluctuations in the value of the contracts are recorded in the Statement of Assets and Liabilities as an asset (liability) and in the Statement of Operations as unrealized appreciation (depreciation) until the contracts are closed, when they are recorded as realized gains (losses) on futures contracts.
10. OPTIONS
Long-Short Equity and Global Risk-Balanced may purchase and write call options and put options on a variety of underlying securities and instruments, including, but not limited to, specific securities, securities indices, futures contracts and foreign currencies. A call option gives the purchaser the right to buy, and obligates the writer to sell, the underlying security or instrument at the agreed-upon price during the option period. A put option gives the purchaser the right to sell, and obligates the writer to buy, the underlying security or instrument at the agreed-upon price during the option period. Options purchased are recorded as an asset, while options written (sold) are recorded as liabilities. When the Funds
59
|
Notes to Financial Statements (continued) |
write options they bear the risk of an unfavorable change in the market value of the instrument underlying the written option. When an option expires, the premium (original option value) is realized as a gain if the option was written or as a loss if the option was purchased. When the exercise of an option results in a cash settlement, the difference between the premium and the settlement proceeds is recognized as realized gain or loss. When securities are acquired or delivered upon exercise of an option, the acquisition cost or sale proceeds are adjusted by the amount of the premium. When an option is closed, the difference between the premium and the cost to close the position is realized as a gain or loss.
11. SWAPS
Long-Short Equity may enter into Equity Basket Swaps to obtain exposure to a portfolio of long and short securities. Under the terms of the agreement, the equity return basket swap is designed to function as a fund of direct investments in long and short equity positions. The Fund will receive all of the economic benefits and risks equivalent to direct investments in these positions such as: capital appreciation or depreciation, corporate actions, and dividends and interest received and paid, all of which are reflected in the swap value. The swap value also includes interest charges and credits (“financing”) related to the notional values of the long and short positions and cash balances within the swap. This financing is based on defined market rates or a specified benchmark rate, plus or minus a specified spread. Underlying positions constituting the Equity Basket Swap are reset periodically. On reset date, any unrealized gains (losses) on positions and accrued financing costs become available for cash settlement between Long-Short Equity and the swap counterparty. Cash settlement in and out of the swap may occur at a reset date, close-out date or at maturity.
A change in the market value of a Equity Basket Swap, unpaid dividend income and/or expense and financing are recognized as net change in unrealized appreciation or depreciation on swaps in the Statements of Operations. Payments received or paid, on resets, close-outs or maturities, are recorded in the statement of operations as realized gains or losses of swaps.
Swaps and Equity Basket Swaps are two-party contracts that may be subject to contractual restrictions on transferability and termination, and because they may have terms of greater than seven days, swap agreements may be considered to be illiquid. If a swap is not liquid, it may not be possible to initiate a transaction or liquidate a position at an advantageous time or price, which may result in significant losses. Moreover, the Fund bears the risk of loss of the amount expected to be received under a swap agreement in the event of the default or bankruptcy of a swap agreement counterparty. The Fund will enter into swap agreements only with counterparties that meet certain standards of creditworthiness. When a counterparty’s obligations are not fully secured by collateral, then the Fund is essentially an unsecured creditor of the counterparty. If the counterparty defaults, the Fund will have contractual remedies, but there is no assurance that a counterparty will be able to meet its obligations pursuant to such contracts or that, in the event of default, the Fund will succeed in enforcing contractual remedies. Counterparty risk still exists even if a counterparty’s obligations are secured by collateral because the Fund’s interest in collateral may not be perfected or additional collateral may not be promptly posted as required. Counterparty risk also may be more pronounced if a counterparty’s obligations exceed the amount of collateral held by the Fund, if any, the Fund is unable to exercise its interest in collateral upon default by the counterparty, or the termination value of the instrument varies significantly from the marked-to-market
value of the instrument. Investments in short Equity Basket Swaps subject the Fund to an unlimited risk of loss.
12. EXCHANGE TRADED NOTES
Global Risk-Balanced invests in Exchange Traded Notes (“ETNs”). ETNs are senior, unsecured, unsubordinated debt securities issued by a financial institution, listed on an exchange and traded in the secondary market. There are no periodic interest payments, and principal is not protected. The Fund could lose some or all of the amount invested. The price in the secondary market is determined by supply and demand, the current performance of the index, and the credit rating of the ETN issuer. At maturity, the issuer pays the Fund a return linked to the performance of the market index, such as a commodity index, to which the ETN is linked, minus the issuer’s fee. ETNs are subject to the risk of a breakdown in the futures markets that they use. As a means to obtain commodity exposure, the Fund invests in ETNs linked to commodity indices. The Fund may be exposed to a wide variety of commodity sectors, including, without limitation, agriculture, livestock, base/industrial metals, oil, energy and precious metals. Commodity prices, and the value of stocks of companies exposed to commodities, can be extremely volatile and are affected by a wide range of factors.
13. MARKET, CREDIT AND COUNTERPARTY RISKS
In the normal course of business, Global Risk-Balanced invests in securities and enters into transactions where risks exist due to market fluctuations and is exposed to credit risk with parties with whom it trades (issuers or counterparties). Market prices of investments held by the Fund may fall rapidly or unpredictably and will rise and fall due to changing economic, political, or market conditions or in response to events that affect particular industries or companies. The Fund may be exposed to credit or counterparty risk, or the risk that an institution or other entity with which the Fund has unsettled or open transactions will default or not perform under the contract. The Fund minimizes credit risk and counterparty risk by undertaking transactions with a large number of customers and counterparties on recognized and reputable exchanges. The Fund could lose money if the issuer or guarantor of a fixed income security, or the counterparty to a financial derivatives contract, repurchase agreement or a loan of portfolio securities, is unable or unwilling to make timely principal and/or interest payments, or to otherwise honor its obligations.
The Funds are subject to various Master Agreements, which govern the terms of certain transactions with select counterparties. These Master Agreements reduce the counterparty risk associated with relevant transactions by specifying credit protection mechanisms and providing standardization that improves legal certainty. Master Agreements can also help limit counterparty risk by specifying collateral posting arrangements at pre-arranged exposure levels. Under the Master Agreements, collateral is routinely transferred if the total net exposure to certain transactions (net of existing collateral already in place) governed under the relevant master agreement with a counterparty in a given account exceeds a specified threshold, which typically ranges from zero to $250,000 depending on the counterparty and the type of Master Agreement.
International Swaps and Derivatives Association, Inc. Master Agreements (“ISDA Master Agreements”) govern OTC financial derivative transactions entered into by the Funds and the respective counterparty. The ISDA Master Agreements maintain provisions for general obligations, representations, agreements, collateral and events of default or termination. Certain ISDA Master Agreements allow counterparties to OTC derivatives to terminate derivative contracts prior to
60
|
Notes to Financial Statements (continued) |
maturity in the event the Funds’ net assets decline by a stated percentage or the Funds fail to meet the terms of the ISDA Master Agreement, which requires accelerated settlement of all outstanding transactions under the applicable ISDA
Master Agreement. Any election to terminate early could be material to the financial statements.
14. MASTER NETTING AGREEMENTS
The Funds may enter into master netting agreements with their counterparties for the securities lending program, Repurchase Agreements and derivative instruments, which provide the right, in the event of default (including bankruptcy or insolvency) for the non-defaulting party to liquidate the collateral and calculate net exposure to the defaulting party or request additional collateral. For financial reporting purposes, the Funds do not offset financial assets and financial liabilities that are subject to master netting agreements in the Statement of Assets and Liabilities. For securities lending transactions, see Note 4.
The following table is a summary of the Funds’ open Repurchase Agreements and Equity Basket Swaps that are subject to a master netting agreement as of October 31, 2020:
| | | | | | | | | | | | | | | | | | | | |
| | | | | | Gross Amount Not Offset in the
Statement of Assets and Liabilities | | | | | | | |
| |
| Gross Amounts of
Assets Presented in
the Statement of |
| | | Offset | | |
| Net
Asset |
| | | Collateral | | | | Net | |
Fund | | | Assets and Liabilities | | | | Amount | | | | Balance | | | | Received | | | | Amount | |
| | | | | | | | | | | | | | | | | | | | |
| | | | | |
Tax-Managed | | | | | | | | | | | | | | | | | | | | |
| | | | | |
Citigroup Global Markets, Inc. | | | $340,570 | | | | �� — | | | | $340,570 | | | | $340,570 | | | | — | |
| | | | | |
Long-Short Equity | | | | | | | | | | | | | | | | | | | | |
| | | | | |
Morgan Stanley | | | $1,573,082 | | | | $(1,573,082) | | | | — | | | | — | | | | — | |
| | | | | |
Global Risk-Balanced | | | | | | | | | | | | | | | | | | | | |
| | | | | |
Nomura Securities International, Inc. | | | $182,291 | | | | — | | | | $182,291 | | | | $182,291 | | | | — | |
| | | | | | | | | | | | | | | | | | | | |
| | | | | | Gross Amount Not Offset in the
Statement of Assets and Liabilities | | | | | | | |
| |
| Gross Amounts of
Liabilities Presented
in the Statement of |
| | | Offset | | |
| Net
Liability |
| | | Collateral | | | | Net | |
Fund | | | Assets and Liabilities | | | | Amount | | | | Balance | | | | Received | | | | Amount | |
| | | | | | | | | | | | | | | | | | | | |
| | | | | |
Long-Short Equity | | | | | | | | | | | | | | | | | | | | |
| | | | | |
Morgan Stanley | | | $(2,226,814) | | | | $1,573,082 | | | | $(653,732) | | | | $653,732 | | | | — | |
15. SUBSEQUENT EVENTS
The Funds have determined that no material events or transactions occurred through the issuance date of the Funds’ financial statements which require an additional disclosure in or adjustment of the Funds’ financial statements.
61
|
Report of Independent Registered Public Accounting Firm |
| | |
TO THE BOARD OF TRUSTEES OF AMG FUNDS I AND SHAREHOLDERS OF AMG FQ TAX-MANAGED U.S. EQUITY FUND, AMG FQ LONG-SHORT EQUITY FUND AND AMG FQ GLOBAL RISK-BALANCED FUND: Opinions on the Financial Statements We have audited the accompanying statements of assets and liabilities, including the schedules of portfolio investments, of AMG FQ Tax-Managed U.S. Equity Fund, AMG FQ Long-Short Equity Fund, and AMG FQ Global Risk-Balanced Fund (three of the Funds constituting AMG Funds I, hereafter collectively referred to as the “Funds”) as of October 31, 2020, the related statements of operations for the year ended October 31, 2020, the statements of changes in net assets for each of the two years in the period ended October 31, 2020, including the related notes, and the financial highlights for each of the five years in the period ended October 31, 2020 (collectively referred to as the “financial statements”). In our opinion, the financial statements present fairly, in all material respects, the financial position of each of the Funds as of October 31, 2020, the results of each of their operations for the year then ended, the changes in each of their net assets for each of the two years in the period ended October 31 2020, and each of the financial highlights for each of the five years in the period ended October 31, 2020, in conformity with accounting principles generally accepted in the United States of America. Basis for Opinion These financial statements are the responsibility of the Funds’ management. Our responsibility is to express an opinion on the Funds’ financial statements based on our audits. We are a public accounting firm registered with the Public Company Accounting Oversight Board (United States) (PCAOB) and are required to be independent with respect to the Funds in accordance with the U.S. federal securities laws and the applicable rules and regulations of the Securities and Exchange Commission and the PCAOB. We conducted our audits of these financial statements in accordance with the standards of the PCAOB. Those standards require that we plan and perform the audits to obtain reasonable assurance about whether the financial statements are free of material misstatement, whether due to error or fraud. Our audits included performing procedures to assess the risks of material misstatement of the financial statements, whether due to error or fraud, and performing procedures that respond to those risks. Such procedures included examining, on a test basis, evidence regarding the amounts and disclosures in the financial statements. Our audits also included evaluating the accounting principles used and significant estimates made by management, as well as evaluating the overall presentation of the financial statements. Our procedures included confirmation of securities owned as of October 31, 2020, by correspondence with the custodian, transfer agent, and brokers; when replies were not received from brokers, we performed other auditing procedures. We believe that our audits provide a reasonable basis for our opinion. PricewaterhouseCoopers LLP Boston, Massachusetts December 23, 2020 We have served as the auditor of one or more investment companies in the AMG Funds Family since 1993. | | |
62
|
Other Information (unaudited) |
TAX INFORMATION
The AMG FQ Tax-Managed U.S. Equity Fund, AMG FQ Long-Short Equity Fund and AMG FQ Global Risk-Balanced Fund each hereby designates the maximum amount allowable of its net taxable income as qualified dividends as provided in the Jobs and Growth Tax Relief Reconciliation Act of 2003. The 2019/2020 Form 1099-DIV you receive for each Fund will show the tax status of all distributions paid to you during the year.
Pursuant to section 852 of the Internal Revenue Code, AMG FQ Tax-Managed U.S. Equity Fund, AMG FQ Long-Short Equity Fund and AMG FQ Global Risk-Balanced Fund each hereby designates $99,294, $2,368,437, and $0 respectively, as a capital gain distribution with respect to the taxable year ended October 31, 2020, or if subsequently determined to be different, the net capital gains of such fiscal year.
63
|
AMG Funds Trustees and Officers |
| | | | | | | | |
The Trustees and Officers of the Trust, their business addresses, principal occupations for the past five years and ages are listed below. The Trustees provide broad supervision over the affairs of the Trust and the Funds. The Trustees are experienced executives who meet periodically throughout the year to oversee the Funds’ activities, review contractual arrangements with companies that provide services to the Funds, and | | | | review the Funds’ performance. Unless otherwise noted, the address of each Trustee or Officer is the address of the Trust: 600 Steamboat Road, Suite 300, Greenwich, Connecticut 06830. There is no stated term of office for Trustees. Trustees serve until their resignation, retirement or removal in | | | | accordance with the Trust’s organizational documents and policies adopted by the Board from time to time. The Chairman of the Trustees, President, Treasurer and Secretary of the Trust are elected by the Trustees annually. Other officers hold office at the pleasure of the Trustees. |
Independent Trustees
The following Trustees are not “interested persons” of the Trust within the meaning of the 1940 Act:
| | |
Number of Funds Overseen in Fund Complex | | Name, Age, Principal Occupation(s) During Past 5 Years and Other Directorships Held by Trustee |
| | |
• Trustee since 2012 • Oversees 46 Funds in Fund Complex | | Bruce B. Bingham, 72 Partner, Hamilton Partners (real estate development firm) (1987-2020); Director of The Yacktman Funds (2 portfolios) (2000-2012). |
| | |
• Trustee since 2000 • Oversees 35 Funds in Fund Complex | | Edward J. Kaier, 75 Attorney at Law and Partner, Teeters Harvey Marrone & Kaier LLP (2007-Present); Attorney at Law and Partner, Hepburn Willcox Hamilton & Putnam, LLP (1977-2007); Trustee of Third Avenue Trust (3 portfolios) (2002-2019); Trustee of Third Avenue Variable Trust (1 portfolio) (2002-2019); Trustee of AMG Funds IV (11 portfolios) (2010 - 2020). |
| | |
• Trustee since 2013 • Oversees 49 Funds in Fund Complex | | Kurt A. Keilhacker, 57 Managing Partner, TechFund Capital (1997-Present); Managing Partner, TechFund Europe (2000-Present); Managing Partner, Elementum Ventures (2013-Present); Director, MetricStory, Inc. (2017-Present); Trustee, Wheaton College (2018-Present); Trustee, Gordon College (2001-2016). Trustee, Board Member, 6wind SA, (2002-2019). |
| | |
• Trustee since 2000 • Oversees 46 Funds in Fund Complex | | Steven J. Paggioli, 70 Independent Consultant (2002-Present); Trustee, Professionally Managed Portfolios (28 portfolios); Advisory Board Member, Sustainable Growth Advisors, LP; Independent Director, Muzinich BDC, Inc. (business development company) (2019-Present); Director, The Wadsworth Group; Independent Director, Chase Investment Counsel (2008–2019); Executive Vice President, Secretary and Director, Investment Company Administration, LLC and First Fund Distributors, INC. (1990-2001). |
| | |
• Trustee since 2013 • Oversees 46 Funds in Fund Complex | | Richard F. Powers III, 74 Adjunct Professor, U.S. Naval War College (2016-Present); Adjunct Professor, Boston College (2011-2015); Director, Ameriprise Financial Inc. (2005-2009); President and CEO of Van Kampen Investments Inc. (1998-2003); President, Morgan Stanley Client Group (2000-2002); Executive Vice President and Chief Marketing Officer of the Morgan Stanley Individual Investor Group (1984-1998). |
| | |
• Independent Chairman • Trustee since 2000 • Oversees 49 Funds in Fund Complex | | Eric Rakowski, 62 Professor of Law, University of California at Berkeley School of Law (1990-Present); Tax Attorney at Davis Polk & Wardwell and clerked for Judge Harry T. Edwards of the U.S. Court of Appeals for the District of Columbia Circuit and for Justice William J. Brennan Jr. of the U.S. Supreme Court; Director of Harding, Loevner Funds, Inc. (9 portfolios); Trustee of Third Avenue Trust (3 portfolios) (2002-2019); Trustee of Third Avenue Variable Trust (1 portfolio) (2002-2019). |
| | |
• Trustee since 2013 • Oversees 49 Funds in Fund Complex | | Victoria L. Sassine, 55 Adjunct Professor, Babson College (2007–Present); Director, Board of Directors, PRG Group (2017-Present); CEO, Founder, Scale Smarter Partners, LLC (2018-Present); Adviser, EVOFEM Biosciences (2019-Present); Teaching Fellow, Goldman Sachs 10,000 Small Business Initiative (2010-Present); Chairperson of the Board of Directors of Business Management Associates (2018 to 2019). |
| | |
• Trustee since 2000 • Oversees 46 Funds in Fund Complex | | Thomas R. Schneeweis, 73 Professor Emeritus, University of Massachusetts (2013-Present); President, TRS Associates (1982-Present); Board Member, Chartered Alternative Investment Association (“CAIA”) (2002-Present); Director, CAIA Foundation (2010-2019); Director, Institute for Global Asset and Risk Management (Education) (2010-Present); Co-Owner, Quantitative Investment Technologies (2014-Present); Co-Owner, Yes Wealth Management (2018-Present); Director of Research, Yes Wealth Management (2018-Present); Partner, S Capital Wealth Advisors (2015-2018); Partner, S Capital Management, LLC (2007-2015); President, Alternative Investment Analytics, LLC, (formerly Schneeweis Partners, LLC) (2001-2013); Finance Professor, University of Massachusetts (1977-2013). |
64
|
AMG Funds Trustees and Officers (continued) |
Interested Trustees
Each Trustee in the following table is an “interested person” of the Trust within the meaning of the 1940 Act. Ms. Carsman is an interested person of the Trust within the meaning of the 1940 Act by virtue of her position with, and interest in securities of, AMG.
| | |
Number of Funds Overseen in Fund Complex | | Name, Age, Principal Occupation(s) During Past 5 Years and Other Directorships Held by Trustee |
| | |
• Trustee since 2011 • Oversees 46 Funds in Fund Complex | | Christine C. Carsman, 68 Senior Policy Advisor, Affiliated Managers Group, Inc. (2019-Present); Chair of the Board of Directors, AMG Funds plc (2015-2018); Director, AMG Funds plc (2010-2018); Executive Vice President, Deputy General Counsel and Chief Regulatory Counsel, Affiliated Managers Group, Inc. (2017-2018); Senior Vice President and Deputy General Counsel, Affiliated Managers Group, Inc. (2011-2016); Senior Vice President and Chief Regulatory Counsel, Affiliated Managers Group, Inc. (2007-2011); Vice President and Chief Regulatory Counsel, Affiliated Managers Group, Inc. (2004-2007); Senior Counsel, Vice President and Director of Operational Risk Management and Compliance, Wellington Management Company, LLP (1995-2004); Director of Harding, Loevner Funds, Inc. (9 portfolios) (2017-Present); Secretary and Chief Legal Officer, AMG Funds, AMG Funds I, AMG Funds II and AMG Funds III (2004-2011). |
| |
| Officers | | |
Position(s) Held with Fund and Length of Time Served | | Name, Age, Principal Occupation(s) During Past 5 Years |
| | |
• President since 2018 • Principal Executive Officer since 2018 • Chief Executive Officer since 2018 • Chief Operating Officer since 2007 | | Keitha L. Kinne, 62 Chief Operating Officer, AMG Funds LLC (2007-Present); Chief Investment Officer, AMG Funds LLC (2008-Present); President and Principal, AMG Distributors, Inc. (2018-Present); Chief Operating Officer, AMG Distributors, Inc. (2007-Present); President, Chief Executive Officer and Principal Executive Officer, AMG Funds, AMG Funds I, AMG Funds II, AMG Funds III and AMG Funds IV (2018-Present); Chief Operating Officer, AMG Funds, AMG Funds I, AMG Funds II, and AMG Funds III (2007-Present); Chief Operating Officer, AMG Funds IV (2016-Present); Chief Operating Officer and Chief Investment Officer, Aston Asset Management, LLC (2016); President and Principal Executive Officer, AMG Funds, AMG Funds I, AMG Funds II and AMG Funds III (2012-2014); Managing Partner, AMG Funds LLC (2007-2014); President and Principal, AMG Distributors, Inc. (2012-2014); Managing Director, Legg Mason & Co., LLC (2006-2007); Managing Director, Citigroup Asset Management (2004-2006). |
| | |
• Secretary since 2015 • Chief Legal Officer since 2015 | | Mark J. Duggan, 55 Senior Vice President and Senior Counsel, AMG Funds LLC (2015-Present); Secretary and Chief Legal Officer, AMG Funds, AMG Funds I, AMG Funds II, AMG Funds III and AMG Funds IV (2015-Present); Attorney, K&L Gates, LLP (2009-2015). |
| | |
• Chief Financial Officer since 2017 • Treasurer since 2017 • Principal Financial Officer since 2017 • Principal Accounting Officer since 2017 | | Thomas G. Disbrow, 54 Vice President, Mutual Fund Treasurer & CFO, AMG Funds, AMG Funds LLC (2017-Present); Chief Financial Officer, Principal Financial Officer, Treasurer and Principal Accounting Officer, AMG Funds, AMG Funds I, AMG Funds II, AMG Funds III and AMG Funds IV (2017-Present); Managing Director - Global Head of Traditional Funds Product Control, UBS Asset Management (Americas), Inc. (2015-2017); Managing Director - Head of North American Funds Treasury, UBS Asset Management (Americas), Inc. (2011-2015). |
| | |
• Deputy Treasurer since 2017 | | John A. Starace, 50 Director, Mutual Fund Accounting, AMG Funds LLC (2017-Present); Vice President, Deputy Treasurer of Mutual Funds Services, AMG Funds LLC (2014-2017); Deputy Treasurer, AMG Funds, AMG Funds I, AMG Funds II, AMG Funds III and AMG Funds IV (2017-Present); Vice President, Citi Hedge Fund Services (2010-2014); Audit Senior Manager (2005-2010) and Audit Manager (2001-2005), Deloitte & Touche LLP. |
| | |
• Chief Compliance Officer since 2019 | | Patrick J. Spellman, 46 Vice President, Chief Compliance Officer, AMG Funds LLC (2017-Present); Chief Compliance Officer and Sarbanes-Oxley Code of Ethics Compliance Officer, AMG Funds, AMG Funds I, AMG Funds II, AMG Funds III and AMG Funds IV (2019-Present); Chief Compliance Officer, AMG Distributors, Inc., (2010-Present); Senior Vice President, Chief Compliance Officer, AMG Funds LLC (2011-2017); Anti-Money Laundering Compliance Officer, AMG Funds, AMG Funds I, AMG Funds II, and AMG Funds III (2014-2019); Anti-Money Laundering Officer, AMG Funds IV, (2016-2019); Compliance Manager, Legal and Compliance, Affiliated Managers Group, Inc. (2005-2011). |
| | |
• Assistant Secretary since 2016 | | Maureen A. Meredith, 35 Vice President, Counsel, AMG Funds LLC (2019-Present); Director, Counsel, AMG Funds LLC (2017-2018); Vice President, Counsel, AMG Funds LLC (2015-2017); Assistant Secretary, AMG Funds, AMG Funds I, AMG Funds II, AMG Funds III and AMG Funds IV (2016-Present); Associate, Ropes & Gray LLP (2011-2015); Law Fellow, Massachusetts Appleseed Center for Law and Justice (2010-2011). |
| | |
• Anti-Money Laundering Compliance Officer since 2019 | | Hector D. Roman, 43 Director, Legal and Compliance, AMG Funds LLC (2020-Present); Manager, Legal and Compliance, AMG Funds LLC (2017-2019); Director of Compliance, Morgan Stanley Investment Management (2015-2017); Senior Advisory, PricewaterhouseCoopers LLP (2014-2015); Risk Manager, Barclays Investment Bank (2008-2014); Anti-Money Laundering Compliance Officer, AMG Funds, AMG Funds I, AMG Funds II, AMG Funds III and AMG Funds IV (2019-Present). |
65
|
Annual Renewal of Investment Management and Subadvisory Agreements |
| | | | | | | | |
| At a meeting held via telephone and video conference on June 25, 20201, the Board of Trustees (the “Board” or the “Trustees”), and separately a majority of the Trustees who are not “interested persons” of AMG Funds I (the “Trust”) (the “Independent Trustees”), approved (i) the Investment Management Agreement, as amended pursuant to letter agreements at any time prior to the date of the meeting, with AMG Funds LLC (the “Investment Manager”) for each of AMG FQ Long-Short Equity Fund, AMG FQ Tax-Managed U.S. Equity Fund and AMG FQ Global Risk-Balanced Fund (each, a “Fund,” and collectively, the “Funds”) and separately each of Amendment No. 1 thereto dated July 1, 2015, and Amendment No. 2 thereto dated October 1, 2016 (collectively, the “Investment Management Agreements”) and (ii) the Subadvisory Agreement, as amended at any time prior to the date of the meeting, with the Subadviser for each Fund (collectively, the “Subadvisory Agreements”). The Independent Trustees were separately represented by independent legal counsel in connection with their consideration of the approval of these agreements. In considering the Investment Management Agreements and the Subadvisory Agreements, the Trustees reviewed a variety of materials relating to each Fund, the Investment Manager and the Subadviser, including the nature, extent and quality of services, comparative performance, fee and expense information for an appropriate peer group of similar mutual funds for each Fund (each, a “Peer Group”), performance information for the relevant benchmark index for each Fund (each, a “Fund Benchmark”), other relevant matters, and other information provided to them on a periodic basis throughout the year. Prior to voting, the Independent Trustees: (a) reviewed the foregoing information with their independent legal counsel; (b) received materials from their independent legal counsel discussing the legal standards applicable to their consideration of the Investment Management Agreements and the Subadvisory Agreements; and (c) met with their independent legal counsel in private sessions at which no representatives of management were present. | | | | Trustees also took into account information provided periodically throughout the previous year by the Investment Manager in Board meetings relating to the performance of its duties with respect to the Funds and the Trustees’ knowledge of the Investment Manager’s management and the quality of the performance of the Investment Manager’s duties under the Investment Management Agreements and Administration Agreement. In the course of their deliberations regarding the Investment Manager, the Trustees evaluated, among other things: (a) the extent and quality of the Investment Manager’s oversight of the operation and management of the Funds; (b) the quality of the Investment Manager’s oversight of the performance by the Subadviser of its portfolio management duties; (c) the Investment Manager’s ability to supervise the Funds’ other service providers; and (d) the Investment Manager’s compliance program. The Trustees also took into account that, in performing its functions under the Investment Management Agreements and supervising the Subadviser, the Investment Manager: performs periodic detailed analyses and reviews of the performance by the Subadviser of its obligations to each Fund, including without limitation, analysis and review of portfolio and other compliance matters and review of the Subadviser’s investment performance with respect to a Fund; prepares and presents periodic reports to the Board regarding the investment performance of the Subadviser and other information regarding the Subadviser, at such times and in such forms as the Board may reasonably request; reviews and considers any changes in the personnel of the Subadviser responsible for performing the Subadviser’s obligations and makes appropriate reports to the Board; reviews and considers any changes in the ownership or senior management of the Subadviser and makes appropriate reports to the Board; performs periodic in-person or telephonic diligence meetings, including with respect to compliance matters, with | | | | the request of the Board; designates and compensates from its own resources such personnel as the Investment Manager may consider necessary or appropriate to the performance of its services; and performs such other review and reporting functions as the Board shall reasonably request consistent with the Investment Management Agreements and applicable law. The Trustees noted the affiliation of the Subadviser with the Investment Manager, noting any potential conflicts of interest. The Trustees also took into account the financial condition of the Investment Manager with respect to its ability to provide the services required under the Investment Management Agreements and the Investment Manager’s undertaking to maintain contractual expense limitations for the Funds. The Trustees also considered the Investment Manager’s risk management processes. The Trustees also reviewed information relating to the Subadviser’s operations and personnel and the investment philosophy, strategies and techniques (its “Investment Strategy”) used in managing each Fund. Among other things, the Trustees reviewed information on portfolio management and other professional staff, information regarding the Subadviser’s organizational and management structure and the Subadviser’s brokerage policies and practices. The Trustees considered specific information provided regarding the experience of the individuals at the Subadviser with portfolio management responsibility for each Fund, including the information set forth in each Fund’s prospectus and statement of additional information. In the course of their deliberations, the Trustees evaluated, among other things: (a) the services rendered by the Subadviser in the past; (b) the qualifications and experience of the Subadviser’s personnel; and (c) the Subadviser’s compliance program. The Trustees also took into account the financial condition of the Subadviser with respect to its ability to provide the |
| | | | | | | | |
NATURE, EXTENT AND QUALITY OF SERVICES In considering the nature, extent and quality of the services provided by the Investment Manager, the Trustees reviewed information relating to the Investment Manager’s operations and personnel. Among other things, the Investment Manager provided financial information, information about its supervisory and professional staff and descriptions of its organizational and management structure. The | | | | representatives of the Subadviser; assists the Board and management of the Trust in developing and reviewing information with respect to the initial approval of each Subadvisory Agreement and annual consideration of each Subadvisory Agreement thereafter; prepares recommendations with respect to the continued retention of the Subadviser or the replacement of the Subadviser, including at the request of the Board; identifies potential successors to, or replacements of, the Subadviser or potential additional subadvisers, including performing appropriate due diligence, and developing and presenting to the Board a recommendation as to any such successor, replacement, or additional subadviser, including at | | | | services required under each Subadvisory Agreement. The Trustees also considered the Subadviser’s risk management processes. PERFORMANCE The Board considered each Fund’s net performance during relevant time periods as compared to the Fund’s Peer Group and Fund Benchmark and considered the gross performance of the Fund as compared to the Subadviser’s relevant performance composite that utilizes the same investment strategy and approach and noted that the Board reviews on a quarterly basis detailed information about both the Fund’s performance results and portfolio composition, as well as the Subadviser’s Investment Strategy. The Board was mindful of the Investment |
66
|
Annual Renewal of Investment Management and Subadvisory Agreements (continued) |
| | | | | | | | |
Manager’s expertise, resources and attention to monitoring the Subadviser’s performance, investment style and risk-adjusted performance with respect to the Funds and its discussions with the Subadviser’s management regarding the factors that contributed to the performance of the Funds. With respect to AMG FQ Long-Short Equity Fund, among other information relating to the Fund’s performance, the Trustees noted that the Fund’s performance for Class I shares (which share class has the earliest inception date and the largest amount of assets of all the share classes of the Fund) for the 1-year, 3-year, 5-year and 10-year periods ended March 31, 2020 was above the median performance of the Peer Group and above, above, below, and below, respectively, the performance of the Fund Benchmark, the Russell 3000® Index. The Trustees took into account management’s discussion of the Fund’s performance, including the fact that the Fund ranked in the top quintile relative to its Peer Group for the 3-year period and the top decile relative to its Peer Group for the 5-year and 10-year periods. The Trustees concluded that the Fund’s overall performance has been satisfactory. With respect to AMG FQ Tax-Managed U.S. Equity Fund, among other information relating to the Fund’s performance, the Trustees noted that the Fund’s performance for Class I shares (which share class has the earliest inception date and the largest amount of assets of all the share classes of the Fund) for the 1-year, 3-year, 5-year and 10-year periods ended March 31, 2020 was below, below, below, and above, respectively, the median performance of the Peer Group and below the performance of the Fund Benchmark, the Russell 3000® Index. The Trustees took into account management’s discussion of the Fund’s performance, including the reasons for the Fund’s underperformance. The Trustees concluded that the Fund’s overall performance has been satisfactory in light of the Fund’s investment objective, strategies and policies. | | | | into account management’s discussion of the Fund’s performance, including the reasons for the Fund’s underperformance. The Trustees concluded that the Fund’s overall performance has been satisfactory in light of the Fund’s investment objective, strategies and policies. ADVISORY AND SUBADVISORY FEES; FUND EXPENSES; PROFITABILITY; AND ECONOMIES OF SCALE In considering the reasonableness of the advisory fee payable to the Investment Manager, the Trustees reviewed information provided by the Investment Manager setting forth all revenues and other benefits, both direct and indirect (including any so-called “fallout benefits” such as reputational value derived from the Investment Manager serving as Investment Manager to a Fund), received by the Investment Manager and its affiliates attributable to managing each Fund and all the mutual funds in the AMG Funds Family of Funds; the cost of providing such services; the significant risks undertaken as Investment Manager and sponsor of the Funds, including investment, operational, enterprise, entrepreneurial, litigation, regulatory and compliance risks; and the resulting profitability to the Investment Manager and its affiliates from these relationships. The Trustees also considered the amount of the advisory fee retained by the Investment Manager after payment of the subadvisory fee with respect to each Fund. The Trustees also noted payments made or to be made from the Subadviser to the Investment Manager, and other payments made or to be made from the Investment Manager to the Subadviser. The Trustees also considered management’s discussion of the current asset levels of the Funds, and the impact on profitability of both the current asset levels and any future growth of assets of the Funds. | | | | noted that as a Fund’s assets increase over time, the Fund may realize other economies of scale to the extent the increase in assets is proportionally greater than the increase in certain other expenses. In considering the reasonableness of the subadvisory fees payable by the Investment Manager to the Subadviser, the Trustees reviewed information regarding the cost to the Subadviser of providing subadvisory services to each Fund and the resulting profitability from these relationships. The Trustees noted that, because the Subadviser is an affiliate of the Investment Manager, a portion of the Subadviser’s revenues or profits might be shared directly or indirectly with the Investment Manager. The Trustees also noted that the subadvisory fees are paid by the Investment Manager out of its advisory fee. The Board also took into account management’s discussion of the subadvisory fee structure, and the services the Subadviser provides in performing its functions under each Subadvisory Agreement. Based on the foregoing, the Trustees concluded that the profitability to the Subadviser is reasonable and that the Subadviser is not realizing material benefits from economies of scale that would warrant adjustments to the subadvisory fees at this time. Also with respect to economies of scale, the Trustees noted that as a Fund’s assets increase over time, the Fund may realize other economies of scale to the extent the increase in assets is proportionally greater than the increase in certain other expenses With respect to AMG FQ Long-Short Equity Fund, the Trustees noted that the management fees (which include both the advisory and administration fees) and total expenses (net of applicable expense waivers/reimbursements) of Class I shares of the Fund as of March 31, 2020 were both lower than the average for the Fund’s Peer Group. The Trustees took into account the fact that the Investment |
| | | | | | | | |
With respect to AMG FQ Global Risk-Balanced Fund, among other information relating to the Fund’s performance, the Trustees noted that the Fund’s performance for Class Z shares (which share class has the earliest inception date and the largest amount of assets of all the share classes of the Fund) for the 1-year, 3-year, 5-year and 10-year periods ended March 31, 2020 was below, below, below, and above, respectively, the median performance of the Peer Group and below the performance of the Fund Benchmark, a Composite Index (60% MSCI World Index and 40% FTSE World Government Bond Index (Hedged)). The Trustees took | | | | In considering the cost of services to be provided by the Investment Manager under each Investment Management Agreement and the profitability to the Investment Manager of its relationship with each Fund, the Trustees noted the undertaking by the Investment Manager to maintain contractual expense limitations for the Funds. The Board also took into account management’s discussion of the advisory fee structure and the services the Investment Manager provides in performing its functions under each Investment Management Agreement and supervising the Subadviser. Based on the foregoing, the Trustees concluded that the profitability to the Investment Manager is reasonable and that the Investment Manager is not realizing material benefits from economies of scale that would warrant adjustments to the advisory fee at this time. Also with respect to economies of scale, the Trustees | | | | Manager has contractually agreed, through March 1, 2021, to limit the Fund’s net annual operating expenses (subject to certain excluded expenses) to 0.69%. The Trustees concluded that, in light of the nature, extent and quality of the services provided by the Investment Manager and the Subadviser (which is an affiliate of the Investment Manager), the foregoing expense limitation and the considerations noted above with respect to the Investment Manager and the Subadviser, the Fund’s advisory and subadvisory fees are reasonable. With respect to AMG FQ Tax-Managed U.S. Equity Fund, the Trustees noted that the management fees (which include both the advisory and administration fees) and total expenses (net of applicable expense waivers/reimbursements) of Class I shares of the Fund as of March 31, 2020 were both higher than the |
67
|
Annual Renewal of Investment Management and Subadvisory Agreements (continued) |
| | | | | | | | |
average for the Fund’s Peer Group. The Trustees took into account the fact that the Investment Manager has contractually agreed, through March 1, 2021, to limit the Fund’s net annual operating expenses (subject to certain excluded expenses) to 0.89%. The Board also took into account management’s discussion of the Fund’s expenses and competitiveness with comparably sized funds and select competitors. The Trustees concluded that, in light of the nature, extent and quality of the services provided by the Investment Manager and the Subadviser (which is an affiliate of the Investment Manager), the foregoing expense limitation and the considerations noted above with respect to the Investment Manager and the Subadviser, the Fund’s advisory and subadvisory fees are reasonable. With respect to AMG FQ Global Risk-Balanced Fund, the Trustees noted that the management fees (which include both the advisory and administration fees) and total expenses (net of applicable expense waivers/reimbursements) of Class Z shares of the Fund as of March 31, 2020 were both lower than the average for the Fund’s Peer Group. The Trustees took into account the fact that the Investment Manager has contractually agreed, through March 1, 2021, to limit the Fund’s net annual operating expenses (subject to certain excluded expenses) to 0.89%. The Trustees concluded that, in light of the nature, extent | | | | and quality of the services provided by the Investment Manager and the Subadviser (which is an affiliate of the Investment Manager), the foregoing expense limitation and the considerations noted above with respect to the Investment Manager and the Subadviser, the Fund’s advisory and subadvisory fees are reasonable. * * * * After consideration of the foregoing, the Trustees also reached the following conclusions (in addition to the conclusions discussed above) regarding the Investment Management and Subadvisory Agreements: (a) the Investment Manager and the Subadviser have demonstrated that they possess the capability and resources to perform the duties required of them under each Investment Management Agreement and each Subadvisory Agreement and (b) the Investment Manager and Subadviser maintain appropriate compliance programs. Based on all of the above-mentioned factors and their related conclusions, with no single factor or conclusion being determinative and with each Trustee not necessarily attributing the same weight to each factor, the Trustees concluded that approval of each Investment Management Agreement and | | | | each Subadvisory Agreement would be in the best interests of the applicable Fund and its shareholders. Accordingly, on June 25, 2020, the Trustees, and separately a majority of the Independent Trustees, voted to approve the Investment Management and the Subadvisory Agreements for each Fund. 1 The Trustees determined that the conditions surrounding COVID-19 constituted unforeseen or emergency circumstances and that reliance on the Securities and Exchange Commission’s (“SEC”) exemptive order, which provides relief from the in-person voting requirements of the Investment Company Act of 1940, as amended (the “1940 Act”), in certain circumstances (the “In-Person Relief”), was necessary or appropriate due to the circumstances related to current or potential effects of COVID-19. The Trustees unanimously wished to rely on the In-Person Relief with respect to the approval of those matters on the agenda for the June 25, 2020 meeting that would otherwise require in-person votes under the 1940 Act. The Trustees, including a majority of the Trustees who are not “interested persons” of AMG Funds I, undertook to ratify the actions taken pursuant to the In-Person Relief at the Board’s next in-person meeting, consistent with the requirements of the In-Person Relief. See Investment Company Release No. 33897 (June 19, 2020). This exemptive order supersedes, in part, a similar, earlier exemptive order issued by the SEC (Investment Company Release No. 33824 (March 25, 2020)). |
68
| | |
| | |
| | | | |
INVESTMENT MANAGER AND ADMINISTRATOR AMG Funds LLC 600 Steamboat Road, Suite 300 Greenwich, CT 06830 800.548.4539 DISTRIBUTOR AMG Distributors, Inc. 600 Steamboat Road, Suite 300 Greenwich, CT 06830 800.548.4539 SUBADVISER First Quadrant, L.P. 800 E. Colorado Boulevard, Suite 900 Pasadena, CA 91101 | | CUSTODIAN The Bank of New York Mellon 111 Sanders Creek Parkway East Syracuse, NY 13057 LEGAL COUNSEL Ropes & Gray LLP Prudential Tower, 800 Boylston Street Boston, MA 02199-3600 TRANSFER AGENT BNY Mellon Investment Servicing (US) Inc. Attn: AMG Funds 4400 Computer Drive Westborough, MA 01581 800.548.4539 | | This report is prepared for the Funds’ shareholders. It is authorized for distribution to prospective investors only when preceded or accompanied by an effective prospectus. To receive a free copy of the prospectus or Statement of Additional Information, which includes additional information about Fund Trustees, please contact us by calling 800.548.4539. Distributed by AMG Distributors, Inc., member FINRA/SIPC. Current net asset values per share for each Fund are available on the Funds’ website at amgfunds.com. A description of the policies and procedures each Fund uses to vote its proxies is available: (i) without charge, upon request, by calling 800.548.4539, or (ii) on the Securities and Exchange Commission’s (SEC) website at sec.gov. For information regarding each Fund’s proxy voting record for the 12-month period ended June 30, call 800.548.4539 or visit the SEC website at sec.gov. The Funds file their complete schedule of portfolio holdings with the SEC for the first and third quarters of each fiscal year as an exhibit to their reports on Form N-PORT. The Funds’ portfolio holdings on Form N-PORT are available on the SEC’s website at sec.gov. To review a complete list of the Funds’ portfolio holdings, or to view the most recent semiannual report or annual report, please visit amgfunds.com. |
| | |
| | |
| | | | | | | | |
AFFILIATE SUBADVISED FUNDS BALANCED FUNDS AMG GW&K Global Allocation GW&K Investment Management, LLC AMG FQ Global Risk-Balanced First Quadrant, L.P. EQUITY FUNDS AMG FQ Tax-Managed U.S. Equity AMG FQ Long-Short Equity First Quadrant, L.P. AMG Frontier Small Cap Growth Frontier Capital Management Co., LLC AMG GW&K Small Cap Core AMG GW&K Small Cap Value AMG GW&K Small/Mid Cap AMG GW&K Mid Cap AMG GW&K Emerging Markets Equity AMG GW&K Emerging Wealth Equity AMG GW&K International Small Cap GW&K Investment Management, LLC AMG Renaissance Large Cap Growth The Renaissance Group LLC AMG River Road Dividend All Cap Value AMG River Road Focused Absolute Value AMG River Road Long-Short AMG River Road Small-Mid Cap Value AMG River Road Small Cap Value River Road Asset Management, LLC | | | | AMG TimesSquare Emerging Markets Small Cap AMG TimesSquare Global Small Cap AMG TimesSquare International Small Cap AMG TimesSquare Mid Cap Growth AMG TimesSquare Small Cap Growth TimesSquare Capital Management, LLC AMG Yacktman AMG Yacktman Focused AMG Yacktman Focused Fund - Security Selection Only AMG Yacktman Special Opportunities Yacktman Asset Management LP FIXED INCOME FUNDS AMG GW&K Core Bond ESG AMG GW&K Enhanced Core Bond ESG AMG GW&K High Income AMG GW&K Municipal Bond AMG GW&K Municipal Enhanced Yield GW&K Investment Management, LLC OPEN-ARCHITECTURE FUNDS EQUITY FUNDS AMG Managers Brandywine AMG Managers Brandywine Blue Friess Associates, LLC AMG Managers CenterSquare Real Estate CenterSquare Investment Management LLC | | | | AMG Managers Emerging Opportunities WEDGE Capital Management L.L.P. Next Century Growth Investors LLC RBC Global Asset Management (U.S.) Inc. AMG Managers Fairpointe Mid Cap Fairpointe Capital LLC AMG Managers LMCG Small Cap Growth LMCG Investments, LLC AMG Managers Montag & Caldwell Growth Montag & Caldwell, LLC AMG Managers Pictet International Pictet Asset Management Limited AMG Managers Silvercrest Small Cap Silvercrest Asset Management Group LLC AMG Managers Special Equity Ranger Investment Management, L.P. Lord, Abbett & Co. LLC Smith Asset Management Group, L.P. Federated MDTA LLC AMG SouthernSun Small Cap AMG SouthernSun U.S. Equity SouthernSun Asset Management, LLC FIXED INCOME FUNDS AMG Managers Doubleline Core Plus Bond DoubleLine Capital LP AMG Managers Loomis Sayles Bond Loomis, Sayles & Company, L.P. |
| | | | |
amgfunds.com | | 103120 | | AR014 |
| | |
 | | ANNUAL REPORT |
| | | | | | | | |
| | | | | AMG Funds October 31, 2020 |
| | | | | AMG Frontier Small Cap Growth Fund |
| | | | | Class N: MSSVX | | Class I: MSSCX | | Class Z: MSSYX |
| | | | | AMG Managers Emerging Opportunities Fund |
| | | | | Class N: MMCFX | | Class I: MIMFX | | |
Beginning on January 1, 2021, as permitted by regulations adopted by the Securities and Exchange Commission, paper copies of the Funds’ shareholder reports like this one will no longer be sent by mail, unless you specifically request paper copies of the reports from the Funds or from your financial intermediary, such as a broker-dealer or bank. Instead, the reports will be made available on the Funds’ website (https://www.amgfunds.com/resources/order_literature.html), and you will be notified by mail each time a report is posted and provided with a website link to access the report.
If you already elected to receive shareholder reports electronically, you will not be affected by this change and you need not take any action. You may elect to receive shareholder reports and other communications from the Funds electronically at any time by contacting your financial intermediary or, if you invest directly with the Funds, by logging into your account at www.amgfunds.com.
You may elect to receive all future reports in paper free of charge. If you invest through a financial intermediary, you can contact your financial intermediary to request that you continue to receive paper copies of your shareholder reports. If you invest directly with the Funds, you can call 1.800.548.4539 to inform the Funds that you wish to continue receiving paper copies of your shareholder reports. Your election to receive reports in paper will apply to all funds in the AMG Funds Family of Funds held in your account if you invest through your financial intermediary or all funds in the AMG Funds Family of Funds held with the fund complex if you invest directly with the Funds
| | |
| amgfunds.com | | 103120 AR022 |
| | |
| | | AMG Funds Annual Report — October 31, 2020 |
| | | | | | |
| | | |
| | | | | | | |
| | | TABLE OF CONTENTS | | PAGE | |
| | | | |
| | | LETTER TO SHAREHOLDERS | | | 2 | |
| | | |
| | | ABOUT YOUR FUND’S EXPENSES | | | 3 | |
| | | |
| | | PORTFOLIO MANAGER’S COMMENTS, FUND SNAPSHOTS AND SCHEDULES OF PORTFOLIO INVESTMENTS | | | | |
| | | |
| | | AMG Frontier Small Cap Growth Fund | | | 4 | |
| | | |
| | | AMG Managers Emerging Opportunities Fund | | | 10 | |
| | | |
| | | FINANCIAL STATEMENTS | | | | |
| | | |
| | | Statement of Assets and Liabilities | | | 20 | |
| | | |
| | | Balance sheets, net asset value (NAV) per share computations and cumulative distributable earnings (loss) | | | | |
| | | |
| | | Statement of Operations | | | 22 | |
| | | |
| | | Detail of sources of income, expenses, and realized and unrealized gains (losses) during the fiscal year | | | | |
| | | |
| | | Statements of Changes in Net Assets | | | 23 | |
| | | |
| | | Detail of changes in assets for the past two fiscal years | | | | |
| | | |
| | | Financial Highlights | | | 24 | |
| | | |
| | | Historical net asset values per share, distributions, total returns, income and expense ratios, turnover ratios and net assets | | | | |
| | | |
| | | Notes to Financial Statements | | | 29 | |
| | | |
| | | Accounting and distribution policies, details of agreements and transactions with Fund management and affiliates, and descriptions of certain investment risks | | | | |
| | | |
| | | REPORT OF INDEPENDENT REGISTERED PUBLIC ACCOUNTING FIRM | | | 35 | |
| | | |
| | | OTHER INFORMATION | | | 36 | |
| | | |
| | | TRUSTEES AND OFFICERS | | | 37 | |
| | | |
| | | ANNUAL RENEWAL OF INVESTMENT MANAGEMENT AND SUBADVISORY AGREEMENTS | | | 39 | |
| | | | | | |
|
| Nothing contained herein is to be considered an offer, sale or solicitation of an offer to buy shares of any series of the AMG Funds Family of Funds. Such offering is made only by prospectus, which includes details as to offering price and other material information. | |
| | |
| | Letter to Shareholders |
Dear Shareholder:
The fiscal year ending October 31, 2020, was a volatile period for financial markets marked by a dramatic selloff and extraordinary rebound amid the unprecedented global effort to stop the COVID-19 pandemic. During the first half of the fiscal year, equities achieved new record highs against the backdrop of a healthy economy and strong investor sentiment. However, a broad-based selloff occurred amid a global flight to quality as investors assessed the scope of the unfolding COVID-19 health care crisis, a deteriorating economy, and skyrocketing unemployment. An oil price war initiated between Saudi Arabia and Russia only made matters worse. From its peak in mid-February 2020, the S&P 500® Index declined (33.79)% over the span of a few weeks, bringing the eleven-year bull market to an abrupt end. In response to the crisis, global central banks and governments were quick to flood the market with massive fiscal and monetary stimulus which helped to stabilize the market and led to an impressive recovery in risk assets, albeit a very uneven one. So despite the volatility, the S&P 500® Index still achieved a 9.71% return for the fiscal year.
During the year there was very wide dispersion in performance across sectors, with information technology and consumer discretionary sectors leading the market with returns of 34.47% and 24.69%, respectively. On the other hand, companies in the energy sector fell (45.24)%, and financials, real estate, and industrials also produced negative returns. Growth stocks significantly outperformed value stocks for the period with returns of 29.22% and (7.57)% for the Russell 1000® Growth and Russell 1000® Value Indexes, respectively. Large caps also outperformed small caps as measured by the 9.71% return for the S&P 500® Index compared to (0.14)% for the Russell 2000® Index. Outside the U.S., emerging markets outperformed developed markets with the 8.25% return for the MSCI Emerging Markets Index compared to the (6.86)% return for the MSCI EAFE Index.
Interest rates fell dramatically and led to strong returns for bond investors as the U.S. Federal Reserve slashed short-term rates in response to the slowing economy. The 10-year Treasury yield ended the year near a historic low yield of 0.88%. The Bloomberg Barclays U.S. Aggregate Bond Index®, a broad measure of U.S. bond market performance, returned 6.19% over the period. Riskier high yield bonds lagged the broader bond market with a 3.49% return as measured by the return of the Bloomberg Barclays U.S. Corporate High Yield Bond Index®.
AMG Funds appreciates the privilege of providing investment tools to you and your clients. Our foremost goal is to provide investment solutions that help our shareholders successfully reach their long-term investment goals. AMG Funds
provides access to a distinctive array of actively managed return-oriented investment strategies. We thank you for your continued confidence and investment in AMG Funds. You can rest assured that
under all market conditions our team is focused on delivering excellent investment management services for your benefit.
Respectfully,

Keitha Kinne
President
AMG Funds
| | | | | | | | | | | | | | |
| Average Annual Total Returns | | Periods ended October 31, 2020* | |
| | | | |
| Stocks: | | | | 1 Year | | | 3 Years | | | 5 Years | |
| | | | |
Large Cap | | (S&P 500® Index) | | | 9.71 | % | | | 10.42% | | | | 11.71% | |
| | | | |
Small Cap | | (Russell 2000® Index) | | | (0.14 | )% | | | 2.19% | | | | 7.27% | |
| | | | |
International | | (MSCI All Country World Index ex USA) | | | (2.61 | )% | | | (0.19)% | | | | 4.26% | |
| Bonds: | | | | | | | | | | | |
| | | | |
Investment Grade | | (Bloomberg Barclays U.S. Aggregate Bond Index) | | | 6.19 | % | | | 5.06% | | | | 4.08% | |
| | | | |
High Yield | | (Bloomberg Barclays U.S. Corporate High Yield Bond Index) | | | 3.49 | % | | | 4.24% | | | | 6.32% | |
| | | | |
Tax-exempt | | (Bloomberg Barclays Municipal Bond Index) | | | 3.59 | % | | | 4.09% | | | | 3.70% | |
| | | | |
Treasury Bills | | (ICE BofAML U.S. 6-Month Treasury Bill Index) | | | 1.30 | % | | | 1.89% | | | | 1.43% | |
*Source: FactSet. Past performance is no guarantee of future results.
2
|
About Your Fund’s Expenses |
| | | | | | | | |
As a shareholder of a Fund, you may incur two types of costs: (1) transaction costs, which may include sales charges (loads) on purchase payments; redemption fees; and exchange fees; and (2) ongoing costs, including management fees; distribution (12b-1) fees; and other Fund expenses. This example is intended to help you understand your ongoing costs (in dollars) of investing in the Fund and to compare these costs with the ongoing costs of investing in other mutual funds. The example is based on $1,000 invested at the beginning of the period and held for the entire period as indicated below. ACTUAL EXPENSES The first line of the following table provides information about the actual account values and | | | | actual expenses. You may use the information in this line, together with the amount you invested, to estimate the expenses that you paid over the period. Simply divide your account value by $1,000 (for example, an $8,600 account value divided by $1,000 = 8.6), then multiply the result by the number in the first line under the heading entitled “Expenses Paid During Period” to estimate the expenses you paid on your account during this period. HYPOTHETICAL EXAMPLE FOR COMPARISON PURPOSES The second line of the following table provides information about hypothetical account values and hypothetical expenses based on the Fund’s actual expense ratio and an assumed annual rate of return of 5% before expenses, which is not the Fund’s | | | | actual return. The hypothetical account values and expenses may not be used to estimate the actual ending account balance or expenses you paid for the period. You may use this information to compare the ongoing costs of investing in the Fund and other funds by comparing this 5% hypothetical example with the 5% hypothetical examples that appear in the shareholder reports of other funds. Please note that the expenses shown in the table are meant to highlight your ongoing costs only and do not reflect any transactional costs, such as sales charges (loads), redemption fees, or exchange fees. Therefore, the second line of the table is useful in comparing ongoing costs only, and will not help you determine the relative total costs of owning different funds |
| | | | | | | | |
| | | | | | | | |
Six Months Ended October 31, 2020 | | Expense Ratio for the Period | | Beginning Account Value 05/01/20 | | Ending Account Value 10/31/20 | | Expenses Paid During the Period* |
AMG Frontier Small Cap Growth Fund |
|
Based on Actual Fund Return |
| | | | |
Class N | | 1.30% | | $1,000 | | $1,307 | | $7.54 |
| | | | |
Class I | | 0.95% | | $1,000 | | $1,308 | | $5.51 |
| | | | |
Class Z | | 0.90% | | $1,000 | | $1,308 | | $5.22 |
|
Based on Hypothetical 5% Annual Return |
| | | | |
Class N | | 1.30% | | $1,000 | | $1,019 | | $6.60 |
| | | | |
Class I | | 0.95% | | $1,000 | | $1,020 | | $4.82 |
| | | | |
Class Z | | 0.90% | | $1,000 | | $1,021 | | $4.57 |
AMG Managers Emerging Opportunities Fund |
|
Based on Actual Fund Return |
| | | | |
Class N | | 1.19% | | $1,000 | | $1,191 | | $6.55 |
| | | | |
Class I | | 0.94% | | $1,000 | | $1,192 | | $5.18 |
|
Based on Hypothetical 5% Annual Return |
| | | | |
Class N | | 1.19% | | $1,000 | | $1,019 | | $6.04 |
| | | | |
Class I | | 0.94% | | $1,000 | | $1,020 | | $4.77 |
| * | Expenses are equal to the Fund’s annualized expense ratio multiplied by the average account value over the period, multiplied by the number of days in the most recent fiscal half-year (184), then divided by 366. |
3
|
AMG Frontier Small Cap Growth Fund Portfolio Manager’s Comments (unaudited) |
| | | | | | | | |
THE YEAR IN REVIEW Despite significant volatility associated with the COVID pandemic, the past year has been generally positive for domestic equities. For the twelve months ending October 31, 2020, small caps lagged large caps as the Russell 2000® Index was essentially flat, down -0.1%, trailing the 10.87% advance of the Russell 1000® Index. Growth continued to lead within the small cap segment as the Russell 2000® Growth Index rose 13.37%. AMG Frontier Small Cap Growth Fund’s (the “Fund”) Class N shares returned 16.22% over this time, outperforming its benchmark, the Russell 2000® Growth Index. The majority of the Fund’s outperformance was driven by positive stock selection. The Fund also experienced positive sector allocation effect. Health care, the Fund’s largest industry and a significant overweight, was the strongest contributor as our 65% return exceeded the 37% return of the index. Our outperformance was driven by strong stock selection in several different groups including medical equipment, up 106%, biotechnology, up 57%, and medical services, up 75%. During this period, six out of the top ten contributors were from these three sectors, contributing a collective +14.5% to overall portfolio return. Immunomedics, Inc. was the Fund’s top overall contributor, advancing on news that Gilead Sciences offered to acquire the company at a 100% premium. The company had recently gained approval for its drug Trodelvy, the first drug to treat “triple negative” breast cancer, which accounts for 15% of all cases. While the Fund garnered a 433% return in Immunomedics over the 12-month period, it was anything but a smooth ride as the stock began the year at $17 per share then dipped to under $9 in early April before ascending to $87 on the acquisition offer. Natera, Inc. a leader in liquid biopsy, was another strong contributor, rising 75%. The company continues to execute well and recently received a coverage decision from Centers for Medicare & Medicaid Services that solidifies their position as the reference test for competitive approvals. With products in numerous testing verticals and multiple future opportunities, we believe Natera is the best positioned, but least highly valued company in the space. Technology, the Fund’s largest overweight industry, outperformed with a return of 25% versus 14% for the index. Software and semiconductors were the | | | | strongest groups in the industry. Top contributing stocks in technology were Five9 Inc., up 173%, and Cree Inc., up 38%. Five9 is a leader in cloud contact center software and has been a strong stock for several reasons. First, contact center software is moving to the cloud where the company has a leading position. Secondly, COVID has been an accelerator to growth as companies focus on flexible systems and different ways to engage their customers. Finally, given their strengthening position, the company has been adding new resellers and channel partners. Subscription growth has accelerated from the high 20% range last year to 34% in the latest quarter. We expect subscription growth to remain north of 30% for several years. That said, given the significant move in the stock and our growth at a reasonable price philosophy, we have materially reduced the position. Cree, a semiconductor company, is benefiting from electric vehicle and autonomous driving adoption and thus a heavily weighted position, averaging 2.5% of the portfolio over the period. The company is the leading manufacturer of silicon carbide products used in power management devices. Silicon carbide devices have significant advantages over pure silicon devices in high voltage applications and will see significant increases in demand over the coming years due to the proliferation of electric vehicles. Cree’s stock performed well as the company secured $1.7 billion worth of design wins driven by upcoming electric vehicle launches, and by an acceleration in electric vehicle production timelines. Management also announced their intent to sell their LED business, enabling them to focus solely on silicon carbide devices going forward. On the down side, industrials, an equal weight industry, was the Fund’s largest detractor, declining (10)% versus a gain of 2% for the index. Consumer discretionary, a modest overweight, was another detractor, falling (2%) compared to a 7% gain for the benchmark. The first sectors impacted by the pandemic in terms of both stock prices and subsequent economic slowdown were travel related such as airlines, hotels, aircraft, and casinos. Unfortunately, the Fund had several holdings in airlines such as JetBlue Airway Corp., down (38)%, Mesa Air Group Inc., down (57)%, and Azul S.A , down (70)%. The Fund also owned aerospace related suppliers including Allegheny Technologies Inc., down (58)%. Other stocks that hurt performance were impacted by the collapse in crude oil prices. | | | | Infrastructure engineering and construction company MasTec was hit hard, falling (31)%, most likely due to the fact it has a large business in pipeline construction. Fortunately, once the pandemic hit we took swift action and reduced exposure to travel, leisure, aerospace, and energy, and this allowed the Fund to significantly outperform the market, which included trimming and selling the above mentioned companies. Since the market low on March 19 through the fiscal year end, the Fund is up approximately 76% and outperformed the Russell 2000® Growth by approximately 20 percentage points. The coronavirus continues to disrupt the lives of people worldwide, and the ultimate economic fallout is difficult to ascertain. What is clear is that the markets are rewarding secular growth companies that have products and services that continue to grow despite the interruptions caused by the pandemic. We are seeing continued growth in technology businesses, and many areas of health care are returning to solid growth rates. Meanwhile financials, real estate investment trusts (REITs) and energy businesses continue to struggle. The wide disparity in growth versus value stocks can be seen when comparing returns for the Russell 2000® Value Index, down nearly (14)% for the trailing one year period versus Russell 2000® Growth Index, up over 13%. The decisions we made in late March and early April to swiftly shift money out of economically sensitive companies and into secular growth companies, along with strong stock selection, have allowed the Fund to overcome a weak calendar year first quarter and positioned it for a solid fiscal year 2020. Given the uncertainty the markets face following the contentious presidential election, we expect a heightened level of market volatility in the fourth calendar quarter. However, we are encouraged by recent announcements about successful COVID vaccines and believe that the economy is in the midst of a recovery and that it will continue to slowly improve. The views expressed represent the opinions of Frontier Capital Management Co. LLC as of October 31, 2020, and are not intended as a forecast or guarantee of future results, and are subject to change without notice. |
| | | | | | | | |
4
|
AMG Frontier Small Cap Growth Fund Portfolio Manager’s Comments (continued) |
CUMULATIVE TOTAL RETURN PERFORMANCE
AMG Frontier Small Cap Growth Fund’s cumulative total return is based on the daily change in net asset value (NAV), and assumes that all dividends and distributions were reinvested. This graph compares a hypothetical $10,000 investment made in the AMG Frontier Small Cap Growth Fund’s Class N shares on October 31, 2010, to a $10,000 investment made in the Russell 2000® Growth Index for the same time period. The graph and table do not reflect the deduction of taxes that a shareholder would pay on a Fund distribution or redemption of shares. The listed returns for the Fund are net of expenses and the returns for the index exclude expenses. Total returns would have been lower had certain expenses not been reduced.
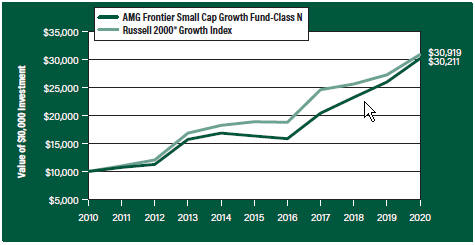
The table below shows the average annual total returns for the AMG Frontier Small Cap Growth Fund and the Russell 2000® Growth Index for the same time periods ended October 31, 2020.
| | | | | | | | | | | | |
| Average Annual Total Returns1 | | One Year | | | Five Years | | | Ten Years | |
AMG Frontier Small Cap Growth Fund2, 3, 4, 5, 6, 7 | |
| | | |
Class N | | | 16.22 | % | | | 13.07 | % | | | 11.69 | % |
| | | |
Class I | | | 16.69 | % | | | 13.40 | % | | | 12.00 | % |
| | | |
Class Z | | | 16.74 | % | | | 13.54 | % | | | 12.21 | % |
| | | |
Russell 2000® Growth Index8 | | | 13.37 | % | | | 10.36 | % | | | 11.95 | % |
The performance data shown represents past performance. Past performance is not a guarantee of future results. Current performance may be lower or higher than the performance data quoted. The investment return and principal value of an investment will fluctuate so that an investor’s shares, when redeemed, may be worth more or less than their original cost.
Investors should carefully consider the Fund’s investment objectives, risks, charges and expenses before investing. For performance information through the most recent month end, current net asset values per share for the Fund and other information, please call 800.548.4539 or visit our website at amgfunds.com for a free prospectus. Read it carefully before investing or sending money.
Distributed by AMG Distributors, Inc., member FINRA/SIPC.
| 1 | Total return equals income yield plus share price change and assumes reinvestment of all dividends and capital gain distributions. Returns are net of fees and may reflect offsets of Fund expenses as described in the prospectus. No adjustment has been made for taxes payable by shareholders on their reinvested dividends and capital gain distributions. Returns for periods greater than one year are annualized. The listed returns on the Fund are net of expenses and based on the published NAV as of October 31, 2020. All returns are in U.S. dollars ($). |
| | |
| | | 2 From time to time, the Fund’s advisor has waived its fees and/or absorbed Fund expenses, which has resulted in higher returns. |
| | |
| | | 3 The Fund is subject to risks associated with investments in small-capitalization companies, such as erratic earnings patterns, competitive conditions, limited earnings history and a reliance on one or a limited number of products. |
| | |
| | | 4 Active and frequent trading of a fund may result in higher transaction costs and increased tax liability. |
| | |
| | | 5 The Fund invests in growth stocks, which may be more sensitive to market movements because their prices tend to reflect future investor expectations rather than just current profits. Growth stocks may underperform value stocks during given periods. |
| | |
| | | 6 Companies that are in similar businesses may be similarly affected by particular economic or market events; to the extent the Fund has substantial holdings within a particular sector, the risks associated with that sector increase. |
| | |
| | | 7 Market prices of investments held by the Fund may fall rapidly or unpredictably due to a variety of economic or political factors, market conditions, disasters or public health issues, or in response to events that affect particular industries or companies. |
| | |
| | | 8 The Russell 2000® Growth Index measures the performance of the Russell 2000® companies with higher price-to-book ratios and higher forecasted growth values. Unlike the Fund, the Russell 2000® Growth Index is unmanaged, is not available for investment and does not incur expenses. |
| | |
| | | The Russell 2000® Growth Index is a trademark of the London Stock Exchange Group companies. |
| | |
| | | Not FDIC insured, nor bank guaranteed. May lose value. |
5
|
AMG Frontier Small Cap Growth Fund Fund Snapshots (unaudited) October 31, 2020 |
| | |
PORTFOLIO BREAKDOWN |
Sector | | % of
Net Assets |
| | |
Health Care | | 39.8 |
| | |
Information Technology | | 20.7 |
| | |
Industrials | | 17.0 |
| | |
Consumer Discretionary | | 15.3 |
| | |
Materials | | 3.3 |
| | |
Financials | | 2.2 |
| | |
Real Estate | | 0.6 |
| | |
Communication Services | | 0.6 |
| | |
Energy | | 0.4 |
| | |
Short-Term Investments | | 5.5 |
| | |
Other Assets Less Liabilities | | (5.4) |
| | |
TOP TEN HOLDINGS |
Security Name | | % of
Net Assets |
| | |
Karyopharm Therapeutics, Inc. | | 3.5 |
| | |
Natera, Inc. | | 3.4 |
| | |
Insulet Corp. | | 3.4 |
| | |
Guardant Health, Inc. | | 3.4 |
| | |
Horizon Therapeutics PLC | | 3.2 |
| | |
Quanterix Corp. | | 3.2 |
| | |
Caesars Entertainment, Inc. | | 2.8 |
| | |
Quanta Services, Inc. | | 2.7 |
| | |
Adaptive Biotechnologies Corp. | | 2.6 |
| | |
Century Communities, Inc. | | 2.3 |
| | |
| | |
Top Ten as a Group | | 30.5 |
| | | |
| | | |
Because a fund’s strategy may result in multiple investments in particular sectors of the economy, its performance may depend on the performance of those sectors and may fluctuate more widely than investments diversified across more sectors. For additional information on these and other risk considerations, please see the Fund’s prospectus.
Any sectors, industries, or securities discussed should not be perceived as investment recommendations. Mention of a specific security should not be considered a recommendation to buy or solicitation to sell that security. Specific securities mentioned in this report may have been sold from the Fund’s portfolio of investments by the time you receive this report.
6
|
AMG Frontier Small Cap Growth Fund Schedule of Portfolio Investments October 31, 2020 |
| | | | | | | | |
| | | Shares | | | Value | |
| | |
Common Stocks - 99.9% | | | | | | | | |
| |
Communication Services - 0.6% | | | | | |
| | |
Cardlytics, Inc.*,1 | | | 1,665 | | | | $122,910 | |
| |
Consumer Discretionary - 15.3% | | | | | |
| | |
Boot Barn Holdings, Inc.*,1 | | | 3,531 | | | | 113,063 | |
| | |
BorgWarner, Inc. | | | 7,335 | | | | 256,578 | |
| | |
Caesars Entertainment, Inc.* | | | 12,251 | | | | 549,090 | |
| | |
Century Communities, Inc.*,1 | | | 11,534 | | | | 447,981 | |
| | |
Dana, Inc. | | | 21,481 | | | | 300,519 | |
| | |
Five Below, Inc.*,1 | | | 2,760 | | | | 368,018 | |
| | |
Floor & Decor Holdings, Inc., Class A* | | | 2,765 | | | | 201,845 | |
| | |
Mattel, Inc.* | | | 12,544 | | | | 172,731 | |
| | |
Ollie’s Bargain Outlet Holdings, Inc.* | | | 41 | | | | 3,571 | |
| | |
Stoneridge, Inc.* | | | 10,522 | | | | 240,217 | |
| | |
Under Armour, Inc., Class C* | | | 15,014 | | | | 183,621 | |
| | |
Veoneer, Inc. (Sweden)*,1 | | | 11,446 | | | | 175,925 | |
| | |
Total Consumer Discretionary | | | | | | | 3,013,159 | |
| |
Energy - 0.4% | | | | | |
| | |
Euronav, N.V. (Belgium)1 | | | 5,082 | | | | 37,403 | |
| | |
International Seaways, Inc. | | | 2,368 | | | | 32,063 | |
| | |
Total Energy | | | | | | | 69,466 | |
| |
Financials - 2.2% | | | | | |
| | |
Argo Group International Holdings, Ltd. (Bermuda) | | | 551 | | | | 19,660 | |
| | |
James River Group Holdings, Ltd. (Bermuda) | | | 3,164 | | | | 147,854 | |
| | |
LPL Financial Holdings, Inc. | | | 1,977 | | | | 158,022 | |
| | |
Pinnacle Financial Partners, Inc. | | | 1,364 | | | | 62,457 | |
| | |
Webster Financial Corp. | | | 1,092 | | | | 35,173 | |
| | |
Total Financials | | | | | | | 423,166 | |
| |
Health Care - 39.8% | | | | | |
| | |
ABIOMED, Inc.* | | | 7 | | | | 1,763 | |
| | |
Acadia Healthcare Co., Inc.* | | | 6,034 | | | | 215,112 | |
| | |
ACADIA Pharmaceuticals, Inc.* | | | 7,466 | | | | 346,796 | |
| | |
Acceleron Pharma, Inc.*,1 | | | 1,912 | | | | 199,957 | |
| | |
Adaptive Biotechnologies Corp.* | | | 11,134 | | | | 513,055 | |
| | |
ADC Therapeutics, S.A. (Switzerland)* | | | 3,682 | | | | 105,637 | |
| | |
Alnylam Pharmaceuticals, Inc.* | | | 66 | | | | 8,116 | |
| | |
Amarin Corp. PLC, ADR (Ireland)*,1 | | | 4,992 | | | | 24,261 | |
| | |
Biohaven Pharmaceutical Holding Co., Ltd.*,1 | | | 2,725 | | | | 211,079 | |
| | |
BioMarin Pharmaceutical, Inc.* | | | 2,937 | | | | 218,601 | |
| | |
Bluebird Bio, Inc.* | | | 727 | | | | 37,593 | |
| | |
Cara Therapeutics, Inc.*,1 | | | 3,591 | | | | 47,617 | |
| | |
CRISPR Therapeutics AG (Switzerland)*,1 | | | 44 | | | | 4,040 | |
| | | | | | | | |
| | | Shares | | | Value | |
| | |
Denali Therapeutics, Inc.* | | | 1,804 | | | | $77,175 | |
| | |
Exact Sciences Corp.*,1 | | | 899 | | | | 111,323 | |
| | |
Guardant Health, Inc.* | | | 6,233 | | | | 664,812 | |
| | |
Horizon Therapeutics PLC* | | | 8,542 | | | | 640,052 | |
| | |
Insmed, Inc.*,1 | | | 3,799 | | | | 125,139 | |
| | |
Inspire Medical Systems, Inc.* | | | 1,303 | | | | 155,617 | |
| | |
Insulet Corp.* | | | 2,998 | | | | 666,306 | |
| | |
Karyopharm Therapeutics, Inc.*,1 | | | 46,346 | | | | 686,848 | |
| | |
Madrigal Pharmaceuticals, Inc.*,1 | | | 369 | | | | 46,955 | |
| | |
Merit Medical Systems, Inc.* | | | 6,836 | | | | 342,142 | |
| | |
Moderna, Inc.*,1 | | | 60 | | | | 4,048 | |
| | |
NanoString Technologies, Inc.*,1 | | | 4,725 | | | | 173,171 | |
| | |
Natera, Inc.* | | | 10,057 | | | | 676,434 | |
| | |
Nektar Therapeutics*,1 | | | 4,266 | | | | 67,573 | |
| | |
Neurocrine Biosciences, Inc.* | | | 269 | | | | 26,542 | |
| | |
Novocure, Ltd. (Jersey)* | | | 51 | | | | 6,227 | |
| | |
Pacira BioSciences, Inc.*,1 | | | 2,853 | | | | 149,212 | |
| | |
Progyny, Inc.*,1 | | | 4,432 | | | | 108,008 | |
| | |
PTC Therapeutics, Inc.* | | | 1,956 | | | | 102,084 | |
| | |
Quanterix Corp.* | | | 17,348 | | | | 635,110 | |
| | |
Silk Road Medical, Inc.* | | | 6,024 | | | | 365,054 | |
| | |
Turning Point Therapeutics, Inc.*,1 | | | 921 | | | | 84,907 | |
| | |
Total Health Care | | | | | | | 7,848,366 | |
| |
Industrials - 17.0% | | | | | |
| | |
AECOM* | | | 4,299 | | | | 192,767 | |
| | |
Altra Industrial Motion Corp.* | | | 2,787 | | | | 119,172 | |
| | |
American Woodmark Corp.*,1 | | | 2,606 | | | | 215,282 | |
| | |
Azul, S.A., ADR (Brazil)* | | | 6,123 | | | | 72,558 | |
| | |
BMC Stock Holdings, Inc.* | | | 1,425 | | | | 56,416 | |
| | |
Builders FirstSource, Inc. | | | 7,128 | | | | 215,978 | |
| | |
EnerSys | | | 4,060 | | | | 290,696 | |
| | |
KAR Auction Services, Inc. | | | 16,148 | | | | 235,115 | |
| | |
Knight-Swift Transportation Holdings, Inc.* | | | 3,997 | | | | 151,846 | |
| | |
Kratos Defense & Security Solutions, Inc.*,1 | | | 6,620 | | | | 125,052 | |
| | |
MasTec, Inc.* | | | 4,551 | | | | 225,912 | |
| | |
MYR Group, Inc. | | | 1,647 | | | | 70,409 | |
| | |
Quanta Services, Inc.* | | | 8,593 | | | | 536,461 | |
| | |
Tutor Perini Corp.* | | | 21,394 | | | | 289,033 | |
| | |
Upwork, Inc.* | | | 16,390 | | | | 302,395 | |
| | |
WESCO International, Inc. | | | 6,189 | | | | 255,234 | |
| | |
Total Industrials | | | | | | | 3,354,326 | |
| |
Information Technology - 20.7%*,1 | | | | | |
| | |
2U, Inc. | | | 581 | | | | 21,410 | |
The accompanying notes are an integral part of these financial statements.
7
|
AMG Frontier Small Cap Growth Fund Schedule of Portfolio Investments (continued) |
| | | | | | | | |
| | | Shares | | | Value | |
| |
Information Technology - 20.7% | | | | | |
(continued) | | | | | | | | |
| | |
Allegro MicroSystems, Inc.* | | | 531 | | | | $9,717 | |
| | |
Alteryx, Inc., Class A*,1 | | | 72 | | | | 9,025 | |
| | |
Ambarella, Inc.* | | | 6,700 | | | | 366,289 | |
| | |
Anaplan, Inc.*,1 | | | 880 | | | | 48,708 | |
| | |
Blackline, Inc.* | | | 819 | | | | 80,000 | |
| | |
Coherent, Inc.* | | | 2,134 | | | | 267,049 | |
| | |
Coupa Software, Inc.* | | | 70 | | | | 18,739 | |
| | |
Cree, Inc.* | | | 5,053 | | | | 321,371 | |
| | |
Five9, Inc.* | | | 72 | | | | 10,924 | |
| | |
FLIR Systems, Inc. | | | 3,237 | | | | 112,292 | |
| | |
Guidewire Software, Inc.* | | | 302 | | | | 29,025 | |
| | |
HubSpot, Inc.* | | | 134 | | | | 38,869 | |
| | |
II-VI, Inc.*,1 | | | 3,292 | | | | 149,687 | |
| | |
Impinj, Inc.*,1 | | | 1,677 | | | | 42,780 | |
| | |
MACOM Technology Solutions Holdings, Inc.* | | | 11,445 | | | | 417,742 | |
| | |
Medallia, Inc.*,1 | | | 6,754 | | | | 192,151 | |
| | |
MKS Instruments, Inc. | | | 1,268 | | | | 137,439 | |
| | |
Model N, Inc.* | | | 3,889 | | | | 137,009 | |
| | |
MongoDB, Inc.*,1 | | | 89 | | | | 20,334 | |
| | |
Monolithic Power Systems, Inc. | | | 15 | | | | 4,794 | |
| | |
Nuance Communications, Inc.* | | | 6,954 | | | | 221,902 | |
| | |
Paylocity Holding Corp.* | | | 111 | | | | 20,593 | |
| | |
Perficient, Inc.* | | | 3,824 | | | | 149,748 | |
| | |
Ping Identity Holding Corp.*,1 | | | 7,915 | | | | 219,166 | |
| | |
Rapid7, Inc.*,1 | | | 5,550 | | | | 343,711 | |
| | |
SiTime Corp.* | | | 3,102 | | | | 258,986 | |
| | |
SYNNEX Corp. | | | 526 | | | | 69,243 | |
| | |
Teradyne, Inc. | | | 109 | | | | 9,576 | |
| | |
The Trade Desk, Inc., Class A* | | | 17 | | | | 9,630 | |
| | |
Ultra Clean Holdings, Inc.* | | | 10,216 | | | | 217,499 | |
| | |
Zendesk, Inc.* | | | 387 | | | | 42,934 | |
| | |
Zscaler, Inc.* | | | 70 | | | | 9,502 | |
| | |
Zuora, Inc., Class A*,1 | | | 7,632 | | | | 73,420 | |
| | |
Total Information Technology | | | | | | | 4,081,264 | |
| | |
Materials - 3.3% | | | | | | | | |
| | |
Alamos Gold, Inc., Class A (Canada) | | | 11,645 | | | | 106,552 | |
| | | | | | | | |
| | | Shares | | | Value | |
| | |
Eagle Materials, Inc. | | | 2,861 | | | | $243,900 | |
| | |
Livent Corp.* | | | 8,048 | | | | 86,516 | |
| | |
Pan American Silver Corp. (Canada) | | | 6,613 | | | | 210,294 | |
| | |
Total Materials | | | | | | | 647,262 | |
| | |
Real Estate - 0.6% | | | | | | | | |
| | |
Brixmor Property Group, Inc., REIT | | | 2,567 | | | | 28,134 | |
| | |
Corporate Office Properties Trust, REIT | | | 406 | | | | 9,107 | |
| | |
SITE Centers Corp., REIT | | | 4,008 | | | | 27,294 | |
| | |
Spirit Realty Capital, Inc., REIT 1 | | | 650 | | | | 19,533 | |
| | |
STAG Industrial, Inc., REIT | | | 1,266 | | | | 39,398 | |
| | |
Total Real Estate | | | | | | | 123,466 | |
Total Common Stocks
(Cost $16,256,347) | | | | | | | 19,683,385 | |
| | |
| | | Principal
Amount | | | | |
| |
Short-Term Investments - 5.5% | | | | | |
| |
Joint Repurchase Agreements - 4.7%2 | | | | | |
| | |
Citigroup Global Markets, Inc., dated 10/30/20, due 11/02/20, 0.090% total to be received $926,430 (collateralized by various U.S. Government Agency Obligations and U.S. Treasuries, 0.000% - 6.500%, 10/31/20 -08/20/70, totaling $944,951) | | | $926,423 | | | | 926,423 | |
| | |
| | | Shares | | | | |
| |
Other Investment Companies - 0.8% | | | | | |
| | |
Dreyfus Government Cash Management Fund, Institutional Shares, 0.02%3 | | | 49,835 | | | | 49,835 | |
| | |
Dreyfus Institutional Preferred Government Money Market Fund, Institutional Shares, 0.04%3 | | | 49,835 | | | | 49,835 | |
| | |
JPMorgan U.S. Government Money Market Fund, IM Shares, 0.04%3 | | | 51,345 | | | | 51,345 | |
| |
Total Other Investment Companies | | | | 151,015 | |
| | |
Total Short-Term Investments
(Cost $1,077,438) | | | | | | | 1,077,438 | |
| | |
Total Investments - 105.4%
(Cost $17,333,785) | | | | | | | 20,760,823 | |
| |
Other Assets, less Liabilities - (5.4)% | | | | (1,058,326 | ) |
| | |
Net Assets - 100.0% | | | | | | $ | 19,702,497 | |
| * | Non-income producing security. |
| 1 | Some of these securities, amounting to $3,540,488 or 18.0% of net assets, were out on loan to various borrowers and are collateralized by cash and various U.S. Treasury Obligations. See Note 4 of Notes to Financial Statements. |
| 2 | Cash collateral received for securities lending activity was invested in these joint repurchase agreements. |
| 3 | Yield shown represents the October 31, 2020, seven day average yield, which refers to the sum of the previous seven days’ dividends paid, expressed as an annual percentage. |
The accompanying notes are an integral part of these financial statements.
8
|
AMG Frontier Small Cap Growth Fund Schedule of Portfolio Investments (continued) |
| | |
| ADR American Depositary Receipt | | REIT Real Estate Investment Trust |
The following table summarizes the inputs used to value the Fund’s investments by the fair value hierarchy levels as of October 31, 2020:
| | | | | | | | | | | | | | | | |
| | | Level 1 | | | Level 2 | | | Level 3 | | | Total | |
Investments in Securities | | | | | | | | | | | | | | | | |
| | | | |
Common Stocks† | | $ | 19,683,385 | | | | — | | | | — | | | $ | 19,683,385 | |
| | | | |
Short-Term Investments | | | | | | | | | | | | | | | | |
| | | | |
Joint Repurchase Agreements | | | — | | | $ | 926,423 | | | | — | | | | 926,423 | |
| | | | |
Other Investment Companies | | | 151,015 | | | | — | | | | — | | | | 151,015 | |
| | | | | | | | | | | | | | | | |
Total Investments in Securities | | $ | 19,834,400 | | | $ | 926,423 | | | | — | | | $ | 20,760,823 | |
| | | | | | | | | | | | | | | | |
| † | All common stocks held in the Fund are Level 1 securities. For a detailed breakout of common stocks by major industry classification, please refer to the Fund’s Schedule of Portfolio Investments. |
For the fiscal year ended October 31, 2020, there were no transfers in or out of Level 3. The accompanying notes are an integral part of these financial statements.
The accompanying notes are an integral part of these financial statements.
9
|
AMG Managers Emerging Opportunities Fund Portfolio Manager’s Comments (unaudited) |
| | | | | | | | |
OVERVIEW For the fiscal year ended October 31, 2020, AMG Managers Emerging Opportunities Fund’s (the “Fund”) Class N share returned (0.86)%, compared with the 3.15% return for the Russell Microcap® Index and the (0.14)% return for the Russell 2000® Index. Next Century Growth Investors, LLC MARKET AND PERFORMANCE REVIEW The year ended October 31, 2020, started with the broad markets moving to all-time highs in mid-February 2020, and that was followed by a COVID-19 related downdraft until late March 2020. The market has steadily recovered since late March 2020. The Russell Microcap Growth® Index finished up 22.33% for the full 12-month period ended October 31, 2020. Over that period, the Next Century Growth sleeve of the Fund performed better than that, returning a positive 57.34%. Performance during the past year was driven mainly by stocks in technology, financials, consumer discretionary, and industrials. The sleeve was able to show relative outperformance during the Q1 2020 market pullback and during the market recovery that followed. In early calendar year 2020, we cut back high valuation positions and raised cash close to our maximum limit of 5% because we believed the market and our stocks were getting ahead of themselves. We did not anticipate the full extent of the impending global pandemic or the impact it would have on the global economy and markets. However, given the moves we made in early 2020, we were able to step in during March/April and add back to some of our strongest conviction holdings and buy some new names at discounted valuations. At the time, we believed there were a lot of uncertainties related to the impact of the pandemic, but we also believed the markets would benefit from the unprecedented actions taken by the U.S. Federal Reserve (the “Fed”) and the federal government. Rates were quickly dropped to close to zero and the Fed committed to do whatever was necessary to bring the economy back. At the same time, Congress passed a huge bipartisan stimulus bill. It appeared this level of | | | | fundamentals were less impacted by the pandemic. In fact, some of these companies experienced a pull forward in demand as the end customers utilized more products and services. Given the strong rebound in stock prices and valuations, we have been cutting back some of these positions and we had to eliminate some holdings due to market cap limits. We continue to be overweight technology as we believe healthy long-term growth prospects remain for the sleeve’s holdings. In financials, the sleeve’s performance was driven by unique growth companies in the insurance industry, where our stock selection process enabled us to identify companies with durable organic revenue growth and strong competitive positions. We have cut back some of these positions due to valuation and market cap but continue to be slightly overweight the sector. The sleeve’s outperformance in consumer discretionary was primarily driven by two holdings. The first company provides a marketplace for companies to find freelance workers to help with projects such as graphics & design, digital marketing initiatives, and software programming, among other things. The other company is a for-profit, post-secondary education company focused on providing nursing degrees. The consumer discretionary sector has been a challenging area to find healthy growth companies for several years, which is why we have been and continue to be underweight. In industrials, positive performance was driven by some existing holdings and a couple of new names purchased in the March/April timeframe, and we benefited from being slightly underweight a sector that underperformed the market during this period. We continue to look for industrial companies that exhibit strong growth and defendable competitive positions. OUTLOOK Looking forward, we feel the U.S. economy will continue recovering as we move past the worst of the global | | | | appropriate. We are still finding opportunities to buy what we view as high quality, long-term growth companies in the current environment. We remain bullish on active investment management right now. Institutions are increasingly turning their equity assets over to index funds, ETFs, and computer-driven “quant funds” which have little understanding of the businesses underlying the stocks they buy and sell. Many large investment pools have moved 100% of their U.S. equity assets to passive strategies. We think this will lead to a very good period for active management because our information and analysis will be even more valuable in a world with fewer assets in the hands of professional investors. We are glad that was the case over the past 12 months and look forward to continuing to invest in companies that we believe can return much better results than the average index holding. RBC Global Asset Management (U.S.) Inc. MARKET OVERVIEW Equity markets offered mixed results in the second half of 2019 that was one of the strongest in two decades in terms of investment performance. Rising trade tensions, geopolitical uncertainties, and slowing economic growth data dampened the positive impact of a more accommodative Fed policy in the period. More accommodative Fed policy and a steepening of the yield curve drove U.S. equity markets strongly higher in the fourth quarter, capping off a year of sizable gains following the negative performance of 2018. After a brief period of leadership by value stocks in the third quarter, returns in the fourth quarter were once again dominated by growth stocks. In the beginning of 2020, the unprecedented slowdown in U.S. and global economic activity, caused by the spread of the coronavirus and associated population quarantines and business closures, triggered sudden and sizable declines in equity market valuations in the first quarter. Rational price discovery |
| | | | | | | | |
accommodation would remain in place for some time. Strong relative performance in technology was driven by several successful investments across semiconductors, software and services, and advertising technology. Many technology stocks benefited during the market recovery as business | | | | pandemic. We continue to believe there will be bumps in the road, but every day that goes by we get closer to a COVID-19 vaccine and additional therapies. We continue to expect a more gradual recovery versus a V-shaped recovery, as several industries like travel and leisure may take years to recover. Also, employment and consumer spending may be negatively affected for some time. We will continue to add to positions at attractive risk/return levels and reduce positions on strength where | | | | based on individual company fundamentals was largely abandoned in a panic-driven environment abounding with profound public health and economic uncertainties. U.S. equity markets bounced back sharply in the second quarter from their precipitous first quarter 2020 declines. The rally was fueled by historically large levels of fiscal and monetary stimulus, a temporary “flattening of the curve” for coronavirus cases in the United States and elsewhere, and the |
10
|
AMG Managers Emerging Opportunities Fund Portfolio Manager’s Comments (continued) |
| | | | | | | | |
early stages of reopening of the domestic economy following numerous state-mandated stay-at-home orders. Following initial reports of huge job losses and slowdown in economic activity early in the quarter, subsequent employment, business activity, and consumer confidence reports in May and June surprised to the upside, providing further support to the market. Following a sharp rally in the second quarter, equity markets sustained their march upward in the third quarter as unprecedented levels of fiscal and monetary stimulus and a rebound in economic activity provided support for further stock appreciation. The easing of lockdown restrictions in many states enabled numerous business re-openings, although the stay-at-home economy remained a dominant force in overall commerce. Growth stocks across all market capitalization levels once again provided significantly higher returns than value stocks. Micro cap stocks, as represented by the Russell Microcap® Index, had weak returns for the year with seven 7 out of the 11 economic sectors posting negative returns. Energy (43.8%), financials (23.8%), and real estate (18.5%) were the worst performing sectors in the Index. The best performing sectors included health care +38.6% and consumer discretionary +14.0%. The RBC sleeve of the Fund is underweight to the energy, financials, real estate, and health care sectors and overweight to consumer discretionary. PERFORMANCE REVIEW The RBC sleeve of the Fund underperformed its Russell Microcap® Index benchmark during the one-year time period, producing a (12.0%) return compared to the +3.15% return for the Russell Microcap® Index. Adverse stock selection (764 bps) and sector allocation decisions (728 bps) contributed to underperformance for the period. Strengths included favorable stock selection within financials and real estate, as well as sector allocation decisions in energy and financials. Weaknesses included adverse stock selection within health care, consumer discretionary, and industrials, as well as sector allocation decisions in health care and industrials. | | | | Russell 2000® Growth Index is beating the Russell 2000® Value Index by over 2,800 basis points for the ten months year-to-date. Exacerbating this differential, as noted before, loss-making companies are the performance leaders among small cap stocks this year. Within this market environment, investors have encountered new phenomena in 2020 such as a global pandemic, widespread shutdowns and sporadic re-openings across the U.S. economy, and massive monetary and fiscal stimulus. This has led to a rollercoaster ride since the depth of the shutdowns at the end of the first quarter. For the four months from the end of March through the end of July, the focus of the market was on economic acceleration off a very depressed base. Starting in August, uncertainty began to grip the markets again as COVID-19 infection rates began to rise in different parts of the country, the potential for additional fiscal stimulus became less sure, and doubts about the upcoming election rose. Market leadership moved back to growth names and away from value-oriented cyclicals. We believe that the extreme valuation differentials between the growth and value investment styles are unsustainable over the long term, especially for speculative companies that tell a good story but prove to be incapable of producing significant long-term profits. Any correction in this regard back toward long-term valuation averages could significantly benefit the relative performance of the Fund. The RBC sleeve of the Fund focuses on neglected small and microcap companies with attractive long-term fundamentals, near-term profitability improvement potential, and low relative valuations. The strategy emphasizes market leaders with proven products or services, sustainable competitive advantages, solid balance sheets, and attractive cash flows. While sector weightings are a result of bottom-up research and stock selection, the sleeve remains positioned for economic recovery with overweights to the | | | | MARKET OVERVIEW This year we have experienced a once-in-a-century pandemic in a global economy that is more connected than ever before. It appears the global earnings decline may be worse than the U.S. While it looks like the recovery may be more V-shaped, it may move in a jagged fashion on the climb out. Unemployment claims are still high but falling and consumer and business confidence is up. While the consumer has suffered greatly, there is pent up savings being deployed, and mobility is off the lockdown low. The Fed has indicated that rates should remain low for the foreseeable future, and, for some, the concern has turned toward the threat of deflation, as many believe inflation could be years off. Fiscal stimulus, on the other hand, while plentiful thus far, offers room for more aid as so many are still out of work. After a (19.6)% drop in the calendar first quarter and a 20.5% gain in the second quarter, the S&P 500® Index added another 8.9% in the third quarter, marking the best third quarter since 2010. In a reversal of leadership yet again, large cap stocks outpaced small cap stocks by 4.5% in the third quarter and remain ahead of small cap by 15.1% year-to-date (according to FTSE Russell Indices). Historically, small cap stocks have led the way out of recession as small caps have outperformed large caps on average by 13% after six months in the five previous bear markets, according to Strategas Research Partners. The large cap stocks remain skewed by the outperformance of five tech stocks (Apple, Microsoft, Amazon, Facebook and Google) that are up nearly 40% on average year-to-date and represent more than 22% of the S&P 500® Index. We did, however, see tech stocks lag three other sectors in September, suggesting a rest for tech stocks may be on the horizon. While the value style of investing beat growth in September in larger stocks, growth remained the leader in mid and small cap stocks for the quarter and across all market caps year-to-date. |
| | | | | | | | |
OUTLOOK Following a multi-year performance advantage for growth stocks versus value stocks, the current valuation gap between the two styles at all market cap levels is at extremes matched only by the technology bubble of 1999–2000. This year alone, the | | | | economically sensitive industrials, consumer discretionary, and materials sectors. Downside protection is provided by the superior return on equity and balance sheet profile of the strategy compared to the Russell Microcap index and the market leadership positions of most portfolio companies. WEDGE Capital Management L.L.P. | | | | PERFORMANCE AND ATTRIBUTION ANALYSIS During the 12 months period ending October 31 2020, the WEDGE sleeve of the Fund returned (16.94)% compared to the Russell Microcap® Value benchmark return of (10.85)%. During the year, health care +50.6%, retail +25.6%, and capital goods +10.8% were the best performing sectors in the index. Energy (56.4%), transportation (26.7%), and finance (26.2%) were the worst performing segments. Stock selection during the year was negative (684 basis points) as selection in the health sector (492 basis points, lack of exposure to biotech), finance (138 |
11
|
AMG Managers Emerging Opportunities Fund Portfolio Manager’s Comments (continued) |
| | | | | | | | |
basis points), and technology (116 basis points) detracted value while selection in consumer staples +113 basis points and energy +100 basis points added value. POSITIONING AND OUTLOOK We largely maintain a sector neutral position to our internal benchmark, with limited exceptions. We want the majority of our added value to be in stock | | | | selection, not sector rotation. The WEDGE sleeve of the Fund is well diversified with portfolio risk in line with the benchmark. Given the volatility throughout the year, turnover was higher than usual, but we continue to be between 50% and 75% on average. We will remain focused on searching for high-quality companies with earnings growth potential that may be temporarily out of favor. | | | | This commentary reflects the viewpoints of the portfolio managers: Next Century Growth Investors LLC, WEDGE Capital Management L.L.P., and RBC Global Asset Management (U.S.) Inc. as of November 29, 2020, and is not intended as a forecast or guarantee of future results. Each commentary references how the subadvisor manages its respective sleeve of AMG Managers Emerging Opportunities Fund. |
12
|
AMG Managers Emerging Opportunities Fund Portfolio Manager’s Comments (continued) |
CUMULATIVE TOTAL RETURN PERFORMANCE
AMG Managers Emerging Opportunities Fund’s cumulative total return is based on the daily change in net asset value (NAV), and assumes that all dividends and distributions were reinvested. This graph compares a hypothetical $10,000 investment made in the AMG Managers Emerging Opportunities Fund’s Class N shares on October 31, 2010, to a $10,000 investment made in the Russell Microcap® Index and the Russell 2000® Index for the same time period. The graph and table do not reflect the deduction of taxes that a shareholder would pay on a Fund distribution or redemption of shares. The listed returns for the Fund are net of expenses and the returns for the index exclude expenses. Total returns would have been lower had certain expenses not been reduced.
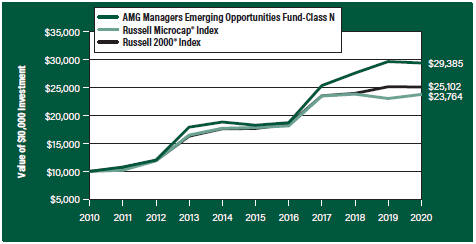
The table below shows the average annual total returns for the AMG Managers Emerging Opportunities Fund, the Russell Microcap® Index and the Russell 2000® Index for the same time periods ended October 31, 2020.
| | | | | | | | | | | | | | | | | | | | |
| Average Annual Total Returns1 | | One
Year | | | Five
Years | | | Ten
Years | | | Since Inception | | | Inception
Date | |
AMG Managers Emerging Opportunities Fund2, 3, 4, 5, 6, 7, 8 | | | | | | | | | | | | | | | | | |
| | | | | |
Class N | | | (0.86% | ) | | | 9.98% | | | | 11.38% | | | | 12.17% | | | | 06/30/94 | |
| | | | | |
Class I | | | (0.62% | ) | | | 10.25% | | | | — | | | | 13.81% | | | | 10/01/11 | |
| | | | | |
Russell Microcap® Index9 | | | 3.15% | | | | 5.88% | | | | 9.04% | | | | 6.03% | | | | — | |
Russell 2000® Index10 | | | (0.14% | ) | | | 7.27% | | | | 9.64% | | | | 8.76% | | | | 06/30/94 | † |
The performance data shown represents past performance. Past performance is not a guarantee of future results. Current performance may be lower or higher than the performance data quoted. The investment return and principal value of an investment will fluctuate so that an investor’s shares, when redeemed, may be worth more or less than their original cost.
Investors should carefully consider the Fund’s investment objectives, risks, charges and expenses before investing. For performance information through the most recent month end, current net asset values per share for the Fund and other information, please call 800.548.4539 or visit our website at amgfunds.com for a free prospectus. Read it carefully before investing or sending money.
Distributed by AMG Distributors, Inc., member FINRA/SIPC.
| † | Date reflects the inception date of the Fund, not the index. |
| 1 | Total return equals income yield plus share price change and assumes reinvestment of all dividends and capital gain distributions. Returns are net of fees and may reflect offsets of Fund expenses as described in the prospectus. No adjustment has been made for taxes payable by shareholders on their reinvested dividends and capital gain distributions. Returns for periods greater than one year are annualized. The listed returns on the Fund are net of expenses and based on the published NAV as of October 31, 2020. All returns are in U.S. dollars ($). |
| | |
| | | 2 From time to time, the Fund’s advisor has waived its fees and/or absorbed Fund expenses, which has resulted in higher returns. 3 The Fund is subject to the special risks associated with investments in micro-cap companies, such as relatively short earnings history, competitive conditions, less publicly available corporate information, and reliance on a limited number of products. 4 Investing in initial public offerings (IPOs) is risky and the prices of stocks purchased in IPOs tend to fluctuate more widely than stocks of companies that have been publicly traded for a longer period of time. Stocks purchased in IPOs generally do not have a trading history, and information about the companies may be available for very limited periods. 5 Companies that are in similar businesses may be similarly affected by particular economic or market events; to the extent the Fund has substantial holdings within a particular sector, the risks associated with that sector increase. 6 Market prices of investments held by the Fund may fall rapidly or unpredictably due to a variety of economic or political factors, market conditions, disasters or public health issues, or in response to events that affect particular industries or companies. |
| | | 7 The Fund invests in growth stocks, which may be more sensitive to market movements because their prices tend to reflect future investor expectations rather than just current profits. Growth stocks may underperform value stocks during given periods. |
| | | 8 The Fund invests in value stocks, which may perform differently from the market as a whole and may be undervalued by the market for a long period of time. |
| | | 9 The Russell Microcap® Index tracks the microcap segment of the U.S. equity market. It makes up less than 3% of the U.S. equity market and is represented by the smallest 1,000 securities in the small-cap Russell 2000® Index plus the next 1,000 securities. Unlike the Fund, the Russell Microcap® Index is unmanaged, is not available for investment, and does not incur expenses. 10 The Russell 2000® Index is composed of the 2,000 smallest stocks in the Russell 3000® Index and is widely regarded in the industry as the premier measure of small-cap stock performance. Unlike the Fund, the Russell 2000® Index is unmanaged, is not available for investment, and does not incur expenses. |
| | | The Russell Indices are trademarks of the London Stock Exchange Group companies. Not FDIC insured, nor bank guaranteed. May lose value. |
13
|
AMG Managers Emerging Opportunities Fund Fund Snapshots (unaudited) October 31, 2020 |
PORTFOLIO BREAKDOWN
| | |
| Sector | | % of
Net Assets |
| | |
Financials | | 20.9 |
| | |
Industrials | | 18.6 |
| | |
Health Care | | 16.7 |
| | |
Information Technology | | 14.9 |
| | |
Consumer Discretionary | | 11.6 |
| | |
Materials | | 3.4 |
| | |
Communication Services | | 2.3 |
| | |
Energy | | 2.3 |
| | |
Real Estate | | 2.3 |
| | |
Consumer Staples | | 1.8 |
| | |
Utilities | | 0.4 |
| | |
Short-Term Investments | | 7.8 |
| | |
Other Assets Less Liabilities | | (3.0) |
TOP TEN HOLDINGS
| | |
| Security Name | | % of
Net Assets |
Columbus McKinnon Corp. | | 1.7 |
| | |
Compass Diversified Holdings, MLP | | 1.6 |
| | |
Model N, Inc. | | 1.6 |
| | |
Patrick Industries, Inc. | | 1.5 |
| | |
Ducommun, Inc. | | 1.4 |
| | |
Novanta, Inc. | | 1.2 |
| | |
Malibu Boats, Inc., Class A | | 1.2 |
| | |
InfuSystem Holdings, Inc. | | 1.1 |
| | |
AMERISAFE, Inc. | | 1.1 |
| | |
CareDx, Inc. | | 1.1 |
| | |
Top Ten as a Group | | 13.5 |
| | |
Because a fund’s strategy may result in multiple investments in particular sectors of the economy, its performance may depend on the performance of those sectors and may fluctuate more widely than investments diversified across more sectors. For additional information on these and other risk considerations, please see the Fund’s prospectus.
Any sectors, industries, or securities discussed should not be perceived as investment recommendations. Mention of a specific security should not be considered a recommendation to buy or solicitation to sell that security. Specific securities mentioned in this report may have been sold from the Fund’s portfolio of investments by the time you receive this report.
14
|
AMG Managers Emerging Opportunities Fund Schedule of Portfolio Investments October 31, 2020 |
| | | | | | | | |
| | | Shares | | | Value | |
| | |
Common Stocks - 95.2% | | | | | | | | |
| |
Communication Services - 2.3% | | | | | |
| | |
Entravision Communications Corp., Class A | | | 101,386 | | | | $185,536 | |
| | |
Glu Mobile, Inc.* | | | 72,270 | | | | 517,453 | |
| | |
Gray Television, Inc.* | | | 81,306 | | | | 1,030,960 | |
| | |
LiveXLive Media, Inc.* | | | 83,810 | | | | 168,458 | |
| | |
TechTarget, Inc.* | | | 32,082 | | | | 1,405,192 | |
| | |
Total Communication Services | | | | | | | 3,307,599 | |
| |
Consumer Discretionary - 11.6% | | | | | |
| | |
American Public Education, Inc.* | | | 19,280 | | | | 545,046 | |
| | |
Aspen Group, Inc.* | | | 99,573 | | | | 933,995 | |
| | |
CarParts.com, Inc.*,1 | | | 36,497 | | | | 463,147 | |
| | |
Carriage Services, Inc. | | | 7,136 | | | | 184,180 | |
| | |
Clarus Corp. | | | 39,871 | | | | 618,399 | |
| | |
Culp, Inc. | | | 17,235 | | | | 213,886 | |
| | |
Del Taco Restaurants, Inc.* | | | 63,067 | | | | 467,642 | |
| | |
Delta Apparel, Inc.* | | | 58,548 | | | | 974,824 | |
| | |
Destination XL Group, Inc.* | | | 176,806 | | | | 46,447 | |
| | |
G-III Apparel Group Ltd* | | | 25,300 | | | | 341,044 | |
| | |
Grand Canyon Education, Inc.* | | | 10,670 | | | | 836,208 | |
| | |
Hamilton Beach Brands Holding Co., Class A | | | 11,819 | | | | 260,609 | |
| | |
Haverty Furniture Cos., Inc. | | | 30,254 | | | | 756,955 | |
| | |
Hibbett Sports, Inc.* | | | 25,433 | | | | 961,622 | |
| | |
Johnson Outdoors, Inc., Class A | | | 7,178 | | | | 626,855 | |
| | |
Lakeland Industries, Inc.* | | | 20,407 | | | | 440,179 | |
| | |
Malibu Boats, Inc., Class A* | | | 32,313 | | | | 1,642,470 | |
| | |
MasterCraft Boat Holdings, Inc.* | | | 7,890 | | | | 162,692 | |
| | |
Monarch Casino & Resort, Inc.* | | | 15,670 | | | | 679,921 | |
| | |
Perdoceo Education Corp.* | | | 56,380 | | | | 636,530 | |
| | |
PetMed Express, Inc.1 | | | 7,536 | | | | 222,915 | |
| | |
Points International, Ltd. (Canada)* | | | 21,930 | | | | 220,396 | |
| | |
Rocky Brands, Inc. | | | 12,498 | | | | 336,196 | |
| | |
Shoe Carnival, Inc.1 | | | 19,012 | | | | 588,992 | |
| | |
Superior Group of Cos., Inc. | | | 7,356 | | | | 159,037 | |
| | |
Tilly’s, Inc., Class A | | | 28,390 | | | | 174,315 | |
| | |
Turtle Beach Corp.*,1 | | | 38,471 | | | | 693,247 | |
| | |
Unifi, Inc.* | | | 28,341 | | | | 424,831 | |
| | |
Universal Electronics, Inc.* | | | 36,330 | | | | 1,346,390 | |
| | |
ZAGG, Inc.* | | | 128,538 | | | | 366,333 | |
| | |
Total Consumer Discretionary | | | | | | | 16,325,303 | |
| |
Consumer Staples - 1.8% | | | | | |
| | |
Celsius Holdings, Inc.*,1 | | | 41,617 | | | | 836,918 | |
| | |
elf Beauty, Inc.* | | | 4,860 | | | | 98,512 | |
| | | | | | | | |
| | | Shares | | | Value | |
| | |
Farmer Bros Co.* | | | 9,931 | | | | $34,461 | |
| | |
John B Sanfilippo & Son, Inc. | | | 10,400 | | | | 756,704 | |
| | |
Lifevantage Corp.* | | | 36,965 | | | | 408,463 | |
| | |
Natural Grocers by Vitamin Cottage, Inc. | | | 23,697 | | | | 252,136 | |
| | |
SunOpta, Inc. (Canada)* | | | 22,976 | | | | 157,615 | |
| | |
Total Consumer Staples | | | | | | | 2,544,809 | |
| | |
Energy - 2.3% | | | | | | | | |
| | |
Aspen Aerogels, Inc.* | | | 69,781 | | | | 788,525 | |
| | |
Bonanza Creek Energy, Inc.* | | | 24,299 | | | | 430,335 | |
| | |
DMC Global, Inc.1 | | | 4,223 | | | | 150,212 | |
| | |
Evolution Petroleum Corp. | | | 53,098 | | | | 117,347 | |
| | |
Exterran Corp.* | | | 104,577 | | | | 442,361 | |
| | |
Matrix Service Co.* | | | 46,405 | | | | 352,678 | |
| | |
North American Construction Group, | | | | | | | | |
| | |
Ltd. (Canada) | | | 29,934 | | | | 231,988 | |
| | |
Par Pacific Holdings Inc.*,1 | | | 44,390 | | | | 285,872 | |
| | |
Solaris Oilfield Infrastructure, Inc., Class A | | | 70,704 | | | | 419,275 | |
| | |
Total Energy | | | | | | | 3,218,593 | |
| |
Financials - 20.9% | | | | | |
| | |
Allegiance Bancshares, Inc. | | | 24,110 | | | | 682,313 | |
| | |
Amalgamated Bank, Class A | | | 26,025 | | | | 288,877 | |
| | |
AMERISAFE, Inc. | | | 26,510 | | | | 1,563,560 | |
| | |
Atlantic Capital Bancshares, Inc.* | | | 52,018 | | | | 722,010 | |
| | |
The Bancorp, Inc.* | | | 149,265 | | | | 1,432,944 | |
| | |
Bank of Marin Bancorp | | | 15,928 | | | | 480,070 | |
| | |
Bridge Bancorp, Inc. | | | 35,166 | | | | 687,144 | |
| | |
Bridgewater Bancshares, Inc.* | | | 35,063 | | | | 389,550 | |
| | |
Business First Bancshares, Inc. | | | 24,541 | | | | 407,626 | |
| | |
Camden National Corp. | | | 22,708 | | | | 725,975 | |
| | |
Capital City Bank Group, Inc.1 | | | 4,957 | | | | 105,634 | |
| | |
Central Valley Community Bancorp | | | 12,197 | | | | 157,341 | |
| | |
Compass Diversified Holdings, MLP 1 | | | 133,152 | | | | 2,302,198 | |
| | |
Cowen, Inc., Class A | | | 60,504 | | | | 1,298,416 | |
| | |
Curo Group Holdings Corp. | | | 75,794 | | | | 567,697 | |
| | |
Customers Bancorp, Inc.* | | | 62,419 | | | | 862,631 | |
| | |
Enova International, Inc.* | | | 55,811 | | | | 856,699 | |
| | |
Farmers National Banc Corp. | | | 44,494 | | | | 518,355 | |
| | |
Financial Institutions, Inc. | | | 18,376 | | | | 325,806 | |
| | |
First Bancorp | | | 15,540 | | | | 374,359 | |
| | |
First Business Financial Services, Inc. | | | 6,036 | | | | 103,517 | |
| | |
First Internet Bancorp | | | 19,796 | | | | 426,010 | |
| | |
The First of Long Island Corp. | | | 27,522 | | | | 424,664 | |
| | |
Flushing Financial Corp. | | | 66,482 | | | | 850,305 | |
The accompanying notes are an integral part of these financial statements.
15
|
AMG Managers Emerging Opportunities Fund Schedule of Portfolio Investments (continued) |
| | | | | | | | |
| | | Shares | | | Value | |
| | |
Financials - 20.9% (continued) | | | | | | | | |
| | |
FS Bancorp, Inc. | | | 4,183 | | | | $193,715 | |
| | |
German American Bancorp, Inc. | | | 31,545 | | | | 951,713 | |
| | |
Goosehead Insurance, Inc., Class A1 | | | 3,508 | | | | 429,870 | |
| | |
Guaranty Bancshares, Inc. | | | 7,682 | | | | 222,010 | |
| | |
HCI Group, Inc. | | | 13,609 | | | | 639,351 | |
| | |
Heritage Financial Corp. | | | 12,887 | | | | 270,112 | |
| | |
Heritage Insurance Holdings, Inc. | | | 40,180 | | | | 379,299 | |
| | |
Independent Bank Corp. | | | 49,193 | | | | 736,419 | |
| | |
Luther Burbank Corp. | | | 37,101 | | | | 349,862 | |
| | |
Macatawa Bank Corp. | | | 28,917 | | | | 207,913 | |
| | |
Mercantile Bank Corp. | | | 14,520 | | | | 317,407 | |
| | |
Merchants Bancorp | | | 14,874 | | | | 320,981 | |
| | |
Metropolitan Bank Holding Corp.* | | | 12,631 | | | | 378,298 | |
| | |
NMI Holdings, Inc., Class A* | | | 49,210 | | | | 1,057,523 | |
| | |
Northrim BanCorp, Inc. | | | 34,762 | | | | 992,803 | |
| | |
Old Second Bancorp, Inc. | | | 53,130 | | | | 454,261 | |
| | |
Palomar Holdings, Inc.* | | | 11,918 | | | | 1,062,728 | |
| | |
Peapack-Gladstone Financial Corp. | | | 29,831 | | | | 503,547 | |
| | |
Preferred Bank | | | 12,190 | | | | 412,388 | |
| | |
Regional Management Corp.* | | | 25,436 | | | | 516,860 | |
| | |
Sierra Bancorp | | | 19,239 | | | | 381,702 | |
| | |
South Plains Financial, Inc. | | | 11,956 | | | | 175,155 | |
| | |
Stock Yards Bancorp, Inc. | | | 19,570 | | | | 747,965 | |
| | |
Territorial Bancorp, Inc. | | | 12,411 | | | | 263,237 | |
| | |
Trean Insurance Group, Inc.* | | | 39,903 | | | | 432,948 | |
| | |
Triumph Bancorp, Inc.* | | | 10,000 | | | | 421,300 | |
| | |
Unity Bancorp, Inc. | | | 6,714 | | | | 94,130 | |
| | |
Total Financials | | | | | | | 29,467,198 | |
| | |
Health Care - 16.7% | | | | | | | | |
| | |
Accolade, Inc.*,1 | | | 10,106 | | | | 353,912 | |
| | |
Alphatec Holdings, Inc.* | | | 87,172 | | | | 744,449 | |
| | |
Axonics Modulation Technologies, Inc.*,1 | | | 24,871 | | | | 1,166,201 | |
| | |
BioLife Solutions, Inc.* | | | 24,879 | | | | 714,276 | |
| | |
CareDx, Inc.* | | | 31,350 | | | | 1,537,718 | |
| | |
Castle Biosciences, Inc.* | | | 23,757 | | | | 1,103,038 | |
| | |
Catalyst Pharmaceuticals, Inc.* | | | 43,467 | | | | 129,097 | |
| | |
Computer Programs and Systems, Inc. | | | 13,976 | | | | 389,791 | |
| | |
CRH Medical Corp. (Canada)* | | | 33,386 | | | | 66,438 | |
| | |
Cross Country Healthcare, Inc.* | | | 51,839 | | | | 406,936 | |
| | |
CryoLife, Inc.* | | | 18,663 | | | | 312,792 | |
| | |
CryoPort, Inc.*,1 | | | 8,286 | | | | 332,600 | |
| | |
Electromed, Inc.* | | | 6,302 | | | | 52,370 | |
| | | | | | | | |
| | | Shares | | | Value | |
| | |
Harvard Bioscience, Inc.* | | | 81,339 | | | | $274,926 | |
| | |
Health Catalyst, Inc.* | | | 10,379 | | | | 357,868 | |
| | |
Healthcare Merger Corp., Class A*,1 | | | 37,683 | | | | 347,437 | |
| | |
InfuSystem Holdings, Inc.* | | | 130,744 | | | | 1,610,766 | |
| | |
Invacare Corp.1 | | | 92,639 | | | | 751,302 | |
| | |
The Joint Corp.* | | | 59,318 | | | | 1,111,619 | |
| | |
Lantheus Holdings, Inc.* | | | 48,470 | | | | 526,384 | |
| | |
MTBC, Inc.* | | | 1,717 | | | | 13,169 | |
| | |
OptimizeRx Corp.* | | | 18,522 | | | | 366,736 | |
| | |
OrthoPediatrics Corp.*,1 | | | 27,923 | | | | 1,245,366 | |
| | |
Osmotica Pharmaceuticals PLC* | | | 66,005 | | | | 338,606 | |
| | |
Pro-Dex, Inc.* | | | 3,044 | | | | 106,692 | |
| | |
Pulmonx Corp.* | | | 4,819 | | | | 202,687 | |
| | |
Quanterix Corp.*,1 | | | 12,081 | | | | 442,285 | |
| | |
Repro-Med Systems, Inc.* | | | 62,222 | | | | 343,465 | |
| | |
Sharps Compliance Corp.*,1 | | | 9,977 | | | | 59,463 | |
| | |
Shockwave Medical, Inc.* | | | 8,871 | | | | 606,067 | |
| | |
SI-BONE, Inc.* | | | 56,548 | | | | 1,185,812 | |
| | |
Silk Road Medical, Inc.* | | | 15,782 | | | | 956,389 | |
| | |
Simulations Plus, Inc.1 | | | 6,419 | | | | 416,080 | |
| | |
STAAR Surgical Co.* | | | 6,732 | | | | 488,070 | |
| | |
Surgalign Holdings, Inc.* | | | 262,545 | | | | 456,828 | |
| | |
Surmodics, Inc.* | | | 34,345 | | | | 1,262,179 | |
| | |
Utah Medical Products, Inc. | | | 3,435 | | | | 285,105 | |
| | |
Veracyte, Inc.*,1 | | | 31,376 | | | | 1,087,492 | |
| | |
Vericel Corp.* | | | 73,423 | | | | 1,360,528 | |
| | |
Total Health Care | | | | | | | 23,512,939 | |
| | |
Industrials - 18.6% | | | | | | | | |
| | |
ACCO Brands Corp. | | | 217,493 | | | | 1,146,188 | |
| | |
Aegion Corp.* | | | 13,518 | | | | 190,739 | |
| | |
Air Transport Services Group, Inc.* | | | 28,020 | | | | 785,681 | |
| | |
Allied Motion Technologies, Inc. | | | 40,607 | | | | 1,534,132 | |
| | |
Barrett Business Services, Inc. | | | 10,650 | | | | 631,012 | |
| | |
Casella Waste Systems, Inc., Class A* | | | 10,977 | | | | 592,648 | |
| | |
CBIZ, Inc.* | | | 26,450 | | | | 599,621 | |
| | |
Chart Industries, Inc.* | | | 7,741 | | | | 653,727 | |
| | |
Columbus McKinnon Corp. | | | 70,872 | | | | 2,401,852 | |
| | |
Covenant Logistics Group, Inc., Class A* | | | 30,436 | | | | 419,104 | |
| | |
CRA International, Inc. | | | 10,871 | | | | 445,167 | |
| | |
DLH Holdings Corp.* | | | 6,508 | | | | 58,312 | |
| | |
Ducommun, Inc.* | | | 58,398 | | | | 1,921,294 | |
| | |
Ennis, Inc. | | | 45,998 | | | | 701,010 | |
| | |
Graham Corp. | | | 1,568 | | | | 20,698 | |
The accompanying notes are an integral part of these financial statements.
16
|
AMG Managers Emerging Opportunities Fund Schedule of Portfolio Investments (continued) |
| | | | | | | | |
| | | Shares | | | Value | |
| |
Industrials - 18.6% (continued) | | | | | |
| | |
The Greenbrier Cos., Inc. | | | 30,073 | | | | $811,370 | |
| | |
Harsco Corp.* | | | 19,650 | | | | 253,485 | |
| | |
Heidrick & Struggles International, Inc. | | | 20,670 | | | | 472,310 | |
| | |
Heritage-Crystal Clean, Inc.* | | | 7,401 | | | | 121,968 | |
| | |
Insteel Industries, Inc. | | | 66,242 | | | | 1,441,426 | |
| | |
Kornit Digital, Ltd. (Israel)* | | | 5,704 | | | | 383,993 | |
| | |
LBFosterCo., ClassA* | | | 8,991 | | | | 121,918 | |
| | |
Lawson Products, Inc. * | | | 6,520 | | | | 268,689 | |
| | |
LSI Industries, Inc. | | | 41,086 | | | | 281,028 | |
| | |
Lydall, Inc.* | | | 65,132 | | | | 1,288,962 | |
| | |
Marten Transport, Ltd. | | | 53,917 | | | | 827,356 | |
| | |
Mistras Group, Inc.* | | | 86,873 | | | | 323,168 | |
| | |
MRC Global, Inc.* | | | 71,362 | | | | 304,002 | |
| | |
MYR Group, Inc.* | | | 12,634 | | | | 540,104 | |
| | |
Northwest Pipe Co.* | | | 44,970 | | | | 1,205,196 | |
| | |
NV5 Global, Inc.*,1 | | | 16,970 | | | | 951,678 | |
| | |
PAM Transportation Services, Inc.* | | | 1,261 | | | | 49,936 | |
| | |
Patrick Industries, Inc. | | | 39,122 | | | | 2,181,051 | |
| | |
Radiant Logistics, Inc.* | | | 49,761 | | | | 255,772 | |
| | |
The Shyft Group, Inc. | | | 20,991 | | | | 405,336 | |
| | |
Transcat, Inc.* | | | 4,415 | | | | 136,468 | |
| | |
Universal Logistics Holdings, Inc. | | | 11,161 | | | | 220,207 | |
| | |
Vectrus, Inc.* | | | 10,954 | | | | 432,902 | |
| | |
Wabash National Corp. | | | 41,273 | | | | 588,553 | |
| | |
Willdan Group, Inc.*,1 | | | 11,531 | | | | 301,766 | |
| | |
Total Industrials | | | | | | | 26,269,829 | |
| |
Information Technology - 14.9% | | | | | |
| | |
Airgain, Inc.* | | | 14,192 | | | | 196,133 | |
| | |
American Software, Inc., Class A | | | 22,487 | | | | 330,109 | |
| | |
AstroNova, Inc. | | | 14,740 | | | | 116,446 | |
| | |
AXT, Inc.*,1 | | | 103,450 | | | | 615,528 | |
| | |
Bel Fuse, Inc., Class B | | | 9,081 | | | | 106,339 | |
| | |
Cerence, Inc.*,1 | | | 9,358 | | | | 510,760 | |
| | |
ChannelAdvisor Corp.* | | | 18,980 | | | | 307,476 | |
| | |
Clearfield, Inc.* | | | 4,120 | | | | 86,232 | |
| | |
Cohu, Inc. | | | 19,770 | | | | 429,602 | |
| | |
Comtech Telecommunications Corp. | | | 31,615 | | | | 455,256 | |
| | |
CyberOptics Corp.* | | | 11,300 | | | | 260,352 | |
| | |
Domo, Inc., Class B* | | | 26,958 | | | | 856,456 | |
| | |
DSP Group, Inc.* | | | 22,235 | | | | 292,835 | |
| | |
eGain Corp.* | | | 48,832 | | | | 773,987 | |
| | |
Genasys, Inc.* | | | 95,319 | | | | 573,820 | |
| | | | | | | | |
| | | Shares | | | Value | |
| | |
Grid Dynamics Holdings, Inc.* | | | 89,256 | | | | $696,197 | |
| | |
The Hackett Group, Inc. | | | 24,230 | | | | 313,052 | |
| | |
IEC Electronics Corp.* | | | 30,906 | | | | 295,770 | |
| | |
MACOM Technology Solutions Holdings, Inc.* | | | 23,851 | | | | 870,561 | |
| | |
Mitek Systems, Inc.* | | | 114,340 | | | | 1,423,533 | |
| | |
Model N, Inc.* | | | 63,056 | | | | 2,221,463 | |
| | |
Napco Security Technologies, Inc.* | | | 35,300 | | | | 851,436 | |
| | |
nLight, Inc.* | | | 15,611 | | | | 331,578 | |
| | |
Novanta, Inc.* | | | 15,310 | | | | 1,664,503 | |
| | |
PC Connection, Inc. | | | 16,357 | | | | 745,061 | |
| | |
PCTEL, Inc. | | | 25,445 | | | | 129,770 | |
| | |
Qumu Corp.* | | | 20,885 | | | | 95,027 | |
| | |
Sapiens International Corp. NV (Israel) | | | 47,121 | | | | 1,278,393 | |
| | |
SiTime Corp.* | | | 16,715 | | | | 1,395,535 | |
| | |
Sprout Social, Inc., Class A* | | | 31,760 | | | | 1,387,912 | |
| | |
Tyler Technologies, Inc.* | | | 590 | | | | 226,784 | |
| | |
Verra Mobility Corp.* | | | 28,554 | | | | 274,404 | |
| | |
Vishay Precision Group, Inc.* | | | 36,569 | | | | 873,633 | |
| | |
Total Information Technology | | | | | | | 20,985,943 | |
| | |
Materials - 3.4% | | | | | | | | |
| | |
FutureFuel Corp. | | | 70,350 | | | | 836,462 | |
| | |
Haynes International, Inc. | | | 8,639 | | | | 140,038 | |
| | |
Koppers Holdings, Inc.* | | | 57,096 | | | | 1,280,663 | |
| | |
Myers Industries, Inc. | | | 44,152 | | | | 633,140 | |
| | |
Trecora Resources* | | | 71,703 | | | | 424,482 | |
| | |
UFP Technologies, Inc.* | | | 28,745 | | | | 1,065,290 | |
| | |
Universal Stainless & Alloy Products, Inc.* | | | 22,136 | | | | 120,198 | |
| | |
Verso Corp., Class A | | | 36,263 | | | | 282,126 | |
| | |
Total Materials | | | | | | | 4,782,399 | |
| | |
Real Estate - 2.3% | | | | | | | | |
| | |
CatchMark Timber Trust, Inc., Class A, REIT | | | 37,541 | | | | 326,231 | |
| | |
Clipper Realty, Inc., REIT | | | 17,508 | | | | 98,395 | |
| | |
Community Healthcare Trust, Inc., REIT | | | 20,350 | | | | 942,205 | |
| | |
Global Medical REIT, Inc. | | | 40,134 | | | | 498,865 | |
| | |
Plymouth Industrial REIT, Inc. | | | 32,832 | | | | 417,295 | |
| | |
UMH Properties, Inc., REIT | | | 68,390 | | | | 932,156 | |
| | |
Total Real Estate | | | | | | | 3,215,147 | |
| | |
Utilities - 0.4% | | | | | | | | |
| | |
Atlantic Power Corp.* | | | 94,913 | | | | 188,877 | |
| | |
Global Water Resources, Inc. | | | 991 | | | | 10,505 | |
The accompanying notes are an integral part of these financial statements.
17
|
AMG Managers Emerging Opportunities Fund Schedule of Portfolio Investments (continued) |
| | | | | | | | |
| | | Shares | | | Value | |
| | |
Utilities - 0.4% (continued) | | | | | | | | |
| | |
Unitil Corp. | | | 12,820 | | | | $442,931 | |
| | |
Total Utilities | | | | | | | 642,313 | |
Total Common Stocks | | | | | | | | |
(Cost $107,188,635) | | | | | | | 134,272,072 | |
| | |
| | | Principal
Amount | | | | |
| | |
Short-Term Investments - 7.8% | | | | | | | | |
| | |
Joint Repurchase Agreements - 4.1%2 | | | | | | | | |
| | |
Cantor Fitzgerald Securities, Inc., dated 10/30/20, due 11/02/20, 0.120% total to be received $1,379,614 (collateralized by various U.S. Government Agency Obligations, 0.160% -9.500%, 12/01/20 - 09/20/70, totaling $1,407,192) | | | $1,379,600 | | | | 1,379,600 | |
| | |
Citadel Securities LLC, dated 10/30/20, due 11/02/20, 0.150% total to be received $1,199,449 (collateralized by various U.S. Treasuries, 0.000% - 8.125%, 10/31/20 -02/15/50, totaling $1,223,966) | | | 1,199,434 | | | | 1,199,434 | |
| | |
Citigroup Global Markets, Inc., dated 10/30/20, due 11/02/20, 0.090% total to be received $713,440 (collateralized by various U.S. Government Agency Obligations and U.S. Treasuries, 0.000% - 6.500%, 10/31/20 -08/20/70, totaling $727,704) | | | 713,435 | | | | 713,435 | |
| | |
JVB Financial Group LLC, dated 10/30/20, due 11/02/20, 0.150% total to be received $1,136,701 (collateralized by various U.S. Government Agency Obligations and U.S. Treasuries, 0.000% - 7.000%, 01/28/21 - 10/01/50, totaling $1,159,421) | | | 1,136,687 | | | | 1,136,687 | |
| | | | | | | | |
| | | Principal
Amount | | | Value | |
| | |
South Street Securities LLC, dated 10/30/20, due 11/02/20, 0.140% total to be received $1,379,616 (collateralized by various U.S. Government Agency Obligations and U.S. Treasuries, 0.125% - 6.500%, 01/13/22 - 04/15/60, totaling $1,407,193) | | | $1,379,600 | | | | $1,379,600 | |
| |
Total Joint Repurchase Agreements | | | | 5,808,756 | |
| | |
| | | Shares | | | | |
| | |
Other Investment Companies - 3.7% | | | | | | | | |
| | |
Dreyfus Government Cash Management Fund, Institutional Shares, 0.02%3 | | | 5,044,266 | | | | 5,044,266 | |
| | |
Dreyfus Institutional Preferred Government Money Market Fund, Institutional Shares, 3 0.04%3 | | | 68,964 | | | | 68,964 | |
| | |
JPMorgan U.S. Government Money Market Fund, IM Shares, 0.04%3 | | | 71,054 | | | | 71,054 | |
| |
Total Other Investment Companies | | | | 5,184,284 | |
Total Short-Term Investments | | | | | |
(Cost $10,993,040) | | | | | | | 10,993,040 | |
| | |
Total Investments - 103.0% | | | | | | | | |
(Cost $118,181,675) | | | | | | | 145,265,112 | |
| |
Other Assets, less Liabilities - (3.0)% | | | | (4,186,206 | ) |
| | |
Net Assets - 100.0% | | | | | | | $141,078,906 | |
| * | Non-income producing security. |
| 1 | Some of these securities, amounting to $9,163,634 or 6.5% of net assets, were out on loan to various borrowers and are collateralized by cash and various U.S. Treasury Obligations. See Note 4 of Notes to Financial Statements. |
| 2 | Cash collateral received for securities lending activity was invested in these joint repurchase agreements. |
| 3 | Yield shown represents the October 31, 2020, seven day average yield, which refers to the sum of the previous seven days’ dividends paid, expressed as an annual percentage. |
| MLP | Master Limited Partnership |
| REIT | Real Estate Investment Trust |
The accompanying notes are an integral part of these financial statements.
18
|
AMG Managers Emerging Opportunities Fund Schedule of Portfolio Investments (continued) |
The following table summarizes the inputs used to value the Fund’s investments by the fair value hierarchy levels as of October 31, 2020:
| | | | | | | | | | | | | | | | |
| | | Level 1 | | | Level 2 | | | Level 3 | | | Total | |
Investments in Securities | | | | | | | | | | | | | | | | |
| | | | |
Common Stocks† | | $ | 134,272,072 | | | | — | | | | — | | | $ | 134,272,072 | |
| | | | |
Short-Term Investments | | | | | | | | | | | | | | | | |
| | | | |
Joint Repurchase Agreements | | | — | | | $ | 5,808,756 | | | | — | | | | 5,808,756 | |
| | | | |
Other Investment Companies | | | 5,184,284 | | | | — | | | | — | | | | 5,184,284 | |
| | | | | | | | | | | | | | | | |
Total Investments in Securities | | $ | 139,456,356 | | | $ | 5,808,756 | | | | — | | | $ | 145,265,112 | |
| | | | | | | | | | | | | | | | |
| | † | All common stocks held in the Fund are Level 1 securities. For a detailed breakout of common stocks by major industry classification, please refer to the Fund’s Schedule of Portfolio Investments. |
For the fiscal year ended October 31, 2020, there were no transfers in or out of Level 3.
The accompanying notes are an integral part of these financial statements.
19
|
Statement of Assets and Liabilities October 31, 2020 |
| | | | | | | | | | |
| | | AMG Frontier
Small Cap
Growth Fund | | AMG Managers
Emerging
Opportunities Fund |
Assets: | | | | | | | | | | |
Investments at value 1 (including securities on loan valued at $3,540,488, and $9,163,634, respectively) | | | | $20,760,823 | | | | | $145,265,112 | |
Receivable for investments sold | | | | 274,536 | | | | | 2,103,375 | |
Dividend and interest receivables | | | | 157 | | | | | 20,562 | |
Securities lending income receivable | | | | 798 | | | | | 2,150 | |
Receivable for Fund shares sold | | | | — | | | | | 780 | |
Receivable from affiliate | | | | 2,531 | | | | | — | |
Prepaid expenses and other assets | | | | 2,962 | | | | | 13,564 | |
Total assets | | | | 21,041,807 | | | | | 147,405,543 | |
Liabilities: | | | | | | | | | | |
Payable upon return of securities loaned | | | | 926,423 | | | | | 5,808,756 | |
Payable for investments purchased | | | | 362,517 | | | | | 190,271 | |
Payable for Fund shares repurchased | | | | 2,514 | | | | | 150,440 | |
Accrued expenses: | | | | | | | | | | |
Investment advisory and management fees | | | | 12,267 | | | | | 95,598 | |
Administrative fees | | | | 2,628 | | | | | 18,770 | |
Distribution fees | | | | 64 | | | | | — | |
Shareholder service fees | | | | — | | | | | 21,664 | |
Other | | | | 32,897 | | | | | 41,138 | |
Total liabilities | | | | 1,339,310 | | | | | 6,326,637 | |
| | |
| | | | | | | | | | |
| | |
Net Assets | | | | $19,702,497 | | | | | $141,078,906 | |
| | |
1 Investments at cost | | | | $17,333,785 | | | | | $118,181,675 | |
The accompanying notes are an integral part of these financial statements.
20
|
Statement of Assets and Liabilities (continued) |
| | | | | | | | | | |
| | | AMG Frontier
Small Cap
Growth Fund | | AMG Managers
Emerging
Opportunities Fund |
| | |
Net Assets Represent: | | | | | | | | | | |
Paid-in capital | | | | $16,144,412 | | | | | $110,002,541 | |
Total distributable earnings | | | | 3,558,085 | | | | | 31,076,365 | |
Net Assets | | | | $19,702,497 | | | | | $141,078,906 | |
| | |
Class N: | | | | | | | | | | |
Net Assets | | | | $305,559 | | | | | $114,121,680 | |
Shares outstanding | | | | 35,740 | | | | | 3,033,961 | |
Net asset value, offering and redemption price per share | | | | $8.55 | | | | | $37.61 | |
Class I: | | | | | | | | | | |
Net Assets | | | | $11,546,915 | | | | | $26,957,226 | |
Shares outstanding | | | | 1,276,776 | | | | | 698,747 | |
Net asset value, offering and redemption price per share | | | | $9.04 | | | | | $38.58 | |
Class Z: | | | | | | | | | | |
Net Assets | | | | $7,850,023 | | | | | — | |
Shares outstanding | | | | 832,216 | | | | | — | |
Net asset value, offering and redemption price per share | | | | $9.43 | | | | | — | |
The accompanying notes are an integral part of these financial statements.
21
|
Statements of Operations For the fiscal year ended October 31, 2020 |
| | | | | | | | | | |
| | | AMG Frontier
Small Cap
Growth Fund | | AMG Managers
Emerging
Opportunities Fund |
Investment Income: | | | | | | | | | | |
Dividend income | | | | $98,139 | | | | | $1,983,776 | |
Securities lending income | | | | 10,804 | | | | | 94,349 | |
Foreign withholding tax | | | | (5,028 | ) | | | | (2,831 | ) |
Total investment income | | | | 103,915 | | | | | 2,075,294 | |
Expenses: | | | | | | | | | | |
Investment advisory and management fees | | | | 127,895 | | | | | 1,086,585 | |
Administrative fees | | | | 27,406 | | | | | 220,254 | |
Distribution fees - Class N | | | | 737 | | | | | — | |
Shareholder servicing fees - Class N | | | | 442 | | | | | 293,557 | |
Shareholder servicing fees - Class I | | | | 5,347 | | | | | — | |
Registration fees | | | | 41,491 | | | | | 35,664 | |
Custodian fees | | | | 35,515 | | | | | 36,661 | |
Professional fees | | | | 27,435 | | | | | 34,449 | |
Reports to shareholders | | | | 5,492 | | | | | 26,874 | |
Transfer agent fees | | | | 5,356 | | | | | 25,119 | |
Trustee fees and expenses | | | | 1,572 | | | | | 12,956 | |
Miscellaneous | | | | 2,855 | | | | | 6,779 | |
Total expenses before offsets | | | | 281,543 | | | | | 1,778,898 | |
Expense reimbursements | | | | (110,484 | ) | | | | (104,667 | ) |
Expense reductions | | | | — | | | | | (20,427 | ) |
Net expenses | | | | 171,059 | | | | | 1,653,804 | |
| | |
| | | | | | | | | | |
Net investment income (loss) | | | | (67,144 | ) | | | | 421,490 | |
Net Realized and Unrealized Gain (Loss): | | | | | | | | | | |
Net realized gain on investments | | | | 1,105,007 | | | | | 6,134,621 | |
Net change in unrealized appreciation/depreciation on investments | | | | 1,636,337 | | | | | (10,442,976 | ) |
Net realized and unrealized gain (loss) | | | | 2,741,344 | | | | | (4,308,355 | ) |
| | |
| | | | | | | | | | |
Net increase (decrease) in net assets resulting from operations | | | | $2,674,200 | | | | | $(3,886,865 | ) |
The accompanying notes are an integral part of these financial statements.
22
|
Statements of Changes in Net Assets For the fiscal years ended October 31, |
| | | | | | | | | | | | | | | | |
| | | AMG Frontier
Small Cap Growth Fund | | | AMG Managers Emerging
Opportunities Fund | |
| | | 2020 | | | 2019 | | | 2020 | | | 2019 | |
| | | | |
Increase (Decrease) in Net Assets Resulting From Operations: | | | | | | | | | | | | | | | | |
Net investment income (loss) | | | $(67,144 | ) | | | $(83,161 | ) | | | $421,490 | | | | $(324,660 | ) |
Net realized gain on investments | | | 1,105,007 | | | | 1,661,550 | | | | 6,134,621 | | | | 14,221,292 | |
Net change in unrealized appreciation/depreciation on investments | | | 1,636,337 | | | | 407,788 | | | | (10,442,976 | ) | | | (1,986,484 | ) |
| | | | |
Net increase (decrease) in net assets resulting from operations | | | 2,674,200 | | | | 1,986,177 | | | | (3,886,865 | ) | | | 11,910,148 | |
| | | | |
Distributions to Shareholders: | | | | | | | | | | | | | | | | |
Class N | | | (28,430 | ) | | | (137,752 | ) | | | (12,148,476 | ) | | | (26,608,055 | ) |
Class I | | | (930,660 | ) | | | (3,607,157 | ) | | | (2,572,340 | ) | | | (4,974,384 | ) |
Class Z | | | (590,610 | ) | | | (2,240,613 | ) | | | — | | | | — | |
Total distributions to shareholders | | | (1,549,700 | ) | | | (5,985,522 | ) | | | (14,720,816 | ) | | | (31,582,439 | ) |
Capital Share Transactions:1 | | | | | | | | | | | | | | | | |
| | | | |
Net increase (decrease) from capital share transactions | | | 185,255 | | | | 3,871,839 | | | | (9,256,576 | ) | | | 11,711,122 | |
| | | | | | | | | | | | | | | | |
| | | | |
Total increase (decrease) in net assets | | | 1,309,755 | | | | (127,506 | ) | | | (27,864,257 | ) | | | (7,961,169 | ) |
Net Assets: | | | | | | | | | | | | | | | | |
Beginning of year | | | 18,392,742 | | | | 18,520,248 | | | | 168,943,163 | | | | 176,904,332 | |
End of year | | | $19,702,497 | | | | $18,392,742 | | | | $141,078,906 | | | | $168,943,163 | |
| 1 | See Note 1(g) of the Notes to Financial Statements. |
The accompanying notes are an integral part of these financial statements.
23
|
AMG Frontier Small Cap Growth Fund Financial Highlights For a share outstanding throughout each fiscal |
| | | | | | | | | | | | | | | | | | | | |
| | | For the fiscal years ended October 31, | |
| | | | | |
| Class N | | 2020 | | | 2019 | | | 2018 | | | 2017 | | | 20161 | |
Net Asset Value, Beginning of Year | | | $8.03 | | | $ | 11.69 | | | $ | 13.20 | | | $ | 10.29 | | | $ | 13.57 | |
Income (loss) from Investment Operations: | | | | | | | | | | | | | | | | | | | | |
Net investment loss2,3 | | | (0.06 | ) | | | (0.06 | ) | | | (0.09 | ) | | | (0.11 | ) | | | (0.06 | )4 |
| | | | | |
Net realized and unrealized gain (loss) on investments | | | 1.30 | | | | 0.45 | | | | 1.58 | | | | 3.07 | | | | (0.22 | ) |
Total income (loss) from investment operations | | | 1.24 | | | | 0.39 | | | | 1.49 | | | | 2.96 | | | | (0.28 | ) |
Less Distributions to Shareholders from: | | | | | | | | | | | | | | | | | | | | |
Net realized gain on investments | | | (0.72 | ) | | | (4.05 | ) | | | (3.00 | ) | | | (0.05 | ) | | | (3.00 | ) |
Net Asset Value, End of Year | | | $8.55 | | | | $8.03 | | | $ | 11.69 | | | $ | 13.20 | | | $ | 10.29 | |
Total Return3,5 | | | 16.22 | % | | | 11.83 | % | | | 13.81 | % | | | 28.82 | % | | | (3.01 | )% |
Ratio of net expenses to average net assets | | | 1.30 | % | | | 1.30 | % | | | 1.30 | % | | | 1.43 | % | | | 1.55 | % |
Ratio of gross expenses to average net assets6 | | | 1.90 | % | | | 1.94 | % | | | 1.81 | % | | | 2.01 | % | | | 1.95 | % |
Ratio of net investment loss to average net assets3 | | | (0.73 | )% | | | (0.79 | )% | | | (0.76 | )% | | | (0.93 | )% | | | (0.58 | )% |
Portfolio turnover | | | 206 | % | | | 226 | % | | | 233 | % | | | 99 | % | | | 70 | % |
Net assets end of year (000’s) omitted | | | $306 | | | | $324 | | | | $553 | | | | $210 | | | | $147 | |
| | | | | | | | | | | | | | | | | | | | | |
24
| | | | |
| | | | AMG Frontier Small Cap Growth Fund Financial Highlights For a share outstanding throughout each fiscal year |
| | | | | | | | | | | | | | | | | | | | |
| | | For the fiscal years ended October 31, | |
| | | | | |
| Class I | | 2020 | | | 2019 | | | 2018 | | | 2017 | | | 20161 |
| | | | | |
Net Asset Value, Beginning of Year | | | $8.43 | | | | $12.02 | | | | $13.46 | | | | $10.46 | | | | $13.76 | |
| | | | | |
Income (loss) from Investment Operations: | | | | | | | | | | | | | | | | | | | | |
| | | | | |
Net investment loss2,3 | | | (0.03 | ) | | | (0.04 | ) | | | (0.06 | ) | | | (0.08 | ) | | | (0.03 | )4 |
| | | | | |
Net realized and unrealized gain (loss) on investments | | | 1.36 | | | | 0.50 | | | | 1.62 | | | | 3.13 | | | | (0.23 | ) |
| | | | | |
Total income (loss) from investment operations | | | 1.33 | | | | 0.46 | | | | 1.56 | | | | 3.05 | | | | (0.26 | ) |
| | | | | |
Less Distributions to Shareholders from: | | | | | | | | | | | | | | | | | | | | |
| | | | | |
Net realized gain on investments | | | (0.72 | ) | | | (4.05 | ) | | | (3.00 | ) | | | (0.05 | ) | | | (3.04 | ) |
| | | | | |
Net Asset Value, End of Year | | | $9.04 | | | | $8.43 | | | | $12.02 | | | | $13.46 | | | | $10.46 | |
| | | | | |
Total Return3,5 | | | 16.69 | % | | | 12.08 | % | | | 14.12 | % | | | 29.22 | % | | | (2.77 | )% |
| | | | | |
Ratio of net expenses to average net assets | | | 0.95 | % | | | 0.96 | % | | | 1.01 | % | | | 1.15 | % | | | 1.29 | % |
| | | | | |
Ratio of gross expenses to average net assets6 | | | 1.55 | % | | | 1.60 | % | | | 1.52 | % | | | 1.73 | % | | | 1.69 | % |
| | | | | |
Ratio of net investment loss to average net assets3 | | | (0.38 | )% | | | (0.45 | )% | | | (0.46 | )% | | | (0.65 | )% | | | (0.32 | )% |
| | | | | |
Portfolio turnover | | | 206 | % | | | 226 | % | | | 233 | % | | | 99 | % | | | 70 | % |
| | | | | |
Net assets end of year (000’s) omitted | | | $11,547 | | | | $10,873 | | | | $11,549 | | | | $11,009 | | | | $9,570 | |
| | | | | | |
25
| | | | |
| | | | AMG Frontier Small Cap Growth Fund Financial Highlights For a share outstanding throughout each fiscal year |
| | | | | | | | | | | | | | | | | | | | |
| | | For the fiscal years ended October 31, | |
| | | | | |
| Class Z | | 2020 | | | 2019 | | | 2018 | | | 2017 | | | 20161 |
| | | | | |
Net Asset Value, Beginning of Year | | | $8.75 | | | | $12.31 | | | | $13.70 | | | | $10.63 | | | | $13.95 | |
| | | | | |
Income (loss) from Investment Operations: | | | | | | | | | | | | | | | | | | | | |
| | | | | |
Net investment loss2,3 | | | (0.03 | ) | | | (0.03 | ) | | | (0.05 | ) | | | (0.06 | ) | | | (0.01 | )4 |
| | | | | |
Net realized and unrealized gain (loss) on investments | | | 1.43 | | | | 0.52 | | | | 1.66 | | | | 3.18 | | | | (0.22 | ) |
| | | | | |
Total income (loss) from investment operations | | | 1.40 | | | | 0.49 | | | | 1.61 | | | | 3.12 | | | | (0.23 | ) |
| | | | | |
Less Distributions to Shareholders from: | | | | | | | | | | | | | | | | | | | | |
| | | | | |
Net realized gain on investments | | | (0.72 | ) | | | (4.05 | ) | | | (3.00 | ) | | | (0.05 | ) | | | (3.09 | ) |
| | | | | |
Net Asset Value, End of Year | | | $9.43 | | | | $8.75 | | | | $12.31 | | | | $13.70 | | | | $10.63 | |
| | | | | |
Total Return3,5 | | | 16.74 | % | | | 12.15 | % | | | 14.26 | % | | | 29.42 | % | | | (2.53 | )% |
| | | | | |
Ratio of net expenses to average net assets | | | 0.90 | % | | | 0.90 | % | | | 0.90 | % | | | 1.00 | % | | | 1.05 | % |
| | | | | |
Ratio of gross expenses to average net assets6 | | | 1.50 | % | | | 1.54 | % | | | 1.41 | % | | | 1.58 | % | | | 1.44 | % |
| | | | | |
Ratio of net investment loss to average net assets3 | | | (0.33 | )% | | | (0.39 | )% | | | (0.36 | )% | | | (0.50 | )% | | | (0.10 | )% |
| | | | | |
Portfolio turnover | | | 206 | % | | | 226 | % | | | 233 | % | | | 99 | % | | | 70 | % |
| | | | | |
Net assets end of year (000’s) omitted | | | $7,850 | | | | $7,196 | | | | $6,418 | | | | $7,354 | | | | $9,114 | |
| | | | | | |
| 1 | Effective October 1, 2016, the Investor Class, Service Class and Institutional Class were renames as Class N, Class I and Class Z, respectively. |
| 2 | Per share numbers have been calculated using average shares. |
| 3 | Total returns and net investment loss would have been lower had certain expenses not been offset. |
| 4 | Includes non-recurring dividends. Without these dividends, net investment income per share would have been $(0.09), $(0.06), and $(0.04) for Class N, Class I, and Class Z shares, respectively. |
| 5 | The total return is calculated using the published Net Asset Value as of fiscal year end. |
| 6 | Excludes the impact of expense reimbursement or fee waivers and expense reductions such as brokerage credits, but includes expense repayments and non-reimbursable expenses, if any, such as interest, taxes, and extraordinary expenses. (See Note 1(c) and 2 in the Notes to Financial Statements.) |
26
| | | | |
| | | | AMG Managers Emerging Opportunities Fund Financial Highlights For a share outstanding throughout each fiscal year |
| | | | | | | | | | | | | | | | | | | | |
| | | For the fiscal years ended October 31, | |
| | | | | |
| Class N | | 2020 | | | 2019 | | | 2018 | | | 20171 | | | 20162 | |
| | | | | |
Net Asset Value, Beginning of Year | | | $41.44 | | | | $48.48 | | | | $50.06 | | | | $37.09 | | | | $40.76 | |
| | | | | |
Income (loss) from Investment Operations: | | | | | | | | | | | | | | | | | | | | |
| | | | | |
Net investment income (loss)3,4 | | | 0.09 | | | | (0.09 | ) | | | (0.32 | ) | | | (0.27 | )5 | | | (0.17 | )6 |
| | | | | |
Net realized and unrealized gain (loss) on investments | | | (0.23 | ) | | | 1.70 | | | | 4.45 | | | | 13.38 | | | | 1.02 | |
| | | | | |
Total income (loss) from investment operations | | | (0.14 | ) | | | 1.61 | | | | 4.13 | | | | 13.11 | | | | 0.85 | |
| | | | | |
Less Distributions to Shareholders from: | | | | | | | | | | | | | | | | | | | | |
| | | | | |
Net realized gain on investments | | | (3.69 | ) | | | (8.65 | ) | | | (5.71 | ) | | | (0.14 | ) | | | (4.52 | ) |
| | | | | |
Net Asset Value, End of Year | | | $37.61 | | | | $41.44 | | | | $48.48 | | | | $50.06 | | | | $37.09 | |
| | | | | |
Total Return4,7 | | | (0.86 | )% | | | 7.46 | % | | | 8.82 | % | | | 35.43 | % | | | 2.50 | % |
| | | | | |
Ratio of net expenses to average net assets8 | | | 1.18 | % | | | 1.24 | % | | | 1.41 | % | | | 1.42 | % | | | 1.41 | % |
| | | | | |
Ratio of gross expenses to average net assets9 | | | 1.26 | % | | | 1.34 | % | | | 1.50 | % | | | 1.51 | % | | | 1.62 | % |
| | | | | |
Ratio of net investment income (loss) to average net assets4 | | | 0.24 | % | | | (0.23 | )% | | | (0.63 | )% | | | (0.62 | )% | | | (0.47 | )% |
| | | | | |
Portfolio turnover | | | 75 | % | | | 79 | % | | | 55 | % | | | 58 | % | | | 72 | % |
| | | | | |
Net assets end of year (000’s) omitted | | | $114,122 | | | | $138,695 | | | | $148,419 | | | | $148,915 | | | | $124,045 | |
| | | | | | | | | | | | | | | | | | | | | |
27
| | | | |
| | | | AMG Managers Emerging Opportunities Fund Financial Highlights For a share outstanding throughout each fiscal year |
| | | | | | | | | | | | | | | | | | | | |
| | | For the fiscal years ended October 31, | |
| | | | | |
| Class I | | 2020 | | | 2019 | | | 2018 | | | 2017 | | | 20162 | |
| | | | | |
Net Asset Value, Beginning of Year | | | $42.31 | | | | $49.19 | | | | $50.60 | | | | $37.40 | | | | $41.05 | |
| | | | | |
Income (loss) from Investment Operations: | | | | | | | | | | | | | | | | | | | | |
| | | | | |
Net investment income (loss)3,4 | | | 0.18 | | | | 0.01 | | | | (0.20 | ) | | | (0.16 | )5 | | | (0.08 | )6 |
| | | | | |
Net realized and unrealized gain (loss) on investments | | | (0.22 | ) | | | 1.76 | | | | 4.50 | | | | 13.51 | | | | 1.02 | |
| | | | | |
Total income (loss) from investment operations | | | (0.04 | ) | | | 1.77 | | | | 4.30 | | | | 13.35 | | | | 0.94 | |
| | | | | |
Less Distributions to Shareholders from: | | | | | | | | | | | | | | | | | | | | |
| | | | | |
Net investment income | | | — | | | | — | | | | — | | | | — | | | | (0.04 | ) |
| | | | | |
Net realized gain on investments | | | (3.69 | ) | | | (8.65 | ) | | | (5.71 | ) | | | (0.15 | ) | | | (4.55 | ) |
| | | | | |
Total distributions to shareholders | | | (3.69 | ) | | | (8.65 | ) | | | (5.71 | ) | | | (0.15 | ) | | | (4.59 | ) |
| | | | | |
Net Asset Value, End of Year | | | $38.58 | | | | $42.31 | | | | $49.19 | | | | $50.60 | | | | $37.40 | |
| | | | | |
Total Return4,7 | | | (0.62 | )% | | | 7.72 | % | | | 9.09 | % | | | 35.80 | % | | | 2.73 | % |
| | | | | |
Ratio of net expenses to average net assets8 | | | 0.93 | % | | | 0.99 | % | | | 1.16 | % | | | 1.17 | % | | | 1.16 | % |
| | | | | |
Ratio of gross expenses to average net assets9 | | | 1.01 | % | | | 1.09 | % | | | 1.25 | % | | | 1.26 | % | | | 1.37 | % |
| | | | | |
Ratio of net investment income (loss) to average net assets4 | | | 0.49 | % | | | 0.02 | % | | | (0.38 | )% | | | (0.37 | )% | | | (0.22 | )% |
| | | | | |
Portfolio turnover | | | 75 | % | | | 79 | % | | | 55 | % | | | 58 | % | | | 72 | % |
| | | | | |
Net assets end of year (000’s) omitted | | | $26,957 | | | | $30,248 | | | | $28,485 | | | | $23,974 | | | | $25,127 | |
| | | | | | | | | | | | | | | | | | | | | |
| 1 | Effective February 27, 2017, Class S was renamed Class N. |
| 2 | Effective October 1, 2016, the Service Class and Institutional Class were renamed Class S and Class I, respectively. |
| 3 | Per share numbers have been calculated using average shares. |
| 4 | Total returns and net investment loss would have been lower had certain expenses not been offset. |
| 5 | Includes non-recurring dividends. Without these dividends, net investment loss per share would have been $(0.34) and $(0.23) for Class N and Class I shares, respectively. |
| 6 | Includes non-recurring dividends. Without these dividends, net investment loss per share would have been $(0.24) and $(0.15) for Class N and Class I shares, respectively. |
| 7 | The total return is calculated using the published Net Asset Value as of fiscal year end. |
| 8 | Includes reduction from broker recapture amounting to 0.01%, 0.02%, 0.02%, 0.01%, and 0.02% for the fiscal years ended 2020, 2019, 2018, 2017 and 2016, respectively. |
| 9 | Excludes the impact of expense reimbursement or fee waivers and expense reductions such as brokerage credits, but includes expense repayments and non-reimbursable expenses, if any, such as interest, taxes, and extraordinary expenses. (See Note 1(c) and 2 in the Notes to Financial Statements.) |
28
|
Notes to Financial Statements October 31, 2020 |
1. ORGANIZATION AND SUMMARY OF SIGNIFICANT ACCOUNTING POLICIES
AMG Funds I (the “Trust”) is an open-end management investment company, organized as a Massachusetts business trust, and registered under the Investment Company Act of 1940, as amended (the “1940 Act”). Currently, the Trust consists of a number of different funds, each having distinct investment management objectives, strategies, risks, and policies. Included in this report are the AMG Frontier Small Cap Growth Fund (“Small Cap”) and AMG Managers Emerging Opportunities Fund (“Emerging Opportunities”), each a “Fund” and collectively, the “Funds”.
Each Fund offers different classes of shares. Both Funds offer Class N and Class I shares, and Small Cap offers Class Z shares. Each class represents an interest in the same assets of the respective Fund. Although all share classes generally have identical voting rights, each share class votes separately when required by law. Different share classes may have different net asset values per share to the extent the share classes pay different distribution amounts and/or the expenses of such share classes differ. Each share class has its own expense structure. Please refer to a current prospectus for additional information on each share class.
Market disruptions associated with the COVID-19 pandemic have had a global impact, and uncertainty exists as to the long-term implications. Such disruptions can adversely affect assets of the Funds and thus Fund performance.
The Funds’ financial statements are prepared in accordance with accounting principles generally accepted in the United States of America (“U.S. GAAP”), including accounting and reporting guidance pursuant to Accounting Standards Codification Topic 946 applicable to investment companies. U.S. GAAP requires management to make estimates and assumptions that affect the reported amounts of assets and liabilities and disclosure of contingent assets and liabilities at the date of the financial statements and the reported amounts of income and expenses during the reporting period. Actual results could differ from those estimates and such differences could be material. The following is a summary of significant accounting policies followed by the Funds in the preparation of their financial statements:
a. VALUATION OF INVESTMENTS
Equity securities traded on a national securities exchange or reported on the NASDAQ national market system (“NMS”) are valued at the last quoted sales price on the primary exchange or, if applicable, the NASDAQ official closing price or the official closing price of the relevant exchange or, lacking any sales, at the last quoted bid price or the mean between the last quoted bid and ask prices (the “mean price”). Equity securities traded in the over-the-counter market (other than NMS securities) are valued at the mean price. Foreign equity securities (securities principally traded in markets other than U.S. markets) are valued at the official closing price on the primary exchange or, for markets that either do not offer an official closing price or where the official closing price may not be representative of the overall market, the last quoted sale price.
Fixed income securities purchased with a remaining maturity of 60 days or less are valued at amortized cost, provided that the amortized cost value is approximately the same as the fair value of the security valued without the use of amortized cost. Investments in other open-end registered investment companies are valued at their end of day net asset value per share.
The Funds’ portfolio investments are generally valued based on independent market quotations or prices or, if none, “evaluative” or other market based
valuations provided by third party pricing services approved by the Board of Trustees of the Trust (the “Board”). Under certain circumstances, the value of certain Fund portfolio investments may be based on an evaluation of fair value, pursuant to procedures established by and under the general supervision of the Board. The Valuation Committee, which is comprised of the Independent Trustees of the Board, and the Pricing Committee, which is comprised of representatives from AMG Funds LLC (the “Investment Manager”) are the committees appointed by the Board to make fair value determinations. Each Fund may use the fair value of a portfolio investment to calculate its net asset value (“NAV”) in the event that the market quotation, price or market based valuation for the portfolio investment is not readily available or otherwise not determinable pursuant to the Board’s valuation procedures, if the Investment Manager or the Pricing Committee believes the quotation, price or market based valuation to be unreliable, or in certain other circumstances. When determining the fair value of an investment, the Pricing Committee and, if required under the Trust’s securities valuation procedures, the Valuation Committee, seeks to determine the price that the Fund might reasonably expect to receive from current sale of that portfolio investment in an arms-length transaction. Fair value determinations shall be based upon consideration of all available facts and information, including, but not limited to (i) attributes specific to the investment; (ii) fundamental and analytical data relating to the investment; and (iii) the value of other comparable securities or relevant financial instruments, including derivative securities, traded on other markets or among dealers.
The values assigned to fair value portfolio investments are based on available information and do not necessarily represent amounts that might ultimately be realized in the future, since such amounts depend on future developments inherent in long-term investments. Because of the inherent uncertainty of valuation, those estimated values may differ significantly from the values that would have been used had a ready market for the investments existed, and the differences could be material. The Board will be presented with a quarterly report showing as of the most recent quarter end, all outstanding securities fair valued by the Funds, including a comparison with the prior quarter end and the percentage of the Funds that the security represents at each quarter end.
With respect to foreign equity securities and certain foreign fixed income securities, the Board has adopted a policy that securities held in the Funds that can be fair valued by the applicable fair value pricing service are fair valued on each business day provided that each individual price exceeds a pre-established confidence level.
U.S. GAAP defines fair value as the price that a fund would receive to sell an asset or pay to transfer a liability in an orderly transaction between market participants at the measurement date. U.S. GAAP also establishes a framework for measuring fair value, and a three level hierarchy for fair value measurements based upon the transparency of inputs to the valuation of an asset or liability. Inputs may be observable or unobservable and refer broadly to the assumptions that market participants would use in pricing the asset or liability. Observable inputs reflect the assumptions market participants would use in pricing the asset or liability based on market data obtained from sources independent of the Funds. Unobservable inputs reflect the Funds’ own assumptions about the assumptions that market participants would use in pricing the asset or liability developed based on the best information available in the circumstances. Each investment is assigned a level based upon the observability of the inputs which are significant to the overall valuation.
The three-tier hierarchy of inputs is summarized below:
29
|
Notes to Financial Statements (continued) |
Level 1 – inputs are quoted prices in active markets for identical investments (e.g., equity securities, open-end investment companies)
Level 2 – other observable inputs (including, but not limited to: quoted prices for similar assets or liabilities in markets that are active, quoted prices for identical or similar assets or liabilities in markets that are not active, inputs other than quoted prices that are observable for the assets or liabilities (such as interest rates, yield curves, volatilities, prepayment speeds, loss severities, credit risks and default rates) or other market corroborated inputs) (e.g., debt securities, government securities, foreign currency exchange contracts, swaps, foreign securities utilizing international fair value pricing, fair valued securities with observable inputs)
Level 3 – inputs are significant unobservable inputs (including the Fund’s own assumptions used to determine the fair value of investments) (e.g., fair valued securities with unobservable inputs)
Changes in inputs or methodologies used for valuing investments may result in a transfer in or out of levels within the fair value hierarchy. The inputs or methodologies used for valuing investments may not necessarily be an indication of the risk associated with investing in those investments.
b. SECURITY TRANSACTIONS
Security transactions are accounted for as of trade date. Realized gains and losses on securities sold are determined on the basis of identified cost.
c. INVESTMENT INCOME AND EXPENSES
Dividend income is recorded on the ex-dividend date. Dividends from foreign securities are recorded on the ex-dividend date, and if after the fact, as soon as the Funds become aware of the ex-dividend date. Interest income, which includes amortization of premium and accretion of discount on debt securities, is accrued as earned. Dividend and interest income on foreign securities is recorded gross of any withholding tax. Non-cash dividends included in dividend income, if any, are reported at the fair market value of the securities received. Upon notification from issuers, distributions received from a real estate investment trust (REIT) may be redesignated as a reduction of cost of investments and/or realized gain. Other
income and expenses are recorded on an accrual basis. Expenses that cannot be directly attributed to a Fund are apportioned among the funds in the Trust and other trusts or funds within the AMG Funds Family of Funds (collectively the “AMG Funds Family”) based upon their relative average net assets or number of shareholders. Investment income, realized and unrealized capital gains and losses, the common expenses of each Fund, and certain fund level expense reductions, if any, are allocated on a pro-rata basis to each class based on the relative net assets of each class to the total net assets of each Fund.
Emerging Opportunities had certain portfolio trades directed to various brokers under a brokerage recapture program. Credits received from the brokerage recapture program are earned and paid on a monthly basis, and are recorded as expense offsets, which serve to reduce the Fund’s overall expense ratio. For the fiscal year ended October 31, 2020, the impact on the expenses and expense ratios were as follows: Emerging Opportunities - $20,427 or 0.01%.
d. DIVIDENDS AND DISTRIBUTIONS
Fund distributions resulting from either net investment income or realized net capital gains, if any, will normally be declared and paid at least annually in December. Distributions to shareholders are recorded on the ex-dividend date. Distributions are determined in accordance with federal income tax regulations, which may differ from net investment income and net realized capital gains for financial statement purposes (U.S. GAAP). Differences may be permanent or temporary. Permanent differences are reclassified among capital accounts in the financial statements to reflect their tax character. Permanent book and tax basis differences, if any, relating to shareholder distributions will result in reclassifications to paid-in capital. Temporary differences arise when certain items of income, expense and gain or loss are recognized in different periods for financial statement and tax purposes; these differences will reverse at some time in the future. Temporary differences are primarily due to distributions received from investments in certain partnerships, wash sales deferrals, mark-to-market on passive foreign investment companies, return of capital from REITs, and the deferral of qualified late year losses.
The tax character of distributions paid during the fiscal years ended October 31, 2020 and October 31, 2019 were as follows:
| | | | | | | | | | | | | | | | |
| | | Small Cap | | | Emerging Opportunities | |
| | | | |
Distributions paid from: | | | 2020 | | | | 2019 | | | | 2020 | | | | 2019 | |
| | | | |
Ordinary income * | | | — | | | | $2,889,333 | | | | — | | | | $5,241,238 | |
| | | | |
Long-term capital gains | | | $1,549,700 | | | | 3,096,189 | | | | $14,720,816 | | | | 26,341,201 | |
| | | | |
| | | | | | | | | | | | | | | | |
| | | | |
| | | $1,549,700 | | | | $5,985,522 | | | | $14,720,816 | | | | $31,582,439 | |
| | | | | | | | | | | | | | | | |
* For tax purposes, short-term capital gain distributions, if any, are considered ordinary income distributions.
As of October 31, 2020, the components of distributable earnings (excluding unrealized appreciation/depreciation) on a tax basis consisted of:
| | | | | | | | |
| | | Small Cap | | Emerging Opportunities |
| | |
Undistributed ordinary income | | $32,635 | | — |
| | |
Undistributed long-term capital gains | | 788,842 | | $7,738,124 |
| | |
Late-year loss deferral | | — | | 116,889 |
30
|
Notes to Financial Statements (continued) |
At October 31, 2020, the cost of investments and the aggregate gross unrealized appreciation and depreciation for federal income tax purposes were as follows:
| | | | | | | | | | | | | | | | |
| Fund | | Cost | | | Appreciation | | | Depreciation | | | Net Appreciation | |
| | | | |
Small Cap | | | $18,024,215 | | | | $3,688,238 | | | | $(951,630) | | | | $2,736,608 | |
| | | | |
Emerging Opportunities | | | 121,809,982 | | | | 36,315,951 | | | | (12,860,821 | ) | | | 23,455,130 | |
e. FEDERAL TAXES
Each Fund currently qualifies as an investment company and intends to comply with the requirements under Subchapter M of the Internal Revenue Code of 1986, as amended, and to distribute substantially all of its taxable income and gains to its shareholders and to meet certain diversification and income requirements with respect to investment companies. Therefore, no provision for federal income or excise tax is included in the accompanying financial statements.
Additionally, based on each Fund’s understanding of the tax rules and rates related to income, gains and transactions for the foreign jurisdictions in which it invests, each Fund will provide for foreign taxes, and where appropriate, deferred foreign taxes.
Management has analyzed the Funds’ tax positions taken on federal income tax returns as of October 31, 2020, and for all open tax years (generally, the three prior taxable years), and has concluded that no provision for federal income tax is required in the Funds’ financial statements. Additionally, Management is not aware of any tax position for which it is reasonably possible that the total amounts of unrecognized tax benefits will change materially in the next twelve months.
f. CAPITAL LOSS CARRYOVERS AND DEFERRALS
As of October 31, 2020, the Funds had no capital loss carryovers for federal income tax purposes. Should the Funds incur net capital losses for the fiscal year ended October 31, 2021, such amounts may be used to offset future realized capital gains indefinitely, and retain their character as short-term and/or long-term.
g. CAPITAL STOCK
The Trust’s Declaration of Trust authorizes for each Fund the issuance of an unlimited number of shares of beneficial interest, without par value. Each Fund records sales and repurchases of its capital stock on the trade date.
For the fiscal years ended October 31, 2020 and October 31, 2019, the capital stock transactions by class for the Funds were as follows:
| | | | | | | | | | | | | | | | | | | | | | | | | | | | | | | | |
| | | Small Cap | | | Emerging Opportunities | |
| | | October 31, 2020 | | | October 31, 2019 | | | October 31, 2020 | | | October 31, 2019 | |
| | | Shares | | | Amount | | | Shares | | | Amount | | | Shares | | | Amount | | | Shares | | | Amount | |
| | | | | | | | |
Class N: | | | | | | | | | | | | | | | | | | | | | | | | | | | | | | | | |
| | | | | | | | |
Proceeds from sale of shares | | | 21,983 | | | | $171,687 | | | | 173,601 | | | | $1,420,613 | | | | 164,332 | | | | $5,862,463 | | | | 127,532 | | | | $5,229,560 | |
| | | | | | | | |
Reinvestment of distributions | | | 3,530 | | | | 27,888 | | | | 21,357 | | | | 137,752 | | | | 300,381 | | | | 11,991,204 | | | | 782,287 | | | | 26,323,951 | |
| | | | | | | | |
Cost of shares repurchased | | | (30,085 | ) | | | (207,132 | ) | | | (201,967 | ) | | | (1,626,392 | ) | | | (777,792 | ) | | | (26,470,500 | ) | | | (624,087 | ) | | | (24,430,038 | ) |
| | | | | | | | | | | | | | | | | | | | | | | | | | | | | | | | |
| | | | | | | | |
Net increase (decrease) | | | (4,572 | ) | | | $(7,557 | ) | | | (7,009 | ) | | | $(68,027 | ) | | | (313,079 | ) | | | $(8,616,833 | ) | | | 285,732 | | | | $7,123,473 | |
| | | | | | | | | | | | | | | | | | | | | | | | | | | | | | | | |
| | | | | | | | |
Class I: | | | | | | | | | | | | | | | | | | | | | | | | | | | | | | | | |
| | | | | | | | |
Proceeds from sale of shares | | | 160,240 | | | | $1,351,935 | | | | 136,557 | | | | $1,114,912 | | | | 141,654 | | | | $5,004,115 | | | | 180,337 | | | | $7,377,241 | |
| | | | | | | | |
Reinvestment of distributions | | | 110,211 | | | | 918,061 | | | | 531,454 | | | | 3,587,315 | | | | 61,148 | | | | 2,498,494 | | | | 139,442 | | | | 4,781,458 | |
| | | | | | | | |
Cost of shares repurchased | | | (284,168 | ) | | | (2,168,212 | ) | | | (338,119 | ) | | | (2,973,626 | ) | | | (218,889 | ) | | | (8,142,352 | ) | | | (183,973 | ) | | | (7,571,050 | ) |
| | | | | | | | | | | | | | | | | | | | | | | | | | | | | | | | |
| | | | | | | | |
Net increase (decrease) | | | (13,717 | ) | | | $101,784 | | | | 329,892 | | | | $1,728,601 | | | | (16,087 | ) | | | $(639,743 | ) | | | 135,806 | | | | $4,587,649 | |
| | | | | | | | | | | | | | | | | | | | | | | | | | | | | | | | |
| | | | | | | | |
Class Z: | | | | | | | | | | | | | | | | | | | | | | | | | | | | | | | | |
| | | | | | | | |
Proceeds from sale of shares | | | 10,516 | | | | $55,000 | | | | 86,958 | | | | $890,000 | | | | — | | | | — | | | | — | | | | — | |
| | | | | | | | |
Reinvestment of distributions | | | 67,965 | | | | 590,610 | | | | 319,631 | | | | 2,240,613 | | | | — | | | | — | | | | — | | | | — | |
| | | | | | | | |
Cost of shares repurchased | | | (68,314 | ) | | | (554,582 | ) | | | (105,930 | ) | | | (919,348 | ) | | | — | | | | — | | | | — | | | | — | |
| | | | | | | | | | | | | | | | | | | | | | | | | | | | | | | | |
| | | | | | | | |
Net increase | | | 10,167 | | | | $91,028 | | | | 300,659 | | | | $2,211,265 | | | | — | | | | — | | | | — | | | | — | |
| | | | | | | | | | | | | | | | | | | | | | | | | | | | | | | | |
At October 31, 2020, certain affiliated and unaffiliated shareholders of record individually or collectively held greater than 10% of the net assets of the Funds as follows: Small Cap - one owns 20%. Transactions by this shareholder may have a material impact on the Fund.
31
|
Notes to Financial Statements (continued) |
h. REPURCHASE AGREEMENTS AND JOINT
REPURCHASE AGREEMENTS
The Funds may enter into third-party repurchase agreements for temporary cash management purposes and third-party or bilateral joint repurchase agreements for reinvestment of cash collateral on securities lending transactions under the securities lending program offered by The Bank of New York Mellon (“BNYM”) (the “Program”) (collectively, “Repurchase Agreements”). The value of the underlying collateral, including accrued interest, must equal or exceed the value of the Repurchase Agreements during the term of the agreement. For joint repurchase agreements, the Funds participate on a pro rata basis with other clients of BNYM in its share of the underlying collateral under such joint repurchase agreements and in its share of proceeds from any repurchase or other disposition of the underlying collateral. The underlying collateral for all Repurchase Agreements is held in safekeeping by the Funds’ custodian or at the Federal Reserve Bank. If the seller defaults and the value of the collateral declines, or if bankruptcy proceedings commence with respect to the seller of the security, realization of the collateral by the Funds may be delayed or limited. Pursuant to the Program, the Funds are indemnified for such losses by BNYM on joint repurchase agreements.
At October 31, 2020, the market value of Repurchase Agreements outstanding for Small Cap and Emerging Opportunities were $926,423 and $5,808,756, respectively.
2. AGREEMENTS AND TRANSACTIONS WITH AFFILIATES
For each of the Funds, the Trust has entered into an investment advisory agreement under which the Investment Manager, a subsidiary and the U.S. retail distribution arm of Affiliated Managers Group, Inc. (“AMG”), serves as investment manager to the Funds and is responsible for the Funds’ overall administration and operations. The Investment Manager selects one or more subadvisers for the Funds (subject to Board approval) and monitors each subadviser’s investment performance, security holdings and investment strategies. Each Fund’s investment portfolio is managed by one or more portfolio managers who serve pursuant to a subadvisory agreement with the Investment Manager. Small Cap is managed by Frontier Capital Management Co., LLC (“Frontier”). AMG indirectly owns a majority interest in Frontier. Emerging Opportunities is managed by Next Century Growth Investors LLC, RBC Global Asset Management (U.S.) Inc., and WEDGE Capital Management L.L.P.
Investment management fees are paid directly by the Funds to the Investment Manager based on average daily net assets. For the fiscal year ended October 31, 2020, the Funds’ investment management fees were paid at the following annual rate of each Fund’s respective average daily net assets:
| | | | |
Small Cap | | | 0.70 | % |
Emerging Opportunities | | | 0.74 | %1 |
1 Prior to March 1, 2019, the annual rate for the investment management fees for Emerging Opportunities was 1.00% of the Fund’s average daily net assets.
The Investment Manager has contractually agreed, through at least March 1, 2021, to waive management fees and/or pay or reimburse fund expenses in order to limit total annual Fund operating expenses after fee waiver and expense reimbursements (exclusive of taxes, interest (including interest incurred in connection with bank and custody overdrafts and in connection with securities sold short), shareholder servicing fees, distribution and service (12b-1) fees, brokerage commissions and other transaction costs, dividends payable with respect to securities sold short, acquired fund fees and expenses and
extraordinary expenses) of Small Cap and Emerging Opportunities to 0.90% and 0.94%, respectively, of each Fund’s average daily net assets (this annual rate or such other annual rate that may be in effect from time to time, the “Expense Cap”), subject to later reimbursement by the Funds in certain circumstances.
In general, for a period of up to 36 months after the date any amounts are paid, waived or reimbursed by the Investment Manager, the Investment Manager may recover such amounts from a Fund, provided that such repayment would not cause the Fund’s total annual operating expenses after fee waiver and expense reimbursements (exclusive of the items noted in the parenthetical above) to exceed either (i) the Expense Cap in effect at the time such amounts were paid, waived or reimbursed, or (ii) the Expense Cap in effect at the time of such repayment by the Fund.
The contractual expense limitation may only be terminated in the event the Investment Manager or a successor ceases to be the investment manager of a Fund or a successor fund, by mutual agreement between the Investment Manager and the Board, or in the event of a Fund’s liquidation unless the Fund is reorganized or is a party to a merger in which the surviving entity is successor to the accounting and performance information of a Fund.
At October 31, 2020, the Funds’ expiration of reimbursements subject to recoupment is as follows:
| | | | | | | | |
Expiration Period | | Small Cap | | | Emerging Opportunities | |
|
Less than 1 year | | | $105,483 | | | | $130,107 | |
1-2 years | | | 121,636 | | | | 131,263 | |
2-3 years | | | 110,484 | | | | 104,667 | |
| | | | | | | | |
Total | | | $337,603 | | | | $366,037 | |
| | | | | | | | |
The Trust, on behalf of the Funds, has entered into an amended and restated Administration Agreement under which the Investment Manager serves as the Funds’ administrator (the “Administrator”) and is responsible for all non-portfolio management aspects of managing the Funds’ operations, including administration and shareholder services to each Fund. Each Fund pays a fee to the Administrator at the rate of 0.15% per annum of the Fund’s average daily net assets for this service.
The Funds are distributed by AMG Distributors, Inc. (the “Distributor”), a wholly-owned subsidiary of the Investment Manager. The Distributor serves as the distributor and underwriter for each Fund and is a registered broker-dealer and member of the Financial Industry Regulatory Authority, Inc. (“FINRA”). Shares of each Fund will be continuously offered and will be sold directly to prospective purchasers and through brokers, dealers or other financial intermediaries who have executed selling agreements with the Distributor. Generally the Distributor bears all or a portion of the expenses of providing services pursuant to the distribution agreement, including the payment of the expenses relating to the distribution of prospectuses for sales purposes and any advertising or sales literature.
Small Cap has adopted a distribution and service plan (the “Plan”) with respect to the Class N shares, in accordance with the requirements of Rule 12b-1 under the 1940 Act and the requirements of the applicable rules of FINRA regarding asset-based sales charges. Pursuant to the Plan, Small Cap may make payments to the Distributor for its expenditures in financing any activity primarily intended to result in the sale of the Fund’s Class N shares and for maintenance and personal
32
|
Notes to Financial Statements (continued) |
service provided to existing shareholders of that class. The Plan authorized payments to the Distributor up to 0.25% annually of the Fund’s average daily net assets attributable to the Class N shares.
For Class N of Small Cap and Emerging Opportunities, and for Class I of Small Cap, the Board has approved reimbursement payments to the Investment Manager for shareholder servicing expenses (“shareholder servicing fees”) incurred. Shareholder servicing fees include payments to financial intermediaries, such as broker-dealers (including fund supermarket platforms), banks, and trust companies who provide shareholder recordkeeping, account servicing and other services. The Class N shares of Small Cap and Emerging Opportunities and Class I shares of Small Cap may reimburse the Investment Manager for the actual amount incurred up to a maximum annual rate of each Class’s average daily net assets as shown in the table below.
The impact on the annualized expense ratios for the fiscal year ended October 31, 2020, were as follows:
| | | | | | | | | | | | |
| Fund | | Maximum Annual Amount Approved | | | | | | Actual Amount Incurred | |
|
|
Small Cap | | | | | | | | | | | | |
Class N | | | 0.15% | | | | | | | | 0.15% | |
Class I | | | 0.15% | | | | | | | | 0.05% | |
Emerging Opportunities | | | | | | | | | | | | |
Class N | | | 0.25% | | | | | | | | 0.25% | |
The Board provides supervision of the affairs of the Trust and other trusts within the AMG Funds Family. The Trustees of the Trust who are not affiliated with the Investment Manager receive an annual retainer and per meeting fees for regular, special and telephonic meetings, and they are reimbursed for out-of-pocket expenses incurred while carrying out their duties as Board members. The Chairman of the Board and the Audit Committee Chair receive additional annual retainers. Certain Trustees and Officers of the Funds are Officers and/or Directors of the Investment Manager, AMG and/or the Distributor.
The Securities and Exchange Commission (the “SEC”) granted an exemptive order that permits the Funds to lend and borrow money for certain temporary purposes
directly to and from other eligible funds in the AMG Funds Family. Participation in this interfund lending program is voluntary for both the borrowing and lending funds, and an interfund loan is only made if it benefits each participating fund. The Administrator manages the program according to procedures approved by the Board, and the Board monitors the operation of the program. An interfund loan must comply with certain conditions set out in the exemptive order, which are designed to assure fairness and protect all participating funds. The interest earned and interest paid on interfund loans are included on the Statement of Operations as interest income and miscellaneous expense, respectively. At October 31, 2020, the Funds had no interfund loans outstanding.
The Funds did not utilize the interfund loan program during the fiscal year ended October 31, 2020.
3. PURCHASES AND SALES OF SECURITIES
Purchases and sales of securities (excluding short-term securities and U.S. Government Obligations) for the fiscal year ended October 31, 2020, were as
follows:
| | | | | | | | |
| | | Long Term Securities | |
| Fund | | Purchases | | | Sales | |
| | |
Small Cap | | | $37,117,790 | | | | $38,242,400 | |
| | |
Emerging Opportunities | | | 106,587,572 | | | | 128,532,176 | |
The Funds had no purchases or sales of U.S. Government Obligations during the fiscal year ended October 31, 2020.
4. PORTFOLIO SECURITIES LOANED
The Funds participate in the Program providing for the lending of securities to qualified borrowers. Securities lending income includes earnings of such temporary cash investments, plus or minus any rebate to a borrower. These earnings (after any rebate) are then divided between BNYM, as a fee for its services under the Program, and the Funds, according to agreed-upon rates. Collateral on all securities loaned is accepted in cash, U.S. Treasury Obligations or U.S. Government Agency Obligations. Collateral is maintained at a minimum level of 102% (105% in the case of certain foreign securities) of the market value, plus interest, if applicable, of investments on loan. It is the Funds’ policy to obtain additional collateral from or return excess collateral to the borrower by the end of the next business day, following the valuation date of the securities loaned. Therefore, the value of the collateral held may be temporarily less than the value of the securities on loan. Lending securities entails a risk of loss to the Funds if and to the extent that the market value of the securities loaned were to increase and the borrower did not increase the collateral accordingly, and the borrower fails to return the securities. Under the terms of the Program, the Funds are indemnified for such losses by BNYM. Cash collateral is held in separate omnibus accounts managed by BNYM, who is authorized to exclusively enter into joint repurchase agreements for that cash collateral. Securities collateral is held in separate omnibus accounts managed by BNYM that cannot be sold or pledged. BNYM bears the risk of any deficiency in the amount of the cash collateral available for return to the borrower due to any loss on the collateral invested. Loans of securities are terminable at any time and the borrower, after notice, is required to return borrowed securities as soon as practical, which is normally within three business days.
The value of securities loaned on positions held, cash collateral and securities collateral received at October 31, 2020, were as follows:
| | | | | | | | | | | | | | | | |
| Fund | | Securities
Loaned | | | Cash
Collateral
Received | | | Securities
Collateral
Received | | | Total
Collateral
Received | |
Small Cap | | | $3,540,488 | | | | $926,423 | | | | $2,825,562 | | | | $3,751,985 | |
Emerging Opportunities | | | 9,163,634 | | | | 5,808,756 | | | | 4,001,716 | | | | 9,810,472 | |
35
|
Notes to Financial Statements (continued) |
The following table summarizes the securities received as collateral for securities lending at October 31, 2020:
| | | | | | | | |
| Fund | | Collateral Type | | Coupon
Range | | Maturity
Date Range | |
Small Cap | | U.S. Treasury Obligations | | 0.000%-8.125% | | | 11/05/20-02/15/50 | |
Emerging Opportunities | | U.S. Treasury Obligations | | 0.000%-8.125% | | | 11/05/20-02/15/50 | |
5. COMMITMENTS AND CONTINGENCIES
Under the Trust’s organizational documents, its trustees and officers are indemnified against certain liabilities arising out of the performance of their duties
to the Trust. In addition, in the normal course of business, the Funds may enter into contracts and agreements that contain a variety of representations and warranties, which provide general indemnifications. The maximum exposure to the Funds under these arrangements is unknown, as this would involve future claims that may be made against a Fund that have not yet occurred. However, based on experience, the Funds had no prior claims or losses and expect the risks of loss to be remote.
6. MASTER NETTING AGREEMENTS
The Funds may enter into master netting agreements with their counterparties for the securities lending program and Repurchase Agreements, which provide the right, in the event of default (including bankruptcy or insolvency) for the non-defaulting party to liquidate the collateral and calculate net exposure to the defaulting party or request additional collateral. For financial reporting purposes, the Funds do not offset financial assets and financial liabilities that are subject to master netting agreements in the Statement of Assets and Liabilities. For securities lending transactions, see Note 4.
The following table is a summary of the Funds’ open Repurchase Agreements that are subject to a master netting agreement as of October 31, 2020:
| | | | | | | | | | | | | | | | | | | | |
| | | | | | Gross Amount Not Offset in the | | | | | | | |
| | | | | | Statement of Assets and Liabilities | | | | | | | |
| Fund | | Gross Amounts of Assets Presented in the Statement of Assets and Liabilities | | | Offset Amount | | | Net Asset Balance | | | Collateral Received | | | Net Amount | |
| | | | | |
Small Cap | | | | | | | | | | | | | | | | | | | | |
| | | | | |
Citigroup Global Markets, Inc. | | | $926,423 | | | | — | | | | $926,423 | | | | $926,423 | | | | — | |
| | | | | |
Emerging Opportunities | | | | | | | | | | | | | | | | | | | | |
| | | | | |
Cantor Fitzgerald Securities, Inc. | | | $1,379,600 | | | | — | | | | $1,379,600 | | | | $1,379,600 | | | | — | |
| | | | | |
Citadel Securities LLC | | | 1,199,434 | | | | — | | | | 1,199,434 | | | | 1,199,434 | | | | — | |
| | | | | |
Citigroup Global Markets, Inc. | | | 713,435 | | | | — | | | | 713,435 | | | | 713,435 | | | | — | |
| | | | | |
JVB Financial Group LLC | | | 1,136,687 | | | | — | | | | 1,136,687 | | | | 1,136,687 | | | | — | |
| | | | | |
South Street Securities LLC | | | 1,379,600 | | | | — | | | | 1,379,600 | | | | 1,379,600 | | | | — | |
| | | | | | | | | | | | | | | | | | | | |
| | | | | |
Total | | | $5,808,756 | | | | — | | | | $5,808,756 | | | | $5,808,756 | | | | — | |
| | | | | | | | | | | | | | | | | | | | |
7. SUBSEQUENT EVENTS
The Funds have determined that no material events or transactions occurred through the issuance date of the Funds’ financial statements which require an additional disclosure in or adjustment of the Funds’ financial statements.
34
|
Report of Independent Registered Public Accounting Firm |
| | |
TO THE BOARD OF TRUSTEES OF AMG FUNDS I AND SHAREHOLDERS OF AMG FRONTIER SMALL CAP GROWTH FUND AND AMG MANAGERS EMERGING OPPORTUNITIES FUND: | | |
| |
| Opinion on the Financial Statements | | |
| |
| We have audited the accompanying statements of assets and liabilities, including the schedules of portfolio investments, of AMG Frontier Small Cap Growth Fund and AMG Managers Emerging Opportunities Fund (two of the Funds constituting AMG Funds I, hereafter collectively referred to as the “Funds”) as of October 31, 2020, the related statements of operations for the year ended October 31, 2020, the statements of changes in net assets for each of the two years in the period ended October 31, 2020, including the related notes, and the financial highlights for each of the five years in the period ended October 31, 2020 (collectively referred to as the “financial statements”). In our opinion, the financial statements present fairly, in all material respects, the financial position of each of the Funds as of October 31, 2020, the results of each of their operations for the year then ended, the changes in each of their net assets for each of the two years in the period ended October 31 2020, and each of the financial highlights for each of the five years in the period ended October 31, 2020, in conformity with accounting principles generally accepted in the United States of America. | | |
| |
| Basis for Opinion | | |
| |
| These financial statements are the responsibility of the Funds’ management. Our responsibility is to express an opinion on the Funds’ financial statements based on our audits. We are a public accounting firm registered with the Public Company Accounting Oversight Board (United States) (PCAOB) and are required to be independent with respect to the Funds in accordance with the U.S. federal securities laws and the applicable rules and regulations of the Securities and Exchange Commission and the PCAOB. | | |
| |
| We conducted our audits of these financial statements in accordance with the standards of the PCAOB. Those standards require that we plan and perform the audits to obtain reasonable assurance about whether the financial statements are free of material misstatement, whether due to error or fraud. | | |
| |
| Our audits included performing procedures to assess the risks of material misstatement of the financial statements, whether due to error or fraud, and performing procedures that respond to those risks. Such procedures included examining, on a test basis, evidence regarding the amounts and disclosures in the financial statements. Our audits also included evaluating the accounting principles used and significant estimates made by management, as well as evaluating the overall presentation of the financial statements. Our procedures included confirmation of securities owned as of October 31, 2020, by correspondence with the custodian, transfer agent, and brokers; when replies were not received from brokers, we performed other auditing procedures. We believe that our audits provide a reasonable basis for our opinion. | | |
| |
| PricewaterhouseCoopers LLP | | |
| Boston, Massachusetts | | |
| December 23, 2020 | | |
| |
| We have served as the auditor of one or more investment companies in the AMG Funds Family since 1993. | | |
35
|
Other Information (unaudited) |
TAX INFORMATION
The AMG Frontier Small Cap Growth Fund and AMG Managers Emerging Opportunities Fund each hereby designates the maximum amount allowable of its net taxable income as qualified dividends as provided in the Jobs and Growth Tax Relief Reconciliation Act of 2003. The 2019/2020 Form 1099-DIV you receive for each Fund will show the tax status of all distributions paid to you during the year.
Pursuant to section 852 of the Internal Revenue Code, AMG Frontier Small Cap Growth Fund and AMG Managers Emerging Opportunities Fund each hereby designates $1,549,700 and $14,720,816, respectively, as a capital gain distribution with respect to the taxable year ended October 31, 2020, or if subsequently determined to be different, the net capital gains of such fiscal year.
36
|
AMG Funds Trustees and Officers |
| | | | |
The Trustees and Officers of the Trust, their business addresses, principal occupations for the past five years and ages are listed below. The Trustees provide broad supervision over the affairs of the Trust and the Funds. The Trustees are experienced executives who meet periodically throughout the year to oversee the Funds’ activities, review contractual arrangements with companies that provide services to the Funds, and | | review the Funds’ performance. Unless otherwise noted, the address of each Trustee or Officer is the address of the Trust: 600 Steamboat Road, Suite 300, Greenwich, Connecticut 06830. There is no stated term of office for Trustees. Trustees serve until their resignation, retirement or removal in | | accordance with the Trust’s organizational documents and policies adopted by the Board from time to time. The Chairman of the Trustees, President, Treasurer and Secretary of the Trust are elected by the Trustees annually. Other officers hold office at the pleasure of the Trustees. |
Independent Trustees
The following Trustees are not “interested persons” of the Trust within the meaning of the 1940 Act:
| | |
Number of Funds Overseen in
Fund Complex | | Name, Age, Principal Occupation(s) During Past 5 Years and Other Directorships Held by Trustee |
• Trustee since 2012 • Oversees 46 Funds in Fund Complex | | Bruce B. Bingham, 72 Partner, Hamilton Partners (real estate development firm) (1987-2020); Director of The Yacktman Funds (2 portfolios) (2000-2012). |
|
• Trustee since 2000 | | Edward J. Kaier, 75 |
• Oversees 35 Funds in Fund Complex | | Attorney at Law and Partner, Teeters Harvey Marrone & Kaier LLP (2007-Present); Attorney at Law and Partner, Hepburn Willcox Hamilton & Putnam, LLP (1977-2007); Trustee of Third Avenue Trust (3 Portfolios) (2002-2019); Trustee of Third Avenue Variable Trust (1 Portfolio) (2002-2019); |
| | | Trustee of AMG Funds IV (11 portfolios) (2010 - 2020). |
• Trustee since 2013 • Oversees 49 Funds in Fund Complex | | Kurt A. Keilhacker, 57 Managing Partner, TechFund Capital (1997-Present); Managing Partner, TechFund Europe (2000-Present); Managing Partner, Elementum Ventures (2013-Present); Director, MetricStory, Inc. (2017-Present); Trustee, Wheaton College (2018-Present); Trustee, Gordon College (2001-2016). Trustee, Board Member, 6wind SA, (2002-2019). |
|
|
|
• Trustee since 2000 • Oversees 46 Funds in Fund Complex | | Steven J. Paggioli, 70 Independent Consultant (2002-Present); Trustee, Professionally Managed Portfolios (28 portfolios); Advisory Board Member, Sustainable Growth Advisors, LP; Independent Director, Muzinich BDC, Inc. (business development company) (2019-Present); Director, The Wadsworth Group; Independent Director, Chase Investment Counsel (2008–2019); Executive Vice President, Secretary and Director, Investment Company Administration, LLC and First Fund Distributors, INC. (1990-2001). |
|
|
|
|
• Trustee since 2013 • Oversees 46 Funds in Fund Complex | | Richard F. Powers III, 74 Adjunct Professor, U.S. Naval War College (2016-Present); Adjunct Professor, Boston College (2011-2015); Director, Ameriprise Financial Inc. (2005-2009); President and CEO of Van Kampen Investments Inc. (1998-2003); President, Morgan Stanley Client Group (2000-2002); Executive Vice President and Chief Marketing Officer of the Morgan Stanley Individual Investor Group (1984-1998). |
|
|
|
• Independent Chairman • Trustee since 2000 • Oversees 49 Funds in Fund Complex | | Eric Rakowski, 62 Professor of Law, University of California at Berkeley School of Law (1990-Present); Tax Attorney at Davis Polk & Wardwell and clerked for Judge Harry T. Edwards of the U.S. Court of Appeals for the District of Columbia Circuit and for Justice William J. Brennan Jr. of the U.S. Supreme Court; Director of Harding, Loevner Funds, Inc. (9 portfolios); Trustee of Third Avenue Trust (3 portfolios) (2002-2019); Trustee of Third Avenue Variable Trust (1 portfolio) (2002-2019). |
|
|
|
|
• Trustee since 2013 • Oversees 49 Funds in Fund Complex | | Victoria L. Sassine, 55 Adjunct Professor, Babson College (2007–Present); Director, Board of Directors, PRG Group (2017-Present); CEO, Founder, Scale Smarter Partners, LLC (2018-Present); Adviser, EVOFEM Biosciences (2019-Present);Teaching Fellow, Goldman Sachs 10,000 Small Business Initiative (2010-Present); Chairperson, Board of Directors, Business Management Associates (2018 to 2019). |
|
|
|
| | |
• Trustee since 2000 • Oversees 46 Funds in Fund Complex | | Thomas R. Schneeweis, 73 Professor Emeritus, University of Massachusetts (2013-Present); President, TRS Associates (1982-Present); Board Member, Chartered Alternative Investment Association (“CAIA”) (2002-Present); Director, CAIA Foundation (2010-2019); Director, Institute for Global Asset and Risk Management (Education) (2010-Present); Co-Owner, Quantitative Investment Technologies (2014-Present); Co-Owner, Yes Wealth Management (2018-Present); Director of Research, Yes Wealth Management (2018-Present); Partner, S Capital Wealth Advisors (2015-2018); Partner, S Capital Management, LLC (2007-2015); President, Alternative Investment Analytics, LLC, (formerly Schneeweis Partners, LLC) (2001-2013); Finance Professor, University of Massachusetts (1977-2013). |
|
|
|
|
|
|
37
|
AMG Funds Trustees and Officers |
Interested Trustees
Each Trustee in the following table is an “interested person” of the Trust within the meaning of the 1940 Act. Ms. Carsman is an interested person of the Trust within the meaning of the 1940 Act by virtue of her position with, and interest in securities of, AMG.
| | |
Number of Funds Overseen in
Fund Complex | | Name, Age, Principal Occupation(s) During Past 5 Years and Other Directorships Held by Trustee |
• Trustee since 2011 • Oversees 46 Funds in Fund Complex | | Christine C. Carsman, 68 Senior Policy Advisor, Affiliated Managers Group, Inc. (2019-Present); Chair of the Board of Directors, AMG Funds plc (2015-2018); Director, AMG Funds plc (2010-2018); Executive Vice President, Deputy General Counsel and Chief Regulatory Counsel, Affiliated Managers Group, Inc. (2017-2018); Senior Vice President and Deputy General Counsel, Affiliated Managers Group, Inc. (2011-2016); Senior Vice President and Chief Regulatory Counsel, Affiliated Managers Group, Inc. (2007-2011); Vice President and Chief Regulatory Counsel, Affiliated Managers Group, Inc. (2004-2007); Senior Counsel, Vice President and Director of Operational Risk Management and Compliance, Wellington Management Company, LLP (1995-2004); Director of Harding, Loevner Funds, Inc. (9 portfolios) (2017-Present); Secretary and Chief Legal Officer, AMG Funds,AMG Funds I, AMG Funds II and AMG Funds III (2004-2011). |
Officers
| | |
Position(s) Held with Fund and
Length of Time Served | | Name, Age, Principal Occupation(s) During Past 5 Years |
• President since 2018 • Principal Executive Officer since 2018 • Chief Executive Officer since 2018 • Chief Operating Officer since 2007 | | Keitha L. Kinne, 62 Chief Operating Officer, AMG Funds LLC (2007-Present); Chief Investment Officer, AMG Funds LLC (2008-Present); President and Principal, AMG Distributors, Inc. (2018-Present); Chief Operating Officer, AMG Distributors, Inc. (2007-Present); President, Chief Executive Officer and Principal Executive Officer, AMG Funds, AMG Funds I, AMG Funds II, AMG Funds III and AMG Funds IV (2018-Present); Chief Operating Officer, AMG Funds, AMG Funds I, AMG Funds II, and AMG Funds III (2007-Present); Chief Operating Officer, AMG Funds IV (2016-Present); Chief Operating Officer and Chief Investment Officer, Aston Asset Management, LLC (2016); President and Principal Executive Officer, AMG Funds, AMG Funds I, AMG Funds II and AMG Funds III (2012-2014); Managing Partner, AMG Funds LLC (2007-2014); President and Principal, AMG Distributors, Inc. (2012-2014); Managing Director, Legg Mason & Co., LLC (2006-2007); Managing Director, Citigroup Asset Management (2004-2006). |
|
|
|
|
|
|
|
• Secretary since 2015 • Chief Legal Officer since 2015 | | Mark J. Duggan, 55 Senior Vice President and Senior Counsel, AMG Funds LLC (2015-Present); Secretary and Chief Legal Officer, AMG Funds, AMG Funds I, AMG Funds II, AMG Funds III and AMG Funds IV (2015-Present); Attorney, K&L Gates, LLP (2009-2015). |
|
|
• Chief Financial Officer since 2017 • Treasurer since 2017 • Principal Financial Officer since 2017 • Principal Accounting Officer since 2017 | | Thomas G. Disbrow, 54 Vice President, Mutual Fund Treasurer & CFO, AMG Funds, AMG Funds LLC (2017-Present); Chief Financial Officer, Principal Financial Officer, Treasurer and Principal Accounting Officer, AMG Funds, AMG Funds I, AMG Funds II, AMG Funds III and AMG Funds IV (2017-Present); Managing Director - Global Head of Traditional Funds Product Control, UBS Asset Management (Americas), Inc. (2015-2017); Managing Director - Head of North American Funds Treasury, UBS Asset Management (Americas), Inc. (2011-2015). |
|
|
|
|
|
|
• Deputy Treasurer since 2017 | | John A. Starace, 50 Director, Mutual Fund Accounting, AMG Funds LLC (2017-Present); Vice President, Deputy Treasurer of Mutual Funds Services, AMG Funds LLC (2014-2017); Deputy Treasurer, AMG Funds, AMG Funds I, AMG Funds II, AMG Funds III and AMG Funds IV (2017-Present); Vice President, Citi Hedge Fund Services (2010-2014); Audit Senior Manager (2005-2010) and Audit Manager (2001-2005), Deloitte & Touche LLP. |
|
|
|
• Chief Compliance Officer since 2019 | | Patrick J. Spellman, 46 Vice President, Chief Compliance Officer, AMG Funds LLC (2017-Present); Chief Compliance Officer and Sarbanes-Oxley Code of Ethics Compliance Officer, AMG Funds, AMG Funds I, AMG Funds II, AMG Funds III and AMG Funds IV (2019-Present); Chief Compliance Officer, AMG Distributors, Inc., (2010-Present); Senior Vice President, Chief Compliance Officer, AMG Funds LLC (2011-2017); Anti-Money Laundering Compliance Officer, AMG Funds, AMG Funds I, AMG Funds II, and AMG Funds III (2014-2019); Anti-Money Laundering Officer, AMG Funds IV, (2016-2019); Compliance Manager, Legal and Compliance, Affiliated Managers Group, Inc. (2005-2011). |
• Assistant Secretary since 2016 | | Maureen A. Meredith, 35 Vice President, Counsel, AMG Funds LLC (2019-Present); Director, Counsel, AMG Funds LLC (2017-2018); Vice President, Counsel, AMG Funds LLC (2015-2017); Assistant Secretary, AMG Funds, AMG Funds I, AMG Funds II, AMG Funds III and AMG Funds IV (2016-Present); Associate, Ropes & Gray LLP (2011-2015); Law Fellow, Massachusetts Appleseed Center for Law and Justice (2010-2011). |
| | |
• Anti-Money Laundering Compliance Officer since 2019 | | Hector D. Roman, 43 Director, Legal and Compliance, AMG Funds LLC (2020-Present); Manager, Legal and Compliance, AMG Funds LLC (2017-2019); Director of Compliance, Morgan Stanley Investment Management (2015-2017); Senior Advisory, PricewaterhouseCoopers LLP (2014-2015); Risk Manager, Barclays Investment Bank (2008-2014); Anti-Money Laundering Compliance Officer, AMG Funds, AMG Funds I, AMG Funds II, AMG Funds III and AMG Funds IV (2019-Present). |
38
|
Annual Renewal of Investment Management and Subadvisory Agreements |
| | | | | | | | |
AMG Managers Emerging Opportunities Fund and AMG Frontier Small Cap Growth Fund: Approval of Investment Management Agreement and Subadvisory Agreements on June 25, 2020 At a meeting held via telephone and video conference on June 25, 2020,1 the Board of Trustees (the “Board” or the “Trustees”), and separately a majority of the Trustees who are not “interested persons” of AMG Funds I (the “Trust”) (the “Independent Trustees”), approved (i) the Investment Management Agreement, as amended pursuant to letter agreements at any time prior to the date of the meeting, with AMG Funds LLC (the “Investment Manager”) for each of AMG Managers Emerging Opportunities Fund and AMG Frontier Small Cap Growth Fund (each, a “Fund,” and collectively, the “Funds”) and separately each of Amendment No. 1 thereto dated July 1, 2015, and Amendment No. 2 thereto dated October 1, 2016 (collectively, the “Investment Management Agreement”) and (ii) the Subadvisory Agreement, as amended at any time prior to the date of the meeting, with the applicable Subadviser for each Fund (collectively, the “Subadvisory Agreements”). The Independent Trustees were separately represented by independent legal counsel in connection with their consideration of the approval of these agreements. In considering the Investment Management Agreement and the Subadvisory Agreements, the Trustees reviewed a variety of materials relating to each Fund, the Investment Manager and each Subadviser, including the nature, extent and quality of services, comparative performance, fee and expense information for an appropriate peer group of similar mutual funds for each Fund (each, a “Peer Group”), performance information for the relevant benchmark index for each Fund (each, a “Fund Benchmark”) and, with respect to each applicable Subadviser, comparative performance information for an appropriate peer group of managed accounts, other relevant matters, and other information provided to them on a periodic basis throughout the year. Prior to voting, the Independent Trustees: (a) reviewed the foregoing information with their independent legal counsel; (b) received materials from their independent legal counsel discussing the legal standards applicable to their consideration of the Investment Management Agreement and Subadvisory Agreements; and (c) met with their independent legal counsel in private sessions at which no representatives of management were present. | | | | NATURE, EXTENT AND QUALITY OF SERVICES In considering the nature, extent and quality of the services provided by the Investment Manager, the Trustees reviewed information relating to the Investment Manager’s operations and personnel. Among other things, the Investment Manager provided financial information, information about its supervisory and professional staff and descriptions of its organizational and management structure. The Trustees also took into account information provided periodically throughout the previous year by the Investment Manager in Board meetings relating to the performance of its duties with respect to the Funds and the Trustees’ knowledge of the Investment Manager’s management and the quality of the performance of the Investment Manager’s duties under the Investment Management Agreement and Administration Agreement. In the course of their deliberations regarding the Investment Manager, the Trustees evaluated, among other things: (a) the extent and quality of the Investment Manager’s oversight of the operation and management of the Funds; (b) the quality of the search, selection and monitoring services performed by the Investment Manager in overseeing the portfolio management responsibilities of the Subadvisers; (c) the Investment Manager’s ability to supervise the Funds’ other service providers; and (d) the Investment Manager’s compliance program. The Trustees also took into account that, in performing its functions under the Investment Management Agreement and supervising each Subadviser, the Investment Manager: performs periodic detailed analyses and reviews of the performance by each Subadviser of its obligations to a Fund, including without limitation, analysis and review of portfolio and other compliance matters and review of each Subadviser’s investment performance with respect to a Fund; prepares and presents periodic reports to the Board regarding the investment performance of each Subadviser and other information regarding each Subadviser, at such times and in such forms as the Board may reasonably request; reviews and considers any changes in the personnel of each Subadviser responsible for performing the Subadviser’s obligations and makes appropriate reports to the Board; reviews and considers any changes in the ownership or senior management of each Subadviser and makes appropriate reports to the Board; performs periodic in-person or telephonic diligence meetings, including with respect to compliance matters, with representatives of each Subadviser; assists the Board and management of | | | | the Trust in developing and reviewing information with respect to the initial approval of each Subadvisory Agreement and annual consideration of each Subadvisory Agreement thereafter; prepares recommendations with respect to the continued retention of any Subadviser or the replacement of any Subadviser, including at the request of the Board; identifies potential successors to, or replacements of, any Subadviser or potential additional subadvisers, including performing appropriate due diligence, and developing and presenting to the Board a recommendation as to any such successor, replacement, or additional subadviser, including at the request of the Board; designates and compensates from its own resources such personnel as the Investment Manager may consider necessary or appropriate to the performance of its services; and performs such other review and reporting functions as the Board shall reasonably request consistent with the Investment Management Agreement and applicable law. With respect to AMG Frontier Small Cap Growth Fund, the Trustees noted the affiliation of the Subadviser with the Investment Manager, noting any potential conflicts of interest. The Trustees also took into account the financial condition of the Investment Manager with respect to its ability to provide the services required under the Investment Management Agreement and the Investment Manager’s undertaking to maintain contractual expense limitations for the Funds. The Trustees also considered the Investment Manager’s risk management processes. The Trustees also reviewed information relating to each Subadviser’s operations and personnel and the investment philosophy, strategies and techniques (for each Subadviser, its “Investment Strategy”) used in managing a Fund or the portion of a Fund for which the Subadviser has portfolio management responsibility. Among other things, the Trustees reviewed information on portfolio management and other professional staff, information regarding each Subadviser’s organizational and management structure and each Subadviser’s brokerage policies and practices. The Trustees considered specific information provided regarding the experience of the individual(s) at each Subadviser with portfolio management responsibility for a Fund or the portion of a Fund managed by the Subadviser, including the information set forth in the Fund’s prospectus and statement of additional information. With respect to AMG Managers Emerging Opportunities Fund, which is managed by multiple Subadvisers, the Trustees |
39
|
Annual Renewal of Investment Management and Subadvisory Agreements (continued) |
| | | | | | | | |
also noted the manner in which each Subadviser’s Investment Strategy complements those utilized by the Fund’s other Subadvisers. In the course of their deliberations, the Trustees evaluated, among other things: (a) the services rendered by each Subadviser in the past; (b) the qualifications and experience of the Subadviser’s personnel; and (c) the Subadviser’s compliance program. The Trustees also took into account the financial condition of each Subadviser with respect to its ability to provide the services required under its Subadvisory Agreement. The Trustees also considered each Subadviser’s risk management processes. PERFORMANCE The Board considered each Fund’s net performance during relevant time periods as compared to each Fund’s Peer Group and Fund Benchmark and considered each applicable Subadviser’s performance as compared to an appropriate peer group of managed accounts and also considered the gross performance of the Fund or the portion of the Fund managed by each Subadviser as compared to the Subadviser’s relevant performance composite that utilizes the same investment strategy and approach and noted that the Board reviews on a quarterly basis detailed information about both the Fund’s performance results and portfolio composition, as well as the Subadviser’s Investment Strategy, including, with respect to AMG Managers Emerging Opportunities Fund, the portion of the Fund managed by each Subadviser. The Board was mindful of the Investment Manager’s expertise, resources and attention to monitoring each Subadviser’s performance, investment style and risk-adjusted performance with respect to the Funds and its discussions with the Subadviser’s management regarding the factors that contributed to the performance of the Funds. The Board also noted each Subadviser’s performance record with respect to AMG Managers Emerging Opportunities Fund. ADVISORY FEES; PROFITABILITY; AND ECONOMIES OF SCALE In considering the reasonableness of the advisory fee charged by the Investment | | | | The Trustees also considered the amount of the advisory fee retained by the Investment Manager after payment of the subadvisory fee(s) with respect to each Fund. The Trustees also noted payments made or to be made from Frontier Capital Management Company, LLC (“Frontier”) to the Investment Manager, and other payments made or to be made from the Investment Manager to Frontier. The Trustees concluded that, in light of the high quality supervisory services provided by the Investment Manager and the fact that the subadvisory fees are paid out of the advisory fee, the advisory fee payable by each Fund to the Investment Manager can reasonably be expected to exceed the median advisory fee for the Peer Group, which consists of many funds that do not operate with a manager-of-managers structure. In this regard, the Trustees also noted that the Investment Manager has undertaken to maintain contractual expense limitations for the Funds. In addition, in considering the reasonableness of the advisory fee payable to the Investment Manager, the Trustees also reviewed information provided by the Investment Manager setting forth all revenues and other benefits, both direct and indirect (including any so-called “fallout benefits” such as reputational value derived from the Investment Manager serving as Investment Manager to a Fund), received by the Investment Manager and its affiliates attributable to managing each Fund and all the mutual funds in the AMG Funds Family of Funds; the cost of providing such services; the significant risks undertaken as Investment Manager and sponsor of the Funds, including investment, operational, enterprise, entrepreneurial, litigation, regulatory and compliance risks; and the resulting profitability to the Investment Manager and its affiliates from these relationships. The Trustees also noted the current asset levels of each Fund and the willingness of the Investment Manager to waive fees and pay expenses for all of the Funds from time to time as a means of limiting total expenses. The Trustees | | | | profitability to the Investment Manager is reasonable and that the Investment Manager is not realizing material benefits from economies of scale that would warrant adjustments to the advisory fees for any Fund at this time. With respect to economies of scale, the Trustees also noted that as a Fund’s assets increase over time, the Fund may realize other economies of scale to the extent that the increase in assets is proportionally greater than the increase in certain other expenses. SUBADVISORY FEES; PROFITABILITY; AND ECONOMIES OF SCALE In considering the reasonableness of the subadvisory fee payable by the Investment Manager to each Subadviser of AMG Managers Emerging Opportunities Fund, the Trustees relied on the ability of the Investment Manager to negotiate the terms of the Subadvisory Agreement at arm’s length as part of the manager-of-managers structure, noting that each Subadviser of AMG Managers Emerging Opportunities Fund is not affiliated with the Investment Manager. In addition, the Trustees considered other potential benefits of the subadvisory relationship to a Subadviser, including, among others, the indirect benefits that the Subadviser may receive from the Subadviser’s relationship with AMG Managers Emerging Opportunities Fund, including any so-called “fallout benefits” to the Subadviser, such as reputational value derived from the Subadviser serving as Subadviser to the Fund. In addition, the Trustees noted that the subadvisory fees are paid by the Investment Manager out of its advisory fee. As a consequence of all of the foregoing, the cost of services to be provided by each unaffiliated Subadviser and the profitability to the Subadviser of its relationship with AMG Managers Emerging Opportunities Fund were not material factors in the Trustees’ deliberations. For similar reasons, the Trustees did not consider potential economies of scale in the management of the portion of AMG Managers Emerging Opportunities Fund managed |
| | | | | | | | |
| Manager for managing each Fund, the Trustees noted that the Investment Manager, and not the Fund, is responsible for paying the fees charged by the Fund’s Subadviser(s) and, therefore, that the fees paid to the Investment Manager cover the cost of providing portfolio management services as well as the cost of providing search, selection and monitoring services in operating a “manager-of-managers” complex of mutual funds. | | | | also considered management’s discussion of the current asset levels of the Funds, and the impact on profitability of both the current asset levels and any future growth of assets of the Funds. The Board took into account management’s discussion of the advisory fee structure, and the services the Investment Manager provides in performing its functions under the Investment Management Agreement and supervising each Subadviser. In this regard, the Trustees noted that, unlike a mutual fund that is managed by a single investment adviser, the Funds operate in a manager-of-managers structure. Based on the foregoing, the Trustees concluded that the | | | | by each unaffiliated Subadviser to be a material factor in their deliberations at this time. In considering the reasonableness of the subadvisory fees payable by the Investment Manager to Frontier, the Trustees noted that Frontier is an affiliate of the Investment Manager, and the Trustees reviewed information regarding the cost to Frontier of providing subadvisory services to AMG Frontier Small Cap Growth Fund and the resulting profitability from such relationship. The Trustees noted that, because Frontier is an affiliate of the Investment Manager, a portion of Frontier’s revenues |
40
|
Annual Renewal of Investment Management and Subadvisory Agreements (continued) |
| | | | | | | | |
or profits might be shared directly or indirectly with the Investment Manager. The Trustees also noted that the subadvisory fees are paid by the Investment Manager out of its advisory fee. The Board also took into account management’s discussion of the subadvisory fee structure, and the services Frontier provides in performing its functions under the Subadvisory Agreement. Based on the foregoing, the Trustees concluded that the profitability to Frontier is reasonable and that Frontier is not realizing material benefits from economies of scale that would warrant adjustments to the subadvisory fees at this time. Also with respect to economies of scale, the Trustees noted that as the Fund’s assets increase over time, the Fund may realize other economies of scale to the extent the increase in assets is proportionally greater than the increase in certain other expenses. In addition to the foregoing, the Trustees considered the specific factors and related conclusions set forth below with respect to each Fund, the Investment Manager and each Subadviser. AMG Managers Emerging Opportunities Fund FUND PERFORMANCE Among other information relating to the Fund’s performance, the Trustees noted that the Fund’s performance for Class N shares (which share class has the earliest inception date and the largest amount of assets of all the share classes of the Fund) for the 1-year, 3-year, 5-year and 10-year periods ended March 31, 2020 was at, above, above, and above, respectively, the median performance of the Peer Group and above the performance of the Fund Benchmark, the Russell Microcap® Index. The Trustees took into account management’s discussion of the Fund’s performance, noting that Class N shares of the Fund ranked in the top decile relative to its Peer Group for the 3-year, 5-year, and 10- year periods. The Trustees concluded that the Fund’s overall performance has been satisfactory. ADVISORY AND SUBADVISORY FEES AND FUND EXPENSES The Trustees noted that the management fees (which include both the advisory and | | | | Investment Manager has contractually agreed, through March 1, 2021, to limit the Fund’s net annual operating expenses (subject to certain excluded expenses) to 0.94%. The Trustees also took into account management’s discussion of the Fund’s expenses, including the Fund’s competitiveness with comparably sized funds. The Trustees concluded that, in light of the nature, extent and quality of the services provided by the Investment Manager and the Subadvisers, the foregoing expense limitation and the considerations noted above with respect to the Investment Manager and the Subadvisers, the Fund’s advisory and subadvisory fees are reasonable. AMG Frontier Small Cap Growth Fund FUND PERFORMANCE Among other information relating to the Fund’s performance, the Trustees noted that the Fund’s performance for Class I shares (which share class has the earliest inception date and the largest amount of assets of all the share classes of the Fund) for the 1-year, 3-year, 5-year and 10-year periods ended March 31, 2020 was below, above, below, and below, respectively, the median performance of the Peer Group and below, above, below, and below, respectively, the performance of the Fund Benchmark, the Russell 2000® Growth Index. The Trustees took into account management’s discussion of the Fund’s performance, including the reasons for the Fund’s underperformance. The Trustees concluded that the Fund’s overall performance has been satisfactory in light of the Fund’s investment objective, strategies and policies. ADVISORY AND SUBADVISORY FEES AND FUND EXPENSES The Trustees noted that the management fees (which include both the advisory and administration fees) and total expenses (net of applicable expense waivers/reimbursements) of Class I shares of the Fund as of March 31, 2020 were both higher than the average for the Peer Group. The Trustees took into | | | | Manager), the foregoing expense limitation and the considerations noted above with respect to the Investment Manager and the Subadviser, the Fund’s advisory and subadvisory fees are reasonable. * * * * After consideration of the foregoing, the Trustees also reached the following conclusions (in addition to the conclusions discussed above) regarding each Investment Management Agreement and each Subadvisory Agreement: (a) the Investment Manager and each Subadviser have demonstrated that they possess the capability and resources to perform the duties required of them under each Investment Management Agreement and the applicable Subadvisory Agreement(s) and (b) the Investment Manager and each Subadviser maintain appropriate compliance programs. Based on all of the above-mentioned factors and their related conclusions, with no single factor or conclusion being determinative and with each Trustee not necessarily attributing the same weight to each factor, the Trustees concluded that approval of each Investment Management Agreement and each Subadvisory Agreement would be in the best interests of the applicable Fund and its shareholders. Accordingly, on June 25, 2020, the Trustees, and separately a majority of the Independent Trustees, voted to approve the Investment Management and the Subadvisory Agreements for each Fund. 1 The Trustees determined that the conditions surrounding COVID-19 constituted unforeseen or emergency circumstances and that reliance on the Securities and Exchange Commission’s (“SEC”) exemptive order, which provides relief from the in-person voting requirements of the Investment Company Act of 1940, as amended (the “1940 Act”), in certain circumstances (the “In-Person Relief”), was necessary or appropriate due to the circumstances related to current or potential effects of COVID-19. The Trustees unanimously wished to rely on the In-Person Relief |
| | | | | | | | |
| administration fees) and total expenses (net of applicable expense waivers/reimbursements) of Class I shares (the class of shares which is the primary focus of the Fund’s distribution) of the Fund as of March 31, 2020 were both higher than the average for the Peer Group. The Trustees took into account the fact that the | | | | account the fact that the Investment Manager has contractually agreed, through March 1, 2021, to limit the Fund’s net annual operating expenses (subject to certain excluded expenses) to 0.90%. The Trustees also took into account management’s discussion of the Fund’s expenses. The Trustees concluded that, in light of the nature, extent and quality of the services provided by the Investment Manager and the Subadviser (which is an affiliate of the Investment | | | | with respect to the approval of those matters on the agenda for the June 25, 2020 meeting that would otherwise require in-person votes under the 1940 Act. The Trustees, including a majority of the Trustees who are not “interested persons” of AMG Funds I, undertook to ratify the actions taken pursuant to the In-Person Relief at the Board’s next in-person meeting, consistent with the requirements of the In-Person Relief. See Investment Company Release No. 33897 (June 19, 2020). This exemptive order supersedes, in part, a similar, earlier exemptive order issued by the SEC (Investment Company Release No. 33824 (March 25, 2020)). |
41
THIS PAGE INTENTIONALLY LEFT BLANK
THIS PAGE INTENTIONALLY LEFT BLANK
THIS PAGE INTENTIONALLY LEFT BLANK
| | |
| | |
| | | | |
INVESTMENT MANAGER AND ADMINISTRATOR AMG Funds LLC 600 Steamboat Road, Suite 300 Greenwich, CT 06830 800.548.4539 DISTRIBUTOR AMG Distributors, Inc. 600 Steamboat Road, Suite 300 Greenwich, CT 06830 800.548.4539 | | CUSTODIAN The Bank of New York Mellon 111 Sanders Creek Parkway East Syracuse, NY 13057 LEGAL COUNSEL Ropes & Gray LLP Prudential Tower, 800 Boylston Street Boston, MA 02199-3600 TRANSFER AGENT BNY Mellon Investment Servicing (US) Inc. Attn: AMG Funds 4400 Computer Drive Westborough, MA 01581 800.548.4539 | | This report is prepared for the Funds’ shareholders. It is authorized for distribution to prospective investors only when preceded or accompanied by an effective prospectus. To receive a free copy of the prospectus or Statement of Additional Information, which includes additional information about Fund Trustees, please contact us by calling 800.548.4539. Distributed by AMG Distributors, Inc., member FINRA/SIPC. Current net asset values per share for each Fund are available on the Funds’ website at amgfunds.com. A description of the policies and procedures each Fund uses to vote its proxies is available: (i) without charge, upon request, by calling 800.548.4539, or (ii) on the Securities and Exchange Commission’s (SEC) website at sec.gov. For information regarding each Fund’s proxy voting record for the 12-month period ended June 30, call 800.548.4539 or visit the SEC website at sec.gov. The Funds file their complete schedule of portfolio holdings with the SEC for the first and third quarters of each fiscal year as an exhibit to their reports on Form N-PORT. The Funds’ portfolio holdings on Form N-PORT are available on the SEC’s website at sec.gov. To review a complete list of the Funds’ portfolio holdings, or to view the most recent semiannual report or annual report, please visit amgfunds.com. |
| | | | |
| | |
| | |
| | | | | | | | | | |
AFFILIATE SUBADVISED FUNDS BALANCED FUNDS AMG GW&K Global Allocation GW&K Investment Management, LLC AMG FQ Global Risk-Balanced First Quadrant, L.P. EQUITY FUNDS AMG FQ Tax-Managed U.S. Equity AMG FQ Long-Short Equity First Quadrant, L.P. AMG Frontier Small Cap Growth Frontier Capital Management Co., LLC AMG GW&K Small Cap Core AMG GW&K Small Cap Value AMG GW&K Small/Mid Cap AMG GW&K Mid Cap AMG GW&K Emerging Markets Equity AMG GW&K Emerging Wealth Equity AMG GW&K International Small Cap GW&K Investment Management, LLC AMG Renaissance Large Cap Growth The Renaissance Group LLC AMG River Road Dividend All Cap Value AMG River Road Focused Absolute Value AMG River Road Long-Short AMG River Road Small-Mid Cap Value AMG River Road Small Cap Value River Road Asset Management, LLC | | | | AMG TimesSquare Emerging Markets Small Cap AMG TimesSquare Global Small Cap AMG TimesSquare International Small Cap AMG TimesSquare Mid Cap Growth AMG TimesSquare Small Cap Growth TimesSquare Capital Management, LLC AMG Yacktman AMG Yacktman Focused AMG Yacktman Focused Fund - Security Selection Only AMG Yacktman Special Opportunities Yacktman Asset Management LP FIXED INCOME FUNDS AMG GW&K Core Bond ESG AMG GW&K Enhanced Core Bond ESG AMG GW&K High Income AMG GW&K Municipal Bond AMG GW&K Municipal Enhanced Yield GW&K Investment Management, LLC OPEN-ARCHITECTURE FUNDS EQUITY FUNDS AMG Managers Brandywine AMG Managers Brandywine Blue Friess Associates, LLC AMG Managers CenterSquare Real Estate CenterSquare Investment Management LLC | | | | AMG Managers Emerging Opportunities WEDGE Capital Management L.L.P. Next Century Growth Investors LLC RBC Global Asset Management (U.S.) Inc. AMG Managers Fairpointe Mid Cap Fairpointe Capital LLC AMG Managers LMCG Small Cap Growth LMCG Investments, LLC AMG Managers Montag & Caldwell Growth Montag & Caldwell, LLC AMG Managers Pictet International Pictet Asset Management Limited AMG Managers Silvercrest Small Cap Silvercrest Asset Management Group LLC AMG Managers Special Equity Ranger Investment Management, L.P. Lord, Abbett & Co. LLC Smith Asset Management Group, L.P. Federated MDTA LLC AMG SouthernSun Small Cap AMG SouthernSun U.S. Equity SouthernSun Asset Management, LLC FIXED INCOME FUNDS AMG Managers Doubleline Core Plus Bond DoubleLine Capital LP AMG Managers Loomis Sayles Bond Loomis, Sayles & Company, L.P. | | |
amgfunds.com | | 103120 AR022 |
Registrant has adopted a Code of Ethics. See attached Exhibit (a)(1).
| Item 3. | AUDIT COMMITTEE FINANCIAL EXPERT |
Registrant’s Board of Trustees has determined that independent Trustee Mr. Steven J. Paggioli qualifies as an Audit Committee Financial Expert. Mr. Paggioli is “independent” as such term is defined in Form N-CSR.
| Item 4. | PRINCIPAL ACCOUNTANT FEES AND SERVICES |
The aggregate fees billed by the Funds’ independent registered public accounting firm, PricewaterhouseCoopers LLP (“PwC”), to the Funds for the Funds’ two most recent fiscal years for professional services rendered for audits of annual financial statements, or services that are normally provided in connection with statutory and regulatory filings or engagements (“Audit Fees”) were as follows:
| | | | | | | | |
| | | Fiscal
2020 | | | Fiscal
2019 | |
AMG FQ Tax-Managed U.S. Equity Fund | | $ | 22,860 | | | $ | 22,186 | |
AMG FQ Long-Short Equity Fund | | $ | 34,587 | | | $ | 33,510 | |
AMG FQ Global Risk-Balanced Fund | | $ | 26,031 | | | $ | 26,240 | |
AMG Frontier Small Cap Growth Fund | | $ | 21,760 | | | $ | 21,369 | |
AMG Managers Emerging Opportunities Fund | | $ | 23,130 | | | $ | 21,775 | |
AMG GW&K Core Bond ESG Fund | | $ | 41,896 | | | $ | 39,548 | |
There were no fees billed by PwC to the Funds in its two recent fiscal years for services rendered for assurance and related services that are reasonably related to the performance of the audit or review of the Fund’s financial statements, but are not reported as Audit Fees (“Audit-Related Fees”).
For the Funds’ two most recent fiscal years, there were no Audit-Related Fees billed by PwC for engagements related directly to the operations and financial reporting of one or more Funds by a Fund Service Provider. A Fund Service Provider is (a) any investment adviser to the Fund (not including any Subadvisor whose role is primarily portfolio management and is subcontracted with or overseen by another investment adviser) or (b) any entity that provides ongoing services to the Fund and is controlling, controlled by or under common control with a Fund investment adviser described in (a).
The aggregate fees billed by PwC to the Funds for the two most recent fiscal years for professional services rendered for tax compliance, tax advice, and tax planning (“Tax Fees”) were as follows:
| | | | | | | | |
| | | Fiscal
2020 | | | Fiscal
2019 | |
AMG FQ Tax-Managed U.S. Equity Fund | | $ | 4,850 | | | $ | 4,850 | |
AMG FQ Long-Short Equity Fund | | $ | 7,000 | | | $ | 7,000 | |
AMG FQ Global Risk-Balanced Fund | | $ | 7,000 | | | $ | 7,000 | |
AMG Frontier Small Cap Growth Fund | | $ | 4,850 | | | $ | 4,850 | |
AMG Managers Emerging Opportunities Fund | | $ | 4,850 | | | $ | 4,850 | |
AMG GW&K Core Bond ESG Fund | | $ | 4,850 | | | $ | 4,850 | |
For the Funds’ two most recent fiscal years, Tax Fees billed by PwC for engagements by Fund Service Providers that related directly to the operations and financial reporting of the Funds were $0 for fiscal 2020 and $0 for fiscal 2019, respectively.
The services for which Tax Fees were charged comprise all services performed by professional staff in PwC’s tax division except those services related to the audit. Typically, this category would include fees for tax compliance, tax planning, and tax advice. Tax compliance, tax advice, and tax planning services include preparation of original and amended tax returns, claims for refund and tax payment-planning services, assistance with tax audits and appeals, tax advice related to mergers and acquisitions and requests for rulings or technical advice from taxing authorities.
There were no other fees billed by PwC to the Funds for all other non-audit services (��Other Fees”) during the Funds’ two most recent fiscal years. During the same period, there were no Other Fees billed by PwC for engagements by Fund Service Providers that related directly to the operations and financial reporting of the Funds.
(e)(1) According to policies adopted by the Audit Committee, services provided by PwC to the Funds must be pre-approved by the Audit Committee. On an annual basis, the Audit Committee reviews and pre-approves various types of services that PwC may perform for the Funds without specific approval of each engagement, subject to specified budget limitations. As contemplated by the Sarbanes-Oxley Act of 2002 and related SEC rules, the Audit Committee also pre-approves non-audit services provided by PwC to any Fund Service Provider for any engagement that relates directly to the operations and financial reporting of the Funds. Any engagement that is not already pre-approved or that will exceed a pre-approved budget must be submitted to the Audit Committee for pre-approval. The Chairman of the Audit Committee is authorized on behalf of the Board of Trustees and the Audit Committee to approve the engagement of PwC to perform non-audit services subject to certain conditions, including notification to the Audit Committee of such pre-approval not later than the next meeting of the Audit Committee following the date of such pre-approval.
(e)(2) None.
(g) The aggregate fees billed by PwC in 2020 and 2019 for non-audit services rendered to the Funds and Fund Service Providers were $82,900 and $82,900, respectively. For the fiscal year ended October 31, 2020, this amount reflects the amounts disclosed above in Item 4(b),(c),(d), plus $49,500 in fees billed to the Fund Service Providers for non-audit services that did not relate directly to the operations and financial reporting of the Funds. For the fiscal year ended October 31, 2019, this amount reflects the amounts disclosed above in Item 4(b),(c),(d), plus $49,500 in fees billed to the Fund Service Providers for non-audit services that did not relate directly to the operations and financial reporting of the Funds.
(h) The Trust’s Audit Committee has considered whether the provision of non-audit services by registrant’s independent registered public accounting firm to the registrant’s investment adviser, and any entity controlling, controlled by, or under common control with the investment adviser that provided ongoing services to the registrant that were not pre-approved by the Committee (because such services did not relate directly to the operations and financial reporting of the registrant) was compatible with maintaining the independence of the independent registered public accounting firm.
| Item 5. | AUDIT COMMITTEE OF LISTED REGISTRANTS |
Not applicable.
| Item 6. | SCHEDULE OF INVESTMENTS |
The schedule of investments in securities of unaffiliated issuers as of the close of the reporting period is included as part of the report to shareholders filed under Item 1 of this form.
| Item 7. | DISCLOSURE OF PROXY VOTING POLICIES AND PROCEDURES FOR CLOSED-END MANAGEMENT INVESTMENT COMPANIES |
Not applicable.
| Item 8. | PORTFOLIO MANAGERS OF CLOSED-END MANAGEMENT INVESTMENT COMPANIES |
Not applicable.
| Item 9. | PURCHASES OF EQUITY SECURITIES BY CLOSED-END MANAGEMENT INVESTMENT COMPANIES AND AFFILIATED PURCHASERS |
Not applicable.
| Item 10. | SUBMISSION OF MATTERS TO A VOTE OF SECURITY HOLDERS |
Not applicable.
| Item 11. | CONTROLS AND PROCEDURES |
(a) The Registrant’s principal executive and principal financial officers have concluded, based on their evaluation of the registrant’s disclosure controls and procedures as of a date within 90 days of the filing of this report, that the Registrant’s disclosure controls and procedures are reasonably designed to ensure that information required to be disclosed by the Registrant on Form N-CSR is recorded, processed, summarized and reported within the required time periods and that information required to be disclosed by the registrant in the reports that it files or submits on Form N-CSR is accumulated and communicated to the Registrant’s management, including its principal executive and principal financial officers, as appropriate to allow timely decisions regarding required disclosure.
(b) There were no changes in the Registrant’s internal control over financial reporting during the period covered by this report that have materially affected, or are reasonably likely to materially affect, the internal control over financial reporting.
| Item 12. | DISCLOSURE OF SECURITIES LENDING ACTIVITIES FOR CLOSED-END MANAGEMENT INVESTMENT COMPANIES |
Not applicable.
SIGNATURES
Pursuant to the requirements of the Securities Exchange Act of 1934 and the Investment Company Act of 1940, the registrant has duly caused this report to be signed on its behalf by the undersigned, thereunto duly authorized.
AMG Funds I
| | |
| By: | | /s/ Keitha L. Kinne |
| | Keitha L. Kinne, Principal Executive Officer |
| |
| Date: | | January 6, 2021 |
Pursuant to the requirements of the Securities Exchange Act of 1934 and the Investment Company Act of 1940, this report has been signed below by the following persons on behalf of the registrant and in the capacities and on the dates indicated.
| | |
| By: | | /s/ Keitha L. Kinne |
| | Keitha L. Kinne, Principal Executive Officer |
| |
| Date: | | January 6, 2021 |
| |
| By: | | /s/ Thomas Disbrow |
| | Thomas Disbrow, Principal Financial Officer |
| |
| Date: | | January 6, 2021 |